
Data Center Strategy Leading Intel's Business Transformation
20
Executive Summary Intel IT runs Intel data center services like a factory, affecting change in a disciplined manner and applying breakthrough technologies, solutions and processes. This enables us to optimally meet Intel’s business requirements while providing our internal customers with effective data center infrastructure capabilities and innovative business services. Building on previous investments and techniques, our data center strategy has generated savings exceeding USD 4.8 billion from 2010 to 2020. We are constantly improving our data center strategy to continue our data center transformation. Using disruptive server, storage, network, infrastructure software and data center facility technologies can lead to unprecedented quality-of-service levels and reduction in total cost of ownership (TCO) for business applications. They also enable us to continue to improve IT operational efficiency and be environmentally responsible. As we continue to apply breakthrough technologies and solutions while evolving our processes, we enable the acceleration of Intel’s business Intel IT Authors Shesha Krishnapura Intel Fellow and Intel IT CTO Shaji Kootaal Achuthan Senior Staff Engineer Pushpa Jahagirdar Technical Program Manager Vipul Lal Senior Principal Engineer Raju Nallapa Senior Principal Engineer Sanjay Rungta Senior Principal Engineer Ty Tang Senior Principal Engineer Murty Ayyalasomayajula Senior Staff Engineer $4.8 Billion in Savings 44% SAVINGS during refresh with a Disaggregated Server Design compared to a full-acquisition 400% INCREASE in Data Transfer Rates between sites through international WAN links 293x INCREASE in our HPC Environment with 107x improvement in quality 1-Day DEPLOYMENT using our Process Transformation for new physical server deployment White Paper November 2021 IT@Intel: Data Center Strategy Leading Intel’s Business Transformation
-
Upload
khangminh22 -
Category
Documents
-
view
3 -
download
0
Transcript of Data Center Strategy Leading Intel's Business Transformation
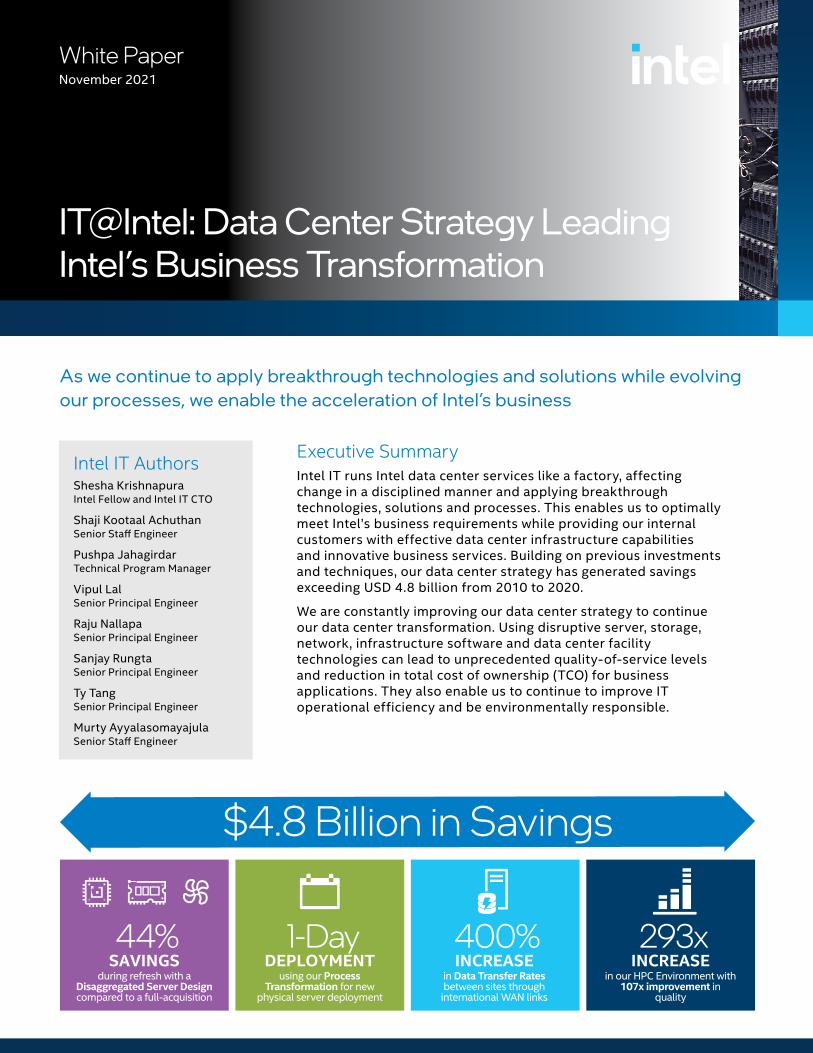
Executive SummaryIntel IT runs Intel data center services like a factory, affecting change in a disciplined manner and applying breakthrough technologies, solutions and processes. This enables us to optimally meet Intel’s business requirements while providing our internal customers with effective data center infrastructure capabilities and innovative business services. Building on previous investments and techniques, our data center strategy has generated savings exceeding USD 4.8 billion from 2010 to 2020.
We are constantly improving our data center strategy to continue our data center transformation. Using disruptive server, storage, network, infrastructure software and data center facility technologies can lead to unprecedented quality-of-service levels and reduction in total cost of ownership (TCO) for business applications. They also enable us to continue to improve IT operational efficiency and be environmentally responsible.
As we continue to apply breakthrough technologies and solutions while evolving our processes, we enable the acceleration of Intel’s business
Intel IT AuthorsShesha Krishnapura Intel Fellow and Intel IT CTO
Shaji Kootaal Achuthan Senior Staff Engineer
Pushpa Jahagirdar Technical Program Manager
Vipul Lal Senior Principal Engineer
Raju Nallapa Senior Principal Engineer
Sanjay Rungta Senior Principal Engineer
Ty Tang Senior Principal Engineer
Murty Ayyalasomayajula Senior Staff Engineer
$4.8 Billion in Savings
44%SAVINGS
during refresh with a Disaggregated Server Design compared to a full-acquisition
400%INCREASE
in Data Transfer Rates between sites through
international WAN links
293xINCREASE
in our HPC Environment with 107x improvement in
quality
1-DayDEPLOYMENT
using our Process Transformation for new
physical server deployment
White PaperNovember 2021
IT@Intel: Data Center Strategy Leading Intel’s Business Transformation

IT@Intel White Paper | IT@Intel: Data Center Strategy Leading Intel’s Business Transformation 2
BackgroundIntel IT operates 56 data center modules at 16 data center sites. These sites have a total capacity of 103 megawatts, housing more than 360,000 servers that underpin the computing needs of more than 116,000 employees.1 To support the business needs of Intel’s critical business functions—Design, Office, Manufacturing and Enterprise (DOME)—while operating our data centers as efficiently as possible, Intel IT has engaged in a multiyear evolution of our data center strategy, as outlined in Figure 1.
1 Number of data centers and servers as of October 2021. To define “data center,” Intel uses IDC’s data center size classification: “any room greater than 100 square feet that houses servers and other infrastructure components.”
Intel Data Center: 31 MW in 30K SQ FT: 1.06 PUE
2006-2010
• Business-focused investments for DOME• Proactive server and infrastructure refresh• Virtualization and enterprise private cloud• Storage optimization and IT sustainability
Foundation for Efficient Growth
2000-2006Standardization and Cost Control• Formed data center team• Completed RISC to Intel Architecture migration in Design• Standardized data center designs• Began data center consolidation efforts
Pre-2000
2010-2013Transform Business Capabilities• TCO assessment of Infrastructure as a Service• Introduction of data center MOR• Unit-costing model to plan improvement targets and benchmark• Pulse dashboard for comprehensive state of
Infrastructure-as-a-Service capacity and utilization
Focus on Resource and Energy Efficiency2013+
• Breakthrough disaggregated server architecture innovation• Centralized batch computing capacity in two mega-hubs• Combined high-frequency servers and optimal workloads for
platform pairings• Centralized management of servers and resources• Converted older wafer fabrication facilities into data centers• Custom rack design to optimize space, compute, and power density • Environmental sustainability—either free-air cooling or evaporative
cooling-tower water to condition the data centers• State-of-the-art electrical density and distribution system
Ad-hoc/Unstructured Growth• No centralized strategy or ownership• Built data centers to support acquisitions• Decentralized procurement and management• RISC migration to Intel® architecture begins
$4.8 BCUMMULATIVECOST SAVINGS 2010-2020
Figure 1. Intel’s data center strategy is a continuous improvement process.
Intel IT Data Center Strategy Evolution
Table of ContentsBackground . . . . . . . . . . . . . . . . . . . . . . . . . . . . . . . . . . . . . . . . . .2Intel IT Data Center Strategy Evolution . . . . . . . . . . . . . . .2Intel IT Data Center Transformation Strategy . . . . . . . . .4
Defining a Model of Record . . . . . . . . . . . . . . . . . . . . . . . . . . . .4Results: Building on the Past, Building for the Future . . .82010-2020 Data Center Results . . . . . . . . . . . . . . . . . . . . .172010-2020 Data Center Best Practices . . . . . . . . . . . . . . 18
Plans for 2021 and Beyond . . . . . . . . . . . . . . . . . . . . . . . . . . 19Conclusion . . . . . . . . . . . . . . . . . . . . . . . . . . . . . . . . . . . . . . . . . 19

IT@Intel White Paper | IT@Intel: Data Center Strategy Leading Intel’s Business Transformation 3
Meeting Compute Environment ChallengesIn the past, we focused our data center investments on improving IT infrastructure to deliver a foundation for the efficient growth of Intel’s business. Our primary goal was cost reduction through data center efficiency and infrastructure simplification while reducing energy consumption and our CO2 footprint to improve IT sustainability.
Over the last several years, we have reduced data center energy consumption and greenhouse gas emissions. At the same time, we have met the constantly increasing demand for data center resources. We anticipate these annual growth rates to continue or even increase further:• 30 to 40% in compute capacity requirements• 35 to 50% in storage needs • 30 to 40% in demand for network capacity
We needed to address these challenges without negatively impacting service delivery. We developed and continue to rely on many established industry best practices in all areas of our data center investment portfolio. These areas include servers, storage, networking and facility innovation. Since 2010, these techniques, described in detail later, have enabled us to realize USD 4.8 billion in cost savings while supporting significant growth.
Aligning Data Center Investments with Business NeedsWe have learned that a one-size-fits-all architecture is not the best approach for Intel’s unique business functions. We worked closely with business leaders to understand their requirements. As a result, we chose to invest in vertically integrated architecture solutions that meet the specific needs of individual business functions.
DesignDesign engineers run more than 213 million compute-intensive batch jobs every week. Each job can take a few seconds to several days to complete. In addition, interactive
Design applications are sensitive to high latencies caused by hosting these applications on remote servers. We have used several approaches in our Design computing data centers to provide enough compute capacity and performance to support requirements. These approaches include high-performance computing (HPC), grid computing and clustered local workstation computing.2 We used Intel® SSDs as fast local data cache drives, single-socket servers, and a specialized algorithm that increases the performance of the heaviest Design workloads. Together, these investments enable Design engineers to run up to 49% more jobs on the same compute capacity. This equates to faster design and time to market.
Because Design engineers need to access Design data frequently and quickly, we did not simply choose the least expensive storage method for this environment. Instead, we have invested in clustered and higher performance scale-out, network-attached storage in combination with caching on local storage and automatic block tiering to on-premises low-cost object storage for our HPC needs. We use storage area networks for specific storage needs such as databases.
ManufacturingIT systems must be available 24/7 in Intel’s Manufacturing environment, so we use dedicated data centers co-located with the factories for Manufacturing. We have invested heavily over
2 Intel uses grid computing for silicon design and tapeout functions. Intel’s compute grid represents thousands of interconnected compute servers, accessed through clustering and job scheduling software. Additionally, Intel’s tapeout environment uses an HPC approach, which optimizes all key components such as servers, storage, network, OS, applications, and monitoring capabilities cohesively for overall performance, reliability, and throughput benefits. For more information on HPC at Intel, refer to “High-Performance Computing for Silicon Design,” Intel Corp., December 2015.
Breakthrough Disaggregated Server ArchitectureBy decoupling the CPU/DRAM and NIC/Drives modules from other server components, we can independently refresh servers’ CPU and memory without replacing other server components. This results in faster technology adoption, which in turn puts new technology at our Design engineers’ fingertips.
Learn More:• In this Document: Disaggregated Server
Innovation Reduces TCO and TCE• White Paper: Disaggregated Servers Drive
Data Center Efficiency and Innovation• Blog: Disaggregated Servers• Video: Mission - Green Computing
CPU and DRAMModule
I/OModule
OTHERCOMPONENTS
DRAM
CPU
DisaggregatedServer Design
Since 2010, these techniques have enabled us to realize USD 4.8 billion in cost savings while supporting significant growth.
IT@Intel White Paper | IT@Intel: Data Center Strategy Leading Intel’s Business Transformation 4
the last few years to develop a robust business continuity plan. Our plan keeps factories running even in the case of a catastrophic data center failure. These efforts have paid off, and we have not experienced factory downtime related to data center facilities since 2009.
In our Manufacturing environment, we pursue a methodical, proven infrastructure deployment approach to support high reliability and rapid implementation. This “copy-exact” approach deploys new solutions in a single factory first and, once successfully deployed, we copy that implementation across other factory environments. This approach reduces the time needed to upgrade the infrastructure that supports new process technologies—thereby accelerating time to market for Intel products. The copy-exact methodology allows to quickly deploy new platforms and applications throughout the Manufacturing environment. This helps us to meet a 13-week infrastructure deployment goal 95% of the time—compared to less than 50% without using copy-exact methodology.
Office and EnterpriseTo improve IT agility and the business velocity of our private enterprise cloud, we have implemented an on-demand self-service model. This model has reduced the time to provision
servers from three months to on-demand provisioning. We have achieved a mature level of virtualization in our Office and Enterprise computing environment and have started deploying containers technology to further improve the agility in managing infrastructure and application; software development and testing; and scalable services deliveries.
In contrast to the Design environment, in the Office and Enterprise environments we rely primarily on a storage area network, with limited network-attached storage for file-based data sharing.
Defining a Model of RecordOur transformational data center strategy involves running Intel data centers and underlying infrastructure as if they were factories, with a disciplined approach to change management. Applying breakthrough technologies, solutions and processes in an effective controlled manner can help us be an industry leader and to keep up with the accelerating pace of Intel’s business.
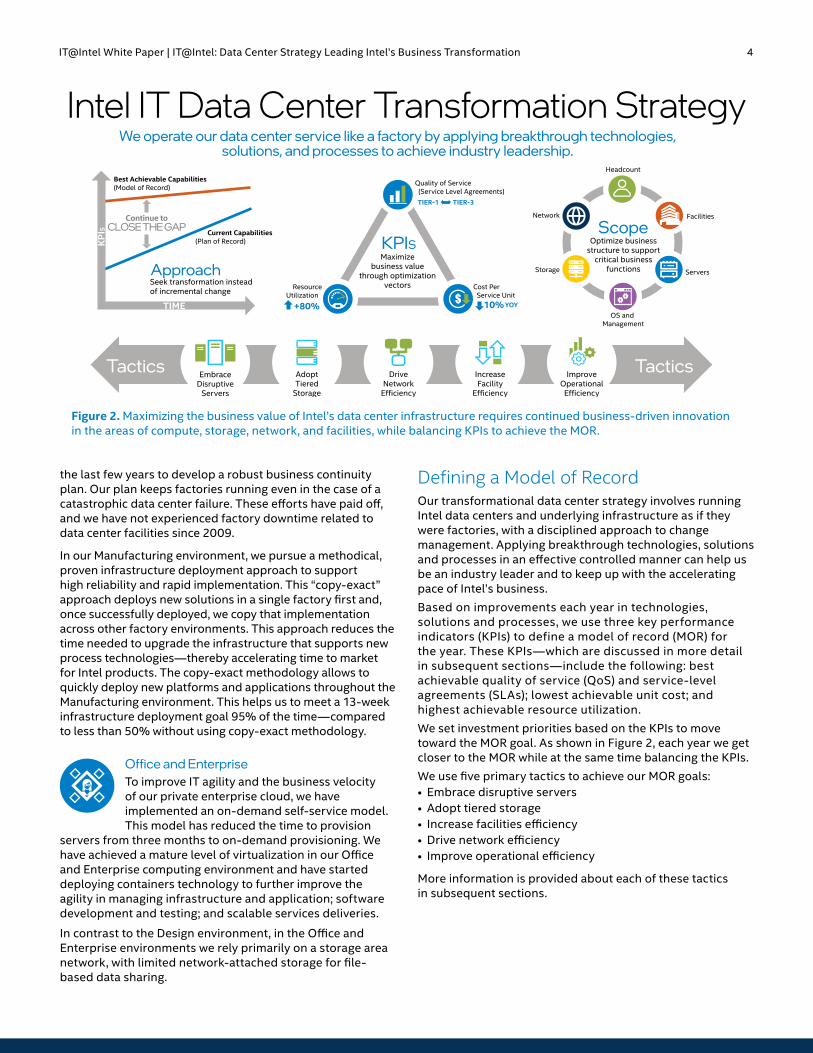
Based on improvements each year in technologies, solutions and processes, we use three key performance indicators (KPIs) to define a model of record (MOR) for the year. These KPIs—which are discussed in more detail in subsequent sections—include the following: best achievable quality of service (QoS) and service-level agreements (SLAs); lowest achievable unit cost; and highest achievable resource utilization.
We set investment priorities based on the KPIs to move toward the MOR goal. As shown in Figure 2, each year we get closer to the MOR while at the same time balancing the KPIs.
We use five primary tactics to achieve our MOR goals:• Embrace disruptive servers • Adopt tiered storage• Increase facilities efficiency• Drive network efficiency• Improve operational efficiency
More information is provided about each of these tactics in subsequent sections.
Seek transformation instead of incremental change
Tactics TacticsEmbraceDisruptive
Servers
IncreaseFacility
Efficiency
AdoptTiered
Storage
DriveNetwork
Efficiency
ImproveOperational
Efficiency
KPIS
Approach
Current Capabilities(Plan of Record)
Best Achievable Capabilities(Model of Record)
TIME
KP
IS ScopeOptimize business
structure to support critical business
functions
OS and Management
Servers
Network
Storage
Headcount
Facilities
We operate our data center service like a factory by applying breakthrough technologies, solutions, and processes to achieve industry leadership.
Quality of Service (Service Level Agreements)
ResourceUtilization
Maximizebusiness value
through optimization vectors
TIER-1 TIER-3
+80%$
Cost Per Service Unit
YOY10%
Continue toCLOSE THE GAP
Intel IT Data Center Transformation Strategy
Figure 2. Maximizing the business value of Intel’s data center infrastructure requires continued business-driven innovation in the areas of compute, storage, network, and facilities, while balancing KPIs to achieve the MOR.
Intel IT Data Center Transformation Strategy
IT@Intel White Paper | IT@Intel: Data Center Strategy Leading Intel’s Business Transformation 5
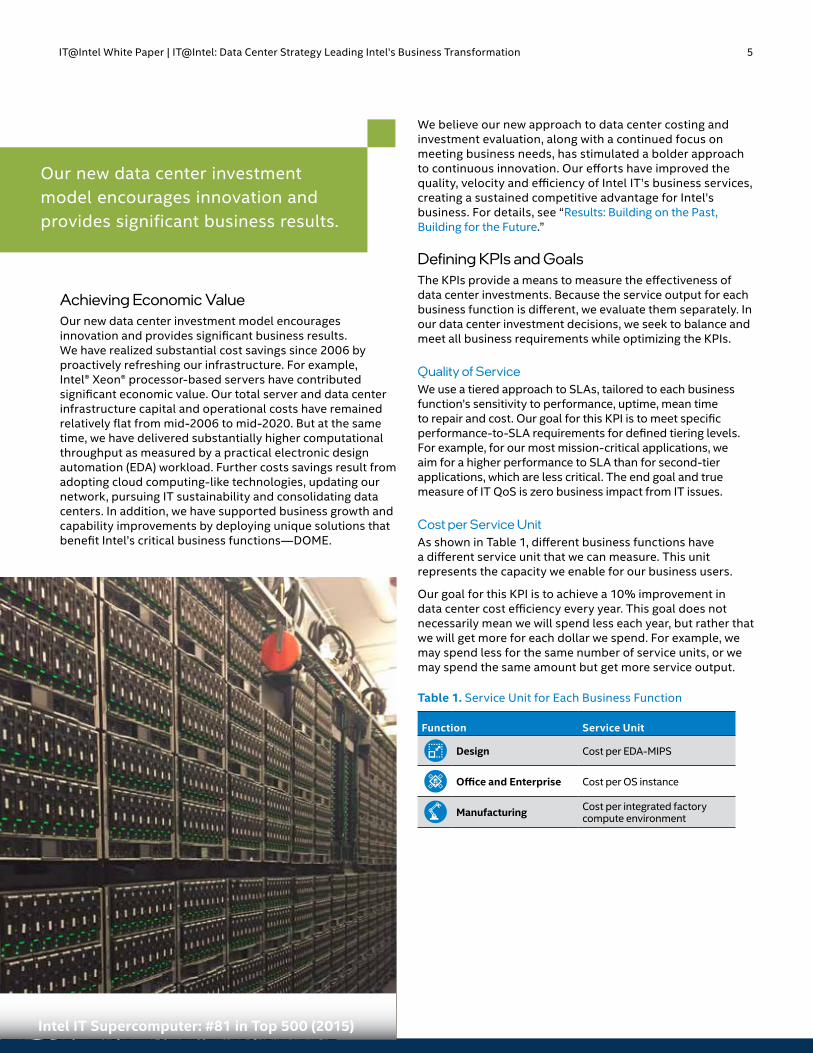
Achieving Economic ValueOur new data center investment model encourages innovation and provides significant business results. We have realized substantial cost savings since 2006 by proactively refreshing our infrastructure. For example, Intel® Xeon® processor-based servers have contributed significant economic value. Our total server and data center infrastructure capital and operational costs have remained relatively flat from mid-2006 to mid-2020. But at the same time, we have delivered substantially higher computational throughput as measured by a practical electronic design automation (EDA) workload. Further costs savings result from adopting cloud computing-like technologies, updating our network, pursuing IT sustainability and consolidating data centers. In addition, we have supported business growth and capability improvements by deploying unique solutions that benefit Intel’s critical business functions—DOME.
We believe our new approach to data center costing and investment evaluation, along with a continued focus on meeting business needs, has stimulated a bolder approach to continuous innovation. Our efforts have improved the quality, velocity and efficiency of Intel IT’s business services, creating a sustained competitive advantage for Intel’s business. For details, see “Results: Building on the Past, Building for the Future.”
Defining KPIs and GoalsThe KPIs provide a means to measure the effectiveness of data center investments. Because the service output for each business function is different, we evaluate them separately. In our data center investment decisions, we seek to balance and meet all business requirements while optimizing the KPIs.
Quality of ServiceWe use a tiered approach to SLAs, tailored to each business function’s sensitivity to performance, uptime, mean time to repair and cost. Our goal for this KPI is to meet specific performance-to-SLA requirements for defined tiering levels. For example, for our most mission-critical applications, we aim for a higher performance to SLA than for second-tier applications, which are less critical. The end goal and true measure of IT QoS is zero business impact from IT issues.
Cost per Service UnitAs shown in Table 1, different business functions have a different service unit that we can measure. This unit represents the capacity we enable for our business users.
Our goal for this KPI is to achieve a 10% improvement in data center cost efficiency every year. This goal does not necessarily mean we will spend less each year, but rather that we will get more for each dollar we spend. For example, we may spend less for the same number of service units, or we may spend the same amount but get more service output.
Table 1. Service Unit for Each Business Function
Function Service Unit
Design Cost per EDA-MIPS
Office and Enterprise Cost per OS instance
Manufacturing Cost per integrated factory compute environment
Our new data center investment model encourages innovation and provides significant business results.
Intel IT Supercomputer: #81 in Top 500 (2015)
IT@Intel White Paper | IT@Intel: Data Center Strategy Leading Intel’s Business Transformation 6
Effective Resource UtilizationOur refined data center strategy represents a dramatic shift in how we view resource utilization. Historically, we measured utilization of IT assets—compute, storage, network and facilities—by simply determining how busy or loaded an asset was. For example, if a server was working at peak capacity 90% of the time, we considered it 90% utilized. If 80% of available storage was allocated, we considered that 80% utilization.
In contrast, we now focus on the actual output of an asset—that is, effective utilization. For example, suppose Intel’s Design engineers start a million design jobs—thereby keeping the servers very busy. If a third of those jobs terminate before completion because there was not enough storage available, that is only 66% effective utilization of compute capacity. Or, if a customer consumes only 4 GB of a 10-GB storage allocation, the remaining 6 GB is essentially wasted storage. Even though it is allocated, it does not represent effective utilization of this asset. Our goal for the effective utilization KPI is to achieve 80% effective utilization of all IT assets.
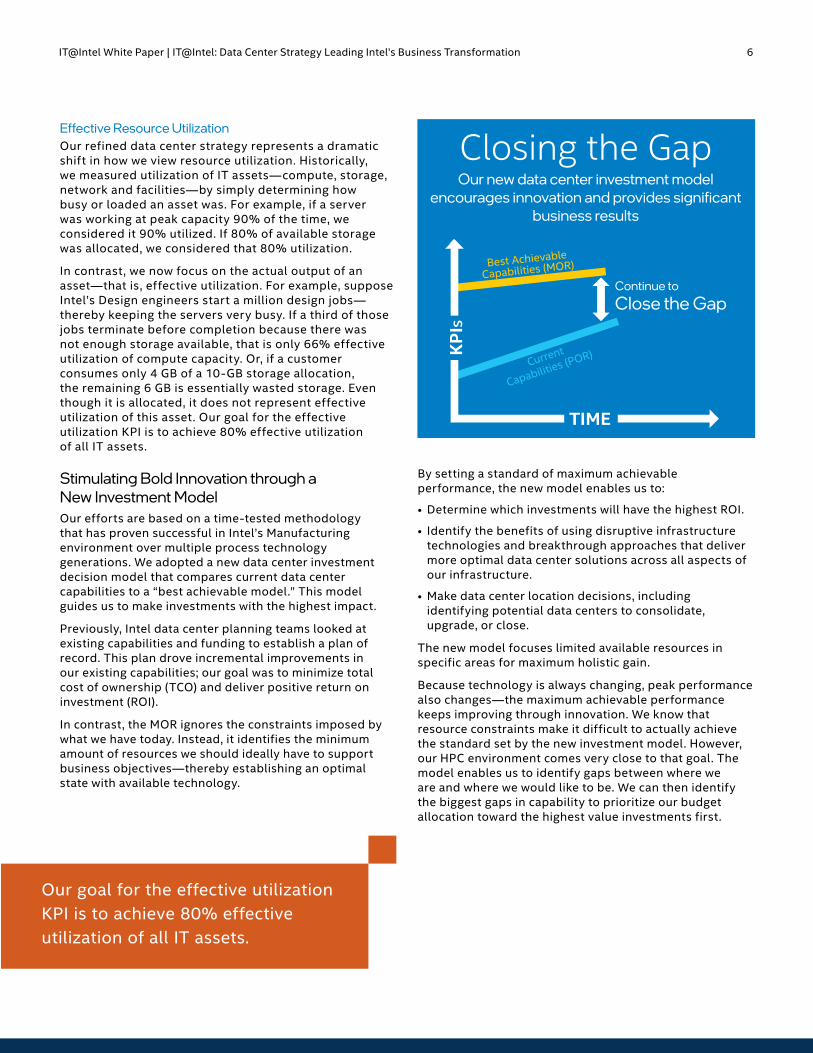
Stimulating Bold Innovation through a New Investment ModelOur efforts are based on a time-tested methodology that has proven successful in Intel’s Manufacturing environment over multiple process technology generations. We adopted a new data center investment decision model that compares current data center capabilities to a “best achievable model.” This model guides us to make investments with the highest impact.
Previously, Intel data center planning teams looked at existing capabilities and funding to establish a plan of record. This plan drove incremental improvements in our existing capabilities; our goal was to minimize total cost of ownership (TCO) and deliver positive return on investment (ROI).
In contrast, the MOR ignores the constraints imposed by what we have today. Instead, it identifies the minimum amount of resources we should ideally have to support business objectives—thereby establishing an optimal state with available technology.
By setting a standard of maximum achievable performance, the new model enables us to:
• Determine which investments will have the highest ROI.
• Identify the benefits of using disruptive infrastructure technologies and breakthrough approaches that deliver more optimal data center solutions across all aspects of our infrastructure.
• Make data center location decisions, including identifying potential data centers to consolidate, upgrade, or close.
The new model focuses limited available resources in specific areas for maximum holistic gain.
Because technology is always changing, peak performance also changes—the maximum achievable performance keeps improving through innovation. We know that resource constraints make it difficult to actually achieve the standard set by the new investment model. However, our HPC environment comes very close to that goal. The model enables us to identify gaps between where we are and where we would like to be. We can then identify the biggest gaps in capability to prioritize our budget allocation toward the highest value investments first.
Our new data center investment model encourages innovation and provides significant
business results
Closing the Gap
Current
Capabilities (POR)
Best Achievable
Capabilities (MOR)
TIME
KP
IS
Continue to
Close the Gap
Our goal for the effective utilization KPI is to achieve 80% effective utilization of all IT assets.

IT@Intel White Paper | IT@Intel: Data Center Strategy Leading Intel’s Business Transformation 7
Implementing a New Unit-Cost Financial ModelWe evolved our financial model from project- and component-based accounting to a more holistic unit-costing model. For example, we previously used a “break/fix” approach to data center retrofits. We would upgrade a data center facility or a portion of the facility in isolation, looking only at the project costs and the expected return on that investment. We had no holistic view as to the impact of service unit output. In contrast, today we focus on TCO per service unit—using the entire data center cost stack per unit of service delivered. This cost stack includes all cost elements associated with delivering business services and now considers the worldwide view of all data centers in the assessment of our investments.
As shown in Figure 3, there are six major categories of cost to consider: headcount, facilities, servers, OS and manageability, storage and backup/recovery and network. By adding these costs and then dividing by the total number of appropriate service units for the environment, we arrive at a cost per service unit.
Total Data Center Cost Categories
Determining the Cost per Service Unit
Total DOME-Specific Service Units
+ NetworkHeadcount
+ + Servers
+ Facilities OS and
Management
+ Storageand BaR
Design Manufacturing Office andEnterprise
DIVIDED BY
Figure 3. We arrive at a data center unit cost by considering all categories of cost and dividing by the number of units for that environment. Unit examples include EDA-MIPS in Design and OS instances in Office and Enterprise.
Service-based unit costing enables us to benchmark ourselves and prioritize data center investments. Determining service-based unit costs also allows us to measure and compare the performance of individual data centers to each other. This comparison helps us identify which data centers are not performing optimally and decide whether to upgrade or consolidate them.
To show how the new unit-based costing model works, Figure 4 compares Design cost data and Office and Enterprise cost data. The headcount category shows equal percentage of total cost in Office and Enterprise and in Design. In contrast, servers are more of a cost factor in Design than they are in Office and Enterprise. Knowing our exact unit cost in each environment, as well as the breakdown of that cost, enables us to develop optimized solutions for each environment that will have the greatest effect on cost efficiency and ROI.
2020 Unit-based Costing of IaaS
Headcount Facilities Servers OS/Management Storage/BaR Network
16.2%
14.6%
19.8%
25.8%
14.3%
9.3%38%
18.5%
16.3%
6.1%
20%
1.1%
DesignEnvironment
Office and EnterpriseEnvironment
Figure 4. Knowing total unit costs and individual cost category figures for each business environment, we can better choose IT investments that lower costs the most.
Intel IT Data Center Dashboard To better monitor and manage our worldwide network of data centers, we developed and deployed an integrated Intel IT Data Center Dashboard. This dashboard is modeled on a dashboard used in Intel’s Manufacturing environment.
This dashboard helps us monitor our KPIs by highlighting the current state and opportunities for optimization. We can thereby achieve overall improvements that align with our data center strategy goals.
For example, the dashboard can report on effective utilization of several data center resources, including EDA-MIPS; raw and utilized storage capacity; and facilities space, power and cooling.
This data can report statistics by business function or by data center, and can be used to compare KPIs and metrics across several data centers. The figure to the right shows a sample of the dashboard.
Design Environment Dashboard
100%
75%
50%
82.1%25%
0%
Effective Utilized MIPS

IT@Intel White Paper | IT@Intel: Data Center Strategy Leading Intel’s Business Transformation 8
Disaggregated Server ArchitectureThe first major server innovation since the introduction of blade servers in 2005
Results: Building on the Past, Building for the FutureThis section details some of the improvements and cost savings our data center strategy has enabled over the years, using our five primary tactics of embracing disruptive servers, adopting tiered storage, increasing facilities efficiency, driving network efficiency and improving operational efficiency. We are building on previous successes. Therefore, some of the results shown here are cumulative; others have been achieved over the last four years as a direct result of our MOR strategy. Our refined data center strategy enables us to support the growth of Intel’s customers, products and acquisitions. It also helps to enhance the quality, velocity and efficiency of the services we offer to Intel business groups.
We have dramatically improved performance and reduced costs for our data centers (Table 2).
Table 2. Data Center Improvements from 2003-2020
Data Center-wide
• Smaller total data center footprint• Improved overall storage and network practices • Increased data center facilities efficiency• Global street-to-server audit helps prioritize investments
Design Environment
• Deployed disaggregated servers• More efficient Design compute and storage• Increased Design throughput using NUMA-Booster• Faster Design throughput using Intel® SSDs
Office and Enterprise Environment
• More efficient Office and Enterprise compute and storage
As shown below, Intel IT has developed a disaggregated server architecture. The architecture separates the CPU/DRAM module and the NIC/Drives module on the motherboard. Redesigning the server to be modular enables us to upgrade the CPU/DRAM module while retaining the other components that are not ready for end-of-life. These include fans, power supplies, cables, network switches, drives, add-on module/accelerator, and chassis. The disaggregated server architecture is characterized by a CPU/DRAM complex or module and a NIC/Drives module. These modules can be refreshed independently of each other and of the rest of the server components. We have found that the disaggregated design offers the following benefits:
• No need to replace perfectly good components.• No need to reinstall the OS.• Cuts refresh costs by a minimum of 44%.
• Reduces technician time spent on refresh by 77%.• Decreases refresh materials’ shipping weight by 82%.
Example of a 1-Socket Disaggregated Server
Example of a 2-Socket Disaggregated Server
CPU and DRAMModule
AcceleratorModule
I/OModule
CPU and DRAMModule
I/OModule
NetworkSwitch
NetworkSwitch
ChassisManager
Battery Pack
Battery Pack Fans
Fans
Fans
Fans
Fans
Fans PowerSupply
PowerSupply
PowerSupply
PowerSupply
CPU andDRAM Module
Accelerator
I/O Module
CPU andDRAM Module
Accelerator
I/O Module
CPU andDRAM Module
Accelerator
I/O Module
NetworkSwitch
NetworkSwitch
ChassisManager
Battery Pack
Battery Pack Fans
Fans
Fans
Fans
Fans
Fans PowerSupply
PowerSupply
PowerSupply
PowerSupply
CPU and DRAM Module I/O Module
CPU and DRAM Module I/O Module
CPU and DRAM Module I/O Module
IT@Intel White Paper | IT@Intel: Data Center Strategy Leading Intel’s Business Transformation 9
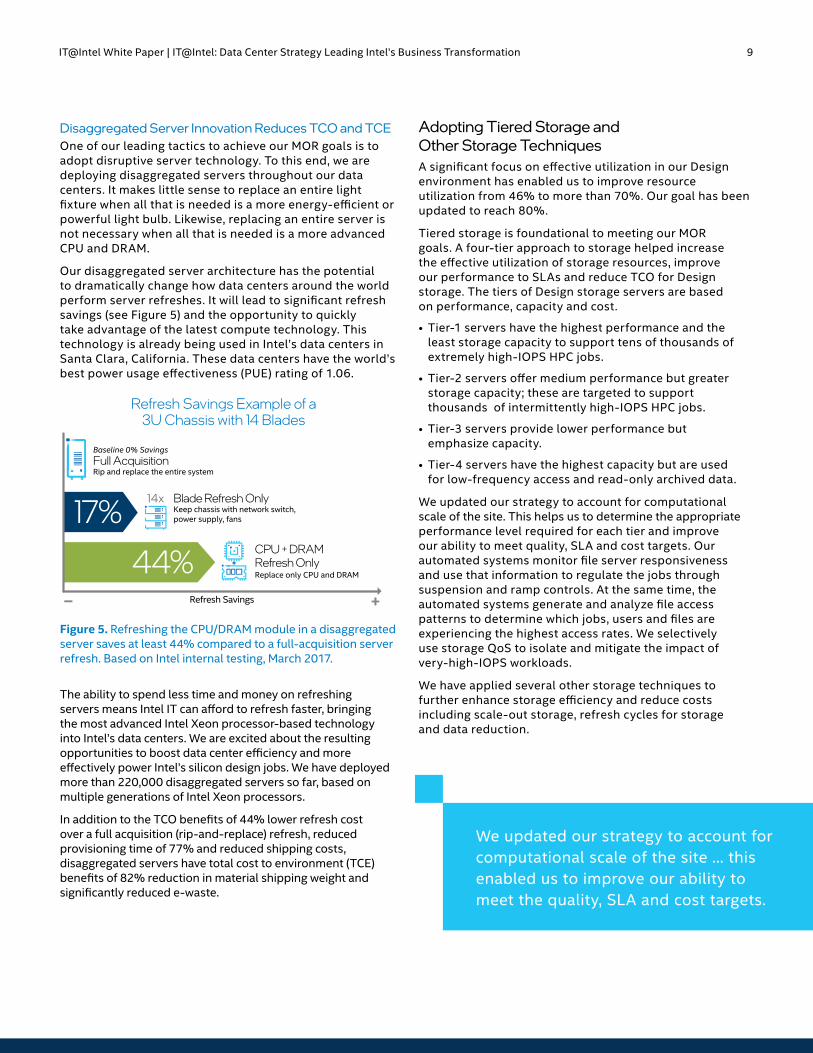
Disaggregated Server Innovation Reduces TCO and TCEOne of our leading tactics to achieve our MOR goals is to adopt disruptive server technology. To this end, we are deploying disaggregated servers throughout our data centers. It makes little sense to replace an entire light fixture when all that is needed is a more energy-efficient or powerful light bulb. Likewise, replacing an entire server is not necessary when all that is needed is a more advanced CPU and DRAM.
Our disaggregated server architecture has the potential to dramatically change how data centers around the world perform server refreshes. It will lead to significant refresh savings (see Figure 5) and the opportunity to quickly take advantage of the latest compute technology. This technology is already being used in Intel’s data centers in Santa Clara, California. These data centers have the world’s best power usage effectiveness (PUE) rating of 1.06.
Refresh Savings Example of a3U Chassis with 14 Blades
17%
44% Refresh Savings +–
Baseline 0% SavingsFull Acquisition Rip and replace the entire system
CPU + DRAMRefresh OnlyReplace only CPU and DRAM
Blade Refresh OnlyKeep chassis with network switch,power supply, fans
14x
Figure 5. Refreshing the CPU/DRAM module in a disaggregated server saves at least 44% compared to a full-acquisition server refresh. Based on Intel internal testing, March 2017.
The ability to spend less time and money on refreshing servers means Intel IT can afford to refresh faster, bringing the most advanced Intel Xeon processor-based technology into Intel’s data centers. We are excited about the resulting opportunities to boost data center efficiency and more effectively power Intel’s silicon design jobs. We have deployed more than 220,000 disaggregated servers so far, based on multiple generations of Intel Xeon processors.
In addition to the TCO benefits of 44% lower refresh cost over a full acquisition (rip-and-replace) refresh, reduced provisioning time of 77% and reduced shipping costs, disaggregated servers have total cost to environment (TCE) benefits of 82% reduction in material shipping weight and significantly reduced e-waste.
Adopting Tiered Storage and Other Storage TechniquesA significant focus on effective utilization in our Design environment has enabled us to improve resource utilization from 46% to more than 70%. Our goal has been updated to reach 80%.
Tiered storage is foundational to meeting our MOR goals. A four-tier approach to storage helped increase the effective utilization of storage resources, improve our performance to SLAs and reduce TCO for Design storage. The tiers of Design storage servers are based on performance, capacity and cost.
• Tier-1 servers have the highest performance and the least storage capacity to support tens of thousands of extremely high-IOPS HPC jobs.
• Tier-2 servers offer medium performance but greater storage capacity; these are targeted to support thousands of intermittently high-IOPS HPC jobs.
• Tier-3 servers provide lower performance but emphasize capacity.
• Tier-4 servers have the highest capacity but are used for low-frequency access and read-only archived data.
We updated our strategy to account for computational scale of the site. This helps us to determine the appropriate performance level required for each tier and improve our ability to meet quality, SLA and cost targets. Our automated systems monitor file server responsiveness and use that information to regulate the jobs through suspension and ramp controls. At the same time, the automated systems generate and analyze file access patterns to determine which jobs, users and files are experiencing the highest access rates. We selectively use storage QoS to isolate and mitigate the impact of very-high-IOPS workloads.
We have applied several other storage techniques to further enhance storage efficiency and reduce costs including scale-out storage, refresh cycles for storage and data reduction.
We updated our strategy to account for computational scale of the site … this enabled us to improve our ability to meet the quality, SLA and cost targets.
IT@Intel White Paper | IT@Intel: Data Center Strategy Leading Intel’s Business Transformation 10
Scale-out StorageWe have executed a strategic shift from a fragmented scale-up storage model to a pooled scale-out storage model. Scale-out storage better supports on-demand requests for performance and capacity. In addition, scale-out storage enables transparent data migration capabilities. It also increases the effective utilization of space freed by using efficiency technologies such as deduplication, compression and compaction. We are performing storage scaling on-demand for read-only storage areas, which require extremely high access rates. We use mount options to increase attribute caching and avoid wasteful locking options on read-only areas. This reduces the storage load by more than 50% and improves job throughput. We have also enabled high-performance shared scratch spaces to meet the demand from our hyperscale EDA compute environment. As we march towards significantly higher compute scale, where the impact of a storage overload is becoming more costly, we are shifting our bias towards achieving higher resiliency. This is achieved through increased redundancy and moderation of our storage capacity utilization targets.
Storage Refresh CycleTo improve performance and reduce cost, we implemented an efficiency-based refresh cycle. This enables us to take advantage of storage servers with better performance and more efficient energy use. This approach has reduced both capital and expense costs. For example, a more energy-efficient server can reduce data center power usage. A more powerful server that replaces several older servers can also reduce our data center footprint. It also helps us deliver better performance for our customers at a similar or lower cost per TB. Over the last few years, our refresh cycle has enabled us to shift from tape-based backup to disk-based backup with a newer
technology and architecture. This shift has made business continuity and rapid recovery from disaster a reality while reducing the backup cost and enhancing the SLA. We are also using this transition to further reduce our backup footprint. Our approach is to avoid backing up data for which it is more cost effective to regenerate it than to recover it from backup.
Data ReductionThe introduction of new storage to support company growth and our commitment to timely refresh are enabling us to use the latest generation of Intel Xeon processors. These processors provide us with the processing power to handle data deduplication, compaction and compression on our primary and backup storage servers. They have freed more than 124 PB of capacity, which we are making available for our users.
We continue to work closely with our internal design teams to achieve the following goals:
• Optimize their design flows to reduce the growth rate of their data and IOPS requirements.
• Dynamically adjust the allocations based on usage.
• Over-allocate capacity.
We have historically used efficient scanning algorithms to determine the age of files and then used that data to right-tier entire areas or subdirectories. We are now using block-level transparent data tiering to tier aged data to object storage. We combine the aging information with I/O activity to make more intelligent decisions to remove unused data within three to six months.
Increasing Facilities EfficiencyWe used our new investment model to evaluate the number of data centers we currently have and the number we should have. The new investment model identified opportunities to reduce the number of data centers using techniques such as the following:
• Closing, retrofitting, or reclassifying data centers and improving efficiency.
• Co-locating local infrastructure with Design and Manufacturing data centers or providing services from a server closet.
• Managing local infrastructure sites remotely.
• Improving facility power efficiency through strategic investments.
We have targeted 32 inefficient data centers since 2011. Our efforts have eliminated 66,375 square feet and converted 23,609 square feet of data center space to low-cost infrastructure rooms. This has saved Intel USD 25.45 million annually.
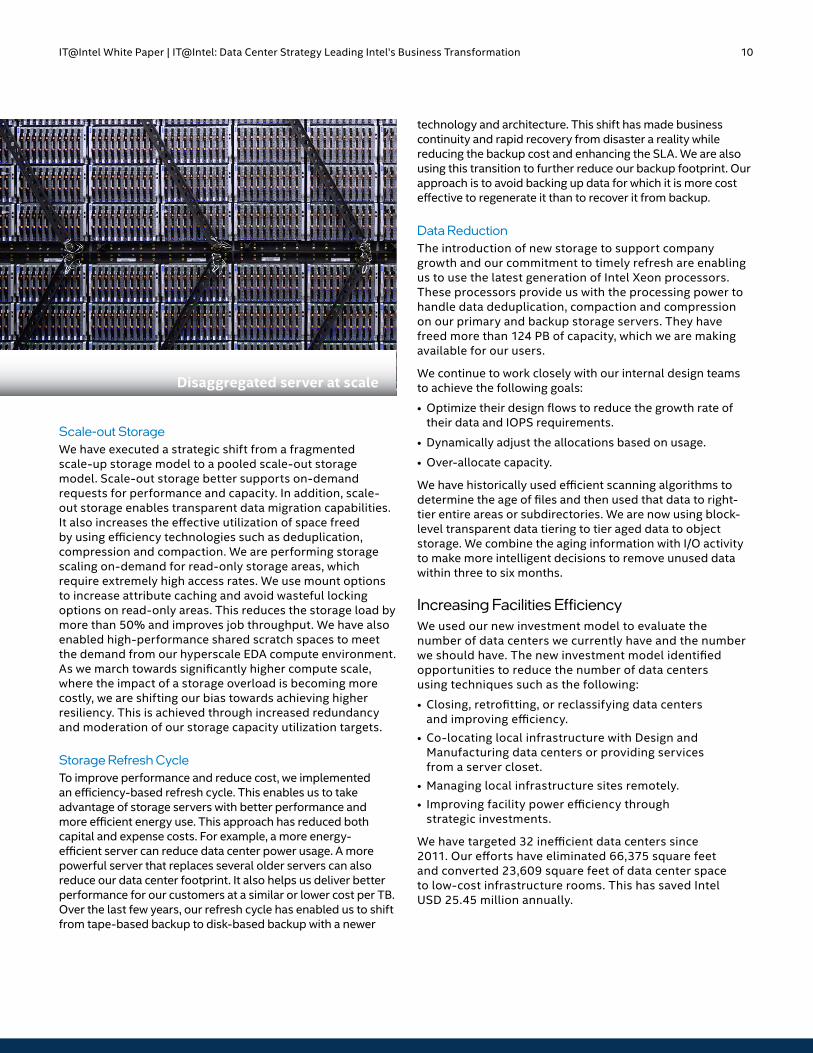
Disaggregated server at scale

IT@Intel White Paper | IT@Intel: Data Center Strategy Leading Intel’s Business Transformation 11
Figure 6 shows how we have consolidated our data center facilities from 2003-2021. We have reduced the total square footage by up to 19% and reduced the number of data centers from 152 to 56. Simultaneously, we increased our data center compute capacity and commissioned power by up to 106% from 50 MW to 103 MW over the last nine years. From 2012-2020, we have saved over 876 million KW hours compared to industry-standard data centers.
2003-2021 Data Center Modules
Sq. Feet Commissioned Power Total Data Center Modules
50 MW
64
85
103 MW
152Modules
2003
136
2005
91
2011
68
2012
60
2016
56
2020
56Modules
2021
482k Ft2
466k446k
419k
350k
356k390k Ft2
Overall Increasein Power
Since 2003
106%
Square FootageDecrease
Since 2003
~19%
Figure 6. Innovative data center designs have enabled us to decrease data center square footage while increasing power density and capacity.
Driving Network EfficiencyData center growth is continually placing greater demands on Intel’s network. In response, in 2010 Intel IT began to convert our data center network architecture to 10 GbE connections. Around 2015, we introduced 40 GbE to meet the inter-switch link capacity demand. In 2019, we started a multiyear journey to make 100 GbE pervasive within our data centers to keep up with the demand. Figure 7 illustrates the growth in data center network port deployments.
10/40/100 GbE Port Deployment
20202019201820172016201520142013201220112010
936 3,856 12,89618,136
37,88065,456
128,756155,082
176,109
87,692
3,121
6,525520
1,619
3,758
17,842
11,755
12,019
12,094
108,604Num
ber o
f Por
ts
10 GbE 40 GbE 100 GbE
201640 GbE Introduction
2017100 GbE Introduction
Figure 7. Implementing 10/40/100 GbE data center fabric design accommodates current capacity growth.
Data Center Evolution at IntelDriving Up Density While Driving Down Power Usage Effectiveness (PUE)
Gen 1 (1990s)Characterized by forced chilled air from the ceiling and no hot/cold air segregation, these early data centers could accommodate 42U racks with a power consumption of 5 KW—resulting in a PUE of >2.0. Data centers that used chilled air from the row end had a PUE of ~1.40.
Gen 2 (early to mid-2000s)With improvements such as raised-floor forced chilled air or hot/cold air segregation including chimney racks, density stayed at 42U, but power consumption delivered to the racks increased to as much as 30 KW, resulting in a lower PUE of ~1.18.
Gen 3 (2013 and beyond)Our modern data centers use free air cooling or close-coupled evaporative cooling to achieve an industry-leading PUE of 1.06, with an extreme rack density of 60U and up to 43 KW/rack.
Read More: Extremely Energy-Efficient High-Density Data Centers White Paper
IT@Intel White Paper | IT@Intel: Data Center Strategy Leading Intel’s Business Transformation 12
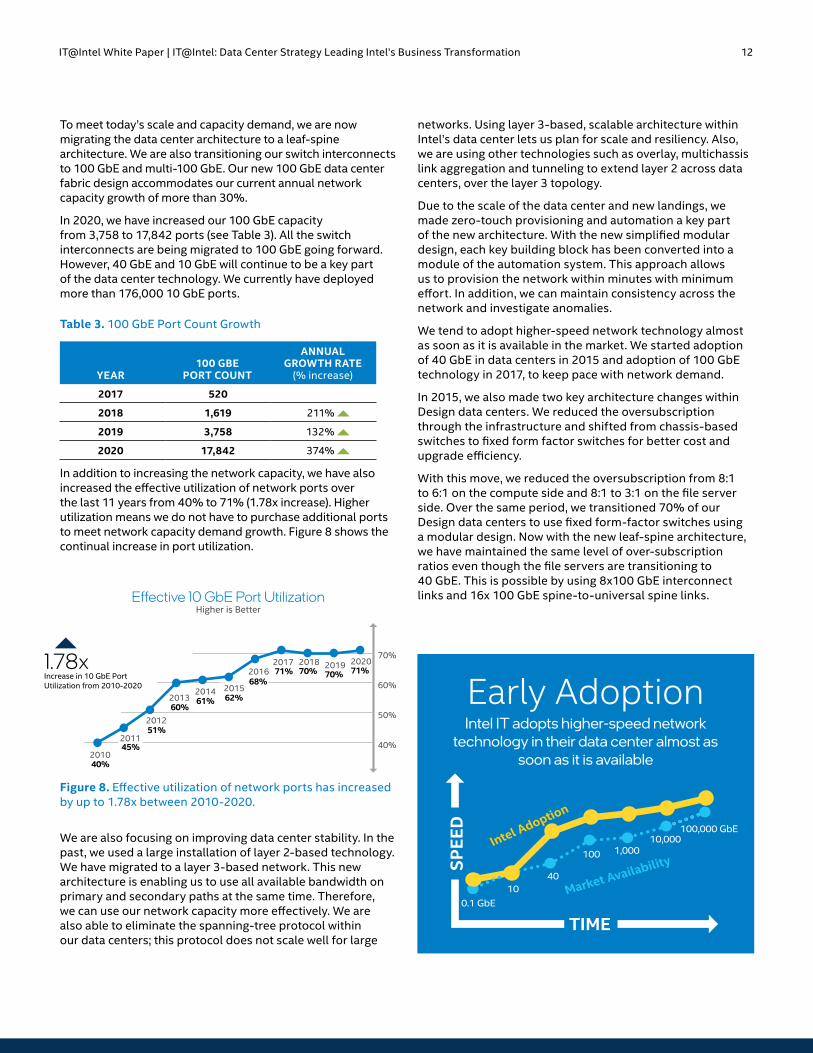
To meet today’s scale and capacity demand, we are now migrating the data center architecture to a leaf-spine architecture. We are also transitioning our switch interconnects to 100 GbE and multi-100 GbE. Our new 100 GbE data center fabric design accommodates our current annual network capacity growth of more than 30%.
In 2020, we have increased our 100 GbE capacity from 3,758 to 17,842 ports (see Table 3). All the switch interconnects are being migrated to 100 GbE going forward. However, 40 GbE and 10 GbE will continue to be a key part of the data center technology. We currently have deployed more than 176,000 10 GbE ports.
Table 3. 100 GbE Port Count Growth
YEAR100 GBE
PORT COUNT
ANNUAL GROWTH RATE
(% increase)
2017 520
2018 1,619 211%
2019 3,758 132%
2020 17,842 374%
In addition to increasing the network capacity, we have also increased the effective utilization of network ports over the last 11 years from 40% to 71% (1.78x increase). Higher utilization means we do not have to purchase additional ports to meet network capacity demand growth. Figure 8 shows the continual increase in port utilization.
40%
50%
60%
70%
201040%
201145%
201251%
201360%
201461%
201562%
201668%
201771%
201870%
201970%
202071%
Effective 10 GbE Port UtilizationHigher is Better
Increase in 10 GbE PortUtilization from 2010-2020
1.78x
Figure 8. Effective utilization of network ports has increased by up to 1.78x between 2010-2020.
We are also focusing on improving data center stability. In the past, we used a large installation of layer 2-based technology. We have migrated to a layer 3-based network. This new architecture is enabling us to use all available bandwidth on primary and secondary paths at the same time. Therefore, we can use our network capacity more effectively. We are also able to eliminate the spanning-tree protocol within our data centers; this protocol does not scale well for large
networks. Using layer 3-based, scalable architecture within Intel’s data center lets us plan for scale and resiliency. Also, we are using other technologies such as overlay, multichassis link aggregation and tunneling to extend layer 2 across data centers, over the layer 3 topology.
Due to the scale of the data center and new landings, we made zero-touch provisioning and automation a key part of the new architecture. With the new simplified modular design, each key building block has been converted into a module of the automation system. This approach allows us to provision the network within minutes with minimum effort. In addition, we can maintain consistency across the network and investigate anomalies.
We tend to adopt higher-speed network technology almost as soon as it is available in the market. We started adoption of 40 GbE in data centers in 2015 and adoption of 100 GbE technology in 2017, to keep pace with network demand.
In 2015, we also made two key architecture changes within Design data centers. We reduced the oversubscription through the infrastructure and shifted from chassis-based switches to fixed form factor switches for better cost and upgrade efficiency.
With this move, we reduced the oversubscription from 8:1 to 6:1 on the compute side and 8:1 to 3:1 on the file server side. Over the same period, we transitioned 70% of our Design data centers to use fixed form-factor switches using a modular design. Now with the new leaf-spine architecture, we have maintained the same level of over-subscription ratios even though the file servers are transitioning to 40 GbE. This is possible by using 8x100 GbE interconnect links and 16x 100 GbE spine-to-universal spine links.
Intel IT adopts higher-speed network technology in their data center almost as
soon as it is available
Early Adoption
TIME
SPEE
D
Market Availability
0.1 GbE10
40
100 1,00010,000
100,000 GbEIntel Adoption

IT@Intel White Paper | IT@Intel: Data Center Strategy Leading Intel’s Business Transformation 13
Achieving More Efficient Design Compute and Storage
One of the major challenges in our Design environment is that server and storage growth is occurring at a high rate. Average annual growth rate of compute capacity demand over the last 11 years is up to 31%, while storage has grown annually at up to 39% (see Figure 9).
We expect the number of cores to continue to increase. We plan to measure data center performance based on number of cores, number of racks, power consumed, and the extent to which we meet the meaningful indicator of performance per system (MIPS) demand.
Compute and Storage DemandDesign
Design Servers (1k) EDA-MIPS (10K) Cores (10K) Raw Storage (PB)
2015 2016201420132012201120102009 2017 2018 2019 2020
1115 21
3243
59
83
120
27 3138
4556
69
95 117
154
229
345
413 PB
145
161
192
237
2029
4053
75101
143
189
239
271
329
380
4856 45 39 48 74 126 161 206 228 262 302
2013High-Density Racks
Introduced140-180 servers/rack
2016Disaggregated Servers
Introduced280 servers/rack
PB INCREASE2010-2020 Average AnnualRaw Storage Demand Growth
39%
EDA-MIPS INCREASE2010-2020 Average AnnualCompute Demand Growth
31%
Figure 9. Despite continuing growth in compute and storage demand, our Design data centers are using powerful Intel technology to meet demand.
6th Generation of HPCDesigning Intel® microprocessors is compute intensive. Tapeout is a final step in silicon design, and its computation demand is growing exponentially for each generation of silicon process technology. Intel IT adopted HPC to address this large computational scale and realized significant improvements in computing performance, reliability and cost.
As shown in Figure 10, our HPC solution has enabled an up to 293x growth in tapeout compute capacity from 2005 to 2020. We are now using the 6th generation of our HPC solution and will continue to develop new HPC generations as Intel process technology advances. The figure also shows our commitment to quality. Through a disciplined approach to change management (basically running our data centers as if they are factories), we have reduced the number of compute issues that impact tapeout by 107x.
Intel Tapeout Computing Metrics
2005 2021
Low
erH
ighe
r 32.2
1.00x 3.95x 7.39x13.2x 17.32x
20.58x29.87x
40.94x51.87x
90.21x
121.78x
156.02x
293.18x
252.59x
383.39x
3.85.4
3.82.9
1.3 1.6 1.00.5 0.5 0.3 0.30.20.5
Compute Issues Impacting Tapeout (Issue per 1,000 masks)Normalized Tapeout Processing Capacity
HPC-145nm
HPC-232nm
HPC-322nm
HPC-414nm
HPC-6Intel 4
HPC-510nm
Pre-HPC
lower is betterhigher is better
Decrease inIssues ImpactingTapeout
107x
Increase inProcessingCapacity
293x
Figure 10. Our HPC solution, combined with disciplined change management, has steadily increased compute capacity and improved QoS.
Increased Design Throughput Using NUMA-BoosterOverall data center optimization includes more than simply looking at server performance and facility efficiency. Application performance and workload optimization can also be contributing factors. We developed a system software capability called NUMA-Booster. This feature automatically and transparently intercepts all Design workloads running on two-socket batch servers and performs workload scheduling better than the default OS scheduling capability. Our tests have shown an average 17% improvement in Design performance on these two-socket servers. We are also deploying large-scale single-socket servers when possible. These servers do not need the NUMA-Booster feature, and can further increase overall Design performance.
IT@Intel White Paper | IT@Intel: Data Center Strategy Leading Intel’s Business Transformation 14
Increased Design Throughput Using Intel® SSDs as Fast Local Data Cache DrivesIntel silicon chip Design engineers face the challenge of integrating more features into ever-shrinking silicon chips, resulting in more complex designs. The increasing design complexity creates large electronic design automation workloads that have considerable memory and compute requirements.
We typically run the workloads on servers that need to be configured to meet these requirements in the most cost-effective way.
Intel IT has deployed over 40 PB of Intel SSD storage in over 20,000 servers as fast local data cache drives. This approach improves workload performance due to reduced network traffic and storage demand.
Optimizing Servers to Meet Compute DemandIntel silicon design is continually increasing in complexity. To achieve concomitant faster time to market improvements, Intel IT provides a global framework for parallel hardware and software design of numerous System on a Chip platforms and IP blocks.
Matching single-socket servers and highly scalable server configurations in our data centers yields 25 to 30% faster product design and architecture validation processes. We use a global scheduling mechanism that pools compute capacity of over 321,000 servers at multiple sites around the world. In this way, our design hub provides scalable capacity and delivers optimal memory and compute capability in a shorter amount of time.
Since the first disaggregated server design in 2016, we have continued to evolve the concept. We currently have deployed more than 220,000 disaggregated servers, using 13 different blade designs including both single-socket and two-socket servers. We use the Intel Xeon processor E family, Intel Xeon processor W family and Intel Xeon Scalable processors. The various models are targeted to meet specific workload requirements, such as different memory capacity, throughput or number of performance cores, high bandwidth, high IOPS storage needs or the ability to add in accelerator cards on demand.
Enhanced User Experience across the Global HPC Design CommunityWe were able to successfully consolidate batch activities into our global compute hubs. Further consolidation was limited by the following:
• We didn’t want to negatively impact user experience for interactive users across the globe.
• We needed to provide local copies of critical data rapidly over the high-latency international WAN links.
We are now able to provide a game-changing remote interactive computing user experience by using User Datagram Protocol (UDP) instead of Transmission Control Protocol (TCP) for interactive jobs over the WAN. Using UDP has provided up to 4.5x faster response for computer-aided design (CAD) modeling.3 We have reached the stage where our international design team members have a better user experience and higher throughput when working from home with systems in the US hubs than their local data centers. We also delivered up to 9x improvement in data transfer rates across the WAN through in-depth collaboration with internal and external technology experts.3 This collaboration optimized the TCP stack, which can take full advantage of high-speed WAN links. The interactive computing and data replication improvements were achieved within existing WAN bandwidth. Combined, these achievements enable us to provide rapid turnaround through the hubs for the model build, design synthesis, layout and tapein cycle.
3 According to internal Intel IT measurements, February 2020.
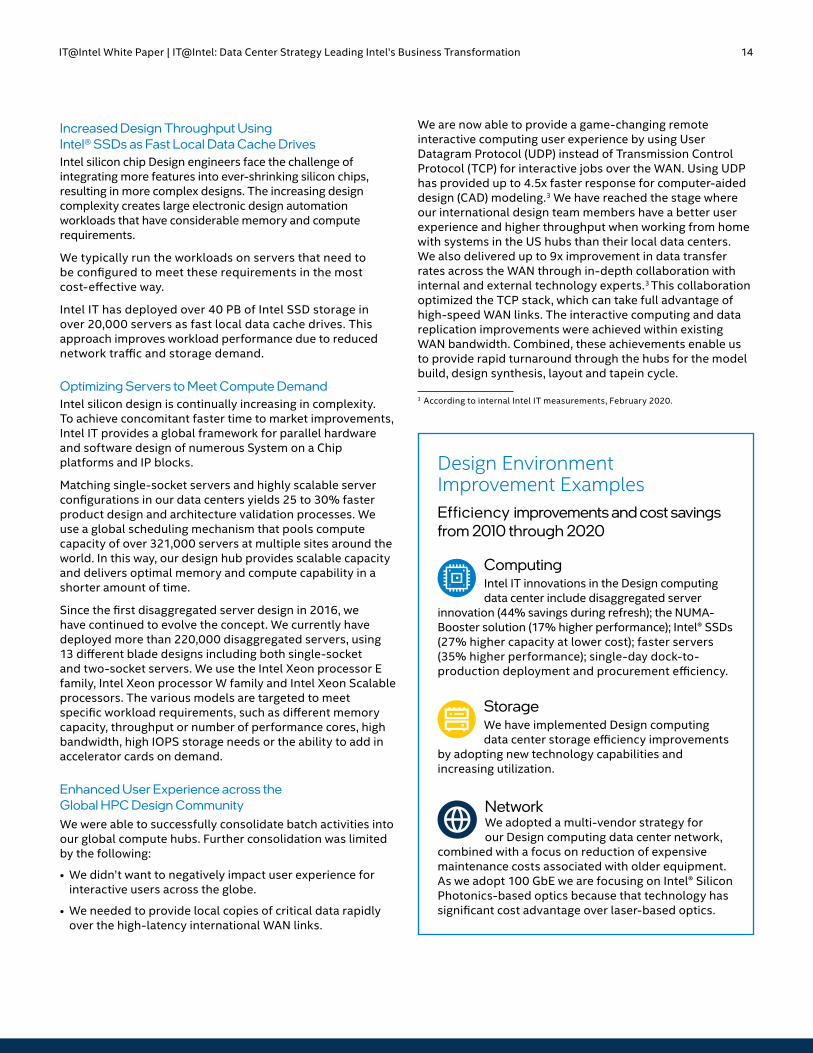
Design Environment Improvement ExamplesEfficiency improvements and cost savings from 2010 through 2020
ComputingIntel IT innovations in the Design computing data center include disaggregated server
innovation (44% savings during refresh); the NUMA-Booster solution (17% higher performance); Intel® SSDs (27% higher capacity at lower cost); faster servers (35% higher performance); single-day dock-to-production deployment and procurement efficiency.
StorageWe have implemented Design computing data center storage efficiency improvements
by adopting new technology capabilities and increasing utilization.
NetworkWe adopted a multi-vendor strategy for our Design computing data center network,
combined with a focus on reduction of expensive maintenance costs associated with older equipment. As we adopt 100 GbE we are focusing on Intel® Silicon Photonics-based optics because that technology has significant cost advantage over laser-based optics.
IT@Intel White Paper | IT@Intel: Data Center Strategy Leading Intel’s Business Transformation 15
Design Zones Enable Highly Resilient Scaling at the HubsThe dramatic increase in computing scale in a shared network-attached storage (NAS) environment with a large number of compute servers can overwhelm the storage server. It can also introduce significant efficiency and reliability concerns when 10,000 or more such systems share the same Network File System (NFS) area and expect very high IOPS or throughput rates. We addressed this in our mission-critical tapeout environment. This environment runs parallel workflows that span the entire compute environment. We introduced the concept of partitioning the compute in the two major hubs into smaller, self-contained sites. Each site has its own NFS storage and management infrastructure. We worked with our tapeout team to update the tools, flows and work methods, along with IT software. As a result, we were able to scale while maintaining the efficiency and improving resiliency and scalability.
We later experienced the same scaling challenges for the rest of the HPC design environment in the hub. These issues were caused by the increased sharing at higher scale, and could not be addressed cost effectively or efficiently by the storage changes alone. We built on the tapeout “sites” concept to introduce design zones into the design hub computing environment. We successfully scaled multiple zones and achieved adequate separation to provide the necessary increased scale and reliability in a cost-effective manner. This is a challenging and ongoing effort. We must contend with decades’ worth of legacy interdependencies across project and business units. These interdependencies use symbolic links and shared source files, tools and flows. We expect that the profiling work that we are doing, combined with our efforts with containers, will enable us to achieve truly independent, scalable and resilient zones without sacrificing efficiency or the agility to respond to peak computing demands.
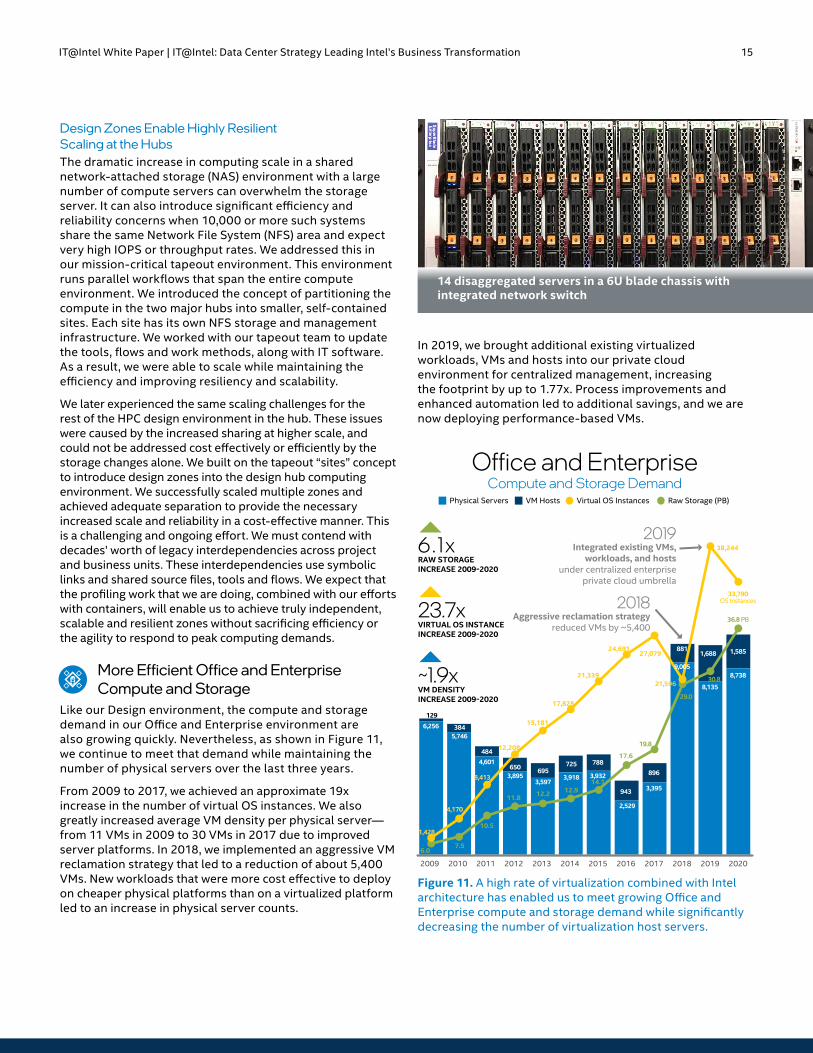
More Efficient Office and Enterprise Compute and Storage
Like our Design environment, the compute and storage demand in our Office and Enterprise environment are also growing quickly. Nevertheless, as shown in Figure 11, we continue to meet that demand while maintaining the number of physical servers over the last three years.
From 2009 to 2017, we achieved an approximate 19x increase in the number of virtual OS instances. We also greatly increased average VM density per physical server—from 11 VMs in 2009 to 30 VMs in 2017 due to improved server platforms. In 2018, we implemented an aggressive VM reclamation strategy that led to a reduction of about 5,400 VMs. New workloads that were more cost effective to deploy on cheaper physical platforms than on a virtualized platform led to an increase in physical server counts.
In 2019, we brought additional existing virtualized workloads, VMs and hosts into our private cloud environment for centralized management, increasing the footprint by up to 1.77x. Process improvements and enhanced automation led to additional savings, and we are now deploying performance-based VMs.
Compute and Storage DemandPhysical Servers VM Hosts Virtual OS Instances Raw Storage (PB)
Office and Enterprise
2015 2016201420132012201120102009 2017 2018 2019 2020
2018Aggressive reclamation strategy
reduced VMs by ~5,400
2019Integrated existing VMs,
workloads, and hosts under centralized enterprise
private cloud umbrella
7.5
10.5
11.8 12.2 12.914.1
17.6
19.8
29.0
30.8
36.8 PB
6.0
384
129
484
650 695725 788
943
896
1,688881 1,585
1,428
8,413
12,208
15,181
17,828
21,339
24,69127,079
21,596
38,244
33,790OS Instances
4,170 2,529
5,7466,256
4,601
3,8953,597
3,918 3,932
9,005
3,395
8,135
8,738
VIRTUAL OS INSTANCEINCREASE 2009-2020
23.7x
VM DENSITY INCREASE 2009-2020
~1.9x
RAW STORAGEINCREASE 2009-2020
6.1x
Figure 11. A high rate of virtualization combined with Intel architecture has enabled us to meet growing Office and Enterprise compute and storage demand while significantly decreasing the number of virtualization host servers.
14 disaggregated servers in a 6U blade chassis with integrated network switch
IT@Intel White Paper | IT@Intel: Data Center Strategy Leading Intel’s Business Transformation 16
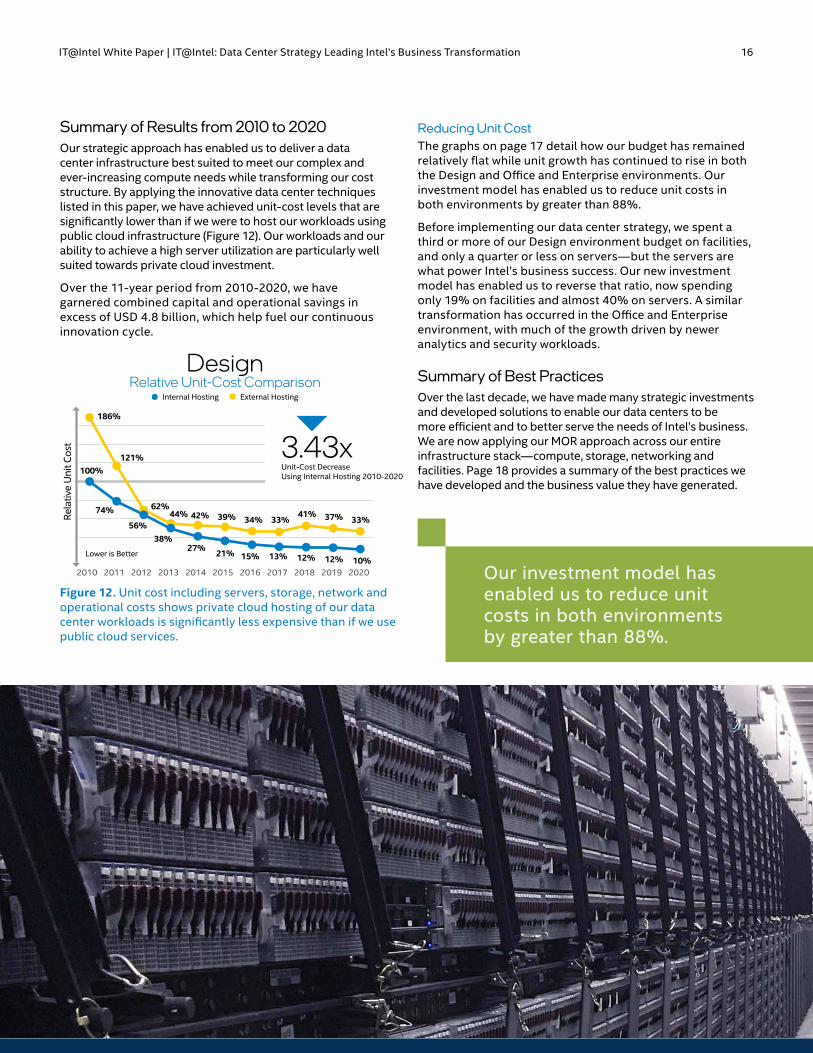
Summary of Results from 2010 to 2020Our strategic approach has enabled us to deliver a data center infrastructure best suited to meet our complex and ever-increasing compute needs while transforming our cost structure. By applying the innovative data center techniques listed in this paper, we have achieved unit-cost levels that are significantly lower than if we were to host our workloads using public cloud infrastructure (Figure 12). Our workloads and our ability to achieve a high server utilization are particularly well suited towards private cloud investment.
Over the 11-year period from 2010-2020, we have garnered combined capital and operational savings in excess of USD 4.8 billion, which help fuel our continuous innovation cycle.
Relative Unit-Cost ComparisonDesign
Rela
tive
Uni
t Cos
t
Internal Hosting External Hosting
2019 2020201820172016201520142013201220112010
186%
100%121%
74%
56%
62%44%
38%
42%
27%
39% 34% 33%41% 37% 33%
21% 15% 13% 12% 12% 10%Lower is Better
Unit-Cost Decrease Using Internal Hosting 2010-2020
3.43x
Figure 12. Unit cost including servers, storage, network and operational costs shows private cloud hosting of our data center workloads is significantly less expensive than if we use public cloud services.
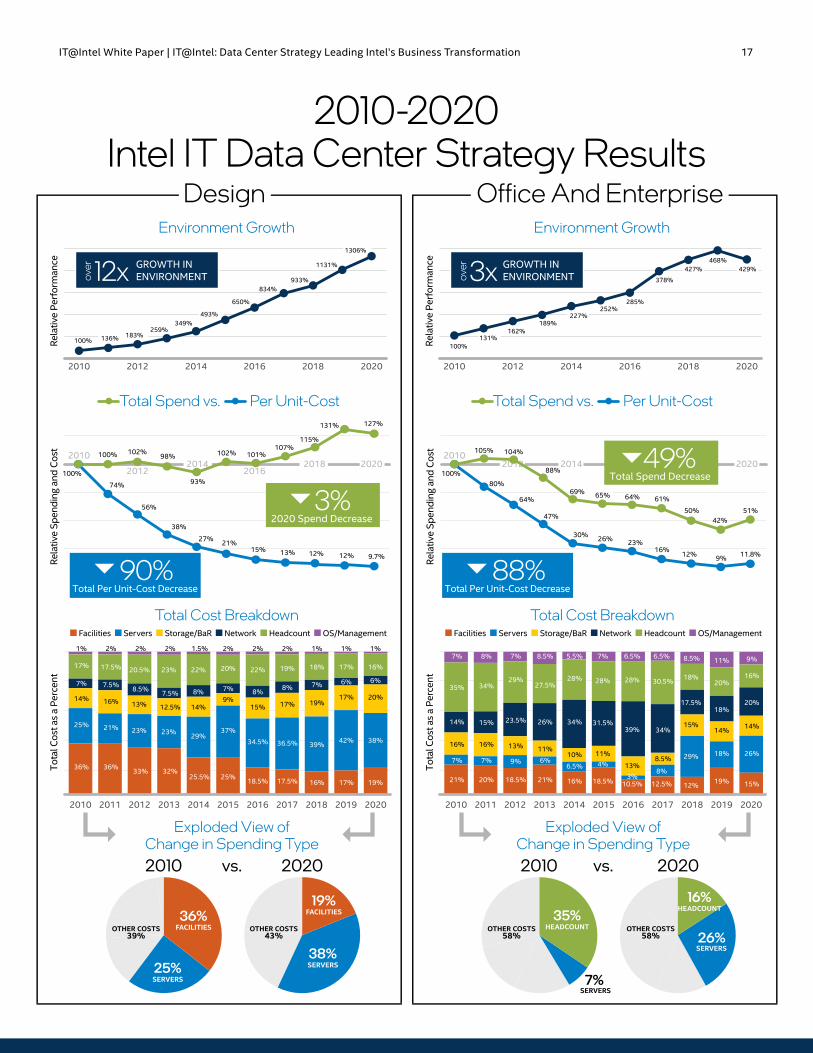
Reducing Unit CostThe graphs on page 17 detail how our budget has remained relatively flat while unit growth has continued to rise in both the Design and Office and Enterprise environments. Our investment model has enabled us to reduce unit costs in both environments by greater than 88%.
Before implementing our data center strategy, we spent a third or more of our Design environment budget on facilities, and only a quarter or less on servers—but the servers are what power Intel’s business success. Our new investment model has enabled us to reverse that ratio, now spending only 19% on facilities and almost 40% on servers. A similar transformation has occurred in the Office and Enterprise environment, with much of the growth driven by newer analytics and security workloads.
Summary of Best PracticesOver the last decade, we have made many strategic investments and developed solutions to enable our data centers to be more efficient and to better serve the needs of Intel’s business. We are now applying our MOR approach across our entire infrastructure stack—compute, storage, networking and facilities. Page 18 provides a summary of the best practices we have developed and the business value they have generated.
Our investment model has enabled us to reduce unit costs in both environments by greater than 88%.
IT@Intel White Paper | IT@Intel: Data Center Strategy Leading Intel’s Business Transformation 17
202020182016201420122010
Rela
tive
Perf
orm
ance
Environment Growth
GROWTH INENVIRONMENT 3x ov
er
Design
Total Spend vs. Per Unit-Cost
Rela
tive
Spen
ding
and
Cos
t
100%
74%
56%
38%
27% 21%15% 13% 9.7%12%12%
100% 102%98%
93%
102% 101%107%
127%131%
115%
Total Cost Breakdown
Tota
l Cos
t as
a Pe
rcen
t
20202019201820172016201520142013201220112010
HeadcountFacilities Servers OS/ManagementStorage/BaR Network
36% 36% 33% 32%25.5% 25% 18.5% 17.5% 16%
25% 21% 23% 23% 29%37%
34.5% 36.5% 39%
14% 16% 13% 12.5% 14%9%
15% 17% 19%
7% 7.5% 8.5% 7.5% 8% 7% 8% 8% 7%
17% 17.5% 20.5% 23% 22% 20% 22% 19% 18%
1% 2% 2% 2% 1.5% 2% 2% 2% 1%
17%
42%
17%
6%
17%
1%
19%
38%
20%
6%
16%
1%
2010 vs. 2020
OTHER COSTS39%
OTHER COSTS43%
Exploded View of Change in Spending Type
202020182016201420122010
Rela
tive
Perf
orm
ance
Environment Growth
GROWTH INENVIRONMENT 12x ov
er
100% 136%259%
349%
650%
834%933%
1131%
1306%
183%
493%
Office And Enterprise
Total Cost Breakdown
Tota
l Cos
t as
a Pe
rcen
t
20202019201820172016201520142013201220112010
100%131%
162%189%
227%252%
285%
378%
427%468%
21% 20% 18.5% 21% 16% 18.5% 10.5% 12.5% 12%
7% 7% 9% 6%6.5% 4%
3%8%
29%
16% 16% 13% 11%10% 11%
13%8.5%
15%14% 15% 23.5% 26% 34% 31.5%39% 34%
17.5%
35% 34%29%
27.5%28% 28% 28% 30.5% 18%
7% 8% 7% 8.5% 5.5% 7% 6.5% 6.5% 8.5%
19%
18%
14%
18%
20%
11%
15%
26%
14%
20%
16%
9%
2010 vs. 2020
OTHER COSTS58%
OTHER COSTS58%
HEADCOUNT
SERVERS
Exploded View of Change in Spending Type
HeadcountFacilities Servers OS/ManagementStorage/BaR Network
202020182016201420122010
Total Spend vs. Per Unit-Cost
Rela
tive
Spen
ding
and
Cos
t
100%80%
64%
47%
30% 26% 23%16%
9% 11.8%12%
105% 104%
88%
69% 65% 64% 61%
50%42%
51%
429%
202020182016
20142012
2010
Total Per Unit-Cost Decrease 90%
Total Per Unit-Cost Decrease 88%
35%
SERVERS38%
FACILITIES19%
SERVERS25%
FACILITIES36%
HEADCOUNT16%
7%
SERVERS26%
2020 Spend Decrease 3%
Total Spend Decrease 49%
2010-2020 Intel IT Data Center Strategy Results

IT@Intel White Paper | IT@Intel: Data Center Strategy Leading Intel’s Business Transformation 18
ServersAdopt disaggregated servers• Saves at least 44% over a full acquisition (rip-and-replace) refresh• Reduces provisioning time (IT technician labor) by as much as 77%• Decreases shipping weight of refreshed server material by 82%
Adopt elastic computing services and technologies• Virtualized the majority of Office and Enterprise servers• Reduced the time it takes to provision a server from 90 days to
on-demand provisioning using virtualization • Enabled containers as a service
Enable one-day dock-to-production for physical servers• Upfront planning and process enhancement to order long-lead time
items and rack readiness, reducing the dock-to-production release from 10+ days to one day
Regularly refresh servers using the latest Intel® Xeon® processors• Virtualization ratios of up to 60:1• Reduced Design environment energy consumption by 10% annually
between 2008 and 2013
Deploy Intel® SSDs as the standard local disk in all new servers• Improved performance for I/O-intensive workloads and expected
reduction of disk failure rates
Migrate applications from RISC to Intel® architecture• Enabled significant savings and IT efficiencies• Allowed us to realize the benefits of industry-standard operating systems
and hardware
Deploy HPC• 293x increase in capacity during HPC-6, with an 107x increase in stability• Saved USD 44.72 million net present value during HPC-1 itself
Enhance server performance through software optimization• Increased Design job throughput up to 49%• Delivered various optimizations including disaggregated servers, NUMA-
Booster, fast local data cache based on Intel SSDs and high-frequency servers and optimal workload to platform pairing
• Significant performance improvement of data replication (up to 9x) and interactive jobs (up to 4.5x) over the WAN (Internal Intel IT, February 2020)
StorageRefresh and modernize storage using the latest generations of Intel Xeon processors• Take advantage of new technology to increase storage capacity, quality,
velocity and efficiency at a lower cost• More than twice the I/O throughput than older systems• Reduced our data center storage hardware footprint by more than
50% in 2011-2012• Reduced backup infrastructure cost due to greater sharing of resources• Tiered backup solutions to optimize backup costs and improve reliability
Implement thin provisioning and deduplication for storage resources• Helps control costs and increase resource utilization without adversely
affecting performance • Increased effective storage utilization in Design from 46% in 2011 to more
than 70% now
Right-size storage solutions using a tiered model• Provide storage resources based on business needs: performance, reliability,
capacity and cost• Better management of storage costs while still enabling easy access to
necessary data• Transition to scale-out storage to reduce operational complexity in tiering data• Automated policy-based data migration between tiers
Continuously monitor and reclaim disk space consumed by aged data• More than USD 1 million in capital expenditure avoidance in 2011
Scale storage on demand and provide high-performance shared scratch spaces• Enables higher workload throughput for read-only storage areas that
require high access
FacilitiesIncrease cooling efficiency• From 2012-2020, we have saved over 876 million KW hours compared
to industry-standard data centers
Use a tiered approach to redundancy, availability and physical hardening• Better matching of data center redundancy and availability features to
business requirements• Reduced wasted power by more than 7% by eliminating redundant power
distribution systems within a data center
Retrofit and consolidate data centers using a modular design• Retrofitted old wafer fabrication plant to high-density, high-efficiency data
center modules with industry-leading PUE of 1.06• Utilized free-air cooling and environmentally efficient evaporative cooling for
maximum energy efficiency• Avoided capital expenditures by not equipping the entire facility with generators• Quickly responded to changing data center needs with minimal effort and cost
2010-2020 Intel IT Data Center Best Practices
NetworkUpgrade data center LAN architecture to support 10/40/100 GbE• Increased data center network bandwidth by 400% over three years,
enabling us to respond faster to business needs and accommodate growth• Increased the network utilization from 40 to 71% between 2010 to 2020• Eliminated spanning tree with multi-chassis link aggregation and
Layer 3 protocol• Reduced network complexity due to fewer NIC and LAN ports• Reduced network cost in our virtualized environment by 18 to 25%
Open the data center network to multiple suppliers• Generated more than USD 60 million in cost avoidance over
five years with new network technology
Deploy Intel® Silicon Photonics optical transceivers• For large-scale 100 GbE deployment, leveraged Intel® Silicon
Photonics to significantly reduce the per-port cost

IT@Intel White Paper | IT@Intel: Data Center Strategy Leading Intel’s Business Transformation 19
EmbraceDisruptive Servers
IncreaseFacility Efficiency
AdoptTiered Storage
DriveNetwork Efficiency
ImproveOperational
Efficiency
Intel IT MOR Tactics
Plans for 2021 and BeyondOur data center strategy is continuously improving. We are always striving to close the gap between current achievements and the best possible scenario. To that end, we plan to continue to apply the MOR approach to our primary enabling tactics:
• Embrace disruptive servers. Deploy ultra-dense, power-optimized disaggregated server nodes to reduce data center space and power consumption for computing needs.
• Adopt standards-based storage. Use industry-standard hardware and software for scale-up and scale-out storage to take advantage of the latest hardware. This will enable higher throughput more rapidly. Use strategic planning and storage protection technologies to deliver both backup and disaster-recovery coverage while reducing backup cost. Enhance automation to achieve fully autonomous performance and capacity management while providing greater visibility and control to our customers.
• Increase facilities efficiency. Use techniques such as higher ambient temperature for specific data center locations to take advantage of newer equipment specifications, which will help reduce cooling needs.
• Drive network efficiency. Continue to drive LAN utilization toward 75% and pursue software-defined networking to support agile, ultra-high-density data center designs. Continue to migrate to 100 GbE with Intel® Silicon Photonics optics where appropriate and cost-effective, to meet network capacity demands. Drive the automation deeper into our day-to-day work.
• Improve operational efficiency. Increase the telemetry within the data center to improve the operational efficiency.
ConclusionWe are committed to providing a foundation for continuous innovation that will improve the quality, velocity and efficiency of Intel IT’s business services. To that end, we have refined our data center strategy, building on the practices established over the last decade. Our refined data center strategy has created new business value exceeding USD 4.8 billion from 2010 to 2020. Our data center transformation strategy is critical for Intel IT to stay competitive.
Key achievements include the following:
• Our breakthrough disaggregated server design allows independent refresh of CPU and memory without replacing other server components. This new design results in faster data center innovation and a minimum of 44% cost savings compared to a full-acquisition refresh. Along with this TCO reduction, the disaggregated server innovation enables significant TCE reduction (82% of material weight in a new server is removed with just a CPU-complex upgrade).
• One-day dock-to-production for new physical server deployment in our data center hub.
• We developed a system software capability called NUMA-Booster, which has saved millions while delivering additional usable server capacity.
• We deployed more than 40 PB of Intel SSDs as fast local data cache drives. This increased workload performance due to lower network traffic and storage demand.
• Six generations of HPC in our design computing environment created a 293x capacity increase and 107x quality improvement.
• We adopted new storage capabilities like deduplication and compression, accelerated storage refresh, focused on increasing utilization, removed unneeded data and implemented policy-based tiering. All of these have resulted in getting additional usable capacity out of storage while reducing cost and providing higher performance.
• We deployed more than 8,378 100 GbE network ports, 12,019 40 GbE network ports, and 176,000 10 GbE network ports.
We are now applying our MOR approach across our entire infrastructure stack.

IT@Intel White Paper | IT@Intel: Data Center Strategy Leading Intel’s Business Transformation 20
We have achieved these results by running Intel data centers like a factory, implementing change in a disciplined manner and applying breakthrough technologies, solutions and processes. Transformational elements of our data center strategy include:
• A focus on three primary KPIs. These metrics enable us to measure the success of data center transformation: Meet growing customer demand (SLAs and QoS) within constrained spending targets (remaining cost-competitive) while optimally increasing infrastructure asset utilization (asset efficiency).
• Stimulating bolder innovation by changing our investment model. Comparing our current capabilities to a “best achievable model” encourages us to strive for innovation that will transform our infrastructure at a faster rate than if we sought only incremental change.
• New unit-costing financial model. This model enables us to better assess our data center TCO based on the business capabilities our infrastructure is supporting. The model measures the cost of a unit of service output and enables us to compare investments and make informed trade-off decisions across business functions. This enables us to maximize ROI and business value.
Related ContentIf you liked this paper, you may also be interested in these: • Fuel Cells: An Alternative Energy Source for Intel’s Data
Centers white paper• Green Computing at Scale white paper• Intel Takes On E-Waste With Disaggregated Servers blog
For more on Intel IT best practices, visit intel.com/IT.
IT@IntelWe connect IT professionals with their IT peers inside Intel. Our IT department solves some of today’s most demanding and complex technology issues. We want to share these lessons directly with our fellow IT professionals in an open peer-to-peer forum.
Our goal is simple: improve efficiency throughout the organization and enhance the business value of IT investments.
Follow us and join the conversation on Twitter or LinkedIn.
Visit us today at intel.com/IT or contact your local Intel representative if you would like to learn more.
AcronymsDOME Design, Office, Manufacturing, and EnterpriseEDA-MIPS electronic design automation MIPSHPC high-performance computingKPI key performance indicatorLAN local area networkMIPS meaningful indicator of performance per system MOR model of recordNIC network interface cardNUMA non-uniform memory accessPUE power usage effectivenessQoS quality of serviceROI return on investmentSLA service-level agreementTCE total cost to environmentTCO total cost of ownershipVM virtual machineWAN wide area network
Performance varies by use, configuration and other factors. Learn more at www.Intel.com/PerformanceIndex. Performance results are based on testing as of dates shown in configurations and may not reflect all publicly available updates. See backup for configuration details. No product or component can be absolutely secure. Cost-reduction scenarios described are intended as examples of how a given Intel-based product, in the specified circumstances and configurations, may affect future costs and provide cost savings. Circumstances will vary. Intel does not guarantee any costs or cost reduction. Your costs and results may vary. Intel technologies may require enabled hardware, software or service activation. © Intel Corporation. Intel, the Intel logo, and other Intel marks are trademarks of Intel Corporation or its subsidiaries. Other names and brands may be claimed as the property of others. Copyright 2021 Intel Corporation. All rights reserved. 1121/WWES/KC/PDF
Our data center transformation strategy is critical for Intel IT to stay competitive.