Daily Clearing Analysis: Sex - UCAS
36
Daily Clearing Analysis: Sex (00:05 on Thursday 13 September 2018). **PLACED APPLICANTS TO B7 NURSING COURSES** UCAS Analysis and Insights, www.ucas.com Daily Clearing Analysis: Sex B7 Nursing analysis at 00:05 on Thursday 13 September 2018 (28 days after A level results day) SB.1 Placed applicants to nursing by sex from all domiciles by sex: 28 days after A level results day Placed applicants to nursing by sex: change relative to 2017 cycle totals Difference between cycle and 2017 cycle -20% -15% -10% -5% -0% 5% 10% 15% 2009 2010 2011 2012 2013 2014 2015 2016 2017 2018 Men Women Note: The percentage change is not plotted in the above chart for groups with fewer than 30 placed applicants in any one cycle.
-
Upload
khangminh22 -
Category
Documents
-
view
0 -
download
0
Transcript of Daily Clearing Analysis: Sex - UCAS

Daily Clearing Analysis: Sex (00:05 on Thursday 13 September 2018). **PLACED APPLICANTS TO B7 NURSING COURSES** UCAS Analysis and Insights, www.ucas.com
Daily Clearing Analysis: Sex
B7 Nursing analysis at 00:05 on Thursday 13 September 2018 (28 days after A level results day)
SB.1 Placed applicants to nursing by sex from all domiciles by sex: 28 days after A level results dayPlaced applicants to nursing by sex: change relative to 2017 cycle totals
Dif
fere
nce
be
twe
en
cyc
le a
nd
20
17
cyc
le
-20%
-15%
-10%
-5%
-0%
5%
10%
15%
2009 2010 2011 2012 2013 2014 2015 2016 2017 2018
MenWomen
Note: The percentage change is not plotted in the above chart for groups with fewer than 30 placed applicants in any one cycle.

Daily Clearing Analysis: Sex (00:05 on Thursday 13 September 2018). **PLACED APPLICANTS TO B7 NURSING COURSES** UCAS Analysis and Insights, www.ucas.com
SB.2 Placed applicants to nursing by sex from all domiciles by sex: 28 days after A level results day
Applicant Status Sex 2009 2010 2011 2012 2013 2014 2015 2016 2017 2018
Placed Men 2,320 2,520 2,290 2,100 2,090 2,370 2,480 2,710 2,360 2,280
Women 21,050 23,210 21,100 21,180 21,920 23,970 24,140 25,530 24,880 24,610
All 23,370 25,730 23,390 23,280 24,010 26,340 26,620 28,240 27,240 26,890
SB.3 Placed applicants to nursing by sex from all domiciles by sex: 28 days after A level results dayPlaced applicants to nursing by sex: change relative to 2017 cycle totals
Applicant Status Sex 2009 2010 2011 2012 2013 2014 2015 2016 2017 2018
Placed Men -2% 7% -3% -11% -11% 0% 5% 15% 0% -3%
Women -15% -7% -15% -15% -12% -4% -3% 3% 0% -1%
All -14% -6% -14% -15% -12% -3% -2% 4% 0% -1%
Note: The percentage change is not recorded in the above table for groups with fewer than 10 placed applicants in that cycle or in the 2017 cycle.
SB.4 Placed applicants to nursing by sex from all domiciles by sex: 28 days after A level results dayPlaced applicants to nursing by sex: absolute change relative to 2017 cycle totals
Applicant Status Sex 2009 2010 2011 2012 2013 2014 2015 2016 2017 2018
Placed Men -40 170 -70 -260 -270 10 120 350 0 -80
Women -3,830 -1,680 -3,780 -3,700 -2,970 -910 -740 650 0 -280
All -3,870 -1,510 -3,850 -3,960 -3,230 -910 -620 1,000 0 -350

Daily Clearing Analysis: Sex (00:05 on Thursday 13 September 2018). **PLACED APPLICANTS TO B7 NURSING COURSES** UCAS Analysis and Insights, www.ucas.com
SB.5 Placed applicants to nursing by sex from the UK by sex: 28 days after A level results dayPlaced applicants to nursing by sex: change relative to 2017 cycle totals
Dif
fere
nce
be
twe
en
cyc
le a
nd
20
17
cyc
le
-20%
-15%
-10%
-5%
-0%
5%
10%
15%
2009 2010 2011 2012 2013 2014 2015 2016 2017 2018
MenWomen
Note: The percentage change is not plotted in the above chart for groups with fewer than 30 placed applicants in any one cycle.

Daily Clearing Analysis: Sex (00:05 on Thursday 13 September 2018). **PLACED APPLICANTS TO B7 NURSING COURSES** UCAS Analysis and Insights, www.ucas.com
SB.6 Placed applicants to nursing by sex from the UK by sex: 28 days after A level results day
Applicant Status Sex 2009 2010 2011 2012 2013 2014 2015 2016 2017 2018
Placed Men 2,290 2,470 2,230 2,070 2,040 2,320 2,430 2,650 2,310 2,240
Women 20,780 22,720 20,620 20,710 21,410 23,520 23,640 25,020 24,410 24,130
All 23,070 25,190 22,850 22,780 23,450 25,840 26,070 27,660 26,720 26,370
SB.7 Placed applicants to nursing by sex from the UK by sex: 28 days after A level results dayPlaced applicants to nursing by sex: change relative to 2017 cycle totals
Applicant Status Sex 2009 2010 2011 2012 2013 2014 2015 2016 2017 2018
Placed Men -1% 7% -4% -10% -12% 1% 5% 14% 0% -3%
Women -15% -7% -16% -15% -12% -4% -3% 2% 0% -1%
All -14% -6% -14% -15% -12% -3% -2% 4% 0% -1%
Note: The percentage change is not recorded in the above table for groups with fewer than 10 placed applicants in that cycle or in the 2017 cycle.
SB.8 Placed applicants to nursing by sex from the UK by sex: 28 days after A level results dayPlaced applicants to nursing by sex: absolute change relative to 2017 cycle totals
Applicant Status Sex 2009 2010 2011 2012 2013 2014 2015 2016 2017 2018
Placed Men -20 150 -80 -240 -270 10 120 340 0 -80
Women -3,630 -1,690 -3,790 -3,700 -3,000 -890 -770 610 0 -280
All -3,650 -1,530 -3,870 -3,940 -3,270 -880 -650 940 0 -360

Daily Clearing Analysis: Sex (00:05 on Thursday 13 September 2018). **PLACED APPLICANTS TO B7 NURSING COURSES** UCAS Analysis and Insights, www.ucas.com
SB.9 Placed 18 year old applicants to nursing from the UK by sex: 28 days after A level results dayPlaced 18 year old applicants to nursing: change relative to 2017 cycle totals
Dif
fere
nce
be
twe
en
cyc
le a
nd
20
17
cyc
le
-25%
-20%
-15%
-10%
-5%
-0%
5%
10%
15%
20%
25%
2009 2010 2011 2012 2013 2014 2015 2016 2017 2018
MenWomen
Note: The percentage change is not plotted in the above chart for groups with fewer than 30 placed applicants in any one cycle.

Daily Clearing Analysis: Sex (00:05 on Thursday 13 September 2018). **PLACED APPLICANTS TO B7 NURSING COURSES** UCAS Analysis and Insights, www.ucas.com
SB.10 Placed 18 year old applicants to nursing from the UK by sex: 28 days after A level results day
Applicant Status Sex 2009 2010 2011 2012 2013 2014 2015 2016 2017 2018
Placed Men 210 260 200 200 170 190 190 210 210 220
Women 4,950 5,060 4,600 4,790 4,630 4,790 5,050 5,270 5,750 5,980
All 5,160 5,310 4,800 4,990 4,800 4,980 5,240 5,480 5,960 6,200
SB.11 Placed 18 year old applicants to nursing from the UK by sex: 28 days after A level results dayPlaced 18 year old applicants to nursing: change relative to 2017 cycle totals
Applicant Status Sex 2009 2010 2011 2012 2013 2014 2015 2016 2017 2018
Placed Men 0% 20% -6% -8% -20% -11% -11% -3% 0% 3%
Women -14% -12% -20% -17% -19% -17% -12% -8% 0% 4%
All -13% -11% -20% -16% -19% -16% -12% -8% 0% 4%
Note: The percentage change is not recorded in the above table for groups with fewer than 10 placed applicants in that cycle or in the 2017 cycle.
SB.12 Placed 18 year old applicants to nursing from the UK by sex: 28 days after A level results dayPlaced 18 year old applicants to nursing: absolute change relative to 2017 cycle totals
Applicant Status Sex 2009 2010 2011 2012 2013 2014 2015 2016 2017 2018
Placed Men 0 40 -10 -20 -40 -20 -20 -10 0 10
Women -800 -690 -1,150 -950 -1,120 -960 -700 -480 0 230
All -800 -650 -1,160 -970 -1,160 -980 -720 -480 0 240
Daily Clearing Analysis: Sex (00:05 on Thursday 13 September 2018). **PLACED APPLICANTS TO B7 NURSING COURSES** UCAS Analysis and Insights, www.ucas.com
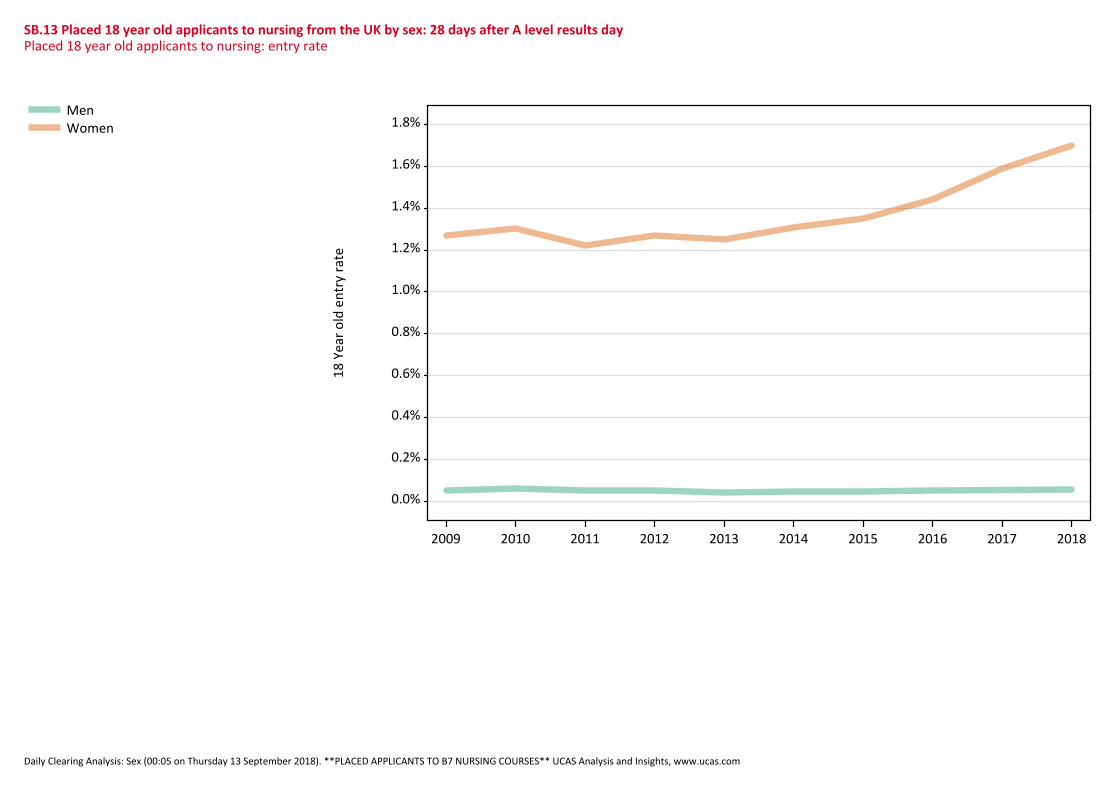
SB.13 Placed 18 year old applicants to nursing from the UK by sex: 28 days after A level results dayPlaced 18 year old applicants to nursing: entry rate
18
Ye
ar o
ld e
ntr
y ra
te
0.0%
0.2%
0.4%
0.6%
0.8%
1.0%
1.2%
1.4%
1.6%
1.8%
2009 2010 2011 2012 2013 2014 2015 2016 2017 2018
MenWomen

Daily Clearing Analysis: Sex (00:05 on Thursday 13 September 2018). **PLACED APPLICANTS TO B7 NURSING COURSES** UCAS Analysis and Insights, www.ucas.com
SB.14 Placed 18 year old applicants to nursing from the UK by sex: 28 days after A level results dayPlaced 18 year old applicants to nursing: entry rate
Applicant Status Sex 2009 2010 2011 2012 2013 2014 2015 2016 2017 2018
Placed Men 0.1% 0.1% 0.1% 0.0% 0.0% 0.0% 0.0% 0.1% 0.1% 0.1%
Women 1.3% 1.3% 1.2% 1.3% 1.2% 1.3% 1.4% 1.4% 1.6% 1.7%
All 0.6% 0.7% 0.6% 0.6% 0.6% 0.7% 0.7% 0.7% 0.8% 0.9%
SB.15 Placed 18 year old applicants to nursing from the UK by sex: 28 days after A level results dayPlaced 18 year old applicants to nursing: entry rate (indexed to 100 = Men)
Applicant Status Sex 2009 2010 2011 2012 2013 2014 2015 2016 2017 2018
Placed Men 100 100 100 100 100 100 100 100 100 100
Women 2,441 2,054 2,413 2,573 2,868 2,694 2,805 2,689 2,852 2,889
Daily Clearing Analysis: Sex (00:05 on Thursday 13 September 2018). **PLACED APPLICANTS TO B7 NURSING COURSES** UCAS Analysis and Insights, www.ucas.com
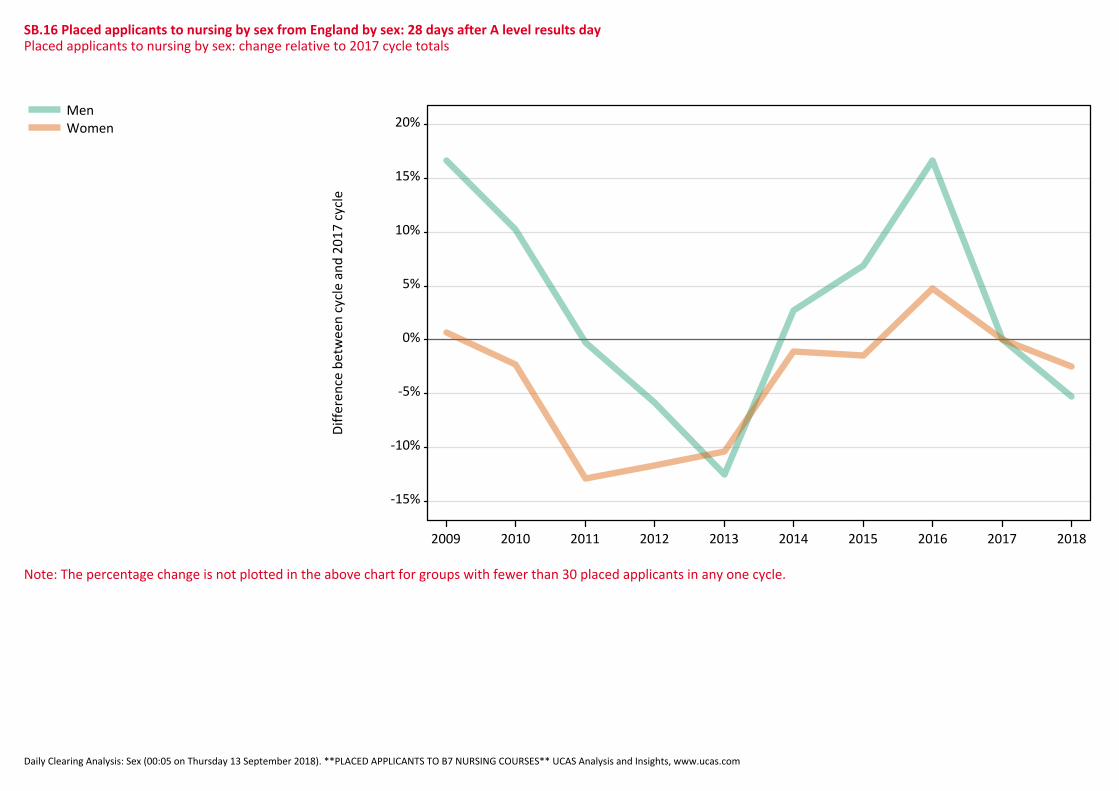
SB.16 Placed applicants to nursing by sex from England by sex: 28 days after A level results dayPlaced applicants to nursing by sex: change relative to 2017 cycle totals
Dif
fere
nce
be
twe
en
cyc
le a
nd
20
17
cyc
le
-15%
-10%
-5%
0%
5%
10%
15%
20%
2009 2010 2011 2012 2013 2014 2015 2016 2017 2018
MenWomen
Note: The percentage change is not plotted in the above chart for groups with fewer than 30 placed applicants in any one cycle.

Daily Clearing Analysis: Sex (00:05 on Thursday 13 September 2018). **PLACED APPLICANTS TO B7 NURSING COURSES** UCAS Analysis and Insights, www.ucas.com
SB.17 Placed applicants to nursing by sex from England by sex: 28 days after A level results day
Applicant Status Sex 2009 2010 2011 2012 2013 2014 2015 2016 2017 2018
Placed Men 2,160 2,040 1,840 1,740 1,620 1,900 1,970 2,150 1,850 1,750
Women 19,090 18,540 16,530 16,760 17,000 18,770 18,700 19,880 18,970 18,500
All 21,250 20,570 18,380 18,500 18,620 20,660 20,670 22,040 20,820 20,250
SB.18 Placed applicants to nursing by sex from England by sex: 28 days after A level results dayPlaced applicants to nursing by sex: change relative to 2017 cycle totals
Applicant Status Sex 2009 2010 2011 2012 2013 2014 2015 2016 2017 2018
Placed Men 17% 10% -0% -6% -13% 3% 7% 17% 0% -5%
Women 1% -2% -13% -12% -10% -1% -1% 5% 0% -2%
All 2% -1% -12% -11% -11% -1% -1% 6% 0% -3%
Note: The percentage change is not recorded in the above table for groups with fewer than 10 placed applicants in that cycle or in the 2017 cycle.
SB.19 Placed applicants to nursing by sex from England by sex: 28 days after A level results dayPlaced applicants to nursing by sex: absolute change relative to 2017 cycle totals
Applicant Status Sex 2009 2010 2011 2012 2013 2014 2015 2016 2017 2018
Placed Men 310 190 0 -110 -230 50 130 310 0 -100
Women 120 -440 -2,440 -2,220 -1,970 -210 -270 910 0 -470
All 430 -250 -2,440 -2,320 -2,200 -160 -150 1,220 0 -570

Daily Clearing Analysis: Sex (00:05 on Thursday 13 September 2018). **PLACED APPLICANTS TO B7 NURSING COURSES** UCAS Analysis and Insights, www.ucas.com
SB.20 Placed 18 year old applicants to nursing from England by sex: 28 days after A level results dayPlaced 18 year old applicants to nursing: change relative to 2017 cycle totals
Dif
fere
nce
be
twe
en
cyc
le a
nd
20
17
cyc
le
-30%
-25%
-20%
-15%
-10%
-5%
-0%
5%
10%
15%
20%
2009 2010 2011 2012 2013 2014 2015 2016 2017 2018
MenWomen
Note: The percentage change is not plotted in the above chart for groups with fewer than 30 placed applicants in any one cycle.

Daily Clearing Analysis: Sex (00:05 on Thursday 13 September 2018). **PLACED APPLICANTS TO B7 NURSING COURSES** UCAS Analysis and Insights, www.ucas.com
SB.21 Placed 18 year old applicants to nursing from England by sex: 28 days after A level results day
Applicant Status Sex 2009 2010 2011 2012 2013 2014 2015 2016 2017 2018
Placed Men 190 200 160 160 120 140 130 150 170 180
Women 4,370 4,000 3,650 3,790 3,560 3,730 3,900 4,080 4,450 4,740
All 4,560 4,200 3,810 3,950 3,690 3,870 4,030 4,220 4,620 4,920
SB.22 Placed 18 year old applicants to nursing from England by sex: 28 days after A level results dayPlaced 18 year old applicants to nursing: change relative to 2017 cycle totals
Applicant Status Sex 2009 2010 2011 2012 2013 2014 2015 2016 2017 2018
Placed Men 10% 16% -4% -6% -28% -20% -22% -15% 0% 5%
Women -2% -10% -18% -15% -20% -16% -12% -8% 0% 7%
All -1% -9% -17% -15% -20% -16% -13% -9% 0% 7%
Note: The percentage change is not recorded in the above table for groups with fewer than 10 placed applicants in that cycle or in the 2017 cycle.
SB.23 Placed 18 year old applicants to nursing from England by sex: 28 days after A level results dayPlaced 18 year old applicants to nursing: absolute change relative to 2017 cycle totals
Applicant Status Sex 2009 2010 2011 2012 2013 2014 2015 2016 2017 2018
Placed Men 20 30 -10 -10 -50 -40 -40 -30 0 10
Women -80 -450 -800 -660 -880 -720 -550 -370 0 300
All -60 -420 -810 -670 -930 -750 -580 -400 0 310

Daily Clearing Analysis: Sex (00:05 on Thursday 13 September 2018). **PLACED APPLICANTS TO B7 NURSING COURSES** UCAS Analysis and Insights, www.ucas.com
SB.24 Placed 18 year old applicants to nursing from England by sex: 28 days after A level results dayPlaced 18 year old applicants to nursing: entry rate
18
Ye
ar o
ld e
ntr
y ra
te
0.0%
0.2%
0.4%
0.6%
0.8%
1.0%
1.2%
1.4%
1.6%
2009 2010 2011 2012 2013 2014 2015 2016 2017 2018
MenWomen

Daily Clearing Analysis: Sex (00:05 on Thursday 13 September 2018). **PLACED APPLICANTS TO B7 NURSING COURSES** UCAS Analysis and Insights, www.ucas.com
SB.25 Placed 18 year old applicants to nursing from England by sex: 28 days after A level results dayPlaced 18 year old applicants to nursing: entry rate
Applicant Status Sex 2009 2010 2011 2012 2013 2014 2015 2016 2017 2018
Placed Men 0.1% 0.1% 0.0% 0.0% 0.0% 0.0% 0.0% 0.0% 0.1% 0.1%
Women 1.3% 1.2% 1.2% 1.2% 1.1% 1.2% 1.2% 1.3% 1.5% 1.6%
All 0.7% 0.6% 0.6% 0.6% 0.6% 0.6% 0.6% 0.7% 0.7% 0.8%
SB.26 Placed 18 year old applicants to nursing from England by sex: 28 days after A level results dayPlaced 18 year old applicants to nursing: entry rate (indexed to 100 = Men)
Applicant Status Sex 2009 2010 2011 2012 2013 2014 2015 2016 2017 2018
Placed Men 100 100 100 100 100 100 100 100 100 100
Women 2,446 2,084 2,325 2,490 3,049 2,903 3,078 2,935 2,733 2,775

Daily Clearing Analysis: Sex (00:05 on Thursday 13 September 2018). **PLACED APPLICANTS TO B7 NURSING COURSES** UCAS Analysis and Insights, www.ucas.com
SB.27 Placed applicants to nursing by sex from Northern Ireland by sex: 28 days after A level results dayPlaced applicants to nursing by sex: change relative to 2017 cycle totals
Dif
fere
nce
be
twe
en
cyc
le a
nd
20
17
cyc
le
-60%
-40%
-20%
0%
20%
40%
60%
2009 2010 2011 2012 2013 2014 2015 2016 2017 2018
MenWomen
Note: The percentage change is not plotted in the above chart for groups with fewer than 30 placed applicants in any one cycle.

Daily Clearing Analysis: Sex (00:05 on Thursday 13 September 2018). **PLACED APPLICANTS TO B7 NURSING COURSES** UCAS Analysis and Insights, www.ucas.com
SB.28 Placed applicants to nursing by sex from Northern Ireland by sex: 28 days after A level results day
Applicant Status Sex 2009 2010 2011 2012 2013 2014 2015 2016 2017 2018
Placed Men 30 40 30 40 60 70 70 110 70 80
Women 430 470 460 490 860 880 880 990 1,000 970
All 470 510 490 530 910 940 950 1,100 1,070 1,050
SB.29 Placed applicants to nursing by sex from Northern Ireland by sex: 28 days after A level results dayPlaced applicants to nursing by sex: change relative to 2017 cycle totals
Applicant Status Sex 2009 2010 2011 2012 2013 2014 2015 2016 2017 2018
Placed Men -52% -48% -56% -48% -23% -6% -4% 48% 0% 18%
Women -57% -53% -55% -51% -14% -12% -12% -1% 0% -3%
All -57% -53% -55% -51% -15% -12% -11% 2% 0% -2%
Note: The percentage change is not recorded in the above table for groups with fewer than 10 placed applicants in that cycle or in the 2017 cycle.
SB.30 Placed applicants to nursing by sex from Northern Ireland by sex: 28 days after A level results dayPlaced applicants to nursing by sex: absolute change relative to 2017 cycle totals
Applicant Status Sex 2009 2010 2011 2012 2013 2014 2015 2016 2017 2018
Placed Men -40 -30 -40 -30 -20 0 0 30 0 10
Women -570 -530 -550 -510 -140 -130 -120 -10 0 -30
All -610 -570 -590 -540 -160 -130 -120 30 0 -20

Daily Clearing Analysis: Sex (00:05 on Thursday 13 September 2018). **PLACED APPLICANTS TO B7 NURSING COURSES** UCAS Analysis and Insights, www.ucas.com
SB.31 Placed 18 year old applicants to nursing from Northern Ireland by sex: 28 days after A level results dayPlaced 18 year old applicants to nursing: change relative to 2017 cycle totals
Dif
fere
nce
be
twe
en
cyc
le a
nd
20
17
cyc
le
-80%
-60%
-40%
-20%
-0%
20%
40%
60%
2009 2010 2011 2012 2013 2014 2015 2016 2017 2018
MenWomen
Note: The percentage change is not plotted in the above chart for groups with fewer than 30 placed applicants in any one cycle.

Daily Clearing Analysis: Sex (00:05 on Thursday 13 September 2018). **PLACED APPLICANTS TO B7 NURSING COURSES** UCAS Analysis and Insights, www.ucas.com
SB.32 Placed 18 year old applicants to nursing from Northern Ireland by sex: 28 days after A level results day
Applicant Status Sex 2009 2010 2011 2012 2013 2014 2015 2016 2017 2018
Placed Men 10 0 0 10 10 10 20 20 10 20
Women 220 190 180 200 300 260 290 300 360 320
All 230 190 190 210 310 270 300 320 370 340
SB.33 Placed 18 year old applicants to nursing from Northern Ireland by sex: 28 days after A level results dayPlaced 18 year old applicants to nursing: change relative to 2017 cycle totals
Applicant Status Sex 2009 2010 2011 2012 2013 2014 2015 2016 2017 2018
Placed Men -18% -18% 0% 18% 45% 36% 0% 55%
Women -39% -48% -48% -43% -16% -28% -19% -15% 0% -9%
All -38% -48% -49% -43% -15% -26% -17% -13% 0% -7%
Note: The percentage change is not recorded in the above table for groups with fewer than 10 placed applicants in that cycle or in the 2017 cycle.
SB.34 Placed 18 year old applicants to nursing from Northern Ireland by sex: 28 days after A level results dayPlaced 18 year old applicants to nursing: absolute change relative to 2017 cycle totals
Applicant Status Sex 2009 2010 2011 2012 2013 2014 2015 2016 2017 2018
Placed Men 0 -10 -10 0 0 0 10 0 0 10
Women -140 -170 -170 -150 -60 -100 -70 -50 0 -30
All -140 -180 -180 -160 -60 -100 -60 -50 0 -30

Daily Clearing Analysis: Sex (00:05 on Thursday 13 September 2018). **PLACED APPLICANTS TO B7 NURSING COURSES** UCAS Analysis and Insights, www.ucas.com
SB.35 Placed 18 year old applicants to nursing from Northern Ireland by sex: 28 days after A level results dayPlaced 18 year old applicants to nursing: entry rate
18
Ye
ar o
ld e
ntr
y ra
te
0.0%
0.5%
1.0%
1.5%
2.0%
2.5%
3.0%
3.5%
2009 2010 2011 2012 2013 2014 2015 2016 2017 2018
MenWomen

Daily Clearing Analysis: Sex (00:05 on Thursday 13 September 2018). **PLACED APPLICANTS TO B7 NURSING COURSES** UCAS Analysis and Insights, www.ucas.com
SB.36 Placed 18 year old applicants to nursing from Northern Ireland by sex: 28 days after A level results dayPlaced 18 year old applicants to nursing: entry rate
Applicant Status Sex 2009 2010 2011 2012 2013 2014 2015 2016 2017 2018
Placed Men 0.1% 0.0% 0.0% 0.1% 0.1% 0.1% 0.1% 0.1% 0.1% 0.1%
Women 1.7% 1.5% 1.5% 1.6% 2.5% 2.2% 2.4% 2.5% 3.0% 2.9%
All 0.9% 0.7% 0.8% 0.8% 1.3% 1.1% 1.2% 1.3% 1.5% 1.5%
SB.37 Placed 18 year old applicants to nursing from Northern Ireland by sex: 28 days after A level results dayPlaced 18 year old applicants to nursing: entry rate (indexed to 100 = Men)
Applicant Status Sex 2009 2010 2011 2012 2013 2014 2015 2016 2017 2018
Placed Men 100 100 100 100 100 100 100 100 100 100
Women 2,531 6,515 4,719 2,299 2,799 2,046 1,877 2,124 3,380 2,051

Daily Clearing Analysis: Sex (00:05 on Thursday 13 September 2018). **PLACED APPLICANTS TO B7 NURSING COURSES** UCAS Analysis and Insights, www.ucas.com
SB.38 Placed applicants to nursing by sex from Scotland by sex: 28 days after A level results dayPlaced applicants to nursing by sex: change relative to 2017 cycle totals
Dif
fere
nce
be
twe
en
cyc
le a
nd
20
17
cyc
le
-100%
-80%
-60%
-40%
-20%
-0%
20%
2009 2010 2011 2012 2013 2014 2015 2016 2017 2018
MenWomen
Note: The percentage change is not plotted in the above chart for groups with fewer than 30 placed applicants in any one cycle.

Daily Clearing Analysis: Sex (00:05 on Thursday 13 September 2018). **PLACED APPLICANTS TO B7 NURSING COURSES** UCAS Analysis and Insights, www.ucas.com
SB.39 Placed applicants to nursing by sex from Scotland by sex: 28 days after A level results day
Applicant Status Sex 2009 2010 2011 2012 2013 2014 2015 2016 2017 2018
Placed Men 30 290 240 210 250 250 250 260 270 260
Women 240 2,770 2,660 2,390 2,390 2,720 2,700 2,680 2,930 3,080
All 270 3,060 2,900 2,590 2,640 2,970 2,950 2,950 3,200 3,340
SB.40 Placed applicants to nursing by sex from Scotland by sex: 28 days after A level results dayPlaced applicants to nursing by sex: change relative to 2017 cycle totals
Applicant Status Sex 2009 2010 2011 2012 2013 2014 2015 2016 2017 2018
Placed Men -89% 10% -9% -22% -7% -6% -7% -1% 0% -4%
Women -92% -6% -9% -19% -19% -7% -8% -9% 0% 5%
All -92% -4% -9% -19% -18% -7% -8% -8% 0% 4%
Note: The percentage change is not recorded in the above table for groups with fewer than 10 placed applicants in that cycle or in the 2017 cycle.
SB.41 Placed applicants to nursing by sex from Scotland by sex: 28 days after A level results dayPlaced applicants to nursing by sex: absolute change relative to 2017 cycle totals
Applicant Status Sex 2009 2010 2011 2012 2013 2014 2015 2016 2017 2018
Placed Men -240 30 -30 -60 -20 -20 -20 0 0 -10
Women -2,690 -170 -270 -550 -550 -220 -240 -250 0 150
All -2,930 -140 -300 -610 -560 -230 -250 -250 0 140

Daily Clearing Analysis: Sex (00:05 on Thursday 13 September 2018). **PLACED APPLICANTS TO B7 NURSING COURSES** UCAS Analysis and Insights, www.ucas.com
SB.42 Placed 18 year old applicants to nursing from Scotland by sex: 28 days after A level results dayPlaced 18 year old applicants to nursing: change relative to 2017 cycle totals
Dif
fere
nce
be
twe
en
cyc
le a
nd
20
17
cyc
le
-100%
-80%
-60%
-40%
-20%
-0%
20%
40%
60%
80%
2009 2010 2011 2012 2013 2014 2015 2016 2017 2018
MenWomen
Note: The percentage change is not plotted in the above chart for groups with fewer than 30 placed applicants in any one cycle.

Daily Clearing Analysis: Sex (00:05 on Thursday 13 September 2018). **PLACED APPLICANTS TO B7 NURSING COURSES** UCAS Analysis and Insights, www.ucas.com
SB.43 Placed 18 year old applicants to nursing from Scotland by sex: 28 days after A level results day
Applicant Status Sex 2009 2010 2011 2012 2013 2014 2015 2016 2017 2018
Placed Men 0 40 20 20 30 30 30 30 20 10
Women 110 620 560 570 520 580 580 580 620 570
All 110 660 580 590 550 610 610 610 640 580
SB.44 Placed 18 year old applicants to nursing from Scotland by sex: 28 days after A level results dayPlaced 18 year old applicants to nursing: change relative to 2017 cycle totals
Applicant Status Sex 2009 2010 2011 2012 2013 2014 2015 2016 2017 2018
Placed Men 71% -5% 0% 48% 52% 19% 48% 0% -43%
Women -83% 1% -9% -9% -16% -6% -6% -6% 0% -9%
All -83% 3% -9% -9% -14% -4% -5% -5% 0% -10%
Note: The percentage change is not recorded in the above table for groups with fewer than 10 placed applicants in that cycle or in the 2017 cycle.
SB.45 Placed 18 year old applicants to nursing from Scotland by sex: 28 days after A level results dayPlaced 18 year old applicants to nursing: absolute change relative to 2017 cycle totals
Applicant Status Sex 2009 2010 2011 2012 2013 2014 2015 2016 2017 2018
Placed Men -20 20 0 0 10 10 0 10 0 -10
Women -510 0 -60 -60 -100 -40 -40 -40 0 -50
All -530 20 -60 -60 -90 -30 -40 -30 0 -60

Daily Clearing Analysis: Sex (00:05 on Thursday 13 September 2018). **PLACED APPLICANTS TO B7 NURSING COURSES** UCAS Analysis and Insights, www.ucas.com
SB.46 Placed 18 year old applicants to nursing from Scotland by sex: 28 days after A level results dayPlaced 18 year old applicants to nursing: entry rate
18
Ye
ar o
ld e
ntr
y ra
te
0.0%
0.5%
1.0%
1.5%
2.0%
2.5%
2009 2010 2011 2012 2013 2014 2015 2016 2017 2018
MenWomen

Daily Clearing Analysis: Sex (00:05 on Thursday 13 September 2018). **PLACED APPLICANTS TO B7 NURSING COURSES** UCAS Analysis and Insights, www.ucas.com
SB.47 Placed 18 year old applicants to nursing from Scotland by sex: 28 days after A level results dayPlaced 18 year old applicants to nursing: entry rate
Applicant Status Sex 2009 2010 2011 2012 2013 2014 2015 2016 2017 2018
Placed Men 0.0% 0.1% 0.1% 0.1% 0.1% 0.1% 0.1% 0.1% 0.1% 0.0%
Women 0.3% 2.0% 1.8% 1.9% 1.8% 2.0% 2.0% 2.0% 2.2% 2.1%
All 0.2% 1.0% 0.9% 0.9% 0.9% 1.0% 1.0% 1.0% 1.1% 1.0%
SB.48 Placed 18 year old applicants to nursing from Scotland by sex: 28 days after A level results dayPlaced 18 year old applicants to nursing: entry rate (indexed to 100 = Men)
Applicant Status Sex 2009 2010 2011 2012 2013 2014 2015 2016 2017 2018
Placed Men 100 100 100 100 100 100 100 100 100 100
Women 2,708 1,784 2,947 2,843 1,806 1,925 2,441 1,972 3,134 4,883

Daily Clearing Analysis: Sex (00:05 on Thursday 13 September 2018). **PLACED APPLICANTS TO B7 NURSING COURSES** UCAS Analysis and Insights, www.ucas.com
SB.49 Placed applicants to nursing by sex from Wales by sex: 28 days after A level results dayPlaced applicants to nursing by sex: change relative to 2017 cycle totals
Dif
fere
nce
be
twe
en
cyc
le a
nd
20
17
cyc
le
-50%
-40%
-30%
-20%
-10%
-0%
10%
20%
2009 2010 2011 2012 2013 2014 2015 2016 2017 2018
MenWomen
Note: The percentage change is not plotted in the above chart for groups with fewer than 30 placed applicants in any one cycle.

Daily Clearing Analysis: Sex (00:05 on Thursday 13 September 2018). **PLACED APPLICANTS TO B7 NURSING COURSES** UCAS Analysis and Insights, www.ucas.com
SB.50 Placed applicants to nursing by sex from Wales by sex: 28 days after A level results day
Applicant Status Sex 2009 2010 2011 2012 2013 2014 2015 2016 2017 2018
Placed Men 70 100 110 90 120 110 140 120 130 140
Women 1,010 950 970 1,070 1,160 1,160 1,360 1,460 1,500 1,580
All 1,090 1,050 1,080 1,160 1,280 1,270 1,500 1,580 1,630 1,720
SB.51 Placed applicants to nursing by sex from Wales by sex: 28 days after A level results dayPlaced applicants to nursing by sex: change relative to 2017 cycle totals
Applicant Status Sex 2009 2010 2011 2012 2013 2014 2015 2016 2017 2018
Placed Men -41% -22% -12% -31% -6% -13% 10% -2% 0% 14%
Women -33% -37% -35% -29% -23% -23% -10% -3% 0% 5%
All -33% -36% -34% -29% -22% -22% -8% -3% 0% 6%
Note: The percentage change is not recorded in the above table for groups with fewer than 10 placed applicants in that cycle or in the 2017 cycle.
SB.52 Placed applicants to nursing by sex from Wales by sex: 28 days after A level results dayPlaced applicants to nursing by sex: absolute change relative to 2017 cycle totals
Applicant Status Sex 2009 2010 2011 2012 2013 2014 2015 2016 2017 2018
Placed Men -50 -30 -20 -40 -10 -20 10 0 0 20
Women -490 -550 -530 -430 -340 -350 -150 -50 0 70
All -550 -580 -550 -470 -350 -360 -130 -50 0 90

Daily Clearing Analysis: Sex (00:05 on Thursday 13 September 2018). **PLACED APPLICANTS TO B7 NURSING COURSES** UCAS Analysis and Insights, www.ucas.com
SB.53 Placed 18 year old applicants to nursing from Wales by sex: 28 days after A level results dayPlaced 18 year old applicants to nursing: change relative to 2017 cycle totals
Dif
fere
nce
be
twe
en
cyc
le a
nd
20
17
cyc
le
-60%
-40%
-20%
0%
20%
40%
60%
80%
100%
2009 2010 2011 2012 2013 2014 2015 2016 2017 2018
MenWomen
Note: The percentage change is not plotted in the above chart for groups with fewer than 30 placed applicants in any one cycle.

Daily Clearing Analysis: Sex (00:05 on Thursday 13 September 2018). **PLACED APPLICANTS TO B7 NURSING COURSES** UCAS Analysis and Insights, www.ucas.com
SB.54 Placed 18 year old applicants to nursing from Wales by sex: 28 days after A level results day
Applicant Status Sex 2009 2010 2011 2012 2013 2014 2015 2016 2017 2018
Placed Men 10 20 10 10 10 10 20 10 10 10
Women 260 250 200 240 240 220 280 310 330 350
All 270 270 220 250 250 230 300 330 340 360
SB.55 Placed 18 year old applicants to nursing from Wales by sex: 28 days after A level results dayPlaced 18 year old applicants to nursing: change relative to 2017 cycle totals
Applicant Status Sex 2009 2010 2011 2012 2013 2014 2015 2016 2017 2018
Placed Men 33% 89% 22% -33% -44% -22% 67% 56% 0% 0%
Women -21% -23% -38% -26% -25% -33% -14% -5% 0% 7%
All -20% -20% -36% -26% -26% -32% -12% -3% 0% 7%
Note: The percentage change is not recorded in the above table for groups with fewer than 10 placed applicants in that cycle or in the 2017 cycle.
SB.56 Placed 18 year old applicants to nursing from Wales by sex: 28 days after A level results dayPlaced 18 year old applicants to nursing: absolute change relative to 2017 cycle totals
Applicant Status Sex 2009 2010 2011 2012 2013 2014 2015 2016 2017 2018
Placed Men 0 10 0 0 0 0 10 10 0 0
Women -70 -80 -120 -80 -80 -110 -50 -20 0 20
All -70 -70 -120 -90 -90 -110 -40 -10 0 20

Daily Clearing Analysis: Sex (00:05 on Thursday 13 September 2018). **PLACED APPLICANTS TO B7 NURSING COURSES** UCAS Analysis and Insights, www.ucas.com
SB.57 Placed 18 year old applicants to nursing from Wales by sex: 28 days after A level results dayPlaced 18 year old applicants to nursing: entry rate
18
Ye
ar o
ld e
ntr
y ra
te
0.0%
0.5%
1.0%
1.5%
2.0%
2.5%
2009 2010 2011 2012 2013 2014 2015 2016 2017 2018
MenWomen

Daily Clearing Analysis: Sex (00:05 on Thursday 13 September 2018). **PLACED APPLICANTS TO B7 NURSING COURSES** UCAS Analysis and Insights, www.ucas.com
SB.58 Placed 18 year old applicants to nursing from Wales by sex: 28 days after A level results dayPlaced 18 year old applicants to nursing: entry rate
Applicant Status Sex 2009 2010 2011 2012 2013 2014 2015 2016 2017 2018
Placed Men 0.1% 0.1% 0.1% 0.0% 0.0% 0.0% 0.1% 0.1% 0.0% 0.1%
Women 1.3% 1.3% 1.1% 1.3% 1.3% 1.2% 1.5% 1.8% 1.9% 2.1%
All 0.7% 0.7% 0.6% 0.6% 0.7% 0.6% 0.8% 0.9% 0.9% 1.0%
SB.59 Placed 18 year old applicants to nursing from Wales by sex: 28 days after A level results dayPlaced 18 year old applicants to nursing: entry rate (indexed to 100 = Men)
Applicant Status Sex 2009 2010 2011 2012 2013 2014 2015 2016 2017 2018
Placed Men 100 100 100 100 100 100 100 100 100 100
Women 2,289 1,484 1,913 4,255 5,129 3,320 1,973 2,326 3,810 4,096
Daily Clearing Analysis: Sex (00:05 on Thursday 13 September 2018). **PLACED APPLICANTS TO B7 NURSING COURSES** UCAS Analysis and Insights, www.ucas.com
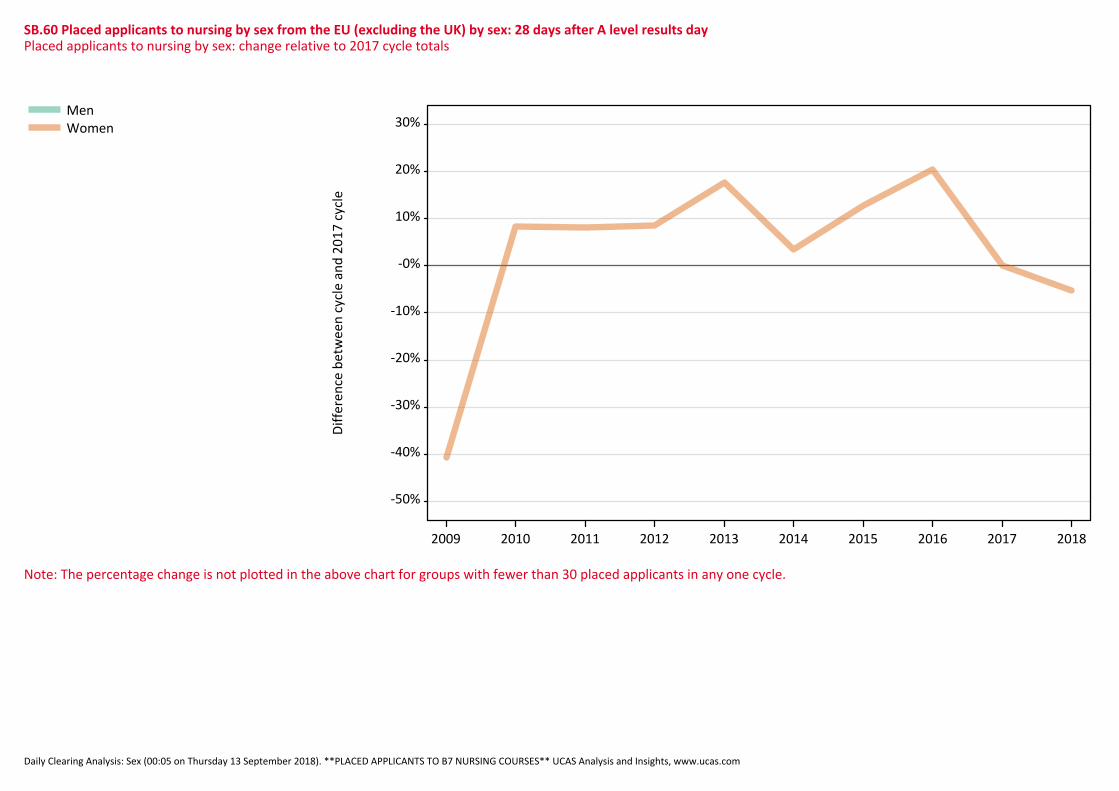
SB.60 Placed applicants to nursing by sex from the EU (excluding the UK) by sex: 28 days after A level results dayPlaced applicants to nursing by sex: change relative to 2017 cycle totals
Dif
fere
nce
be
twe
en
cyc
le a
nd
20
17
cyc
le
-50%
-40%
-30%
-20%
-10%
-0%
10%
20%
30%
2009 2010 2011 2012 2013 2014 2015 2016 2017 2018
MenWomen
Note: The percentage change is not plotted in the above chart for groups with fewer than 30 placed applicants in any one cycle.

Daily Clearing Analysis: Sex (00:05 on Thursday 13 September 2018). **PLACED APPLICANTS TO B7 NURSING COURSES** UCAS Analysis and Insights, www.ucas.com
SB.61 Placed applicants to nursing by sex from the EU (excluding the UK) by sex: 28 days after A level results day
Applicant Status Sex 2009 2010 2011 2012 2013 2014 2015 2016 2017 2018
Placed Men 20 50 60 30 50 40 40 60 40 40
Women 230 420 410 420 450 400 430 460 380 360
All 250 460 470 440 510 440 480 520 420 400
SB.62 Placed applicants to nursing by sex from the EU (excluding the UK) by sex: 28 days after A level results dayPlaced applicants to nursing by sex: change relative to 2017 cycle totals
Applicant Status Sex 2009 2010 2011 2012 2013 2014 2015 2016 2017 2018
Placed Men -42% 24% 47% -32% 42% 3% 16% 45% 0% 0%
Women -41% 8% 8% 9% 18% 3% 13% 20% 0% -5%
All -41% 10% 12% 5% 20% 3% 13% 23% 0% -5%
Note: The percentage change is not recorded in the above table for groups with fewer than 10 placed applicants in that cycle or in the 2017 cycle.
SB.63 Placed applicants to nursing by sex from the EU (excluding the UK) by sex: 28 days after A level results dayPlaced applicants to nursing by sex: absolute change relative to 2017 cycle totals
Applicant Status Sex 2009 2010 2011 2012 2013 2014 2015 2016 2017 2018
Placed Men -20 10 20 -10 20 0 10 20 0 0
Women -160 30 30 30 70 10 50 80 0 -20
All -170 40 50 20 80 10 60 100 0 -20

Daily Clearing Analysis: Sex (00:05 on Thursday 13 September 2018). **PLACED APPLICANTS TO B7 NURSING COURSES** UCAS Analysis and Insights, www.ucas.com
SB.64 Placed applicants to nursing by sex from overseas (not EU) by sex: 28 days after A level results dayPlaced applicants to nursing by sex: change relative to 2017 cycle totals
Dif
fere
nce
be
twe
en
cyc
le a
nd
20
17
cyc
le
-60%
-50%
-40%
-30%
-20%
-10%
-0%
10%
20%
30%
2009 2010 2011 2012 2013 2014 2015 2016 2017 2018
MenWomen
Note: The percentage change is not plotted in the above chart for groups with fewer than 30 placed applicants in any one cycle.
Daily Clearing Analysis: Sex (00:05 on Thursday 13 September 2018). **PLACED APPLICANTS TO B7 NURSING COURSES** UCAS Analysis and Insights, www.ucas.com
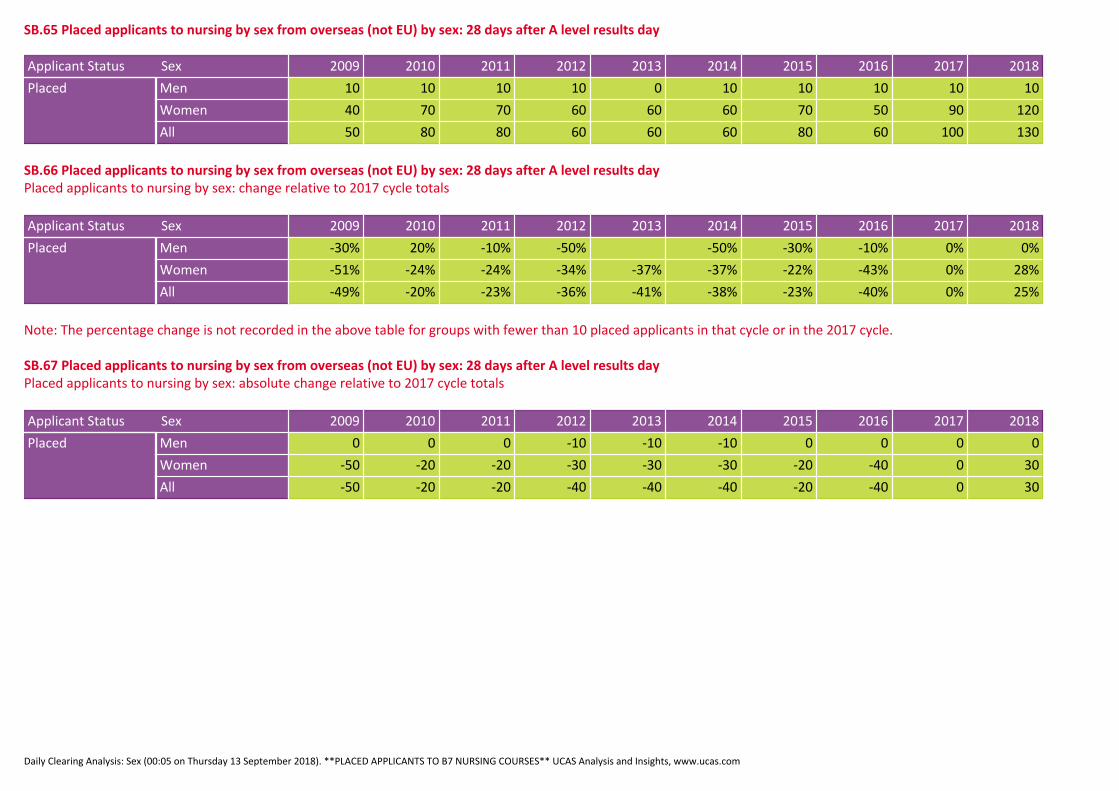
SB.65 Placed applicants to nursing by sex from overseas (not EU) by sex: 28 days after A level results day
Applicant Status Sex 2009 2010 2011 2012 2013 2014 2015 2016 2017 2018
Placed Men 10 10 10 10 0 10 10 10 10 10
Women 40 70 70 60 60 60 70 50 90 120
All 50 80 80 60 60 60 80 60 100 130
SB.66 Placed applicants to nursing by sex from overseas (not EU) by sex: 28 days after A level results dayPlaced applicants to nursing by sex: change relative to 2017 cycle totals
Applicant Status Sex 2009 2010 2011 2012 2013 2014 2015 2016 2017 2018
Placed Men -30% 20% -10% -50% -50% -30% -10% 0% 0%
Women -51% -24% -24% -34% -37% -37% -22% -43% 0% 28%
All -49% -20% -23% -36% -41% -38% -23% -40% 0% 25%
Note: The percentage change is not recorded in the above table for groups with fewer than 10 placed applicants in that cycle or in the 2017 cycle.
SB.67 Placed applicants to nursing by sex from overseas (not EU) by sex: 28 days after A level results dayPlaced applicants to nursing by sex: absolute change relative to 2017 cycle totals
Applicant Status Sex 2009 2010 2011 2012 2013 2014 2015 2016 2017 2018
Placed Men 0 0 0 -10 -10 -10 0 0 0 0
Women -50 -20 -20 -30 -30 -30 -20 -40 0 30
All -50 -20 -20 -40 -40 -40 -20 -40 0 30