
DAC Technology - ELECTRISA
11
1 DAC technology introduction and OHV experience with onsite test on MV cables INTRODUCTION DAMPED AC TESTS For testing power cables with continuous AC voltage a very high reactive power and large power equipment is needed to charge the capacitance of the cable. Therefore, alternative high voltage test methods like DAC are used for power cable testing in the field. This method was Introduced in the late 1980’s by CIGRE (Study Committee 21 Insulated Cables) as an effective alternative method for on-site testing. This patented technology detects insulation defects in new installed or repaired MV, HV and EHV power cables during after-laying or maintenance testing. At test voltages up to twice the nominal working level, the intent is to determine if the insulation is healthy (defect-free and/or non-aged) and that it can withstand a high voltage stress level. In case the insulation is aged and/or has any defects, it will only withstand a lower level of voltage. The damped AC stress represents electrical stress similar to factory testing conditions or operating voltage frequency. HOW DOES DAMPED AC (DAC) METHOD WORK? During the energizing phase the cable is charged via a HV reactor up to the pre-selected peak test voltage by a high voltage source within a couple of seconds. After having reached the test voltage the DC source will be disconnected and the HV switch will be closed instantly providing LC resonance circuit with the cable capacitance and the system inductance. This provides a damped sinusoidal AC (DAC) voltage. The resonance frequency depends on the cable capacitance and the inductance of the HV reactor of the test system. Due to dielectric losses inside the cable the voltage magnitude is decreasing continuously. The damping factor can be used for estimating the dielectric losses inside the cable.
-
Upload
khangminh22 -
Category
Documents
-
view
0 -
download
0
Transcript of DAC Technology - ELECTRISA

1
DAC technology introduction and
OHV experience with onsite test on MV cables
INTRODUCTION
DAMPED AC TESTS
For testing power cables with continuous AC voltage a very high reactive power and large power equipment is needed to charge the capacitance of the cable. Therefore, alternative high voltage test methods like DAC are used for power cable testing in the field. This method was Introduced in the late 1980’s by CIGRE (Study Committee 21 Insulated Cables) as an effective alternative method for on-site testing.
This patented technology detects insulation defects in new installed or repaired MV, HV and EHV power cables during after-laying or maintenance testing. At test voltages up to twice the nominal working level, the intent is to determine if the insulation is healthy (defect-free and/or non-aged) and that it can withstand a high voltage stress level. In case the insulation is aged and/or has any defects, it will only withstand a lower level of voltage.
The damped AC stress represents electrical stress similar to factory testing conditions or operating voltage frequency.
HOW DOES DAMPED AC (DAC) METHOD WORK?
During the energizing phase the cable is charged via a HV reactor up to the pre-selected peak test voltage by a high voltage source within a couple of seconds. After having reached the test voltage the DC source will be disconnected and the HV switch will be closed instantly providing LC resonance circuit with the cable capacitance and the system inductance. This provides a damped sinusoidal AC (DAC) voltage.
The resonance frequency depends on the cable capacitance and the inductance of the HV reactor of the test system.
Due to dielectric losses inside the cable the voltage magnitude is decreasing continuously. The damping factor can be used for estimating the dielectric losses inside the cable.

2
DAMPED AC TESTING AND DIAGNOSTICS BENEFITS
The main benefits using DAC voltage test and diagnostic measurements are:
ü Applicable for all types of MV, HV and EHV power cables for rated voltages up to 380 kV: XLPE, EPR,
PILC, LPOF, HPPT
ü Applicable for after-laying commissioning tests for long lengths of power cables (0.1 km – 30 km),
providing a condition assessment baseline for future comparison
ü PD localization in cable insulation and accessories provides accurate information about location and
magnitude of any defects
ü Reproduces AC stresses from the electrical network
ü Approved method, accepted by relevant international standards (IEEE, IEC)
ü Non-destructive and sensitive testing method
ü Portable test system, compact design and low weight with reduced energy consumption during testing
ü Combined with standardized partial discharge diagnostics
ü Combined with dissipation factor measurements at HV conditions
ü State of the art power electronics and signal processing technologies
ü Straightforward technology and operation
Using this method, allows much more than a simple go or no-go decision. DAC testing is an advanced maintenance tool which supports asset management and grid operation as well.
DAMPED AC TESTING RELEVANT INTERNATIONAL STANDARDS
General IEC 60060-3: High Voltage test techniques Part 3: Definitions and requirements for on-site testing
On-site testing IEEE 400: Guide for Field Testing and Evaluation of the Insulation of Shielded Power Cable Systems Rated 5 kV and Above HD 632 S2 (CENELEC): Power cables with extruded insulation and their accessories for rated voltages above 36 kV (Um = 42 kV) up to 150 kV (Um = 170 kV) IEC 60840: Power cables with extruded insulation and the accessories for rated voltages above 30 kV up to 150 kV Test methods and requirements IEC 62067: Power cables with extruded insulation and the accessories for rated voltages above 150 kV IEEE 400.4: Guide for Field-Testing of Shielded Power Cable Systems Rated 5 kV and Above with Damped Alternating Current Voltage (DAC) (draft under preparation) Standardized PD detection IEEE 400.3: Guide for PD Testing of Shielded Power Cable Systems in a Field Environment IEC 60270: Partial discharges measurements IEC 885-3: Test methods for partial discharges measurements on lengths of extruded power cable Dissipation Factor measurement IEC 60141: Tests on oil-filled and gas-pressure cables and their accessories IEEE 1425: Guide for the Evaluating of the Remaining Life of Impregnated Paper-insulated Transmission Cables Systems

3
CASE STUDIES
1. Shanghai, China
In this case study we would like to share with you our experience of the routine on-site tests of Partial Discharges performed in the city of Shanghai, China.
Partial discharges indicate inhomogeneities within high voltage insulation systems. For this reason, sensitive detecting as well as exact locating of PD signals are important requirements for condition assessment of high voltage equipment. On-site DAC voltage test in combination with non-destructive PD and loss factor measurement is unique and fundamental for reliable service of newly installed, repaired or service-aged cable systems.
CABLE DETAILS
Cable voltage 35 kV, type – XLPE.
The length of cable: 3313m
The position of cable joints: 4m, 219m, 449.2m, 560m, 761.1m, 940.3m, 1218.6m, 1450.6m, 1662.8m, 1896.3m, 2113.5m, 2274.3m, 2489.5m, 2736.9m,2878.9m and 3117.1m
Condition during the tests:
Capacitance: Ø 0.62µF
Frequency: Ø 139.36Hz
Temperature: Ø 24.57°C
EQUIPMENT USED FOR TESTS
As this XLPE cable voltage is 35kV, we are used our product M60 with DAC Output voltage 60kV (peak) / 42,2kV (RMS).
Frequency Range 20 Hz – 1000 Hz (acc. IEC 60060 – 3) Test object capacitance 0,025 µF – 5 µF
PD range / resolution 5 pC – 100 nC / 1pC PD bandwidth 100 kHz – 500 kHz (acc. IEC 60270)
Joint location in calibration mode Integrated PD location Wide – band, 100 kHz – 20 MHz
Automatic adjustment Power Supply 1 – phase, 94 V – 250 V, 48 Hz – 63 Hz, 500VA Dimensions Diameter: ca. 620 mm / Height: ca. 890 mm
Weight Approx. 90 kg Transportation Aluminum handle bars
Controls Laptop via LAN
Software ohv diagnostic suite incl. TDR, Mapping, PRPDA Pattern recognition, Import from older formats, test report generator
4
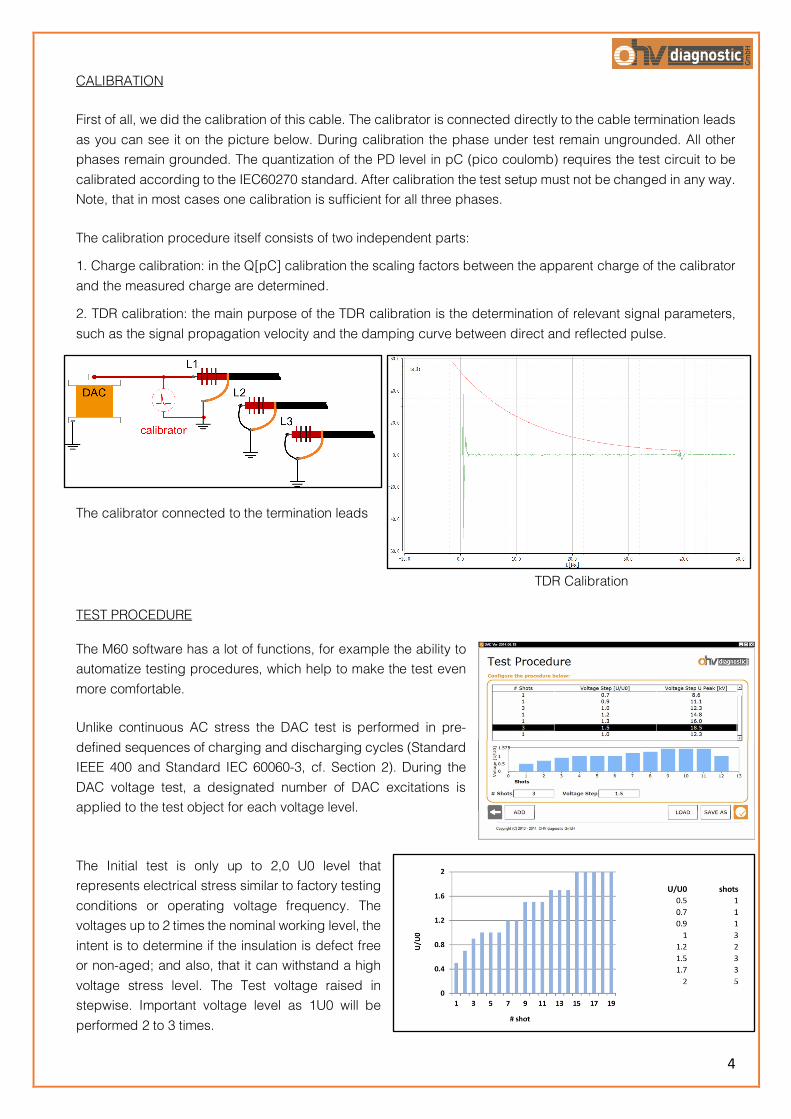
CALIBRATION
First of all, we did the calibration of this cable. The calibrator is connected directly to the cable termination leads as you can see it on the picture below. During calibration the phase under test remain ungrounded. All other phases remain grounded. The quantization of the PD level in pC (pico coulomb) requires the test circuit to be calibrated according to the IEC60270 standard. After calibration the test setup must not be changed in any way. Note, that in most cases one calibration is sufficient for all three phases.
The calibration procedure itself consists of two independent parts:
1. Charge calibration: in the Q[pC] calibration the scaling factors between the apparent charge of the calibrator and the measured charge are determined.
2. TDR calibration: the main purpose of the TDR calibration is the determination of relevant signal parameters, such as the signal propagation velocity and the damping curve between direct and reflected pulse.
The calibrator connected to the termination leads
TDR Calibration
TEST PROCEDURE
The M60 software has a lot of functions, for example the ability to automatize testing procedures, which help to make the test even more comfortable.
Unlike continuous AC stress the DAC test is performed in pre-defined sequences of charging and discharging cycles (Standard IEEE 400 and Standard IEC 60060-3, cf. Section 2). During the DAC voltage test, a designated number of DAC excitations is applied to the test object for each voltage level.
The Initial test is only up to 2,0 U0 level that represents electrical stress similar to factory testing conditions or operating voltage frequency. The voltages up to 2 times the nominal working level, the intent is to determine if the insulation is defect free or non-aged; and also, that it can withstand a high voltage stress level. The Test voltage raised in stepwise. Important voltage level as 1U0 will be performed 2 to 3 times.

5
While performing tests, all necessary values like test voltage, PD-level, frequency, dissipation factor as well as a PD-pattern are shown in a single screen.
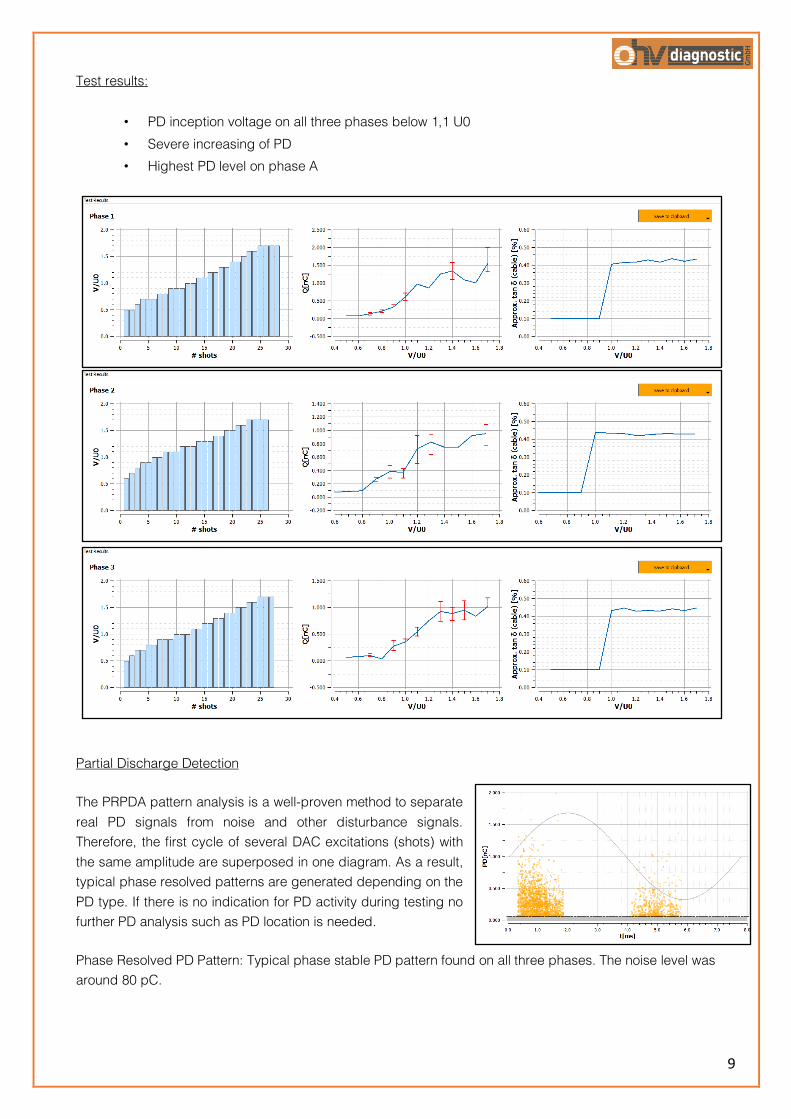
Test results:
• PD inception voltage on all three phases below 1,1 U0 • Severe increasing of PD • Highest PD level on phase A
Partial Discharge Detection
The PRPDA pattern analysis is a well-proven method to separate real PD signals from noise and other disturbance signals. Therefore, the first cycle of several DAC excitations (shots) with the same amplitude are superposed in one diagram. As a result, typical phase resolved patterns are generated depending on the PD type. If there is no indication for PD activity during testing no further PD analysis such as PD location is needed.
The PRPDA pattern generation provides you the same evaluation possibilities as during continuous AC test. The more shots with the same amplitude are superposed the better the PRPDA result will be. There are typical pattern shapes generated by specific types of PD. Harmful surface discharges as well as inner PD generate phase resolved patterns between 0 to 90, and 180 to 270 degrees.
Phase Resolved PD Pattern: Typical phase stable PD pattern found on all three phases. The noise level was around 100 pC.
6
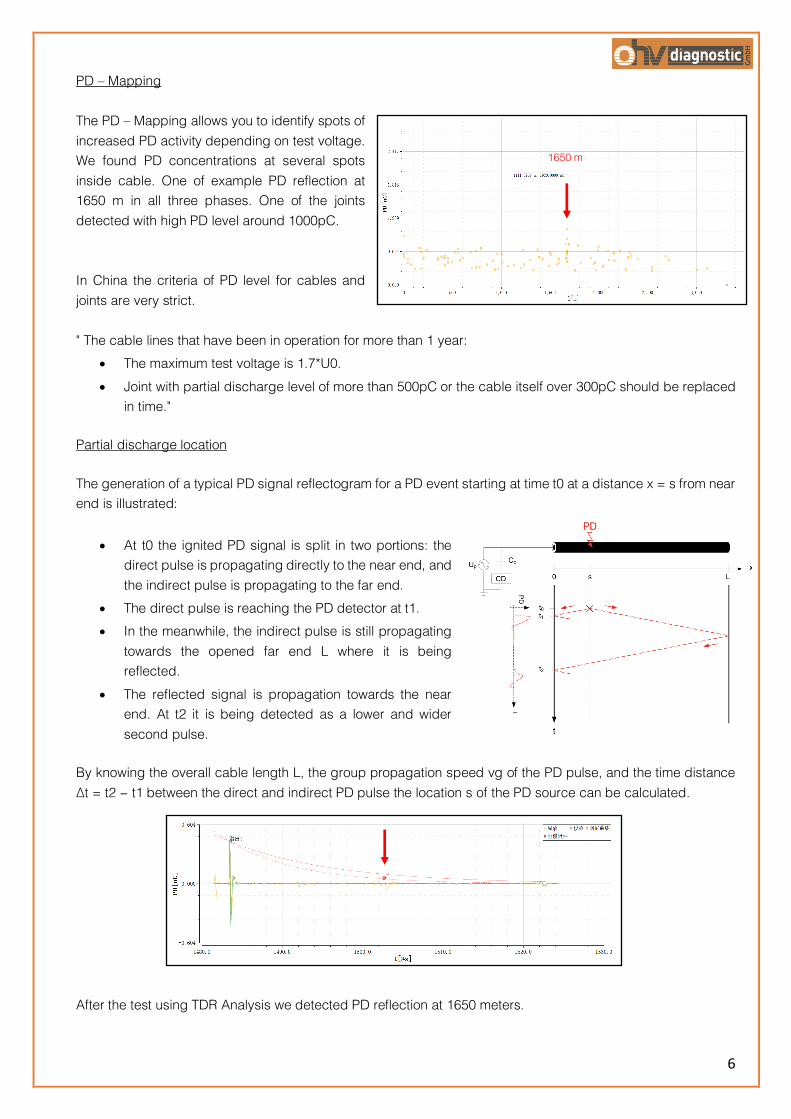
PD – Mapping The PD – Mapping allows you to identify spots of increased PD activity depending on test voltage. We found PD concentrations at several spots inside cable. One of example PD reflection at 1650 m in all three phases. One of the joints detected with high PD level around 1000pC. In China the criteria of PD level for cables and joints are very strict. " The cable lines that have been in operation for more than 1 year:
• The maximum test voltage is 1.7*U0. • Joint with partial discharge level of more than 500pC or the cable itself over 300pC should be replaced
in time."
Partial discharge location
The generation of a typical PD signal reflectogram for a PD event starting at time t0 at a distance x = s from near end is illustrated:
• At t0 the ignited PD signal is split in two portions: the direct pulse is propagating directly to the near end, and the indirect pulse is propagating to the far end.
• The direct pulse is reaching the PD detector at t1. • In the meanwhile, the indirect pulse is still propagating
towards the opened far end L where it is being reflected.
• The reflected signal is propagation towards the near end. At t2 it is being detected as a lower and wider second pulse.
By knowing the overall cable length L, the group propagation speed vg of the PD pulse, and the time distance ∆t = t2 − t1 between the direct and indirect PD pulse the location s of the PD source can be calculated.
After the test using TDR Analysis we detected PD reflection at 1650 meters.
1650 m

7
The joint with high Partial Discharges was cut. The customer found serious trace of Partial Discharges activities.
The customer replaced defective joint by a new one and we made together the second test with DAC system. This time, there is no PD concentration anymore in replaced joint. CONCLUSION The defective joint was send by customer to HV laboratory for investigation. This joint was cut to slice for analysis. Result: the laboratory found the air bladder very clearly in the XLPE layer.This defect might be caused by the warm shrinking process with bad temperature controlling.

8
2. Nordenham, Germany
In this case study we would like to share with you another on-site test of Partial Discharges performed in the city of Nordenham in Germany. This time our customer would like to optimize their maintenance cost of this electrical cable XPLE 20 kV and find the exact position of cable joints with abnormal level of partial discharges. The main aim was to reduce risks of costly production stops.
CABLE DETAILS
Cable voltage 20 kV, type – XLPE.
The length of cable: 2435m
The position of cable joints: 221m, 870m, 560m, 1750m.
Condition during the tests:
Capacitance: 0.68 µF - 0.74 µF (Ø 0.70 µF)
Frequency: 124.60 Hz - 129.90 Hz (Ø 127.55 Hz)
Temperature: Ø 24.57°C
EQUIPMENT USED FOR TESTS
As this XLPE cable nominal voltage is 20kV we should reach during the test 2U0 (40kV). For this reason, we are used our product M60 with DAC Output voltage 60kV (peak) / 42,2kV (RMS).
CALIBRATION
First of all, we did the calibration of this cable. The calibrator is connected directly to the cable termination leads as you can see it on the picture below. During calibration the phase under test remain ungrounded. All other phases remain grounded.
The calibration procedure itself consists of two independent parts:
1. Charge calibration: in the Q[pC] calibration the scaling factors between the apparent charge of the calibrator and the measured charge are determined. 2. TDR calibration: the main purpose of the TDR calibration is the determination of relevant signal parameters, such as the signal propagation velocity and the damping curve between direct and reflected pulse.
The calibrator connected to the termination leads TDR Calibration
9
Test results:
• PD inception voltage on all three phases below 1,1 U0 • Severe increasing of PD • Highest PD level on phase A
Partial Discharge Detection
The PRPDA pattern analysis is a well-proven method to separate real PD signals from noise and other disturbance signals. Therefore, the first cycle of several DAC excitations (shots) with the same amplitude are superposed in one diagram. As a result, typical phase resolved patterns are generated depending on the PD type. If there is no indication for PD activity during testing no further PD analysis such as PD location is needed.
Phase Resolved PD Pattern: Typical phase stable PD pattern found on all three phases. The noise level was around 80 pC.
10
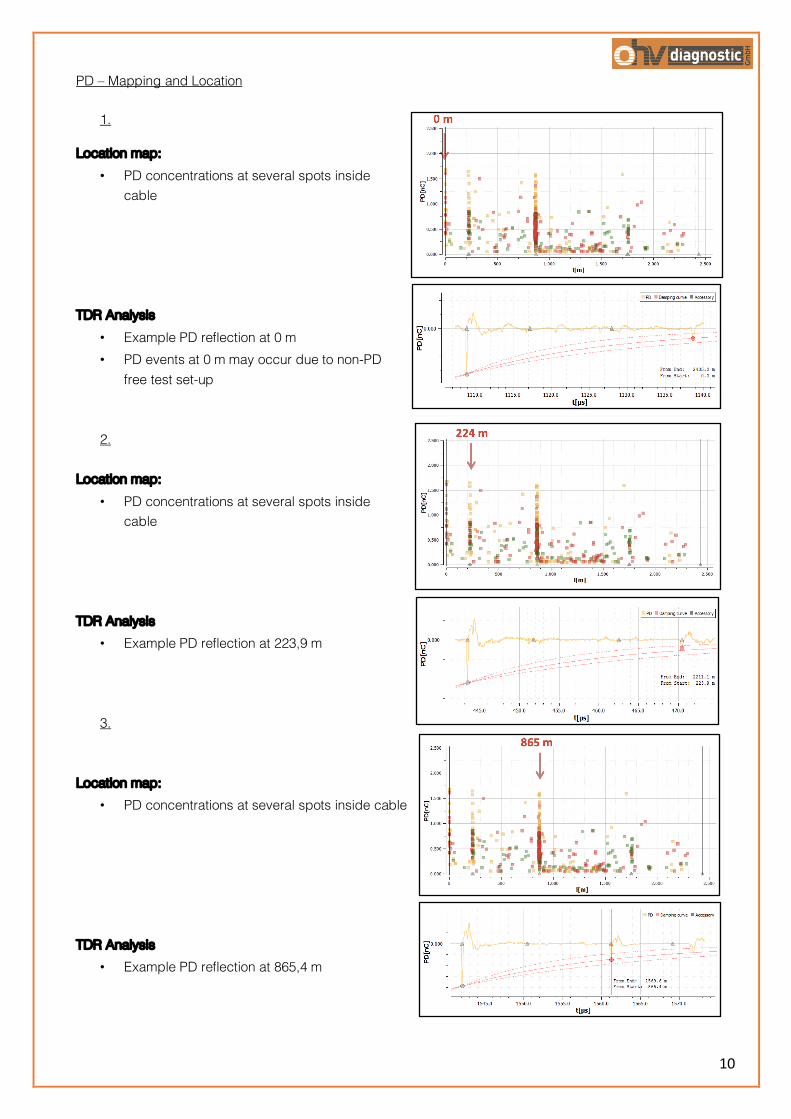
PD – Mapping and Location
1.
Location map: • PD concentrations at several spots inside
cable TDR Analysis
• Example PD reflection at 0 m • PD events at 0 m may occur due to non-PD
free test set-up
2. Location map:
• PD concentrations at several spots inside cable
TDR Analysis
• Example PD reflection at 223,9 m
3. Location map:
• PD concentrations at several spots inside cable TDR Analysis
• Example PD reflection at 865,4 m

11
4. Location map:
• PD concentrations at several spots inside cable TDR Analysis
• Example PD reflection at 1758,6 m CONCLUSION The defective joints and their exact positions were indentified by M60 system and customer replaced them by a new joints. Detection of almost any type of problem in the cable insulation at an early stage of development can be done with monitoring of partial discharges. Thereby, the technical staff has got enough time to prevent an important cable breakdown. Highly refined instrumentation and diagnostic tools help you identify and localize defects. Most of the defects found in medium and high voltage cable grids are the result of faulty assembly of joints and terminations. HOW WE CAN REDUCE THE RISKS OF THIS TYPE.
The periodic monitoring of Partial Discharges can give us an early warning of potential problems. This will enable the customer to effectively identify any possible issues and resolve them rather than having an expensive interruption to normal production which at times can also be potentially safety critical.
The main benefit of monitoring systems – using it as the preventive tools that can help to reduce the risk of catastrophic major failures of the electrical equipment. At the same time, this approach helps the customers to optimize maintenance cost of these electrical installations and to reduce risks of costly production stops.
For more information about this case study or about PD monitoring systems that was used, please contact: [email protected]