D6.1- Report on the synopsis on the current framework ...
147
RACE2050© – FP7 314753 D6.1 Report on the synopsis on the current framework conditions – Final – 06/11/2013 Page 1 of 147 RACE2050 - Responsible innovation Agenda for Competitive European transport industries up to 2050 D6.1- Report on the synopsis on the current framework conditions FINAL Dissemination level: PUBLIC
-
Upload
khangminh22 -
Category
Documents
-
view
1 -
download
0
Transcript of D6.1- Report on the synopsis on the current framework ...
RACE2050© – FP7 314753
D6.1 Report on the synopsis on the current framework conditions – Final – 06/11/2013 Page 1 of 147
RACE2050 - Responsible innovation Agenda for
Competitive European transport industries up to 2050
D6.1- Report on the synopsis on the current framework conditions
FINAL
Dissemination level:
PUBLIC
RACE2050© – FP7 314753
D6.1 Report on the synopsis on the current framework conditions – Final – 06/11/2013 Page 2 of 147
1. EXECUTIVE SUMMARY................................................................................................................................................. 4 2. INTRODUCTION ......................................................................................................................................................... 6 3. APPROACH AND METHOD ........................................................................................................................................... 8 4. THE EUROPEAN TRANSPORT MARKET .......................................................................................................................... 10 4.1 ROAD TRANSPORT ................................................................................................................................................... 10
4.1.1 Automotive manufacturers ....................................................................................................................... 11 4.1.2 Other manufacturers ................................................................................................................................ 12 4.1.3 Freight transport by road and removal services ....................................................................................... 13 4.1.4 Other passenger land transport service .................................................................................................... 14
4.2 RAIL TRANSPORT ..................................................................................................................................................... 15 4.2.1 Manufacture of railway locomotives and rolling stock ............................................................................. 17 4.2.2 Passenger rail transport services .............................................................................................................. 18 4.2.3 Freight rail transport services ................................................................................................................... 19
4.3 SEA TRANSPORT ...................................................................................................................................................... 20 4.3.1 Shipbuilding............................................................................................................................................... 21 4.3.2 Sea, coastal and inland passenger water transport services .................................................................... 23 4.3.3 Sea, coastal and inland freight water transport ....................................................................................... 24
4.4 AIR TRANSPORT ....................................................................................................................................................... 25 4.4.1 Manufacture of air and spacecraft and related machinery ...................................................................... 26 4.4.2 Passenger and freight air transport services ............................................................................................. 31
4.5 CONCLUSION EUROPEAN TRANSPORT MARKET .............................................................................................................. 32 5. GLOBAL COMPETITIVENESS ........................................................................................................................................ 34 5.1 ROAD TRANSPORT ................................................................................................................................................... 34
5.1.1 Market share ............................................................................................................................................. 34 5.1.2 Financial indicators (revenue, EBIT margin, sales) .................................................................................... 40 5.1.3 Demand Growth ........................................................................................................................................ 43 5.1.4 Employment .............................................................................................................................................. 45 5.1.5 Exports of goods and services ................................................................................................................... 47 5.1.6 Political framework ................................................................................................................................... 49 5.1.7 Outsource .................................................................................................................................................. 52
5.2 RAIL TRANSPORT ..................................................................................................................................................... 53 5.2.1 Market share ............................................................................................................................................. 53 5.2.2 Financial indicators ................................................................................................................................... 54 5.2.3 Demand Growth ........................................................................................................................................ 57 5.2.4 Employment .............................................................................................................................................. 59 5.2.5 Exports of goods and services ................................................................................................................... 62 5.2.6 Political framework ................................................................................................................................... 63 5.2.7 Outsource .................................................................................................................................................. 64
5.3 SEA TRANSPORT ...................................................................................................................................................... 64 5.3.1 Market share ............................................................................................................................................. 65 5.3.2 Financial indicators ................................................................................................................................... 70 5.3.3 Demand Growth ........................................................................................................................................ 74 5.3.4 Exports of goods and services ................................................................................................................... 75 5.3.5 Political framework ................................................................................................................................... 77 5.3.6 Outsource .................................................................................................................................................. 77
5.4 AIR TRANSPORT ....................................................................................................................................................... 78 5.4.1 Market share ............................................................................................................................................. 78 5.4.2 Financial indicators ................................................................................................................................... 78 5.4.3 Growth of demand .................................................................................................................................... 81 5.4.4 Employment .............................................................................................................................................. 82 5.4.5 Export of goods and services ..................................................................................................................... 84 5.4.6 Political framework ................................................................................................................................... 86 5.4.7 Outsource .................................................................................................................................................. 87
5.5 CONCLUSION COMPETITIVENESS SITUATION .................................................................................................................. 88 6. KEY FACTORS EXPLAINING THE COMPETITIVENESS INDICATORS DEVELOPMENT....................................................................... 90 6.1 KEY FACTORS ROAD TRANSPORT ................................................................................................................................. 91
6.1.1 New technologies ...................................................................................................................................... 91
RACE2050© – FP7 314753
D6.1 Report on the synopsis on the current framework conditions – Final – 06/11/2013 Page 3 of 147
6.1.2 Income development and shift of demand ............................................................................................... 95 6.1.3 Emerging competitors ............................................................................................................................... 96
6.2 KEY FACTORS RAIL TRANSPORT ................................................................................................................................... 96 6.2.1 Infrastructural investment ........................................................................................................................ 97 6.2.2 End of the (first) cycle of massive rail investment in China ....................................................................... 97 6.2.3 Emerging competitors ............................................................................................................................... 98 6.2.4 Research and development for energy savings ......................................................................................... 98
6.3 KEY FACTORS SEA TRANSPORT .................................................................................................................................. 100 6.3.1 Economic growth and globalization ........................................................................................................ 100 6.3.2 Business cycles ........................................................................................................................................ 100 6.3.3 Political framework ................................................................................................................................. 101 6.3.4 Access to Finance .................................................................................................................................... 101 6.3.5 Skilled workforce ..................................................................................................................................... 102 6.3.6 Energy prices and energy efficiency ........................................................................................................ 102 6.3.7 New technologies and Green Growth potential ...................................................................................... 102 6.3.8 Gas fuelled ships/fuel Cells (DNV 2012). ................................................................................................. 103 6.3.9 Shipping in polar waters ......................................................................................................................... 103 6.3.10 Offshore New markets ........................................................................................................................ 104
6.4 KEY FACTORS AIR TRANSPORT................................................................................................................................... 104 6.4.1 Wealth growth ........................................................................................................................................ 104 6.4.2 Demographic dynamics ........................................................................................................................... 105 6.4.3 Emerging new competitors ..................................................................................................................... 107 6.4.4 Energy prices and energy efficiency ........................................................................................................ 108 6.4.5 The threat of High Speed Rail ................................................................................................................. 109 6.4.6 Decrease of Government’s Military Budgets ........................................................................................... 110 6.4.7 Air Space Management ........................................................................................................................... 110 6.4.8 New technologies .................................................................................................................................... 110
6.5 CONCLUSION KEY FACTORS ...................................................................................................................................... 111 7. KEY INDICATORS FOR SUSTAINABILITY AND THEIR RELEVANCE FOR COMPETITIVENESS ............................................................ 113 7.1 POLLUTION .......................................................................................................................................................... 113 7.2 POLITICAL FRAMEWORK .......................................................................................................................................... 116 7.3 ENERGY PRICE AND EFFICIENCY OF POWERTRAINS AND TRANSPORT CONCEPTS.................................................................... 118 7.4 CONCLUSION SUSTAINABILITY IN TRANSPORT ............................................................................................................... 119 8. CHALLENGES AND OPPORTUNITIES ............................................................................................................................ 121 8.1 CHALLENGES AND OPPORTUNITIES – RESULTS OF THE COMPETITIVENESS AND KEY FACTORS ANALYSIS ...................................... 121 8.2 CHALLENGES AND OPPORTUNITIES – IN THE PERSPECTIVE OF EXPERTS .............................................................................. 121 8.3 CONCLUSION OF CHALLENGES AND OPPORTUNITIES ..................................................................................................... 127 9. LIST OF FIGURES AND TABLES .................................................................................................................................... 130 10. REFERENCE .......................................................................................................................................................... 134 11. ANNEX ................................................................................................................................................................ 146 11.1 RACE2050 BASICS ........................................................................................................................................... 146 11.2 DELIVERABLE BASICS .......................................................................................................................................... 147

RACE2050© – FP7 314753
D6.1 Report on the synopsis on the current framework conditions – Final – 06/11/2013 Page 4 of 147
1. Executive summary
The objective of the Deliverable is a description of the framework conditions for the European transport Sector including a broad context perspective. As the sector is diversified concerning specialisation, regionalisation and development intra-European differences need to be considered. Main aim is to identify the driving forces increasing competitiveness and to point out the main advantages and constraints for the competitiveness of the European transport Sector giving an outlook on future challenges and opportunities. The European transport market is considered to be innovative in technology development, offers a high number of jobs and contributes fundamental to European GDP. In the last years the financial and economic crisis affected the transport industry in almost all areas. In the fields of maritime transport and also rail transport competitors from other regions, especially from Asia, catch up strong. Nevertheless, the European transport market in general is competitive as shown in numbers of business development, although there are several problems in a few areas. Numerous companies from all sectors are amongst the world leaders. Especially machinery, motor vehicles, aircrafts, chemical products, pharmaceutical product and carbon/low carbon steel from European Union are considered excellent. Products and services from Europe are still experience a high demand. Key indicators and factors for competitiveness In order to stay competitive in the future the European transport sector has to ensure exports and needs increase presence in emerging markets in the future to compensate decreasing domestic markets. European companies still have technological advantages but new competitors challenge this position. New technologies, increasing demand of global and urban mobility will go along with a shift of demand towards upcoming and further growing economies. New mobility solutions, technologies and concepts will bring up new player competing with the established transport industries. This fundamental transformation will challenge the EU transport sector. Policy stimulating in this process innovation and technology setting new standards, e.g. for CO2 reduction will be one of the main key factors to support the transport industry. Key Indicators for Sustainability Sustainable issues in transport will gain importance not only in the European Union. European efforts towards more sustainable transport are ambitious. Greenhouse gas reduction and sustainability goals in European politics are ambitious in comparison to other countries, especially in the transport sector. Getting targets help to improve efficiency and to make the transport sector more environmental friendly. European political and technological efforts are regarded as a reference in many other countries. Therefore the possibilities for sustainable transport are seen as an opportunity to open new markets for products and environmentally based policies in transport. Sustainability aims to limit the use and consumption of resources and to avoid harm and danger towards society and environment. Energy price, efficiency, pollution or policies are such indicators to show and describe the sustainability situation. Challenges and Opportunities The transport sector has to face changes coming up with new trends in mobility and transport demand causing a fundamental change of the market such as global shift of demand, diversification of economic power and new perspectives on transport and mobility. This shift is not only resulting in decisions relevant to the market but also affecting culture, planning philosophy and values relevant for the transport sector. The European transport industry is based on a long history of solid based experience in technology, innovation, quality and high skilled labour force. This position is and will be challenged by the transformation of the market, claiming for a new way of thinking in transport as well as in developing and providing technologies and services. European transport industry could benefit from increasing demand in emerging markets, particularly where there is already a strong position, which offers also the opportunity to meet essential requirements of the European home markets like efficiency improvement or sustainable transport. A challenge will be to meet the needs of emerging markets by inventing new solution and to compete with suppliers entering the
RACE2050© – FP7 314753
D6.1 Report on the synopsis on the current framework conditions – Final – 06/11/2013 Page 5 of 147
market and changing the transport system with new technologies (e.g. ICT solutions) during the phase of transformation. As strategies for the European transport industry several fields could be derived from the analysis who could serve as a first guideline for further investigation: 1. Optimizing the infrastructure and efficiency are to be addressed. 2. Knowhow has to be build and new solutions in the field of sustainable mobility have to be developed. 3. Thinking transport in a broader perspective, where mobility is an active movement combining different modes in a flexible and efficient way has to be established. 4. Change has to be embraced as transformation to create new ways in terms of products, services, business models, the way to operate and to be present in the market of mobility and transport. 5. The main opportunity for the European transport industry is the high level of quality, which is the greatest challenge at the same time - the greatest challenge is to overcome and to challenge own perspectives to stay competitive.
RACE2050© – FP7 314753
D6.1 Report on the synopsis on the current framework conditions – Final – 06/11/2013 Page 6 of 147
2. Introduction
The main aim of this report is to provide an overview over the situation of the European transport sector as a synopsis and to give a future outlook based on this. The objective of the synopsis is a description of the framework conditions for the European transport sector including a broad context perspective. Relevant key factors for competitiveness should be identified and described according to their impact on the transport sectors competitiveness. Main aim is to identify the driving forces increasing competitiveness. Thus the report points out the main advantages and constraints for the competitiveness of the European transport sector and gives an outlook on future challenges and opportunities. This includes a framework for estimating the uncertainty of the occurrence/non-occurrence of future constraints. Beside ‘classical’ aspects of economic competitiveness also aspects related to sustainability will be considered. The latter have become more relevant for the EU as well as for other global players as they have to address issues of:
• growing energy consumption, beside environmental aspects leading to increasing energy prices • climate change related to increasing greenhouse gas emissions, and • scarcity of resources due to increasing demand, which is not only affecting fossil energy but
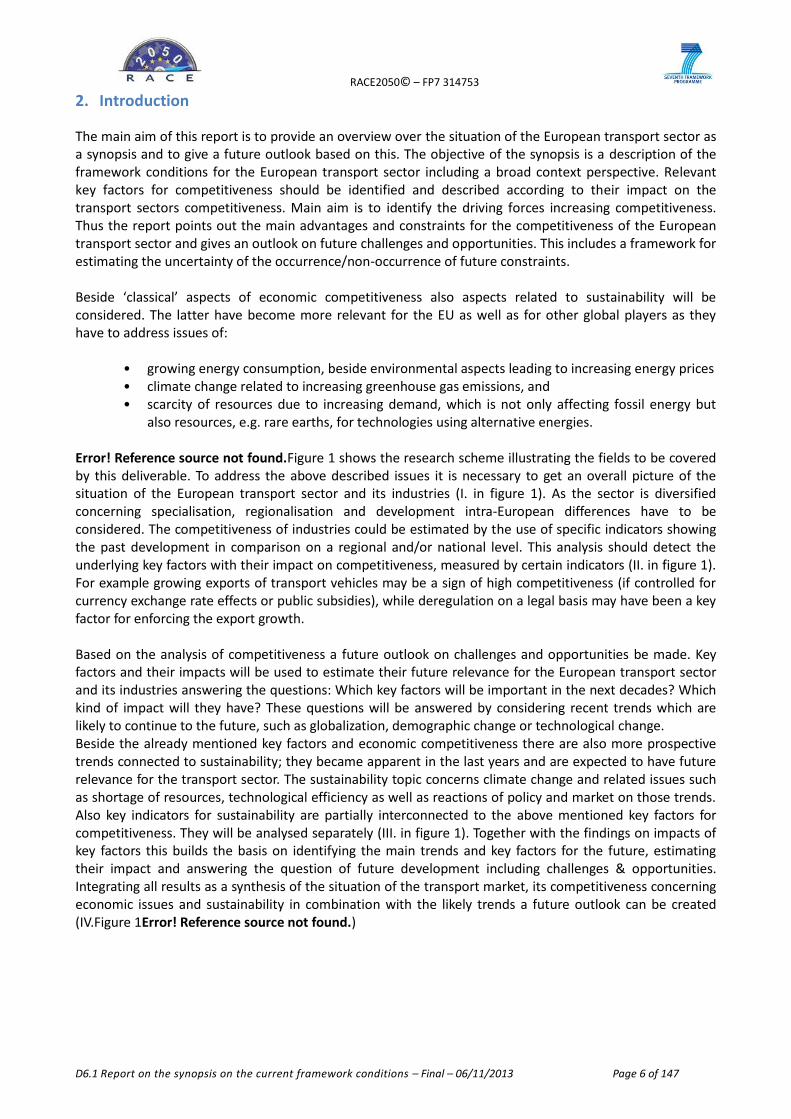
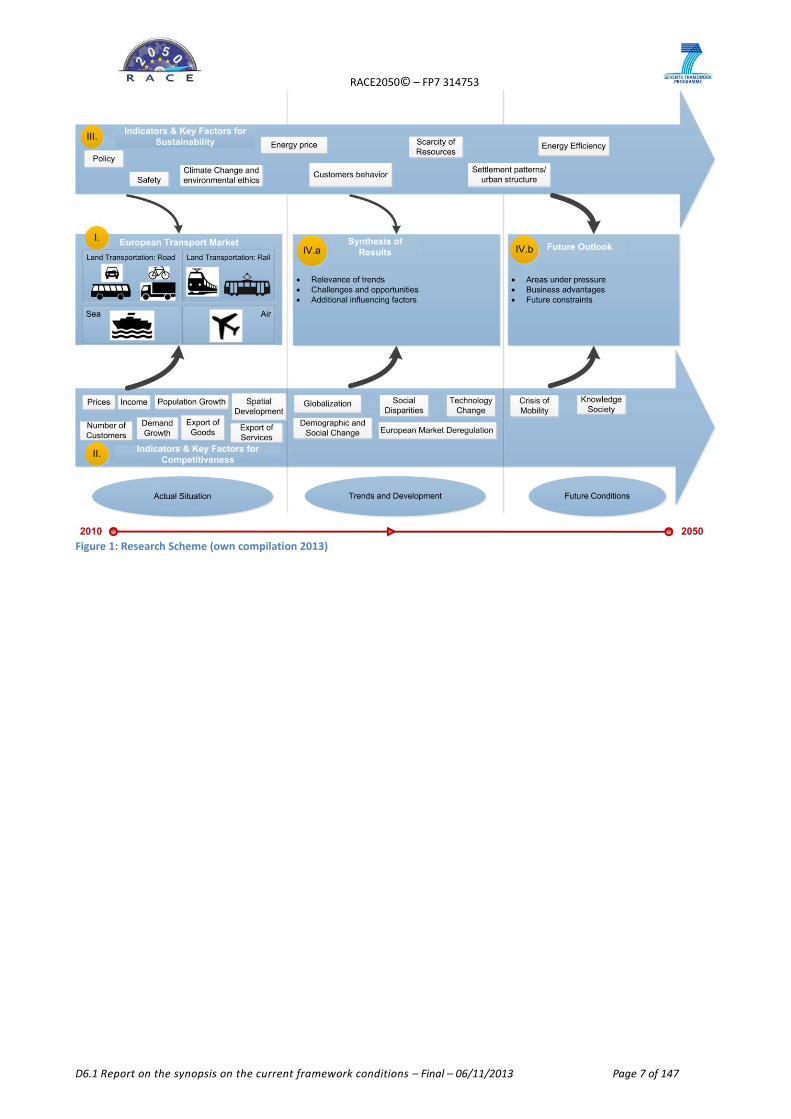
also resources, e.g. rare earths, for technologies using alternative energies. Error! Reference source not found.Figure 1 shows the research scheme illustrating the fields to be covered by this deliverable. To address the above described issues it is necessary to get an overall picture of the situation of the European transport sector and its industries (I. in figure 1). As the sector is diversified concerning specialisation, regionalisation and development intra-European differences have to be considered. The competitiveness of industries could be estimated by the use of specific indicators showing the past development in comparison on a regional and/or national level. This analysis should detect the underlying key factors with their impact on competitiveness, measured by certain indicators (II. in figure 1). For example growing exports of transport vehicles may be a sign of high competitiveness (if controlled for currency exchange rate effects or public subsidies), while deregulation on a legal basis may have been a key factor for enforcing the export growth. Based on the analysis of competitiveness a future outlook on challenges and opportunities be made. Key factors and their impacts will be used to estimate their future relevance for the European transport sector and its industries answering the questions: Which key factors will be important in the next decades? Which kind of impact will they have? These questions will be answered by considering recent trends which are likely to continue to the future, such as globalization, demographic change or technological change. Beside the already mentioned key factors and economic competitiveness there are also more prospective trends connected to sustainability; they became apparent in the last years and are expected to have future relevance for the transport sector. The sustainability topic concerns climate change and related issues such as shortage of resources, technological efficiency as well as reactions of policy and market on those trends. Also key indicators for sustainability are partially interconnected to the above mentioned key factors for competitiveness. They will be analysed separately (III. in figure 1). Together with the findings on impacts of key factors this builds the basis on identifying the main trends and key factors for the future, estimating their impact and answering the question of future development including challenges & opportunities. Integrating all results as a synthesis of the situation of the transport market, its competitiveness concerning economic issues and sustainability in combination with the likely trends a future outlook can be created (IV.Figure 1Error! Reference source not found.)
RACE2050© – FP7 314753
D6.1 Report on the synopsis on the current framework conditions – Final – 06/11/2013 Page 7 of 147
Figure 1: Research Scheme (own compilation 2013)
RACE2050© – FP7 314753
D6.1 Report on the synopsis on the current framework conditions – Final – 06/11/2013 Page 8 of 147
3. Approach and Method
According to the above described design of the research the analysis of the framework conditions for the European transport sector has been organised in four steps (I. to IV. in Figure 1).
I. Description of the European transport market
II. Key Factors for Competitiveness III. Key Indicators for Sustainability IV. Challenges and Opportunities
I. Description of the European transport market
The importance of influencing factors and their impact on different industries are varying according to specific demand and supply. With regard to this in a first step the European transport sector was classified by kind of business as a basis for the following analysis of competitiveness (see Scheme transport sector in Figure 2). For the analysis the transport sector first was divided in two main categories:
Transport-manufacturer, and
Transport Service Provider These parts were subdivided based on the NACE classification1. For these different industries a description of the market will give an overview over the general situation, centres or specific aspects relevant to competitiveness, such as diversification versus concentration of the sector or main players.
II. Key indicators and factors for competitiveness This work will include the analysis of the development of the transport sector, its competitiveness and the underlying factors driving the development to get an overall picture of the situation. The situation and development of single industries was analysed based on indicators showing the performance of the transport sector in terms of competitiveness. Based on such competitiveness indicators the sub industries were analysed on national and European level as well as in international comparison (including China, Brazil, Korea, India, USA, etc.). The analysis of the subareas is necessary to show differences in development. It also helps to identify areas under pressure and areas of business advantages for European companies in step IV. The work was based on desk research supported by statistical data. As the main aim was to identify key factors and their impact on competitiveness underlying factors were identified to be included in the further assessment of challenges and opportunities in step IV.
III. Key Indicators for Sustainability Beside economic competitiveness also the position of the European transport sector concerning sustainability in international comparison should be analysed. Sustainable aspects are expected to become more important in the next decades. Transport - as a highly energy consuming industry - will be affected by this trend to a higher degree in the future due to growing demand formability and increasing prices. First a bunch of competitiveness indicators concerning sustainability were identified. These indicators were analysed for the transport sectors of different countries (China, Brazil, Korea, India, USA, etc.). The results of comparison also complete the analysis of areas under pressure and business advantages of the European market and were included for assessing future challenges and opportunities of the transport industry in step IV.
1 NACE Classification of Economic Activities in the European Community:
http://ec.europa.eu/eurostat/ramon/nomenclatures/index.cfm?TargetUrl=LST_NOM_DTL&StrNom=NACE_REV2&StrLanguageCode=DE&IntPcKey=&StrLayoutCode=HIERARCHICec.europa.eu/eurostat/ramon/nomenclaturs
RACE2050© – FP7 314753
D6.1 Report on the synopsis on the current framework conditions – Final – 06/11/2013 Page 9 of 147
IV. Challenges and Opportunities Based on the results of I., II. and III., the last part synthesizes the situation of the transport sector concerning its competitiveness according to the future development of main important key factors for competitiveness and sustainability. This includes two main parts:
a) The Synthesis of results includes the following aspects which were assessed by an online-expert consultation:
Assessment of the relevance of the assumed trends with impacts on competitiveness
Identification and evaluation of challenges and opportunities for the EU transport sector
Gathering of additional input from experts b) A future outlook on challenges and opportunities deduced from the competitive analysis covering
the following aspects: • Industries and market areas under pressure • Business advantages for EU transport sector • Estimation of future constraints for the EU transport sector
c) Expert consultation
The future development of the European transport sector and the resulting challenges and opportunities covering competitiveness have also been analysed by an experts´ consultation. 30 experts of different fields of activity (politics, research, transport planning, urban/spatial planning, automotive industry, rail industry, maritime industry, supplier industry, services public transport, others) took position to a questionnaire concerning the potential future development of competition relevant aspects. In detail the experts were asked about the following topics:
Transport demand
Global transport demand development
Emerging markets
New technologies
Expected changes
EU’s sustainability policy’s role
RACE2050© – FP7 314753
D6.1 Report on the synopsis on the current framework conditions – Final – 06/11/2013 Page 10 of 147
4. The European transport Market
In the following chapters an overview of the market structures and developments of the European transport market will be given. Due to their specific structure and situation road, rail, sea and air transport will be described separately.
4.1 Road transport
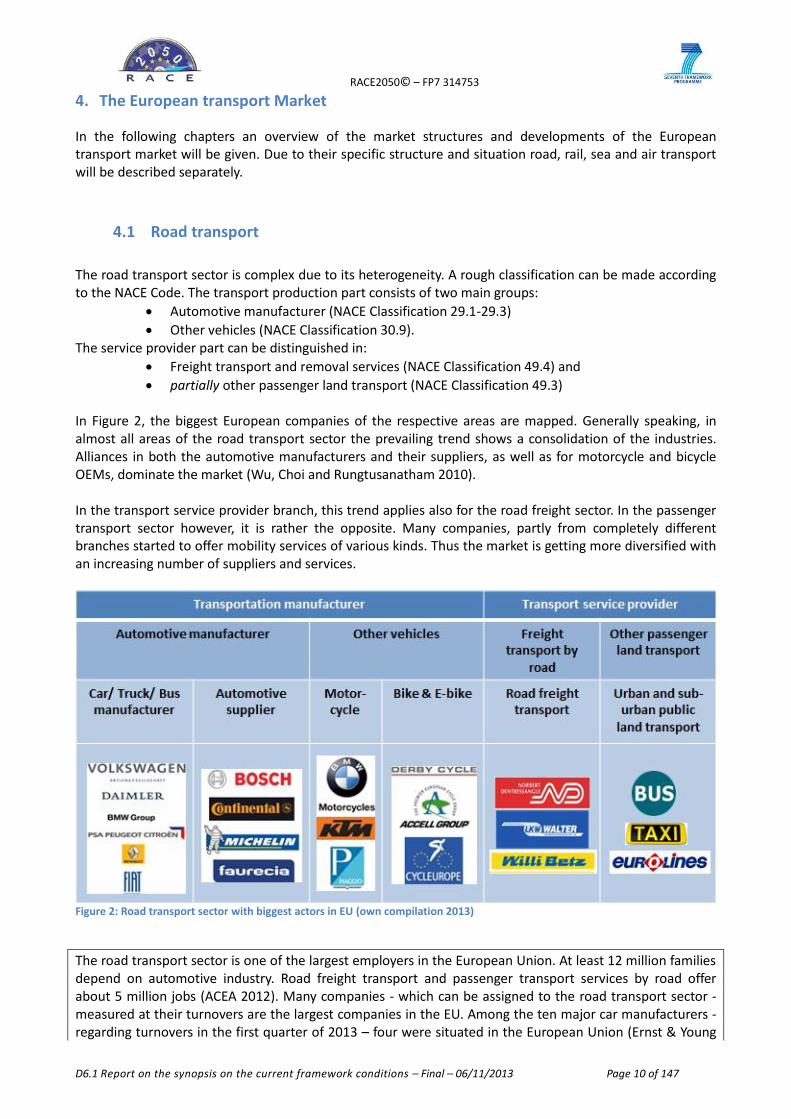
The road transport sector is complex due to its heterogeneity. A rough classification can be made according to the NACE Code. The transport production part consists of two main groups:
Automotive manufacturer (NACE Classification 29.1-29.3)
Other vehicles (NACE Classification 30.9). The service provider part can be distinguished in:
Freight transport and removal services (NACE Classification 49.4) and
partially other passenger land transport (NACE Classification 49.3) In Figure 2, the biggest European companies of the respective areas are mapped. Generally speaking, in almost all areas of the road transport sector the prevailing trend shows a consolidation of the industries. Alliances in both the automotive manufacturers and their suppliers, as well as for motorcycle and bicycle OEMs, dominate the market (Wu, Choi and Rungtusanatham 2010). In the transport service provider branch, this trend applies also for the road freight sector. In the passenger transport sector however, it is rather the opposite. Many companies, partly from completely different branches started to offer mobility services of various kinds. Thus the market is getting more diversified with an increasing number of suppliers and services.
Figure 2: Road transport sector with biggest actors in EU (own compilation 2013)
The road transport sector is one of the largest employers in the European Union. At least 12 million families depend on automotive industry. Road freight transport and passenger transport services by road offer about 5 million jobs (ACEA 2012). Many companies - which can be assigned to the road transport sector - measured at their turnovers are the largest companies in the EU. Among the ten major car manufacturers - regarding turnovers in the first quarter of 2013 – four were situated in the European Union (Ernst & Young
RACE2050© – FP7 314753
D6.1 Report on the synopsis on the current framework conditions – Final – 06/11/2013 Page 11 of 147
2012). Particularly the automotive OEMs are global players and their developments are considered to be extremely innovative with high investments in R&D, often setting the agenda for future development of the entire sector. Safety and assistance systems, which are mainly installed at first in the luxury class of European manufacturer’s products are seen by many experts as groundbreaking and market-changing (Pander 2013). The sector is very innovative with big investments in R&D. Many companies are connected to the road transport sector, either directly or indirectly. Freight transport by road has with over 35% (expressed in tone kilometres in 2010) the biggest share of all freight transport in EU and is still increasing (European Union 2012). Passenger transport services by road are important for public transport especially in European cities and agglomerations, based on buses and taxis. For long distance journeys the bus system offers a convenient alternative to rail sector with potential to develop further.
4.1.1 Automotive manufacturers
The automotive industry is still “the engine” of the manufacturing sector in Europe (ACEA 2012). In 2010 about 3.2 million jobs were allocated to the automotive manufacturing industry. Therefore it is one of the most important manufacturing industries in Europe regarding employment and revenues. Overall the European Union automotive sector offered 11.6 million people work in 2010 with two million direct jobs and another 10 million in directly related manufacturing and other sectors (ACEA 2012). Recently there are 233 automobile assembly and production plants in 18 different member states of the EU-27 (ACEA 2012). The automotive industry has, with more than €700 billion in turnover, a multiplier effect on the entire economy in Europe via links with other sectors, such as steel, chemical and textile (European Commission 2012). It also is one of the biggest EU export sectors and leading in high-quality products. It is a highly innovative sector with lots of patent applications selling and producing vehicles in all major world markets. In 2011 over 58% of all patents were filed in the automotive sector at the European patent office (ACEA 2012b). In 2007 the European automotive industry reached a peak with 19.7 million produced vehicles, which is equivalent to about 27% of total production worldwide. In the segment of cars the EU holds a global market share of about 30% (European Commission 2009). In 2013 China is likely to surpass the European auto production for the first time. Citing five forecasters China will produce in 2013 approximately 19.6 million cars, while in Europe only 18.3 million will be produced (Spiegel 2013). European companies are present in almost all markets. Mostly they were able to strengthen their position in the recent years due to their presence in the overseas markets, in which the sales quantity did not subside. But there are also regional differences within the Union. The competitiveness of the European companies on the global market differs. Some manufacturers have overcome the financial crisis better than others. Fiat for example still has to fight with their competitiveness on the European and global markets (Frost & Sullivan 2013). The current macro-economic situation leads to a decline of automotive sales. Recovery of growth on a global level is expected in 2014/2015 and a return to pre-crisis levels is not expected in the next 4-5 years - in certain markets, like the European market, only by the end of the decade (European Commission 2009). In contrast, the demand for automobiles in other regions (especially in China) is stronger than ever. Changes fired up by political decisions and social developments concerning reductions of CO2 emissions in transport supported sustainable technologies like electric vehicles. While electric vehicles sales in EU in 2011 reached only 11,000 units, electro-mobility is firmly on track and it is expected that by 2020, registrations of vehicles with traditional combustion engines will fall while the registrations of electric vehicles will increase its share to 7% (European Commission 2012).
Excursus The bus and truck manufacturers in the European Union are mostly affiliated to car manufacturers. The three largest truck manufacturers in Europe are Daimler, Volvo and MAN. Volvo was bought in 2010 by the Chinese automaker Geely. Volkswagen holds the biggest share of MAN / Scania. In terms of market share, Dongfeng is currently the world's largest truck manufacturers with 11.3%, followed by Daimler Trucks with
RACE2050© – FP7 314753
D6.1 Report on the synopsis on the current framework conditions – Final – 06/11/2013 Page 12 of 147
9.7% and MAN / Scania and Volvo follow on position six and seven (Fasse und Schneider 2012). The situation is similar with the three largest bus manufacturers. Again, Chinese manufacturers take the top position. After sales in 2012 the company Yutong is market leader. Second place went to King Long (Market Watch 2012). The European network of automotive suppliers is very pronounced. Also here are the most innovative companies and supply the entire automotive market. The two largest companies worldwide by revenue in 2012 are European: Bosch and Continental (Statista 2013). But these are not the only successful suppliers of the EU. According to CLEPA (the European Association of Automotive Suppliers), the supplier sector includes some 3,000 companies, of which 2,500 are small or medium-sized enterprises employing over 3 million people. (European commission 2009). The technological developments that arise are often considered market-changing in their R&D section. The supply chain of all European suppliers is distinct, so their presence on the world market is very strong and the dependence from single automobile manufacturers reduced (BCG Boston Consulting Group 2010)2.
4.1.2 Other manufacturers
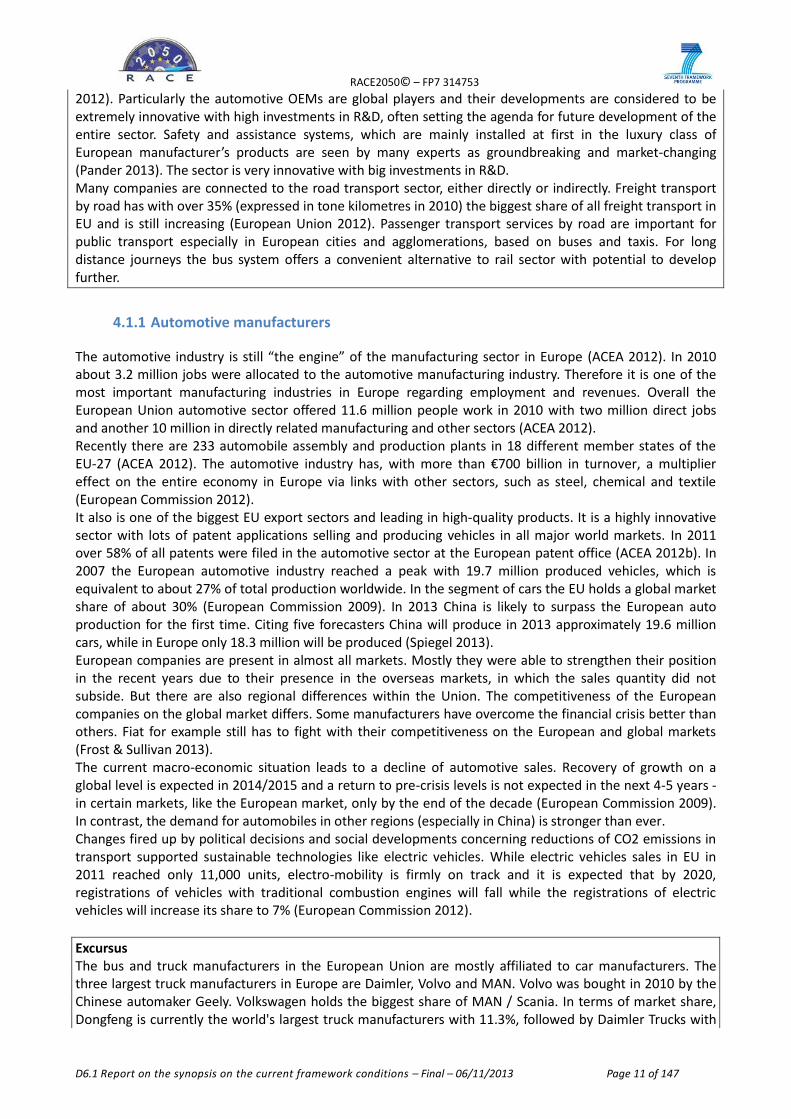
The motorcycle industry in the European Union is characterized by a negative trade balance (ACEM 2010). Although the demand for motorcycles in the EU is very high and there are strong producers within the EU, such as Piaggio, the competition from Asia is significantly stronger. The trade balance of exports to imports is negative since years and restrictions on access to foreign markets also prevent a change in this trend (ACEM 2010). Figure 3 shows the decreasing production of motorcycles in the EU between 2001 and 2011. It is not clear yet whether the motorcycle industry can improve their current situation by developments in the area of electric motorcycles in Europe.
Figure 3: Production of powered two-wheelers in Europe 2001-2011 (ACEM 2013)
Beside the motorcycle manufacturers the bicycle industry is another branch in the road transport sector. Compared to the big network of the automotive manufacturers, motorcycle and bicycle industry appears small concerning employment and revenues, although they have much in common historically. Similar to the motorcycle industry the development of European Union´s bicycle industry is decreasing (Figure 3). The current low production was significantly declined by the crisis. As in other industrial areas European manufacturer only occupy top positions in niche markets. Nevertheless, the bicycle industry is changing. As bikes are losing the image of recreational objects the demand for bicycles increase and they become increasingly important as a mean of transport -especially in cities where bikes in same cases are part of the cities mobility policies like in Munich, where they established a transport development plan for cycling (Landeshauptstadt München 2006). Technological developments in the field of electrical bicycles
2 The Boston Consulting Group (BCG) is a global strategic management consulting
RACE2050© – FP7 314753
D6.1 Report on the synopsis on the current framework conditions – Final – 06/11/2013 Page 13 of 147
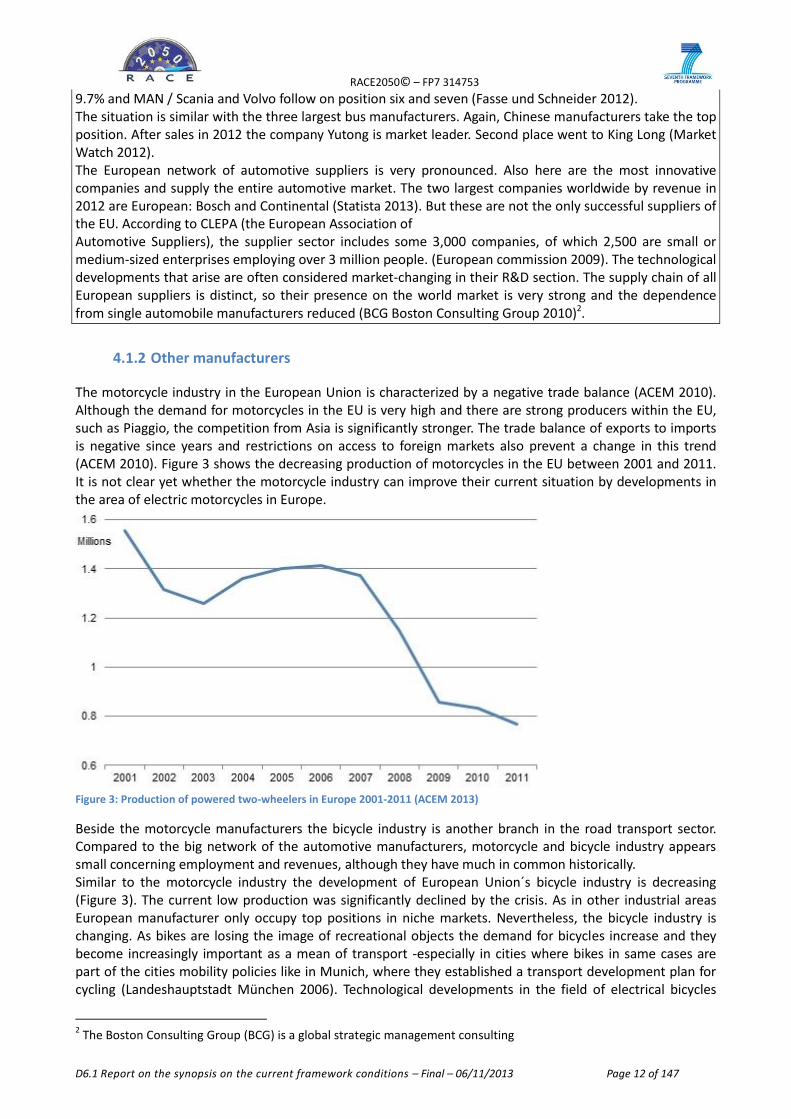
support this and bring the industry a boost. Sales for bikes and e-bikes are growing (Bike Europe 2013).
Figure 4: Bicycle production by region between 1998 and 2007 (Earth Policy Institute 2008)
At the same time EU´s production volume, sales and also exports for bikes decreased (Earth Policy Institute 2008). China is the world's dominant supplier of bicycles by far (Figure 4). Imports from China and Taiwan displaced the European producers in their own market (Formosa 2012).Competitiveness in this area is limited for European manufacturers. Only in niche markets, particularly in the high tech sector, their technological advantage still counts. For the future it will be seen if the upcoming e-bike sector could change the actual trends of growing companies in China and other emerging market versus a shrinking bicycle industry in Europe. It will turn out whether quality and comfort, especially in the e-bike range (e.g. reliable batteries), guide the European bicycle production back to the markets.
4.1.3 Freight transport by road and removal services
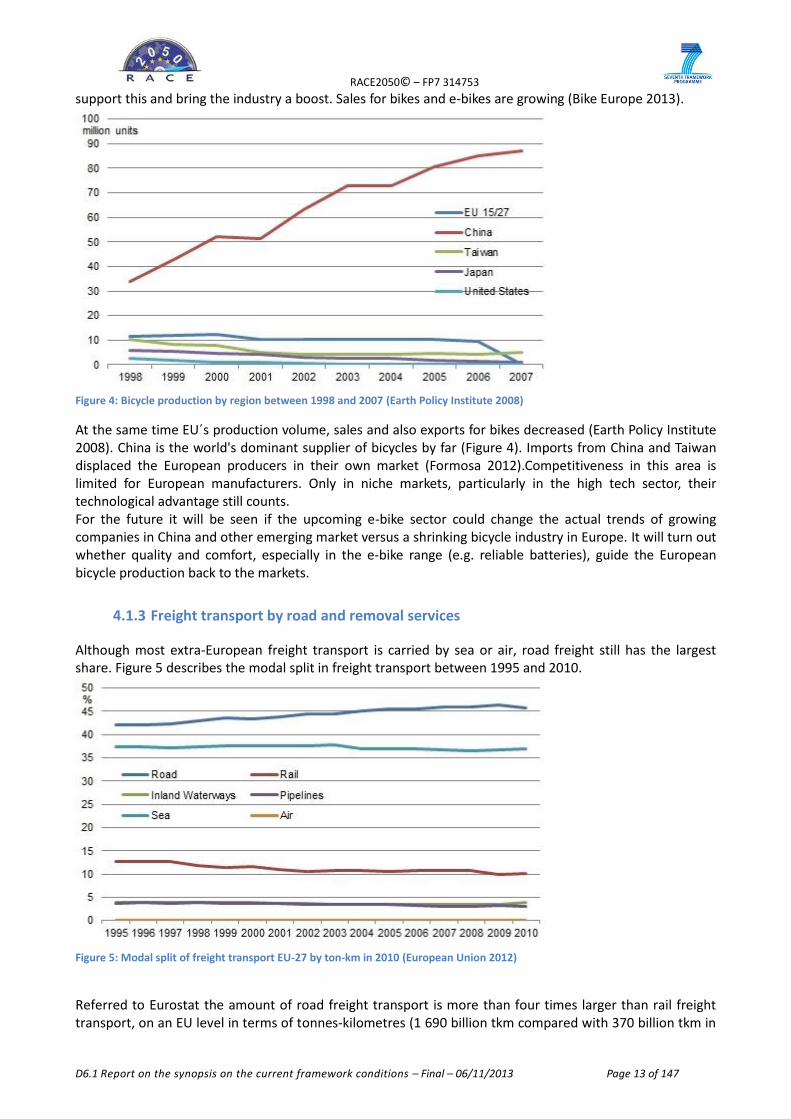
Although most extra-European freight transport is carried by sea or air, road freight still has the largest share. Figure 5 describes the modal split in freight transport between 1995 and 2010.
Figure 5: Modal split of freight transport EU-27 by ton-km in 2010 (European Union 2012)
Referred to Eurostat the amount of road freight transport is more than four times larger than rail freight transport, on an EU level in terms of tonnes-kilometres (1 690 billion tkm compared with 370 billion tkm in
RACE2050© – FP7 314753
D6.1 Report on the synopsis on the current framework conditions – Final – 06/11/2013 Page 14 of 147
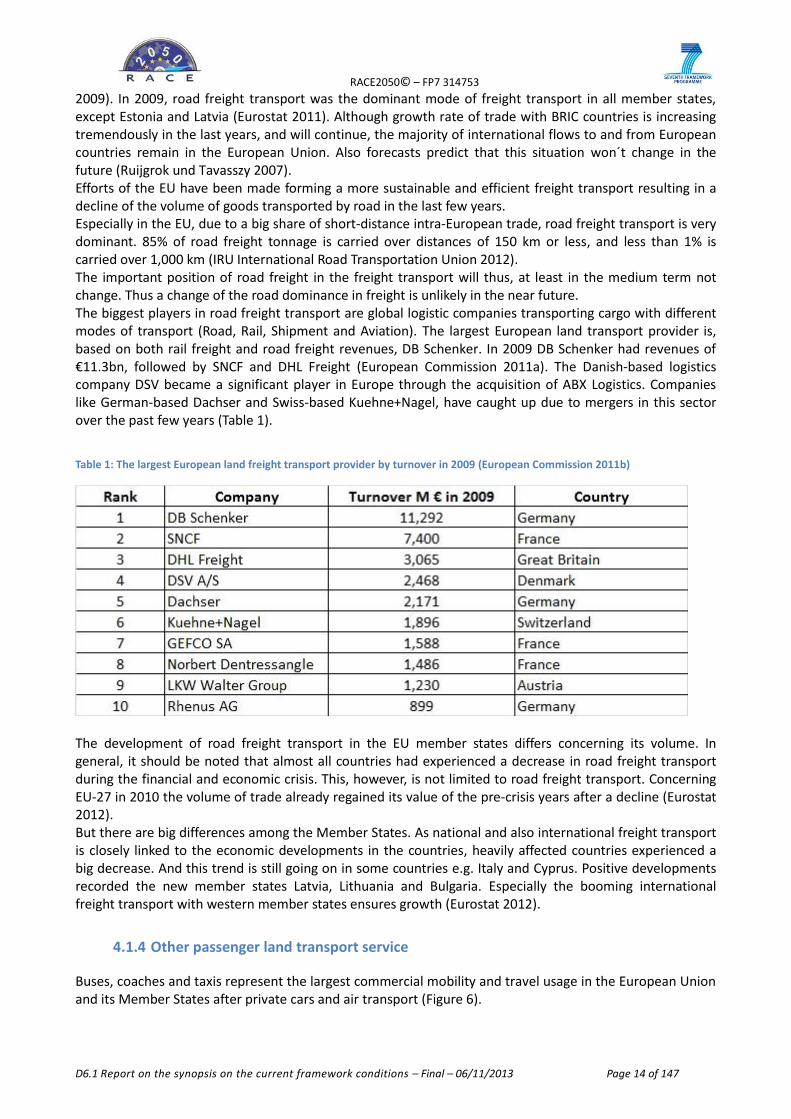
2009). In 2009, road freight transport was the dominant mode of freight transport in all member states, except Estonia and Latvia (Eurostat 2011). Although growth rate of trade with BRIC countries is increasing tremendously in the last years, and will continue, the majority of international flows to and from European countries remain in the European Union. Also forecasts predict that this situation won´t change in the future (Ruijgrok und Tavasszy 2007). Efforts of the EU have been made forming a more sustainable and efficient freight transport resulting in a decline of the volume of goods transported by road in the last few years. Especially in the EU, due to a big share of short-distance intra-European trade, road freight transport is very dominant. 85% of road freight tonnage is carried over distances of 150 km or less, and less than 1% is carried over 1,000 km (IRU International Road Transportation Union 2012). The important position of road freight in the freight transport will thus, at least in the medium term not change. Thus a change of the road dominance in freight is unlikely in the near future. The biggest players in road freight transport are global logistic companies transporting cargo with different modes of transport (Road, Rail, Shipment and Aviation). The largest European land transport provider is, based on both rail freight and road freight revenues, DB Schenker. In 2009 DB Schenker had revenues of €11.3bn, followed by SNCF and DHL Freight (European Commission 2011a). The Danish-based logistics company DSV became a significant player in Europe through the acquisition of ABX Logistics. Companies like German-based Dachser and Swiss-based Kuehne+Nagel, have caught up due to mergers in this sector over the past few years (Table 1).
Table 1: The largest European land freight transport provider by turnover in 2009 (European Commission 2011b)
The development of road freight transport in the EU member states differs concerning its volume. In general, it should be noted that almost all countries had experienced a decrease in road freight transport during the financial and economic crisis. This, however, is not limited to road freight transport. Concerning EU-27 in 2010 the volume of trade already regained its value of the pre-crisis years after a decline (Eurostat 2012). But there are big differences among the Member States. As national and also international freight transport is closely linked to the economic developments in the countries, heavily affected countries experienced a big decrease. And this trend is still going on in some countries e.g. Italy and Cyprus. Positive developments recorded the new member states Latvia, Lithuania and Bulgaria. Especially the booming international freight transport with western member states ensures growth (Eurostat 2012).
4.1.4 Other passenger land transport service
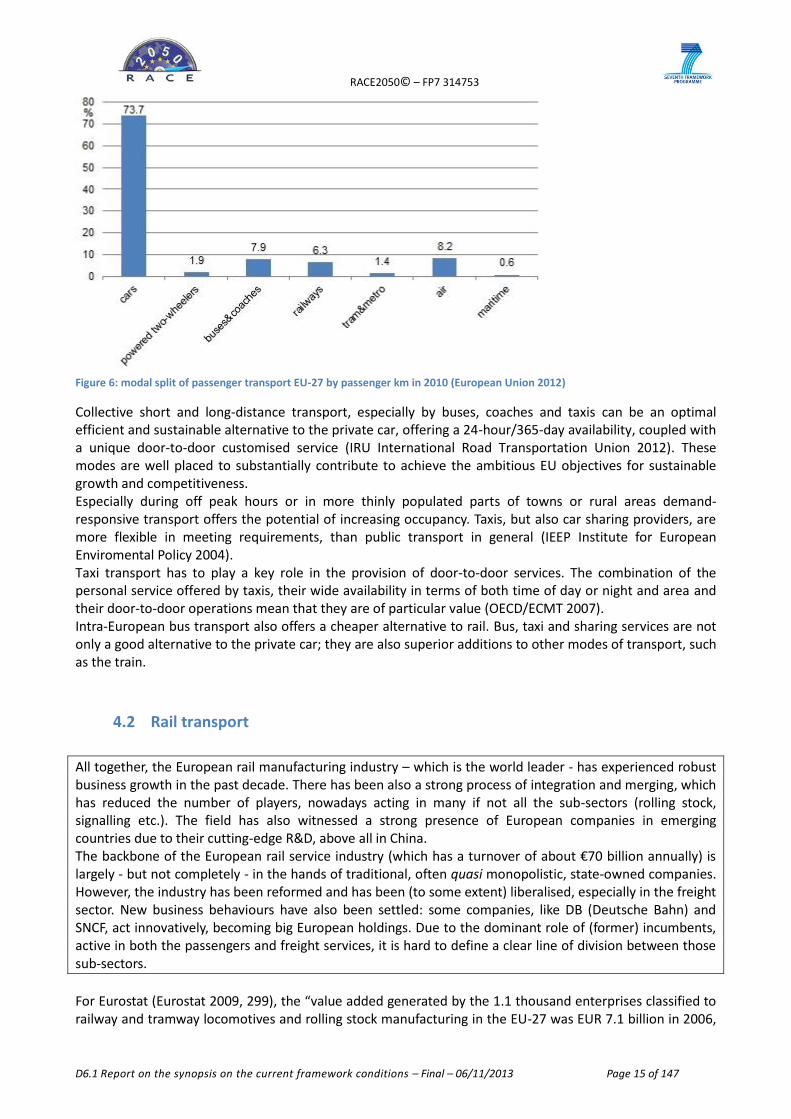
Buses, coaches and taxis represent the largest commercial mobility and travel usage in the European Union and its Member States after private cars and air transport (Figure 6).
RACE2050© – FP7 314753
D6.1 Report on the synopsis on the current framework conditions – Final – 06/11/2013 Page 15 of 147
Figure 6: modal split of passenger transport EU-27 by passenger km in 2010 (European Union 2012)
Collective short and long-distance transport, especially by buses, coaches and taxis can be an optimal efficient and sustainable alternative to the private car, offering a 24-hour/365-day availability, coupled with a unique door-to-door customised service (IRU International Road Transportation Union 2012). These modes are well placed to substantially contribute to achieve the ambitious EU objectives for sustainable growth and competitiveness. Especially during off peak hours or in more thinly populated parts of towns or rural areas demand-responsive transport offers the potential of increasing occupancy. Taxis, but also car sharing providers, are more flexible in meeting requirements, than public transport in general (IEEP Institute for European Enviromental Policy 2004). Taxi transport has to play a key role in the provision of door-to-door services. The combination of the personal service offered by taxis, their wide availability in terms of both time of day or night and area and their door-to-door operations mean that they are of particular value (OECD/ECMT 2007). Intra-European bus transport also offers a cheaper alternative to rail. Bus, taxi and sharing services are not only a good alternative to the private car; they are also superior additions to other modes of transport, such as the train.
4.2 Rail transport
All together, the European rail manufacturing industry – which is the world leader - has experienced robust business growth in the past decade. There has been also a strong process of integration and merging, which has reduced the number of players, nowadays acting in many if not all the sub-sectors (rolling stock, signalling etc.). The field has also witnessed a strong presence of European companies in emerging countries due to their cutting-edge R&D, above all in China. The backbone of the European rail service industry (which has a turnover of about €70 billion annually) is largely - but not completely - in the hands of traditional, often quasi monopolistic, state-owned companies. However, the industry has been reformed and has been (to some extent) liberalised, especially in the freight sector. New business behaviours have also been settled: some companies, like DB (Deutsche Bahn) and SNCF, act innovatively, becoming big European holdings. Due to the dominant role of (former) incumbents, active in both the passengers and freight services, it is hard to define a clear line of division between those sub-sectors.
For Eurostat (Eurostat 2009, 299), the “value added generated by the 1.1 thousand enterprises classified to railway and tramway locomotives and rolling stock manufacturing in the EU-27 was EUR 7.1 billion in 2006,
RACE2050© – FP7 314753
D6.1 Report on the synopsis on the current framework conditions – Final – 06/11/2013 Page 16 of 147
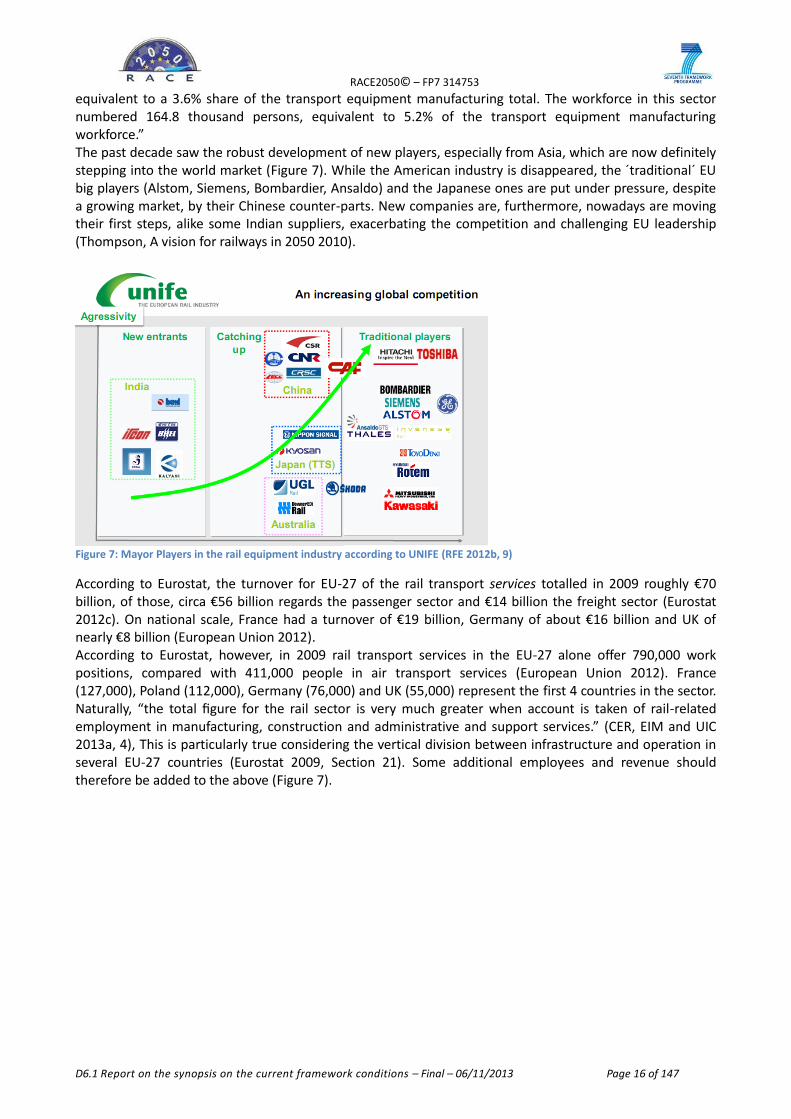
equivalent to a 3.6% share of the transport equipment manufacturing total. The workforce in this sector numbered 164.8 thousand persons, equivalent to 5.2% of the transport equipment manufacturing workforce.” The past decade saw the robust development of new players, especially from Asia, which are now definitely stepping into the world market (Figure 7). While the American industry is disappeared, the ´traditional´ EU big players (Alstom, Siemens, Bombardier, Ansaldo) and the Japanese ones are put under pressure, despite a growing market, by their Chinese counter-parts. New companies are, furthermore, nowadays are moving their first steps, alike some Indian suppliers, exacerbating the competition and challenging EU leadership (Thompson, A vision for railways in 2050 2010).
Figure 7: Mayor Players in the rail equipment industry according to UNIFE (RFE 2012b, 9)
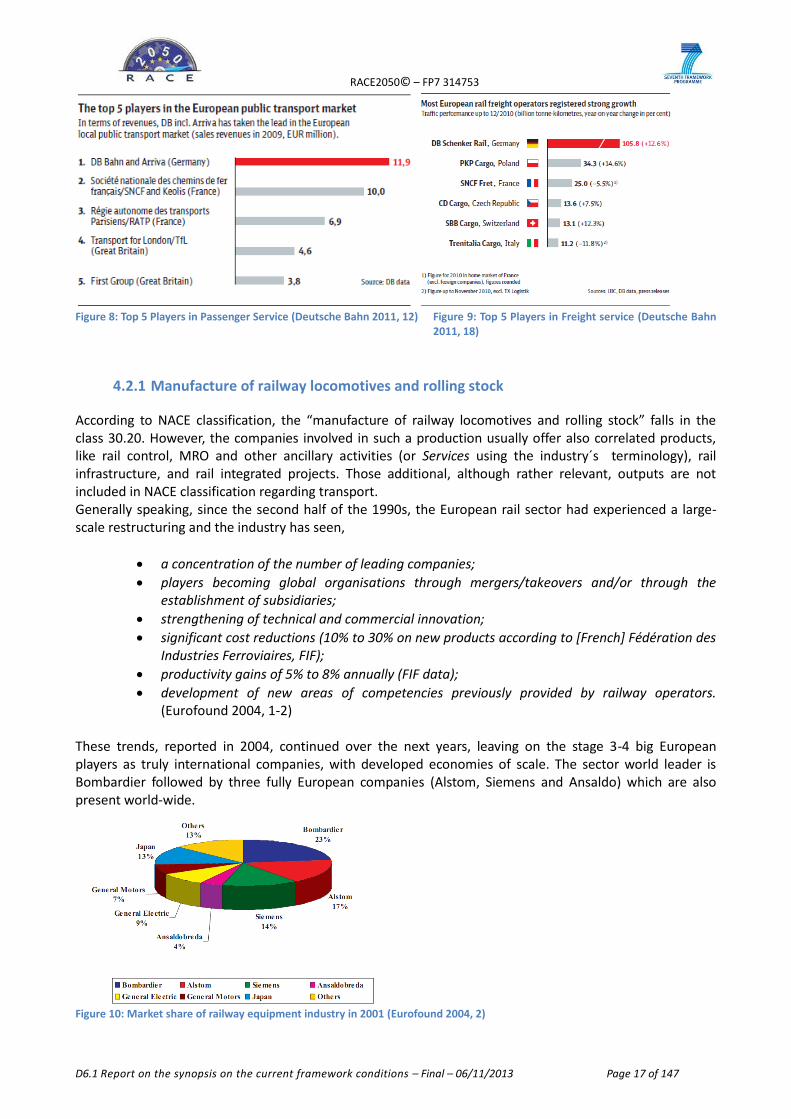
According to Eurostat, the turnover for EU-27 of the rail transport services totalled in 2009 roughly €70 billion, of those, circa €56 billion regards the passenger sector and €14 billion the freight sector (Eurostat 2012c). On national scale, France had a turnover of €19 billion, Germany of about €16 billion and UK of nearly €8 billion (European Union 2012). According to Eurostat, however, in 2009 rail transport services in the EU-27 alone offer 790,000 work positions, compared with 411,000 people in air transport services (European Union 2012). France (127,000), Poland (112,000), Germany (76,000) and UK (55,000) represent the first 4 countries in the sector. Naturally, “the total figure for the rail sector is very much greater when account is taken of rail-related employment in manufacturing, construction and administrative and support services.” (CER, EIM and UIC 2013a, 4), This is particularly true considering the vertical division between infrastructure and operation in several EU-27 countries (Eurostat 2009, Section 21). Some additional employees and revenue should therefore be added to the above (Figure 7).
RACE2050© – FP7 314753
D6.1 Report on the synopsis on the current framework conditions – Final – 06/11/2013 Page 17 of 147
Figure 8: Top 5 Players in Passenger Service (Deutsche Bahn 2011, 12) Figure 9: Top 5 Players in Freight service (Deutsche Bahn
2011, 18)
4.2.1 Manufacture of railway locomotives and rolling stock
According to NACE classification, the “manufacture of railway locomotives and rolling stock” falls in the class 30.20. However, the companies involved in such a production usually offer also correlated products, like rail control, MRO and other ancillary activities (or Services using the industry´s terminology), rail infrastructure, and rail integrated projects. Those additional, although rather relevant, outputs are not included in NACE classification regarding transport. Generally speaking, since the second half of the 1990s, the European rail sector had experienced a large-scale restructuring and the industry has seen,
a concentration of the number of leading companies;
players becoming global organisations through mergers/takeovers and/or through the establishment of subsidiaries;
strengthening of technical and commercial innovation;
significant cost reductions (10% to 30% on new products according to [French] Fédération des Industries Ferroviaires, FIF);
productivity gains of 5% to 8% annually (FIF data);
development of new areas of competencies previously provided by railway operators. (Eurofound 2004, 1-2)
These trends, reported in 2004, continued over the next years, leaving on the stage 3-4 big European players as truly international companies, with developed economies of scale. The sector world leader is Bombardier followed by three fully European companies (Alstom, Siemens and Ansaldo) which are also present world-wide.
Figure 10: Market share of railway equipment industry in 2001 (Eurofound 2004, 2)
RACE2050© – FP7 314753
D6.1 Report on the synopsis on the current framework conditions – Final – 06/11/2013 Page 18 of 147
Although with some teething troubles3, these big European companies were able to consolidate their market shares (figure 10) Moreover, the European rail manufacturing industry, pushed by strong development in emerging economies (and by the need of service and maintenance of the already existing networks) passed through the economic crisis with minor damages (UNIFE 2012, 6). Of the total markets, about €105 billion are in so-called “accessible” markets, e.g. markets which have “open door” policy and are open to any supplier. The “not accessible” markets have de facto hurdles for foreign players – such as Japan (RFE 2012a). Additionally, some markets (like China) are accessible only with technological transfers. Due to different gauges, signalling systems, local or national practises and so on, the rail supply sector cannot be defined as one world market, but instead as a plurality of tailored markets, which have their own requirements. Additionally, we should keep in mind that many of the rail equipment industry products have a long life cycle, often longer than 20 years (UIC and CER 2010). Moreover, “most transport equipment manufacturing activities are structured on the basis of complex pyramidal relationships between major manufacturers and several tiers of component suppliers, ranging from systems suppliers down to very small, specialised manufacturers that may provide a single component for a vehicle. It is common to find clusters of enterprises concentrated in regions around the leading producers” (Eurostat 2009, 286). Finally, more than other transport sectors, railway industries, generally speaking, are more product-oriented than customer-oriented, although relevant changes have happened in the most recent years. As an overall picture, according to same rail lobby (ERRAC 2011, 4), “the sector is for many reasons relatively slow to adopt new ideas and technologies”, although this seems to be less true in the past decade, as witnessed by new business models and new market attitudes. However, economies of scale and homogenisation of procedures and performances are surely achievable, and many of those have been achieved in the past decades. Being a tailored market, and often strongly influenced by local (technical and political) conditions, economies of scale are not so easily achievable.
4.2.2 Passenger rail transport services
Although split in two separated classes according to NACE classification, in each EU Member State rail passengers (NACE 49.1, and partially 49.31) and rail freight (NACE 49.20) services are very often run by the same national (former) incumbent company. It is thus difficult to elaborate two separate analyses for the two realms of passengers and freight, due to de facto monopoly still enjoyed by those ´national champion´. However some changes happened in the past two decades. All together,
Since the early 1990s the European rail transport sector has undergone massive structural change. These changes have largely been driven by EU policies aimed at developing a more integrated European railway market, at improving efficiency and competitiveness in the railway sector, and at further opening up market access to new entrants” (Eurofound 2006, 22).
Looking back at the past, “we should notice that the railways essentially developed in a system of national economies” (Engle 2012, 8). In the past decades, usually a centralized, state owned company ran the network and organized all the organisational aspects of such a system. The network fragmentation and the national monopoly state-of-the-art were seen as unpleasant for several reasons.
1. Throughout the post-WW2 period, the national “isolation” of the European network was seen as a burden which impeded a more appropriate economy of scale for European operators and, thus, for the whole rail industry, including the manufacturing side (Schot 2012).
2. National monopolistic companies had often political goals, not necessarily overlapping with business concerns and financial performance. New social compromise developed after the 1970s considered the situation as negative for the development of a (more-efficient) sector. Additionally,
3 “Railway and tramway locomotives and rolling stock manufacturing saw output in the EU-27 fall sharply in 2000,
since when, output expanded, most years. Average output growth between 2000 and 2007 was 2.3 % per annum, boosted by strong growth in 2002 and most recently in 2007” (Eurostat 2009, 299).
RACE2050© – FP7 314753
D6.1 Report on the synopsis on the current framework conditions – Final – 06/11/2013 Page 19 of 147
in the 1980s the political debate moved to characterize state-owned, monopolistic companies as inept and not innovative (Thompson 2010).
3. Thirdly, national separations in such a vital and symbolic topic (as the transport system is) inherently challenged the core idea of European integration, as stated in a 1985 Condemnation of the EU council for inactivity in the transport field (Heriter et alii 2001).
Considering the political patronage of the national rail operators, for many decades there were no changes in the sector, which was, meanwhile, under pressure from a strong competition coming from the road transport. In the 1990s a better policy was shaped, with the goal to create a proper competition, not only within the rail market, but more generally in the transport field. The Commission directive 1991/440 was a first step (ITS and CER 2009, 8), and the directives 2001/12, 2001/13 and 2001/14 were further actions to break the on-going status quo and to open the market. Thus, “the industry has been restructured on two levels, the vertical dimension, which involves the relationship between infrastructure and operations, and the horizontal dimension, which covers the relationship between the various services that use the infrastructure.” (Cantos, Pastor und Serrano 2008, 5) In other words, with the EU 2001 white paper, “the Commission took the view that the decline in rail traffic over the past 30 years reflected in part the failure of the rail system to provide efficient high quality transport, and the fact that the relative prices of the different modes of transport did not reflect their full social costs including externalities” (ITS and CER 2009, 13).
4.2.3 Freight rail transport services
The rail freight services (NACE 49.20), benefitted more than the passenger sector of EU 2006 policies, which further developed the directives 1991/440 and 2001/14. All together, the EU rail service policy aimed to:
• Separation of the management of infrastructure, freight and passenger services, at least into separate divisions with their own profit and loss accounts and balance sheets; • Non-discriminatory setting of access charges and allocation of paths (as a safeguard; if the infrastructure manager was also involved in train operation then these functions had to be undertaken by an independent body); • The establishment of a rail regulator, independent of the infrastructure manager and any train operator, to whom appeal could be made in the case of dispute; • A performance regime to incentivise the infrastructure manager; • Financial equilibrium of the infrastructure manager - either through the regulatory system or by means of a multi-annual contract lasting at least three years – whilst maintaining pressure for cost reductions. (ITS and CER 2009, 23)
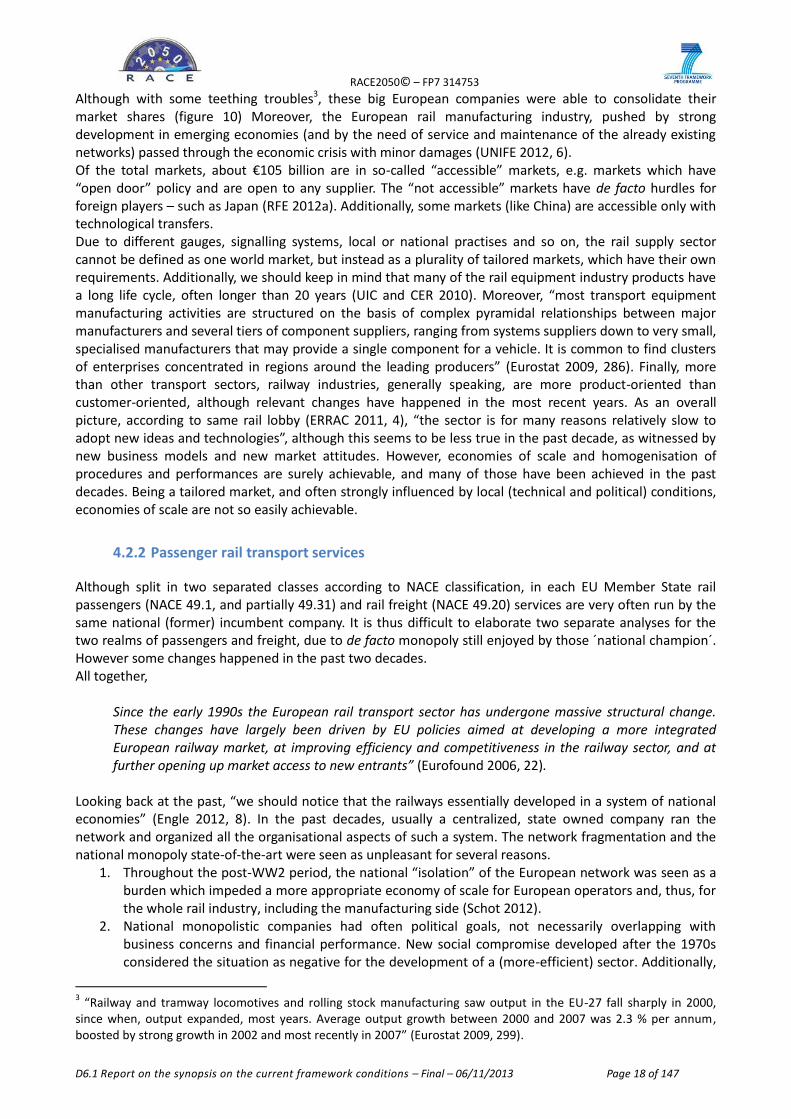
However, although some relevant changes have been achieved, the EU directive has been implemented at different speeds, intensity and depth in the different national contexts. “Strong competition has emerged in the freight business particularly on the crucial north–south axis through the Alps. In freight the market share of new entrants now exceeds 20% in Germany and Poland and is around 30% in Sweden and Romania” (ITS and CER 2009, 7). Deutsche Bahn, itself a (former) incumbent, ranked the EU liberation process, according to the degree of free access to new entrants, the lack of not-legal barrier and the actual possibility to have access to the railway networks, as shown in Figure 11. It shows great disparities among the EU countries, with great varieties of implementation of the EU directives. The overall impression is a three speed Europe, in which some countries (mainly North and Central European) followed to a greater degree to EU directive, while at the periphery of the continent, this trend was slower.
RACE2050© – FP7 314753
D6.1 Report on the synopsis on the current framework conditions – Final – 06/11/2013 Page 20 of 147
Figure 11: 2011 Rail “liberalization” index (Deutsche Bahn 2011, 46).
Beyond the legislation concerns and developments, e.g. the degree of liberalisation achieved, in the past years new business model were developed. For instance, UK has completely abandoned the traditional model of a central company, and its rail market is completely in the hands of private firms. In Germany, there are hundreds of private-owned operators, but the major railway operator, Deutsche Bahn, is state-owned and largely dominant, while there is no clear vertical separation. Additionally, Deutsche Bahn, like some of its peers, is developing a clear strategy to offer a wider portfolio of mobility services, well beyond the rail sector. Thus, a combination of new policies, market pressure (including spill-over effects from other transport modes), and technological innovations changed the structure of the operations and the business models. The above business and management innovations since the 1970s “have permitted roughly a 50% reduction in freight costs per tonne km on the major freight systems, primarily through more intensive use of capacity and reduction in energy costs, coupled with far better use of information to control system quality and enhance pricing. The containerization revolution that started in the maritime area ended up as a major source of traffic for railways, especially in the US and Canada, though Russia, China and India have seen significant traffic increases in containers. Passenger systems have been improved through better signalling and equipment design that fostered reduced energy use. [...] Both freight and passenger [systems] have improved safety records as a result of improved signalling and traffic control techniques (Thompson, A vision for railways in 2050 2010). Concerning Europe, these developments are challenged by monopolies still dominant in many countries, as well as by “the lack of full technical interoperability and of a common approach to rail safety between the national railway networks, the relatively weak financial situation of railway undertakings, which is especially acute in the ´new´ Member States, and the high market entry costs in the rail sector related to the high fixed costs of market operations and significant administrative expenses for rolling stock acceptance, licensing procedures, etc. Furthermore, some Member States show an insufficient level of investment in the rail sector, particularly in maintenance and upgrading of rail infrastructure” (European Commission 2007, 13).
4.3 Sea transport
The shipbuilding industry operates in a global marketplace holding a substantial amount of concentration.
RACE2050© – FP7 314753
D6.1 Report on the synopsis on the current framework conditions – Final – 06/11/2013 Page 21 of 147
Asian shipyards dominate the industry as a small number of Asian conglomerates concentrate the majority of order books for new ships. It is mostly a three player’s game between South Korea, China and Japan. European players hold a prime position in some niche segments of the industry.
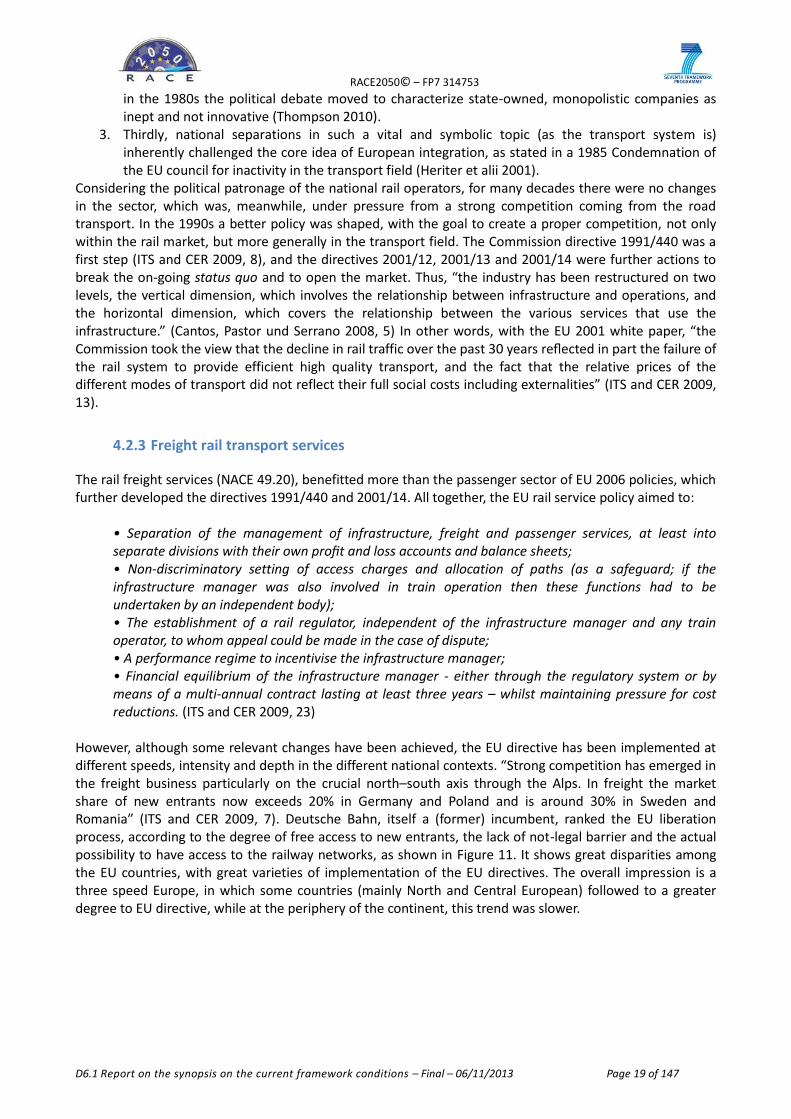
Although not all productive output from the shipbuilding industry relates to transport, it is essential to consider all sectors outputs since depressive markets in a particular sector indirectly affects others sectors, as it pushes production capabilities between different market segments. In figure 12 are presented the main European actors in each maritime sector, including shipbuilding manufacturers, maritime suppliers and transport service providers. According to this figure it is noticeable that European manufacturers are more focused on specialized vessels, being the freight ships manufactured by East Asia players, which dominate the market.
Figure 12: Main European actors in each maritime sector (own compilation 2013)
4.3.1 Shipbuilding
Shipbuilding has once been one of the European industry strengths, having a share of 80% of the world market in the beginning of the 20th century until after World War II – namely with the British riveted iron hull technology.
Improvements on block assembly based on welding impelled the Japanese industry progressively to reduce its operational costs, which eventually led them to the overall cost advantage by late 1950s and global market leaders in the 1970s. This forced European builders to convert their production onto more sophisticated vessels that comprised advanced technology (Ecorys 2009) – a positioning strategy still holding nowadays. Europe and Japan dominated the market until the early 1980s, with a combined share of about 90% of the world market (Figure 56).
Their situation became increasingly challenged by the entrance of South Korea in the market backed, once again, by the strong determination from South Korean’s government to develop shipbuilding as a strategic export-oriented industry. Korean plans, combined with low wages performed at that time in Korea, its acceptance of dollars (instead of the Japanese Yen) and focus on the exporting market from the start (instead of internally serving domestic demand), leveraged South Korea to respond adequately to the key shifts occurring during the 1970s, such as the energy crises of 1973 and 1979, as well as the demand for larger and larger vessels.
Meanwhile, Japan did not make the adaptations required to maintain its global leadership, while a series of factors weakened its competitive position during the 1990s. More specifically Japan producers did not
Maritime suppliersPassenger Transport by
seaFreight Transport by sea
Freight ships
manufacturerDredgers
Other specialized
vessels manufacturerMarine equipment
Passenger water
TransportFreight water Transport
Non applicable
to Europe, as the
major shipyards
of freight ships
are all located in
South-East Asia
Shipbuilding manufacturer
Transportation manufacturer Transport service provider
RACE2050© – FP7 314753
D6.1 Report on the synopsis on the current framework conditions – Final – 06/11/2013 Page 22 of 147
focusing the production capacity on bigger vessels as government regulations (lifted only in the late 2000s) hindered local shipyards from expanding or reducing their docks. South Korea achieved a 25% of the world market share by the mid-1990s and become the world leader of this industry by 2005, measured either in CGT4 deliveries, new orders or backlog.
China is involved in the shipbuilding business since 1940s, but it is only during the 2000s that it manages to become a significant player. In ten years, led by the rapid expansion of the Chinese economy, the Chinese government committed extensively to develop the domestic shipbuilding industry. Its order book grew accordingly, from 1.9 billion CGT, in 1998, to 62 billion in 2008. China stands now as the global leader in building volume, based on price competitiveness and low value-added vessels construction, with 35% of the global order books, while South Korea retrieves only 30% of placed orders5, and the Chinese government continues to invest extensively in shipbuilding, in a way Korea and Japan can no longer due to arrangements with EU. Industry foresight studies predict that Chinese shipbuilders will dominate the shipbuilding market in the next twenty years (Lloyd’s Register 2013).
The European shipbuilding Industry is formed by a large number of entities – shipyards, equipment manufacturers, engineering services and other knowledge providers – delivering a wide range of outputs as shipbuilding, repair and conversions, and specialized services as off-shoring. Many of these companies are SMEs, although large shipyard groups dominate the European sector – representing some 34% of CESA6 shipyards and up to 56% of direct shipyard employment (Ludwig and Tholen 2006) – resulting from a strong consolidation of the industry in the last 20 years, by mergers and acquisitions, as well as the closure of many others (like Odense Steel Shipyards or Spanish IZAR, companies which figured as top European players just some years ago). The Defence industry accounts for a relevant number of EU major maritime players.
There are about 150 large shipyards in Europe, according to the industry report by the European Commission, but only 40 of them are active in the global market for large commercial vessels. These large yards contribute the most to the European 15% market share (Business Vibes 2012) in volume terms (in 2007, against a 8,5% market share in tonnage based statistics, which implies a relative higher value of European production) and the 109,000 direct employees in 2011, down from 149,000 in 2007 (SEA Europe 2013a).
4 The shipbuilding market is analyzed in terms of Gross Tons (GT), Compensated Gross Tons (CGT) and Deadweight
tonnes (DWT). According to SEAEurope (SEA Europe 2013b) (SEA Europe 2013b), GT is a measure gross tonnage which unit is equivalent to 2.831 cubic meters (or 100 cubic feet) and DWT is a “deadweight tonnes, roughly equivalent to a ships carrying capacity measured in metric tonnes”. CGT was created to provide a more accurate measure of shipyards’ activity and is an “international unit of measure that facilitates the comparison of different shipyards’ production regardless of the types of vessel produced. The CGT of a ship is calculated using a table of conversion factors published by OECD. The conversion factors vary with ship type”. 5 Nevertheless, based on contract values, South Korea maintains its leadership based on a higher value of its orders
and technical complexity of its deliveries. 6 Cesa: Community of European Shipyards’ Associations
RACE2050© – FP7 314753
D6.1 Report on the synopsis on the current framework conditions – Final – 06/11/2013 Page 23 of 147
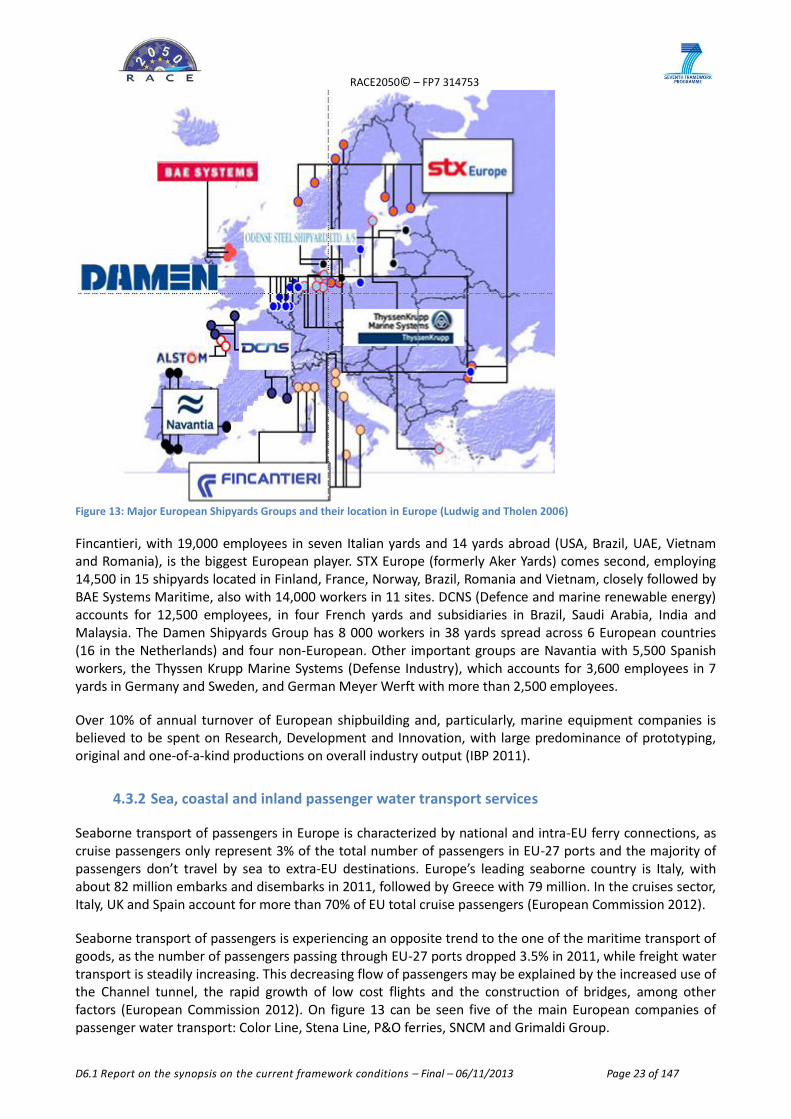
Figure 13: Major European Shipyards Groups and their location in Europe (Ludwig and Tholen 2006)
Fincantieri, with 19,000 employees in seven Italian yards and 14 yards abroad (USA, Brazil, UAE, Vietnam and Romania), is the biggest European player. STX Europe (formerly Aker Yards) comes second, employing 14,500 in 15 shipyards located in Finland, France, Norway, Brazil, Romania and Vietnam, closely followed by BAE Systems Maritime, also with 14,000 workers in 11 sites. DCNS (Defence and marine renewable energy) accounts for 12,500 employees, in four French yards and subsidiaries in Brazil, Saudi Arabia, India and Malaysia. The Damen Shipyards Group has 8 000 workers in 38 yards spread across 6 European countries (16 in the Netherlands) and four non-European. Other important groups are Navantia with 5,500 Spanish workers, the Thyssen Krupp Marine Systems (Defense Industry), which accounts for 3,600 employees in 7 yards in Germany and Sweden, and German Meyer Werft with more than 2,500 employees.
Over 10% of annual turnover of European shipbuilding and, particularly, marine equipment companies is believed to be spent on Research, Development and Innovation, with large predominance of prototyping, original and one-of-a-kind productions on overall industry output (IBP 2011).
4.3.2 Sea, coastal and inland passenger water transport services
Seaborne transport of passengers in Europe is characterized by national and intra-EU ferry connections, as cruise passengers only represent 3% of the total number of passengers in EU-27 ports and the majority of passengers don’t travel by sea to extra-EU destinations. Europe’s leading seaborne country is Italy, with about 82 million embarks and disembarks in 2011, followed by Greece with 79 million. In the cruises sector, Italy, UK and Spain account for more than 70% of EU total cruise passengers (European Commission 2012).
Seaborne transport of passengers is experiencing an opposite trend to the one of the maritime transport of goods, as the number of passengers passing through EU-27 ports dropped 3.5% in 2011, while freight water transport is steadily increasing. This decreasing flow of passengers may be explained by the increased use of the Channel tunnel, the rapid growth of low cost flights and the construction of bridges, among other factors (European Commission 2012). On figure 13 can be seen five of the main European companies of passenger water transport: Color Line, Stena Line, P&O ferries, SNCM and Grimaldi Group.
RACE2050© – FP7 314753
D6.1 Report on the synopsis on the current framework conditions – Final – 06/11/2013 Page 24 of 147
Color Line is the largest cruise and transport shipping company in Norway, and one of the leading European companies. Color Line’s routes operate both on passengers and freight and link several ports between Norway, Germany, Denmark and Sweden (Color Line n.d.).
Stena Line is the largest privately owned shipping company in the world and the biggest ferry operator in Europe, with the largest fleet and widest number of destinations. This Swedish company transports passengers to Ireland, Britain and Holland (Stena Line n.d.).
P&O Ferries is a British Company that operates ferries from United Kingdom to Belgium, Spain, Netherlands and France and runs several passenger and freight routes.
SNCM is a French operator that transports passengers and freight through Occidental Mediterranean, with routes connecting France to Sardinia, Tunisia and Algeria.
Grimaldi Group is an Italian group of shipping companies, including Finnlines, Malta Motorways of the Sea (MMS) and Minoan Lines, which is specialized in the maritime transport of passengers, containers, cars and rolling cargo.
4.3.3 Sea, coastal and inland freight water transport
Low demand, low rates, high fuel prices, asset-values at record-low levels and difficult access to finance are limiting the world need for additional vessels, and putting enormous pressure on an over-capacitated ship yards industry, facing postponements or even cancelled orders from troubled ship owners struggling to raise debt to support new investments.
The need of finance is particularly noteworthy for European shipyards, which lacks the credit policies pursued by other regional competitors to encourage foreign ship-owners to build new vessels in their shipyards.
In 2008, almost 42% of the world merchant ships, measured in DWT, belonged to European ship owners (and 40% of these to Greeks). Japan and China (all provinces) hold a similar share, around 15%, with South East Asia countries controlling 9% of the world fleet, and USA and Canada accounting for a little over 5% (UNCTAD 2008).
Since 2008, the world fleet has grown 45% while seaborne demand volumes only grew by 15%. In terms of fleet controlling, the panorama for 2012 maintains similar to 2008, although with a slight decrease of European share (falling to 38%) compensated by China and South East Countries fleet increases.
Low asset values, high bunker prices (fuel) and relatively high scrap values are leading to scrapping vessel under 25 year of age, but the pressure are not evenly distribute among all market segments as larger ships are hit harder by current market conditions.
Containers Ships: The container industry is currently struggling to handle its surplus overcapacity. The liners have been able to keep box rates fairly high, but vessels are operated at low speed and low utilization rates. The pressure is on the tonnage providers (charter rates) - asset values are down 70% from 2008 heights, as 1.25 million TEU7 were delivered in 2012 (1.1 Post-Panamax), and 3 million TEU are currently on order (half of them scheduled to delivery in 2013). To a 1% growth in demand in 2012, the shipping industry responded with a 6% increase in the world fleet, putting reasonable doubts on the capability of the liners to support healthy box prices in the future.
Crude tankers: The low freight rates of crude tankers somewhat improved in 2012 from 2011 low levels as rates grew by 6% in 2012, but growing US oil production and capacity inflow kept rates low in 2012, disclosing an imbalanced market with oversupply. The value of distance-adjusted demand is expected to further contract in 2013, due to Europe’s and US’s diminishing imports of crude oil from short distances (Danish Ship Finance 2013). Crude tankers suffered a 5% fleet increase in 2012 as 25 million DWT were added to the fleet, and 10 million DWT were scrapped - a relatively low
7 Twenty-foot equivalent unit, a measure used for capacity in container Transport
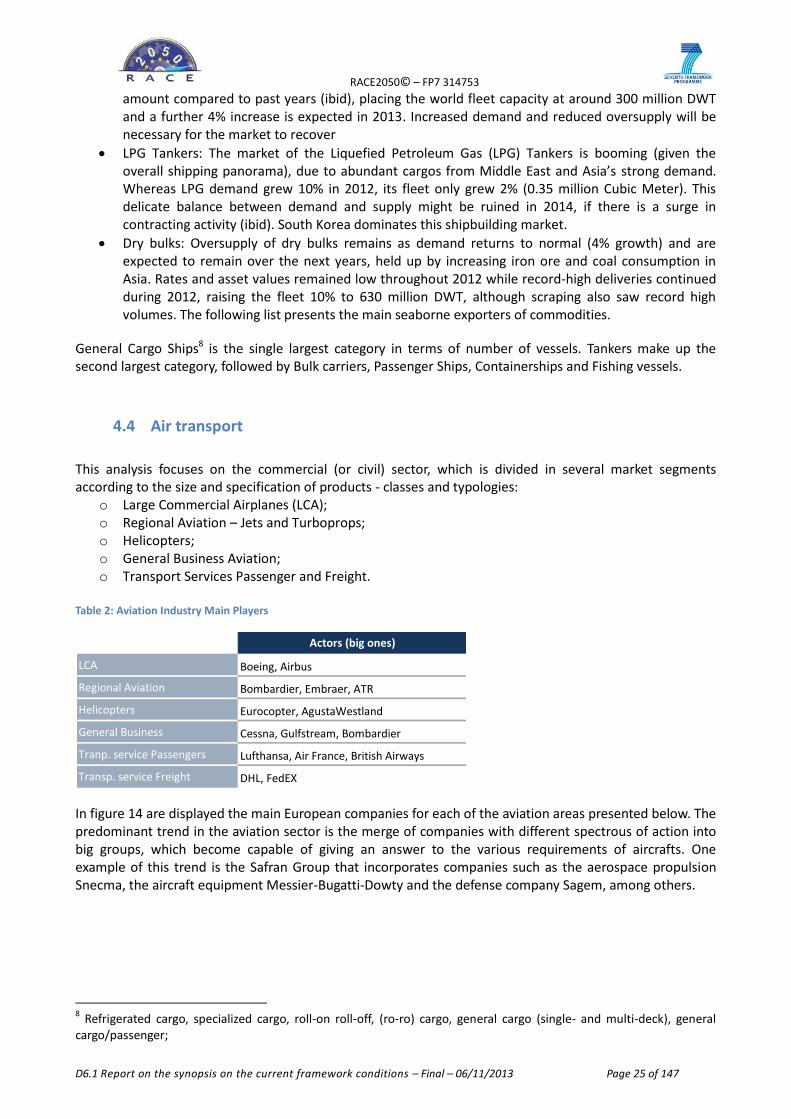
RACE2050© – FP7 314753
D6.1 Report on the synopsis on the current framework conditions – Final – 06/11/2013 Page 25 of 147
amount compared to past years (ibid), placing the world fleet capacity at around 300 million DWT and a further 4% increase is expected in 2013. Increased demand and reduced oversupply will be necessary for the market to recover
LPG Tankers: The market of the Liquefied Petroleum Gas (LPG) Tankers is booming (given the overall shipping panorama), due to abundant cargos from Middle East and Asia’s strong demand. Whereas LPG demand grew 10% in 2012, its fleet only grew 2% (0.35 million Cubic Meter). This delicate balance between demand and supply might be ruined in 2014, if there is a surge in contracting activity (ibid). South Korea dominates this shipbuilding market.
Dry bulks: Oversupply of dry bulks remains as demand returns to normal (4% growth) and are expected to remain over the next years, held up by increasing iron ore and coal consumption in Asia. Rates and asset values remained low throughout 2012 while record-high deliveries continued during 2012, raising the fleet 10% to 630 million DWT, although scraping also saw record high volumes. The following list presents the main seaborne exporters of commodities.
General Cargo Ships8 is the single largest category in terms of number of vessels. Tankers make up the second largest category, followed by Bulk carriers, Passenger Ships, Containerships and Fishing vessels.
4.4 Air transport
This analysis focuses on the commercial (or civil) sector, which is divided in several market segments according to the size and specification of products - classes and typologies:
o Large Commercial Airplanes (LCA); o Regional Aviation – Jets and Turboprops; o Helicopters; o General Business Aviation; o Transport Services Passenger and Freight.
Table 2: Aviation Industry Main Players
In figure 14 are displayed the main European companies for each of the aviation areas presented below. The predominant trend in the aviation sector is the merge of companies with different spectrous of action into big groups, which become capable of giving an answer to the various requirements of aircrafts. One example of this trend is the Safran Group that incorporates companies such as the aerospace propulsion Snecma, the aircraft equipment Messier-Bugatti-Dowty and the defense company Sagem, among others.
8 Refrigerated cargo, specialized cargo, roll-on roll-off, (ro-ro) cargo, general cargo (single- and multi-deck), general
cargo/passenger;
Actors (big ones)
LCA Boeing, Airbus
Regional Aviation Bombardier, Embraer, ATR
Helicopters Eurocopter, AgustaWestland
General Business Cessna, Gulfstream, Bombardier
Tranp. service Passengers Lufthansa, Air France, British Airways
Transp. service Freight DHL, FedEX
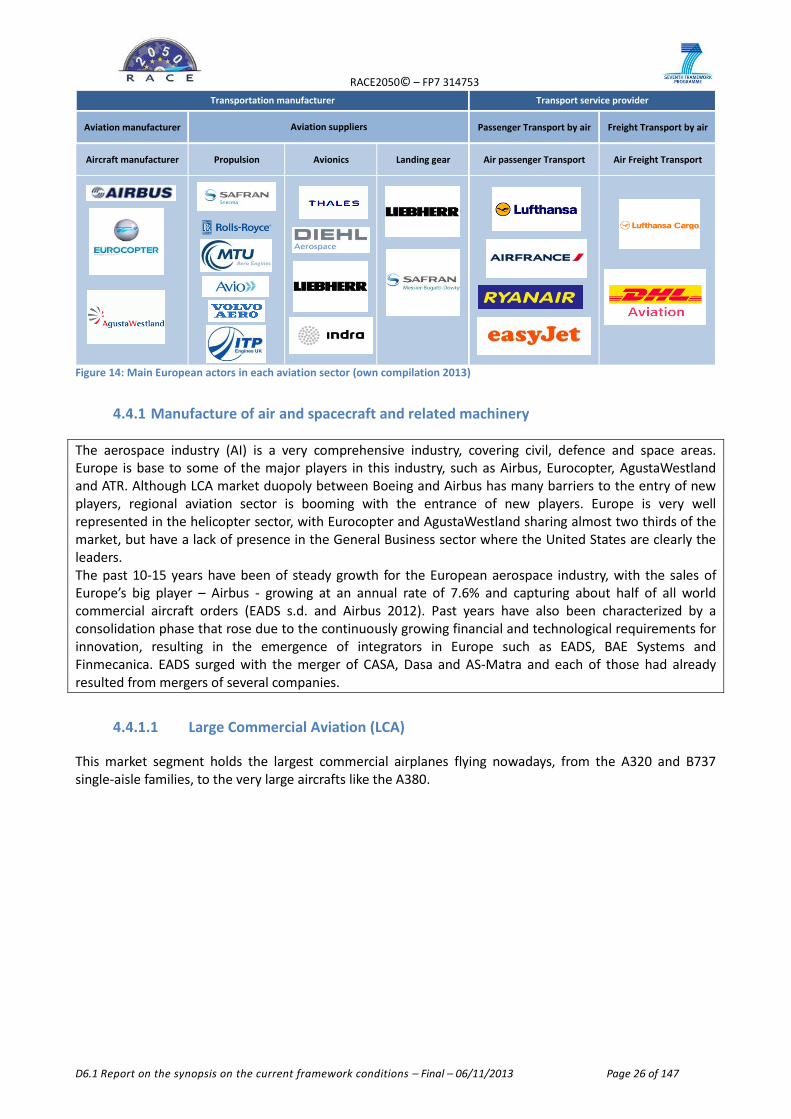
RACE2050© – FP7 314753
D6.1 Report on the synopsis on the current framework conditions – Final – 06/11/2013 Page 26 of 147
Figure 14: Main European actors in each aviation sector (own compilation 2013)
4.4.1 Manufacture of air and spacecraft and related machinery
The aerospace industry (AI) is a very comprehensive industry, covering civil, defence and space areas. Europe is base to some of the major players in this industry, such as Airbus, Eurocopter, AgustaWestland and ATR. Although LCA market duopoly between Boeing and Airbus has many barriers to the entry of new players, regional aviation sector is booming with the entrance of new players. Europe is very well represented in the helicopter sector, with Eurocopter and AgustaWestland sharing almost two thirds of the market, but have a lack of presence in the General Business sector where the United States are clearly the leaders. The past 10-15 years have been of steady growth for the European aerospace industry, with the sales of Europe’s big player – Airbus - growing at an annual rate of 7.6% and capturing about half of all world commercial aircraft orders (EADS s.d. and Airbus 2012). Past years have also been characterized by a consolidation phase that rose due to the continuously growing financial and technological requirements for innovation, resulting in the emergence of integrators in Europe such as EADS, BAE Systems and Finmecanica. EADS surged with the merger of CASA, Dasa and AS-Matra and each of those had already resulted from mergers of several companies.
4.4.1.1 Large Commercial Aviation (LCA)
This market segment holds the largest commercial airplanes flying nowadays, from the A320 and B737 single-aisle families, to the very large aircrafts like the A380.
Aviation manufacturer Passenger Transport by air Freight Transport by air
Aircraft manufacturer Propulsion Avionics Landing gear Air passenger Transport Air Freight Transport
Transport service provider
Aviation suppliers
Transportation manufacturer
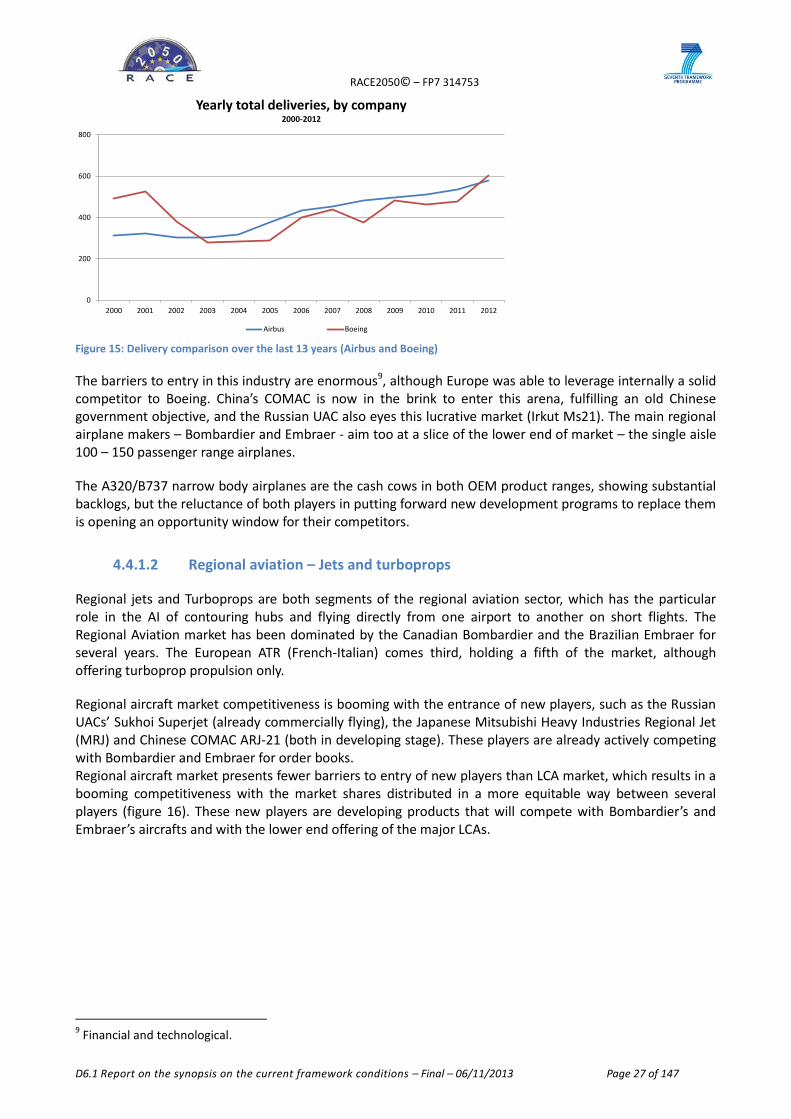
RACE2050© – FP7 314753
D6.1 Report on the synopsis on the current framework conditions – Final – 06/11/2013 Page 27 of 147
Figure 15: Delivery comparison over the last 13 years (Airbus and Boeing)
The barriers to entry in this industry are enormous9, although Europe was able to leverage internally a solid competitor to Boeing. China’s COMAC is now in the brink to enter this arena, fulfilling an old Chinese government objective, and the Russian UAC also eyes this lucrative market (Irkut Ms21). The main regional airplane makers – Bombardier and Embraer - aim too at a slice of the lower end of market – the single aisle 100 – 150 passenger range airplanes.
The A320/B737 narrow body airplanes are the cash cows in both OEM product ranges, showing substantial backlogs, but the reluctance of both players in putting forward new development programs to replace them is opening an opportunity window for their competitors.
4.4.1.2 Regional aviation – Jets and turboprops
Regional jets and Turboprops are both segments of the regional aviation sector, which has the particular role in the AI of contouring hubs and flying directly from one airport to another on short flights. The Regional Aviation market has been dominated by the Canadian Bombardier and the Brazilian Embraer for several years. The European ATR (French-Italian) comes third, holding a fifth of the market, although offering turboprop propulsion only.
Regional aircraft market competitiveness is booming with the entrance of new players, such as the Russian UACs’ Sukhoi Superjet (already commercially flying), the Japanese Mitsubishi Heavy Industries Regional Jet (MRJ) and Chinese COMAC ARJ-21 (both in developing stage). These players are already actively competing with Bombardier and Embraer for order books. Regional aircraft market presents fewer barriers to entry of new players than LCA market, which results in a booming competitiveness with the market shares distributed in a more equitable way between several players (figure 16). These new players are developing products that will compete with Bombardier’s and Embraer’s aircrafts and with the lower end offering of the major LCAs.
9 Financial and technological.
0
200
400
600
800
2000 2001 2002 2003 2004 2005 2006 2007 2008 2009 2010 2011 2012
Yearly total deliveries, by company2000-2012
Airbus Boeing
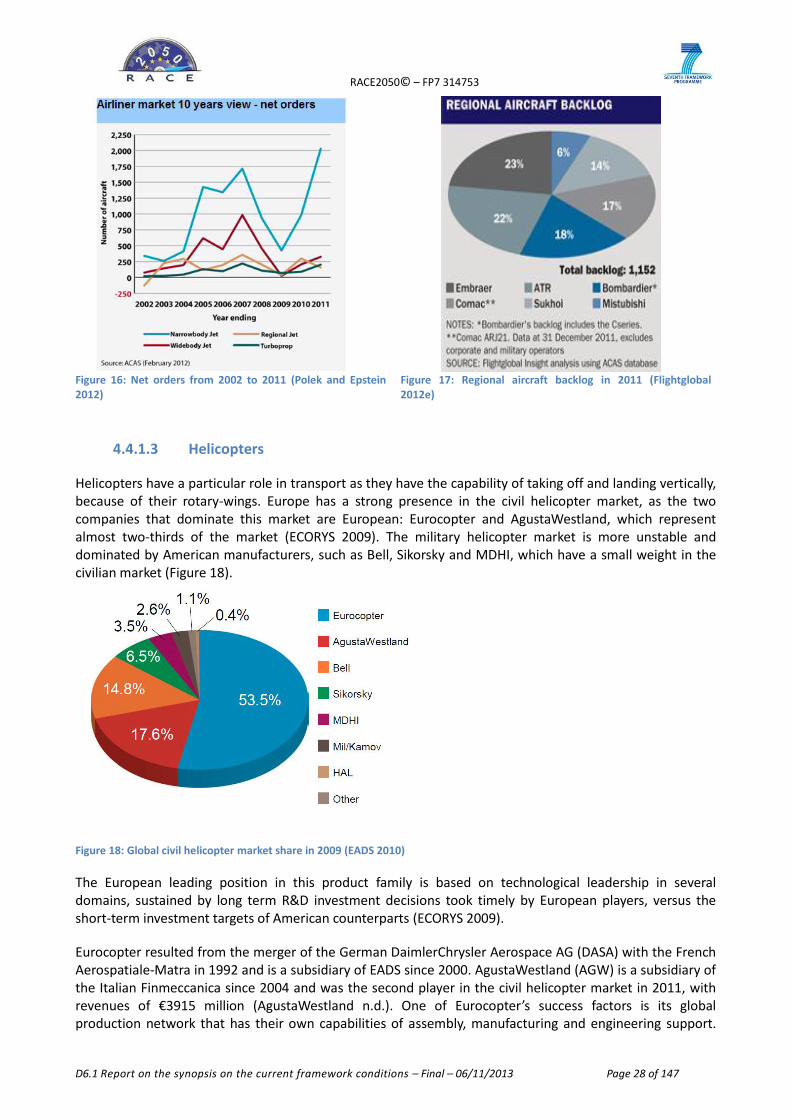
RACE2050© – FP7 314753
D6.1 Report on the synopsis on the current framework conditions – Final – 06/11/2013 Page 28 of 147
Figure 16: Net orders from 2002 to 2011 (Polek and Epstein 2012)
Figure 17: Regional aircraft backlog in 2011 (Flightglobal 2012e)
4.4.1.3 Helicopters
Helicopters have a particular role in transport as they have the capability of taking off and landing vertically, because of their rotary-wings. Europe has a strong presence in the civil helicopter market, as the two companies that dominate this market are European: Eurocopter and AgustaWestland, which represent almost two-thirds of the market (ECORYS 2009). The military helicopter market is more unstable and dominated by American manufacturers, such as Bell, Sikorsky and MDHI, which have a small weight in the civilian market (Figure 18).
Figure 18: Global civil helicopter market share in 2009 (EADS 2010)
The European leading position in this product family is based on technological leadership in several domains, sustained by long term R&D investment decisions took timely by European players, versus the short-term investment targets of American counterparts (ECORYS 2009).
Eurocopter resulted from the merger of the German DaimlerChrysler Aerospace AG (DASA) with the French Aerospatiale-Matra in 1992 and is a subsidiary of EADS since 2000. AgustaWestland (AGW) is a subsidiary of the Italian Finmeccanica since 2004 and was the second player in the civil helicopter market in 2011, with revenues of €3915 million (AgustaWestland n.d.). One of Eurocopter’s success factors is its global production network that has their own capabilities of assembly, manufacturing and engineering support.
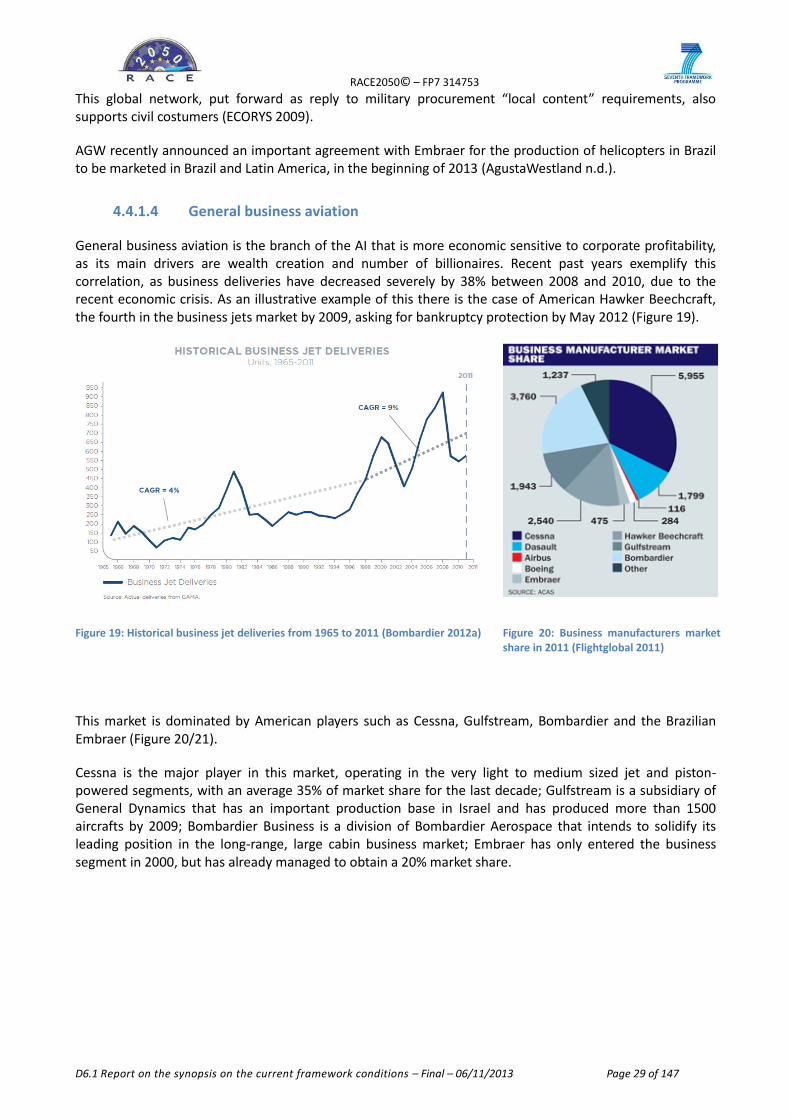
RACE2050© – FP7 314753
D6.1 Report on the synopsis on the current framework conditions – Final – 06/11/2013 Page 29 of 147
This global network, put forward as reply to military procurement “local content” requirements, also supports civil costumers (ECORYS 2009).
AGW recently announced an important agreement with Embraer for the production of helicopters in Brazil to be marketed in Brazil and Latin America, in the beginning of 2013 (AgustaWestland n.d.).
4.4.1.4 General business aviation
General business aviation is the branch of the AI that is more economic sensitive to corporate profitability, as its main drivers are wealth creation and number of billionaires. Recent past years exemplify this correlation, as business deliveries have decreased severely by 38% between 2008 and 2010, due to the recent economic crisis. As an illustrative example of this there is the case of American Hawker Beechcraft, the fourth in the business jets market by 2009, asking for bankruptcy protection by May 2012 (Figure 19).
Figure 19: Historical business jet deliveries from 1965 to 2011 (Bombardier 2012a) Figure 20: Business manufacturers market share in 2011 (Flightglobal 2011)
This market is dominated by American players such as Cessna, Gulfstream, Bombardier and the Brazilian Embraer (Figure 20/21).
Cessna is the major player in this market, operating in the very light to medium sized jet and piston-powered segments, with an average 35% of market share for the last decade; Gulfstream is a subsidiary of General Dynamics that has an important production base in Israel and has produced more than 1500 aircrafts by 2009; Bombardier Business is a division of Bombardier Aerospace that intends to solidify its leading position in the long-range, large cabin business market; Embraer has only entered the business segment in 2000, but has already managed to obtain a 20% market share.
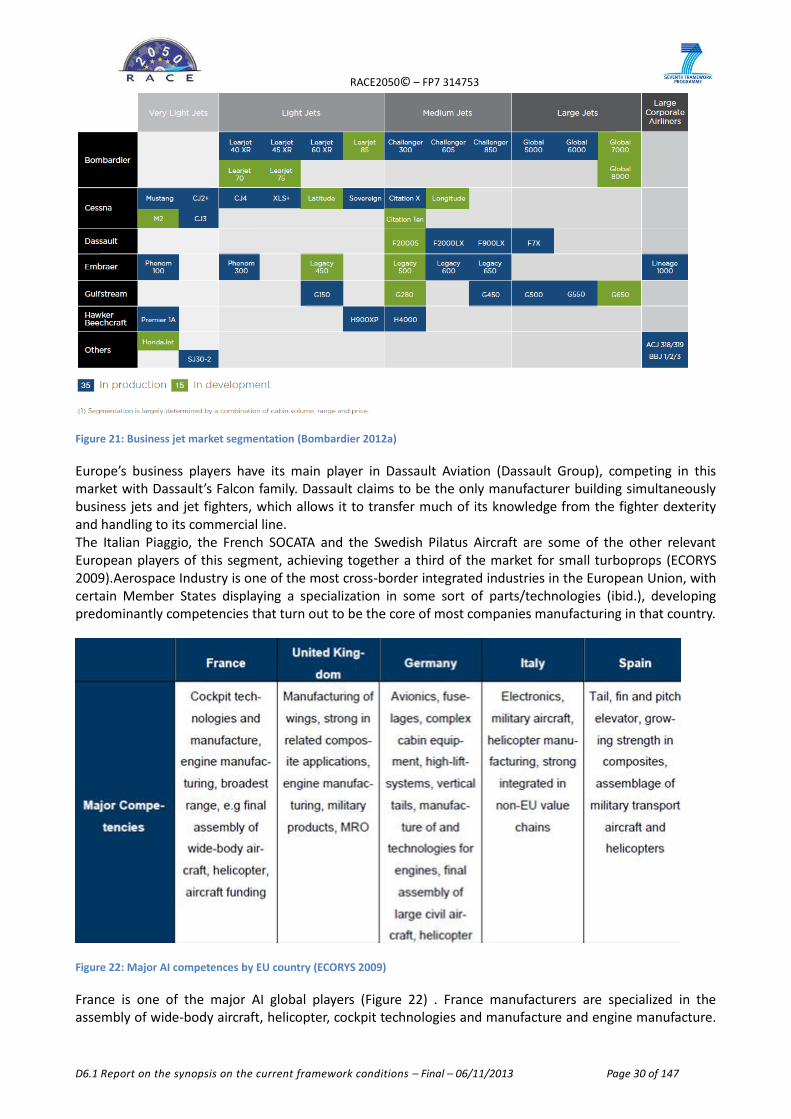
RACE2050© – FP7 314753
D6.1 Report on the synopsis on the current framework conditions – Final – 06/11/2013 Page 30 of 147
Figure 21: Business jet market segmentation (Bombardier 2012a)
Europe’s business players have its main player in Dassault Aviation (Dassault Group), competing in this market with Dassault’s Falcon family. Dassault claims to be the only manufacturer building simultaneously business jets and jet fighters, which allows it to transfer much of its knowledge from the fighter dexterity and handling to its commercial line. The Italian Piaggio, the French SOCATA and the Swedish Pilatus Aircraft are some of the other relevant European players of this segment, achieving together a third of the market for small turboprops (ECORYS 2009).Aerospace Industry is one of the most cross-border integrated industries in the European Union, with certain Member States displaying a specialization in some sort of parts/technologies (ibid.), developing predominantly competencies that turn out to be the core of most companies manufacturing in that country.
Figure 22: Major AI competences by EU country (ECORYS 2009)
France is one of the major AI global players (Figure 22) . France manufacturers are specialized in the assembly of wide-body aircraft, helicopter, cockpit technologies and manufacture and engine manufacture.
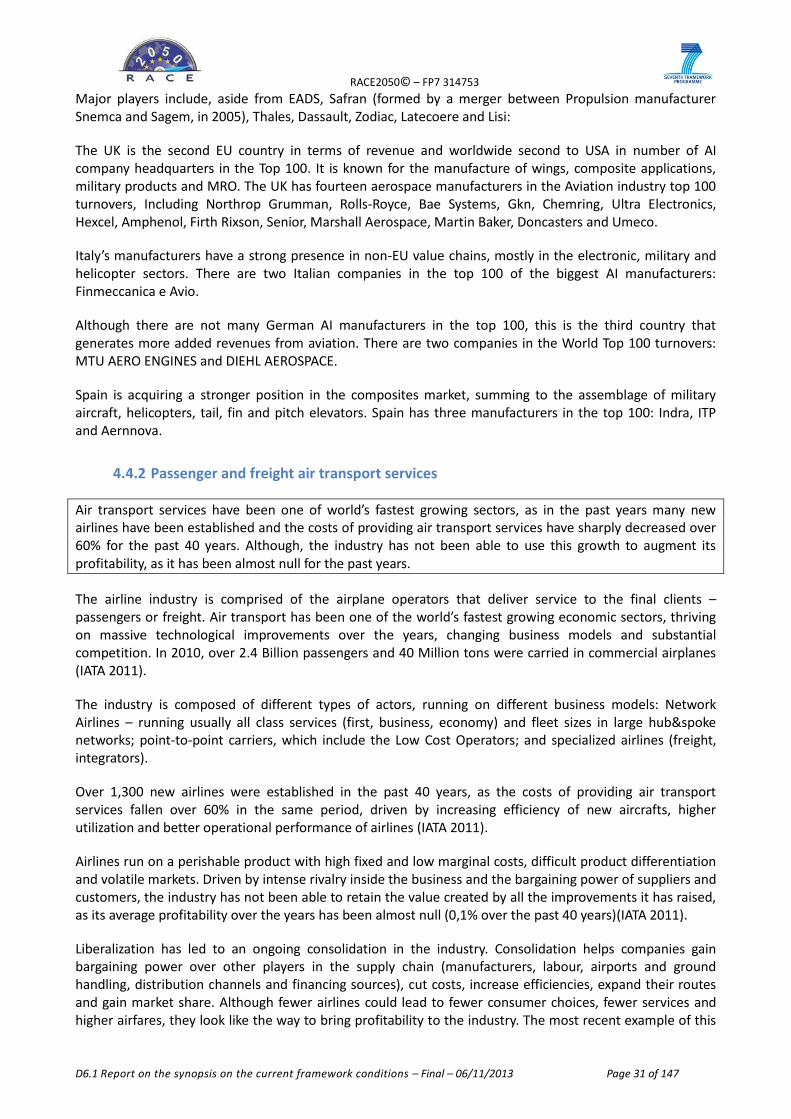
RACE2050© – FP7 314753
D6.1 Report on the synopsis on the current framework conditions – Final – 06/11/2013 Page 31 of 147
Major players include, aside from EADS, Safran (formed by a merger between Propulsion manufacturer Snemca and Sagem, in 2005), Thales, Dassault, Zodiac, Latecoere and Lisi:
The UK is the second EU country in terms of revenue and worldwide second to USA in number of AI company headquarters in the Top 100. It is known for the manufacture of wings, composite applications, military products and MRO. The UK has fourteen aerospace manufacturers in the Aviation industry top 100 turnovers, Including Northrop Grumman, Rolls-Royce, Bae Systems, Gkn, Chemring, Ultra Electronics, Hexcel, Amphenol, Firth Rixson, Senior, Marshall Aerospace, Martin Baker, Doncasters and Umeco.
Italy’s manufacturers have a strong presence in non-EU value chains, mostly in the electronic, military and helicopter sectors. There are two Italian companies in the top 100 of the biggest AI manufacturers: Finmeccanica e Avio.
Although there are not many German AI manufacturers in the top 100, this is the third country that generates more added revenues from aviation. There are two companies in the World Top 100 turnovers: MTU AERO ENGINES and DIEHL AEROSPACE.
Spain is acquiring a stronger position in the composites market, summing to the assemblage of military aircraft, helicopters, tail, fin and pitch elevators. Spain has three manufacturers in the top 100: Indra, ITP and Aernnova.
4.4.2 Passenger and freight air transport services
Air transport services have been one of world’s fastest growing sectors, as in the past years many new airlines have been established and the costs of providing air transport services have sharply decreased over 60% for the past 40 years. Although, the industry has not been able to use this growth to augment its profitability, as it has been almost null for the past years.
The airline industry is comprised of the airplane operators that deliver service to the final clients – passengers or freight. Air transport has been one of the world’s fastest growing economic sectors, thriving on massive technological improvements over the years, changing business models and substantial competition. In 2010, over 2.4 Billion passengers and 40 Million tons were carried in commercial airplanes (IATA 2011).
The industry is composed of different types of actors, running on different business models: Network Airlines – running usually all class services (first, business, economy) and fleet sizes in large hub&spoke networks; point-to-point carriers, which include the Low Cost Operators; and specialized airlines (freight, integrators).
Over 1,300 new airlines were established in the past 40 years, as the costs of providing air transport services fallen over 60% in the same period, driven by increasing efficiency of new aircrafts, higher utilization and better operational performance of airlines (IATA 2011).
Airlines run on a perishable product with high fixed and low marginal costs, difficult product differentiation and volatile markets. Driven by intense rivalry inside the business and the bargaining power of suppliers and customers, the industry has not been able to retain the value created by all the improvements it has raised, as its average profitability over the years has been almost null (0,1% over the past 40 years)(IATA 2011).
Liberalization has led to an ongoing consolidation in the industry. Consolidation helps companies gain bargaining power over other players in the supply chain (manufacturers, labour, airports and ground handling, distribution channels and financing sources), cut costs, increase efficiencies, expand their routes and gain market share. Although fewer airlines could lead to fewer consumer choices, fewer services and higher airfares, they look like the way to bring profitability to the industry. The most recent example of this
RACE2050© – FP7 314753
D6.1 Report on the synopsis on the current framework conditions – Final – 06/11/2013 Page 32 of 147
trend is the merger between American Airlines and U.S. Airways to create the world largest airline, in a path already trailed by others like Delta/Northwest or Europeans Air France/KLM Royal Dutch Airlines and British Airways/Iberia. The American Airlines / U.S. Airways merge is expected to generate more than $1 billion in net synergies from combining networks, fleets and other operations.
Another critical issue for airlines’ operations, with great potential for future industry efficiency gains, is Air Traffic Management (ATM). The steady growth of traffic in airspace is leading to more and more congestion, particularly in consolidated markets such as Europe and the USA. Europe has an average of 26,000 flights per day and a very high density of airports, which makes management of its airspace even more complex, furthermore as nowadays’ airspace management relies on obsolete technologies like radar, radio beacons or voice communications.
To deal with this situation there has been an investment to develop a Global air transport system (ATS) that would structure airspace and air navigation services. European Commission is developing a Single European Sky, a legislative framework that aims to increase the overall efficiency of air traffic management (ATM) system, generate additional capacity and accommodate air traffic flows through the restructuring of the European airspace. The idea is to organize Europe’s airspace in functional blocks instead of national borders, allowing for savings and efficiency improvement. The technology requirements to meet these objectives of European ATM network are assured by SESAR, the Single European Sky Research Programme (Eurocontrol 2011). One of the main challenges in the development of ATM’s will be the integration of Europe’s Single European Sky and SESAR with USA’s Federal Aviation Administration (FAA) NextGen program, and other regional programs, in order to a global ATM system take place.
The application of these programs is estimated to save three billion gallons of fuel, four million flight hours in delays and 29 million metric tonnes of carbon emissions globally per year(Deloitte 2012), which will increase the potential for further consumer/passenger price drops in the Airlines’ Industry and consequently raise air travel demand.
4.5 Conclusion European Transport market
Road The road transport sector in Europe is dominated by the automotive manufacturers. Automotive manufacturing industry is one of the most important manufacturing industries in Europe regarding employment and revenues. The last decade was characterized by strong changes. Production was increasing in the automotive industry until the financial and economic crisis stopped this up going trend. Afterwards production, sales, and jobs fall down and the rehabilitation is still in process. Market structural changes with new players in Asia require a reorientation on the market. Exports are still very important for European manufacturers but a shift of production towards emerging markets already takes place. Road transport services mostly focus on intra-European services. Global competition is less distinct than in the industry sector. Only road freight transport at European level takes an important position and is subjected to a certain competition. The passenger transport by road, however, has often only regional or national significance. But liberalization processes throughout the transport sector could bring some changes also in this area. Rail All together, the European rail manufacturing industry – which is the world leader - has experienced robust business growth in the past decade, with a trend to internationalisation and off-shoring. While the European rail manufacturing industry, pushed by strong development in emerging economies, passed through the economic crisis with minor damages, there was the robust development of new players, coming especially from Asia. The rail transport services were essentially developed into national boundaries. This monopolistic
RACE2050© – FP7 314753
D6.1 Report on the synopsis on the current framework conditions – Final – 06/11/2013 Page 33 of 147
incumbents prevented a fully integrated European networks, and border-crossing companies, although several efforts changed the structure of the operations and the business models of the companies. Sea The shipbuilding industry operates in a global marketplace and European players hold a prime position in some niche but valuable segments. There are about 150 large shipyards in Europe, and only 40 of them are active in the global market for large commercial vessels. European manufacturers are more focused on specialized and Hi-Tech vessels. Regarding transport services in Europe, while freight water transport is steadily increasing, seaborne transport of passengers is experiencing an opposite trend, as the number of passengers passing through EU-27 ports dropped 3.5% in 2011. Air Europe is base for some of the major players in air transport and is well represented in almost all sectors of air transport industry (Airbus, Eurocopter, AugustaWestland). The predominant trend in the aviation sector is the merge of companies with different spectrous of action into big groups, which become capable of giving an answer to the various requirements and beeing able to compete on a global market of aircrafts. This applies to air transport industry as well as for air transport services. Among the air transport services European companies are well suited in the airline environment. Air transport is one of the world’s fastest growing economic sectors and Europe´s infrastructure is quite good, although the financial situation of many airlines is rather poor. Europe´s transport industry as a whole has a long history. It is considered to be very innovative in all sectors, offers an enormous number of jobs and contributes a huge part in European GDP. However the last years have been characterized mainly by the crisis, and in almost all areas declines were recorded. In some sectors, especially in sea manufacturing and services, competitors from other regions catch up strong. Nevertheless, the European transport industry, generally speaking, is competitive. Numerous companies from all sectors are amongst the world leaders. Products and services from Europe are still considered a high demand.
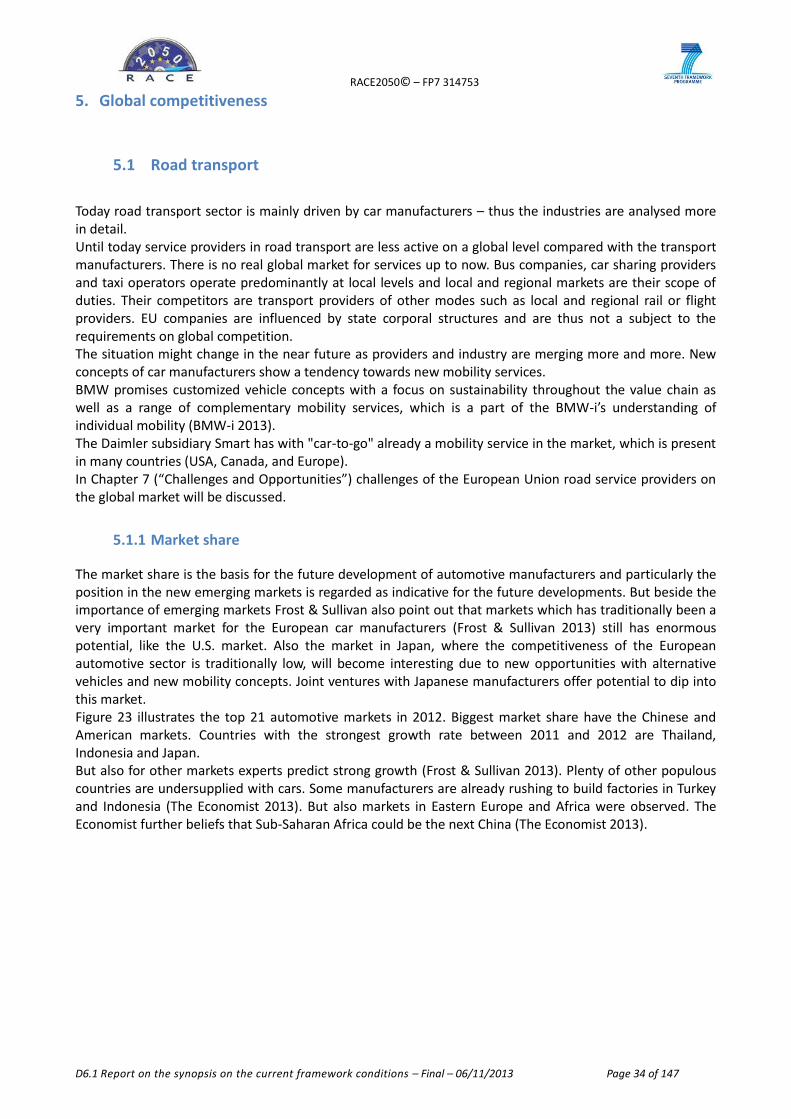
RACE2050© – FP7 314753
D6.1 Report on the synopsis on the current framework conditions – Final – 06/11/2013 Page 34 of 147
5. Global competitiveness
5.1 Road transport
Today road transport sector is mainly driven by car manufacturers – thus the industries are analysed more in detail. Until today service providers in road transport are less active on a global level compared with the transport manufacturers. There is no real global market for services up to now. Bus companies, car sharing providers and taxi operators operate predominantly at local levels and local and regional markets are their scope of duties. Their competitors are transport providers of other modes such as local and regional rail or flight providers. EU companies are influenced by state corporal structures and are thus not a subject to the requirements on global competition. The situation might change in the near future as providers and industry are merging more and more. New concepts of car manufacturers show a tendency towards new mobility services. BMW promises customized vehicle concepts with a focus on sustainability throughout the value chain as well as a range of complementary mobility services, which is a part of the BMW-i’s understanding of individual mobility (BMW-i 2013). The Daimler subsidiary Smart has with "car-to-go" already a mobility service in the market, which is present in many countries (USA, Canada, and Europe). In Chapter 7 (“Challenges and Opportunities”) challenges of the European Union road service providers on the global market will be discussed.
5.1.1 Market share
The market share is the basis for the future development of automotive manufacturers and particularly the position in the new emerging markets is regarded as indicative for the future developments. But beside the importance of emerging markets Frost & Sullivan also point out that markets which has traditionally been a very important market for the European car manufacturers (Frost & Sullivan 2013) still has enormous potential, like the U.S. market. Also the market in Japan, where the competitiveness of the European automotive sector is traditionally low, will become interesting due to new opportunities with alternative vehicles and new mobility concepts. Joint ventures with Japanese manufacturers offer potential to dip into this market. Figure 23 illustrates the top 21 automotive markets in 2012. Biggest market share have the Chinese and American markets. Countries with the strongest growth rate between 2011 and 2012 are Thailand, Indonesia and Japan. But also for other markets experts predict strong growth (Frost & Sullivan 2013). Plenty of other populous countries are undersupplied with cars. Some manufacturers are already rushing to build factories in Turkey and Indonesia (The Economist 2013). But also markets in Eastern Europe and Africa were observed. The Economist further beliefs that Sub-Saharan Africa could be the next China (The Economist 2013).
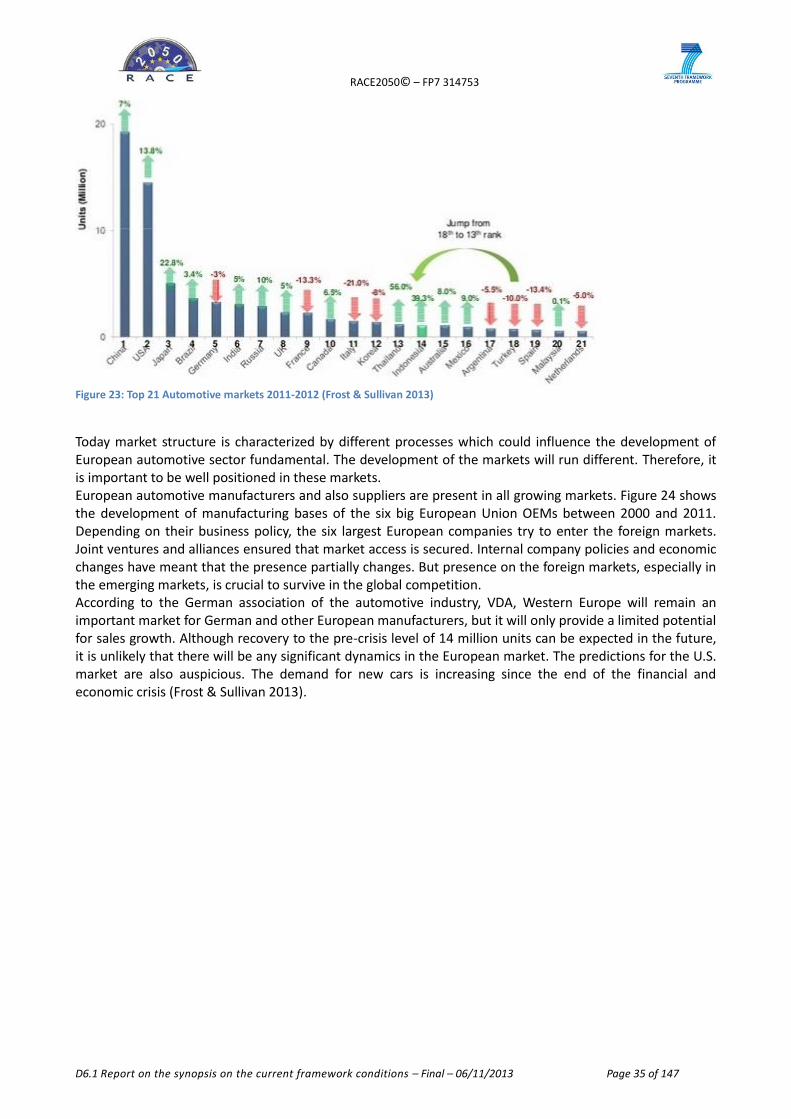
RACE2050© – FP7 314753
D6.1 Report on the synopsis on the current framework conditions – Final – 06/11/2013 Page 35 of 147
Figure 23: Top 21 Automotive markets 2011-2012 (Frost & Sullivan 2013)
Today market structure is characterized by different processes which could influence the development of European automotive sector fundamental. The development of the markets will run different. Therefore, it is important to be well positioned in these markets. European automotive manufacturers and also suppliers are present in all growing markets. Figure 24 shows the development of manufacturing bases of the six big European Union OEMs between 2000 and 2011. Depending on their business policy, the six largest European companies try to enter the foreign markets. Joint ventures and alliances ensured that market access is secured. Internal company policies and economic changes have meant that the presence partially changes. But presence on the foreign markets, especially in the emerging markets, is crucial to survive in the global competition. According to the German association of the automotive industry, VDA, Western Europe will remain an important market for German and other European manufacturers, but it will only provide a limited potential for sales growth. Although recovery to the pre-crisis level of 14 million units can be expected in the future, it is unlikely that there will be any significant dynamics in the European market. The predictions for the U.S. market are also auspicious. The demand for new cars is increasing since the end of the financial and economic crisis (Frost & Sullivan 2013).
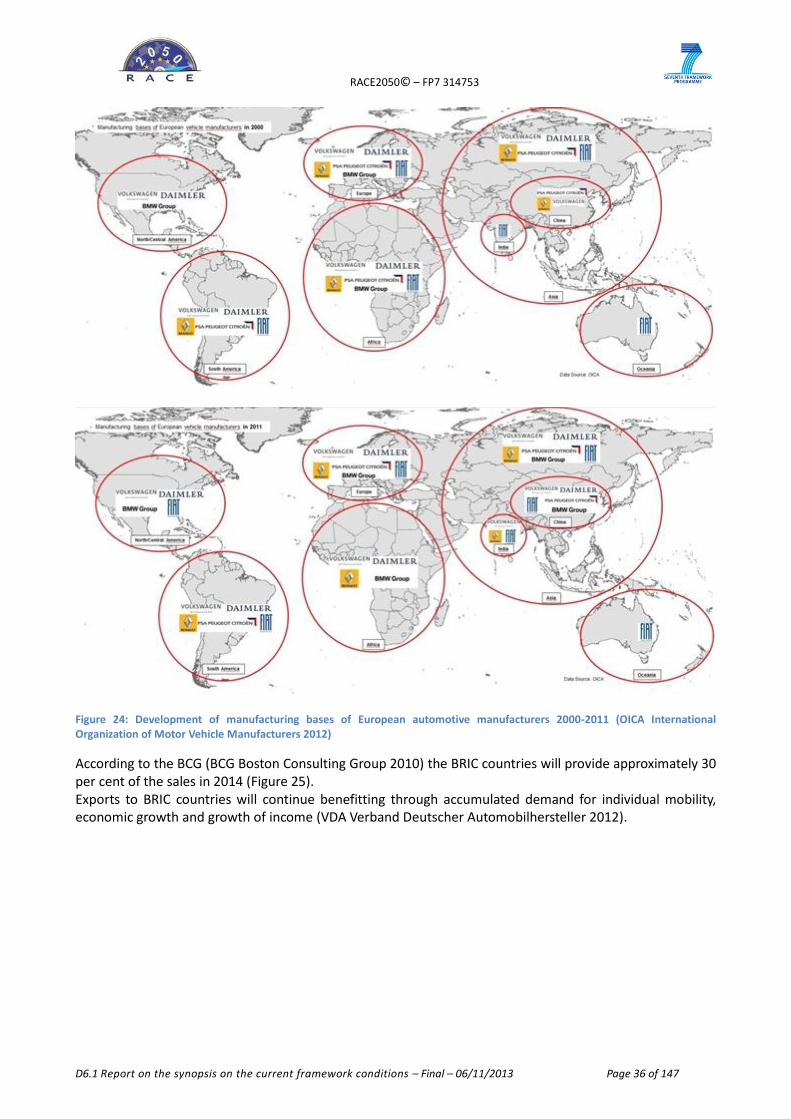
RACE2050© – FP7 314753
D6.1 Report on the synopsis on the current framework conditions – Final – 06/11/2013 Page 36 of 147
Figure 24: Development of manufacturing bases of European automotive manufacturers 2000-2011 (OICA International Organization of Motor Vehicle Manufacturers 2012)
According to the BCG (BCG Boston Consulting Group 2010) the BRIC countries will provide approximately 30 per cent of the sales in 2014 (Figure 25). Exports to BRIC countries will continue benefitting through accumulated demand for individual mobility, economic growth and growth of income (VDA Verband Deutscher Automobilhersteller 2012).
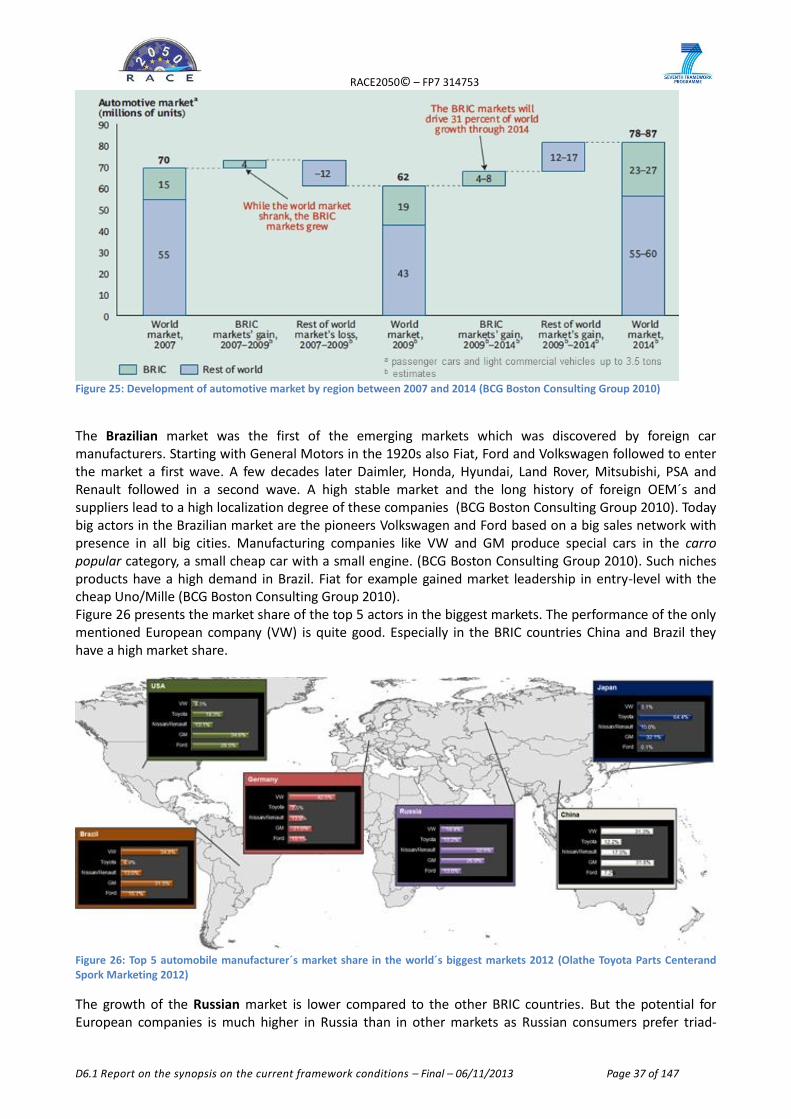
RACE2050© – FP7 314753
D6.1 Report on the synopsis on the current framework conditions – Final – 06/11/2013 Page 37 of 147
Figure 25: Development of automotive market by region between 2007 and 2014 (BCG Boston Consulting Group 2010)
The Brazilian market was the first of the emerging markets which was discovered by foreign car manufacturers. Starting with General Motors in the 1920s also Fiat, Ford and Volkswagen followed to enter the market a first wave. A few decades later Daimler, Honda, Hyundai, Land Rover, Mitsubishi, PSA and Renault followed in a second wave. A high stable market and the long history of foreign OEM´s and suppliers lead to a high localization degree of these companies (BCG Boston Consulting Group 2010). Today big actors in the Brazilian market are the pioneers Volkswagen and Ford based on a big sales network with presence in all big cities. Manufacturing companies like VW and GM produce special cars in the carro popular category, a small cheap car with a small engine. (BCG Boston Consulting Group 2010). Such niches products have a high demand in Brazil. Fiat for example gained market leadership in entry-level with the cheap Uno/Mille (BCG Boston Consulting Group 2010). Figure 26 presents the market share of the top 5 actors in the biggest markets. The performance of the only mentioned European company (VW) is quite good. Especially in the BRIC countries China and Brazil they have a high market share.
Figure 26: Top 5 automobile manufacturer´s market share in the world´s biggest markets 2012 (Olathe Toyota Parts Centerand Spork Marketing 2012)
The growth of the Russian market is lower compared to the other BRIC countries. But the potential for European companies is much higher in Russia than in other markets as Russian consumers prefer triad-
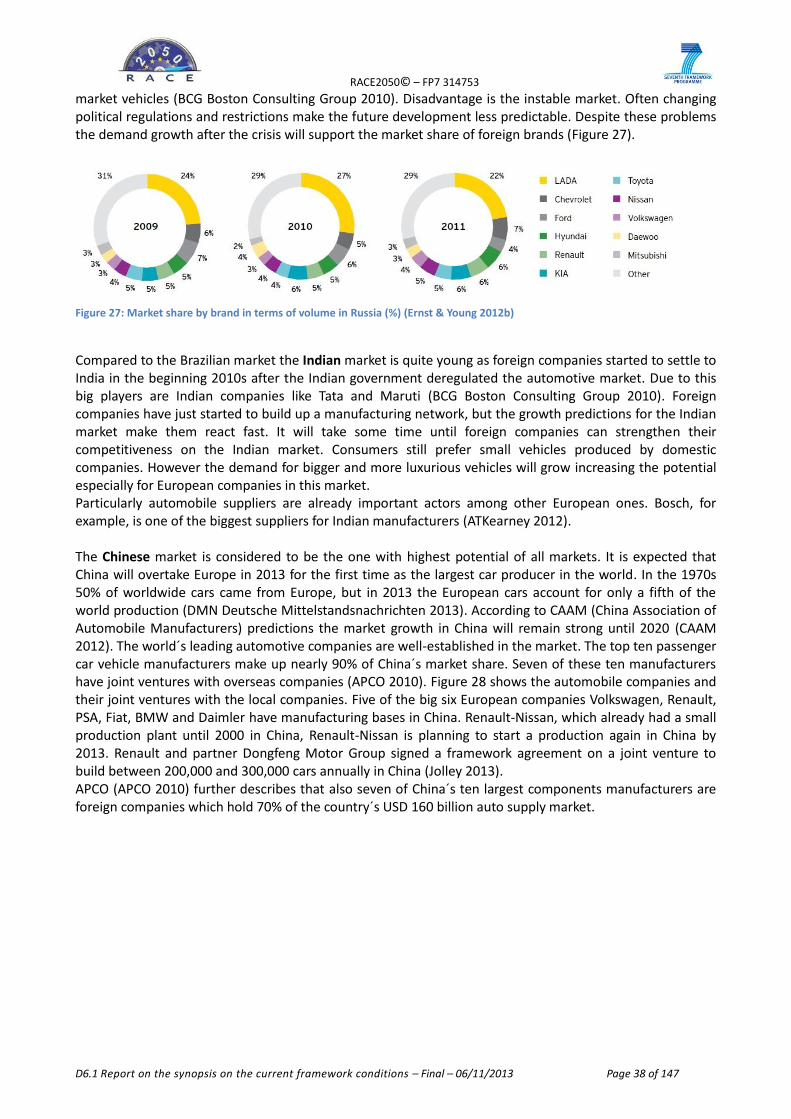
RACE2050© – FP7 314753
D6.1 Report on the synopsis on the current framework conditions – Final – 06/11/2013 Page 38 of 147
market vehicles (BCG Boston Consulting Group 2010). Disadvantage is the instable market. Often changing political regulations and restrictions make the future development less predictable. Despite these problems the demand growth after the crisis will support the market share of foreign brands (Figure 27).
Figure 27: Market share by brand in terms of volume in Russia (%) (Ernst & Young 2012b)
Compared to the Brazilian market the Indian market is quite young as foreign companies started to settle to India in the beginning 2010s after the Indian government deregulated the automotive market. Due to this big players are Indian companies like Tata and Maruti (BCG Boston Consulting Group 2010). Foreign companies have just started to build up a manufacturing network, but the growth predictions for the Indian market make them react fast. It will take some time until foreign companies can strengthen their competitiveness on the Indian market. Consumers still prefer small vehicles produced by domestic companies. However the demand for bigger and more luxurious vehicles will grow increasing the potential especially for European companies in this market. Particularly automobile suppliers are already important actors among other European ones. Bosch, for example, is one of the biggest suppliers for Indian manufacturers (ATKearney 2012). The Chinese market is considered to be the one with highest potential of all markets. It is expected that China will overtake Europe in 2013 for the first time as the largest car producer in the world. In the 1970s 50% of worldwide cars came from Europe, but in 2013 the European cars account for only a fifth of the world production (DMN Deutsche Mittelstandsnachrichten 2013). According to CAAM (China Association of Automobile Manufacturers) predictions the market growth in China will remain strong until 2020 (CAAM 2012). The world´s leading automotive companies are well-established in the market. The top ten passenger car vehicle manufacturers make up nearly 90% of China´s market share. Seven of these ten manufacturers have joint ventures with overseas companies (APCO 2010). Figure 28 shows the automobile companies and their joint ventures with the local companies. Five of the big six European companies Volkswagen, Renault, PSA, Fiat, BMW and Daimler have manufacturing bases in China. Renault-Nissan, which already had a small production plant until 2000 in China, Renault-Nissan is planning to start a production again in China by 2013. Renault and partner Dongfeng Motor Group signed a framework agreement on a joint venture to build between 200,000 and 300,000 cars annually in China (Jolley 2013). APCO (APCO 2010) further describes that also seven of China´s ten largest components manufacturers are foreign companies which hold 70% of the country´s USD 160 billion auto supply market.
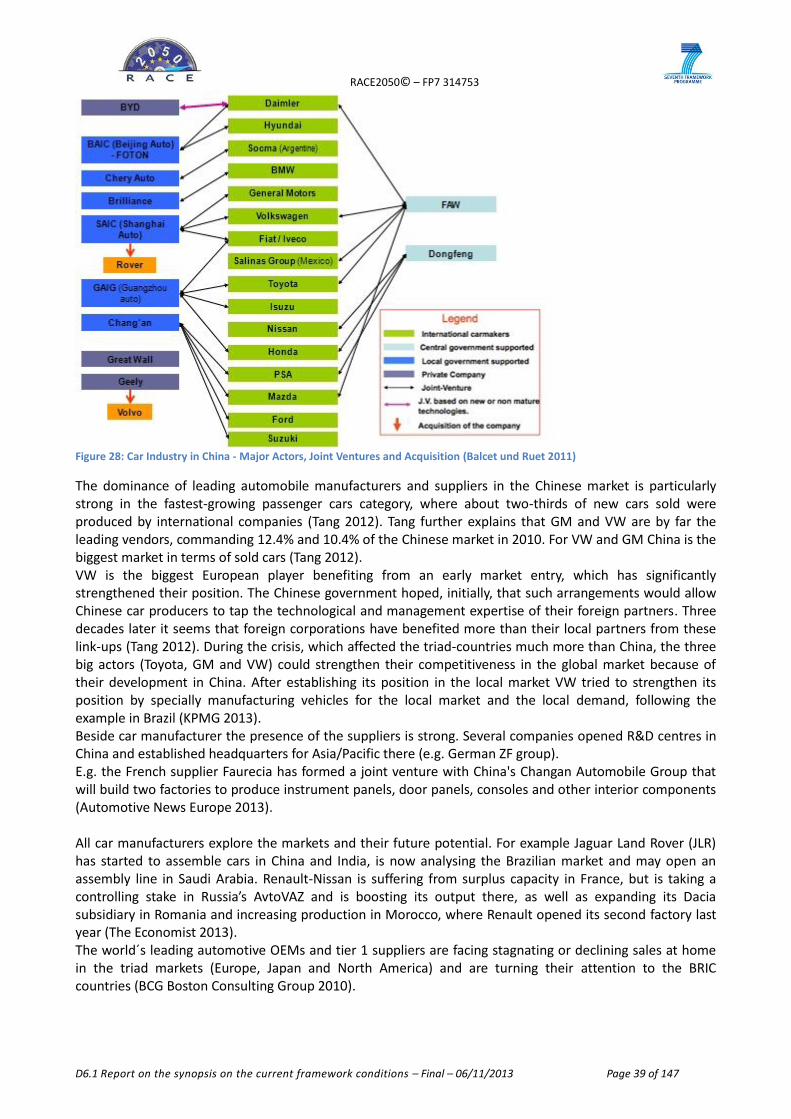
RACE2050© – FP7 314753
D6.1 Report on the synopsis on the current framework conditions – Final – 06/11/2013 Page 39 of 147
Figure 28: Car Industry in China - Major Actors, Joint Ventures and Acquisition (Balcet und Ruet 2011)
The dominance of leading automobile manufacturers and suppliers in the Chinese market is particularly strong in the fastest-growing passenger cars category, where about two-thirds of new cars sold were produced by international companies (Tang 2012). Tang further explains that GM and VW are by far the leading vendors, commanding 12.4% and 10.4% of the Chinese market in 2010. For VW and GM China is the biggest market in terms of sold cars (Tang 2012). VW is the biggest European player benefiting from an early market entry, which has significantly strengthened their position. The Chinese government hoped, initially, that such arrangements would allow Chinese car producers to tap the technological and management expertise of their foreign partners. Three decades later it seems that foreign corporations have benefited more than their local partners from these link-ups (Tang 2012). During the crisis, which affected the triad-countries much more than China, the three big actors (Toyota, GM and VW) could strengthen their competitiveness in the global market because of their development in China. After establishing its position in the local market VW tried to strengthen its position by specially manufacturing vehicles for the local market and the local demand, following the example in Brazil (KPMG 2013). Beside car manufacturer the presence of the suppliers is strong. Several companies opened R&D centres in China and established headquarters for Asia/Pacific there (e.g. German ZF group). E.g. the French supplier Faurecia has formed a joint venture with China's Changan Automobile Group that will build two factories to produce instrument panels, door panels, consoles and other interior components (Automotive News Europe 2013). All car manufacturers explore the markets and their future potential. For example Jaguar Land Rover (JLR) has started to assemble cars in China and India, is now analysing the Brazilian market and may open an assembly line in Saudi Arabia. Renault-Nissan is suffering from surplus capacity in France, but is taking a controlling stake in Russia’s AvtoVAZ and is boosting its output there, as well as expanding its Dacia subsidiary in Romania and increasing production in Morocco, where Renault opened its second factory last year (The Economist 2013). The world´s leading automotive OEMs and tier 1 suppliers are facing stagnating or declining sales at home in the triad markets (Europe, Japan and North America) and are turning their attention to the BRIC countries (BCG Boston Consulting Group 2010).
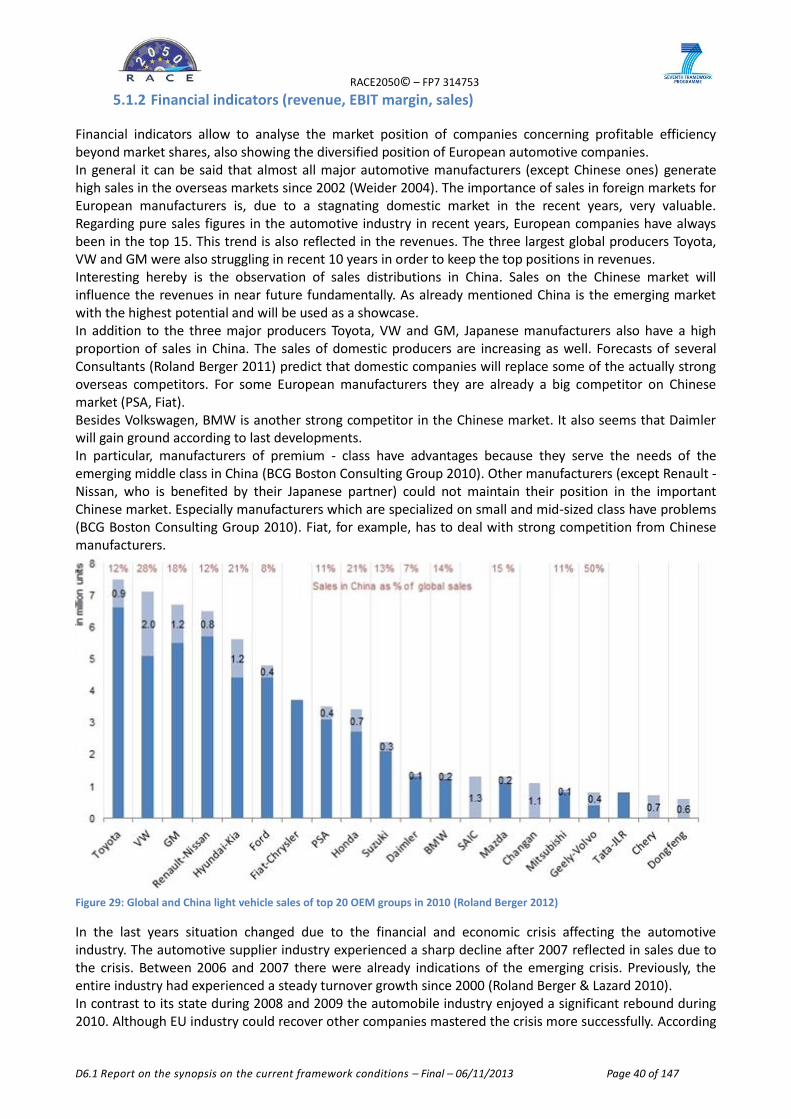
RACE2050© – FP7 314753
D6.1 Report on the synopsis on the current framework conditions – Final – 06/11/2013 Page 40 of 147
5.1.2 Financial indicators (revenue, EBIT margin, sales)
Financial indicators allow to analyse the market position of companies concerning profitable efficiency beyond market shares, also showing the diversified position of European automotive companies. In general it can be said that almost all major automotive manufacturers (except Chinese ones) generate high sales in the overseas markets since 2002 (Weider 2004). The importance of sales in foreign markets for European manufacturers is, due to a stagnating domestic market in the recent years, very valuable. Regarding pure sales figures in the automotive industry in recent years, European companies have always been in the top 15. This trend is also reflected in the revenues. The three largest global producers Toyota, VW and GM were also struggling in recent 10 years in order to keep the top positions in revenues. Interesting hereby is the observation of sales distributions in China. Sales on the Chinese market will influence the revenues in near future fundamentally. As already mentioned China is the emerging market with the highest potential and will be used as a showcase. In addition to the three major producers Toyota, VW and GM, Japanese manufacturers also have a high proportion of sales in China. The sales of domestic producers are increasing as well. Forecasts of several Consultants (Roland Berger 2011) predict that domestic companies will replace some of the actually strong overseas competitors. For some European manufacturers they are already a big competitor on Chinese market (PSA, Fiat). Besides Volkswagen, BMW is another strong competitor in the Chinese market. It also seems that Daimler will gain ground according to last developments. In particular, manufacturers of premium - class have advantages because they serve the needs of the emerging middle class in China (BCG Boston Consulting Group 2010). Other manufacturers (except Renault - Nissan, who is benefited by their Japanese partner) could not maintain their position in the important Chinese market. Especially manufacturers which are specialized on small and mid-sized class have problems (BCG Boston Consulting Group 2010). Fiat, for example, has to deal with strong competition from Chinese manufacturers.
Figure 29: Global and China light vehicle sales of top 20 OEM groups in 2010 (Roland Berger 2012)
In the last years situation changed due to the financial and economic crisis affecting the automotive industry. The automotive supplier industry experienced a sharp decline after 2007 reflected in sales due to the crisis. Between 2006 and 2007 there were already indications of the emerging crisis. Previously, the entire industry had experienced a steady turnover growth since 2000 (Roland Berger & Lazard 2010). In contrast to its state during 2008 and 2009 the automobile industry enjoyed a significant rebound during 2010. Although EU industry could recover other companies mastered the crisis more successfully. According
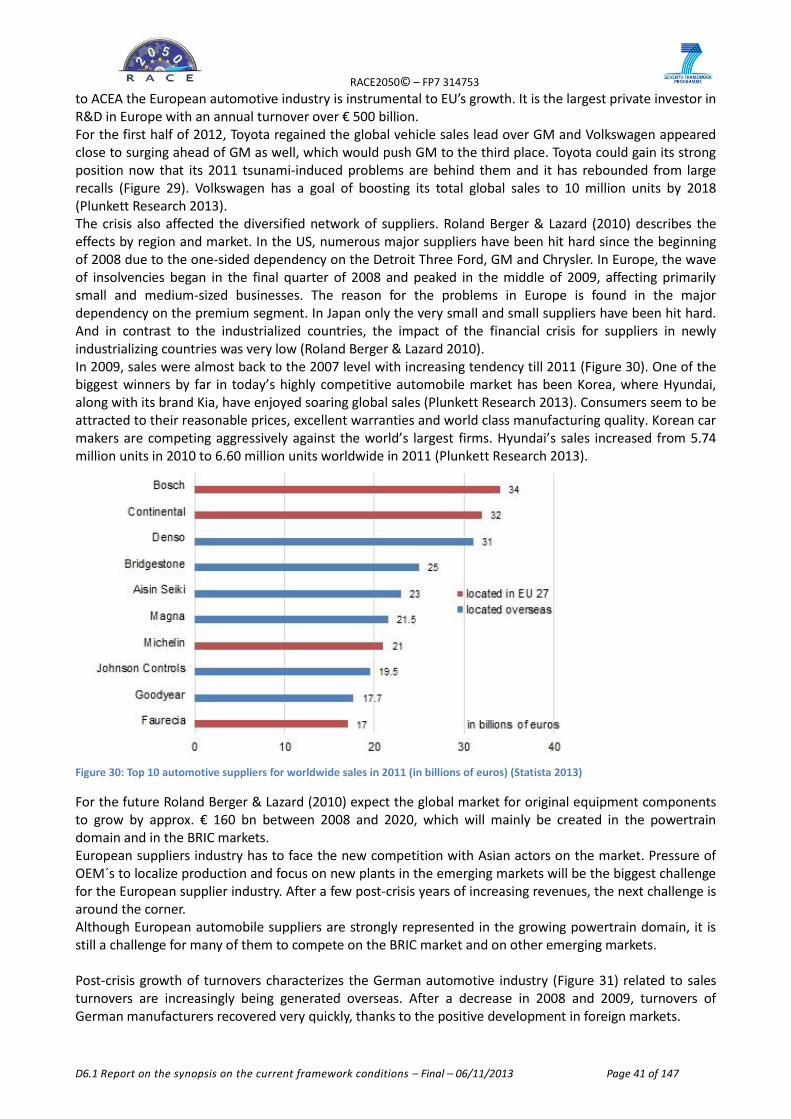
RACE2050© – FP7 314753
D6.1 Report on the synopsis on the current framework conditions – Final – 06/11/2013 Page 41 of 147
to ACEA the European automotive industry is instrumental to EU’s growth. It is the largest private investor in R&D in Europe with an annual turnover over € 500 billion. For the first half of 2012, Toyota regained the global vehicle sales lead over GM and Volkswagen appeared close to surging ahead of GM as well, which would push GM to the third place. Toyota could gain its strong position now that its 2011 tsunami-induced problems are behind them and it has rebounded from large recalls (Figure 29). Volkswagen has a goal of boosting its total global sales to 10 million units by 2018 (Plunkett Research 2013). The crisis also affected the diversified network of suppliers. Roland Berger & Lazard (2010) describes the effects by region and market. In the US, numerous major suppliers have been hit hard since the beginning of 2008 due to the one-sided dependency on the Detroit Three Ford, GM and Chrysler. In Europe, the wave of insolvencies began in the final quarter of 2008 and peaked in the middle of 2009, affecting primarily small and medium-sized businesses. The reason for the problems in Europe is found in the major dependency on the premium segment. In Japan only the very small and small suppliers have been hit hard. And in contrast to the industrialized countries, the impact of the financial crisis for suppliers in newly industrializing countries was very low (Roland Berger & Lazard 2010). In 2009, sales were almost back to the 2007 level with increasing tendency till 2011 (Figure 30). One of the biggest winners by far in today’s highly competitive automobile market has been Korea, where Hyundai, along with its brand Kia, have enjoyed soaring global sales (Plunkett Research 2013). Consumers seem to be attracted to their reasonable prices, excellent warranties and world class manufacturing quality. Korean car makers are competing aggressively against the world’s largest firms. Hyundai’s sales increased from 5.74 million units in 2010 to 6.60 million units worldwide in 2011 (Plunkett Research 2013).
Figure 30: Top 10 automotive suppliers for worldwide sales in 2011 (in billions of euros) (Statista 2013)
For the future Roland Berger & Lazard (2010) expect the global market for original equipment components to grow by approx. € 160 bn between 2008 and 2020, which will mainly be created in the powertrain domain and in the BRIC markets. European suppliers industry has to face the new competition with Asian actors on the market. Pressure of OEM´s to localize production and focus on new plants in the emerging markets will be the biggest challenge for the European supplier industry. After a few post-crisis years of increasing revenues, the next challenge is around the corner. Although European automobile suppliers are strongly represented in the growing powertrain domain, it is still a challenge for many of them to compete on the BRIC market and on other emerging markets. Post-crisis growth of turnovers characterizes the German automotive industry (Figure 31) related to sales turnovers are increasingly being generated overseas. After a decrease in 2008 and 2009, turnovers of German manufacturers recovered very quickly, thanks to the positive development in foreign markets.
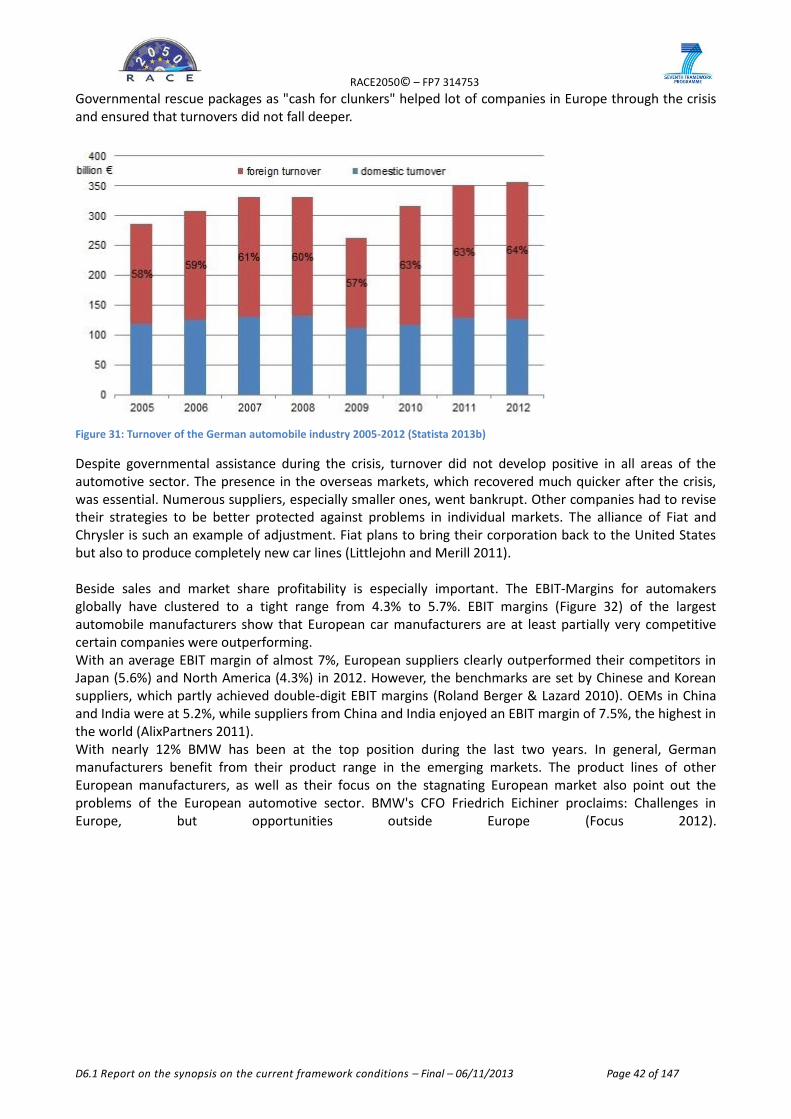
RACE2050© – FP7 314753
D6.1 Report on the synopsis on the current framework conditions – Final – 06/11/2013 Page 42 of 147
Governmental rescue packages as "cash for clunkers" helped lot of companies in Europe through the crisis and ensured that turnovers did not fall deeper.
Figure 31: Turnover of the German automobile industry 2005-2012 (Statista 2013b)
Despite governmental assistance during the crisis, turnover did not develop positive in all areas of the automotive sector. The presence in the overseas markets, which recovered much quicker after the crisis, was essential. Numerous suppliers, especially smaller ones, went bankrupt. Other companies had to revise their strategies to be better protected against problems in individual markets. The alliance of Fiat and Chrysler is such an example of adjustment. Fiat plans to bring their corporation back to the United States but also to produce completely new car lines (Littlejohn and Merill 2011). Beside sales and market share profitability is especially important. The EBIT-Margins for automakers globally have clustered to a tight range from 4.3% to 5.7%. EBIT margins (Figure 32) of the largest automobile manufacturers show that European car manufacturers are at least partially very competitive certain companies were outperforming. With an average EBIT margin of almost 7%, European suppliers clearly outperformed their competitors in Japan (5.6%) and North America (4.3%) in 2012. However, the benchmarks are set by Chinese and Korean suppliers, which partly achieved double-digit EBIT margins (Roland Berger & Lazard 2010). OEMs in China and India were at 5.2%, while suppliers from China and India enjoyed an EBIT margin of 7.5%, the highest in the world (AlixPartners 2011). With nearly 12% BMW has been at the top position during the last two years. In general, German manufacturers benefit from their product range in the emerging markets. The product lines of other European manufacturers, as well as their focus on the stagnating European market also point out the problems of the European automotive sector. BMW's CFO Friedrich Eichiner proclaims: Challenges in Europe, but opportunities outside Europe (Focus 2012).
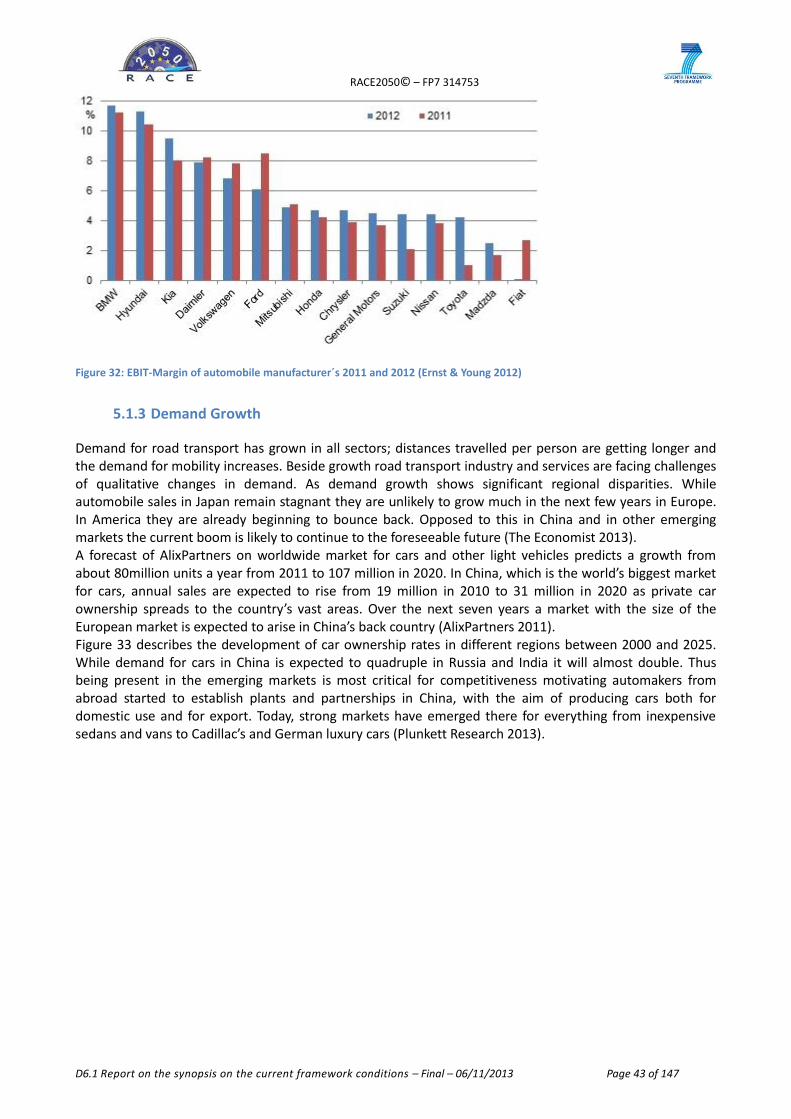
RACE2050© – FP7 314753
D6.1 Report on the synopsis on the current framework conditions – Final – 06/11/2013 Page 43 of 147
Figure 32: EBIT-Margin of automobile manufacturer´s 2011 and 2012 (Ernst & Young 2012)
5.1.3 Demand Growth
Demand for road transport has grown in all sectors; distances travelled per person are getting longer and the demand for mobility increases. Beside growth road transport industry and services are facing challenges of qualitative changes in demand. As demand growth shows significant regional disparities. While automobile sales in Japan remain stagnant they are unlikely to grow much in the next few years in Europe. In America they are already beginning to bounce back. Opposed to this in China and in other emerging markets the current boom is likely to continue to the foreseeable future (The Economist 2013). A forecast of AlixPartners on worldwide market for cars and other light vehicles predicts a growth from about 80million units a year from 2011 to 107 million in 2020. In China, which is the world’s biggest market for cars, annual sales are expected to rise from 19 million in 2010 to 31 million in 2020 as private car ownership spreads to the country’s vast areas. Over the next seven years a market with the size of the European market is expected to arise in China’s back country (AlixPartners 2011). Figure 33 describes the development of car ownership rates in different regions between 2000 and 2025. While demand for cars in China is expected to quadruple in Russia and India it will almost double. Thus being present in the emerging markets is most critical for competitiveness motivating automakers from abroad started to establish plants and partnerships in China, with the aim of producing cars both for domestic use and for export. Today, strong markets have emerged there for everything from inexpensive sedans and vans to Cadillac’s and German luxury cars (Plunkett Research 2013).
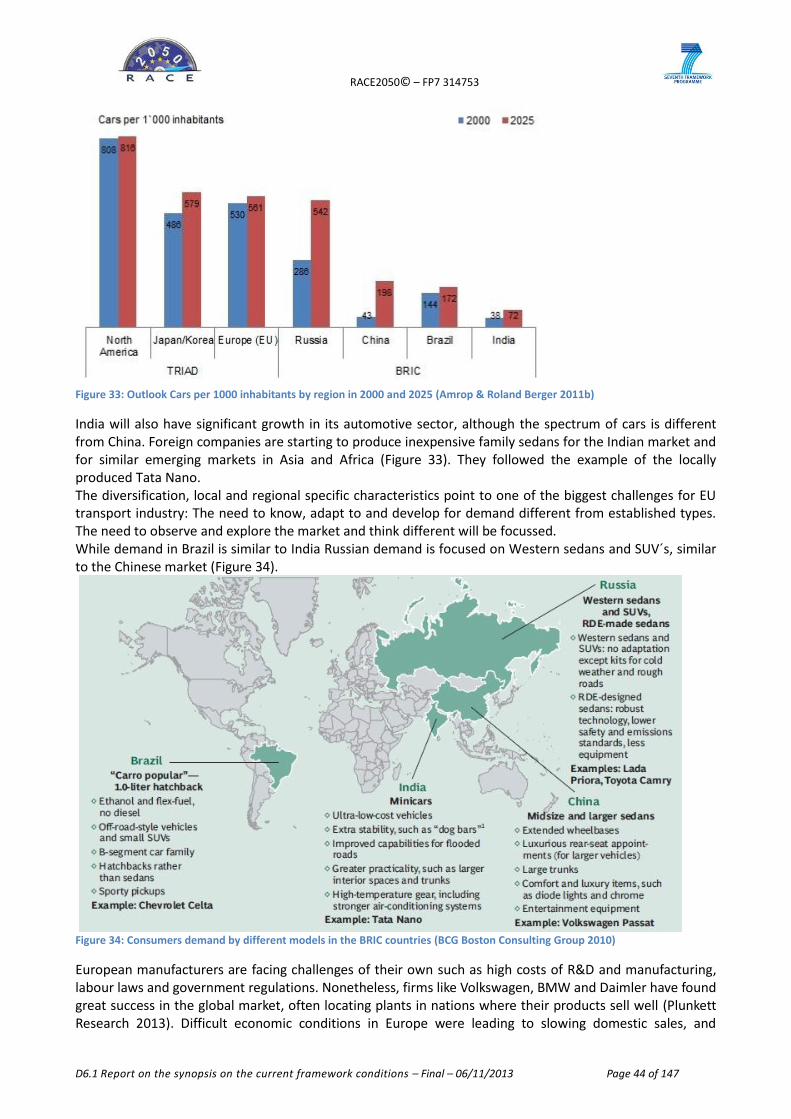
RACE2050© – FP7 314753
D6.1 Report on the synopsis on the current framework conditions – Final – 06/11/2013 Page 44 of 147
Figure 33: Outlook Cars per 1000 inhabitants by region in 2000 and 2025 (Amrop & Roland Berger 2011b)
India will also have significant growth in its automotive sector, although the spectrum of cars is different from China. Foreign companies are starting to produce inexpensive family sedans for the Indian market and for similar emerging markets in Asia and Africa (Figure 33). They followed the example of the locally produced Tata Nano. The diversification, local and regional specific characteristics point to one of the biggest challenges for EU transport industry: The need to know, adapt to and develop for demand different from established types. The need to observe and explore the market and think different will be focussed. While demand in Brazil is similar to India Russian demand is focused on Western sedans and SUV´s, similar to the Chinese market (Figure 34).
Figure 34: Consumers demand by different models in the BRIC countries (BCG Boston Consulting Group 2010)
European manufacturers are facing challenges of their own such as high costs of R&D and manufacturing, labour laws and government regulations. Nonetheless, firms like Volkswagen, BMW and Daimler have found great success in the global market, often locating plants in nations where their products sell well (Plunkett Research 2013). Difficult economic conditions in Europe were leading to slowing domestic sales, and
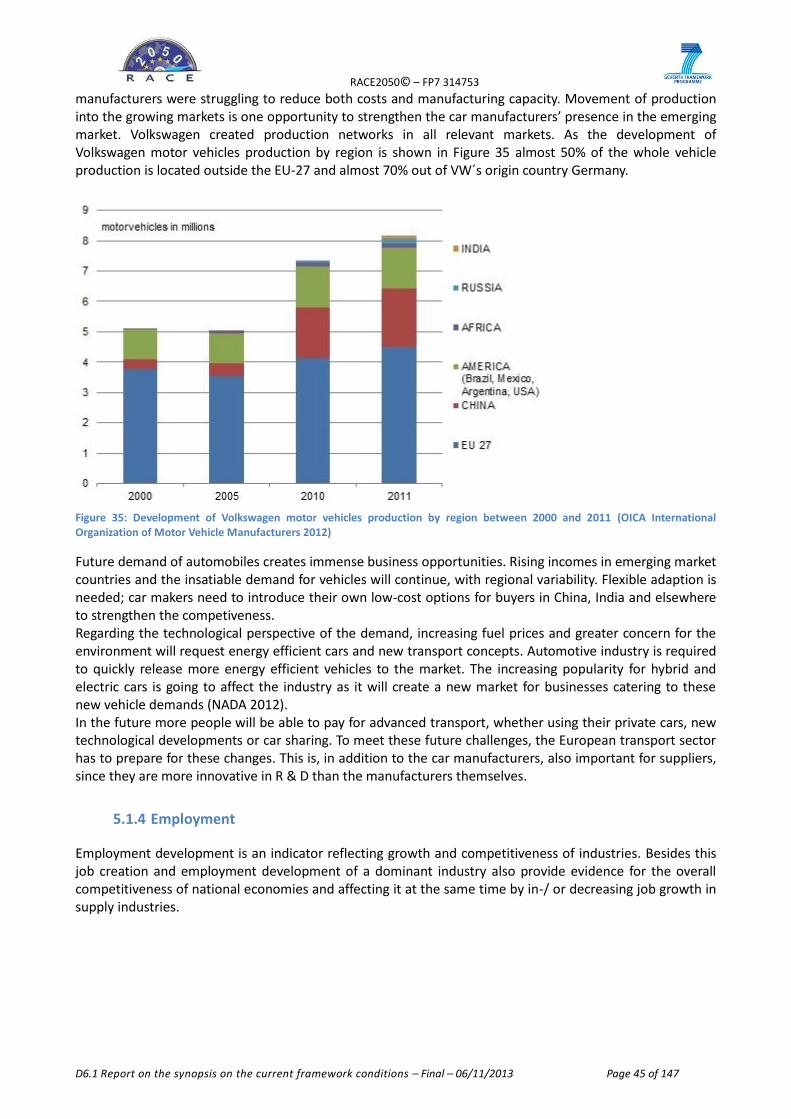
RACE2050© – FP7 314753
D6.1 Report on the synopsis on the current framework conditions – Final – 06/11/2013 Page 45 of 147
manufacturers were struggling to reduce both costs and manufacturing capacity. Movement of production into the growing markets is one opportunity to strengthen the car manufacturers’ presence in the emerging market. Volkswagen created production networks in all relevant markets. As the development of Volkswagen motor vehicles production by region is shown in Figure 35 almost 50% of the whole vehicle production is located outside the EU-27 and almost 70% out of VW´s origin country Germany.
Figure 35: Development of Volkswagen motor vehicles production by region between 2000 and 2011 (OICA International Organization of Motor Vehicle Manufacturers 2012)
Future demand of automobiles creates immense business opportunities. Rising incomes in emerging market countries and the insatiable demand for vehicles will continue, with regional variability. Flexible adaption is needed; car makers need to introduce their own low-cost options for buyers in China, India and elsewhere to strengthen the competiveness. Regarding the technological perspective of the demand, increasing fuel prices and greater concern for the environment will request energy efficient cars and new transport concepts. Automotive industry is required to quickly release more energy efficient vehicles to the market. The increasing popularity for hybrid and electric cars is going to affect the industry as it will create a new market for businesses catering to these new vehicle demands (NADA 2012). In the future more people will be able to pay for advanced transport, whether using their private cars, new technological developments or car sharing. To meet these future challenges, the European transport sector has to prepare for these changes. This is, in addition to the car manufacturers, also important for suppliers, since they are more innovative in R & D than the manufacturers themselves.
5.1.4 Employment
Employment development is an indicator reflecting growth and competitiveness of industries. Besides this job creation and employment development of a dominant industry also provide evidence for the overall competitiveness of national economies and affecting it at the same time by in-/ or decreasing job growth in supply industries.
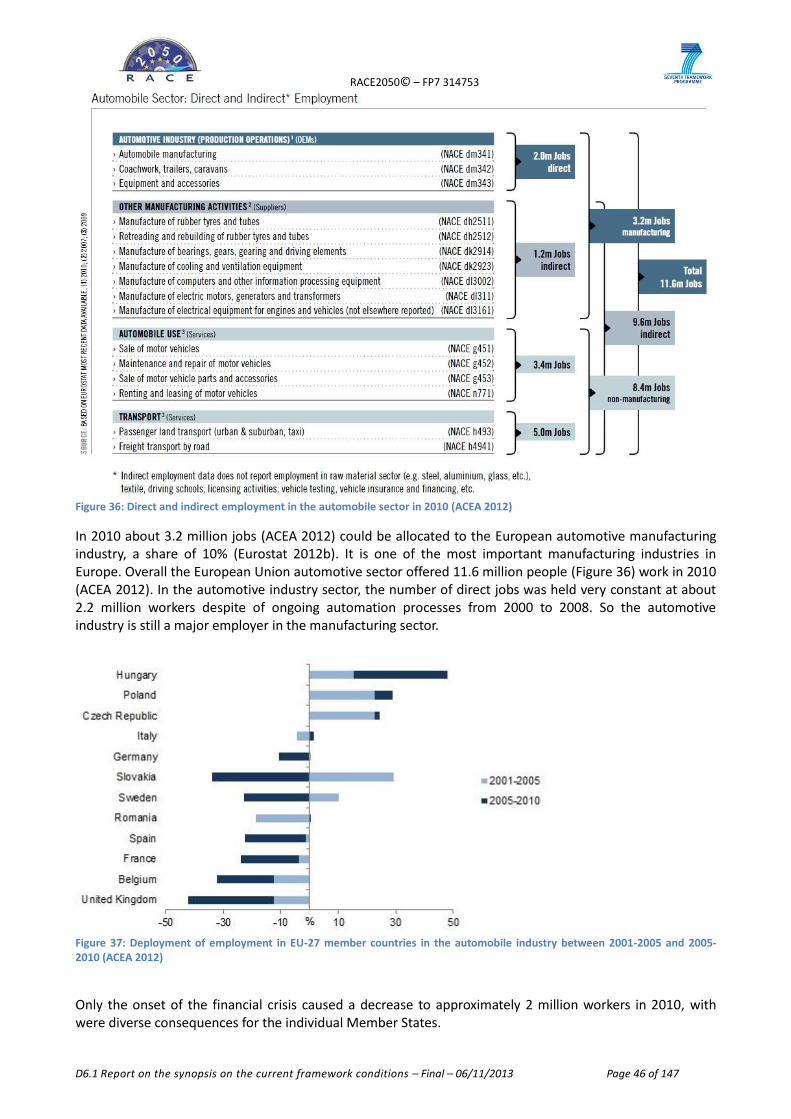
RACE2050© – FP7 314753
D6.1 Report on the synopsis on the current framework conditions – Final – 06/11/2013 Page 46 of 147
Figure 36: Direct and indirect employment in the automobile sector in 2010 (ACEA 2012)
In 2010 about 3.2 million jobs (ACEA 2012) could be allocated to the European automotive manufacturing industry, a share of 10% (Eurostat 2012b). It is one of the most important manufacturing industries in Europe. Overall the European Union automotive sector offered 11.6 million people (Figure 36) work in 2010 (ACEA 2012). In the automotive industry sector, the number of direct jobs was held very constant at about 2.2 million workers despite of ongoing automation processes from 2000 to 2008. So the automotive industry is still a major employer in the manufacturing sector.
Figure 37: Deployment of employment in EU-27 member countries in the automobile industry between 2001-2005 and 2005-2010 (ACEA 2012)
Only the onset of the financial crisis caused a decrease to approximately 2 million workers in 2010, with were diverse consequences for the individual Member States.
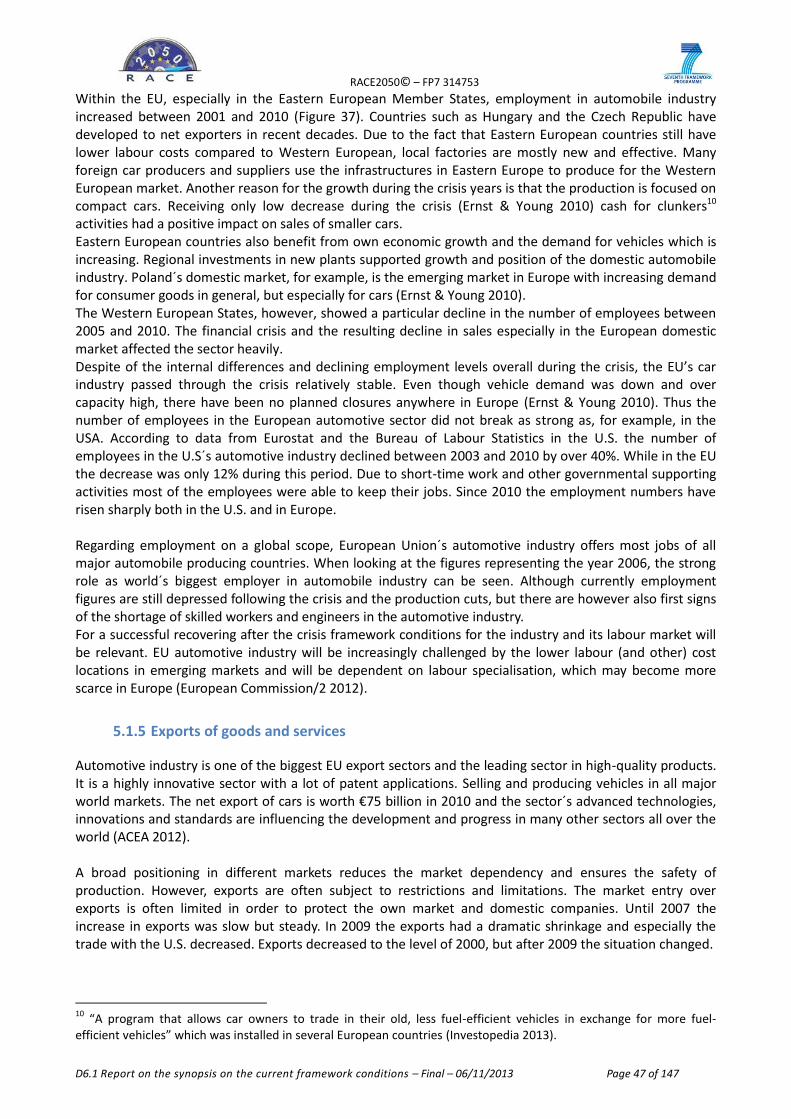
RACE2050© – FP7 314753
D6.1 Report on the synopsis on the current framework conditions – Final – 06/11/2013 Page 47 of 147
Within the EU, especially in the Eastern European Member States, employment in automobile industry increased between 2001 and 2010 (Figure 37). Countries such as Hungary and the Czech Republic have developed to net exporters in recent decades. Due to the fact that Eastern European countries still have lower labour costs compared to Western European, local factories are mostly new and effective. Many foreign car producers and suppliers use the infrastructures in Eastern Europe to produce for the Western European market. Another reason for the growth during the crisis years is that the production is focused on compact cars. Receiving only low decrease during the crisis (Ernst & Young 2010) cash for clunkers10 activities had a positive impact on sales of smaller cars. Eastern European countries also benefit from own economic growth and the demand for vehicles which is increasing. Regional investments in new plants supported growth and position of the domestic automobile industry. Poland´s domestic market, for example, is the emerging market in Europe with increasing demand for consumer goods in general, but especially for cars (Ernst & Young 2010). The Western European States, however, showed a particular decline in the number of employees between 2005 and 2010. The financial crisis and the resulting decline in sales especially in the European domestic market affected the sector heavily. Despite of the internal differences and declining employment levels overall during the crisis, the EU’s car industry passed through the crisis relatively stable. Even though vehicle demand was down and over capacity high, there have been no planned closures anywhere in Europe (Ernst & Young 2010). Thus the number of employees in the European automotive sector did not break as strong as, for example, in the USA. According to data from Eurostat and the Bureau of Labour Statistics in the U.S. the number of employees in the U.S´s automotive industry declined between 2003 and 2010 by over 40%. While in the EU the decrease was only 12% during this period. Due to short-time work and other governmental supporting activities most of the employees were able to keep their jobs. Since 2010 the employment numbers have risen sharply both in the U.S. and in Europe. Regarding employment on a global scope, European Union´s automotive industry offers most jobs of all major automobile producing countries. When looking at the figures representing the year 2006, the strong role as world´s biggest employer in automobile industry can be seen. Although currently employment figures are still depressed following the crisis and the production cuts, but there are however also first signs of the shortage of skilled workers and engineers in the automotive industry. For a successful recovering after the crisis framework conditions for the industry and its labour market will be relevant. EU automotive industry will be increasingly challenged by the lower labour (and other) cost locations in emerging markets and will be dependent on labour specialisation, which may become more scarce in Europe (European Commission/2 2012).
5.1.5 Exports of goods and services
Automotive industry is one of the biggest EU export sectors and the leading sector in high-quality products. It is a highly innovative sector with a lot of patent applications. Selling and producing vehicles in all major world markets. The net export of cars is worth €75 billion in 2010 and the sector´s advanced technologies, innovations and standards are influencing the development and progress in many other sectors all over the world (ACEA 2012). A broad positioning in different markets reduces the market dependency and ensures the safety of production. However, exports are often subject to restrictions and limitations. The market entry over exports is often limited in order to protect the own market and domestic companies. Until 2007 the increase in exports was slow but steady. In 2009 the exports had a dramatic shrinkage and especially the trade with the U.S. decreased. Exports decreased to the level of 2000, but after 2009 the situation changed.
10
“A program that allows car owners to trade in their old, less fuel-efficient vehicles in exchange for more fuel-efficient vehicles” which was installed in several European countries (Investopedia 2013).
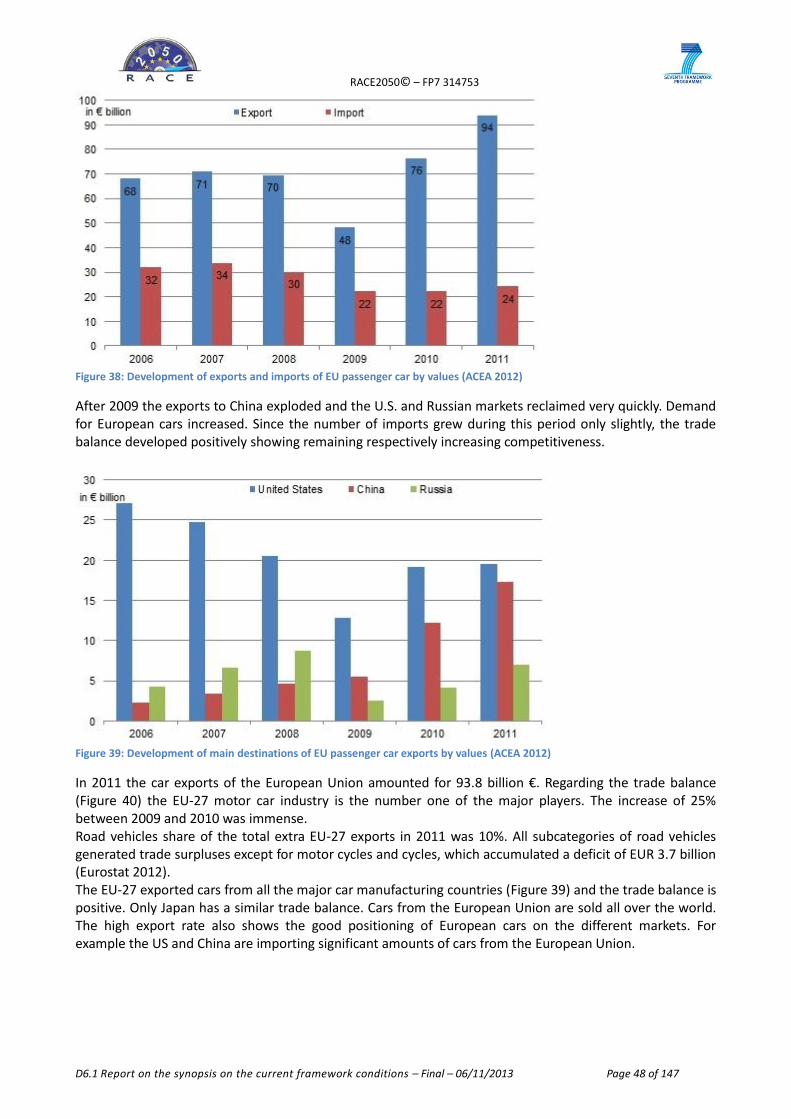
RACE2050© – FP7 314753
D6.1 Report on the synopsis on the current framework conditions – Final – 06/11/2013 Page 48 of 147
Figure 38: Development of exports and imports of EU passenger car by values (ACEA 2012)
After 2009 the exports to China exploded and the U.S. and Russian markets reclaimed very quickly. Demand for European cars increased. Since the number of imports grew during this period only slightly, the trade balance developed positively showing remaining respectively increasing competitiveness.
Figure 39: Development of main destinations of EU passenger car exports by values (ACEA 2012)
In 2011 the car exports of the European Union amounted for 93.8 billion €. Regarding the trade balance (Figure 40) the EU-27 motor car industry is the number one of the major players. The increase of 25% between 2009 and 2010 was immense. Road vehicles share of the total extra EU-27 exports in 2011 was 10%. All subcategories of road vehicles generated trade surpluses except for motor cycles and cycles, which accumulated a deficit of EUR 3.7 billion (Eurostat 2012). The EU-27 exported cars from all the major car manufacturing countries (Figure 39) and the trade balance is positive. Only Japan has a similar trade balance. Cars from the European Union are sold all over the world. The high export rate also shows the good positioning of European cars on the different markets. For example the US and China are importing significant amounts of cars from the European Union.
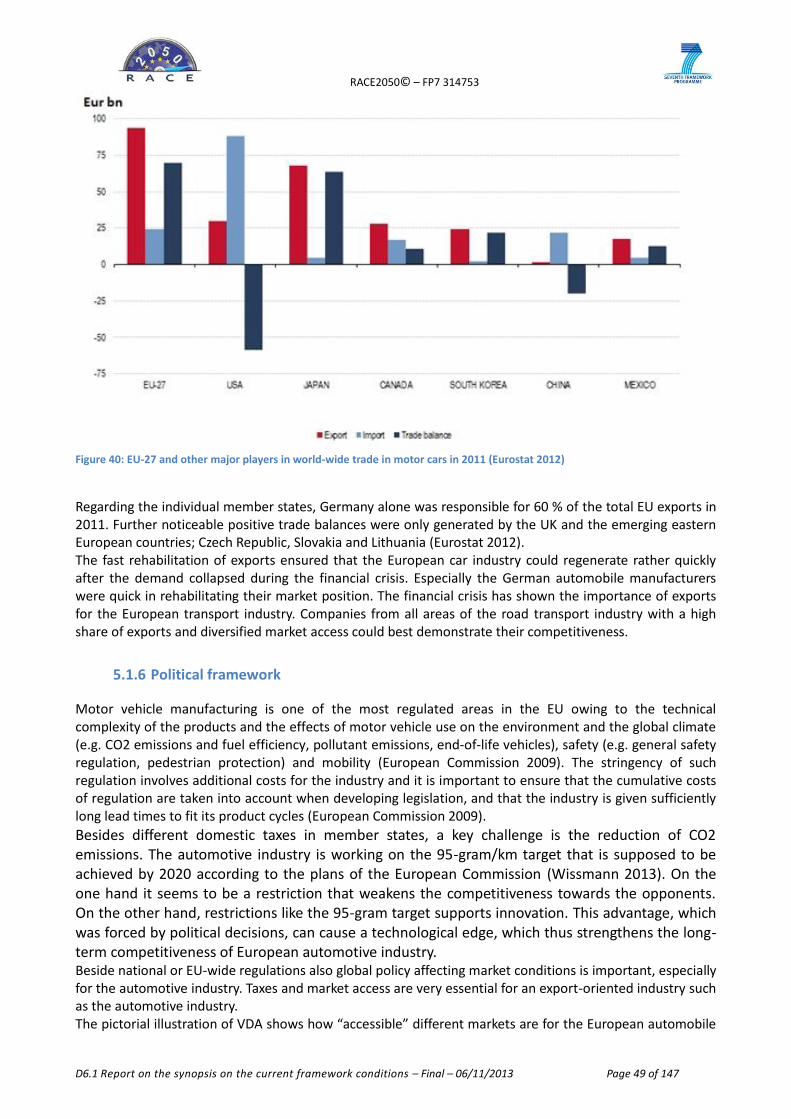
RACE2050© – FP7 314753
D6.1 Report on the synopsis on the current framework conditions – Final – 06/11/2013 Page 49 of 147
Figure 40: EU-27 and other major players in world-wide trade in motor cars in 2011 (Eurostat 2012)
Regarding the individual member states, Germany alone was responsible for 60 % of the total EU exports in 2011. Further noticeable positive trade balances were only generated by the UK and the emerging eastern European countries; Czech Republic, Slovakia and Lithuania (Eurostat 2012). The fast rehabilitation of exports ensured that the European car industry could regenerate rather quickly after the demand collapsed during the financial crisis. Especially the German automobile manufacturers were quick in rehabilitating their market position. The financial crisis has shown the importance of exports for the European transport industry. Companies from all areas of the road transport industry with a high share of exports and diversified market access could best demonstrate their competitiveness.
5.1.6 Political framework
Motor vehicle manufacturing is one of the most regulated areas in the EU owing to the technical complexity of the products and the effects of motor vehicle use on the environment and the global climate (e.g. CO2 emissions and fuel efficiency, pollutant emissions, end-of-life vehicles), safety (e.g. general safety regulation, pedestrian protection) and mobility (European Commission 2009). The stringency of such regulation involves additional costs for the industry and it is important to ensure that the cumulative costs of regulation are taken into account when developing legislation, and that the industry is given sufficiently long lead times to fit its product cycles (European Commission 2009).
Besides different domestic taxes in member states, a key challenge is the reduction of CO2 emissions. The automotive industry is working on the 95-gram/km target that is supposed to be achieved by 2020 according to the plans of the European Commission (Wissmann 2013). On the one hand it seems to be a restriction that weakens the competitiveness towards the opponents. On the other hand, restrictions like the 95-gram target supports innovation. This advantage, which was forced by political decisions, can cause a technological edge, which thus strengthens the long-term competitiveness of European automotive industry. Beside national or EU-wide regulations also global policy affecting market conditions is important, especially for the automotive industry. Taxes and market access are very essential for an export-oriented industry such as the automotive industry. The pictorial illustration of VDA shows how “accessible” different markets are for the European automobile
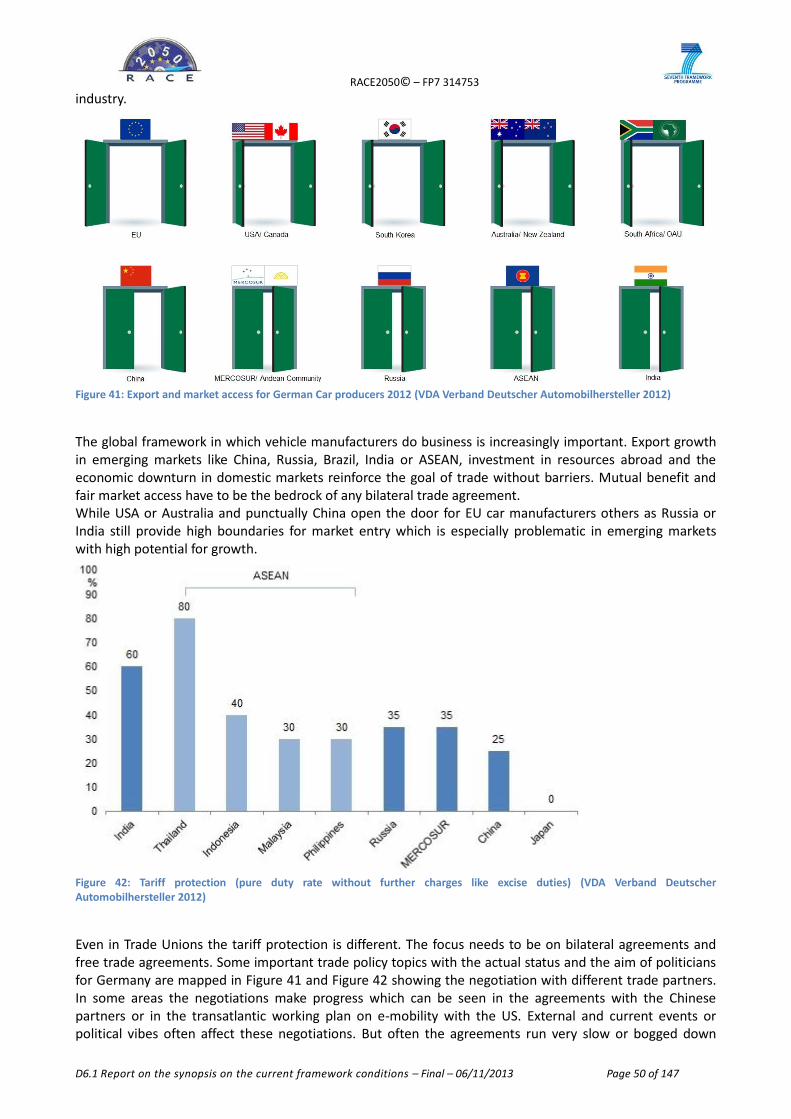
RACE2050© – FP7 314753
D6.1 Report on the synopsis on the current framework conditions – Final – 06/11/2013 Page 50 of 147
industry.
Figure 41: Export and market access for German Car producers 2012 (VDA Verband Deutscher Automobilhersteller 2012)
The global framework in which vehicle manufacturers do business is increasingly important. Export growth in emerging markets like China, Russia, Brazil, India or ASEAN, investment in resources abroad and the economic downturn in domestic markets reinforce the goal of trade without barriers. Mutual benefit and fair market access have to be the bedrock of any bilateral trade agreement. While USA or Australia and punctually China open the door for EU car manufacturers others as Russia or India still provide high boundaries for market entry which is especially problematic in emerging markets with high potential for growth.
Figure 42: Tariff protection (pure duty rate without further charges like excise duties) (VDA Verband Deutscher Automobilhersteller 2012)
Even in Trade Unions the tariff protection is different. The focus needs to be on bilateral agreements and free trade agreements. Some important trade policy topics with the actual status and the aim of politicians for Germany are mapped in Figure 41 and Figure 42 showing the negotiation with different trade partners. In some areas the negotiations make progress which can be seen in the agreements with the Chinese partners or in the transatlantic working plan on e-mobility with the US. External and current events or political vibes often affect these negotiations. But often the agreements run very slow or bogged down
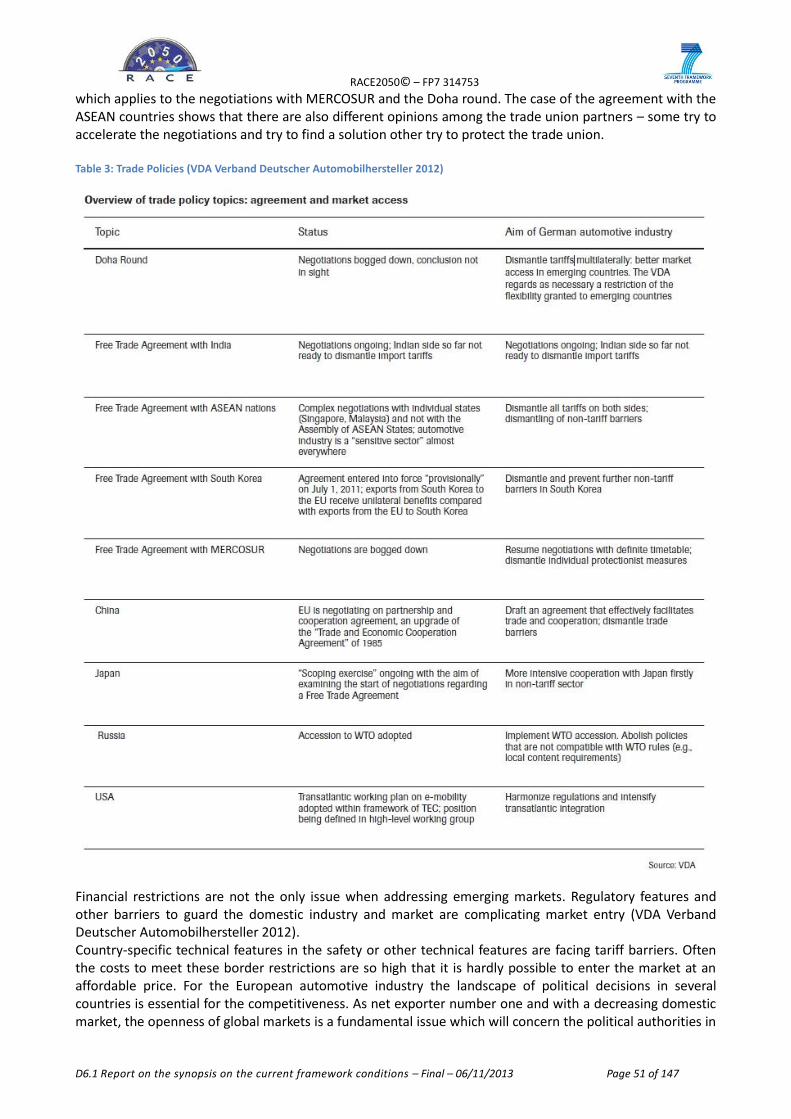
RACE2050© – FP7 314753
D6.1 Report on the synopsis on the current framework conditions – Final – 06/11/2013 Page 51 of 147
which applies to the negotiations with MERCOSUR and the Doha round. The case of the agreement with the ASEAN countries shows that there are also different opinions among the trade union partners – some try to accelerate the negotiations and try to find a solution other try to protect the trade union. Table 3: Trade Policies (VDA Verband Deutscher Automobilhersteller 2012)
Financial restrictions are not the only issue when addressing emerging markets. Regulatory features and other barriers to guard the domestic industry and market are complicating market entry (VDA Verband Deutscher Automobilhersteller 2012). Country-specific technical features in the safety or other technical features are facing tariff barriers. Often the costs to meet these border restrictions are so high that it is hardly possible to enter the market at an affordable price. For the European automotive industry the landscape of political decisions in several countries is essential for the competitiveness. As net exporter number one and with a decreasing domestic market, the openness of global markets is a fundamental issue which will concern the political authorities in
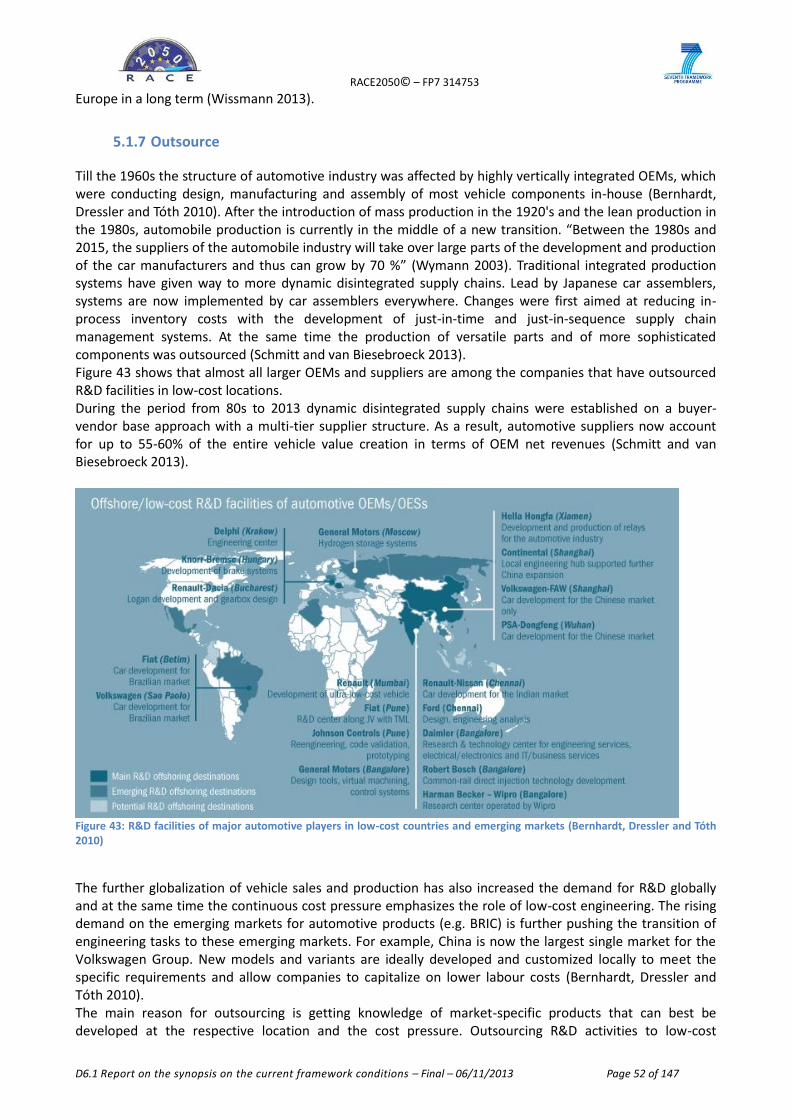
RACE2050© – FP7 314753
D6.1 Report on the synopsis on the current framework conditions – Final – 06/11/2013 Page 52 of 147
Europe in a long term (Wissmann 2013).
5.1.7 Outsource
Till the 1960s the structure of automotive industry was affected by highly vertically integrated OEMs, which were conducting design, manufacturing and assembly of most vehicle components in-house (Bernhardt, Dressler and Tóth 2010). After the introduction of mass production in the 1920's and the lean production in the 1980s, automobile production is currently in the middle of a new transition. “Between the 1980s and 2015, the suppliers of the automobile industry will take over large parts of the development and production of the car manufacturers and thus can grow by 70 %” (Wymann 2003). Traditional integrated production systems have given way to more dynamic disintegrated supply chains. Lead by Japanese car assemblers, systems are now implemented by car assemblers everywhere. Changes were first aimed at reducing in-process inventory costs with the development of just-in-time and just-in-sequence supply chain management systems. At the same time the production of versatile parts and of more sophisticated components was outsourced (Schmitt and van Biesebroeck 2013). Figure 43 shows that almost all larger OEMs and suppliers are among the companies that have outsourced R&D facilities in low-cost locations. During the period from 80s to 2013 dynamic disintegrated supply chains were established on a buyer-vendor base approach with a multi-tier supplier structure. As a result, automotive suppliers now account for up to 55-60% of the entire vehicle value creation in terms of OEM net revenues (Schmitt and van Biesebroeck 2013).
Figure 43: R&D facilities of major automotive players in low-cost countries and emerging markets (Bernhardt, Dressler and Tóth 2010)
The further globalization of vehicle sales and production has also increased the demand for R&D globally and at the same time the continuous cost pressure emphasizes the role of low-cost engineering. The rising demand on the emerging markets for automotive products (e.g. BRIC) is further pushing the transition of engineering tasks to these emerging markets. For example, China is now the largest single market for the Volkswagen Group. New models and variants are ideally developed and customized locally to meet the specific requirements and allow companies to capitalize on lower labour costs (Bernhardt, Dressler and Tóth 2010). The main reason for outsourcing is getting knowledge of market-specific products that can best be developed at the respective location and the cost pressure. Outsourcing R&D activities to low-cost
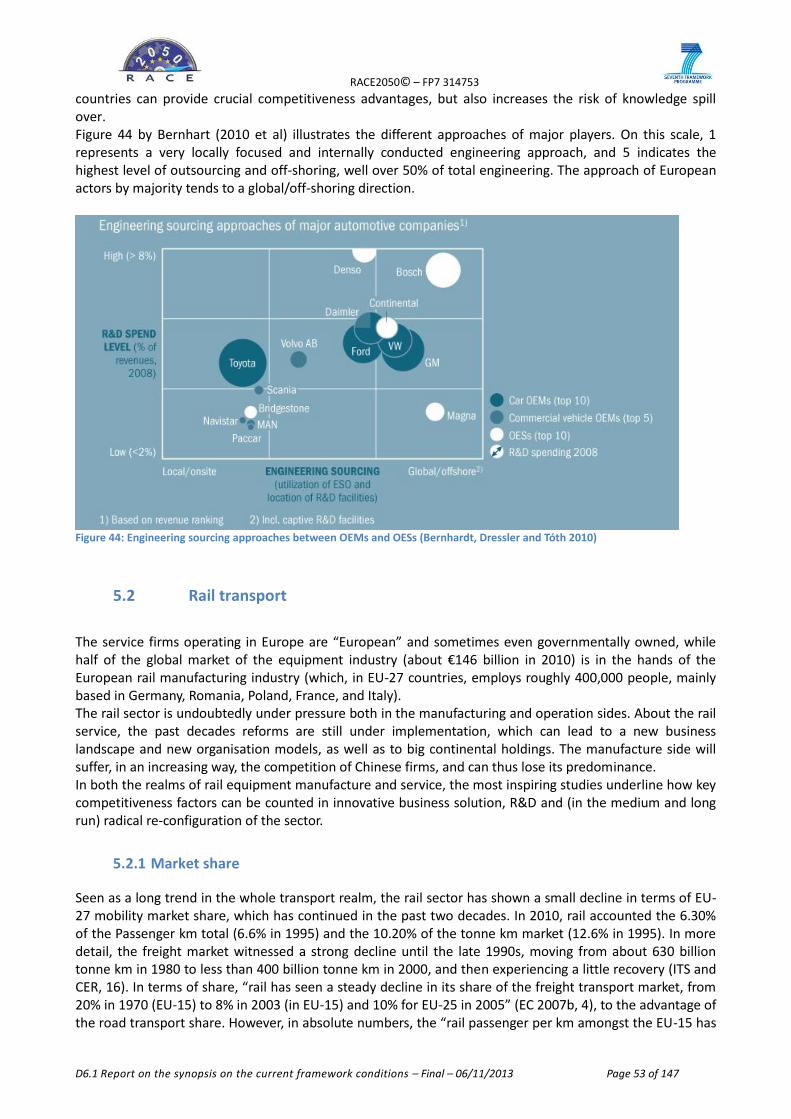
RACE2050© – FP7 314753
D6.1 Report on the synopsis on the current framework conditions – Final – 06/11/2013 Page 53 of 147
countries can provide crucial competitiveness advantages, but also increases the risk of knowledge spill over. Figure 44 by Bernhart (2010 et al) illustrates the different approaches of major players. On this scale, 1 represents a very locally focused and internally conducted engineering approach, and 5 indicates the highest level of outsourcing and off-shoring, well over 50% of total engineering. The approach of European actors by majority tends to a global/off-shoring direction.
Figure 44: Engineering sourcing approaches between OEMs and OESs (Bernhardt, Dressler and Tóth 2010)
5.2 Rail transport
The service firms operating in Europe are “European” and sometimes even governmentally owned, while half of the global market of the equipment industry (about €146 billion in 2010) is in the hands of the European rail manufacturing industry (which, in EU-27 countries, employs roughly 400,000 people, mainly based in Germany, Romania, Poland, France, and Italy). The rail sector is undoubtedly under pressure both in the manufacturing and operation sides. About the rail service, the past decades reforms are still under implementation, which can lead to a new business landscape and new organisation models, as well as to big continental holdings. The manufacture side will suffer, in an increasing way, the competition of Chinese firms, and can thus lose its predominance. In both the realms of rail equipment manufacture and service, the most inspiring studies underline how key competitiveness factors can be counted in innovative business solution, R&D and (in the medium and long run) radical re-configuration of the sector.
5.2.1 Market share
Seen as a long trend in the whole transport realm, the rail sector has shown a small decline in terms of EU-27 mobility market share, which has continued in the past two decades. In 2010, rail accounted the 6.30% of the Passenger km total (6.6% in 1995) and the 10.20% of the tonne km market (12.6% in 1995). In more detail, the freight market witnessed a strong decline until the late 1990s, moving from about 630 billion tonne km in 1980 to less than 400 billion tonne km in 2000, and then experiencing a little recovery (ITS and CER, 16). In terms of share, “rail has seen a steady decline in its share of the freight transport market, from 20% in 1970 (EU-15) to 8% in 2003 (in EU-15) and 10% for EU-25 in 2005” (EC 2007b, 4), to the advantage of the road transport share. However, in absolute numbers, the “rail passenger per km amongst the EU-15 has
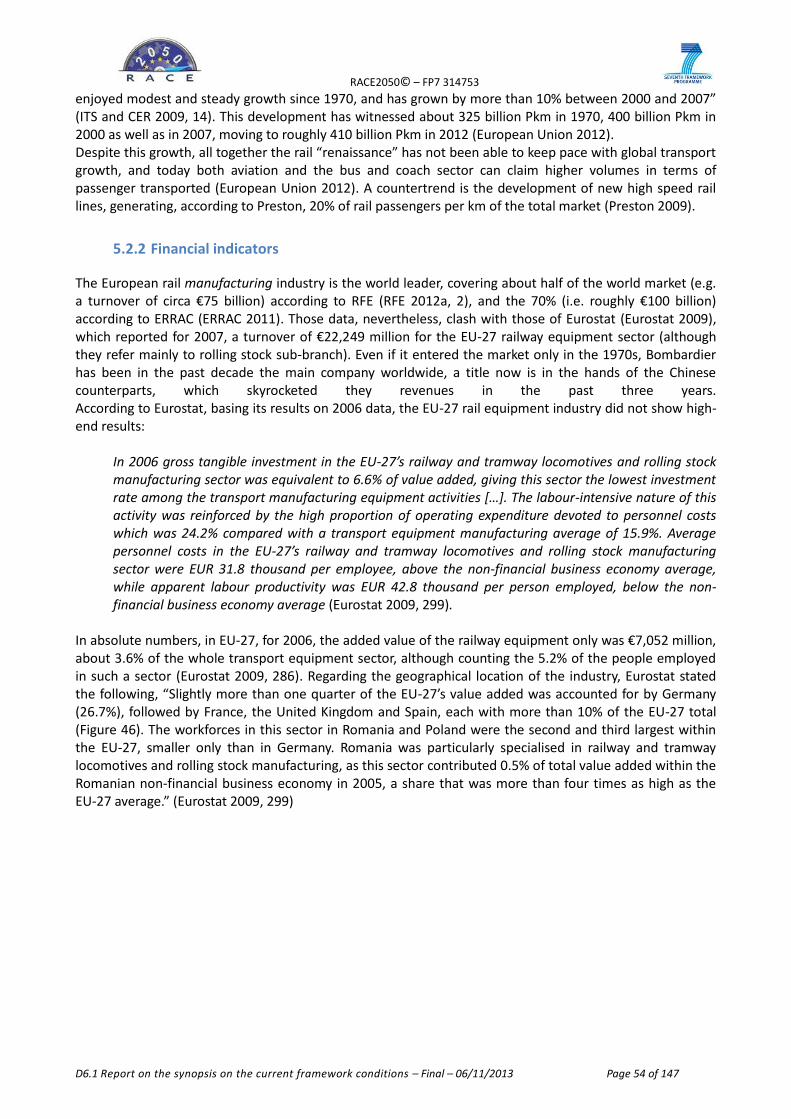
RACE2050© – FP7 314753
D6.1 Report on the synopsis on the current framework conditions – Final – 06/11/2013 Page 54 of 147
enjoyed modest and steady growth since 1970, and has grown by more than 10% between 2000 and 2007” (ITS and CER 2009, 14). This development has witnessed about 325 billion Pkm in 1970, 400 billion Pkm in 2000 as well as in 2007, moving to roughly 410 billion Pkm in 2012 (European Union 2012). Despite this growth, all together the rail “renaissance” has not been able to keep pace with global transport growth, and today both aviation and the bus and coach sector can claim higher volumes in terms of passenger transported (European Union 2012). A countertrend is the development of new high speed rail lines, generating, according to Preston, 20% of rail passengers per km of the total market (Preston 2009).
5.2.2 Financial indicators
The European rail manufacturing industry is the world leader, covering about half of the world market (e.g. a turnover of circa €75 billion) according to RFE (RFE 2012a, 2), and the 70% (i.e. roughly €100 billion) according to ERRAC (ERRAC 2011). Those data, nevertheless, clash with those of Eurostat (Eurostat 2009), which reported for 2007, a turnover of €22,249 million for the EU-27 railway equipment sector (although they refer mainly to rolling stock sub-branch). Even if it entered the market only in the 1970s, Bombardier has been in the past decade the main company worldwide, a title now is in the hands of the Chinese counterparts, which skyrocketed they revenues in the past three years. According to Eurostat, basing its results on 2006 data, the EU-27 rail equipment industry did not show high-end results:
In 2006 gross tangible investment in the EU-27’s railway and tramway locomotives and rolling stock manufacturing sector was equivalent to 6.6% of value added, giving this sector the lowest investment rate among the transport manufacturing equipment activities […]. The labour-intensive nature of this activity was reinforced by the high proportion of operating expenditure devoted to personnel costs which was 24.2% compared with a transport equipment manufacturing average of 15.9%. Average personnel costs in the EU-27’s railway and tramway locomotives and rolling stock manufacturing sector were EUR 31.8 thousand per employee, above the non-financial business economy average, while apparent labour productivity was EUR 42.8 thousand per person employed, below the non-financial business economy average (Eurostat 2009, 299).
In absolute numbers, in EU-27, for 2006, the added value of the railway equipment only was €7,052 million, about 3.6% of the whole transport equipment sector, although counting the 5.2% of the people employed in such a sector (Eurostat 2009, 286). Regarding the geographical location of the industry, Eurostat stated the following, “Slightly more than one quarter of the EU-27’s value added was accounted for by Germany (26.7%), followed by France, the United Kingdom and Spain, each with more than 10% of the EU-27 total (Figure 46). The workforces in this sector in Romania and Poland were the second and third largest within the EU-27, smaller only than in Germany. Romania was particularly specialised in railway and tramway locomotives and rolling stock manufacturing, as this sector contributed 0.5% of total value added within the Romanian non-financial business economy in 2005, a share that was more than four times as high as the EU-27 average.” (Eurostat 2009, 299)
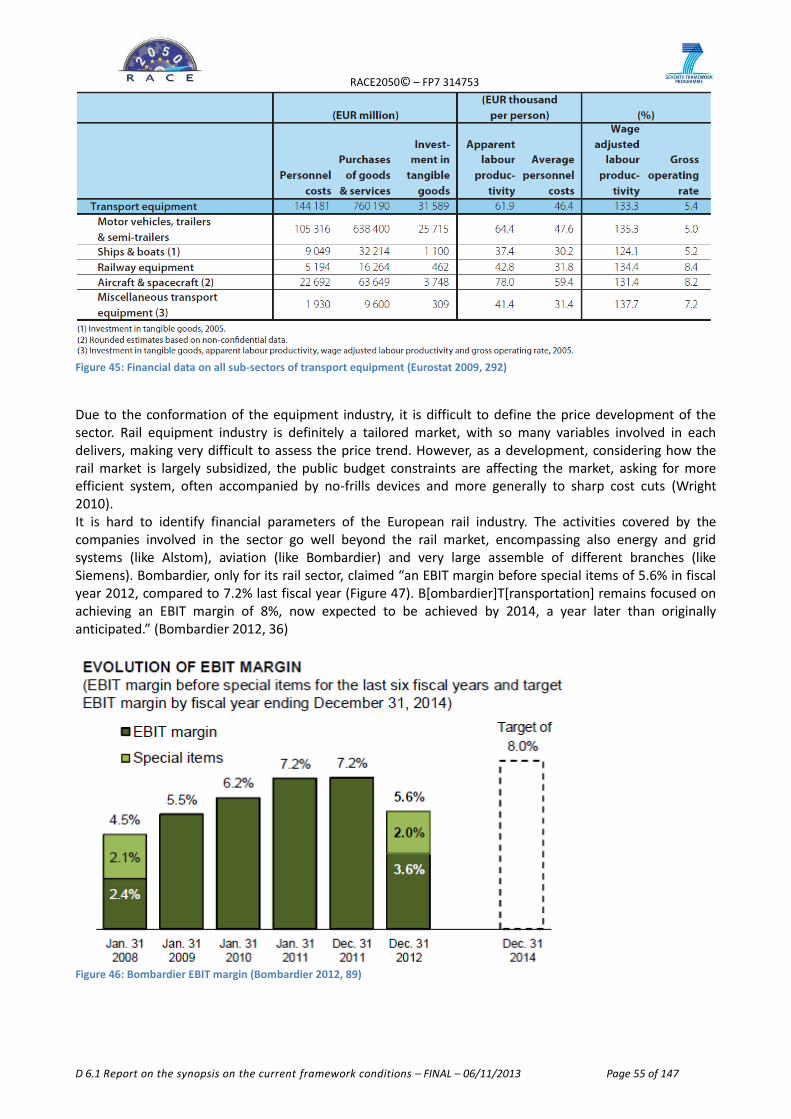
RACE2050© – FP7 314753
D 6.1 Report on the synopsis on the current framework conditions – FINAL – 06/11/2013 Page 55 of 147
Figure 45: Financial data on all sub-sectors of transport equipment (Eurostat 2009, 292)
Due to the conformation of the equipment industry, it is difficult to define the price development of the sector. Rail equipment industry is definitely a tailored market, with so many variables involved in each delivers, making very difficult to assess the price trend. However, as a development, considering how the rail market is largely subsidized, the public budget constraints are affecting the market, asking for more efficient system, often accompanied by no-frills devices and more generally to sharp cost cuts (Wright 2010).It is hard to identify financial parameters of the European rail industry. The activities covered by the companies involved in the sector go well beyond the rail market, encompassing also energy and grid systems (like Alstom), aviation (like Bombardier) and very large assemble of different branches (like Siemens). Bombardier, only for its rail sector, claimed “an EBIT margin before special items of 5.6% in fiscal year 2012, compared to 7.2% last fiscal year (Figure 47). B[ombardier]T[ransportation] remains focused on achieving an EBIT margin of 8%, now expected to be achieved by 2014, a year later than originally anticipated.” (Bombardier 2012, 36)
Figure 46: Bombardier EBIT margin (Bombardier 2012, 89)
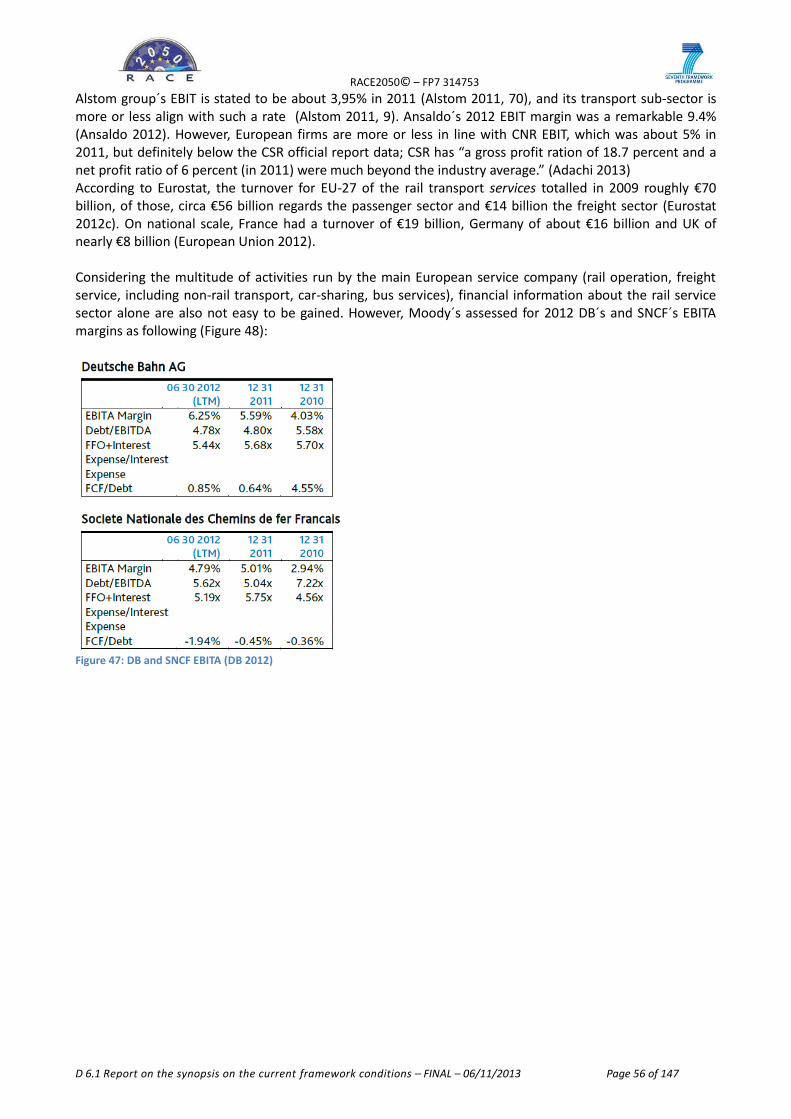
RACE2050© – FP7 314753
D 6.1 Report on the synopsis on the current framework conditions – FINAL – 06/11/2013 Page 56 of 147
Alstom group´s EBIT is stated to be about 3,95% in 2011 (Alstom 2011, 70), and its transport sub-sector is more or less align with such a rate (Alstom 2011, 9). Ansaldo´s 2012 EBIT margin was a remarkable 9.4% (Ansaldo 2012). However, European firms are more or less in line with CNR EBIT, which was about 5% in 2011, but definitely below the CSR official report data; CSR has “a gross profit ration of 18.7 percent and a net profit ratio of 6 percent (in 2011) were much beyond the industry average.” (Adachi 2013) According to Eurostat, the turnover for EU-27 of the rail transport services totalled in 2009 roughly €70 billion, of those, circa €56 billion regards the passenger sector and €14 billion the freight sector (Eurostat 2012c). On national scale, France had a turnover of €19 billion, Germany of about €16 billion and UK of nearly €8 billion (European Union 2012). Considering the multitude of activities run by the main European service company (rail operation, freight service, including non-rail transport, car-sharing, bus services), financial information about the rail service sector alone are also not easy to be gained. However, Moody´s assessed for 2012 DB´s and SNCF´s EBITA margins as following (Figure 48):
Figure 47: DB and SNCF EBITA (DB 2012)
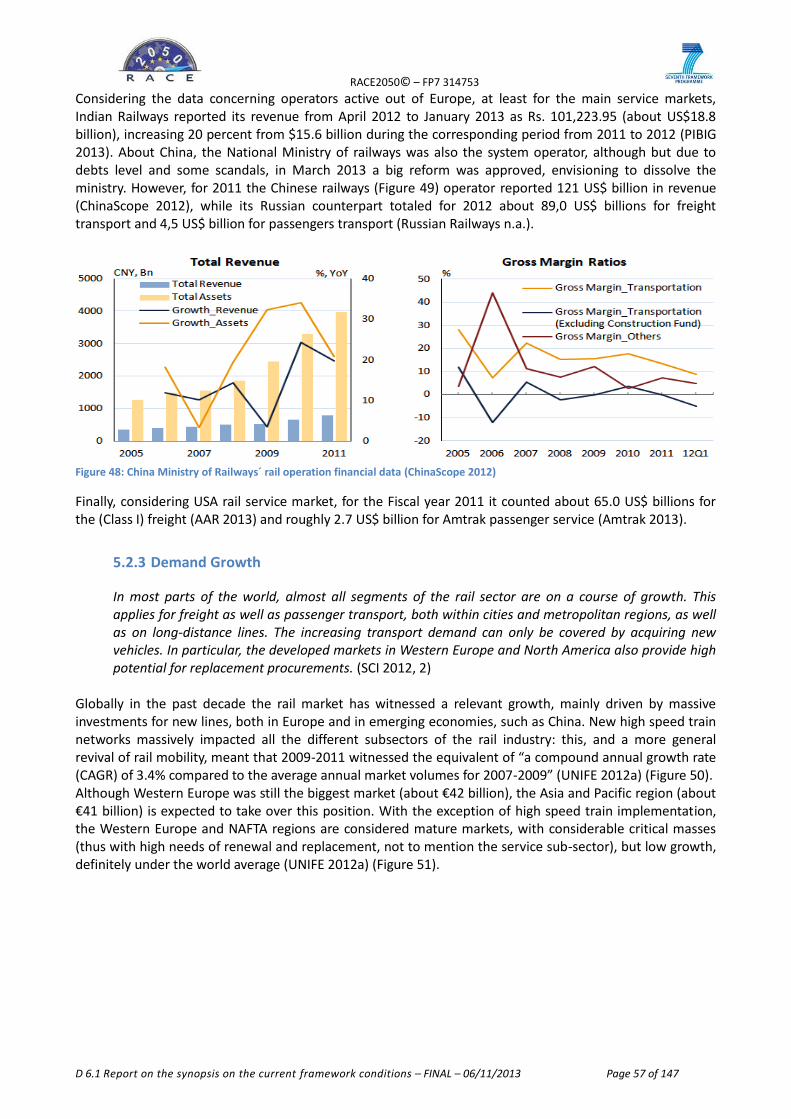
RACE2050© – FP7 314753
D 6.1 Report on the synopsis on the current framework conditions – FINAL – 06/11/2013 Page 57 of 147
Considering the data concerning operators active out of Europe, at least for the main service markets, Indian Railways reported its revenue from April 2012 to January 2013 as Rs. 101,223.95 (about US$18.8 billion), increasing 20 percent from $15.6 billion during the corresponding period from 2011 to 2012 (PIBIG 2013). About China, the National Ministry of railways was also the system operator, although but due to debts level and some scandals, in March 2013 a big reform was approved, envisioning to dissolve the ministry. However, for 2011 the Chinese railways (Figure 49) operator reported 121 US$ billion in revenue (ChinaScope 2012), while its Russian counterpart totaled for 2012 about 89,0 US$ billions for freight transport and 4,5 US$ billion for passengers transport (Russian Railways n.a.).
Figure 48: China Ministry of Railways´ rail operation financial data (ChinaScope 2012)
Finally, considering USA rail service market, for the Fiscal year 2011 it counted about 65.0 US$ billions for the (Class I) freight (AAR 2013) and roughly 2.7 US$ billion for Amtrak passenger service (Amtrak 2013).
5.2.3 Demand Growth
In most parts of the world, almost all segments of the rail sector are on a course of growth. This applies for freight as well as passenger transport, both within cities and metropolitan regions, as well as on long-distance lines. The increasing transport demand can only be covered by acquiring new vehicles. In particular, the developed markets in Western Europe and North America also provide high potential for replacement procurements. (SCI 2012, 2)
Globally in the past decade the rail market has witnessed a relevant growth, mainly driven by massive investments for new lines, both in Europe and in emerging economies, such as China. New high speed train networks massively impacted all the different subsectors of the rail industry: this, and a more general revival of rail mobility, meant that 2009-2011 witnessed the equivalent of “a compound annual growth rate (CAGR) of 3.4% compared to the average annual market volumes for 2007-2009” (UNIFE 2012a) (Figure 50). Although Western Europe was still the biggest market (about €42 billion), the Asia and Pacific region (about €41 billion) is expected to take over this position. With the exception of high speed train implementation, the Western Europe and NAFTA regions are considered mature markets, with considerable critical masses (thus with high needs of renewal and replacement, not to mention the service sub-sector), but low growth, definitely under the world average (UNIFE 2012a) (Figure 51).
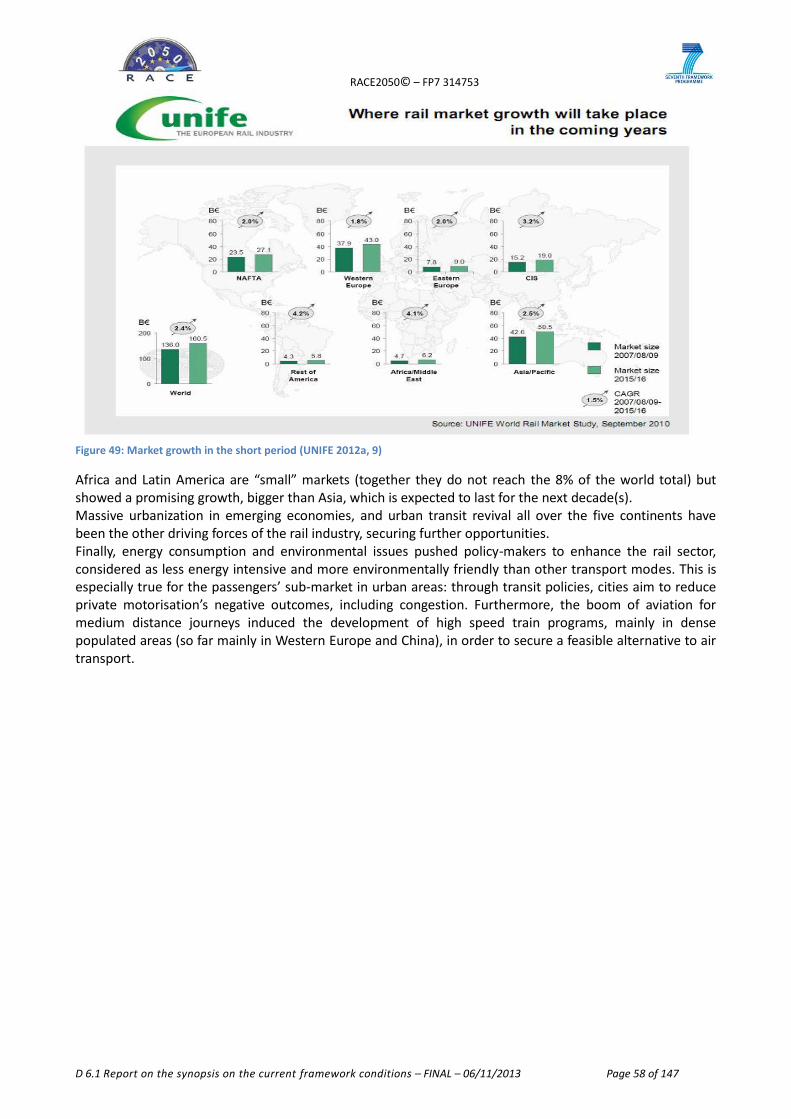
RACE2050© – FP7 314753
D 6.1 Report on the synopsis on the current framework conditions – FINAL – 06/11/2013 Page 58 of 147
Figure 49: Market growth in the short period (UNIFE 2012a, 9)
Africa and Latin America are “small” markets (together they do not reach the 8% of the world total) but showed a promising growth, bigger than Asia, which is expected to last for the next decade(s). Massive urbanization in emerging economies, and urban transit revival all over the five continents have been the other driving forces of the rail industry, securing further opportunities. Finally, energy consumption and environmental issues pushed policy-makers to enhance the rail sector, considered as less energy intensive and more environmentally friendly than other transport modes. This is especially true for the passengers’ sub-market in urban areas: through transit policies, cities aim to reduce private motorisation’s negative outcomes, including congestion. Furthermore, the boom of aviation for medium distance journeys induced the development of high speed train programs, mainly in dense populated areas (so far mainly in Western Europe and China), in order to secure a feasible alternative to air transport.
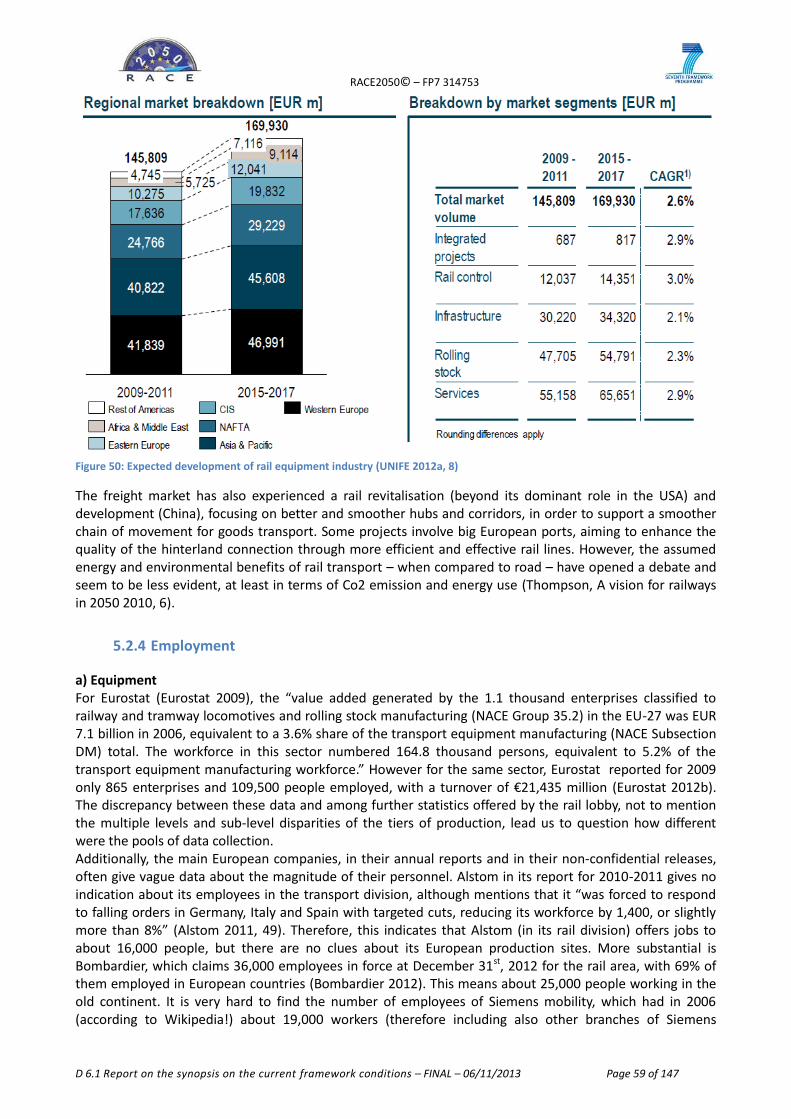
RACE2050© – FP7 314753
D 6.1 Report on the synopsis on the current framework conditions – FINAL – 06/11/2013 Page 59 of 147
Figure 50: Expected development of rail equipment industry (UNIFE 2012a, 8)
The freight market has also experienced a rail revitalisation (beyond its dominant role in the USA) and development (China), focusing on better and smoother hubs and corridors, in order to support a smoother chain of movement for goods transport. Some projects involve big European ports, aiming to enhance the quality of the hinterland connection through more efficient and effective rail lines. However, the assumed energy and environmental benefits of rail transport – when compared to road – have opened a debate and seem to be less evident, at least in terms of Co2 emission and energy use (Thompson, A vision for railways in 2050 2010, 6).
5.2.4 Employment
a) Equipment For Eurostat (Eurostat 2009), the “value added generated by the 1.1 thousand enterprises classified to railway and tramway locomotives and rolling stock manufacturing (NACE Group 35.2) in the EU-27 was EUR 7.1 billion in 2006, equivalent to a 3.6% share of the transport equipment manufacturing (NACE Subsection DM) total. The workforce in this sector numbered 164.8 thousand persons, equivalent to 5.2% of the transport equipment manufacturing workforce.” However for the same sector, Eurostat reported for 2009 only 865 enterprises and 109,500 people employed, with a turnover of €21,435 million (Eurostat 2012b). The discrepancy between these data and among further statistics offered by the rail lobby, not to mention the multiple levels and sub-level disparities of the tiers of production, lead us to question how different were the pools of data collection. Additionally, the main European companies, in their annual reports and in their non-confidential releases, often give vague data about the magnitude of their personnel. Alstom in its report for 2010-2011 gives no indication about its employees in the transport division, although mentions that it “was forced to respond to falling orders in Germany, Italy and Spain with targeted cuts, reducing its workforce by 1,400, or slightly more than 8%” (Alstom 2011, 49). Therefore, this indicates that Alstom (in its rail division) offers jobs to about 16,000 people, but there are no clues about its European production sites. More substantial is Bombardier, which claims 36,000 employees in force at December 31st, 2012 for the rail area, with 69% of them employed in European countries (Bombardier 2012). This means about 25,000 people working in the old continent. It is very hard to find the number of employees of Siemens mobility, which had in 2006 (according to Wikipedia!) about 19,000 workers (therefore including also other branches of Siemens
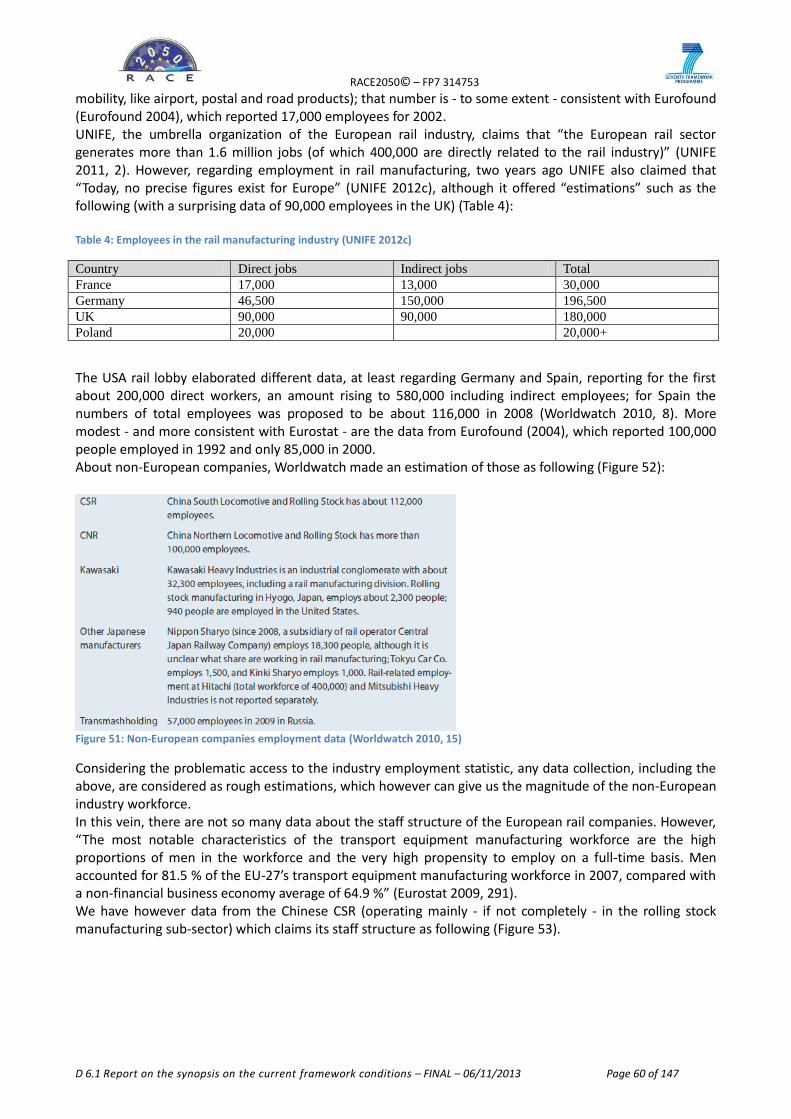
RACE2050© – FP7 314753
D 6.1 Report on the synopsis on the current framework conditions – FINAL – 06/11/2013 Page 60 of 147
mobility, like airport, postal and road products); that number is - to some extent - consistent with Eurofound (Eurofound 2004), which reported 17,000 employees for 2002. UNIFE, the umbrella organization of the European rail industry, claims that “the European rail sector generates more than 1.6 million jobs (of which 400,000 are directly related to the rail industry)” (UNIFE 2011, 2). However, regarding employment in rail manufacturing, two years ago UNIFE also claimed that “Today, no precise figures exist for Europe” (UNIFE 2012c), although it offered “estimations” such as the following (with a surprising data of 90,000 employees in the UK) (Table 4): Table 4: Employees in the rail manufacturing industry (UNIFE 2012c)
Country Direct jobs Indirect jobs Total
France 17,000 13,000 30,000
Germany 46,500 150,000 196,500
UK 90,000 90,000 180,000
Poland 20,000 20,000+
The USA rail lobby elaborated different data, at least regarding Germany and Spain, reporting for the first about 200,000 direct workers, an amount rising to 580,000 including indirect employees; for Spain the numbers of total employees was proposed to be about 116,000 in 2008 (Worldwatch 2010, 8). More modest - and more consistent with Eurostat - are the data from Eurofound (2004), which reported 100,000 people employed in 1992 and only 85,000 in 2000. About non-European companies, Worldwatch made an estimation of those as following (Figure 52):
Figure 51: Non-European companies employment data (Worldwatch 2010, 15)
Considering the problematic access to the industry employment statistic, any data collection, including the above, are considered as rough estimations, which however can give us the magnitude of the non-European industry workforce. In this vein, there are not so many data about the staff structure of the European rail companies. However, “The most notable characteristics of the transport equipment manufacturing workforce are the high proportions of men in the workforce and the very high propensity to employ on a full-time basis. Men accounted for 81.5 % of the EU-27’s transport equipment manufacturing workforce in 2007, compared with a non-financial business economy average of 64.9 %” (Eurostat 2009, 291). We have however data from the Chinese CSR (operating mainly - if not completely - in the rolling stock manufacturing sub-sector) which claims its staff structure as following (Figure 53).
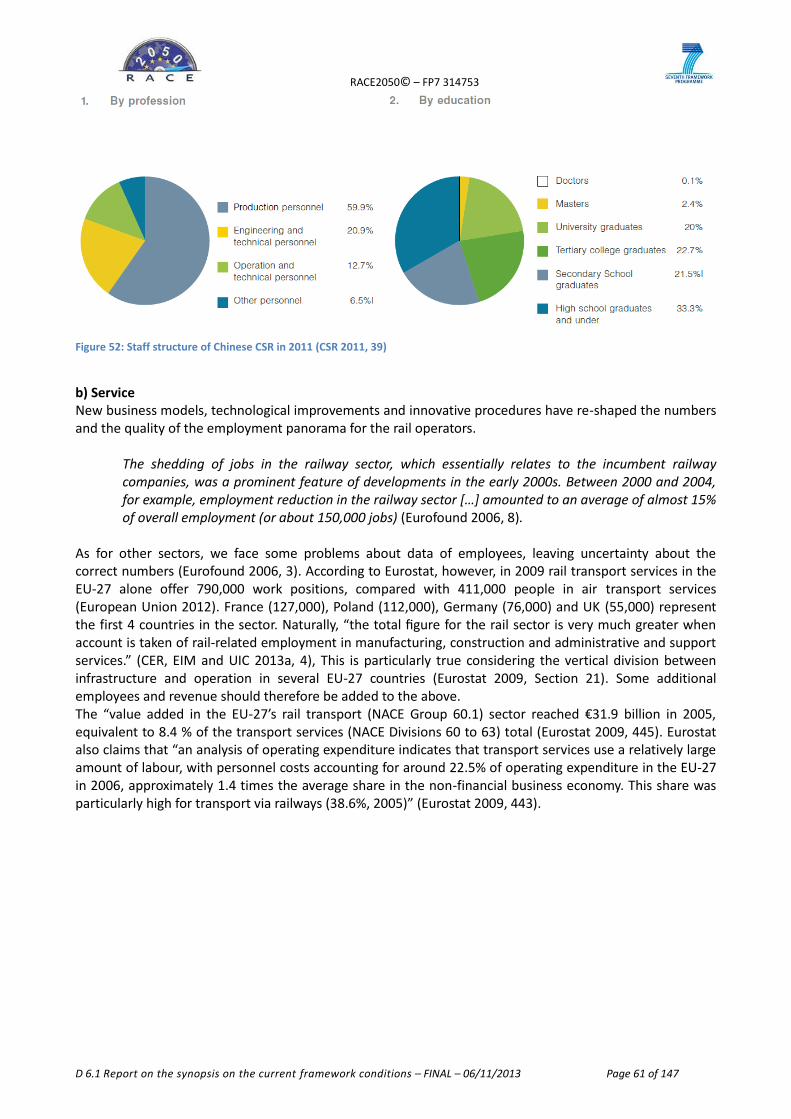
RACE2050© – FP7 314753
D 6.1 Report on the synopsis on the current framework conditions – FINAL – 06/11/2013 Page 61 of 147
Figure 52: Staff structure of Chinese CSR in 2011 (CSR 2011, 39)
b) ServiceNew business models, technological improvements and innovative procedures have re-shaped the numbers and the quality of the employment panorama for the rail operators.
The shedding of jobs in the railway sector, which essentially relates to the incumbent railway companies, was a prominent feature of developments in the early 2000s. Between 2000 and 2004, for example, employment reduction in the railway sector […] amounted to an average of almost 15% of overall employment (or about 150,000 jobs) (Eurofound 2006, 8).
As for other sectors, we face some problems about data of employees, leaving uncertainty about the correct numbers (Eurofound 2006, 3). According to Eurostat, however, in 2009 rail transport services in the EU-27 alone offer 790,000 work positions, compared with 411,000 people in air transport services (European Union 2012). France (127,000), Poland (112,000), Germany (76,000) and UK (55,000) represent the first 4 countries in the sector. Naturally, “the total figure for the rail sector is very much greater when account is taken of rail-related employment in manufacturing, construction and administrative and support services.” (CER, EIM and UIC 2013a, 4), This is particularly true considering the vertical division between infrastructure and operation in several EU-27 countries (Eurostat 2009, Section 21). Some additional employees and revenue should therefore be added to the above. The “value added in the EU-27’s rail transport (NACE Group 60.1) sector reached €31.9 billion in 2005, equivalent to 8.4 % of the transport services (NACE Divisions 60 to 63) total (Eurostat 2009, 445). Eurostat also claims that “an analysis of operating expenditure indicates that transport services use a relatively large amount of labour, with personnel costs accounting for around 22.5% of operating expenditure in the EU-27 in 2006, approximately 1.4 times the average share in the non-financial business economy. This share was particularly high for transport via railways (38.6%, 2005)” (Eurostat 2009, 443).
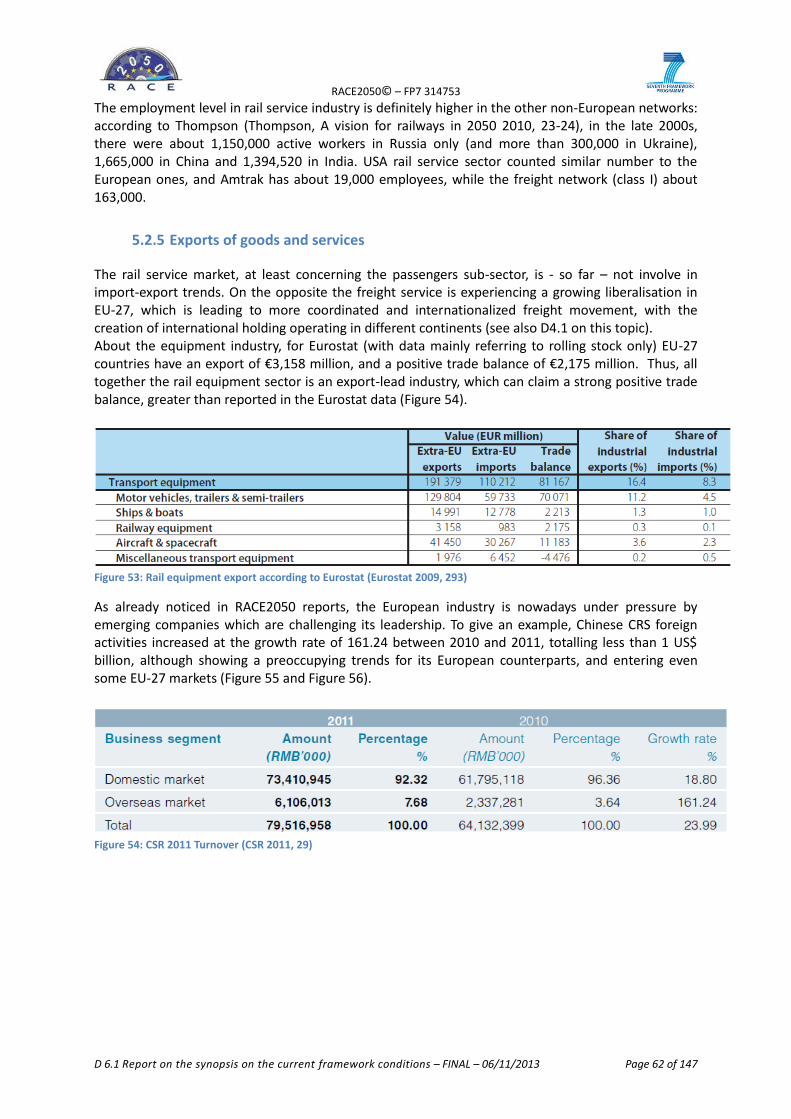
RACE2050© – FP7 314753
D 6.1 Report on the synopsis on the current framework conditions – FINAL – 06/11/2013 Page 62 of 147
The employment level in rail service industry is definitely higher in the other non-European networks: according to Thompson (Thompson, A vision for railways in 2050 2010, 23-24), in the late 2000s, there were about 1,150,000 active workers in Russia only (and more than 300,000 in Ukraine), 1,665,000 in China and 1,394,520 in India. USA rail service sector counted similar number to the European ones, and Amtrak has about 19,000 employees, while the freight network (class I) about 163,000.
5.2.5 Exports of goods and services
The rail service market, at least concerning the passengers sub-sector, is - so far – not involve in import-export trends. On the opposite the freight service is experiencing a growing liberalisation in EU-27, which is leading to more coordinated and internationalized freight movement, with the creation of international holding operating in different continents (see also D4.1 on this topic). About the equipment industry, for Eurostat (with data mainly referring to rolling stock only) EU-27 countries have an export of €3,158 million, and a positive trade balance of €2,175 million. Thus, all together the rail equipment sector is an export-lead industry, which can claim a strong positive trade balance, greater than reported in the Eurostat data (Figure 54).
Figure 53: Rail equipment export according to Eurostat (Eurostat 2009, 293)
As already noticed in RACE2050 reports, the European industry is nowadays under pressure by emerging companies which are challenging its leadership. To give an example, Chinese CRS foreign activities increased at the growth rate of 161.24 between 2010 and 2011, totalling less than 1 US$ billion, although showing a preoccupying trends for its European counterparts, and entering even some EU-27 markets (Figure 55 and Figure 56).
Figure 54: CSR 2011 Turnover (CSR 2011, 29)
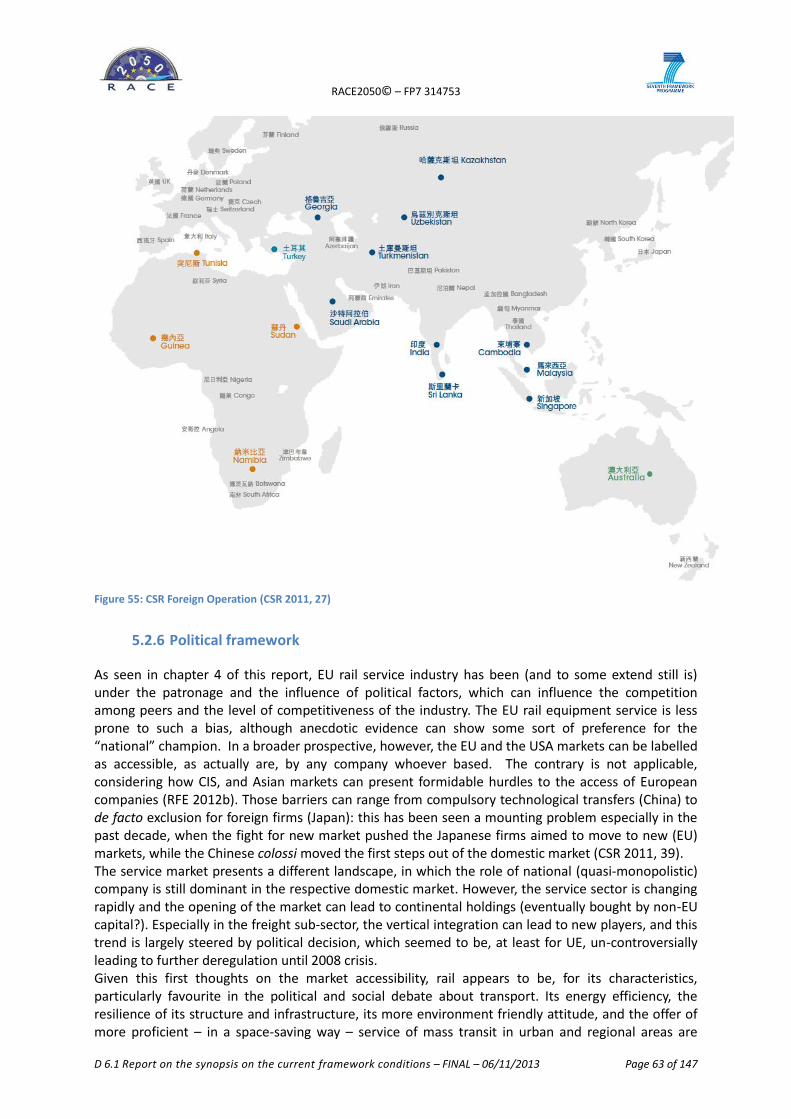
RACE2050© – FP7 314753
D 6.1 Report on the synopsis on the current framework conditions – FINAL – 06/11/2013 Page 63 of 147
Figure 55: CSR Foreign Operation (CSR 2011, 27)
5.2.6 Political framework
As seen in chapter 4 of this report, EU rail service industry has been (and to some extend still is) under the patronage and the influence of political factors, which can influence the competition among peers and the level of competitiveness of the industry. The EU rail equipment service is less prone to such a bias, although anecdotic evidence can show some sort of preference for the “national” champion. In a broader prospective, however, the EU and the USA markets can be labelled as accessible, as actually are, by any company whoever based. The contrary is not applicable, considering how CIS, and Asian markets can present formidable hurdles to the access of European companies (RFE 2012b). Those barriers can range from compulsory technological transfers (China) to de facto exclusion for foreign firms (Japan): this has been seen a mounting problem especially in the past decade, when the fight for new market pushed the Japanese firms aimed to move to new (EU) markets, while the Chinese colossi moved the first steps out of the domestic market (CSR 2011, 39). The service market presents a different landscape, in which the role of national (quasi-monopolistic) company is still dominant in the respective domestic market. However, the service sector is changing rapidly and the opening of the market can lead to continental holdings (eventually bought by non-EU capital?). Especially in the freight sub-sector, the vertical integration can lead to new players, and this trend is largely steered by political decision, which seemed to be, at least for UE, un-controversially leading to further deregulation until 2008 crisis. Given this first thoughts on the market accessibility, rail appears to be, for its characteristics, particularly favourite in the political and social debate about transport. Its energy efficiency, the resilience of its structure and infrastructure, its more environment friendly attitude, and the offer of more proficient – in a space-saving way – service of mass transit in urban and regional areas are
RACE2050© – FP7 314753
D 6.1 Report on the synopsis on the current framework conditions – FINAL – 06/11/2013 Page 64 of 147
definitely in any political agenda inside and outside Europe (Worldwatch 2010). The rail freight transport witnesses a second youth too, again inside and outside Europe (Thompson, A vision for railways in 2050 2010). These trends have a large political support and a wide social acceptance, at least in the general debate.
5.2.7 Outsource
As reported in Chapter 4 of this report, rail equipment service, “most transport equipment manufacturing activities are structured on the basis of complex pyramidal relationships between major manufacturers and several tiers of component suppliers” (Eurostat 2009, 286). However, even top original equipment manufacturers (OEM) can be themselves feeder of other OEM: Bombardier is, for instance, a Talgo´s subcontractor in a Saudi Arabia contract (Bombardier 2012). Therefore the relation among the different industries is rather complex and outsourcing is a common everyday practice. As for the aviation sector, also rail equipment industry is aiming to Risk and Revenue Sharing Partners (RRSP), in order to achieve an improved risk management and to gain access to resources and technologies. Despite growing, the rail equipment market always shows volatilities and demand irregularities. This lead to over- or under-exploitation of resources, while the lack of coordination of EU industry is not just a matter of systems disparities and fragmentation, but it is a wider problem also in terms of (political-driven) market condition: “Cost competitive rolling stock and innovative and future proof vehicles European vehicle manufacturers face difficult home market conditions due to the irregularity of demand. The number of contracts placed is relatively small but the successful bidder then has a limited time available for delivering the vehicles. This process is not cost efficient for the supply industry or conducive to global competitiveness. (Amoore and Jaiswal 2012, 15). And, again as for the aviation and automotive industry, also rail equipment industry tends to diversify their production sites in many different countries. This was the outcome of three converging trends. 1. The acquisition of intra- and out-EU27 production sites was an outcome of the merging process, which was also motivated 2. by the legal requirement or “de facto” market advantages to have a factory in a given country, when it comes to choose a “national” champion; and 3. by the above and by the attempt to achieve a lower final cost of their products installing factories in economies with lower labour costs.
To map the field, UNIFE - already three years ago - evaluated the presence of EU rail industry´s production venues in emerging countries: to move the production abroad can be a winning model if “the product and the process are localized” oversee, claiming that “a very good example of localization efforts and success is the automotive industry in China” (UNIFE 2010, 101 Italics added).
5.3 Sea transport
The European maritime industry pursues its competitiveness through excellence, as its competitive advantage against other regional blocks stands majorly upon its ability to produce and service the most specialized, complex and high-tech vessels, like Naval vessels, Cruise ships, Dredgers and Offshore support vessels.
As already stated, the European shipbuilding industry faces tremendous competition from Asian export-oriented economies, and must deal with a set of challenges and opportunities that will shape its future, that range from access to finance and guarantee schemes for local ship building, fostering a skilled workforce, promoting safer and eco-friendly fleets, levelling the shipbuilding playing field and
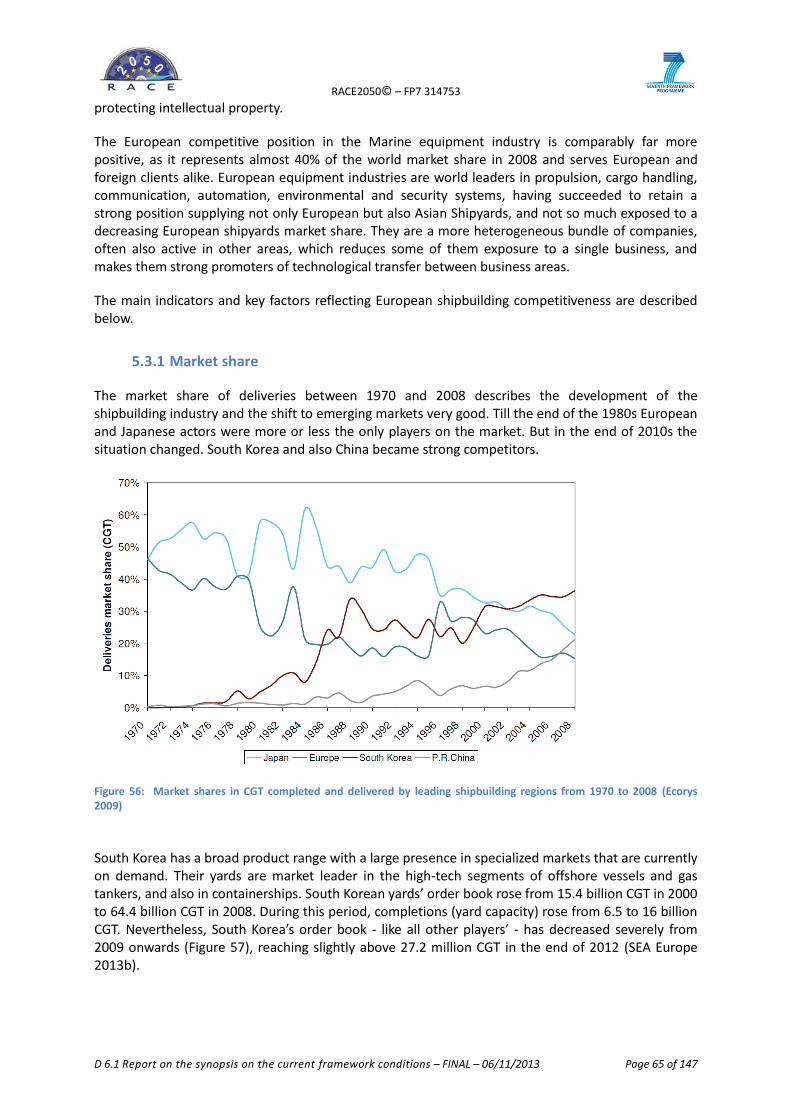
RACE2050© – FP7 314753
D 6.1 Report on the synopsis on the current framework conditions – FINAL – 06/11/2013 Page 65 of 147
protecting intellectual property.
The European competitive position in the Marine equipment industry is comparably far more positive, as it represents almost 40% of the world market share in 2008 and serves European and foreign clients alike. European equipment industries are world leaders in propulsion, cargo handling, communication, automation, environmental and security systems, having succeeded to retain a strong position supplying not only European but also Asian Shipyards, and not so much exposed to a decreasing European shipyards market share. They are a more heterogeneous bundle of companies, often also active in other areas, which reduces some of them exposure to a single business, and makes them strong promoters of technological transfer between business areas.
The main indicators and key factors reflecting European shipbuilding competitiveness are described below.
5.3.1 Market share
The market share of deliveries between 1970 and 2008 describes the development of the shipbuilding industry and the shift to emerging markets very good. Till the end of the 1980s European and Japanese actors were more or less the only players on the market. But in the end of 2010s the situation changed. South Korea and also China became strong competitors.
Figure 56: Market shares in CGT completed and delivered by leading shipbuilding regions from 1970 to 2008 (Ecorys 2009)
South Korea has a broad product range with a large presence in specialized markets that are currently on demand. Their yards are market leader in the high-tech segments of offshore vessels and gas tankers, and also in containerships. South Korean yards’ order book rose from 15.4 billion CGT in 2000 to 64.4 billion CGT in 2008. During this period, completions (yard capacity) rose from 6.5 to 16 billion CGT. Nevertheless, South Korea’s order book - like all other players’ - has decreased severely from 2009 onwards (Figure 57), reaching slightly above 27.2 million CGT in the end of 2012 (SEA Europe 2013b).
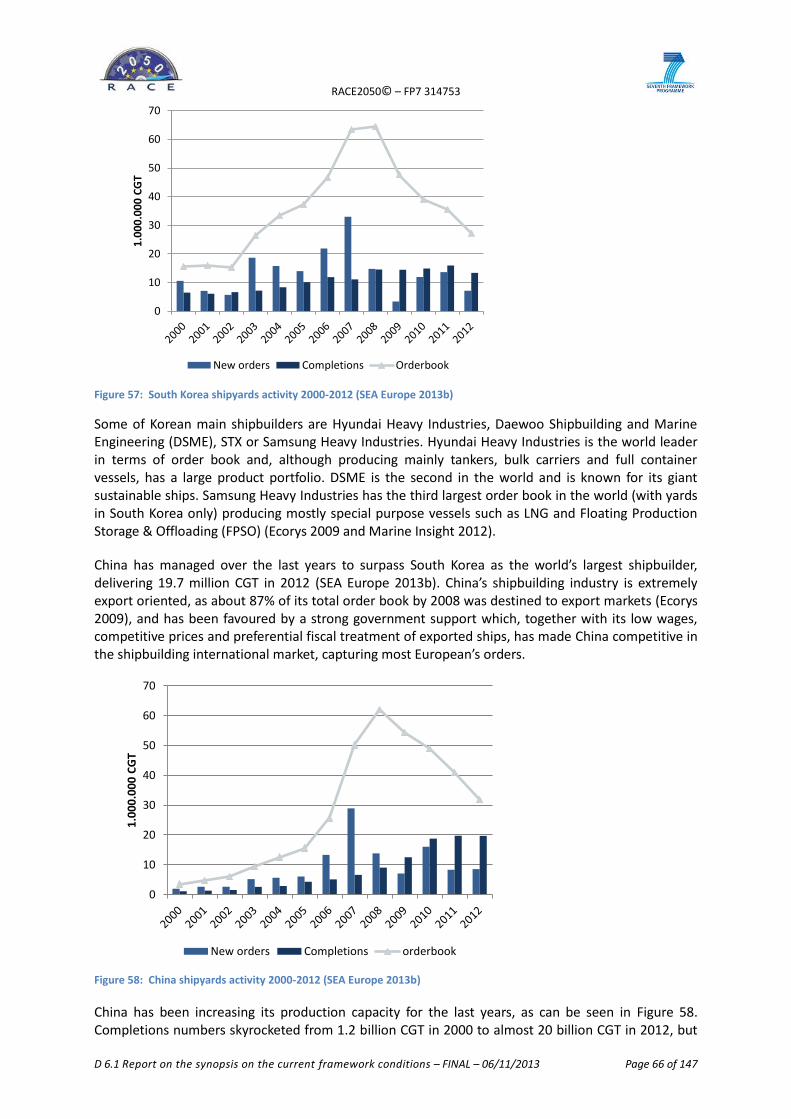
RACE2050© – FP7 314753
D 6.1 Report on the synopsis on the current framework conditions – FINAL – 06/11/2013 Page 66 of 147
Figure 57: South Korea shipyards activity 2000-2012 (SEA Europe 2013b)
Some of Korean main shipbuilders are Hyundai Heavy Industries, Daewoo Shipbuilding and Marine Engineering (DSME), STX or Samsung Heavy Industries. Hyundai Heavy Industries is the world leader in terms of order book and, although producing mainly tankers, bulk carriers and full container vessels, has a large product portfolio. DSME is the second in the world and is known for its giant sustainable ships. Samsung Heavy Industries has the third largest order book in the world (with yards in South Korea only) producing mostly special purpose vessels such as LNG and Floating Production Storage & Offloading (FPSO) (Ecorys 2009 and Marine Insight 2012).
China has managed over the last years to surpass South Korea as the world’s largest shipbuilder, delivering 19.7 million CGT in 2012 (SEA Europe 2013b). China’s shipbuilding industry is extremely export oriented, as about 87% of its total order book by 2008 was destined to export markets (Ecorys 2009), and has been favoured by a strong government support which, together with its low wages, competitive prices and preferential fiscal treatment of exported ships, has made China competitive in the shipbuilding international market, capturing most European’s orders.
Figure 58: China shipyards activity 2000-2012 (SEA Europe 2013b)
China has been increasing its production capacity for the last years, as can be seen in Figure 58. Completions numbers skyrocketed from 1.2 billion CGT in 2000 to almost 20 billion CGT in 2012, but
0
10
20
30
40
50
60
70
1.0
00
.00
0 C
GT
New orders Completions Orderbook
0
10
20
30
40
50
60
70
1.0
00
.00
0 C
GT
New orders Completions orderbook
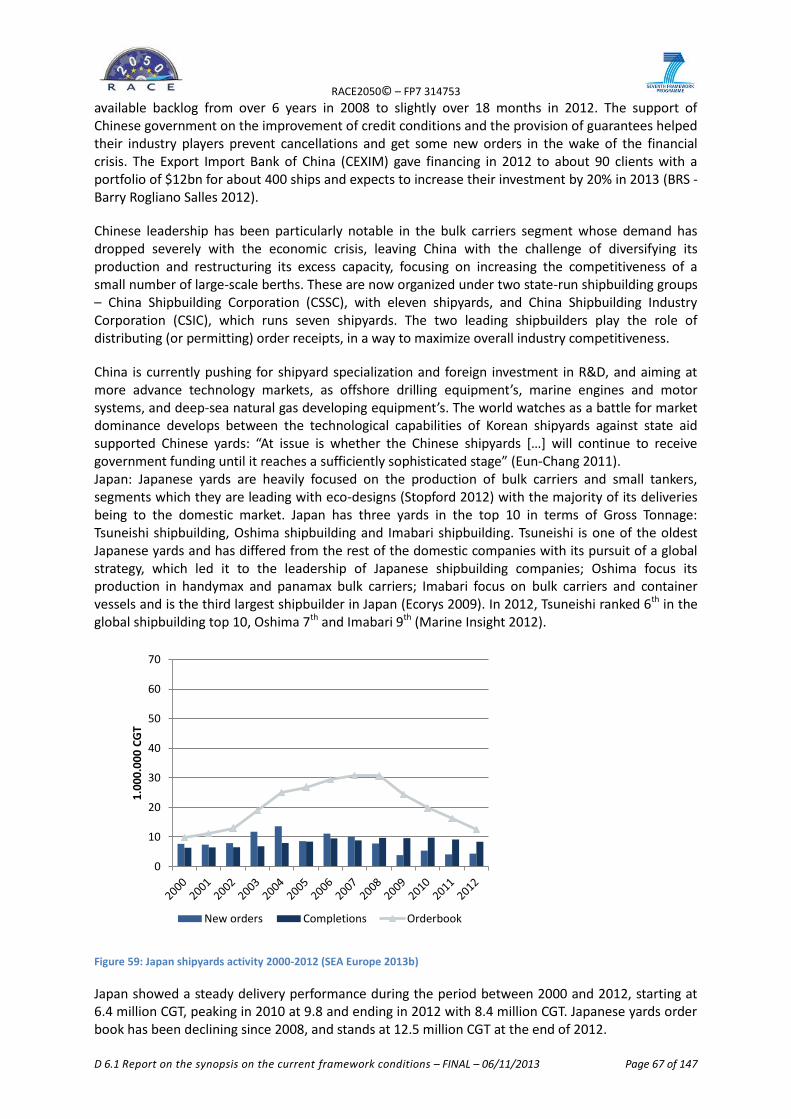
RACE2050© – FP7 314753
D 6.1 Report on the synopsis on the current framework conditions – FINAL – 06/11/2013 Page 67 of 147
available backlog from over 6 years in 2008 to slightly over 18 months in 2012. The support of Chinese government on the improvement of credit conditions and the provision of guarantees helped their industry players prevent cancellations and get some new orders in the wake of the financial crisis. The Export Import Bank of China (CEXIM) gave financing in 2012 to about 90 clients with a portfolio of $12bn for about 400 ships and expects to increase their investment by 20% in 2013 (BRS - Barry Rogliano Salles 2012).
Chinese leadership has been particularly notable in the bulk carriers segment whose demand has dropped severely with the economic crisis, leaving China with the challenge of diversifying its production and restructuring its excess capacity, focusing on increasing the competitiveness of a small number of large-scale berths. These are now organized under two state-run shipbuilding groups – China Shipbuilding Corporation (CSSC), with eleven shipyards, and China Shipbuilding Industry Corporation (CSIC), which runs seven shipyards. The two leading shipbuilders play the role of distributing (or permitting) order receipts, in a way to maximize overall industry competitiveness.
China is currently pushing for shipyard specialization and foreign investment in R&D, and aiming at more advance technology markets, as offshore drilling equipment’s, marine engines and motor systems, and deep-sea natural gas developing equipment’s. The world watches as a battle for market dominance develops between the technological capabilities of Korean shipyards against state aid supported Chinese yards: “At issue is whether the Chinese shipyards […] will continue to receive government funding until it reaches a sufficiently sophisticated stage” (Eun-Chang 2011). Japan: Japanese yards are heavily focused on the production of bulk carriers and small tankers, segments which they are leading with eco-designs (Stopford 2012) with the majority of its deliveries being to the domestic market. Japan has three yards in the top 10 in terms of Gross Tonnage: Tsuneishi shipbuilding, Oshima shipbuilding and Imabari shipbuilding. Tsuneishi is one of the oldest Japanese yards and has differed from the rest of the domestic companies with its pursuit of a global strategy, which led it to the leadership of Japanese shipbuilding companies; Oshima focus its production in handymax and panamax bulk carriers; Imabari focus on bulk carriers and container vessels and is the third largest shipbuilder in Japan (Ecorys 2009). In 2012, Tsuneishi ranked 6th in the global shipbuilding top 10, Oshima 7th and Imabari 9th (Marine Insight 2012).
Figure 59: Japan shipyards activity 2000-2012 (SEA Europe 2013b)
Japan showed a steady delivery performance during the period between 2000 and 2012, starting at 6.4 million CGT, peaking in 2010 at 9.8 and ending in 2012 with 8.4 million CGT. Japanese yards order book has been declining since 2008, and stands at 12.5 million CGT at the end of 2012.
0
10
20
30
40
50
60
70
1.0
00
.00
0 C
GT
New orders Completions Orderbook

RACE2050© – FP7 314753
D 6.1 Report on the synopsis on the current framework conditions – FINAL – 06/11/2013 Page 68 of 147
The first four places in the 2012 yards backlog ranking, expressed in Compensated Gross Tons are all Korean, and together they accounted for some 20% of the market, with the remaining top 10 positions being occupied by yards from these three countries11.
Table 5: Top 10 Shipyards in the world by Order book in June 2012 (Clarkson 2012)
China (35%) and South Korea (29%) shared almost two thirds of the world order book at the end of 2012. Japan came third with 18% of the world orders, and CESA – the Community of European Shipyards’ Association (EU27+ Norway and Croatia) accounted for only 8%. Together, Korea China and Japan accounted for 81% of international orders at the end of the year. European weight in terms of CGT is not particularly important, but its role in terms of value is stronger, especially if naval activities are considered (Ecorys 2009).
Figure 60: Order book Evolution (SEA Europe 2013b)
The following table ranks the most prominent countries by industry order books at the end of 2012.
11
In 2008, the first European position only ranked in 38th in terms of order book
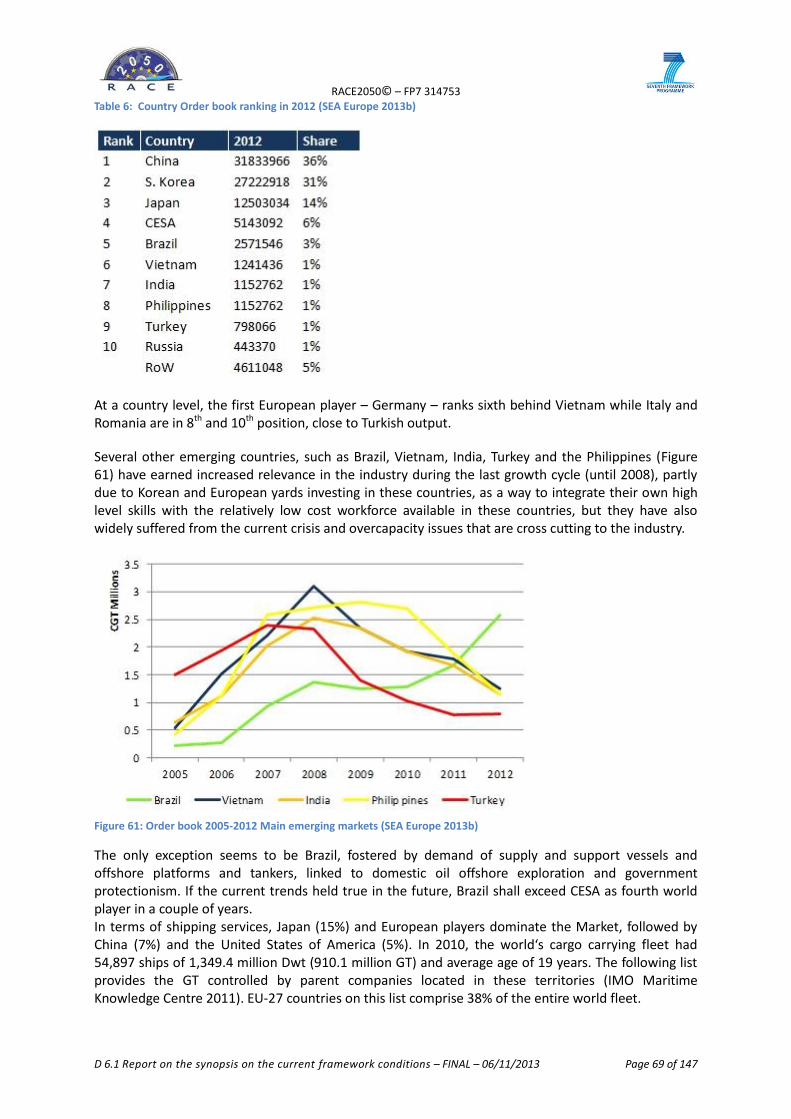
RACE2050© – FP7 314753
D 6.1 Report on the synopsis on the current framework conditions – FINAL – 06/11/2013 Page 69 of 147
Table 6: Country Order book ranking in 2012 (SEA Europe 2013b)
At a country level, the first European player – Germany – ranks sixth behind Vietnam while Italy and Romania are in 8th and 10th position, close to Turkish output.
Several other emerging countries, such as Brazil, Vietnam, India, Turkey and the Philippines (Figure 61) have earned increased relevance in the industry during the last growth cycle (until 2008), partly due to Korean and European yards investing in these countries, as a way to integrate their own high level skills with the relatively low cost workforce available in these countries, but they have also widely suffered from the current crisis and overcapacity issues that are cross cutting to the industry.
Figure 61: Order book 2005-2012 Main emerging markets (SEA Europe 2013b)
The only exception seems to be Brazil, fostered by demand of supply and support vessels and offshore platforms and tankers, linked to domestic oil offshore exploration and government protectionism. If the current trends held true in the future, Brazil shall exceed CESA as fourth world player in a couple of years. In terms of shipping services, Japan (15%) and European players dominate the Market, followed by China (7%) and the United States of America (5%). In 2010, the world‘s cargo carrying fleet had 54,897 ships of 1,349.4 million Dwt (910.1 million GT) and average age of 19 years. The following list provides the GT controlled by parent companies located in these territories (IMO Maritime Knowledge Centre 2011). EU-27 countries on this list comprise 38% of the entire world fleet.
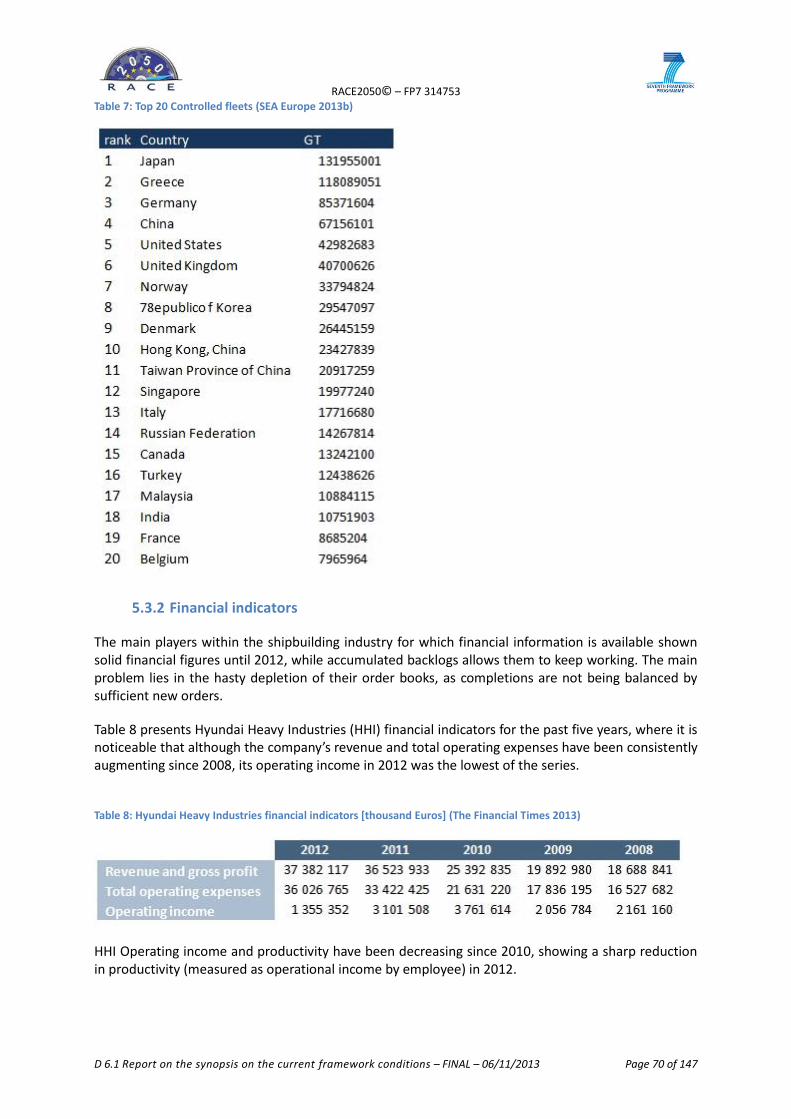
RACE2050© – FP7 314753
D 6.1 Report on the synopsis on the current framework conditions – FINAL – 06/11/2013 Page 70 of 147
Table 7: Top 20 Controlled fleets (SEA Europe 2013b)
5.3.2 Financial indicators
The main players within the shipbuilding industry for which financial information is available shown solid financial figures until 2012, while accumulated backlogs allows them to keep working. The main problem lies in the hasty depletion of their order books, as completions are not being balanced by sufficient new orders.
Table 8 presents Hyundai Heavy Industries (HHI) financial indicators for the past five years, where it is noticeable that although the company’s revenue and total operating expenses have been consistently augmenting since 2008, its operating income in 2012 was the lowest of the series.
Table 8: Hyundai Heavy Industries financial indicators [thousand Euros] (The Financial Times 2013)
HHI Operating income and productivity have been decreasing since 2010, showing a sharp reduction in productivity (measured as operational income by employee) in 2012.
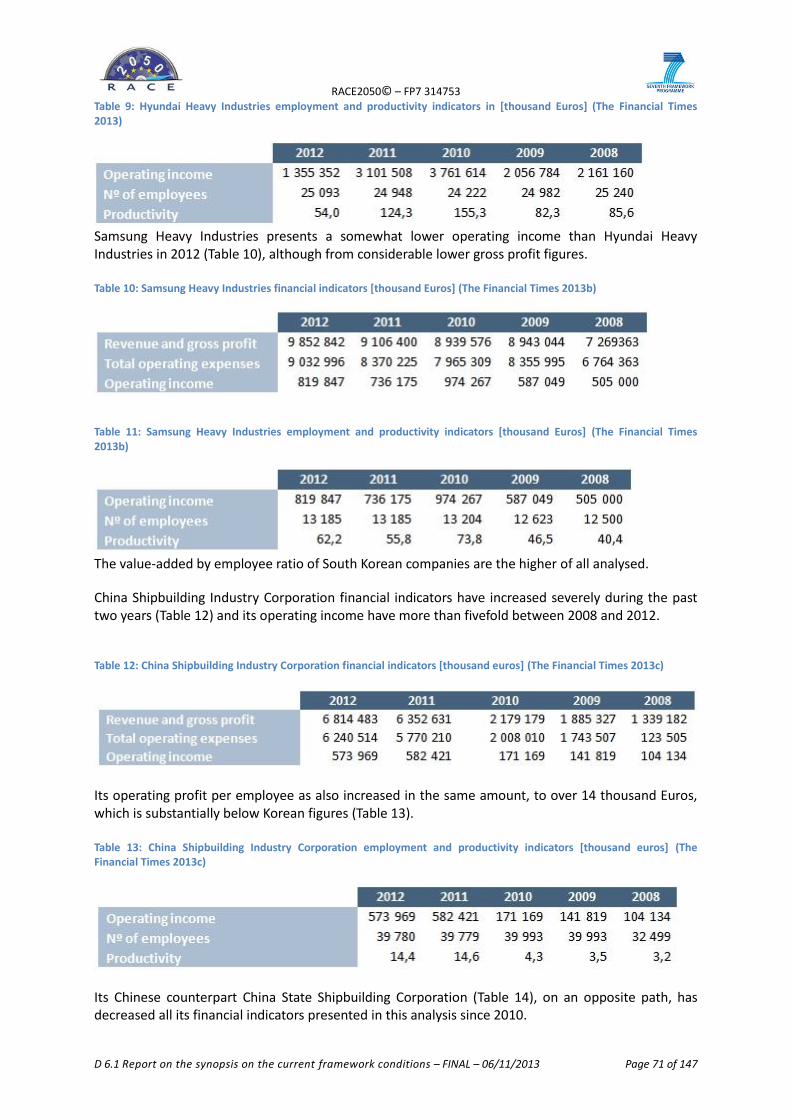
RACE2050© – FP7 314753
D 6.1 Report on the synopsis on the current framework conditions – FINAL – 06/11/2013 Page 71 of 147
Table 9: Hyundai Heavy Industries employment and productivity indicators in [thousand Euros] (The Financial Times 2013)
Samsung Heavy Industries presents a somewhat lower operating income than Hyundai Heavy Industries in 2012 (Table 10), although from considerable lower gross profit figures. Table 10: Samsung Heavy Industries financial indicators [thousand Euros] (The Financial Times 2013b)
Table 11: Samsung Heavy Industries employment and productivity indicators [thousand Euros] (The Financial Times 2013b)
The value-added by employee ratio of South Korean companies are the higher of all analysed.
China Shipbuilding Industry Corporation financial indicators have increased severely during the past two years (Table 12) and its operating income have more than fivefold between 2008 and 2012.
Table 12: China Shipbuilding Industry Corporation financial indicators [thousand euros] (The Financial Times 2013c)
Its operating profit per employee as also increased in the same amount, to over 14 thousand Euros, which is substantially below Korean figures (Table 13). Table 13: China Shipbuilding Industry Corporation employment and productivity indicators [thousand euros] (The Financial Times 2013c)
Its Chinese counterpart China State Shipbuilding Corporation (Table 14), on an opposite path, has decreased all its financial indicators presented in this analysis since 2010.
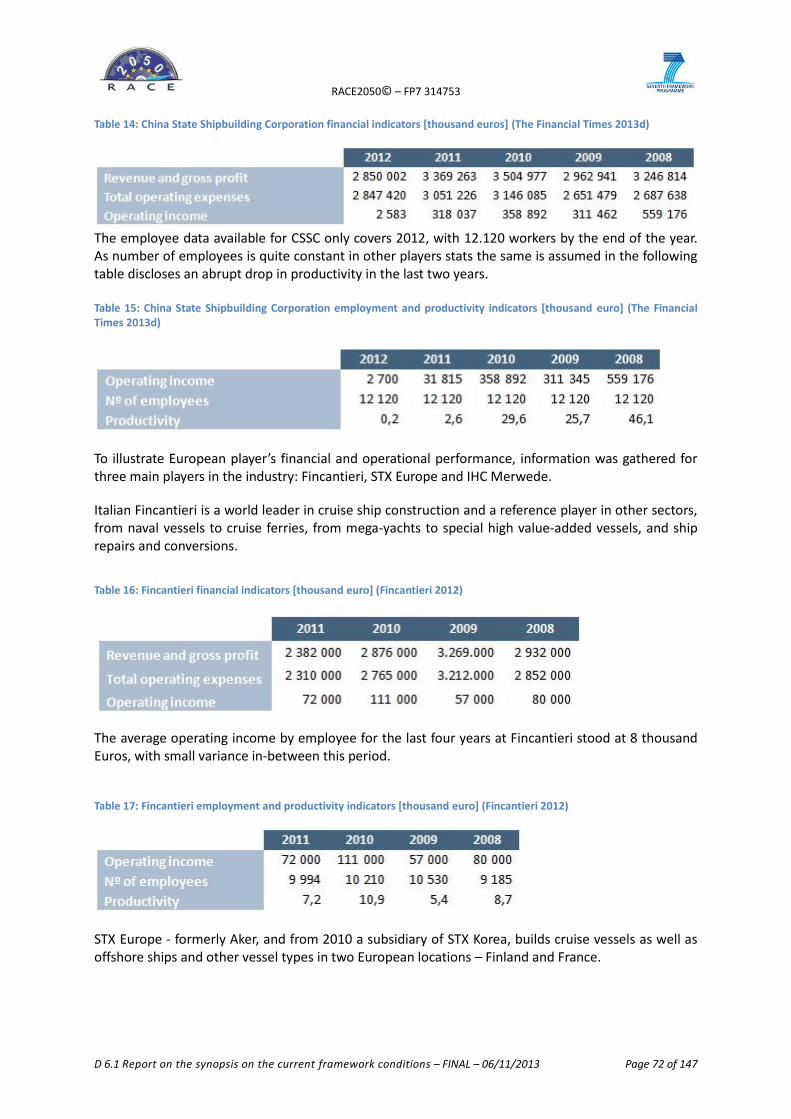
RACE2050© – FP7 314753
D 6.1 Report on the synopsis on the current framework conditions – FINAL – 06/11/2013 Page 72 of 147
Table 14: China State Shipbuilding Corporation financial indicators [thousand euros] (The Financial Times 2013d)
The employee data available for CSSC only covers 2012, with 12.120 workers by the end of the year. As number of employees is quite constant in other players stats the same is assumed in the following table discloses an abrupt drop in productivity in the last two years. Table 15: China State Shipbuilding Corporation employment and productivity indicators [thousand euro] (The Financial Times 2013d)
To illustrate European player’s financial and operational performance, information was gathered for three main players in the industry: Fincantieri, STX Europe and IHC Merwede.
Italian Fincantieri is a world leader in cruise ship construction and a reference player in other sectors, from naval vessels to cruise ferries, from mega-yachts to special high value-added vessels, and ship repairs and conversions.
Table 16: Fincantieri financial indicators [thousand euro] (Fincantieri 2012)
The average operating income by employee for the last four years at Fincantieri stood at 8 thousand Euros, with small variance in-between this period.
Table 17: Fincantieri employment and productivity indicators [thousand euro] (Fincantieri 2012)
STX Europe - formerly Aker, and from 2010 a subsidiary of STX Korea, builds cruise vessels as well as offshore ships and other vessel types in two European locations – Finland and France.
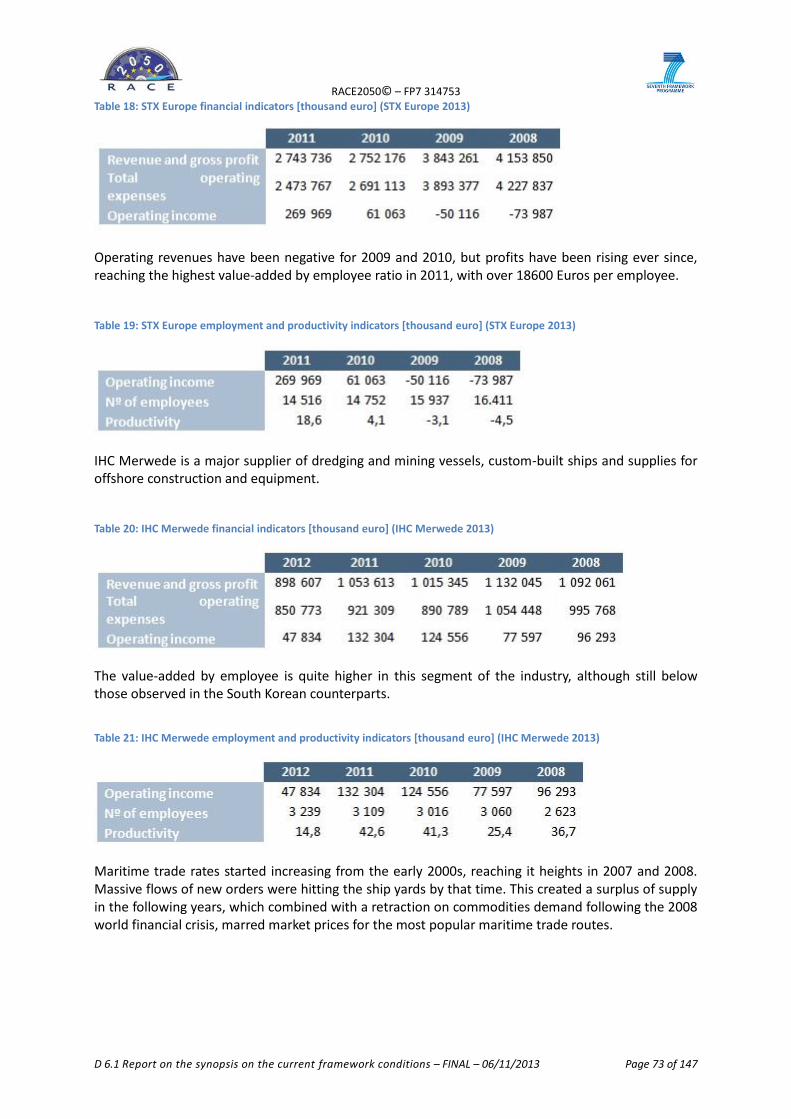
RACE2050© – FP7 314753
D 6.1 Report on the synopsis on the current framework conditions – FINAL – 06/11/2013 Page 73 of 147
Table 18: STX Europe financial indicators [thousand euro] (STX Europe 2013)
Operating revenues have been negative for 2009 and 2010, but profits have been rising ever since, reaching the highest value-added by employee ratio in 2011, with over 18600 Euros per employee.
Table 19: STX Europe employment and productivity indicators [thousand euro] (STX Europe 2013)
IHC Merwede is a major supplier of dredging and mining vessels, custom-built ships and supplies for offshore construction and equipment.
Table 20: IHC Merwede financial indicators [thousand euro] (IHC Merwede 2013)
The value-added by employee is quite higher in this segment of the industry, although still below those observed in the South Korean counterparts.
Table 21: IHC Merwede employment and productivity indicators [thousand euro] (IHC Merwede 2013)
Maritime trade rates started increasing from the early 2000s, reaching it heights in 2007 and 2008. Massive flows of new orders were hitting the ship yards by that time. This created a surplus of supply in the following years, which combined with a retraction on commodities demand following the 2008 world financial crisis, marred market prices for the most popular maritime trade routes.
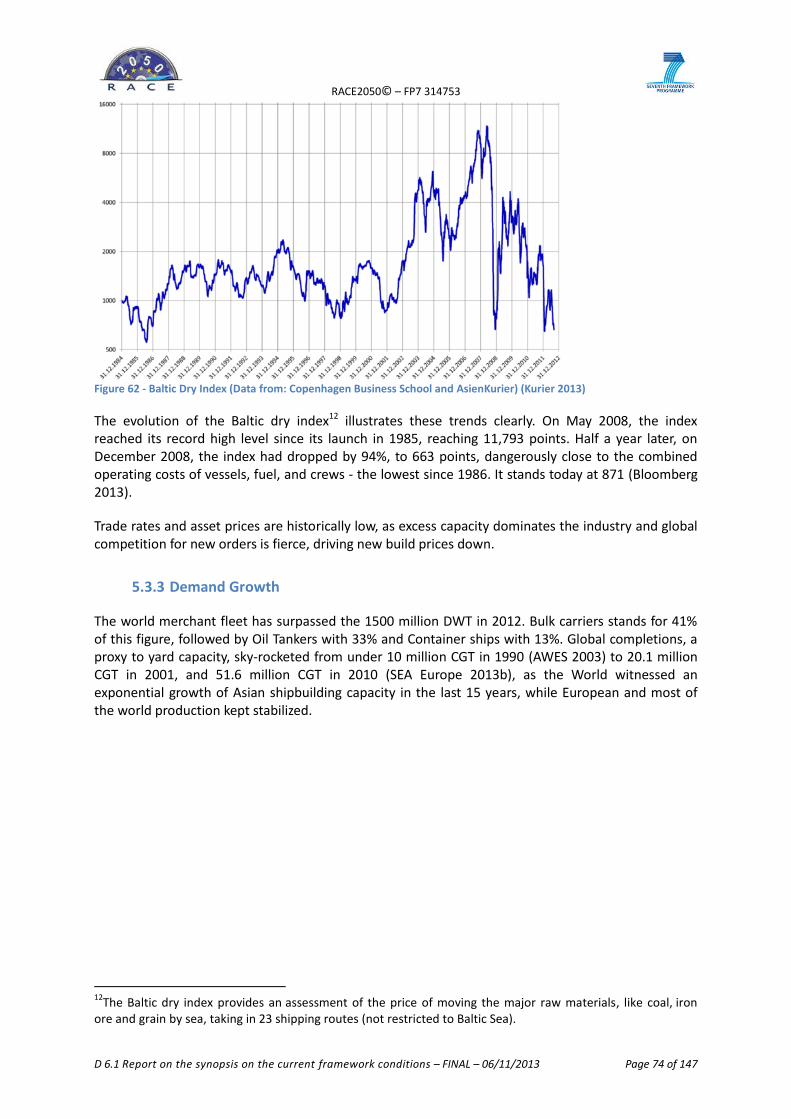
RACE2050© – FP7 314753
D 6.1 Report on the synopsis on the current framework conditions – FINAL – 06/11/2013 Page 74 of 147
Figure 62 - Baltic Dry Index (Data from: Copenhagen Business School and AsienKurier) (Kurier 2013)
The evolution of the Baltic dry index12 illustrates these trends clearly. On May 2008, the index reached its record high level since its launch in 1985, reaching 11,793 points. Half a year later, on December 2008, the index had dropped by 94%, to 663 points, dangerously close to the combined operating costs of vessels, fuel, and crews - the lowest since 1986. It stands today at 871 (Bloomberg 2013).
Trade rates and asset prices are historically low, as excess capacity dominates the industry and global competition for new orders is fierce, driving new build prices down.
5.3.3 Demand Growth
The world merchant fleet has surpassed the 1500 million DWT in 2012. Bulk carriers stands for 41% of this figure, followed by Oil Tankers with 33% and Container ships with 13%. Global completions, a proxy to yard capacity, sky-rocketed from under 10 million CGT in 1990 (AWES 2003) to 20.1 million CGT in 2001, and 51.6 million CGT in 2010 (SEA Europe 2013b), as the World witnessed an exponential growth of Asian shipbuilding capacity in the last 15 years, while European and most of the world production kept stabilized.
12
The Baltic dry index provides an assessment of the price of moving the major raw materials, like coal, iron ore and grain by sea, taking in 23 shipping routes (not restricted to Baltic Sea).
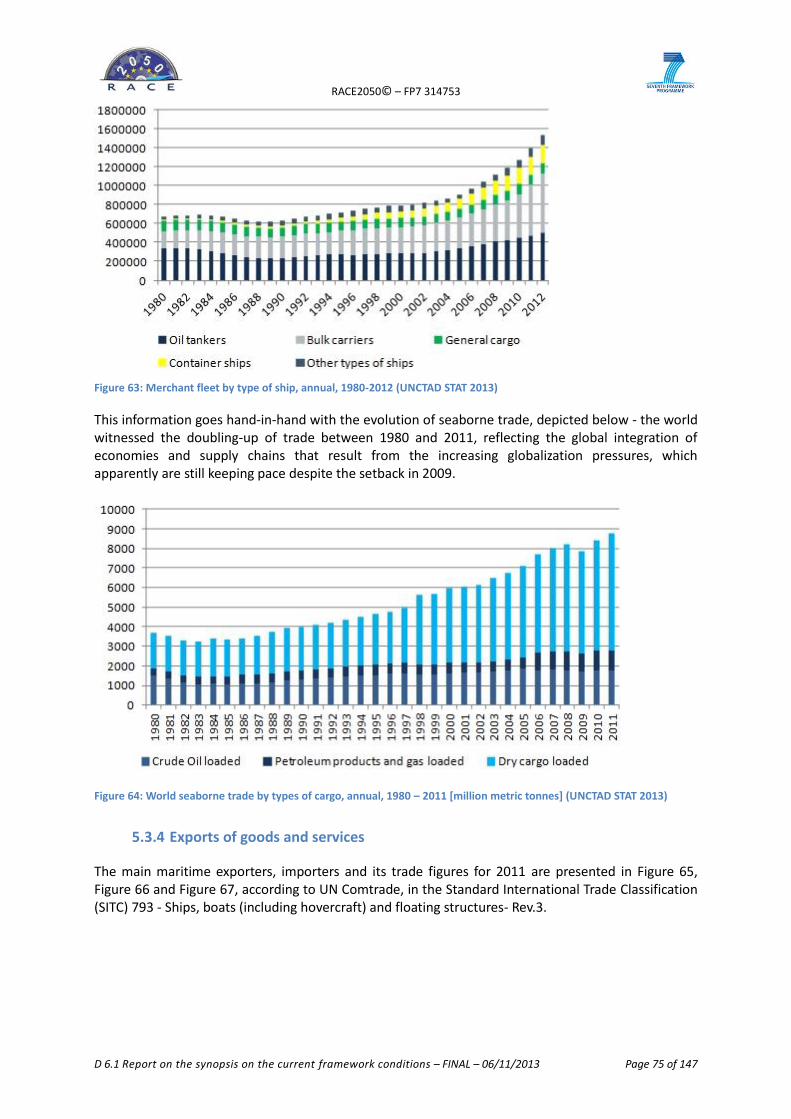
RACE2050© – FP7 314753
D 6.1 Report on the synopsis on the current framework conditions – FINAL – 06/11/2013 Page 75 of 147
Figure 63: Merchant fleet by type of ship, annual, 1980-2012 (UNCTAD STAT 2013)
This information goes hand-in-hand with the evolution of seaborne trade, depicted below - the world witnessed the doubling-up of trade between 1980 and 2011, reflecting the global integration of economies and supply chains that result from the increasing globalization pressures, which apparently are still keeping pace despite the setback in 2009.
Figure 64: World seaborne trade by types of cargo, annual, 1980 – 2011 [million metric tonnes] (UNCTAD STAT 2013)
5.3.4 Exports of goods and services
The main maritime exporters, importers and its trade figures for 2011 are presented in Figure 65, Figure 66 and Figure 67, according to UN Comtrade, in the Standard International Trade Classification (SITC) 793 - Ships, boats (including hovercraft) and floating structures- Rev.3.
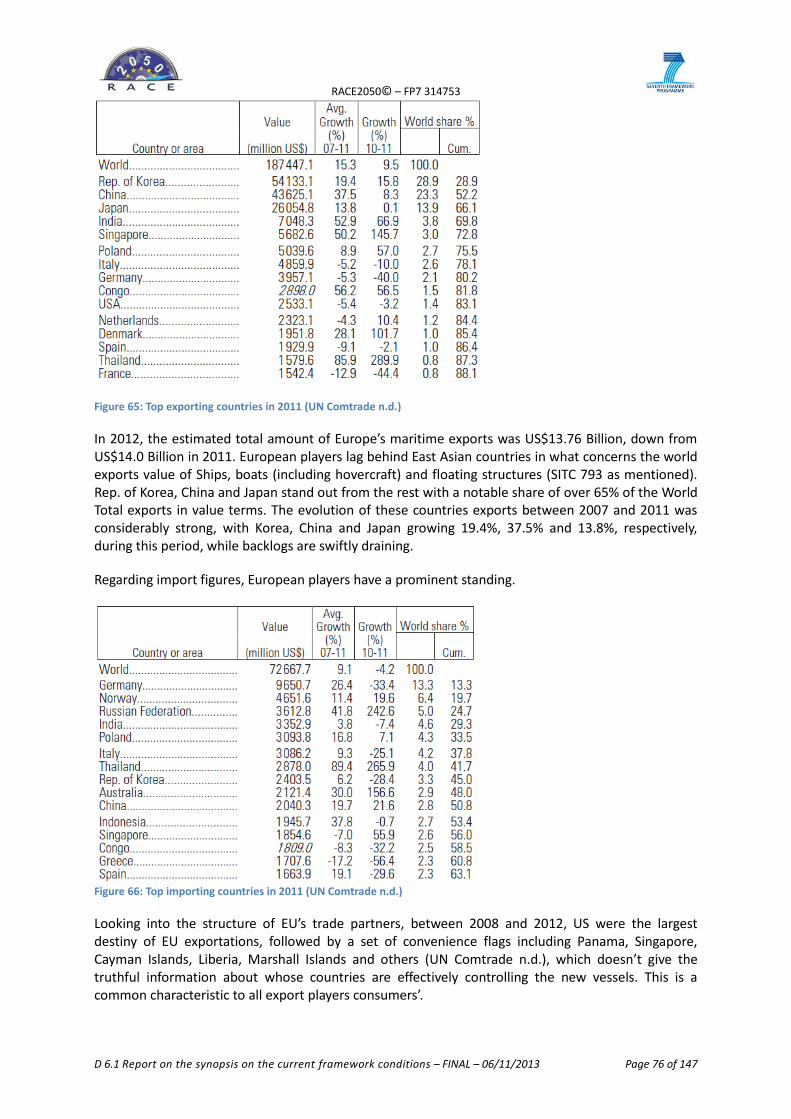
RACE2050© – FP7 314753
D 6.1 Report on the synopsis on the current framework conditions – FINAL – 06/11/2013 Page 76 of 147
Figure 65: Top exporting countries in 2011 (UN Comtrade n.d.)
In 2012, the estimated total amount of Europe’s maritime exports was US$13.76 Billion, down from US$14.0 Billion in 2011. European players lag behind East Asian countries in what concerns the world exports value of Ships, boats (including hovercraft) and floating structures (SITC 793 as mentioned). Rep. of Korea, China and Japan stand out from the rest with a notable share of over 65% of the World Total exports in value terms. The evolution of these countries exports between 2007 and 2011 was considerably strong, with Korea, China and Japan growing 19.4%, 37.5% and 13.8%, respectively, during this period, while backlogs are swiftly draining.
Regarding import figures, European players have a prominent standing.
Figure 66: Top importing countries in 2011 (UN Comtrade n.d.)
Looking into the structure of EU’s trade partners, between 2008 and 2012, US were the largest destiny of EU exportations, followed by a set of convenience flags including Panama, Singapore, Cayman Islands, Liberia, Marshall Islands and others (UN Comtrade n.d.), which doesn’t give the truthful information about whose countries are effectively controlling the new vessels. This is a common characteristic to all export players consumers’.
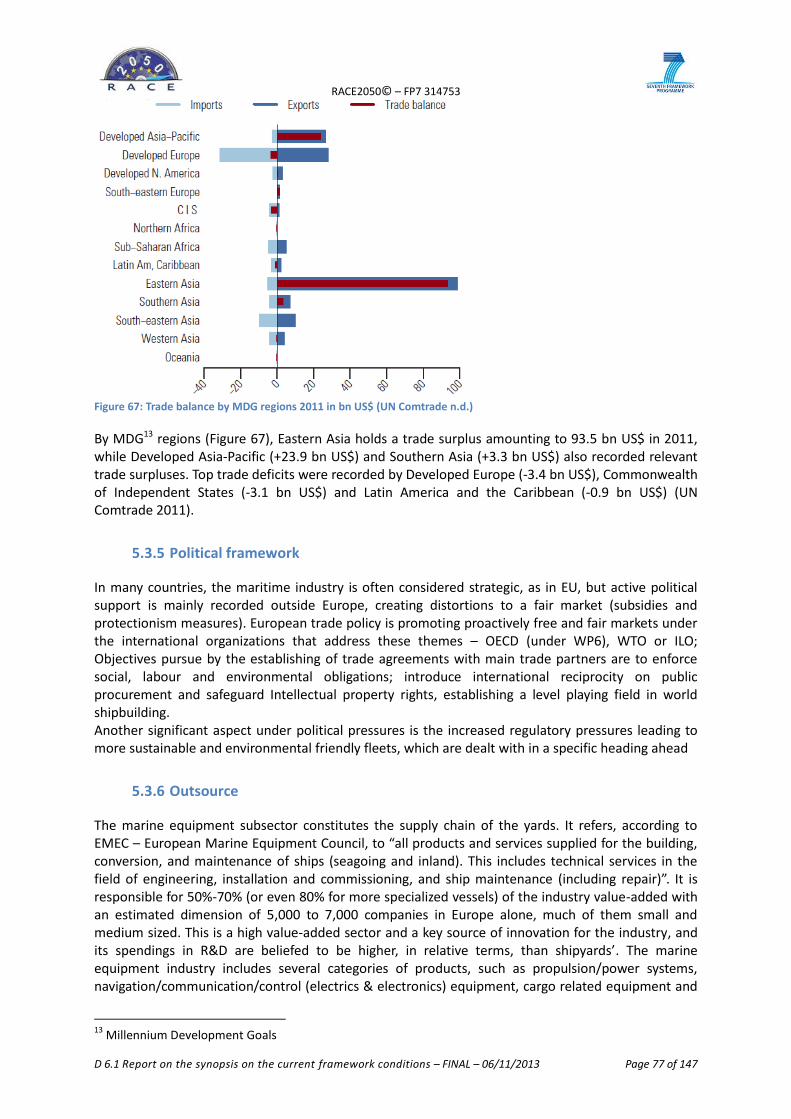
RACE2050© – FP7 314753
D 6.1 Report on the synopsis on the current framework conditions – FINAL – 06/11/2013 Page 77 of 147
Figure 67: Trade balance by MDG regions 2011 in bn US$ (UN Comtrade n.d.)
By MDG13 regions (Figure 67), Eastern Asia holds a trade surplus amounting to 93.5 bn US$ in 2011, while Developed Asia-Pacific (+23.9 bn US$) and Southern Asia (+3.3 bn US$) also recorded relevant trade surpluses. Top trade deficits were recorded by Developed Europe (-3.4 bn US$), Commonwealth of Independent States (-3.1 bn US$) and Latin America and the Caribbean (-0.9 bn US$) (UN Comtrade 2011).
5.3.5 Political framework
In many countries, the maritime industry is often considered strategic, as in EU, but active political support is mainly recorded outside Europe, creating distortions to a fair market (subsidies and protectionism measures). European trade policy is promoting proactively free and fair markets under the international organizations that address these themes – OECD (under WP6), WTO or ILO; Objectives pursue by the establishing of trade agreements with main trade partners are to enforce social, labour and environmental obligations; introduce international reciprocity on public procurement and safeguard Intellectual property rights, establishing a level playing field in world shipbuilding. Another significant aspect under political pressures is the increased regulatory pressures leading to more sustainable and environmental friendly fleets, which are dealt with in a specific heading ahead
5.3.6 Outsource
The marine equipment subsector constitutes the supply chain of the yards. It refers, according to EMEC – European Marine Equipment Council, to “all products and services supplied for the building, conversion, and maintenance of ships (seagoing and inland). This includes technical services in the field of engineering, installation and commissioning, and ship maintenance (including repair)”. It is responsible for 50%-70% (or even 80% for more specialized vessels) of the industry value-added with an estimated dimension of 5,000 to 7,000 companies in Europe alone, much of them small and medium sized. This is a high value-added sector and a key source of innovation for the industry, and its spendings in R&D are beliefed to be higher, in relative terms, than shipyards’. The marine equipment industry includes several categories of products, such as propulsion/power systems, navigation/communication/control (electrics & electronics) equipment, cargo related equipment and
13
Millennium Development Goals
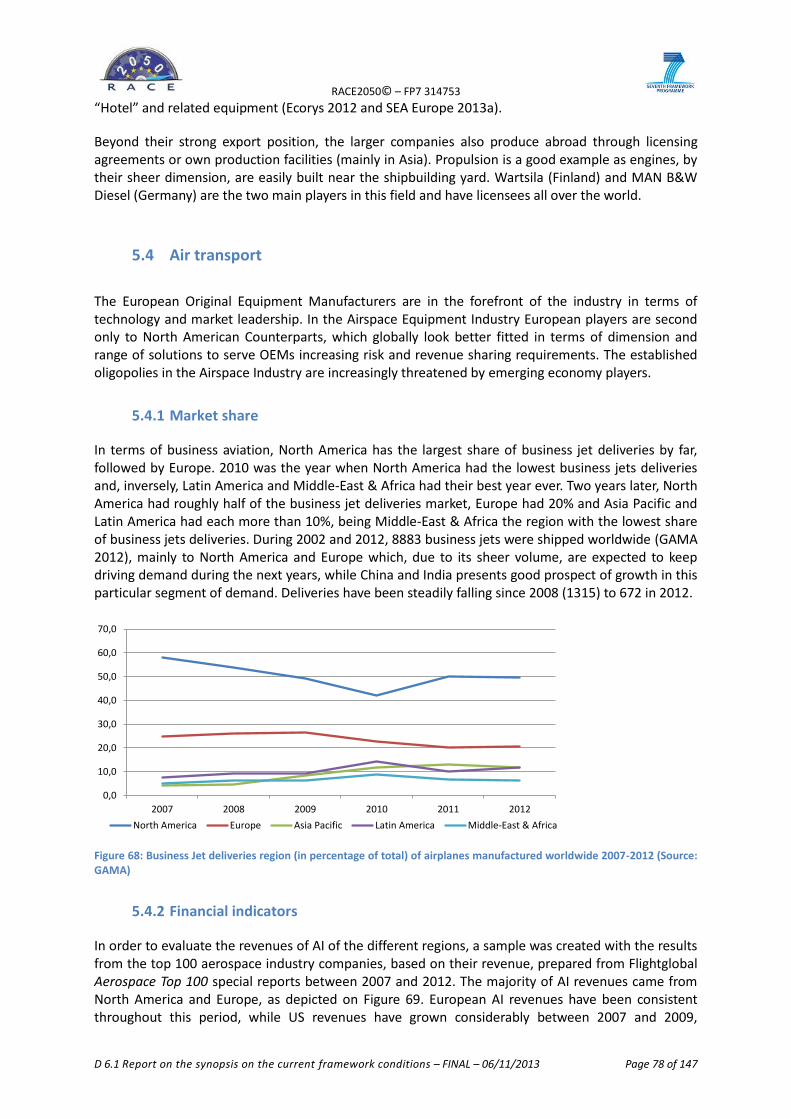
RACE2050© – FP7 314753
D 6.1 Report on the synopsis on the current framework conditions – FINAL – 06/11/2013 Page 78 of 147
“Hotel” and related equipment (Ecorys 2012 and SEA Europe 2013a).
Beyond their strong export position, the larger companies also produce abroad through licensing agreements or own production facilities (mainly in Asia). Propulsion is a good example as engines, by their sheer dimension, are easily built near the shipbuilding yard. Wartsila (Finland) and MAN B&W Diesel (Germany) are the two main players in this field and have licensees all over the world.
5.4 Air transport
The European Original Equipment Manufacturers are in the forefront of the industry in terms of technology and market leadership. In the Airspace Equipment Industry European players are second only to North American Counterparts, which globally look better fitted in terms of dimension and range of solutions to serve OEMs increasing risk and revenue sharing requirements. The established oligopolies in the Airspace Industry are increasingly threatened by emerging economy players.
5.4.1 Market share
In terms of business aviation, North America has the largest share of business jet deliveries by far, followed by Europe. 2010 was the year when North America had the lowest business jets deliveries and, inversely, Latin America and Middle-East & Africa had their best year ever. Two years later, North America had roughly half of the business jet deliveries market, Europe had 20% and Asia Pacific and Latin America had each more than 10%, being Middle-East & Africa the region with the lowest share of business jets deliveries. During 2002 and 2012, 8883 business jets were shipped worldwide (GAMA 2012), mainly to North America and Europe which, due to its sheer volume, are expected to keep driving demand during the next years, while China and India presents good prospect of growth in this particular segment of demand. Deliveries have been steadily falling since 2008 (1315) to 672 in 2012.
Figure 68: Business Jet deliveries region (in percentage of total) of airplanes manufactured worldwide 2007-2012 (Source: GAMA)
5.4.2 Financial indicators
In order to evaluate the revenues of AI of the different regions, a sample was created with the results from the top 100 aerospace industry companies, based on their revenue, prepared from Flightglobal Aerospace Top 100 special reports between 2007 and 2012. The majority of AI revenues came from North America and Europe, as depicted on Figure 69. European AI revenues have been consistent throughout this period, while US revenues have grown considerably between 2007 and 2009,
0,0
10,0
20,0
30,0
40,0
50,0
60,0
70,0
2007 2008 2009 2010 2011 2012
North America Europe Asia Pacific Latin America Middle-East & Africa

RACE2050© – FP7 314753
D 6.1 Report on the synopsis on the current framework conditions – FINAL – 06/11/2013 Page 79 of 147
followed by a decrease that placed US revenues in 2011 almost at the same level as they were in 2007. The other regions AI showed very small revenues compared to EU and US.
Figure 69: Revenue of the top 100 manufacturers per region 2007-2011 in dollars (Race2050 based on Flightglobal data)
This is in line with information from ASD which compares Global Aerospace turnovers in 2009, presented in Figure 70.
Figure 70: 2009 comparative Aerospace Industry Turnover (ASD 2010)
The EBIT Margin and the Return on Capital of the AI, presented in Figure 71 and Figure 72, have been chosen to illustrate the return on revenue of the AI. Europe presents a contrary tendency than the Rest of the World in what concerns the EBIT Margin, as European’s difference between operational costs and revenues has always been much lower and is declining since 2005, while in the Rest of the World it is growing since 2002. Although Europe presents a higher average of return on Capital then the Rest of the World it presents a declining tendency since 2005, while it has been continuously growing since 2004 in the Rest of the World. This shows that European’s profitability and competitiveness is lower than in the Rest of the World, although the volatility of European data may refer to the weight of new project developments on industry turnover in specific years, namely the A380. It is important to refer that these figures lack of data since 2008, year when the economic crisis
0
100000
200000
300000
400000
500000
600000
700000
2007 2008 2009 2010 2011
Asia Pacific
Europe
Latin America
Middle-East & Africa
North America
Grand Total
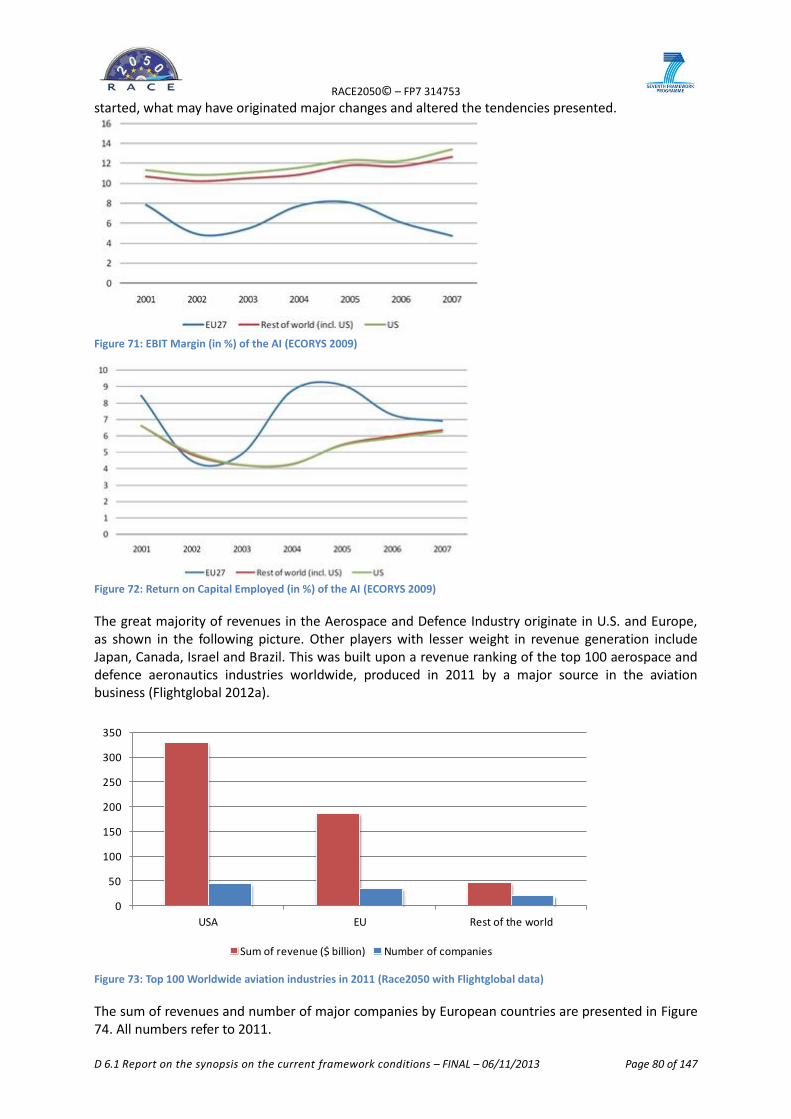
RACE2050© – FP7 314753
D 6.1 Report on the synopsis on the current framework conditions – FINAL – 06/11/2013 Page 80 of 147
started, what may have originated major changes and altered the tendencies presented.
Figure 71: EBIT Margin (in %) of the AI (ECORYS 2009)
Figure 72: Return on Capital Employed (in %) of the AI (ECORYS 2009)
The great majority of revenues in the Aerospace and Defence Industry originate in U.S. and Europe, as shown in the following picture. Other players with lesser weight in revenue generation include Japan, Canada, Israel and Brazil. This was built upon a revenue ranking of the top 100 aerospace and defence aeronautics industries worldwide, produced in 2011 by a major source in the aviation business (Flightglobal 2012a).
Figure 73: Top 100 Worldwide aviation industries in 2011 (Race2050 with Flightglobal data)
The sum of revenues and number of major companies by European countries are presented in Figure 74. All numbers refer to 2011.
0
50
100
150
200
250
300
350
USA EU Rest of the world
Sum of revenue ($ billion) Number of companies
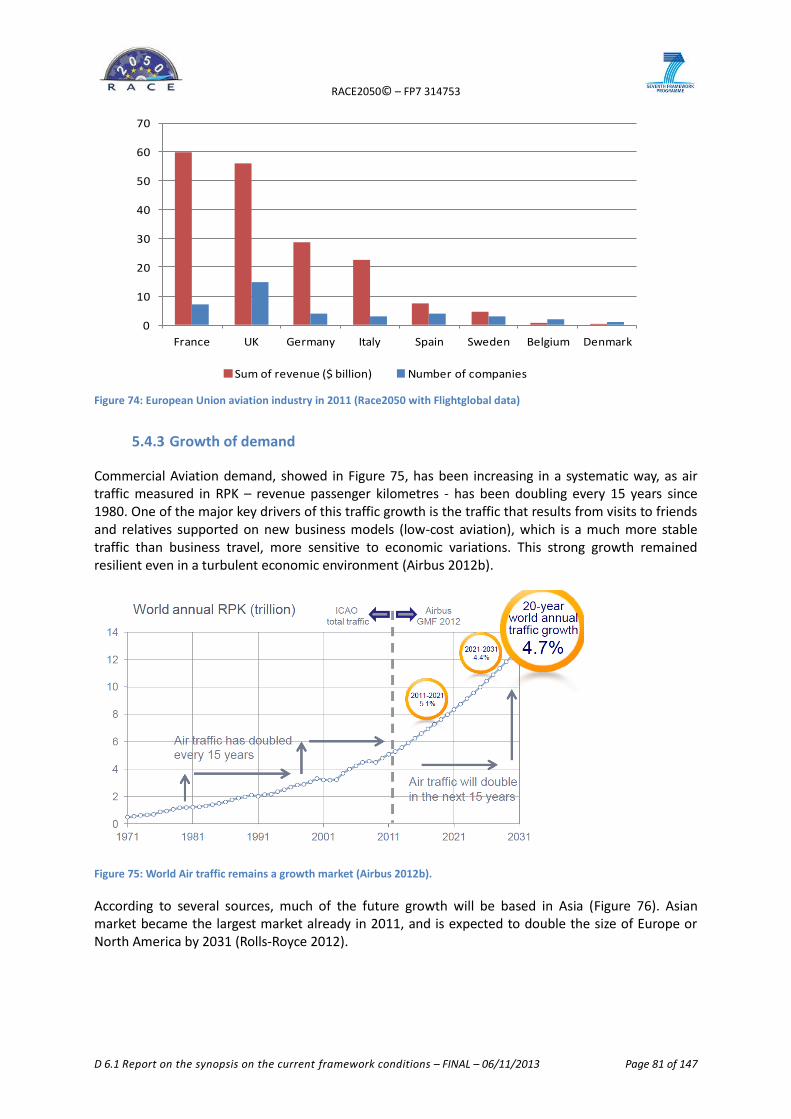
RACE2050© – FP7 314753
D 6.1 Report on the synopsis on the current framework conditions – FINAL – 06/11/2013 Page 81 of 147
Figure 74: European Union aviation industry in 2011 (Race2050 with Flightglobal data)
5.4.3 Growth of demand
Commercial Aviation demand, showed in Figure 75, has been increasing in a systematic way, as air traffic measured in RPK – revenue passenger kilometres - has been doubling every 15 years since 1980. One of the major key drivers of this traffic growth is the traffic that results from visits to friends and relatives supported on new business models (low-cost aviation), which is a much more stable traffic than business travel, more sensitive to economic variations. This strong growth remained resilient even in a turbulent economic environment (Airbus 2012b).
Figure 75: World Air traffic remains a growth market (Airbus 2012b).
According to several sources, much of the future growth will be based in Asia (Figure 76). Asian market became the largest market already in 2011, and is expected to double the size of Europe or North America by 2031 (Rolls-Royce 2012).
0
10
20
30
40
50
60
70
France UK Germany Italy Spain Sweden Belgium Denmark
Sum of revenue ($ billion) Number of companies
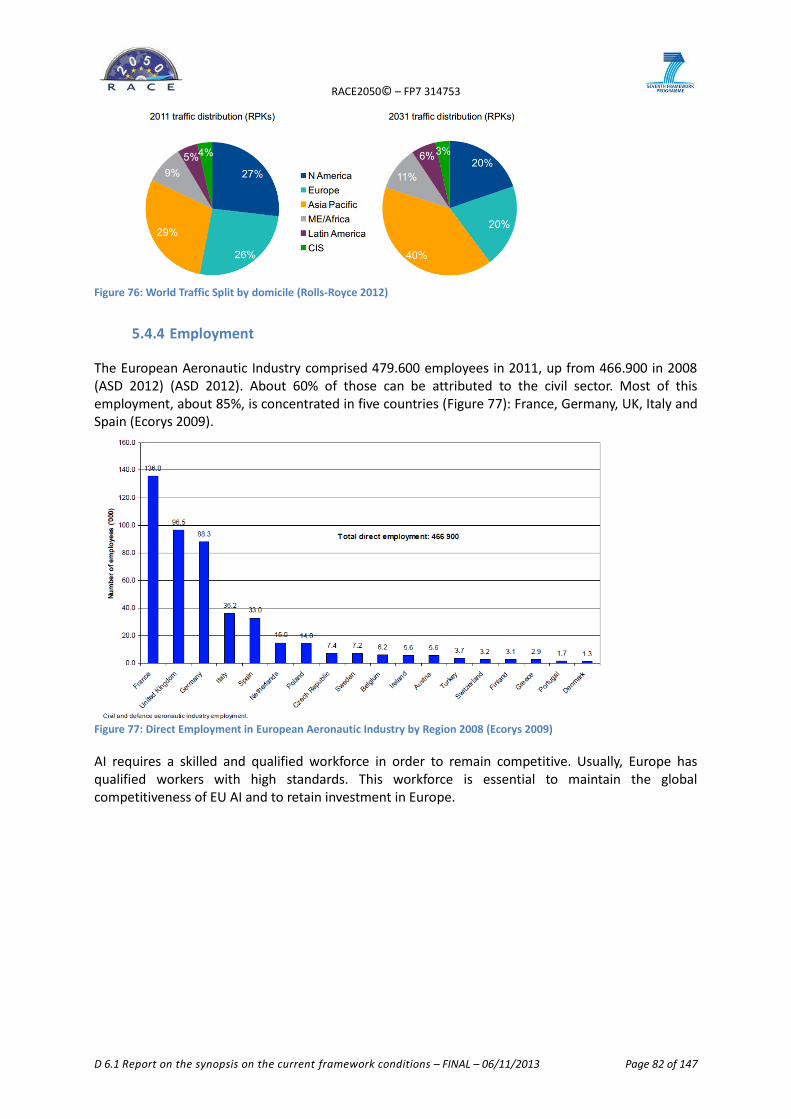
RACE2050© – FP7 314753
D 6.1 Report on the synopsis on the current framework conditions – FINAL – 06/11/2013 Page 82 of 147
Figure 76: World Traffic Split by domicile (Rolls-Royce 2012)
5.4.4 Employment
The European Aeronautic Industry comprised 479.600 employees in 2011, up from 466.900 in 2008 (ASD 2012) (ASD 2012). About 60% of those can be attributed to the civil sector. Most of this employment, about 85%, is concentrated in five countries (Figure 77): France, Germany, UK, Italy and Spain (Ecorys 2009).
Figure 77: Direct Employment in European Aeronautic Industry by Region 2008 (Ecorys 2009)
AI requires a skilled and qualified workforce in order to remain competitive. Usually, Europe has qualified workers with high standards. This workforce is essential to maintain the global competitiveness of EU AI and to retain investment in Europe.
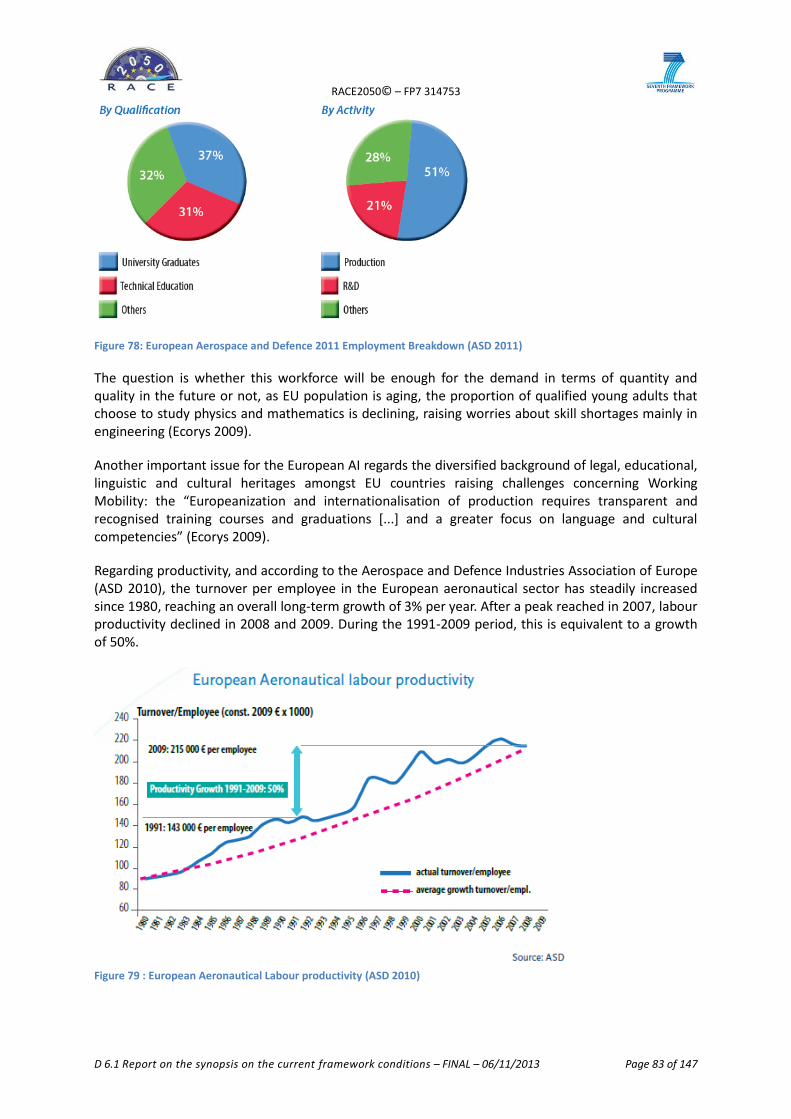
RACE2050© – FP7 314753
D 6.1 Report on the synopsis on the current framework conditions – FINAL – 06/11/2013 Page 83 of 147
Figure 78: European Aerospace and Defence 2011 Employment Breakdown (ASD 2011)
The question is whether this workforce will be enough for the demand in terms of quantity and quality in the future or not, as EU population is aging, the proportion of qualified young adults that choose to study physics and mathematics is declining, raising worries about skill shortages mainly in engineering (Ecorys 2009).
Another important issue for the European AI regards the diversified background of legal, educational, linguistic and cultural heritages amongst EU countries raising challenges concerning Working Mobility: the “Europeanization and internationalisation of production requires transparent and recognised training courses and graduations [...] and a greater focus on language and cultural competencies” (Ecorys 2009).
Regarding productivity, and according to the Aerospace and Defence Industries Association of Europe (ASD 2010), the turnover per employee in the European aeronautical sector has steadily increased since 1980, reaching an overall long-term growth of 3% per year. After a peak reached in 2007, labour productivity declined in 2008 and 2009. During the 1991-2009 period, this is equivalent to a growth of 50%.
Figure 79 : European Aeronautical Labour productivity (ASD 2010)
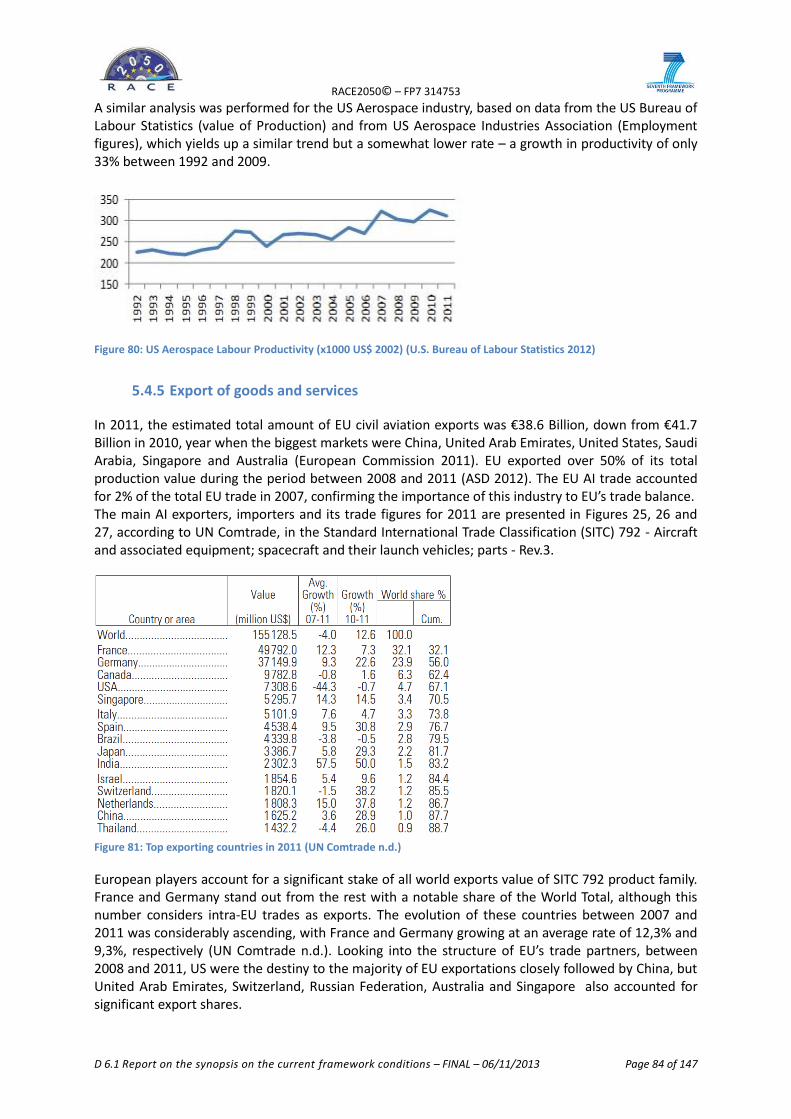
RACE2050© – FP7 314753
D 6.1 Report on the synopsis on the current framework conditions – FINAL – 06/11/2013 Page 84 of 147
A similar analysis was performed for the US Aerospace industry, based on data from the US Bureau of Labour Statistics (value of Production) and from US Aerospace Industries Association (Employment figures), which yields up a similar trend but a somewhat lower rate – a growth in productivity of only 33% between 1992 and 2009.
Figure 80: US Aerospace Labour Productivity (x1000 US$ 2002) (U.S. Bureau of Labour Statistics 2012)
5.4.5 Export of goods and services
In 2011, the estimated total amount of EU civil aviation exports was €38.6 Billion, down from €41.7 Billion in 2010, year when the biggest markets were China, United Arab Emirates, United States, Saudi Arabia, Singapore and Australia (European Commission 2011). EU exported over 50% of its total production value during the period between 2008 and 2011 (ASD 2012). The EU AI trade accounted for 2% of the total EU trade in 2007, confirming the importance of this industry to EU’s trade balance. The main AI exporters, importers and its trade figures for 2011 are presented in Figures 25, 26 and 27, according to UN Comtrade, in the Standard International Trade Classification (SITC) 792 - Aircraft and associated equipment; spacecraft and their launch vehicles; parts - Rev.3.
Figure 81: Top exporting countries in 2011 (UN Comtrade n.d.)
European players account for a significant stake of all world exports value of SITC 792 product family. France and Germany stand out from the rest with a notable share of the World Total, although this number considers intra-EU trades as exports. The evolution of these countries between 2007 and 2011 was considerably ascending, with France and Germany growing at an average rate of 12,3% and 9,3%, respectively (UN Comtrade n.d.). Looking into the structure of EU’s trade partners, between 2008 and 2011, US were the destiny to the majority of EU exportations closely followed by China, but United Arab Emirates, Switzerland, Russian Federation, Australia and Singapore also accounted for significant export shares.

RACE2050© – FP7 314753
D 6.1 Report on the synopsis on the current framework conditions – FINAL – 06/11/2013 Page 85 of 147
UN Comtrade database shows a large drop in US exports in the last 4 years, but these figures are unfortunately not trustworthy as it comes out from our analysis that EU-27 imports of US products are two-fold the total amount of US Export, for the years between 2009 and 2011.
Figure 82: Top importing countries in 2011 (UN Comtrade n.d.)
Regarding AI import flows, France and Germany are the EU countries with the higher share of world trades. Part of this European dominance is explained through the trades between each of these countries, as intra-EU trades are considered in these figures. The largest source of EU imports is the US by far, representing about half of the total AI imports made by EU in 2011. This number has decreased since 2008, from 76% in 2008 to 54% in 2011 (UN Comtrade n.d.). Growing markets such as China, India and Brazil only account for a very small parcel of EU importations, but the tendency is for this number to augment (Ecorys 2009).
US is the second largest importer in the world, and has been slightly decreasing its import share for the past 4 years, at an average growth of -0.4%. In 2011, US share in world AI imports was about 12% (UN Comtrade n.d.).
Other important players in the AI global market are Canada, Brazil, Japan and China, according to UN Comtrade data:
Canada exports almost the double it imports. It ranks fourth in the list of AI exporting countries (most surely behind USA, to whom it sells the majority of its exports), with almost no variation of its exports between 2007 and 2011. Concerning imports, Canada comes seventh in 2011, with a value slump of almost 5% between 2007 and 2011, with almost all of it sourcing from the USA – EU-27 share of Canada imports was a little over 10% in 2011.
Brazil is one of the countries that export most AI products (Figure 81), but its imports are much lower, reflecting the dominance of Brazilian in-house production policies. AI Brazilian exports represent 3% of the total world share.
Japan has about the same value of AI exports and imports and ranks ninth on top AI exporting countries (Figure 81), with exports value growing 5.8% between 2007 and 2011. During the same period, Japanese AI imports decreased some considerable 11.6%, being the majority of them from the US.
China’s value of AI imports is over eight times the value of its exports, and they are growing faster as well. This is coherent with Figure 83, where it is noticeable that Eastern Asia is the region with the most negative trade balance, contrasting with Developed Europe, the only region that presents a positive trade balance.
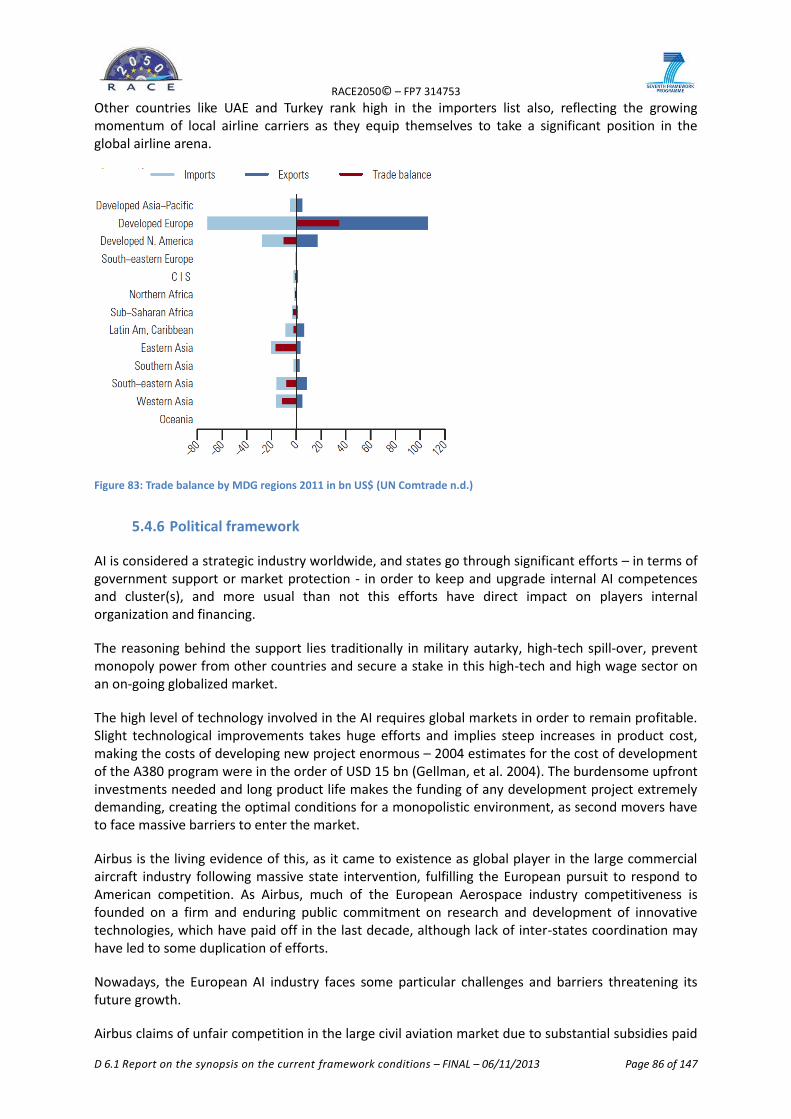
RACE2050© – FP7 314753
D 6.1 Report on the synopsis on the current framework conditions – FINAL – 06/11/2013 Page 86 of 147
Other countries like UAE and Turkey rank high in the importers list also, reflecting the growing momentum of local airline carriers as they equip themselves to take a significant position in the global airline arena.
Figure 83: Trade balance by MDG regions 2011 in bn US$ (UN Comtrade n.d.)
5.4.6 Political framework
AI is considered a strategic industry worldwide, and states go through significant efforts – in terms of government support or market protection - in order to keep and upgrade internal AI competences and cluster(s), and more usual than not this efforts have direct impact on players internal organization and financing.
The reasoning behind the support lies traditionally in military autarky, high-tech spill-over, prevent monopoly power from other countries and secure a stake in this high-tech and high wage sector on an on-going globalized market.
The high level of technology involved in the AI requires global markets in order to remain profitable. Slight technological improvements takes huge efforts and implies steep increases in product cost, making the costs of developing new project enormous – 2004 estimates for the cost of development of the A380 program were in the order of USD 15 bn (Gellman, et al. 2004). The burdensome upfront investments needed and long product life makes the funding of any development project extremely demanding, creating the optimal conditions for a monopolistic environment, as second movers have to face massive barriers to enter the market.
Airbus is the living evidence of this, as it came to existence as global player in the large commercial aircraft industry following massive state intervention, fulfilling the European pursuit to respond to American competition. As Airbus, much of the European Aerospace industry competitiveness is founded on a firm and enduring public commitment on research and development of innovative technologies, which have paid off in the last decade, although lack of inter-states coordination may have led to some duplication of efforts.
Nowadays, the European AI industry faces some particular challenges and barriers threatening its future growth.
Airbus claims of unfair competition in the large civil aviation market due to substantial subsidies paid
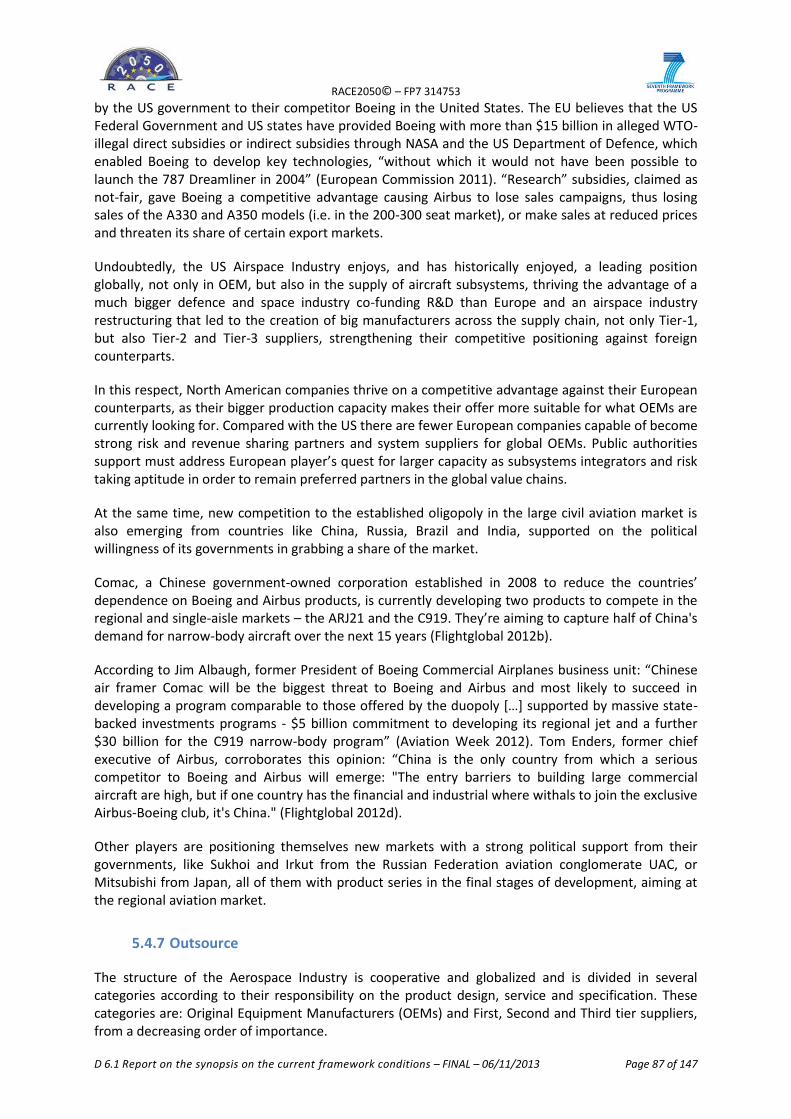
RACE2050© – FP7 314753
D 6.1 Report on the synopsis on the current framework conditions – FINAL – 06/11/2013 Page 87 of 147
by the US government to their competitor Boeing in the United States. The EU believes that the US Federal Government and US states have provided Boeing with more than $15 billion in alleged WTO-illegal direct subsidies or indirect subsidies through NASA and the US Department of Defence, which enabled Boeing to develop key technologies, “without which it would not have been possible to launch the 787 Dreamliner in 2004” (European Commission 2011). “Research” subsidies, claimed as not-fair, gave Boeing a competitive advantage causing Airbus to lose sales campaigns, thus losing sales of the A330 and A350 models (i.e. in the 200-300 seat market), or make sales at reduced prices and threaten its share of certain export markets.
Undoubtedly, the US Airspace Industry enjoys, and has historically enjoyed, a leading position globally, not only in OEM, but also in the supply of aircraft subsystems, thriving the advantage of a much bigger defence and space industry co-funding R&D than Europe and an airspace industry restructuring that led to the creation of big manufacturers across the supply chain, not only Tier-1, but also Tier-2 and Tier-3 suppliers, strengthening their competitive positioning against foreign counterparts.
In this respect, North American companies thrive on a competitive advantage against their European counterparts, as their bigger production capacity makes their offer more suitable for what OEMs are currently looking for. Compared with the US there are fewer European companies capable of become strong risk and revenue sharing partners and system suppliers for global OEMs. Public authorities support must address European player’s quest for larger capacity as subsystems integrators and risk taking aptitude in order to remain preferred partners in the global value chains.
At the same time, new competition to the established oligopoly in the large civil aviation market is also emerging from countries like China, Russia, Brazil and India, supported on the political willingness of its governments in grabbing a share of the market.
Comac, a Chinese government-owned corporation established in 2008 to reduce the countries’ dependence on Boeing and Airbus products, is currently developing two products to compete in the regional and single-aisle markets – the ARJ21 and the C919. They’re aiming to capture half of China's demand for narrow-body aircraft over the next 15 years (Flightglobal 2012b).
According to Jim Albaugh, former President of Boeing Commercial Airplanes business unit: “Chinese air framer Comac will be the biggest threat to Boeing and Airbus and most likely to succeed in developing a program comparable to those offered by the duopoly […] supported by massive state- backed investments programs - $5 billion commitment to developing its regional jet and a further $30 billion for the C919 narrow-body program” (Aviation Week 2012). Tom Enders, former chief executive of Airbus, corroborates this opinion: “China is the only country from which a serious competitor to Boeing and Airbus will emerge: "The entry barriers to building large commercial aircraft are high, but if one country has the financial and industrial where withals to join the exclusive Airbus-Boeing club, it's China." (Flightglobal 2012d).
Other players are positioning themselves new markets with a strong political support from their governments, like Sukhoi and Irkut from the Russian Federation aviation conglomerate UAC, or Mitsubishi from Japan, all of them with product series in the final stages of development, aiming at the regional aviation market.
5.4.7 Outsource
The structure of the Aerospace Industry is cooperative and globalized and is divided in several categories according to their responsibility on the product design, service and specification. These categories are: Original Equipment Manufacturers (OEMs) and First, Second and Third tier suppliers, from a decreasing order of importance.
RACE2050© – FP7 314753
D 6.1 Report on the synopsis on the current framework conditions – FINAL – 06/11/2013 Page 88 of 147
OEMs tasks include the final assembly, the design of the product specifications and the large scale integration – going through intensive pre-project periods to select the best partners for the job. OEMs are increasingly systems integrators rather than airplane manufacturers, and their prevailing business strategy is to concentrate on core competencies and to do less of the direct manufacturing.
This strategy shifts production to tier-1 contract companies, leveraging an increased integration between OEMs and the Tier-1 suppliers, which therefore have to accept more risk and responsibilities - OEMs are increasingly seeking for Risk and Revenue Sharing Partners (RRSP). RRSP enable better risk managements and access to resources and technologies.
First tier suppliers provide the main components and entire subsystems to OEMs, such as propulsion, avionics, landing gear, engine manufacturers or airframe components; Tier-2 suppliers develop and manufacture parts as motors, hydraulic pumps and controls; and Tier-3 suppliers are responsible for the supply of basic products and components such as connectors, piston and solenoid (Clearwater 2010).
On the other hand, prime suppliers are focusing on enhancing its core offerings of complex systems manufacture in order to remain preferred partners in the value chain, and shifting part of the production to countries where the labour costs are inferior in order to present more competitive products to the market. This resulted in a further integration of the supply chain, with players outsourcing complex components manufacture and connecting their economic result to the final products performance, in order to enhance their results.
This share of investments and innovation risks allows the assignment of development risks to the player that is more suitable to handle them and the lowering of production costs. By this contractors are forced to increase productivity to save cost. In conjunction with risk sharing tier 1 companies pass cost saving pressure down the supply chain.
5.5 Conclusion Competitiveness situation
Road Concerning road transportation the European automotive sector in general is fairly well established on the world market as companies have proven during the economic and financial crisis. Sales, turnover and EBIT remained or recovered strengthening the pre-crisis good positioning. Beside the global scale also the intra-European situation has to be considered as there are big differences between the EU companies. In the last years a shift to East-Europe has taken place which is and will change intra-European competition and change the traditional industry. However, all companies have to face the same business challenges on a global level. The presence in the overseas markets is essential for automotive sector as demand growth is mostly located in emerging markets. The European automotive industry has a strong position in Asia, based on established brands and high level technologies related to constant R&D investments; this provides a good basis for the future to strengthen competitiveness. Thus Europe is especially competitive for high quality and high priced products and will benefit from rising incomes in the middle- and upper-class of emerging countries. Increasing wealth of low-income groups might not provide the same opportunities for European automotive industries as Asian originated companies can build on their strength in inexpensive car and component markets. Beside the inner-industry advantages for the European automotive industry the landscape of political decisions in several countries is essential to strengthen its competitiveness. As net exporter number one the openness of global markets is fundamental.
RACE2050© – FP7 314753
D 6.1 Report on the synopsis on the current framework conditions – FINAL – 06/11/2013 Page 89 of 147
Rail The global rail equipment industry is dominated by European manufacturers. But increasing competition, especially from China, will challenge this predominance, not to mention that the rail sector also has not been able to keep pace with global transport growth. The still monopolistic structure of the European rail sector in several countries is also a blockade regarding competitiveness. Big potential is accounted towards new high speed rail lines. This technology could strengthen the rail sector as a whole but also the European rail manufacture sector, which has leading know-how on this topic. This means the introduction of political measures to get access to emerging markets. Production and service abroad will become more and more important. Sea The European competitiveness position in the marine equipment industry is comparably far more positive as it represents almost 40% of the world market share. European equipment manufacturers are market leader in several niches. But even this sector has to face challenges coming along with changes, such as the shift towards Asia. In the last 15 years the world witnessed an exponential growth of Asian shipbuilding capacity, while European and most of the world production kept stabilized. By the end of the 2010s South Korea and also China became strong competitors. The challenge is, as already mentioned for the other transport sectors, to ensure access to emerging Asian markets without losing the strong position in the “traditional” markets. Therefore, political supporting measures are necessary. Air The European original equipment manufacturers in air transportation are in the forefront of the industry in terms of technology and market leadership. The great majority of revenues in the Aerospace and Defence industries originated in USA and Europe. Competition in the large civil aviation market is arising from emerging countries like China, Russia, Brazil and India, supported by the political willingness of its governments in increasing a share of the market. As growth in the aviation sector is based in Asia in the long term new competitors from emerging countries will adapt technologies and thus advance to serious competitors. Thus it is crucial to strengthen the technological advances of European companies further. Conclusion It can be stated that, to stay competitive the European transport sector needs to be present in emerging markets and to ensure exports. Political measures are necessary to support this market access in the emerging countries. European competitiveness is mainly based on technological advantage due to previous investments in R&D, efficient business organization and skilled labour force. As new competitors will try to take this position further investments in R&D are necessary as well as the critical observation of and proactive adaption to regional market shifts and potential shifts of demand in terms of quality and prices. With rising income and affordability of mobility in general, cars and flight trips in emerging countries price level disparities may increase. Due to this transportation and mobility might get more cost sensitive for both, production and services. The European transport industry needs to develop strategies to adapt to the transformation, shape it and remain competitive in the challenging environment.
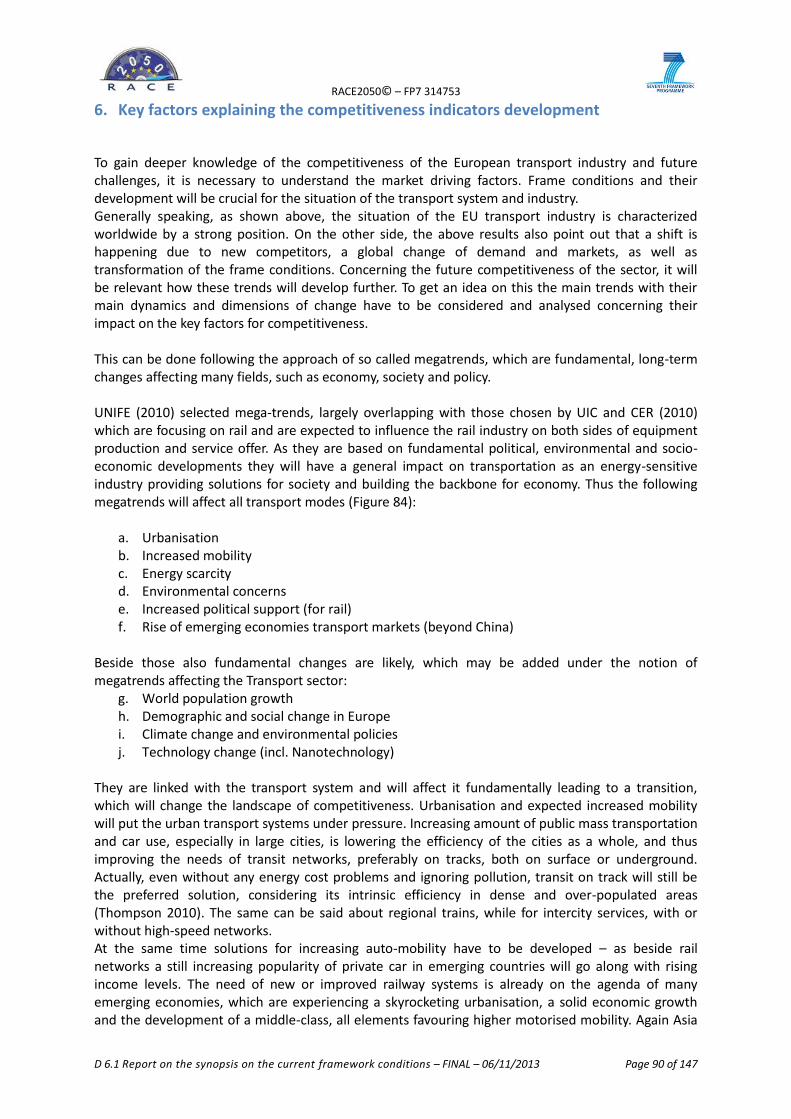
RACE2050© – FP7 314753
D 6.1 Report on the synopsis on the current framework conditions – FINAL – 06/11/2013 Page 90 of 147
6. Key factors explaining the competitiveness indicators development
To gain deeper knowledge of the competitiveness of the European transport industry and future challenges, it is necessary to understand the market driving factors. Frame conditions and their development will be crucial for the situation of the transport system and industry. Generally speaking, as shown above, the situation of the EU transport industry is characterized worldwide by a strong position. On the other side, the above results also point out that a shift is happening due to new competitors, a global change of demand and markets, as well as transformation of the frame conditions. Concerning the future competitiveness of the sector, it will be relevant how these trends will develop further. To get an idea on this the main trends with their main dynamics and dimensions of change have to be considered and analysed concerning their impact on the key factors for competitiveness. This can be done following the approach of so called megatrends, which are fundamental, long-term changes affecting many fields, such as economy, society and policy. UNIFE (2010) selected mega-trends, largely overlapping with those chosen by UIC and CER (2010) which are focusing on rail and are expected to influence the rail industry on both sides of equipment production and service offer. As they are based on fundamental political, environmental and socio-economic developments they will have a general impact on transportation as an energy-sensitive industry providing solutions for society and building the backbone for economy. Thus the following megatrends will affect all transport modes (Figure 84):
a. Urbanisation b. Increased mobility c. Energy scarcity d. Environmental concerns e. Increased political support (for rail) f. Rise of emerging economies transport markets (beyond China)
Beside those also fundamental changes are likely, which may be added under the notion of megatrends affecting the Transport sector:
g. World population growth h. Demographic and social change in Europe i. Climate change and environmental policies j. Technology change (incl. Nanotechnology)
They are linked with the transport system and will affect it fundamentally leading to a transition, which will change the landscape of competitiveness. Urbanisation and expected increased mobility will put the urban transport systems under pressure. Increasing amount of public mass transportation and car use, especially in large cities, is lowering the efficiency of the cities as a whole, and thus improving the needs of transit networks, preferably on tracks, both on surface or underground. Actually, even without any energy cost problems and ignoring pollution, transit on track will still be the preferred solution, considering its intrinsic efficiency in dense and over-populated areas (Thompson 2010). The same can be said about regional trains, while for intercity services, with or without high-speed networks. At the same time solutions for increasing auto-mobility have to be developed – as beside rail networks a still increasing popularity of private car in emerging countries will go along with rising income levels. The need of new or improved railway systems is already on the agenda of many emerging economies, which are experiencing a skyrocketing urbanisation, a solid economic growth and the development of a middle-class, all elements favouring higher motorised mobility. Again Asia
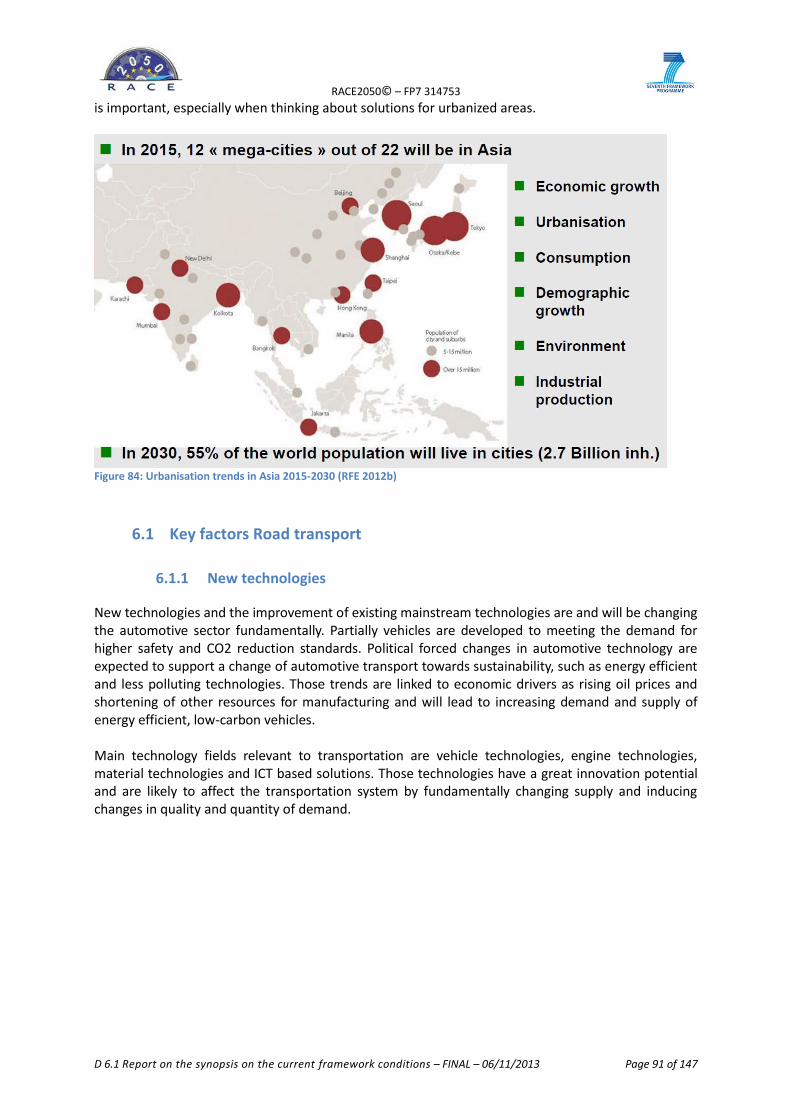
RACE2050© – FP7 314753
D 6.1 Report on the synopsis on the current framework conditions – FINAL – 06/11/2013 Page 91 of 147
is important, especially when thinking about solutions for urbanized areas.
Figure 84: Urbanisation trends in Asia 2015-2030 (RFE 2012b)
6.1 Key factors Road transport
6.1.1 New technologies
New technologies and the improvement of existing mainstream technologies are and will be changing the automotive sector fundamentally. Partially vehicles are developed to meeting the demand for higher safety and CO2 reduction standards. Political forced changes in automotive technology are expected to support a change of automotive transport towards sustainability, such as energy efficient and less polluting technologies. Those trends are linked to economic drivers as rising oil prices and shortening of other resources for manufacturing and will lead to increasing demand and supply of energy efficient, low-carbon vehicles. Main technology fields relevant to transportation are vehicle technologies, engine technologies, material technologies and ICT based solutions. Those technologies have a great innovation potential and are likely to affect the transportation system by fundamentally changing supply and inducing changes in quality and quantity of demand.
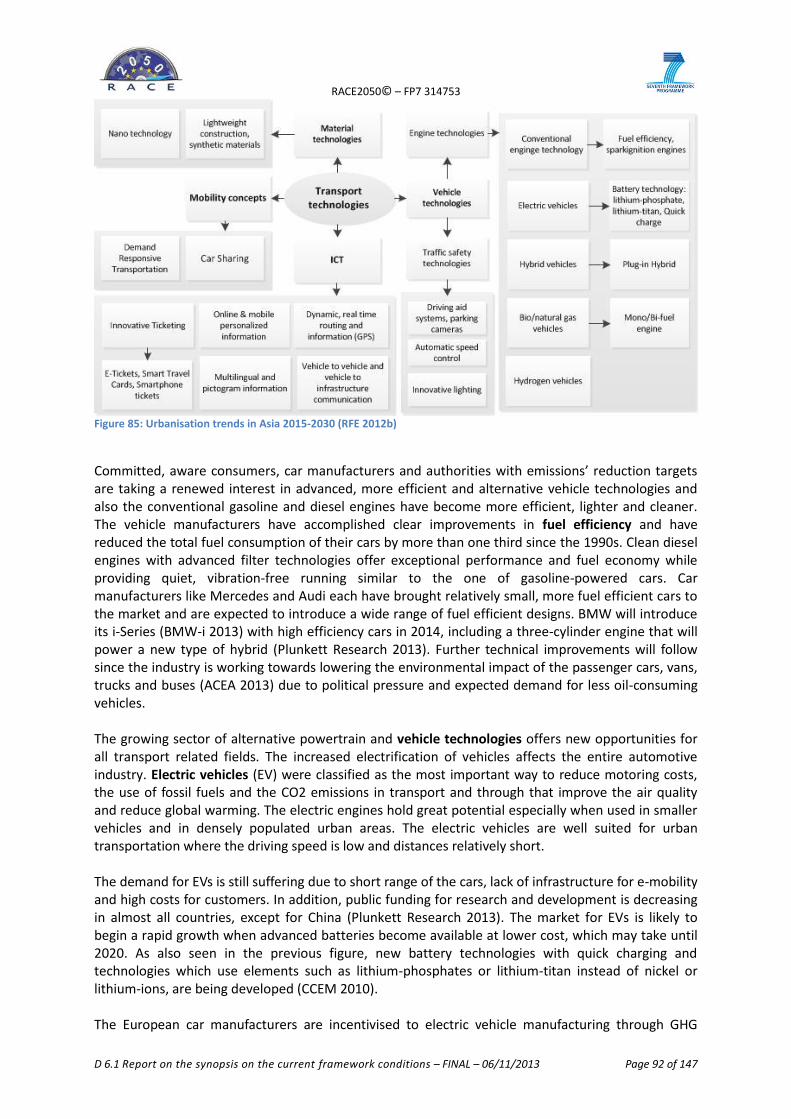
RACE2050© – FP7 314753
D 6.1 Report on the synopsis on the current framework conditions – FINAL – 06/11/2013 Page 92 of 147
Figure 85: Urbanisation trends in Asia 2015-2030 (RFE 2012b)
Committed, aware consumers, car manufacturers and authorities with emissions’ reduction targets are taking a renewed interest in advanced, more efficient and alternative vehicle technologies and also the conventional gasoline and diesel engines have become more efficient, lighter and cleaner. The vehicle manufacturers have accomplished clear improvements in fuel efficiency and have reduced the total fuel consumption of their cars by more than one third since the 1990s. Clean diesel engines with advanced filter technologies offer exceptional performance and fuel economy while providing quiet, vibration-free running similar to the one of gasoline-powered cars. Car manufacturers like Mercedes and Audi each have brought relatively small, more fuel efficient cars to the market and are expected to introduce a wide range of fuel efficient designs. BMW will introduce its i-Series (BMW-i 2013) with high efficiency cars in 2014, including a three-cylinder engine that will power a new type of hybrid (Plunkett Research 2013). Further technical improvements will follow since the industry is working towards lowering the environmental impact of the passenger cars, vans, trucks and buses (ACEA 2013) due to political pressure and expected demand for less oil-consuming vehicles. The growing sector of alternative powertrain and vehicle technologies offers new opportunities for all transport related fields. The increased electrification of vehicles affects the entire automotive industry. Electric vehicles (EV) were classified as the most important way to reduce motoring costs, the use of fossil fuels and the CO2 emissions in transport and through that improve the air quality and reduce global warming. The electric engines hold great potential especially when used in smaller vehicles and in densely populated urban areas. The electric vehicles are well suited for urban transportation where the driving speed is low and distances relatively short. The demand for EVs is still suffering due to short range of the cars, lack of infrastructure for e-mobility and high costs for customers. In addition, public funding for research and development is decreasing in almost all countries, except for China (Plunkett Research 2013). The market for EVs is likely to begin a rapid growth when advanced batteries become available at lower cost, which may take until 2020. As also seen in the previous figure, new battery technologies with quick charging and technologies which use elements such as lithium-phosphates or lithium-titan instead of nickel or lithium-ions, are being developed (CCEM 2010). The European car manufacturers are incentivised to electric vehicle manufacturing through GHG

RACE2050© – FP7 314753
D 6.1 Report on the synopsis on the current framework conditions – FINAL – 06/11/2013 Page 93 of 147
targets and rising fossil fuel costs. Advanced techniques are already developed in high-end vehicles and sports cars and for example Volkswagen, BMW, and Audi plan to be mass-producing electric cars in the near future (Roth, R. and Fine 2010). Not only the stricter limits on vehicle emissions and changing mobility behaviour, but also subsidies, tax reductions and other advantages such as free parking spaces are important for the success of alternative electric vehicles and other alternative engines on the market. For example in Switzerland most of the electric, hybrid and gas driven vehicles are completely or partly freed of vehicle taxes (BFE 2013). The French government has gone even further and is offering financial bonuses for the purchase of energy efficient and low emission vehicles. The highest incentives are paid for electric and hybrid vehicles, since their direct operating emissions are the lowest (Ministère de l'Ecologie 2013). The hybrid models have prevailed better than the pure electric vehicles, since they aren’t as dependent on the battery range, but lead to improved fuel efficiency, lower emissions and lower noise levels. The high gasoline costs and price-conscious consumers have been one reason for the strong demand for bi-fuel, gasoline-electric cars such as Toyota’s Prius (Plunkett Research 2013). The company has made investments which enable it to manufacture hybrid versions of many of its popular models, including the Camry and several versions of the Lexus. Hybrids are now available from a wide variety of manufacturers and the technology has steadily improved. Despite of the success of the Toyota hybrid models, the hybrid vehicles remain a very small fraction of the overall car and truck market due to their relatively high initial costs. Another alternative vehicle technology for the future is a hydrogen driven engine. Hydrogen (H) exists naturally only in combinations with other elements and needs to be extracted for example out of water (H2O) or methane (CH4) (Empa 2011). A hydrogen vehicle has a fuel cell, which produces electricity out of hydrogen and oxygen and possibly also a battery, which can provide additional energy to the vehicle (Hydropole 2009). Hydrogen vehicles have very low CO2 emissions and the technology would help to further reduce the transport sector’s dependency on oil. The main challenges for hydrogen are storing it (Empa 2011) and its very high initial costs compared with conventional vehicles (Bullinger 2009). So far there are no commercial passenger cars with hydrogen engines on the market, but hydrogen buses and vans already exist and several car manufacturers have been working on proto types (Bullinger 2009). A relevant transport related technology field is ICT. It can be applied on a variety of fields, such as real time, personalized mobility information, innovative ticketing, safety technologies and transport telematics. Currently the innovative ICT is a key competence in Europe, with very little innovation of this kind brought in from outside the EU’s automotive companies (EC 2010). It also highlights the need for continuous product innovation, if the employment level should be maintained or even improved in the ICT sector. ICT will play a crucial role on the future market and the EU should retain its leadership in the most automotive ICT sectors. ICT features can be used to differentiate market segments and raise car sales, which can help to solve the overcapacity problem the European automotive industry has been facing for decades. Investments in emerging and future technologies with software-intensive segments, like Advance Driver Assist Systems, Vehicle-to-vehicle/Vehicle-to-Infrastructure communication and autonomous driving are expected to cause a mobility revolution. New opportunities will be created and the given infrastructure will be restructured in order to enable the changing mobility behaviour and travel patterns. Autonomous vehicles use sensors which keep the vehicle on the correct driving lane and direction as well as control the speed. The sensors also measure the distance to other vehicles and obstacles and an emergency brake reacts if the distance becomes too short (Bullinger 2009). Existing safety technologies are closely linked with autonomous vehicle solutions for example in the form of
RACE2050© – FP7 314753
D 6.1 Report on the synopsis on the current framework conditions – FINAL – 06/11/2013 Page 94 of 147
automatic driving aid systems, parking cameras on board, innovative lighting and speed monitoring. Safety is a necessary aspect for vehicle manufacturers’ competitiveness. The automatic driving technologies can transform the way to drive and to make mobility decisions. They also have the potential to increase the road safety dramatically. According to a Swiss estimation an automatic driving system could reduce the road accidents by 50% (Verkehrs-Club Schweiz 2011). Besides safety technologies the demand for lighter vehicles is a major driver for the design and development of automotive materials. The weight of a car is crucial for its fuel consumption, which means that the fuel efficiency can be drastically improved by using such materials as aluminium and magnesium instead of steel (Bullinger 2009). Theories and predictions suggest that 10% reduction in vehicle weight can lead to a 6 to 8 per cent improvement in fuel efficiency, since 75% of the fuel consumption depends on the weight of a vehicle. At the same time the lightweight construction technologies and synthetic materials contribute to the GHG reduction targets of the OEMs until 2015 (Saidpour 2004). Especially European and Asian manufacturers have a long tradition in the field of innovative material research. The U.S. automobile industry’s strength is in steel and less in alternative materials. Therefore only a few domestic metallurgy programs in the States focus on lightweight materials (ACEA 2013). Steel has so far been the most cost-efficient material for vehicle manufacturing, which is one of the main reasons for the strong market position (Bullinger 2009). Also the way to operate, offer and sell mobility and new technologies is relevant for the transition in the transport sector. It brings certain challenges and opportunities for the industry and leads to new mobility concepts. The changing lifestyles, mobility behaviour and driving habits open the door for new market entries such as car sharing. Besides new product lines with hybrid and electric vehicles, the European manufacturers and other transport service providers have started to offer car sharing services such as drive-now by BMW and car-2-go by Daimler in several cities around the world. These services also include electric and hybrid vehicles. ZIPCAR is one of the world's leading car-sharing networks in the States (Roland Berger 2011) and Mobility is a Swiss version of such car sharing schemes, with around 100 000 members (Mobility 2013). Another form of car sharing is car-pooling, where private persons offer a space in their car on a route which they would in any case be driving. It improves the capacity use of private vehicles and enables cost sharing. Another new mobility concept contributing to the individual, more flexible transport services is Demand Responsive Transportation (DRT). It is something in between private and public modes and help optimizing capacity use and driven routes especially in rural and sparsely populated areas, where conventional public transport services are not available. The previously mentioned mobility concepts as well as ICT solutions are all supporting multimodal mobility and enable the combined use of different transport modes. The combination of public, private and active modes with the help of ICT-solutions enable individual, more sustainable transport services. There are already first attempts for improving the links between different transport modes at so called interchange points, where the transition from one regional or local transport system to another is possible. Some examples of the ICT solutions, which can be used at interchange points in order to support transfers, are multimodal, real time information services and electronic ticketing. Seamless tariffs and timetables are also important when changing from a local to a regional transport mode. Car and bike sharing services are ways to improve the connections to interchange points and to strengthen the use of multimodal services. Smooth, quick transfers between modes are essential for the attractiveness of public transport services.
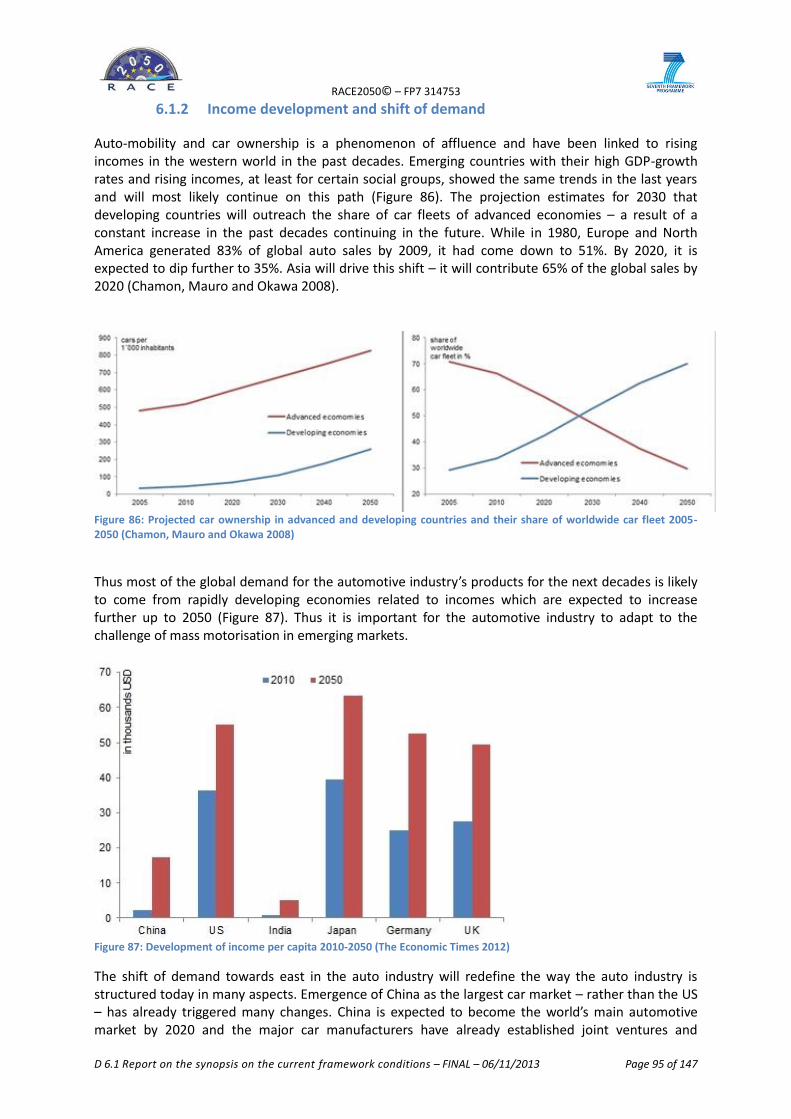
RACE2050© – FP7 314753
D 6.1 Report on the synopsis on the current framework conditions – FINAL – 06/11/2013 Page 95 of 147
6.1.2 Income development and shift of demand
Auto-mobility and car ownership is a phenomenon of affluence and have been linked to rising incomes in the western world in the past decades. Emerging countries with their high GDP-growth rates and rising incomes, at least for certain social groups, showed the same trends in the last years and will most likely continue on this path (Figure 86). The projection estimates for 2030 that developing countries will outreach the share of car fleets of advanced economies – a result of a constant increase in the past decades continuing in the future. While in 1980, Europe and North America generated 83% of global auto sales by 2009, it had come down to 51%. By 2020, it is expected to dip further to 35%. Asia will drive this shift – it will contribute 65% of the global sales by 2020 (Chamon, Mauro and Okawa 2008).
Figure 86: Projected car ownership in advanced and developing countries and their share of worldwide car fleet 2005-2050 (Chamon, Mauro and Okawa 2008)
Thus most of the global demand for the automotive industry’s products for the next decades is likely to come from rapidly developing economies related to incomes which are expected to increase further up to 2050 (Figure 87). Thus it is important for the automotive industry to adapt to the challenge of mass motorisation in emerging markets.
Figure 87: Development of income per capita 2010-2050 (The Economic Times 2012)
The shift of demand towards east in the auto industry will redefine the way the auto industry is structured today in many aspects. Emergence of China as the largest car market – rather than the US – has already triggered many changes. China is expected to become the world’s main automotive market by 2020 and the major car manufacturers have already established joint ventures and
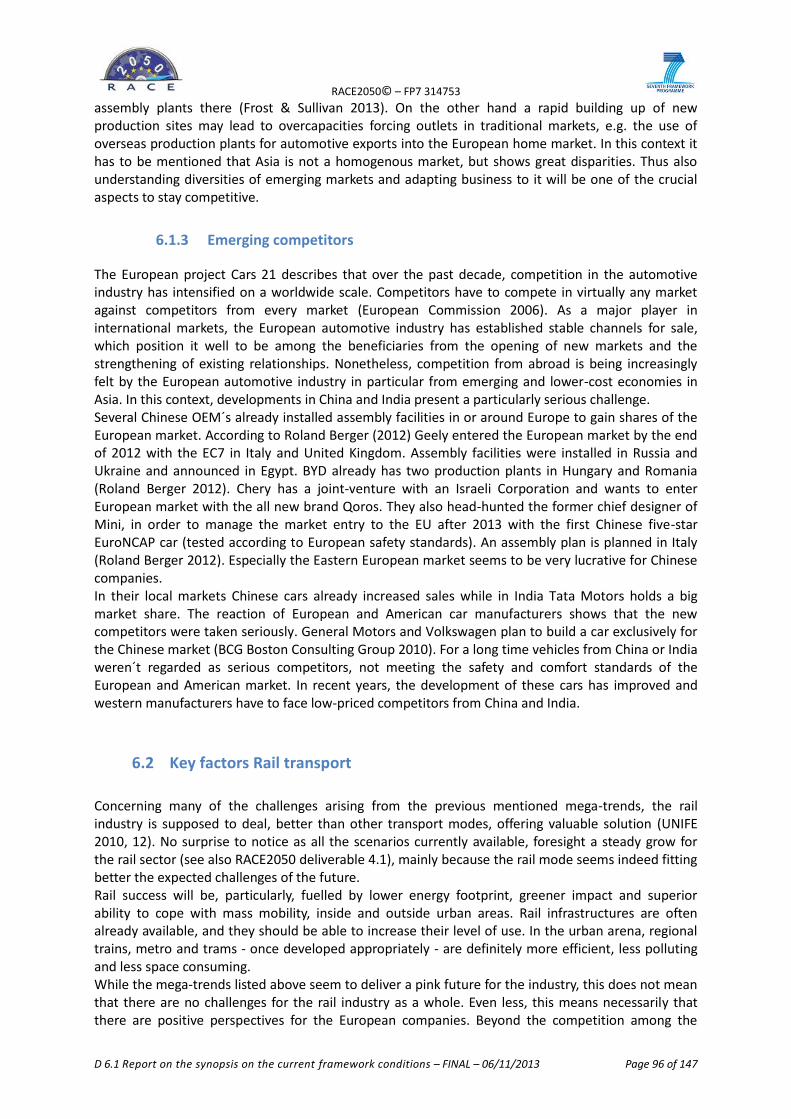
RACE2050© – FP7 314753
D 6.1 Report on the synopsis on the current framework conditions – FINAL – 06/11/2013 Page 96 of 147
assembly plants there (Frost & Sullivan 2013). On the other hand a rapid building up of new production sites may lead to overcapacities forcing outlets in traditional markets, e.g. the use of overseas production plants for automotive exports into the European home market. In this context it has to be mentioned that Asia is not a homogenous market, but shows great disparities. Thus also understanding diversities of emerging markets and adapting business to it will be one of the crucial aspects to stay competitive.
6.1.3 Emerging competitors
The European project Cars 21 describes that over the past decade, competition in the automotive industry has intensified on a worldwide scale. Competitors have to compete in virtually any market against competitors from every market (European Commission 2006). As a major player in international markets, the European automotive industry has established stable channels for sale, which position it well to be among the beneficiaries from the opening of new markets and the strengthening of existing relationships. Nonetheless, competition from abroad is being increasingly felt by the European automotive industry in particular from emerging and lower-cost economies in Asia. In this context, developments in China and India present a particularly serious challenge. Several Chinese OEM´s already installed assembly facilities in or around Europe to gain shares of the European market. According to Roland Berger (2012) Geely entered the European market by the end of 2012 with the EC7 in Italy and United Kingdom. Assembly facilities were installed in Russia and Ukraine and announced in Egypt. BYD already has two production plants in Hungary and Romania (Roland Berger 2012). Chery has a joint-venture with an Israeli Corporation and wants to enter European market with the all new brand Qoros. They also head-hunted the former chief designer of Mini, in order to manage the market entry to the EU after 2013 with the first Chinese five-star EuroNCAP car (tested according to European safety standards). An assembly plan is planned in Italy (Roland Berger 2012). Especially the Eastern European market seems to be very lucrative for Chinese companies. In their local markets Chinese cars already increased sales while in India Tata Motors holds a big market share. The reaction of European and American car manufacturers shows that the new competitors were taken seriously. General Motors and Volkswagen plan to build a car exclusively for the Chinese market (BCG Boston Consulting Group 2010). For a long time vehicles from China or India weren´t regarded as serious competitors, not meeting the safety and comfort standards of the European and American market. In recent years, the development of these cars has improved and western manufacturers have to face low-priced competitors from China and India.
6.2 Key factors Rail transport
Concerning many of the challenges arising from the previous mentioned mega-trends, the rail industry is supposed to deal, better than other transport modes, offering valuable solution (UNIFE 2010, 12). No surprise to notice as all the scenarios currently available, foresight a steady grow for the rail sector (see also RACE2050 deliverable 4.1), mainly because the rail mode seems indeed fitting better the expected challenges of the future. Rail success will be, particularly, fuelled by lower energy footprint, greener impact and superior ability to cope with mass mobility, inside and outside urban areas. Rail infrastructures are often already available, and they should be able to increase their level of use. In the urban arena, regional trains, metro and trams - once developed appropriately - are definitely more efficient, less polluting and less space consuming. While the mega-trends listed above seem to deliver a pink future for the industry, this does not mean that there are no challenges for the rail industry as a whole. Even less, this means necessarily that there are positive perspectives for the European companies. Beyond the competition among the
RACE2050© – FP7 314753
D 6.1 Report on the synopsis on the current framework conditions – FINAL – 06/11/2013 Page 97 of 147
transport modes industries, there are overall challenges and opportunities impacting the rail sector as a whole, without distinctions among the companies operating within such a market. Naturally some of these challenges can be more relevant for the rail equipment industry, and other can affect to a larger magnitude the rail service sector. Rail has to compete with other modes, especially concerning the expensive infrastructure and long-term investment decisions combined with less flexibility of the system, which is challenging competitiveness. On the other side rail may gain importance in replacing short-term flights and therefore strengthen its position compared to aviation.
6.2.1 Infrastructural investment
The rail sector has been traditionally supported by public authorities, especially in terms of infrastructural investment and subsidies for railways operators. Even in the most de-regulated markets, with the lower governmental intervention, the rail industry benefitted from public support, and this usually granted for political, social and economic reason, considering how (rail) transport is claimed as supporting the social fabric and a vibrant economy. Such a situation has changed in its magnitude, but not in its fundamentals. Considering how railways (in any of their shapes, from underground to high-speed train, from tram to regional service) do need an impressive infrastructural system and network to operate, the role of infrastructural investment is simply crucial (UNIFE 2010). The expected increased volumes of passengers and freight envisioned for the next decades will ask massive investment in the infrastructural networks, which need to be implemented not just on their quantitative aspects, but also in their qualities, including ability to cope with new technological enhanced vehicles, new operational systems, as well as lower maintenance cost, better exploitation and enhanced resilience (OECD 2012a). This would be formidable task in “normal” years, and naturally it is seen as one of the main social and economic problems of our time, considering the present difficulties. Mature economies are facing a financial crisis and public budget cuts (while emerging countries can face the infrastructure challenge with fewer headaches). More generally, especially for the equipment market, the rail industry advocates envision a two speed worlds (UNIFE 2012a). In mature economies rail industry will face severe reduction in the public expenses, the first to feel the breath of this trend has been some mega projects, alike High speed networks in Portugal, which has been cancelled. But naturally this will impact also other sub-fields and, for instance, can reduce the financial contribution for subsidised services (as, for instance, urban mass transit are). In both cases – end of mega projects and reduction of transit subsidies – the feedback for the rail industry will be severe. Budget constraints and public expense cuts can lead to a reduction of the services, and to brutal cut in the rail industry production volumes, therefore reducing its critical mass and its R&D program. The rail industry representatives stress how a reduced public support, combined with a strong financial crisis, and with, additionally, EU political instability, will be a formidable problem (UNIFE 2012a).
6.2.2 End of the (first) cycle of massive rail investment in China
The rail industry is also facing the end of the first wave of High speed train program in China, which has been a pushing factor for the (international) rail market (UNIFE 2012a, 76). This has led to more cautious forecast concerning the Asian market, which is expect to grow, in the short-period, even slower than mature economies (UNIFE 2012a). The good news for the rail industry is that, even considering a strong downturn in the Asia and Pacific market (which is expected to be have the world lowest CAGR for 2015-2017 compared to 2009-2011), and the fact that there is not on the horizon, so far, a “second China”, additional factors will push the rail sector. As a matter of fact, rail is gaining momentum all around the world, and not just in BRIC countries; the “next-eleven” economies are definitely interested about develop rail programs, and this is one of the
RACE2050© – FP7 314753
D 6.1 Report on the synopsis on the current framework conditions – FINAL – 06/11/2013 Page 98 of 147
main reasons behind those positive outlooks. “New nomadism”, growing request of mobility, trends towards urbanisation (and thus for transit transport facilities) are among the reason of rail positive forecasts. Jut to give an example, “India plan is to set up a metro or comparable urban transport system in every city of over three million inhabitants” (UNIFE 2012a, 76).
6.2.3 Emerging competitors
The European railways operators industry is, so far, based on “national champions”, with a low or very low access from foreign competitors. As better developed in RACE2050 deliverable 4.1, Europe rail transport services are experience a higher degree of ´Europeanisation´, although the market opportunities and the framework condition are still not adequate to develop a proper international competition. The rail equipments industry is, instead, fully engaged in a fully international market. The European companies have been able to gain a world leadership, based on a solid ´domestic´ market and by high R&D program. The astonishing development of emerging economies and their massive investment in the transport sector have favourite the health of the European industry. Nevertheless, in the meanwhile, those growing economies have been able to develop sturdy local producers, which first gained their domestic market and, then, step out, embittering the global competition (UNIFE 2012a). In other words, new actors are already near to achieve (regional) dominant position, and other are entering the stage, while the traditional players (mainly EU based) are reducing their business opportunity (Worldwatch 2010). The EU rail equipment lobby is thus claiming a “Chinese threat”, which is based on low cost products, exploitation of technology transfers, robust domestic R&D development, integrated projects proposal, political and financial ability to enter new markets (KPMG 2010). But also solid domestic market opportunities give an additional strength to the Asian industry (UNIFE 2012a) . Additionally, while European rail markets are claimed to be open to any company, EU industry states how many other foreign markets have de facto hurdles (alike Japan), or are partially accessible (as CIS area), or – as China – reachable only under the condition of technological transfers (RFE 2012a) (Figure 88).
Figure 88: Chinese manufacturing industry wiping away European firms (UNIFE 2009, 52)
6.2.4 Research and development for energy savings
The European rail industry, however, will not be able to compete with rivals from developing countries on the basis of price. Only continuous innovation and quality improvement can enable European companies to compete successfully. (ERRAC 2011, 3) As reported above, rail industry is under pressure and it needs to develop new and innovative solutions. The key point for the EU rail industry can be identified in business preparedness, R&D,

RACE2050© – FP7 314753
D 6.1 Report on the synopsis on the current framework conditions – FINAL – 06/11/2013 Page 99 of 147
continental harmonization of national rail systems (a topic developed in RACE2050 deliverable 4.1), as well as radical changes in the industry offer. Research and development are surely key factors of the EU rail industry: so far they have been the driving force of its success. This becomes more relevant while we put on the stage energy saving issues and environmental concerns, which can be addressed by technological innovations. There is a broader request “to reduce fleet and infrastructure operation and maintenance costs [and] to develop innovative and advanced rolling stock, control and infrastructure solutions with cost competitive technologies, including retrofitting and reuse solutions” (Amoore and Jaiswal 2012, 16). The R&D topic is entering the agenda also concerning long term prospective, even more considering the long life-cycle of rail device. The second issue is the life and weight of rolling stock. At the present time rail vehicles may have a life of 40 years or more. However, as stated elsewhere, much innovation is increasing exponentially and it is questionable whether 40 year old rolling stock can be sufficiently updated by refitting interiors and running gear to meet customer expectation, as the comparison will be made with the comfort and convenience of personal transport that will have developed through several generations by 2050. Research and demonstration activities in construction have developed techniques for reusing structural members from buildings that are no longer suitable for their original use. The carbon footprint of the new building may be significantly reduced by reusing the structural members from a building that has no further useful life in its present location. Reuse of body components in a new vehicle may be possible especially with the introduction of composite materials technology. (Amoore and Jaiswal 2012, 15) However, ERRAC research also noticed how R&D polices need to be fine-tune, and how “the benefits from innovation are not always easily determined; this requires the development of a clear and agreed approach for assessing innovation” (Amoore and Jaiswal 2012, 16). Moreover, has been said that there is a “poor understanding amongst innovators of the business case or how to present it” and “lack of a purpose designed railway test facility” (Amoore and Jaiswal 2012, 16). In other words, there is the risk of develop innovation just for the sake of innovation, with inadequate business exploitation of technological achievement and poor understanding of the market expectations. There can be also some misinterpretation, or even diverging agendas within the EU rail sector. For instance, reducing maintenance cost will be more relevant in the future, although some of the buyers, so far, seem to have little incentives in accept the industry most innovative products: generally speaking, the main focus is still “on short term economics, particularly first installed costs regardless of whole life issues, and the influence of political cycles”, and ERRAC research claimed a “poor understanding amongst innovators of the business case or how to present it, as well as “lack of understanding and management of innovation risk” (Amoore and Jaiswal 2012, 16). Even more, due to budget restraints, not only in mature economies, some market niches are easily accessed by “low-cost” products, with basic technology and no-frills attitudes (HeiterBlick firm in Leipzig, Germany, is an example of this). In other words, rail industry and rail product buyers face a decisive dilemma; budget constrains push to focus on price and maintenance costs, exactly while maintenance costs, energy saving issue and flexible (and reusable) products push to buy “expensive” (but in-the-long-term cheaper) devices. So, “the established manufacturers should be able to persuade the British and other European governments that it is worth paying for their quality, reliability and sophistication. But the case will become harder to make the more sophisticated and competitive China’s products become. However clever train makers’ latest products, complacency is currently a luxury none of them can afford” (Wright 2010).
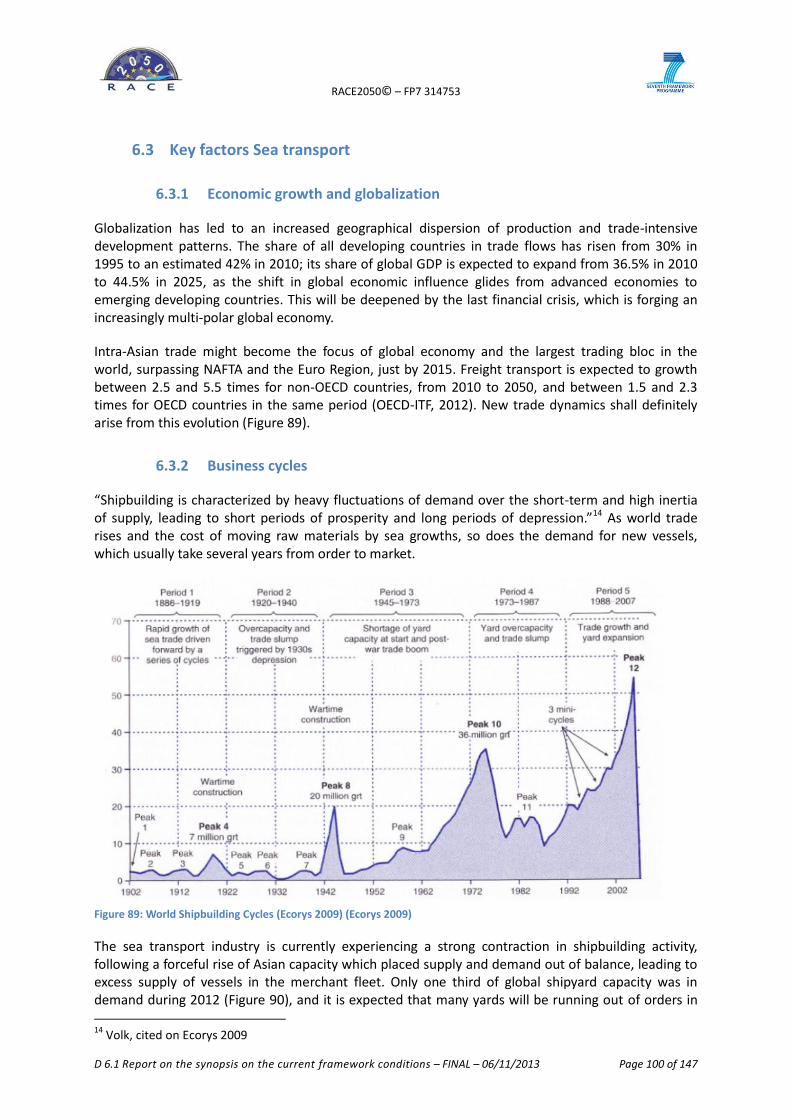
RACE2050© – FP7 314753
D 6.1 Report on the synopsis on the current framework conditions – FINAL – 06/11/2013 Page 100 of 147
6.3 Key factors Sea transport
6.3.1 Economic growth and globalization
Globalization has led to an increased geographical dispersion of production and trade-intensive development patterns. The share of all developing countries in trade flows has risen from 30% in 1995 to an estimated 42% in 2010; its share of global GDP is expected to expand from 36.5% in 2010 to 44.5% in 2025, as the shift in global economic influence glides from advanced economies to emerging developing countries. This will be deepened by the last financial crisis, which is forging an increasingly multi-polar global economy.
Intra-Asian trade might become the focus of global economy and the largest trading bloc in the world, surpassing NAFTA and the Euro Region, just by 2015. Freight transport is expected to growth between 2.5 and 5.5 times for non-OECD countries, from 2010 to 2050, and between 1.5 and 2.3 times for OECD countries in the same period (OECD-ITF, 2012). New trade dynamics shall definitely arise from this evolution (Figure 89).
6.3.2 Business cycles
“Shipbuilding is characterized by heavy fluctuations of demand over the short-term and high inertia of supply, leading to short periods of prosperity and long periods of depression.”14 As world trade rises and the cost of moving raw materials by sea growths, so does the demand for new vessels, which usually take several years from order to market.
Figure 89: World Shipbuilding Cycles (Ecorys 2009) (Ecorys 2009)
The sea transport industry is currently experiencing a strong contraction in shipbuilding activity, following a forceful rise of Asian capacity which placed supply and demand out of balance, leading to excess supply of vessels in the merchant fleet. Only one third of global shipyard capacity was in demand during 2012 (Figure 90), and it is expected that many yards will be running out of orders in 14
Volk, cited on Ecorys 2009
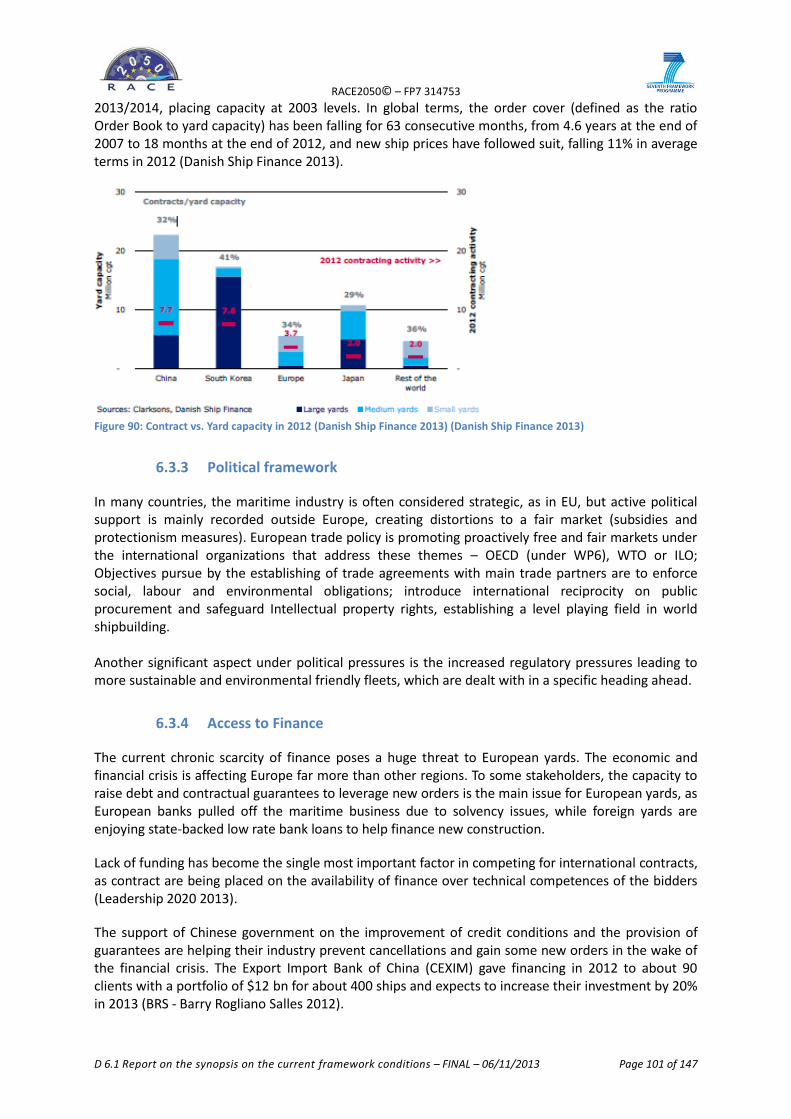
RACE2050© – FP7 314753
D 6.1 Report on the synopsis on the current framework conditions – FINAL – 06/11/2013 Page 101 of 147
2013/2014, placing capacity at 2003 levels. In global terms, the order cover (defined as the ratio Order Book to yard capacity) has been falling for 63 consecutive months, from 4.6 years at the end of 2007 to 18 months at the end of 2012, and new ship prices have followed suit, falling 11% in average terms in 2012 (Danish Ship Finance 2013).
Figure 90: Contract vs. Yard capacity in 2012 (Danish Ship Finance 2013) (Danish Ship Finance 2013)
6.3.3 Political framework
In many countries, the maritime industry is often considered strategic, as in EU, but active political support is mainly recorded outside Europe, creating distortions to a fair market (subsidies and protectionism measures). European trade policy is promoting proactively free and fair markets under the international organizations that address these themes – OECD (under WP6), WTO or ILO; Objectives pursue by the establishing of trade agreements with main trade partners are to enforce social, labour and environmental obligations; introduce international reciprocity on public procurement and safeguard Intellectual property rights, establishing a level playing field in world shipbuilding. Another significant aspect under political pressures is the increased regulatory pressures leading to more sustainable and environmental friendly fleets, which are dealt with in a specific heading ahead.
6.3.4 Access to Finance
The current chronic scarcity of finance poses a huge threat to European yards. The economic and financial crisis is affecting Europe far more than other regions. To some stakeholders, the capacity to raise debt and contractual guarantees to leverage new orders is the main issue for European yards, as European banks pulled off the maritime business due to solvency issues, while foreign yards are enjoying state-backed low rate bank loans to help finance new construction.
Lack of funding has become the single most important factor in competing for international contracts, as contract are being placed on the availability of finance over technical competences of the bidders (Leadership 2020 2013).
The support of Chinese government on the improvement of credit conditions and the provision of guarantees are helping their industry prevent cancellations and gain some new orders in the wake of the financial crisis. The Export Import Bank of China (CEXIM) gave financing in 2012 to about 90 clients with a portfolio of $12 bn for about 400 ships and expects to increase their investment by 20% in 2013 (BRS - Barry Rogliano Salles 2012).
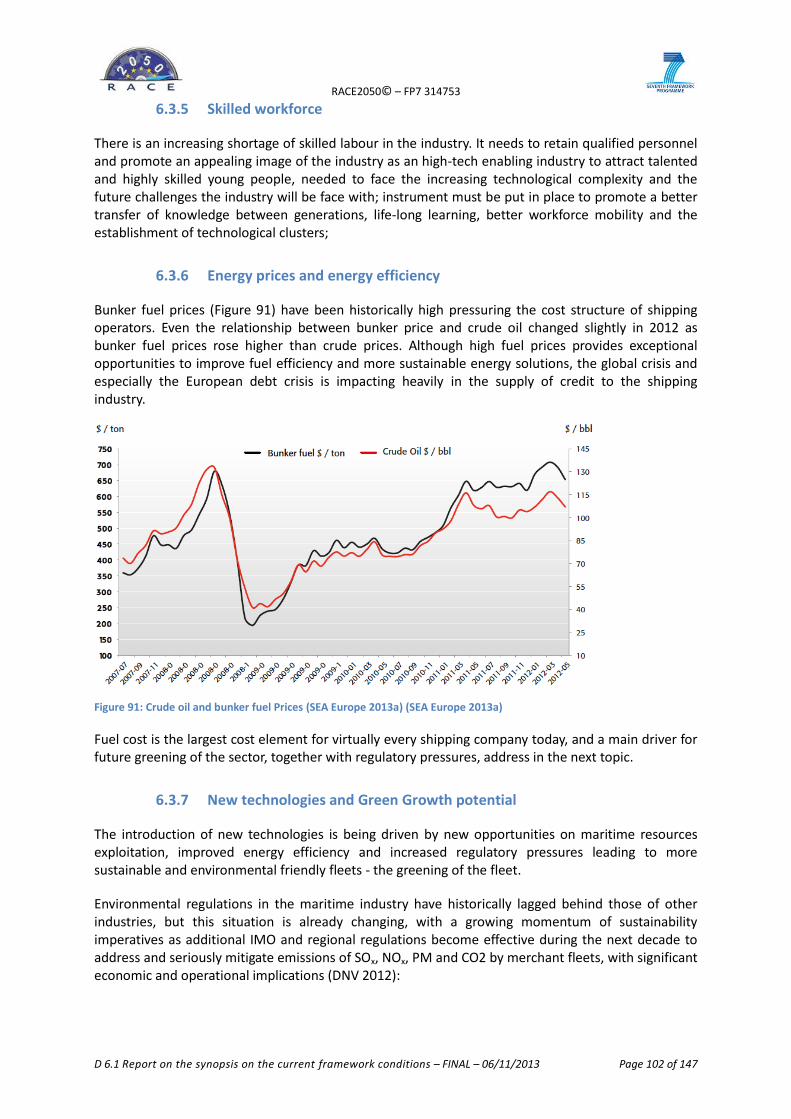
RACE2050© – FP7 314753
D 6.1 Report on the synopsis on the current framework conditions – FINAL – 06/11/2013 Page 102 of 147
6.3.5 Skilled workforce
There is an increasing shortage of skilled labour in the industry. It needs to retain qualified personnel and promote an appealing image of the industry as an high-tech enabling industry to attract talented and highly skilled young people, needed to face the increasing technological complexity and the future challenges the industry will be face with; instrument must be put in place to promote a better transfer of knowledge between generations, life-long learning, better workforce mobility and the establishment of technological clusters;
6.3.6 Energy prices and energy efficiency
Bunker fuel prices (Figure 91) have been historically high pressuring the cost structure of shipping operators. Even the relationship between bunker price and crude oil changed slightly in 2012 as bunker fuel prices rose higher than crude prices. Although high fuel prices provides exceptional opportunities to improve fuel efficiency and more sustainable energy solutions, the global crisis and especially the European debt crisis is impacting heavily in the supply of credit to the shipping industry.
Figure 91: Crude oil and bunker fuel Prices (SEA Europe 2013a) (SEA Europe 2013a)
Fuel cost is the largest cost element for virtually every shipping company today, and a main driver for future greening of the sector, together with regulatory pressures, address in the next topic.
6.3.7 New technologies and Green Growth potential
The introduction of new technologies is being driven by new opportunities on maritime resources exploitation, improved energy efficiency and increased regulatory pressures leading to more sustainable and environmental friendly fleets - the greening of the fleet.
Environmental regulations in the maritime industry have historically lagged behind those of other industries, but this situation is already changing, with a growing momentum of sustainability imperatives as additional IMO and regional regulations become effective during the next decade to address and seriously mitigate emissions of SOx, NOx, PM and CO2 by merchant fleets, with significant economic and operational implications (DNV 2012):

RACE2050© – FP7 314753
D 6.1 Report on the synopsis on the current framework conditions – FINAL – 06/11/2013 Page 103 of 147
2015 – 0.1% sulphur emission limit in Emission Control Areas (ECAs15) - (MARPOL 73/78 Annex VI) and Directive 2005/33/EC;
2016 – NOx tier III for new buildings (MARPOL 73/78 Annex VI);
2020 – 0.5% global sulphur limit and possible entry into force of Recycling Convention and mandatory ballast water treatment on all ships;
To comply with new regulations, operators will have to choose between installing exhaust gas cleaning systems (scrubbers) or switching to low sulphur fuels like LNG, and incorporate already available technologies to enhance the combustion cycle and lower the temperature of combustion as (EMEC 2010):
Miller Cycle;
2-Stage Turbo charging;
Fuel injection equipment (fuel injection valves and combustion pumps);
Humid Air Motors;
Direct Water Injection;
Exhaust gas recirculation;
Fuel-Water Emulsification.
The opportunities lie in both the new building and retrofitting markets, as emission limits are enforced globally.
The competitive position the European shipbuilding Industry to address this new opportunities is relatively strong, supported on experience gained while building high value and high complexity ships and marine equipment for special purpose vessels as dredging and offshore exploration, and innovation promotion within the industry.
6.3.8 Gas fuelled ships/fuel Cells (DNV 2012).
LNG is currently installed as fuel on 30 vessels as of July, 2012, and there is a new building order of approximately the same number of vessels. The main technical issues regarding its wide spread utilization are handling and bunkering; and containment systems on board, due to the low temperatures involved, requiring specialized alloys.
Use of LNG as fuel will reduce the NOx emissions by approximately 90% on a lean burn gas fuelled engine, and the SOx and particulate matters emissions are eliminated. The CO2 emissions are about 20% lower because of the lower carbon content of LNG. However, the Release of unburned methane from engines (methane slip) is a challenge, especially for 4-stroke dual fuel engines, as the greenhouse gas effect of methane is between 20 and 25 times higher than for CO2.
6.3.9 Shipping in polar waters
The development of Arctic shipping routes, a paradox consequence from climate change, will require the development of new technologies to guarantee stringent safety and security conditions to all involved: “Ships operating in the Arctic and Antarctic environments are exposed to a number of unique risks. Poor weather conditions and the relative lack of good charts, communication systems and other navigational aids pose challenges for mariners. The remoteness of the areas makes rescue or clean-up operations difficult and costly. Cold temperatures may reduce the effectiveness of numerous components of the ship, ranging from deck machinery and emergency equipment to sea suctions. When ice is present, it can impose additional loads on the hull, propulsion system and appendages.” (IMO 2012)
15
The North and Baltic Seas in Europe, and North American Atlantic and Pacific shores
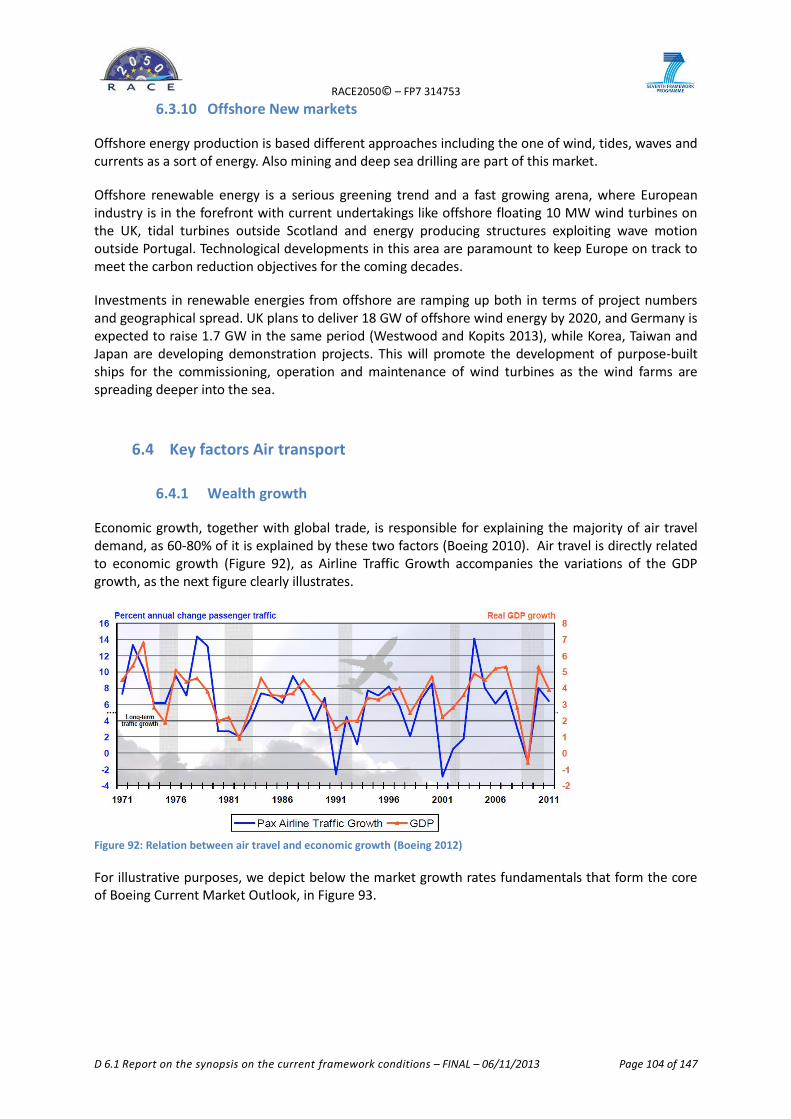
RACE2050© – FP7 314753
D 6.1 Report on the synopsis on the current framework conditions – FINAL – 06/11/2013 Page 104 of 147
6.3.10 Offshore New markets
Offshore energy production is based different approaches including the one of wind, tides, waves and currents as a sort of energy. Also mining and deep sea drilling are part of this market.
Offshore renewable energy is a serious greening trend and a fast growing arena, where European industry is in the forefront with current undertakings like offshore floating 10 MW wind turbines on the UK, tidal turbines outside Scotland and energy producing structures exploiting wave motion outside Portugal. Technological developments in this area are paramount to keep Europe on track to meet the carbon reduction objectives for the coming decades.
Investments in renewable energies from offshore are ramping up both in terms of project numbers and geographical spread. UK plans to deliver 18 GW of offshore wind energy by 2020, and Germany is expected to raise 1.7 GW in the same period (Westwood and Kopits 2013), while Korea, Taiwan and Japan are developing demonstration projects. This will promote the development of purpose-built ships for the commissioning, operation and maintenance of wind turbines as the wind farms are spreading deeper into the sea.
6.4 Key factors Air transport
6.4.1 Wealth growth
Economic growth, together with global trade, is responsible for explaining the majority of air travel demand, as 60-80% of it is explained by these two factors (Boeing 2010). Air travel is directly related to economic growth (Figure 92), as Airline Traffic Growth accompanies the variations of the GDP growth, as the next figure clearly illustrates.
Figure 92: Relation between air travel and economic growth (Boeing 2012)
For illustrative purposes, we depict below the market growth rates fundamentals that form the core of Boeing Current Market Outlook, in Figure 93.
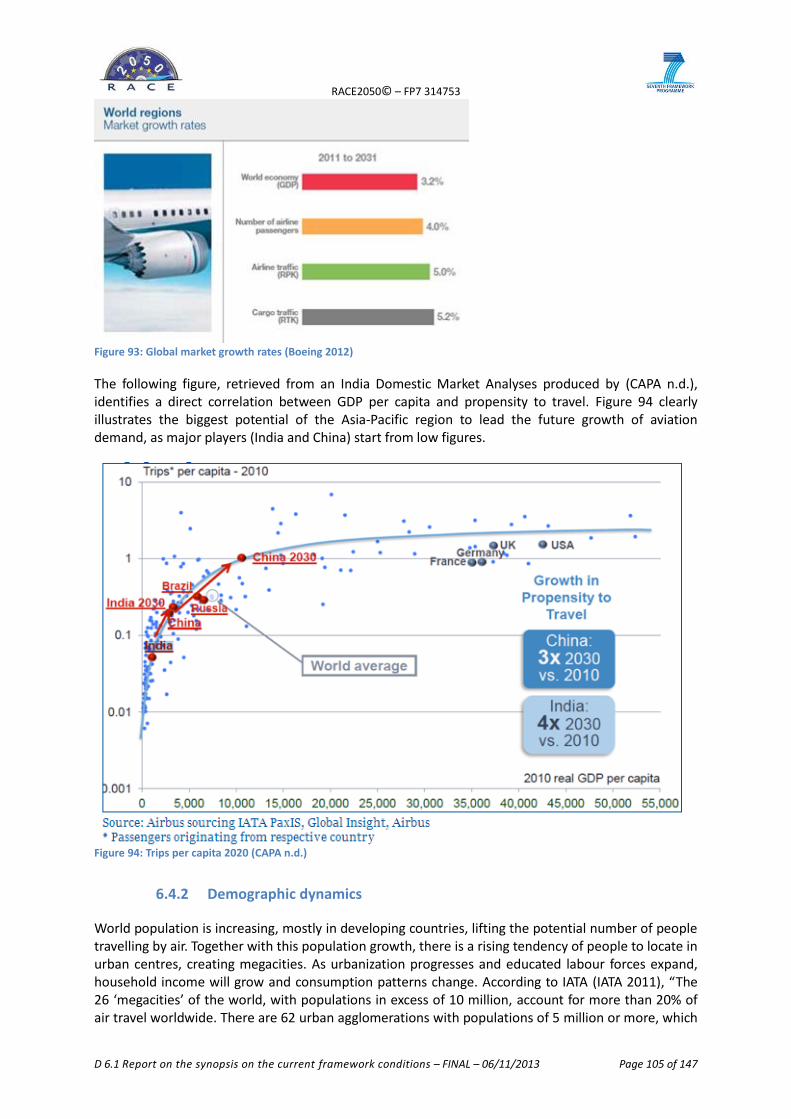
RACE2050© – FP7 314753
D 6.1 Report on the synopsis on the current framework conditions – FINAL – 06/11/2013 Page 105 of 147
Figure 93: Global market growth rates (Boeing 2012)
The following figure, retrieved from an India Domestic Market Analyses produced by (CAPA n.d.), identifies a direct correlation between GDP per capita and propensity to travel. Figure 94 clearly illustrates the biggest potential of the Asia-Pacific region to lead the future growth of aviation demand, as major players (India and China) start from low figures.
Figure 94: Trips per capita 2020 (CAPA n.d.)
6.4.2 Demographic dynamics
World population is increasing, mostly in developing countries, lifting the potential number of people travelling by air. Together with this population growth, there is a rising tendency of people to locate in urban centres, creating megacities. As urbanization progresses and educated labour forces expand, household income will grow and consumption patterns change. According to IATA (IATA 2011), “The 26 ‘megacities’ of the world, with populations in excess of 10 million, account for more than 20% of air travel worldwide. There are 62 urban agglomerations with populations of 5 million or more, which
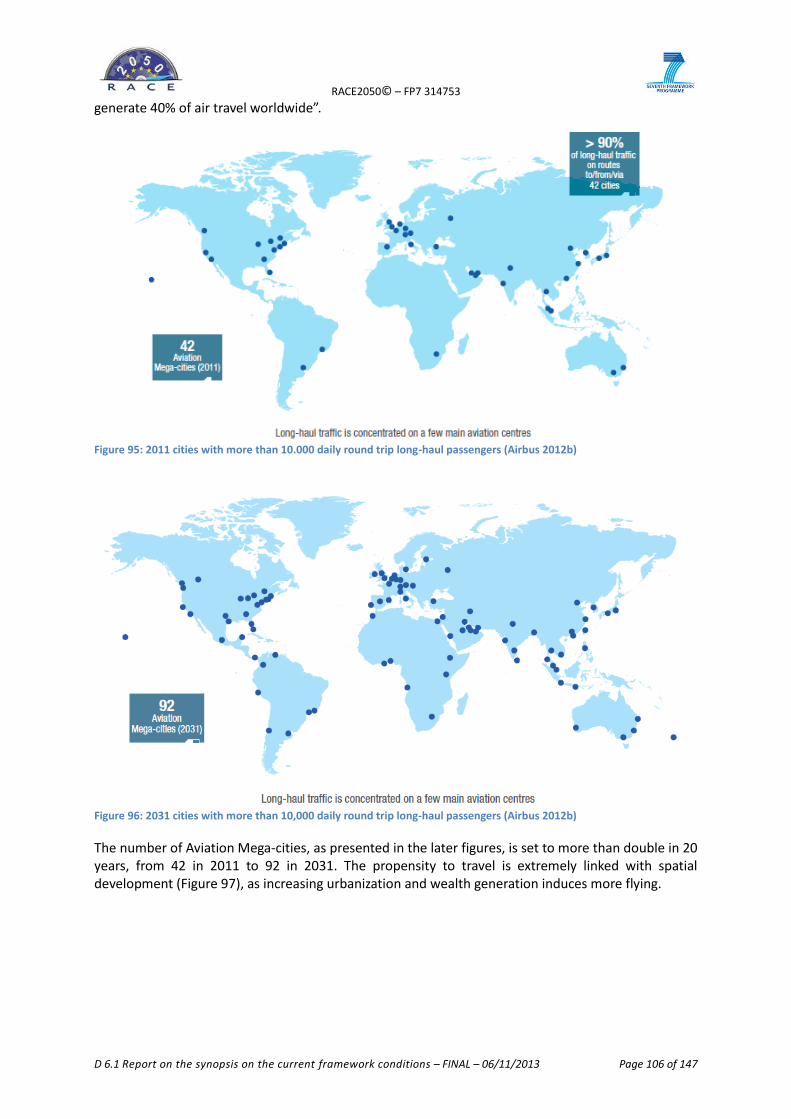
RACE2050© – FP7 314753
D 6.1 Report on the synopsis on the current framework conditions – FINAL – 06/11/2013 Page 106 of 147
generate 40% of air travel worldwide”.
Figure 95: 2011 cities with more than 10.000 daily round trip long-haul passengers (Airbus 2012b)
Figure 96: 2031 cities with more than 10,000 daily round trip long-haul passengers (Airbus 2012b)
The number of Aviation Mega-cities, as presented in the later figures, is set to more than double in 20 years, from 42 in 2011 to 92 in 2031. The propensity to travel is extremely linked with spatial development (Figure 97), as increasing urbanization and wealth generation induces more flying.
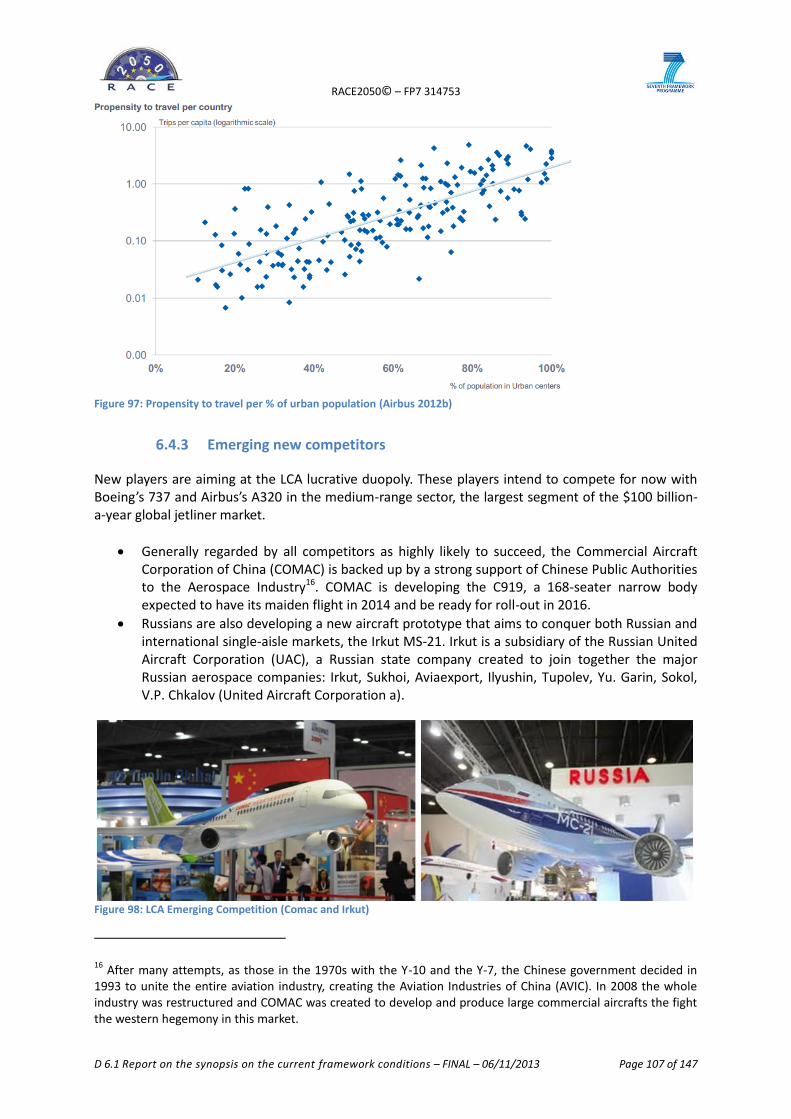
RACE2050© – FP7 314753
D 6.1 Report on the synopsis on the current framework conditions – FINAL – 06/11/2013 Page 107 of 147
Figure 97: Propensity to travel per % of urban population (Airbus 2012b)
6.4.3 Emerging new competitors
New players are aiming at the LCA lucrative duopoly. These players intend to compete for now with Boeing’s 737 and Airbus’s A320 in the medium-range sector, the largest segment of the $100 billion-a-year global jetliner market.
Generally regarded by all competitors as highly likely to succeed, the Commercial Aircraft Corporation of China (COMAC) is backed up by a strong support of Chinese Public Authorities to the Aerospace Industry16. COMAC is developing the C919, a 168-seater narrow body expected to have its maiden flight in 2014 and be ready for roll-out in 2016.
Russians are also developing a new aircraft prototype that aims to conquer both Russian and international single-aisle markets, the Irkut MS-21. Irkut is a subsidiary of the Russian United Aircraft Corporation (UAC), a Russian state company created to join together the major Russian aerospace companies: Irkut, Sukhoi, Aviaexport, Ilyushin, Tupolev, Yu. Garin, Sokol, V.P. Chkalov (United Aircraft Corporation a).
Figure 98: LCA Emerging Competition (Comac and Irkut)
16 After many attempts, as those in the 1970s with the Y-10 and the Y-7, the Chinese government decided in
1993 to unite the entire aviation industry, creating the Aviation Industries of China (AVIC). In 2008 the whole industry was restructured and COMAC was created to develop and produce large commercial aircrafts the fight the western hegemony in this market.
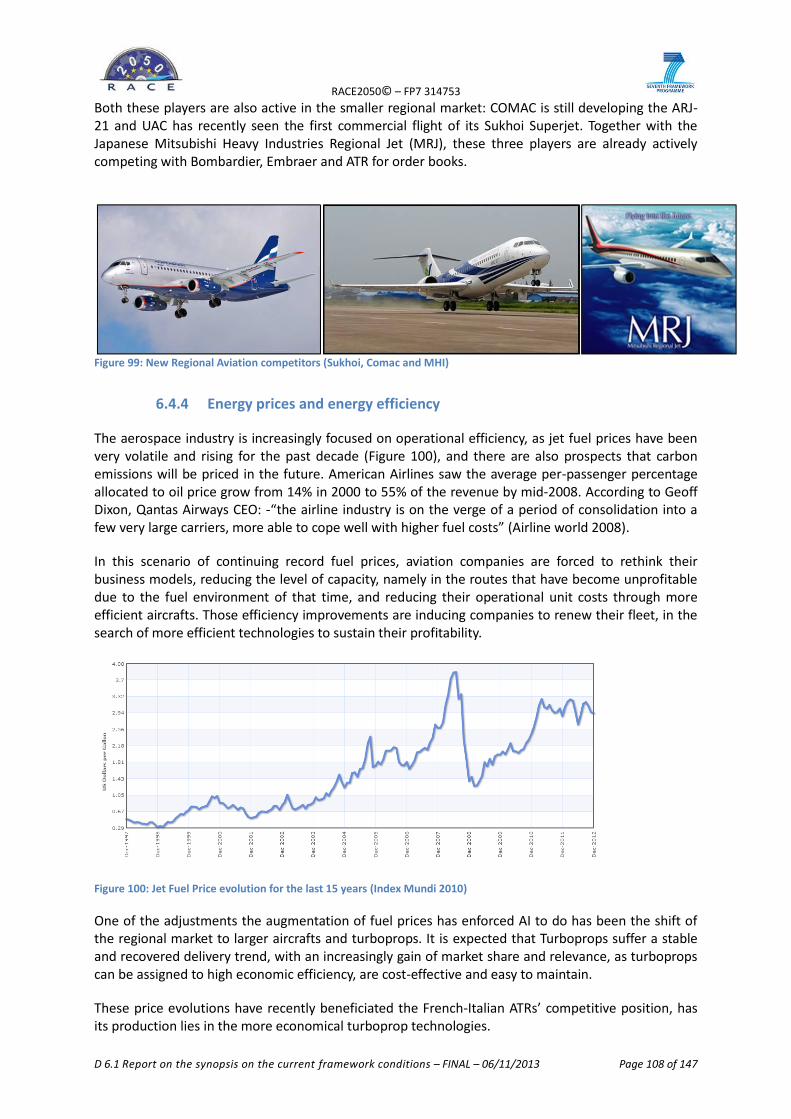
RACE2050© – FP7 314753
D 6.1 Report on the synopsis on the current framework conditions – FINAL – 06/11/2013 Page 108 of 147
Both these players are also active in the smaller regional market: COMAC is still developing the ARJ-21 and UAC has recently seen the first commercial flight of its Sukhoi Superjet. Together with the Japanese Mitsubishi Heavy Industries Regional Jet (MRJ), these three players are already actively competing with Bombardier, Embraer and ATR for order books.
Figure 99: New Regional Aviation competitors (Sukhoi, Comac and MHI)
6.4.4 Energy prices and energy efficiency
The aerospace industry is increasingly focused on operational efficiency, as jet fuel prices have been very volatile and rising for the past decade (Figure 100), and there are also prospects that carbon emissions will be priced in the future. American Airlines saw the average per-passenger percentage allocated to oil price grow from 14% in 2000 to 55% of the revenue by mid-2008. According to Geoff Dixon, Qantas Airways CEO: -“the airline industry is on the verge of a period of consolidation into a few very large carriers, more able to cope well with higher fuel costs” (Airline world 2008).
In this scenario of continuing record fuel prices, aviation companies are forced to rethink their business models, reducing the level of capacity, namely in the routes that have become unprofitable due to the fuel environment of that time, and reducing their operational unit costs through more efficient aircrafts. Those efficiency improvements are inducing companies to renew their fleet, in the search of more efficient technologies to sustain their profitability.
Figure 100: Jet Fuel Price evolution for the last 15 years (Index Mundi 2010)
One of the adjustments the augmentation of fuel prices has enforced AI to do has been the shift of the regional market to larger aircrafts and turboprops. It is expected that Turboprops suffer a stable and recovered delivery trend, with an increasingly gain of market share and relevance, as turboprops can be assigned to high economic efficiency, are cost-effective and easy to maintain.
These price evolutions have recently beneficiated the French-Italian ATRs’ competitive position, has its production lies in the more economical turboprop technologies.
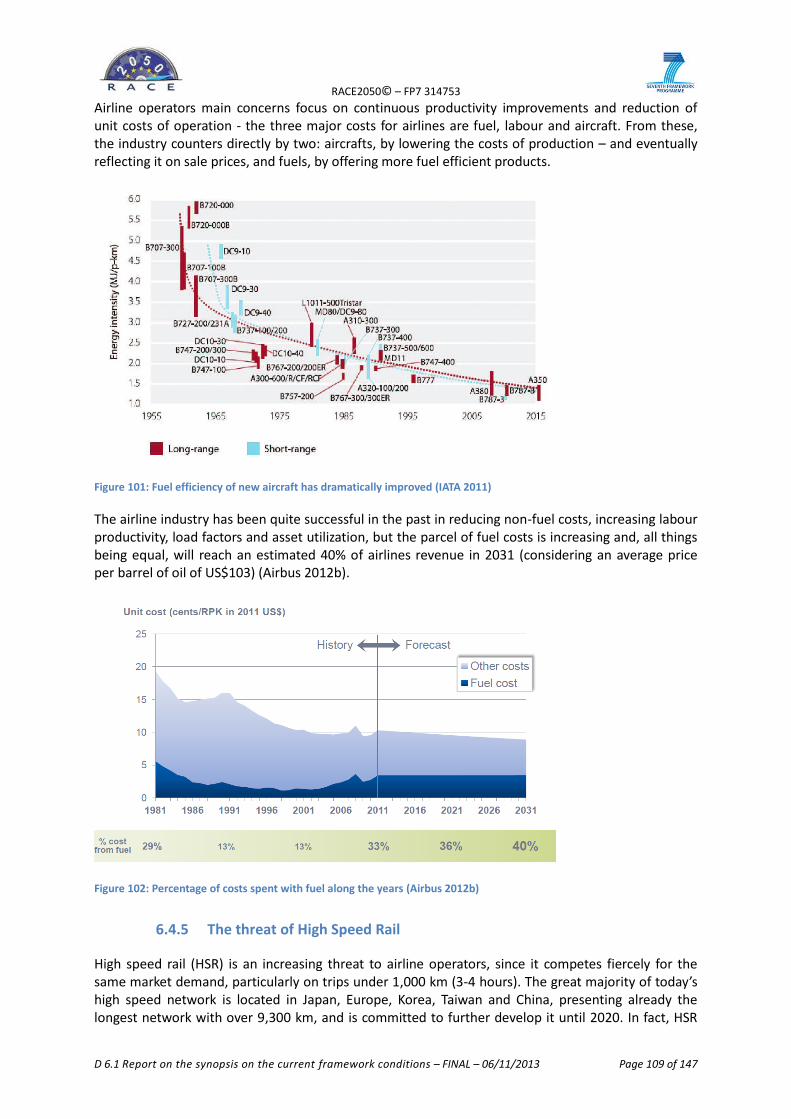
RACE2050© – FP7 314753
D 6.1 Report on the synopsis on the current framework conditions – FINAL – 06/11/2013 Page 109 of 147
Airline operators main concerns focus on continuous productivity improvements and reduction of unit costs of operation - the three major costs for airlines are fuel, labour and aircraft. From these, the industry counters directly by two: aircrafts, by lowering the costs of production – and eventually reflecting it on sale prices, and fuels, by offering more fuel efficient products.
Figure 101: Fuel efficiency of new aircraft has dramatically improved (IATA 2011)
The airline industry has been quite successful in the past in reducing non-fuel costs, increasing labour productivity, load factors and asset utilization, but the parcel of fuel costs is increasing and, all things being equal, will reach an estimated 40% of airlines revenue in 2031 (considering an average price per barrel of oil of US$103) (Airbus 2012b).
Figure 102: Percentage of costs spent with fuel along the years (Airbus 2012b)
6.4.5 The threat of High Speed Rail
High speed rail (HSR) is an increasing threat to airline operators, since it competes fiercely for the same market demand, particularly on trips under 1,000 km (3-4 hours). The great majority of today’s high speed network is located in Japan, Europe, Korea, Taiwan and China, presenting already the longest network with over 9,300 km, and is committed to further develop it until 2020. In fact, HSR
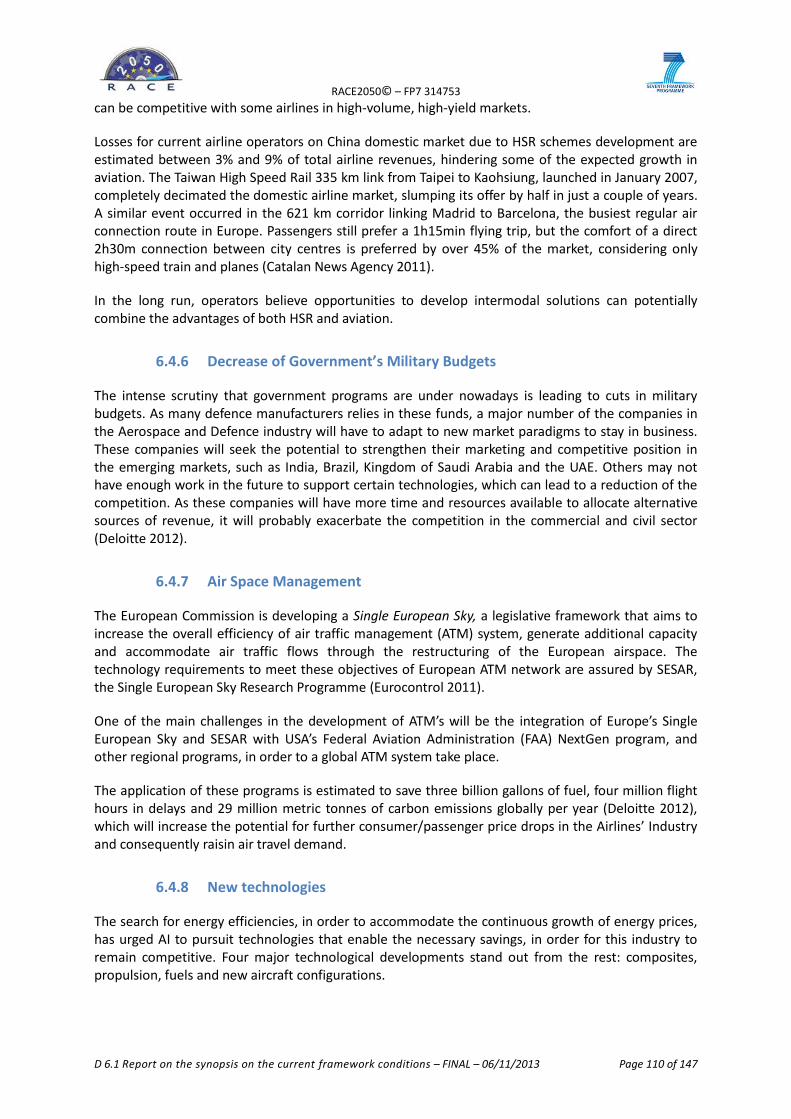
RACE2050© – FP7 314753
D 6.1 Report on the synopsis on the current framework conditions – FINAL – 06/11/2013 Page 110 of 147
can be competitive with some airlines in high-volume, high-yield markets.
Losses for current airline operators on China domestic market due to HSR schemes development are estimated between 3% and 9% of total airline revenues, hindering some of the expected growth in aviation. The Taiwan High Speed Rail 335 km link from Taipei to Kaohsiung, launched in January 2007, completely decimated the domestic airline market, slumping its offer by half in just a couple of years. A similar event occurred in the 621 km corridor linking Madrid to Barcelona, the busiest regular air connection route in Europe. Passengers still prefer a 1h15min flying trip, but the comfort of a direct 2h30m connection between city centres is preferred by over 45% of the market, considering only high-speed train and planes (Catalan News Agency 2011).
In the long run, operators believe opportunities to develop intermodal solutions can potentially combine the advantages of both HSR and aviation.
6.4.6 Decrease of Government’s Military Budgets
The intense scrutiny that government programs are under nowadays is leading to cuts in military budgets. As many defence manufacturers relies in these funds, a major number of the companies in the Aerospace and Defence industry will have to adapt to new market paradigms to stay in business. These companies will seek the potential to strengthen their marketing and competitive position in the emerging markets, such as India, Brazil, Kingdom of Saudi Arabia and the UAE. Others may not have enough work in the future to support certain technologies, which can lead to a reduction of the competition. As these companies will have more time and resources available to allocate alternative sources of revenue, it will probably exacerbate the competition in the commercial and civil sector (Deloitte 2012).
6.4.7 Air Space Management
The European Commission is developing a Single European Sky, a legislative framework that aims to increase the overall efficiency of air traffic management (ATM) system, generate additional capacity and accommodate air traffic flows through the restructuring of the European airspace. The technology requirements to meet these objectives of European ATM network are assured by SESAR, the Single European Sky Research Programme (Eurocontrol 2011).
One of the main challenges in the development of ATM’s will be the integration of Europe’s Single European Sky and SESAR with USA’s Federal Aviation Administration (FAA) NextGen program, and other regional programs, in order to a global ATM system take place.
The application of these programs is estimated to save three billion gallons of fuel, four million flight hours in delays and 29 million metric tonnes of carbon emissions globally per year (Deloitte 2012), which will increase the potential for further consumer/passenger price drops in the Airlines’ Industry and consequently raisin air travel demand.
6.4.8 New technologies
The search for energy efficiencies, in order to accommodate the continuous growth of energy prices, has urged AI to pursuit technologies that enable the necessary savings, in order for this industry to remain competitive. Four major technological developments stand out from the rest: composites, propulsion, fuels and new aircraft configurations.
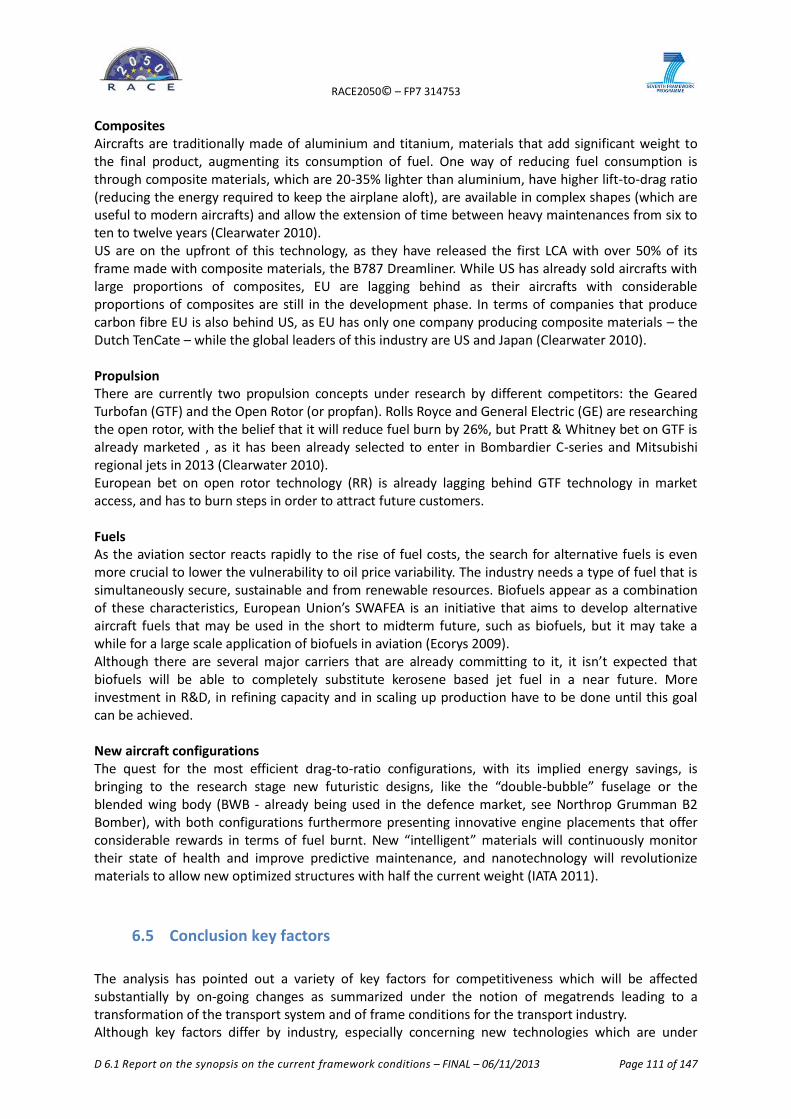
RACE2050© – FP7 314753
D 6.1 Report on the synopsis on the current framework conditions – FINAL – 06/11/2013 Page 111 of 147
Composites Aircrafts are traditionally made of aluminium and titanium, materials that add significant weight to the final product, augmenting its consumption of fuel. One way of reducing fuel consumption is through composite materials, which are 20-35% lighter than aluminium, have higher lift-to-drag ratio (reducing the energy required to keep the airplane aloft), are available in complex shapes (which are useful to modern aircrafts) and allow the extension of time between heavy maintenances from six to ten to twelve years (Clearwater 2010). US are on the upfront of this technology, as they have released the first LCA with over 50% of its frame made with composite materials, the B787 Dreamliner. While US has already sold aircrafts with large proportions of composites, EU are lagging behind as their aircrafts with considerable proportions of composites are still in the development phase. In terms of companies that produce carbon fibre EU is also behind US, as EU has only one company producing composite materials – the Dutch TenCate – while the global leaders of this industry are US and Japan (Clearwater 2010). Propulsion There are currently two propulsion concepts under research by different competitors: the Geared Turbofan (GTF) and the Open Rotor (or propfan). Rolls Royce and General Electric (GE) are researching the open rotor, with the belief that it will reduce fuel burn by 26%, but Pratt & Whitney bet on GTF is already marketed , as it has been already selected to enter in Bombardier C-series and Mitsubishi regional jets in 2013 (Clearwater 2010). European bet on open rotor technology (RR) is already lagging behind GTF technology in market access, and has to burn steps in order to attract future customers. Fuels As the aviation sector reacts rapidly to the rise of fuel costs, the search for alternative fuels is even more crucial to lower the vulnerability to oil price variability. The industry needs a type of fuel that is simultaneously secure, sustainable and from renewable resources. Biofuels appear as a combination of these characteristics, European Union’s SWAFEA is an initiative that aims to develop alternative aircraft fuels that may be used in the short to midterm future, such as biofuels, but it may take a while for a large scale application of biofuels in aviation (Ecorys 2009). Although there are several major carriers that are already committing to it, it isn’t expected that biofuels will be able to completely substitute kerosene based jet fuel in a near future. More investment in R&D, in refining capacity and in scaling up production have to be done until this goal can be achieved. New aircraft configurations The quest for the most efficient drag-to-ratio configurations, with its implied energy savings, is bringing to the research stage new futuristic designs, like the “double-bubble” fuselage or the blended wing body (BWB - already being used in the defence market, see Northrop Grumman B2 Bomber), with both configurations furthermore presenting innovative engine placements that offer considerable rewards in terms of fuel burnt. New “intelligent” materials will continuously monitor their state of health and improve predictive maintenance, and nanotechnology will revolutionize materials to allow new optimized structures with half the current weight (IATA 2011).
6.5 Conclusion key factors
The analysis has pointed out a variety of key factors for competitiveness which will be affected substantially by on-going changes as summarized under the notion of megatrends leading to a transformation of the transport system and of frame conditions for the transport industry. Although key factors differ by industry, especially concerning new technologies which are under
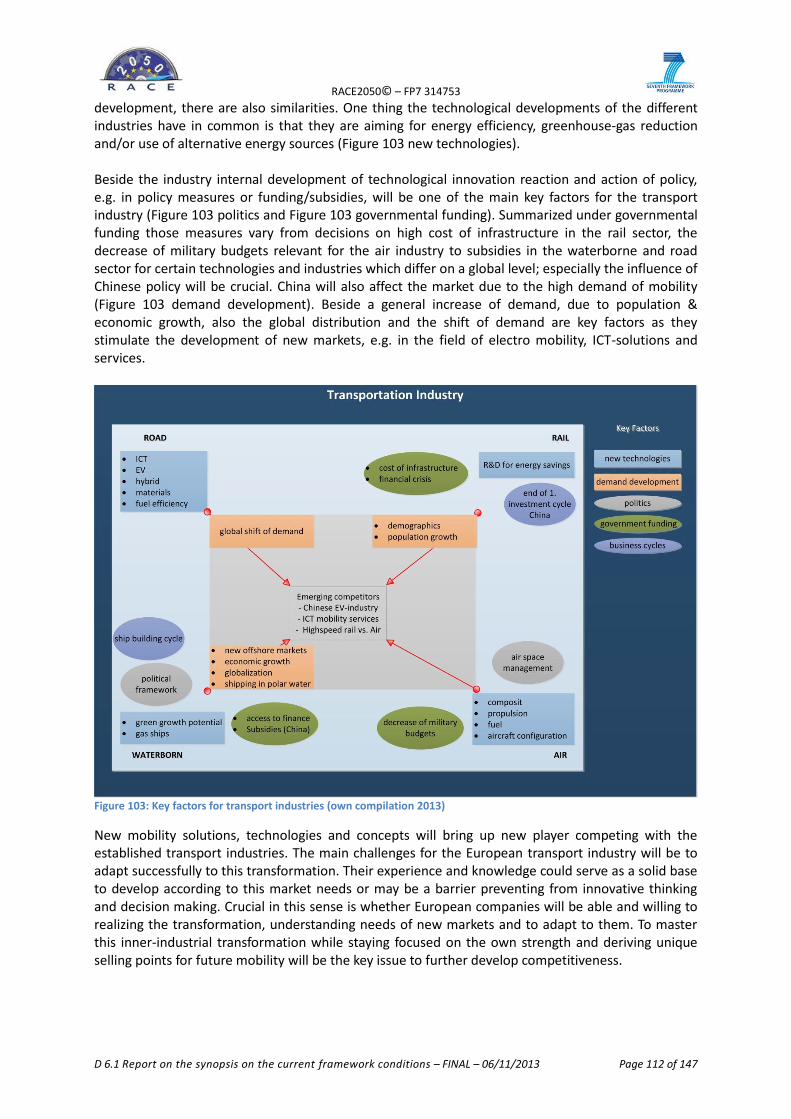
RACE2050© – FP7 314753
D 6.1 Report on the synopsis on the current framework conditions – FINAL – 06/11/2013 Page 112 of 147
development, there are also similarities. One thing the technological developments of the different industries have in common is that they are aiming for energy efficiency, greenhouse-gas reduction and/or use of alternative energy sources (Figure 103 new technologies). Beside the industry internal development of technological innovation reaction and action of policy, e.g. in policy measures or funding/subsidies, will be one of the main key factors for the transport industry (Figure 103 politics and Figure 103 governmental funding). Summarized under governmental funding those measures vary from decisions on high cost of infrastructure in the rail sector, the decrease of military budgets relevant for the air industry to subsidies in the waterborne and road sector for certain technologies and industries which differ on a global level; especially the influence of Chinese policy will be crucial. China will also affect the market due to the high demand of mobility (Figure 103 demand development). Beside a general increase of demand, due to population & economic growth, also the global distribution and the shift of demand are key factors as they stimulate the development of new markets, e.g. in the field of electro mobility, ICT-solutions and services.
Figure 103: Key factors for transport industries (own compilation 2013)
New mobility solutions, technologies and concepts will bring up new player competing with the established transport industries. The main challenges for the European transport industry will be to adapt successfully to this transformation. Their experience and knowledge could serve as a solid base to develop according to this market needs or may be a barrier preventing from innovative thinking and decision making. Crucial in this sense is whether European companies will be able and willing to realizing the transformation, understanding needs of new markets and to adapt to them. To master this inner-industrial transformation while staying focused on the own strength and deriving unique selling points for future mobility will be the key issue to further develop competitiveness.
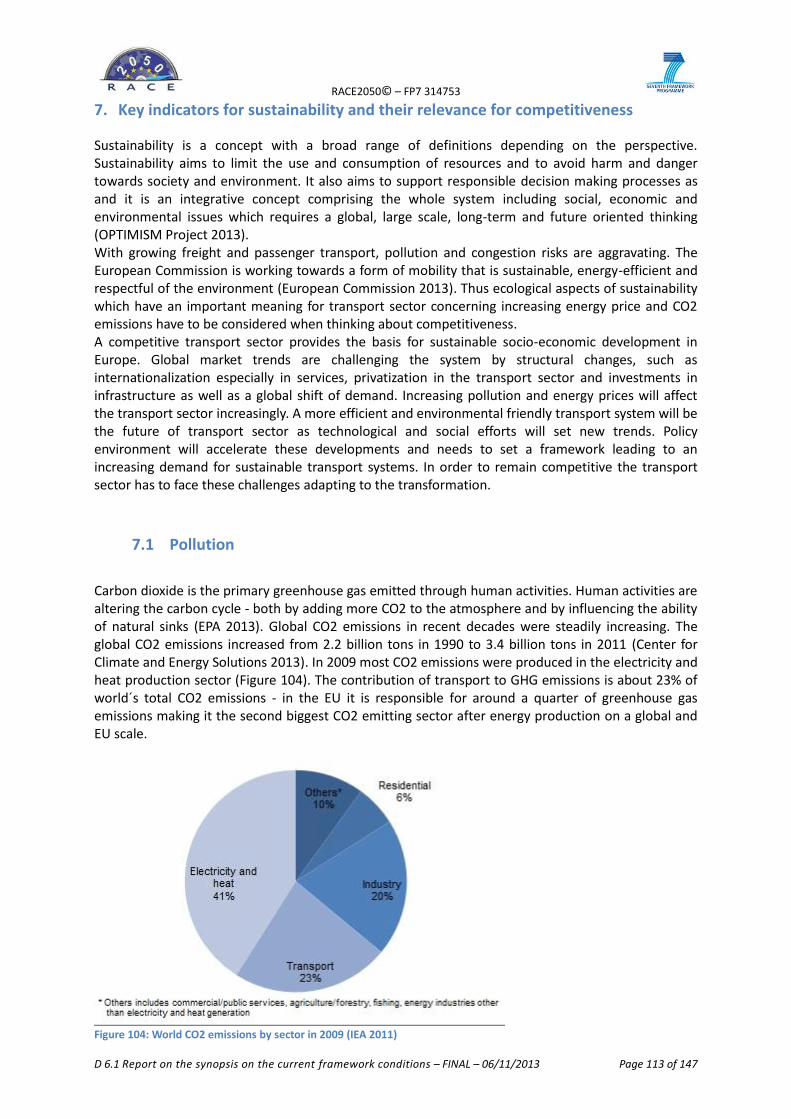
RACE2050© – FP7 314753
D 6.1 Report on the synopsis on the current framework conditions – FINAL – 06/11/2013 Page 113 of 147
7. Key indicators for sustainability and their relevance for competitiveness
Sustainability is a concept with a broad range of definitions depending on the perspective. Sustainability aims to limit the use and consumption of resources and to avoid harm and danger towards society and environment. It also aims to support responsible decision making processes as and it is an integrative concept comprising the whole system including social, economic and environmental issues which requires a global, large scale, long-term and future oriented thinking (OPTIMISM Project 2013). With growing freight and passenger transport, pollution and congestion risks are aggravating. The European Commission is working towards a form of mobility that is sustainable, energy-efficient and respectful of the environment (European Commission 2013). Thus ecological aspects of sustainability which have an important meaning for transport sector concerning increasing energy price and CO2 emissions have to be considered when thinking about competitiveness. A competitive transport sector provides the basis for sustainable socio-economic development in Europe. Global market trends are challenging the system by structural changes, such as internationalization especially in services, privatization in the transport sector and investments in infrastructure as well as a global shift of demand. Increasing pollution and energy prices will affect the transport sector increasingly. A more efficient and environmental friendly transport system will be the future of transport sector as technological and social efforts will set new trends. Policy environment will accelerate these developments and needs to set a framework leading to an increasing demand for sustainable transport systems. In order to remain competitive the transport sector has to face these challenges adapting to the transformation.
7.1 Pollution
Carbon dioxide is the primary greenhouse gas emitted through human activities. Human activities are altering the carbon cycle - both by adding more CO2 to the atmosphere and by influencing the ability of natural sinks (EPA 2013). Global CO2 emissions in recent decades were steadily increasing. The global CO2 emissions increased from 2.2 billion tons in 1990 to 3.4 billion tons in 2011 (Center for Climate and Energy Solutions 2013). In 2009 most CO2 emissions were produced in the electricity and heat production sector (Figure 104). The contribution of transport to GHG emissions is about 23% of world´s total CO2 emissions - in the EU it is responsible for around a quarter of greenhouse gas emissions making it the second biggest CO2 emitting sector after energy production on a global and EU scale.
Figure 104: World CO2 emissions by sector in 2009 (IEA 2011)
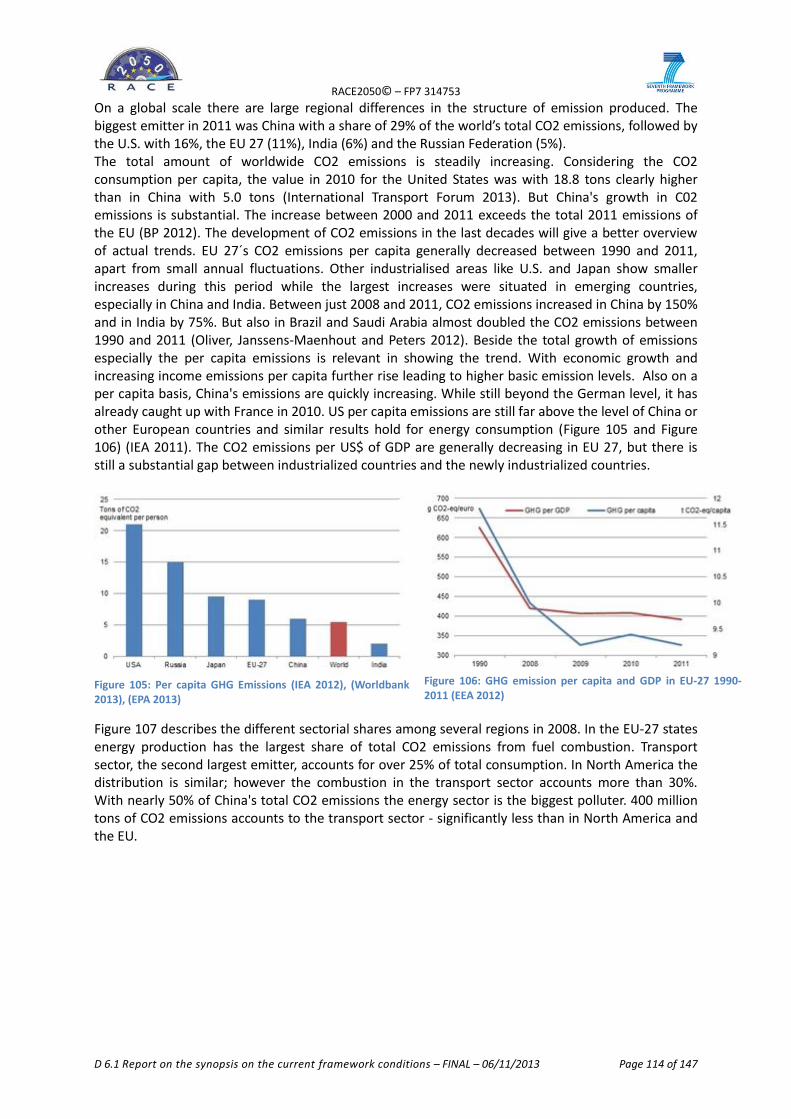
RACE2050© – FP7 314753
D 6.1 Report on the synopsis on the current framework conditions – FINAL – 06/11/2013 Page 114 of 147
On a global scale there are large regional differences in the structure of emission produced. The biggest emitter in 2011 was China with a share of 29% of the world’s total CO2 emissions, followed by the U.S. with 16%, the EU 27 (11%), India (6%) and the Russian Federation (5%). The total amount of worldwide CO2 emissions is steadily increasing. Considering the CO2 consumption per capita, the value in 2010 for the United States was with 18.8 tons clearly higher than in China with 5.0 tons (International Transport Forum 2013). But China's growth in C02 emissions is substantial. The increase between 2000 and 2011 exceeds the total 2011 emissions of the EU (BP 2012). The development of CO2 emissions in the last decades will give a better overview of actual trends. EU 27´s CO2 emissions per capita generally decreased between 1990 and 2011, apart from small annual fluctuations. Other industrialised areas like U.S. and Japan show smaller increases during this period while the largest increases were situated in emerging countries, especially in China and India. Between just 2008 and 2011, CO2 emissions increased in China by 150% and in India by 75%. But also in Brazil and Saudi Arabia almost doubled the CO2 emissions between 1990 and 2011 (Oliver, Janssens-Maenhout and Peters 2012). Beside the total growth of emissions especially the per capita emissions is relevant in showing the trend. With economic growth and increasing income emissions per capita further rise leading to higher basic emission levels. Also on a per capita basis, China's emissions are quickly increasing. While still beyond the German level, it has already caught up with France in 2010. US per capita emissions are still far above the level of China or other European countries and similar results hold for energy consumption (Figure 105 and Figure 106) (IEA 2011). The CO2 emissions per US$ of GDP are generally decreasing in EU 27, but there is still a substantial gap between industrialized countries and the newly industrialized countries.
Figure 105: Per capita GHG Emissions (IEA 2012), (Worldbank 2013), (EPA 2013)
Figure 106: GHG emission per capita and GDP in EU-27 1990-2011 (EEA 2012)
Figure 107 describes the different sectorial shares among several regions in 2008. In the EU-27 states energy production has the largest share of total CO2 emissions from fuel combustion. Transport sector, the second largest emitter, accounts for over 25% of total consumption. In North America the distribution is similar; however the combustion in the transport sector accounts more than 30%. With nearly 50% of China's total CO2 emissions the energy sector is the biggest polluter. 400 million tons of CO2 emissions accounts to the transport sector - significantly less than in North America and the EU.
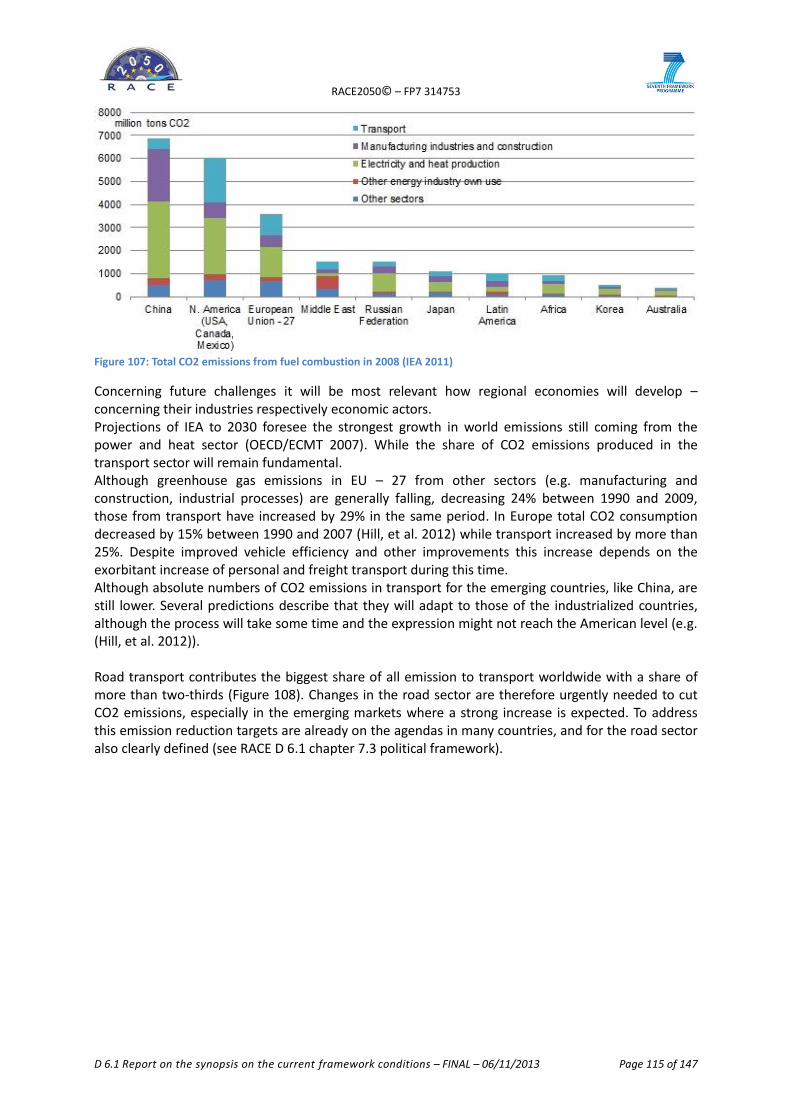
RACE2050© – FP7 314753
D 6.1 Report on the synopsis on the current framework conditions – FINAL – 06/11/2013 Page 115 of 147
Figure 107: Total CO2 emissions from fuel combustion in 2008 (IEA 2011)
Concerning future challenges it will be most relevant how regional economies will develop – concerning their industries respectively economic actors. Projections of IEA to 2030 foresee the strongest growth in world emissions still coming from the power and heat sector (OECD/ECMT 2007). While the share of CO2 emissions produced in the transport sector will remain fundamental. Although greenhouse gas emissions in EU – 27 from other sectors (e.g. manufacturing and construction, industrial processes) are generally falling, decreasing 24% between 1990 and 2009, those from transport have increased by 29% in the same period. In Europe total CO2 consumption decreased by 15% between 1990 and 2007 (Hill, et al. 2012) while transport increased by more than 25%. Despite improved vehicle efficiency and other improvements this increase depends on the exorbitant increase of personal and freight transport during this time. Although absolute numbers of CO2 emissions in transport for the emerging countries, like China, are still lower. Several predictions describe that they will adapt to those of the industrialized countries, although the process will take some time and the expression might not reach the American level (e.g. (Hill, et al. 2012)). Road transport contributes the biggest share of all emission to transport worldwide with a share of more than two-thirds (Figure 108). Changes in the road sector are therefore urgently needed to cut CO2 emissions, especially in the emerging markets where a strong increase is expected. To address this emission reduction targets are already on the agendas in many countries, and for the road sector also clearly defined (see RACE D 6.1 chapter 7.3 political framework).
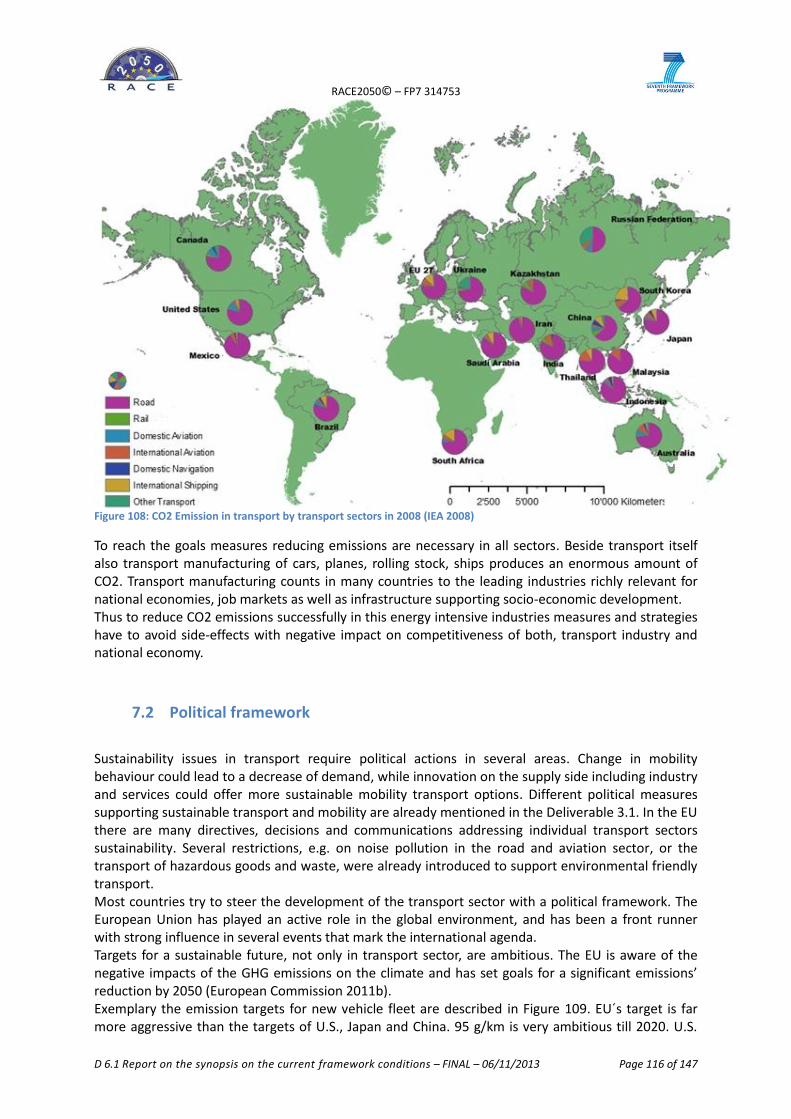
RACE2050© – FP7 314753
D 6.1 Report on the synopsis on the current framework conditions – FINAL – 06/11/2013 Page 116 of 147
Figure 108: CO2 Emission in transport by transport sectors in 2008 (IEA 2008)
To reach the goals measures reducing emissions are necessary in all sectors. Beside transport itself also transport manufacturing of cars, planes, rolling stock, ships produces an enormous amount of CO2. Transport manufacturing counts in many countries to the leading industries richly relevant for national economies, job markets as well as infrastructure supporting socio-economic development. Thus to reduce CO2 emissions successfully in this energy intensive industries measures and strategies have to avoid side-effects with negative impact on competitiveness of both, transport industry and national economy.
7.2 Political framework
Sustainability issues in transport require political actions in several areas. Change in mobility behaviour could lead to a decrease of demand, while innovation on the supply side including industry and services could offer more sustainable mobility transport options. Different political measures supporting sustainable transport and mobility are already mentioned in the Deliverable 3.1. In the EU there are many directives, decisions and communications addressing individual transport sectors sustainability. Several restrictions, e.g. on noise pollution in the road and aviation sector, or the transport of hazardous goods and waste, were already introduced to support environmental friendly transport. Most countries try to steer the development of the transport sector with a political framework. The European Union has played an active role in the global environment, and has been a front runner with strong influence in several events that mark the international agenda. Targets for a sustainable future, not only in transport sector, are ambitious. The EU is aware of the negative impacts of the GHG emissions on the climate and has set goals for a significant emissions’ reduction by 2050 (European Commission 2011b). Exemplary the emission targets for new vehicle fleet are described in Figure 109. EU´s target is far more aggressive than the targets of U.S., Japan and China. 95 g/km is very ambitious till 2020. U.S.
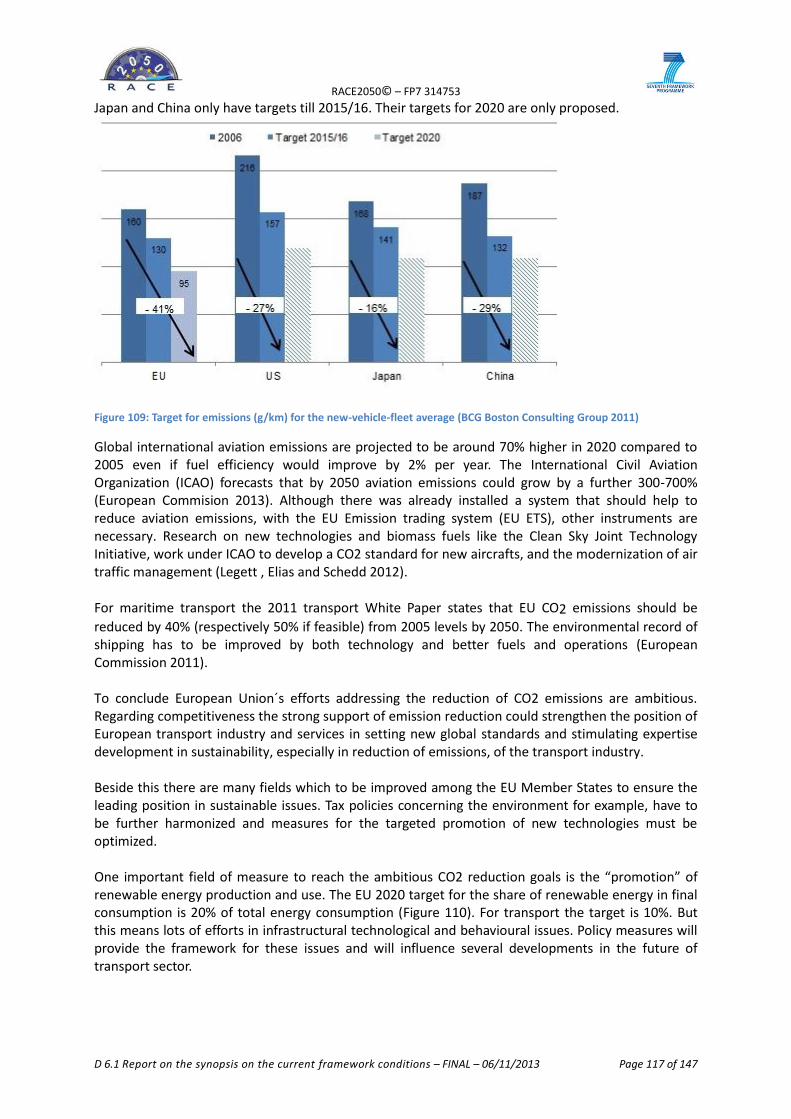
RACE2050© – FP7 314753
D 6.1 Report on the synopsis on the current framework conditions – FINAL – 06/11/2013 Page 117 of 147
Japan and China only have targets till 2015/16. Their targets for 2020 are only proposed.
Figure 109: Target for emissions (g/km) for the new-vehicle-fleet average (BCG Boston Consulting Group 2011)
Global international aviation emissions are projected to be around 70% higher in 2020 compared to 2005 even if fuel efficiency would improve by 2% per year. The International Civil Aviation Organization (ICAO) forecasts that by 2050 aviation emissions could grow by a further 300-700% (European Commision 2013). Although there was already installed a system that should help to reduce aviation emissions, with the EU Emission trading system (EU ETS), other instruments are necessary. Research on new technologies and biomass fuels like the Clean Sky Joint Technology Initiative, work under ICAO to develop a CO2 standard for new aircrafts, and the modernization of air traffic management (Legett , Elias and Schedd 2012). For maritime transport the 2011 transport White Paper
states that EU CO2 emissions should be
reduced by 40% (respectively 50% if feasible) from 2005 levels by 2050. The environmental record of shipping has to be improved by both technology and better fuels and operations (European Commission 2011). To conclude European Union´s efforts addressing the reduction of CO2 emissions are ambitious. Regarding competitiveness the strong support of emission reduction could strengthen the position of European transport industry and services in setting new global standards and stimulating expertise development in sustainability, especially in reduction of emissions, of the transport industry. Beside this there are many fields which to be improved among the EU Member States to ensure the leading position in sustainable issues. Tax policies concerning the environment for example, have to be further harmonized and measures for the targeted promotion of new technologies must be optimized. One important field of measure to reach the ambitious CO2 reduction goals is the “promotion” of renewable energy production and use. The EU 2020 target for the share of renewable energy in final consumption is 20% of total energy consumption (Figure 110). For transport the target is 10%. But this means lots of efforts in infrastructural technological and behavioural issues. Policy measures will provide the framework for these issues and will influence several developments in the future of transport sector.
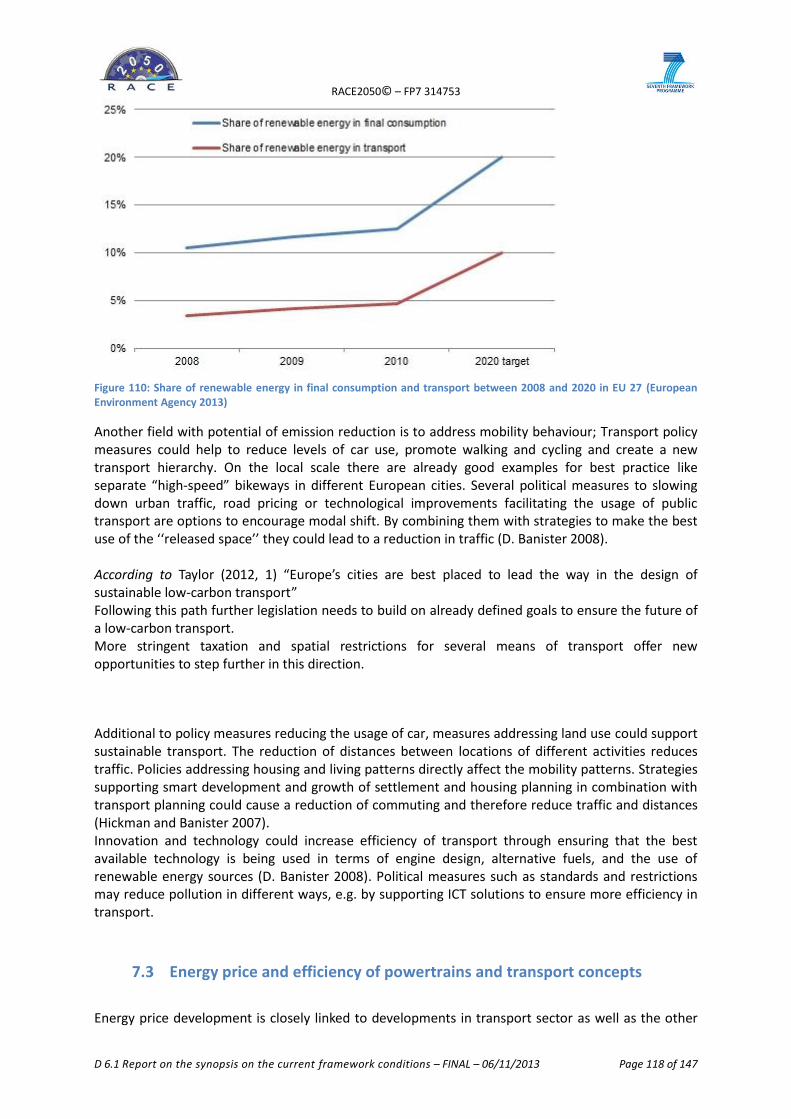
RACE2050© – FP7 314753
D 6.1 Report on the synopsis on the current framework conditions – FINAL – 06/11/2013 Page 118 of 147
Figure 110: Share of renewable energy in final consumption and transport between 2008 and 2020 in EU 27 (European Environment Agency 2013)
Another field with potential of emission reduction is to address mobility behaviour; Transport policy measures could help to reduce levels of car use, promote walking and cycling and create a new transport hierarchy. On the local scale there are already good examples for best practice like separate “high-speed” bikeways in different European cities. Several political measures to slowing down urban traffic, road pricing or technological improvements facilitating the usage of public transport are options to encourage modal shift. By combining them with strategies to make the best use of the ‘‘released space’’ they could lead to a reduction in traffic (D. Banister 2008). According to Taylor (2012, 1) “Europe’s cities are best placed to lead the way in the design of sustainable low-carbon transport” Following this path further legislation needs to build on already defined goals to ensure the future of a low-carbon transport. More stringent taxation and spatial restrictions for several means of transport offer new opportunities to step further in this direction.
Additional to policy measures reducing the usage of car, measures addressing land use could support sustainable transport. The reduction of distances between locations of different activities reduces traffic. Policies addressing housing and living patterns directly affect the mobility patterns. Strategies supporting smart development and growth of settlement and housing planning in combination with transport planning could cause a reduction of commuting and therefore reduce traffic and distances (Hickman and Banister 2007). Innovation and technology could increase efficiency of transport through ensuring that the best available technology is being used in terms of engine design, alternative fuels, and the use of renewable energy sources (D. Banister 2008). Political measures such as standards and restrictions may reduce pollution in different ways, e.g. by supporting ICT solutions to ensure more efficiency in transport.
7.3 Energy price and efficiency of powertrains and transport concepts
Energy price development is closely linked to developments in transport sector as well as the other
RACE2050© – FP7 314753
D 6.1 Report on the synopsis on the current framework conditions – FINAL – 06/11/2013 Page 119 of 147
way round. Energy efficiency and the support of renewables sources is a main topic in all observed energy strategies of several countries (also see D.4.1). For the transport sector, the technological efficiency of conventional power trains almost reached its maximum. Evidence to move away from fossil fuels is becoming more and more visible. Therefore the increasing energy price forces a more sustainable handling in transport and is probably one of the most important factors to influence mobility behaviour and sustainable decision making beside political measures. Sustainable and renewable energy sources ensure a constant energy prices. The high dependency on fossil fuels makes conventional fuels in the transport sector increasingly unpopular. Financial benefits of alternative powertrains, but particularly of alternative mobility concepts, offer enormous potential in the future to mitigate the problem. Minimizing the energy price fluctuations by developing alternative energy production will guarantee a better predictability price development. Car manufacturers already address this issue as a future field of its corporate strategy. Though car manufacturers, such as BMW and Daimler started to offer electric mobility services (e.g. drive-by now BMW car to go) in several cities around the world. Together with policy measures, such as tax benefits and favourable conditions, sustainable modes of transport can establish in long term and also can mitigate the problem of energy prices. Beside promotion of alternative energies there is still potential for energy savings by improving efficiency. Efficiency in all areas of the transport sector is necessary to ensure a more sustainable transport. Long-time efficiency improvements were added exclusively to technological developments. But efficiency cannot be achieved by technological developments only Schade (2013), points out, that around 2030 the improvements in efficiency of fossil-fuelled cars will reach its maximum. By then, alternative drive systems must provide reliable and affordable replacement. Efficient transport systems reduce dispensable journeys by facilitating sustainable mobility to technologies, such as ICT solutions supporting co modality. For example, transport systems can avoid empty trips in freight passenger transport. Incentives to reduce single or empty runs could increase efficiency and to summarize a variety of factors could lead to a competitive and resource efficient transport system. The Implementation of an efficient framework for transport users and operators could help to reach the CO2 emission targets, as already defined in the EU White Paper. The ten goals for a competitive and resource efficient transport system try to ensure this in Europe on a long-term perspective (European Commission 2011). On a local scale there are already many examples addreassing efficient and competitive transport systems. In London for example, interchange facilities or zones allow efficient movement of people between the public transport services they use. Multimodal pricing systems, e.g. like in Amsterdam and several cities around the world, facilitate travelling with public transport. Beside the local and regional projects a large-scale implementation of such solutions has to be achieved to ensure a sustainable development of the transport system and address energy supply and demand issues on a European and global dimension.
7.4 Conclusion sustainability in transport
The topic of sustainable issues in transport will gain importance not only in the European Union. European efforts towards are more sustainable transport are ambitious aiming for targets to improve efficiency and to make the transport sector more environmental friendly. The European White Paper on transport targets a reduction of greenhouse gases by at least 60% between 1990 and 2050. This reduction could be achieved, as European research project GHG TransPoRD showed (ISI 2013). The project points out that a combination of technical improvements and behavioural changes, both through incentives in the form of policy instruments, could ensure the goals. The largest quantities for reducing GHG emissions and fastest possible implementation could be reached in the road transport sector although only by serious efforts. Especially passenger cars and light commercial
RACE2050© – FP7 314753
D 6.1 Report on the synopsis on the current framework conditions – FINAL – 06/11/2013 Page 120 of 147
vehicles provide big potential for energy savings. The most important measure for realizing these savings is the ambitious reduction in CO2 limits for new car fleets. For air transport the introduction of sustainably produced bio-kerosene could contribute if carefully taking and preventing negative side-effects. For the maritime sector lowering of driving speed could be the most effective in a short term while alternative energy sources and new technologies have to be further developed. In the EU the possibilities for sustainable transport can be seen as an opportunity to open new markets for products by stimulating R&D through environmentally based policies in transport. Overall the European transport industry is one of the most innovative in the field of energy efficiency and new technologies. Greenhouse gas reductions and sustainability in the transport sector are ambitious in comparison to other countries. In addition, according to Banister (2008) the acceptance of measures to reduce pollution in Europe is higher compared to other regions. The issue of sustainability will also get more and more important in other regions of the world and technological, political but also social solutions will be in demand. Sustainability, particularly in the transport sector, will play an important role worldwide. Smog infested cities and congested streets but also safety and accessibility changes will ensure demand for sustainable mobility approaches and thereby stimulate supply at products and services meeting those needs. For the European transport sector this development offers enormous potential. In many areas, European service providers and manufacturers are leader concerning sustainable technologies and systems. Ambitious political regulations and rapidly growing sustainability thinking in the population could offer great opportunities. Concerning sustainability issues the European transport sector in general is well positioned. Political and technological efforts are regarded in many other countries as a reference. As a result, the EU has an important position in terms of sustainability. Thus Europe could take the lead and thereby gain competitive advantages in the transformation process.
RACE2050© – FP7 314753
D 6.1 Report on the synopsis on the current framework conditions – FINAL – 06/11/2013 Page 121 of 147
8. Challenges and Opportunities
In Chapter 5, 6 and 7 the situation of the European transport sector and its position concerning competitiveness were described. There are areas in which the European transport sector already has a very strong position. But the sector also faces challenges. New market developments and trends have major impact on the transport sector, but also offer tremendous potential to break new ground. The following chapters will point out the challenges and also describes the resulting opportunities.
8.1 Challenges and Opportunities – results of the competitiveness and key
factors analysis
The analysis of relevant factors for competitiveness allows to identify challenges and opportunities for the transformation sector. Transport is undergoing a major transformation as a result of major changes in the frame conditions leading to trends with strong impact on transport system and industry several key factors. Transport has to face new trends in mobility demand. A qualitative change of demand occurred, due to the new awareness of climate change which has led to political actions. New contemporary mobility cultures in different global regions appear with the shift of economic power toward Asia. This leads to new demand patterns and planning perspectives. Together with technological development related to changing behaviours and energy reduction this will bring challenges and opportunities in one. An example for behaviour is changing ownership relations. For younger generations in some countries, the car as a status symbol is losing ground to high-tech multimedia appliances, such as smartphones or tablets. Especially car manufacturers need to take this seriously. Innovative business models need to be created and cooperation between companies, also some from different branches, may help to solve the problem. Modifications of traditional “European” products need to be considered to meet the needs of markets with different economic and cultural background. Especially the industry sector has to define strategies concerning shift of demand in emerging markets. In addition, the shift in consumer demand and the increase in “green” awareness in these emerging markets could be more rapid than in Europe. Infrastructure development and funding for mobility offer new opportunities as traditional approaches will be replaced by new ones and offer big potential for the whole sector to innovate and strengthen competitiveness. Especially policies addressing qualitative change towards sustainability are pushing this development. On the other hand products and services from emerging markets can significantly affect the landscape conditions in the traditional markets of the European transport industry and service. Manufacturer and services of leading products have to defend its supremacy in the market as with the shift of demand new competitors will enter the market.
8.2 Challenges and Opportunities – in the perspective of experts
The future outlook for the transport sector brings uncertainty with it, due to the variety of influencing factors. Beside estimations based on statistical indicators, additional sources of knowledge have to be taken into account. Thus the future development of the European transport sector and the resulting challenges and opportunities concerning competitiveness have also been analysed by an experts´ consultation, providing a second look at the subject. Using the opinions of experts from transport
RACE2050© – FP7 314753
D 6.1 Report on the synopsis on the current framework conditions – FINAL – 06/11/2013 Page 122 of 147
allows to substantiate the analysis and to get further insights on the situation as their opinion provides an additional and different view on the topic. 30 experts from different fields of activity (politics, research, transport planning, urban/spatial planning, automotive industry, rail industry, maritime industry, supplier industry, services public transport, others) took position in an online survey concerning the potential future development of competition relevant aspects. The online survey took place in May 2013 (more details on realisation of the survey in chapter 3. IV) As a basis for the survey out of the analysis of competitiveness indicators and key factors (Chapter 5 and 6) forcing the future development of the transport sector up to 2030 and 2050 six hypotheses were derived:
The demand for transport in rail, road, aviation & maritime will continue to grow until 2030.
The growth of demand will mostly take place in BRIC-countries with fundamental impact on European transport industries and their competitiveness.
New technologies will greatly affect the transport sector and may lead to rapid changes.
Sustainability and environmental issues will shape the transport sector until 2050 due to change of politics, consumer behaviour and investments of industry in green technologies.
The need for reduction of CO2-emissions and energy use will support certain transport modes compared to others.
The global shift of political power and disparities of the political framework for transport will affect the transport sector.
The hypotheses describe main expected future trends as identified by the analysis of indicators and key factors for competitiveness and should be confronted with expert’s opinion. This approach helps to integrate knowledge as a qualitative constituent going beyond the limits of the analysis of quantitative indicators and thus to supporting the interpretation of the quantitative results. Based on this hypothesis a questionnaire was designed to for the expert consultation aiming to identify challenges and opportunities for a sustainable growth of the European transport sector until 2030. The consultation includes questions related to transport technologies, policies and the impact of the emerging markets on the European transport sector’s competitiveness. Transport Demand by industries The global demand for transport is one of the key factors influencing the future development of passenger and goods transport. The experts gave their opinion on the development of the global demand and are expecting the strongest increase in passengers air transport, whereas rail and road passenger transport are expected to have a varying increase from low to strong.
Figure 111 and Figure 112 describes the experts anticipated developments until 2030. For passenger transport an increase is predicted for all sectors (Figure 111) with biggest increase for the aviation sector and lowest growth for the maritime sector. Almost 40% of the expert beliefs that there will be a decrease.
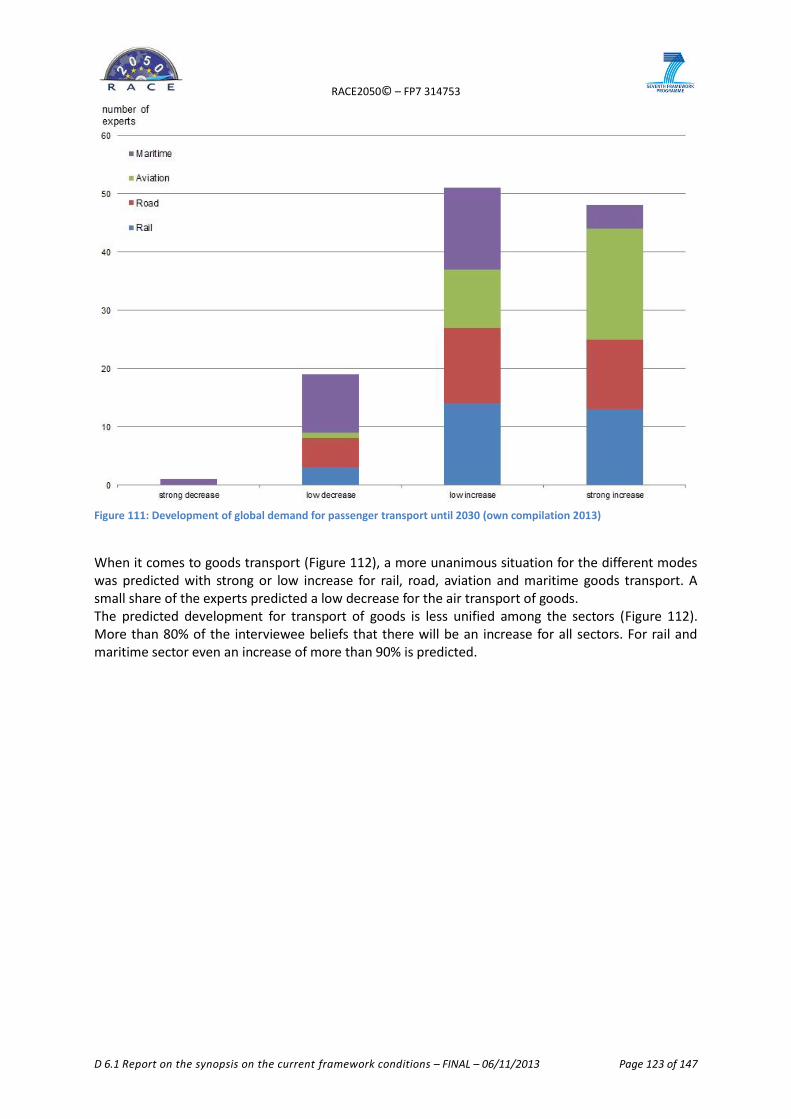
RACE2050© – FP7 314753
D 6.1 Report on the synopsis on the current framework conditions – FINAL – 06/11/2013 Page 123 of 147
Figure 111: Development of global demand for passenger transport until 2030 (own compilation 2013)
When it comes to goods transport (Figure 112), a more unanimous situation for the different modes was predicted with strong or low increase for rail, road, aviation and maritime goods transport. A small share of the experts predicted a low decrease for the air transport of goods. The predicted development for transport of goods is less unified among the sectors (Figure 112). More than 80% of the interviewee beliefs that there will be an increase for all sectors. For rail and maritime sector even an increase of more than 90% is predicted.

RACE2050© – FP7 314753
D 6.1 Report on the synopsis on the current framework conditions – FINAL – 06/11/2013 Page 124 of 147
Figure 112: Development of global demand for transport of goods until 2030 by sector (own compilation 2013)
Global transport demand development and global competition concerning sustainability Additional to the global demand development of the transport sector it has been asked what this development will mean for the development of European transport industry and services. Many experts’ answers are focused on the shift towards a more sustainable transport sector. European transport sector will have to deal with sustainable issues like increasing energy consumption, increasing prices and needs to find solutions for these problems. Numerous experts also point out that the upcoming global competition will increase. New competitors offer challenges and opportunities for industry and services. Another important and often mentioned point is multimodality. Infrastructural development, which is also necessary, should be geared on multimodality. A “green” legislative should support this goal. In this context a few experts think that funding of transport needs a new concept. The above described expert’s statements towards the role of European transport sectors development regarding global demand development come from people who work in politics, researchers or services in public transport. Statements of industrial actors toward this topic are rare. Emerging markets and their impact on the competitiveness of the European transport sector The BRIC countries (Brazil, Russia, India and China) are expected to have a great impact on the global transport demand and on the competitiveness of the transport sectors in the future. The experts estimated the competitive situation of the European sector and considered the impact of the BRIC countries on it. The European transport sector’s competitiveness is expected to lose the most to China, whereas other emerging markets such as Turkey and Indonesia are less likely to have a significant impact on the European market (Figure 113).
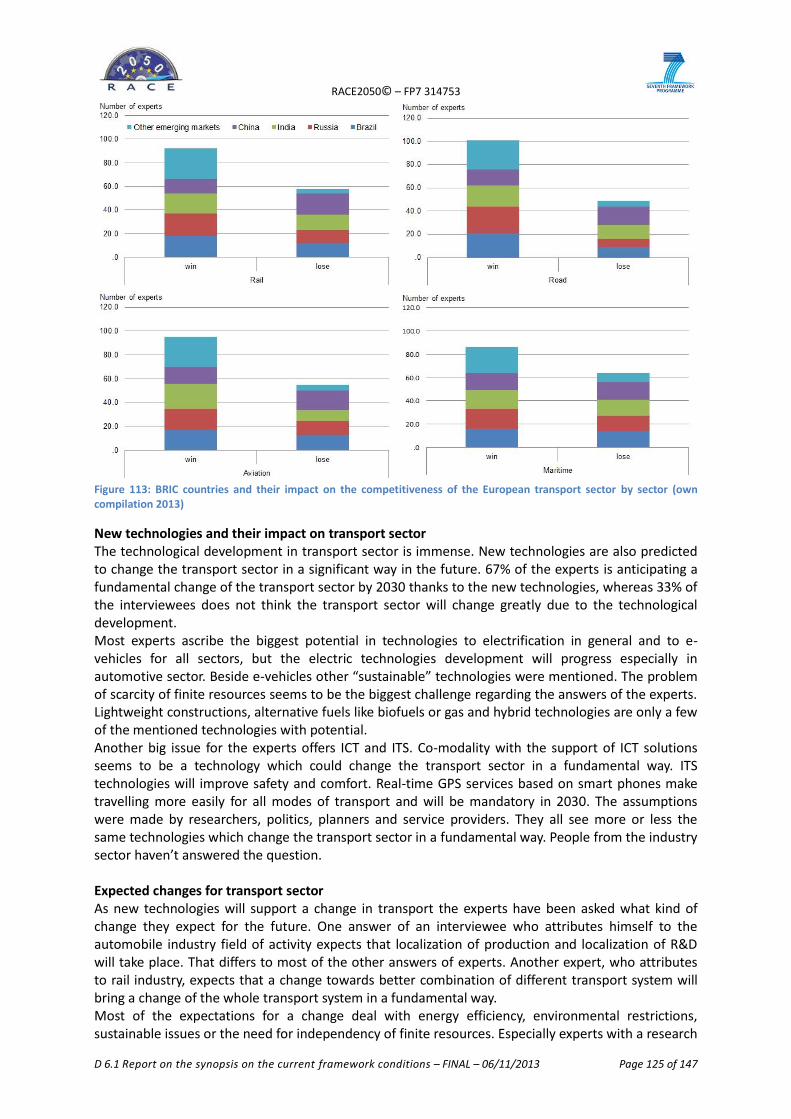
RACE2050© – FP7 314753
D 6.1 Report on the synopsis on the current framework conditions – FINAL – 06/11/2013 Page 125 of 147
Figure 113: BRIC countries and their impact on the competitiveness of the European transport sector by sector (own compilation 2013)
New technologies and their impact on transport sector The technological development in transport sector is immense. New technologies are also predicted to change the transport sector in a significant way in the future. 67% of the experts is anticipating a fundamental change of the transport sector by 2030 thanks to the new technologies, whereas 33% of the interviewees does not think the transport sector will change greatly due to the technological development. Most experts ascribe the biggest potential in technologies to electrification in general and to e-vehicles for all sectors, but the electric technologies development will progress especially in automotive sector. Beside e-vehicles other “sustainable” technologies were mentioned. The problem of scarcity of finite resources seems to be the biggest challenge regarding the answers of the experts. Lightweight constructions, alternative fuels like biofuels or gas and hybrid technologies are only a few of the mentioned technologies with potential. Another big issue for the experts offers ICT and ITS. Co-modality with the support of ICT solutions seems to be a technology which could change the transport sector in a fundamental way. ITS technologies will improve safety and comfort. Real-time GPS services based on smart phones make travelling more easily for all modes of transport and will be mandatory in 2030. The assumptions were made by researchers, politics, planners and service providers. They all see more or less the same technologies which change the transport sector in a fundamental way. People from the industry sector haven’t answered the question. Expected changes for transport sector As new technologies will support a change in transport the experts have been asked what kind of change they expect for the future. One answer of an interviewee who attributes himself to the automobile industry field of activity expects that localization of production and localization of R&D will take place. That differs to most of the other answers of experts. Another expert, who attributes to rail industry, expects that a change towards better combination of different transport system will bring a change of the whole transport system in a fundamental way. Most of the expectations for a change deal with energy efficiency, environmental restrictions, sustainable issues or the need for independency of finite resources. Especially experts with a research
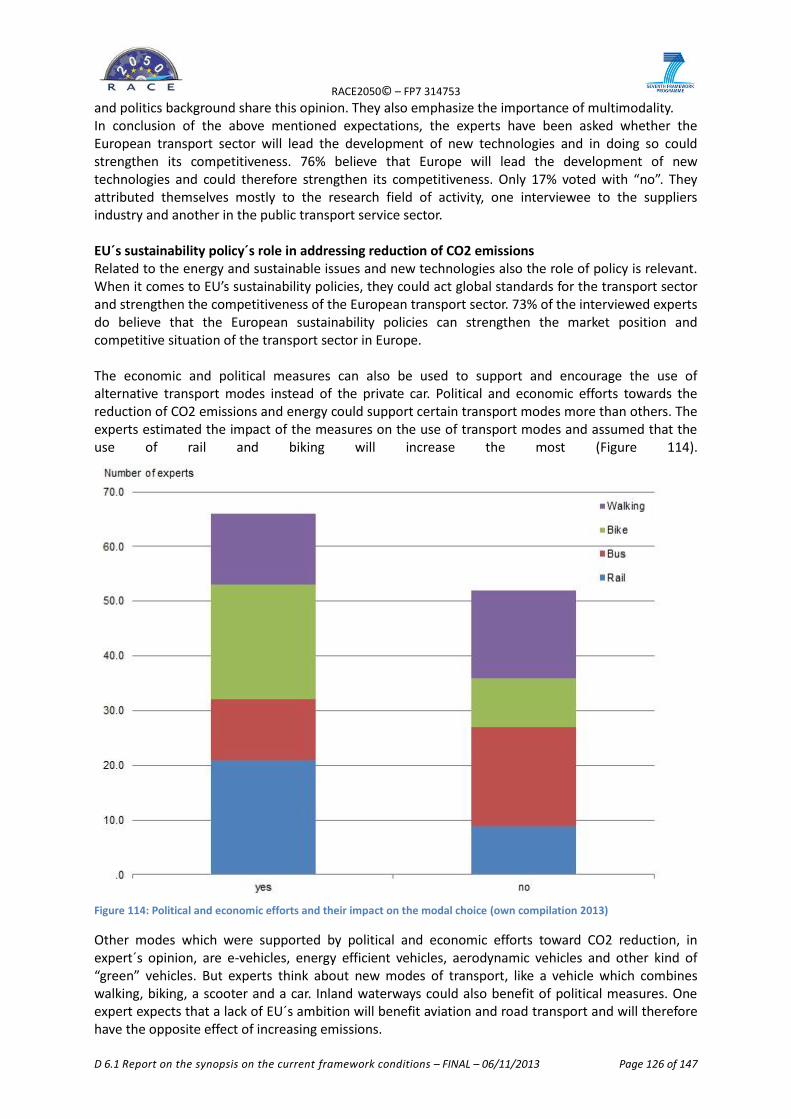
RACE2050© – FP7 314753
D 6.1 Report on the synopsis on the current framework conditions – FINAL – 06/11/2013 Page 126 of 147
and politics background share this opinion. They also emphasize the importance of multimodality. In conclusion of the above mentioned expectations, the experts have been asked whether the European transport sector will lead the development of new technologies and in doing so could strengthen its competitiveness. 76% believe that Europe will lead the development of new technologies and could therefore strengthen its competitiveness. Only 17% voted with “no”. They attributed themselves mostly to the research field of activity, one interviewee to the suppliers industry and another in the public transport service sector. EU´s sustainability policy´s role in addressing reduction of CO2 emissions Related to the energy and sustainable issues and new technologies also the role of policy is relevant. When it comes to EU’s sustainability policies, they could act global standards for the transport sector and strengthen the competitiveness of the European transport sector. 73% of the interviewed experts do believe that the European sustainability policies can strengthen the market position and competitive situation of the transport sector in Europe. The economic and political measures can also be used to support and encourage the use of alternative transport modes instead of the private car. Political and economic efforts towards the reduction of CO2 emissions and energy could support certain transport modes more than others. The experts estimated the impact of the measures on the use of transport modes and assumed that the use of rail and biking will increase the most (Figure 114).
Figure 114: Political and economic efforts and their impact on the modal choice (own compilation 2013)
Other modes which were supported by political and economic efforts toward CO2 reduction, in expert´s opinion, are e-vehicles, energy efficient vehicles, aerodynamic vehicles and other kind of “green” vehicles. But experts think about new modes of transport, like a vehicle which combines walking, biking, a scooter and a car. Inland waterways could also benefit of political measures. One expert expects that a lack of EU´s ambition will benefit aviation and road transport and will therefore have the opposite effect of increasing emissions.
RACE2050© – FP7 314753
D 6.1 Report on the synopsis on the current framework conditions – FINAL – 06/11/2013 Page 127 of 147
Global disparities in politics (regulation, subsidies, rules for market entry etc.) affect the transport sector already today. With increasing economic growth of emerging markets a shift of geopolitical influence is expected. Expert’s opinion towards the consequences of a shift of geopolitical influence on competitiveness of European transport industry is divided. 50% of expert’s belief that this will have negative consequences on European transport sector´s competitiveness, 40% belief that it could have positive effects. The statements related to the field of activity of the interviewee´s hardly describes a clear trend and is very balanced, but the few respondents from the industry sectors tends to see the geopolitical influences for European transport sector´s competitiveness more positive.
8.3 Conclusion of Challenges and Opportunities
Transformation in transport industry
The transport sector has to face new trends in mobility and transport demand causing a fundamental change of the market and a transformation of the system. The shift of demand hotspots is accompanied by a dynamic movement of economic and political power mainly towards Asia. This shift is not only resulting in decisions relevant to the market but also affecting culture, philosophy and values of products and production, policies and regulations, business practices and models as well as the market structures concerning demand and supply. With changing demand patterns also new perspectives on organisation of transport and mobility needs are emerging while new technologies for increasing the efforts for energy reduction and changing behaviour will result in challenges and opportunities at the same time. Political awareness of climate change and the need to react on it are additional factors stimulating innovation in the sector and therefore enforcing change. Main issue is to create awareness of the change as a fundamental system transformation causing a need not only to react on it but also to develop strategies to shape the development.
Position of the European transport industry
The position and standing point of the European transport industry is characterized by a long history of solid based experience in technology development leading to a competitive market position until today. Established technologies, innovation, quality and high skilled labour force are main advantages of European suppliers. The position is not only based on industries abilities but also linked to the related industries and education system as well as free and reliable market conditions in Europe. The transformation of transport is challenging this position as with the shifting demand new technologies are being developed providing solutions beyond established forms of mobility. This change is fundamental causing more than a need of slight improvements, but demanding a new way of thinking in transport, developing and providing technologies and services. Thus the transformation opens a window for new competitors from industries which haven’t been active in the field of transport up to now. For example a variety of ICT-related industries challenging competitiveness of established companies as well as providing opportunities for innovation stimulated by a competitive environment and new business opportunities.
Opportunities for Europe
With every change new challenges and opportunities arise. The globally changing market hotspots bring challenges and opportunities at once. While new markets offer potential to expand the performance of products and services, on the other hand new local competitors are entering the market. Based on the analysis of European transport industries and supported by stakeholder survey realized in RACE2050 there is evidence that Europe will benefit from increasing demand in upcoming markets - particularly in areas and for industries which have already a strong position in the emerging
RACE2050© – FP7 314753
D 6.1 Report on the synopsis on the current framework conditions – FINAL – 06/11/2013 Page 128 of 147
markets. As the domestic transport sector in Europe will not increase as much as in upcoming countries, the development of foreign markets is even more important. For the manufacturing sector, this brings a need to adapt to new demand preferences and create suitable products and services meeting the new needs. This offers also the opportunity to meet essential requirements of the European home markets and to innovate from the given level. Infrastructure efficiency could be improved and sustainable transport could be forced as efficiency in cost and energy will increase importance in all industrial sectors. Rising energy prices in transport and the need for reducing CO2 emissions claim for efficiency and sustainability. For the road sector, alternative drives like hybrids and electric vehicles have a high expectation and potential and also biofuels should be considered attributed to potential according to the experts. In the maritime and aviation sector alternative fuels can reduced CO2 consumption. The opportunities and challenges are also politically influenced as decisions on infrastructure and funding for mobility change frame conditions offering new perspectives. Traditional approaches will and have to be replaced by innovative ones offering big potential for the whole sector. Challenges for Europe
Especially the industry sector has to deal with the shift of demand in emerging markets with the challenge to meet the needs of those markets. Products and services from emerging markets fitting to the needs of their countries of origin can also significantly affect the conditions in traditional markets of the European transport industry and services. New perspectives and ways of business operation of upcoming competitors allow for innovation which may challenge “traditional innovation”, which is rather aiming for modification and improvement of existing solution than for inventing new ones. Manufacturer and services of leading products have to defend their supremacy in the market as new competitors will enter the market and try to take their position. Thus innovative business models have to be created while cooperation between companies and different branches could help to adapt to new market structures. Political measures addressing transport and those aiming for more sustainable transport could bring a shift towards public means of transport. The experts of the stakeholder survey considered a high impact of political measures on the use of transport modes and assumed that the use of rail and biking will increase the most. Concepts supporting convenient mobility and particularly seamless mobility by combination of different means of transport are also likely to increase multimodality, which is expected to be one of the most important future trends in the sector. ICT solutions and other technological innovations will support this as well as the transport sector as a whole. The challenge consists in the optimal combination of different transport services through technological and political measures. Developing appropriate technological solutions and offering services will increase the need for cross company and cross industry collaboration. This will be a challenge in itself as competitiveness will further increase due to market entry of new competitors: due to the qualitative transformation in mobility and transport other industries than the established ones will be entering the markets; a development which is already under way – thinking of ICT or electric industries starting to get involved in the transport business. Beside traditional cooperation and strategic alliances this will bring up the need to think beyond former borders of own technologies and markets; business perspectives have to be enlarged to system thinking as a transformed way of doing business.
Strategies for Europe
Based on the analysis advice can be given as first guidelines for business strategies in order to strengthen the competitiveness of the European transport industry: Focusing on optimizing the infrastructure and efficiency through technology and gain importance in the emerging markets is a must. The shift has to be considered with all facets from amount of demand to cultural differences for business. Building knowhow and developing new solutions in the field of sustainable mobility provides
RACE2050© – FP7 314753
D 6.1 Report on the synopsis on the current framework conditions – FINAL – 06/11/2013 Page 129 of 147
potential. The European transport sector already demonstrates good approaches addressing this topic which have to be further developed. Especially through political measures, sustainable issues will be pushed forward – even in the emerging markets, through the issue of rising energy prices and increasing environmental pressures. The European transport sector should use this advantage and thereby strengthen its position in the world market. Both, European transport manufacturers and services could benefit from the standards which they have already set and the stimulated innovation in this field. On a long term-perspective Europe could gain a leading role in the growing field of sustainable mobility and therefore strengthen its competitiveness. Developments of technologies and markets show already today that thinking in terms of mobility instead of transport has to established – resulting in a broader perspective going beyond transporting passengers and goods based on a certain mode from one to another location; mobility has to be dealt as an active movement combining different modes in a flexible and efficient way and to consider markets in a system perspective. Developments Change has not only to be realised, but embraced as transformation bringing the need not only to adapt to new frame conditions but to create new ways in terms of products, services, business models, the way to operate and to be present in the market of mobility and transport. Strengthened competitiveness will arise from development, which goes beyond overcoming problems; it is about anticipating and designing transformation by seeking for opportunities and actively working for innovation The main opportunity for the European transport industry is the high quality level, including quality skills and technological know-how, as described above, while the greatest challenge is to overcome the own perspective of a comfortable position in global terms and to challenge own perspectives and businesses on a daily base.
RACE2050© – FP7 314753
D 6.1 Report on the synopsis on the current framework conditions – FINAL – 06/11/2013 Page 130 of 147
9. List of figures and tables
Figures
FIGURE 1: RESEARCH SCHEME (OWN COMPILATION 2013) 7 FIGURE 2: ROAD TRANSPORT SECTOR WITH BIGGEST ACTORS IN EU (OWN COMPILATION 2013) 10 FIGURE 3: PRODUCTION OF POWERED TWO-WHEELERS IN EUROPE 2001-2011 (ACEM 2013) 12 FIGURE 4: BICYCLE PRODUCTION BY REGION BETWEEN 1998 AND 2007 (EARTH POLICY INSTITUTE 2008) 13 FIGURE 5: MODAL SPLIT OF FREIGHT TRANSPORT EU-27 BY TON-KM IN 2010 (EUROPEAN UNION 2012) 13 FIGURE 6: MODAL SPLIT OF PASSENGER TRANSPORT EU-27 BY PASSENGER KM IN 2010 (EUROPEAN UNION
2012) 15 FIGURE 7: MAYOR PLAYERS IN THE RAIL EQUIPMENT INDUSTRY ACCORDING TO UNIFE (RFE 2012B, 9) 16 FIGURE 8: TOP 5 PLAYERS IN PASSENGER SERVICE (DEUTSCHE BAHN 2011, 12) 17 FIGURE 9: TOP 5 PLAYERS IN FREIGHT SERVICE (DEUTSCHE BAHN 2011, 18) 17 FIGURE 10: MARKET SHARE OF RAILWAY EQUIPMENT INDUSTRY IN 2001 (EUROFOUND 2004, 2) 17 FIGURE 11: 2011 RAIL “LIBERALIZATION” INDEX (DEUTSCHE BAHN 2011, 46). 20 FIGURE 12: MAIN EUROPEAN ACTORS IN EACH MARITIME SECTOR (OWN COMPILATION 2013) 21 FIGURE 13: MAJOR EUROPEAN SHIPYARDS GROUPS AND THEIR LOCATION IN EUROPE (LUDWIG AND THOLEN
2006) 23 FIGURE 14: MAIN EUROPEAN ACTORS IN EACH AVIATION SECTOR (OWN COMPILATION 2013) 26 FIGURE 15: DELIVERY COMPARISON OVER THE LAST 13 YEARS (AIRBUS AND BOEING) 27 FIGURE 16: NET ORDERS FROM 2002 TO 2011 (POLEK AND EPSTEIN 2012) 28 FIGURE 17: REGIONAL AIRCRAFT BACKLOG IN 2011 (FLIGHTGLOBAL 2012E) 28 FIGURE 18: GLOBAL CIVIL HELICOPTER MARKET SHARE IN 2009 (EADS 2010) 28 FIGURE 19: HISTORICAL BUSINESS JET DELIVERIES FROM 1965 TO 2011 (BOMBARDIER 2012A) 29 FIGURE 20: BUSINESS MANUFACTURERS MARKET SHARE IN 2011 (FLIGHTGLOBAL 2011) 29 FIGURE 21: BUSINESS JET MARKET SEGMENTATION (BOMBARDIER 2012A) 30 FIGURE 22: MAJOR AI COMPETENCES BY EU COUNTRY (ECORYS 2009) 30 FIGURE 23: TOP 21 AUTOMOTIVE MARKETS 2011-2012 (FROST & SULLIVAN 2013) 35 FIGURE 24: DEVELOPMENT OF MANUFACTURING BASES OF EUROPEAN AUTOMOTIVE MANUFACTURERS 2000-
2011 (OICA INTERNATIONAL ORGANIZATION OF MOTOR VEHICLE MANUFACTURERS 2012) 36 FIGURE 25: DEVELOPMENT OF AUTOMOTIVE MARKET BY REGION BETWEEN 2007 AND 2014 (BCG BOSTON
CONSULTING GROUP 2010) 37 FIGURE 26: TOP 5 AUTOMOBILE MANUFACTURER´S MARKET SHARE IN THE WORLD´S BIGGEST MARKETS 2012
(OLATHE TOYOTA PARTS CENTERAND SPORK MARKETING 2012) 37 FIGURE 27: MARKET SHARE BY BRAND IN TERMS OF VOLUME IN RUSSIA (%) (ERNST & YOUNG 2012B) 38 FIGURE 28: CAR INDUSTRY IN CHINA - MAJOR ACTORS, JOINT VENTURES AND ACQUISITION (BALCET UND RUET
2011) 39 FIGURE 29: GLOBAL AND CHINA LIGHT VEHICLE SALES OF TOP 20 OEM GROUPS IN 2010 (ROLAND BERGER
2012) 40 FIGURE 30: TOP 10 AUTOMOTIVE SUPPLIERS FOR WORLDWIDE SALES IN 2011 (IN BILLIONS OF EUROS)
(STATISTA 2013) 41 FIGURE 31: TURNOVER OF THE GERMAN AUTOMOBILE INDUSTRY 2005-2012 (STATISTA 2013B) 42 FIGURE 32: EBIT-MARGIN OF AUTOMOBILE MANUFACTURER´S 2011 AND 2012 (ERNST & YOUNG 2012) 43 FIGURE 33: OUTLOOK CARS PER 1000 INHABITANTS BY REGION IN 2000 AND 2025 (AMROP & ROLAND BERGER
2011B) 44 FIGURE 34: CONSUMERS DEMAND BY DIFFERENT MODELS IN THE BRIC COUNTRIES (BCG BOSTON CONSULTING
GROUP 2010) 44 FIGURE 35: DEVELOPMENT OF VOLKSWAGEN MOTOR VEHICLES PRODUCTION BY REGION BETWEEN 2000 AND
2011 (OICA INTERNATIONAL ORGANIZATION OF MOTOR VEHICLE MANUFACTURERS 2012) 45 FIGURE 36: DIRECT AND INDIRECT EMPLOYMENT IN THE AUTOMOBILE SECTOR IN 2010 (ACEA 2012) 46 FIGURE 37: DEPLOYMENT OF EMPLOYMENT IN EU-27 MEMBER COUNTRIES IN THE AUTOMOBILE INDUSTRY
BETWEEN 2001-2005 AND 2005-2010 (ACEA 2012) 46 FIGURE 38: DEVELOPMENT OF EXPORTS AND IMPORTS OF EU PASSENGER CAR BY VALUES (ACEA 2012) 48 FIGURE 39: DEVELOPMENT OF MAIN DESTINATIONS OF EU PASSENGER CAR EXPORTS BY VALUES (ACEA 2012) 48 FIGURE 40: EU-27 AND OTHER MAJOR PLAYERS IN WORLD-WIDE TRADE IN MOTOR CARS IN 2011 (EUROSTAT
2012) 49
RACE2050© – FP7 314753
D 6.1 Report on the synopsis on the current framework conditions – FINAL – 06/11/2013 Page 131 of 147
FIGURE 41: EXPORT AND MARKET ACCESS FOR GERMAN CAR PRODUCERS 2012 (VDA VERBAND DEUTSCHER AUTOMOBILHERSTELLER 2012) 50
FIGURE 42: TARIFF PROTECTION (PURE DUTY RATE WITHOUT FURTHER CHARGES LIKE EXCISE DUTIES) (VDA VERBAND DEUTSCHER AUTOMOBILHERSTELLER 2012) 50
FIGURE 43: R&D FACILITIES OF MAJOR AUTOMOTIVE PLAYERS IN LOW-COST COUNTRIES AND EMERGING MARKETS (BERNHARDT, DRESSLER AND TÓTH 2010) 52
FIGURE 44: ENGINEERING SOURCING APPROACHES BETWEEN OEMS AND OESS (BERNHARDT, DRESSLER AND TÓTH 2010) 53
FIGURE 45: FINANCIAL DATA ON ALL SUB-SECTORS OF TRANSPORT EQUIPMENT (EUROSTAT 2009, 292) 55 FIGURE 46: BOMBARDIER EBIT MARGIN (BOMBARDIER 2012, 89) 55 FIGURE 47: DB AND SNCF EBITA (DB 2012) 56 FIGURE 48: CHINA MINISTRY OF RAILWAYS´ RAIL OPERATION FINANCIAL DATA (CHINASCOPE 2012) 57 FIGURE 49: MARKET GROWTH IN THE SHORT PERIOD (UNIFE 2012A, 9) 58 FIGURE 50: EXPECTED DEVELOPMENT OF RAIL EQUIPMENT INDUSTRY (UNIFE 2012A, 8) 59 FIGURE 51: NON-EUROPEAN COMPANIES EMPLOYMENT DATA (WORLDWATCH 2010, 15) 60 FIGURE 52: STAFF STRUCTURE OF CHINESE CSR IN 2011 (CSR 2011, 39) 61 FIGURE 53: RAIL EQUIPMENT EXPORT ACCORDING TO EUROSTAT (EUROSTAT 2009, 293) 62 FIGURE 54: CSR 2011 TURNOVER (CSR 2011, 29) 62 FIGURE 55: CSR FOREIGN OPERATION (CSR 2011, 27) 63 FIGURE 56: MARKET SHARES IN CGT COMPLETED AND DELIVERED BY LEADING SHIPBUILDING REGIONS FROM
1970 TO 2008 (ECORYS 2009) 65 FIGURE 57: SOUTH KOREA SHIPYARDS ACTIVITY 2000-2012 (SEA EUROPE 2013B) 66 FIGURE 58: CHINA SHIPYARDS ACTIVITY 2000-2012 (SEA EUROPE 2013B) 66 FIGURE 59: JAPAN SHIPYARDS ACTIVITY 2000-2012 (SEA EUROPE 2013B) 67 FIGURE 60: ORDER BOOK EVOLUTION (SEA EUROPE 2013B) 68 FIGURE 61: ORDER BOOK 2005-2012 MAIN EMERGING MARKETS (SEA EUROPE 2013B) 69 FIGURE 62 - BALTIC DRY INDEX (DATA FROM: COPENHAGEN BUSINESS SCHOOL AND ASIENKURIER) (KURIER
2013) 74 FIGURE 63: MERCHANT FLEET BY TYPE OF SHIP, ANNUAL, 1980-2012 (UNCTAD STAT 2013) 75 FIGURE 64: WORLD SEABORNE TRADE BY TYPES OF CARGO, ANNUAL, 1980 – 2011 [MILLION METRIC TONNES]
(UNCTAD STAT 2013) 75 FIGURE 65: TOP EXPORTING COUNTRIES IN 2011 (UN COMTRADE N.D.) 76 FIGURE 66: TOP IMPORTING COUNTRIES IN 2011 (UN COMTRADE N.D.) 76 FIGURE 67: TRADE BALANCE BY MDG REGIONS 2011 IN BN US$ (UN COMTRADE N.D.) 77 FIGURE 68: BUSINESS JET DELIVERIES REGION (IN PERCENTAGE OF TOTAL) OF AIRPLANES MANUFACTURED
WORLDWIDE 2007-2012 (SOURCE: GAMA) 78 FIGURE 69: REVENUE OF THE TOP 100 MANUFACTURERS PER REGION 2007-2011 IN DOLLARS (RACE2050
BASED ON FLIGHTGLOBAL DATA) 79 FIGURE 70: 2009 COMPARATIVE AEROSPACE INDUSTRY TURNOVER (ASD 2010) 79 FIGURE 71: EBIT MARGIN (IN %) OF THE AI (ECORYS 2009) 80 FIGURE 72: RETURN ON CAPITAL EMPLOYED (IN %) OF THE AI (ECORYS 2009) 80 FIGURE 73: TOP 100 WORLDWIDE AVIATION INDUSTRIES IN 2011 (RACE2050 WITH FLIGHTGLOBAL DATA) 80 FIGURE 74: EUROPEAN UNION AVIATION INDUSTRY IN 2011 (RACE2050 WITH FLIGHTGLOBAL DATA) 81 FIGURE 75: WORLD AIR TRAFFIC REMAINS A GROWTH MARKET (AIRBUS 2012B). 81 FIGURE 76: WORLD TRAFFIC SPLIT BY DOMICILE (ROLLS-ROYCE 2012) 82 FIGURE 77: DIRECT EMPLOYMENT IN EUROPEAN AERONAUTIC INDUSTRY BY REGION 2008 (ECORYS 2009) 82 FIGURE 78: EUROPEAN AEROSPACE AND DEFENCE 2011 EMPLOYMENT BREAKDOWN (ASD 2011) 83 FIGURE 79 : EUROPEAN AERONAUTICAL LABOUR PRODUCTIVITY (ASD 2010) 83 FIGURE 80: US AEROSPACE LABOUR PRODUCTIVITY (X1000 US$ 2002) (U.S. BUREAU OF LABOUR STATISTICS
2012) 84 FIGURE 81: TOP EXPORTING COUNTRIES IN 2011 (UN COMTRADE N.D.) 84 FIGURE 82: TOP IMPORTING COUNTRIES IN 2011 (UN COMTRADE N.D.) 85 FIGURE 83: TRADE BALANCE BY MDG REGIONS 2011 IN BN US$ (UN COMTRADE N.D.) 86 FIGURE 84: URBANISATION TRENDS IN ASIA 2015-2030 (RFE 2012B) 91 FIGURE 85: URBANISATION TRENDS IN ASIA 2015-2030 (RFE 2012B) 92 FIGURE 86: PROJECTED CAR OWNERSHIP IN ADVANCED AND DEVELOPING COUNTRIES AND THEIR SHARE OF
WORLDWIDE CAR FLEET 2005-2050 (CHAMON, MAURO AND OKAWA 2008) 95 FIGURE 87: DEVELOPMENT OF INCOME PER CAPITA 2010-2050 (THE ECONOMIC TIMES 2012) 95
RACE2050© – FP7 314753
D 6.1 Report on the synopsis on the current framework conditions – FINAL – 06/11/2013 Page 132 of 147
FIGURE 88: CHINESE MANUFACTURING INDUSTRY WIPING AWAY EUROPEAN FIRMS (UNIFE 2009, 52) 98 FIGURE 89: WORLD SHIPBUILDING CYCLES (ECORYS 2009) (ECORYS 2009) 100 FIGURE 90: CONTRACT VS. YARD CAPACITY IN 2012 (DANISH SHIP FINANCE 2013) (DANISH SHIP FINANCE 2013)
101 FIGURE 91: CRUDE OIL AND BUNKER FUEL PRICES (SEA EUROPE 2013A) (SEA EUROPE 2013A) 102 FIGURE 92: RELATION BETWEEN AIR TRAVEL AND ECONOMIC GROWTH (BOEING 2012) 104 FIGURE 93: GLOBAL MARKET GROWTH RATES (BOEING 2012) 105 FIGURE 93: TRIPS PER CAPITA 2020 (CAPA N.D.) 105 FIGURE 94: 2011 CITIES WITH MORE THAN 10.000 DAILY ROUND TRIP LONG-HAUL PASSENGERS (AIRBUS 2012B)
106 FIGURE 95: 2031 CITIES WITH MORE THAN 10,000 DAILY ROUND TRIP LONG-HAUL PASSENGERS (AIRBUS 2012B)
106 FIGURE 96: PROPENSITY TO TRAVEL PER % OF URBAN POPULATION (AIRBUS 2012B) 107 FIGURE 97: LCA EMERGING COMPETITION (COMAC AND IRKUT) 107 FIGURE 98: NEW REGIONAL AVIATION COMPETITORS (SUKHOI, COMAC AND MHI) 108 FIGURE 99: JET FUEL PRICE EVOLUTION FOR THE LAST 15 YEARS (INDEX MUNDI 2010) 108 FIGURE 100: FUEL EFFICIENCY OF NEW AIRCRAFT HAS DRAMATICALLY IMPROVED (IATA 2011) 109 FIGURE 101: PERCENTAGE OF COSTS SPENT WITH FUEL ALONG THE YEARS (AIRBUS 2012B) 109 FIGURE 102: KEY FACTORS FOR TRANSPORT INDUSTRIES (OWN COMPILATION 2013) 112 FIGURE 103: WORLD CO2 EMISSIONS BY SECTOR IN 2009 (IEA 2011) 113 FIGURE 104: PER CAPITA GHG EMISSIONS (IEA 2012), (WORLDBANK 2013), (EPA 2013) 114 FIGURE 105: GHG EMISSION PER CAPITA AND GDP IN EU-27 1990-2011 (EEA 2012) 114 FIGURE 106: TOTAL CO2 EMISSIONS FROM FUEL COMBUSTION IN 2008 (IEA 2011) 115 FIGURE 107: CO2 EMISSION IN TRANSPORT BY TRANSPORT SECTORS IN 2008 (IEA 2008) 116 FIGURE 108: TARGET FOR EMISSIONS (G/KM) FOR THE NEW-VEHICLE-FLEET AVERAGE (BCG BOSTON
CONSULTING GROUP 2011) 117 FIGURE 109: SHARE OF RENEWABLE ENERGY IN FINAL CONSUMPTION AND TRANSPORT BETWEEN 2008 AND
2020 IN EU 27 (EUROPEAN ENVIRONMENT AGENCY 2013) 118 FIGURE 110: DEVELOPMENT OF GLOBAL DEMAND FOR PASSENGER TRANSPORT UNTIL 2030 (OWN
COMPILATION 2013) 123 FIGURE 111: DEVELOPMENT OF GLOBAL DEMAND FOR TRANSPORT OF GOODS UNTIL 2030 BY SECTOR (OWN
COMPILATION 2013) 124 FIGURE 112: BRIC COUNTRIES AND THEIR IMPACT ON THE COMPETITIVENESS OF THE EUROPEAN TRANSPORT
SECTOR BY SECTOR (OWN COMPILATION 2013) 125 FIGURE 113: POLITICAL AND ECONOMIC EFFORTS AND THEIR IMPACT ON THE MODAL CHOICE (OWN
COMPILATION 2013) 126 Tables
TABLE 1: THE LARGEST EUROPEAN LAND FREIGHT TRANSPORT PROVIDER BY TURNOVER IN 2009 (EUROPEAN COMMISSION 2011B) 14
TABLE 2: AVIATION INDUSTRY MAIN PLAYERS 25 TABLE 4: EMPLOYEES IN THE RAIL MANUFACTURING INDUSTRY (UNIFE 2012C) 60 TABLE 5: TOP 10 SHIPYARDS IN THE WORLD BY ORDER BOOK IN JUNE 2012 (CLARKSON 2012) 68 TABLE 6: COUNTRY ORDER BOOK RANKING IN 2012 (SEA EUROPE 2013B) 69 TABLE 7: TOP 20 CONTROLLED FLEETS (SEA EUROPE 2013B) 70 TABLE 8: HYUNDAI HEAVY INDUSTRIES FINANCIAL INDICATORS [THOUSAND EUROS] (THE FINANCIAL TIMES
2013) 70 TABLE 9: HYUNDAI HEAVY INDUSTRIES EMPLOYMENT AND PRODUCTIVITY INDICATORS IN [THOUSAND EUROS]
(THE FINANCIAL TIMES 2013) 71 TABLE 10: SAMSUNG HEAVY INDUSTRIES FINANCIAL INDICATORS [THOUSAND EUROS] (THE FINANCIAL TIMES
2013B) 71 TABLE 11: SAMSUNG HEAVY INDUSTRIES EMPLOYMENT AND PRODUCTIVITY INDICATORS [THOUSAND EUROS]
(THE FINANCIAL TIMES 2013B) 71 TABLE 12: CHINA SHIPBUILDING INDUSTRY CORPORATION FINANCIAL INDICATORS [THOUSAND EUROS] (THE
FINANCIAL TIMES 2013C) 71 TABLE 13: CHINA SHIPBUILDING INDUSTRY CORPORATION EMPLOYMENT AND PRODUCTIVITY INDICATORS

RACE2050© – FP7 314753
D 6.1 Report on the synopsis on the current framework conditions – FINAL – 06/11/2013 Page 133 of 147
[THOUSAND EUROS] (THE FINANCIAL TIMES 2013C) 71 TABLE 14: CHINA STATE SHIPBUILDING CORPORATION FINANCIAL INDICATORS [THOUSAND EUROS] (THE
FINANCIAL TIMES 2013D) 72 TABLE 15: CHINA STATE SHIPBUILDING CORPORATION EMPLOYMENT AND PRODUCTIVITY INDICATORS
[THOUSAND EURO] (THE FINANCIAL TIMES 2013D) 72 TABLE 16: FINCANTIERI FINANCIAL INDICATORS [THOUSAND EURO] (FINCANTIERI 2012) 72 TABLE 17: FINCANTIERI EMPLOYMENT AND PRODUCTIVITY INDICATORS [THOUSAND EURO] (FINCANTIERI 2012)
72 TABLE 18: STX EUROPE FINANCIAL INDICATORS [THOUSAND EURO] (STX EUROPE 2013) 73 TABLE 19: STX EUROPE EMPLOYMENT AND PRODUCTIVITY INDICATORS [THOUSAND EURO] (STX EUROPE 2013)
73 TABLE 20: IHC MERWEDE FINANCIAL INDICATORS [THOUSAND EURO] (IHC MERWEDE 2013) 73 TABLE 21: IHC MERWEDE EMPLOYMENT AND PRODUCTIVITY INDICATORS [THOUSAND EURO] (IHC MERWEDE
2013) 73
RACE2050© – FP7 314753
D 6.1 Report on the synopsis on the current framework conditions – FINAL – 06/11/2013 Page 134 of 147
10. Reference
AAR. “Class I Railroad Statistics.” Association of American Railroads. 10 January 2013. https://www.aar.org/StatisticsAndPublications/Documents/AAR-Stats-2013-01-10.pdf (accessed April 29, 2013).
ACEA. «A Competitive Auto Industry for Europe.» www.acea.be. 2012b. http://www.acea.be/images/uploads/files/A_Competitive_Auto_Industry_for_Europe_20121108.pdf (Zugriff am 30. May 2013).
ACEA. EU Economic report 2011. Geneva: ACEA, 2011. ACEA. Facts of worlds automobile industry. Brussels: ACEA, 2008. —. Fuel Efficiency - A key objective. 2013.
http://www.acea.be/news/news_detail/fuel_efficiency_a_key_objective (accessed April 04, 2013).
ACEA. The Automobile Industry - Pocket guide 2012. annual industry report, Bussels: European Automobile manufacturers association, 2012.
ACEM. The motorcycle industry in Europe - Statistical overview. Brussels: ACEM, 2013. ACEM. The motorcycle industry in Europe. ACEM Report, Brussels: ACEM, 2010. Adachi, Masashi. “China Competitiveness. Case Study: China South Locomotive and Rolling Stock
Corporation (CSR).” Center for Strategic and International Studies (CSIS). 2013. http://csis.org/publication/chinas-competitiveness-china-south-locomotive-and-rolling-stock-corporation-csr (accessed May 25, 2013).
AgustaWestland. Profile: AgustaWestland. n.d. http://www.agustawestland.com/content/profile (accessed January 2013).
Airbus. Navigating the future. Blagnac: AIRBUS S.A.S., 2012b. Airbus. Navigating the future. Blagnac: Airbus S.A.S, 2012. Airline world. “Oil Crisis in the Airline Industry.” Airline world Web site. 5 August 2008.
http://airlineworld.wordpress.com/2008/08/05/oil-crisis-in-the-airline-industry/ (accessed April 2013).
AlixPartners. Post-Crisis Auto Industry Faces New Set of Challenges and Decisions. Press release. 2011. http://www.alixpartners.com/en/MediaCenter/PressReleaseArchive/tabid/821/articleType/ArticleView/articleId/141/Post-Crisis-Auto-Industry_Faces-New-Set-of-Challenges-and-Decisions-According-to-AlixPartners-Study.aspx (accessed April 4, 2013).
Alstom. “Activity report 2010-2011.” www.alstom.com. 2011. http://www.alstom.com/Global/Group/Resources/Documents/Activity%20report%202010%2011.pdf (accessed May 25, 2013).
Amoore, John, and Jay Jaiswal. “ERRAC Roadmap. WP 05 Strengthening Competitiveness.” www.errac.org. 2012. http://www.errac.org/spip.php?article23 (accessed May 25, 2013).
Amrop & Roland Berger. Auswierkungen neuer Mobilitätsanforderungen auf Wertschöpfungsanteile der Zulieferer. ACOD Congress in February 2011. 2011b. http://www.acod.de/media/events/kongress2011/referate/schlick_auswierkungen_neuer_mobilit%C3%A4tsanforderungen_auf_wertsch%C3%B6pfungsanteile_der_zulieferer.pdf (accessed March 20, 2013).
Amtrak. “Fiscal Year 2012 Budget.” Amtrak. 20 January 2013. http://www.amtrak.com/ccurl/963/948/AmtrakFY12ComprehensiveBusinessPlan-FINAL-wAppx.pdf (accessed April 29, 2013).
Ansaldo. “2012 Estimates.” Ansaldo. 2012. http://www.ansaldo-sts.com/en/arc/press/preliminary-fy-2012-estimates (accessed April 29, 2013).
APCO. Market analysis report - China's Automotive Industry. Beijing: APCO, 2010. ASD. Facts and Figures 2009. Brussels: ASD, 2010. ASD. Facts and Figures 2010. Brussels: ASD, 2011. ASD. Key Facts and Figures 2011. Brussels: ASD, 2012. ATKearney. India's Auto Component Suppliers - New Frontiers in Growth. June 2012.
RACE2050© – FP7 314753
D 6.1 Report on the synopsis on the current framework conditions – FINAL – 06/11/2013 Page 135 of 147
http://www.atkearney.com/paper/-/asset_publisher/dVxv4Hz2h8bS/content/india-s-auto-component-suppliers-new-frontiers-in-growth/10192 (accessed April 13, 2013).
ATR. About ATR. n.d. http://www.atraircraft.com/about-atr/corporate-overview/company-profile.html (accessed January 2013).
Automotive News Europe. Faurecia, China's Changan from JV to marke interior parts. 2013. http://europe.autonews.com/apps/pbcs.dll/article?AID=/20130501/ANE/130509996/faurecia-chinas-changan-form-jv-to-make-interior-parts#axzz2SbAEBEUd (accessed May 7, 2013).
Aviation Week. China is the biggest emerging threat to Boeing and Airbus, says Albaugh. 6 January 2012. http://www.aviationweek.com/Article.aspx?id=/article-xml/avd_06_01_2012_p01-01-463868.xml (accessed January 2013).
AWES. “AWES Annual Report 2002-2003.” CESA Web site. 2003. http://www.cesa.eu/links_downloads# (accessed April 2013).
Balcet, G., and J. Ruet. “From Joint Ventures to National Champions or Global Players? Alliances and Technological Catching-up in Chinese and Indian Automotive Industries.” ERIEP - European Review of Industrial Economics and Policy. 2011. http://revel.unice.fr/eriep/index.html?id=3309 (accessed May 7, 2013).
Banister, D., J. Pucher, and M. Lee-Gosselin. “Making Sustainable Transport Politically and Publicly Acceptable.” In Institutions and Sustainable Transport: Regulatory Reform in Advanced Economies, by P. Rietveld, R. Stough and eds., 17-50. Cheltenham, england: Edward Elgar Publishing, 2007.
Banister, David. “The sustainable mobility paradigm.” Transport Policy, 15 2008: 73-80. BCG Boston Consulting Group. Powering Autos to 2020 - the Era of the electric car? BCG Report,
Boston: BCG, 2011. BCG Boston Consulting Group. Winning the BRIC auto markets - Achieving deep localization in Brazil,
Russia, India and China. Boston: BCG, 2010. BDA. FAST 2025 - Massiver Wandel in der automobilen wertschöpfungsstruktur - europa bleibt starker
Industriestandort und behält F&E-Vormachtstellung. 2012. http://www.vda.de/de/meldungen/news/20121114-2.html (accessed March 25, 2013).
Bell Rae, John, and Alan K. Binder. Universalium. 2010. http://universalium.academic.ru/257827/automotive_industry (accessed March 30, 2013).
Bernhardt, W., N. Dressler, and A. Tóth. Mastering Engineering Service Outsourcing in the automotive industry. Roland Berger Market Study, Munich: Roland Berger, 2010.
BFE, Bundesamt für Energie. Kantonale Motorfahrzeugsteuern: Rabatte für energieeffiziente Fahrzeuge. Schweizerische Eidgenossenschaft, 2013.
Bike Europe. http://www.bike-eu.com. 2013. http://www.bike-eu.com/Sales-Trends/Market-Report/2013/3/European-Union-2012-Is-Cycling-Becoming-Hot-Again-in-Europe-1179947W/ (accessed March 12, 2013).
Bloomberg. Mitsubishi wins SkyWest jet sale in blow to Bombardier. 12 July 2012. http://www.bloomberg.com/news/2012-07-11/mitsubishi-wins-regional-jet-order-from-skywest.html (accessed January 2013).
—. www.blomberg.com. 2013. http://www.bloomberg.com/quote/BDIY:IND/chart (accessed April 28, 2013).
BMW-i. BMW-i. 2013. http://www.bmw-i.ch/de_de/concept/ (accessed April 17, 2013). Boeing. Boeing Current Market Outlook. Chicago: Boeing, 2012. Boeing. Current Market Outlook 2012-2031. The Boeing Company, 2012. Boeing. The Boeing Company - Overview. Chicago: Boeing, 2010. Bombardier. About Us: Bombardier. n.d. http://www.bombardier.com/en/corporate/about-us
(accessed January 2013). —. “Annual report 2012.” http://ir.bombardier.com. 2012. http://ir.bombardier.com/en/financial-
reports (accessed May 25, 2013). Bombardier. Business Aircraft Market Forecast 2012-2031. Market forecast, Montreal: Bombardier,
2012a.
RACE2050© – FP7 314753
D 6.1 Report on the synopsis on the current framework conditions – FINAL – 06/11/2013 Page 136 of 147
Bombardier. Commercial Aircraft Market Forecast 2012-2031. Montreal: Bombardier, 2012b. BP. BP Statistical Review of World Energy. Statistical Review, London: BP, 2012. BRS - Barry Rogliano Salles. Shipping and shipbuilding markets. Annual Review 2012. Paris: BRS, 2012. Bullinger, Hans-Jörg. Technology Guide, Principles - Applications - Trends. Springer, 2009. Business Vibes. Industry Insight: Shipbuilding Industry in EU. 24 September 2012.
http://www.businessvibes.com/blog/industry-insight-shipbuilding-industry-eu (accessed March 2013).
CAAM. Statistics. 2012. http://www.caam.org.cn/english (accessed May 7, 2013). Cantos, Pedro, José Manuel Pastor, and Lorenzo Serrano. Vertical and Horizontal Separation in the
European Railway Sector. Effects on Productivity. Bilbao: FBBVA, 2008. CAPA. India: the world’s fastest growing domestic aviation market. n.d.
http://centreforaviation.com/analysis/india---the-worlds-fastest-growing-domestic-market-62124 (accessed April 12, 2013).
Catalan News Agency. High-Speed Train between Barcelona and Madrid is reduced to 2h 30 min. 24 October 2011. http://www.catalannewsagency.com/news/society-science/high-speed-train-between-barcelona-and-madrid-reduced-2h-30-min (accessed January 25, 2013).
CCEM, Competence Center Energy and Mobility. «Ultra-Fast Charging of Electric Vehicles.» In Mobility, von CCEM, 20-22. CCEM, 2010.
Center for Climate and Energy Solutions. www.c2es.org. 2013. http://www.c2es.org/facts-figures/international-emissions/historical (accessed May 25, 2013).
CER, EIM and UIC. “CHALLENGE 2050. The Rail Sector Vision.” www.cer.be. 2013a. http://www.cer.be/index.php?id=98&tx_ttnews[tt_news]=966&cHash=32421c0122a3227f9190496e2a4370e5 (accessed May 25, 2013).
Chamon, Marcos, Paolo Mauro, and Yohei Okawa. “Cars - the implications of mass car ownership in the emerging market giants.” Economic Policy, 18 March 2008: 243-296.
Chang, Gordon G. “China's Aviation ABCs: Airbus, Boeing, and COMAC.” Forbes. 25 11 2012. http://www.forbes.com/sites/gordonchang/2012/11/25/chinas-aviation-abcs-airbus-boeing-and-comac/ (accessed 4 29, 2013).
ChinaScope. “China's Ministry Of Railways Issues.” ChinaScope. 31 July 2012. http://seekingalpha.com/instablog/968545-chinascope-financial/913771-china-s-ministry-of-railways-issues-bonds-worth-cny-27-bn-today-18-of-annual-target (accessed April 2013, 2013).
Ciara, F. “Estimation of Car-Sharing Demand Using an Activity-Based AMicrosimulation Approach - Model Discussion and Preliminary Results.” European Industry in a changing world - updated Sectoral Overview 2009. STRC 2010: CEC Commission of the European communities, 2009.
Clarkson. “ShipYard Orderbook Monitor.” July 2012. http://shipiu.oie.go.th/transport/upload_worlddata/WSM-orderbook%2007-july-2012-1348741002.pdf (accessed April 2013).
Clarksons Capital Markets. Overview of the Offshore Supply Vessel Industry. London: Clarksons Capital Markets, 2012.
Clearwater. Aerospace Global Report 2011. London: clearwatercf, 2010. Clearwater. Aerospace Global Report 2011. London: clearwatercf, 2010. Color Line. About Color Line. n.d. http://www.colorline.com/about_color_line (accessed June 2013). Cruise Market Watch. Growth of the Cruise Line Industry. n.d.
http://www.cruisemarketwatch.com/growth/ (accessed April 2013). CSR. “2011 Annual Report.” www.csr.com. 2011. http://www.csr.com/annualreport2011/ (accessed
May 25, 2013). Danish Ship Finance. Shipping Market Review. Copenhagen: Danish Ship Finance, 2013. DB. “Deutsche Bahn and SNCF: Peer Comparison.” DB. 14 December 2012.
http://www1.deutschebahn.com/file/3189850/data/moodys_peer.pdf (accessed April 29, 2013).
Deloitte. 2012 Global aerospace and defense industry outlook: A tale of two industries. Seattle:
RACE2050© – FP7 314753
D 6.1 Report on the synopsis on the current framework conditions – FINAL – 06/11/2013 Page 137 of 147
Deloitte Touche Tohmatsu Limited, 2012. Deutsche Bahn. “Competition Report 2011.” http://www.deutschebahn.com. 2011.
http://www.deutschebahn.com/en/press/brochures/competition_report/2236384/competition_report_2011.html?start=0 (accessed May 25, 2013).
DMN Deutsche Mittelstandsnachrichten. Automobilindustrie - China wird 2013 erstmals Europa überholen. 2013. http://www.deutsche-mittelstands-nachrichten.de/2013/01/49162 (accessed April 29, 2013).
DNV. Shipping 2020. Høvik: Det Norske Veritas, 2012. Douglas Westwood. Global Offshore Prospects. London: Douglas Westwood, 2013. dpa. Handelsblattonline. 2013. http://www.handelsblatt.com/unternehmen/industrie/bushersteller-
chinesen-ueberholen-daimler/7959010.html (accessed April 22, 2013). EADS. EADS. n.d. www.eads.com (accessed January 2013). EADS. Eurocopter in the US. New York, 18 March 2010. Earth Policy Institute. Earthpolicy.org. 6 May 2008. http://www.earth-policy.org/data_center/C23
(accessed April 15, 2013). EBAA. www.ebaa.org. n.d. www.ebaa.org (accessed May 2013). EC. «COMMUNICATION FROM THE COMMISSION 104 "Responding to the crisis in the European
automotive industry".» http://eur-lex.europa.eu. 2009. http://eur-lex.europa.eu/LexUriServ/LexUriServ.do?uri=COM:2009:0104:FIN:EN:PDF (Zugriff am 30. May 2013).
—. ICT innovation in the automotive industry, a key competence in Europe. Joint Research Centre news. 2010. http://ec.europa.eu/dgs/jrc/index.cfm?id=1410&obj_id=12390&dt_code=NWS&lang=en (accessed April 28, 2013).
—. “On monitoring development of the rail market.” http://eur-lex.europa.eu. 2007b. http://eur-lex.europa.eu/LexUriServ/LexUriServ.do?uri=CELEX:52007DC0609:EN:NOT (accessed May 25, 2013).
ECMT. Improving Access to Taxis. Summary Document, Paris: ECMT, 2007. Ecorys. Competitiveness of the EU Aerospace Industry. Study, Munich: Ecorys, 2009. ECORYS. Competitiveness of the EU Aerospace Industry. Study, Munich: ECORYS, 2009. Ecorys. Study on Competitiveness of the European Shipbuilding Industry. Rotterdam: ECORYS SCS
Group, 2009. EEA. Greenhousegas emission trends and projections in Europe 2012 - Tracking process towards Kyoto
and 2020 targets. EEA Report 6/2012, Copenhagen: EEA, 2012. Embraer. Embraer Annual report 2011. São José dos Campos: Embraer, 2011. Embraer. Market Outlook 2012-2031. São José dos Campos: Embraer, 2012. EMEC. Green Ship Technology Book. Brussels: European Maritime Equipment Council, 2010. Empa, Materials, Science & Technology. «Der Funken im Wasserstoff.» Empa News, September 2011:
13-15. Engle, Eric Allen. “A Single Integrated European Rail Market.” http//ssrn.com. 1 October 2012.
http//ssrn.com/abstract=2155169 or http, //dx.doi.org/10.2139/ssrn.2155169 (accessed May 25, 2013).
EPA. Inventory of U.S. Greenhouse Gas Emissions and Sinks. Washington D.C.: U.S. Environmental Protection Agency, 2013.
Ernst & Young. “An overview of Russian and CIS automotive industry.” www.ey.com. 2012. http://www.ey.com/Publication/vwLUAssets/Russian_and_CIS_automotive_industry/$FILE/Russia%20Automotive_2012.pdf (accessed April 4, 2012).
Ernst & Young. The Central and Eastern European automotive market - Industry overview. Industry overview, Stuttgart: Ernst & Young, 2010.
—. “www.ey.com.” Die grössten Automobilhersteller weltweit 2012. 2012. http://www.ey.com/Publication/vwLUAssetsPI/Die_groessten_Automobilhersteller_weltweit_2012/$FILE/Automotive_Bilanzen_Q1_2012_EY.pdf (accessed April 4, 2013).
RACE2050© – FP7 314753
D 6.1 Report on the synopsis on the current framework conditions – FINAL – 06/11/2013 Page 138 of 147
—. “www.ey.com.” An overview of Russian and CIs automotive industry. 2012b. http://www.ey.com/Publication/vwLUAssets/Russian_and_CIS_automotive_industry/$FILE/Russia%20Automotive_2012.pdf (accessed April 4, 2012).
ERRAC. “Answer to the questionnaire for STTP Stakeholders' Hearing on Rail Transport.” www.errac.org. 14 Febraury 2011. http//www.errac.org/IMG/pdf/sttp_errac.pdf (accessed May 25, 2013).
—. “Answer to the questionnaire for STTP Stakeholders' Hearing on Rail Transport February.” www.errac.org. Febraury 2011. http, //www.errac.org/IMG/pdf/sttp_errac.pdf (accessed May 25, 2013).
Eun-Chang, Lee. “Korea’s Shipbuilding Industry Still Ranks No. 1 in the World.” Korea Focus ( Hana Institute of Finance), April 2011.
Eun-chang, Lee. Korea's Shipbuilding Industry Still Ranks No. 1 in the World. April 2011. www.koreafocus.or.kr/design2/layout/content_print.asp?group_id=103571 (accessed April 2013).
Eurocontrol. Single European Sky. September 2011. http://www.eurocontrol.int/dossiers/single-european-sky (accessed January 2013).
—. Single European Sky. September 2011. http://www.eurocontrol.int/dossiers/single-european-sky (accessed January 2013).
Eurocopter. Eurocopter. n.d. www.eurocopter.com (accessed January 2013). Eurofound 2004. Trends and drivers of change in the European railway equipment sector. Dublin:
Eurofound, n.d. Eurofound. Employment, industrial relations and working conditions in the European rail transport
sector. Dublin: Eurofound, 2006. —. Employment, industrial relations and working conditions in the European rail transport sector.
Dublin: Eurofound, 2006. —. Trends and drivers of change in the European railway equipment sector. Dublin: Eurofound, 2004. —. Trends and drivers of change in the European railway equipment sector. Dublin: Eurofound, 2004. European Commision. europa.eu. 2013.
http://ec.europa.eu/clima/policies/transport/aviation/index_en.htm (accessed June 26, 2013).
European Commission. Action plant for the EU automotive industry in 2020. 2012. http://ec.europa.eu/enterprise/newsroom/cf/itemdetail.cfm?item_id=6268&lang=en (accessed April 22, 2013).
European Commission. CARS 21 - A competitive automotive regulatory system for the 21st century. Final report, Brussels: EC, 2006.
—. “EC communication On monitoring development of the rail market.” http://eur-lex.europa.eu. 2007. http://eur-lex.europa.eu/LexUriServ/LexUriServ.do?uri=COM:2007:0609:FIN:EN:PDF (accessed May 25, 2013).
European Commission. European industry in a changing world - updated sectoral overview 2009. Working Document, Brussels: European Commission, 2009.
European Commission. European Industry in a changing world. updated sectoral overview, Brussels: EC, 2009.
—. Eurostat. October 2012. http://epp.eurostat.ec.europa.eu/statistics_explained/index.php/Main_Page (accessed April 2013).
—. Industrial goods: Civil aviation. 13 May 2011. http://ec.europa.eu/trade/creating-opportunities/economic-sectors/industrial-goods/civil-aviation/ (accessed April 2013).
—. “Industrial goods: Civil aviation.” European Commission Web site. 13 May 2011. http://ec.europa.eu/trade/creating-opportunities/economic-sectors/industrial-goods/civil-aviation/ (accessed April 2013).
European Commission. road Freight Transport Vademecum 2010 Report. Market trends and structure of the road haulage sector in the EU in 2010. Brussels: European Commission, 2011a.
RACE2050© – FP7 314753
D 6.1 Report on the synopsis on the current framework conditions – FINAL – 06/11/2013 Page 139 of 147
European Commission. Roadmap to a Single European Transport Area - Towards a competitive and resource efficient transport system. Brussels: European Commission, 2011b.
European Commission. White Paper - Roadmap to a single European Transport area - towards a competitive and resource efficient transport system. COM(2011) 144 final, Brussels: EC, 2011.
—. www.ec.europa.eu. 2013. http://ec.europa.eu/transport/themes/sustainable/index_en.htm (accessed June 16, 2013).
European Commission/2. Cars 21. High Level Group on the Competitiveness and Sustainable Growth of the Automotive Industry in the European Union - final Report 2012. Final Report, Brussels: European Commission , 2012.
European Environment Agency. eea.europa.eu. March 2013. http://www.eea.europa.eu/data-and-maps/indicators/renewable-gross-final-energy-consumption-1/assessment (accessed June 1, 2013).
European Union. EU Transport in figures. Statistical pocketbook 2012. Brussels: EU, 2012. Eurostat. European Business. Facts and figures. 2009 edition. Brussels: Eurostat, 2009. —. European Business. Facts and figures. 2009 edition. Brussels: Eurostat, 2009. —. “Road and rail freight transport in the EU 27.” Eurostat news release 45/2011, 2011. —. “Panorama of transport.” Eurostat statistical book 2009 edition, 2009. —. International trade in motor cars. 2012.
http://epp.eurostat.ec.europa.eu/statistics_explained/index.php?title=File:EU_and_other_major_players_in_world-wide_trade_in_motors_cars,_2010.PNG&filetimestamp=20120910141444 (accessed April 3, 2013).
—. “Land transport and transport via pipelines services at http://epp.eurostat.ec.europa.eu/statistics_explained/index.php/Land_transport_and_transport_via_pipelines_services_statistics_-_NACE_Rev._2.” http://epp.eurostat.ec.europa.eu. 2012c. http://epp.eurostat.ec.europa.eu/statistics_explained/index.php/Land_transport_and_transport_via_pipelines_services_statistics_-_NACE_Rev._2 (accessed May 24, 2013).
—. “Manufacture of other transport equipment statistics - NACE Rev. 2.” Eurostat. 2012b. http//epp.eurostat.ec.europa.eu/statistics_explained/index.php/Manufacture_of_other_transport_equipment_statistics_-_NACE_Rev._2 (accessed April 29, 2013).
—. Road freight transport by journey characteristics. 2012. http://epp.eurostat.ec.europa.eu/statistics_expained/index.php/Road_freight_transport_by_journey_characteristics (accessed April 10, 2013).
Fasse, M., and M. C. Schneider. Handelsblattonline. MAN greift Daimler an. 2012. http://www.handelsblatt.com/unternehmen/logistik-spezial2012/lkw-hersteller-man-greift-daimler-an-/6257576.html (accessed April 22, 2013).
Financial Times. Hawker Beechcraft: Industry expects jet division to be grounded. 29 October 2012. http://www.ft.com/cms/s/0/504ced88-1c38-11e2-a63b-00144feabdc0.html#axzz2IssdsyBx (accessed January 2013).
—. Markets data. 7 May 2013. http://markets.ft.com/research/Markets/Companies-Research (accessed May 7, 2013).
Fincantieri. Annual Reports 2008-2011. annual report, Trieste: Fincantieri, 2012. Flightglobal. Aerospace top 100 special report. September 2012a.
http://pwc.blogs.com/files/aerospace-top-100-special-report-20121-1.pdf (accessed December 2012).
Flightglobal. Aerospace top 100 special report. http://pwc.blogs.com/files/aerospace-top-100-special-report-20121-1.pdf, Flight International, 2012a.
—. AIRSHOW China: Comac eyes half of China's narrowbody market. 14 November 2012b. http://www.flightglobal.com/news/articles/airshow-china-comac-eyes-half-of-chinas-narrowbody-market-378972/ (accessed January 2013).
—. Business aircraft census 2011. 5 October 2011.
RACE2050© – FP7 314753
D 6.1 Report on the synopsis on the current framework conditions – FINAL – 06/11/2013 Page 140 of 147
http://www.flightglobal.com/news/articles/business-aircraft-census-2011-362709/ (accessed January 2013).
—. Embraer considers turboprop market too small for three manufacturers. 12 April 2012c. http://www.flightglobal.com/news/articles/embraer-considers-turboprop-market-too-small-for-three-manufacturers-370595/ (accessed January 2013).
—. Enders sees China as main challenger to Airbus-Boeing duopoly. 3 December 2012d. http://www.flightglobal.com/news/articles/enders-sees-china-as-main-challenger-to-airbus-boeing-duopoly-379679/ (accessed January 2013).
—. IN FOCUS: Boom and bust, the regional jey phenomenon. 10 April 2012e. http://www.flightglobal.com/news/articles/in-focus-boom-and-bust-the-regional-jet-phenomenon-370541/ (accessed January 2013).
—. “Russian Revolution: The Sukhoi Superjet.” Flightglobal Web site. 6 February 2007. http://www.flightglobal.com/news/articles/russian-revolution-the-sukhoi-superjet-211873/ (accessed January 2013).
Flying mag. Heli-Expo Helps Define Rotorcraft Industry Outlook. 25 February 2010. http://www.flyingmag.com/pilot-reports/helicopters/heli-expo-helps-define-rotorcraft-industry-outlook#VokD3zhId4oBAprW.99 (accessed January 2013).
Focus. Wauchstum ausserhalb europas - BMW verkauft so viele Autos wie noch nie. 2012. http://www.focus.de/finanzen/news/unternehmen/absatz-in-europa-stagniert-bmw-brilliert-mit-export-rekord-dank-usa-und-china_aid_888070.html (accessed May 4, 2013).
Formosa, N. “Up-and-comers rise in relevance to global market.” Bicycle retailer Vol. 21, Nr. 11, 1 July 2012: 11.
Frost & Sullivan. Slideshare.net, Automotive industry outlook. 2013. http://de.slideshare.net/FronstandSullivan/2013-automotive-industry-outlook-frost-sullivan (accessed April 22, 2013).
GAMA. General Aviation: Statistical Databook & Industry Outlook. Washington, DC: Gama, 2012. Gellman, Aaron, Hans Weber, George Hamlin, and Richard Aboulafia. A Shadow Critical Project
Appraisal: The A380 Program. Evanston: McCormick School of Engineering, 2004. Heriter et alii. Differential Europe. The European Union impact on national policymaking. Lanham:
Rowman & Littlefield, 2001. Hickman, Robin, and David Banister . “Transport and reduced energy consumption.” Working paper
No 1026, 2007: 27. Hill, Nikolas, Charlotte Brannigan, Richard Smokers, Arno Schroten, Huib van Essen, and Ian Skinner.
EU Transport GHG - Routes to 2025 II. Final report, Brussels: EC, 2012. Hydropole. Hydrogen Report Switzerland 08/09. Swiss Hydrogen Association, 2009. IATA. Vision 2050. Montreal - Geneve: IATA, 2011. IATA. Vision 2050. Singapore: IATA, 2011. IBP. European Union Shipbuilding IndustryInvestment and Business Guide Vol. 3. Washington DC:
International Business Publications, 2011. IEA. CO2 Emission from fuel combustion - Highlights. Highlights Report, Paris: IEA/OECD, 2012. IEA. CO2 Emissions form fuel combustion - Highlights. International Energy Agency Statistics.
Highlights Report, Paris: IEA/OECD, 2011. —. Internationaltransportforum.org. 2008.
http://www.internationaltransportforum.org/statistics/CO2/index.html (accessed March 25, 2013).
IEEP Institute for European Enviromental Policy. Mobility Services - Setting the policy framework. First year Project report, London: IEEP, 2004.
IHC Merwede. www.ihcmerwede.com. 2013. http://www.ihcmerwede.com/about-ihc-merwede/annual-report/ (accessed April 2013).
IMO. Energy efficiency and the reduction of GHG emissions from ships. e. http://www.imo.org/MediaCentre/HotTopics/GHG/Pages/default.aspx (accessed April 2013).
IMO Maritime Knowledge Centre. International Shipping Facts and Figures. London: Maritime
RACE2050© – FP7 314753
D 6.1 Report on the synopsis on the current framework conditions – FINAL – 06/11/2013 Page 141 of 147
Knowledge Center, 2011. IMO. Passenger ship safety. a.
http://www.imo.org/MediaCentre/HotTopics/passengership/Pages/default.aspx (accessed April 2013).
—. Piracy and armed robbery against ships. b. http://www.imo.org/MediaCentre/HotTopics/piracy/Pages/default.aspx (accessed April 2013).
—. Recycling of ships. c. http://www.imo.org/OurWork/Environment/shiprecycling/pages/Default.aspx (accessed April 2013).
—. Shipping in polar waters. 2012. http://www.imo.org/MediaCentre/HotTopics/polar/Pages/default.aspx (accessed April 2013).
—. Sustainable maritime development. d. http://www.imo.org/MediaCentre/HotTopics/SMD/Pages/default.aspx (accessed April 2013).
Index Mundi. Crude Oil (petroleum), Price index Monthly Price - Index Number. 2010. http://www.indexmundi.com/commodities/?commodity=petroleum-price-index&months=180 (accessed January 2013).
Institute, Earth Policy. “Bicycle Production by Top Countries.” 2008. http://www.earth-policy.org/datacenter/xls/indicator11_2008_3.xls (accessed April 22, 2013).
International Transport Forum. internationaltransportforum.org. 2013. http://www.internationaltransportforum.org/statistics/CO2/index.html (accessed February 23, 2013).
Investopedia. www.investopedia.com. 2013. http://www.investopedia.com/terms/c/cash-for-clunkers.asp (accessed April 22, 2013).
IRU International Road Transportation Union. EU Public - Private Smart Move High Level Group. Final Recommendations - Follow up to the European Commission Transport White Paper and contribution to the EU 2020 Growth Agenda. Geneva: IRU, 2012.
ISI. www.ghg-transpord.eu. 2013. http://www.ghg-transpord.eu/ghg-transpord/index.php (accessed May 03, 2013).
ITS and CER. “European transport policy. Progress and prospects.” www.its.leeds.ac.uk. 2009. http://www.its.leeds.ac.uk/research/projects/details/?id=764 (accessed May 25, 2013).
—. European transport policy. Progress and prospects. Brussels: CER, 2009. Jeon, C.M., A. A. Amekudzi, and J. Vanegas . “transportation System Sustainability Issues in High-,
Middle-, and Low-Income Economies: Case Studies from Georgia "U.S...., Sourth Korea, Colombia, and Ghana.” Journal of urban planning and development, September 2006.
Jolley, D. Automotive news Europe. Renault awaiting China OK on production. 2013. http://europe.autonews.com/apps/pbcs.dll/article?AID=/20130328/ANE/130329866#axzz2St4iVtXa (accessed April 22, 2013).
KPMG. “Infrastructure 2050.” INSIGHT, November 2010. KPMG. KPMG's global automotive executive survey 2013. Survey report, Amstelveen: KPMG, 2013. Kurier, Asien. Baltic Dry Index. April 2013. http://en.wikipedia.org/wiki/File:Baltic_Dry_Index.png
(accessed April 2013). Landeshauptstadt München. Verkehrsentwicklungsplan. Flyer, München: Landeshauptstadt München,
Referat fürStadtplanung und Bauordnung, 2006. Leadership 2020. New opportunities for the future. Brussels: European Comission, 2013. Legett , Jane A., Bart Elias, and Daniel T. Schedd. Aviation and the European Union’s Emission Trading
Scheme. CRS report, Washington D.C.: Congresional Research Service, 2012. Littlejohn, T., and S. Merill. Fiat and Chrysler Merger - an analysis of the alliance of Fiat and Chrysler.
n.a: n.a, 2011. Lloyd’s Register. Global maritime trends 2030. Glasgow: Lloyd’s Register Group Limited, QinetiQ,
University of Strathclyde and Marine Strategies International Limited, 2013. Ludwig, Thorsten, and Jochen Tholen. Shipbuilding in Europe. Bremen: Institute Labour and Economy
RACE2050© – FP7 314753
D 6.1 Report on the synopsis on the current framework conditions – FINAL – 06/11/2013 Page 142 of 147
- University of Bremen, 2006. Marine Insight. Top 10 Shipbuilding Companies in the World in 2012. 14 August 2012.
http://www.marineinsight.com/marine/marine-news/headline/top-10-shipbuilding-companies-in-the-world-in-2012/ (accessed April 2013).
Market Watch. Marketwatch.com. 28 November 2012. http://www.marketwatch.com/story/sorl-receives-excellent-supplier-award-by-yutong-2012-11-28 (accessed March 25, 2013).
Mickeviciene, Rima. Global Competition in Shipbuilding: Trends and Challenges for Europe. Klaipeda: InTech, 2011.
Ministère de l'Ecologie, du Développement durable et de l'Energie. Bonus-Malus 2013. 2013. http://www.developpement-durable.gouv.fr/Bonus-Malus-2013 (Zugriff am 28. August 2013).
Mitsubishi Heavy Industries. About MHI: Corporate Overview. 2012. http://www.mhi.co.jp/en/company/outline/contents/index.html (accessed January 2013).
Mobility. Mobility. 2013. www.mobility.ch (Zugriff am 28. August 2013). NADA. NADA Automotive Market Report - 2012 Market Analysis and 2013 Used Price Forecast.
Market report, McLean: NADA, 2012. National Bureau of Statistics of China. China Statistical Yearbook. Beijing: China Statistics Press, 2012. NEAA et alii. “Getting into the Right Lane for 2050.” www.rivm.nl. 2009.
http://www.rivm.nl/bibliotheek/rapporten/500150001.pdf (accessed 2013). OECD. “Strategic Transport Infrastructure Needs to 2030.” http://dx.doi.org. 2012a.
http://dx.doi.org/10.1787/9789264114425-en (accessed May 24, 2013). OECD/ECMT. Cutting transport CO2 emission. What progress? Summary Document, Paris: OECD,
2007. OICA International Organization of Motor Vehicle Manufacturers. OICA. 2012.
http://oica.net/category/production-statistics/ (accessed March 20, 2013). Olathe Toyota Parts Centerand Spork Marketing. www.visual.ly. 2012. http://visual.ly/2012-global-
car-sales-statistics (accessed April 23, 2013). Oliver, J., G. Janssens-Maenhout, and J.A.H.W. Peters. Trends in global CO2 emissions - 2012 Report.
PBL and JRC background study, The Hague/Bilthoven: PBL, 2012. OPTIMISM Project. “MCA Sustainability.” Deliverable 5.3 Optimim Project. Winterthur: ZHAW, June
2013. own compilation. “own compilation.” Winterthur, 2013. Pander, Jürgen. Spiegel.de, Sicherheitstechnik - Die vielen augen der neuen S-Klasse. 2013.
http://www.spiegel.de/auto/aktuell/die-neue-s-klasse-was-mercedes-audi-und-bmw-voraus-hat-a-900233.html (accessed April 16, 2013).
Perry, Dominic. Eurocopter begins 2012 with positive outlook. 15 February 2012. http://www.flightglobal.com/news/articles/eurocopter-begins-2012-with-positive-outlook-368141/ (accessed March 2013).
PIBIG. “Railway Revenue Earnings.” Press Information Bureau of India Government. 08 February 2013. http://pib.nic.in/newsite/erelease.aspx?relid=92104 press information bureau of India government (accessed April 29, 2013).
Plunkett Research. Automobile Industry Introduction. 2013. http://www.plunkettresearch.com/automobiles-trucks-market-research/industry-and-business-data (accessed May 15, 2013).
Polek, Gregory, and Curt Epstein. Embraer's Commercial Backlog Continues to Shrink. 20 April 2012. http://www.ainonline.com/aviation-news/2012-04-20/embraers-commercial-backlog-continues-shrink (accessed March 2013).
Preston, John. “Trends in European Railways over the Last Two Decades.” Built Environment, 1 35 2009: 11-23.
RFE. Minutes of Rail Forum Europe’s 4th Event. European rail industry, latest trends in international rail markets and the way forward. 11 January 2012. 2012a. http, //www.rail-forum.eu/wp-content/uploads/2012/01/120111_Minutes_RFE.pdf. (accessed May 25, 2013).
RACE2050© – FP7 314753
D 6.1 Report on the synopsis on the current framework conditions – FINAL – 06/11/2013 Page 143 of 147
—. Minutes of Rail Forum Europe’s 4th Event. European rail industry, latest trends in international rail markets and the way forward. 11 January 2012. 2012a. http, //www.rail-forum.eu/wp-content/uploads/2012/01/120111_Minutes_RFE.pdf. (accessed May 25, 2013).
—. “The international rail market - challenges and opportunities for the European rail industry.” RFE. 25 January 2012b. http://www.rail-forum.eu/wp-content/uploads/2012/01/Citroen.pdf (accessed April 23, 2013).
—. “The international rail market - challenges and opportunities for the European rail industry.” RFE. 2012b. http://www.rail-forum.eu/wp-content/uploads/2012/01/Citroen.pdf (accessed April 2013, 25).
Roland Berger & Lazard. Global Automotive Supplier Study - Quick rebound after the crisis - Significant challenges ahead. Munich: Roland Berger & Lazard, 2010.
Roland Berger. Automotive landscape 2025 - Opportunities and challenges ahead. Study, Munich: Roland Berger, 2011.
—. “www.researchfindr.ch.” impact-china-central-european-automotive-industry. April 2012. http://www.researchfindr.com/impact-china-central-european-automotive-industry (accessed March 4, 2013).
Rolls-Royce. Market Outlook 2012-2031. London: Rolls-Royce PLC, 2012. Roth, R., and C. Fine. “Lightweight Materials for Transport - Developing a Vehicle Technology
Roadmap for the Use of Lightweight Materials.” MIT Roundtable on the "The Future of Manufacturing Innovation - Advanced Technologies". Massachusetts: MSL, 2010. 18.
Ruijgrok, C.J., and L.A. Tavasszy. “The development of international freight transport in Europe as a result of developments in international trade and logistics. Canada''s Asia-Pacific Gateway and Corridor Initiative 2007.” Canada’s Asia-Pacific Gateway and corridor Conference. Vancouver, 2007. 34.
Russian Railways. Performance Highlights. n.a. http://eng.rzd.ru/statice/public/rzdeng?STRUCTURE_ID=297 (accessed April 29, 2013).
Saidpour, H. “Lightweight High Performance Materials for Car Body Structures.” NTI Technology Conference paper. London: University of London, 2004. 14-19.
Schade, Wolfgang. Treibhausgasemissionen senken im Verkehrssektor. 2013. http://www.isi.fraunhofer.de/isi-de/service/presseinfos/2013/pri1307_Treibhausgasemissionen_senken_Verkehrssektor.php (accessed June 25, 2013).
Schmitt, A., and J. van Biesebroeck. “Proximity strategies in outsourcing relations: the role of geographical, cultural and relational proximity in the European automotive industry.” KU Leuven Discussion Papers series DPS 13.02. Leuven: KU Leuven, 2013.
Schot, Johan. “The Mystery of the Failed European Common Trasnport Policy Explained.” Trasnfers, 1 2 2012: 144-149.
SCI. Worldwide Rolling Stock Manufacturers and Production Sites. Data and Facts on 170 Companies and Sites. Hamburg: SCI, 2012.
SEA Europe. SEA Europe Annual Report 2011-2012. Brussels: Sea Europe, 2013a. SEA Europe. Shipbuilding Market Monitoring. Brussels: Sea Europe, 2013b. Spiegel. “www.spiegel.de.” www.spiegel.de. 2 January 2013.
http://www.spiegel.de/wirtschaft/unternehmen/china-produziert-2013-mehr-autos-als-europa-a-875368.html (accessed May 15, 2013).
Statista. The leading automotive suppliers based on worldwide revenue in 2012. 2013. http://www.statista.com/statistics/164216/leading-automotive-suppliers-based-on-worldwide-revenue/ (accessed April 12, 2013).
—. Umsatz der deutschen Automobilindustrie in den Jahren 2005 bis 2012. 2013b. http://de.statista.com/statistik/daten/studie/160479/umfrage/umsatz-der-deutschen-automobilindustrie/ (accessed April 4, 2013).
Stena Line. Ferries to Ireland, Britain and Holland. n.d. http://www.stenaline.co.uk/ferry/ (accessed June 2013).
RACE2050© – FP7 314753
D 6.1 Report on the synopsis on the current framework conditions – FINAL – 06/11/2013 Page 144 of 147
Stopford, Martin. “World Shipbulding 2012.” SMM 2012. Hamburg: SMM, 2012. STX Europe. www.stxeurope.com. 2013. http://www.stxeurope.com/news/Pages/Annual-
Reports.aspx (accessed May 20, 2013). Tang, R. China's Auto Sector Development and Policies - Issues and Implications. Washington D.C: CRS,
2012. Taylor, K. Europe's cities ar best placed to lead the way in the design of sustainable low-carbon
transport. 2012. http://www.europesworld.org/NewEnglish/Home_old/Article/tabid/191/ArticleType/ArticleView/ArticleID/22125/language/en-US/Default.aspx (accessed April 6, 2013).
The Economic Times. Economics 101: GDP growth, per capita income rise and how it affects us. 2012. http://blogs.economictimes.indiatimes.com/moneyhappyreturns/entry/economics-101-gdp-growth-per-capita-income-rise-and-the-effect-on-us (accessed April 12, 2013).
—. Irkut expects to sell up to 200 planes in India by 2025. March 2012. http://articles.economictimes.indiatimes.com/2012-03-15/news/31196920_1_passenger-aircraft-airliners-planes (accessed January 2013).
The Economist. “The Economist online.” Markets and makers - Running harder. 2013. http://www.economist.com/news/special-report/21576217-carmaking-can-still-be-highly-profitable-manufacturers-have-work-it-running (accessed May 4, 2013).
—. The future of cars - gloom and boom. 2013b. http://www.economist.com/news/special-report/21576213-motor-industrys-fortunes-are-increasingly-divided-says-peter-collins (accessed April 22, 2013).
The Financial Times. markets.ft.com. 2013. http://markets.ft.com/research/Markets/Tearsheets/Financials?s=A009540S:KSC (accessed April 2013).
—. markets.ft.com. 2013b. http://markets.ft.com/research/Markets/Tearsheets/Financials?s=A010140:KSC (accessed April 2013).
—. markets.ft.com. 2013c. http://markets.ft.com/research/Markets/Tearsheets/Financials?s=601989:SHH (accessed April 2013).
—. markets.ft.com. 2013d. http://markets.ft.com/research/Markets/Tearsheets/Financials?s=600150:SHH&subview=Overview (accessed April 2013).
The Globe and Mail. “Bombardier cuts jobs as orders drop.” The Globe and Mail Web site. 23 August 2012. http://m.theglobeandmail.com/globe-investor/bombardier-cuts-jobs-as-orders-drop/article1347668/?service=mobile (accessed January 2013).
Thompson, Louis. A vision for railways in 2050. Paris: International Transport Forum, 2010. —. A vision for railways in 2050. Paris: International Transport Forum, 2010. TI - Technofunctional Institute. History of automotive industry. 2012.
http://www.technofunc.com/index.php/domain-knowledge/automotive-industry/item/history-of-automotive-industry (accessed April 22, 2013).
U.S. Bureau of Labour Statistics. www.bls.gov. 2012. http://www.bls.gov/data/ (accessed April 2012). UIC and CER. Moving towards Sustainable Mobility, European Rail Sector Strategy 2030 and beyond.
Version October 2010. Paris: UIC, 2010. —. Moving towards Sustainable Mobility, European Rail Sector Strategy 2030 and beyond. Version
October 2010. Paris: UIC, 2010. UN Comtrade. UN Comtrade Data. n.d. http://comtrade.un.org/db/ (accessed April 2013). —. Yearbook 2011 - Commodity pages. 2011.
http://comtrade.un.org/pb/CommodityPagesNew.aspx?y=2011 (accessed 5 20, 2013). UNCTAD. Review of maritime Transport. Geneva: United Nations Publication, 2008. UNEP. The emission gap report 2012. UNEP synthesis report, Nairobi: UNEP, 2012. UNIFE. “Annual Report 2011.” www.unife.org. 2011.
RACE2050© – FP7 314753
D 6.1 Report on the synopsis on the current framework conditions – FINAL – 06/11/2013 Page 145 of 147
http://www.unife.org/publication_detail.asp?pid=35 (accessed May 24, 2013). —. “The prospects of employment in the European rail industry.” UNIFE. 2012c. http,
//www.eesc.europa.eu/resources/docs/clausecker.pdf (accessed April 2013, 25). —. World Rail Market Study forecast 2012 to 2017. Brussels: UNIFE, 2012. —. World Rail Market Study forecast 2012 to 2017. Brussels: UNIFE, 2012a. —. World Rail Market Study forecast 2012 to 2017. Brussels: UNIFE, 2012. —. World Rail Market Study. Status quo and outlook 2020. Brussels: UNIFE, 2010. United Aircraft Corporation. About UAC. a. http://www.uacrussia.ru/en/corporation/ (accessed
January 2013). VDA Verband Deutscher Automobilhersteller. Annual Report 2012. annual report, Berlin: VDA, 2012. Verkehrs-Club Schweiz. «Sondernummer VCS Magazin / Auto-Umweltliste.» VCS Für Mensch und
Umwelt. März 2011. http://www.verkehrsclub.ch/index.php?eID=tx_nawsecuredl&u=0&file=/uploads/tx_frpredakdata/AUL_2011_02.pdf&t=1312538033&hash=f60aebefdb3c274a561057362f524841 (Zugriff am 15. März 2011).
Weider, Marc. China - Automobilmarkt der Zukunft? Wie nachhaltig und zukunftsorientiert sind die Strategien der internationalen Automobilindustrie in China? Discussion Paper, Berlin: Wissenschaftszentrum Berlin für Sozialforschung WZB, 2004.
Westwood, John, and Steven Kopits. Global offshore prospects. Norwich: Douglas - Westwood, 2013. Wissmann, M. “The German automotive industry - opportunities and challenges in European and
global competition.” 24th Automobil Forum. Ludwigsburg: VDA, 2013. Worldbank. Statista.Worldbank.org. 2013. http://data.worldbank.org/indicator/EN.ATM.CO2E.PC
(accessed March 12, 2013). Worldwatch. “Global Competitiveness in the Rail and Transit Industry.” www.worldwatch.org. 2010.
http://www.worldwatch.org/bookstore/publication/global-competitiveness-rail-and-transit-industry (accessed May 25, 2013).
Wright, Robert. “Made in Europe.” Rail professional website. 2010. http//www.railpro.co.uk/magazine/?idArticles=490 (accessed April 23, 2013).
Wu, Zhaohui, Thomas Y Choi, and Johnny M. Rungtusanatham. “Supplier–supplier relationships in buyer–supplier–supplier triads: Implications for supplier performance.” Journal of Operations Management, March 2010: 115-120.
Wymann, O. Die neue Arbeitsteilung in der Automobilindustrie. Munich: Mercer & Frauenhofer-Institut, 2003.
RACE2050© – FP7 314753
D 6.1 Report on the synopsis on the current framework conditions – FINAL – 06/11/2013 Page 146 of 147
11. Annex
11.1 RACE2050 basics
Project acronym RACE2050
Project title Responsible innovation Agenda for Competitive European transport industries up to 2050
Call identifier FP7-TPT-2012-RTD-1 [Prospects for transport evolution: challenges for the competitiveness of the European transport sector in the long term]
Grant Agreement no. 314753
Starting date 01/09/2012
End date 28/02/2015
Funding Scheme Coordination and support action
RACE2050 consortium partners are:
Partner acronym Partner name Logo
TUB TU Berlin, ZentrumTechnik und Gesellschaft,
Berlin, Germany
RCAB Ritchey Consulting AB, Stockholm, Sweden
ZHAW ZurcherHochschulefürAngewandteWissenschaften,
Zurich, Switzerland
ICTAF Interdisciplinary Centre for Technological Analysis
and Forecasting, Tel Aviv, Israel
TOI TransportokonomistInstitutt, Oslo, Norway
VTM VTM ConsultoresemEngenharia e
PlaneamentoLda, Lisbon, Portugal
RACE2050© – FP7 314753
D 6.1 Report on the synopsis on the current framework conditions – FINAL – 06/11/2013 Page 147 of 147
11.2 Deliverable basics
Deliverable no. D6.1
Document name RACE2050D6.1FINAL
Deliverable name Report on the synopsis on the current framework conditions
Work Package WP6
Nature Report
Dissemination Public
Editor Dr. Merja Hoppe
Contributors Massimo Moraglio, Andreas Christ, Merja Hoppe, Nuno Soares Ribeiro, Miguel Silva
Due date of submission June 30th, 2013