D.4.5. CARE_BOOK Empowering Climate Resilience.pdf
263
-
Upload
khangminh22 -
Category
Documents
-
view
1 -
download
0
Transcript of D.4.5. CARE_BOOK Empowering Climate Resilience.pdf


1

2
Introduction. CARE Project ............................................................................................... 3
Towards a Latin American resilience framework. .............................................................. 14
Section I. Climate change and resilience national institutional frameworks ...................... 23
Chapter 1.Advances and regressions in the risk management policy in Brazil .................. 26
Chapter 2.Climate change in Colombia .............................................................................. 34
Chapter 3. The resilience framework in Chile .................................................................... 44
Chapter 4. Institutional Framework of Climate Change in Ecuador................................... 56
Chapter 5. Framework for climate adaption and resilience in Italy ................................... 65
Chapter 6. Climate Change Adaptation and Disaster Risk Reduction Strategies in
Spain. ............................................................................................................... 71
Chapter 7. Resilience Frameworks Netherlands ................................................................ 84
Chapter 8.Resilience Frameworks in National Policies and Territorial Planning in
Uruguay. .......................................................................................................... 95
SECTION II. Climate resilience experiences and practices .................................................. 103
Chapter 9. What resilience to aim for in Brazil? Readings on São Paulo’s and
Belém’s local practices. ................................................................................. 105
Chapter 10. Planning for Climate Change Adaptation in Italy. Two Innovative Case
Studies ........................................................................................................... 122
Chapter 11. Resilience and Urban Local Planning in Uruguay. Montevideo case
study. ............................................................................................................. 137
Chapter 12: Variability and climate change urban resilience index.Case study
Medellín ........................................................................................................ 151
Chapter 13. Use of Geographic Information System (GIS) tools in the climate
change evaluation in rural sector of Tolima ................................................. 164
Chapter 14 .Planning for Resilience in the IJssel River Valley and Delta ...................... 183
Chapter 15. Wetlands at risk. Climate change and environmental imbalance in
the Metropolitan Area of Concepción .......................................................... 205
Chapter 16. "Water and population" and "food sovereignty is also resilient
farming". Two resilience cases frim Ecuador. ............................................... 221
Chapter 17. Drought Management Plans in urban supply systems in Spain. A
resilience tool for drought management ...................................................... 236
Conclusions ...................................................................................................................... 255

3
Introduction. CARE Project Flavio Camerata1, Mara Cossu2, Pilar Paneque1, Diana Reckien3, Diana Reckien3 and
Jesús Vargas1
1Pablo de Olavide University of Seville (Spain)
2Poliedra-Politecnico di Milano (Italy)
3University of Twente(The Netherlands)
CARE project has been funded by the ERASMUS+ Programme of the European
Commission. Following the funding programme aims and nature, it promotes the
empowerment of Latin American Universities staff’s and students’ interdisciplinary skills
through the development of innovative educational approaches to planning.
Resilience thinking calls for the interaction among different disciplines (spatial planning,
environment, engineering, landscape) and for the collaboration with research, policy making
and professionals, in order to properly address the call for the integration of climate
resilience within policies at different levels.
For this reason, CARE chose to address professionals and administrations by providing
flexible and open e-training modules. In doing so, it aims to deliver a contribution to those
who daily engage themselves in urban decision making and planning, providing robust
conceptual basis on resilience and sharing case studies and experiences.
Going further from the initial objectives, the CARE consortium established a fruitful and
balanced exchange among Latin American and Europe Partners, in terms of climate change
urban impacts detection, resilience frameworks and planning experiences and practices.
Challengin climate change by collaboration and networking
By focussing on urban resilience, CARE addresses one of the most urgent topics at
European as well at Latin American level. Most LA countries are dealing with climate risk
management issues, but they currently lack - despite recent efforts - a holistic and wider
approach to resilience. A common frame of action based on proper shared knowledge and
inclusion of all resilience issues – from the risk management to the social resilience - is

4
missing. International cooperation seemed then the best-fit environment where to develop
joint learning tools, go in depth on peculiar research topics and deliver support to policy
makers.
CARE main objective is to develop innovative educational experiences to enhance the
knowledge of urban resilience potential to fight against climate change effects. Thus, the
project challenges the wide issues tackled by resilience to climate change at urban level by
promoting HEI staff’s and students’ interdisciplinary skills through the development of
innovative educational approaches to planning. Furthermore, it aims to bring the challenge
within the core of urban municipalities by directly and indirectly (through empowering HEIs
curricula) training professionals and officers to shape resilient policies. It will be based on
the interaction among different disciplines (spatial planning, environment, engineering,
landscape, etc.) and foster collaboration with research, policy making and professionals, in
order to properly address the call for the integration of climate resilience within policies at
different levels.
Four further aims have been identified within the project, highlighting the role of conceptual
mapping, digital sharing of learning tools and networking embody in the urban resilience
challenge:
1. To help the modernisation of higher education curricula and enlarging the ongoing
training potential for public officers and professionals, by providing Open Educational
Resources on climate and urban resilience integrated issues (by integrating them
with issues such as climate risk management, social resilience, strategic planning,
monitoring and assessment of plans and policies)
2. To enhance the transferring of resilience conceptual issues into operational
capabilities in local government, civil society and professional communities.
3. To establish a network among LA, Europe and outside, with the aim of improving
their educational capacities in the field of urban and climate resilience, as well as the
transferring of project findings to an operational policy perspective at different
territorial levels.
The CARE consortium has been built accordingly, involving different categories of partners
who can provide significant contributions following their own perspective and specific
expertise.
The partnership engaged partners form different areas in the EU zone and in Latin America
in order to get a wide range of climate subtypes including Mediterranean, continental and
temperate (EU), humid tropical and subtropical (State of Parà, BR, Chile), tropical (State of
Sao Paulo, Brazil), semi arid (Chile) climates. In relation to urban environments, the
partnership aimed at covering a large variety of context and situations possibly affecting the
climate resilience issue, including middle cities, large metropolis (Sao Paulo) and
metropolitan regions.
Universities are the main target of the educational tools produced by the project and the
main actors in their development. The 13 selected partner universities provided qualified
expertise in a wide number of domains (urban and regional planning, environmental
5
assessment and management, sustainable development, urban policies, land
administration, geo-information tools and techniques, and others). They have been selected
due to the existence of specific department and courses focusing on climate change and
resilient adaptation strategies for urban environments, and have been extremely interested
end engaged in developing and sharing their own research and training methods and
findings. Most of them are also engaged in institutional networks working on resilience
strategies at different territorial levels.
1. CARE mthods and outcomes
CARE methodology foresaw an alternation of desk activities and workshops aimed at the
collective production, testing and practical application of open educational materials, namely
the CARE Cmaps and the Open Training Modules (OTM). This combination of activities is
needed to properly address a demanding issue such as the urban resilience and to
operativise it in order to successfully drive and focus policies at different territorial level.
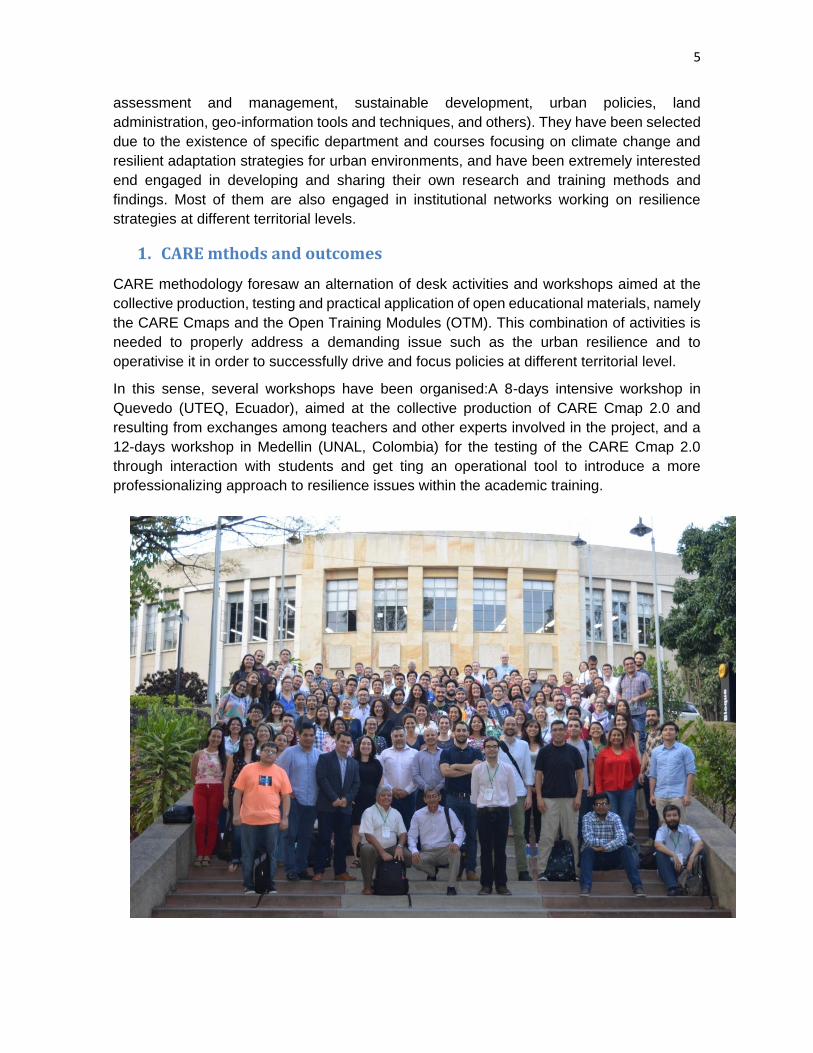
In this sense, several workshops have been organised:A 8-days intensive workshop in
Quevedo (UTEQ, Ecuador), aimed at the collective production of CARE Cmap 2.0 and
resulting from exchanges among teachers and other experts involved in the project, and a
12-days workshop in Medellin (UNAL, Colombia) for the testing of the CARE Cmap 2.0
through interaction with students and get ting an operational tool to introduce a more
professionalizing approach to resilience issues within the academic training.

6
Open training modules (OTM) for specific targets groups (municipalities staff; experts; post
graduate
2. Planning for climate resilience: the use of concept mapping in
interdisciplinary learning activities
Planning for climateresilience requires boundary-crossing skills, which can be described as “the ability to change perspectives, to synthesize knowledge of different disciplines, and to cope with complexity” (Spelt et al. 2009). Such ability must be trained for higher education students who are likely to be future researchers, professionals and decision makers in this field.However, boundary-crossing skills are seldom fostered by traditional, domain-specific higher education, where ordinary classroom activities and academic curricula are normally unfit for such purposes (Banchetti et al. 2012).
Therefore, studentsshould be trained, whenever possible, through additional, dedicated activities, where specific support and learning tasks help them in developing interdisciplinary thinking (Spelt et al. 2009).Concept mapping as a learning tool has been positively connected to interdisciplinary learning by various authors (Banchetti et al. 2012; Borrego et al. 2009; Mikser et al. 2008; Sibilla 2017).Starting from these premises, the CARE project brought together two elements intended to promote and achieve interdisciplinarity in teaching and learning, namely: the involvement of teachers and students in intensive, interdisciplinary workshops; and the use of concept mapping as a tool for fostering interdisciplinarity.
A concept map is a graphical tool showing concepts and their relationships, and representing a person’s cognitive structure about a given topic. It is often used as a means to convey meaningful learning, a process in which the learner constructs new knowledge by making active connections to what he/she already knows.Concept mapping is not new in teaching and learning; however, it is not widely known and practiced, and needs to be introduced to – and accepted by –both teachers and students before it can be used at its best. For the CARE project, teachers from the participating Latin American universitieswere trained in concept mapping during a preliminary workshop, held in Ecuador in 2017; they were in turn able to tutor the studentsfrom the same universities in the following workshop, held in Medellín in 2018. For both workshops,building interdisciplinarity and getting to master the use of concept mapping were intended as two parallel, strictly related tasks.
The latter workshop, held in Medellín, was organised as an intensive, 8-day event, and hosted100 students of different academic backgrounds and levels from universities of Brasil, Chile, Colombia, Ecuador, and Uruguay. A main assumption for this workshop was the necessity to bring togetherstudents from different academic fields – as diverse as architecture, spatial planning, environmental engineering and management, geography, and agronomy –and make them collaborate in a path towards understanding the essentials of planning for climate adaptation, based on the use of concept mapping and interdisciplinary group work.
The workshop was organised as a series of concept mapping exercises with a growing degree of complexity, which helped students to break the barriers of their disciplines and learn to collaborate for the sake of climate adaptation. Students were assigned to four, parallel groups of around 25 persons of different academic fields, each tutored by three/four

7
teachers. A coordinator provided tutors with a guide to the general method and the single exercises, intended to even out the process in each group; tutors could apply modifications to the programme, yet preserving the general approach and the most important rules concerning the process of concept mapping. The coordinator acted as supervisor to all groups, making sure that the exercises remained on track despite the modifications applied by tutors. The last, and most important, exercise required students to conceive an adaptation plan applied to a given geographic, economic and social context, and describe it through a concept map.
For this final exercise, students were informed that they would have to present their work in a plenary session on the following day, where a jury would choose the best three. This was intended to ensure additional dedication and commitment, since many learnersdo not immediately grasp the usefulness of concept mapping as a learning tool but rather see it as a useless, additional effort (Daley and Torre 2010). A jury composed of members from the same workshop’s teaching staff evaluated the works upon a simple evaluation guide proposed by the supervisor, consisting in a series of qualitative statements to be checked by the jury members during the single presentations, and discussed at the end of the session in order to choose the best three works. Given the constrained time available, we decided to avoid applying complex, time-consuming analytical evaluation methods such as those proposed and tested by many authors (such as Moni and Moni 2008, Prats 2014, Rice et al. 1998, Sibilla 2017, West et al. 2000, Cañas et al. 2013).The outcomes of the final exercise were quite surprising in terms of appropriateness of contents, mastery of the tool, and enthusiasm by the students, despite the initial difficulty shown by manyof them in approaching both concept mapping and interdisciplinarity.
Indeed, although simple, concept mapping can be difficult to apply, depending on each student’s reasoning and learning inclinations. However, only the basic rules were explained to students on the first day – mainly concerning syntactic correctness and the importance of “cross links” connecting different parts of the maps.This was intended to ensure that the maps remained as authentic as possible, suitable to reveal the students’ reasoning and learning abilities, in compliance with the theoretical premises of concept mapping (Novak and Cañas 2008). On the other hand, little importance was given to the necessity to include a strict reading direction or hierarchy in the maps, as expressed by some authors such as Cañas et al. (2015): planning is a “recursive” activity, and a map describing an adaptation plan is likely to be “circular” rather than “directional”. As a matter of fact, the best maps among the ones shown by students in the last day were those demonstrating that their authors understood such recursive characteristic of planning.
The above teaching method, applicable to any subject but particularly fit for practices,such as planning, whichincreasingly need an interdisciplinary, holistic and integrated approach, has been viable thanks to the possibility of bringing together many teachers and students in specially designed intensive workshops, beyond the ordinary academic curricula offered by universities.Concept mapping proved to be a flexible tool capable of supporting group work, interdisciplinary teaching and learning, and the practice of planning; and despite the initial perplexities, by the end of the workshop most teachers and students showed to appreciate its effectiveness.
Image 1 – The final concept map made by one of the students’ groups that received a
mention.

8
3.Working on resilience definitions
The term resilience is now widely used in various scientific fields and professions. In this
section we briefly examine the origins of the term, and how it has been used in the three
fields most relevant to the CARE+ project, namely engineering, ecology and what we might
term a socio-ecological systems perspective. We then briefly reflect on how these definitions
relate to processes that are connected to the notion of planning for climate change.
The origins of resilience can be found in the Latin term, resilire, a word with a variety of
possible meanings such as “to jump back, to retire, withdraw, to recoil, shrink, to bounce
back, rebound, to spring back, to return to a smaller size, in post-classical Latin also to go
back on, repudiate” (Oxford English Dictionary online). It therefore refers to a quality and
can be applied to multiple systems, objects or subjects. In engineering, resilience usually
refers to the properties of a material that enable it to return to its previous form without loss
of strength after having been exposed to some form of stress or pressure. As such it is an
important property to be considered by mechanical or civil engineers who endeavour to
design infrastructures or machines thatcan withstand certain pressures or forces and to

9
return to a prior steady-state without loss of basic performance characteristics. The time
taken to return to the previous state becomes a measure of resilience (Davoudi, 2012). The
ability to “bounce back” in a given period of time is therefore central to the engineering view
of resilience. However appealing the notion of “bouncing back” may be, it does not question
the desirability of theprevious statein the light of long-term considerations, such as those
associated with climate change. Is it wise to recreate a situation when experience has shown
us that it entails significant risk of future losses or damages?
By contrast, ecological resilience looks at (natural or socio-ecological) systems and
acknowledges that a system can change to a different state when subjected to external
forces. Systems are seen to have a set of states representing different states of equilibria.
If a system changes from one state to another, we can speak of a regime change. Holling
(1996, p.33) refers to ecological resilience as “the magnitude of the disturbance that can
be absorbed before the system changes its structure”. A system is therefore not ‘unresilient’,
but resilient to different degrees. Systems may therefore either “bounce back” to a previous
state or ”bounce forth” to a new state. In other words, they persist and adapt (Adger, 2003).
The concept of adaptation is central to many issues raised by climate change and the role
of spatial planning, in its various forms and guises, in realizing adaptations that seek to
enhance resilience, also to likely future conditions.
A third view of resilience is termed evolutionary resilience, which is grounded in notions of
complexity, uncertainty and the very unpredictability of systems. This view recognises that
systems may change of themselves, without the need for a specific external force or shock
to trigger change. Such emergent behaviour is typical of a complex systems’ perspective
that encompasses non-linear processes and principles of self-organization. Rather than
being about returning to a previous “normal” state, it concerns issues of how systems
change, adapt, and, transform in relation to internal and external stimuli (Carpenter et al,
2005). However, it also raises new challenges for planning for resilience, whether in relation
to climate change or more immediate crises often associated with hazardous events and
disasters. It challenges planning to move beyond a short-term focus on emergencies and
disaster response, to longer-term issues that may address structural constraints and
vulnerabilities in a community or area, and to seek out ways to generate significant
transformative changes that may emanate from such an approach.
UNISDR (2009) defines resilience as “The ability of a system, community or society exposed
to hazards to resist, absorb, accommodate, adapt to, transform and recover from the effects
of a hazard in a timely and efficient manner, including through the preservation and
restoration of its essential basic structures and functions through risk management.” Seen
in the light of climate change, this definition encompasses both mitigation and adaptation
measures, and implicitly incorporates issues of vulnerability, which are an essential element
of understanding how climate change is likely to affect a given community or system.
However, the definition is more aligned with the notions of engineering resilience and
ecological resilience, rather than the transformation implied by evolutionary resilience.

10
In contrast the IPCC (Agard et al., 2014) defines resilience as “The capacity of social,
economic, and environmental systems to cope with a hazardous event or trend or
disturbance, responding or reorganizing in ways that maintain their essential function,
identity, and structure, while also maintaining the capacity for adaptation, learning, and
transformation.” In that sense the IPCC definition aligns more with the evolutionary
understanding of resilience including incremental, small-scale changes of a system and
addressing longer time-scales.
Challenges therefore abound when thinking of long-term climate change and resilience. Our
knowledge of the climate system itself is wrought with uncertainties and scaling problems,
as global and regional climate scenarios need to be scaled down to the local level in order
to become inputs into local spatial planning practices. At the same time, planners must
realise that their plans will never be perfect instruments for the guidance of development.
Yet, despite the well known failures of master planning (Davidson, 1996; Healey, 1988) in
many parts of the world, planning systems are anything but geared up to be flexible, adaptive
and transformative. In part, this is due to the slow rate of change in legal frameworks for
spatial planning and environmental management. But, it perhaps also reflects a lack of
understanding on what a more transformative planning system might entail and how it could
be attained. Rather than focussing on blueprint-style master plans, it is increasingly clear
that scenario based spatial planning processes that are inclusive and collaborative may
provide a more useful basis for responding to future climatic and developmental challenges.
Furthermore, it must be recognised that planning and plans for climate change must be
aligned with other societal interests if they are to gain ground in practice.
4.CARE project definitions
In the framework of the definitions proposed in the previous paragraph, the CARE Project preliminary worked on sharing a set of definitions to describe climate-related issues. They have been crucial in order to deliver CARE further activities and outputs.
Climate
resilience
The ability of a social or ecological system to absorb disturbances
deriving from climate-related phenomena, while retaining the same
basic structure and ways of functioning, the capacity for self-
organisation, and the capacity to adapt to stress and change (adapted
from IPCC 2007).
Climate risk
reduction
Action taken to reduce the risk of disasters and the adverse impacts of
climate-related natural hazards, through systematic efforts to analyse
and manage the causes of disasters, including through avoidance of
hazards, reduced social and economic vulnerability to hazards, and
improved preparedness for adverse events (adapted from ISDR 2008
– United Nations).

11
Climate
adaptation
Initiatives and measures to reduce the vulnerability of natural and
human systems against actual or expected climate change effects
(IPCC 2007).
Climate
mitigation
Implementing policies to reduce greenhouse gas emissions and
enhance sinks (IPCC 2007).
Climate
exposure
The nature and degree to which a system is exposed to significant
climatic variations (IPCC 2007).
Climate
sensitivity
The degree to which a system is affected, either adversely or
beneficially, by climate variability or climate change (IPCC 2007).
Adaptive
capacity
The whole of capabilities, resources and institutions of a country or
region to implement effective adaptation measures (IPCC 2007).
Climate
impacts
Consequences of climate change on natural and human systems.
Depending on the consideration of adaptation, one can distinguish
between potential and residual impacts, respectively all impacts that
may occur given a projected change in climate without considering
adaptation, and those that would occur after adaptation (IPCC 2007).
Climate
vulnerability
The degree to which a system is susceptible to, or unable to cope with,
adverse effects of climate change, including climate variability and
extremes. Vulnerability is a function of the character, magnitude, and
rate of climate variation to which a system is exposed, its sensitivity,
and its adaptive capacity (IPCC 2007).
Please remember that the following relations among some of the above concepts are the most frequent in literature:
Equatioin 1𝐼𝑚𝑝𝑎𝑐𝑡 = 𝐸𝑥𝑝𝑜𝑠𝑢𝑟𝑒 ∗ 𝑆𝑒𝑛𝑠𝑖𝑡𝑖𝑣𝑖𝑦
Equatioin 2𝑉𝑢𝑙𝑛𝑒𝑟𝑎𝑏𝑖𝑙𝑖𝑡𝑦 = 𝐼𝑚𝑝𝑎𝑐𝑡 ∗ 𝐴𝑑𝑎𝑝𝑡𝑖𝑣𝑒 𝐶𝑎𝑝𝑎𝑐𝑖𝑡𝑦
The mentioned concepts relations could also be considered, as developed in the EU Commission FP7 funded project “ENSURE” 2008-2011.
Equatioin 3𝑉𝑢𝑙𝑛𝑒𝑟𝑎𝑏𝑖𝑙𝑖𝑡𝑦 = 𝑊𝑒𝑎𝑘𝑛𝑒𝑠𝑠𝑒𝑠 (𝑜𝑟 𝑆𝑒𝑛𝑠𝑖𝑡𝑖𝑣𝑖𝑡𝑦) ∗ 𝐼𝑚𝑝𝑎𝑐𝑡

12
Equatioin 4𝑅𝑒𝑠𝑖𝑙𝑖𝑒𝑛𝑐𝑒 = 𝐴𝑑𝑎𝑝𝑡𝑎𝑡𝑖𝑜𝑛 ∗ 𝐸𝑥𝑝𝑜𝑠𝑢𝑟𝑒 ∗ 𝑉𝑢𝑙𝑛𝑒𝑟𝑎𝑏𝑖𝑙𝑖𝑡𝑦
Imagen 1 – CARE Cmap 1.0 on resilience definitions
References
Adger, W.N. (2003) Building resilience to promote sustainability, IHDP Update, 2, pp. 1–3.
Agard, J., E.L.F. Schipper, J. Birkmann, M. Campos, C. Dubeux, Y. Nojiri, L. Olsson, B.
Osman-Elasha, M. Pelling, M.J. Prather, M.G. Rivera-Ferre, O.C.
Banchetti Cordeiro, Gislaine, Paula Lacerda Aguiar, Camila Aparecida Tolentino Cicuto, andPaulo Rogéiro Miranda Correia.2012. Making interdisciplinarity visible using concept mapping.Proceedings of the Fifth international Conference on Concept Mapping.
Borrego, Maura, Chad B. Newswander, Lisa D. McNair, Sean McGinnis, and Marie C. Paretti. 2009. Using concept maps to assess interdisciplinary integration of green engineering knowledge.Advances in Engineering Education1, 3.
Camerata, Flavio. 2018. Interdisciplinary Learning through Concept Mapping: Lessons learnt from the ENEPLAN experience.Integrated energy and education in Mediterranean universities.Proceedings of the ENEPLAN final conference, Beirut, 13-14 September 2018.
Cañas, Alberto J., Larry Bunch, Joseph D. Novak, andPriit Reiska. 2013. Cmapanalysis: an extensible concept map analysis tool.Journal for Educators, Teachers and Trainers 4, 1: 36-46.
Cañas, Alberto J., Joseph D. Novak, and Priit Reiska. 2015. How good is my concept map? Am I a good Cmapper? Knowledge Management & E-Learning 7, 1: 6-19.
Carpenter, S.R., Westley, F. & Turner, G. (2005) Surrogates for resilience of social–
ecological systems, Ecosystems, 8(8), pp. 941–944.
Daley, Barbara J., andDario M. Torre. 2010. Concept maps in medical education: an analytical literature review. Medical Education 44: 440-448.
Davidson, F. (1996).Planning for performance: requirements for sustainable
development.Habitat International, 20(3), 445–462.
Davoudi, S., (2012). Resilience: A Bridging Concept or a Dead End? Planning Theory &
Practice,, 299–333. http://doi.org/10.1080/14649357.2012.677124
Healey, P. (1988). The British planning system and managing the urban environment.Town
Planning Review, 59(4), 397–417.

13
Holling, C.S. (1996) Engineering resilience versus ecological resilience, in: P.C. Schulze
(Ed.) Engineering Within Ecological Constraints, pp. 31–44 (Washington, DC, National
Academy Press).
Mikser, Rain, Priit Reiska, and Kai Rohtla. 2008. Science teachers’ interpretations about interdisciplinary teaching. Proceedings of the Third International Conference on Concept Mapping.
Moni, Roger W., and Karen B. Moni. 2008. Student perceptions and use of an assessment rubric for a group concept map in physiology. Advances in Physiology Education 32: 47-54.
Novak, Joseph D., and Alberto J. Cañas. 2008. The Theory Underlying Concept Maps and How to Construct and Use Them. Technical Report IHMC CmapTools 2006-01 Rev. 01-2008, Institute for Human and Machine Cognition
Prats, Ernest. 2014. La evaluación de mapas conceptuales: análisis de instrumentos y su aplicación en un caso práctico.Proceedings of Sixth International Conference on Concept Mapping.
Rice, Diana C., Joseph M. Ryan, and Sara M. Samson. 1998. Using Concept Maps to Assess Student Learning in the Science Classroom: Must Different Methods Complete?Journal of Research in Science Teaching 35, 10: 1103-1127.
Ruppel, A. Sallenger, K.R. Smith, A.L. St Clair, K.J. Mach, M.D. Mastrandrea, and T.E. Bilir
(eds.) (2014): Annex II: Glossary. In: Barros, V. R., Field, C. B., Dokken, D. J., Mastrandrea,
M. D., Mach, K. J., Bilir, T., Chatterjee, M., Ebi, K. L., Estrada, Y. O., Genova, R. C., Girma,
B., Kissel, E. S., Levy, A. N., MacCracken, S., Mastrandrea, P. R., White, L. L. (eds.):
Climate Change 2014: Impacts, Adaptation, and Vulnerability. Part B: Regional Aspects.
Contribution of Working Group II to the Fifth Assessment Report of the Intergovernmental
Panel on Climate Change, pp. 1757-17. Cambridge, United Kingdom and New York, NY,
USA: Cambridge University Press
Sibilla, Maurizio. 2017. A meaningful mapping approach for the complex design. International Journal of Design Sciences and Technology 23, 2: 41-78.
Spelt, Elisabeth J. H., Harm J.A. Biemans,Hilde Tobi, PieternelA. Luning, and Martin Mulder. 2009. Teaching and Learning in Interdisciplinary Higher Education: A Systematic Review.Educational Psychology Review 21:365-378.
UNISDR.(2009). 2009 UNISDR Terminology on Disaster Risk Reduction.International Strategy for Disaster Reduction (ISDR).https://doi.org/978-600-6937-11-3
West, Daniel C., J. Richard Pomeroy, Jeanny K. Park, Elise A. Gerstenberger, and Jonathan Sandoval. 2000. Critical Thinking in Graduate Medical Education. A Role for Concept Mapping Assessment?Journal of the American Medical Association 284, 9.

14
Towards a Latin American resilience
framework. Jonathan R. Barton1, Ana Cláudia Cardoso2, Kátia Canil3, Juan Carlos Santa Cruz4
1 Pontificia Universidad Católica de Chile
2 Universidade Federal do Pará
3 Universidade Federal do ABC
4 Universidad de Concepción
1. Climate change in Latin America
Latin America is responsible for a relatively low proportion of global emissions of greenhouse gases (12%) - relatively close to its global demographic weight (8.5%) (EPA, 2017), however, it will be one of the most severely affected by climate change during this century. This can already be seen in the advance of desertification in the northeast of Brazil and central-south of Chile, heat waves, severe droughts and reduction of water resources in these countries, and others, or the increase of extreme rainfalls and flash floods at the South of Brazil and in Colombia, among other locations1(Marengo et al., 2011; AdaptChile, 2018). This situationhighlights the issues of justice and responsibility in terms ofclimate change and resilience from a Latin American perspective, also the urgency of an adequate response. Curiously, one of the greatest paradoxes of the concept of resilience applied to Latin American realities is that, while the concept was popularized worldwide over the last two decades, it is possible to appreciate a deep-rooted resilience in previous periods of Latin American settlement, from which valuable lessons can be drawn. However, as the twentieth century progressed, indigenous knowledge about how to face disasters through simple actions, such as fleeing to higher places after an earthquake, or how to confront flooding in the Brazilian Amazon by the use of raised wooden floors, seems to have been marginalised in favour of modern technological solutions; the Bolivian government opposition to signing the Cancún Agreement at COP16 was also a rejection of this form of modernist, technological diplomatic agenda. Comparisons between reactions to the Chilean 2010 earthquake (8,8° Richter) and to the earthquake occurred in Talca, one hundred years before, in 1928 (7,9°), have shown that increased priority was given to reconstruction technologies rather than to prevention and warning systems. Although this was a tectonic phenomenon, many of the same lessons apply to the challenges of climate change.
1 Hazards become risks when there is a possibility of physical, economic or social damage to an element (living being or material artefact), while the degree of exposure of an element to a hazard determines the intensity of its vulnerability. Hazards can be natural (i.e. volcanos, earthquakes), anthropogenic (i.e. floods) or technological (i.e. explosion, contamination, dam breaches), and planning is the tool for understanding these processes and interactions, issues of spatial impact, and also the most appropriate strategies for generating resilience to these events (Cardona, 2003).
15
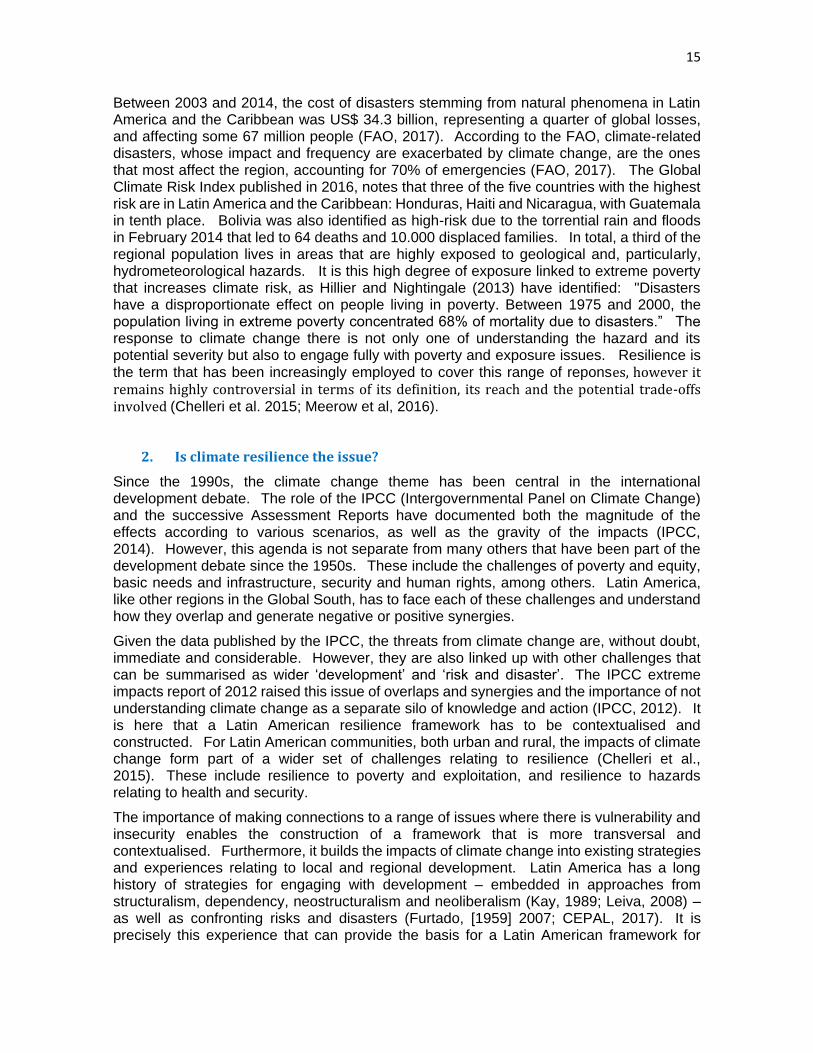
Between 2003 and 2014, the cost of disasters stemming from natural phenomena in Latin America and the Caribbean was US$ 34.3 billion, representing a quarter of global losses, and affecting some 67 million people (FAO, 2017). According to the FAO, climate-related disasters, whose impact and frequency are exacerbated by climate change, are the ones that most affect the region, accounting for 70% of emergencies (FAO, 2017). The Global Climate Risk Index published in 2016, notes that three of the five countries with the highest risk are in Latin America and the Caribbean: Honduras, Haiti and Nicaragua, with Guatemala in tenth place. Bolivia was also identified as high-risk due to the torrential rain and floods in February 2014 that led to 64 deaths and 10.000 displaced families. In total, a third of the regional population lives in areas that are highly exposed to geological and, particularly, hydrometeorological hazards. It is this high degree of exposure linked to extreme poverty that increases climate risk, as Hillier and Nightingale (2013) have identified: "Disasters have a disproportionate effect on people living in poverty. Between 1975 and 2000, the population living in extreme poverty concentrated 68% of mortality due to disasters.” The response to climate change there is not only one of understanding the hazard and its potential severity but also to engage fully with poverty and exposure issues. Resilience is the term that has been increasingly employed to cover this range of reponses, however it remains highly controversial in terms of its definition, its reach and the potential trade-offs involved (Chelleri et al. 2015; Meerow et al, 2016).
2. Is climate resilience the issue?
Since the 1990s, the climate change theme has been central in the international development debate. The role of the IPCC (Intergovernmental Panel on Climate Change) and the successive Assessment Reports have documented both the magnitude of the effects according to various scenarios, as well as the gravity of the impacts (IPCC, 2014). However, this agenda is not separate from many others that have been part of the development debate since the 1950s. These include the challenges of poverty and equity, basic needs and infrastructure, security and human rights, among others. Latin America, like other regions in the Global South, has to face each of these challenges and understand how they overlap and generate negative or positive synergies.
Given the data published by the IPCC, the threats from climate change are, without doubt, immediate and considerable. However, they are also linked up with other challenges that can be summarised as wider ‘development’ and ‘risk and disaster’. The IPCC extreme impacts report of 2012 raised this issue of overlaps and synergies and the importance of not understanding climate change as a separate silo of knowledge and action (IPCC, 2012). It is here that a Latin American resilience framework has to be contextualised and constructed. For Latin American communities, both urban and rural, the impacts of climate change form part of a wider set of challenges relating to resilience (Chelleri et al., 2015). These include resilience to poverty and exploitation, and resilience to hazards relating to health and security.
The importance of making connections to a range of issues where there is vulnerability and insecurity enables the construction of a framework that is more transversal and contextualised. Furthermore, it builds the impacts of climate change into existing strategies and experiences relating to local and regional development. Latin America has a long history of strategies for engaging with development – embedded in approaches from structuralism, dependency, neostructuralism and neoliberalism (Kay, 1989; Leiva, 2008) – as well as confronting risks and disasters (Furtado, [1959] 2007; CEPAL, 2017). It is precisely this experience that can provide the basis for a Latin American framework for

16
resilience. This framework will have at its base this experience of successes and failures, of sectoral versus more integrated planning, and in particular the need for a holistic approach to climate change adaptation that makes strong connections with other phenomena that are also driving forces in local and regional contexts (Barton and Irrarázaval, 2016).
Despite international efforts since the 1960s (The Decade for Development), particularly investment in infrastructure and housing, poverty persists across the Global South while inequality increases across different dimensions, not only income (World Bank, 1994; CEPAL 2010, 2016). A particular feature of development during this fifty year period is that urbanization has concentrated this poverty and inequality in specific locations, with marked intra-urban differences in the urban fabric and adaptive capacities (UN Habitat 2011, 2016). In this light, the role of neoliberalism or ‘savage capitalism’ has also to be seen as having had a role in shaping vulnerability to climate change, particularly in the context of urbanisation in the Global South (Satterthwaite, et al, 2009).
Rather than climate change, and resilience to it, being ‘the’ issue for a Latin American resilience framework, climate impacts should be understood as revealing certain trends that compound existing vulnerabilities. When the layers of vulnerability are considered, for example sensitivity, exposure and adaptive capacity, these relate to factors that are generated by socio-economic, socio-ecological and cultural dimensions. Sensitivity, for example, is shaped by generational factors that are defined by the demographic profiles of particular communities. Exposure is linked to residential location, for example, and therefore to land use and access to tenure. While adaptive capacity is produced not only by access to financial capital, but also by human and social capital (Barton, 2013; Henríquez, 2018). These are all multi-dimensional considerations that lead to the conclusion that a Latin American resilience framework is one that is centred on broad-based considerations of development, within which the threats of climate change, particularly the predicted behaviour of these threats during the rest of the twenty-first century, have to be equated.
The reason for a more contextualised, regional approach to climate change adaptation is necessary in the face of the predominance of the global climate change debate and the consequent agreements - initially the Kyoto Protocol mechanisms and more recently the INDCs of COP21, for example, which outline each country´s strategy to – theoretically – contribute to a global goal of under 2oC of warming; in the Chilean case, the language is similar to many others in not clarifying any legal commitment: “Chile hopes (sic) to reduce its greenhouse gas emissions while decreasing poverty and inequality as well as continue advancing toward sustainable, competitive, inclusive and low-carbon development.” (INDC, 2015, 11). While mitigation, with the need to reduce greenhouse gas emissions and increase carbon sequestration, has dominated the agenda since the launching of the UNFCCC in 1994 and has been relatively uniform in its set of responses: ‘global solutions for a global problem’, adaptation requires a different approach. This approach has to be highly contextualised given the tremendous range of potential impacts and the local conditions in terms of vulnerability. To reduce vulnerability to climate change impacts requires a reduction in vulnerability to a range of other development considerations in order to reduce exposure and increase adaptive capacity.
Until the landmark special report on extreme events, climate change research and proposed responses tended to be fragmented, sectoral and rarely linked to wider development issues. The IPCC Working Group (WG) II on adaptation had considerably less protagonism than WG I on climate science and WG III on migitation (IPCC, 2014). It can also be said that this adaptation WG has the strongest links with local and regional development

17
concerns. Each of the adaptation chapters on regional conditions - for example, chapter 27 on Central and South America (Magrin et al, 2014)– stresses the local contexts in which the impacts are generated and to which appropriate responses are required. While there may be many commonalities in climate science and mitigation research and action agendas, in the realm of adaptation, it is context – for impacts, vulnerability and resilience – that is paramount (Magrin et al, 2014).
3. A history of risk and resilience
Rather than assuming that climate change is neutral in terms of adaptive capacities and risk, the Latin American experience leads to the need to examine vulnerability and climate hazards in terms of what Ulrich Beck terms ‘the risk society’ (Beck, 1992). Although Latin America has a long history of risk and disaster associated with tectonic and seismic activity – volcanic eruptions, earthquakes, and tsunamis – the role of the risk society in terms of climate change is particularly relevant. In the case of ‘natural’ disasters based on geological activity in the earth´s crust, the issue of anthropogenic factors is less of an issue in terms of risk. There are clearly factors that reduce these risks, such as the location of settlements in proximity to areas affected by a tsunami, lava flows, and mudslides. However, in the case of climate change, the risk society as defined by Beck is more than explicit. He refers to the term ‘reflexive modernization’ as the form with which society should adapt to the production or manufacture of new risks, usually new technologies and products (nuclear energy, for example, see Beck, 1992). However, governments, and society more generally, has proved to be poor in terms of engaging reflexively with the threats emanating from greenhouse gas emissions as well as planning for adaptive measures for constructing more resilient communities.
As in the urban centres of Africa and Asia, Latin America cities congregate millions of people living in precarious housing with unsanitary conditions, often in areas defined as having a high level of risk from climate impacts (IPCC, 2014; Henríquez and Romero, 2019). Since many of these settlements are informal and irregular, the conclusion can be drawn that risk is being manufactured through urban planning and management strategies, whether the inability to access land that is not classified as at risk, or in terms of the generalized adaptive capacities of low income, high vulnerability (socio-economic and socio-ecological) communities (Krellenberg et al. 2016; Krellenberg et al. 2017). The segregation that characterizes Latin American cities is also a segregation that shapes climate risk and resilience.
The more vulnerable, socially and spatially segregated population has highest exposure to hazards (‘socio-natural hazard’, or natural hazards that are socially induced, Lavell, 1999) and therefore has higher risk levelsin terms of the consequences of ‘natural’ and climate change. A Latin American resilience framework highlights that adaptation alternatives cannot be considered without addressing these structural issues first. These are issues that constitute the basis of climate risk and social resilience. Rather than climate change being understood as a ‘natural’ phenomena relating to climate science, it should be defined clearly as an anthropogenic risk, produced since the Industrial Revolution but with a notable acceleration in the second half of the twentieth century. When this anthropogenic process is then combined with the twentieth-century risks associated with urban development, it can be viewed as a compounded problem.
Urban development in Latin America since the 1960s has been both rapid and intensive. Urbanisation rates in most countries – Mexico and Brazil in particular – were among the highest in the world, leading to the production of the most urbanised region in

18
the world. Although there are differences between the highly urbanised Southern Cone countries and the less urbanised countries of Central America, the region as a whole reflects this dramatic shift from rural, subsistence societies to urban manufacturing and service economies in a short space of time. However, the rate of urbanisation and poor systems of governance led to high levels of spontaneous settlement and low service provision (United Nations, 2014). Of particular importance has been the settlement on urban fringes and in risk areas within the city, whether river banks, floodplains, gullies or steep slopes, leading to the new urban population being located primarily in risk areas. It is precisely this historical condition of Latin American cities that provides the context in which climate change impacts add to the vulnerability of the urban population. Nevertheless, climate change impacts should not be considered in isolation.
According to the IPCC, the increase in intensity and/or frequency of extreme events is related to climate change. However, most of the disasters recorded in the region over the past fifty years have occurred in or have affected urban areas (IPCC, 2012). This can be partially explained by the exponential growth of the urban population and their location, particularly in cities with recognized high levels of exposure to ‘natural’ hazards and climate variability events.
The impacts of climate change exacerbate the effects of disasters that were traditionally experienced in Latin American urban settlements, whether ‘natural’ hazards or those generated by climate variability. More recently, the IPCC has noted that there is no climate variability that is not affected by climate change – the ‘new normal’ - therefore many of the events since the 1950s have also had a factor of climate change related to them (IPCC, 2014). Resilience to these earlier events is highly relevant to the ways in which climate change adaptation and resilience-building are understood. Rather than new terrain, Latin American societies and their authorities have a long tradition of knowledge in relation to risk, disasters, adaptation and resilience, but economic priorities have directed investments to the fulfilment of external demands rather than longer-term protective measures for local populations.
The insertion of Latin America within the international division of labour as peripheral and disarticulated has fostered economic dependence, structural indebtedness, significant inequalities, and persisting poverty. These circumstances have affectednational capacities for developing appropriate adaptive responses, while at the same time national links to Global North countries and agencies – through economic agreements, and bilateral and multilateral technical assistance - has limited the formulation of a specific Latin American perspective on regional and local challenges, although CEPAL has attempted to define more autonomous paths, such as neostructuralism (Sunkel and Zulueta, 1990, Bielschowsky, 2009).
The search for swift economic growth to reproduce the ‘development path’ of Global North countries has resulted in the assumption that economic, political, academic and other categories imported from those countries, could be easily and directly incorporated by Latin American countries. However, the incorporation of such concepts without considering previous knowledge and diverse contexts, in in other regions of the Global South (Chakrabarty, 2001; Wallerstein, 2001), has helped aggravate the risk of low income economic groups, while investments in logistics for production and export have been prioritised in order to accelerate the conversion of areas according to specific productive and financial rationalities, which often lead to water stress, wholesale ecosystem modification, and increased emissions and discharge levels. In this sense, climate change discourses have often replicated development discourses that position Latin American societies as European cultural appendices - hybrid, unfinished, and following postcolonial trajectories –

19
and which have diminished the role of traditional knowledges. Climate change, as with other structural challenges to the sustainability of communities in the region, will depend on a decolonisation of knowledge as an important step in renegotiating power relations and reorganising priorities (Santos, 2010). In the field of risk and disaster, knowledges that have been considered as “primitive”, “underdeveloped”, “pre-modern”, should be drawn upon to address climate change, and to position alternative strategies for resilience-building that are bottom-up, context-based and historically-informed.
4. Final Remarks: The importance of developing regional frameworks for developing resilience.
The ideas presented above were raised to highlight that neutrality or unrooted discussion is not possible in the field of climate change. Debates on resilience require reflections on historical change and knowledge as much as future threats. How much of this knowledge can be drawn upon – e.g. from experiences facing disasters not related to climate change (such as earthquakes, tsunamis or volcanoes’ activities) –to integrate into regional and local strategies in the face of droughts and floods caused by human activity (change in land use, deforestation and changes in water cycles), which have been progressively aggravated by climate change.
The presence of different kinds of hazards across the continent is a superficial justification for the historical lack of effort to create a regional framework to face environmental problems and, at present, to build broad-based resilience. Targeted funding for climate change may not engage with the root structural weaknesses that exist and that are central to the vulnerability that exists and persists. This funding may also employ methodologies and instruments that are not necessarily in tune with national and local practices in situ. The requirement for complementary funding by beneficiary states may also be a limitation, as is the longer-term commitment once the disaster status period has ended. For example, in Brazil, the organisations such as UNISDR (United Nations Office for Disasters Risk Reduction) are welcomed when a disaster strikes but they rapidly lose protagonism as the disaster period shifts into reconstruction (Salim, 2012; Coffee, 2016).
Despite incipient progress in integrating the approach to risk reduction into urban development, food security, planning, budgeting, institutional mechanisms and action implementation at the local level, Latin American institutions remain focused on responding to emergencies and have struggled to engage with the key structural issues that define resilience. This orientation has evolved from responses to disasters that precede climate change discussions. However, decades of experience reveal that emergency response is not enough. Enhanced resilience means that communities and authorities must be prepared for disasters and also must engage in actions to reduce climate risk by reducing vulnerability, in terms of physical losses, economic costs, and most importantly loss to human life. In this sense, climate risk reduction is part and parcel of generating inclusive, sustainable development.
In terms of building a regional resilience framework through which climate risks can be linked to other risks and more generalised conditions of vulnerability, it is important to recognise factors of context, including history. Latin American societies have a long history of risk and disaster and there is evidence of them being intuitively resilient, with adaptation to drought, extreme heat and flooding being grounded in traditional practices of construction and design. However, much of this traditional knowledge has been colonised by otherforms of knowledge associated with modernisation during the twentieth century. The combined

20
processes of: a) modernisation of particular types of ‘valid’ knowledge; b) climate change, and c) urbanisation rates (with consequent demands on regional food, water, and energy systems) have led to increased vulnerability of a large numbers of Latin Americans over recent decades.
It raises the need to introduce a contextualised resilience framework, able to place climate risk alongside other structural and systemic risks associated with socio-economic development, provision of basic needs, services, and infrastructure, with a view to combined actions of land use management and planning, and an understanding of risk and of possible measures for increasing local resilience.
The willingness to integrate traditional and indigenous knowledge to scientific frameworks is a fundamental step for strengthening resilience in locations where vulnerable communities are mostly concentrated. By focusing on local knowledges that combine different experiences, methods and practices, and by focusing on context andsocio-ecological specificities, it should be possible to avoid the standardised formulas which are favoured by funding agencies and bilateral partners,but are so often disconnected from everyday experiences. Macro regional economic and planning agendas need to stress the importance of local planning demands and environmental regulations, land use norms, and the importance of addressing claims for socio-ecological justice. In Latin American cities, the evidence of the gap between those with enhanced adaptive capacities, less exposure and less sensitivity, and those who are more vulnerable, is brutally evident. It is for this reason that a regional resilience framework has to place climate change in a wider context of structural inequalities and risks, as well as recognising the long history and experience of risk and disaster that the region has faced before climate change was even a consideration on the public policy agenda.

21
Reference List
Adapt-Chile. (2018). Adapt Chile Resiliencia la Cambio Global. Retrieved from http://www.adapt-chile.org/esp/
Aguilera, Silvia (ed.) (2010). El terremoto social del bicentenario. Santiago: LOM Ediciones.
Barton, Jonathan R. ‘Climate change adaptive capacity in Santiago de Chile: Creating a governance regime for sustainability planning’ International Journal of Urban and Regional Research 37:6, 1916-1933
Barton, Jonathan R. and Irarrázaval, Felipe. (2016) Adaptación al cambio climático y gestión de riesgos naturales: Buscando síntesis en la planificación urbana Revista de Geografia Norte Grande 63, 85-108.
Bech, Ulrich (1992)Risk Society: Towards a New Modernity. London: Sage..
Bielschowsky, (2009) ‘Sesenta años de la CEPAL: estructuralismo y neoestructuralismo Revista de la CEPAL 97, 173-194.
CEPAL (2010) La hora de la igualdad: brechas por cerrar, caminos por abrir. Santiago de Chile: CEPAL
CEPAL (2016) Ciudades sostenibles con igualdad en América Latina y el Caribe: seis mensajes claves. Santiago de Chile: CEPAL
CEPAL (2017) Plande Acción Regional para la Implementación de la Nueva Agenda Urbana en América Latina y el Caribe, 2016-36. Santiago de Chile: CEPAL
Chakrabarty, Dipesh (2001). “Postcolonialismo y el artificio de la historia: ¿Quién habla por los pasados ‘indios’?”, en Mignolo, W. – Ed. -. Capitalismo y geopolítica del conocimiento.Durham: Duke University / Ediciones Signos.
Chelleri, Lorenzo, James J. Waters, Marta Olazabal, Guido Minucci (2015) ‘Resilience trade-offs: addressing multiples scales and temporal aspects of urban resilience’ Environment and Urbanisation 27:1, 181-198.
Coffee, Patrick. Huge to Shutter All Operations in Brazil Amid Ongoing Economic Crisis. AgencySpy. Available at: www.adweek.com/agencyspy/huge-to-shutter-all-operations-in-brazil-amid-ongoing-economic-crisis/140397. Access October 2018.
EPA -United States Environmental Protection Agency (2017) International Climate Impacts. Available at: https://19january2017snapshot.epa.gov/climate-impacts/international-climate-impacts_.html
FAO (2017). Guidelines and recommendations for the implementation of the Sendai Framework for Disaster Risk Reduction in the Agriculture and Food Security and Nutrition Sector Latin America and the Caribbean. Santiago: FAO 2017.
Furtado, Celso ([1959] 2007) Formação Econômica do Brasil. São Paulo: Companhia das Letras.
Henríquez, Cristian (2018). Resiliencia Urbana. In CEDEUS (Ed.), Camino a Ciudades Sustentables. Aportes desde la investigacion a las politicas publicas urbanas en Chile Santiago de Chile: CEDEUS, 73-79.
22
Henríquez, Christian and Hugo Romero (eds. 2019) Urban Climates in Latin America Heidelberg: Springer.
Hillier, Debbie and Katherine Nightingale (2013) How disaster disrupts development: Recommendations for the post-2015 development framework. Oxfam International December . Published by Oxfam GB for Oxfam International under ISBN 978-1-78077-526-5. Oxfam GB, Oxfam House, John Smith Drive, Cowley, Oxford, OX4 2JY, UK.
IPCC. (2012) Managing the Risks of Extreme Events and Disasters to Advance Climate Change Adaptation (SREX). New York: Cambridge University Press.
IPCC (2014) Fifth Assessment Report: Impacts, Adaptation and Vulnerability. New York: Cambridge University Press.
Kay, Cristóbal. (1989)Latin American Theories of Development and Underdevelopment. London: Routledge.
Krellenberg, Kerstin, Juliane Welz, Felipe Link and Katrin Barth (2016) ‘Urban vulnerability and the contribution of socio-environmental fragmentation: Theoretical and methodological pathways’ Progress in Human Geography 41:4, 408-431.
Krellenberg, Kerstin, Juliane Welz and Felipe Link (2017) Cambio climático, vulnerabilidad urbana y adaptación a nivel municipal: Santiago de Chile y otras ciudades de América Latina. Santiago de Chile: RIL.
Lavell, Allan (1999) Un encuentro con la verdad: Los desastres en América Latina durante 1998. Anuario Político y Social de América Latina, Núm. 2, pp. 1-19. http://www.desenredando.org/public/articulos/1999/ldeald1998/LosDesastresEnAmericaLatinaDurante1998-1.0.0.pdf. Accessed October 2018.
Leiva, F.I. (2008) Latin American Neostructuralism: The contradictions of post-neoliberal development. Minneapolis: University of Minnesota Press.
Magrin, Graciela; Marengo, José ; Boulanger, Jean-Philip; Buckeridge, Marcos; Castellanos, Edwin; Poveda, German; Scarano, Fabio and Vicuña, Sebastian (2014): Central and South America. In: Climate Change 2014: Impacts, Adaptation, and Vulnerability. Part B: Regional Aspects. Contribution of Working Group II to the Fifth Assessment Report of the Intergovernmental Panel on Climate Change [Barros, V.R., C.B. Field, D.J. Dokken, M.D.
Mastrandrea, K.J. Mach, T.E. Bilir, M. Chatterjee, K.L. Ebi, Y.O. Estrada, R.C. Genova, B. Girma, E.S. Kissel, A.N. Levy, S. MacCracken, P.R. Mastrandrea, and L.L.White (eds.)]. Cambridge University Press, Cambridge, United Kingdom and New York, NY, USA, pp. 1499-1566. Available at: http://www.ipcc.ch/pdf/assessment-report/ar5/wg2/WGIIAR5-Chap27_FINAL.pdf. Acessed October 2018.
Marengo, José A. et. al. (2011). Risco das Mudanças Climáticas no Brasil: Análise Conjunta Brasil-Reino Unido sobre os Impac tos das Mudanças Climática s e do Desmatamento na Amazônia. Relatório. INPE. MetOffice Hadley Centre. Access in: 2018-10-12.http://www.ccst.inpe.br/wp-content/uploads/relatorio/Mudancas_Climaticas_no_Brasil_relatorio.pdf. Accessed September 2018.
Meerow, Sara, Joshua P. Newell, Melissa Stults (2016) ‘Defining urban resilience: a review’ Landscape and Urban Planning 147, 38-49

23
Nogueira, F., Oliveira, V., Canil, K. 9(2014) Políticas públicas para gestão regional de riscos: o processo de implantação no ABC, SP. Ambiente & Sociedade, São Paulo, 17:4, 177-194.
Salim, Dizery (2012) Brazil to open Centre of Excellence for Disaster Risk Reduction. UNISRD. www.unisdr.org/archive/24792. Accessed October 2018.
INDC (2015) Intended Nationally Determined Contribution of Chile towards the Climate Agreement of Paris, 2015. Santiago de Chile: Gobierno de Chile
Santos, Boaventura De Sousa (2010). Descolonizar el saber, reinventar el poder. Montevideo: Ed. Trilce.
Satterthwaite, David, Saleemul Huq, Hannah Reid, Mark Pelling and Patricia Romero Lankao (2009) ‘Adapting to Climate Change in Urban Areas: The Possibilities and Constraints in Low- and Middle-Income Nations’ in Jane Bicknell, David Dodman and David Satterthwaite (eds) Adapting Cities to Climate Change: Understanding and Addressing the Development Challenges. London: Earthscan, 3-50.
Sunkel, Osvaldo and Gustavo Zulueta (1990) ‘Neoestructuralismo versus neoliberalismo en los años noventa’ Revista de la CEPAL 42, 35-53.
The International Bank for Reconstruction and Development / THE WORLD BANK (1994). World Development Report 1994 Infrastructure for Development. Published by Oxford University Press, Inc. New York, N.Y. 10016. Acesss: https://openknowledge.worldbank.org/bitstream/handle/10986/5977/WDR%201994%20-%20English.pdf?sequence=2
UN Habitat (2011). Global report on human settlements 2011: Cities and Climate Change. New York: UN Habitat.
UN Habitat (2016) La Nueva Agenda Urbana. Quito: UN Habitat
United Nations (2014). World Urbanization Prospects - The 2014 Revision Highlights. New York: Inited Nations. Acess: https://esa.un.org/unpd/wup/publications/files/wup2014-highlights.pdf. Access October 2018.
Wallerstein, Immanuel (2001). “El eurocentrismo y sus avatares. Los dilemas de la Ciencia Social”, en Mignolo, W. – ed. –. Capitalismo y geopolítica del conocimiento. Durham: Duke University / Ediciones Signos.
Section I. Climate change and resilience
national institutional frameworks Marcello Magoni CCRR-Lab – DAStU – Politecnico di Milano (Italy)
The eight countries that participate in the "CARE" project, of which 5 belonging to Latin
America (Brazil, Chile, Colombia, Ecuador, Uruguay) and three to the European Union (Italy,
Spain, The Netherland), have all ratified the "Paris climate agreement"and have approved
at least a program, a strategy and/or even a law, see the case of The Netherlands, of
adaptation to climate change at the national level. Furthermore, for the three member

24
countries of the European Union, the strategies and plans related to climate change derive
from the European Union's Directives, Recommendations and Guidelines.
The plans, strategies or laws approved have in some cases indicated the targets for the
reduction of greenhouse gas emissions compared to the year 1990, always considering that
the member countries of the European Union have as a whole and individually targets to be
reached defined at the continental level. These targets can only be improved by individual
countries, and on the whole they progressively go from 20% in 2020 to 80% in 2050. Among
the CARE project countries that have given indications, the targets range goes from the one
of Colombia, which plans to reduce its emissions by 20% in 2030, to the one of The
Netherlands, which plans to reduce its emissions by 49% in 2030 and 95% in 2050.
The problems resulting from climate changes that have been observed in the different
countries, albeit with very different intensities, mainly concern the phenomena linked to the
water cycle, such as floods, extreme rainfall, rising sea levels, melting ice, drought and water
shortages, while less problematic arethe heat waves and the unstable land phenomena.
The strategies, tools and general intervention criteria indicated for adaptation to climate
change tend to be similar since, with different accents, national and local adaptation plans,
urban-scale resilience strategies, and achievement of climate proofing conditionsare pointed
out. Furthermore, the need to achieve a strong integration of climate change adaptation
strategies with mitigation ones and with the intervention tools and strategies of other
sectorsis indicated, in particular those of risk management, freshwater supply, spatial
planning and nature, agriculture and economic policies. The general objectives that are
indicated are the vulnerability and disaster risk reduction, the resilient improvement and the
ability to cope with the increasing weather extremes. The strategies generally consider the
risk associated with the climate change impacts as a result of the interaction of natural
hazards with the vulnerability and exposure of human and natural systems, as well as their
capacity for adaptation. Latin American countries aim to implement resilient actions as part
of the sustainable urbanization process, to integrate the theme of urbanization with the
eradication of poverty and the conception of public land policies.
In general, there is a great difficulty in implementing the strategies in a systemic way and
with the speed necessary to meet the objective of the Paris agreement not to exceed 2%
increase in the average global temperature, even better if under the 1.5%, although
considerable efforts are being made both by states and individual cities.
Up to now, the implementation of adaptation strategies are very limited in these countries
and are generally developed above all at the project level, while there are many and
widespread plans, actions and actions designed to manage territorial risks or to improve the
urban comfort and the quality of life that can be considered adaptation actionsto all effects.
There are also several experiences in the implementation of resilient actions designed on a
local scale, including those of some cities participating in initiatives such as "C40 cities",
which are taking bold climate action, and "100 Resilient Cities", sponsored by The
Rockefeller Foundation, which aim to support the adaptability of urban areas to climate
change.

25
The following chapters show the progress of experiences in implementing adaptation and
resilience policies and strategies related to Brazil, Chile, Colombia, Ecuador, Uruguay, Italy,
Spain and The Netherland.

26
Chapter 1.Advances and regressions in the risk
management policy in Brazil Ana Cláudia Cardoso1, Kátia Canil2, José Julio Lima1, Luciana Trasvassos2, Carolina Pinho2, Sandra
Momm2 and Juliano Ximenes1
1Universidade Federal do Pará 2Universidade Federal do ABC
1. Introduction: How the urban climate resilience frame matches the Brazilian context
The last two centuries have been marked by major social, economic, spatial and
environmental transformations. An unprecedented search for wealth accumulation, through
the integration of New Territories and the continuous growth of the economic product, was
based on the incorporation of environmental resources into the productive process and the
exploitation of work, causing a concentration of benefits and unequal distribution of
socioenvironmental impacts. In Brazil, the intensification in the rhythm of assimilation of rural
areas for productive uses related to an industrial matrix (mineral extractivism, agribusiness,
etc.) plus population concentration in cities since the years 1950, have consolidated an
unequal and unsustainable standard of land use and occupation, which promotes a dispute
over access to environmental resources, such as water and occupation of appropriate sites
for urbanization.
Urbanization in Brazil was associated with an unequal economic structure and with a political power differentiated among social groups throughout its history, this circumstance generated different material and symbolic expressions across Brazilian regions. However The distributive focus, concerned with access to natural resources, services and opportunities in the city, was disregarded in favor of a pragmatic approach to risk with a focus on disasters, following industrial societies, where disaster prevention methodologies have been associated with a strong planning and regulation experience of urban space-producing agents, and the recognition of nature's risk as intrinsic to the capitalist economy.
From this perspective, the disruption of the Chernobyl reactors (Aleksiévitch, 2013) and the
impacts of tsunamis and tornadoes, although associated with human failure and natural
environmental disasters respectively, would be processes both arising from recent capitalist
strategy of appropriation of natural resources and economic growth acceleration.
The recognition of risk as something intrinsic to the contemporary society has been
absorbed by the financial market, and industrial societies became stricter to pollution,
fostering the displacement of polluting and risk-causing structures to peripheral countries.
On the other hand, the insertion of peripheral countries into the international division of labor
has been more permissive to the factors that aggravate the risk (due to insufficient regulation
and/or supervision, lack of planning or ordering territorial policy, etc.), in the face of the
dispute of these countries by the industrial activities, which although polluting, were seen as
instruments for the expansion of internal income and consumption.
While the conditions of land use and occupation remain looser in countries such as Brazil,
in the contexts of the post-industrial countries the consequences of events of geological and
hydrological natures – capable of damaging either the physical, social or mental integrity of

27
human beings (due to death, missing, displaced, homeless, and affected in general), or
public functions (transport, water and energy supply, communications, etc.) and buildings
(private and public), or economic and environmental resources (soil, flora, fauna, water
bodies), have led to the construction of international landmarks facing disaster risks, that
came about from these events, and also the vulnerability to exposure to these risks
(Cardona, 2007).
The inability to articulate environmental, productive processes and urbanization standards
forwarded the Brazilian alignment to international formulations led by technical and reactive
bias, with distancing of relevant social aspects for the definition of risk and vulnerability
situations. Despite the increase on the importance of the environmental discussion in the
1980s, the discussion on sustainability was quickly co-opted by the search for the reduction
of productive activities impacts on the territory by means of technological modernization,
before that the distributive problem should be properly placed.
This question is reflected in the construction of climate policies in Brazil. The National Policy
of Climate Change (Federal Law n. 12.187), approved in 2009, still under the validity of the
Kyoto Protocol, focuses on "Consolidation of a low-carbon economy", and therefore its
guidelines are mainly related to the productive sectors: generation and distribution of
electricity, urban public transport and interstate cargo and passengers transportation, as
well as the various industrial sectors, of health and livestock services, without regard to the
Brazilian specificity in relation to the unequal distribution of the consequences of climate
change. Under the Paris Agreement in 2015, the country laid the foundations for its
Nationally Determined Contribution (NDC), built in a project supported by the Inter-American
Development Bank (IDB). The document deals with mitigation actions and aims, in addition
to the above-mentioned sectors, the production of biofuels, forest recovery and the reduction
of deforestation.
In 2016, the National Plan for Adaptation to Climate Change (MMA, 2016) was published,
broader in its objectives than earlier documents on climate change. It stands out in one of
its objectives, namely the identification and proposition of measures to promote adaptation
and reduction of climate risk in people and vulnerable populations. Although the idea of
resilience appears superficially, in general linked to the maintenance of the activities of the
productive sectors or to biodiversity and ecosystems, it is also considered in the chapter on
strategies for cities, which recognizes the historical construction of the socio-environmental
vulnerabilities of Brazilian cities and their increase in the face of climate change. In this
context, it links resilience to the need for planning for vulnerability reduction.
In a much more consistent way, however, such topics have been treated in the institutional
construction related to the identification and mitigation of geological-geotechnical,
hydrological and disaster reduction risks.
The Brazilian political context of the years 2000 favored a commitment to the international
agendas defined within the framework of the United Nations – through the "International
Disaster Reduction Strategy" (EIRD), created as part of the system of Nations United
Nations and regional organizations around the reduction of disasters and activities in socio-
economic and humanitarian fields (UNISRD, 2018), and by the I, II and III world conferences
on disaster risk reduction, carried out in Japanese cities with a history of Earthquakes, in the
1994s (Yokohama), 2005 (Kobe - Hyogo Agreement) and 2015 (Sendai - Sendai
Agreement).
The II International Conference produced the Hyogo Framework of Action (2005-2015),

28
considered the most important instrument for the implementation of the 'disaster risk
reduction' within the member states of the United Nations. The III World Conference on
Disaster Risk reduction that generated new protocol in 2015, the Sendai landmark, more
focused on planning, prevention, risk reduction and disaster. Among its various
developments, this milestone based the campaign "Building resilient cities: My city is
preparing", with the purpose of raising awareness of mayors, governors and national
authorities for the development of actions for To establish resilient cities as part of
sustainable urbanization processes, seeking to articulate the theme of urbanization with the
eradication of poverty and the conception of territorial public policies. Due to the diverse
circumstances of the cities in the world, a ten-step plan of action was also organized, with
ten aspects considered essential for the resilience of the cities.
It should be noted that the definition of resilience as "the ability of a social or ecological
system to absorb disturbances derived from climatic phenomena, maintaining the same
basic structure and modes of operation, the capacity of self-organization and the ability to
adapting to stress and change" (Project CARE report, adapted from the IPCC, 2007), or the
ability to restore the conditions before a disaster, would have the prospect of conservation
of the productive structures, which given the conditions of the cities could be translated by
maintaining the unequal distribution of the impacts of economic restructuring and
environmental degradation.
In the Brazilian context, the social geography of power is clearly a sort of sacrifice zone,
where great material deficiencies prevail due to the precariousness and improvisation of
urbanization and which houses the population exposed to adverse conditions; in these
places, conflicts, risks and failure in the control of the urbanization process prevail. There is
a geopolitics of risk, which is technological and environmental, but it is also socio-economic,
associated with the lack of income and socio-environmental injustice (Beck, 2010; Acserald,
2009). In recent decades, it has been added to the framework of precarious socio-
environmental, the increase and frequency of extreme events associated with global and
regional climatic variability, causing disasters in various regions of the country. The urgency
of an agenda and facts, coupled with a period of strong State acting in the development and
social policies, resulted in the creation of institutional policies and structures as will be
described below.
2. Background of risk and disaster prevention policy in Brazil
In Brazil it has long held the belief that, on account that the Brazilian territory has no history
of occurrence of natural phenomena such as earthquakes, cyclones or volcanoes, the
country would not have to worry about major natural disasters, with the exception of drought
events, especially in the semi-arid northeast region, and flooding in the cities, especially
after mid-20th Century, when a number of ineffective actions were carried out. During the
20th Century the developmentalist attitude of the federal government, disseminated the logic
of the exploitation of nature as something dead, in principle in the conception of regional
development, and subsequently in a negligent management of environmental and social
issues within cities.
Since the 1950s, urbanization has been associated with roads paved with asphalt, the use
of reinforced concrete in buildings, and the diffusion of motor vehicles, all was seen as
synonymous with progress, while a rural restructuring was exclusively guided by economic
interests, disregarding nature within urban and rural areas. Large enterprises such as
hydroelectric plants and productive structures were taken as best choice to smaller and best

29
adapted solutions and deployed in the margin of any environmental concern. Two examples
of this period are: a) the implementation of the Itaipu hydroelectric power plant and the flood
and disappearance of the waterfall of Seven Falls, compromising natural and landscape
heritage; and b) the high levels of water and air pollution caused by the Cubatão
petrochemical complex near the coastal region in the state of São Paulo.
In the urban environment an expression of this orientation was the provision of mass housing
during the 1970s, to assimilate the migration of the rural population to urban areas. The
expansion of cities was improvised, assimilating peripheral land that supported rural
communities and traditional extractivism even in areas such as the Amazon, and taking
water courses as sewage launch channels, to be rectified and buffered. By the end of 1980s,
the landscapes of the urban areas, especially of the periphery, was characterized by high
density of occupation, precariousness or lack of infrastructure, especially regarding
sanitation and vulnerability of the communities against the risks arising from natural threats,
predominantly landslides and floods.
Another Brazilian peculiarity from this period has been the failure to comply with
environmental legislation by sectors with economic and political power with the consent of
the state and sometimes by the State itself, which endures today. This posture is especially
due to high-income groups when refers to landscape-valued sites (mountain ranges, dunes,
waterfronts, etc.) or areas valued because of infrastructure or centrality. The spatial result is
the worsening of risks and sociospatial inequalities and the occurrence of geological-
geotechnical and hydro-meteorological processes that can generate disaster situations.
The normative and institutional Brazilian environmental framework was consolidated from
the 1980s; however, since the 1960s, Brazil has had instruments to control land use and
occupation, especially in areas close to rivers and hillsides. From the Federal Constitution
of 1988, the Brazilian federation system defined different environmental and territorial
competences at the three levels of government: Federal, State and Municipal. In
environmental matters, competences are complementary and competing, with the federal
level being the general ruler, while states and municipalities regional were in charge of local
issues, always respecting the principle of obedience to the most restrictive criterion, or of
greater precaution as well as its constitutionality. In territorial matters, the local level (the
municipalities) received greater autonomy and responsibility in the management and control
of land use and occupation, with setting up Planos Diretores Municipais (Municipal Master
Plans in Portuguese). Considering that the territory is the basis of natural resources, the
relative municipal autonomy in its planning and management, has created a bottleneck and
difficulties in the implementation of various environmental policies and instruments. The
Brazilian social and spatial disparity, with 5.570 municipalities in the territory of 8,516,000
km², presents municipal contexts with extensive territories and low institutional and
governance capacity, and, on the other hand, municipalities with very high population
densities and high institutional capacity in already degraded or highly modified territories.
Despite the history of occupations on slopes and river banks by excluded social groups
occurring since the end of the 19th Century in Brazilian cities, and the risk to which they are
exposed, it was only after the occurrence of a sequence of extreme climatic events that the
culture and planning system was changed. In 2008, in the Itajaí Valley in Santa Catarina
State, a climatic event with no precise record of recurrence due to the volume and intensity
of the precipitation - about 500 mm of rain in 48 hours, caused 135 deaths (Jacobi, Momm-
Schult, Bohn, 2013). In 2010, floods occurred in Alagoas State, and in 2011 the largest event
recorded in the last 50 years caused landslides and movement of big portions of land (mass

30
races ) in several municipalities in the Serra Fluminense region in Rio de Janeiro State.
Faced with this series of disasters, a new perspective was assumed, precisely by including
among the victims the highest income groups, including tourists who visited the cities of
Nova Friburgo, Petrópolis and Teresópolis, with 905 dead, 345 missing, 34,600 persons
homeless or displaced in the region. (Busch, Amorim, 2011), a circumstance that
expanded media coverage of the event and its consequences.
The magnitude and sequence of disasters clarified the need to develop effective policies
and instruments for risk prevention and mitigation and disaster response, what led the
subject to be included in the federal government's agenda. The occurrence of disasters in
the most vulnerable areas (i.e.: housing on dumping ground, improvised landfill or on hilly
areas) made more explicit that social exclusion would be the main source of vulnerability in
the Brazilian context, but scholars suggest that environmental policies miss this issue
(Valencio, et. all, 2009). The other hand, in areas with infrastructure and centrality, the real
estate value and the political power of the owners restrained preventive measures being
taken. In this case, the realization of works and interventions aggravated the problem, as is
the case of flood-prone wetlands and the plumbing of water courses.
The amount of casualties and the material losses occurring in the Serra Fluminense region
in Rio de Janeiro, triggered a timid dialogue between civil protection/risk management
actions (military and technical staff in charge of emergency action) and spatial planning
(related to land use and occupation control and preventive planning) policies, which still
remained independent of the discussion on the management of urban or environmental
policies, more linked to the epistemological field of environmental sciences and the earth
(climatology, meteorology, geology). In practice, the emergency character of interventions
became an electoral asset, due to the loosening of the rules and possibility of hiring without
bids (Valêncio, 2014; Jacobi et al 2013), discouraging the implementation of measures at a
preventive level. To treat the risk as something strictly "natural" and as "episodic" favors an
emergency approach of the processes, which is disinterested in the search for ways to
prevent and face their causes. Emergency usually gives opportunity to interventions to
happen outside planned budget, providing greater political and financial return to the
political and economic elites (Klein, 2015; Momm et al, 2017).
In this respect Douglas (2012) points out that the very classification of areas such as
"inadequate" can be based on common sense and discriminatory character, vetoing a space
to the most vulnerable social groups, that if they go through technological improvements can
come to make, suitable for a shopping-center or high-income housing. However, while
maintained as inadequate to occupation, such areas constitute an environmental liability.
However, they are maintained in this condition while the informal occupation is instrumental
for the urban productive sector, and environmental policy is primarily occupied by non-urban
environments, based on the belief that some ecosystems should be protected while others
could be appropriate for the urbanization and the productive sector.
In short, the fierceness of climatic variations (e.g. El Niño, La Niña), associated with a climate
change scenario, and the needs of the "new vulnerable" (social groups of medium and high
income), motivated the creation of a flood alert system, with incorporation of cities in the
forecast scope of meteorology, until then very focused on the needs of the agricultural
sector. In the cities, the emergence of disasters sustains the role of firefighters in the states,
associated with Civil Defense systems of municipal scope. This shows that politics have
much more a focus on emergency care than in preventive actions in terms of planning and
preparedness and response. From 2011 there was the Association of Risk Analysis to the

31
elaboration of the Planos DIretores Municipais, but the interdisciplinarity needed to
understand the limits and socio-environmental challenges of Brazilian cities was not
established, nor were they attacked central issues of the Brazilian development model that
produces and reproduces socio-environmental vulnerability.
The closest proximity to this debate between engineers and geologists, added to the reactive
way in which public management is based on media collections, has valued works and
investments, defined from an industrial hegemonic logic, which governs the conception of
the public administration and make understanding and low-cost approaches illegal. In
addition, the disclosure of budgets for prevention actions (for equipment acquisition,
construction work, infrastructure maintenance) is seldom fulfilled, exacerbating the problems
accumulated by the lack of articulation of the epistemological fields. The actions were not
completed in any of the directions, and the doctrine of emergency services of disasters
prevails, without discussion of solution to its causes, i.e. for an effective policy of planning
and prevention.
3. The design of the Risk Management Policy, advances and regressions in the current scenario
From the mobilization, especially in the technical and scientific means associated with the
visibility and the clamor that the disasters previously related caused, the Federal
government in the Lula period (2003-2010/14), characterized by the state' strong
performance, when the Ministry of Cities proposed a national policy for the organization of
actions and a risk management system. The approval of the 12.608/12 law that established
the National Policy of Protection and Civil Defense – PNPDEC (Brazil, 2012) was constituted
in a period still favorable to the creation of policies considered progressive on account of
instruments of social participation and sustainability-related issues (such as sanitation
policy, solid waste, and climate change). PNPDEC gained special prominence in the short,
faltering and fragile history of risk management in Brazil by pointing out the need to
incorporate disaster risk reduction actions in territorial management, urban planning and
other sectoral policies (Nogueira, 2008; Nogueira et al, 2014). From a technical point of
view, it brought positive aspects: the adoption of the watershed as a unit of analysis and
action for planning, the compulsory development of prevention plans by the three levels of
government, the creation of a National Register of Areas susceptible to the occurrence of
large-impact landslides, abrupt floods or related geological or hydrological processes, the
proposed integration with other sectoral policies, with an emphasis on prevention.
Law 12.608/12 foresees in its 6th item VIII: "To institute the National Plan for protection and
Civil Defense-PNGRD" (Brazil, 2012), extending its scope, to meet the country's pressing
demands, for the management of risks and disasters, with the inclusion of Risk prevention
effectively. Actually, this plan highlights the importance of the articulation of the various
actions, programs and policies focused on identifying and reducing threats, vulnerabilities
and natural and technological risks, by all levels and sectors of government, to achieve
qualification, Synergy and integrated planning, reducing losses and damage to populations,
infrastructure and the economy. The PNGRD points out action lines and procedures,
supported in principles and guidelines, for the full implementation of strategic programs and
actions, pathways for the development of a culture of risk reduction in the country and the
construction of a resilient society, in more harmonious coexistence with the environment.
However, the reductions of resources envisaged for their implementation were progressive,
with the changes that occurred within the framework of the legislative and the executive at

32
the federal level from the impeachment of President Dilma Roussef of the Workers' Party in
2016. Since then, the current period is characterized as a process of dismantling and
discontinuity in the creation and implementation of public policies, within the reduction of the
role of the State, especially after the validation of constitutional amendment 95 which fixes
a limit for public spending, and a dismantle social and corrective policies of the unequal and
unsustainable development model. Currently, Brazilian Congress holds several legislative
propositions that fully reshape important instruments used in regulation and environmental
management, as is the case of environmental licensing (Ciminelli, Momm, 2016).
In this context, the still fragile advances obtained by PNPDEC, can suffer setbacks further
worsening the Brazilian vulnerability in the face of disasters. It is highlighted that the 6th
National Conference of Cities (and its state and municipal preparatory), the Brazilian urban
policy procedure that seeks to approximate urban management, territorial and local
demands of the population has been cancelled by the federal government In December
2017 (Brazil, 2017), and that the National Council of Cities has been weakened since 2016.
The retreat in the discussion about the structural causes of urban problems supports the
maintenance of the focus on the risk as a physical problem, to be treated as an emergency.
The debate continues disarticulated even within the academy; research groups and risk
events do not dialogue with others dedicated to the study of the climate, or to urban studies
and still very far from the population. The emergency action in turn offers administrative
benefits such as the authorization of transfers of resources and of contracts in an
emergency, with dispensing of bidding processes. Everything indicates that this modus
operandi, established in authoritarian times of the twentieth century, still resounds valid in
the 21st Century.
Reference List
Acserald, Henri. (ed.) (2009) A duração das cidades: sustentabilidade e risco nas políticas
urbanas. Coleção espaços do desenvolvimento. Rio de Janeiro: Lamparina.
Aleksiévitch, Svetlana (2016) Vozes De Tchernóbil. São Paulo: Companhia das Letras.
Beck, Urick. (2010) Sociedade de risco. Rumo a uma outra modernidade. São Paulo:
Editora 34.
Brasil (2012) Lei federal nº 12.608, 10/04/2012. Institui a Política Nacional de Proteção e
Defesa Civil - PNPDEC; dispõe sobre o Sistema Nacional de Proteção e Defesa
Civil - SINPDEC e o Conselho Nacional de Proteção e Defesa Civil - CONPDEC; autoriza
a criação de sistema de informações e monitoramento de desastres; altera as Leis
nos 12.340, de 1o de dezembro de 2010, 10.257, de 10 de julho de 2001, 6.766, de 19 de
dezembro de 1979, 8.239, de 4 de outubro de 1991, e 9.394, de 20 de dezembro de 1996;
e dá outras providências. Brasília: Diário Oficial da União.
Brasil (2016) Plano Nacional de Adaptação à Mudança do Clima: sumário executivo /
Ministério do Meio Ambiente. Brasília: MMA.
Brasil, (2017) Decreto n. 9.076, 07/07/2017, sobre a Conferência Nacional das Cidades.
Brasília: Diário Oficial. Available at http://www.planalto.gov.br/ccivil_03/_ato2015-
2018/2017/decreto/D9076.htm
Bush, Amarílis; Amorim, Sônia (2011). A tragédia da região serrana do Rio de Janeiro em
2011: procurando respostas. ENAP Casoteca de Gestão Pública. Available at:
http://repositorio.enap.gov.br/bitstream/1/328/2/A%20trag%C3%A9dia%20da%20regi%C3

33
%A3o%20serrana%20do%20Rio%20de%20Janeiro%20em%202011%20procurando%20r
espostas.pdf
Cardona, Omar. Midiendo lo inmedieble. Indicadores de vulnerabilidad y Riesgo La Red -
Red de Estudios Sociales in Prevención de Desastres en América Latina, 2007. 5p.
http://www.desenredando.org/public/articulos/2007/articulos_omar/Midiendo_lo_inmedible
_ODC_LaRed.pdf . Acess: August 02nd, 2018.
Ciminelli, Paula; Momm, Sandra (2016). Alterações Normativas e Perspectivas para o
Licenciamento Ambiental no Brasil. In: Proceedings of the 3o Brazilian Impacts Evaluation
Congress, Ribeirão Preto. Available at
<http://docs.wixstatic.com/ugd/c54848_94c3ac424e894b61adc741ceb9c90f0e.pdf>
Douglas, M. (2012) Risco e Cultura, um ensaio sobre a seleção de riscos tecnológicos. São
Paulo: CAMPUS.
Jacobi, Momm-Schult, Bohn, N. (2013 Ação e reação. Intervenções urbanas e a atuação
das instituições no pós-desastre em Blumenau (Brasil). Eure, 39 (116), o.243-261. Available
at <http://dx.doi.org/10.4067/S0250-71612013000100010>
Klein, Naomi (2015) This changes everything. Capitalism vs. the Climate. Nova York:
Penguin Book..E-book
Momm, Sandra; Travassos, Luciana ;Grisa, G. ; Falcao, K.(2017) Análises comparativas
em planejamento e governança em um cenário de mudanças climáticas. In: Proceedings of
the XVII ENANPUR, São Paulo. Available at
http://docs.wixstatic.com/ugd/c54848_c0a37b66ed794bd9bdf0119acb0b903a.pdf
Nogueira, Fernando. (2008) A curta história da gestão de riscos ambientais urbanos. São
Paulo, UNESP, Geociências, v.27, n.1, p.125-126.
Nogueira, Fernando; Oliveira, Vanessa; Canil, Katia. (2014) Políticas públicas para gestão
regional de riscos: o processo de implantação no ABC, SP. Ambiente & Sociedade, São
Paulo, v. XVII, n. 4, p. 177-194, oct.-dec.
United Nations (2018) United Nations Office for Disaster Risk Reduction.Availble at
https://www.unisdr.org/who-we-are/history
Valencio, Norma; Siena, Mariana; Marchezini, Victor; Gonçalves, Juliano Costa (orgs.).
Sociologia dos desastres: construção, interfaces e perspectivas no Brasil. São Carlos: RiMa
Editora, 2009. 280p.
Valencio, Norma. (2014). Desastres: tecnicismo e sofrimento social. Ciênc. saúde coletiva
[online]. 2014, vol.19, n.9, pp.3631-3644. Available at http://dx.doi.org/10.1590/1413-
81232014199.06792014
http://www.desenredando.org/public/articulos/2007/articulos_omar/Midiendo_lo_inmedible_ODC_LaRed.pdf

34
Chapter 2.Climate change in Colombia
Liliana Delgadillo1, M. Cepeda1, Mauricio Hernández,1J. Hernández1, A. Muñoz2 and C.
Sánchez2
1Universidad de Ibagué (Colombia)
2Universidad de Tolima (Colombia)
Colombia is particularly vulnerable to climate change, given that the majority of the
population lives in the elevated Andes, areas prone to water shortages, flooding and
unstable land, and on the coast, where increases in sea levels and floods will likely affect
populated places and economic activities. In addition, the country presents a high
recurrence and magnitude of disasters associated to climate conditions.The Colombia's
Third National Communication on Climate Change envisages an increase in average
temperature of 1.6°C by 2070 with a rainfall reduced by 10 to 40% that will affect to 30% of
national territory(IDEAM, PNUD, MADS, DNP, & CANCILLERÍA, 2017).The country is
responsible of 0.46% of total global emissions, according to data from 2010, and exhibit
biogeographical conditions that are ideal for mitigation of climate change through
greenhouse gas sequestration and emission reduction. However, the greenhouse
gascontributions could have a tendency to grow. An increase in emission of 50 % by 2030
has been predicted, if no actions are taken(IDEAM et al., 2017).As shown in figure 1.
Figure 1. Climate projection and key climate impacts in Colombia
(Source:USAID Colombia, 2017a)

35
1. Background of climate change policy in Colombia
The Colombian adaptation agenda around climate change has become
increasinglyimportant in recent years in light of the global negotiation process and due to
greater national awareness.The country is a signatory of the United Nations Framework
Convention on Climate Change (UNFCCC), the Kyoto Protocol, and the Paris Agreements.
Like most countries in the region, Colombia has submitted one National Communication to
the United Nations Framework Convention on Climate Change (UNFCCC) in December
2001, laying out the actions that the government has already taken, the analytical basis
for its policy response to climate change and outlining its commitments to take future actions
within an official international framework(Gobierno de Colombia, 2015). The Communication
established the First National GHG Inventories for 1990 and 1994. It also presented the
actions done for mitigating of GHG emissions in Colombia, as well as vulnerability and
adaptation studies for the coastal area, water resources, agricultural sector and land
management.
Colombia has been developing important norms and legal instruments to face the
challenges of climate change within the framework supporting both mitigation and
adaptation actions. Among the adopted national norms, Law 1523 of 2012 implements the
National Policy on Disaster Risk Management and establishes the National Disaster Risk
Management System. In this norm,adaptation to climate change has been conceived as part
of the process of disaster risk reduction.Law 1715 of 2014promotes the development and
use of non-conventional sources of energy, mainly those of a renewable nature as a
necessary means for sustainable economic development, the reduction of emissions of
greenhouse gases and the security of energy supply.The country has also adopted public
policies by the National Council for Economic and Social Policy (CONPES), such as
CONPES 3242 of 2003 that implements the institutional strategy for environmental services
sale for mitigation of climate change, and CONPES 3700 of 2011 that contains the
institutional strategy for shaping policies and actions on climate change in Colombia. At the
same time, climate change issueshas been incorporated into several national policies, such
as the National Policy for integral management of water resources, the National Policy for
management of biodiversity and its ecosystem services and the National Policy for
management environmental soil, among others.
Colombia submitted its Intended Nationally Determined Contribution to the Secretariat of the
Convention on Climate Change in September 2015(Gobierno de Colombia, 2015).

36

37

38
It commits the country to reduce 20% of its GHG emissions by 2030,in case of further
international support, the country has enough international support, this reduction could be
increased to 30%(Florian, M. Pabón, G. Pérez, 2017).Furthermore, the actions to perform
the National Plan for climate change adaptation to 2030, can be prioritized as:
1. All regions will be covered by climate change plans, to be properly elaborated and implemented.
2. A national system of climate change adaptation indicators will be provided, in order to monitor and evaluate the implementation of adaptation measures.
3. Instruments of water resource management will be developed, embodying considerations on climate variability and climate change in the country's priority watersheds.
4. Climate change considerations will be included planning instruments and
innovative adaptation actions will be boosted in to six priority sectors of the
economy.
This contribution was incorporated into the Paris Agreement at end of 2015 and it entered
into force on November 4, 2016.
Finally, Decree 298 of 2016 proposed the creation, organization and operation of the
National Climate Change System (SISCLIMA). SISCLIMA is defined as an intersectional
scheme to facilitate and promote the formulation and implementation of policies, plans,
programs, methodologies, incentives and projects related to climate change, mainstreaming
climate into the design and planning of development projects in the country.
2. Climate change policy in Colombia
The Government of Colombia’s 2010-2014 National Development Plan listed climate
adaptation as a priority and established a National Climate Change System to improve
coordination among the institutions. Since 2014, a National Climate Change Policy has
focused on mitigation and adaptation actions by increasing resilience and achieving low
carbon development.In 2015, the Government of Colombia’s 2010-2014 submitted its
Intended Nationally Determined Contribution, which reiterates a commitment to adaptation
and resilienceefforts. A year later, the Government of Colombia’s 2010-2014 established the
Colombia National Climate Change Decree, which creates the Intersectional Commission
on Climate Change to implement and coordinate climate change efforts at the national level
and Regional Nodes for Climate Change for sharing regional efforts. In 2017, the
Government of Colombia’s 2010-2014 completed a National Climate Change Adaptation
Plan.

39
Figure 2. Strategies and instrument of National Climate Change Policy of Colombia
Source:(Florian, M. Pabón, G. Pérez, 2017)
The objective of the National Climate Change Policy is to incorporate climate change
management into public and private decisions, in order to advance in developing climate
resilient and low carbon economies, which reduce the risks of climate change and makes it
possible to take advantage of the opportunities that climate change generates(Florian, M.
Pabón, G. Pérez, 2017). This policy proposes a series of general and sectoral territorial
strategies, with a high impact for adaptation and mitigation. Furthermore, it introduces
guidelines for their articulation aiming to optimizing the combination of different criteria and
elements in the same territory.
The territorial proposed strategies are:
• Climate resilient and low carbon rural development
• Climate resilient and low carbon urban development.
• Climate resilient and conservation of ecosystem and their service.
Additionally, two sectoral strategies are proposed:
• Development mining and energy sectorswith low carbon and climate resilient
• Infrastructure development with climate resilient and low carbon.

40
Figure 3.Evolution of climate resilience in Colombia.
(Source: USAID Colombia, 2017b)
To implement these five strategies, appropriate instruments are required:
• Information, science, technology and innovation
• Education, training and public awareness
• Climate change management planning
• Financing and economic instruments.
The policy has also proposed a planning cycle for the actions. The cycle has begun with the
formulation of long-term national strategies:
• Colombia'slow-carbondevelopmentstrategy (ECDBC) (Estrategia colombiana de
desarrollo bajo en carbon)
• Nationalclimatechangeadaptationplan (PNACC) (Plan nacional de adaptación al
cambio climatico)
• National strategy for reducing emissions from deforestation and forest degradation
(ENREDD+) (Estrategianacional de reducción de emisiones y deforestación)
• National disaster risk management plan (Plan nacional de manejo del riesgo y
desastres)
• Financial protection strategy against disasters ( Estragia de financiacion de
protección contra desastres)
• National climate financing strategy; (estrategia nacional de fianciamiento del clima)
Table 1 - Action Lines of strategies in the National Climate Change Policy
Strategic line
Action lines
Rural development
with climate resilient
and low-carbon
▪ Promote agriculture, forestry and fisheries production to improve competitiveness and
food security.
▪ Generate and disseminate strategic agro-climatic information for development climate
resilient agriculture, climate insurance and early warning systems.

41
▪ Promote the efficient use of soil, low-carbon livestock intensification, reduction of
deforestation and technical assistance or technology transfer.
▪ In post-conflict scenarios, provide productive alternatives and access to land, in terms
of productive system resilient.
▪ Promote technologies and adaptation and mitigation options in agriculture, livestock,
agroindustrial and biofuel sectors.
▪ Promote a climate resilient, low-carbon, and territorial ordering in no-agricultural
sectors (i.e. tourism).
▪ Promote the sustainable forest management, sustainable use of natural resources and
restoration of degraded areas.
Urban development
with climate resilient
and low-carbon
▪ Provide urban resilient infrastructure to flooding or sea level rice (e.i. aqueduct and
sewerage systems).
▪ Reduce climate risk due to water shortage, through incentives for efficient water use,
losses reduction and unaccounted-for water.
▪ Provide an efficient and integrated public transport with low carbon and climate
resilient.
▪ Reduce the generation of solid waste. Promote the reuse, recycling and use of waste,
including energy recovery from waste and sanitary landfills.
▪ Encourage residential and non-residential energy efficient and promote green and
sustainable construction.
▪ Decrease exposure to floods and emission through to cities development compact and
interconnected way.
▪ Generate scientific knowledge for CO2 uptake by marine and coastal areas.
Management and
conservation of
ecosystem and their
services for
development with low-
carbon and climate
resilient
▪ Promote the conservation and restoration of terrestrial and marine-coastal ecosystems
that favor the adaptation to climate change of socioeconomic systems.
▪ Incorporate impact of climate change scenarios in the management, conservation and
restoration of the terrestrial and marine-coastal ecosystems.
▪ Incorporate in the territorial planning and sectoral development, actions of management
and conservation of the ecosystems and their services.
▪ Strengthen forest governance to prevent deforestation and forest degradation.
▪ Encourage the development of urban systems that save natural resources.
▪ Promote strategies and territorial agreements to resolve conflicts for access to
vulnerable environmental services between economic sectors and communities.
▪ Evaluate and strengthen the institutional capacity of environmental authorities.
Development mining
and energy sectors
with low carbon and
climate resilient
▪ Integrate policies, instruments and regulation on expansion of electricity supply,
adaptation objectives to climate events and low-carbon development measures.
▪ Evaluate biofuels use with low carbon footprint throughout their life cycle and prevent
their potential impacts on water resources, food security and biodiversity.
▪ Encourage the energy diversification through instruments and technologies with
benefits on GHG mitigation, air quality, climate resilience and energy security access.
▪ Promote the use of renewable energy sources complementary to non-renewable sources
in order to supply electric power in non-interconnected zones (ZNI).
▪ Improve the adequate fugitive emissions management that occur during mining and
hydrocarbon activities.
Infrastructure
development with
climate resilient and
low carbon
▪ Incorporate climate change consideration in design of transport infrastructure.
▪ Evaluate the vulnerability of current transport infrastructure and implement options to
reduce its climate risk.
▪ Promote share management of climate risk in public-private partnerships for
construction, concession and maintenance of transport infrastructure.

42
▪ Consider instruments to internalize the climate change costs in the transport sector (e.i.
carbon and emission tax).
Source: Florian, M. Pabón, G. Pérez, 2017
3. Progress toward climate resilience in Colombia
According to the National Unit for Disasters Risk Management, from 1998 to 2012, 90% of
emergencies in Colombia were related to hydro-climatological phenomenon. Therefore, it is
a priority to articulate the mitigation processes and efforts to be performed, including through
the identification of potential co-benefits and synergies with adaptation, in order to move
towards resilient and sustainable climate scenarios. Mitigation actions reduce the risk of loss
and damage as well as future adaptation costs; whileadaptation measures have co-benefits
in reducing emissions(Florian, M. Pabón, G. Pérez, 2017).
Colombia assumes its Intended Nationally Determined Contribution as an opportunity to
strengthen and build on the work done on sectorsand territories both in mitigation and in
adaptation to climate change. This will contribute to formulateintegrated policies, plans,
programs and projects, sharing with the different productive sectors,public and private
entities, non-governmental organizations and civil society in general(USAID Colombia,
2017).
Reference List
Florian, M. Pabón, G. Pérez, P. R. (2017). Política Nacional de Cambio Climático. Bogotá D.C.: Ministerio de medio ambiente y desarrollo sostenible - Colombia.
Gobierno de Colombia. (2015). Colombia’s INDC - UNFCC.
IDEAM, PNUD, MADS, DNP, & CANCILLERÍA. (2017). Resumen ejecutivo Tercera Comunicación Nacional De Colombia a La Convención Marco De Las Naciones Unidas Sobre Cambio Climático (CMNUCC). Tercera Comunicación Nacional de Cambio Climático.
USAID Colombia. (2017). Progress Toward Climate Resilience in Colombia.
IDEAM, PNUD, MADS, DNP, & CANCILLERÍA. 2017. Resumen ejecutivo Tercera Comunicación Nacional De Colombia a La Convención Marco De Las Naciones Unidas Sobre Cambio Climático (CMNUCC). Tercera Comunicación Nacional de Cambio Climático. Retrieved from http://documentacion.ideam.gov.co/openbiblio/bvirtual/023732/RESUMEN_EJECUTIVO_TCNCC_COLOMBIA.pdf
USAID Colombia.2017a. Climate Risk Profile Colombia. Retrieved from https://www.climatelinks.org/sites/default/files/asset/document/2017_USAIDCCIS_ClimateRiskprofile_Colombia.pdf
USAID Colombia. 2017b. Progress Toward Climate Resilience in Colombia. Retrieved from https://www.climatelinks.org/sites/default/files/asset/document/180322_USAID_Progress-Toward-Climate-Resilience-Colombia-timeline_English.pdf

43

44
Chapter 3. The resilience framework in Chile Cristián Henríquez, Jonathan R. Barton & Valeria Fuentealba
Universidad Pontificia Católica de Chile
The increasing frequency of extreme events, such as flooding, landslides and coastal storm
surges, have highlighted the fragility of urban areas in the face of climate change(IPCC,
2012, 2014; UN-Habitat, 2011). The climate change impacts projected for Chile include a
generalised increase in temperatures and a reduction in rainfall over the next decades
(Fuenzalida, Falvey, Rojas, Aceituno, & Garreaud, 2006), although the variations across the
national territory due to its longitudinal extension and strong gradients on the east-west axis,
from the Andes to the coast. Despite the threats and the diversity of conditions however,
there is little evidence that cities have adopted resilience as a strategy for development to
face these impacts, in spite of the high concentration of population (88%) in urban areas
(INE, 2018).
Resilience can be understood as the capacity of socio-ecological systems to adjust and
adapt in the face of natural and socio-economic perturbances at larger scales, and the
resulting ability to return structures and functioning to a stable state, in as short a timescale
as possible and better prepared for a future event. This takes into account considerations
such as knowledge of the causes of the changes, the consequences of them and the
preparations by individuals, communities and institutions, the capacity to absorb these
impacts, the robustness of physical installations, and the strength of social networks and
governance arrangements(Gallopín, 2006; UNISDR, 2009).If adaptation to climate change
is understood as the processes that are associated with the required transformations,
resilience is the condition that is generated; consequently, better adaptation processes lead
to greater resilience.
In the Chilean case, rather than effective resilience in the face of adverse climate impacts,
especially extreme hydro-meteorological events and drought, most capacity is reactive in
origin (Pelling, 2010), which replicates a common historical precedent, whereby many cities
have had to recover and reorganise following significant riskevents(Barton & Irarrázaval,
2016).To this can be added the fact that the most socio-economically vulnerable social
groups are those most affected by these events. This reveals the fragility of urban areas and
the weak or inexistent governance arrangements of formal or informal systems of social
regulation, to combat these threats, or to anticipate and recover from them effectively
(Henríquez, 2018).
The following chapter briefly reviews the Chilean urban system, followed by the principal
instruments and urban resilience strategies at the national level. Some examples are
introduced from the coastal zone before concluding with some key observations and
recommendations.

45
1. The Chilean urban system in the face of climate change impacts
Chile is a largely urban country in a highly urbanised region. It is also highly centralized.
Recent census data show that the Santiago metropolitan areas continues to be the most
important hub in the Chilean urban system, concentrating not only the bulk of the population
(45%, or6.220.197 people), but also the principal economic activities (or at least their
headquarters and the declaration of their contribution to GDP). Following Santiago, the most
important conurbations are Greater Valparaíso and Greater Concepción that have 866.268
and841.861 inhabitants respectively. Finally, there is a network of smaller cities of between
50.000 and 500.000 people that represent 29% of the national urban population, with the
cities of Paine-Hospital, Mejillones andPozo Almonte registering the highest increases –
over 40% - during the intercensal period2002-2017(INE, 2002, 2018). In spite of the fact
that, proportionally, it is the intermediate cities that have shown the highest urbanization
rates over the past two intercensal periods, it is still the traditional metropolitan areas that
dominate the national urban profile.
The lack of explicit consideration of climate change effects in cities has been evident in the
ways in which these cities have expanded over recent decades, with increasing use of
designated risk areas and other areas where there has been a consolidation of heat island
effects, loss of green space, degradation of natural areas, and a generalized increase in
urban vulnerability. One explanation for this is the lack of adequate planning for climate
change, also the lack of a national urban development policy from 1985until 2014 (the former
having been approved under dictatorship). The new policy is not explicit regarding the
importance of climate change however, preferring to outline a wide range of anthropic and
natural risks facing cities and noting need to incorporate these into planning instruments
(MINVU, 2014).
Generally speaking, these impacts have not been dealt with in detail in public policies, since
much of the focus has been on the reduction of greenhouse emissions and other mitigation
measures, with an emphasis on how mitigation can also favour – through co-benefits – the
challenges of poor air quality that are faced by a large number of cities up and down the
country (during the second government of Michelle Bachelet, 2015-18, 14 local air
contamination reduction plans were approved and implemented). In this regard, the Ministry
of Environment initiative to create an Emissions and Contaminants Register is worth noting,
also the MAPS Project with its objective of pushing the country towards a low carbon
development path(Henríquez, Smith, Qüense, Villarroel, & Treimun, 2018), also other
proposals promoted by the UN at the regional scale (Ruiz Tagle & Jordán, 2013; Sánchez
Rodríguez, 2013).
Despite these initiatives however, and given the urban predominance in the country, it is
adaptation to climate change that concentrates – or should concentrate – most concern
among authorities and communities. Wildfires, flooding, landslides, storm surges, among
other events, are the impacts that are leading to severe damage to the stability of the urban
system and put at risk the effective implementation of the national urban development policy
(MMA, 2014, 2018a).

46
Risk management instruments in Chile tend to more reactive rather than preventative or
adaptative
(IPCC, 2014; Pelling, 2010). In certain ways, disasters have defined public policy
innovations in urbanisation, reconstruction and urban renovation, including the earthquakes
of Talca, Chillán and Valdivia that influenced building regulations (Arenas, Lagos, & Hidalgo,
2010). This explains why the 27 February 2010 earthquake generated such little impact in
terms of loss of life from damage to buildings and the urban fabric. Despite these positive
responses to earthquakes however, implementation of measures to increase resilience to
climate change remain weak. For example, the national report of the Chilean government to
the Habitat III forum in Quito in 2016 highlighted the fact that the country has important
exposure to natural and anthropogenic risks, as evident in a series of events over the
previous decade. Consequently, the incorporation of specific measures in urban and
regional planning insturments remains an essential step for facing the challenges of climate
change. This should involve the approach based on resililence in order to reduce and
mitigate impact sas well as instituting systems and processes for recovery and repair
(Gobierno de Chile, 2016).Chile is not the only countries in this situation in the region, since
the Declaration of Quito in October 2016 – The New Urban Agenda - emphasised the
importance of increasing resilience through adaptation measures (UN-Habitat, 2016).The
Regional Action Plan developed during 2017 – led by UN ECLAC – emphasised that climate
change is now a priority for sustainable urban development (CEPAL, 2017).
For Chilean cities, these events are increasingly important, for example in the number of
events that have been registered over recent decades that have led governments to declare
‘catastrophe zones’ or significant damage. According to a study by Henriquez et al (2019),
in the regional capitals of the country, there have been more than 700 disaster events over
the past fifty years. For example, in coastal cities, such as Concepción, flooding events and
storm damage have been particular intense and damaging.

47
Figure 1. Climate-related disasters registered in regional capitals, 1965-2015,
according to disaster zone declarations and news sources.
Source: Henríquez etal.(2019).
2. Chilean urban resilience strategies and instruments
The most important public policy on climate change at the national level relates to the
National Climate Change Adaptation Plan from 2014, which was generated as a result of
the National Climate Change Action Plan (2008-12). This document, produced by the
Ministry of Environment, was approved by the Council of Ministers for Sustainability and
Climate Change on 1 December 2014 (MMA, 2014) and is valid for the period 2015-2019.
Although it does not emphasise urban resilience per se, it is centred on the concepts of
efficiency and management of the risks that directly or indirectly influence it. The plan
includes a conceptual framework and guidelines for adaptation in Chile, articulating the need
for specific plans in the following sectors: agriculture and forestry, biodiversity, fisheries and
aquaculture, health, infrastructure services, and cities (MMA, 2018b).
Also at the national level it is important to highlight the Intended Nationally Determined
Contribution (INDC) of Chile towards the Climate Agreement of Paris 2015 and the Third
National Communication on Climate Change to the United Nations Framework Convention
on Climate Change (2016). Both reports were developed by the Ministry of
Environment(MMA, 2015, 2016)and the emphasis is principally on mitigation and proposals
for certain energy-intensive sectors.Despite the urgency of adaptation, as experienced by
the prevalence of catastrophic events, e.g. drought, wildfires and flooding (Centro de Ciencia
del Clima y la Resiliencia (CR2), 2015; de la Barrera, Barraza, Favier, Ruiz, & Quense,

48
2018), both reports are weak in terms of adaptation in relation to the emphasis on mitigation;
in the INDC (INDC, 2015), only 3 of over 30 pages are dedicated to adaptation measures.
From the perspective of risk management, it is also relevant to note the DIPECHO Action
Plan for South America 2011-2012, which provides a general vision of current risk
conditions, including threats, vulnerability and capacities present in the country (Khamis &
Osorio, 2012); this report updates the Análisis de lascondiciones de riesgoen
Chilepresented in 2010.More recently, the National Policy for Disaster Risk Management
(ONEMI, 2016), has the objective:“to grant the Chilean State an instrument or framework to
allow it tocarry out integral disaster risk management, linking general policy with transversal
policies and sectorial policies, and within which the actions of prevention, response and
recovery can be carried out in the framework of sustainable development in the event of any
disaster”.This policy prioritises five strategic areas linked to the Hyogo Action Plan. In the
area of institutional strengthening, the National Platform for Disaster Risk Reduction,
coordinated by the ONEMI (National Emergency Office), and Disaster Risk Management in
policies, strategies, and sectoral and spatial plans, at all levels of political administration.
Although this was formerly designed in the light of the Hyogo conference, and more recently
the Sendai Strategy, it is important to emphasise the synergies that exist between both
agendas (risk and climate change) in terms of strengthening urban resilience. It is precisely
this need to link agendas of development, disasters and climate change that forms the basis
of the IPCC special report on extreme events (IPCC, 2012).
In urban areas, without doubt the most notable advance in terms of policy has been the 2018
approval of the Climate Change Adaptation Plan for Cities (2018-22). This plan is
coordinated by the Ministry of Environment and has the objective of “proposing adaptation
guidelines for cities in the face of climate change, strengthening, with a prospective vision,
the capacity of inhabitants to respond to different impacts, with a view to improving spatial
equity.”(MMA, 2018a). The specific objectives are as follows:
1. To engage with climate change from a territorial perspective, through urban planning and land use.
2. To generate investments and projects that take climate change into account, improving adaptation capacity in cities.
3. To develop capacities to prevent climate change impacts and devise response mechanisms for climate change effects in urban areas.
4. To promote coordination and cooperation to confront the different effects of climate change in cities.
5. To strengthen training, and the development of research and dissemination, that are necessary for implementing actions for climate change adaptation.
There are five strategic areas and ten lines of action relating to: Urban planning and land
use; Sustainable infrastructure and construction; Reduction and management of disaster
risk associated with climate change; Local management and interinstitutional collaboration;
and Dissemination. Various of the 35 measures and actions are based on urban resilience
and sustainability. For example, measure 7 on strengthening climate change adaption
through public infrastructure investment, measure 24 on strengthening intersectoral

49
coordination to deal with urban climate change challenges, measure 27 on actions for
environmental sustainability in the context of climate change in intermediate cities (based
on the IADB ICES experience), and measure 28 on promoting actions for reduce disaster
risk in neighbourhoods. All these measures propose specific results, timings and
responsibilities, where the local level plays a strategic role in urban and territorial resilience.
Although there are objectives associated with cities in previous plans, e.g. the integration of
climate change in land use plans, and the reduction of risks in coastal settlements (from
storm surges and rising sea level), both in the National Climate Change Action Plan of 2008,
progress was slow and weak, as documented in the mid-term evaluation of the Plan. This
new sectoral Plan, which is clearer in terms of details of responsibilities of local government
and the Ministry of Housing and Urbanism, constitutes a first initiative in prioritising urban
resilience to climate change in Chile.
3. Experiences and practice
In spite of the delay in generating a sectoral urban policy, there have been different initiatives
set in motion in the meantime. One of the more interesting responses at the urban level in
Chile is the 100 Resilient Cities project of the Rockefeller foundation, applied to Santiago
through the Resilience Strategy: Human and Resiliente Santiago, led by the Metropolitan
Region Intendent in 2017.It is a resilience strategy centred on climate change and risk areas,
including adaptation and mitigation. The conceptual framework of the initiative proposes
measuring the capacity of the city for maintaining its operations, adaptation and behavioural
change once confronted by an event.The following impacts are noted in the strategy: (1)
geophysical phenomena such as deep (subduction zones) or surface earthquakes (the San
Ramón fault), also volcanic eruptions; (2) extreme climatic phenomena such as flooding and
drought cycles, which affect the greater part of the Metropolitan Region;(3) landslides as a
result of heavy rainfall in urban areas built in risk zones;(4) wildfires in rural areas of the
region. This proposal is not a legal instrument as such, since the official strategic plan is the
Regional Development Plan (to 2021) (Equipo de Resiliencia Santiago Resiliente,
2017).Another international initiative is the InterAmerican Development Bank (IADB) project
CiudadesEmergentes y Sostenibles, that promotes local assessment, an indicator set and
an emphasis on linking specific urban initiatives to a sustainability strategy. In Chile, two
cities have benefited from support through this project: La Serena and Puerto
Montt.Adaptation to climate change is present in both of these city strategies.
In terms of municipal government, the work of Adapt-Chile is most relevant since this NGO
has coordinated activities in urban localities (Adapt-Chile, 2018).Financed by national and
international multilateral organisations that include the EU, CEPAL, GIZ, FCIL, the Ministries
of Energy and Environment, and the Avina Foundation,Adapt-Chile is a non-profit that was
set up in January 2013 with the objective of promoting climate change integration into local
government decision-making, to improve local responses. The work of this organisation is
focused on local governments but it has also collaborated with other government tiers, firms
and academic centres.Although focused on Chile it has carried out similar work in other
countries in the region.
50
Its most important contribution is the organisation and coordination of the Chilean Network
of Municipalities against Climate Change(www.redmunicc.cl) which currently accounts for
46 local governments in 15 regions of the country. Other projects involve: the generation of
local capacities, with special emphasis on tools and methodologies for technical personnel;
improving science-policy dialogue through communication and collaboration bridges
between academics and decision-makers in local and regional government; critical analysis,
design and formulation of public policies and governance arrangements for climate change;
and the generation of spaces to make the strategic role of local governments more visible,
such as the Forum for Mayors against Climate Change (Adapt-Chile, 2018).The experience
of this ONG in knowledge transfer and adaptation capacity building has resulted in it
becoming the most relevant actor in this field in Chile, and also an important player in the
region.
In terms of research, there are different national academic centres that have engaged with
climate change issues. Three of these, which have ‘priority area’ funding from the National
Science and Technology Council, are CR2, CEDEUS and CIGIDEN. The Center for Climate
and Resilience Research (CR2),based at the Universidad de Chile, works on improving
knowledge on climate systems as well as increasing resilience to change in the national
context.Although not a central part of its activities, the Center for Sustainable Urban
Development (CEDEUS), which links researchers at the Pontificia Universidad Católica de
Chile and the Universidad de Concepción, focuses on urban transformations in which
climate change is increasingly relevant, whether in connection to urban energy efficiency
and emissions, or expansion onto risk zones (CEDEUS, 2018).The third of these centres,
CIGIDEN (Integrated Management of Natural Disasters) is focused on knowledge for
responding effectively to extreme natural events, through preparation, response, recovery
and mitigation (CIGIDEN, 2018); climate change impacts are an important contributor to this
list of events. While CR2 generated a key policy paper relating to the ‘mega-drought’ in the
country, CEDEUS has worked with local governments on measuring their carbon footprint,
while CIGIDEN co-produced – with the National Commission for Resilience to Natural
Disasters (CREDEN), the National Council for Innovation in Development (CNID) and other
public and private organisations – the National Strategy for Research, Development and
Innovation for a Chile resilient to natural disasters(CREDEN, 2016).
Similarly important, and operating over a longer period of time is the UC Global Change
Center.This centre brought together researchers across the Pontificia Universidad Católica
de Chile, who were working on biophysical and human climate change-related issues,
dissemination, continuous education, and links to other stakeholders(CCG UC, 2018). It has
drafted several of the government adaptation and mitigation plans at the national and
sectoral levels.Other research projects that are worthy of mention, and that relate to the
Santiago Metropolitan Region specifically, are Risk Habitat Megacity (RHM), Climate
Adaptation Santiago(CAS) and the MAPA project (vulnerability and adaptation to climate
change variability in the Maipo Basin).
RHM was financed by the German federal government in order to generate inputs for public
decision-making around strategic planning of the Santiago Metropolitan Region, in particular

51
the Regional Development Strategy of 2010(Helmholtz-Association, 2011). The principal
problem that it faced was the stability of the public sector political representatives: there
were 5 Intendents during the five-year duration of the project, and there was also a transfer
problem at the end of the project when the results were not incorporated into the new
Development Strategy in a systematic way given the change of national government in 2010.
The CAS project was linked to RHM with many of the researchers in the Helmholtz
Association, the Universidad de Chile and the Pontificia Universidad Católica de Chile taking
their work from RHM to concentrate on the challenge of adaptation to climate change. The
objective was to devise a participatory process, informed by scientific research, to generate
an adaptation plan for Santiago, focusing in the themes of vulnerability, water and
energy(CAS, 2013; Krellenberg & Hansjürgens, 2014). The final plan of 14 measures was
supported by a 10-session participatory process with a large number of stakeholder
organisations, and it was presented to the Intendent in December 2013(Barton, Krellenberg,
& Harris, 2015). Unfortunately, the following year was also an electoral year and the
government changed hands once again.The plan would not be taken up by the new
government. While CAS focused more on the urban area of the Metropolitan Region, the
MAPA: Maipo adaptation plan (2012-2015 project developed by Centro de Cambio Global
UC and financed by the Canadian Development Agency (IDRC), put more emphasis on
basin-wide processes and modelling of water demand and supply across different sectors.
Widespread participation was also a feature of this project, with workshops and
roundtables(MAPA Maipo: Plan de Adaptación, 2017). As with the other projects, the final
products were not explicitly incorporated into regional policy, however the findings have
been influential in other policy documents in which these researchers have been involved,
with the Ministry of Environment in particular.
Finally, it is important to note that the proposal for the protection of urban wetlands is also
highly relevant for urban resilience.Coastal wetlands in particular provide critical ecosystem
services for controlling flood events and, as green infrastructure, have a role in mitigating
climate change impacts. Nevertheless, currently they have no official recognition on spatial
planning instruments, being considered as part of urban expansion zones, leading to
draining and indiscriminatein-filling. In 2018, a debate was generated on a Law for Urban
Wetlands Protection in the Senate Commission on Environment and National Property. This
law would require changes to the general laws on Environment, and Urbanism and
Construction(Martínez, 2018). The problems associated with the loss of wetlands to urban
development are documented in Section II. b) Natural resources management and
resilience.
Conclusions
One of the most significant challenges that has been identified in terms of the application of
adaptation mechanisms is that of governance arrangements. As can be seen in the
examples of adaptation initiatives, there is a lack of continuity in public authorities and an
absence of stable networks of coordination between different key actors. This in turn is one
of the principal weaknesses for implementing strategies for resilience.

52
There are also difficulties in articulating private sector actors in adaptation and risk
management proposals.This accentuates further the issue of governance and intersectoral
coordination, especially in terms of the management of risk cycles: mitigation, preparation,
early warning systems, recovery, and response. Privatisation has left much critical
infrastructure in the hands of private firms (water supply, sewerage, electricity, etc.), which
can generate problems in terms of urban sensitivity and fragility, in relation to decisions
relating to short-term accumulation versus longer-term public goods(Henríquez, 2018).The
influence of private firms can also be seen in the Rockefeller-financed 100 Resilient Cities
strategy (2012-2021), generating tensions and confusion in terms of formal strategic
planning instruments.
In summary, it is vital that urban climate diagnostics in Chile are improved, also the
coordination of stakeholders through governance arrangements, especially in cities
comprised of more than one municipality. This is essential for channeling and managing the
necessary actions for participative adaptation measures for promoting more sustainable and
resilient cities. Following a decade of partial and fragmented initiatives in the field of urban
development in the country, with regards to climate adaptation and increased urban
resilience, the approval of the Adaptation Plan for Cities in March 2018 marks a turning point
in the incorporation of the impacts of climate change in urban area planning and
management. It will also provide a context for generating synergies with the national risk
reduction agenda and the urban development policy.
Reference List
Adapt-Chile. (2018). Adapt Chile Resiliencia la Cambio Global. Recuperado a partir de http://www.adapt-chile.org/esp/
Arenas, F., Lagos, M., & Hidalgo, R. (2010). Los riesgos naturales en la planificacion territorial. Santiago de Chile: Centro de Politicas Públicas UC.
Barton, J. R., & Irarrázaval, F. (2016). Adaptación al cambio climático y gestión de riesgos naturales: buscando síntesis en la planificación urbana. Revista de geografía Norte Grande, (63), 87–110. https://doi.org/10.4067/S0718-34022016000100006
Barton, J. R., Krellenberg, K., & Harris, J. M. (2015). Collaborative governance and the challenges of participatory climate change adaptation planning in Santiago de Chile. Climate and Development, 7(2), 175–184. https://doi.org/10.1080/17565529.2014.934773
CAS. (2013). Climate Adaptation Santiago. Recuperado a partir de http://www.ufz.de/climate-adaptation-santiago/index.php?en=19724
CCG UC. (2018). Centro de Cambio Global UC. Recuperado a partir de http://cambioglobal.uc.cl/
CEDEUS. (2018). Centro de Desarrollo Urbano Sustentable. Recuperado a partir de https://www.cedeus.cl/
Centro de Ciencia del Clima y la Resiliencia (CR2). (2015). La Megasequía 2010-2015: Una lección para el futuro. Santiago de Chile.

53
CEPAL. (2017). Panorama multidimensional del desarrollo urbano en América Latina y el Caribe. (L. Montero & Johann García, Eds.). Santiago: Comisión Económica para América Latina y el Caribe (CEPAL).
CIGIDEN. (2018). Centro de Investigación para la Gestión Integrada del Riesgo de Desastre. Recuperado a partir de http://cigiden.cl/es/
CR2. (2018). Center for Climate and Resilience Research. Recuperado a partir de http://www.cr2.cl/
CREDEN. (2016). Hacia un Chile Resiliente frente a Desastres: Una Oportunidad. Estrategia Nacional de Investigación, Desarrollo e Innovación para un Chile resiliente frente a desastres de origen natural. Santiago de Chile: Secretaría Ejecutiva del Consejo Nacional de Innovación para el Desarrollo.
de la Barrera, F., Barraza, F., Favier, P., Ruiz, V., & Quense, J. (2018). Megafires in Chile 2017: Monitoring multiscale environmental impacts of burned ecosystems. Science of the Total Environment, 637–638, 1526–1536. https://doi.org/10.1016/j.scitotenv.2018.05.119
Equipo de Resiliencia Santiago Resiliente. (2017). Estrategia de Resiliencia, Región Metropolitana: Santiago Humano y Resiliente. Santiago de Chile: Intendencia Region Metropolitana de Santiago.
Fuenzalida, H., Falvey, M., Rojas, M., Aceituno, P., & Garreaud, R. (2006). Estudio de la variabilidad climática en Chile para el siglo XXI. Informe final CONAMA, 71.
Gallopín, G. C. (2006). Linkages between vulnerability, resilience, and adaptive capacity. Global Environmental Change, 16(3), 293–303. https://doi.org/10.1016/j.gloenvcha.2006.02.004
Gobierno de Chile. (2016). Chile Informe Nacional Habitat III. Santiago de Chile: Ministerio de Vivienda y Urbanismo.
Helmholtz-Association. (2011). Risk Habitat Megacity. Recuperado a partir de http://www.ufz.de/risk-habitat-megacity/index.php?en=15003
Henríquez, C. (2018). Resiliencia Urbana. En E. CEDEUS (Ed.), Camino a Ciudades Sustentables. Aportes desde la investigacion a las politicas publicas urbanas en Chile (Informe de, pp. 73–79). Santiago de Chile: CEDEUS.
Henríquez, C., Qüense, J., Villarroel, C., & Mallea, C. (2019). 50-years of climate extreme indices trends and inventory of natural disasters in Chilean cities (1965-2015). En C. Henríquez & H. Romero (Eds.), Urban climate in Latin American (p. (press)). Springer International Publishing. https://doi.org/10.1007/978-3-319-97013-4
Henríquez, C., Smith, P., Qüense, J., Villarroel, C., & Treimun, J. (2018). Índices Climáticos Extremos y de Confort en Ciudades Costeras Chilenas. En R. Hidalgo, C. Martínez, C. Henríquez, F. Arenas, N. Rangel, & M. Contreras (Eds.), La zona costera en Chile: adaptación y planificación para la resiliencia (p. (en prensa)). Santiago de Chile: GeoLibro, PUC.
INDC. (2015). Intended Nationally Determined Contribution of Chile towards the Climate Agreement of Paris, 2015. Santiago de Chile.
54
INE. (2002). Censo de Población y Vivienda 2002. Santiago de Chile: Instituto Nacional de Estadísticas.
INE. (2018). Entrega Final Censo 2017. Santiago de Chile: Instituto Nacional de Estadísticas.
IPCC. (2012). Managing the Risks of Extreme Events and Disasters to Advance Climate Change Adaptation. Summary for Policymakers. Intergovernmental panel on Climate Change Spacial Report on Managing the Risks of Extreme Events and Disasters to Advance Climate Change Adaptation, 30. https://doi.org/10.1017/CBO9781139177245
IPCC. (2014). Fifth Assessment Report: Impacts, Adaptation and Vulnerability. New York.
Khamis, M., & Osorio, C. (2012). Análisis de riesgos de desastre en Chile. VII Plan de Accion Dipecho en Sudamérica 2011-2012. Santiago de Chile: UNESCO.
Krellenberg, K., & Hansjürgens, B. (2014). Climate adaptation Santiago. Climate Adaptation Santiago. https://doi.org/10.1007/978-3-642-39103-3
MAPA Maipo: Plan de Adaptación. (2017). Vulnerabilidad y Adaptación a la variablidad del clima y cambio climático en la cuenca del Maipo. Recuperado a partir de http://www.maipoadaptacion.cl/
Martínez, C. (2018). Por qué una de Ley de Humedales Urbanos. Recuperado 9 de agosto de 2018, a partir de http://www.elmostrador.cl/noticias/opinion/2018/06/27/por-que-una-de-ley-de-humedales-urbanos/
MINVU. (2014). Política Nacional de Desarrollo Urbano. Santiago de Chile.
MMA. (2014). Plan Nacional de Adaptación al Cambio Climático. Santiago de Chile: Ministerio de Medio Ambiente.
MMA. (2015). Contribucion Nacional Tentativa de Chile (INDC) para el Acuerdo Climatico Paris 2015. Santiago de Chile: Ministerio de Medio Ambiente.
MMA. (2016). Chile’s Third National Communication on Climate Change to the United Nations Framework Convention on Climate Change. Santiago de Chile: Ministerio de Medio Ambiente.
MMA. (2018a). Plan de Adaptacion al Cambio Climatico para Ciudades 2018 ‐ 2022.
Santiago de Chile: Ministerio del Medio Ambiente.
MMA. (2018b). Plan Nacional de Adaptación al Cambio Climático y Planes Sectoriales.
ONEMI. (2016). Política Nacional para la Gestión de Riesgo de Desastres. Santiago de Chile: ONEMI Ministerio del Interior y Seguridad Pública.
Pelling, M. (2010). Adaptation to Climate Change: From resilience to transformation. London: Routledge.
Ruiz Tagle, M. T., & Jordán, R. (2013). Estrategias de desarrollo bajo en carbono en megaciudades de América Latina. Santiago de Chile. Santiago de Chile: CEPAL.
Sánchez Rodríguez, R. (2013). Respuestas urbanas al cambio climático en América Latina.

55
Santiago de Chile: CEPAL-IAI.
UN-Habitat. (2011). Cities and Climate Change: global report on human settlements. London, Washington, DC: United Nations Human Settlements Programme.
UN-Habitat. (2016). La Nueva Agenda Urbana. Quito.
UNISDR. (2009). 2009 UNISDR. Terminologia sobre Reduccion del Riesgo de Desastres. Ginebra: Estrategia Internacional para la Reducción de Desastres de las Naciones Unidas (UNISDR). Recuperado a partir de https://www.unisdr.org/files/7817_UNISDRTerminologySpanish.pdf

56
Chapter 4. Institutional Framework of Climate Change in
Ecuador
Oswaldo Zea Moscos and Victor Arias Bejarano
Universidad UTE (Ecuador)
Introduction
The following section presents the main frames used for the topic of climate change in the
country of Ecuador. All the instruments base their strategies on the National Development
Plan called “Toda una vida”. The main instruments and strategies used for adaptation,
mitigation and resilience to climate change in the different regions of Ecuador are detailed
as well.
1. Institutional strategic plan 2018-2021
The goal of the plan is the administration of the National Decentralized System of
Participatory Planning (SNDPP) in order to contribute to the economic growth and
sustainable development of the country.This plan considers that state institutions and the
cycle of public policies must be consolidated.The strategic objectives are developed to be
aligned with the national development plan, which are valid until 2021.
Regarding the organizational structure, the Regional Undersecretaries main task is to direct
and coordinate the zonal planning within the framework of the National Competencies
System and the SNDPP, and to promote social participation in the different processes that
the National Secretary of Planning and Development (SENPLADES) has in charge.

57
Figure 1: Methodological structure for monitoring and evaluation of the Institutional Strategic Plan Source: Adapted from General Coordination of Planning and Institutional DevelopmentManagement: Institutional Planning and Monitoring and Social Communication
2. National development plan 2010-2021 “toda unavida”
The National Development Plan 2017-2021 which is called "Todaunavida" (A lifetime) is the
first planning tool that addresses governance for compliance with government programs and
the achievement of national goals; this instrument is structured as follows:
Figure 2: General Structure of the National Development Plan 2017-2021 Source: Adapted from National Development Plan 2017-2021 LIFETIME Preparation: Senplades
The National Development Plan (2017-2021) was built on the Government Program of
President Lenin Moreno Garcés, entitled "An Agenda for society, education, production, and
decent work"(Senplades, 2017). Such project is supported by 12 revolutions which are
included in this plan. These 12 revolutions stablish the major themes of the public agenda
during the corresponding period and are described in the following list:
• Political and Ethic
• Economic

58
• Production and Labor
• Rural and Social
• Ecological
• Knowledge and Skills
• Cultural
• Justice
• Security and Coexistence
• Urban and Territories
• Sovereignty and Integration
• Youth Similarly, the National Plan has been directed to comply with the proposals made by the
government during the electoral campaign, including a set of emblematic interventions such
as the “Toda unavida” Plan or “MingaAgropecuaria” Plan. These instruments were created
to address critic topics and to seek for specific outcomes, which respond to the reality of the
country and to improve the living conditions of people (especially those who need it most).
The SNDPP center its content in compliance processes. It specifies the institutions, the
instruments and the tools for planning and management that allow the interaction of the
different social and institutional actors. All of these objects are detailed to organize and
coordinate development planning which is required at all levels of government.2
The National Spatial Strategy is complementarily defined as "the expression of national
public policy in the territory and is an instrument of territorial planning at national level,
including the criteria, guidelines, and action guidelines on land management, natural
resources, its great infrastructure, human settlements, economic activities, great facilities,
and the protection of natural and cultural heritage.This strategy is based on national
objectives and policies contained in the national Development Plan. The Strategy will
contain specific policy guidelines for border areas, the Amazon, the Galapagos special
regime and the coastal marine territory, without detriment to its national character "3
The National Spatial Strategy is incorporated into the National Development Plan to
enhance the capabilities of the territories, articulate the interventions to the national
objectives and define specific guidelines for the deconcentrated and decentralized public
action. This means, harmonious coordination between national and subnational planning
through multilevel governance; and implementation of effective, participatory and permanent
mechanisms for monitoring, evaluation and accountability. Therefore, the National
Development Plan (2017-2021) has become the instrument that articulate and bind all
elements of governance in Ecuador and enables coordination between the Central
Government and the autonomous decentralized governments 4 . However, beyond their
technical functions, the Plan and its National Spatial Strategy are instruments for social and
2Constitution of Ecuador, Art. 279, 2008
3 Organic Law on Territorial Planning, Land Use and Management, 2016
4Constitution of Ecuador, Art. 280, 2008

59
political dialogue, through which we can identify similarities and agree on a joint work for the
benefit of all.
National Development Objectives
Axis 1: Rights for All throughout life
Objective 1: To ensure a decent life with equal opportunities for all people
Objective 2: To affirm intercultural and multinational, revaluing the different identities
Objective 3: To guarantee the rights of nature for present and future generations
Axis 2: Economy in the Service of Society
Objective 4: To consolidatethe sustainability of economic and social solidarity system, and
strengthen dollarization
Objective 5: To promote productivity and competitiveness for sustainable economic growth
and solidarity redistributive way
Objective6: To developproductive capacities and environment to achieve food sovereignty
and rural Good Living
Axis 3: More society, better State
Objective7: To encourage a participatory society, with a close to the service of citizenship
State
Objective8: To promote transparency and responsibility for a new social ethic
Objective 9: To guarantee sovereignty and peace, and strategically position the country in
the region and the world
3. Organic environment code (coa)
This code aims to establish the legal and institutional framework for planning, coordinating,
and monitoring public policies in order to design, manage and execute local, regional and
national actions on adaptation and mitigation of climate change transversely, timely,
efficient, participatory, coordinated and articulated with the international instruments ratified
by the State and the principle of common but differentiated responsibility.
National policies in this area will be designed to prevent and respond to the effects of climate
change and contribute to global efforts against this anthropogenic phenomenon.
The articles detailed inthis code define actions to promote care and adequate responses to
climate change, generating policies and procedures that help to fulfill the objectives

60
proposed by this code.5 Article 248 determines the state's objectives on climate change
which are:
1. To prevent and avoid the occurrence of environmental damage and thereby reduce the effects of climate change;
2. To develop education, research, innovation, development, disaggregation and technology transfer on climate change programs;
3. To reduce the vulnerability of people and ecosystems of the country against the effects of climate change;
4. To regulate and control the actions and measures for adaptation and mitigation of climate change;
5. To coordinate, implement and enforce national policies on climate change, throughstate institutions and different levels of government in the scope of its powers;
6. To promote sustainable development in territorial management models and planning at local, regional and national levels;
7. To establish mechanisms to manage risks and disasters or emergencies caused by climate change impacts;
8. To ensure on-timeaccess to necessary information to properly manage risk through adaptation and mitigation measures;
9. To promote the use and ensure access for renewable energy; and, 10. Other established for the purpose.
4. National climate change strategy 2012-2025 ecuador
The Government of Ecuador has seen the need to develop a National Strategy of Climate
Change (Ministry of the Environment, 2012) of a transversal nature to the different
sectors.This strategy leads to a concerted, ordered and planned action that promotes
internalization of the climate issue in public and private instances throughout the country.
Moreover, it considers the corresponding political, regulatory and institutional framework.
The coordination of efforts in the different levels of management is of fundamental
importance to ensure the consistency required and to improve the impact of this Strategy.
The strategy wants to achieve by 2025 that Ecuador could handle the challenges of climate
change, ensuring good living and the rights of nature.
It operatesover9 principles that guide the implementation of the National Climate Change
Strategy to achieve the vision outlined by 2025.
1. Regional and international coordination. 2. Consistency with international principles on climate change. 3. Emphasis on local implementation. 4. Environmental integrity. 5. Citizen participation. 6. Proactivity. 7. Protection of vulnerable groups and ecosystems. 8. Inter-generational responsibility.
5Organic Environment Code, 2017

61
9. Crosscutting and comprehensiveness. For this, there are two strategic lines; The first one relates to adaptation to climate change
aimed at reducing the social, economic and environmental vulnerability to the impacts of
climate change. The second strategic linefocuses on mitigating climate change by reducing
the gas emissions,the greenhouse effect and by increasing carbon sinks in strategic sectors.
5. National biodiversity strategy
The Ecuadorian Constitution (2008) and the National Development Plan are cornerstones
of the political agenda, which is inspired by the natives ancestral knowledge and posit the
regime ofGood Living or SumakKawsay as a new form of citizen coexistence in diversity and
harmony with nature. From this historic statement, Ecuador has enshrined in its Constitution
the rights of nature and recognized as fundamental duties of the State: planning national
development, eradicate poverty, promote sustainable development and equitable
redistribution of wealth to achieve Good Living.6
The 2030 development vision, aligned within the framework of the SNDPP, involves the
implementation of successive stages of government and steps that society must take to
materialize a new mode of accumulation, distribution and redistribution of wealth. In this
scenario of changes, biodiversity is the spearhead to reach the superior objectives of
transforming the productive matrix and eradicating poverty. However, moving from a
primary-extractivist development model dependent on the export of raw materials to a
generating economy with high added value in sustainability principles requires the
responsible use of the state's strategic natural resources.(Ministry of the Environment, 2015)
Therefore, it is essential to have a specific instrument for managing biodiversity that, while
recognizing the intrinsic challenges to the process of structural change that the State is going
through, proposes a set of measures that guarantee the human right to live in an
environment healthy, free of contamination and sustainable, as well as ensuring the rights
of nature. This means deepening knowledge of available and potentially usable biological
resources, protecting the intangible values associated with them, restoring ecosystems,
undertaking sustained processes of research, development and technological innovation
based on biodiversity; and, strategically linking local initiatives for the use of biodiversity with
national and global economic dynamics.
6. Plan of land use and occupancy (puos)
The plandelimitszonesof the geographical area of the Metropolitan District of Quito
(DMQ)and establishes land use and compatibility relations; occupation and buildable land
through the definition of load factors; the volume and height of buildings; standards for
enabling the ground; categories and dimensions of the tracks; affected areas and special
protection needs.7
6Constitution of Ecuador, Art. 3, 2008
7MetropolitanOrdinance No. 0172

62
Allocation in urban land use, urban and rural expansion, is set according to the destination
of each area defined by the structure model established by the Metropolitan Land
Management Plan. It is classified in:
Residential use, multiple use, industrial use, equipment, cultural heritage use, natural
resource use, agricultural use, residential, commercial and service sectors.
7. Atlas of natural threats and exhibition of infrastructure of the
metropolitan district of quito
The atlas contains information on the entire DMQ which determines the level of vulnerability
that each sector has according to the different types of exposure to both natural and human
risks. It details the exposure that exists regarding the public infrastructure. The DMQ territory
is characterized by its geodynamic conditions (earthquakes and volcanic eruptions),
geomorphological (landslides, subsidence, mudflows, among others), hydrometeorological
(torrential rains, floods, hail, etc.) and anthropic that distinguish their natural and urban
landscapes. In this scenario, the constituent elements of the Metropolitan territory
(population, infrastructure, services, production, natural areas) are exposed to multiple and
diverse threats that originate in the dynamics of nature and the social and economic
interventions of the population.(Municipality of the Metropolitan District of Quito, 2015)
In the physical complexity of this area, the public services that serve as support for the
development of the activities of the inhabitants of the DMQ present different levels of fragility
depending on their location and exposure to the threats that are generated in the territory.
In this situation there are infrastructures considered fundamental to guarantee the integrity
of the population and the functioning of the city in case of crises, such as mobility systems
(roads and airport), drinking water and sanitation, electricity, telecommunications, networks
of health service, education, and public administration.
8. Metropolitan development and territorial plan (pmdot)
It is a comprehensive territorial ordering instrument of the DMQ that aims to organize the
land of the entire metropolitan territory, to achieve a harmoniousand sustainable
development through the best use of natural resources, the organization of space,
infrastructure and activities according to their physical, environmental and social impact in
order to improve the quality of life of its inhabitants and achieve good living.8
The principles of the strategic planningare:
a) Quality of life for all citizens. b) Greater opportunities for all. c) Correspondence between development, land use and planning. d) Crosscutting and comprehensiveness.
8MetropolitanOrdinance No. 0172; Article ... (20), section 1.

63
e) Innovation towards a smart city. f) Multiple centralitiesof Quito. g) Responsibility.
Within the city, sustainable development is considered necessary, which is why strategic
planning is generated. This strategic planning is understood as a tool to meet the challenges
posed by a sustainable future. It must be consistent with a change in vision that has been
carried out to date. had respect to the city. This paradigm shift implies understanding,
guiding and integrating the essential factors that influence territorial development, such as
the availability of natural resources, economic and social dynamics, identity and socio-
cultural fabric, geophysical characteristics and the infrastructure network, just to mention
some. In this light, planning is the guiding instrument that drives the dynamics and guides
citizens towards a sustainable human and territorial horizon.(Metropolitan Council of the
DMQ, 2015)
Although it is true that the regulations in the country are aimed at guaranteeing the quality of life for all citizens, not all of them respond in a timely manner to the impacts that have arisen and could arise in the future because of climate change. Therefore, local, regional and national environmental education must be increased at all levels and instances to guarantee a high level of knowledge about the factors that intervene in climate exposure as an external element that cannot be controlled by society, generating timely and effective reactions, so that this same society can assess their sensitivity to these external factors. It is important for this to consider their adaptive capacity to these events, assuming innovations for development, planning based on mutual non-individualistic interests, in such a way that the potential impact on the territory is seen before of its occurrence and if this occurred, that the community is resilient before any capital damage which is achieved through the application of the public policy documents mentioned and discussed above.
Reference List
National Plan Of Good Living (2018). Plan Nacional 2013 - 2017. http://www.buenvivir.gob.ec/
Code Organic Environment, (2017)http://www.competencias.gob.ec/wp-content/uploads/2017/06/05NOR2017-COA.pdf
Ministry of the Environment, (2012), National Strategy of Climate Change 2012-2025http://extwprlegs1.fao.org/docs/pdf/ecu140074.pdf
Senplades, (2017), Institutional Strategic Plan 2018-2021http://www.planificacion.gob.ec/wp-content/uploads/downloads/2018/02/PEI-2018-2021.pdf

64
Ministry of the Environment, (2015), National Biodiversity Strategy 2015-2030http://maetransparente.ambiente.gob.ec/documentacion/WebAPs/Estrategia%20Nacional%20de%20Biodiversidad%202015-2030%20-%20CALIDAD%20WEB.pdf
Municipality of the Metropolitan District of Quito, (2015), Atlas Of Natural Threats And Exhibition Infrastructure Quito Metropolitan District (2010-2020)http://www.quito.gob.ec/index.php/municipio/218-atlas-amenazas-naturales-dmq
Senplades, (2017), National Development Plan 2010-2021 Lifetimehttp://www.planificacion.gob.ec/wp-content/uploads/downloads/2017/10/PNBV-26-OCT-FINAL_0K.compressed1.pdf
Metropolitan Council of the DMQ, (2015), Metropolitan Development Plan and Land Managementhttp://www.quito.gob.ec/documents/PMDOT.pdf

65
Chapter 5. Framework for climate adaption and
resilience in Italy
Mara Cossu, Simona Muratori and Silvia Pezzoli
Poliedra-Politecnico di Milano (Italy)
In Italy the institutional and programmatic framework for resilience can be xxxx to three main
themes:
1. Climate adaptation and resilience
2. Disaster risk reduction
3. Sustainable development
The main themes are developed through specific policy documents, described in the
following paragraphs.
1. Climate adaptation and resilince
Following the international and European vision, the Italian Ministry for Environment, Land
and Sea (MATTM), in charge of climate change policy, in 2015 has approved the Italian
National Adaptation Strategy to Climate Change (NAS).
The Strategy is a tool for encouraging adaptation actions in planning activities at national,
regional and local level. After approval by the "State-Regions Unified Conference" on the
30th of October 2014 (14/136/CU6/C5), the NAS was finally adopted on June 2015 with a
Directorial Decree of the Climate Change and Energy General Director (DG-CLE)
establishing specific objectives to be reached by 31th December 2016.
In order to elaborate the NAS some background documents have been published
• an analysis of European and National policy framework for adaptation;
• a state of the art on the knowledge on climate change, impacts, vulnerability and
adaptation for relevant sectors
• elements for a strategy document.
The NAS implements at the national level the European Adaptation Strategy to Climate
Change 2013 and provides a set of adaptation actions in order to mitigate and take
advantage from climate change for the different areas and sectors. Such actions are divided
into 5 categories: non-structural or soft actions; ecosystem approach based or green
actions; infrastructural and technological or grey actions; brief and long term actions;
transversal actions (soft, green, grey).

66
The main adaptation activities already implemented in Italy and collected by the NAS
concern the most vulnerable sectors as agriculture, water use, forests, human health, flood
risk, desertification and drought, coastal areas, biodiversity, tourism, urban settlements.
Resilience is often mentioned as the main goal and result of the application of the National
Strategy (through the Adaptation Plans at the national and regional levels). It is particularly
important at the community level and looking at the adaptation of production sectors.
Resilience of urban settlements is directly mentioned looking at the adaptation of urban
areas. It is then mentioned throughout the document when addressing the need for action
to enhance climate change adaptation and reduce the damage in urban areas, where risk
may produce huge damages and economic losses, which could overpass adaptation costs.
With reference to urban settlements, the NAS foresees the strong need of actively engage
citizens in defining urban adaption strategies, promoting “no regret interventions”, expected
to solve existing problems while providing socio-economic benefits to citizens, in order to
increase their adaptation capacity (Ministry of Environment, 2015).
The approach adopted by Italy in elaborating the strategy includes:
• The collection, analysis and interpretation of data and scientific information about
impacts, vulnerability and adaptation issues on economic sectors
• The study on adaptation governance processes and issues
• The involvement of stakeholders and national institutions in delivering priorities on
climate adaptation actions
Following such an approach, the strategy delivers an overview on how to address climate
impacts by focussing on 9 principles, deriving from the European Adaptation Strategy
elaboration process (EC, 2013).
• Adopt a knowledge and awareness-basedapproach
• Promote partnership as well as stakeholders’ and citizens’ engagement
• Work jointly with the research and innovation sector
• Consider complementarities between mitigation and adaptation
• Adopt the precaution principle to address scientific uncertainties
• Adopt a flexibility-based approach
• Adopt a sustainability-based and intergenerational approach
• Adopt an integrated approach in the adaptation assessment
• Adopt a risk-based approach in the adaptation assessment
• Mainstreaming adaptation into existing policies
Image 1 – The five steps of the adaptation policy process, to be considered as iterative and closely interlinked phases.

67
Source (EC, 2013)
The Ministry of Environment, with the support of the Euro-Mediterranean Center for Climate
Change (CMCC), has been working on the implementation of the NAS through the
development of the Italian National Adaptation Plan for Climate Change (NAP). The NAP
represents a national framework for other ministries, regions, local authorities with technical-
scientific background information, for the integration of adaptation within policy processes.
It delivers a detailed description of the adaptation actions focussing on the actors needed
for their effective implementation and the expected role. It also contains information about
available funding means. The NAP is currently being finalized taking into account the
outcomes of the process of public consultation and scientific review. Regions are required
to further implement their regional adaptation strategies.
2. Risk reduction
In the recent years Italy adopted some focussed instruments directly addressing the disaster
risk reductions. They follow the update of European framework on the issue, as well as the
raised awareness due to the intensified frequency of the events.
The Decree no. 66/2008 of the President of the Council of Ministers establishes “the National
Platform for Disaster Risk Reduction”, which focusses on a few main principles:

68
• reducing the risk must be understood as a national responsibility and treated in an
interdisciplinary way in the context of sustainable development processes;
• the participatory approach should guide the work of the Platform in order to facilitate
the involvement of various sectors within the framework of different perspectives and
actions;
• Platform works shall give way to positive changes through planned and coordinated
efforts in the processes of decision-making;
Consequently, the objectives of the Platform aim at ensuring the full implementation of the
Hyogo Declaration and of the Hyogo Framework for Action in Italy, namely to integrate
Disaster Risk Reduction into decision making processes at all levels in policy, administration
and in the private sector. The overall goal is to promote all activities that may enable the
society to reduce human, social and economic losses caused by natural disasters
(https://www.unisdr.org/partners/countries/ita).
The Platform, leaded by the National Civil Protection Department of the Presidency of the
Council of Ministers, is to be intended as a governance mean. Its Main objectives directly
address intergovernmental and stakeholders interaction mechanisms and can be described
as follows:
• be a forum for knowledge sharing, political cooperation on DRR and the definition of
sector-specific policies;
• help putting theory into practice by liaising between policymakers, scientists and
DRR professionals;
• promote public-private partnerships and joint projects carried out in Italy and abroad;
• link national and international activities and initiatives.
In 2010 Italy also adopted the Legislative Decree no. 49/2010 “implementation of the EU
Directive 2007/60/CE regarding the assessment and management of flood risks”. The Italian
Government, Italian Ministry of Environment, Land and Sea, the Water Basin Authorities,
the Regions, the Civil protection Department are jointly responsible for the implementation
of the plan both at National and Regional level.
The Decree regulates the activities of assessment and management of flood risks in order
to reduce the related negative impacts on human health, territories, goods, the natural
environment, the cultural heritage and the economic activities. In particular, the regulation
refers to the development of flood risk maps on the bases of most appropriate and advanced
tools, with particular attention on limiting required economic efforts; to the development of
the early warning system at the national and regional levels.
It further provides information about the plans for flooding risk management to be adopted
by Regions. Following the EU flood directive, they are required to focus on four main
categories of action:
Prevention – measures acting on the vulnerability and on the value of exposed elements,
directly linked to planning issues (vincles on flooding areas; measures of delocalization and
re-development; adaptation measures)

69
Protection – measures acting on the probability of flooding (measures of reduction of flows,
structural measures for the regulation of outflows; measures for urban drainage;
management measures)
Preparation – measures for empowering the responsiveness to extreme events addressing
the population and the civil protection system as a whole (alert systems, emergency
planning, awareness raising training and information measures)
Reconstructionand post-event assessment– safety and recovery measures in order to
overcome critical conditions imposed by floods (preliminary risk assessment; collection of
information and data on floods).
Most regional plans for flooding risk have been adopted, delivering prioritized actions.
3. Sustainable development
The link between climate adaption and resilience and sustainable development is widely
recognized, particularly in urban areas(Collier et al. 2013).
The above cited National Adaption Strategy points out how the capacity of selecting and
implementing climate oriented actions taking into account the need to avoid conflicts with
other sustainability dimensions is increasingly important(IPCC, 2007; 2014).
It also stresses how climate change as well as the provided adaptation and
mitigationmeasures have to be intended as a part of the wider sustainable development
challenge.
Italy is currently engaged in gearing the 2030 Sustainable Development Goals (SDGs) to
the economic, social and environmental planning, by drafting the National Sustainable
Development Strategy 2017/2030 (NSDS).
The NSDS, approved at the end of 2017 by the Interministerial Committee for Economic
Programming (ComitatoInterministeriale per la ProgrammazioneEconomica – CIPE) is an
update of the former Environmental Action Strategy for Sustainable Development in Italy
2002/2010 and a first step towards a holistic policy framework, widened to include social
and economic dimensions, in line with the 2030 Agenda.
The delivery and implementation of the NSDS interlink the existing national programming
documents, namely the National Reform Programme and the Economy and Financial
Document.
The NSDS is organized in five core areas: People, Planet, Prosperity, Peace and
Partnership. Each area consists of a set of national strategic choices articulated in strategic
national goals. The goals integrate the three dimensions of sustainable development and
are the result of a synthesis and abstraction procedure of the most relevant issues emerged
in the consultation process. The chosen structure represents a concise way to reflect the
complexity of the 2030 Agenda – and balance the three environmental, economic and social
pillars of sustainable development, focusing with particular attention on the environmental

70
dimension whose integration is traditionally weak. Furthermore, this arrangement allows to
synthesize the information yielded from the consultation, without scattering the significant
contribution provided by the institutional players, who know best about the different matters
of intervention.
Within this framework, the NSDS mainstreams the adaptation, mitigation and resilience
issues all along the strategic choices and objectives it defines, concerning PEOPLE (risk
exposure), PLANET (sustainable management of natural resources, water and soil
management, air pollution, city, territory and landscape management), PROSPERITY
(sustainable consumption and production, decarbonization of the economy), PARNERSHIP.
The PLANET area also contains a strategic choice dedicated to creating resilient
communities and territories, protecting landscapes and cultural heritage.
The NSDS is to be intended as a wide framework for implementing the 2030 Agenda in Italy.
It is also by law (art 34 of the Decree 152/2006 and subsequent amendments) the framework
for territorial planning and environmental assessments. Regions and Autonomous Provinces
have to further contribute to the implementation of the NSDS by implementing their own
sustainable development strategies.
The NSDS is endorsed by the Italian Council of Ministers. A Plan of Action is being
developed and will include numerical and quantitative targets at 2030, as well as monitoring
and review mechanisms and analytical models capable of measuring the impacts of policies
on the NSDS objectives.
The Government will provide an annual review about NSDS implementation as well as an
assessment of the achieved results.
To this aim, the National Statistical System is progressively releasing sets of indicators
hugely based on the BES project, launched in 2011 to measure equitable and sustainable
well-being (BES) besides economic conditions. It considers economic parameters alone as
inadequate to evaluate the progress of societies and views them to be complemented by
social and environmental information as well as by measures of inequality and sustainability.
For the first time, in 2017, four BES indicators have been introduced within the Economy
and Financial Document, following national legislation promoting the integration BES within
economic programming (L.163/2016).
Reference List
Collier, Marcus J., ZoricaNedović-Budić, JeroenAerts, Stuart Connop, Dermot Foley, Karen Foley, Darryl Newport, SiobhánMcQuaid, AleksanderSlaev, e Peter Verburg. 2013. Transitioning to resilience and sustainability in urban communities. Cities, Current Research on Cities, 32, Supplement 1 (july): S21–28. https://doi.org/10.1016/j.cities.2013.03.010.
Metz, Bert, e Intergovernmental Panel on Climate Change, eds. 2007. Climate change 2007: mitigation of climate change: contribution of Working Group III to the Fourth assessment report of the Intergovernmental Panel on Climate Change. Cambridge; New York: Cambridge University Press.

71
Fleurbaey M., S. Kartha, S. Bolwig, Y. L. Chee, Y. Chen, E. Corbera, F. Lecocq, W. Lutz, M. S. Muylaert, R. B. Norgaard, C. Okereke, and A. D. Sagar, 2014: Sustainable Development and Equity. In: Climate Change 2014: Mitigation of Climate Change. Contribution of Working Group III to the Fifth Assessment Report of the Intergovernmental Panel on Climate Change [Edenhofer, O., R. Pichs-Madruga, Y. Sokona, E. Farahani, S. Kadner, K. Seyboth, A. Adler, I. Baum, S. Brunner, P. Eickemeier, B. Kriemann, J. Savolainen, S. Schlömer, C. von Stechow, T. Zwickel and J.C. Minx (eds.)]. Cambridge University Press, Cambridge, United Kingdom and New York, NY, USA
European Commission. 2013. Guidelines on developing adaptation strategies. Commission staff working document - SWD(2013) 134 final. Brussels, 16.04.2013.
Ministry of Environment, Land and Sea. 2015. National Adaptation Strategy to Climate Change. http://www.minambiente.it/sites/default/files/archivio/allegati/clima/strategia_adattamentoCC.pdf
Ministry of Environment, Land and Sea. 2017. National Strategy for Sustainable Development http://www.minambiente.it/pagina/la-strategia-nazionale-lo-sviluppo-sostenibile
Chapter 6. Climate Change Adaptation and Disaster
Risk Reduction Strategies in Spain.

72
Jesús Vargas, Pilar Paneque, Flavio Camerata and Josefina López
Pablo de Olavide University of Sevilla (Spain)
Introduction
The main objective of any risk management strategy must be to avoid human fatalities and to minimize socioeconomic and environmental impacts. To reach this objective requires a firm commitment to influence the different aspects that make up exposure, vulnerability and the ability to adapt the different socio-territorial systems. Important efforts are being made from national and international organizations to reduce climate change effects. Although this strategies have prioritized mitigation actions, in recent years adaptation strategies have acquired a relevant role. Very recently, climate change studies have concerned about the relationship between natural hazards and climate change. The fourth IPCC Report (IPCC, 2007) and the Special IPCC Report "Managing the Risks of Extreme Events and Disasters to Advance Climate Change Adaptation" (IPCC, 2012) have prompted the definitive recognition of the relationship between these two processes. Due to its climatic, geographical and socioeconomic characteristics, Spain is exposed to different natural hazards related to weather events (droughts, floods, wind storms, storms, etc.). Moreover, the projections on climate change suggest that hazards linked to climate will increase and worsen, as well as that new risks will be generated for natural and human systems (IPPC, 2014, EEA, 2016).
Specially sensitive to risks are urban areas, due to their high degree of occupation, where people and resources are concentered. In Spain, urban area, which combine a variety of natural hazards -especially hydroclimatic hazard- with a high degree of human occupation, are territories of risk and it is necessary to focus on prevention, mitigation and adaptation strategies. In this regard, three key tools are highlighted for the strengthening of urban resilience in Spain, from the point of view of urban areas: urban planning, new urban agendas and city resilient networks.
1. Natural hazards in a climate change context in Spain
Spanish’s climate is characterized byan intense variability due to its complex topography and geographical situation. The spatial, seasonal and interannual climatic variability is very high, which makes the country a territory of climatic contrasts, conditioned in large, by the circulation patterns of the atmosphere in the Northern Hemisphere, in particular by the North Atlantic Oscillation (NAO) (Martín-Vide, 1996). The coincidence of a complex and difficult physical environment and a dynamic and growing population, increasingly concentrated in urban centers, with a massive occupation of the territory in some regions, especially on the coast, means that Spain is one of the most affected geographical areas for the dangers of nature. As Olcina Cantos says (2009)
“Spain is territory of risk. The variety of natural hazards, especially climatic ones, which can affect it joined to high degree of human occupation in some of his regions, turn Spanish territory in geographical space with raised natural risk in the set of Europa” (Olcina Cantos, 2009:197).

73
In Spain, the most significant risks capable of generating major disasters are those related to terrestrial dynamics, specially earthquakes. Earthquakes are not very frequent in time in Spain however they have reached sufficient magnitude to devastate populations. The most devastating of the last two centuries was the 1884 earthquake in Granadameasured over 6.0 on the Richter scale. This earthquake caused more than 1,000 fatalities, thousands of injuries and houses destroyed, in addition to damages on the ground (IGN, 1980). More recently, in 2011 it occurred in Lorca (Murcia) an earthquake measuredon 5.1 on the Richter scale. It caused9fatalities, several injured and numerous property damage worth more than 1,000 million euros. Also of seismic origin there is some volcanic risk in the Canary Islands, where the only Spanish region currently exposed to this type of risk is located. The most recent eruption occurred in 2011 on the island of El Hierro, where a submarine volcanic eruption took place that lasted six months forcing to evict 547 people. However, greater recurrence and socioeconomic hazards in Spain are those related to hydroclimatic conditions: droughts and floods. The most severe drought episodes in terms of economic losses took place in 1941-1945, 1979-1983, 1990-1995, 2004-2008 and 2015-2017; These drought events affected the whole of the Spanish territory. Floods are the natural phenomenon that most often occur and produce the greatest number of economic and human losses in Spain. According to the Ministry of Ecological Transition, flood damage is estimated at an average of 800 million euros per year9. In addition, wind storms and heat waves, present virtually throughout the Spanish territory generate significant human and socio-economic impacts. Forest fires are another problem that seriously affects the Spanish territory, without any region being free of them. Their number tends to increase and for the most part they are provoked and, therefore, fall into the category of induced risks. However, in addition to the economic losses they cause and the danger they entail for people and human goods, fires cause important environmental impacts and, in the long term, environment degradation wich causes the appearance of other problems such as, for example, soil erosion. Vegetation degradation and soil erosion can combine and affect hydrology, triggering desertification phenomena. In terms of fatalities due to natural disasters in Spain, in the period 1995-2014 amounted to 1,174, highlighting by its incidence, those due to floods, storms, forest fires and heat waves (Table 1) .
Table 1. Number of fatalities in Spain due to natural disasters (1995-2014).
Natural Hazard
19
95
-20
04
20
05
20
06
20
07
20
08
20
09
20
10
20
11
20
12
20
13
20
14
20
15
20
16
Tota
l
9http://www.mapama.gob.es/es/agua/temas/gestion-de-los-riesgos-de-inundacion/

74
Flood 229 8 9 11 6 5 12 9 15 5 2 17 10 339
Storm 139 8 9 4 3 11 6 2 1 7 5 3 1 200
Forest fire 53 19 8 1 1 11 9 12 10 1 4 3 1 133
Landslide 21 0 5 2 1 2 2 3 0 2 0 0 3 41
Hot waves 86 9 23 9 3 6 16 6 6 4 0 33 8 209
Snow avalanche 27 1 0 0 4 3 11 2 0 4 0
1 1
54
Cold waves 17 3 0 0 0 1 1 1 0 0 0 0 2 25
Marine storm 202 nd nd nd 4 2 5 2 7 9 18 2 04 248
Earthquakes 0 0 0 0 0 0 0 9 0 0 0 0 0 9
Total year 774 48 54 27 22 41 62 46 39 32 29 59 30 1268
Source: MAPAMA, 2016.
Besides this risk scenario, climate change forecasts are added on future climate scenarios and their effects in the medium and long term in Spain (IPCC, 2014). The Fifth Assessment Report of the IPCC (2014) (AR5) has worked on a set of new General Circulation Models (CGM) and new emission scenarios. Regarding the new MCGs, the AR5 has worked with both Atmosphere-Ocean coupled MCGs (MCGAO) that simulate the dynamics of the physical components of the climate system (atmosphere, ocean, earth and ice sheet), such as the Models of the MCG Earth System -ESM (from English, Earth System Models). These last ones are considered more complete when including representation of several biochemical cycles like those implied in the cycle of carbon, sulfur or ozone. Regarding the emissions scenarios used to obtain the climate projections (the AR5 of the IPCC), the new emission scenarios for climate change have been used, known as trajectories (or paths) representative of concentration (RCP of its acronym in English). These RCPs describe different projections for emissions and concentrations of greenhouse gases and aerosols and for land uses throughout the 21st century. The RCPs include scenarios of strong reduction of emissions (RCP2.6), two intermediate scenarios (RCP4.5 and RCP6.0) and a scenario of high emissions (RCP8.5). The reference scenarios, in which emissions are not controlled, are between RCP6.0 and RCP8.5. The Spanish Meteorological Agency (AEMET) has carried out a regionalization for Spain of climate scenarios of RCP 4.5, 6.0 and 8.5 of the AR5 using the 1961-1990 period as the reference series. AR5 stands out that: in relation to temperatures;an increase in temperatures is expected, an increase in the number of warm days and a progressive increase in the annual and seasonal average value of the maximum temperature throughout the 21st century in all emission scenarios evaluated, with greater increases in the interior and lower in the north and northwest of the peninsula. An increase in the average of the anomalies of the minimum temperatures is also expected. Regarding precipitation; the report acknowledges more uncertainty than for the case of temperatures and forecasts a reduction in average rainfall in peninsular Spain and a decrease in the average number of days of annual precipitation, with longer dry periods, with a fork of important differences depending on the scenarios used and the seasons of the year. Thus, in summer, the greatest decreases are expected to be located in the southern part of the peninsula and in the extreme northwest of the Peninsula. A decrease in runoff and real evapotranspiration - both variables dependent on rainfall - is also forecast for the reference period with steeper decreases for the summer months. Regarding the incidence of climate change on extreme weather events in Spain, the report predicts a very likely increase in the frequency and duration of heat waves and a decrease

75
in the annual number of days of frost. The report does not evaluate the effects of climate change on the frequency and magnitude of hydro-climatic risks (droughts and floods), which in Spain have the highest incidence, both in the number of events and in the number of people affected. In this sense, the Center for Studies and Experimentation of Public Works (CEDEX) published in the year 2017 the report "Evaluation of the impact of climate change on water resources and droughts in Spain" in which it concludes that the forecasts point in general towards a reduction in water resources as the 21st century advances and, therefore, towards an increase in water scarcity in Spain. In addition, the report predicts a change in the drought regime in which most of the climate projections show a future in which droughts would be more intense and frequent, with that effect occurring as the 21st century advances.
2. Spanish Institutional framework to cope with climate change effects
and Natural Hazards
As a European Union member a large part of the strategies and plans related to climate change and natural risks in Spain are derived from documents prepared by the European Commission, either by obligation, through Directives , or through documents that, without being mandatory for member countries, establish a series of recommendations and guidelines to follow where the main priorities and opportunities in terms of climate change and natural risks are established (Strategies, reports, recommendations, etc.). At European level, the White Paper“Adaptation to Climate Change: Towards a European Action Framework” (EC, 2009) was an important imput and currently remains as a reference for the development of policies and strategies for adapting to climate change in Europe. This document is structured around four pillars of action, (i) reinforcement of the knowledge base, (ii) integration of adaptation into all EU policies, (iii) instruments (financial and otherwise) to ensure effectiveness of adaptation and (iv) strengthening of international cooperation and the external dimension of adaptation. This first effort served as a seedbed to develop the European frame of reference in terms of adaptation to climate change, European Strategy for Climate Change Adaptation (2013 -2020). The overall aim of the EU Adaptation Strategy is to contribute to a more climate-resilient Europe. This means enhancing the preparedness and capacity to respond to the impacts of climate change at local, regional, national and EU levels, developing a coherent approach and improving coordination. Although it is true that the reduction of disaster risk is not one of the priority lines of the EU Adaptation Strategy, this strategy recognizes the importance of the natural system-human system interaction for the generation of risk and defines the risk associated with the impacts related to climate as a result of the interaction of the interaction of natural hazards with the vulnerability and exposure of human and natural systems, as well as their capacity for adaptation. Furthermore, it considers it essential to bring the areas of adaptation to climate change and disaster risk reduction closer to the national and sectoral policies of the different EU countries. This strategy establishes specific activities to support a better informed decision-making and promote adaptation in the most vulnerable key sectors. In this regard, the platform should be highlighted Climate-ADAPT (https://climate-adapt.eea.europa.eu) which aims to support Europe in adapting to climate change trough access and share information on: expected climate change in Europe, current and future vulnerability of regions and sectors, national

76
and transnational adaptation strategies, adaptation case studies and potential adaptation options and tools that support adaptation planning. In the Spanish context, the reference tool for dealing with climate change is “The Spanish Strategy of Climate Change and Clean Energy (2007-2012-2020)”, which is part of the “Spanish Strategy for Sustainable Development (EEDS)”. The Spanish Strategy of Climate Change and Clean Energy is divided into two main blocks. On the one hand, a series of policies and measures are presented to mitigate climate change, mitigate the adverse effects of climate change, and make it possible to comply with the commitments assumed by Spain. It also a priority to facilitate public and private initiatives aimed to to combat climate change from all sectors, focusing on the achievement of the objectives that allow compliance with the Kyoto Protocol. On the other hand, measures are proposed for the achievement of energy consumption compatible with sustainable development. Disaster Risk Reduction is not considered in this instrument. This strategy is focused more on mitigation and the reduction of emissions rather than adaptation to climate change. Regarding adaptation,the frame of reference at the National level is the “Spanish National Plan for Climate Change Adaptation (PNAAC)”. It is the frame for coordination between Public Administrations in the activities of impact assessment, vulnerability and adaptation to climate change in Spain. The main goal is to reach the effective integration of climate change measures in all sectoral and natural resource management policies that are vulnerable. For this, it relies on the best knowledge available. The PNACC is developed through different work programs, which allow prioritizing and structuring the activities contained therein. The first PNACC Work Program (2006-009): was approved in 2006, together with the Plan itself, in order to address the immediate priorities and crosscutting aspects of adaptation in Spain (Develoment of regionalized climate change scenarios in Spain, Impact assessment of climate change on water resources, coastal areas and biodiversity). The second PNACC Work Program (2009-2013) has as a main objective the integration of adaptation to climate change in different sectoral planning. The third PNACC Work Program (2014-2020): was approved in 2013 and seeks to comprehensively address adaptation to climate change. In relation to disaster risk management, the PNACC contemplates a double approach to risk assessment. On the one hand, the risks associated with the gradual effects of climate change and on the other, the risks associated with extreme weather events —such as torrential rainfall, large floods or prolonged droughts— that can cause great effects and where adaptation to climate change can reduce the risk of disaster. On the latter, despite putting the focus in reducing exposure and vulnerability and increase resilience to the possible adverse effects of climatic extreme events,the integration between climate change and disaster risk reduction has received little attention. At least, at the institutional level until the recent publication of the IPPC Special Report Management of the risk of extreme weather events and disasters to improve adaptation to climate change in the year 2012. In addition to the Nation Strategy PNACC, the Autonomous Communities, in the exercise of their competencies, have developed and maintain strategic frameworks, plans and / or programs in terms of adaptation to climate change, which are implemented through different initiatives and actions. The Platform for exchange and consultation of information on adaptation to climate change in Spain AdapteCCa10. This platform compiles a complete and homogeneous information, and provides the entry point to know in depth the frameworks and actions that are carried out in Spain.
10www.adaptecca.es

77
Different plans and strategies for adapting to climate change are increasingly introducing considerations related to necessary integration between the effects of climate change and disaster risk reduction. In these documents, adaptation to climate change is considered as a fundamental strategy for risk management. In spite of the opportuneness and convenience of this approach, which is from the point of view of the authors unquestionable, its development is ambiguous enough so that, in practice this integration between adaptation to climate change and disaster risk reduction is not operationalized. As the most notable evidence of this lack of concreteness in Spain, specific flood risk management plans and drought risk management plans have been developed and, in turn, the integration of the effects of climate change into ordinary hydrological planning has been practically null. (Vargas et al., 2018). As a result, we have increasingly better tools for managing risk situations, but at the same time, we increase exposure and vulnerability to these situations by not integrating the effects of climate change into sectoral planning. Therefore, the utility of these tools is reduced. Regarding operational management of disaster risk, Spain has a National System of Civil Protection11 for the management and coordination of emergency situations. The objective of the Civil Protection service is to protect people and property, offering an adequate response to different types of emergencies and catastrophes, whether natural or derived from human action. Although Civil Protection service has traditionally emphasized more in the response to emergency situations, its actions also include forecasting and prospective analysis by improving knowledge in order to reduce risk and mitigate its effects. The National Civil Protection Strategy is based on prospectively analyzing the risks that can affect people and goods, the necessary response capacities, and formulating strategic lines of action to align, integrate and prioritize efforts to optimize resources to mitigate the effects of emergencies. This strategy is developed through different tools that operate at different administrative levels and in a different degree of detail. On the one hand, the General State Plan, which develops the basic guidelines for the organization and coordination of State action procedures to provide support and assistance to other Public Administrations in cases of emergency. On the other hand, the Territorial Plans that are prepared to face the emergency risks that may arise in the territory of an Autonomous Community or municipality, where it will be mandatory to provide the local civil protection service if it exceeds 20,00012 inhabitants, being able to request of the respective Autonomous Community the exemption of this obligation when it is impossible or very difficult to comply with the establishment and provision of such services by the City Council. Another tool is the Self-protection Plans, which establish the organic and functional framework foreseen for the centers, establishments, facilities or dependencies included in the applicable regulations, in order to prevent and control the emergency risks of civil protection on people and services. goods and give an adequate response in those situations. In addition, there is a type of Special Plans, which may be state or autonomous and whose purpose is to deal with flood risks; earthquakes; tidal waves; volcanoes; adverse weather phenomena; forest fires and technological risks. These special plans affect many of the most recurrent natural hazards in Spain, such as floods and droughts. These plans have their own regulations and are covered by sectoral policies.
11 Ley 17/2015, de 9 de julio, del Sistema Nacional de Protección Civil
12 Ley 7/1985, de 2 de abril, reguladora de las bases del Régimen Local (LBRL)

78
As a consequence of the approval of the European Floods Directive13, the obligation to develop Flood Risk Management Plans (PGRI) in each of the Spanish river basin districts is established. These PGRI start with a preliminary assessment of the risk of flooding and an identification of the Areas with Potential Significant Flood Risk (ARPSIs) based on the preparation of hazard and risk maps. The PGRIs include a series of measures to minimize the damage caused by the floods; many of them are non-structural ones related to early warning systems and land use planning for limiting uses in flood areas. In the case of droughts, as in a pioneering way in Europe, the Hydrological National Plan establishes the obligation to develop drought plans, such as the preparation of territory-specific special drought plans, urban-supply emergency drought plans. As a result, the National Floodplain Mapping System (SNCZI) has been launched. The SNCZI is established as an instrument to support the management of fluvial space, risk prevention, territorial planning and transparency. In the case of droughts, as in a pioneering way in Europe, the Hydrological National Plan establishes the obligation to develop drought plans, such as Special action plans in situation of alert and eventual drought (PES) in the field of river basin district and Emergency Plans for urban supply systems (PEM) in the field of urban supply systems of more than 20,000 inhabitants. This drought management plans are tools that are based on the establishment of a system of indicators that allows forecasting and tracking the evolution of the period of time and then establish a series of progressive measures while the phenomenon advances to minimize environmental, economic and social.
3. Urban initiatives. Resilience strategies opportunities
If there is any scenario especially sensitive to the effects of climate change and natural hazards, this is undoubtedly urban areas. In an unprecedented process, the concentration of population in urban areas has gone from 10% in 1990 to over 50% in 2010 (UNDESA, 2010). In Spain, the percentage of the population living in urban areas reached 80% in 2016 (INE, 2017). The concentration of population and activities in urban spaces has increased the exposure to natural hazards and has turned cities into territories prone to economic damage and loss of human lives. Urban areas are therefore territories of risk and a large part of disaster risk reduction strategies are oriented and / or integrated to reduce vulnerability and strengthen resilience in urban areas (Senday Framework for Disaster Risk Reduction 2015 -2030 (UNISDR, 2015), Urban Adaptation to climate change in Europe 2016 - transforming cities in a changing climate (EEA, 2016b), City Resilience Program of the World Bank (CRP). In Spain, three different but complementary tools stand out, which represent important opportunities for the practical application of strategies to strengthen resilience in urban areas: territorial planning, the New Urban Agenda and the participation of different cities in networks on resilience.
3.1. Territorial planning: the key to promote urban resilience
In recent years we have gradually witnessed a change in the consideration of risk reduction policies, from the emphasis on structural measures and the lack of consideration of risk in plans and regulations towars the proposal of measures based on the ordination and management of the territory (Olcina Cantos, 2009). At urban level, municipalities in Spain
13 Directiva 2007/60 de evaluación y gestión de los riesgos de inundación

79
have a great capacity - and also legal responsibility - in terms of prevention, mitigation and response to natural risks. In addition to the mentioned civil protection competencies, in the case of municipalities with more than 20,000 inhabitants and the obligation also for these municipalities to develop Emergency Plans for urban supply systems (PEM), the municipalities hold the competences of land management through the General Plans of Urban Planning. In this sense, the Land Law of 2008 represents a great step forward for the integration of the consideration of risk in urban planning processes, at least at the regulatory level. This Law obliges all municipalities to develop risk cartography to delimit soils not suitable for urbanization; However, there are still not many general municipal plans that incorporate natural risk mappin. Until very recently, the problem of natural hazard and its territorial effects in the allocation processes has not been taken into account. (Pérez et al., 2016, Olcina Cantos, Morote and Hernández-Hernández, 2018). Territorial planning competencies represent a fundamental tool for adequate risk prevention for several reasons: 1) it facilitates better knowledge about the territory and allows for more detailed diagnoses about risks (hazards and vulnerability), capacities and means to deal with these; 2) adequate planning of activities, settlements and infrastructures is a fundamental prevention tool and can have a very important influence on the greater or lesser exposure to natural hazards; 3) the municipal level facilitates the participation of diverse agents where it is possible to take into account their perception, evaluation, diversity of knowledge and political interests in order to produce vulnerability analysis and decision making in risk management (Klinke &Renn , 2013). This last point is especially relevant because it allows strengthening the institutional and population capacities to face the risks and therefore generate more resilient individuals. Cities can not be resilient if institutions and citizens are not in turn resilient
3.2. Spanish Urban Agenda
The Spanish Urban Agenda (AUE) is being developed, which is a strategic document (not normative) that aims to be an instrument at the service of all Public Administrations, within the scope of their respective competences and mainly of the Town Councils, to propitiate improvements in the areas of regulation and planning, financing, governance, knowledge, transparency and participation. The EUA is in line with other similar international initiatives that have recently been developed, such as the Urban Agenda for the EU (NP-CEU 2016) or the New Urban Agenda of the United Nations (UNU-HABITAT, 2016). These initiatives represent a common ideal to achieve a better and more sustainable future through an adequate coordination between good urbanization and development. In a context of climate change, no self-respecting strategy can be called sustainable without considering the effect of climate change and natural risks. Thus, these initiatives include climate change and resilient urban development as strategic objectives. However, all these initiatives and the good intentions derived from them have not yet crystallized into operational frameworks put into practice. And it is that, in this case, the main advantage that the urban area has to address these issues, which is precisely to be able to work on a specific territory, becomes a difficulty when trying to establish common assessment procedures and frameworks Top-to -Down precisely because of the variety of contexts and territorial realities that characterize each municipality and that hinder the application of these methodologies and common frameworks to specific contexts.mIn spite of this, the development and future maturation of these urban agendas, incorporating adequate information and public participation channels, can be a very useful frame of reference for the integration of sustainable and resilient urban development.

80
3.3. City resilient networks
In recent decades, several city resilient networks have emerged, such as the Global Campaign for Resilient Cities of the United Nations Office for Disaster Risk Reduction, the Resilient Cities Network, promoted by UN-HABITAT or the Red Redes 100 Ciudades Resilientes Network promoted by the Rockefeller Foundation. These strategies promote urban development by incorporating the concept of resilience as a cross-cutting element in development plans and providing support to local governments to develop capacity in resilience, adaptation and recovery, in an efficient manner, in the face of the economic or social impacts of natural disasters.The great potential of this type of network, of which several Spanish cities are part, lies in the promotion of cooperation through the exchange of good practices and experiences.
Conclusions
Spain is a territory of risk. The natural recurrence of different natural hazards is compounded by a growing population, increasingly concentrated and more exposed that determines higher levels of risk. In addition, climate change forecasts predict an increase in the frequency and intensity of extreme weather events and place Spain as one of the countries most vulnerable to the effects of climate change. In spite of the remarkable advances that have been made in Spain in recent years to face the challenges posed by climate change, especially through the National Strategy for Adaptation to Climate Change and its development through the different work programs, the The relationship between adaptation to climate change and disaster risk reduction has received little attention both in terms of regulations and in the development of operational tools. There are many strategies about climate change which talk about vulnerability and resilience and point out its importance in disaster risk reduction, however, these strategies do not develop or design specific tools, methodologies or action plans. In practice, adaptation to climate change and risk management are covered by different strategies, most of them sectoral strategies and in many cases contradictory with each other. Especially relevant is the consideration of urban spaces as risk territories, as these concentrate more than 80% of the country's population and it is in these areas that most of the activities for generating resources are carried out. In Spain, the municipalities have the Civil Protection competencies (those with more than 20,000 inhabitants) for the prevention, mitigation and response to natural risks, and also have the competences of spatial planning through the General Plans of Urban Planning and therefore they have a very important role in the configuration of land uses. An adequate urban planning is the best tool to reduce the exposure of people and goods to natural hazards and reduce the vulnerability of the population. In this regard, the preparation of risk mapping in urban planning as required by Article 15 of the Land Law of 2018 is essential to increase knowledge about risks and incorporate this knowledge into planning. In addition, the preparation of the Spanish Urban Agenda and participation in networks of resilient cities are ideal opportunities to integrate communication and risk management, strengthen social and institutional capacities and promote the exchange of experiences.
References List

81
CEDEX (Centro de estudios hidrográficos (2017): Evolución del impacto del cambio climático en los recursos hídricos y las sequías en España. Informe técnico para Ministerio de Agricultura, Alimentación, Pesca y Medio Ambiente. Madrid. EEA (2016): Climate change, impacts and vulnerability in Europe. Copenhagen, Denmark. EEA (2016b): Urban adaptation to climate change in Europe 2016 –transforming cities in a changing climate.Copenhagen, Denmark. IPCC(2007): Cambio climático 2007: Informe de síntesis. Contribución de los Grupos de trabajo I, II y III al Cuarto Informe de evaluación del Grupo Intergubernamental de Expertos sobre el Cambio Climático [Equipo de redacción principal: Pachauri,R.K. y Reisinger, A. (directores de la publicación)]. IPCC, Ginebra, Suiza, 104 págs. IPCC (2012): Managing the Risks of Extreme Events and Disasters to Advance Climate Change Adaptation. A Special Report of Working Groups I and II of the Intergovernmental Panel on Climate Change [Field, C.B., V. Barros, T.F. Stocker, D. Qin, D.J. Dokken, K.L. Ebi, M.D. Mastrandrea, K.J. Mach, G.-K. Plattner, S.K. Allen, M. Tignor, and P.M. Midgley (eds.)]. Cambridge University Press, Cambridge, UK, and New York, NY, USA, 582 pp. IGN (1980): El terremoto de Andalucía del 25 de diciembre de 1884. Instituto Geográfico Nacional. Madrid, España. IPCC (2014): Cambio climático 2014: Impactos, adaptación y vulnerabilidad – Resumen para responsables de políticas. Contribución del Grupo de trabajo II al Quinto Informe de Evaluación del Grupo Intergubernamental de Expertos sobre el Cambio Climático [Field, C.B., V.R. Barros, D.J. Dokken, K.J. Mach, M.D. Mastrandrea, T.E. Bilir, M. Chatterjee, K.L. Ebi, Y.O. Estrada, R.C. Genova, B. Girma, E.S. Kissel, A.N. Levy, S. MacCracken, P.R. Mastrandrea y L.L. White (eds.)]. Organización Meteorológica Mundial, Ginebra, Suiza, 34 págs. (en árabe, chino, español, francés, inglés y ruso). Martín-Vide, J. (1996): “Decálogo de la pluviometría española, clima y agua”, in Marzol, J. et al. (eds.) III Reuníón Nacional de Climatología, Grupo de Climatología de la A.G.E., 15-24. MAPAMA (2016): Perfil ambiental de España. Capítulo 2.18 Desastres Naturales y tecnológicos. Madrid, España. Olcina Cantos, j. (2009): “Cambio climático y riesgos climáticos en España”, en Investigaciones Geográficas, 49, 197-220. Olcina Cantos, J., Morote, A. & Hernández- Hernández, (2018): Los riesgos naturales en la ordenación urbana municipal. Legislación del suelo y cartografías de riesgo, in Cuadernos Geográficos (in press). Renn and Klinkee (2013): “A Framework of Adaptive Risk Governance for Urban Planning”, in Sustainability, 5, 2036-2059 UNDESA (2010): World urbanization prospects: The 2009 revision highlights. New York, NY, USA

82
UNISDR, 2015: Sendai Framework for Disaster Risk Reduction 2015-2030. Vargas, J., La Calle, A., Hernández-Mora, N., y Paneque, P. (2018): Gestión de sequías en España. Retos y oportunidades de la gestión y planificación de sequías en pequeñas y medianas poblaciones. Zaragoza, España. Fundación Nueva Cultura del Agua.

83

84
Chapter 7. Resilience Frameworks Netherlands Diana Reckien and Richard Sliuzas
University of Twente(The Netherlands)
Introduction
The Netherlands are one of the front-runner countries when it comes to acting on climate change. It is likely to soon be among the seven countries worldwide that have passed a ‘climate law’.
On June 28th 2018, after months of negotiations, a parliamentary fraction of seven parties have reached an agreement on a new Climate Act. The proposed law would bind the Netherlands to reduce its CO2 emissions by 49% in 2030 and 95% in 2050, as compared with emission levels in 1990. The proposed law is now with the Council of States (the Dutch Senate) for advice. Due to the broad support of the law it is expected that it will pass the Dutch Senate without delay after the summer. Should the law be adopted, the Netherlands will be the 7th country in the world with its own Climate Act after the United Kingdom, Sweden, Norway, Denmark, Finland, France and Mexico.
But the Netherlands are not only a front-runner when it comes to climate change mitigation, the country is also in the process and in need of large-scale climate adaptation. With about 26% of the Netherlands being below sea level (Schiermeier 2010), it is a low-lying country characterised by an abundance of water. The Netherlands borders the North Sea region of the North Atlantic Ocean, with several major rivers flowing through the country into the ocean forming an extensive delta region. During the course of the 19th century, the country closed off a number of previous ocean bays and river arms by large dikes making artificial lakes, such as the IJsselmeer, in order to use the water bodies for human purposes, manage flood waters, and calm the coast. In essence, the whole country is a large delta region and therefore in need of comprehensive and smart water management. This need is amplified with changing climatic conditions.
1. The National Level Framework: Dutch National Climate Adaptation
Strategy (NAS) - Adapting with ambition
The Netherlands adopted its first National Adaptation Strategy in 2007. Called “Make Space
for Climate”, this strategy sets out the general policy for tackling the effects of a warming
climate. In 2013, the national government published the “Climate Agenda”, and integrated
climate mitigation and adaptation approach. As regards adaptation, the report reiterated the
goals of the previous adaptation strategy from 2007 and announced that a new
comprehensive and integrated National Adaptation Strategy will be developed in the coming
years. In December 2016 the Council of Ministers adopted the current National Climate
Adaptation Strategy (EEA 2018). As a follow up to the strategy, in 2017, the Climate
Adaptation Implementation Programme was started (see Fig. 1).
Imagen 1 – Temporal development of Climate Resilience Planning in the Netherlands.

85
(Fuente: Kennisportaal Ruimtelijke Adaptatie, 2018)
Climate adaptation in the Netherlands is understood as a comprehensive process of “climate
proofing”. The National Climate Adaptation Strategy shows the effects of climate change in
the Netherlands as well as the high impact risks that urgently need to be addressed. The
approach is to launch new adaptation initiatives and to support and accelerate existing
adaptation initiatives and practices. The national government wants to cooperate with local
governments, industry and citizens to invest in these practices and in the development of
policies and research that firmly supports them, in order that the Netherlands will soon be

86
adequately prepared for climate change. The NAS envisaged 6 steps of climate resilience
planning (or climate adaptation, or climate proofing), as laid out in Fig. 2.
Imagen 2 – The six steps of Climate proofing as envisaged by the Dutch National
Adaptation Strategy (NAS).
(Fuente: Kennisportaal Ruimtelijke Adaptatie, 2018)
An important building block to the new adaptation strategy is an overall assessment of the
risks and opportunities arising from climate change, particularly looking at nine social and
economic sectors as shown in Fig. 3, namely: water/ spatial planning, agriculture/
horticulture/ fisheries, nature/ biodiversity, health, recreation/ tourism, infrastructure, energy,
ICT and safety and security. These sectors are assessed for the potential impact of four
climate risks, i.e. increasing temperature, increasing and decreasing rainfall, and rising sea
levels.
Imagen 3 – Climate trends affect 9 economic and social sectors - Infographic of the
National Adaptation Strategy (NAS).

87
(Fuente: Kennisportaal Ruimtelijke Adaptatie, 2018)
Thereby the new National Adaptation Strategy adopts a comprehensive approach, going
beyond the water related focus of the previous strategy and related Delta Programme (see
section ‘national and regional adaptation programs’). Strikingly, cross-sectoral cascading
effects (Fig. 4) are also addressed as are the effects of climate change in other countries
with potential impacts on the Dutch society and economy (within and outside Europe).
Imagen 4 – Cross-sectoral cascading effects of climate change impacts as envisaged
and addressed in the Dutch National Adaptation Strategy.
(Fuente: Kennisportaal Ruimtelijke Adaptatie, 2018)

88
The NAS has been developed in close cooperation with stakeholders. To this end, three
national workshops were held as well as a national climate summit, all bringing together
representatives from different government levels, knowledge organisations and the private
sector.
Various projects have been initiated to support the implementation of the strategy, stressing
an adaptation need with regard to the following aspects:
- Heat stress, in particular looking at vulnerable societal groups
- Failure of infrastructure networks, mainly as related to extreme weather conditions
- Frequent crop damage and other damages in agriculture and horticulture due to
extreme weather conditions
- Shifting climate zones, related to gradual climate change
- Reduction of health, labour and others costs, following a possible increase in
infections, allergies and other health-related impacts
- Cascading effects (see Fig. 4)
The National Adaptation Strategy announces the development of a Monitoring and
Evaluation framework for climate change adaptation. This is currently under development
with the Netherlands Environmental Assessment Agency (PBL). This system will primarily
look into progress with the adaptation policies (=process), but also seeks transparency with
regards to implementation (=output) and effectiveness (=outcome) of actions.
2. The National Level Implementation
Within the framework of the National Adaptation Strategy several programs for climate
adaptation are set up. One of the largest programs is the Delta Programme. It started in
2010 and concurrently re-evaluates the water management strategy and spatial planning in
light of long-term climatic change. The Delta Programme is a nationwide programme, in
which the national authorities as well as provinces, (regional) water boards, and local
authorities work together with NGO’s, knowledge institutes, companies and citizens in order
to innovatively and comprehensively manage the complex issue of water supply and
demand, including flood waters, droughts and storm surges, in the Netherlands. The
objective of the Delta Programme is to protect the Netherlands from (coastal and river)
flooding, to work towards a climate resilient country, and to ensure adequate supplies of
freshwater for the current and future populations (EEA 2018).
The legal framework for the implementation of the Delta Programme is the Delta Act on
Flood Safety and Freshwater Supply (short Delta Act). The Delta Act came into force on 1st
January 2012. It anchors the role of the Delta Commissioner, the Delta Programme, and the
Delta Fund (EEA 2018).
The Delta Commissioner, a special government commissioner, is leading and directing the
development and implementation of the Delta Programme. Every year the Delta
Commissioner reports to the Cabinet about progress and advises on necessary steps. On
89
behalf of the Cabinet the Minister of Infrastructure and the Environment (politically
responsible for the Programme and the Funding) presents the Delta Commissioner's annual
report to the Parliament supplemented with an appropriate policy response. The provinces,
municipalities, the regional water boards, as well as NGOs, are closely involved in
developing this annual report (Delta Programme 2018; EEA 2018).
The Delta Programme sets out the strategic focus areas to work for climate resilience over
the coming years. In the first stage, it included extensive research to identify the climate
challenges and to explore potential solutions. This research has resulted in 12
recommendations to increase the protection level of the Netherlands and 5 Delta decisions.
These decisions pertain to the standards for dikes and dams, the availability and distribution
of freshwater, the water level of the IJsselmeer, ways to keep the river Rhine estuary and
Drechtsteden area safe without losing its economic value, and ways to take account of water
in the construction of neighbourhoods and districts. Solidarity between regions and between
generations, sustainable development and flexibility are the three key principles of the Delta
Programme (Delta Programme 2018).
The Delta Fund is used to finance the projects of the Delta Programme. The Delta Fund
holds money dedicated by the national government for the implementation of measures and
research needs. It has an average budget of 1.2 billion € per year up to and including 2030.
Every year the Delta Commissioner will present an advice on how to target the budget on
necessary measures and supporting research in the annual Delta Programme. The Delta
Program Commissioner assumes that the Cabinet will continue to fund the program after
2030, due to the major tasks in the decades ahead. The fund will be highly significant for
credible and timely delta-management in the coming decades (Delta Programme 2018; EEA
2018).
Interim decisions will take account of uncertainties around the future impact of climate
change as well as spatial and socio-economic developments. The approach here is the so
called ‘adaptive delta management', choosing the kind of necessary measures that keep
options open for later adjustment. In the process all relevant material, results of research
and knowledge programmes (‘Knowledge for Climate'), experience from international
cooperation (e. g. ‘Netherlands Water Partnership', ‘Partners for Water', ‘Delta Alliance' and
Connecting Delta Cities), and assessments by the Netherlands Environmental Assessment
Agency (such as the study ‘Climate Adaptation in the Dutch Delta - Strategic options for a
climate-proof development of the Netherlands') are taken into account. Adaptive delta
management based on sound knowledge used in a future oriented Delta Programme is
essential for cost-effective investments (Delta Programme 2018; EEA 2018).
The process of developing the Delta Act involved significant amounts of consultations and
participation. Participation in legislation and planning decisions is a legal requirement, and
it is embedded in Dutch culture. The so-called “polder model” of planning and decision
making refers to the need to collectively manage the land and water resources of this low-
lying flood prone the country. Although it is a national program many of its actions are taken
at sub-national levels by public and private organizations and citizens. Engaging these
actors is therefore an essential part of the program.

90
3. Dutch Regional Level Frameworks: Delta Plans
As part of the National Delta Programme 2018 three focal areas were established, leading
to three so-called Delta Plans. The aim is that flood risk management, freshwater supply
and spatial planning will make the country climate-proof and water-resilient by 2050, so that
the Netherlands will be able to cope with the increasing weather extremes. For that reason
the government now focuses on three areas:
1. Delta Plan on Flood Risk Management: New flood protection standards will not only
be linked to the probability of flooding, but also to the impact of a flood. The scope of the
impact is the decisive factor. As part of the Delta Plan on Flood Risk Management the
country conducts implementation programmes/ measures, such as ‘Room for the River’, ‘the
IJsselmeer Closure Dam’ project, a.o. (Deltaprogramma 2018).
2. Delta Plan on Freshwater Supply: The availability of freshwater for agriculture,
industry and nature will become more predictable.
3. Delta Plan on Spatial Adaptation: It is envisaged to make the Netherlands more
climate-proof and water resilient through appropriate and comprehensive spatial planning
measures (Delta Programme 2018).
The Delta Plan on Spatial Adaptation, added in 2018, goes back to an agreement between
the national government and the Dutch provinces signed in 2009, which explicitly calls for
mainstreaming adaptation into spatial planning. Today most provinces have developed
climate adaptation action programmes. Priorities are ‘no regret' options and mainstreaming
climate adaptation into water management, spatial planning, nature policy, agriculture and
economic policy. Next to these programmes, sector (infrastructure, nature, health etc.)
specific adaptation measures are in the process of being created or are already being
implemented (Delta Programme 2018; EEA 2018).
4. Dutch Regional Level Implementation of Delta Plans - Example Rhine
Estuary (Overijssel)
Regional level implementation of the National Level Delta Program in the Netherlands is not
organised based on provinces or administrative regions, but along river catchments, delta
regions and coastal areas (see Figure 5a). In the current program following eight regions
are centre of attention (Fig. 5b):
1. IJsselmeer Region/freshwater supply region IJsselmeer Region
2. Rhine (Rijn) Estuary-Drechtsteden/West-Netherlands freshwater supply region
3. Rhine (Rijn)/ Area around the major rivers freshwater supply region
4. Meuse (Maas)
5. Southwest Delta/Southwest Delta freshwater supply region
6. The Coast
7. Wadden Region
8. Elevated Sandy Soils South and East
In these regions, attention and problem foci can vary, but regions need to work towards
implementing the three Delta Plans (Delta Plan on Flood Risk Management, Freshwater

91
Supply and Spatial Adaptation). As part of implementation regions have to report on
progress, on their integrated implementation approach and on the participation strategy.
Imagen 5a – River basins of the major
rivers in the Netherlands.Key: Rijn =
Rhine; Maas = Meuse.
(Fuente: Adapted from Wereldwijs-
Reggesteyn, 2019)
Imagen 5b –Topography of large rivers and
waters of the Netherlands against the
distribution of provinces in the Netherlands.
(Fuente: Adapted from Topomania, 2018)
As one of the local case study areas, (see chapter 13) will introduce a practice example and highlight
the experiences of implementation from two localities in the River Rhine area (Fig. 5a - Rijn area).
The next section, X.5, introduces a local resilience framework.
5. Local Level Resilience Framework: Rotterdam
As outlined above, climate adaptation and resilience strategies in the Netherlands are
strongly organised along the National Adaptation Strategy and its regional implementation.
Local authorities heavily rely on these national frameworks as adaptation service, resources
and guiding material allowing for a coherent approach and implementation. In fact, few cities
in the Netherlands have separate local climate change adaptation or resilience frameworks
in place (Reckien et al. 2018).
Rotterdam is the exception. It has both, a separate Climate Change Adaptation Strategy
(City of Rotterdam 2018) and a Resilience Strategy (City of Rotterdam 2017). Possibly due
to its size and location at the sea, and therefore international relevance as port city, decisive
for the European trade economy, Rotterdam is highly vulnerable to projected climate change
impacts. This elevated vulnerability has required and inspired Rotterdam to become a front-
runnner city as regards, climate adaptation. With it came international recognition for its
climate adaptation initiatives and its international accessibility (Rockefeller Foundation

92
2017). It is part of a world-wide resilience program “100 Resilient Cities”, funded by the
Rockefeller Foundation (Rockefeller Foundation 2017). It is also--together with the Dutch
City of Groningen--hosting the Global Centre of Excellence on Climate Adaptation
(GCECA)(Rockefeller Foundation 2017). The GCECA is an international knowledge centre
to help countries, institutions and businesses adapt to a changing climate, initiated by the
country of Japan and UN Environment. The cities were chosen based on factors such as
the cities’ location, expertise on the impact of climate change, and innovative office
buildings. Continuing with its groundbreaking adaptation work, Rotterdam is exploring the
possibility of building a new climate-neutral floating office building for the climate centre staff.
Resilience as understood and employed by the City of Rotterdam is a city when it is able “to
recover quickly and to bounce back to become stronger” (The City of Rotterdam 2017, p.14).
Guided by an underlying vision containing 7 objectives (see Fig. 6) and 68 action campaigns,
Rotterdam aims to enhance the city’s resilience – aiming to ensure that Rotterdam will be
prepared to embrace the opportunities and challenges of the 21st century.
Imagen 6 – The seven qualities of Rotterdam’s Resilience Strategy.
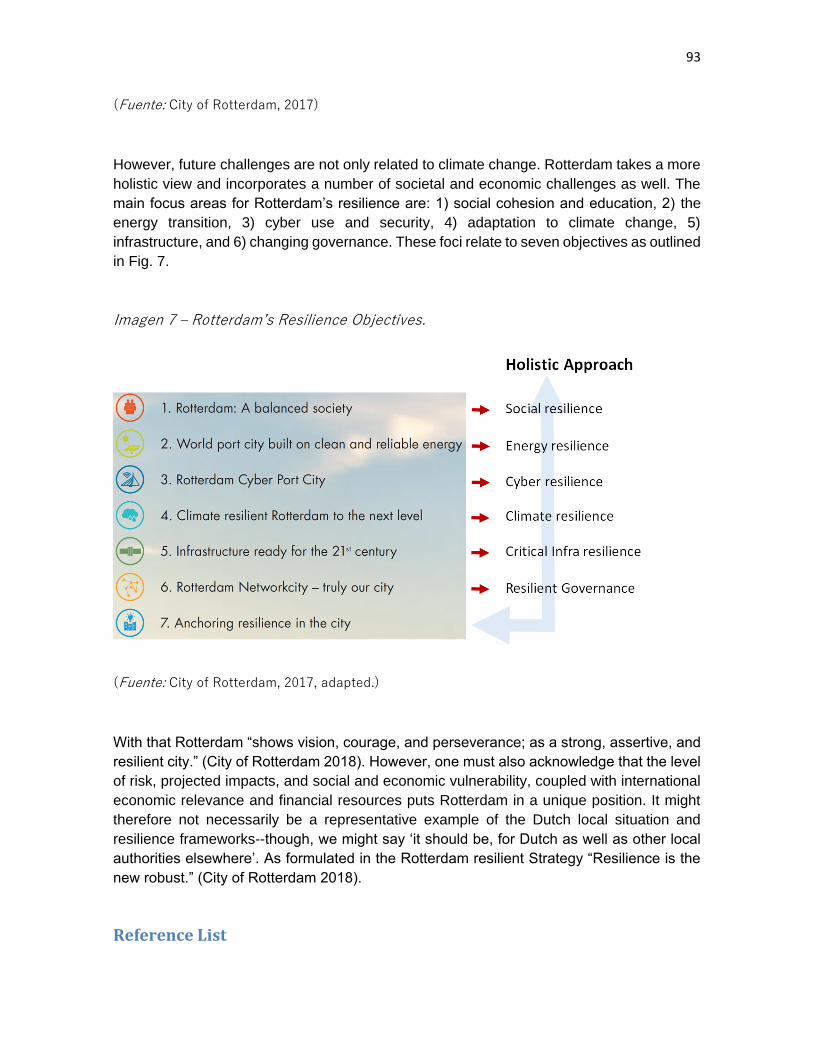
93
(Fuente: City of Rotterdam, 2017)
However, future challenges are not only related to climate change. Rotterdam takes a more
holistic view and incorporates a number of societal and economic challenges as well. The
main focus areas for Rotterdam’s resilience are: 1) social cohesion and education, 2) the
energy transition, 3) cyber use and security, 4) adaptation to climate change, 5)
infrastructure, and 6) changing governance. These foci relate to seven objectives as outlined
in Fig. 7.
Imagen 7 – Rotterdam’s Resilience Objectives.
(Fuente: City of Rotterdam, 2017, adapted.)
With that Rotterdam “shows vision, courage, and perseverance; as a strong, assertive, and
resilient city.” (City of Rotterdam 2018). However, one must also acknowledge that the level
of risk, projected impacts, and social and economic vulnerability, coupled with international
economic relevance and financial resources puts Rotterdam in a unique position. It might
therefore not necessarily be a representative example of the Dutch local situation and
resilience frameworks--though, we might say ‘it should be, for Dutch as well as other local
authorities elsewhere’. As formulated in the Rotterdam resilient Strategy “Resilience is the
new robust.” (City of Rotterdam 2018).
Reference List

94
City of Rotterdam. 2013. Rotterdam Climate Change Adaptation Strategy. http://www.rotterdamclimateinitiative.nl/documents/2015-en-ouder/Documenten/20121210_RAS_EN_lr_versie_4.pdf. Accessed 1 August 2018.
City of Rotterdam. 2017. Rotterdam Resilience Strategy. http://www.rotterdamclimateinitiative.nl/documents/2015-en-ouder/Documenten/20121210_RAS_EN_lr_versie_4.pdf. Accessed 1 August 2018 City of Rotterdam. 2018. Rotterdam Resilient City. https://www.resilientrotterdam.nl/en/rotterdam-resilient-city. Accessed 1 August 2018 Delta Programme. 2018. Continuing the work on a sustainable and safe delta. Source: https://deltaprogramma2018.deltacommissaris.nl/viewer/publication/1/2-delta-programme-#. Accessed 26 July 2018 Delta Programma. 2018. Delta plan on flood risk management. Source: https://deltaprogramma2018.deltacommissaris.nl/viewer/paragraph/1/1-delta-programme-/chapter/appendix-i/paragraph/delta-plan-on-flood-risk-management#. Accessed 2 August 2018 European Environment Agency (EEA). 2018. European Climate Adaptation Platform - Country Information / Netherlands. Source: https://climate-adapt.eea.europa.eu/countries-regions/countries/netherlands. Accessed 26 July 2018 Kennisportaal Ruimtelijke Adaptatie.2018. National climate adaptation strategy 2016 (NAS). Source: https://ruimtelijkeadaptatie.nl/english/nas/. Accessed26 July 2018 Reckien, Diana, MonicaSalvia, Oliver Heidrich , Jon Marco Church, Filomena Pietrapertosa, Sonia De Gregorio-Hurtado, Valentina D'Alonzo, Aoife Foley, Sofia G. Simoes, Eliska Krkoška Lorencova, Hans Orru, Kati Orru, Anja Wejs, Johannes Flacke, Marta Olazabal, Davide Geneletti, Efren Feliu, Sergiu Vasilie, Christiana Nador, Anna Krook-Riekkola, Marco Matosović, ParisA. Fokaides, Byron I. Ioannou, Alexandros Flamos, Niki-Artemis Spyridaki, Mario V. Balzan, Orsolya Fülöp, Ivan Paspaldzhiev, Stelios Grafakos, Richard Dawson. 2018. How are cities planning to respond to climate change? Assessment of local climate plans from 885 cities in the EU-28. Journal of Cleaner Production. doi:10.1016/j.jclepro.2018.03.220 . Rockefeller Foundation.2017. Rotterdam Awarded Global Centre of Excellence on Climate Adaptation. https://www.100resilientcities.org/rotterdam-awarded-global-centre-excellence-climate-adaptation/. Accessed 1 August 2018 Schiermeier, Quirin. 2010. Few fishy facts found in climate report. Nature 466: 170. doi:10.1038/466170a. Topomania. 2018. Topografie Grote rivieren en wateren van Nederland. Source: https://www.topomania.net/mapinfo/312Accessed26 July 2018 Wereldwijs-Reggesteyn. 2019. River basins of the major rivers in the Netherlands. Source: http://wereldwijs-reggesteyn.yurls.net/nl/page/946925. Accessed26 July 2018

95
Chapter 8.Resilience Frameworks in National
Policies and Territorial Planning in Uruguay.
Adriana Goñi Mazzitell, Isabel Gadino, Ingrid Roche and Pablo Sierra
Universidad de la Republica (Uruguay)
Introduction
Uruguay is known in Latin America for its strong political, social and economic stability,
which is supported by a legal and robust democracy. This is essential to work on public
policiesin orderto reach solid results in the long term. In this chapter we describe, on the
one hand, how actions and strategies in climate change and urban resilience have grown
at the National level in recent years and, on the other hand, how current territorial urban
planning policies incorporate this new knowledge in order to create better and more
efficient effects in prevention and mitigation to deal with this issue.
1. Development of the legal and institutional frameworks
Uruguayan government participate actively in international Summits in order to achieve the
United Nations Framework Convention on Climate Change (UNFCCC) objectives. It
declares the aim to build a sustainable, resilient and low-carbon country, by enduring efforts
and capacities, which means incorporate these topics to public policies and actions in
different sectors.
Based on the executive summary of Uruguay’s Fourth National Communication to the
Conference of the Parties in the UNFCCC on 2016, the main topic on Climate Change that
worried the country in 2015, was the water deficit that had a strong impact on the agricultural
sector, causing major economic losses. While in other Latin American countries, that counts
on fossil fuel or other main natural sources for their economies, this problem could be not
so much important, for Uruguay the agricultural and livestocksector is a central motor for its
economy, therefore a priority to Climate Change policies (Hareau et al. 1999).
In addition to this, the regional climate scenarios show an increase in rain-fall and
temperatures with a strong influence of the El Niño–Southern Oscillation (ENSO)
phenomenon. That means in the same year, 2015, severe floods in the Departments of

96
Salto, Paysandú and Artigas, north of the country, forced until 25% of the population in these
areas to evacuate their homes. This caused major losses in housing and urban infrastructure
and had a psychosocial impact on the most vulnerable population.
Since 1992 several international agreements were ratified by Uruguayan Government in the
area of Sustainable Development, the government follows-up international measures
defined to avoid the negative effects of climate change. As long as Uruguay has not fossil
fuels, or minerals, the main productive sector is the agricultural and livestockone (Achkar et
al. 2016), that means government focus on create systems to protect, mitigate and adapt
rural environments from extreme events, like floods and droughts, hurricanes and other
periodic phenomenon that El Niño–Southern Oscillation (ENSO) phenomenon takes year
after year (FAO-Project; Bidegain et al. 2013).
At the first decade of the XXI Century, the National Emergency System was created,
including urban areas, helping to understand and mitigate some of the worst effects that
increase with the strong winds in the costs, and floods in poor slums or deprived areas of
the cities.
The Ministry of Housing, Territorial Planning and Environment (MVOTMA) became the focal
point and competent national authority in charge of enforcing the United Nations Framework
Convention on Climate Change (UNFCCC) and the Kyoto Protocol. In 2018 MVOTMA
started to elaborate the National Plan on Climate Change, reinforcing the idea that this
should be a central topic for the country in the next years.
If we evaluate these measures we can find that many actions were undertaken, for example,
the country strengthened its domestic capacities to develop national greenhouse gas
inventories, climate scenarios, and to implement pilot projects on adaptation and mitigation
technologies and strategies. Between 2009 and 2014, with the creation of the National
Climate Change and Variability Response System (SNRCC) and the participatory
development of the National Climate Change Response Plan, the topic is brought to the
forefront.
The main objective of these tools is to create an inter-institutional and cross-sectorial
coordinated work, as well as to analyze the national and local impact of climate change
related problems and develop strategic guidelines for the year 2050 within a model of
sustainable, inclusive, low carbon and climate change resistant development.

97
In this period, climate change and variability has become part of national strategies and
public policies, that should be applied to sectors such as energy, agriculture, tourism, health,
disasters risk and water resource management.
As of 2015, the Administration strengthened its commitment to achieve sustainable and
resilient development in the country. This can be seen in the support given to the SNRCC,
in the creation of a political management position for all climate change affairs within the
MVOTMA, and in the creation of the National Environmental System (SNA), the National
Environmental Cabinet and the National Environment, Water and Climate Change
Secretariat (SNAAC) under the higher authority of the country, the Executive Power.
2. Academic and civil society support
Following this strategy, a particular support was given to the research on climate change
and variability that the country starts to produce, which has helped to promote and
consolidate knowledge creation and research teams at different institutions, in order to start
collaborative and supplementary lines of work. For example, the Interdisciplinary Network
of the Universidad de la República (UdelaR), a horizontal grid integrated by: a) Urban Waters
Planning & Management; b) Interdisciplinary Response Center to Climate Change and
Variability (CIRCVC); c) Interdisciplinary Center for the Integrated Coastal Management of
the Southern Cone (MCISur); d) South American Institute for Resilience and Sustainability
Studies (SARAS). The National Climate Change Response System put together a Task
Force on Indicators of Variability and Social Vulnerability to Climate Change, which has
demanded thorough interdisciplinary and cross-sectional work to draw input for further
assessment on the social vulnerability of our country.The coordination happened also with
other sectors of applied research, government agencies and regional research centers.
Since climate change studies take on a strong territorial component, several research/action
lines have been developed to validate adaptation and mitigation strategies in different
sectors, thus, allowing for multidisciplinary and cross-sectorial efforts, engaging national and
local governments, NGOs, farmers and urban local communities.
That means several institutions in the country have been engaged in meteorological and
climate information generation and climate services, providing essential inputs for the
different sectors in the Uruguayan economy to plan their undertakings and to protect the
population.

98
However, there are still shortcomings both in the quality of the information produced and its
utilization as long as the efforts have mainly been focused on: the development of a Flood
Early Warning System to forecast and manage floods in the priority cities of Durazno and
Artigas (middle and north of the country); the development of a Climate Index Insurance in
Uruguay for different sectors in farming production; the development of instruments to
monitor water excess and droughts in the country; and the rollout of the National Climate
Database.
The information before shows thatsome progress has been made towards the development
of additional information systems, in order to supplement efforts to manage the impacts of
climate changealthough many of them are currently under development: the Environmental
Information System (SINIA), National Environmental Observatory (OAN), National
Agricultural Information System (SNIA), Information and Support System for Decision
Making (SISTD) for climate risk management in agriculture, the GIS viewer of the National
Emergency System, and the National GHG Inventory System. There is still a great need to
discuss how to deal with the vulnerability that Uruguay confronts, by thinking how different
actors could create capacities to act a coordinated resilience strategy.
As Borrego states:
“The concept of vulnerability includes a complex and dynamic reality. Besides referring
to the possibility that a system is negatively affected by something (a stressor), it is also
a relative property defining both the sensitivity and the capacity to deal with that stress.
Therefore, vulnerability cannot be defined by the stressor alone, nor can it be
represented strictly by internal properties of the system being stressed. Instead, it must
be considered as an interaction of these factors, expressed by the sum of several
dimensions: exposure, sensitivity, and capacity to adapt” (Borrego et al 2015, p. 381).
3. Climate Change in territorial and urban planning
From the territorial and urban planning point of view, the creation of The Territorial Planning
and Sustainable Development Law (Ley de Ordenamiento Territorial y Desarrollo Sostenible
LOTDS N.18308, 2008), gives a framework for streamlining actions and management of
great importance. The law allows, and has progressively enabled to, deploy several tools of
planning at different levels, for example, National and Regional Guidelines for Territorial
Planning and Sustainable Development, Strategic Environmental Assessment Protocol,

99
Local Plans, Special Plans, among others. Thanks to the law new planning initiatives in the
country are applied with a gradualrecognition of their importance, including social
participation and environmental awareness of the impact on territorial development.
Uruguay is divided in nineteen regions, called epartments, the Departamental and city
governments had been including the climate change and variability in local plans for
emergency situations, technology replacement and infrastructure arrangements among
other initiatives. Specific inter-institutional areas were created, and progress has been made
regarding knowledge creation and the implementation of adaptation and mitigation
measures.
One of the most important challenges about Climate Change and Urban Policies in
Uruguay,is the need to know exactly which type of phenomena are affecting Uruguay’s
cities. In order to study the problem properly, information and management tools were
incorporated at all levels to address for example, droughts and floods, which were previously
absent in the government management of urban effects.
On the second hand, particular attention was given to coastal ecosystems, as long as
coastal areas are central to urban development and tourism in Uruguay and are at the same
time a natural barrier against sea level increase and high wind storms (Gadino et al, 2012).
This last topic was identified by academic research and social movements, but not by the
touristic and real estate sector that continue making unsustainable urban development in
coastal areas, in some cases with the acceptance of local governments, which don’t create
economic alternatives to such environments (De Álava, 2008).
Finally, another important topic for urban policies is the effects of climate change for the
most vulnerable sectors in urban contexts, especially the flood affected population. Uruguay
is a country with a high level of rain falls, but in the last years the extreme situations between
heavy rains and drought periods have considerablyincreasesed. The Program for Mapping
of Flood-Prone Areas has started recently; it was proposed that cities with more than 10,000
inhabitants should have a map of their flood risk areas in the short term. This mapping will
be part of the Water Information System within the framework of the Environmental
Information System. The delimitation of these areas is a priority for the definition of territorial
policies, in particular for Urban Plans.

100
In this sense, the Law on Territorial Planning and Sustainable Development, LOTDS, in
article 49 states that "territorial planning instruments should guide future developments
towards non-flood prone areas identified by the competent water resources state body”
(LOTDS: 2008).
In order to support planning instruments, The National Relocation Plan was launched. As
Piperno and Sierra stated, it has required the coordination of decentralized policies and
programs together with the efforts of departmental governments, in order toapply a new
interdisciplinary approach to the topic. It is early to determine the results, because the first
experiences are being developed currently, however the prevention aspects are clear and
sign a path to near solutions (Piperno and Sierra 2015).
From the innovation in local administrations, it is important to underline how the elaboration
of local plans for territorial planning, responsible of the departmental level, incorporate risks
maps in a shared work among the first and the second level of government. Furthermore,
systematization of existing information on floods has been carried out under the Program
for Mapping of Flood-Prone Areas (DINAGUA-MVOTMA). The information implies a set of
data processed with order and hierarchy so that they can be understood by the users.
Hence, quality criteria need to be defined in terms of accuracy, consistency, timeliness,
comparability, accessibility to data, metadata with information about the quality of the
curves, presentation of the curves in user friendly and usable formats, and compatibility with
the mapping Spatial Data Infrastructure.
Within this framework, DINAGUA (National Direction of Water at the MVOTMA), performed
a compilation and processing of riparian flood curves, i.e. the area occupied by water during
floods. This compilation comprises the analysis of past flood events and curves resulting
from hydrodynamic studies of watercourses, which estimate the flood curves. The
generation of new information on river flooding implies the articulation of different actors at
various levels. During the Flood Area Mapping Project, protocols were also developed to
generate new information.
According Agrawala,“Analyses of current climatic trends reveal a warming trend in recent
decades with country averaged mean temperature increases of 1.1 °C and 1.9 °C projected
by 2050 and 2100. Climate models also project increased precipitation both in summer and
winter, although there is considerably less agreement across climate models on such
projections. The most significant impacts of climate change are projected to be on Uruguay’s

101
coastal zones, both because of the higher certainty of sea level rise and the high exposure
of critical economic and natural resources on the coastline. On the other hand, many other
sectors dependent on natural resources – including forestry, agriculture and livestock – offer
considerable potential for mitigating climate change through carbon sequestration. Natural
resource management therefore is a critical link in Uruguay’s efforts to both adapt to and
help mitigate climate change”. (Agrawala et al. 2004).
From the urban planning point of view, the Department of Urban Planning (ITU) at the
Faculty of Architecture, Design and Urban Studies, UDELAR has made significant
contributions for flood management in the country, in particular in the characterization of the
vulnerability of the exposed areas and started to work on how to incorporate Climate Change
issues to Urban and Territorial Planning.
Reference List
Achkar, M., Díaz, I., Domínguez, A. & Pesce, F. 2016. Uruguay. Naturaleza, Sociedad, Economía. Montevideo, Uruguay: Ed. Banda Oriental.
Agrawala S., Mohener A., Gagnon –Lebrun, F., Baethgen D., Martino L., Lorenzo E., Hagenstad M., Smith J. & van Aalst M. 2004. Development and climate change in Uruguay: Focus on Coastal zones, agriculture and forestry. Working Party on Global and Structural Policies, Working Party on Development Co-operation and Environment,OECED.
Altman L. & Martínez, E. 2016. Entre la macrocefalia estructural y el policentrismo emergente. Modelos de desarrollo territorial en el Uruguay (1908-2011). Montevideo, Uruguay: Ed. CSIC, UDELAR.
Bidegain, M., Crisci, C., del Puerto, L., Inda, H., Mazzeo, N., Taks, J. & Terra, R. 2013. Clima de cambios: Nuevos desafíos de adaptación en Uruguay. Proyecto FAO MGAP. TCP URU/3302.
Borrego, C., Lopes, M., Martins, H. & Rafael, S. 2015. Urban vulnerability and resilience to climate change. WIT Transactions on Ecology and The Environment, 198. Retrieved from www.witpress.com.Accessed 13 June 2018.
DINAMA & JICA, 2011 Informe Cooperación Internacional. www.auci.gub/pdfs/jica.pdf.
Accessed 23 August 2017.
Conde, C., Piperno, A. & Quintans, F. (Coord). 2015. Urban Water Supply in Uruguay: Progress Made and Challenges to Integrated Management. In IANAS, Urban Water Challenges in the Americas. A perspective from the Academies of Sciences. 524-555. Mexico: Ed. IANAS and UNESCO.
De Alava, D. 2008. Proyecto de Restauración Sistema de Playas y Dunas Frontales de la Bahía de Portezuelo, Informe para Unión Vecinal de Punta Ballena.www.puntaballena.org/servlet/com.qportal.servlet.GetHttpFile?typefile=d&contentid=977&version=1&disposition=d&filename=1._Restauracion_de_dunas._UVPB_2008. pdf.Accesed 16 August 2018.

102
FAO MGAP. TCP URU/3302. (2013). Compilación Final. Clima de cambios: Nuevos desafíos de adaptación en Uruguay. www.fao.org/3/a-au192s.pdf.Accessed 25 July 2018.
LOTDS (2008). Ley Ordenamiento Territorial y Desarrollo Sostenible. Marco Regulador General. www.parlamento.gub.uy/documentosyleyes/leyes/ley/18308.Accessed 25 July 2018.
Gadino, I., Brazeiro, A., Gutiérrez, O., Panario, D. & Roche, I. 2012. El modelo actual de desarrollo turístico al oeste del balneario La Paloma, Rocha, Uruguay. Tendencias, riesgos y propuestas. Sustentabilidade em Debate,Vol. 3N°2. 21.39. Retrievedfromhttp://periodicos.unb.br/index.php/sust/issue/view/790.Accessed 2 May 2018.
Goñi Mazzitelli, A., Roche, I., Sierra P., Gadino, I. 2018 Incorporatingresilience and adaptive strategies to climate change in urban and territorial planning in Uruguay. In Urban Climate Changes in Latin-American Cities. Edited by Cristián Henriquez and Hugo Romero, Springer (on printing).
Hareau, A., Hofstader, R. &Saizar A. 1999. Vulnerability to climate change in Uruguay: potential impacts on the agricultural and coastal resource sectors and response capabilities. ClimateResearch, 12, 185–193.
MVOTMA 2015: Atlas de la Cuenca del Río Santa Lucía.www.mvotma.gub.uy/sala-de-prensa/item/10007499-atlas-de-la-cuenca-del-rio-santa-lucia.html. Accessed 23 May 2018.
MVOTMA_SNRNC 2016 Cuarta_Comunicación_Nacional_a la Conferencia de las Partes en la Convención de las Naciones Un. www.mvotma.gub.uy/comunicaciones-nacionales-y-
burs.html.Accessed 2 June 2018.
Piperno, A., Sierra, P. 2015. Análisis de la interacción del sistema hídrico con el sistema territorial: el caso de Uruguay. Geografía Aplicada en Iberoamérica. 543-572). El Colegio Mexiquense.
SINAE, Presidencia de la República 2013 La Gestión del riesgo de desastres en Uruguay. www/sinae.gub.uy/. Accessed 5 June 2018.

103
SECTION II. Climate resilience
experiences and practices
Santiado Arango Universidad Nacional de Colombia
In recent years, society has become more aware of the enormous risks that climate
change poses for cities; the increase in temperature and sea level, more intense
storms, droughts and heat waves, are a reflection of the eventual and increasingly
frequent threats to which they are exposed. In fact, the recent IPPC report shows
that the climate risk is increasing with critical consequences to humanity that could
be catastrophic. The target to stabilize the temperature under 1.5 C° is getting
difficult, and we are on the way to reach 3 C°. In this sense, there are still a number
of opportunities, but they come with a cost. It certainly implies that we must adapt
for the changes that are upon us.
Climate change brings new risk. In order to reduce the risk and impact of these
threats, cities must work to increase their resilience by incorporating it as a priority
in urban planning, involving a wide range of stakeholders including civil society, local
and national governments, the private sector and the academy. There should be
taking into account that the strategies adopted at the local level will have a significant
impact on a global level, taking these strategies from strategy to action.
The adaptation always has to do with the local territories, where it is practically
impossible to have a solution or universal recipes. The case studies have been an
important tool to evaluate the pros and cons of the alternatives. This chapter
presents a series of experiences and initiatives on urban resilience in Europe and
Latin America cities. Although, thanks to geographic and social differences, each
city needs to create its own unique resilience plan, cross-cutting elements are
highlighted for the development of strategies that help increase urban resilience.
Some elements that we observe in common from the cases,it highlights the fact that,
despite the wide spread knowledge, it is still required to increase awareness of
climate change and the individual actions we could take. There is also a need for an
integral view of the problem, and not a collection of individual pieces. Finally, we
have to consider to strongly move from speech and plans to actions and

104
implementation. The message to be conveyed is that resilience and risk reduction
should be part of urban design and strategies to achieve sustainable development.

105
Chapter 9. What resilience to aim for in Brazil?
Readings on São Paulo’s and Belém’s local
practices. Ana Cláudia Cardoso1, José Júlio Lima1 Carolina Moutinho Duque de Pinho2, Luciana
Travassos2 and Katia Canil2
1 Universidade Federal do Pará
2 Universidade Federal do ABC
1. Presentation of the formation processes of São Paulo and Belém
The continental dimensions of Brazil (8.515.767,049 km²) and the diversity of
circumstance of its 5.570 municipalities and regions hinder any effort of comparing
municipalities in such different regional contexts. To compare São Paulo and Belém, it
is necessary to introduce elements of the formation of Brazil, a country that had its
territory appropriated defined by colonial economic cycles and the conditions of
communication with Europe.
The occupation of the Brazilian territory developed from the Atlantic coast in the portion
that today corresponds to the Northeast region and unfolded in two vectors. A vector
followed towards the gold mines of Minas Gerais and the port of Rio de Janeiro. Only in
the 18th century the small village, which was the place of a Jesuit college since 1554,
was raised to the condition of the city of São Paulo, at that time, the connection of the
interior to the port of Santos, by railway, was a starting point for a larger logistics
structure consisting of ports, roads, railways, hydroelectric dams, etc., made possible by
the prosperous and long cycle of coffee occurring between the years 1800 and 1930
(PradoJr, 1989). These elements in addition to the high European migration and the
support of the federal governments in both coffee farming and the industrialization
process allowed the city to take a position of political and economic leadership in the
country at the beginning of the twentieth century, and reached the 21st century as the
seventh largest agglomeration on the planet. São Paulo is the core of a metropolitan
area with 20 million inhabitants and of a mega metropolis with about 33 million, which
still concentrates the largest part of Brazilian industrial production and is articulated by
means of a dense urban network, to the research and production centres of high
technology industry of Brazil (Emplasa, 2017).

106
The second vector of occupation of the territory went towards the north, where Belém
was founded in 1616, to defend the territory from French, Dutch and English
occupations, towards the Amazon. This region was a "frontier Mundi", disputed by five
nations until the 18th century (Becker, 2013), and the privileged location of Belém
sustained it as a port of outflow from all Pan-Amazonia towards the Atlantic, and a
privileged connection point with Europe. The forest product cycles and the pombaline
expectation of making Belém the capital of northern Brazil (Rio de Janeiro was already
capital of the colony and would be the capital of south Brazil according to these plans),
sustained the condition of main metropolis of the region until the 1960s (Correa, 1987),
when the national highways and all the military government's colonization policy for the
Amazon, significantly altered the population and environmental conditions in the region.
The insertion into the international division of work of both cities is very distinctive,
although in the two cases the urbanization has been accelerated and generates many
environmental liabilities. São Paulo has reproduced the trajectory of European industrial
cities, such as the epicentre of industrialization and urbanization, without achieving,
however, the same socioeconomic conditions as those cities, while Belém assimilated
the impacts of the productive system restructuring in an area that covers more than 50%
of the Brazilian territory - the Amazon, assumed as a provider of natural resources, taken
as infinite, and that has been converted to cerrado since the implantation of the federal
highways. The imposition of industrial logic in the Amazon was due to the implantation
of logistical networks and land uses changes, over an ancient pattern of well articulated
with the biome and dispersed occupation. Resistances to the transformations of the
Amazon are still visible, despite the fact that the region already has its population
urbanized since the 1980s, and they can be taken as inspiration for new platforms of
more Biocentric than Anthropocentric urbanization character - like the one that prevailed
in the twentieth century.
Given these considerations, it becomes easier to understand that São Paulo and Belém
have absolutely different socioeconomic, institutional, cultural and environmental
conditions, but that they share the common characteristic of being governed by the
peripheral capitalism, and now liberal, Brazilian government. In this article it is expected
to explore to what extent the realities expressed by these two cities (from the national
and global metropolis of São Paulo and the peripheral metropolis of Belém) were
considered in the formation of the National Civil Defence policy and how the Issues of
civil defence and urban governance could be articulated in each of them.

107
2. The National Civil Defence Protection Policy (PNPDEC) The occurrence of disasters in areas with susceptibility to gravitational movements of
mass - notably landslides in the southeast region where the states of São Paulo, Rio de
Janeiro, Minas Gerais and Espírito Santo, as well as in the South region, especially in
the State of Santa Catarina and in the northeast region, mainly in the states of
Pernambuco and Bahia, in addition to severe floods and inundations that have been
occurring in different regions of the country -, promoted national mobilization for the
need of advances in the coverage of Civil Defence bodies. The scenario of disasters, in
the progressist political context, has delivered the National Civil Defence Protection
Policy (PNPDEC) as the response (Brasil, 2012). To a large extent the Brazilian
progressist political context, between 2003 and 2014, during the Governments of
Presidents Lula and Dilma, was favourable to the construction of an institutional and
technical apparatus to support the PNPDEC. The same can be said with respect to
municipal policies, which have found an institutional environment in which the risk-
affecting issues could move forward. However, the current scenario has already changed
completely.
The PNPDEC was established by Law No. 12.608 of 10 April 2012 (Brasil, 2012) as the
main Brazilian instrument for the management of the disaster risk, aiming to ensure
adequate social, economic and environmental conditions to foster the dignity of and the
promotion of sustainable development. Its determinations include the Union, the States,
the Federal district and the municipalities, which have the duty to take the necessary
measures to reduce the risk of disaster.
The policy dictates which are the responsibilities of the Union, of the States and of the
municipalities: the development of a national disaster prevention culture, to increase the
awareness of the disaster risks in the country, provide the stimulus to prevention
behaviours capable to avoid or minimise the occurrence of disasters; to stimulate the
reorganization of the productive sector and the economic restructuring of disaster-
affected areas; to establish preventive safety measures against disasters in schools and
hospitals located in risky areas; to provide human resources training for civil protection
and defence actions; and to supply data and information to the national system of
information and disaster monitoring.
However, the main objective would be the integration of territorial planning policies,
urban development, health, environment, climate change, water resource management,
geology, infrastructure, education, science and technology and other sectorial policies,
with a view to promoting sustainable development. It also goes back to the elaboration
108
and implementation of Defence and Civil Protection Plans at the three levels of
government, setting short, medium and long-term goals; National disaster information
and monitoring system; National Register of municipalities with areas susceptible to the
occurrence of high impact slides and associated geological processes, floods and
hydrological processes.
Some instruments provided for in law 12.608/12 as the responsibility of municipalities
are being drawn up with the resources and support of federal agencies, such as the
identification of risk areas, maps of susceptibility to the processes of landslides and
floods and geotechnical maps of suitability for urbanization. The creation of the National
Centre for Natural Disaster Monitoring and alerts, which responds to the Ministry of
Science, Technology, Innovation and Communication, performs the monitoring of natural
threats in areas of risk in Brazilian municipalities susceptible to Occurrence of natural
disasters. Even so, the States also play the role of supporting municipalities in
monitoring meteorological, geological and hydrological risks.
The subject of disaster risk reduction has entered the administrative agenda as the need
for relief and assistance to disaster-affected populations has been highlighted, since
then articulation of sectorial policies of risk and disaster reduction and Civil Defence
actions to the instruments of planning and territorial management was demanded, that
is, it was a proposal more focused on prevention actions than simply to emergency
services. It is also in the scope of disaster risk reduction the promotion, identification of
threat assessment, susceptibility and vulnerability to disaster, in order to avoid or reduce
its occurrence. Their actions can also extend to the monitoring of meteorological,
hydrological, geological events, aiming to produce early alerts on the possibility of
natural disasters; and to the stimulus to the planning of the occupation of urban and
rural land, with a view to its conservation and protection of native vegetation, water
resources, and human life; as well as combating the occupation of environmentally
vulnerable and risky areas and promoting the relocation of the resident population in
these areas.
The starting point for the involvement of municipalities with the theme was the
realization of mappings with the support of the National Geological Service and the
CPRM. In recent years these bodies have developed and made available mappings of
risk areas (sectorization) and maps of susceptibility to gravitational movements of mass
and floods, within the framework of the Risk Management Program and Natural Disaster
Response, foreseen in the Multiannual Plan 2012-2015 of the Ministry of Planning,
109
Budget and Management, which counted on the allocation of resources of the Ministries
of Cities for the elaboration of geotechnical maps of aptitude to urbanization.
The Maps of Susceptibility to Gravitational Movements of Mass and Floods elaborated
on scale 1:25.000 indicate the degree of susceptibility (high, medium and low) for the
occurrence of a given process, (mass movements and floods). Despite the progress that
its elaboration represents, its objective is only to indicate in general the distribution of
processes and the degrees of susceptibility in the territory (Bitar, 2014).
At a higher level of detail (scale 1:10.000), with a look at defining guidelines for the
occupation, it is foreseen in PNPDEC, the elaboration of Geotechnical Maps of Aptitude
to Urbanization in the Face of Natural Disasters. This Map has a caption with the
geotechnical units defining the terrain aptitude classes, according to the limitations and
potential for the occupation, and providing guidance for urban expansion. The results
should be incorporated into the elaboration and discussion of the Municipal Directors
Plans (Planos Diretores Municipais in Portuguese) (Nogueira, Canil, 2017).
Under the new guidelines for the elaboration of the geotechnical maps of aptitude for
urbanization, the number of municipalities that have this instrument is still incipient.
This reduced number is due to budget cuts in the federal bodies after the political coup
of 2016 and also by the reduced teams of the teaching and research institutions that
hold the knowledge and experience in the implementation of these products.
Belém and São Paulo rely on the mapping of susceptibility elaborated by CPRM
according to the new legal framework. Belém does not have the geotechnical maps of
fitness for urbanization in the face of disasters Natural and São Paulo has that precedes
the new policy.
In south-eastern Brazil (where São Paulo is inserted), in addition to the legal
determinations, there would be an influence of the type of correlation between the
amount of public investment and the value of the land, in attention to the demands of
the land market. While in the north (where Belém is inserted) the situation is reversed,
there would be the influence of events listed as associated with climate change capable
of generating great losses.
In both contexts, there is a disarticulation of risk surveys with the policy of urban and
regional planning, possibly because the PNPDEC is not yet regulated. The prospectuses
posed by the current political context are of reduction in the role of the State, the
reduction of spaces and approaches that allow the direct participation of society and
the option for non-structural measures, which can jeopardize the whole institutional
apparatus ever conquered so far, or even the response capacity of Civil Defence in the

110
cases of disasters that have intensified since 2012. In the municipal sphere, the creation
of the instruments and policies and their developments in the production of technical
instruments, demonstrate that there is a lack of dialogue between technicians who act
in the prevention of risk, planning and management of the territory, and in the face of
the impacts of climate change.
3. The Case Studies Despite the expectation of the national risk and disaster management policy to be
articulated with other federal laws, such as the City Statute, and the recognition of the
importance of integrating the various instruments related to the territorial planning,
there is a great diversity of situations in the country as to the effective manifestation of
this articulation. In this sense the construction of a parallel between Belém, located in
a region assumed since the decade of 1950 as of extraction and agrarian vocation, and
São Paulo, assumed as an industrial region and motor of the national economy (Loeb,
1987) can be very illustrative of how these differences influence compliance with the
premises of PNPDEC in the country.
The exploitation of natural resources in the Brazilian Amazon by public and private
initiative has caused major environmental and social impacts, which have made the
management of risks and disasters to which urban populations are subjected a
challenge for formulators of Public policy. For decades the extractivism of wood, iron ore
and livestock production reduce the rainforest, destructured traditional populations, and
caused large population displacements to cities. In São Paulo the policies of
industrialization and the attraction of European and Japanese migration made the
population of the city grow in the decade of 1940 from 100.000 to 1 million inhabitants
(Rolnik, 1997). The concentration of the Brazilian industrial park at MRSP in the mid-
twentieth century made it the main attractor pole of manpower in the country.
In Belém the flow of unqualified migrants to enter the urban market occupied, and
gradually consolidated from landfill, areas originally flooded when they were not
interested in the market. Cycles of occupation, consolidation, and absorption of land by
the real state market configured the metropolitan periphery, modifying ecosystems and
urban metabolism while expelling the poorest population to farther peripheries
(Cardoso, 2002; Lima, 2000).
In São Paulo the urban expansion process was clearly accelerated from the beginning
of the years 1950, associated with the growth of the industrialization process, especially
at ABC Region, within the metropolitan area. The increase of the population, especially

111
from other Brazilian states, in an exponential way, was not accompanied by planning
actions. In parallel, the implementation of protection legislation, as the example of the
Law of Sources Protection, which restricted both the infrastructure implementation and
the occupation in the dams watersheds, already in the process of peripheral growth,
worsened the precariousness of informal occupations by the low-income population that
could not access urbanized areas with infrastructure (Maricato, 2003). A similar process
occurred in the floodplains of the streams, also protected by law. From then on, such
areas considered to be despised by the formal real estate market and for being
environmentally fragile from the standpoint of the physical environment (areas of hills,
with geological-geotechnical problems, susceptible to landslides, streams and plains
Rivers subject to flooding and erosion of margins), of the biotic medium (areas with
significant portions of plant cover that meet the maintenance of ecosystem services),
and of the socio-economic environment, which present high vulnerability, have
undergone a process of densification and precariousness, which began to challenge the
government in the search for solutions.
In that respect, Maricato (2003, 158) clarifies:
“What happens most frequently, however, is the consolidation of illegal occupations in
areas of environmental protection due to the unfeasible cost of its removal. The numbers
of illegality in the use and occupation of the soil in the Guarapiranga dam in São Paulo
(which serves the need for water of one-third of the population of the municipality) are
definitive proof of that statement [...]. The maps that present the use and the occupation
of the soil in the basin, evidence the massive illegality (UGP/Sema, 1999)”.
Box 1 presents relevant variables to the understanding of the nature of the risk existing
in both cities (demographic growth, physiography, precariousness). It is observed that
in the proposed structure for Civil Defence operation, risk events are treated as a state
of exceptionality, when in fact they happen cyclically. It is necessary to consider the risk
in a different approach to that of the expert's discourse, capable of recognizing the social
construction of inequality as a source of vulnerabilities.
The risk used to be seen as something probabilistic, associated with natural events, and
therefore immutable. Alternatively, the prospect of the social construction of the risk has
as its agenda to deconstruct this probabilistic characteristic and to consider the
historical formation of the occupation of the places. The speech merely probabilistic
favours the belief that the elaboration of parameters and models of predictability can
solve the problem. Part of the prohibition of the occupation of certain areas, without
considering the reasons that led to such occupations. In both cities it is necessary to
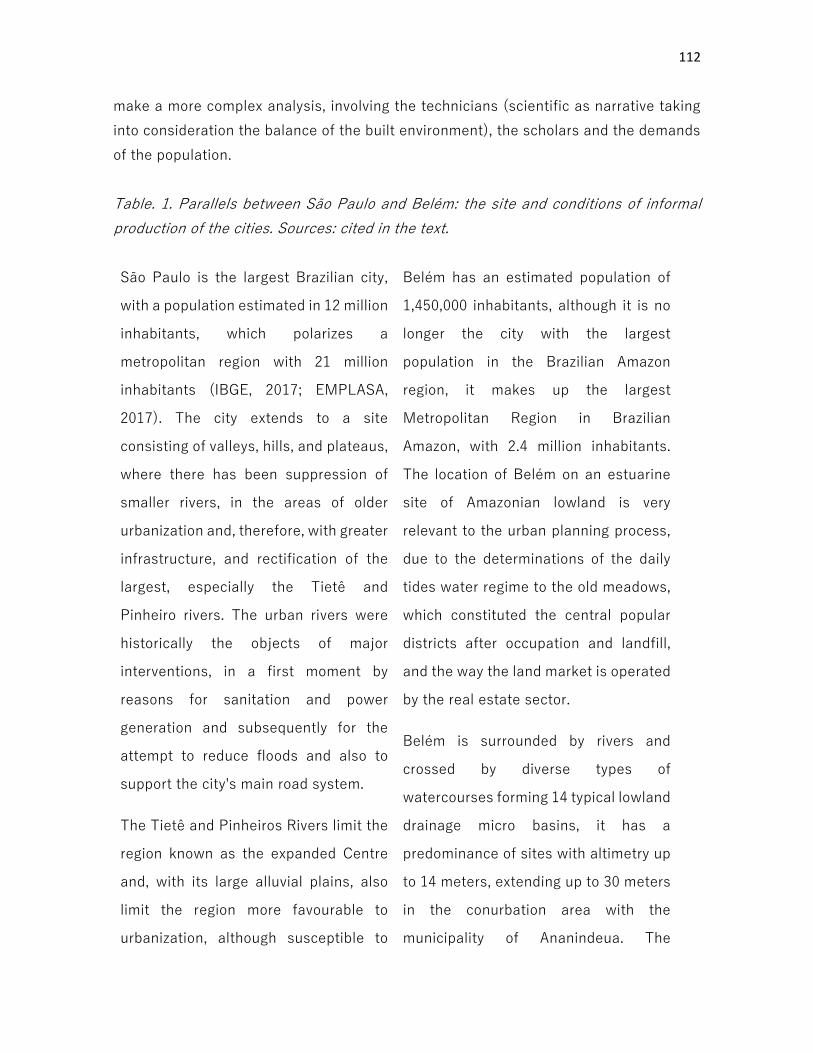
112
make a more complex analysis, involving the technicians (scientific as narrative taking
into consideration the balance of the built environment), the scholars and the demands
of the population.
Table. 1. Parallels between São Paulo and Belém: the site and conditions of informal
production of the cities. Sources: cited in the text.
São Paulo is the largest Brazilian city,
with a population estimated in 12 million
inhabitants, which polarizes a
metropolitan region with 21 million
inhabitants (IBGE, 2017; EMPLASA,
2017). The city extends to a site
consisting of valleys, hills, and plateaus,
where there has been suppression of
smaller rivers, in the areas of older
urbanization and, therefore, with greater
infrastructure, and rectification of the
largest, especially the Tietê and
Pinheiro rivers. The urban rivers were
historically the objects of major
interventions, in a first moment by
reasons for sanitation and power
generation and subsequently for the
attempt to reduce floods and also to
support the city's main road system.
The Tietê and Pinheiros Rivers limit the
region known as the expanded Centre
and, with its large alluvial plains, also
limit the region more favourable to
urbanization, although susceptible to
Belém has an estimated population of
1,450,000 inhabitants, although it is no
longer the city with the largest
population in the Brazilian Amazon
region, it makes up the largest
Metropolitan Region in Brazilian
Amazon, with 2.4 million inhabitants.
The location of Belém on an estuarine
site of Amazonian lowland is very
relevant to the urban planning process,
due to the determinations of the daily
tides water regime to the old meadows,
which constituted the central popular
districts after occupation and landfill,
and the way the land market is operated
by the real estate sector.
Belém is surrounded by rivers and
crossed by diverse types of
watercourses forming 14 typical lowland
drainage micro basins, it has a
predominance of sites with altimetry up
to 14 meters, extending up to 30 meters
in the conurbation area with the
municipality of Ananindeua. The

113
flooding. As urbanization moves away
from it, it reaches progressively more
altitude differences, reaching 1100m
and greater declivities in the granite
massifs that delimit the upper Tietê
basin, especially north and south, where
the biggest susceptibilities to mass
movements are observed (Ab'Saber,
[1956] 2007).
The urban area has high indexes of
infrastructure coverage and greater
management capacity installed when
compared to other Brazilian capitals, yet
the coverage of environmental
sanitation services still presents many
failures in periphery and, in relation to
the sewage system, although part of the
infrastructure is installed, much of the
sewers produced still have as main
destination the water bodies, resulting
in great environmental degradation.
In demographic terms, although São
Paulo has presented a cooling in its
average population growth, it continues
to present significant changes in the
intramunicipal territory, with significant
urban expansion in regions of high
susceptibility to landslides, as in the far
east and north regions, as well as in the
environmental commitment is greater in
the surroundings of the water bodies
that functioned as natural drainage, on
sites with altimetry of up to 4 meters, to
the extent that they were mostly
modified to serve as infrastructure to
receive domestic and industrial sewage,
in addition to garbage, and suffered
silting and landings of streams. Thus,
the significant presence of areas of
lowland and igapós in the urbanized
basins highlights the vulnerability of
several areas to events such as flooding.
According to the IBGE, approximately
55% of the population of Belém lives in
subnormal agglomerations (IBGE,
2010), which are characterized and
located as follows: 2.,784 households
are in the margin of streams, rivers or
lakes, of which 331 are stilts, according
to the demographic census of 2010
(IBGE, 2010). Studies of the years 1960
(Penteado, 1968), record that the quota
of flooding in Belém varied between 4
and 4.5 meters. Recent studies indicate
flooding in areas of quotas up to 6
meters depending on factors such as
soil proofing, precarious maintenance of
drainage networks, presence of garbage
in the city streams, narrowing of water

114
southern region (São Paulo, 2018). A
result of this process is the existence of,
in 2010, 407 areas of geological risk,
configuring almost 106,000 endangered
dwellings, located mainly in precarious
settlements, with situations of land,
urbanity, and building irregularity (São
Paulo and IPT, 2010; São Paulo, 2018).
Among these, 54.5% of the buildings do
not even have information in the real
estate register. However, the
vulnerability may be even greater, with
regard to the risk of flooding, of the
386.000 domiciles located in precarious
settlements, in the municipality, 274.000
are wholly or partially located in valley
funds, with varying degrees of
susceptibility (Travassos et al, 2017).
The population that lives in the 407
areas of risk mapped is mainly
composed of families with less income
than a minimum wage (70%) and 4
times more sewage and open-air waste
disposal. In these areas, also live on
average almost one third more of
children than in the rest of the
municipality (São PAULO, 2018).
courses due to the landfill and water
flow modification (Pinheiro, 2015).
The area of flooding in Belém,
considering the quota up to 6 meters,
has 27.05 km2, representing
approximately 10% of the municipal
urban area and 45.39% of subnormal
settlements universe concentrated in
the area that corresponds to the
metropolitan center and its immediate
surroundings, placed in low areas that
were occupied between 1930 and 1980.
State-funded drainage projects have
brought profound modifications to the
water operation with the commitment of
natural drainage and the worsening of
flooding points; 77.10% of the
population of the subnormal
settlements is in a situation of
vulnerability in relation to the risk of
flooding and possible inundation.
However, the Amazon Protection
System (SIPAM in Portuguese) in Study
for the Civil Defence of the State of Pará
identifies floods outside the "risk area",
associated with the convergence of
rainfall and low slope, which function as
valleys in relation to the built-up mass
(Pinheiro, 2015).

115
The prosperity of São Paulo (it concentrates a range of 34% of the São Paulo State GDP,
which represents itself near one third of Brazilian GDP (SEADE, 2018) and its great
concentration of technical competence were decisive for the implementation of the most
complete management apparatus in the country. The city has a Susceptibility Map,
finalized in 2015 (Bitar, 2014) and a mapping of geological risk areas produced in 2010
(São Paulo, 2010), which gathers and updates previous mappings. These were the
instruments that could be used as a diagnosis when the municipality elaborated its
Strategic Director Plan (São Paulo,2014) prepared and approved between 2013 and
2014, which adopter the Map of Risk Areas as one of the maps of the law (Map 10, Risk
Areas). The PDE 2014 established priority actions in areas of risk, within the housing
policy of Social interest, focusing on the prevention of occupation of susceptibility areas,
implementation of infrastructure to minimize risks in areas already occupied, in addition
to the participatory development of actions and prevention and relief programs. Many of
these actions have been consolidated in a Municipal Risk-Reduction Plan, not yet
concluded.
However, the issue of disaster prevention and risk was no longer considered in the
planning instruments that regulated the PDE. The debate on the Land Use and
Occupation Settlement Act (Municipal Law n. 16.402, 2016) carried out after the
elaboration of the Strategic Director Plan, did not consider the mappings of this
document to define the rules of occupation, and did not establish forms of Specific
control to curb occupation in high-risk areas. Similar situation occurs in the regional
plans completed in 2016, in which the flood risks appear indirectly, associated with the
idea of recovering water bodies and their margins, but without pointing out the question
of geological risk clearly. Doubts prevail over the possibilities of regulation and specific
action in the reduction of risks in the municipality, through the existing planning tools.
Regarding the institutional framework, the risk management structure in the
municipality of São Paulo was established in 2006, therefore, six years before the
PNPDEC. Since 2013 there is a bill aimed at the creation of a Municipal Civil Defence
Secretariat and its instruments of action in the municipality (PL 664/2013), but its
structuring remained institutionalisedthrough Municipal Decree N. 47.534/2006, leaving
it more likely to extinction by the administration by means of a simple act of repealing
his decree of creation. The decree reorganizes the Municipal System of Civil Defence, in
convergence with the National System of Civil Defence (structured in the country in
2005), aiming at the integration of municipal actions to the state and federal, through

116
the Municipal Civil Defence Coordinator (COMDEC), subordinate to the municipal
Department of Urban Security. The COMDEC consists of representatives of all the
bodies of the municipal administration and has the commitment to create policies and
guidelines for Civil Defence: prevention, alert, relief, and recovery.
Among its functions, the implementation of decentralized Civil Defence actions, in
particular the creation of District Civil Defence - CODDECs, and the Nucleus of Civil
Defence- NUDECs. The CODDECSs have the task of adapting the general guidelines of
the policies and programs to the reality of the risk incidence of each of the 31 regional
prefectures of the municipality. The NUDECs are formed by community representatives
of risk areas, who act in a decentralised and voluntary manner under the coordination
of CODDECs.
Despite the importance given to risk management in the municipality of São Paulo, and
the historical association of susceptibility and vulnerability to extreme risk in the
occupation of the city, the information necessary to accomplish it and the consolidation
of the structuring of its institutional framework walk in a slow and limping way. Although
technical efforts have been made around the mitigation of risks, political disinterest
persists in prevention, manifested in the disarticulation of actions related to prevention
and territorial planning, and in maintaining the reactive posture of emergency and post
recovery actions.
In Belém, there is a clear disarticulation between disaster risk prevention and urban
planning policy. The regulation of the use and occupation of the soil in Belém is highly
committed to the real estate interests, to the extent that there are no indicators that
incorporate risk management and response to natural disaster policy developments. The
status quo is maintained in the low-income areas, subjected to constant flooding, which
are treated as ordinary by the local government and receive punctual actions in the event
of disasters. On the other hand, in the areas of interest of the real estate capital, the
rule of use and occupation of the soil suffers interferences from the market and allows
the indiscriminate increase of the impermeability of the soil intensifying the flooding in
the course of the last years. In general, CPRM's susceptibility maps indicate the
possibility of problems, but they are not incorporated into the urban control instruments.
The management and operational centre of the Amazon Protection System
(CENSIPAM), linked to the Ministry of Defence is today the main provider of information
for the Civil Defence structures installed in the Amazon. It operates in the prediction of
floods and inundations caused by tidal waves, and flooding and inundation caused by
heavy rainfall. In urban basins, it also monitors the formation of clouds and storms,

117
including short-term forecasts. The Civil Defence structure existing in the state of Pará
is a joint responsibility of the Fire Department and the State and Municipal Civil Defence.
The actions of state and municipal structures are aimed at actions of prevention,
mitigation, preparedness, response, and recovery, to minimizing disasters. Threats are
defined from a radius of action within which may occur damage and disorders. A
representative of the Fire Department in the event promoted by the CARE group of UFPA
on May 2018 (UFPA, 2018) conceptualized the vulnerability as exposure, fragility, and
low responsiveness. The disaster is measured by the intensity of environmental, material
and financial human damage, while the disaster exists only when there are elements
exposed to vulnerability, notably in the northern region: fires, droughts, floods.
Meanwhile, the Emergency situation is seen as an abnormal situation caused by
disasters, which implies the loss of the official responsiveness capacity, and ultimately
the situation of public calamity: loss of substantial capacity. At this point, the State is
called to provide support to the Municipality.
The Municipal Civil Defence created in 1984, works in a coordinating of the Municipal
City Hall of Belém and has goals that coincide with the vision of the Fire Department as
to prevention, mitigation, preparedness, response and reconstruction (UFPA, 2018),
namely: conducting threat studies, establishing vulnerabilities, classifying and
prioritising risks, keeping residents of the areas on alert to maintain support for State
Civil Defence - CEDEC. The response focus is the immediate reconstruction of losses in
the case of up to 30 affected families, which depends on the assessment of the
occurrence and realization of the First Care procedures, survey of families and affected
homes, of food needs and personal hygiene, and the activation of the organs involved in
the process. In larger events, the state administrative structure is triggered. According
to its records, the most recurring causes of disasters are the soil waterproofing, trees
removal, occupation of river margins, excessive deforestation and increased
concentration of rainfall.
There are no considerations in the planning and urban Legislation and Belém (Belém,
1999 and 2008) about risks and disasters caused by occupations in areas identified as
subnormal agglomerations or in association with changes caused by drainage
engineering works modifications. The way to see the lowland and the practice of
converting this type of ecosystem by landfill and plumbing since the 17th century have
transformed this risk-building factor into a blind spot for official planning, which accepts
as "natural" the transformation of these spaces, at first by the action of families and
communities in small agglomerations, but more recently, by action of the great capital
118
in cities, notably by the real estate sector, and in the rural environment, where major
transformations are promoted by agribusiness, livestock and mining activities.
In Belém, it is also clear that the inadequacy of occupation in lowland area already
anthropic impacted is selective; the risk is emphasized always that it refers to low-
income population, which only initiates the processes of conversion of areas, that are
subsequently absorbed by the market and offered to other population social extracts,
after large public and private investments and significant changes in their relative
location within the metropolitan area. Thus occupying vulnerable areas, deforestation,
and waterproofing are very lucrative businesses that are kept out of the reach of limiting
regulations. Not by chance during the years 1980, Belém was known in the country as
the capital of the invasions and is currently the only capital that has more than 50% of
its occupied territory improvised or informal (Trindade JR, 1998; CEM, 2007).
4. Deficiencies and challenges in São Paulo and Belém
Despite the institutional and legal apparatus available in São Paulo, there is still little
public policy effectiveness in the implementation of the instruments envisaged in the
policies. The situation is marked by the structural problems caused by the Brazilian
peripheral development model manifested in the urban infrastructure deficit and in
social inequalities that result in the production of risk. The lack of participation of civil
society and the population in the production and management of public policies
aggravates the distancing between policy formulation and real demands of society. It
also highlights the scale of the challenge of promoting mechanisms of interest and
participation to mobilize society. It is pointed out that given the magnitude of the
problem both the technical structure and the investments are insufficient, which is a
major challenge, considering the recessive period and the liberal orientation of the
current Brazilian government, which advocates the reduction of State action (Brazil,
2016). In addition, there is no link to prevention and risk actions with climate change
policies (Brasil, 2012), this is the reason underneath the inadequacy of many regulations
devised in Brazil since they disregard the need of structural inequalities reduction, which
is essential to achieving resilience.
On the other hand, it is observed the weak institutional performance in the face of the
impacts of climate change in Belém, the lack of consistent connection between urban
and environmental policies on specific issues related to resilience, notably in the need
of drainage projects consistent with the precipitation intensity and natural behaviour of
abundant water bodies in the region. The challenges posed are related to the need for

119
greater integration between sectorial policies and deeper relationship between land use
planning, land policies, environmental project and territorial planning policies.
Specifically in the recognition of living conditions in the peripheral areas, the lack of
policies for slum urbanization, for example, the fact that there is a majority of the
households (inadequate and improvised) in the region Metropolitan of Belém, despite
the socio-environmental context, indicates the importance of the planning for land use
and occupation. In Belém, unlike São Paulo, there are problems in the management of
water resources in the institutional frameworks, linked to the fact, for example, that
regional committees of basins rarely meet and do not deliberate in the environmental
policy of the state of Pará. Associating technical territories with political jurisdictions
would be a major step towards the democratization of water problems, regionally. In this
respect, it should also be noted that the Planos Diretores Municipais, basic instruments
and sometimes, the only ones available in municipalities, do not deal adequately with
the modelling of the built environment, and do not seek to improve the environmental
performance. There is a need for revision and detailing of urbanistic instruments to
achieve better urban project results, both in physical and socioeconomic aspects.
In the Amazon, traditional territorial strategies begin to be recognized as low impact, but
institutionalized planning instruments have not assimilated this. So there is a need to
recognize, encode and apply traditional knowledge in planning instruments, which will
certainly generate nuisance for the social agents accustomed to benefiting by the
concentration of land, established as part of the modus operandi of elites, despite the
agendas of urban reform and agrarian reform claimed by Brazilian social movements,
but still to be restructured for better adherence to hybrid conditions and socio-
environmental diversity, generated by superimposing logics, of the Amazon.
In both cases, there are challenges related to the application of agendas to encourage
resilience, starting from the question: what is the point one wants to establish as the
reference to return after events that create system disturbances?
Reference List Ab´Saber, Aziz. [1956] 2007. Geomorphology of the Urban Site of São Paulo. São Paulo: Ateliê Editorial. Belém. 1999. Lei Complementar de Controle Urbanístico. Lei no. 02/1999. Dispõe de uso e ocupação do solo. Belém: Diário Oficial do Muncípio de Belém. Belém. 2008. Lei do Plano Diretor. Belém: Diário Oficial do Muncípio de Belém. Becker, Bertha (2013). Urbe Amazônida. Rio de Janeiro: Garamond. Bitar, Omar Yasbek. (Coord.) 2014. Mapas de susceptibilidade a movimentos gravitacionais de massa e inundações: 1: 25.000: nota técnica explicativa. São Paulo: IPT; Brasília: CPRM.

120
Brasil. 2012. Lei Federal No. 12,608, April 10, 2012. Estabelece a Política Nacional Proteção e Defesa Civil - PNPDEC; institui o Sistema Nacional de Proteção e Defesa Civil - SINPDEC e o Conselho Nacional para Proteção e Defesa Civil - CONPDEC; autoriza a criação do sistema de informação e monitoramento de desastres; emenda a Lei No. 12.340/2010, 10.257/2001, 6.766/1979, 8.239/1991, e 9.394/1996; e dá outras providências. Brasília: Diário Oficial da União. Brasil. 2016. Emenda Constitucional n. 95. Altera o Ato das Disposições Constitucionais Transitórias, para instituir o Novo Regime Fiscal, e dá outras providências. Brasília: Congresso Nacional. Available at http://www2.camara.leg.br/legin/fed/emecon/2016/emendaconstitucional-95-15-de Dezembro-2016-784029-publicacaooriginal-151558-pl.htmlAccessed July 2018 Cardoso, A. C. The Alternative Space, urban form and life chances in Belém (PhD Thesis) Oxford: Oxford Brookes University, 2002. CENTRO DE ESTUDOS DA METRÓPOLE – CEM, 2007. Assentamentos Precários no Brasil Urbano. São Paulo: CEM, 2007. Available at: http://web.fflch.usp.br/centrodametropole/antigo/v1/mc/assets/pdfs/assentamentos_web.pdf. Accessed July 2018. Corrêa, Roberto Lobato (1987). A periodização da rede urbana da Amazônia. Revista Brasileira de Geografia, Rio de Janeiro, v. 4, n.3, p. 39-68, jul./set. EMPLASA - Empresa Paulista de Planejamento Metropolitano.(2017). Região
Metropolitana de São Paulo. São Paulo: EMPLASA. Available at:
https://www.emplasa.sp.gov.br/RMSP. Accessed July 2018.
IBGE– Instituto Brasileiro de Geografia e Estatística. 2010. Censo Demográfico. Rio de Janeiro: IBGE. IBGE– Instituto Brasileiro de Geografia e Estatística. 2017. Estimativa Populacional 2017. Rio de Janeiro: IBGE. Loeb, Roberto 1987. A Experiência do Planejamento Regional. In LAFER, Betty. Planejamento no Brasil. São Paulo: Perspectiva, pp. 139-160. Lima, José Júlio. 2000. Regulatory instruments and urban form: searching for social equity in Belém, Brazil (PhD Thesis). Oxford: Oxford Brookes University.
• Maricato, Ermínia (2003). Metrópole, Legislação e Desigualdade. Estudos Avançados. DOI: https://doi.org/10.1590/S0103-40142003000200013Accessed July 2018
Meyer, Regina; Groestein, Marta; Bidernman, Ciro (2004). São Paulo Metrópole. São Paulo: EDUSP e Imprensa Oficial.
Nogueira, Fernando; Canil, Katia (2017). Cartas Geotécnicas de Aptidão à Urbanização: Instrumento de Planejamento para prevenção de desastres e para gestão do uso do solo. In: Anais do XVII ENANPUR, São Paulo: USP. Available at: http://anpur.org.br/xviienanpur/principal/publicacoes/XVII.ENANPUR_Anais/ST_Sessoes_Tematicas/ST%208/ST%208.4/ST%208.4-04.pdf. Accessed July 2018
Prado Jr, Caio(1989). A Cidade de São Paulo: geografia e história. São Paulo: Brasiliense. Penteado, Antônio. 1968. Estudo de Geografia Urbana. Belém: Editora da UFPA. PINHEIRO, Andrea. 2015. Aglomerados Subnormais em Belém: risco e vulnerabilidade socioambiental. Dissertação de Mestrado. Belém: PPGAU/UFPA. Avaliable at: http://www.ppgau.propesp.ufpa.br/ARQUIVOS/documentos/Disserta%C3%A7%C3%A3o%20Andrea%20Pinheiro%20c%20ficha.pdf. Accessed July 2018 Rolnik, Raquel (1997). A Cidade e a Lei. São Paulo: FAPESP / Studio Nobel.

121
SANTOS, Paulo (2001). Formação de cidades no Brasil colonial. Rio de Janeiro: Editora da UFRJ. São Paulo. Lei Nº 16.050/ 2014. Aprova a Política de Desenvolvimento Urbano e o Plano Diretor Estratégico do Município de São Paulo e revoga a Lei nº 13.430/2002. São Paulo: Diário Oficial do Município. Available at: www.prefeitura.sp.gov.br/cidade/secretarias/upload/chamadas/2014-07-31_-_lei_16050_-_plano_diretor_estratgico_1428507821.pdf. Accessed July 2018
São Paulo. Lei Nº 16.402/ 2016. Disciplina o parcelamento, o uso e a ocupação do solo no Município de São Paulo. São Paulo: Diário Oficial do Município. Available at: http://www3.prefeitura.sp.gov.br/cadlem/secretarias/negocios_juridicos/cadlem/integra.asp?alt=23032016l%20164020000. Accessed July 2018
São Paulo (2018). Departamento Municipal de Urbanismo e Licenciamento. Informes Urbanos No. 31. São Paulo: SMUL. São Paulo (2010). Secretaria Municipal para Coordenação de Subprefeituras e Instituto de Pesquisa Tecnológica Municipal (IPT). Mapeamento de Áreas de Risco. São Paulo: IPT. São Paulo. Decreto Municipal No. 47.534/2006. Reorganiza o Sistema Municipal de Defesa Civil. São Paulo: Secretaria de Governo Municipal. Available at: www.prefeitura.sp.gov.br/cidade/secretarias/upload/subprefeituras/Decreto47534.pdf. Acess July 2018. SEADE - Fundação Sistema Estadual de Análise de Dados. 2018. PIB Anual. São Paulo: SEADE. Available at: http://www.seade.gov.br/produtos/pib-anual/. Accessed July 2018.
TRAVASSOS, Luciana, PENTEADO, Claudio Luis, FORTUNATO, Ivan (2017). Urbanização desigual: rios, mídia e modernização ecológica. Espacio Abierto n.26. Disponível em:http://www.redalyc.org/articulo.oa?id=12252818005Accessed July 2018.
Trindade Jr., Saint-Clair(1998). A Cidade Dispersa: os novos espaços de assentamentos em Belém e a reestruturação metropolitana. Tese de Doutorado: USP. Não Publicada. UFPA - Universidade Federal do Pará. 2018. Relatório do Seminário realizado em in Maio/ 2018 vinculado ao Projeto CARE. Não Publicado.

122
Chapter 10. Planning for Climate Change Adaptation
in Italy. Two Innovative Case Studies Marcello Magoni, Giulia Pesaro and Rachele Radaelli
Politecnico di Milano
1. Introduction The paper describe the characteristics of the municipality adaptation plans of Ancona and Bologna,
that are considered among the most innovative ones in Italy (Figure 1). These plans are developed
from the Sustainable Energy and Climate Action Plans (SECAP - see Climate ADAPT https://climate-
adapt.eea.europa.eu/about) and have three mainly aims: to reduce polluting emissions and energy
consumption, to increase the production and use of renewable energy, to implement adaptation
strategies to reduce the exposure and vulnerability to climate change of the territory and to increase
its resilience. The description focuses on some of the factors that characterize the urban resilience
to climate change.
Figure 1: The geographical location of Ancona and Bologna
(Source: Authors)
The Plan of Ancona is one of the pilot application of a common methodology about climate
adaptation planning, shared through the LIFE Project ACT -Adapting to Climate Change within
European cities in the Mediterranean basin (see http://www.actlife.eu). It represents a concrete
implementation of an action plan oriented toward the integrated risk management and the
vulnerabilities reduction, acting on contingency and on prevention of environmental, social and
economic impacts of hydrogeological risk and climate change.
The Plan of Bologna is the result of the European Commission funded project LIFE+ ““BLUE UP
Bologna Local Urban Environment Adaptation Plan for a Resilient City” (see
http://www.blueap.eu/site/en/). It focuses on the vulnerabilities of the urban area of Bologna and
the close surroundings, mainly related to droughts, heat waves, floods and hydrogeological

123
instability. The Plan offers a gallery of tools and possible solutions, especially selecting those based
on a more stable and effective public-private partnership. This is why the participation of
stakeholders and target communities to the Plan design process has been emphasized and
considered one of the main focuses of the Plan development itself.
The comparative analysis factors considered are:
1. Planning Approach
2. Exposure and Vulnerability
3. Solutions
4. Raising Awareness
5. Monitoring
The Planning Approach of the climate adaptation strategies is characterized by three factors. The
first one concerns the adoption of a systemic vision, that is distinguished by the integration of the
strategies/actions of the different plans at different scales that affect the area of intervention and
the integration of the main dimensions (socio-economic, environmental, institutional, etc.) of the
problems to face up. The second is linked to the consideration and representation of a multilevel
governance, in which all the main actors are contemplated, while the third is linked to the
involvement of the personnel of all public authority sectors in the elaboration and implementation
of actions.
Exposure and Vulnerability are strictly connected. Exposure focuses on the elements of a territorial
area that may potentially be damaged by the impacts of events caused by climate change on a
certain territorial area (heavy rains may cause floods and hydrogeological hazards, high
temperatures may cause droughts, hit waves may cause diseases). It can be defined as “the degree
to which natural or socio-economic community or territorial systems are exposed to the potential
impacts of climate change” (Ensure Final Report, 2011). Vulnerability can be broadly defined as “the
degree of fragility of a natural and/or socio-economic community or territorial system towards the
impacts of climate change” (Ensure Final Report, 2011). Vulnerability can therefore refer to the
physical fragility of buildings and infrastructures, to the physical and psychological fragility of
communities and individuals, to the fragility of the economic sectors and the production models
facing the impacts of climate change. Attention has to be paid also to systemic vulnerability, deriving
from the interconnections and interrelated dynamics of the different territorial sectors, subjects
and elements with the related characteristics.
The Solutions are the adaptation actions and measures (soft, grey, green) that a Plan sets in order
to reduce the climate change hazard, the exposure of people, activities and territorial contexts to
these hazards and the vulnerability of exposed resources, increasing robustness and/or improving
adaptive capacity to resist, react and rebuild.
The Raising Awareness is supported by the Information, Knowledge, Awareness interrelated factors
that individually and in their synergistic relationship contribute to strengthening the adaptive and
resilient capacities of individuals and communities. We consider the relevance that Adaptation Plan
gives to those factors, in term of promotion, implementation and improvement of: information
about the context (among the others, characters, problems, resources, opportunities) and the Plan
(among the others, vision, objectives, strategies, action options, decisions, results, impacts);
knowledge as comprehension of the phenomena, the problems and the solution options consistent
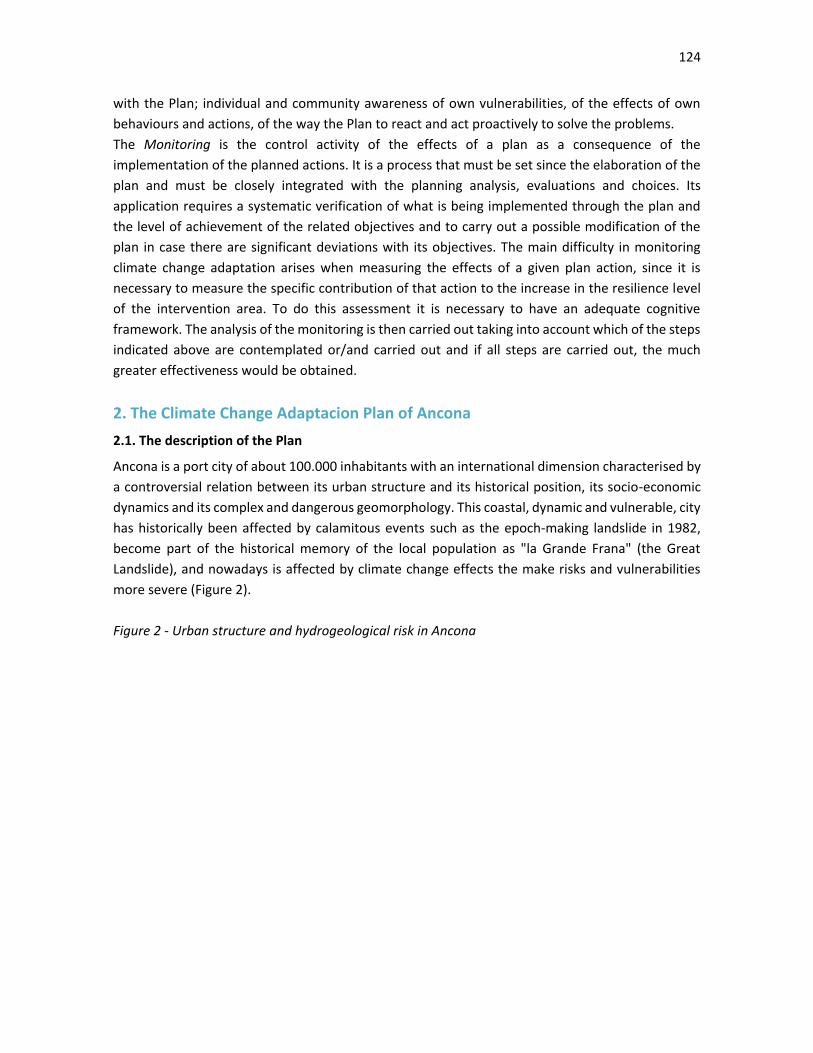
124
with the Plan; individual and community awareness of own vulnerabilities, of the effects of own
behaviours and actions, of the way the Plan to react and act proactively to solve the problems.
The Monitoring is the control activity of the effects of a plan as a consequence of the
implementation of the planned actions. It is a process that must be set since the elaboration of the
plan and must be closely integrated with the planning analysis, evaluations and choices. Its
application requires a systematic verification of what is being implemented through the plan and
the level of achievement of the related objectives and to carry out a possible modification of the
plan in case there are significant deviations with its objectives. The main difficulty in monitoring
climate change adaptation arises when measuring the effects of a given plan action, since it is
necessary to measure the specific contribution of that action to the increase in the resilience level
of the intervention area. To do this assessment it is necessary to have an adequate cognitive
framework. The analysis of the monitoring is then carried out taking into account which of the steps
indicated above are contemplated or/and carried out and if all steps are carried out, the much
greater effectiveness would be obtained.
2. The Climate Change Adaptacion Plan of Ancona
2.1. The description of the Plan
Ancona is a port city of about 100.000 inhabitants with an international dimension characterised by
a controversial relation between its urban structure and its historical position, its socio-economic
dynamics and its complex and dangerous geomorphology. This coastal, dynamic and vulnerable, city
has historically been affected by calamitous events such as the epoch-making landslide in 1982,
become part of the historical memory of the local population as "la Grande Frana" (the Great
Landslide), and nowadays is affected by climate change effects the make risks and vulnerabilities
more severe (Figure 2).
Figure 2 - Urban structure and hydrogeological risk in Ancona

125
(Source: Authors)
The Adaptation Plan of Ancona, carried out between 2010 and 2012 (see
http://www.actlife.eu/medias/260-actpianoadattamentoancona.pdf), is conceived as a local
planning tool able to integrate the hydrogeological risks management with the wider promotion of
an urban development able to strengthen sustainable conditions and to raise resilience to climate
change, working on “the self-organization capacity of a social/economic system to maintain its
structures and functions in the presence of multiple risk factors” (Finley, 1994).
2.2. The comparative analysis
Planning Approach
The Adaptation Plan is strongly integrated to the Urban Plan and takes into account its
systemic visions to specify its strategic axes for adaptation.
The Plan declines visions and strategic axes in adaptation strategies and actions in all local
policies and sectors (climate change, environmental and urban regeneration, risk
management, among the others), according to the mainstreaming logic, in order to
guarantee the transversal consideration of the theme, multiply the synergistic interaction
among policies and reinforce the results. At the territorial scale, the Adaptation Plan
recognizes and assumes the planning and legislative indications of regional and sub-
regional institutions that have influence on local adaptation planning, highlighting the
territorial adaptation policies (even "unaware") already in place (Table 1).
Table 1 - Urban Plan Systemic Visions and Adaptation Plan Strategic Axes

126
Urb
an
Pla
n
Syste
mic
Vis
ion
s
1. Polycentric, liveable and accessible city
Combine the new housing demands with the forms assumed by its polycentrism which is one of the peculiar characteristics of the regional "functional urban areas"
2. Joint, interconnected and competitive city
Enhance the strengths of the infrastructure system by transforming it into a strategic resource and a growth multiplier
3. Ecological city
Integrate urban planning and planning of scarce and renewable resources, through the strengthening of ecological connections, the bioclimatic and energetic renewal of settlements and buildings and the development of rail and cycle system
4. Landscape, beautiful and identity city
Protect and enhance the physical and cultural resources as networks of places and systems of landscape of the sea, of the city and of the rural territory
Ad
ap
tatio
n
Pla
n
Str
ate
gic
Axe
s
1. Territorial safety / prevision and protection
Ensure the safety of citizens exposed to landslide risks but also of infrastructures, cultural heritage and economic activities, such as tourism
2. Management and prevention
Combine protection with development of the city's natural and cultural heritage, which implies awareness of negative externalities related to planning choices
3. Change management / recovery and innovation
Raise awareness about the inevitability of some climate change consequences and translate this constraint into opportunities, reorienting development policies
(Source: Authors)
The governance of the Adaptation Plan is based on a top-down direction open to the
stakeholders’ involvement. The process governance is hinged on a Local Adaptation Board
(LAB), a multidisciplinary and inter-sectoral working group that include representatives of
sectors involved, from environmental and civil protection to land and water management,
from tourism and infrastructures to business and communication. Within the LAB a manager
(member of the Municipality of Ancona) of the adaptation process is identified, with the dual
role of coordinator of the internal resources of the local authority and facilitator of relations
with the stakeholders to promote dialogue and participation.
The participation is activated through a multi-level process: starting from actors mapping,
the Plan selects the selection criteria of key stakeholder based on their capacity to influence
the decision-making process and on the level of competence on the topic at hand; the first
stage consists in enhancing stakeholders involvement, asking their contribute into the
analysis, evaluation of impacts and planning; during the second phase, they discuss and
define a sharing vision and action options sets, raising consensus and strengthening
governance capacity on climate change; the last stage is the launch of initiatives or actions
of Adaptation Plan by the local authority, even in collaboration with stakeholders (business
and civil society) which have an active role within the community.
Exposure and Vulnerability
The city of Ancona is characterized by a heterogeneous historical urban texture, where local
and supra-local functions and services are concentrated, due to the role of regional capital,
to international importance of the port and to tourist appeal, and generate and attract
significant flows of goods and people. At the same time, the city is strongly diffused in a
territory with a complex orography, that has influenced the development of the infrastructural
network and the organization of the collective transport system, and has led to both

127
congestion situations on the main roads and isolation or access difficulties. even in parts of
the city that are contiguous to each other.
The context of Ancona is, by location and orography, exposed to landslides and erosion and
to meteorological and climatic phenomena in some cases linked to them, in particular:
- the great deep landslide of Ancona (1982), produced by persistent and long lasting rains;
- the localized floods, as a result of extemporaneous and short but intense rain
concentrations;
- the coastal erosion, accentuated by intense rainfall and prolonged periods of summer
dryness;
- the summer heat waves.
In addition, the territorial and urban vulnerability of Ancona with respect to these risks have
been accentuated by anthropic factors: the high urbanization, mainly due to tourism and
industrial dynamics, in hydrogeological instability zones, the improper consumption of
natural resources, for example connected to the extraction of fluids from the subsoil near
the sea and to the reduction of the dune system, with effects of increase of subsidence and
coastal erosion, the improvised and unorganized management of the emergency and the
lack of coordination between the responsible subjects involved.
The Plan identifies the most relevant climate phenomena that may exacerbate the context
vulnerability, starting from future climate scenarios based on the probability of occurrence
during the 21stcentury: raising of the sea level, increase in intense precipitation events,
increase in the number of very hot days and heat waves, and increase in storm intensity.
According to the climate scenarios, it is expected that the increase in temperature, the
uneven distribution of rainfall and the sea level rise will have consequences on soil and
subsoil. There will be increased coastal erosion and landslides on the road and railway
infrastructures, which run behind the coastline, and physical deterioration of cultural and
artistic heritage. Finally, health risks due to the increase in heat waves are expected.
Consequently, the Plan identified soil and subsoil (landslides), coastal erosion, infrastructure
connectivity and mobility, cultural heritage as priority action sectors.
Solutions
The Adaptation Plan sets actions and measures referred to the 4 priority action sectors,
aimed at reducing natural hazards, exposure of people, activities and territorial contexts to
natural and climate risks and its vulnerability, increasing robustness and improving capacity
to forecast risk and properly react to it.
The Plan distinguishes four categories of actions: political decisions and behavioural
measures, both considered soft solutions, and management actions and technological and
infrastructure actions, both considered not soft-grey/green solutions. Grey/green solutions
refer to the priority action sectors (landslides, coastal erosion, infrastructure connectivity and
mobility, cultural heritage) and for each sectors a symbolic action in identified (Table 2).
Table 2 - Categories, priority sectors and example of solutions
Categories Priority Action Sectors
Symbolic solutions (◆) and other examples
Political decisions
- Improvement of the governance process (LAB, …) - Introduction of a financial budget for adaptation on the

128
budget of the Municipality of Ancona
Behavioural measures
- Information campaigns for the population - Enhancement of public awareness - Training for the creation of specific professionals for
assessment, monitoring and analysis of the historical and cultural heritage
Management actions
Landslides - Map of landslides speed
Coastal erosion
- Improvement of knowledge on erosion and monitoring - Study of the coastal sea currents between Ancona and
Senigallia Cultural Heritage
- Map of cultural heritage risk
Technological and infrastructure actions
Landslides
◆Enhancement and optimization of the system of early warning of Ancona’s landslide, coupled with extension of monitoring landslides that are ranked as very dangerous ones in the whole municipal territory of Ancona
- Drainage and naturalistic engineering interventions
Coastal erosion
◆Defence of Portonovo’s coast obtained by moving back from the coastline bathing establishments and restaurants
- Improvement and extension of technologies for coastal monitoring
- Improvement of the urban green network Infrastructure connectivity and mobility
◆Restoration of landslide damages of the railway and the Via Flaminia
(Source: Authors)
Raising awareness
The Adaptation Plan identify the awareness of citizens, communities and institutions as a
key factor of resilience, as the adaptive (resilient) capacity of a system is strictly connected
to the awareness about existing and expected risk and the effects of climate change and
about the rules and the ways for dealing with it.
There are several actions, both soft and not soft, that promote and/or support raising
awareness through:
- the deepening of knowledge, based on a step-by-step knowledge construction process:
data collection and definition of basic scenarios on climate variables (temperature,
precipitation and sea level); evaluation of existing and expected socio-economic
dynamics; identification of key systems (coasts, landslides, infrastructures, cultural
heritage) on which to conduct risk and vulnerability analysis; definition of future climatic
scenarios and the consequent potential impacts (taking into account frequency, intensity,
vulnerability, sensitivity, uncertainty); estimation of the risk exposure of each of the key
systems with respect to the scenarios identified; assigning intervention priorities to reduce
risk (danger, exposure and vulnerability) and improve resilience;
- the diffusion of information, because the knowledge heritage must be transmitted to all
relevant stakeholders in the most appropriate ways, to create a basic level of awareness
from which to compare visions, objectives, options of intervention. The diffusion of reliable
information is also considered useful to debunk false myths and fake news spread by the

129
press and social media;
- acceptance and management of uncertainty: an "adaptive" approach is proposed in the
construction of climate and socio-economic scenarios, based on regular monitoring and
consequent revision of the actions undertaken on the basis of the results and of any new
information that may be available;
- the knowledge sharing and awareness processing: the Local Adaptation Board (LAB),
activated by the Adaptation Plan, is conceived as a "place" in which all the stakeholders
of the adaptation process have the opportunity to discuss and share a common vision of
the problems and a common strategy and the consequent actions to face them.
Monitoring
Monitoring of the Adaptation Plan is carried out on two levels:
- Process Monitoring: it is conducted with respect to the "Ten essentials" principles defined
by the "Make my city resilient" campaign (Table 3). The campaign provides an online tool
for participating cities, which allows for a self-assessment of the success of the process.
- Action Plan Monitoring: it is the monitoring of indicators developed for each measure
adopted by the Plan, that allow periodically checking the progress and effectiveness of
the intervention, in order to assess the possibility of a reorientation if the results they are
not satisfactory.
-
Table3 - Ten essentials of "Make my city resilient" campaign
1. PUT IN PLACE ORGANISATION AND COORDINATION to understand and reduce disaster risk, based on participation of citizen groups and civil society. Build local alliances. Ensure that all departments understand their role in disaster risk reduction and preparedness.
2. ASSIGN A BUDGET FOR DISASTER RISK REDUCTION and provide incentives for homeowners, low income families, communities, businesses and the public sector to invest in reducing the risks they face.
3.
MAINTAIN UP TO DATE DATA ON HAZARDS AND VULNERABILITIES. Prepare risk assessments and use these as the basis for urban development plans and decisions, ensure that this information and the plans for your city’s resilience are readily available to the public and fully discussed with them
4. INVEST IN AND MAINTAIN CRITICAL INFRASTRUCTURE THAT REDUCES RISK, such as flood drainage, adjusted where needed to cope with climate change.
5. ASSESS THE SAFETY of all schools and health facilities and upgrade these as necessary.
6. APPLY AND ENFORCE REALISTIC, RISK COMPLIANT BUILDING REGULATIONS AND LAND USE
PLANNING PRINCIPLES. Identify safe land for low income citizens and upgrade informal settlements, wherever feasible.
7. ENSURE THAT EDUCATION PROGRAMMES AND TRAINING on disaster risk reduction are in place in schools and local communities.
8. PROTECT ECOSYSTEMS AND NATURAL BUFFERS to mitigate floods, storm surges and other hazards to which your city may be vulnerable. Adapt to climate change by building on good risk reduction practices.

130
9. INSTALL EARLY WARNING SYSTEMS AND EMERGENCY MANAGEMENT CAPACITIES in your city and hold regular public preparedness drills.
10. AFTER ANY DISASTER, ENSURE THAT THE NEEDS OF THE AFFECTED POPULATION ARE PLACED AT
THE CENTRE OF RECONSTRUCTION, with support for them and their community organisations to design and help implement responses, including rebuilding homes and livelihoods.
(Source: Authors)
The Adaptation Plan introduces a specific financial budget for adaptation within the
municipal budget, partially dedicated to support the annual measurement of the resources
allocated to multi-level risk management, the monitoring of the achievement of adaptation
targets and the mainstreaming process, ensuring a timely planning of the areas of
competence coherent and integrated with the political and institutional level.
3. The Climate Change Adaptation
3.1. The description of the Plan. Plan of Bolonia
Bologna is one of the most important Italian cities. Capital city of Emilia Romagna Region,
with 389.261 inhabitants (January 2018) is the seventh largest city in the country. The city,
thanks to its central location in the Italian territory, is a central hub for the national
transportation infrastructures, with particular reference to highways and railways (Figure 3).
Because of its geographical position, the high rate of urbanized territorial areas and the
presence of water-intensive agriculture, the city has severely felt the impacts of climate
change in the last two decades. Climate driven impacts mainly refer to floods and droughts
and one of the most important problems the city had to face in recent years have been heat
waves. The highest temperature ever recorded in historical era is +40.1 °C in August 2017
but particularly hot summers have been recorded in 2003, 2013 and 2015, with long drought
periods.
The growing frequency and intensity of these phenomena lead the local administration to
begin working on adaptation strategies to climate change at the starting of years 2010 and
in year 2012 a European Commission LIFE+ funded project has been stated in order to
develop “BLUE AP - Bologna Local Urban Environment Adaptation Plan for a Resilient City”.
Figure 3 - Urban structure of Bologna (Source: property of the author)

131
(Source: Authors)
Two key factors can be identified in the Plan’s development: a very accurate analysis of the
major territorial vulnerabilities from the one hand and the centrality of the participation of
local communities to the decision making processes from the other hand.
The Adaptation Plan concentrates the attention on three main issues: drought and water
shortages, heat waves in the urban area and rain and hydrogeological risk extreme events.
For each of the considered issues, long-term goals have been identified, in a way to make
them measurable and the monitoring of the project more stable and feasible. Then
operational actions have been selected, through which, at different territorial levels, local
administration and other public and private bodies involved will be able to implement the
Plan. Actually, one of the goals of the selection of the actions is also to experiment the
effectiveness of public-private collaboration models, in order to repeat them, improve their
capability to obtain good and stable results over time and to involve an increasing number
of territorial stakeholders. The actions have also been the reference for the design of the
intervention strategies. The main interventions can be summarised as follows: (i) reduction
of the water withdrawals through the reduction of civil and agriculture water consumption
profiles and the reduction of water losses; (ii) reduction of discomforts and sanitary risks for
the population facing long periods with high temperatures through the setting of the alert
system and the increase of green surfaces and trees in all available urban spaces; (iii)
mitigation of floods through the increase of the soil capability to absorb rain waters, the
improvement of the quality of the hydric and hydrographic networks and the securing of the
hydrogeological instability in the hills area.

132
3.2. The comparative analysis
Planning Approach
The Adaptation Plan has been developed in two main steps. The first is related to the design
of the “Local Adaptation Strategy”,aiming at improving the response of the Bologna territory
to climate changes, identifying the main issues and solutions to be tackled under a long term
perspective (2025). This includes the climate profile, the territorial vulnerability assessment
and a system of goals to enhance the territorial resilience, detailed according to three main
issues: drought and water scarcity, heat waves in the urban areas and extreme rainfall
events and hydrogeological risk. The “Local Adaptation Strategy” integrates municipal
policies and tools with other instruments available at over-municipal levels, this particularly
focusing on water supply systems and services and hydrogeological instability, where
problems are interconnected at the over local level and need solutions able to go beyond
the administrative boundaries of the city. The second phase resulted in the operative
“Adaptation Action Plan”, implementing and better specifying the strategy itself through a
system of operational actions, part of which to be initially implemented as pilot actions (Table
4).
The transition from the Strategy to the Adaptation Plan passed through a long and rich
participatory process, involving more than 150 participants in two main plenary (Initial and
Final) meetings, 3 thematic sessions, 5 special issues meetings and many technical focus
groups and discussion tables. As the result of the territorial vulnerability assessments and
of the citizens and stakeholders involvement, the Adaptation Plan defines six main pilot
actions aiming at building resilient communities and at raising awareness about the climate
change driven territorial risks.
Exposure and Vulnerability
The Bologna area is considered particularly crucial in the Italian territorial framework, as it
represents a central logistics and transportation hub because of its central geographical
position.
Table 4 - Six Pilot Actions for Bologna Adaptation Plan
1. Include adaptation measures in the city’s building code
To design incentives for adaptation and develop more efficient management models to reduce climate change effects, while making them more explicitly foreseen
2. Define guidelines for infrastructures at risk
To improve coordination and system-level reactions during extreme meteorological events involving lifelines and territorial infrastructures
3. Launch a green roofs campaign
To sustain the Bologna Municipality, together with the other project partners and stakeholders, in promoting the spreading of green roofs through info points and other communication tools
4. Improve the rainwater harvesting capacity of waterproof areas
To transform paved surfaces, for example a parking place, using less waterproof materials able to increase draining rainwaters, limiting and slowing them down into the drainage system and thereby diminishing flooding risks

133
5. Collect rainwaters
To make rainwaters, when collected, become a resource: filtered and conserved, they may be reused in different ways, from WC drainage to the irrigation of green areas
6. Promote insurance schemes
To sustain the diffusion of insurances by informing companies and citizens about possible solutions to reduce risks, by public/private partnerships and by promoting the diffusion of knowledge about extreme climate events
(Source: Authors)
Moreover, it is the capital city of Emilia Romagna, one of the leading regions in Italy from an
economic perspective (data from Banca d’Italia 2017) and in recent public surveys the
Bologna metropolitan area revealed to be one of the most alive and liveable in Italy. Such
territorial capital faces important vulnerabilities, which have been deeply analysed in the
Vulnerability Assessment of the Plan. The climate changes are clearly visible in temperature
trends. In Bologna, the recorded temperature increase is about +0.3°C per decade starting
from 1980s. About rainfall, during winter, spring and summer, a decrease has been
observed, while a slight increase has been recorded during autumn. The number of
consecutive days without rain shows an increase during summer, when there is also an
increase in the frequency of the number of intense rainfall events. Forecasts also underline
that summers such as those of 2003 or 2012, which are currently in the upper part of the
distribution of summer temperatures, could become recurrent, leading to a consequent
increase in heat waves, while for rainfall estimates indicate a potential decrease.
These, together with an increase in the hydrogeological instability, will lead to the following
main vulnerabilities (Table 5).
Solutions
The Bologna Adaptation Plan outlines a system of strategies able to positively tackle the
critical situations highlighted in the Local Climate Profile and in the Vulnerability
Assessment. It identifies a series of actions which refer to good practices identified at the
national and international level and adapted to the specific needs, characteristics and
communities of the Bologna urban environment. A special focus is made on the
management of urban green spaces, existing or to be developed, able to mitigate the climate
driven risks (both heavy rains and heat waves) and, more generally, on the management of
the water systems and services, in order to reduce water consumptions and better managing
intense weather events(Table 6).
Table 5 - The Vulnerabilities to Climate Change of the Bologna Territorial Area
1. Drought and
Water
shortages
Climate change will accentuate the intensity and duration of summer drought
periods, aggravating the already present problems of water availability. The
aqueduct, the historical canals crossing the city center and the network of drains are
essentially fed only by the Reno river, whose natural flow decreases a lot during the
summer period.
2. Heat waves in
urban areas
The climate trends increase the frequency of the phenomenon of the urban heat
waves, increasing the bioclimatic disadvantage of the population and the
vulnerability of the most sensitive parts of local communities, according to age,

134
family characteristics and census conditions.
3. Natural
disasters and
Hydrogeological
risks
Given the geographical and topographical conditions of the urban area of Bologna,
the climate change driven events will increase the vulnerability of the hills area
around the urban environment and the urban water systems, intensifying the
present risk of floods and landslides. This situation is worsen by the inadequate
hydrogeological performance of more than 50% of the territory, particularly in areas
where urbanized surfaces prevail or where there are many waterproof surfaces,
which prevent rain from penetrating the soil. On the other hand, the historical
structure of the city’s drainage network offers good protection against the risk of
floods in a large part of the urbanized area.
(Source: Authors)
Table 6 - Vulnerabilities, Strategies and Pilot Actions
Vulnerability Strategy Pilot actions
Drought
and water
shortages
Reduce use of natural water
resources
Eliminate parasitic waters and the
mixing of black and white waters
Regulate the flow of Reno river
Protect and promote the local
agricultural production while
reducing and increasing the
effectiveness of irrigation
New goals for water saving in the Urban
Building Regulations
Reduction of water use in F.I.Co Project
(Fabbrica Italiana Contadina – Agriculture
Italian Factory)
Irrigation with non-potable water in the
Margherita Gardens
Implementation of solutions to collect
rainwater at the University of Bologna
Agriculture Institute
Recovery of the Aposa stream and Ficcacollo
canal
Heat waves in
urban areas
Increase urban greening
Protect and enhance extensive
tree-lined green areas and urban
agriculture
Increase insulation and greening in
public and private buildings
Reduce the vulnerability of the
population exposed to health risks
linked to temperature increase
New regulation for the green areas
New municipal urban vegetable gardens
GreenUP information campaign
Extreme rain
events and
hydrogeological
risk
Improve the city’s hydrogeological
response
Make the territory more “resistant”
to intense rain
Reduce water pollution carried by
rain
Increase the resilience of the
population
New guidelines for sustainable urban
drainage
Sustainable rain management in a new
commercial establishment (via Larga)
Sustainable management of rain in a new
POC urbanisation of state-owned areas
Insurance packages
(Source: Authors)
The Plan offers both strategies (what to do according to the expected results) and solutions
(how to implement the strategies) paying particular attention to the interactions between
administrative bodies at different territorial levels and to public-private cooperation models
to enhance the Plan implementation. Moreover, the implementation of the strategies and

135
actions outlined in the Adaptation Plan will be enhanced by the upgrading of the over-local
and regional territorial regulation and planning tools.
Raising awareness
Even if a great work has been done over the past 20 years at many institutional levels, still
the territorial impacts and risks driven by climate change seem not fully understood by local
communities and stakeholders. This is why the Adaptation Plan pays a special attention to
the communication and the raising of awareness about the concept of Resilience.
Within the BLUE AP project, a communication strategy has been developed to enhance the
perception of systemic risk. During the participatory design of the Adaptation Plan, it was
noted that individuals have very diverse knowledge and beliefs about climate change.
Communication was then carried out concentrating on the climate problems of Bologna.
This has been done by designing and developing “simple and clear” messages, which would
elicit adaptive responses from individuals, enhancing citizen awareness about the
consequences of global warming into everyday life in order to overcome the perception of
climate change as something far away from individuals and their environments.
For this reason, the communication strategy has been designed to be easily developed also
through the project website and the social networks, Facebook pages of the project partners
and Twitter, which supported training and fact-finding activities targeting citizens and
schools in order to create a collective awareness regarding the impacts and risks of climate
change.
A web application, BLUE APP, has also been designed, where citizens will be able to
familiarize, in a virtual way, with actions promoting the environmental health of the city. The
main goal is the raising of awareness around the fact that climate change can largely be
faced with already existing practices, feasible at the individual and everyday life levels and
not only with huge works on infrastructures or highly innovative technology.
For the private economic sectors, a questionnaire has been distributed, in order to
understand the needs and current perception regarding the performances and management
of the industrial production and manufacturing plants and of the distribution and logistic
systems.
Monitoring
The development of the Plan, together with the involvement of stakeholders in the urban
area, is mainly based on the operational implementation of a set of actions to be carried out
by public and private stakeholders in a variety of territorial sectors. The monitoring system
is based on such actions, for each of which a specific set of monitoring indicators has been
selected.
The indicators related to adaptation topics mainly refer to climate, air quality, potable water,
ground water and green areas. The values for this set of indicators are already constantly
monitored by the Municipality of Bologna and other public bodies in charge for the stable
monitoring of territorial and environmental indicators (for instance the ARPAE, the Regional
Agency for the Protection of the Natural Environment) through different monitoring systems
and thematic reports. The indicators related to the Adaptation Plan mainly refer to
temperatures, rainfall, ozone and PM10 concentrations, water resources availability, uses
and services, public and private green surfaces and trees plantations.

136
Reference List
Finley M. 1994. Cultivating Resilience: An Overview for Rural Educators and Parents. ERIC Digest
Giordano F., Capriolo A., Mascolo R. A. (editors). 2012. Planning for adapting to climate change. Guidelines for municipalities, ACT – Adapting to Climate change in Time. https://base-adaptation.eu/sites/default/files/306-guidelinesversionefinale20.pdf. Accessed 15 July 2018.
Final Report ENSURE - Enhancing resilience of communities and territories facing natural and na-tech hazards. 2011. https://cordis.europa.eu/publication/rcn/14275_en.html.Accessed 15 July 2018.
Municipality of Ancona. 2012.Piano di Adattamentodel Comune di Ancona.http://www.actlife.eu/medias/260-actpianoadattamentoancona.pdf (in Italian).Accessed 15 July 2018.
Municipality of Bologna. 2015. BolognaResilientCity.TheLayman’sReport.http://www.blueap.eu/site/en/documenti/. Accessed 15 July 2018.
PelizzaroP.,BarbiV. 2014. Participatory Process: financial opportunities for SEAP and LAP implementation, Proceedings of the Resilient Cities 2014 congress, Bonn, May 29-31 2014.http://uest.ntua.gr/adapttoclimate/proceedings/full_paper/Pelizzaro_et_al.pdf. Accessed 15 July 2018.
SpizzichinoD.,CaprioloA., DiGioia F. 2015. Climate Change, Landslide Risk Assessment and Adaptation Policies: The Urban Area of Ancona Municipality. pp. 821-825. doi: 10.1007/978-3-319-09048-1_159, 2015.

137
Chapter 11. Resilience and Urban Local
Planning in Uruguay. Montevideo case study. Adriana GoñiMazzitelli, Isabel Gadino, Ingrid Roche and Ingrid Roche
University of La Republica Uruguay (UDELAR)
1. Introduction
From colonial times Uruguay was organized mainly in little towns, that gradually became
small, medium and great cities, some industrial or ports, others cattle breeding centres or
transit cities. Nowadays more than 90% of the Uruguayan population lives in urban
environments, which means from the point of view of territorial balance and sustainable
development a historical weakness. The reasons can be found in the division of land and
extensive cattle breeding, which resulted in a very scarce demand for rural working
population for many years.
In the last decades these phenomena have been changing as long as productive sector was
modified by introducing intensive cattle breeding as well as soya and eucalyptus production.
The novel industries such as cellulose processing factories, and large coastal construction
sites are creating a new urban geography, while the intra and inter-urban population flow is
changing and growing, the capital Montevideo is loosing population(Altman and Martinez
2016). Other important territorial transformation is the urbanization of the south cost of
Uruguay. As long as life at Montevideo become more expensive and difficult, by high rents,
traffic, long distances without appropiate public transport, loose of quality in life from the
natural and social point of view and security issues, a great sprawl has been consolidating
in the last fiteen years. In particular creating one of the most important urban corridors of
the country between Montevideo and Punta del Este in the coast. These quickly movements
of population affect urban environments, making them more vulnerable to climate change.
On one hand by consolidating practises of settling in informal and flood-prone areas of the
cities. This is a typical survival strategy that continue growing as long as social housing
solutions could not be so fast. On the other hand coastal ocupation of high class housing,
which although the many laws in territorial planning, continue using special exceptions to
the rules for real estate buisness that have a great impact over the coastal ecosystms.
138
Climate Change challenges deal with territorial and demographic great changes in the
country. If we analyze the first issue, although informal settlements and urban poverty in
Uruguay is different to other countries in Latin America, as long as the cities growth for a
great deal with urban plans, that doesn’t means illegal occupation of land is absent. However
as soon as informal settlements became bigger, the State start public policies of relocation
or legalization of the already existing neighborhoods (Lombardo 2015).
In Uruguay, climate vulnerability from flood risks is one of the most important climate related
impacts in the country. During the last decade, more than 67,000 people were evacuated
from their homes in 60 cities across the country because of flooding.
In order to deal with this problem, many departament governments adopt the country’s
National Resettlement Plan, which has been relocating thousands of families out of flood-
prone and polluted areas and into secure housing on secure land to help them adapt to the
effects of climate change. The National Resettlement Plan focuses on resettling families that
live in extreme poverty and do not have the necessary resources to find housing alternatives
or secure land on their own. The investment of USD 42 million resettlement plan also
includes job training for family members and the reuse of former flood-risk residential land
into other flood-compatible uses.
Uruguay is divided in ninteen regions call departments. The Department governments
prioritize the areas where population should be relocated and provide the land and
infrastructures for the construction of new homes. The financing for the works and the
technical equipment involved are the responsibility of the Ministry of Housing, Planning and
Environment (MVOTMA). The National Housing Agency (DINAVI) worked together with the
National Water Agency (DINAGUA) helping in the intervention and the study of particular
cases flooding. The Neighborhood Improvement Plan, co- financed by the Interamerican
Bank of Development, situated at the DINAVI (Direction of Social Housing) developed an
operating program regulation approved in 2011.

139
2. Policies and actions in Urban Planning and Resilience to adapt to climate change at Montevideo
The great population concentration at Montevideo, almost 60% of the Uruguayan population
is the result of the concentration of economic activities and opportunities. The Capital City
concentrates the Government offices, most of the industries, the main international port and
airport, as well as the financial, services and commercial institutions.
Following the data of the National Institute of Statistics in the report of Poverty at the National
Level, Montevideo, is the department with higher levels of poverty. In 2016 it registered 8,3%
of households in poverty, that means each 1.000 households 83 are under the poverty line.
According to Carmona and Gómez (1999), the Department of Montevideo has an important
planning tradition, starting in the early decades of the 20 Century, with significant examples
as the Regulator Plan Pre-Project of 1930, the Director Plan of 1956, and the Plan
Montevideo of 1998. This last plan is a milestone in the territorial legislation in the country,
initiating a process of re- appraisal of urban territorial planning in public policies, that would
afterward reach national scope with the passing of the LOTDS (Territorial Planning and
Sustainable Development Law N 18308, 2008).
In the Plan Montevideo the sustainability is expressly included as an objective of territorial
development, and although climate change is not explicit as a driving force, the recently
introduction of adaptive strategies point in that direction, demonstrate the interest of the city.
The recognition of rurality as a value to preserve and the restoration of banks of structuring
urban streams are relevant to this goal. The Plan Montevideo is the background of a
derivative planning system in time and space that contribute to significant urban adaptation
strategies.
The Department Guidelines were reviewed afterward the LOTDS approval and in the context
of the Revision of Plan Montevideo, the environmental dimension is identified as essential
for this approach and to the relevant adaptive strategies for designing projects and
interventions.
The proposal is based on six items, one of them is environmental sustainability; the
document emphasizes on

140
“preservation of environmental values, responsible use of natural resources, climate
change and variability response, and comprehensive risk management. The processes
that contradict environmental sustainability principles such as urban land extension,
socio-territorial segregation, and lowering of life quality in consolidated city areas are
critically approached" (Guidelines Document, Directrices Departamentales 2012, p.
39).
In this sense the water streams take relevance, in particular because of the high level of
housing and socio vulnerability, that take place in their margins, putting them under risk in
extreme events situations. Next plans are examples of this phenomena.
2.1. Special plans for urban streams and basins
Montevideo as we said is the main scenario of the country for incorporate new topics on
urban planning. The water streams have a great importance for urban policies on climate
change, in particular in the cases they have informal housing, under risk for floods.
The land categorization defines the banks of the main water streams as natural rural land
and establishes restrictions for alteration of their natural condition. The "green wedges" (of
the main urban streams Arroyo Pantanoso and Arroyo Miguelete) are recognized as
extended territorial frameworks, considered "strategic territories" that materialize the link
between the natural background of the territory and the urbanization processes (Plan
Montevideo, 1998).
Therefore, we can see the main efforts in include resilience instruments and climate change
measures in plans for urban streams and basins (Table 14.1). We are going to analyze
deeper here the Miguelete Stream Plan already approved that starts its implementation
recently. In the next table we are going to shortly describe some examples Casavalle Plan,
Chacarita Plan and Pantanoso Basins Plan (currently in elaboration).
Table 1- Urban Planning Instruments that incorporate the resilience and adaptability to
Climate Change as relevant strategies together with other social and environmental policies.
Source: Self Elaboration
Main problems
related to climate
change and
urban issues
Socio
ecologicalActions
Ecosystem
services and
Green
Infrastructure
Government Level of Impact
and Participation

141
Plan
Miguelete
River
(PEAM)
Great
Contamination of
water on the river
and to the
Montevideo Bay.
Environmental
degradation of
the watercourse.
Housing
precarious
situation. Risks
on population
health.
Relocation of
informal settlements
on the river. Green
Eco Place to
cooperatives of waste
pickers
Actions of
sanitation
infrastructure to
avoid
contamination.
Linear Park.
Rehabilitation of
the public spaces.
Vehicular, cycle,
and pedestrian
paths.
District, Municipality,
Regional
Plan
Pantanoso
River (in
process of
elaboration)
Great
Contamination of
water due to
domestic,
industrial
disposals and
solid waste.
Informal
settlements
occupied the
banks. Loose of
ecosystem
services of the
watercourse.
Landscape
potential loss.
Non-dwelling
large fields and
wetland areas
under high
pressure. Formal
housing areas
next to the
stream.
Main Strategies:
Relocation of
informal settlements
on the river. Involves
an interdisciplinary
team. Create a
hydrological model
that describes the
dynamics of flood
pulse return that
includes the climate
change scenario in
the design.
Main Strategies
Consider the area
a “green wedge"
where the natural
framework
organizes and
determines the
urban
development along
the 16 km area
length of the
stream. Create
Flood areas
restrictions. Linear
parks, Preservation
areas, Ecosystem
restoration areas.
Multiple institutional
actors’ competence, need to
coordinate
Plan
Casavalle.
Cañada
Matilde
Pacheco
Environmental
degradation of
the watercourse.
Housing
precarious
situation.
Extreme poverty.
High Criminality
Strength inter-
institutional
collaboration. Create
technical solutions
with specific focus in
create a social
resilient environment.
Regenerate small
streams areas
which can build
transversal
connectivity. Build
quality public
space.
Amelioration of
sanitation.
Creation of a participatory
planning and management
figure, the Council of the
CasavalleNeighbourhood

142
rates. Flood risk
situations.
Plan La
Chacarita
(in process
of
elaboration)
Northeast area of
Montevideo
presents the
highest
vulnerability
index of the city.
Urban- rural
borders
degradation.
Informal
settlements. Lack
of urban
planning.
Environmental
degradation of
the watercourse.
Contamination of
the water.
Irregular
settlement
located on the
culvert itself
Santa Teresa
Settlement.
Main Strategies:
Relocation of
informal settlements
on the river. Involves
an interdisciplinary
team. Create a
hydrological model
that describes the
dynamics of flood
pulse return that
includes the climate
change scenario in
the design. Working
on memories about
the importance of the
story of
Neighbourhood “Los
Milagros”, the social
housing plans Juana
de America
Cooperative, as well
as the river that was
culverted as rainfall
sewer pipe, making
that the stream
"disappeared" from
the local culture.
Main Strategies:
Regenerate the
lower course of
the stream, located
at the rural-urban
inter-phase
remains open-air
with irregular
occupation of the
floodplains and the
consequent impact
of the flood events
(Chacarita de los
Padres
Settlement).
Coordination and
control of the
existing
interventions, and
elaboration of the
Plan of La
Chacarita basin
with the
Departmental
Government,
inside the context
of a
comprehensive
plan of social
connection and
land-use planning.
Creation of a participatory
planning and management
figure, the Council of the
ChacaritaBassin. It was
created in 2014 as an inter-
institutional council with
members of City Council
Government, local
neighbors' council,
Environmental Ministry,
Social Ministry, National
Education Authority, among
other institutions.

143
2.2. A participatory Metropolitan Plan for Montevideo on Climate Change
The Metropolitan Plan on Climate Change for Montevideo was done in 2012 with the
purpose of, on one hand, focus on the specific topic of measures to be undertaken in order
to deal with this issue and, on the other hand, make an institutional coordination among
different actors and programs that in the last years deals in a fragmentary way with the
climate change challenges.
From the urban planning perspective, the area has had a relevant quantity of planning
instruments as Departmental plans of land characterization, Departmental guidelines, and
regional strategies, however the Metropolitan Area of Montevideo implies a new level of
governance and coordination, which is having many problems to be implemented.
Following the current international changes in the definition of urban planning units, the
Metropolitan Area of Montevideo must be conceived together with the adjacent areas of the
Departments of Canelones and San Jose regarding integrated regulation and planning,
which nowadays is very weak and secondary in public policies priorities.
The Metropolitan Area does not have a specific institutional organization for coordination of
the three Departmental Governments, Montevideo, San Jose, and Canelones, and the 42
Municipalities(municipal councils, administrative units corresponding to the third level of
Government inside each Department territory) defined by Decentralization and Political
Participation Law of 2010.
The coexisting of national, departmental and municipal competences determines the
absence of specific instruments of coordination, however some instruments of territorial
planning as Regional Strategies for the Metropolitan Area was already approved as well as
the Inter-Departmental Plans, that has to be implemented.
This coordination was not new, as long as to address this administration weakness of the
faster growth of the capital of the country, at the end of 2005, the Presidency of the Republic
with the Departments governments created the Metropolitan Agenda Program for solve
some particular operative issues.

144
The Metropolitan Plan on Climate Change meet this administrative problem of coordination,
that almost all new metropolitan areas encounter. Therefore, the methodological approach
of the Plan is based on institutional coordination and participatory planning: the main targets
groups of the Plan are ministries, and other high authorities of regional governments (from
Montevideo, San Jose and Canelones), which deal with climate change issues. In addition
to this, municipalities, citizens, entrepreneurs, environmental civil society associations and
others are involved in the different steps of the Plan.
For the elaboration of the Plan a participatory methodology was designed. The steps
design for the process were:
1) Actors Map and working groups for a preliminary diagnosis; 2) Definition of risks and
opportunities for the development related to climate change; 3) Definition of priorities with
multi-criteria analysis; 4) Build of a General Strategy for adaptation and mitigation of
Climate Change; 5) Working Groups in order to define particular guidelines for specific
topics: Transports, Coastal Management, Biodiversity, Extreme Events, Intensive and
Extensive agricultural activities, Energy, Solid Waste, Build Environment and Health; 6)
Participatory Mapping of Climate Change Impacts in all the metropolitan area.
Considering the Forester theory on deliberative practice, the current plan assumes more
than a participatory approach, a well-done consultation (Forester 1999). That means an
active involvement of the different actors, without letting yet a way in which these actors
can take mandatory decisions, which Lussault states is the real difference between a
consultation and a real process (Lussault 2011).
However, the plan was a success in the sense of sensitizationof the metropolitan area
governments. It identifies as well the main vulnerabilities of the area which are:
a) the consumption of land by the informal settlements, as well as by the gated
communities, and the free trade zones,
b) the great extension of coastal area exposed to sea-level rise and storms,
c) the increase of temperatures with the consequence of an increase in the rain level as
well as in extreme events as flows,
d) the contamination of potable water.

145
We consider that all of these topics need not only a consultation process, but mainly a
collaborative way of thinking the planning of resilience solutions, as Patsey Healey stated
(Healey 1997). As well as permanet groups of citizens and local governments for
monitoring and contribute to the implementation and management of actions (Goni
Mazzitelli et alt., 2013).
2.3. Actions of the Metropolitan Plan of Montevideo on Climate Change
After identified the main vulnerabilities the participatory groups identified specific objectives
in order to protect: 1) water resources, 2) agriculture and food production, 3) vulnerable and
under risk population, and 4) coastal zone.
The program envisages some actions that need to be regulated as well as financed by the
government: Sustainable management of urban water cycle, control in the increasing
presence of vectors, reduction of risks to human health associated to the variability of
temperatures.
The plan has many elements of innovation, although by now they are just good declarations,
we can mention some of them here, underlined that the most interesting work of the group
was to think in different levels, with different disciplines and involving also knowledge from
civil society and local governments.
Some of the focal points were the conviction of the need of strengthening of local capabilities
in the attention of human health; the development of a new management model for the
governance of natural resources and biodiversity, as well as water resources in the basin;
the need to better access for insurance and climate information on the rural production.
On the other hand, some modifications need to be done to the transport system inorder to
stop the current impact of carbon emissions. The proposals vary from reduce carbon
emissions in the urban transport, to increase the use of clean technologies and increase the
efficiency in urban mobility, as well as promote of active transport.
As mentioned before the Plan think about great systems for prevention and reduce of impact
measures, like support the National Policy on Sustainable Energy that is changing the matrix
for low emission in Greenhouse Gases, or reduce organizational weaknesses for improve a
cross strategy in adaptation and mitigation of climate change.

146
In order to work also in a participatory way in the monitoring of the implementation, the Plan
develops a platform for associate different policies, and government directions that are
related to climate change, as long as monitoring resources and investments do in the topic.
In particular, trying to reinforce the National System on Protected Areas (SNAP), by creating
a Corridor of protected natural areas in each region, like an Ecological Network Corridor in
the metropolitan area.
The same platform should work with local level by making an Agreement of Environment
Management with local governments, and supporting regional working groups with all the
municipalities involved. This is a very innovative proposal as long as local actors can
exchange good practices or make synergy in asking coordination of central funds in related
policies. In fact, this last point is related to financial resources, as the instrument is part of a
Pilot Program of the United Nations; therefore, it counts with international funds to be
formulated as well as tries to work as a coordination tool for funds in the phase of
implementation of it.
In addition to this the main aim of the participatory networking work is to create Innovative
Management figures as the Basin Commission or Urban Local Plans with particular attention
to resilience aspects.
Finally, the Plan promotes what is called prompt intervention measures, in order to avoid
serious damage to the current situation. For example, protection and recuperation of
coastal morphology, dune restoration, capturing fences of sand in critical places, and
building of ten low impact access to beaches in coastal region of Canelones. The first
measures are giving excellent results, and some of the erosion that were created in
beaches and dunes by Climate Change are going back restoring natural environments.
3. Discussion and Conclusions
The main challenge that Uruguay is trying to solve, is the need of a gradual involvement of
climate change and variability approach in the Territorial Planning agenda. In recent years
Uruguay has progressed in making the environmental issues explicit. From different
conceptual and methodological backgrounds (risk management, environmental policies,
water resources management, climate change) the specific institutional framework has been
created with the purpose of work crossing policies and actions in the territory and not more
in a sectorial way. The challenge is that the current coordination of these diverse initiatives
147
transforms in a potent platform of governance on this subject, both at the national,
metropolitan and local levels (Ostrom, 1990) (Ostrom, 2005).
In the case of Montevideo, the creation of the Climate Change Work Group (GTCC) in 2010,
of inter-disciplinary and inter-institutional characteristics is a relevant milestone. This group
contributed to the elaboration of the aforementioned Metropolitan Climate Plan of
Montevideo. Other recent achievement has been the denomination of the former Planning
Department of the Montevideo Government in "Planning and Resilience Department", as
well as the consolidation of GTCC as a section of this Department.
The urban dimension has taken relevance, and adaptation has taken place as a significant
strategy for make positive synergies with urban development in our country, where the
climate variability is a main determinant of adverse event occurrence.
Also, the flood-prone urban areas have taken priority in risk management and relocation
policies, consider communities that have been actively involved both in preparation
processes for early warnings, recognition of their local capacities to face extreme events,
development of solidarity in the implementation of adaptation measures, and design of local
adaptation and risk management policies within the framework of promoting a culture of
prevention and enhancement of adaptive capacity (Beebeejaun 2012).
As in all the processes some problems arise between the elaboration of these new
approaches and the real incorporation of them to the institutional traditional systems that
govern urban areas. For example, from the DINAVI (Direction of Social Housing) data, it is
possible to evaluate that the relocation projects of the last five years have been formulated
from this integral vision, but their implementation was focused on the housing response. The
multi-dimensional family problems of a high percentage of the cases were addressed by
contracted technical teams with scarce institutional resources or by resorting to proximity
social programs when the families fulfilled the required profile.
Something similar happened with the Metropolitan Plan on Climate Change, although the
platforms for map the risks, and the coordination figures were decided and design by the
Plan, there are not yet evidence they have been implemented, or that they are in a process
of implementation.
Therefore the future challenges are, on one hand continue producing further knowledge and
responses on the climate change and variability impact in urban contexts, although the focus

148
on floods and extreme vulnerable population is one of the main problems. We need to
explore more about other urban issues, like the city urban heat islands, or make further
investigation related to the adaptation of the materials and constructive systems in coastal
zones to potential resilience in front of variation in storm forces as the greatest winds that
arrives to Atlantic and Rio de la Plata coasts. On the other hand, the improvements in
regulations, the creation of norms and laws, that modify the traditional adaptation practices
requires more time to consolidate, perhaps by supporting more practices and have
examples of proceedings in different urban areas of the country, university can improve the
methodology to deal with climate change phenomenon.
Anyway, we can say that the first steps were made, and that the efforts are well distributed
and should be done among a great variety of actors, trying to promote collaborative
scenarios to continue dealing with the climate change and urban resilience issues in the
future.
Reference List
Altman Leonardo& Martínez, Edgardo. 2016. Entre la macrocefalia estructural y el
policentrismo emergente. Modelos de desarrollo territorial en el Uruguay (1908-2011).
Montevideo, Uruguay: Ed. CSIC, UDELAR.
Beebeejaun, Yasminah. 2012. Participation by the people- what will it achieve for the
people? England, Town and Country Planning. The Journal of the Town and Country
Planning Association, 81(5).
Bidegain, Mario, Crisci, Carolina, del Puerto, Laura, Inda, Hugo, Mazzeo, Néstor, Taks,
Javier& Terra, Rafael. 2013. Clima de cambios: Nuevos desafíos de adaptación en
Uruguay. Proyecto FAO MGAP. TCP URU/3302.
Carmona, Liliana& Gómez, María Julia 1999. Montevideo, proceso planificador y
crecimiento. Montevideo, Uruguay: Facultad de Arquitectura-SAU.
Forester, John. 1999. The deliberative Practitioner. Encouraging Participatory Planning
Processes. Cambridge: Massachusetts Institute of Technology.
Goni Mazzitelli, A. et alt. (2013) Democrazia Emergente. Gangemi Editori, Roma, Italia.
Goñi Mazzitelli, Adriana., Roche, Ingrid, Sierra Pablo, Gadino, Isabel. 2018. Incorporating
resilience and adaptive strategies to climate change in urban and territorial planning in

149
Uruguay. InUrban Climate Changes in Latin-American Cities. Edited by Cristián Henriquez
and Hugo Romero, Springer (on printing).
Healey, Patsy. 1997. Collaborative Planning, shaping places in fragmented societies. UK:
Ed. Palgrave.
Lombardo, Cecilia. 2015. Hacia una ciudad inclusiva. Cuadernos del CLAEH, 102, 43-56.
Lussault, Michel. (2011). La gouvernance doit s’inventer en permanence. « Actes » de la
32o rencontre nationale des agences d’urbanisme, Territoires et projets, les outils de la
gouvernance. Revue Urbanisme, 42.
Ostrom, Elinor. (1990). Governing the Commons: The Evolution of Institutions for Collective
Action. Cambridge University Press.
Ostrom, Elinor. (2005). How types of good and property rights jointly affect collective action.
Journal of Theoretical Politics, 15(3).
Documents and reports
Facultad de Arquitectura- IMM (1998). Plan Montevideo basado en Anteproyecto Plan de
Ordenamiento Territorial Montevideo. Documento ASESORÍA (Unpublished advisory
document in) in ITU, FADU.
Facultad de Arquitectura - IMM 2009 Revisión del Plan de Ordenamiento Territorial.
IMM (2012). Guidelines Document, Directrices Departamentales de Ordenamiento
Territorial, Edit Intendencia Municipal de Montevideo.
IMM-Junta de Andalucía (2004) Plan Especial Arroyo Miguelete, PEAM @IMM ref. en
montevideo.gub.uy y en http://pmb.mvotma.gub.uy/barrios/ribera-del-miguelete;
2016http://pmb.mvotma.gub.uy/noticias/documental-15años.
IMM, Plan de mejoramiento de barrios (2004), más de cien historias.
Instituto Nacional de Estadística INE (2017). Estimación de la Pobreza por el método del
ingreso para el año 2016. http://www.ine.gub.uy/.
LOTDS (2008). Ley Ordenamiento Territorial y Desarrollo Sostenible. Marco Regulador
General https://parlamento.gub.uy/documentosyleyes/leyes/ley/18308
MVOTMA 2015: Atlas de la Cuenca del Río Santa Lucía http://www.mvotma.gub.uy/sala-
de-prensa/item/10007499-atlas-de-la-cuenca-del-rio-santa-lucia.html.

150
PNUD Uruguay. Plan Climático de la Región Metropolitana de Uruguay, © 2012
http://www.montevideo.gub.uy/sites/default/files/plan_climatico_region_metropolitana_uru
guay.pdf; http://www.cambioclimatico.gub.uy/index.php/plan-nacional/plan-
metropolitano2.html.
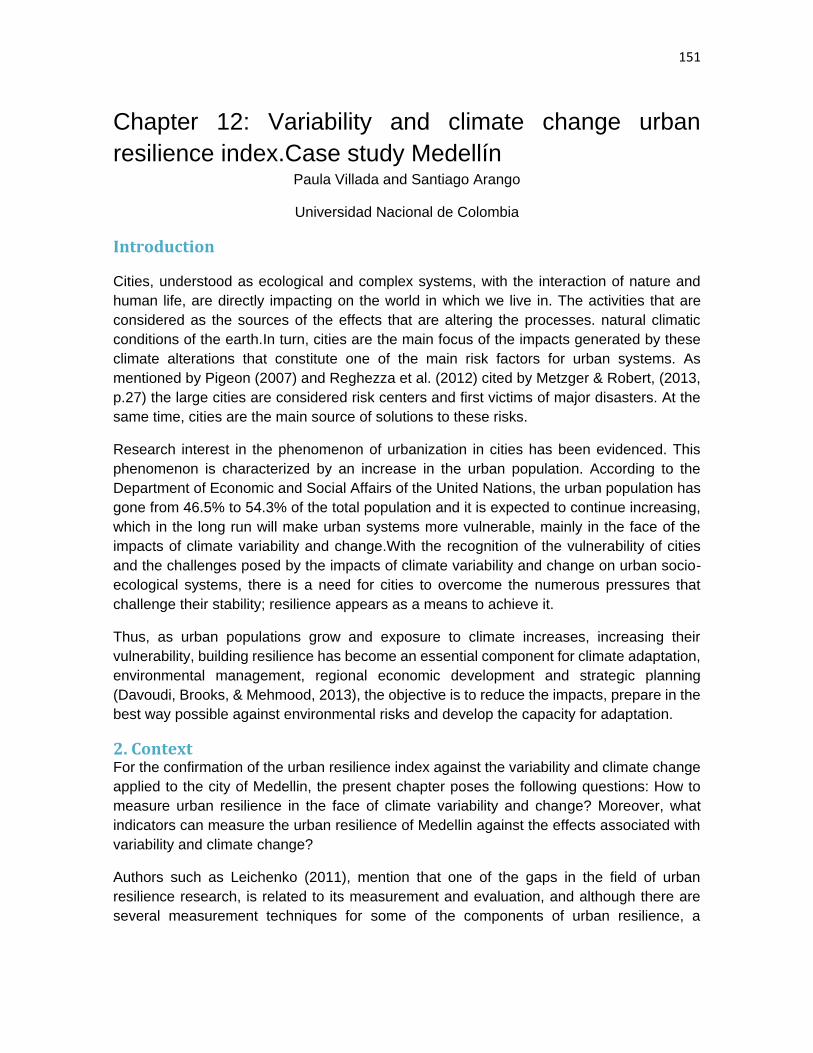
151
Chapter 12: Variability and climate change urban
resilience index.Case study Medellín
Paula Villada and Santiago Arango
Universidad Nacional de Colombia
Introduction
Cities, understood as ecological and complex systems, with the interaction of nature and
human life, are directly impacting on the world in which we live in. The activities that are
considered as the sources of the effects that are altering the processes. natural climatic
conditions of the earth.In turn, cities are the main focus of the impacts generated by these
climate alterations that constitute one of the main risk factors for urban systems. As
mentioned by Pigeon (2007) and Reghezza et al. (2012) cited by Metzger & Robert, (2013,
p.27) the large cities are considered risk centers and first victims of major disasters. At the
same time, cities are the main source of solutions to these risks.
Research interest in the phenomenon of urbanization in cities has been evidenced. This
phenomenon is characterized by an increase in the urban population. According to the
Department of Economic and Social Affairs of the United Nations, the urban population has
gone from 46.5% to 54.3% of the total population and it is expected to continue increasing,
which in the long run will make urban systems more vulnerable, mainly in the face of the
impacts of climate variability and change.With the recognition of the vulnerability of cities
and the challenges posed by the impacts of climate variability and change on urban socio-
ecological systems, there is a need for cities to overcome the numerous pressures that
challenge their stability; resilience appears as a means to achieve it.
Thus, as urban populations grow and exposure to climate increases, increasing their
vulnerability, building resilience has become an essential component for climate adaptation,
environmental management, regional economic development and strategic planning
(Davoudi, Brooks, & Mehmood, 2013), the objective is to reduce the impacts, prepare in the
best way possible against environmental risks and develop the capacity for adaptation.
2. Context For the confirmation of the urban resilience index against the variability and climate change
applied to the city of Medellin, the present chapter poses the following questions: How to
measure urban resilience in the face of climate variability and change? Moreover, what
indicators can measure the urban resilience of Medellin against the effects associated with
variability and climate change?
Authors such as Leichenko (2011), mention that one of the gaps in the field of urban
resilience research, is related to its measurement and evaluation, and although there are
several measurement techniques for some of the components of urban resilience, a

152
systemic approach must be prioritized for the measurement of all the components
(Jabareen, 2013).
Research has been published with proposed indexes to estimate urban resilience in the
contexts of variability and climate change (Cutter, 2015, D'Lima & Medda, 2015, Engle, by
Bremond, Malone, & Moss, 2014; Kotzee & Reyers, 2016; R. Shaw, 2015; Tyler et al., 2016;
Xu & Xue, 2017), these tools help to understand and measure the resilience of cities, serve
as inputs for planning and monitoring (Sharma, Singh, &Singh , 2014; Tyler et al., 2016), in
addition, they allow directing efforts towards adaptation and mitigation policies that limit the
negative impacts of the increasingly frequent extreme phenomena.
Although urban resilience indices have already been developed in the context of climate
change, applied to different cities, there is not one, or a set of indicators, that measures
resilience universally (Suárez, Gómez-Baggethun, Benayas, & Tilbury, 2016), since this
depends to a large extent on the characteristics associated with vulnerability (Brenkert &
Malone, 2005). Analyzing this variable requires a multidimensional perspective of each
territory. Vulnerability differs according to geographical regions, political boundaries, climate
scenarios and socio-economic conditions of the population (Harley, M., Horrocks, L.,
Hodgson, N., & Van Minnen, 2008).In this regard, Cutter (2015, p. 3) states that:
There is no one size tool to measure resilience due to the variety of actors,
environments, purposes, and disciplines involved. The landscape of resilience
indicators is as diverse as the systems, communities or disasters being studied.
The vulnerability is a specific characteristic of each city, and Medellin has not developed a
tool to measure its urban resilience in the context of climate variability and change. Thus, It
is necessary to formulate an index that allows this measurement and that considers the
variables that correspond to its particularities and the climatic risks that it faces.
Thus, the need was identified to develop an index that allows a better understanding of the
characteristics and variables that affect the city's lower or higher resilience in the face of
climate variability and change. This tool will offer a potential way to address the multivariate
and complex nature of socio-ecological systems. At the same time, it will contribute to
making more accurate decisions regarding the strategies that are being implemented to deal
with climate impacts, and it can be used to assign priorities of institutional support, identify
priority areas regarding technological projects and resource management. (Adger, Brooks,
Bentham, &Agnew, 2004).
1.1. Urban Resilience
Resilience, from the Latin of the verb resilio, resilire meaning "to jump back, to bounce," is
the ability to "resist" or "resurface from" a shock. (Klein, Nicholls, & Thomalla, 2003)
(Davoudi et al., 2012). The concept of resilience was initially defined from the ecological
perspective by (Holling, 1973), as the persistence of relationships within a system and its
ability to absorb changes and persist. Since then, the concept has been refined in the context
of ecological sciences to describe the tendency of an ecosystem to recover after being

153
disturbed through changes in ecological variables, due to natural causes (hurricanes,
earthquakes, etc.). ) or anthropic (introduction of exotic species, deforestation, etc.) and
reorganize to fully recover their previous state (Holling, 1973).
Recently, the concept has also been applied in other areas such as human social systems
(Adger, 2004, Leichenko, 2011, Pelling, 2011); urban ecological resilience (Folke, 2006);
the economy (Simmie & Martin, 2010), disaster management (Alexander, 2013), and urban
security and resilience against terrorism after September 11 Jabareen (2013, p.221).
In recent years, the concept of resilience associated with cities has begun to be used
because they are complex socio-ecological systems. In this case, it is called urban
resilience. Resilience in the urban context is understood as the way in which socio-
ecological systems deal with the tensions and disturbances caused by external factors
(Walker, Holling, Carpenter, & Kinzig, 2004). Likewise: "the ability of a system to absorb
disturbances and reorganize itself while changing to preserve essentially the same function,
structure, identity and feedback" (Leichenko, 2011). Resilience requires three main
properties: (1) the amount of change that a system can suffer while maintaining the same
structure and function controls; (2) the ability of the system to self-organize; and (3) the
degree to which the system is capable of learning and adapting (Carpenter, Walker,
Anderies, & Abel, 2001).
In the most recent studies, urban resilience has been studied from three perspectives:
ecological, engineering and evolutionary or socio-ecological (Dhar & Khirfan, 2017).
From the perspective of ecology, resilience is the environmental and ecological capacity of
a structure to absorb a temporary disturbance and then reorganize to recover its previous
state (Holling, 1973) fully, this approach highlights the potential of self-organizing systems ,
learn and adapt, while absorbing disturbances and undergoing changes, in addition to
maintaining the same function, structure and identity (Walker et al., 2004); it reflects a
process of "bounce forward" (Davoudi et al., 2012; Davoudi, Brooks, & Mehmood, 2013)
(Shaw, 2012) that points towards changes.
Resilience, from engineering, focuses on resistance to disturbance and the property of a
system bouncing back to the state before external stress, this takes a "bounce back"
approach that refers to the capacity of a system to return to the point of equilibrium or initial
state (Holling, 1973).
On the other hand, evolutionary or socio-ecological resilience (Davoudi et al., 2012;
Gunderson, 2000; Simmie & Martin, 2010) challenges all ideas of balance and admits that
the nature of a system can change over time, with or without external disturbance. It focuses
on the evolutionary perspective of Folke (2006) of a socio-ecological system, and in multiple
and ever-changing processes rather than in a single state; therefore, they call it "transform
forward." Although this approach takes into account achieving balance, it is mainly aimed at
developing the ability to adapt, learn and transform systems when they are subject to
disturbances.
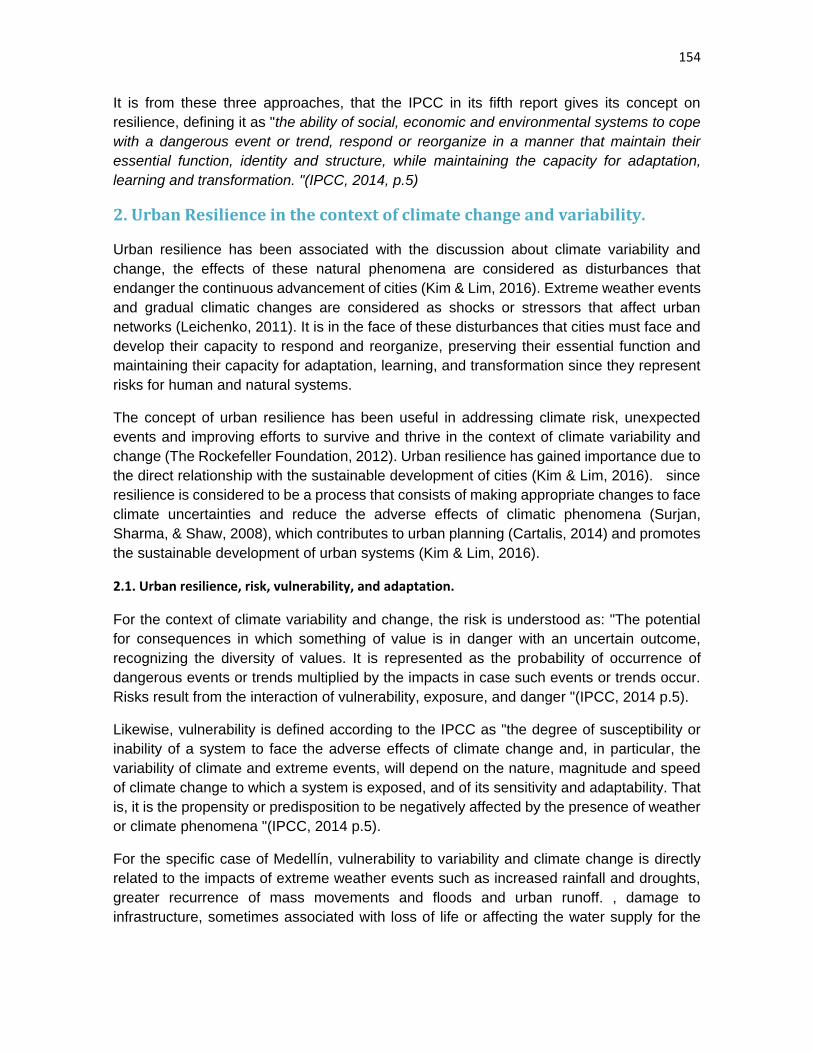
154
It is from these three approaches, that the IPCC in its fifth report gives its concept on
resilience, defining it as "the ability of social, economic and environmental systems to cope
with a dangerous event or trend, respond or reorganize in a manner that maintain their
essential function, identity and structure, while maintaining the capacity for adaptation,
learning and transformation. "(IPCC, 2014, p.5)
2. Urban Resilience in the context of climate change and variability.
Urban resilience has been associated with the discussion about climate variability and
change, the effects of these natural phenomena are considered as disturbances that
endanger the continuous advancement of cities (Kim & Lim, 2016). Extreme weather events
and gradual climatic changes are considered as shocks or stressors that affect urban
networks (Leichenko, 2011). It is in the face of these disturbances that cities must face and
develop their capacity to respond and reorganize, preserving their essential function and
maintaining their capacity for adaptation, learning, and transformation since they represent
risks for human and natural systems.
The concept of urban resilience has been useful in addressing climate risk, unexpected
events and improving efforts to survive and thrive in the context of climate variability and
change (The Rockefeller Foundation, 2012). Urban resilience has gained importance due to
the direct relationship with the sustainable development of cities (Kim & Lim, 2016). since
resilience is considered to be a process that consists of making appropriate changes to face
climate uncertainties and reduce the adverse effects of climatic phenomena (Surjan,
Sharma, & Shaw, 2008), which contributes to urban planning (Cartalis, 2014) and promotes
the sustainable development of urban systems (Kim & Lim, 2016).
2.1. Urban resilience, risk, vulnerability, and adaptation.
For the context of climate variability and change, the risk is understood as: "The potential
for consequences in which something of value is in danger with an uncertain outcome,
recognizing the diversity of values. It is represented as the probability of occurrence of
dangerous events or trends multiplied by the impacts in case such events or trends occur.
Risks result from the interaction of vulnerability, exposure, and danger "(IPCC, 2014 p.5).
Likewise, vulnerability is defined according to the IPCC as "the degree of susceptibility or
inability of a system to face the adverse effects of climate change and, in particular, the
variability of climate and extreme events, will depend on the nature, magnitude and speed
of climate change to which a system is exposed, and of its sensitivity and adaptability. That
is, it is the propensity or predisposition to be negatively affected by the presence of weather
or climate phenomena "(IPCC, 2014 p.5).
For the specific case of Medellín, vulnerability to variability and climate change is directly
related to the impacts of extreme weather events such as increased rainfall and droughts,
greater recurrence of mass movements and floods and urban runoff. , damage to
infrastructure, sometimes associated with loss of life or affecting the water supply for the

155
population and public transport with increased congestion and travel times (Alcaldía de
Medellín, 2014).
With the recognition of the vulnerability of cities and the challenges posed by the impacts of
climate variability and change on urban socio-ecological systems, resilience is presented as
a measure to address these risks; it has been considered as the "opposite" of vulnerability,
the more resilient a system, the less vulnerable (Pelling, 2011).
On the other hand, resilience has been related to adaptation (FUNFGELD, 2013; Kim & Lim,
2016; Wong-Parodi, Fischhoff, & Strauss, 2015), understanding the latter as a means to
create resilience and make adjustments based on the impacts of climate change (IPCC,
2014); In this sense, improving the adaptive capacity of a system can reduce its exposure
to climate variability, thus reducing the vulnerability of this system and improving its
resilience (Adger, Brooks, Bentham, & Agnew, 2004, Leichenko, 2011).
In other words, when the adaptive capacity is low, there is a vulnerability; therefore there will
be a risk; whereas if the capacity for adaptation is high, there will be resilience.
Thus, the concept of resilience intersects with the notions of vulnerability, risk, and
adaptation. (Bulkeley & Tuts, 2013; Leichenko, 2011). The increasingly common objectives
of activities that address climate issues are to increase resilience, decrease vulnerability and
improve adaptive capacity. These three concepts are not interchangeable, but all of them
refer to factors that allow people or systems to anticipate, avoid, plan, assume and
overcome, recover and adapt to climatic shocks related to climate variability (Jabareen,
2013).
Building resilience has become an essential component for climate adaptation (Davoudi,
Brooks, & Mehmood, 2013), the objective is to reduce impacts, prepare in the best way
possible against environmental risks and develop adaptive capacity.
3. Urban Resilience Measurement
The indices to measure urban resilience offer a potential way to address the multivariate
and complex nature of socio-ecological systems. Such indices are a composite of indicators
that summarize many aspects that can be interrelated in one value (Krishnamurthy, Lewis,
&Choularton, 2014). Thus, an indicator is defined as a variable that quantifies and
characterizes attributes of the object of study (Schuschny& Soto, 2009). These tools are
considered useful for measuring urban resilience, so various indices have been constructed
to estimate it in the contexts of variability and climate change (Cutter, 2015, D'Lima & Medda,
2015, Engle, by Bremond, Malone, & Moss, 2014; Kotzee & Reyers, 2016; R. Shaw, 2015;
Tyler et al., 2016; Xu & Xue, 2017).
The urban resilience indexes are helping cities to understand and measure their capacity to
support, adapt and transform (Engle et al., 2014), also, by starting from a conceptual
framework that integrates all the dimensions, allows identifying how they should move cities
towards a more resilient state.

156
For the construction of the Urban Resilience Index applied to the city of Medellín, the phases
presented in Figure 1 were followed, based on methodologies applied by other authors.
Figure 1: Methodology for the construction of the Urban Resilience Index in the face of Variability and Climate
Change.
Source: self-made
Initially, a review of the literature on the conceptual framework of resilience and case studies
was carried out, mainly in the context of climate change and variability, as well as a
bibliographic review on the construction of composite indices (Saisana & Tarantola, 2002;
Schuschny& Soto, 2009).
Next, the dimensions and variables for the urban resilience index were determined, the
identification was made from two moments: Bibliography review and selection of dimensions
and variables, and validation by experts in order to determine the importance and
contribution of each of the variables in the construction of the index. In addition, taking into
account (Schuschny & Soto, 2009), variables were selected based on relevance, quality,
the frequency of sampling and the availability of information. Based on this, the following
dimensions and variables were proposed for each of them that allow measuring urban
resilience in the face of variability and climate change. Table 1.
Dimensions Variables

157
Social
Demographic conditions:
• Quality of life
• Population density
• Education
• Social equity
• Poverty / Unsatisfied Basic Needs
Ecological
Environmental quality and use of natural
resources:
• Ecosystem services
• Water quality
• Air quality
• Ecological connectivity
• Deforestation
Economic
• Unemployment
• Level of income per capita
• Economic growth
• Economic diversity
Physics / Infrastructure
• Buildings Quality.
• Climate-adapted Buildings
• Population in areas of high threat
• Areas of threat and risk
• Green Infrastructure
Institutional /
Governance
• Disaster prevention and response programs.
• CommunityEmpowerment
• The degree of integration of climate change in
planning
• Population aware of variability and climate
change
• Social cohesion
• Climate changePolicies

158
Table 1: Dimensions and Variables to measure urban resilience.
Source: Own elaboration, based on the following references: (Abdrabo & Hassaan, 2015; Engle et al.,
2014; Suárez et al., 2016; Xu & Xue, 2017), Sharif (2016) Tyler y Moench, 2012, Alshehri et al., 2014;
Cutter, 2016). (Prashar, Shaw, & Takeuchi, 2012), (Brown, Shaker, & Das, 2016) (Thathsarani &
Gunaratne, 2018) (Angeon & Bates, 2015) (The Rockefeller Foundation & ARUP, 2015) (Cimellaro,
Renschler, Reinhorn, & Arendt, 2016) cox 2014, Cutter et al. (2014), Burton 2015, Abdrabo & Hassaan,
2015; Engle, de Bremond, Malone, & Moss, 2014; Suárez, Gómez-Baggethun, Benayas, & Tilbury,
2016; Xu & Xue, 2017.
From this approach, the importance of understanding urban resilience as a multifaceted
concept that includes social, economic, institutional, infrastructural, and ecological elements
is highlighted (Cumming et al., 2005, Cutter, 2015, Tyler & Moench, 2012) , (Figure 2), most
of the indices developed address each of these dimensions (Engle, de Bremond, Malone, &
Moss, 2014; Nguyen, Bonetti, Rogers, & Woodroffe, 2016; Tyler et al., 2016; Xu & Xue,
2017). Likewise, it has been identified that the dimensions (and the variables within the
dimensions) may need to be modified in specific cases, some may not be necessary or may
be joined if the variables encompass two or more dimensions (Engle, de Bremond, Malone,
& Moss, 2014).
Likewise, although there are already several measurement techniques for some of these
components, future research should prioritize a systemic approach for the measurement of
all components.

159
Figure 2: Dimensions of Urban Resilience.
Source: self-made
In the case of Medellín, in future work the index will be applied to the city in order to obtain
the measurement and, therefore, its resilience profile; If possible, a historical index will be
developed to observe progress and setbacks regarding urban resilience.
Finally, it is clear that we have an instrument to identify the resilience profile of cities,
correlating social, economic, institutional, environmental and infrastructure variables, with
their capacity to recover from the impact of a disturbing phenomenon, in this case, climate
change, is the first step to increase the resilience of cities.
Reference List
Abdrabo, M. A., & Hassaan, M. A. (2015). An integrated framework for urban resilience to
climate change - Case study: Sea level rise impacts on the Nile Delta coastal urban
areas. Urban Climate, 14. https://doi.org/10.1016/j.uclim.2015.09.005
Adger, W. N., Brooks, N., Bentham, G., & Agnew, M. (2004). New indicators of
vulnerability and adaptive capacity. Change, 5(January), 128. Retrieved from
http://citeseerx.ist.psu.edu/viewdoc/download?doi=10.1.1.112.2300&rep=rep1&a
mp;type=pdf

160
Alexander, D. E. (2013). Resilience and disaster risk reduction: An etymological journey.
Natural Hazards and Earth System Sciences, 13(11). https://doi.org/10.5194/nhess-
13-2707-2013
Brenkert, A. L., & Malone, E. L. (2005). Modeling vulnerability and resilience to climate
change: A case study of India and Indian states. Climatic Change, 72(1–2), 57–102.
https://doi.org/10.1007/s10584-005-5930-3
Bulkeley, H., & Tuts, R. (2013). Understanding urban vulnerability, adaptation and
resilience in the context of climate change. Local Environment, 18(6), 646–662.
https://doi.org/http://dx.doi.org/10.1080/13549839.2013.788479
Carpenter, S., Walker, B., Anderies, J. M., & Abel, N. (2001). From Metaphor to
Measurement: Resilience of What to What? Ecosystems, 4(8), 765–781.
https://doi.org/10.1007/s10021-001-0045-9
Cartalis, C. (2014). Toward resilient cities - a review of definitions, challenges and
prospects. Advances in Building Energy Research.
https://doi.org/10.1080/17512549.2014.890533
Cumming, G. S., Barnes, G., Perz, S., Schmink, M., Sieving, K. E., Southworth, J., … Van
Holt, T. (2005). An exploratory framework for the empirical measurement of
resilience. Ecosystems, 8(8), 975–987. https://doi.org/10.1007/s10021-005-0129-z
Cutter, S. L. (2015). The landscape of disaster resilience indicators in the USA. Natural
Hazards, 80(2). https://doi.org/10.1007/s11069-015-1993-2
D’Lima, M., & Medda, F. (2015). A new measure of resilience: An application to the
London Underground. Transportation Research Part A: Policy and Practice, 81, 35–
46. https://doi.org/10.1016/j.tra.2015.05.017
Davoudi, S., Brooks, E., & Mehmood, A. (2013). Evolutionary Resilience and Strategies for
Climate Adaptation. Planning Practice and Research, 28(3), 307–322.
https://doi.org/10.1080/02697459.2013.787695
Davoudi, S., Shaw, K., Haider, L. J., Quinlan, A. E., Peterson, G. D., Wilkinson, C., …
Porter, L. (2012). Resilience: A Bridging Concept or a Dead End? "Reframing"
Resilience: Challenges for Planning Theory and Practice Interacting Traps: Resilience
Assessment of a Pasture Management System in Northern Afghanistan Urban
Resilience: What Does it Mean in Planning. Planning Theory and Practice, 13(2),
299–333. https://doi.org/10.1080/14649357.2012.677124
Dhar, T. K., & Khirfan, L. (2017). A multi-scale and multi-dimensional framework for
enhancing the resilience of urban form to climate change. Urban Climate, 19, 72–91.
https://doi.org/10.1016/j.uclim.2016.12.004
Engle, N. L., de Bremond, A., Malone, E. L., & Moss, R. H. (2014). Towards a resilience
indicator framework for making climate-change adaptation decisions. Mitigation and

161
Adaptation Strategies for Global Change, 19(8), 1295–1312.
https://doi.org/10.1007/s11027-013-9475-x
Folke, C. (2006). Resilience: The emergence of a perspective for social-ecological
systems analyses. Global Environmental Change, 16(3), 253–267.
https://doi.org/10.1016/j.gloenvcha.2006.04.002
FUNFGELD, H. & M. D. (2013). ¿Resilience as a useful concept for climate change
adaptation? Planning Theory & Practice, 13(2), 324–328.
https://doi.org/10.1080/14649357.2012.677124
Gunderson, L. H. (2000). ECOLOGICAL RESILIENCE — IN THEORY AND
APPLICATION.
Harley, M., Horrocks, L., Hodgson, N., & Van Minnen, J. (2008). Climate change
vulnerability and adaptation indicators. European Topic Centre on Air and Climate
Change (ETC/ACC) Technical Paper, 9.
Holling, C. S. (1973). Resilience and Ecological Systems. Annu.Rev.Ecol.Syst., 4, 1–23.
https://doi.org/10.1146/annurev.es.04.110173.000245
IPCC. (2014). Cambio climático 2014. Impactos, adaptación y vulnerabilidad - Resumen
oara responsables de políticas. Contribución Del Grupo de Trabajo II Al Quinto
Informe de Evaluación Del Grupo Intergubernamental de Expertos Sobre El Cambio
Climático., 34.
Jabareen, Y. (2013). Planning the resilient city: Concepts and strategies for coping with
climate change and environmental risk. Cities, 31.
https://doi.org/10.1016/j.cities.2012.05.004
Kim, D., & Lim, U. (2016). Urban Resilience in Climate Change Adaptation: A Conceptual
Framework. Sustainability. https://doi.org/10.3390/su8040405
Klein, R. J. T., Nicholls, R. J., & Thomalla, F. (2003). Resilience to natural hazards: How
useful is this concept? Environmental Hazards, 5(1), 35–45.
https://doi.org/10.1016/j.hazards.2004.02.001
Kotzee, I., & Reyers, B. (2016). Piloting a social-ecological index for measuring flood
resilience: A composite index approach. Ecological Indicators, 60, 45–53.
https://doi.org/10.1016/j.ecolind.2015.06.018
Krishnamurthy, P. K., Lewis, K., & Choularton, R. J. (2014). A methodological framework
for rapidly assessing the impacts of climate risk on national-level food security
through a vulnerability index. Global Environmental Change, 25(1), 121–132.
https://doi.org/10.1016/j.gloenvcha.2013.11.004
Leichenko, R. (2011). Climate change and urban resilience. Current Opinion in
Environmental Sustainability, 3(3), 164–168.

162
https://doi.org/10.1016/j.cosust.2010.12.014
Nguyen, T. T. X., Bonetti, J., Rogers, K., & Woodroffe, C. D. (2016). Indicator-based
assessment of climate-change impacts on coasts: A review of concepts,
methodological approaches and vulnerability indices. Ocean and Coastal
Management. https://doi.org/10.1016/j.ocecoaman.2015.11.022
Pelling, M. (2011). Adaptation to Climate Change from resilience to transformation.
Climate Change 2014: Impacts, Adaptation, and Vulnerability. Contribution of
Working Group II to the Fifth Assessment Report of the Intergovernmental Panel on
Climate Change. https://doi.org/10.4324/9780203889046
Saisana, M., & Tarantola, S. (2002). State-of-the-art Report on Current Methodologies and
Practices for Composite Indicator Development. Joint Research Centre. Italy:
European Commission, (July), 1–72. https://doi.org/10.13140/RG.2.1.1505.1762
Schuschny, A., & Soto, H. (2009). Guía metodológica Diseño de indicadores compuestos
de desarrollo sostenible Andrés Schuschny. Cepal, 109. https://doi.org/LC/W255
Sharma, D., Singh, R., & Singh, R. (2014). Building urban climate resilience: learning from
the ACCCRN experience in India. International Journal of Urban Sustainable
Development, 6(2), 133–153. https://doi.org/10.1080/19463138.2014.937720
Shaw, K. (2012). Reframing Resilience: Challenges for Planning Theory and Practice.
Plan. Theory Pract, 13, 308–312.
Shaw, R. (2015). Climate and Disaster Resilience Index of Asian Cities. Retrieved from
http://www.cger.nies.go.jp/gcp/workshop-on-tools-and-indicators-for-assessing-urban-
resilience.html
Simmie, J., & Martin, R. (2010). The economic resilience of regions : towards an
evolutionary approach, (January), 27–43. https://doi.org/10.1093/cjres/rsp029
Suárez, M., Gómez-Baggethun, E., Benayas, J., & Tilbury, D. (2016). Towards an Urban
Resilience Index: A Case Study in 50 Spanish Cities. Sustainability, 8(8), 774.
https://doi.org/10.3390/su8080774
Surjan, A., Sharma, A., & Shaw, R. (2008). CHAPTER 2 UNDERSTANDING URBAN
RESILIENCE Akhilesh Surjan , Anshu Sharma and Rajib Shaw. Community,
Environment and Disaster Risk Management (Vol. 6). Emerald.
https://doi.org/10.1108/S2040-7262(2011)0000006008
Tyler, S., & Moench, M. (2012). A framework for urban climate resilience. Climate and
Development, 4(4), 311–326. https://doi.org/10.1080/17565529.2012.745389
Tyler, S., Nugraha, E., Nguyen, H. K., Nguyen, N. Van, Sari, A. D., Thinpanga, P., …
Verma, S. S. (2016). Indicators of urban climate resilience: A contextual approach.
Environmental Science and Policy, 66, 420–426.

163
https://doi.org/10.1016/j.envsci.2016.08.004
Walker, B., Holling, C. S., Carpenter, S. R., & Kinzig, A. (2004). Resilience, adaptability
and transformability in social-ecological systems. Ecology and Society, 9(2).
https://doi.org/10.5751/ES-00650-090205
Wong-Parodi, G., Fischhoff, B., & Strauss, B. (2015). Resilience vs. Adaptation: Framing
and action. Climate Risk Management, 10, 1–7.
https://doi.org/10.1016/j.crm.2015.07.002
Xu, H., & Xue, B. (2017). Key indicators for the resilience of complex urban public spaces.
Journal of Building Engineering, 12(July), 306–313.
https://doi.org/10.1016/j.jobe.2017.06.018

164
Chapter 13. Use of Geographic Information
System (GIS) tools in the climate change
evaluation in rural sector of Tolima
Jose Armando Hernández López Armando, Liliana Delgadillo Mirquez, Manuela Cepeda Sánchez and Mauricio Hernández Sarabia
Universidad de Ibagué (Colombia)
1. Introduction
Human influence on the climate system is clear, and currently the increase of anthropogenic
emissions of greenhouse gases is evident. Recent climate changes have had widespread
impacts on human and natural systems (IPCC, 2014). This situation will modify the spatial
distributions in physic-biotic and socio-economic components, and will produce conflicts in
the society-nature relationship. Indeed, climate change seen as the modification of average
temperature, annual precipitation, relative humidity and runoff, it will directly affect
ecosystems, human health and water availability for different purposes (Asmus et al., 2017;
Barrett et al., 2015; Barnett et al., 2005).
Given that there is a close relation between climate-vegetation-ecosystems-biomes, this
environmental relation has an important incidence in the biotic processes of the planet, and
particularly in the biomes spatial distribution and the existence of a certain biodiversity
(Mantyka-Pringle et al., 2015). Climate change will affect biodiversity from the ecosystem to
the species level. However, it will not affect all species and communities in the same way,
some tend more to extinction than others, it due to direct or indirect effects of the change.
The most obvious impact is on ecosystem boundaries as a result of sea level rise and
changes in temperature; this will cause some ecosystems to expand into new areas and
others to decrease in size (IPCC, 2014). According to Buytaert et al. (2011), climate change
will displace ecosystem boundaries and strongly reduce the total area of tropical alpine
regions in Colombian territories.
An approach to assess the climate change impact on ecosystems is based on the modeling
of possible impacts on the spatial distribution of vegetation cover. In fact, vegetation cover
is defined as the percentage of soil which is covered by green vegetation. In the planet,
vegetation and forest act as natural water filters, removing many pollutants before the water
reaches streams, lakes and reservoirs. Indeed, vegetation activity is regarded as one of the
most important indicators for evaluating interactions between climate and terrestrial
ecosystems. Vegetation dynamics are highly sensitive to climate change, especially in arid

165
scale (city and regional scale) are conducted based on the remote sensing techniques like
Normalized Difference Vegetation Index (NDVI).
1.1. Tools for the analysis of land use
Currently, the Geographic Information Systems (GIS) is the tools used to study changes in
vegetation cover and land use. The maps was transformed into a digital format for its
electronic analysis, it that include updated georeferenced data ant integrate multiple sets
and information processes, quickly and efficiently. A GIS is a manual or computerized set of
procedures used to store and manipulate georeferenced data. The evaluation and
monitoring of resources for territorial ordering of a community can be possible for the
implementation of GIS, remote sensing and cartography.
Remote sensing (aerial photographs and satellite images) increases the observation
capacity for obtaining data on a phenomenon with a spatial dimension; cartographic systems
symbolize geographical data through maps (paper or digital), and GIS analyze and generate
information from these data. The information that is generated through remote sensing
systems, such as satellite images, has been applied to the assessment of natural resources
and risks, through GIS. The spectral classification has been used, for example, in the
detection and quantification of eroded lands, with the assumption that these constitute an
identifiable spectral class. However, there is inconsistency in the identification of the classes,
since different objects can have a very similar response, this also happens with water
bodies, due to the large amount of sediments they can contain. Therefore, the experience
and knowledge of the interpreter on the area is very important.
1.2. Image processin The analysis of NDVI requires the use of topographic map of the study area. A topographic map represents the main elements that make up the earth surface. These maps show natural or artificial objects of a territory, such as hills, rivers, forests, villages, roads, bridges, etc. These allow identifying the planimetry and altimetry according to the scale of work. In addition, geomatics or georeference data is defined as an approach to the measurement, analysis, management, storage and visualization of terrestrial data descriptions and location. The sources of these data included satellite, aerial and terrestrial instruments platforms. In fact, the image interpretation requires to perform adequate techniques of combination like use the remote sensing. It is based on the electromagnetic radiation registration using remote sensors that are not in physical contact the object that energy emits. The remote sensors can carried by air navigation vehicles in the atmosphere (balloons, airplanes, helicopters) or outside it (satellites, orbital stations, spacecraft). In general, for this type of studies, the satellite images are obtained from Landsat sensor (NASA). Landsat program was created in the United State and provide essential information to help land managers and policy makers make wise decisions about our resources and our environment (Landsat Science). Seven Landsat satellites have been launched by NASA to obtain Earth images in a global way since 1972. The most modern sensor is the Enhanced Thematic Mapper Plus (ETM+). The Table 1 presents information about satellite of the Landsat program and the general characteristics of the sensor.

166
Landsat sensors record reflected and emitted energy from Earth in various wavelengths of the electromagnetic spectrum. The electromagnetic spectrum includes all forms of radiated energy from tiny gamma rays and x-rays all the way to huge radio waves. The human eye is sensitive to the visible wavelengths of this spectrum; we can see color, or reflected light, ranging from violet to red (Landsat Science).
Table 1 - Satellite of the Landsat program and the general characteristics of the sensor
Satellite launch date End of operation Band feature
ERTS1 23/July/72 5/January/78 Band 4: blue
Band 5: green
Band 6: red
Band 7: Infrared
LANDSAT 3 5/March/78 7/September/93
LANDSAT 4 16/June/82 1983 Band 4: blue
Band 5: green
Band 6: red
Band 7: Near infrared 1
LANDSAT 5 1/March/84 In operation Band 1: blue
Band 2: green
Band 3: red
Band 4: Near infrared 1
Band 5: Near infrared 2
Band 7: Medium infrared
Band 6: Thermal infrared
LANDSAT 7 1998 In operation Band 1: blue
Band 2: green
Band 3: red
Band 4: Near infrared 1
Band 5: Near infrared 2
Band 6: Medium infrared
Band 8: Panchromatic
In the flow chart presented below, the activities that can be develop for a study of vegetation cover.
Obtaining aerial photographs
and thematic cartography
Photointerpretation and
digitization
Map rectification
Map of vegetation and land
use
Dimensional analysis

167
1.3. Local. regional and globe climate Climate is the result of environmental factors and conditions and it operate at different
scales, in such a way that it is possible to speak of local climate, regional climate and global
climate (Rodríguez et al., 2010). Global climate is a concept that considers the dominant
atmospheric conditions during a long period (months, years, centuries). They are generated
by a heterogeneous distribution of solar energy that enters to planet and produces an
atmospheric and oceanic circulation. This circulation redistributes the energy (heat),
humidity of air, cloudiness and rainfall. Regional climate refers to the predominant
atmospheric conditions in a region, which are a consequence of the modulation of global
conditions due to the physic-geographical factors that characterize it. Local climate refers
to the prevalent atmospheric conditions in a place. Here the soil cover characteristics (forest,
crops, water mirror, cement-asphalt) play a significant role in the modification of the
underlying conditions, generated by the global and regional climate.
1.4. Global and regional impacts of climate change
Global environmental changes related to climate alteration, biogeochemical cycles, land use
and mobility of organisms and species have changed the local and global diversity of the
planet, with important ecological and social systems consequences (Chapin et al., 2000).
According to Sala et al. (2000), for terrestrial ecosystems, land use change probably will
have the largest effects in biological diversity, followed by climate change by the year 2100.
Climate change effect combined with the effects of habitat loss and landscapes
fragmentation will make it possible to modify the composition of ecosystems and displace
the habitats of many species. In fact, it will increase the rate of species loss and create
opportunities for the establishment of other one (IPCC, 2014). Changes in the communities,
composition and ecosystems distribution can produce reactions that affect the global and
regional climate. In addition, changes in the intensity and spatial patterns of land use can
lead to the loss of important ecosystem services and the provision of future demands of our
society (Quétier et al., 2009).
2. Case study: Analysis of the Normalised Difference Vegetation Index (NDVI) in the department of Tolima, Colombia Vegetation cover refers to the type of cover (natural or human product) that is on the land
surface (grass, crop, forest, etc.). One of the most important characteristics currently used
as an indicator of the status and condition of the forest ecosystem is vegetation cover.
Vegetation cover estimates are developed and used to characterize forest vegetation and

168
enable the assignment of attributes or descriptive information regarding species type,
composition, and even stand structure (Stumpf, 1993).
Vegetation is the most abundant biotic element of the biosphere and it is described for the
plant life of a place. Vegetation aids several critical functions in the biosphere:
(i) Vegetation regulates the flow of biogeochemical cycles: water, carbon, nitrogen.
(ii) Vegetation strongly affects soil characteristics, that including soil volume,
chemistry and texture. It also affects productivity and structure.
(iii) Vegetation serves as wildlife habitat and energy source for an extensive variety
of animal species on the planet.
(iv) Vegetation is important to the word economy and in the production of food,
wood, fuel, shelter, medicines and other materials.
(v) Vegetation is a source of oxygen in the atmosphere, and favors that anaerobic
metabolism systems evolve and persist.
(vi) Vegetation is psychologically important to human.
2.1. Normalized Difference Vegetation Index (NDVI) The normalized difference vegetation index (NDVI) has been widely used for remote sensing
of vegetation for many years as the major indicator of urban climate (Yuan & Bauer, 2007).
NDVI is related of biomass of the plants and it can estimate the ecosystem productivity.
Strong chlorophyll absorption is located in two absorption peaks of visible spectrum, one is
the blue light (400-500 nm) and other one is the red (600-700 nm). However, plant cells have
evolved to disperse solar radiation in the near-infrared spectral region. The reflection in the
red region is low due to the absorption of chlorophyll. On the other hand, infrared region
shows a high reflection due to the diffusion by the structures of the leaves cells. Therefore,
the vegetation appears relatively dark in the region of active photosynthetic radiation and
relatively bright in the near infrared.
Normalized difference vegetation index maps are derived for images as follows:
Where NIR and R are the spectral reflectances percentage in near-infrared and red bands,
respectively. NDVI equation produces values in the range from −1 to 1. Positive values
indicate vegetated areas and negative values signify non-vegetated surface features such
as water, barren, clouds, and snow. The classification of the NDVI can be seen in the Table
2.
Table 2 - The classification of the NDVI
Classification Values
Clouds and water (NA) < 0,01
Soil without vegetation (SV) 0,01 – 0,1
Light vegetation (VL) 0,1 – 0,2
Medium vegetation (VM) 0,2 – 0,4

169
High vegetation (VA) >0,4
2.2. Study area The area is the eastern region of the department of Tolima (Colombia) with a surface 4115
km2 (Figure 1). The study area includes 13 municipalities with an elevation between 285
and 1300 meters above sea level. In addition, this region is characterized by an intense
agricultural activity associated with the fact that most of the territory is rural. Also, some
municipalities depend on a regional tourism as main economic activity. Most of the
municipalities have agricultural vocation, although the latest reports indicate the change in
recent years of land use. Currently, land use for the livestock and fish farming sector is
increased. These activities have changed the structure of the landscape.
This region is characterized by having a tropical dry forest, it is an ecosystem used in Tolima
as a supply of tree species for anthropic use. The climate of the area is characterized by the
contrast in the values of the precipitation in dry areas with around 700 mm year. In general,
the precipitation regime is bimodal, with two wet periods and two dry periods. In this area
cross the Magdalena River, the principal river of Colombia, it is navigable and flows through
the Magdalena River Valley. Another important aspect in this region is the existence of the
Prado Reservoir with a store capacity of 966.22 million cubic meters of water, extension of
42 km2 and 51 MW of electrical generation capacity.
Figure 1 – Study area for vegetation cover

170
Source: authors
2.3. Results The NDVI method was used for monitoring temporal changes in vegetation of the eastern
region of the department of Tolima. The changes were register for two year: 1998 and 2017.
It has been used to prepare spectral vegetation indices which separate green vegetation
using Landsat data. This method depends on the different interactions between
electromagnetic spectrum of near-infrared and red wavelengths. Red wavelength (about
600–700 nm) shows low reflectance because chlorophyll of leaf pigment absorbs more red
wavelengths and infrared wavelength (about 800–900 nm) is of high reflectance because
cell structure of the leaves scatters more infrared wavelength. NDVI can easily determine
with the comparison of infrared wavelength band to that of red wavelength band.
NDVI values were calculated using ArcGIS raster calculator and maps of the region were
prepared. In this study, forest cover area, agriculture area, grassland and shrubland are
taken into consideration for vegetation class category. Classified maps for each year are
presented as shown in Figure 2.
The results obtained from NDVI analysis show the loss of vegetation cover in the region on
a period of 19 years. In this case, Villarica, Cunday and Icononzo, the municipalities with
the highest degree of loss of vegetation cover.

171
Figure 2 – Classification maps for eastern region of the department of Tolima
Source: authors
Figure 3 clearly shows a very good vegetation layer in 1998, we can also appreciate the
Magdalena river and how it divides with the Saldaña River, and the area occupied by the
hydro-Prado dam. More than 60% is high vegetative layer, and more than 86% is medium-
high vegetation, little more than 4% are water and clouds although it seems very low it really
is not, since we are analyzing in function of area and not volume.
For the year 2017 (Figure 4) is a more drastic change, it is evident in the image as in the
graph and numbers, since the soil without vegetation occupies just over 17% of the area
and the upper vegetative layer has a percentage of 35.5%, which shows the impact of
climate change on the vegetative layer of this area.
Figure 3 – State of vegetation in the area for 1998
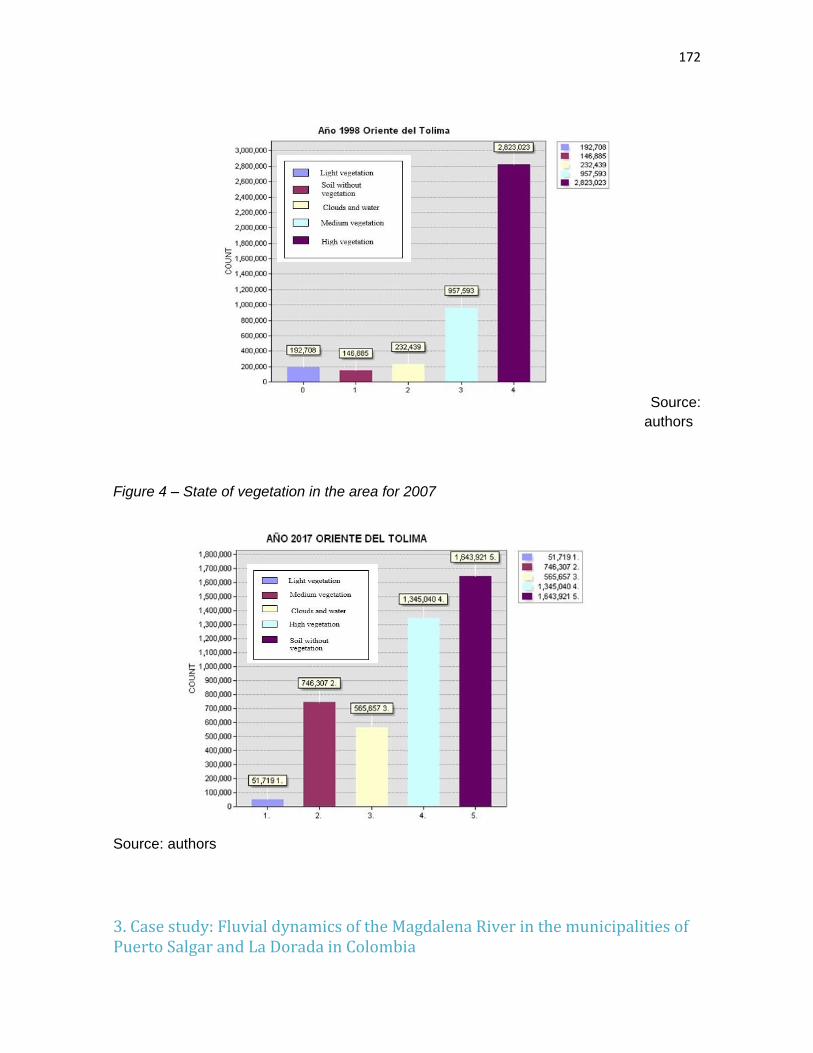
172
Source:
authors
Figure 4 – State of vegetation in the area for 2007
Source: authors
3. Case study: Fluvial dynamics of the Magdalena River in the municipalities of Puerto Salgar and La Dorada in Colombia

173
Rivers are of great importance for the economy of any society, they give us the resources such as water, energy, food and recreation. Rivers not only transport water, they transport salts, sediments and organisms, and the complex chemical and biological reactions that occur in the river channels are partly responsible for the chemical characteristics of the water retained in the large reservoirs, like lakes and oceans (Elosegi, Sabater 2009). Rivers are dynamic entities that evolve by themselves due to hydrological, meteorological and geomorphological factors (Segura-Serrano, 2013); but the change in the structure of the rivers is also due to the anthropic intervention of natural resources, such as the changes in the land uses, construction of reservoirs, irrigation districts, agricultural activities, deforestation, among others. All these activities directly affect the river dynamics and the water resource planning (Lopez et al. 2014).
3.1. Fluvial Dynamics Potamology, the science of rivers, focuses on issues of fluvial erosion, transport and
sedimentation; and river metamorphosis or change through time. Fluvial dynamics as a
branch of potamology, studies the action of forces on riverbed materials and water flow in
watercourses (AMS, 2012). The understanding and identification of the way a river flows
through time is really necessary to mitigate flood and erosion threats, also to design civil
works and navigability (Vargas, 2012). As cited in Robert (2003, p. 9) the morphology of
rivers is determined by the following four factors:
1. Volume and time distribution of water supplied from upstream
2. Volume, time distribution and character of sediment delivered to the channel
3. Nature of the material through which the river flows
4. Topographic gradient down which the river flows.
According to Elosegi and Sabater (2009) geological characteristics and climate are the key
factors that explain the differences between rivers of different latitudes and biomass. Density
and type of vegetation, weathering and development of soils, slope of the basin and
circulating flow are descriptive parameters of the basin that depend on geology and climate
as shown in figure 5.
Figure 5 – Factors that determine the morphology and dynamics of the fluvial system

174
Source: Elosegi, Sabater (2009)
3.2. Study area for fluvial dynamics For this case two municipalities of Colombia were studied: Puerto Salgar - Cundinamarca
and La Dorada - Caldas (Figure 6). These two municipalities are part of the 128 bathed by
the main fluvial artery of the country: the Magdalena River. This river has a length between
1528 and 1628 kilometers, which 866 km are navigable. Its basin is more than 257000
square kilometers in length which represents 34% of the national territory (Semana, 2016).
In the Magdalena River basin, 70 percent of the Colombian population is settled and 85
percent of the nation’s gross domestic product (GDP) is generated. 184 million tons of
sedimentation are thrown every year into the river by deforestation, causing the rise of the
level by 5 meters during the rain period (El Tiempo, 1996).
Figure 6 – Location of Puerto Salgar and La Dorada in the national territory and their
closeness to the Magdalena River

175
Source: authors
The municipalities of Puerto Salgar and La Dorada are highly vulnerable to flood risks due
to their proximity to the Magdalena River as shown in figure 7, which presents a flood threat,
especially during the winter season and when the floodgates of the Betania Dam in the
department of Huila are opened, affecting the buildings located near its channel (PBOT,
2002).
Figure 7 – Closeness of both municipalities Puerto Salgar (1) and La Dorada (3) to the
Magdalena River (2).
Source: Google earth, 2018.

176
The bodies of water of the national territory (rivers, lagoons, lakes, swamps, etc.) cover 1.7%
of the surface. The periodically flooded areas reach 12% of the national territory and extend
to 28% in times with excess rainfall. 28% of the population is exposed to a high flood
potential and 31% to a high and medium threat by mass movements. In 2012, floods under
the phenomenon of La Niña affected both departments under study (Caldas and
Cundinamarca), flooding 1203 ha and 45846 ha respectively (IDEAM, 2013).
Methodology to determine the fluvial dynamics
For determine the fluvial dynamics of the Magdalena river at Puerto Salgar and la Dorada,
three phases were developed.
First phase: Image selection.
Images from the USGS portal were analyzed for years 1985 and 2015, separating the good
quality images from the ones with nubosity, color and band alterations. At the end of this
phase, the mosaic with the optimal images for the study area in both years 1985 and 2015
was obtained.
Second phase: Geometrical correction
It consists in the use of the gvSIG software as a tool to integrate the information stored and
codified; in this program the geometric corrections of the image are made, including changes
in the position occupied by the pixels that make it up; it is about changing its position, its
coordinates and the geometric error is modeled.
Third phase: Visual interpretation of satellite images
Once the other two phases were completed, the images were interpreted taking into
consideration scientific documents (such as IDEAM maps) and papers.
3.3. Results The forms that the rivers adopt adjust to the volumes of water and sediments they transport,
and the material conditions of the lands they register. Defining fluvial dynamics for the
municipalities of Puerto Salgar and La Dorada was an important factor in the planning of the
territory in the departments of Cundinamarca and Caldas. Undoubtedly, reduce the
exposure of the population to natural hazards through the implementation of techniques that
enable the analysis of dynamic phenomena in space and time, contributing to the prevention
of risks and disasters.
Figure 8 – Fluvial dynamics of the Magdalena River in Puerto Salgar and La Dorada

177
Source: authors
In figure 8 it can be seen that in 1985 the Magdalena River has three islands and by the
year 2015 it has not; it is also observed that the dynamics of the river presents changes in
the urban area of the municipality of La Dorada.
When performing the ARCGIS procedures (image corrections, composition, trimming,
intersection, union), we proceed to obtain the results of the study, calculate the total area
affected in each of the municipalities as shown below.
Final result of the affected areas by the real width of the river
Municipalitie affected area (m2) by the
Magdalena River
La Dorada 2033925.65
Puerto Salgar 65613.65
Total 2099539.3
Figure 8 – Affected areas by the Magdalena River in Puerto Salgar and La Dorada

178
Source: authors
References
American Meteorological Society. 2012. Glossary of meteorology. Retrieved from
http://glossary.ametsoc.org/wiki/Potamology
Asmus, M. L., Nicolodi, J., Anello, L. S., & Gianuca, K. 2017. The risk to lose ecosystem
services due to climate change: A South American case. Ecological Engineering, (January),
0–1. https://doi.org/10.1016/j.ecoleng.2017.12.030
Barnett, T. P., Adam, J. C., & Lettenmaier, D. P. 2005. Potential impacts of a warming
climate on water availability in snow-dominated regions. Nature, 438(7066), 303–309.
https://doi.org/10.1038/nature04141
Barrett, B., Charles, J. W., & Temte, J. L. 2015. Climate change, human health, and
epidemiological transition. Preventive Medicine, 70, 69–75.
https://doi.org/10.1016/j.ypmed.2014.11.013
Buytaert, W., Cuesta-Camacho, F., & Tobón, C. 2011. Potential impacts of climate change
on the environmental services of humid tropical alpine regions. Global Ecology and
Biogeography, 20(1), 19–33. https://doi.org/10.1111/j.1466-8238.2010.00585.x
Chapin, F. S., Zavaleta, E. S., Eviner, V. T., Naylor, R. L., Vitousek, P. M., Reynolds, H. L.,
… Diaz, S. 2000. Consequences of changing biodiversity. Nature, 405(6783), 234–242.
https://doi.org/10.1038/35012241

179
Consejo municipal de Puerto Salgar. 2002. Plan básico de ordenamiento territorial PBOT.
Retrieved from
http://cdim.esap.edu.co/BancoMedios/Documentos%20PDF/puertosalgarcundinamarcapb
ot2002.pdf
Elosegi, A., Sabater, S. 2009. Conceptos y técnicas en ecología fluvial. Fundación BBVA.
Retrieved from
https://eva.udelar.edu.uy/pluginfile.php/319717/mod_resource/content/1/ecofluvial.pdf
IDEAM. 2013. Memoria descriptiva mapas de inundación: Departamento de caldas.
Retrieved from
www.siac.gov.co/documents/670372/31372033/InundacionCaldas.pdf/8d3149a0-9368-
4087-bf69-0a97f5a6f100
IDEAM. 2013. Memoria descriptiva mapas de inundación: Departamento de cundinamarca.
Retrieved from
http://www.siac.gov.co/documents/670372/31372033/InundacionCundinamarca.pdf/89b08f
30-ddc7-44e0-bb20-fd58d802e789
IPCC. 2014. Climate Change 2014 Synthesis Report Summary Chapter for Policymakers.
IPCC, 31. https://doi.org/10.1017/CBO9781107415324
La Dorada; Caldas. 2018. Escala indeterminada. Retrieved from:
https://earth.google.com/web/@5.4650418,-
74.65667615,173.72708509a,7613.0425969d,35y,0h,0t,0r
Li, Z., Chen, Y., Li, W., Deng, H., & Fang, G. 2015. Journal of Geophysical Research :
Atmospheres, 345–356. https://doi.org/10.1002/2015JD023618.Received
López Ramos, Álvaro A., Martínez Acosta, Luisa E., Feria Díaz, Jhon J. 2014. Parámetros
hidrológicos y tensores en la dinámica fluvial: estudio en cuencas del caribe colombiano.
Ingeniería y Desarrollo, 32 (Julio-Diciembre) Retrieved from
http://www.redalyc.org/articulo.oa?id=85232596004
Mantyka-Pringle, C. S., Visconti, P., Di Marco, M., Martin, T. G., Rondinini, C., & Rhodes, J.
R. 2015. Climate change modifies risk of global biodiversity loss due to land-cover change.
Biological Conservation, 187, 103–111. https://doi.org/10.1016/j.biocon.2015.04.016

180
Quétier, F., Lavorel, S., Daigney, S., & de Chazal, J. 2009. Assessing ecological and social
uncertainty in the evaluation of land-use impacts on ecosystem services. Journal of Land
Use Science, 4(3), 173–199. https://doi.org/10.1080/17474230903036667
Redacción El Tiempo. 21 de noviembre 1996. El río en cifras. El Tiempo. Retrieved from
http://www.eltiempo.com/archivo/documento/MAM-599566
Revista Semana (2016, december). El río que somos: un río total. Semana, edición
especial, p. 22-23.
Robert, A. 2003. River processes: an introduction to fluvial dynamics. Ontario, Canada:
Routledge. https://doi.org/10.1002/aqc.606
Rodríguez, N., Pabón, J. D., Bernal, N. R., & Martínez, J. 2010. Cambio climático y su
relación con el uso del suelo en los Andes colombianos. Mtnforum.Org. Retrieved from
http://www.mtnforum.org/sites/default/files/publication/files/cambio_climatico_uso_suelo_a
ndes_colombianos.pdf
Sala, O. E., Chapin, F. S., Armesto, J. J., Berlow, E., Bloomfield, J., Dirzo, R., … Wall, D.
H. 2000. Global biodiversity scenarios for the year 2100. Science, 287(5459), 1770–1774.
https://doi.org/10.1126/science.287.5459.1770
Segura-Serrano, L. 2013. Conocimiento de la dinámica fluvial como herramienta para la
planificación territorial. Caso río Volcán, Buenos Aires, Puntarenas, Costa Rica. Tecnología
en Marcha. VI Encuentro de Investigación y Extensión. Pág 12-21.
Stumpf, K. 1993. The estimation of forest vegetation cover descriptions using a vertical
densitometer. Geographic Resource Solution, 97(12). Retrieved from
http://www.grsgis.com/downloads/publications/grsdensitometer/GRS_Publications/fieldsa
mplingdensitometer.pdf%5Cnhttp://www.grsgis.com/publications/saf_93.pdf
Vargas, G. 2012. Geología, geomorfología y dinámica fluvial aplicada a hidráulica de ríos.
XX seminario nacional de hidráulica e hidrología. Barranquilla, Colombia. Retrieved from
https://www.researchgate.net/publication/281444715_Geologia_Geomorfologia_y_Dinami
ca_Fluvial_Aplicada_a_Hidraulica_de_Rios?enrichId=rgreq-
3dc713aad617d8cb03bdd1d04b0e25c4-
XXX&enrichSource=Y292ZXJQYWdlOzI4MTQ0NDcxNTtBUzoyNjkzODcyMTkzMzcyMTZ
AMTQ0MTIzODMyNjIzOQ%3D%3D&el=1_x_3&_esc=publicationCoverPdf
Yuan, F., & Bauer, M. E. 2007. Comparison of impervious surface area and normalized
difference vegetation index as indicators of surface urban heat island effects in Landsat

181
imagery. Remote Sensing of Environment, 106(3), 375–386.
https://doi.org/10.1016/j.rse.2006.09.003

182

183
Chapter 14 .Planning for Resilience in the
IJssel River Valley and Delta Richard Sliuzas and Diana Reckien
University of Twente
1. Introduction This section describes some examples of climate change adaptation and resilience
programmes that are ongoing along the IJssel River Valley and in the IJssel Delta area
in the Netherlands. The description of resilience frameworks, laws and regulations
related to climate change adaptation in the Netherlands in section 1 of this report,
therefore provides a useful context for understanding and positioning the descriptions
of specific project activities which are provided here. In this section we will focus on
some of the key projects and actions which have been initiated in the region of the
Netherlands around the city of Kampen, which is situated on the banks of the IJssel
River. The IJssel River is a tributary of the River Rhine; regulated by a weir located at
Driel (see Figure x.1), it transports some of the Rhine’s water to the IJsselmeer area,
which is the largest freshwater basin of Western Europe . The IJsselmeer area is a source
of freshwater for agriculture in Friesland and Groningen and for drinking water in various
cities around it. Water levels in the lakes, rivers and canals are all regulated to ensure a
fair distribution of water resources across the various uses, and to reduce the probability
of flooding disasters occurring.
Given the many large rivers that transect the Netherlands, the potential for storm surges
from the North Sea and the low-lying topography of much of the country (about 40% of
the land, including much of the most urbanized areas, is below sea-level), disaster risk
reduction is a prominent element of the Netherlands’ water management programme.
Major flood events which occurred in 1993 and 1995 were the trigger to rethink water
management and flood protection practices across the country. At that time it was
realised that the traditional approach of building higher and higher dikes to manage flood
waters was unrealistic – too expensive and impossible to implement in some areas due
to space restrictions (higher dikes become broader at their base) and soil conditions.
The ‘Room for the River’ programme was devised as a new and more cost-effective way
to manage river discharges. Although Room for the River is focussed on river water
discharges, it has become a key element of the broader set of instruments that make up
the Dutch National Adaptation Strategy and the Delta Plan on Spatial Adaptation.

184
Figure x.1 The water networks of the Netherlands, showing the IJssel River
connecting the Rhine to the IJsselmeer area and the cities of Deventer, Zwolle
and Kampen.
(Source:Rijkswaterstaat, 2018)
As was shown in section 1, the Netherlands has various frameworks for climate
adaptation actions at different administrative levels: at national, provincial and local
levels. The local level includes both municipalities as well as water boards, both of which
have elected representatives who are politically responsible for decision making. A key
aspect of the Dutch approach is vertical and horizontal integration of actions across
these levels. A national programme, such as ‘Room for the River’ under the Delta Plan

185
on Flood Risk Management (see Figure x.2), requires coordination with provincial and
local levels to be fully realised. All levels must be party to the planning and
implementation process as the measures to be undertaken under the programme have
many implications for spatial planning, private and institutional landowners and all
sectors of society. In other words, there needs to be a mutual adjustment and alignment
between Room for the River and spatial and sectoral plans. Reaching agreement on the
required alignment of planning goals, is often a difficult and time-consuming process,
but it is an essential part of a successful programme.
Figure x.2 Map of projects undertaken under the Room for the River programme.
(Source: Room for the River, 2016)
2. Principles for climate adaptation: Multi-Layer Safety Approach
A key element of the overall strategy for water safety, which is an important component
of the Dutch National Adaptation Strategy (NAS), is what is known as the Multi-Layer
Safety approach (see figure x.3), which consists of three levels, prevention, spatial
planning and disaster management.
As one may well imagine, realization of such a Multi-Layer Safety strategy requires a
massive effort to achieve agreements between stakeholders at different levels. In the

186
case of the Room for the River project, it was decided that the programme would not be
pursued forcefully through a special procedure for major national infrastructure projects,
but rather follow the PKB procedure (Spatial Planning Key Decision) which allows for
broad multi-stakeholder participation and negotiation, and the assessment of
environmental and social impacts (Warner, 2011). As a consequence of this choice,
about 15 years were required to go through the entire stakeholder negotiation and plan
preparation stages, as stakeholders negotiated solutions to problems and conflicts, and
even sometimes ended up in court to have dispute settled. Such disputes have also
arisen in the IJssel Delta project presented below).
Figure x.3 The Multi-Layer Safety approach.
Level 3: Disaster Management -
crisis management systems
including early warning systems
and evacuation, response and
recovery.
Level 2: Sustainable spatial
planning - aligning water safety
issues with planning for spatial
quality.
Level 1: Prevention - building and
maintaining dykes and other infrastructures, awareness raising and
(Source: National Water Plan, 2009)

187
The first level, prevention, is generally realised through a suite of nine measures which
can be applied for the purpose of flood prevention (Figure x.4). Typically, Room for the
River projects, such as the IJssel Delta project, will make use of a selection of these
instruments, in an integrated manner and in combination with level 2 spatial planning
measures. Ultimately, all flood prone municipalities also have developed local disaster
management plans in the event that level 1 and 2 measures prove to be insufficient to
protect their population and their economic activities.
3. Key features of the Ijssel Delta area As explained above, the IJssel River is a branch of the River Rhine , which provides a
means to discharge water from the Rhine to the IJssel Lake. The IJssel Delta area (Fig.
x.5), therefore functions as a transition zone between Lake IJssel and the River IJssel.
Its location is such that it is exposed to fluvial floods from the River IJssel and to storm-
induced floods from Lake IJssel. Both sources of floods, also the combination of both as
a storm surge may occur when river levels are high, have to be considered in climate
change adaptation plans.
Figure x.4 Major measures for flood prevention applied in Room for the River projects.

188
(Source: https://www.ruimtevoorderivier.nl/english/)
Figure x.5 Location map of the IJssel Delta, IJssel River and IJssel Lake.

189
(Source: Sokolewicz, et al., 2011)
3.1. Ijssel Delta: challengues of water management
Following the 1993 and 1995 flood events, the design discharge in the River Rhine was
increased from 15,000 m3/s to 16,000 m3/s and sea levels were anticipated to be 50 cm
higher. However, as a result of climate change, water levels in the IJssel Delta area are
expected to rise by between 0.20 and 0.60 metres. This rise needs to be accommodated
by further adaptation of the IJssel Delta project, including an anticipated increase in
discharge in the Rhine to 18,000 m3/s and a sea level rise of 0.60 metres by 2100, as
well as the construction of a so-called climate-proof dyke. More details of the final
adaptation measures are provided below.
4. The Multi-Layer Safety Approach in Practivce in th Ijssel Delta Project 4.1. Key features of the Ijseel Delta Project
The IJSSEL Delta project is the last in a chain of projects in Room for River programme
(Fig. x.2). It is unique and complex undertaking with multiple, interlinked components.
Key challenges for the project are the balancing of development goals with public safety
in changing climate and hazard scenarios (rainfall, peak river flows and storm surges).
The major flood protection activities to be undertaken over the period 2015-2022 are:
• Deepening of the IJssel River summer-bed over a distance of 7,5 km
• Construction of 20 km of dykes in the Reevediep area to create a bypass around
Kampen for excess water
• Creation of the Reevediep bypass, with an area of 570 ha (including more than
350 ha wetland nature reserve)
• Flood protection works encompassing a total of 6 separate flood plain areas
involving a massive 6 million m3 of ground work (incl. 2 million m3 river sand)
These activities are designed to have the following effects:
• A 41 cm high water level reduction (near the city of Zwolle)
• A maximum discharge capacity via the Reevediep of 730 m3/s (approximately 25
% of the total discharge of river IJssel
• A 72 cm high water level reduction near the Reevediep inlet just upstream from
Kampen (30cm near Zwolle))
• Significant flood protected areas in the municipalities of Zwolle, Hattem, Elburg,
Kampen, Zwartwaterland

190

191
Figure 6. Bird’s eye perspective of the plan IJssel Delta for the Reevediep bypass area
(Source: Province of Overijssel)
The entire planning and implementation process is summarized below.
Period Activity
2001-2006 Initialization of the national programme Room for the River
2005-2007 Interactive, informal phase
National pilot “spatial planning”
Master plan + gentlemen's agreement between key stakeholders
2007-2015 Formal phase
Review of land-use plans, SEA + EIA
Purchase of land and real estate (voluntarily)
2nd gentlemen's agreement (2010)
Decision to combine bypass with enlarging of summerbed (2012)
Licenses, permits, blueprints / legal procedures
Detailed design and tender documents / contract with developer (Isala Delta - a
combination of two firms, Boskalis and van Hattum and Blankevoort which was
formed for the project implementation)
2014/2015-2030 Implementation
Phase 0: 2014: reed marsh development (8 ha.)
Phase 1: 2015-2019: dykes bypass, nature development, inlet, dam, sluice, bypass
partly operational, enlargement of summerbed
Phase 2: 2018-2022: construction of 2 big sluices,

192
Reconstruction of 3 km. dikes, bypass fully operational
2018-2030: housing development?
The period 2001-2007 was essential a test phase, in which ideas for the new paradigm of allowing more space in the landscape to manage surplus water rather than building bigger dykes, was developed and tested through pilot projects. The formal process commenced from 2007 and is still ongoing. By 2022 all of the major construction works for water management, including the complete Reevediep project area should have been completed.
4.2. The Reevediep project
Figure 7 shows a more detailed overview of the Reevediep project area (the full map and
details of projects can be downloaded here:
http://www.ruimtevoorderivierijsseldelta.nl/). It indicates the locations of the various
sub-projects which it entails, all of which are interconnected .
This interconnectivity is something which can exploited to the benefit of the overall
project management and cost control. However, it is not conflict free. The goal of the
Reevediep bypass is essentially to dramatically reduce flood risk in the city of Kampen.
Figure x.8 provides an indication of how the extent of water in the Reevediep will change
under a range of expected conditions. However, even after its completion, some
additional flood risk management measures requiring active engagement with citizens
will still be required in the city centre area during times of extreme water level. Some
details of this will be provided later.
Figure x.7 Overview of projects in progress (red) and completed projects (blue) as of
July 2018.

193
(Source: www.ruimtevoorderivierijsseldelta.nl)
Projects in progress:
1. Dyke construction including climate-proof dyke
2. Reeve dam and sluice gate
3. Landscaping of flow path at inlet
4. Navigation channel
5. Nieuwendijk bridge
6. OnderdijkseWaard - reconstruction of the IJssel floodplain near inlet
7. Navigation lock
8. Inlet Reevediep
9. Phase 2 projects Reevediep
Completed projects
10. Deepening summer bed
11. Strengthening city bridge
12. Salvaging of historic boat (IJssel cog) from river bed

194
13. Restoration of Zalkerbosch floodplain
14. Restoration of Scherenwelle floodplain
15. Development of 43 ha of reed marsh (partly funded by the EU LIFE programme.
Figure x.8 Sketches of inundation extents in the ReevediepIJssel bypass under
different water levels
(Source: Province of Overijssel)

195
Figure x.9 Aerial photographs of the Reevediep
(TL: navigation sluice; TR: Inlet Reevediep; BL: View of Onderdijksewaard toward sluice and
inlet; BR: view of reed marsh area and location of new housing near climate-proof dyke. (Source:
http://www.ruimtevoorderivierijsseldelta.nl)

196
Figure10. Photographs of the Reevediep
(TL: Inlet Reevediep; TR: Navigation channel; BL: Climate proof dyke construction; BR: Existing
farm along Zwartendijk (Source: Sliuzas, 2018)
4.3. Connections and conflicts in the Reevediep project
The Reevediep is a good example of a multi-purpose water management measure. It
provides the following functions: flood protection by diverting excess water in the IJssel
away from Kampen, it creates a direct channel for small recreational boat traffic
between the IJssel Lakes and the IJssel River, it creates additional natural wetland
conservation areas, it offers extra protection to lands from river and storm surge floods
from the so-called climate -proof dyke (Fig x.7, #1) which will create opportunities for
new housing development with a high spatial quality. Figures 9 and 10 show some aerial
and terrestrial photographs of some locations and construction activities in the project
area.
Although the primary goal is risk reduction in Kampen and Zwolle, its design as an
integrated package is such that sand extracted from the deepening of the river bed and
the navigation channel has been used in the construction of nearby dykes, thereby
reducing the need for long-distance transport of construction materials. The design
also generates new spatial qualities in the area and enables new recreational, economic
and environmental functions to be realised in certain locations. Such connections are

197
useful in terms of the project’s viability and they have helped to generate support from
many stakeholders but not all.
In such complex projects involving large scale infrastructural elements, there is always
a potential for conflict. Though the IJssel Delta project is generally framed as being
successful (Warner, 2011), opposition has regularly been expressed to certain aspects
of the project. For instance, in the preparatory stages of the project (2007-2015), much
land had to be acquired from several land owners, mostly farmers, within the area.
Long delays occurred around the issue of financial compensation due to acquisition.
Waner (2011, see Table x.1) shows how in the end three main frames have been used
by various parties with a stake in the IJssel Delta area and this project. In particular, the
so-called “conservation coalition” has played a substantial role in raising frequent
challenges and substantial resistance to many aspects of this project, using the full
scope of possibilities for legal objections at their disposal. In this sense, the decision not
to make this a special infrastructure project with a fast track procedure provides many
opportunities for parties with conflicting interests to delay such a project. However,
many of the current design features and qualities of the project can be directly attributed
to adjustments in plans as a result of resistance form the conservation coalition.

198
Table 1. Coalitions and narratives in the IJssel Delta
(Source: Warner, 2011)
For example, the extent of reed marsh has been increased due to opposition from the
conservation coalition. Currently, the stakeholders are awaiting court decisions on
whether the navigation channel will indeed be open for recreational boating or not, which
is seen by some to be in contradiction with the environmental goals of the project. Also,
the construction of the climate-proof dyke ostensibly makes it safe to construct housing
in an area with very high spatial quality (i.e. close to environmental zones and water
bodies, in the vicinity of the historic Zwaterndijk area). This is also an issue of
considerable conflict, which is pitting conservationists against developmentists and is
likely to require considerable time before it is resolved.
199
5. Examples of other initiatives at local level
Before completing this section it is useful to point out that not all innovations and actions
require such massive funding. Many actions can be undertaken by private citizens or
groups of citizens as well. Typical actions of interest here relate to investments in private
property related to water runoff such as green roofs, water retention tanks and
infiltration areas (Figure x.11). Municipalities and water boards are increasingly
requiring property owners and developers to look for ways to reduce surface water runoff
from their properties as a contribution to reducing drainage and river discharges.
Emergency water retention is now often included in the design of public parks and
squares to reduce the pressure on water drainage systems and prevent pluvial flood
damage.

200
Figure 11. Examples of measures for water protection in Zwolle.
L - A barrier to restrict ground water flows: R - green roofs and water retention tanks integrated
into the fence with small gardens and porous paving for runoff infiltration (Source: Sliuzas, 2018).
In Kampen, a community flood brigade consisting of 200 citizen volunteers was created
in 2003 to assist in protecting the historic city centre area from extreme flood events.
The volunteers are trained to operate and install a set of automatic and manual flood
barriers in the city centre area (see https://www.oecd.org/governance/observatory-
public-sector-innovation/innovations/page/kampenfloodbrigade.htm#tab_lessons).
The brigade practices the installation and dismantling of the flood barriers twice per
year and it forms an important component of the cities flood defences (Figure x.12).
Such citizen initiatives are an important component of Kampen’s flood defences. They
are part of a soft infrastructure that goes beyond awareness raising and education
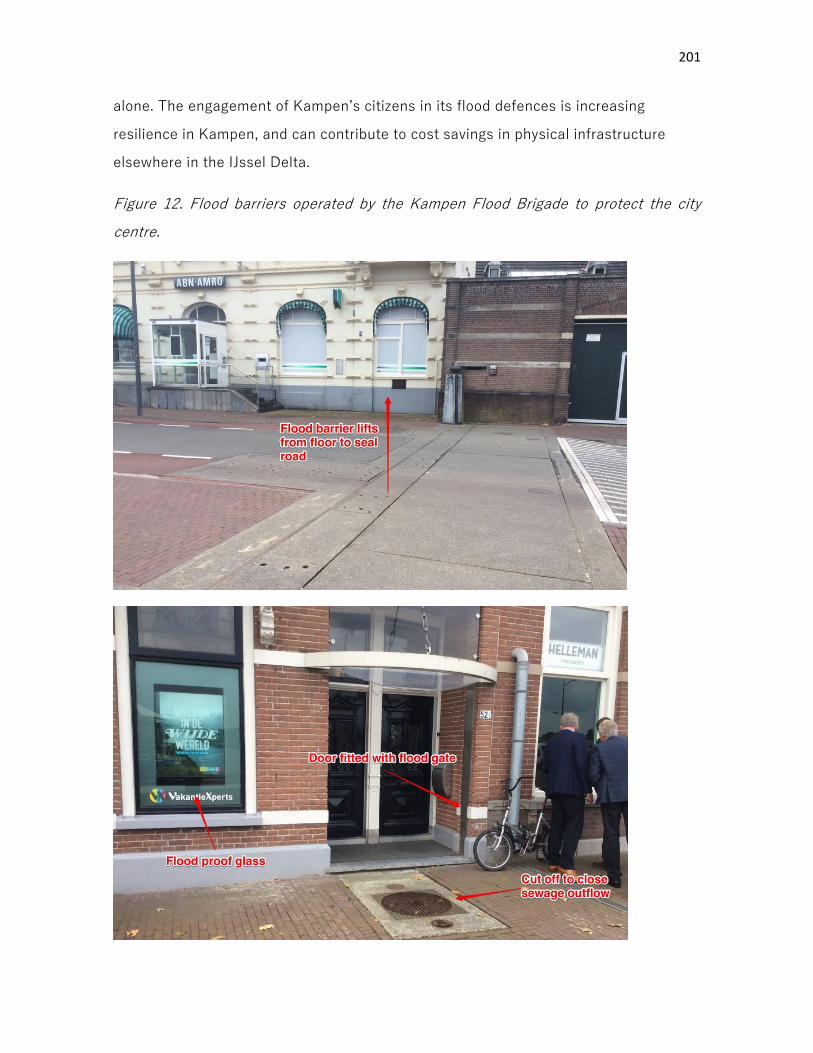
201
alone. The engagement of Kampen’s citizens in its flood defences is increasing
resilience in Kampen, and can contribute to cost savings in physical infrastructure
elsewhere in the IJssel Delta.
Figure 12. Flood barriers operated by the Kampen Flood Brigade to protect the city
centre.

202
(Source: John Curtin)

203
6. Conclusions The realisation of climate resilience adaptations in the Netherlands is a complex, multi-
level process. Many of climate adaptation issues are related to water management and
flooding, issues that have long been central to the identify and culture of Dutch society.
Water issues are almost always transboundary issues, so too in the Netherlands. Its
major rivers have their origins far away in neighbouring European countries and large
parts of the country can be considered to be deltas. As deltas are also areas which have
long been favoured for human habitation and city development, it is hardly surprising
that in confronting and preventing flooding from rivers and storm surges along the coast
has a high priority. The multi-layer approach to water management includes spatial
planning and development concerns alongside those of flood safety and disaster
prevention. The example of the IJssel Delta project illustrates how such a process
works. How vertical and horizontal coordination is required and how an integrated set of
actions can be designed and implemented to climate proof the city of Kampen. However,
it has also shown that such plans also entail conflicts of interest which need to be
addressed, ultimately leading to
Reference List
Dutch Water Authorities (2017) Water Governance The Dutch Water Authority Model,
Opmeer, The Hague www.uvw.nl.
Ministry of Infrastructure and Water Management (2009), National Water Plan 2009-
2015 , The Hague. (in Dutch).
Ministry of Infrastructure and Water Management (2011), Water Management in the
Netherlands , The Hague.
Sokolewicz, M., Louters, T., &Otten, A. (2011). Modern integrated river flood
management for climate change in the Netherlands: The IJssel delta project.
International Journal of River Basin Management, 9(2), 141–149.
https://doi.org/10.1080/15715124.2011.607824
Warner, J., & Van Buren, A. (2011). Implementing Room for the River : narratives of
success and failure in Kampen , the Netherlands. International Review of
Administrative Sciences, 77(4), 779–801. https://doi.org/10.1177/0020852311419387

204
Websites containing information on the projects discussed in this section:
Room for the River https://www.ruimtevoorderivier.nl/english/
IJssel Delta project http://www.ruimtevoorderivierijsseldelta.nl/en/
x.7 Overview of projects in progress (red) and completed projects (blue) as of July 2018.
Projects in progress:
1. Dyke construction including climate-proof dyke
2. Reeve dam and sluice gate
3. Landscaping of flow path at inlet
4. Navigation channel
5. Nieuwendijk bridge
6. OnderdijkseWaard - reconstruction of the IJssel floodplain near inlet
7. Navigation lock
8. Inlet Reevediep
9. Phase 2 projects Reevediep
Completed projects
10. Deepening summer bed
11. Strengthening city bridge
12. Salvaging of historic boat (IJssel cog) from river bed
13. Restoration of Zalkerbosch floodplain
14. Restoration of Scherenwelle floodplain
15. Development of 43 ha of reed marsh (partly funded by the EU LIFE programme.

205
Chapter 15. Wetlands at risk. Climate change and
environmental imbalance in the Metropolitan Area of
Concepción Juan Carlos Santa Cruz and Leonel Ramos
Universidad de Concepción
1. Introduction
The Metropolitan Area of Concepcion (MAC) is located in the geographical centre of Chile, along the coastline of the Biobio Region. It is a fragile territory of important morphological heterogeneity and rich biological diversity, characterized by the presence of a series of bodies of water of different nature (rivers, lagoons, wetlands), which constitute an interdependent system, where the urban sprawl is distributed amongst its lands. These wetlands appear as one of the most threatened natural ecosystems on the planet, despite their importance, as noted in the international bibliography. This is mainly because of human intervention, linked to the urban expansion that progressively reduces their dimensions, transforming them into simple channels or pools that receive garbage temporarily (Rojas et al, 2015, Boavida, 1999). Also, they are threatened by the effects of climate change that alter their size, structure, hydrology and biological communities (Moreno 2005, Finlayson 1999). In parallel, the aforementioned literature concurs that the wetlands represent ecosystems that are difficult to address, given their wide diversity and complexity. Wetlands are still undervalued by urban planning in Chile (Figueroa et al, 2009). In fact, in an institutional context in which there is no consistent territorial planning, wetlands are not yet defined within the available planning instruments which leaves them in a state of extreme vulnerability. Geographer Carolina Rojas14 points out that, “in Chile (...) there are only construction standards, and if the urban development plan establishes that a wetland is an area of urban expansion, there is no problem in filling it […] since they are considered as simple vacant lots and swamps, the legislation only protects those that are located outside the cities "15. At present, the main economic activities of the MAC are tertiary and commercial, linked to higher education16, logistics and transport derived from the exportation of raw materials, and 14 Geographer and PhD in Cartography, is one of the leading researchers on wetlands at the MAC. 15 Interview by Gabriel Espinosa of Periodismo UdeC - online press - (11/08/2017), “Grave daño Ambiental en humedales de Concepcion”, http://www.periodismoudec.cl/tiemporeal/2017/08/11/grave-dano-ambiental-humedales-concepcion/ 16 MAC hosts four universities of the Chilean Council of Rectors: one public (U. del Bio-Bío) and three
private traditional (U. de Concepción, U. Católica de la Santísima Concepción and Federico Santa María
Technical University); besides 8 non-traditional private universities (U. del Desarrollo, U. San Sebastián, U.
Nacional Andrés Bello, U. de las Américas, Technological University of Chile INACAP, U. Santo Tomás, U.
Bolivariana and U. La República; and several professional institutes and vocational training centres.

206
construction. In this scenario the vulnerability of the wetlands translates into concrete risks both for the survival of these ecosystems and their biodiversity, as well as for the well-being of the population living in their vicinity, These risks are due to the fact that these territories have historically been submitted to the pressures imposed by urban expansion, industrialization processes and industrial decline. The result of this has seen wetlands, bodies of water and river beds and estuaries, used as spaces for urban expansion and places to dump industrial waste, garbage and debris. All of the aforementioned has significantly impacted the territory, causing large environmental imbalances.
2. The Metropolitan Area of Concepción (MAC) territory
With a population of around one million inhabitants, the MAC is considered the third most populated metropolitan area in Chile, and, despite being one of the main industrial development poles of the country throughout history, it has experienced important processes of deindustrialization in recent decades. The territory where the MAC is located constitutes a kind of border area between two distinct traditional cultural zones, where the Bio-Bio river, nearly 2 km wide, acts as a natural, historical and symbolic boundary. To the north of the river lies the central Chile, peasant, born of miscegenation and the cultural matrix of the "Central Valley hacienda", imposed by Spanish colonization. Meanwhile, to the south of the Bio-Bio is the Wallmapu, the country of the Mapuche people. Specifically the Lafkenche territory – sea border Mapuche –, with its own approach to meaning, appropriation and relationship with the different elements of the territory. After centuries of independence, the Lafkenche territory was incorporated under the effective control of the Chilean State, in the mid-nineteenth century. Administratively, the MAC is composed by 11 municipalities that extend along the coastline, and go upstream through the Bio-Bio17. It is a complex zone, with an abundant diversity of territories, and very different origins, historical development, demographic dynamics, and social identities. With populations ranging from 230,000 inhabitants in Concepcion to 25,000 in Hualqui, several of these municipalities have had to face the demographic, economic, and social consequences derived from the processes of gradual de-industrialization, that the area has been experiencing since the mid-70s. As a product of the implementation of neoliberal policies during the dictatorship of Pinochet, which has been continued by successive governments. Some of these consequences are: a) a decrease in the rate of population growth in several municipalities, well below the national average - even in Lota, a slight demographic contraction is observed; b) unemployment rates and poverty levels above the national average; and c) an impoverishment of the local production model.
17 Tomé, Penco, Talcahuano, Hualpén, Concepción, Chiguayante, Hualqui, San Pedro de La Paz,
Santa Juana, Coronel and Lota.
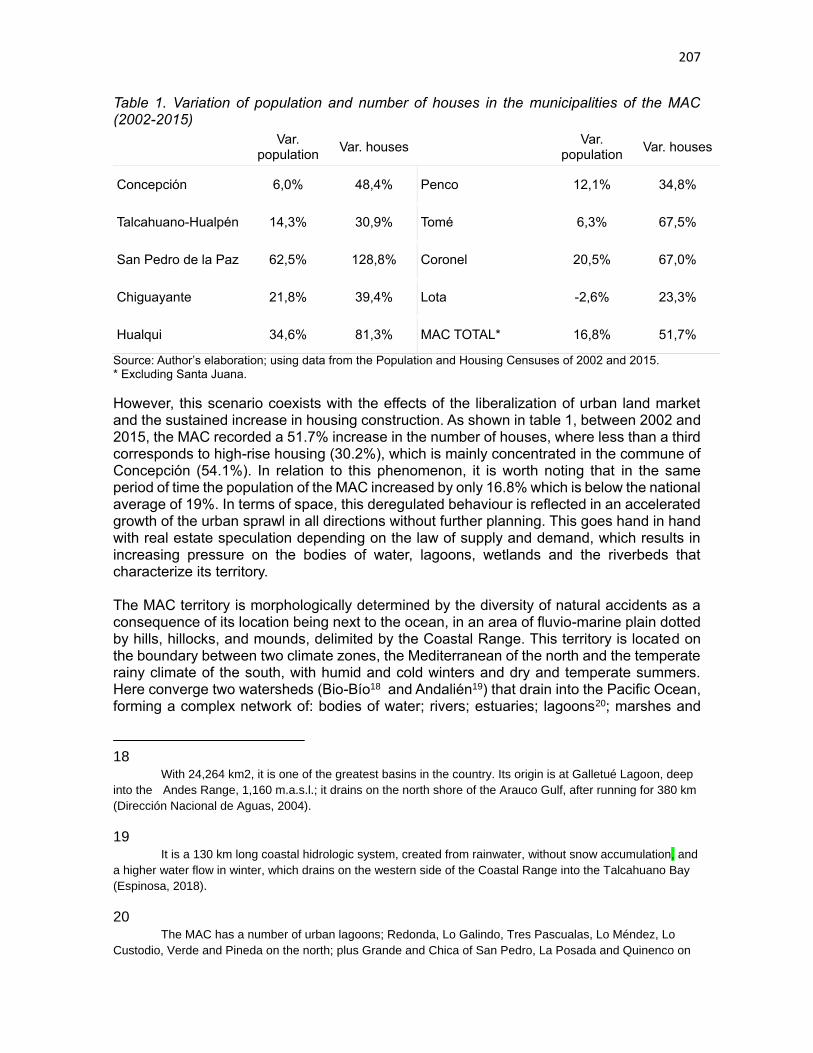
207
Table 1. Variation of population and number of houses in the municipalities of the MAC (2002-2015)
Var.
population Var. houses
Var. population
Var. houses
Concepcion 6,0% 48,4% Penco 12,1% 34,8%
Talcahuano-Hualpén 14,3% 30,9% Tomé 6,3% 67,5%
San Pedro de la Paz 62,5% 128,8% Coronel 20,5% 67,0%
Chiguayante 21,8% 39,4% Lota -2,6% 23,3%
Hualqui 34,6% 81,3% MAC TOTAL* 16,8% 51,7%
Source: Author’s elaboration; using data from the Population and Housing Censuses of 2002 and 2015. * Excluding Santa Juana.
However, this scenario coexists with the effects of the liberalization of urban land market and the sustained increase in housing construction. As shown in table 1, between 2002 and 2015, the MAC recorded a 51.7% increase in the number of houses, where less than a third corresponds to high-rise housing (30.2%), which is mainly concentrated in the commune of Concepcion (54.1%). In relation to this phenomenon, it is worth noting that in the same period of time the population of the MAC increased by only 16.8% which is below the national average of 19%. In terms of space, this deregulated behaviour is reflected in an accelerated growth of the urban sprawl in all directions without further planning. This goes hand in hand with real estate speculation depending on the law of supply and demand, which results in increasing pressure on the bodies of water, lagoons, wetlands and the riverbeds that characterize its territory. The MAC territory is morphologically determined by the diversity of natural accidents as a consequence of its location being next to the ocean, in an area of fluvio-marine plain dotted by hills, hillocks, and mounds, delimited by the Coastal Range. This territory is located on the boundary between two climate zones, the Mediterranean of the north and the temperate rainy climate of the south, with humid and cold winters and dry and temperate summers. Here converge two watersheds (Bio-Bio18 and Andalién19) that drain into the Pacific Ocean, forming a complex network of: bodies of water; rivers; estuaries; lagoons20; marshes and
18 With 24,264 km2, it is one of the greatest basins in the country. Its origin is at Galletué Lagoon, deep
into the Andes Range, 1,160 m.a.s.l.; it drains on the north shore of the Arauco Gulf, after running for 380 km
(Dirección Nacional de Aguas, 2004).
19 It is a 130 km long coastal hidrologic system, created from rainwater, without snow accumulation, and
a higher water flow in winter, which drains on the western side of the Coastal Range into the Talcahuano Bay
(Espinosa, 2018).
20 The MAC has a number of urban lagoons; Redonda, Lo Galindo, Tres Pascualas, Lo Méndez, Lo
Custodio, Verde and Pineda on the north; plus Grande and Chica of San Pedro, La Posada and Quinenco on

208
wetlands. Al of the above contribute to a fragile and historically mistreated system.
3. The metropolisation of Concepción At the beginning of the 20th century Concepcion was one of the first cities in Chile where urbanism principles were applied for its development; even before the first Urbanism Law of the country was enacted in 1929. In 1912 Law No. 2,658 was passed, which regulated the construction and urban limits of Concepcion (Fernandez, 2012), expanding the urban area to the limits of the Paicavi wetland on the northwest and incorporating the Tres Pascualas lagoon and the wet areas of Agua Negra in the plan. Progressively, the city expanded, taking space away from what was then called ‘pajonales’ (place where herbs and weeds abound). With the passing of years, the 1936 the Decree with Force of Law n ° 345 of the Ministry of Public Works dated 1931 came into force. The decree would establish the instrument of the regulatory plan, becoming mandatory for all cities with more than 20,000 inhabitants. That same year, the State created the Popular Housing Fund to address the housing deficit problem. At that time Concepcion already exceeded 80,000 inhabitants, and the territory that currently comprises the MAC reached 200,000. The urban sprawl of Concepcion, which for centuries was limited well beyond the limits of the foundational plot over the La Mocha valley and the coastal plains of Penco and Talcahuano, experienced an accelerated growth after the earthquake of 1939. On the one hand, the government of president Pedro Aguirre Cerda created the Reconstruction and Assistance Corporation to address the emergencies arising from the reconstruction, since 60% of the buildings of the city were destroyed or rendered uninhabitable. It is interesting to remember that most of the rubble was used to fill wet areas and riverside and lacustrine borders. On the other hand, the government created the Corporation for the Promotion of Production (CORFO) which aimed to promote and plan the modernization and industrialization of the country. One of its first projects was to put into operation the Compañia de Aceros del Pacifico (CAP) in 1945, with the mission of building a modern steel mill in the San Vicente Bay, partly on the surface of the Lenga wetland. The inauguration of the stell mill “Huachipato” in 1950 would be followed by several other industries in the area: Carburo y Metalurgia (1953), Chilean Wire Industry - Inchalam (1954), Cementos Bio-Bio (1957), Electroquimicas Unidas S.A. (1959), ENAP Refinery (1966) and Petroquimica (1970). This consolidated a central hub for the industrial development of steel, oil, chemical and metalworking, between the city of Concepcion and the port of Talcahuano, which notoriously attracted more inhabitants, and became fundamental for the conurbation of both districts (Santa Cruz, 2018). The territory between both cities, historically known as the Vegas of Talcahuano and Hualpén, was mainly formed by wetlands, grasslands and lagoons that surrounded a handful of low hills and hillocks. However, the process of conurbation that began to become evident in the 60s, would fill and bury land that could be flooded; progressively reducing the area of wetlands. At the end of the decade, in 1968, in the Rocuant-Andalién wetland, the Carriel Sur of Concepcion Airport was inaugurated, replacing the Hualpencillo aerodrome that was
the south. numerosas lagunas urbanas, ql norte del río Bío-Bío se encuentran las lagunas Redonda, Lo
Galindo, Tres Pascualas, Lo Méndez, Lo Custodio, Verde y Pineda; mientras que al sur las lagunas Grande y
Chica de San Pedro, La Posada y Quinenco.

209
located on a sandbank between the Lenga, Green Lagoon and Price Lagoon wetlands, and the Bio-Bio river. This area would be rapidly urbanized by numerous sets of working class and social housing, giving rise to the commune of Hualpén (Santa Cruz, 2018). Towards the middle of the century, Chile was dragging an endemic lack of housing, which would be exacerbated by the increase in rural migrants in search of new opportunities, attracted by the expansion of the industrial sector. In the decade of 1950, Chile began to introduce significant changes in the Law of Urbanism and Constructions, adding concepts like metropolis, intercommunal, and region, as an attempt to face the current processes of urban expansion, and with a special emphasis on the problem of the housing deficit. In 1953, the Popular Housing Fund and the Reconstruction and Assistance Corporation were merged, giving rise to the Housing Corporation (CORVI), which then in 1965 was taken over by the newly formed Ministry of Housing and Urban Development.
After the coup d'état of September 11, 1973, an extreme version of the theory of the subsidiary role of the State began to be applied in Chile, where the deregulated market was seen as the best optimizer in the allocation of resources. All of this would result in severe consequences both for the water system of the MAC and for the Chilean society as a whole. During General Pinochet's civic and military dictatorship in Chile, the Parliament was closed, a systematic policy of State terrorism was carried out against the opposition, political parties were illegal and there was no freedom of the press. In this context, the State of Chile was completely reformed according to the vision of a small group of economists, disciples of Milton Friedman, who were known as the "Chicago Boys" (Harvey, 2007). In 1976, Supreme Decree (DS) 458 of the Ministry of Housing and Urban Planning of 1975, would be passed to become a Law, known as the General Law of Urbanism and Constructions (LGUC) which, with its 28 modifications, remains in force today. Among other things, it established the liberalization of land and urban transport according to supply and demand, and stated that the "excessive" regulation of land for development was the cause for the shortage of land to develop real estate projects, reducing the functions of the public sector to those of mere recorders and generators of information for private investors.
In practice, urban and territorial planning was pushed to the background, being almost paralyzed, leading to the worsening of the uncontrolled urban expansion that was already happening in Chilean cities since the mid-twentieth century. As a consequence, in the last forty years, urban expansion has dramatically altered the coverage and uses of the territory of MAC, increasing vulnerability levels due to risks of mass removal and flooding (Espinosa, 2018).
4. Wetlands in the Metropolitan Area of Concepción Chile is characterized by its abundant biodiversity; almost 4,400 km long, it has a wide variety of climates and landscapes in which it is possible to find thousands of wetlands or wet areas of different types. However, it has only thirteen wetlands recognized as Ramsar Sites, most of which correspond to highland wetlands (bofedales) and salt flats located in the altiplano of the Atacama Desert. None of the 13 belong to the Bio-Bio Region, despite being some of the most threatened. As can be deduced from the name, the fundamental element that characterizes wetlands is the abundant presence of water, which determines their structure and the ecological function

210
they fulfil (Beltran, 2012). In the Penquista21 case, this presence is closely related to the characteristics of the hydrographic basins that converge in the Metropolitan Area and the rainfall regime of the area, with a marked rainy season between April and September and a brief dry season in summer. Although, in recent decades there has been a considerable decrease in rainfall and a lengthening of the dry season. According to the available bibliography (since these are not yet defined in Chilean regulation), the identification of wetlands tends to respond to a variety of criteria and methodologies, which combine the use of satellite images and observations in the field, through which both their perimeters and their areas of influence are defined (Rojas et al, 2015). For the Penquista case, these definitions have a certain complexity, as shown in Image 1, it is a highly interconnected water system, in which 2 watersheds converge and drain into the ocean. Figure 1: Main bodies of water, wetlands, rivers and lagoons of MAC
Source: Authors’ elaboration In this complex territory, wetlands stand out due to their great ecological importance, the biodiversity they harbour, and the environmental services they provide. The total number of wetlands distributed in different sectors of the MAC is estimated at 61, covering an area of 106 km2. Some of the areas with the greatest occurence of wetlands are: Rocuant-Andalién in Talcahuano; the Green Lagoon sector and the Lenga wetland in Hualpén; the Cuatro Esquinas sector, between Hualpén and Talcahuano; the San Andrés sector - Parque Central, between Talcahuano and Concepcion; the Paicavi wetland, in Concepcion (Rojas et al, 2015); the Los Batros wetland in San Pedro de la Paz; and the Boca Maule wetland, in Coronel. This same complexity is evident in the existing variety of wetlands. In this sense, it is possible
21 Demonym given to the inhabitants of Concepción and others events related to the city, because of the
its original foundation in Penco area in 1550. The city was moved to its present location in the valley between
Bío-Bío and Andalién rivers after a devastating earthquake and tsunami in 1751.

211
to subdivide the wetlands found in the Penquista territory into two large types according to their water regime: a) swampy freshwater wetlands, such as the wetlands of Laguna Verde, Paicavi, San Andrés (Parque Central), Cuatro Esquinas, Los Batros, Calabozo, and Lagunillas; and b) marsh-type wetlands, which are affected by tidal changes, such as the Rocuant-Andalién, Lenga, and Boca Maule wetlands. An interesting element is that several of these wetlands are interconnected. For example, the Rocuant-Andalién wetland - the most important and greatest in extension, which also harbours the largest number of birds - is connected to the Paicavi and San Andrés wetlands. It is also possible to find differences in their biodiversity and, above all, in their state of conservation. For these purposes, indicators of biodiversity and wildlife of wetlands are used both to establish their delimitations and their state of health. In this sense, among other factors, the richness of species of plants, birds, crustaceans, insects, or lepidoptera that they harbour are analysed; the latter "constitute one of the groups most commonly used as an indicator of the conservation status of wetland biodiversity" (Rojas et al, 2015). In relation to plant diversity, the bibliography emphasizes the need to study the composition and structure of the vegetation communities of each wetland in order to determine their conservation status and the course of action to be followed in their restoration or conservation processes (Gallo and Rodriguez, 2010). In this sense, a first superficial observation of the state of the wetlands in the MAC reveals a worrisome result: most of them are not protected and several are highly anthropized and have seen their dimensions dramatically reduced in the last decades. Furthermore, some are being constructed on or they have become illegal garbage and rubble dumps. Among the most endangered are the Paicavi, San Andrés, and Los Batros wetlands. However, in order to analyse the wetlands within the Penquista territorial system, it is essential to take into account their role, in relation to the different environmental services they provide – the most remarkable being their role as reservoirs of biological diversity, their role in water purification, and their ability to control floods and mitigate the effects of tsunamis. 4.1. Biological diversity The wetlands, especially the Rocuant-Andalién, that currently covers an area of ha 1,500, are fundamental ecosystems for the migration of avifauna in the area of Concepcion (EULA Centre, 2011). Among the species with the highest number of individuals in this wetland are: the Dominican gull, the tern, the coscoroba swan, the Franklin gull, the curlew, the American skimmer, the Magellanic oystercatcher, and the marsh crow, among many other species of birds. The estimation is that in the wetland it is possible to find 25% of the waterfowl species existing in Chilean territory. In this sense, despite not having any kind of guardianship or preservation plan, this wetland would comply with at least 2 criteria to be considered of global importance. It has a population of more than 20,000 waterfowl (a figure that far exceeds), and it regularly harbours at least 1% of the individuals of a waterbird species (Beltran, 2012). Many of these species are also found in the rest of the MAC wetlands. These ecosystems are also home to numerous species of freshwater fish, some of them endemic and endangered, such as the catfish (nematogenys inermis), the “bagrecito” (bullockia maldonadoi) – a small fish that does not exceed 7 cm –, the “pocha de los Lagos” (cheoirodon palusdae) or “Carmelita de Concepcion” (percilia irwini), the latter exclusive of the Andalién and Bio-Bio river basins, among many others; in marsh-type wetlands, they

212
also harbor several species of freshwater fish, such as: Patagonian bass (eleginops maclovinus), silverside (basilichthys australis) or sole (paralichthys adspersus), (Pauchard et al, 2006). There are also numerous species of mammals, amphibians, reptiles, and crustaceans. Among the latter, one of the most abundant - at least until before the 2010 tsunami - was the Estuarine crab (hemigrapsus crenulatus), and one of the most threatened, the tiger crab (Aegla concepcionensis), whose habitat is currently reduced to a few estuaries and streams in the Andalién basin. These are two endemic species of this area that were considered extinct until 2004. At the same time, these wetlands harbour a wide variety of insects, which tends to vary depending on the characteristics of each wetland, and the degree of conservation it presents. In this sense, it is interesting to consider that those wetlands in a better state of conservation tend to evidence a greater wealth of macrolepidoptera, mainly due to the scarce presence of introduced flora (Rojas et al, 2015), which is a good indicator of the degree of conservation of the wetland. In the same way, wetlands are characterized by the diversity of plant species that they harbor, although some of them evidence greater vegetational heterogeneity than others, where hygrophilous species are the most characteristic, for example: Chilean junquillo (juncus procerus), canutillo (equisetum giganteum), or totora (typha domingensis); and, as we get closer to the sea, the halophyte species, such as: sosa weed (sarcocornia fruticosa), llinto (spartina densiflora), and golden button (cotula coronopifolia), among others. 4.2. Control floods and tsunamis Perhaps, one of the most obvious environmental services provided by wetlands, are those related to flood control, whether these events are caused by intense rain events, flooding of rivers, or tsunamis. These services could disappear or be reduced by the construction of urbanization projects, for residential, productive and general service purposes. In this regard, it is important to remember that in the last 50 years flood events have been recurrent in the MAC. In fact, between 1960 and 2010 there were 21 river floods – 5 of which were of great magnitude (Rojas et al, 2015). In 2006, the MAC suffered the effects of a historic flood caused by 36 hours of heavy rain, leaving thousands of people affected and entire neighbourhoods under water due to the replacement of natural coverings by urban landscapes - especially in the basin of the Andalién river - among other reasons (Espinosa, 2018). Table 2: Mega earthquakes and tsunamis, in the Metropolitan Area of Concepción
Earthquake 1730 1751 1835 1939 1960 2010
Epicentre Valparaiso Concepcion Concepcion Chillan Valdivia** Cobquecura
Richter magnitude*
8.7 8.5 8.5 8.3 9.5 8.8
Casualties 3.000 70 120 5.690 2.000 545
Tsunami Yes Yes Yes No Yes Yes
* The magnitudes of the pre-1960 earthquakes are estimated. // ** Strictly corresponds to two consecutive earthquakes, one on May 21 of magnitude 8.0 with an epicentre in Concepcion and another in Valdivia the next

213
day of 9.5 lasting 8 minutes, the strongest worldwide earthquake ever recorded. Source: Authors’ elaboration; with data from the National Seismological Centre (Universidad de Chile) and the National Oceanographic Committee.
However, along with the floods of rivers and the events of intense rains, the territory in which the MAC is located has witnessed numerous tsunamis in its history. In fact, these wetlands, particularly the Rocuant-Andalién area, have historically provided protection against these events, as evidenced by the tsunami deposits of 1835 and 2010 (Beltrán, 2012; Valdivia and Lagos, 2014). It is important to consider that far from representing exceptional events, mega earthquakes and tsunamis are phenomena which have historically coexisted with the Penquista territory, with five of them occurring in the last 300 years; this means an average of one every 60 years, of which those of 1835 and 2010 are particularly significant, since great masses of water advanced deep inland, where the Rocuant-Andalién wetland absorbed much of the effect of the wave train.
Figure 2: Concepción and San Vicente bays, Tsunami flood chart, 1835 4 Source: SHOA, Hydrographic and Oceanographic Service of the Chilean Navy, 2011.

214
5. Impact on urbanisation The aforementioned accounts for a series of demographic, social and productive processes, which take a place in a fragile and very complex territory. The urban growth of the Great Concepcion has historically taken place with disregard to the effects that urbanization could generate for environmental balances. In fact, the conurbation process that would give rise to the "Concepcion-Talcahuano inter-commune" and later to the Metropolitan Area of Concepcion (MAC), far from stopping, has instead accelerated, generating a series of territorial imbalances, which in extreme circumstances have had severe impacts on the territorial system. This scenario was worsened after the liberalization of the land according to the law of supply and demand, during the dictatorship of Augusto Pinochet. This allowed the expansion of the city beyond any planning, consuming more and more agricultural and rural land, filling wetlands and lake edges, urbanizing hills, and canalising rivers and estuaries. According to the available bibliography, when studying the difficult relationship between urban expansion and the ecological balances of water systems - which are part of and nourish the wetlands that coexist in the same territory - there are a series of dimensions and indicators that can shed some light not only on the state of conservation of each one of them (as explained above) but also, on the threats that hover over these areas. Some of these threats include: the proximity of these environments to productive, industrial, and seaport activities, as well as the pollutants that they emit, the form of disposal, and the places to which they expel industrial toxic waste which, in this area, were spilled directly into channels, rivers, wetlands, and the sea. In the same vein, it is important to consider the distance from roads and highways, through which thousands of cars, buses, trucks and vehicles of all kinds pass by, emitting different types of polluting gases and acoustic pollution; these also benefit the arisal of irregular garbage and debris dumps. In the case studied, for example, the wet network of the MAC is abruptly crossed by a network of highways, roads, railways and other infrastructure. Another dimension to be taken into consideration is the behaviour of the amount of urbanized surface and surface area considered appropriate for development over time, and to what extent they begin to put pressure on the living space of wetlands and bodies of water. Along with the dispersion of the urban sprawl, it is essential to consider other indicators, such as population density and housing density, as well as land uses allowed by the Development Plan, especially in areas like the MAC, in which the wetlands are not considered in the planning of the city and are seen only as available or vacant sites, since they are not recognized as such by the current planning instruments. For example, as a result of this, an important part of the urban expansion areas identified in the Concepcion Communal Development Plan are located within the wetlands, and it is projected to fill them almost completely. This scenario is particularly worrisome, because in the last 3 decades, almost one quarter of the surface of wetlands of the MAC has disappeared as a result of urban expansion – of which environmental impact is still difficult to estimate. In fact, it is widely documented in specialized literature that the urban expansion of the Gran Concepcion has advanced to the detriment of lagoons, wetlands, and native vegetation (Rojas et al, 2019; Vidal & Romero, 2010); in doing so, significant amounts of high environmental quality areas of the wetlands of Lenga, Rocuant-Andalién, and Los Batros in San Pedro de La Paz, have been replaced by residential areas, scattered vegetation, and

215
areas without vegetation (Smith & Romero, 2009). Moreover, in both cases, wetlands are threatened by large infrastructure projects, which, like the Paicavi wetland landfill, only consider some small "green corridors", designated as ecological protection areas. In the case of the Rocuant-Andalién wetland, the construction of the Logistics Platform of the Bio Bio Region is planned entirely on the area of the wetland, to serve mainly the ports of Talcahuano and San Vicente in storing containers, materials, warehouses of different types, and industrial facilities. It will be located on an area of 795 ha between the coastal border and the airport, and it is projected to cover a total area of 1,869,085 m2; this would, in fact, destroy the core of the main wetland in the whole area, reserving just a corridor of 84 ha between the two small areas that will remain, which euphemistically receives the name of "ecological protection zone". The environmental damage caused by this would be irreparable and would have consequences that we are not yet able to foresee.
Figure 3: Logistics platform of the Bio-Bio Region
A
B
C
D
E
F
G
H
I
J
K
L
M
Logistics Services Center
Logistics Activities Zone, Storage
Logistics Support and Distribution Center
Interport Services Center
Storage and Transfer Center
Industrial Productive Park
Technological Park
Storage and Port Support Center
Business center
Shopping center
Tourist Park - Recreationa
Ecological Protection Zone
Airport “Carriel Sur”
Source: Baeriswyl, 2005: Logistics Platform of the Bio-Bio Region, Master Plan.
On the other hand, the Los Batros wetland from the 1990s onwards, was rapidly refilled in its upper part, at the mouth of the San Pedro lagoon, for the construction of residential buildings (Laguna Grande Residential Park), educational infrastructure, and supermarkets. It is currently facing the threat of construction of a highway and an industrial bridge on the wetland terrain. The creation of the Los Batros Wetland Park was adopted as a palliative measure, following the urban landscape of the late twentieth century, for aesthetic and recreational purposes, rather than from the logic of river and water systems restoration. These patterns of urbanization and use of land inevitably result in serious environmental imbalances, demonstrating that, to a large extent, environmental degradation in Chile is linked to the absence of a regulatory framework, which would be capable of planning, regulating and managing the evolution of cities and urban growth, assuring the minimum conditions that would allow the survival of water systems and other elements of the landscape. In this sense, the MAC - far from being alien to this reality - is a paradigmatic example of it; this is how the urban population exposed to the flood risk has been increasing

216
rapidly. For the last 2 decades, along with the works of canalisation of estuaries and protection of fluvial and lacustrine banks, the real estate projects constructed on landfills, in wetlands and on the terraces against flooding of the Andalién river have multiplied, as for example, in the Brisas del Sol (165 ha), Valle Noble (50 ha) or Valle Escondido sectors. One of the biggest problems in this regard is that - although the effects generated by the destruction of wetlands throughout the 20th century are evident - their preservation, restoration, and recovery are not a priority for the organisms entrusted by the Law of urban planning. In fact, in the municipality of Concepcion, a good part of the urban expansion areas defined in the Communal Regulatory Plan are located in the wetlands, in the bed of the Andalién River, or in areas at risk of mass removal or flooding. This increases the risk of suffering large floods in the face of possible anomalous rainfall events, such as the one that occurred in 2006. The scenario is not very different from that observed in the communes of Talcahuano, Coronel or San Pedro de La Paz, where a decrease in the potential storage capacity of rain water in the Penquista water system, increases the possibility of flood and water logging events of greater intensity in the near future. This dramatic reduction and neglecting of wetlands occurs in a global context of great uncertainty regarding the effects that climate change can generate in our territory. That is to say, a key element for the environmental equilibrium of the Penquista territorial system is being eliminated, just when important climate changes are foreseen in the near future.
6. Towards effective protection of urban wetlands In summary, the scenario described so far reveals, on the one hand, the characteristics of the MAC wetlands, the main ecological functions that they fulfil, and their urban, cultural and scientific relevance. On the other hand, it shows us a worrying reality, of which territorial management and planning have not been effectively executed. Even if, nominally, Chile signed the Convention on Wetlands in 1981, enacting it as Law through Supreme Decree No. 771 of the Ministry of Foreign Affairs, very little has been done about it in urban areas. The Ramsar Convention obliged its signatories to implement measures aimed at "the conservation and wise use of wetlands through local and national actions and through international cooperation, as a contribution to the achievement of sustainable development throughout the entire world" (RAMSAR, 2017). Until 2005, the responsibility for this fell on the National Forestry Corporation (CONAF), an autonomous institution of the Chilean State, which did not have the skills, nor the necessary human, technical, or material resources to effectively deal with this responsibility imposed by the conservation of wetlands. This is because the very logic of the Chilean regulatory framework sways towards deregulation, encouraging private investors to undertake projects and carry out actions which end up progressively destroying the wetlands located in the vicinity of urban and productive areas. An aspect that complicates the situation most in the Chilean context is that the situation described above coexists with a slow but progressive development and updating of environmental legislation in the country. This, on the one hand, has increased issues and tension points for real estate, productive and infrastructure projects that are deemed as necessary and inevitable, in order to achieve the long-awaited development, generate jobs and modernise the country. On the other hand, a greater environmental awareness - striving to advance on the improvement of environmental legislation - is rivalled by the fear of investors who rush to sell or buy land, fill wetlands and obtain building permits for their
217
projects. Moreover, there are conflicts which may arise within the State itself, between those who want to preserve and those who do not care, as far as economic growth is at the centre, and all the intermediate nuances that may exist. Despite the fact that Article 19 of the 1980 Constitution acknowledges "the right of every citizen to enjoy a pollution-free environment", according to the subsidiary role of the State that the same constitution establishes, the State cannot intervene in those sectors which are "regulated" by the market because it would be violating the principle of free competition. For this reason, one of the main threats facing wetlands is the liberalization of urban land which transforms urban land into a commodity, tradable in the market. In Chile, it was not until 1994 that Law 19.300 on the Bases of the Environment was promulgated, which came to regulate the right to live in a pollution-free environment that the Constitution guaranteed, advancing towards "the protection of the environment, the preservation of nature and conservation of environmental heritage" (BCN, 1994). With this, management instruments, emission standards and the first environmental remediation plans were set, and the National Environment Commission (CONAMA) was created as a proactive organism responsible for consultation and inspection on environmental issues before the Presidency of the Republic. Over time, awareness of the urgency of a consistent and comprehensive environmental policy was gaining ground in broad sectors of society, which clearly saw the inadequacy and insufficiency of current national regulations. This motivated the first government of Michelle Bachelet to update environmental regulations, transforming Conama into the Ministry of the Environment (MMA) in 2010 (Santa Cruz, 2018). In that same vein, previously, in 2005 the National Committee of Wetlands had been created, which is currently led by the Ministry of the Environment. This inconsistency between decisions, commitments, announcements aimed at one direction, and a regulatory framework whose logic points in the opposite direction, could explain why the implementation of the initiatives that respond to these decisions and commitments does not seem effective to ensure the preservation of fragile environments on an urban scale. For example, "in 2017 the Chilean State ratified the agreement of the XXI Conference of the Parties (COP21) of the United Nations Framework Convention on Climate Change that was held in Paris in 2015" (Santa Cruz, 2018b), accepting the obligation to reduce its intensity of emissions per unit of GDP by 30% by 2030 - and up to 45% in the case of receiving international support - including the afforestation of 100,000 ha, mainly of native forest. Nevertheless, at the same time the State does not take responsibility for the environmental sacrifice zones in Mejillones, Tocopilla, Quintero-Puchuncavi, Til-Til and Coronel - in which some 230,000 people live. Not only are there a lack of tangible environmental alleviation plans and in-depth research papers on the concrete effects that industrial poles found in the territory have had on the health of the population; but the decisionmakers have continued to pass productive and industrial projects in these places. The above can be explained from two different perspectives. On the one hand, "territorial planning" in Chile, is not properly planned and is only limited to define the zoning and to specify the requirements and procedures necessary to obtain the construction and operation permits. Plus, its activity is reactive in general; that is to say, unlike in the academy, this planning does not foresee scenarios, but operates on the go, according to the circumstances. On the other hand, the update of the environmental legislation in force, only rules on future projects, not on those that are already being executed; this means compensation or sanctions are not foreseen for the pollution of past decades, but at most the current emissions that exceed the norm are fined; in other words, there can be an oil

218
refinery, a thermoelectric plant, or a steel mill polluting the adjacent wetlands or poisoning the population, and there is very little that the health inspection authority can do about it if those industries have valid permits and their emissions are within defined standards - which are quite flexible, by the way. Notwithstanding the above, recently in 2018 the Chilean Senate took the first step towards new legislation that recognizes these spaces and protects them as urban wetlands, in an effort to resolve the legal vacuum that exists in their regulation - specifically in relation to urban wetlands, which are also those that are currently under greater threat. In fact, for the first time an official definition is included, according to which: urban wetlands would be those extensions of marshes, swamps, and peat bogs, or areas covered with water - whether natural or artificial, permanent or temporary, stagnant or current, sweet, brackish or salty, including extensions of sea water, whose depth at a low tide do not exceed 6 meters, and which are within the urban radius. The proposal also obliges the Municipalities to establish the minimum criteria for the rational use of existing urban wetlands within the limits of each commune, through ordinances; this is one of the most urgent aspects, since the main threat is the uncontrolled urban expansion that the country has experienced in the last 40 years. At the same time, it incorporates the obligation for all projects or activities likely to cause some environmental impact to undergo the environmental impact assessment system - in any of its phases - including the execution of works, programs, or activities that may bring physical alteration to wetlands that are within the area of an urban radius and which imply their eventual destruction, filling, drainage, or drying. As a summary, more than 100 years after the first urban planning instrument for Concepcion was issued, after having destroyed, dried, and filled an important part of the area of wetlands of the Metropolitan Area to build industries, residential districts, highways, airports, supermarkets, malls, schools, and universities - among other activities - a step is finally taken in the right direction for the preservation of these environments. This is a first step which must be followed by many others in order for the State to assume its responsibility in ensuring the sustainability of the Penquista territorial system over time, and so, being able to improve the intrinsic capacities of the territory and to contribute to its resilience, as the fore coming scenario is uncertain.
Reference List
Baeriswyl, S. (2005). Plan Maestro. Plataforma Logistica Region del Bio Bio. CORFO, Gobierno de Chile.
Beltran, M. (2012). Transformaciones espaciales y valoracion social del humedal Rocuant-Andalién (Concepcion, Chile): Periodo de 1950 a 2011. Thesis to apply for the Bachelor’s Degree in Geography, Universidad de Chile.
Boavida, M. J. (1999). “Wetlands: Most relevant structural and functional aspects”, in Limnetica n°17, pp.57-63.
Direccion General de Aguas (2004). Diagnostico y clasificacion de los cursos y cuerpos de agua segun objetivos de calidad. Cuenca del rio Bio-Bio. Santiago: Ministerio de Obras Publicas.

219
Espinosa, P. (2018). Concepcion Habitando el (al) limite. El rio Andalién, restauracion fluvial & diseño urbano. Resumen de Datos y Contexto. Project funded by the National Fund for Culture and Art Development.
Fernandez, José (2012). “Sintesis de la evolucion historica experimentada por la Legislacion Urbanistica Chilena”, in Revista de Derecho, n°28, pp. 51-75
Figueroa, R. et al (2009). “Caracterizacion ecologica de humedales de la zona semiarida en Chile Central”, in Gayana (Concepcion) vol. 73, n°1, pp: 76-94.
Finlayson, C. M. (1999). “Coastal wetlands and climate change: the role of governance and science”, in Aquatic Conservation: Marine and Freshwater Ecosystems, n°9, pp. 621-626
Gallo, M. & Rodriguez, E. (2010). Caracterizacion de paisajes y ecosistemas: proyecto demostrativo cuenca baja del rio Paz El Salvador – Guatemala. The Netherlands: Wetlands international.
Harvey, D. (2007). Breve historia del Neoliberalismo. Madrid: Ed. AKAL.
Moreno J. M. (2005). Evaluacion preliminar de los impactos en España por efecto del cambio climatico. Madrid: Ministry of the Environment, Spain.
Centro EULA (2011). Diagnostico y propuesta para la conservacion y uso Sustentable de los humedales lacustres y urbanos. Principales de la region del Biobio. Propuesta Metodologica para el Manejo y Gestion para Humedales de la Region del Biobio. Concepcion: Center for Environmental Sciences, University of Concepcion.
Munizaga, J. (2015). Cambios en la superficie del humedal Andalién-Rocuant 2004- 2014. Faculty of Architecture, Urbanism and Geography, FAUG, University of Concepcion, Chile.
Pauchard, A. (2006). “Multiple effects of urbanization on the biodiversityof developing countries: The case of afast-growing metropolitan area (Concepcio n, Chile)”, in Biological Conservation, n° 127, pp. 272–281.
RAMSAR (2017). Convencion relativa a los humedales de importancia internacional especialmente como habitat de aves acuaticas. UNESCO: Authorised copy.
Rojas, C., et al (2019). “Urban development versus wetland loss in a coastal Latin American city: Lessons for sustainable land use planning”, in Land Use Policy, n° 80, pp. 47–56.
Rojas, C., et al (2015). “Patrones de urbanizacion en la biodiversidad de humedales urbanos en Concepcion metropolitano”, in Revista de Geografia Norte Grande, n°61, pp. 181-204.
Santa Cruz, J.C. (2018). Patrimonio industrial de la Provincia de Concepcion: una herencia cultural en riesgo. Concepcion: Ed. Stoq, available in press.
Santa Cruz, J.C. (2018b). Desafios impuestos por la contaminacion ambiental en Los Ángeles. ¿Qué podemos hacer?. INACAP Universidad Tecnologica de Chile, Los Ángeles.
Smith, P. (2007). Efectos del crecimiento urbano del Área Metropolitana de Concepcion sobre los humedales de Rocuant-Andalién, Los Batros y Lenga. Faculty of Architecture, Urbanism and Geography, FAUG, University of Concepcion, Chile.
Smith, P. & Romero, H. (2009). “Efectos del crecimiento urbano del Área Metropolitana de Concepcion sobre los humedales de Rocuant-Andalién, Los Batros y Lenga”, in Revista de Geografia Norte Grande, n°43, pp. 81-93.
Valdivia, D. & Lagos, M (2014). “Reconocimiento y caracterizacion de depositos del tsunami de 2010 en la bahia de Concepcion, Chile”, in Congreso de la Sociedad Chilena de Ciencias Geograficas, Coyhaique, November, 2014.
Vidal, C. & Romero, H. (2010). “Efectos ambientales de la urbanizacion de las cuencas de los rios Bio-Bio y Andalién sobre los riesgos de inundacion y anegamiento de la ciudad de Concepcion”, in Pérez, L. & Hidalgo, R. – eds. – Concepcion Metropolitano (MAC). Planes, procesos y proyectos. Santiago: Institute of Geography, PUC.

220
221
Chapter 16. "Water and population" and "food
sovereignty is also resilient farming". Two
resilience cases frim Ecuador. Betty Beatriz González Ozorio1, Luis Simba Ochoa1, Eduardo Díaz Ocampo1 , Isabella
Giunta2
1Faculty of Environmental Sciences. Quevedo State Technical University. Campus Eng. Manuel Haz Álvarez, Km 1 ½ via Santo Domingo de Los Tsáchilas. Quevedo, Los Ríos, Ecuador
2 CRIC – Centro Regionale d’Intervento per la Cooperazione ONLUS. IAEN - Instituto de Altos Estudios Nacionales
1. Water and population
Another important resource to consider is water. Its use allows to generate transformation. Water is the counterfoil of culture and the basic support for human life; water is the key liquid for the material and cultural well-being of societies all over the world, its existence is a sign of abundance and prosperity, and its absence has originated poverty, destruction and death. This resource is under threatening due to increasing pollution. The paradox is that, even when two third parts of our planet are made up of water, nowadays we face a serious shortage of this resource.
According to the Word State report, 2002 from all the water existing in the planet only the 2.5% is not salty, and from this only a 0.3% is available in rivers and lakes. Evidently water resources in the planet are limited what together with the high levels of consumption and usage in production activities constitutes one of the indicators of the current ecological crisis: water resource depletion. Of all the crises human beings have to face, be them social or relative to natural resources, the crisis of water is the one defining our survival and that of our planet
All over the world, water consumption by humans is divided, as a tendency, as follows: 70 % for agricultural irrigation, 22 % for the remaining industry, and 8 % for domestic use. With the growth of population, industrialization, and with the use of water at a worldwide scale grows also the demand on the part of the industry and the individuals, and given the current level of consumption, the problems of water shortage will be become problems of food supply.
Traditionally water has been considered a limited resource, but the diverse problems of the water crisis found in different parts of the world have made us aware of the depletion of this resource, due to its exploitation to much bigger index than that of its natural renovation. In the specific case of the underground water, the volume that is extracted implies a pressure for the aquifers. Water is a natural unique resource, it is indispensable not only for the man, but it is also an essential resource for diverse forms of animal and plant life in our planet. Water constitutes an essential part of any ecosystem, in qualitative and quantitative terms.
1.1. The parameters in water quality
To determine the quality of consumption water in the urban and rural areas of Quevedo canton, methodologies adjusting to our way of doing similar researches have been

222
compiled, based on the accuracy of sample selection and on the analysis made in laboratories approved according to quality norms. Three categories of physical analyses were made. The first consisted in analyzing the temperature, dissolved solids and suspended total; second, chemical analyses consisted in determining the pH, chlorides, nitrates and total phosphates, finally, microbiological analyses considered the total and fecal coliforms. Water simple analysis was carried out at Chemical Laboratory “Marcos”, following as reference methodology the Standard Methods 2012, 22nd edition. Temperature parameters (source INHAMI-INIAP) were measured in situ; pH for analysis was obtained using calorimetry
Depending on the values obtained in the analysis of water, each evaluated parameter is contrasted with the permissible ranges established in the National Regulation of Ecuador, published by Ministry of the Environment, 2015). The Ministerial Agreement No. 061, dated on May 04, 2015, reforms the Book VI of the Secondary Environmental Legislation Unified Test (TULAS). Annexes are issued through the Ministerial Agreement No. 097-A, dated on November 04, 2015. The regulations of the 1994 Mexican Norm for human consumption water by the Secretariat of Health 1994 and the WHO Guide 2008 have also been considered. They are detailed in Table 1.
Table 1. National and international environmental norms
Classificatio
n Para
met
ers
Mea
sure
men
t u
nit
Annex 1, Book VI Environmental
Quality – Agreement 097 TULAS
Mex
ico
19
94
.
Wa
ter
for h
um
an
con
sum
pti
on
OM
S, 2
00
8
H
um
an
an
d
do
mes
tic
con
sum
pti
on
Hu
ma
n
Wil
d a
qu
ati
c
life
in
sw
eet
wa
ters
Ag
ricu
ltu
re
irri
ga
tion
Use
in
an
ima
l
hu
sba
nd
ry
Rec
reati
on
al
pu
rpo
ses
PHYSICAL
Temperature °C --- --- --- --- --- --- ---
Total
suspended
solids
mg/L --- --- --- --- --- --- ---
CHEMICAL
pH pH
units
6-9 6,5-9 6-9 --- 6,5-
8,3
6,5-8,5 ---
Chloride mg/L --- --- --- --- --- 250 200-300
Nitrates mg/L 50 13 --- 50 --- 10 50
Phosphates mg/L --- --- --- --- --- ---
MICROBIO
LOGICAL
Fecal
coliforms
NMP/
100ml
1000 --- 1000 1000 200 Absence Absence
Total
coliforms
NMP/
100ml
--- --- --- --- 2000 Absence Absence
Source: The authors
The determination of water quality is based on the analysis of the physical, chemical, and
microbiological parameters, according to Brown’s methodology, developed by the
National Health Foundation of the USA (NSF) and the North American index, Dinius
(1987) quoted in Baque (2016), by means of the geometrically weighted average equation
(Equation 1) and the weighted weight (Table 2).
ICA (NSF, Dinius) = (∏ Qi
n
i=1
)
Wi
Equation (1)
Where:

223
n : Number of parameters
Qi: Scale of quality, it is the parameter i sub-index
Wi: Relative weight assigned to parameter i depending on the influence of water quality
Temperature: NSF and Dinius 1987 use the difference between room temperature and
water temperature ((∆T=T_room-T_Water) expressed in °C
Table 2. Weights weighted for physical, chemical, and microbiological parameters for ICA Dinius and N
Parameter Water Quality Indexes ( Weighted weights)
NSF Dinius (1987)
Nitrates 0,10 0.090
Temperature) 0,10 0,077
DBO 0,10 0,097
pH 0,12 0,077
Fecal coliforms 0,15 0.116
Dissolved oxygen (%) 0,17 0,109
Turbidity 0,08 -----
Total dissolved solids 0,08 -----
Phosphates 0,10 -----
Total coliforms ---- 0.090
Chlorides ---- 0,074
Color ---- 0,063
Electrical conductivity ---- 0,079
Alkalinity ---- 0,063
Hardness ---- 0,065
Source: (González, Caicedo, & Aguirre, 2013)
The indexes of water quality were related to the qualifications proposed for every index
NSF and Dinius. Once the ICA averages are obtained, it is possible to do a statistical
correlation with the "t" test of Student, whose statistical significance is p = 0,05, to see
how the data correlate (Equation 2).
t =d-μ0
sd/(√n) Ecuación (1)
Where:
μ0 = Hypothetical population and difference average
d = The averages of the groups of date to be compared)
sd = Standard deviation of the differences of the compared samples)
sd = Samples number

224
The ICA values obtained are verified against the ranges of quality classification of water
to be considered a source of supply for human consumption and thus the quality of the
water at every monitored stage is established. Tables 3 and 4 detail the values for water
state classification once the analyses have been done.
Table 3. ICA-NSF Values and classification
ICA NSF VALUE Classification of water quality
90-100 Excellent quality
70-90 Good quality
50-70 Medium quality
25-50 Bad quality
0-25 Very bad quality

225
Table 4. Classification ranges of Multiapplicative ICA depending on water use according to Dinius (1987)
Human Consumption Agriculture Fishing and aquatic life Industrial Recreation
Range Description Range Description Range Description Range Description Range Description
90-
100
Treatment for
consumption is
not required
90-
100
Purification for
irrigation is not
required
70-100 Abundant fishing
and aquatic life
90-100 Purification is not
required
70-100 Any type og
water sport
80-90 Minor treatment
required
70-90 Minor purification for
cultures requiring
high quality water
60-70 Limit for very
sensitive fish
70-90 Minor purification for
industries requiring
high quality water
50-70 Immersion sports
to be restricted
70-80 Doubtful
consumption
50-70 Treatment not required
for the majority of
cultures
50-60 Doubtful fishing
without risks for
health
50-70 Treatment not
required for the
majority of operation
industries
40-50 Doubtful for
contact with
water
50-70 Treatment to
make water
potable needed
30-50 Treatment required for
the majority of cultures
40-50 Aquatic life
limited to very
resistant species
30-50 Treatment required
for most uses
30-40 Contact only with
boats
40-50 Doubtful
consumption
20-30 Use only in very
resistant species
30-40 Unacceptable
For fishing
20-30 Use restricted only to
Coarse activities
20-30 Visible
contamination,
avoid nearness
0-40 Unacceptable for
consumption
0-20 Unacceptable for
irrigation
0-30 Unacceptable for
aquatic life
0-20 Unacceptable for any
industry
0-20 Unacceptable for
recreation
Source: Adapted from León (as quoted in Corporacion Autonoma Regional Valle del Cauca 2004)

226
1.2. Water Quality in Quevedo Canton
The average concentrations of the parameters (water temperature total suspended solids,
pH, chlorides, nitrates, phosphates, fecal and total coliforms), suspended solids and
chlorides, at a temperature of 27,42 oC are in the permissible ranges.
The pH remains at 6,92 a normal value for water according to the pH scale. As Jiménez
mentioned in (Perez Lopez, 2016) states, the pH is an important operative parameter of
water quality. Very acid waters dissolve the metals used in conductions (lead, copper, zinc),
which, when consumed, negatively affect health. According to Galvin mentioned in (Perez
Lopez, 2016), for human consumption waters, the extreme values can cause irritation in the
mucous membranes, irritation in internal organs and even ulceration processes.
The content of chlorides in the water is in a range of 2,58 mg/l, that is why these waters
are classified as normal chlorinated waters by (Rivera, Encina, Muñoz, and Mejias, 2004)
in their study Quality of the Waters, the values of chloride are under the permissible limit,
(table 5).
Table 5. Physical, chemical and microbiological parameter concentrations
Classification Parameters Measurement unit Average consumption in
rural area
Physical Temperature °C 27,42
T. Suspended solids mg/L 27,665
Chemical
pH pH units 6,915
Chloride mg/L 2,58
Nitrates mg/L 2,36
Phosphates mg/L 1,155
Microbiological Fecal coliforms N.M.P./100ml 6423,335
Total coliforms N.M.P./100ml 58370
The indexes of water quality (ICA) have been promoted in order to contribute to the reports on water condition to the society (Espinal Carreon, Cedeño Diaz, and Lopez Lopez, 2013). Water contamination has a great impact both on health and environment Morel and Hernandez quoted by (Perez Lopez 2016). The valuable concentration of undesirable components (e. g. chlorides, nitrates, and heavy metals) limits the viability of the liquid and increases its toxicity, what makes the study of pollution, the measurement its effects and the control of its evolution important aspects for quality considerations. The application of the ICA Dinius and NSF is very important in determining the quality of surface water, since they consider accurately chosen parameters demonstrating the environmental condition of water on the basis of ranges and criteria, The ICA in the north zone demonstrates that in the sector 3 according to Dinius (1987) methodology and NSF the water is slightly contaminated
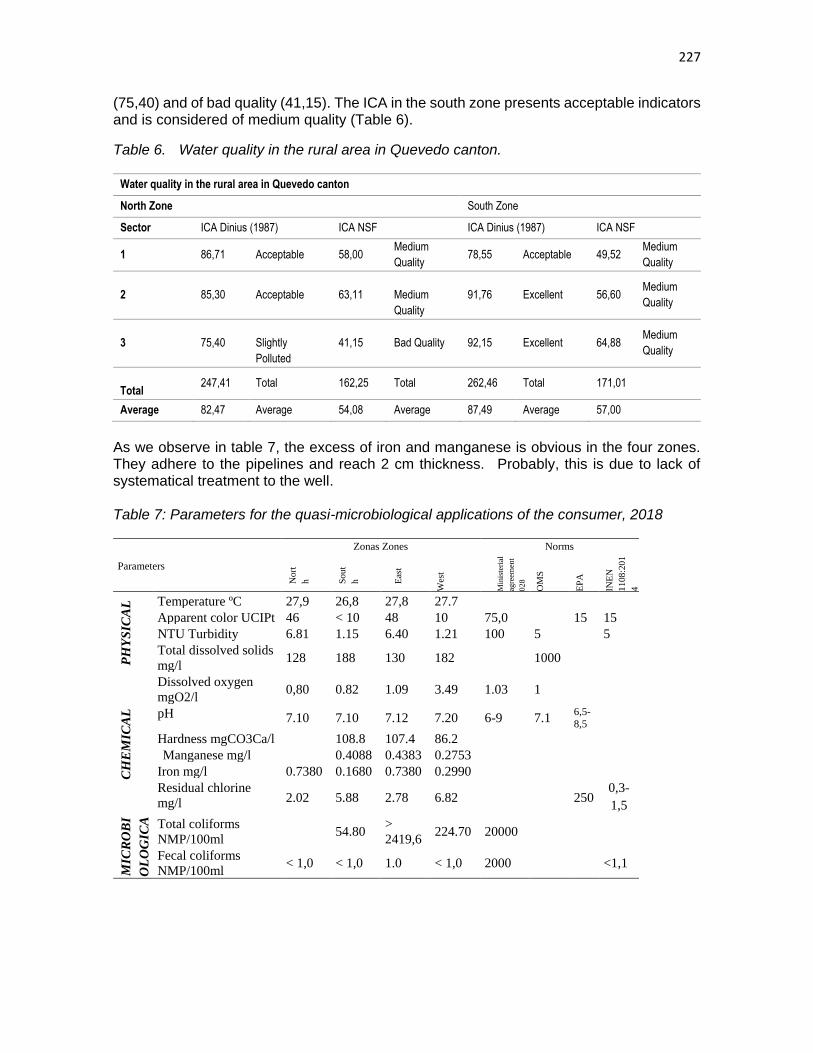
227
(75,40) and of bad quality (41,15). The ICA in the south zone presents acceptable indicators and is considered of medium quality (Table 6).
Table 6. Water quality in the rural area in Quevedo canton.
Water quality in the rural area in Quevedo canton
North Zone South Zone
Sector ICA Dinius (1987) ICA NSF ICA Dinius (1987) ICA NSF
1 86,71 Acceptable 58,00 Medium
Quality 78,55 Acceptable 49,52
Medium
Quality
2 85,30 Acceptable 63,11
Medium
Quality
91,76 Excellent 56,60 Medium
Quality
3 75,40
Slightly
Polluted
41,15 Bad Quality 92,15 Excellent 64,88 Medium
Quality
Total 247,41 Total 162,25 Total 262,46 Total 171,01
Average 82,47 Average 54,08 Average 87,49 Average 57,00
As we observe in table 7, the excess of iron and manganese is obvious in the four zones. They adhere to the pipelines and reach 2 cm thickness. Probably, this is due to lack of systematical treatment to the well. Table 7: Parameters for the quasi-microbiological applications of the consumer, 2018
Parameters
Zonas Zones Norms
Nort
h
So
ut
h
Eas
t
Wes
t
Min
iste
rial
agre
emen
t
028
OM
S
EP
A
INE
N
1108
:20
1
4
PH
YS
ICA
L Temperature ºC 27,9 26,8 27,8 27.7
Apparent color UCIPt 46 < 10 48 10 75,0 15 15
NTU Turbidity 6.81 1.15 6.40 1.21 100 5 5
Total dissolved solids
mg/l 128 188 130 182 1000
CH
EM
ICA
L
Dissolved oxygen
mgO2/l 0,80 0.82 1.09 3.49 1.03 1
pH 7.10 7.10 7.12 7.20 6-9 7.1 6,5-
8,5
Hardness mgCO3Ca/l 108.8 107.4 86.2
Manganese mg/l 0.4088 0.4383 0.2753
Iron mg/l 0.7380 0.1680 0.7380 0.2990
Residual chlorine
mg/l 2.02 5.88 2.78 6.82 250 0,3-
1,5
MIC
RO
BI
OL
OG
ICA
L
Total coliforms
NMP/100ml 54.80
>
2419,6 224.70 20000
Fecal coliforms
NMP/100ml < 1,0 < 1,0 1.0 < 1,0 2000 <1,1

228
After the analysis of grouping between physical and microbiological parameters, we observe
three groups of cluster. The first one is considered to be the point of minor pollution, the
second one with average pollution, and the third, moving away from the rest, is that of major
pollution. With less distance among themselves, parameters iron and apparent color, move
away from other groups and are considered to be the parameters most influencing water
quality (Figure 1)
Figure 1. Dendogram of PHYSYCAL, chemical, and microbiological parameters
1.3. Conclusions
The water consumed by the people in Quevedo, according to the quality indexes established by Dinius (1987) to the north zone presents criteria of " acceptable and slightly contaminated " and according to the ICA NSF for four zones the criteria are of " medium quality ", what can be observed with the application of the GWQI. The low concentration of fluoride directly influences water due to the high relative weight that it possesses as compared to other indicators, therefore the quality standards of the water do not comply with the regulations established for the parameters apparent color, turbidity and iron. It becomes necessary to apply governmental management that would guarantee water of excellent quality for the city of Quevedo.
2. Food sovereignty is also resilient farming. The corporate food regime,
and is relation with climate change
Dendograma
Método del Vecino Más Cercano,Euclideana Cuadrada
0
4
8
12
16
20
24
Dis
tan
cia
Te
mp
era
tura
Co
lor
Ap
are
nte
Tu
rbid
ez
SD
T
OD
Clo
ruro
s
Du
reza
Nit
rato
s
Ma
ng
an
es
o
Hie
rro

229
Within the ambitious agenda 2030, SDG2 target established to end hunger, through the promotion of sustainable, bio-diverse and resilient small-scale farming systems, that is, a conversion of production systems towards a more sustainable agricultural model. Among the targets set to achieve SDG2, a more conventional challenge is listed, to increase productivity, within the classic paradigm of agricultural modernization, as pushed by the green revolution, and based on industrial farming models. At the same time, SDG13 aims at facing climate change, by setting measures to reduce the risk of disasters, mitigation and adaptation plans, and strengthening education, as well as capacity building. However, serious doubts arise from the association between resilience and industrial farming, if we consider the impacts produced by the latest in terms of food insecurity and environmental degradation at global level. Genetic loss, water pollution, soil fertility reduction, deforestation, GHG emissions, massive energy consumption, are just a few examples of the impacts of the industrial farming model, which has been imposed as universal remedy against hunger and poverty, and widely spread over the agricultural lands of Northern Countries, as well as in the Global South. The Green Revolution was first introduced in the 60s, and then updated by many innovation waves, till the most recent “new green revolution” relying on biotechnology. Since its origin, the attempt was made to impose the Green Revolution as the only possible “modern” agricultural model, despite its impacts, not only on food contamination and environmental degradation, but also on poverty of both, rural farmers, whose production systems became non-viable, and urban citizens, affected by the increase of food prices. The current food system has been defined as “corporate food regime” (Friedmann, 1987, 2005; Friedman y McMichael, 1989; McMichael, 2009, 2014, 2015), in order to put emphasis on its most important feature, which is the fact of being controlled by large corporations. Initially, the regime was ruled by international Institutions, such as WTO (World Trade Organization), while most recently the free trade agreements (both multi- and bi-lateral ones) took control. States are no longer the most important actors of the global food systems, which are mostly led by corporations that control the food value chains, ruling trade and imposing continent-scale distances between producers and consumers. The corporate food regime is characterized by extremely high mechanization levels, as well as by the large use of robotics, which causes an increasing cut of manpower (“farming without farmers”). The intensive systems bring GM seeds along, as well as relevant processes of resource concentration (land and water grabbing) and the financialization of rural areas, which in turn, triggers indebtment processes. In this framework, rather than a right, food becomes another option for business and profits, and for accumulation and guarantee system, whose approach aims at generating the highest profits in the shortest time. Since maximising productivity is the only target, there is no regard for the cost of the impact it may cause. In this kind of systems, production costs spike, and to become competitive, the scale of production must be constantly enlarged too. As a consequence, all over the world –and despite their traditional key role to ensure food security- peasants farming systems undergo increasingly aggressive factors of displacement. Marginalized and impoverished peoples turn out to be more exposed, and more severely hit by the impact of climate-change related events. In particular, the productive model of agricultural modernization is based on specialization, implemented by single-crop farms and a strong dependence on market-provided inputs, such as seeds, fertilizers, machinery, energy sources and manpower. In this model, natural resources are not regarded as an asset to be preserved and renewed, but to be exploited for merely productive and short-term purposes. One such situation explains why the agricultural sector turns out to be a major driver of climate change, and therefore, a priority to be addressed when it comes to mitigation

230
measures, such as the reduction of GHG and CO2 emissions, change in soil use, deforestation. Its role for adaptation is recognized as well, because the negative effects of climate change, such as droughts and floods, have a direct impact on the food production capacity, and therefore, on the food security of both urban and rural population. To address the recurring ecological and food crises, and with the declared purpose to highlight the importance of the peasant approach on thinking and making agriculture, over 20 years ago, movements like La Via Campesina introduced the principle of Food Sovereignty. This proposal was based on the claim that peasantry had resisted and replicated itself all over the world, despite the global expansion of aggressively imposed “modernizer” agricultural policies, accompanied by a discourse based on the oppositions between modern vs. traditional, and urban vs. rural As a matter of fact, still nowadays peasant farming systems are estimated to be more widely practiced than industrial ones, and to produce the majority of the food consumed by the world population. The principle of Food Sovereignty became popular, while in the same years, all over the world people gained awareness of the ecological issues, as well as of food quality, and of the need to shift to responsible consumption models. As a result, the so-called alternative agro-food-networks gained strength, which are nowadays well rooted over countless territories worldwide. Some examples include agro-ecology, permaculture, organic farming, short chains, solidarity economy, farmers’ markets, and territorial food pacts, among others. The majority of these alternatives fairly refer to Food Sovereignty, as a guiding principle, showing the way to escape from unsustainable agricultural models.
2.1. The proposal of food sovereignty: the concept, and its consequences on agriculture and the right to food 2014 has been declared as the International Year of Family Farming, so to promote the visibility of family farming, and positioning it again "at the centre of agricultural, environmental and social policies in the national agendas by identifying gaps and opportunities to promote a shift towards a more equal and balanced development".
More than 500 million family farming units exist in the world. They include a huge variety of small- and medium-scale actors, encompassing peasants, indigenous peoples, pastoralists, artisanal fisherfolks and groups of gatherers. In many regions of the world, family farming is responsible of most of the food produced and made available. Family farming systems not only offer a balanced diet, it also contribute to the conservation of the food habits, and the agrobiodiversity within the regions concerned.
In particular, in Latin America and the Caribbean region, family farms account for 80% of the total farm land, involving more than 60 million people. Family farming is the main source of rural employment in the whole region, and produces most of the food for domestic consumption.
The principle of Food Sovereignty as launched by “La Via Campesina” international movement in 1996 - on the occasion of the FAO World Food Summit – recognizes and highlights the role of the food systems based on family, peasant, indigenous and fisher folk producers. It sets the goal to defend and strengthen them, as suppliers of local systems, providing healthy and culturally appropriate, food, while preserving the natural environment.
The difference between the concept of food security and food sovereignty, basically lays in the possibility to decide on food production models. It does not claim only for the right to have access to food, but also to the food production resources, within local systems that

231
respect the peculiar ecological, social and cultural conditions of peoples, and of the territories they inhabit.
At the International Forum on Food Sovereignty held in Nyeleni, Mali, in 2007, Food Sovereignty was defined as "the right of all peoples, nations and states to determine their own food producing systems and policies, that provide every one of us with good quality, adequate, affordable, healthy and culturally appropriate food”
A few elements can be told, as key-features of agriculture, within the framework of food sovereignty:
1) a peasant and small-scale centered approach;
2) diversification, agroecology, respect and renewal of the natural resource base that nourishes the production cycles (land, seeds, water, etc.), preservation and enhancement of local agrobiodiversity and local knowledge;
3) re-territorialization: that is, the food chain is short, and it is shaped based on the territories, considering the potential and the identity of each local system;
4) promotion of virtuous economic circuits, reducing intermediaries between producer and consumer groups, and fuelling rural-urban alliances.
The proposal of food sovereignty is opposed to agro-industrial monocultures and to the massive use of pesticides. It aims at reducing the distance between producers and consumers, and at guaranteeing equitable access to productive resources (land, water, seeds, capital, technical assistance, etc.). It defines the quality of food on the basis of its nutritional properties, as well as of the social and environmental impacts caused by its production. The capacity to adjust to the food identity of each territory is another key feature.
2.2. Food sovereignty and resilient agriculture Many types of production systems could be found matching the frame of food sovereignty. They all have common features, such as the capacity to adapt to different ecosystems, so as to preserve and reproduce their biological and cultural diversity, and to diversify productive strategies. It is possible, therefore, to propose them as a solution for both, reducing the causes and impacts of climate change. In 2014, with the aim of contributing to the Fifth Assessment Report of the Intergovernmental Panel on Climate Change (IPCC), FAO launched a new alarm claiming that emissions coming from agriculture, forestry and fishing had almost doubled in the last fifty years and that "they could increase by an additional 30% by 2050, unless a major effort to reduce them was agreed".
The main sources were listed, including the emissions generated by enteric fermentation (CH4 produced by livestock), the use of synthetic fertilizers, methane emissions generated by biological processes in rice fields, wild fires burning savannahs and the use of fossil fuels (including electricity and fossil fuels for agricultural machinery, irrigation pumps and fishing vessels).
The International panel of experts on Climate Change (IPCC) estimates that agriculture is responsible for about 14% of total GHG emissions, however, this percentage does not include "indirect emissions from agriculture", that is, for example, the energy spent to produce fertilizers, agricultural machinery or transport (of both inputs and harvests). Likewise, the emissions resulting from the change in land use generated by agriculture are not accounted for. Considering all those factors the percentage of GHG produced by the agricultural sector could very well double.

232
These facts explain the need for a transition to those agri-food systems living in harmony with nature, addressing the causes of CC and, at the same time, allowing to strengthen the adaptation capacities.
Food Sovereignty leads to the resilience of the agri-food systems, with positive effects on the food security of rural and urban populations. However, it is not only a matter of raw materials, but of food, going beyond production, so to address transformation and consumption as well.
In fact, the climate impact of food is not generated only at the production level. High energy costs and contamination rates are associated to transformation by hyper - industrialized farms, and to trade over extremely long distances. This is why according to various authors, if we want to counter climate change, while strengthening mitigation and adaptation capacities, "changing the industrial model of production and distribution is of utmost priority" (Various authors, 2010: s/n).
If we agree to define resilience as the "ability of an individual, family, group or system to be prepared for, absorb and recover from the effects of an adverse event, without compromising (and possibly improving) their future prospects", the agro-food issue becomes undoubtedly an enabling factor for world population to tackle this challenge, being food vital for the reproduction of every single human being, in all ecosystems.
In this regard, peasant and indigenous family farmers - as acknowledged by the food sovereignty approach - undoubtedly represent a virtuous model, inspiring an agro-ecological transition able of mitigating global warming, as well as our adaptation capacity.
These farm models are characterized by limited access to resources (such as land, water and capital). As a consequence, they must search for high levels of self-sufficiency, in order to make sure that inputs, tools, work force and technical knowledge are maintained. An extreme care for the sustainable use of the available resources becomes essential, not so much because of a natural environmental responsibility, as because of the scarcity of the available resource base. In similar conditions, the ability of safeguarding the resources necessary for the on-going productive cycle, while preserving them for the future ones becomes vital.
For example, the maintenance of soil fertility becomes strategic, as well as the ability to breed and improve seeds at farm level. According to the “peasant” small producer approach, not all the production is sent to the market: one part is left for family-consumption, and another part is set aside to start future production cycles (e.g. selection, reproduction of seeds).
For the international movement Vía Campesina (s / f), the original promoter of the food sovereignty proposal, small-scale sustainable agriculture is characterized by the fact of generating intensive work and low energy consumption, therefore contributing to cooling the planet through: (1) a greater capture of organic Carbon and Carbon dioxide in the soil, obtained through sustainable production, and also through mixed crop-livestock farming, an alternative to industrial livestock farming; (2) agro-ecological practices for soil management and soil fertility, an alternative to industrial fertilizers; (3) the production of biogas from animal and vegetable waste, maintaining sufficient organic matter in the soil; (4) the production of solar energy and other renewable sources. (5) preservation and recovery of agricultural biodiversity, at the same time counteracting genetic erosion driven by global warming, and providing species and varieties more adapted or resistant to adverse events; (6) integrated forests management; (7) diversified, small-scale and agroecological production, and fostering local markets.

233
Diversifying productions, recovering and preserving agricultural biodiversity and fostering the right to access agro-biodiversity by indigenous and peasant communities, provides opportunities for the production systems to both mitigate and adapt to climate change.
In other words, in order to assess the efficiency and productivity of certain agri-food systems, it is necessary to take into account not only the harvest amount, but also the vulnerability to adverse events. It will increasingly be needed to diversify risks, and to adapt to the climatic changes affecting the productive systems.
In this framework, it is possible and even urgent to strengthen the resilience and resistance capacities of peasant and fisherfolks, as well as of the entire consumers community: as Wendell Berry affirms, "eating is an agricultural act". Our choice as consumers is the key, in determining what kind of food is produced, and how.
This kind of increased resilience in agriculture could be achieved through supporting small scale agriculture. It requires more workforce and absorbs less energy, being based on production diversification, agroecological practices for the production and processing of healthy food, within food systems strongly rooted in the territories.
Refrence List
ALONSO, J.A. (2016): La Agenda 2030 para el desarrollo: ¿Es una agenda transformadora?. Speak at the Inernational Conference of the International Leadership Association, held in the Recinto Modernista de Sant Pau.
ALTIERI, M. (2002): Agroecología: el camino hacia una agricultura sustentable. E.C.A.: BA.
ALTIERI, M. A., NICHOLLS, C., & FUNES, F. (2012). The scaling up of agroecology: Spreading the hope for food sovereignty and resiliency. Sociedad Científica Latinoamericana De Agroecología. Disponible en: http://www.fao.org/docs/eims/upload/288618/Enduring_Farms.pdf
AYRES, J. y BOSIA, M. J. (2011): "Beyond Global Summitry: Food Sovereignty as Localized Resistance to Globalization". Globalizations, 8 (1), pp. 47-63.
AUTORES VARIOS (2010), "Agricultura y cambio climático", Revista Ecologistas en Accion, Nº 67. Available at: https://www.ecologistasenaccion.org/
Baque, R., Simba, L., Gonzalez, B., Suatunce, P., Diaz, E., & Cadme, L. (2016). Calidad del agua
destinada al consumo humano en un cantón de Ecuador / Quality of water intended for human
consumption in a canton of Ecuador. Ciencia Unemi, 9(20), 109–117.
Barrera Escorcia, G., Fernández Rendón, C. L., Wong-Chang, I., & Ramírez Romero, P. (2013). La
sensibilidad del grupo coliforme como indicador de la presencia de enterobacterias patógenas
en cuatro cuerpos acuáticos de México. Hidrobiología, 23, 87–96.
CARRIÓN, A., GIUNTA, I. et AL. (2017): Posterremoto, gestión de riesgos y cooperación internacional, Quito, UNDP-IAEN.
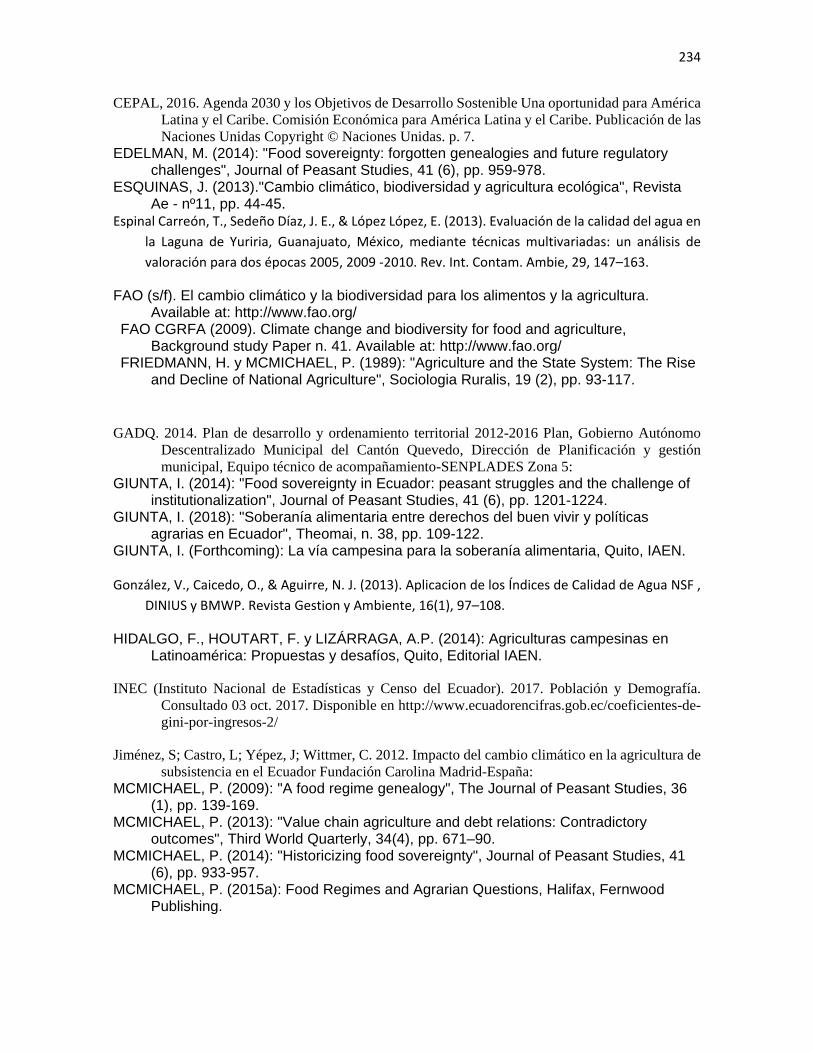
234
CEPAL, 2016. Agenda 2030 y los Objetivos de Desarrollo Sostenible Una oportunidad para América
Latina y el Caribe. Comisión Económica para América Latina y el Caribe. Publicación de las
Naciones Unidas Copyright © Naciones Unidas. p. 7.
EDELMAN, M. (2014): "Food sovereignty: forgotten genealogies and future regulatory challenges", Journal of Peasant Studies, 41 (6), pp. 959-978.
ESQUINAS, J. (2013)."Cambio climático, biodiversidad y agricultura ecológica", Revista Ae - nº11, pp. 44-45.
Espinal Carreón, T., Sedeño Díaz, J. E., & López López, E. (2013). Evaluación de la calidad del agua en
la Laguna de Yuriria, Guanajuato, México, mediante técnicas multivariadas: un análisis de
valoración para dos épocas 2005, 2009 -2010. Rev. Int. Contam. Ambie, 29, 147–163.
FAO (s/f). El cambio climático y la biodiversidad para los alimentos y la agricultura. Available at: http://www.fao.org/
FAO CGRFA (2009). Climate change and biodiversity for food and agriculture, Background study Paper n. 41. Available at: http://www.fao.org/
FRIEDMANN, H. y MCMICHAEL, P. (1989): "Agriculture and the State System: The Rise and Decline of National Agriculture", Sociologia Ruralis, 19 (2), pp. 93-117.
GADQ. 2014. Plan de desarrollo y ordenamiento territorial 2012-2016 Plan, Gobierno Autónomo
Descentralizado Municipal del Cantón Quevedo, Dirección de Planificación y gestión
municipal, Equipo técnico de acompañamiento-SENPLADES Zona 5:
GIUNTA, I. (2014): "Food sovereignty in Ecuador: peasant struggles and the challenge of institutionalization", Journal of Peasant Studies, 41 (6), pp. 1201-1224.
GIUNTA, I. (2018): "Soberanía alimentaria entre derechos del buen vivir y políticas agrarias en Ecuador", Theomai, n. 38, pp. 109-122.
GIUNTA, I. (Forthcoming): La vía campesina para la soberanía alimentaria, Quito, IAEN. González, V., Caicedo, O., & Aguirre, N. J. (2013). Aplicacion de los Índices de Calidad de Agua NSF ,
DINIUS y BMWP. Revista Gestion y Ambiente, 16(1), 97–108.
HIDALGO, F., HOUTART, F. y LIZÁRRAGA, A.P. (2014): Agriculturas campesinas en Latinoamérica: Propuestas y desafíos, Quito, Editorial IAEN.
INEC (Instituto Nacional de Estadísticas y Censo del Ecuador). 2017. Población y Demografía.
Consultado 03 oct. 2017. Disponible en http://www.ecuadorencifras.gob.ec/coeficientes-de-
gini-por-ingresos-2/
Jiménez, S; Castro, L; Yépez, J; Wittmer, C. 2012. Impacto del cambio climático en la agricultura de
subsistencia en el Ecuador Fundación Carolina Madrid-España:
MCMICHAEL, P. (2009): "A food regime genealogy", The Journal of Peasant Studies, 36 (1), pp. 139-169.
MCMICHAEL, P. (2013): "Value chain agriculture and debt relations: Contradictory outcomes", Third World Quarterly, 34(4), pp. 671–90.
MCMICHAEL, P. (2014): "Historicizing food sovereignty", Journal of Peasant Studies, 41 (6), pp. 933-957.
MCMICHAEL, P. (2015a): Food Regimes and Agrarian Questions, Halifax, Fernwood Publishing.

235
NYLENI (2011): "Pesca y Cambio Climatico”. Nyeleni Bulletin, No 7. Available at: https://nyeleni.org/
NYLENI (2014): "Agroecología y clima “. Boletín nyeleni, Número 20. Available at: https://nyeleni.org/
Ordoñez D. 2015. Calidad de agua de consumo humano en el proceso de captación, distribución,
almacenamiento y consumo en los sectores Salvador Allende, 15 de Noviembre, Isla del Rio
y Pantano en la parroquia San Cristóbal del cantón Quevedo provincia de Los Ríos”, proyecto
de investigación. UTEQ. FCA. Quevedo-Ecuador. 103p
Organización de las naciones Unidas para la agricultura y la Alimentación. Roma (FAO), 2007. Agua y Cultivos, logrando el uso óptimo del agua en la agricultura. Uso agrícola del agua. (en línea). Consultado 27 mar. 2012. Disponible en http://www.fao.org/DOCREP/005/Y3918S/y3918s00.htm#TopOfPage
Pérez López, E. (2016). Control de calidad en aguas para consumo humano en la región occidental
de Costa Rica. Tecnología En Marcha, 29, 3–14. https://doi.org/10.18845/tm.v29i3.2884
PLOEG, J.D. van der (2014): "Peasant-driven agricultural growth and food sovereignty", Journal of Peasant Studies, 41 (6), pp. 999-1030.
Rivera, N., Encina, F., Muñoz, A., & Mejias, P. (2004). La Calidad de las Aguas en los Ríos Cautín e
Imperial, IX Región-Chile. Información Tecnológica, 15(5), 89–101.
https://doi.org/10.4067/S0718-07642004000500013.
Saa Marola y Gonzalez : B. 2017 FOCICYT 003- Calidad del agua de las albarradas del cantón
mocache, provincia de Los Ríos Determinantes en la contaminación del recurso hídrico en
albarradas del cantón Mocache,Universidad Técnica estatal de Quevedo. Facultad de
Ciencias Ambientales. 144 p.
VIA CAMPESINA (sf): Los pequeños agricultores y la agricultura sostenible están enfriando el planeta. Available at: https://viacampesina.org/es/wp-content/uploads/sites/3/2015/12/ES-paper5.pdf

236
Chapter 17. Drought Management Plans in urban
supply systems in Spain. A resilience tool for
drought management Jesús Vargas1 and Pilar Paneque1
1 Geography, History and Philosophy Department Pablo de Olavide University
Introduction
Drought is defined as a transitory anomaly characterised by below-average rainfall in a
given area for a long period of time (Pita 1989). These events may (or may not) lead to
shortages in water supply which largely depends on demand and the characteristics of
current water management and exploitation systems. Drought may have an immense
impact when below-average rainfall leads to a decrease in annual pluviometric levels
and shortcomings in the necessary volume of water for irrigation, human consumption,
and ecosystem preservation (Morales et al. 2000). In Spain, drought is a recurrent
phenomenon. A drought or quasi drought takes place approximately every ten years.
Moreover, forecasts related to climate change indicate that in the future, the frequency
and intensity of droughts in Southern Europe will increase (IPPC 2014) and Spain is
highlighted as one of the most vulnerable countries in terms of water scarcity (EEA 11
2012).
In recent years, the European Commission and the European Environment Agency have
published a series of reports on the consequences of climate change in regards to its
effect on water scarcity and drought. These reports confirm that this issue is one of
the main challenges posed by climate change in the short and long term (EC 2007, EEA
2/2009, EEA 11/2012, EEA 2/2015, EEA 1/2017, and EEA 15/2017). These consequences
are especially concerning for cities, as they greatly affect urban water supply. This is
corroborated formally by numerous basin organizations and public entities responsible
for urban supply through of the “Paris Pact on Water and Adaptation to Climate Change
in the Basins of Rivers, Lakes, and Aquifers” promoted in the framework of the COP21
held in Paris in December 2015.
Traditionally drought management strategies have considered these phenomena as
natural events for which little or nothing can be done. This viewpoint regards droughts
as unavoidable natural disasters, thus risk management strategies are typically reactive

237
in nature after the impact has already been felt (Wilhite 2000; UNISDR 2005; WMO and
GWP 2014). Repetitive droughts have led to substantial improvements in infrastructure,
such as water reservoirs, interbasin transfers, desalination plants, and underground
water surveys. It has influenced the normative and especially the development of
drought-oriented strategies and tools. In this sense, the approval of the National
Hydrological Plan Law (PHN) in 2001 was an important breakthrough, at least in the
normative corpus. The PHN establishes the obligation to develop drought plans, such as
the preparation of territory-specific special drought plans and urban-supply emergency
drought plans. Despite the important advances in drought risk planning on river basin
districts and in large urban-supply systems, there are still large remaining problems in
small and medium-sized municipalities, which are also the most vulnerable to drought.
Climate change and droughts in a context of severe water stress
Precipitation is the most important climatic element in Spain, both from a climatic point
of view and in its consideration as a resource, given its limited levels in a majority of the
territory and its high temporal and spatial variability (De Castro et al. 2005). Although,
average annual precipitation is 650 mm (series 1981-2010), rainfall in Spain presents a
great inter-annual, seasonal and spatial variability (Martín-Vide 1996). The inter-annual
variability reaches up to 20% difference in the Mediterranean regions and the Canarian
archipelago. On the east coast, the variation in annual precipitation reaches 40%. This
inter-annual variability is caused by diverse patterns of the general circulation of the
atmosphere in the northern hemisphere, among which the so-called North Atlantic
Oscillation (NAO index) stands out (De Castro et al. 2005). Besides, precipitation tends
to be concentrated in spring and winter and is close to non-existent during the summer
months (www.aemet.es). Regarding variability, the highest amounts of precipitation are
concentrated in mountainous areas and areas exposed to humid Atlantic flows, with a
gradual decrease towards the south, which increases as we get closer to the southeast
(Olcina 2006). This distribution of rainfall has led to the traditional regional distinction
between "wet Spain", where the annual rainfall exceeds 800 mm/year and “dry Spain”,
where the average rainfall is between 300 and 800 mm/year. The transition from "wet
Spain" to "dry Spain" takes place through a transition zone in which rainfall decreases
from north to south and from west to east, staying around 600-800 mm/year. Finally, the
"Arid Spain" corresponds to those places that receive less than 300 mm/year and are
located mainly in the southeast of the peninsula.

238
Additionally, the appearance of drought is a recurrent phenomenon in Spain which has
already increased since the 1970s (Vicente 2006). The most severe episodes in terms of
economic losses took place in 1941-1945, 1979-1983, 1990-1995, 2004-2008 and 2015-
2017; these drought events affected virtually the entire Spanish territory. In addition to
the natural variability of rainfall in Spain and the recurrent appearance of drought
episodes, predictions related to climate change indicate that the frequency and intensity
of droughts may increase in Southern Europe in the future (IPCC 2014). In Spain’s
specific case, regional climate change models indicate a reduction of water resources
throughout the peninsula, somewhat more intense towards the South and in the
archipelagos and a lesser impact in some areas of the peninsular East. This decrease in
the availability of resources will result in an increase in the scarcity of water resources
to meet water demands. In addition, a change in the drought regime is predicted. Most
of the climate projections show a future in which droughts would be more frequent and
intense, magnifying along the 21st century and thus increasing the exposure to drought
in the future (CEDEX 2017b).
Although in Spain it rains enough to satisfy water demands (Olcina 2008), the variability
of rainfall is combined with an increasing water demand for different uses (Quiroga et
al. 2011). The level of pressure to which water resources are subjected in the ordinary
hydrological planning determines the hydrological response of the system when a
drought occurs and therefore, the sensitivity of the system suffers effects. The greater
the pressure on water resources, the more difficulties there will be in meeting demands
when the availability of resources decreases because of drought. The Water Exploitation
Index (WEI) is a widely recognized indicator to characterize the level of pressure on
water resources of specific territory or river basin (EEA 2012). This indicator relates the
total use of resources (consumptive and non-consumptive) with respect to total
renewable resources, expressed as a percentage. According to Eurostat, WEI values
below 10% imply that the analysed system is not subject to water stress, if the value of
the indicator is between 10-20% it implies a low level of water stress, if the indicator
exceeds 20% it is considered that the system has reached the alarm level due to water
stress, while if it exceeds 40% the system is considered as having severe stress. Another
very similar indicator is WEI+ (which can be considered an evolution of the first) in which
the total of resources consumed (consumption minus returns) is related to total
renewable resources. According to CEDEX (2017) all Spanish river basin districts
exceed WEI+ values of 31%. This value places the whole country on alert for water
stress.

239
1. Drought management in Spain. Towards drought risk planning strategies.
Due to the intensity and frequency of drought events, Spain has a lot of experience in
dealing with these risks. This experience can be framed in two different approaches. On
one hand, traditional drought-management strategies have considered these
phenomena as exceptional events and causality has been associated with nature. From
this point of view, drought responses have been largely reactive: constructing
infrastructures to increase the availability of water and distributing monetary
compensation for losses and damages incurred. This is the crisis management approach
(Wilhite 2000; UNISDR 2005; WMO and GWP 2014). As the Spanish Ministry for the
Environment itself recognises (http://www.magrama.gob.es/), drought management in
Spain has been dominated by a crisis-management approach. Perceptions about
drought as an extraordinary event and insufficient rainfall are key to gaining a good
understanding of drought management and hydraulic policy in general, in Spain from the
mid-19th century onwards. The traditional division between “Humid Spain” and “Dry
Spain” has often been used in hydraulic policies which aim to redress territorial and
seasonal unbalance in water supply through the construction of major infrastructures,
such as reservoirs and interbasin transfers (Arrojo 2003; Arrojo and Naredo 1997; López
Ontiveros 1998; Naredo 1997a, 1997b; Ortega Cantero 1992). However, although the
correction of territorial unbalance was the flagship of ‘regenerationist’ policies on water
management, on which abundant literature, both national and international, exists
(Gómez and Ortega 1987; Orteg 1992; Arrojo 2003; Naredo 1997a, 1997b; López 1998;
Saurí and Del Moral 2001; Swyngedouw 1999, 2000). These ideas sprang up in the first
place due to the recurrence of drought; furthermore, drought needs to be alleviated in
order not to imperil progress and development, which was the paradigm’s declared
objective. In this sense, the construction of reservoirs and interbasin transfers can be
argued not only to redress territorial differences, but to reduce the vulnerability of the
system by making it flexible and adaptable by the ‘common pooling’ of resources.
However, as pointed out by Naredo (1997), what was originally conceived as a method
to redress territorial unbalance in terms of water supply, ended up turning major
infrastructures into the solution during conditions of scarcity that were, and increasingly
became, a social construction. Within this paradigm —which is characterised by poor
control over the use of the resource and little responsibility for costs— the resource is
conceived as a heavily subsidised productive input which, along with other social and

240
political aspects, served to legitimise traditional hydraulic policies (Del Moral 1996). This
forms a sort of vicious circle between low-cost supply (guaranteed by the state-
sponsored construction of new supply infrastructures) and the emergence of new
conditions of scarcity caused by bad management and the disproportionate use of the
resource, which again legitimises the construction of further infrastructures as the only
way to deal with the new situation of scarcity. In this regard, what we often call drought
is nothing but the end result of policies aimed at constantly increasing the availability of
water (Estevan 2003).
From crisis management approach, the institutional response to drought in Spain is
materialized through reactive and emergency measures through the approval of Royal
Decrees (RDL). These RDD’s are justified in the alarm situation and covered by the
declaration of "general interest". They establish reactive measures once the impacts
have appeared: subsidies for losses, mainly in agriculture and livestock, restrictions on
uses and the construction of new infrastructures to increase water supply (Del Moral
and Hernández-Mora 2017). In a situation characterized by productivism and
intervention in hydrological systems, for years not only the reactive approach of drought
management has been consolidated in Spain, but the appearance of each dry period has
been used to justify, legitimize and strengthen the consolidation of water supply policies
and the construction of infrastructures, as the only viable solution to address water
scarcity (Paneque 2015).
Due to the increase in losses due to drought, and despite the efforts made to mitigate
its impacts, in the last decades of the last century, the effectiveness of reactive
approaches to deal with droughts began to be questioned (Knutson et al. 1998; Wilhite
et al. 2000). The main critiques of this approach are: (i) the ineffectiveness of the
reactive approach to reduce the losses associated with droughts; (ii) the limitation of
solutions to technical aspects in whose design there is no evaluation of alternatives or
participation of interest groups; (iii) lack of capacity for reaction and adaptation through
application of emergency measures once the event has been presented; and (iv) the
emphasis on impacts rather than the underlying causes that determine them (Knutson
et al. 1998; Wilhite et al. 2000; Iglesias et al. 2007; Kallis 2008). In this sense, at the turn
of the 21st century, a new approach to deal with drought emerges. This approach is called
the risk management approach (Wilhite et al. 2000) and is oriented towards the
preparation, prevention and mitigation of impacts, which focuses on adaptation to
drought and not so much on emergency response (Knutson et al. 1998). While crisis

241
management only addresses the symptoms of drought as they manifest themselves in
the impacts, risk management focuses on identifying where the vulnerabilities are
(sectors, regions, communities or population groups) and systematically implements
mitigation and adaptation measures that reduce the risk associated with future
droughts. The risk management approach has been the central element of the main
strategies and guidelines developed by international organizations for risk drought
adaptation: Drought Risk Reduction. Framework and Practices (UNISDR 2009),
Guidelines for a national drought management policy (WMO and GWP, 2014), or Water
resources in Europe: how to cope with water scarcity and drought (EEA 2010). The main
tools presented by this approach are drought management plans, which are based on
monitoring and early warning systems, which make it possible to predict, detect, and
monitor the drought and thus implement different measures to be taken as the drought
progresses. In addition, this approach requires the integration of these types of events
within the hydrological planning, accepting the normality of the occurrence of droughts,
the questioning of water supply policies and the integration of communication and
environmental education. In Spain the institutions recognized, albeit with some
reluctance in practice, the need to adopt new approaches based on risk management
(Paneque 2015).
Considering the infectiveness of reactive approach to deal with drought as well as the
assumption about the normality of drought in the Spanish climate and the projections
provided by climate change models on the increase in the frequency and intensity of
droughts, it can no longer be regarded as an extraordinary event. Coinciding with the
arrival of the new century, the need to reorient the management of droughts towards
risk management strategies is recognized in the institutional sphere, although with
certain reticence still in practice (Paneque 2015). Three milestones represent the
paradigm shift in Spain: 1) the experience of the 1990s drought with more than 25% of
the population of the country affected by supply restrictions; 2) the entry into force of
the Water Framework Directive (WFD) in 2000, as well as its transposition to the Spanish
legal system through Law 63/2003 of November 30th. WFD introduces important changes
in the objectives of water resources management, moving from quantitative aspects,
towards qualitative role of get good condition of all the water bodies. Despite extreme
weather events (as drought) is not one of the priority objectives of the WFD (nor does it
incorporate any article specifically addressing the relative aspects to its management),
establishes that one of the objectives of hydrological planning must be prevent the
242
effects of floods and droughts (article 1), which is an opportunity to incorporate drought
management into planning and carry out preventive, short-term and recovery
management (La Calle 2007); 3) the approval of the PHN where referring to droughts
and as a novelty in the European context, its article 27 includes the requirement to draw
up Special Plans for Action in Situation of Alert and Eventual Drought (PES) and
Emergency Plans for urban supply systems of more than 20,000 inhabitants (PEM). This
milestone is recognized by the Ministry itself as the turning point that marks the change
of paradigm towards the management of droughts as risks and not as crisis (Paneque
2015).
2. Drought risk planning in Spain. Planning means anticipating the problem before this problem becomes unmanageable,
by identifying strengths and weaknesses and avoiding, as much as possible, crisis-
driven contingency measures. However, the notion that these plans may be capable of
confronting the problem single-handed, without a serious review of the prevailing water-
exploitation model can lead us to a false sense of security. In a country such as Spain,
where we cannot predict when the next drought will come, or how severe it will be, but
where we are certain that it will come, the only valid strategy for confronting drought is
to tackle vulnerability and improve . In order to achieve this, we must: 1) reduce the
sensitivity of systems by reducing consumption and adapting planning strategies to the
predicted effects of climate change; 2) presume that drought is a normal occurrence,
and that the frequency of episodes of drought will increase with climate change; and 3)
increase our ability to adapt and respond to this sort of event, that is, increase our
resilience.
Drought management plans can be defined as management tools that are based on the
establishment of a system of indicators that allows forecasting and tracking of the
evolution of a period of drought and thus establish a series of progressive measures
while the phenomenon advances. The objective is minimizing environmental, economic
and social impacts. As has already been done, according to article 27 of the PHN,
drought risk planning and management is articulated through the special action plans in
situation of alert and eventual drought (PES) in the field of river basin district and
Emergency Plans for urban supply systems (PEM) in the field of urban supply systems
of more than 20,000 inhabitants.

243
Spain, as a member of the European Union and since WFD is in force (2000), the
territorial and administrative organization of water management is carried out on the
basis of river basin districts, which includes “the area of land and sea, made up of one
or more neighbouring river basins together with their associated groundwaters and
coastal waters, which is identified under article 3(1) as the main unit for management
of river basins” (definition 15, WFD). In peninsular Spain there are 15 river basin
districts, ten of them managed by the Spanish Government, is the case of river basin
district that include more than one Autonomous Community (inter-community river
basin district) and five of them are managed by regional governments when the area of
a given river basin district includes just one Autonomous Community (intra-community
river basin district).
PES are prepared by basin authorities in the field of river basin district and must
incorporate the main indicators and thresholds that flag each stage of drought (normal,
pre-alert, alert and emergency), as well as exploitation rules and the measures to be
implemented concerning public ownership of water at each stage (art 27.2 LPHN). PES
are an important step forward in conceptual and operational terms, as they aim to
evaluate drought objectively and to implement progressive measures with which to
prevent droughts from becoming more severe (Estrela et al. 2016). In any case, the first
steps of this new policy have suffered from several teething problems:
1) PES were meant to be approved for 2005, but most of them were published in 2007,
while first-cycle hydrological plans (2009-2015) were published even later (some of
them as much as six years late). These hydrological plans must be incorporated into the
drought plans, but there is no guarantee that the targets and measures contemplated in
both will be compatible. The late publication and inadequate updating of PES makes
integrating current (but out-of-date) PES (2007) and second cycle hydrological planning
(2015-2021), published in late 2015, with up-to-date information concerning resource
inventories, demand, and especially ecological flows, very difficult.
2) Drought indicators in use are, in fact, indicators of scarcity. While indicators of
scarcity may be useful in assessing and comparing supply and demand, they fall short
of discriminating between ‘meteorological drought’ (caused by below-average rainfall)
and water scarcity related to reservoir and aquifer levels, which depend to a large extent
on the management model in place and the usage of water before and after rainfall
declined. As such, these plans are little more than contingency plans to address
244
shortcomings in supply, and are largely unrelated to meteorological drought. The WFD
permits the temporary deterioration of water bodies, but only in unforeseeable and
exceptional circumstances (article 4.6. WFD). Adjusting the indicators to ensure that the
reasons behind the deterioration of bodies of water are adequately accounted for is
essential for the correct implementation of the WFD.
3) In spite of the important advances introduced by PES, they contradict the fundamental
idea of integrating the risk in the management of resources, even during normal phases.
As Brufao (2012: 222) states, "they are basically contingency plans with measures to
apply when a drought situation has manifested, and therefore with limited to integrate
the necessary preventive measures to minimize the negative impacts of droughts in the
more general framework of the 'normality scenario', of hydrological planning, that is,
within the framework of the studies and drafting of the new River Basin Management
Plan in accordance with the FWD”.
In 2017, the Agricultural, Food and Environment Ministry (MAGRAMA) published a
technical guideline 22 concerning special drought plans and prolonged drought and
scarcity indicators (IT), which establish a number of rules for the updating of PES.
Certain basin authorities have already published drafts of updated PES (Imagen 1).
Imagen 1 – Administrative status of the PES of the Spanish peninsular river basin districts
22 Proyecto de Orden AAA/XXX/2017, de XX de XXXX, por la que se aprueba la instrucción
técnica para la elaboración de los planes especiales de sequía y la definición del sistema global
de indicadores de sequía prolongada y escasez.
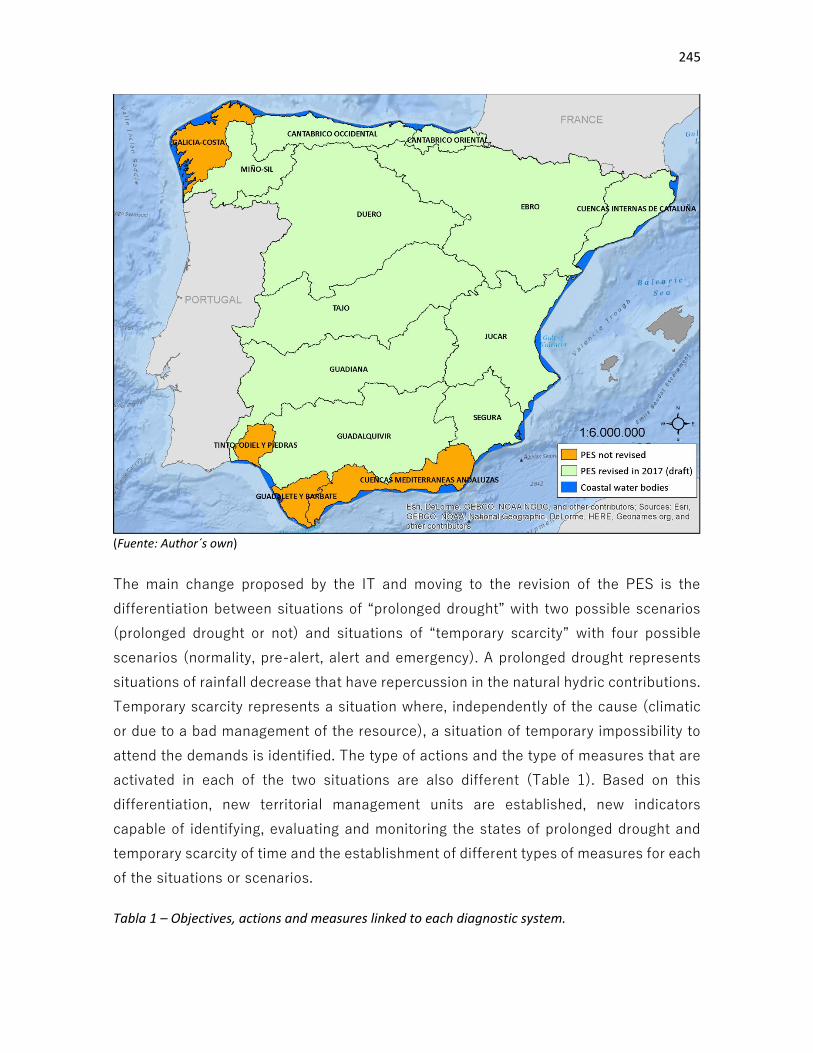
245
(Fuente: Author´s own)
The main change proposed by the IT and moving to the revision of the PES is the
differentiation between situations of “prolonged drought” with two possible scenarios
(prolonged drought or not) and situations of “temporary scarcity” with four possible
scenarios (normality, pre-alert, alert and emergency). A prolonged drought represents
situations of rainfall decrease that have repercussion in the natural hydric contributions.
Temporary scarcity represents a situation where, independently of the cause (climatic
or due to a bad management of the resource), a situation of temporary impossibility to
attend the demands is identified. The type of actions and the type of measures that are
activated in each of the two situations are also different (Table 1). Based on this
differentiation, new territorial management units are established, new indicators
capable of identifying, evaluating and monitoring the states of prolonged drought and
temporary scarcity of time and the establishment of different types of measures for each
of the situations or scenarios.
Tabla 1 – Objectives, actions and measures linked to each diagnostic system.

246
Diagnostic system Definition Index’s objective Typology of actions and measures that activate
Prolonged drought
Drought produced by exceptional circumstances or that could not reasonably have been foreseen. The identification of these circumstances is made by using indicators related to the lack of precipitation during a period of time taking into account aspects such as intensity and duration (definition 63. IPH).
Detecting a persistent and intense situation of rainfall reduction reflected in water contributions.
Admission of temporary deterioration of water bodies state due to natural causes. Reducing ecological flow regime.
Temporary scarcity
Temporary scarcity that even allowing the fulfilment of the criteria of guarantee in the attention of the demands recognized in the corresponding hydrological plan, temporarily limits the supply in a significant way.
Detecting the difficulties to attend water demands
Awareness and savings. Supplies restrictions and mobilization of resources. Enabling short-term systems of rights exchange. Increased environmental vigilance. Other management measures or exceptional and extraordinary that may result from application.
(Fuente: Translated from IT, 2017)
Moreover, new PES based on article 16 of the IT, allow declaring “exceptional situation
due to extraordinary drought”. The president of the river basin district may declare the
exceptional situation due to extraordinary drought when in one or more territorial units
one of the following situations is found: a) warning scenarios that coincide temporarily
with the prolonged drought or; b) emergency scenarios that coincide temporarily with
the prolonged drought or, without coinciding, are clearly affected after a passage
through it.
Finally, the publication of the IT drives the promotion for the development of PEM and
requires a diagnosis of the status of the PEM be included in the review of the PES.
Drafts of PES published in December 2017 identify 213 supply systems for urban areas
with over 20,000 inhabitants, which are required to provide a PEM. Although the deadline
for the publication of PES was 2005, only a few have been published and their impact
has therefore been very limited. No doubt it is one of the main pending challenges for
drought risk management in Spain.
3. Drought management plans in urban supply systems. The pending matter.
The publication of the new PES draft in December 2017 meant that progress could be
assessed, regarding PEM. The aim of PEM is to prevent drought from affecting urban
supply and thus are only concerned with urban areas. In Spain, municipalities have
control of the supply of drinking water to households and on the evacuation and
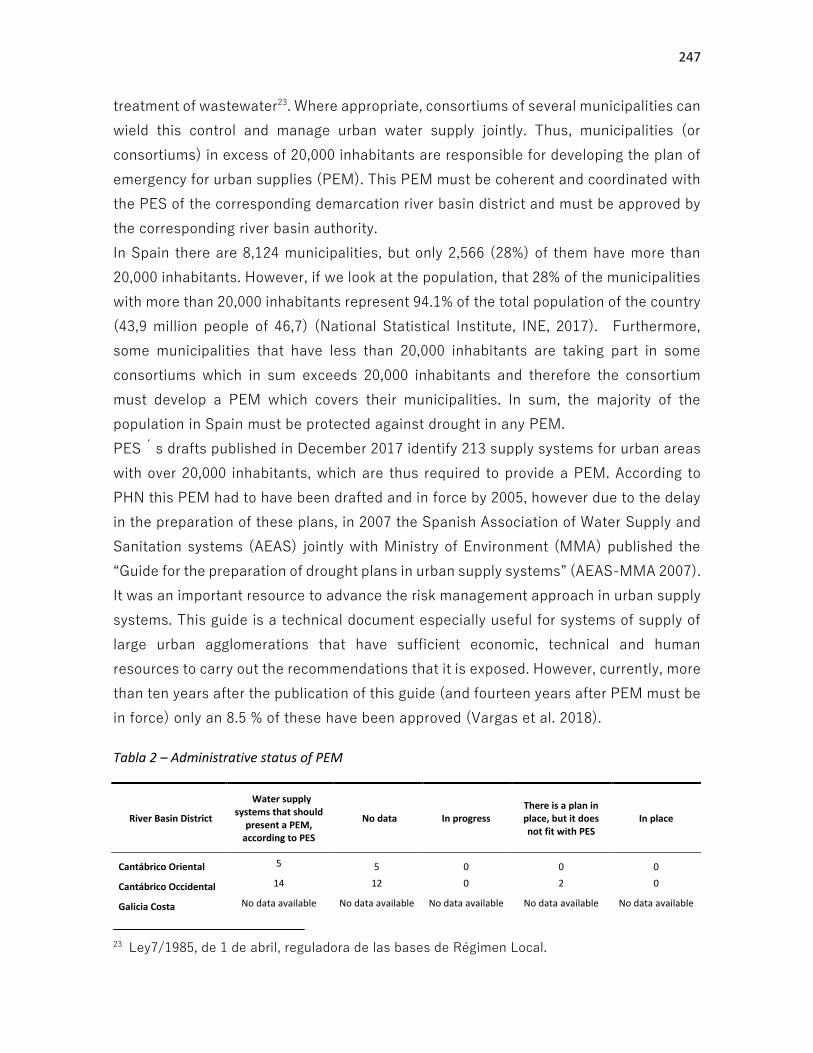
247
treatment of wastewater23. Where appropriate, consortiums of several municipalities can
wield this control and manage urban water supply jointly. Thus, municipalities (or
consortiums) in excess of 20,000 inhabitants are responsible for developing the plan of
emergency for urban supplies (PEM). This PEM must be coherent and coordinated with
the PES of the corresponding demarcation river basin district and must be approved by
the corresponding river basin authority.
In Spain there are 8,124 municipalities, but only 2,566 (28%) of them have more than
20,000 inhabitants. However, if we look at the population, that 28% of the municipalities
with more than 20,000 inhabitants represent 94.1% of the total population of the country
(43,9 million people of 46,7) (National Statistical Institute, INE, 2017). Furthermore,
some municipalities that have less than 20,000 inhabitants are taking part in some
consortiums which in sum exceeds 20,000 inhabitants and therefore the consortium
must develop a PEM which covers their municipalities. In sum, the majority of the
population in Spain must be protected against drought in any PEM.
PES´s drafts published in December 2017 identify 213 supply systems for urban areas
with over 20,000 inhabitants, which are thus required to provide a PEM. According to
PHN this PEM had to have been drafted and in force by 2005, however due to the delay
in the preparation of these plans, in 2007 the Spanish Association of Water Supply and
Sanitation systems (AEAS) jointly with Ministry of Environment (MMA) published the
“Guide for the preparation of drought plans in urban supply systems” (AEAS-MMA 2007).
It was an important resource to advance the risk management approach in urban supply
systems. This guide is a technical document especially useful for systems of supply of
large urban agglomerations that have sufficient economic, technical and human
resources to carry out the recommendations that it is exposed. However, currently, more
than ten years after the publication of this guide (and fourteen years after PEM must be
in force) only an 8.5 % of these have been approved (Vargas et al. 2018).
Tabla 2 – Administrative status of PEM
River Basin District
Water supply systems that should
present a PEM, according to PES
No data In progress There is a plan in place, but it does not fit with PES
In place
Cantábrico Oriental 5 5 0 0 0
Cantábrico Occidental 14 12 0 2 0
Galicia Costa No data available No data available No data available No data available No data available
23 Ley7/1985, de 1 de abril, reguladora de las bases de Régimen Local.

248
Miño‐Sil 5 5 0 0 0
Duero 15 9 6 0 0
Tajo 16 15 1 0 0
Guadiana 25 17 8 0 0
Tinto-Odiel-Piedras No data available No data available 0 No data available No data available
Guadalquivir 21 12 9 0 0
Guadalete-Barbate No data available No data available 0 No data available No data available
C. M. Andaluzas No data available No data available 0 No data available No data available
Segura 24 5 0 10 9
Júcar 69 54 0 9 6
Ebro 19 16 0 0 3
Cuencas internas de Cataluña No data available No data available 0 No data available No data available
Total 213,0 150,0 24,0 21,0 18,0
% 100,0 70,4 11,3 9,9 8,5
(Fuente: Vargas, et al, 2018)
As mentioned above, only 8.5% of the 213 systems identified have approved their PEM
according to current PES (2007); 11.3% of systems have already delivered their PEM,
and this is currently being evaluated by the relevant river basin authorities; 9.9 % have
a PEM in place, but the plans need to be revised and fitted to adapt the relevant PES,
either because it was published before the PES and, in consequence, does not follow
the PES guidelines, or because, despite the PEM being published after PES, the
indicators used do not fit those used in the relevant PES. Most systems (70.4%) have
not yet submitted their PEM to the river basin authority.
The development of these has encountered greater difficulties in small and medium
municipalities (less than 50.000 inhabitants), which are usually more vulnerable to
drought for several reasons: 1) they usually depend on more fragile water sources,
whether for reasons of quality or due to low diversity of sources, and this causes that
water sources respond worse to a period of drought; and 2) low performance and
efficiency of supply system infrastructures, due to poor infrastructure and low rates of
replacement, is a relevant factor especially to deal with drought.
Difficulties of these small and medium municipalities to alter the PEM can be the result
of several factors. On one hand, despite the important changes about risks perception,
drought is still viewed as an extraordinary event and the attitude of apathy returns once
the drought has passed. This attitude causes a lack of thought about drought until the

249
next one and therefore we do not work on drought planning when we should, which is
during normal meteorological situation. On the other hand, the elaboration of these PEM
requires minimum requirements (economic, technical and human) that for some
municipalities is difficult to deal with. In this sense, PHN has the same requirements for
a system such as the “Isabel II Chanel”, which supplies almost the entire autonomous
community of Madrid with a population of more than 6 million people, and the Puente
Genil municipality (Córdoba, Andalusia) that has 30,124 inhabitants (INE 2017).
Moreover, there is a great variety of water management models of the integral water
cycle in terms of administrative competences, sources of supply, or demographic and
socioeconomic characteristics. That makes it difficult to apply a common methodology
for the establishment of thresholds, indicators and measures for the preparation of
drought risk management plans.
Alternatively, a new Methodological Guide has recently been published: “Guide for the
participatory development of risk management plans for drought in small and medium-
sized municipalities” (Hernández-Mora and Vargas 2018). The objective of this Guide is
to strengthen the social and institutional capacities of small and medium-sized
municipalities (up to 50,000 inhabitants) and to manage droughts in a way that
minimizes their socio-economic and environmental impacts. For this, emphasis is placed
on risk management and not so much on emergency response, prioritizing the reduction
of vulnerability and applying a series of progressive measures as the phenomenon
progresses. To reduce the vulnerability to drought, the system must be improved in
periods of climatic normality so that when a drought appears the municipality is less
sensitive to suffering effects. In addition, for the development of drought plans, this
guide promotes an effective participatory process. Through a participatory methodology,
the social and institutional capacities are increased and therefore the resilience is
strengthened so that once a drought appears, the municipality will be able to better
resist its effects by applying the gradual measures presented by the PEM.
Conclusions
According to traditional water-management models, droughts are perceived as
extraordinary events. From this point of view reactive and contingency measures after
the effects of the event have developed have dominated drought risk strategies. This
interpretation has not dealt with drought effectively, but has legitimised expansionist
water policies which are based on constructing major infrastructures in order to increase
water supply and thus palliate water scarcity. However, given the normality of drought

250
in Spain and the climate change forecasts predicting the increase of frequency and
intensity of droughts in the near future, drought can no longer be perceived as an
extraordinary phenomenon. In contrast, droughts have to be regarded as a normal event
in Spain and thus drought management strategies must shift from crisis management
approaches to risk management.
The WFD represents an important advance in the way water resources management and
hydric risks are approached. On one hand, the directive promotes a change from
quantity-centered management to managing and maintaining the quality of water bodies
and associated ecosystems. On the other hand, it establishes the objective of ordinary
water planning, to mitigate the effects of droughts and floods. At the same time, as in a
pioneering way in Europe, the impulse received by Article 27. Drought management of
the PHN represents an important step forward for the establishment of the risk
management approach in Spain. Since this PHN, drought risk plans are the main tool to
cope with drought both at the river basin district level (PES) and at municipality level
(PEM). There have been important advances at river basin district level and on large
municipalities, however, there is still much to be done in small and medium-sized
population municipalities which are usually more vulnerable to drought.
Perception of droughts as exceptional events limits actions to simply applying
emergency measures, the diversity of management models of the integral water cycle
and the requirements of technical, economic and human resources are the main reasons
for explaining the low compliance with the obligation to develop PEM in systems of more
than 20,000 inhabitants. However, given the forecasts of climate change and the
vulnerability of small and medium-size municipalities, it is important that this issue be
updated. Only through an adequate elaboration of these plans based on prevention, the
anticipation, and the progressive application of measures, can we considerably reduce
the vulnerability of the municipalities to the effects of the drought and reinforce the
resilience of the municipality to cope with a drought and reduce the socio-economic and
environmental impacts can be increased.
Despite urban supply systems, drought plans are still an ongoing challenge in terms of
drought risk management in Spain, but some important recent changes represent an
opportunity to address it. On one hand, the recognition of relevant authorities about the
need to advance in the development of urban supply system through plans. This
recognition is evident both in the IT and in the revision of the river basin district drought

251
plans. On the other hand, the publication of the Guide for the participatory development
of risk management plans for drought in small and medium-sized municipalities. This
Guide facilitates the necessary tools and procedures so that municipalities with more
technical, economic and difficulties, which are at the same time the most vulnerable to
drought, are able to elaborate their own drought management plans.
References List
Arrojo, P. 2003. El Plan Hidrológico Nacional. Una cita frustrada con la historia.
Barcelona: RBA libros-integral.
Arrojo,P., and Naredo, José. Manuel. 1997. La gestión del agua en España y California.
Bilbao: Bakeaz.
Brufao, P. 2012. El régimen jurídico de las sequías: crítica a la regulación extraordinaria
y urgente de un fenómeno natural y cíclico propio del clima. Revista de Administración
Pública, 187: 199-239.
CEDEX (Centro de estudios hidrográficos) (2017a). Síntesis de los planes hidrológicos
españoles. Segundo ciclo de la DMA (2015‐2021). Dirección General del Agua.
Secretaria de Estado de Medio Ambiente. Madrid
CEDEX (Centro de estudios hidrográficos (2017b). Evolución del impacto del cambio
climático en los recursos hídricos y las sequías en España. Informe técnico para
Ministerio de Agricultura, Alimentación, Pesca y Medio Ambiente. Madrid.
CE (2007): Afrontar el desafío de la escasez de agua y la seguía en la Unión Europea.
Comunicación de la Comisión al Parlamento Europeo y el Consejo. (COM, 2007, 414).
Disponible en: https://eur-lex.europa.eu/legal-
content/ES/TXT/?uri=celex:52007DC0414
EEA (2/2009): Water resources across Europe — confronting water scarcity and drought.
EEA Report No 2/2009. ISSN 1725-9177. Copenhagen.
EEA (11/2012): Water resources in Europe in the context of vulnerability. EEA
Report No 11/2012. ISSN 1725-9177. Copenhagen.

252
EEA (2/2015): Extreme weather and climate in Europe. ETC/CCA Technical Paper N.
2/2015. Copenhagen.
EEA (1/2017): Climate change, impacts and vulnerability in Europe 2016. An indicator-
based report. EEA Report No 1/2017. ISSN 1977-8449. Copenhagen.
EEA (15/2017): Climate change adaptation and disaster risk reduction in Europe.
Enhancing coherence of the knowledge base, policies and practices. EEA Report No
15/2017. Copenhagen.
EEA (European Environmental Agency) (2012a). Water resources in Europe in context of
vulnerability. Copenhagen: Publications office.
Estevan, A. 2003. El Plan Hidrológico Nacional: destapando la olla. Archipiélago:
Cuadernos de crítica de la cultura, 57: 43-57.
De Castro, M., Martín-Vide, J., Sergio, A. 2005. El clima de España: Pasado, presente y
escenarios de clima para el siglo XXI. Madrid, España: Ministerio de Medio Ambiente.
Gómez Mendoza, J., & Ortega, Cantero, N. 1987. Geografía y regeneracionismo en
España. Sistemas, 77: 77-89.
Hernández-Mora, N y Vargas, J. (coord.) 2018. Guía metodológica para la elaboración
participada de planes de gestión de riesgo por sequía en pequeñas y medianas
poblaciones. Zaragoza, España: Fundación Nueva Cultura del Agua.
Iglesias, A., Moneo, M. and Quiroga, S. 2007. Methods for evaluating social vulnerability
to drought. In Coping with Drought Risk in Agriculture and Water Supply Systems.
Advances in Natural and Technological Hazards Research, ed. Iglesias A.,
Cancelliere A., Wilhite D.A., Garrote L., Cubillo F., 153-159. Dordrecht: Springer.
IPCC (2014): Cambio climático 2014: Impactos, adaptación y vulnerabilidad – Resumen
para responsables de políticas. Contribución del Grupo de trabajo II al Quinto Informe
de Evaluación del Grupo Intergubernamental de Expertos sobre el Cambio Climático
[Field, C.B., V.R. Barros, D.J. Dokken, K.J. Mach, M.D. Mastrandrea, T.E. Bilir, M.

253
Chatterjee, K.L. Ebi, Y.O. Estrada, R.C. Genova, B. Girma, E.S. Kissel, A.N. Levy, S.
MacCracken, P.R. Mastrandrea y L.L. White (eds.)]. Organización Meteorológica
Mundial, Ginebra, Suiza, 34 págs. (en árabe, chino, español, francés, inglés y ruso).
Kallis, G. 2008. Droughts. Annual Review of Environment and Resources, 33: 85-118.
Knutson, C., Hayes, M. J., & Philips, T. 1998. How to Reduce Drought Risk, Western
Drought Coordination Council report.
La Calle, A. 2007. Sequía y adaptación de la Directiva del Agua. In La Sequía en España.
Directrices para Minimizar su Impacto. Madrid: Ministerio de Medio Ambiente, 87-103.
López Ontiveros, A. 1998. El regadío, salvación a la patria y fuente de felicidad según los
congresos nacionales de riesgos (1913-1934). Demófilo. Revista cultura Tradicional de
Andalucía, 27: 27-64.
Martín-Vide, J. 1996. Decálogo de la pluviometría española, clima y agua. In III Reunión
Nacional de Climatología, Grupo de Climatología de la A.G.E., ed. Marzol, J., 15-24.
MMA – AEAS (Ministerio de Medio Ambiente y Asociación Española de Abastecimiento
y Saneamiento) (2007): Guía para la elaboración de planes de emergencia por sequía en
sistemas de abastecimiento urbano. Madrid, España.
Morales Gil, A., Olcina Cantos, J. and Rico Amorós, A. M. 2000. Diferentes percepciones
de la sequía en España: adaptación, catastrofismo e intentos de correcciones.
Investigaciones Geográficas, 23: 5-46.
Naredo, J. M. 1997a. La gestión del agua en España. Revista de Occidente, 194/195: 92-
114.
Blanco Romero, J.L 1997b. Problemática de la gestión del agua en España. In La
economía del agua en España. Ed. Naredo, J. M, 211-214. Madrid: Fundación Argentaria.
Olcina cantos, J. 2006. ¿Riesgos naturales? I. Sequías e inundaciones. Mataró. Davinci
Continental, 2 volúmenes. Colección Geoambiente XXI.

254
Olcina cantos, J. 2008. Prevención de riesgos: cambio climático, sequías e
inundaciones. (Panel científico-técnico de seguimiento de la política del agua).
Zaragoza. Fundación Nueva Cultura del Agua.
Ortega Cantero, N. 1992. El Plan Nacional de Obras Hidráulicas, in Hitos históricos de
los regadíos españoles., Ed. Gil Olcina, A., and Morales, 335-364. Madrid: Ministerio
de Agricultura, Pesca y Alimentación.
Paneque, Pilar. 2015. Drought Management Strategies in Spain. Water 7 (12): 6.689–
6.701.
Pita López, M.F. 1989. La sequía como riesgo natural: Su incidencia en el ámbito
español. Boletín de la Asociación de Geógrafos Españoles, Nº. 10: 21-40. 1990.
Quiroga, S., Garrote, I., Iglesias, A. Fernández-Haddad, Z., Schlickenrieder, J. De Lam,
B., Mosso, C. y Sanchez-Arcilla, A. 2011. The economic value of drought information for
water management under climate change: a case study in the Ebro Basin. Natural
Hazards and Earth System Sciences, 11: 1-15.
Saurí, D. & Del Moral. L. 2001. Recent developments in Spanish Water Policy.
Alternatives and conflicts and the end of the hydraulic age. Geoforum, 32: 351-362.
Swyngedouw, E. 1999. Modernity and hybridity: Regeneracionismo, the production of
nature and the Spanish waterscape, 1890–1930. Annanls of the American Association of
Geographers, 89: 443– 465.
Swyngedouw, E. 2007. Technonatural revolutions: The scalar politics of Franco’s hydro-
social dream for Spain,1939–1975. Transactions of the Institute of British Geographers,
32: 9- 28.
UNISDR (United Nation Office for Disaser Risk Reduction) (2005): Living with risk: a
global review of disaster reduction initiatives.
Vargas, Jesús., La Calle, Abel., Hernández-Mora, Nuria., and Paneque, Pilar. 2018.
Gestión de sequías en España. Retos y oportunidades de la gestión y planificación de

255
sequías en pequeñas y medianas poblaciones. Zaragoza, España. Fundación Nueva
Cultura del Agua.
Vicente-Serrano, S. M. 2006. Differences in spatial patterns of drought on different time
scales: an analysis of the Iberian Peninsula. Water Resources Management, 20: 37-60
Wilhite, D. A. 2002. Combating Drought through Preparedness. Natural Resources
Forum, 26 (4): 275-285.
Wilhite, D.A., Hayes, M., Knutson, C. & Smith, K. H. 2000. Planning for drought: Moving
from crisis to risk management, Journal of the American Water Resources Association,
36 (4): 697-710.
WMO y GWP (World Metheori¡ological Organization y Global Water Partnership). 2014.
National Drought Management Policy Guidelines A Template for Action. Wilhite, D.A.
(ed.) Integrated Drought Management Programme (IDMP) Tools and Guidelines Series
1. WMO, Geneva, Switzerland and GWP, Stockholm, Sweden.
Conclusions
Challenges and opportunities identified in each of the CARE + Project countries present
several differences.These differences are due mainly to the different territorial, social,
economic, physical, cultural and technological realities among different countries, which are
also exposed to hazards of very different natures. Throughout the chapters of this book local
frameworks and some resilient experiences that allow analyzing specific challenges and
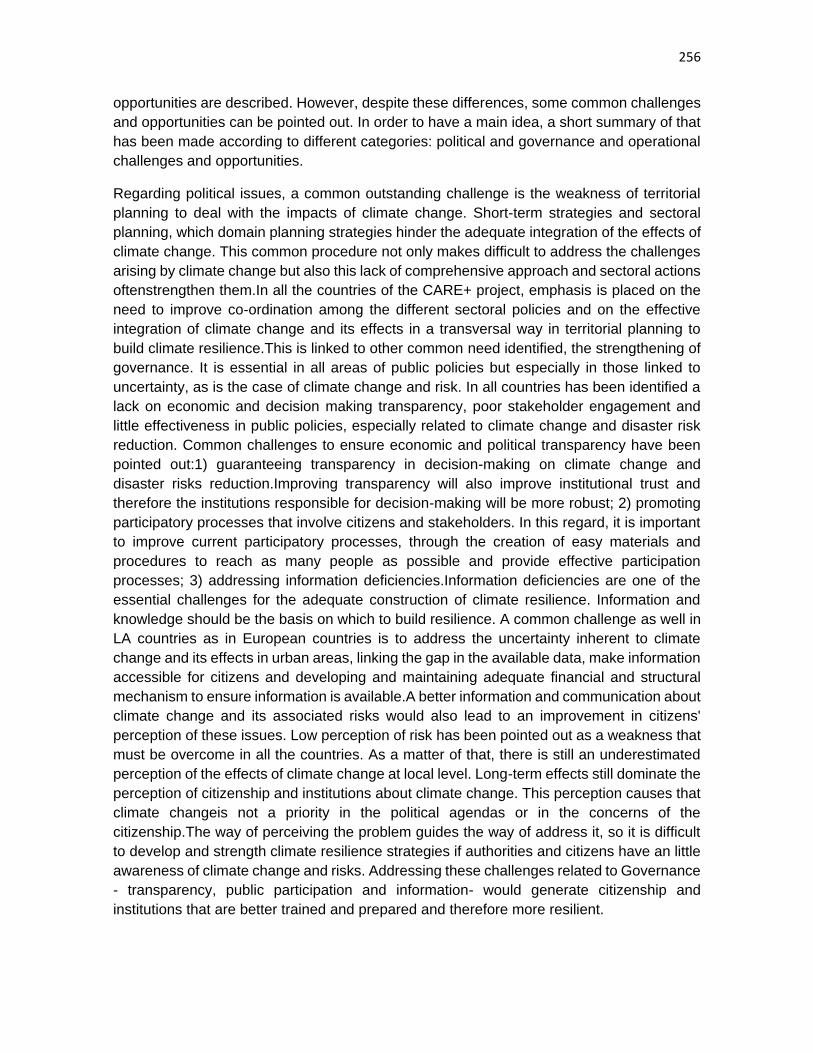
256
opportunities are described. However, despite these differences, some common challenges
and opportunities can be pointed out. In order to have a main idea, a short summary of that
has been made according to different categories: political and governance and operational
challenges and opportunities.
Regarding political issues, a common outstanding challenge is the weakness of territorial
planning to deal with the impacts of climate change. Short-term strategies and sectoral
planning, which domain planning strategies hinder the adequate integration of the effects of
climate change. This common procedure not only makes difficult to address the challenges
arising by climate change but also this lack of comprehensive approach and sectoral actions
oftenstrengthen them.In all the countries of the CARE+ project, emphasis is placed on the
need to improve co-ordination among the different sectoral policies and on the effective
integration of climate change and its effects in a transversal way in territorial planning to
build climate resilience.This is linked to other common need identified, the strengthening of
governance. It is essential in all areas of public policies but especially in those linked to
uncertainty, as is the case of climate change and risk. In all countries has been identified a
lack on economic and decision making transparency, poor stakeholder engagement and
little effectiveness in public policies, especially related to climate change and disaster risk
reduction. Common challenges to ensure economic and political transparency have been
pointed out:1) guaranteeing transparency in decision-making on climate change and
disaster risks reduction.Improving transparency will also improve institutional trust and
therefore the institutions responsible for decision-making will be more robust; 2) promoting
participatory processes that involve citizens and stakeholders. In this regard, it is important
to improve current participatory processes, through the creation of easy materials and
procedures to reach as many people as possible and provide effective participation
processes; 3) addressing information deficiencies.Information deficiencies are one of the
essential challenges for the adequate construction of climate resilience. Information and
knowledge should be the basis on which to build resilience. A common challenge as well in
LA countries as in European countries is to address the uncertainty inherent to climate
change and its effects in urban areas, linking the gap in the available data, make information
accessible for citizens and developing and maintaining adequate financial and structural
mechanism to ensure information is available.A better information and communication about
climate change and its associated risks would also lead to an improvement in citizens'
perception of these issues. Low perception of risk has been pointed out as a weakness that
must be overcome in all the countries. As a matter of that, there is still an underestimated
perception of the effects of climate change at local level. Long-term effects still dominate the
perception of citizenship and institutions about climate change. This perception causes that
climate changeis not a priority in the political agendas or in the concerns of the
citizenship.The way of perceiving the problem guides the way of address it, so it is difficult
to develop and strength climate resilience strategies if authorities and citizens have an little
awareness of climate change and risks. Addressing these challenges related to Governance
- transparency, public participation and information- would generate citizenship and
institutions that are better trained and prepared and therefore more resilient.

257
In addition to these issues, a series of operational challenges have also been identified: 1)
limited capabilities to cope with climate change effects, especially at local level. In this sense,
there are many differences between some countries and others and also within the countries
themselves. Local level does not always have the economic, technical and human resources
to face the challenges posed by climate change as the development of climate resilience
strategies; 2) In spite of important theoretical improvements about climate resilience, a lack
of operational frameworks to analyze and strength resilience has been pointed out.
However, developing common operational frameworks is difficult if not impossible due to the
different territorial realities of application of each of the countries. In this regard, developing
local strategies and exchanging experiences to develop common tools has agreed as a good
way to address it.Greater financial resources to resilient infrastructures investment and the
training of experts in the field is one of the common challenges identified. 3)The is a weak,
trough growing experiences adopting urban resilience strategies. The debate on resilience
is still an incipient debate, which although it has already been established in the
maininternational organizations in charge of dealing with climate change and disaster risk
reduction (UNISDR, World Bank, UNASUR, European Environmental Agency, etc..), is still
landing at the local level.In this sense, more and more cities are takingpart on different
resiliencecities in networks (Resilient Cities World Campaign, UNISDR, Resilient Cities
Network, ONU-HABITAT or100 Resilient CitiesNetwork, Rockefeler Foundation). Taking
part in these networks is an important input both economically, as some of these networks
have funding aids, as in the learning generated by the experience exchange.

258

259

260

261

262