d1.2 state of the art review and taxonomy of existing knowledge
174
Copyright by the EU-CIRCLE consortium, 2015-2018 EU-CIRCLE is a project that has received funding from the European Union’s Horizon 2020 research and innovation programme under grant agreement No 653824. Please see http://www.eu- circle.eu/for more information. DISCLAIMER: This document contains material, which is the copyright of EU-CIRCLE consortium members and the European Commission, and may not be reproduced or copied without permission, except as mandated by the European Commission Grant Agreement no. 653824 for reviewing and dissemination purposes. The information contained in this document is provided by the copyright holders "as is" and any express or implied warranties, including, but not limited to, the implied warranties of merchantability and fitness for a particular purpose are disclaimed. In no event shall the members of the EU-CIRCLE collaboration, including the copyright holders, or the European Commission be liable for any direct, indirect, incidental, special, exemplary, or consequential damages (including, but not limited to, procurement of substitute goods or services; loss of use, data, or profits; or business interruption) however caused and on any theory of liability, whether in contract, strict liability, or tort (including negligence or otherwise) arising in any way out of the use of the information contained in this document, even if advised of the possibility of such damage. D1.2 STATE OF THE ART REVIEW AND TAXONOMY OF EXISTING KNOWLEDGE Contractual Delivery Date: 05/2016 Actual Delivery Date: 18/07/2016 Type: Report Version: 1.0 Dissemination Level: Public Deliverable Statement This report provides an extensive assessment of the impacts from climate hazards and extreme weather on critical infrastructures, on a categorised way. Also existing regulatory frameworks, national and international policies on CI protection are discussed. The work also describes databases related to the project scope.
-
Upload
khangminh22 -
Category
Documents
-
view
3 -
download
0
Transcript of d1.2 state of the art review and taxonomy of existing knowledge

Copyright by the EU-CIRCLE consortium, 2015-2018
EU-CIRCLE is a project that has received funding from the European Union’s Horizon 2020 research and innovation programme under grant agreement No 653824. Please see http://www.eu-circle.eu/for more information.
DISCLAIMER: This document contains material, which is the copyright of EU-CIRCLE consortium members and the European Commission, and may not be reproduced or copied without permission, except as mandated by the European Commission Grant Agreement no. 653824 for reviewing and dissemination purposes.
The information contained in this document is provided by the copyright holders "as is" and any express or implied warranties, including, but not limited to, the implied warranties of merchantability and fitness for a particular purpose are disclaimed. In no event shall the members of the EU-CIRCLE collaboration, including the copyright holders, or the European Commission be liable for any direct, indirect, incidental, special, exemplary, or consequential damages (including, but not limited to, procurement of substitute goods or services; loss of use, data, or profits; or business interruption) however caused and on any theory of liability, whether in contract, strict liability, or tort (including negligence or otherwise) arising in any way out of the use of the information contained in this document, even if advised of the possibility of such damage.
D1.2 STATE OF THE ART REVIEW AND TAXONOMY OF EXISTING KNOWLEDGE
Contractual Delivery Date: 05/2016 Actual Delivery Date: 18/07/2016
Type: Report
Version: 1.0
Dissemination Level: Public Deliverable
Statement
This report provides an extensive assessment of the impacts from climate hazards and extreme weather on critical infrastructures, on a categorised way. Also existing regulatory frameworks, national and international policies on CI protection are discussed. The work also describes databases related to the project scope.
D1.2 State of the art review and taxonomy of existing knowledge
Grand Agreement 653824 DISSEMINATION LEVEL Page I
Preparation Slip
Name Partner Date
From Michael Skitsas ADITESS 01/07/2016
Reviewer Nenad Petrovic UVG 13/07/2016
Reviewer
For delivery Thanasis Sfetsos NCSRD 18/07/2016
Document Log
Issue Date Comment Author / Organization
V0.1 19/10/2015 Deliverable Structure NCSRD, ADITESS
V0.2 15/03/2016 Energy Sector, Chemical Sector EUC, D’APP, ADITESS
V0.3 30/03/2016 Water Systems, ICT Sector NCSRD, UVG, ADITESS
V0.4 15/04/2016 Transportation MRK, Fraunhofer
V0.5 30/04/2016 Public Sector KEMEA
V0.6 30/04/2016 First Draft ADITESS
V0.7 10/05/2016 Comments and additions All partners
V0.8 01/06/2016 Comments and Input after internal review
ADITESS
V0.9 13/07/2016 Review of D1.2 UVG
V1.0 18/07/2016 Final Version ADITESS, NCSRD
List here the changes and their rational for each release
D1.2 State of the art review and taxonomy of existing knowledge
Grand Agreement 653824 DISSEMINATION LEVEL Page II
Executive Summary
EU-CIRCLE‘s scope is to derive an innovative framework for supporting the interconnected European Infrastructure‘s resilience to climate pressures, as well to generate scientifically truthful and validated knowledge on the potential impacts of climate. In a like manner, first step of this effort should be to review and taxonomy of the existing knowledge in order to provide an extensive assessment of the impacts from climate hazards and extreme weather on critical infrastructures, on a categorized way. This deliverable, D1.2 state of the art review and taxonomy of existing knowledge, by the contribution of consortium partners as well as the stakeholder’s infrastructure owners, the national policy bodies, financial sector and scientific community developed and extend an existing pool of knowledge, such as, climate hazards and their impacts, defined and implemented customized impact assessment models and generic frameworks.
Critical infrastructures such as telecommunications, electric power generation and transmission, chemical industry, water supply systems, transportation, ICT networks and emergency services have become the components of a larger interconnected system. A disruption in one infrastructure has ripple effects into other infrastructures and eventually impacts the community and the broader economy. For each one of the CI sector a review about the climate changes and their impact is performed. In particular, the potential consequences and impacts of climate phenomena such as temperature, extreme winds, floods, wild fires, etc. are presented. Furthermore, for each sector, a relevant risk assessment, resilience strategies as well as a climate change adaptation framework are also provided. In terms of a practical manner, climate impacts on each Critical Infrastructure type and sub-type have been examined and provided on the ANNEXES part of this deliverable.
Furthermore, in this deliverable an extensive analysis of related EU-Funded and international projects as well as holistic frameworks on CI risk and resilience assessment due to climate change are included. Finally, last section of this deliverable, provides the state of the art overview of risk assessment data and modelling tools including open access software packages for natural hazards.
D1.2 State of the art review and taxonomy of existing knowledge
Grand Agreement 653824 DISSEMINATION LEVEL Page III
Table of Contents
EXECUTIVE SUMMARY ........................................................................................................................... II
TABLE OF CONTENTS ............................................................................................................................. III
LIST OF FIGURES ................................................................................................................................... VII
LIST OF TABLES ...................................................................................................................................... IX
1 INTRODUCTION .............................................................................................................................. 1
1.1 Methodology ..................................................................................................................................... 2
2 RELATED EU FUNDED AND INTERNATIONAL PROJECTS .................................................................... 3
3 HOLISTIC FRAMEWORKS ON CI RISK AND RESILIENCE ASSESSMENT DUE TO CLIMATE CHANGE ......... 6
3.1 Federal Emergency Management Agency (FEMA) .......................................................................... 12
3.2 Federal high way administration (FHWA) ....................................................................................... 13
3.3 The disaster resilience of Place (DROP) program ............................................................................ 14
3.4 UK study ........................................................................................................................................... 15
4 INTRODUCTION TO CI SECTORS ..................................................................................................... 17
4.1 Energy production and distribution systems................................................................................... 21
4.1.1 Potential Consequences & Impacts ............................................................................................................. 21
4.1.2 Risk assessment .......................................................................................................................................... 24
4.1.3 Resilience strategies .................................................................................................................................... 26
4.1.4 Climate change adaptation on CI sector ..................................................................................................... 27
4.1.5 Sector interdependencies ............................................................................................................................ 29
4.2 Chemical Industry ............................................................................................................................ 31
4.2.1 Potential Consequences & Impacts ............................................................................................................. 33
4.2.2 Risk assessment .......................................................................................................................................... 37
4.2.3 Resilience strategies .................................................................................................................................... 39
4.2.4 Climate change adaptation on CI sector ..................................................................................................... 41
4.2.5 Sector interdependencies ............................................................................................................................ 41
4.3 Water System .................................................................................................................................. 43
4.3.1 Potential Consequences & Impacts ............................................................................................................. 44
4.3.2 Risk assessment .......................................................................................................................................... 45
4.3.3 Resilience strategies .................................................................................................................................... 46
4.3.4 Climate change adaptation on CI sector ..................................................................................................... 48
4.3.5 Sector interdependencies ............................................................................................................................ 48
4.4 Transportation ................................................................................................................................. 51
4.4.1 Potential Consequences & Impacts ............................................................................................................. 51
4.4.2 Risk assessment .......................................................................................................................................... 53
4.4.3 Resilience strategies .................................................................................................................................... 54
4.4.4 Climate change adaptation on CI sector ..................................................................................................... 56
4.4.5 Sector interdependencies ............................................................................................................................ 57
4.5 ICT networks .................................................................................................................................... 58
4.5.1 Potential Consequences & Impacts ............................................................................................................. 58
4.5.2 Risk assessment .......................................................................................................................................... 62
D1.2 State of the art review and taxonomy of existing knowledge
Grand Agreement 653824 DISSEMINATION LEVEL Page IV
4.5.3 Resilience strategies .................................................................................................................................... 62
4.5.4 Climate change adaptation on CI sector ..................................................................................................... 62
4.5.5 Sector interdependencies ............................................................................................................................ 63
4.6 Public sector .................................................................................................................................... 65
4.6.1 Potential Consequences & Impacts ............................................................................................................. 65
4.6.2 Risk assessment .......................................................................................................................................... 66
4.6.3 Resilience strategies .................................................................................................................................... 69
4.6.4 Climate change adaptation on CI sector ..................................................................................................... 71
4.6.5 Sector interdependencies ............................................................................................................................ 74
5 RELATED SOFTWARE ..................................................................................................................... 76
6 CONCLUSIONS .............................................................................................................................. 79
7 BIBLIOGRAPHY ............................................................................................................................. 80
A. ANNEX - ENERGY PRODUCTION & DISTRIBUTION SYSTEMS ............................................................ 91
1. Electric power generation & transmission .......................................................................................... 91
i. Temperature .................................................................................................................................................... 93
ii. Extreme precipitation ...................................................................................................................................... 95
iii. Floods .............................................................................................................................................................. 95
iv. Landslides ........................................................................................................................................................ 96
v. Snowfall ........................................................................................................................................................... 98
vi. Extreme winds ................................................................................................................................................. 99
vii. Sea level rise .............................................................................................................................................. 100
viii. Drought ..................................................................................................................................................... 100
ix. Wildfires ........................................................................................................................................................ 101
2. Oil plants ............................................................................................................................................ 102
i. Temperature .................................................................................................................................................. 103
ii. Extreme precipitation .................................................................................................................................... 104
iii. Floods ............................................................................................................................................................ 104
iv. Landslides ...................................................................................................................................................... 104
v. Snowfall ......................................................................................................................................................... 106
vi. Extreme winds ............................................................................................................................................... 106
vii. Sea level rise .............................................................................................................................................. 107
viii. Drought ..................................................................................................................................................... 108
ix. Wildfires ........................................................................................................................................................ 109
B. ANNEX- CHEMICAL INDUSTRY ..................................................................................................... 110
i. Temperature .................................................................................................................................................. 110
ii. Extreme precipitation .................................................................................................................................... 110
iii. Floods ............................................................................................................................................................ 110
iv. Landslides ...................................................................................................................................................... 111
v. Sea level rise .................................................................................................................................................. 111
C. ANNEX- WATER SYSTEM ............................................................................................................. 112
1. Drinking water ................................................................................................................................... 112
i. Temperature .................................................................................................................................................. 113
ii. Extreme precipitation .................................................................................................................................... 115
D1.2 State of the art review and taxonomy of existing knowledge
Grand Agreement 653824 DISSEMINATION LEVEL Page V
iii. Floods ............................................................................................................................................................ 116
iv. Landslides ...................................................................................................................................................... 118
v. Snowfall ......................................................................................................................................................... 119
vi. Extreme winds ............................................................................................................................................... 119
vii. Sea level rise .............................................................................................................................................. 119
viii. Drought ..................................................................................................................................................... 120
2. Wastewater ....................................................................................................................................... 122
i. Temperature .................................................................................................................................................. 122
ii. Extreme precipitation .................................................................................................................................... 123
iii. Floods ............................................................................................................................................................ 124
iv. Landslides ...................................................................................................................................................... 125
v. Snowfall ......................................................................................................................................................... 125
vi. Sea level rise .................................................................................................................................................. 125
vii. Drought ..................................................................................................................................................... 126
D. ANNEX- TRANSPORTATION ......................................................................................................... 128
1. Road network .................................................................................................................................... 128
i. Temperature .................................................................................................................................................. 129
ii. Extreme precipitation .................................................................................................................................... 129
iii. Floods ............................................................................................................................................................ 130
iv. Landslides ...................................................................................................................................................... 130
v. Snowfall ......................................................................................................................................................... 132
vi. Extreme winds ............................................................................................................................................... 132
vii. Wildfires .................................................................................................................................................... 132
2. Railway network ................................................................................................................................ 133
i. Temperature .................................................................................................................................................. 134
ii. Extreme precipitation .................................................................................................................................... 134
iii. Floods ............................................................................................................................................................ 135
iv. Landslides ...................................................................................................................................................... 135
v. Snowfall ......................................................................................................................................................... 136
vi. Extreme winds ............................................................................................................................................... 136
vii. Sea level rise .............................................................................................................................................. 136
viii. Wildfires .................................................................................................................................................... 137
3. Aviation .............................................................................................................................................. 137
i. Temperature .................................................................................................................................................. 139
ii. Extreme precipitation .................................................................................................................................... 139
iii. Floods ............................................................................................................................................................ 139
iv. Snowfall ......................................................................................................................................................... 139
v. Extreme winds ............................................................................................................................................... 140
vi. Wildfires ........................................................................................................................................................ 140
4. Maritime ............................................................................................................................................ 140
i. Temperature .................................................................................................................................................. 142
ii. Extreme precipitation .................................................................................................................................... 142
iii. Floods ............................................................................................................................................................ 142
iv. Landslides ...................................................................................................................................................... 143
D1.2 State of the art review and taxonomy of existing knowledge
Grand Agreement 653824 DISSEMINATION LEVEL Page VI
v. Snowfall ......................................................................................................................................................... 144
vi. Extreme winds ............................................................................................................................................... 144
vii. Sea level rise .............................................................................................................................................. 144
viii. Drought ..................................................................................................................................................... 145
E. ANNEX- ICT NETWORKS .............................................................................................................. 146
i. Temperature .................................................................................................................................................. 146
ii. Extreme precipitation .................................................................................................................................... 146
iii. Floods ............................................................................................................................................................ 147
iv. Landslides ...................................................................................................................................................... 148
v. Snowfall ......................................................................................................................................................... 148
vi. Extreme winds ............................................................................................................................................... 149
vii. Sea level rise .............................................................................................................................................. 149
F. ANNEX- BUILDINGS ..................................................................................................................... 150
i. Temperature .................................................................................................................................................. 151
ii. Extreme precipitation .................................................................................................................................... 152
iii. Floods ............................................................................................................................................................ 154
iv. Landslides ...................................................................................................................................................... 159
v. Snowfall ......................................................................................................................................................... 159
vi. Extreme winds ............................................................................................................................................... 161
vii. Drought ..................................................................................................................................................... 163
viii. Wildfires .................................................................................................................................................... 164
D1.2 State of the art review and taxonomy of existing knowledge
Grand Agreement 653824 DISSEMINATION LEVEL Page VII
List of Figures
Figure 1 Overview of climate related impacts on infrastructures ...................................................................................... 1 Figure 2 Risk equation ........................................................................................................................................................ 6 Figure 3 Damage Ratio ........................................................................................................................................................ 7 Figure 4 Example of a qualitative risk matrix to determine a level of risk ......................................................................... 8 Figure 5 Quantitative method for estimating risk (Standards Australia/New Zealand, 2004, p50-52) .............................. 8 Figure 6 Semi-quantitative method for estimating risk. ‘Frequency’ is equivalent to ‘likelihood’ used in the text ........... 8 Figure 7 Risk Matrix ............................................................................................................................................................ 9 Figure 8 Individual risk curves for different hazards (earthquakes – EQ, floods – FL, windstorms – WS) [15] ................ 10 Figure 9 The "traditional" disaster cycle and the role of risk assessment [16] ................................................................. 11 Figure 10 Summary of definitions used in the GIS-based risk assessment [16] ............................................................... 12 Figure 11 Basic function of risk, which can be divided into the components of hazard, the vulnerability, and the
amount of elements at risk that are exposed to the hazard [16] ............................................................................ 12 Figure 12 Relative importance of main hazard types per continent ................................................................................ 15 Figure 13 Key observed and projected climate change and impacts for the main regions in Europe ............................. 17 Figure 14 An illustration of infrastructure interdependencies [24] .................................................................................. 18 Figure 15 List of Climate Hazards’ Impacts of European Infrastructures [6] [22] ............................................................. 20 Figure 16 Hazard assessment per CI type ......................................................................................................................... 21 Figure 17 Examples of illustrative technology opportunities to build more climate resilient energy critical
infrastructures [46] .................................................................................................................................................. 26 Figure 18 Overview on steps taken within the circle of plan-do-check-and-act concerning site-related and GIS-based
approaches [43] ....................................................................................................................................................... 27 Figure 19 Concentrating solar power plant in the Mojave Desert [51] ............................................................................ 28 Figure 20 Giordano [49] adapted from Walker et al. [52] ................................................................................................ 29 Figure 21 Anticipated climate change impacts on electricity infrastructures [57] ........................................................... 30 Figure 22 Bulk tanking: an important part of the oil and liquid chemical supply chain ................................................... 32 Figure 23 Natech accidents over the period 1992 to 2012 .............................................................................................. 34 Figure 24 Events Involving Special Circumstances (1990 to 2002; 2003 to 2015) ............................................................ 35 Figure 25 RNRA Methodology [71] ................................................................................................................................... 38 Figure 26 Overview of the sectors dependencies and interdependencies (Adapted from NIPP DHL) ............................. 42 Figure 27 Movement of water in urban environment [79] .............................................................................................. 44 Figure 28 A schematic outline of some of the interdependencies between critical infrastructure sectors [95] ............. 49 Figure 29 Example of infrastructure interdependencies [97] ........................................................................................... 50 Figure 30 Risk analysis matrix ........................................................................................................................................... 54 Figure 31 Resilience strategies ......................................................................................................................................... 55 Figure 32 Potential climate change impacts and effects on the ICT sector [118] ............................................................ 59 Figure 33 Critical Interdependencies in UK national infrastructure [122] ........................................................................ 63 Figure 34 Infrastructure interdependencies between sectors (and ICT) [123] ................................................................ 64 Figure 35 Mapping Climate Impacts on Hospitals & Health ............................................................................................. 65 Figure 36 Assess Preparedness ......................................................................................................................................... 69 Figure 37 Conceptual framework of a resilient system [114] .......................................................................................... 70 Figure 38 Conceptual presentation of health risks due to climate change and the potential for risk reduction through
adaptation [129] ...................................................................................................................................................... 73 Figure 39 CI Sectors interdependencies, with respect to Emergency Services ................................................................ 75 Figure 40 The purpose and general flood damage, fragility, and/or functionality Information embedded in each of the
7 EU-flood impact models [132] .............................................................................................................................. 77 ANNEX A-F Figure 41 An example of n-th-order infrastructure interdependencies (adapted from [5]) ............................................ 91 Figure 42 Overview of climate impacts on electricity demand, supply and transmission by type of climatic change [135]
................................................................................................................................................................................. 92 Figure 43 Thresholds for extreme weather events (according to the [136] and [137]) ................................................... 92
D1.2 State of the art review and taxonomy of existing knowledge
Grand Agreement 653824 DISSEMINATION LEVEL Page VIII
Figure 44 Relative output loss due to thermodynamic losses and auxiliary power needed for the cooling system. Approximation based on [140] ................................................................................................................................ 93
Figure 45 Permissible KVA loading for varying ambient Temperature for self-cooled transformers for normal life expectancy [142] ...................................................................................................................................................... 94
Figure 46 Schematic structure of a cooling system model with the most relevant components [144] ........................... 95 Figure 47 Direct and indirect impacts of extreme hydro-meteorological events on power plant structures and
equipment, focus lies on flood events [43] .............................................................................................................. 96 Figure 48 Landslides effects on electric power facilities .................................................................................................. 97 Figure 49 Bulking damages on infrastructure system ...................................................................................................... 98 Figure 50 Extreme wind effects on distribution networks ............................................................................................... 99 Figure 51 Sea level rise impacts on facilities................................................................................................................... 100 Figure 52 Compouding impacts of drought .................................................................................................................... 101 Figure 53 Wildfires impacts on electricity distribution network .................................................................................... 102 Figure 54 Potential Risks to oil and gas operations from climate change [158] ............................................................. 103 Figure 55 Flooded refinery [162] .................................................................................................................................... 104 Figure 56 Landslide impact on Trans-Ecuador pipeline [164] ......................................................................................... 105 Figure 57 Hurricanes Katrina impacts on onshore facility [167] ..................................................................................... 107 Figure 58 Hurricanes Katrina impacts on offshore platform [167] ................................................................................. 107 Figure 59 Global mean sea level change 1900 -2010 [170] ............................................................................................ 108 Figure 60 Wildfire threatening production site [172] ..................................................................................................... 109 Figure 61 Percentage change in weekly salmonella cases due to 1°C increase in temperature .................................... 115 Figure 62 Causes of dam failure [186] ............................................................................................................................ 115 Figure 63 Mythe water treatment plant flooded in July 2007 ........................................................................................ 117 Figure 64 Damage-depth curve for water treatment plants [193] ................................................................................. 118 Figure 65 Impact of temperature to the wastewater treatment process [197] ............................................................. 123 Figure 66 EU28 greenhouse gas emissions by sector and mode of transport, 2012 ...................................................... 128 Figure 67 The resilient road ............................................................................................................................................ 128 Figure 68 Fatal jump: broken lane on a German highway .............................................................................................. 129 Figure 69 River Ebro breaks its banks ............................................................................................................................. 130 Figure 70 The impact of landslides onto the highway .................................................................................................... 131 Figure 71 A car drives through thick smoke as flames from a fire creep over the safety barrier of a motorway in the
region of Nemea, near Corinth in the Peloponnese, Greece [313] ....................................................................... 132 Figure 72 A flooded section of Berlin - Hannover high-speed line at Schönhausen ....................................................... 135 Figure 73 The impact of landslides onto the railway ...................................................................................................... 135 Figure 74 Fallen Trees ..................................................................................................................................................... 136 Figure 75 The collapse of the sea wall and underlying subsidence around the rail line in Dawlish ............................... 137 Figure 76 Considered area affected by ash cloud, Met Office [315] .............................................................................. 140 Figure 77 Classification of submarine mass movements adapted from sub-aerial classification proposed by the ISSMGE
Technical Committee on Landslides [249] ............................................................................................................. 143 Figure 78 A small boat makes its way along a partly frozen canal in Venice. The city's lagoon has frozen for the first
time in more than two decades ............................................................................................................................. 144 Figure 79 Adopted from [118] ........................................................................................................................................ 147 Figure 80 Verizon: Manhattan facilities .......................................................................................................................... 148 Figure 81 2009 Great Britain and Ireland floods............................................................................................................. 148 Figure 82 A train pulling into Watlington railway station, 18 December 2009 .............................................................. 149 Figure 83 Effect on buildings .......................................................................................................................................... 151 Figure 84 Examples of Potential Climate Change Impacts on Building Infrastructure and Operations [263] ................ 152 Figure 85 Schematic illustration of different types of vulnerability models ................................................................... 157 Figure 86 Ground Snow Load Database Data from 2600 weather stations from 18 countries Elaborations with common
statistical procedures [274] ................................................................................................................................... 160 Figure 87 Ground Snow Load Map 10 Climatic Regions with homogeneous climatic features [274] ............................ 160 Figure 88 Overview susceptibility of urban assets to climate hazards [275] .................................................................. 163 Figure 89 Bayesian network for building damage cost due to wildfires [275] ............................................................... 164
D1.2 State of the art review and taxonomy of existing knowledge
Grand Agreement 653824 DISSEMINATION LEVEL Page IX
List of Tables
Table 1 Classification of disasters according to the main controlling factor .................................................................... 15 Table 2 Climate change projections and implications for the energy sector ................................................................... 24 Table 3 Possible impacts of hydrometeorological events and climate change ................................................................ 36 Table 4 Water supply and wastewater infrastructure assets ........................................................................................... 43 Table 5 Impacts of climate hazards to the water infrastructure assets and proposed responses for increasing resilience
[78] ........................................................................................................................................................................... 47 Table 6 Other sector's dependencies on water infrastructure [90] ................................................................................. 49 Table 7 Key figures of the German transport sector [100] ............................................................................................... 51 Table 8 ICT sector, climate projection and potential implications [119] .......................................................................... 61 Table 9 Summary of the main expected health impacts of climate variability and climate change globally by the middle
of the current century .............................................................................................................................................. 68 Table 10 Emergency and Health critical infrastructure sector interdependencies .......................................................... 74
ANNEX A-F Table 11 Observed and projected changes in climate conditions: potential risks and opportunities ............................ 112 Table 12 Impacts of temperature increase to water supply infrastructure [78] ............................................................ 113 Table 13 Impacts of floods to water supply infrastructure ............................................................................................ 116 Table 14 Impacts from sea level rise to water supply assets .......................................................................................... 120 Table 15 Impacts of drought to water supply infrastructure [78] .................................................................................. 121 Table 16 Impacts of temperature increase to wastewater infrastructure assets .......................................................... 123 Table 17 Impacts of floods to wastewater infrastructure .............................................................................................. 124 Table 18 Impacts of sea level rise to wastewater infrastructure.................................................................................... 126 Table 19 Impacts of drought to wastewater infrastructure ........................................................................................... 126 Table 20 Key climate change risks to rail infrastructure [218] ....................................................................................... 133 Table 21 Key Climate Change Risks for Aviation, Eurocontrol [235] .............................................................................. 137 Table 22 Potential implications adaptation in maritime transport, Maritime Transport, United Nations conference on
trade and development [246] ................................................................................................................................ 141 Table 23 Overview of the damage classes and unit costs used in the flood risk assessment framework ...................... 153 Table 24 Summary of importance of building characteristics for damage estimation for different hazard types (red =
very important, yellow = less important, green = not important .......................................................................... 155
D1.2 State of the art review and taxonomy of existing knowledge
Grand Agreement 653824 DISSEMINATION LEVEL Page 1
1 Introduction
According to EU-CIRCLE Statement, it is presently acknowledged and scientifically proven that climate related hazards have the potential to substantially affect the lifespan and effectiveness or even destroy of European Critical Infrastructures (CI), particularly the energy, transportation sectors, marine and water management infrastructure with devastating impacts in EU appraising the social and economic losses. According to the European Academies' Science Advisory Council, a 60 % rise in the cost of damage from extreme weather events across Europe has been estimated over a 30 year period. Europe‘s infrastructures have the largest merit in terms of monetary damages [1].
As European Infrastructures have lifelines that span in several decades, it is imperative to generate scientifically truthful and validated knowledge on the potential impacts of climate, as a viable pathway for making resilient infrastructures. The main policy objective, as underline in the national policy briefs [2], is to move towards infrastructure network that is resilient to today’s natural hazards and prepared for the future changing climate. Furthermore, modern infrastructures are inherently interconnected and interdependent systems, therefore extreme events are liable to lead to cascade failures.
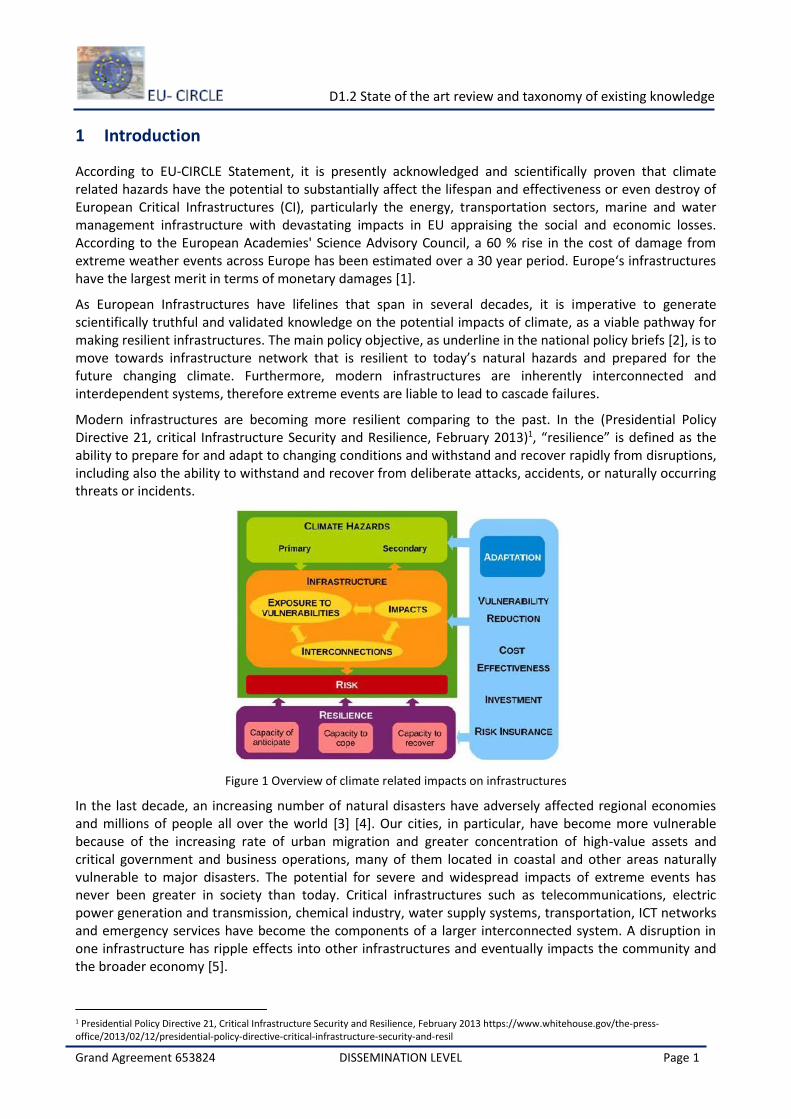
Modern infrastructures are becoming more resilient comparing to the past. In the (Presidential Policy Directive 21, critical Infrastructure Security and Resilience, February 2013)1, “resilience” is defined as the ability to prepare for and adapt to changing conditions and withstand and recover rapidly from disruptions, including also the ability to withstand and recover from deliberate attacks, accidents, or naturally occurring threats or incidents.
Figure 1 Overview of climate related impacts on infrastructures
In the last decade, an increasing number of natural disasters have adversely affected regional economies and millions of people all over the world [3] [4]. Our cities, in particular, have become more vulnerable because of the increasing rate of urban migration and greater concentration of high-value assets and critical government and business operations, many of them located in coastal and other areas naturally vulnerable to major disasters. The potential for severe and widespread impacts of extreme events has never been greater in society than today. Critical infrastructures such as telecommunications, electric power generation and transmission, chemical industry, water supply systems, transportation, ICT networks and emergency services have become the components of a larger interconnected system. A disruption in one infrastructure has ripple effects into other infrastructures and eventually impacts the community and the broader economy [5].
1 Presidential Policy Directive 21, Critical Infrastructure Security and Resilience, February 2013 https://www.whitehouse.gov/the-press-office/2013/02/12/presidential-policy-directive-critical-infrastructure-security-and-resil
D1.2 State of the art review and taxonomy of existing knowledge
Grand Agreement 653824 DISSEMINATION LEVEL Page 2
1.1 Methodology
The purpose of this deliverable is to provide an extensive assessment of the impacts from climate hazards and extreme weather on critical infrastructures, on a categorised way. Beyond the direct impacts on each critical infrastructure, this deliverable includes an extensive analysis of existing holistic frameworks on CI risk and resilience assessment due to climate change, related EU-Funded and International projects and open access software platforms.
The structure of this document is as follows:
Related EU-Funded and international projects
Under this section, a reference to the major related EU-Funded and international projects is presented.
Holistic frameworks on CI risk and resilience assessment due to climate change
An extensive analysis of holistic frameworks on CI from risk and resilience assessment is described. Through this section, reader could find methods and approaches to measure the level of risk due to climate change. An introduction to HAZUS, a nationally applicable standardized methodology that contains models for estimating potential losses of disasters as well as reference to the Federal Highway Administration’s climate change adaptation website for assessing the vulnerability of transportation assets to climate change and extreme weather events. Finally, the Disaster Resilience of Place (DROP) program is mentioned as well as the UK study for CI and their interconnections.
Introduction to CI sectors (More extensive analysis in ANNEXES part)
In this section an analysis of the impact from climate change and extreme weather events to the CI is performed. For this review, we consider the major critical infrastructure sectors and their interconnections and interdependencies. Specifically, energy sector, water sector, chemical sector, transportation sector, ICT networks sector and public (health) sector. For each one of the sector, D1.2 presents the potential consequences and impacts from climate change for each natural phenomenon (i.e. temperature, extreme precipitation, extreme winds, etc.). Furthermore, details about relevant to each sector risk assessment methodologies and resilience strategies are presented as well as climate change adaptation measures. Sector interdependencies (of each sector with the other sectors) are also considered and described in this section.
A more extensive analysis of impacts of climate change to the CI sectors including sub-sectors is included in this deliverable and can be found in the ANNEXES part. Under this section, detailed analysis of the impacts to CI including (examples, past events, damage functions) is presented.
Related Software
Reference to open access software can be found in the latest section of this deliverable.
D1.2 State of the art review and taxonomy of existing knowledge
Grand Agreement 653824 DISSEMINATION LEVEL Page 3
2 Related EU funded and international projects
The European Union is a major investor in public infrastructure projects. European, investment-based development policies such as EU cohesion policy, TEN-T and TEN-E, help overcoming gaps in infrastructure needs, especially in Convergence regions in order to generate the preconditions for growth and jobs. The EU primarily addresses this issue through EU cohesion policy and in particular in less developed Member States and regions which have a low endowment of basic infrastructure. The policy aims at creating growth and jobs through delivering Europe 2020 and thereby strengthening social, economic and territorial cohesion in the EU [6].
Examples of European financial institutions addressing climate risk and adaptation in project appraisal and development are presented in EU CIRCLE official page2. A list of EU Projects according to the European Commission - European Research on Natural Hazards (Catalogue of FP7 Projects) in http://matrix.gpi.kit.edu/EU%20Projects.php.
The Critical Infrastructure Preparedness and Resilience Research Network or CIPRNet establishes a Network of Excellence in Critical Infrastructure Protection (CIP). CIPRNet performs research and development that addresses a wide range of stakeholders including (multi)national emergency management, critical infrastructure operators, policy makers, and the society. By integrating resources of the CIPRNet partners acquired in more than 60 EU co-funded research projects, CIPRNet will create new advanced capabilities for its stakeholders. A key technology for the new capabilities will be modelling, simulation and analysis for CIP. CIPRNet builds a long-lasting virtual centre of shared and integrated knowledge and expertise in CIP. This virtual centre shall provide durable support from research to end users. It will form the foundation for the European Infrastructures Simulation & Analysis Centre (EISAC) by 20203.
Driving Innovation in Crisis Management for European Resilience. Crisis management and societal resilience capabilities are regularly challenged and constantly need to evolve to cope with new trends, such as emerging natural and man-made hazards, and the continuing connectivity of citizens. DRIVER4 has the goal to enhance crisis management capabilities and societal resilience in Europe. It provides guidance and support for resilience and innovation in these areas by helping practitioners articulate their needs in a structured dialogue with researchers and industry. In doing so, it also fosters flexibility and adaptability to future threats and changing crisis situations.
FRC stands for 'FloodResilienCity'. It is an EU-funded project which has enabled responsible public authorities in eight cities in North West Europe to better cope with floods in urban areas. This has been done through a combination of transnational cooperation and regional investments5.
INFRARISK is developing a reliable stress test framework to establish the resilience of European Critical Infrastructure to rare, low frequency, extreme natural hazard events and to aid decision making in the long term regarding robust infrastructure development and the protection of existing infrastructure. In an integrated approach to hazard assessment, the project is focusing on the impacts of seismic, landslide and flooding hazards on road and rail transport infrastructure, considering the interdependencies of the networks, cascading hazards and cascading effects and spatial and temporal vulnerability6.
INTACT brings together innovative and cutting edge knowledge and experience in Europe in order to develop and demonstrate best practices in engineering, materials construction, planning and designing protective measures as well as crisis response and recovery capabilities7.
2 http://www.eu-circle.eu/eu-funded-projects/ 3 https://www.ciprnet.eu/summary.html 4 http://www.driver-project.eu/ 5 http://www.floodresiliencity.eu/ 6 http://www.infrarisk-fp7.eu/ 7 http://www.intact-project.eu/
D1.2 State of the art review and taxonomy of existing knowledge
Grand Agreement 653824 DISSEMINATION LEVEL Page 4
RAIN will quantify the complex interactions between weather events and land based infrastructure systems. The output of RAIN will aid decision making in the long term, securing new robust infrastructure development and protection of existing infrastructure against climate change and increasingly more unpredictable weather patterns. Transport, energy and telecommunications infrastructure will be considered and risk mitigation strategies will be developed. This will be achieved through developing an operational analysis framework which considers the impact of individual hazards on specific infrastructure systems and the coupled interdependencies of critical infrastructure through robust risk and uncertainty modelling8.
The aim of the PREDICT project is to provide a comprehensive solution for dealing with cascading effects in multi-sectoral crisis situations covering aspects of critical infrastructures. The PREDICT solution will be composed of the following three pillars: methodologies, models and software tools. Their integrated use will increase the awareness and understanding of cascading effects by crisis response organisations, enhances their preparedness and improves their response capability to respond in case of cascading failures9.
SnowBall consists in a deep analysis of cascading effects and development of methods to anticipate them; and in a Decision Support System able to display current crisis monitoring and results of simulated decisions integrating cascading effects, thanks to a data collection system, an Events Log Database, Simulators and a Dashboard. SnowBall innovates in its modular approach to crises, its modelling techniques, its agent-supported coupled grid simulations, its generic Events Log Database and tools to follow public behaviour (Emergency Alert, social networks, mobile application)10.
River flood risks in urban areas across Europe will increase tremendously in the coming decades. STAR-FLOOD (2012-2016) aims to design policies to better deal with these risks. The results of the project will be highly relevant for policies and law at the European, national and regional level and for the development of public-private partnerships11.
STREST is an harmonized approach to stress tests for critical infrastructures against natural hazards12.
The Territories of Rivers Action Plans (TRAP) project is about bringing together river basin & landscape protection, with regional growth models and solutions. This is called ‘integrated river & river territory development’. While the protection of rivers basins & river territories is not negotiable, the costs associated with it must be explicitly balanced by income through growth and rationalised by suitable development actions13.
The MATRIX project develops methods and tools to tackle multiple natural hazards within a common framework. A variety of natural extreme events, including earthquakes, landslides, volcanic eruptions, tsunamis, river floods, winter storms, wildfires and coastal phenomena, threaten different regions of Europe suffering not only from individual hazards, but also from multiple events that occur in combination. Classes of interaction include triggered events, cascade effects and the rapid increase in vulnerability during successive hazards. Planners and policy-makers, and the scientists who inform their judgements, usually treat the hazards and risks related to such events separately from each other, neglecting interdependencies between the different types of phenomena, as well as the importance of risk comparability. Resolving this deficit improves their ability to take risk reduction measures in a cost-effective way and in doing so, strengthen societies' resilience to natural disasters.
The ENSURE project dealt with the development of a new methodological framework for an integrated multi-scale vulnerability assessment, based on a comprehensive, integrated and inter-disciplinary
8 http://rain-project.eu/ 9 http://www.predict-project.eu/ 10 http://www.snowball-project.eu/index.php#tf-home 11 http://www.starflood.eu/ 12 http://www.strest-eu.org/opencms/opencms/ 13 http://trapproject.eu/
D1.2 State of the art review and taxonomy of existing knowledge
Grand Agreement 653824 DISSEMINATION LEVEL Page 5
understanding of how mitigation strategies can be improved in the future, in order to reduce human losses, economic damage and social discomfort due to extreme events striking communities exposed to a variety of natural hazards, as well as to the potential consequences of climate change. Amongst the achievements of the project were: to improve the understanding of the vulnerability concept at different spatial scales, a number of reviews were performed on the methodologies used to assess vulnerability of structural, territorial, social and economic systems; a review was performed to understand how vulnerability was operated in both natural hazards and climate change communities; it explored the connections between different types of vulnerabilities; need to make explicit the relevance of resilience and not to restrict to the vulnerability concept only; processes and catalytic factors of vulnerability change in the course of time and in particular, along a single disaster cycle and its successive stages or along successive disaster cycles, were highlighted.
The RAMSES (Reconciling Adaptation, Mitigation and Sustainable Development for citiES) European research project aims to deliver much needed quantified evidence of the impacts of climate change and the costs and benefits of a wide range of adaptation measures, focusing on cities. It will engage with stakeholders to ensure this information is policy relevant and ultimately enables the design and implementation of adaptation strategies in the EU and beyond. The project will focus on climate impacts and adaptation strategies pertinent to urban areas due to their high social and economic importance.
The MOVE FP7 (Improvement of Vulnerability Assessment in Europe) has gathered knowledge about risks from 13 European teams to propose a holistic framework and to provide the necessary tools for vulnerability assessments of territories exposed to natural hazards. The project MOVE focused on the conceptual development and practical application of vulnerability assessments towards risk management strategies, comforted by case studies.
D1.2 State of the art review and taxonomy of existing knowledge
Grand Agreement 653824 DISSEMINATION LEVEL Page 6
3 Holistic frameworks on CI risk and resilience assessment due to climate change
There is a rich multidisciplinary tradition that examines risk, hazards and disasters. To understand and appreciate the literature, a few key concepts require definitions. First is the concept of hazards. Hazards are threats that have the potential to harm people (and the things they value) and places. Risk is the likelihood of incurring harm, or the probability that some type of injury or loss would result from the hazard event. Disasters are singular larger scale events that overwhelm the local capacity to effectively respond to and recover from an event [7].
In looking at climate variability and climate change as particular stressors, we can further differentiate hazards into two primary classes. Sudden onset hazards appear rapidly such as flooding or hurricanes, but last for a short time period ranging from hours to weeks. Chronic hazards are very slow onset events that are barely perceptible by society such as drought or sea level rise. They affect populations incrementally and it is not until some tipping point is reached that they transcend into disasters. The distinction between sudden onset and chronic hazards is significant in terms of perception and policy—the public and policy makers can see the flood or hurricane and anticipate the necessary response to reduce the impact on people and places [8]. There is considerable interest also in the concept of vulnerability, for which there are many definitions in the research literature, derived from differing conceptual models and frameworks.
Beginning in the 1940s, there was considerable research and policy interest in understanding the human occupancy of hazard zones, the range of societal adjustments available for reducing the impact, and the social acceptance or at least tolerance of the risks associated with placing human lives and livelihoods in harm’s way. Derived from the pioneering work of Gilbert F. White and his students, the risk/hazards paradigm was born. Working at the interface between social and environmental systems, the risk/hazards approach sought to understand who lived in hazardous areas and the drivers of the nation’s increasing vulnerability to losses from natural hazards [9].
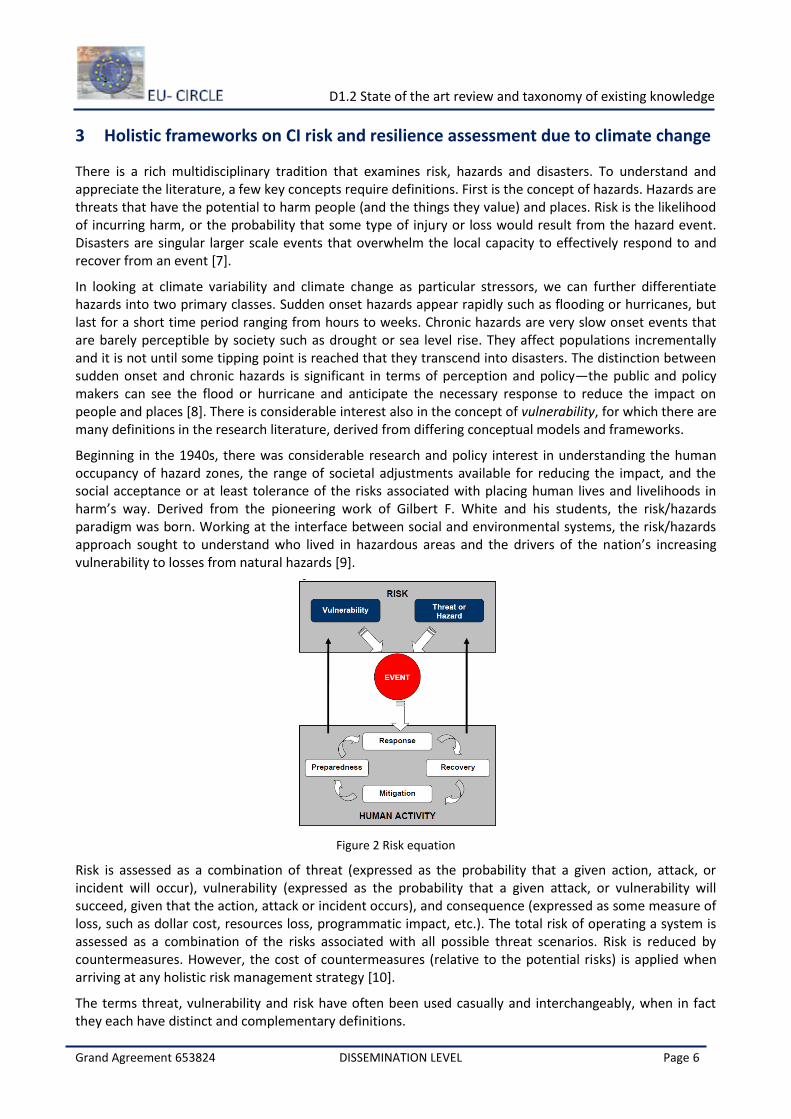
Figure 2 Risk equation
Risk is assessed as a combination of threat (expressed as the probability that a given action, attack, or incident will occur), vulnerability (expressed as the probability that a given attack, or vulnerability will succeed, given that the action, attack or incident occurs), and consequence (expressed as some measure of loss, such as dollar cost, resources loss, programmatic impact, etc.). The total risk of operating a system is assessed as a combination of the risks associated with all possible threat scenarios. Risk is reduced by countermeasures. However, the cost of countermeasures (relative to the potential risks) is applied when arriving at any holistic risk management strategy [10].
The terms threat, vulnerability and risk have often been used casually and interchangeably, when in fact they each have distinct and complementary definitions.
D1.2 State of the art review and taxonomy of existing knowledge
Grand Agreement 653824 DISSEMINATION LEVEL Page 7
Hazard vulnerability assessments describe who and what is exposed to the threat (hazard identification), and the differential susceptibility (the potential for loss, injury, harm, adverse impacts on livelihoods), and impacts of that exposure. In other words, the goal is not only to identify the risk factors (who and what is vulnerable), but also the driving forces that shape vulnerability in a particular place [11] [12]. These assessments are either qualitative in their approach or they are quantitative in nature providing numerical estimates of population exposures and rankings of vulnerability. They can be single hazard or multi-hazard and they can range from local place-specific analyses to more regionally based patterns. Three distinct elements comprise hazard vulnerability assessments: exposure assessment (the identification of the risk source including magnitude, frequency of occurrence, and spatial impact); impact assessments (the consequences of a particular hazard or stressor on a population; and damage assessment (defining the direct and indirect losses (fatalities, infrastructure, economic) associated with a particular event). However, the integration of these three elements into a comprehensive vulnerability assessment for the area or region of concern is often lacking. Part of this is a function of the bifurcation of the science inputs (e.g. natural scientists provide most of the relevant data and models for exposure assessments while social scientists provide the inputs for the populations at risk) and the difficulties of working across disciplinary or knowledge boundaries [8].
There is a plethora of case studies on risk and vulnerability assessment techniques and applications compiled by NOAA’s Coastal Services Center [13]. Some focus only on exposure, while others take a more comprehensive view of the hazards assessment and include impact and damage assessments14.
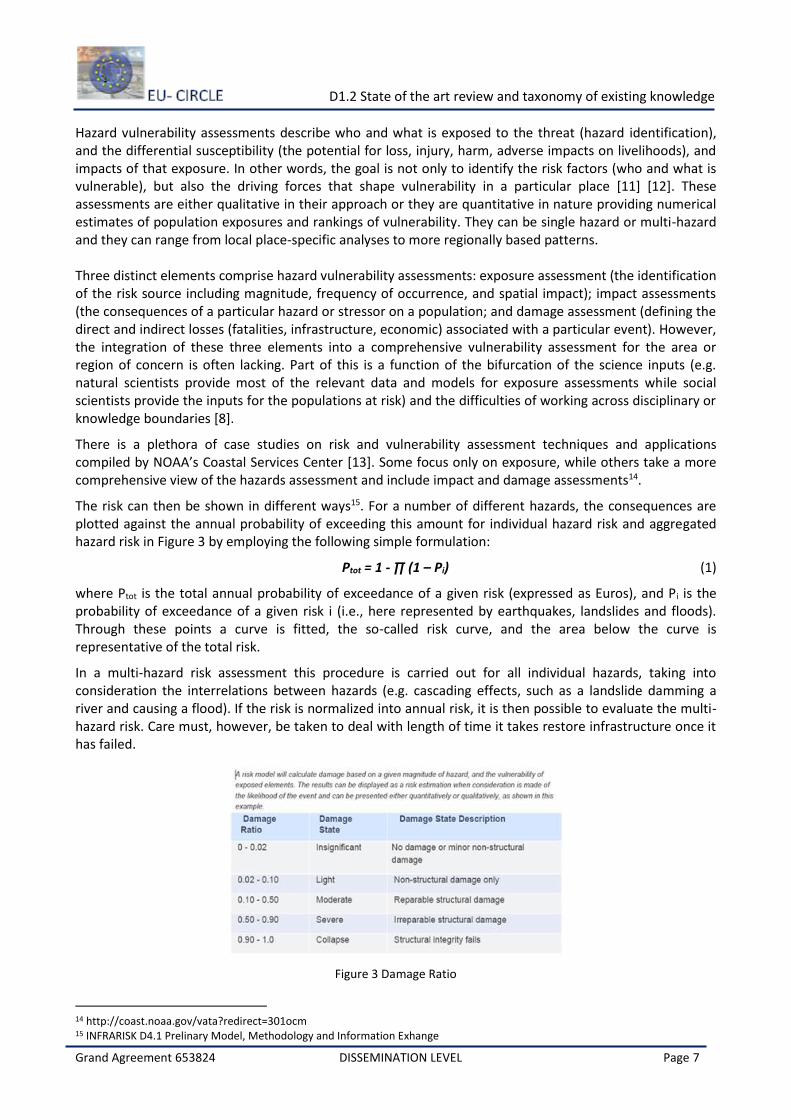
The risk can then be shown in different ways15. For a number of different hazards, the consequences are plotted against the annual probability of exceeding this amount for individual hazard risk and aggregated hazard risk in Figure 3 by employing the following simple formulation:
Ptot = 1 - ∏ (1 – Pi) (1)
where Ptot is the total annual probability of exceedance of a given risk (expressed as Euros), and Pi is the probability of exceedance of a given risk i (i.e., here represented by earthquakes, landslides and floods). Through these points a curve is fitted, the so-called risk curve, and the area below the curve is representative of the total risk.
In a multi-hazard risk assessment this procedure is carried out for all individual hazards, taking into consideration the interrelations between hazards (e.g. cascading effects, such as a landslide damming a river and causing a flood). If the risk is normalized into annual risk, it is then possible to evaluate the multi-hazard risk. Care must, however, be taken to deal with length of time it takes restore infrastructure once it has failed.
Figure 3 Damage Ratio
14 http://coast.noaa.gov/vata?redirect=301ocm 15 INFRARISK D4.1 Prelinary Model, Methodology and Information Exhange

D1.2 State of the art review and taxonomy of existing knowledge
Grand Agreement 653824 DISSEMINATION LEVEL Page 8
Risk analysis
There are three primary methods for measuring levels of risk [14]:
1. Qualitative analysis, which uses words to describe the magnitude of potential consequences, and the likelihood that the event will occur. An example of this is a risk matrix, which can be colour-coded to make it easier to understand the level of associated risk (as shown in the table below). A high level of risk (red) can be deemed intolerable; a medium level of risk (yellow) tolerable, and a low level of risk (green) acceptable.
Figure 4 Example of a qualitative risk matrix to determine a level of risk (adapted from Standards New Zealand, 2004, p56)
2. Quantitative analysis, which uses numerical values for both consequences and likelihood, as shown in the figure below.
Figure 5 Quantitative method for estimating risk (Standards Australia/New Zealand, 2004, p50-52)
3. Semi-qualitative analysis, which uses a combination of words and numerical values, as shown in the Figure below.
Figure 6 Semi-quantitative method for estimating risk. ‘Frequency’ is equivalent to ‘likelihood’ used in the text

D1.2 State of the art review and taxonomy of existing knowledge
Grand Agreement 653824 DISSEMINATION LEVEL Page 9
It can be done using a qualitative or a quantitative approach. In both cases, however, the goal is to gain a better understanding of the probability of occurrence of a scenario and the consequence of that scenario16:
R = p ∗ C (2)
where p is the probability that a scenario occurs and C is the consequences related to this scenario.
Qualitative approach A qualitative approach is one where relatively exact estimates of the probability of occurrence of a scenario or relatively exact estimates of the consequences are not required. It allows a first impression of the risks. This approach is based exclusively on the experience of the experts and the risks, as well as the probability of occurrence and their consequences are categorized in general terms, e.g. “very high”, “high”, “moderate”, “low” and “very low”.
Figure 7 Risk Matrix17
Quantitative approach A quantitative approach is one where relatively exact estimates of the probability of occurrence of a scenario and relatively exact estimates of the consequences are required. With such an approach the risk analysis is based on information in form of data, expert knowledge, physical and mathematical models, etc. The result of a quantitative risk analysis is an exact number (Equation 2), that indicates the risks associated with each scenarios and an exact number to indicate the risk associated with all relevant scenarios considered together, even if it is acknowledged that there is uncertainty with respect to these numbers.
Statistical analysis Statistical models of different complexity have been developed to estimate the risk related to the failure of an individual infrastructure objects, with respect to both the probability of occurrence of a hazard and the probability of failure of the infrastructure object
Probabilistic modeling This approach comprised a variety of methods used for the risk analysis, such as Event trees, fault trees, Markov chains, Bayesian networks, and Monte Carlo simulations.
Event trees Event trees, are used to analyse and display different discrete scenarios, their corresponding probability of occurrence and the resulting consequences, as used in Figure 7. They are built from a starting event and branch at each subsequent event based on the values of key parameters these key parameters were intensity measures. When the event tree is complete it is a logical and visual representation of the set of scenarios that can occur.
16 INFRARISK PROJECT: D 4.1: Preliminary Model, Methodology and Information Exchange 17 INFRARISK PROJECT: D 4.1: Preliminary Model, Methodology and Information Exchange
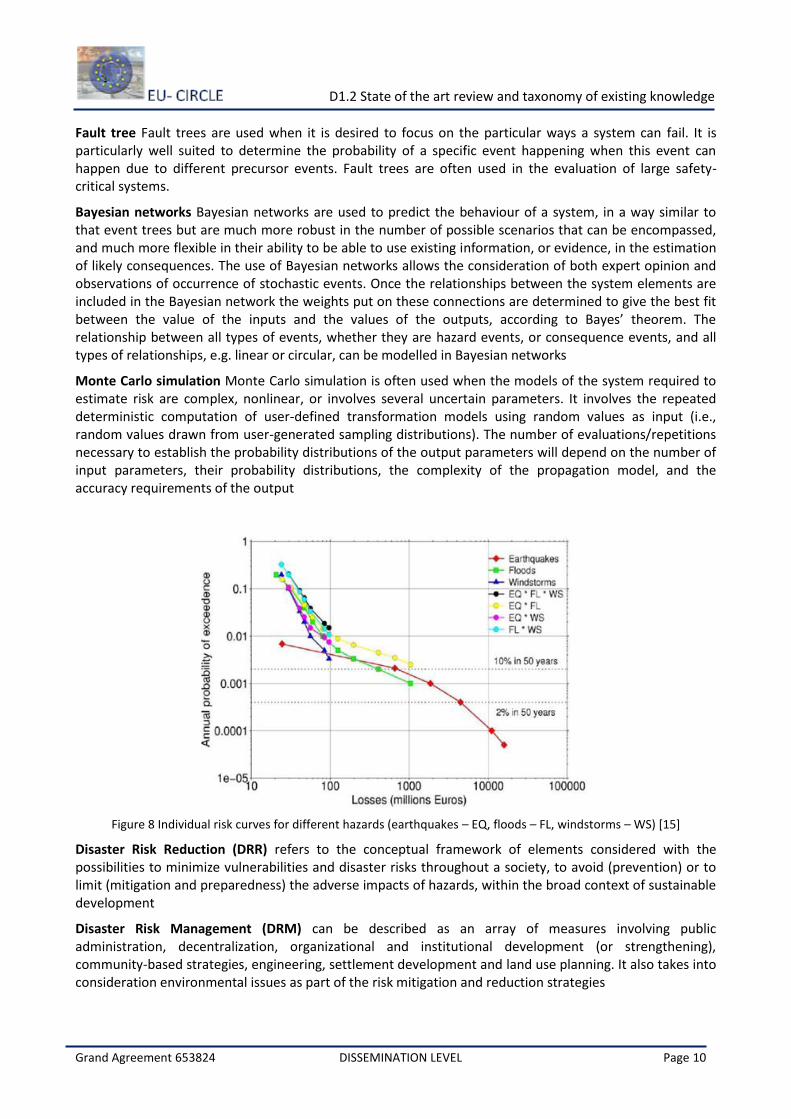
D1.2 State of the art review and taxonomy of existing knowledge
Grand Agreement 653824 DISSEMINATION LEVEL Page 10
Fault tree Fault trees are used when it is desired to focus on the particular ways a system can fail. It is particularly well suited to determine the probability of a specific event happening when this event can happen due to different precursor events. Fault trees are often used in the evaluation of large safety-critical systems.
Bayesian networks Bayesian networks are used to predict the behaviour of a system, in a way similar to that event trees but are much more robust in the number of possible scenarios that can be encompassed, and much more flexible in their ability to be able to use existing information, or evidence, in the estimation of likely consequences. The use of Bayesian networks allows the consideration of both expert opinion and observations of occurrence of stochastic events. Once the relationships between the system elements are included in the Bayesian network the weights put on these connections are determined to give the best fit between the value of the inputs and the values of the outputs, according to Bayes’ theorem. The relationship between all types of events, whether they are hazard events, or consequence events, and all types of relationships, e.g. linear or circular, can be modelled in Bayesian networks
Monte Carlo simulation Monte Carlo simulation is often used when the models of the system required to estimate risk are complex, nonlinear, or involves several uncertain parameters. It involves the repeated deterministic computation of user-defined transformation models using random values as input (i.e., random values drawn from user-generated sampling distributions). The number of evaluations/repetitions necessary to establish the probability distributions of the output parameters will depend on the number of input parameters, their probability distributions, the complexity of the propagation model, and the accuracy requirements of the output
Figure 8 Individual risk curves for different hazards (earthquakes – EQ, floods – FL, windstorms – WS) [15]
Disaster Risk Reduction (DRR) refers to the conceptual framework of elements considered with the possibilities to minimize vulnerabilities and disaster risks throughout a society, to avoid (prevention) or to limit (mitigation and preparedness) the adverse impacts of hazards, within the broad context of sustainable development
Disaster Risk Management (DRM) can be described as an array of measures involving public administration, decentralization, organizational and institutional development (or strengthening), community-based strategies, engineering, settlement development and land use planning. It also takes into consideration environmental issues as part of the risk mitigation and reduction strategies

D1.2 State of the art review and taxonomy of existing knowledge
Grand Agreement 653824 DISSEMINATION LEVEL Page 11
Figure 9 The "traditional" disaster cycle and the role of risk assessment [16]
Definition of risk: The probability of harmful consequences, or expected losses (deaths, injuries, property, livelihoods, economic activity disrupted or environment damaged) resulting from interactions between (natural, human-induced or man-made) hazards and vulnerable conditions Definition of risk assessment: A methodology to determine the nature and extent of risk by analyzing potential hazards and evaluating existing conditions of vulnerability that could pose a potential threat or harm to people, livelihoods and the environment on which they depend. (Source UN-ISDR: http://www.unisdr.org/eng/library/lib-terminology-eng%20home.htm)
UN-ISDR defines risk in short as “the probability of losses”. Risk can presented conceptually with the following basic equation
Risk = Hazard * Vulnerability * Amount of elements-at-risk (3)
and the more conceptual equation:
Risk = Hazard * Vulnerability / Capacity (4)
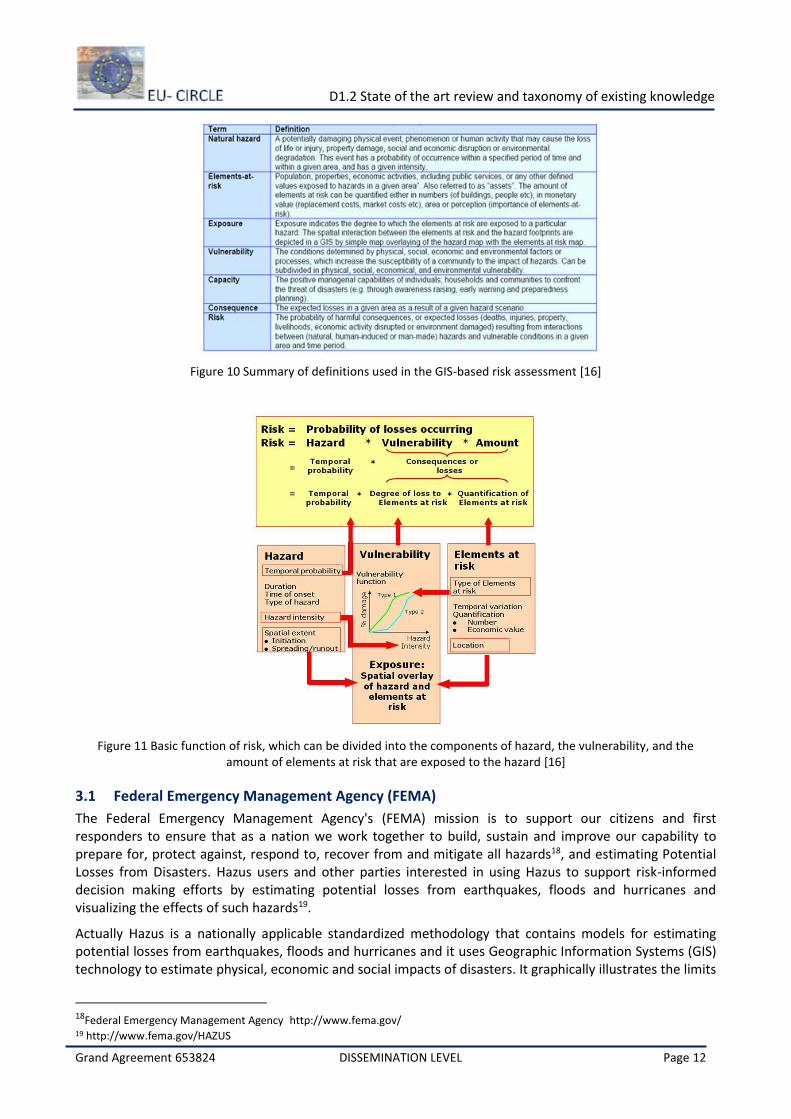
D1.2 State of the art review and taxonomy of existing knowledge
Grand Agreement 653824 DISSEMINATION LEVEL Page 12
Figure 10 Summary of definitions used in the GIS-based risk assessment [16]
Figure 11 Basic function of risk, which can be divided into the components of hazard, the vulnerability, and the amount of elements at risk that are exposed to the hazard [16]
3.1 Federal Emergency Management Agency (FEMA)
The Federal Emergency Management Agency's (FEMA) mission is to support our citizens and first responders to ensure that as a nation we work together to build, sustain and improve our capability to prepare for, protect against, respond to, recover from and mitigate all hazards18, and estimating Potential Losses from Disasters. Hazus users and other parties interested in using Hazus to support risk-informed decision making efforts by estimating potential losses from earthquakes, floods and hurricanes and visualizing the effects of such hazards19.
Actually Hazus is a nationally applicable standardized methodology that contains models for estimating potential losses from earthquakes, floods and hurricanes and it uses Geographic Information Systems (GIS) technology to estimate physical, economic and social impacts of disasters. It graphically illustrates the limits
18Federal Emergency Management Agency http://www.fema.gov/ 19 http://www.fema.gov/HAZUS
D1.2 State of the art review and taxonomy of existing knowledge
Grand Agreement 653824 DISSEMINATION LEVEL Page 13
of identified high-risk locations due to earthquake, hurricane and floods. Users can then visualize the spatial relationships between populations and other more permanently fixed geographic assets or resources for the specific hazard being modeled, a crucial function in the pre-disaster planning process.
It is mainly used for mitigation and recovery, as well as preparedness and response. Government planners, GIS specialists and emergency managers use it in order to determine losses and the most beneficial mitigation approaches to take to minimize them. It can be also used in the assessment step in the mitigation planning process, which is the foundation for a community's long-term strategy to reduce disaster losses and break the cycle of disaster damage, reconstruction and repeated damage. Being ready will aid in recovery after a natural disaster.
HAZUS-MH is the most recent evolution of a family of natural hazards loss estimation software whose development began in the early 1990s. The purpose of HAZUS and natural hazards loss estimation software in general is to quantify the human, property, financial, and social impacts of natural hazards such as earthquake, wind, and flood, under existing conditions and given any of numerous possible mitigation measures. Quantification of losses under existing conditions is valuable for understanding and communicating the relative importance of natural hazards risks and the various factors such as location, land use zoning, construction quality, etc. contributing to that risk. Similarly, analysis of the beneficial impacts of mitigation measures such as relocation, improved land use and planning, structural modifications, warning, etc. permits informed decision making and efficient allocation of scarce resources [17].
3.2 Federal high way administration (FHWA)
This section of FHWA's Climate Change Adaptation website20 provides resources, tools, and guidance to help local and regional transportation agencies implement the Federal Highway Administration's (FHWA's) Climate Change and Extreme Weather Vulnerability Assessment Framework, a guide to assessing the vulnerability of transportation assets to climate change and extreme weather events.
One of the first steps in performing a climate change vulnerability assessment is to determine the assessment's objectives. Objectives define the strategies or implementation steps that must be taken to achieve the assessment's goals. Articulating an assessment's objectives helps determine the level of detail, the types of data and tools, and the range of expertise and skills needed to conduct the assessment. Identifying which climate stressors (also known as climate variables) should be included in a vulnerability assessment is an important early step in the assessment process. Not all changes in the future climate will be significant to local or regional transportation networks and limiting the study to the key stressors of interest may allow for more in-depth projections of these variables.
Determining which climate stressors are "key" involves understanding the sensitivity of transportation assets to weather and climate. Sensitivity, which refers to how an asset or system fares when it is exposed to an impact, is one of the three components of vulnerability-the other two being exposure and adaptive capacity. Analyzing sensitivity, which involves determining whether transportation assets would be affected by the stressor, can help narrow the range of climate impacts considered, allowing the study to focus its resources on analyzing the climate stressors that would cause the greatest damage to the system.
Identifying the relevant transportation assets for a vulnerability assessment and determining which of their characteristics to examine can help narrow the scope of the assessment, bringing it in line with the resources available to conduct the study.
To begin the process, start by deciding which assets to include, assessing data availability for those assets, and identifying the relevant timeframes under which assets are managed. Performing a criticality assessment is one way to limit the type and number of assets for further study. Having defined the objectives and scope of the study, identified key climate variables, and limited the number or types of
20Federal high way administration http://www.fhwa.dot.gov/environment/climate_change/adaptation/adaptation_framework/
D1.2 State of the art review and taxonomy of existing knowledge
Grand Agreement 653824 DISSEMINATION LEVEL Page 14
assets to be considered, the next step is to assess the vulnerability of selected assets to the impacts of climate change.
The findings of the assessment can be integrated into transportation decision-making processes and used to consider and prioritize measures to address the vulnerabilities. Integrating vulnerability considerations into existing decision-making processes, such as those related to asset management and emergency management, puts the findings of a vulnerability assessment into practice. Considering climate change as one of many risks to be deliberated in these processes, rather than as a separate issue requiring its own framework, can lower barriers to adaptation.
Climate considerations can be integrated into asset management systems, emergency management and hazard mitigation plans, long-range planning, and other existing processes. Agencies can prioritize programs and projects that increase climate change resilience as a co-benefit, rather than a main focus. Adapting to climate change is an iterative process that requires monitoring and evaluation to keep adaptation efforts on track with our evolving understanding of climate risks. Monitoring and evaluation activities are a process of collaborative learning that reveals progress toward goals and objectives. It identifies which activities are working, which ones aren't, and why. The results of monitoring and evaluation can be used to periodically revisit and fine-tune adaptation strategies, as well as the recommendations and findings of a vulnerability assessment.
3.3 The disaster resilience of Place (DROP) program
In recent years, efforts have been undertaken by various organizations to design indicators for measuring resilience more broadly. The [18], commissioned by the united nations development programme, takes stock and provides an overview of ongoing efforts at developing and applying measurement frameworks for disaster resilience. It is concerned with measurements of resilience against natural disasters. It includes also measurements that focus – partially or fully – on tropical cyclones and related storm surges, droughts, earthquakes, biomass fires, floods, landslides, tsunamis and/or volcanic eruptions. Furthermore, the review includes issues which are closely linked to disaster resilience such as disaster risk management, vulnerability to disasters and food and nutrition.
First of all, it pays attention at what is currently being measured in disaster resilience and the characteristics of the measurements. Continuously it provides a mapping that summarized current specific efforts to measure disaster resilience and finally provides some recommendations based on the mapping and a literature review.
Disaster types [16] A hazard, and the disaster resulting from that, can have different origins: natural (geological, hydrometeorological and biological) or induced by human processes (environmental degradation and technological hazards). Hazards can be single, sequential or combined in their origin and effects. Each hazard is characterised by its location, intensity, frequency, probability, duration, area of extent, speed of onset, spatial dispersion and temporal spacing. We will look at this much more in later sessions. Hazards can be classified in several ways. A possible subdivision is between:
Natural hazards are natural processes or phenomena within the earth's system (lithosphere, hyd rosphere, biosphere or atmosphere) that may constitute a damaging event (such as earthquakes, volcanic eruptions, hurricanes);
Human-induced hazards are modifications and of natural processes within the earth's system (lithosphere, hydrosphere, biosphere or atmosphere) caused by human activities which accelerate/aggravate damaging events (such as atmospheric pollution, industrial chemical accidents, major armed conflicts, nuclear accidents, oil spills);
Human-made hazards or technological hazards: dangers originating from technological or industrial accidents, dangerous procedures, infrastructure failures or certain human activities, which may cause the loss of life or injury, property damage, social and economic disruption or environmental
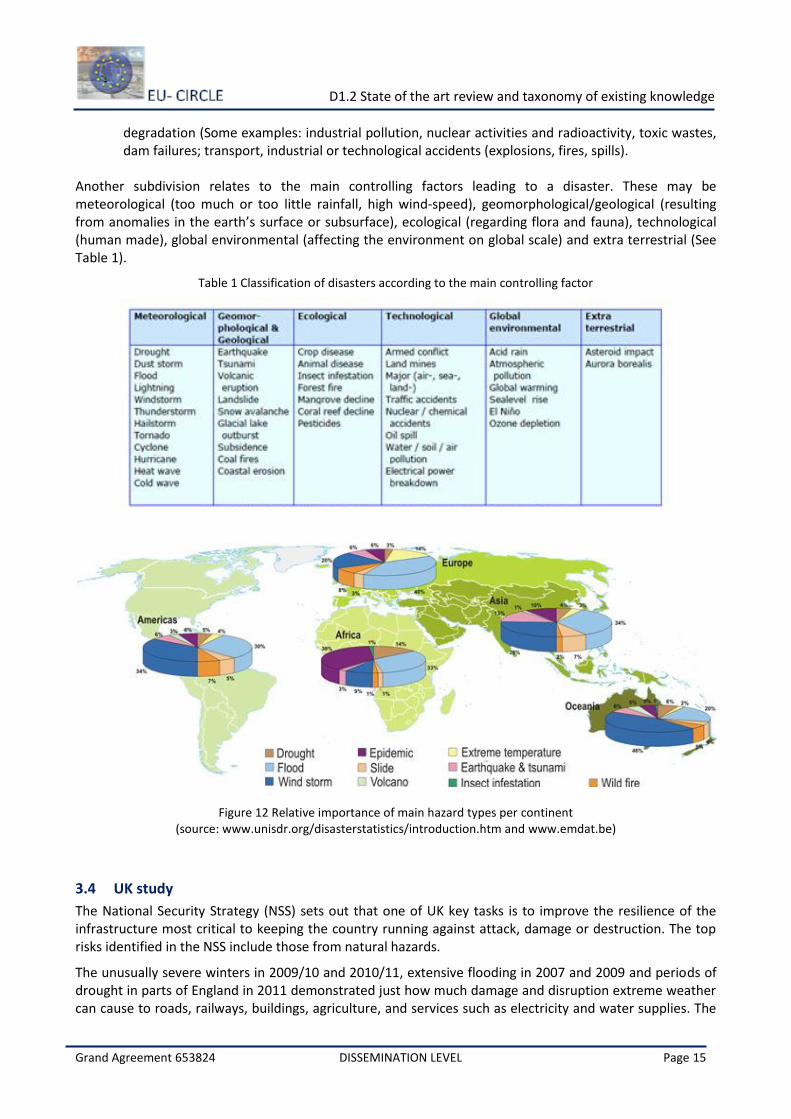
D1.2 State of the art review and taxonomy of existing knowledge
Grand Agreement 653824 DISSEMINATION LEVEL Page 15
degradation (Some examples: industrial pollution, nuclear activities and radioactivity, toxic wastes, dam failures; transport, industrial or technological accidents (explosions, fires, spills).
Another subdivision relates to the main controlling factors leading to a disaster. These may be meteorological (too much or too little rainfall, high wind-speed), geomorphological/geological (resulting from anomalies in the earth’s surface or subsurface), ecological (regarding flora and fauna), technological (human made), global environmental (affecting the environment on global scale) and extra terrestrial (See Table 1).
Table 1 Classification of disasters according to the main controlling factor
Figure 12 Relative importance of main hazard types per continent (source: www.unisdr.org/disasterstatistics/introduction.htm and www.emdat.be)
3.4 UK study
The National Security Strategy (NSS) sets out that one of UK key tasks is to improve the resilience of the infrastructure most critical to keeping the country running against attack, damage or destruction. The top risks identified in the NSS include those from natural hazards.
The unusually severe winters in 2009/10 and 2010/11, extensive flooding in 2007 and 2009 and periods of drought in parts of England in 2011 demonstrated just how much damage and disruption extreme weather can cause to roads, railways, buildings, agriculture, and services such as electricity and water supplies. The
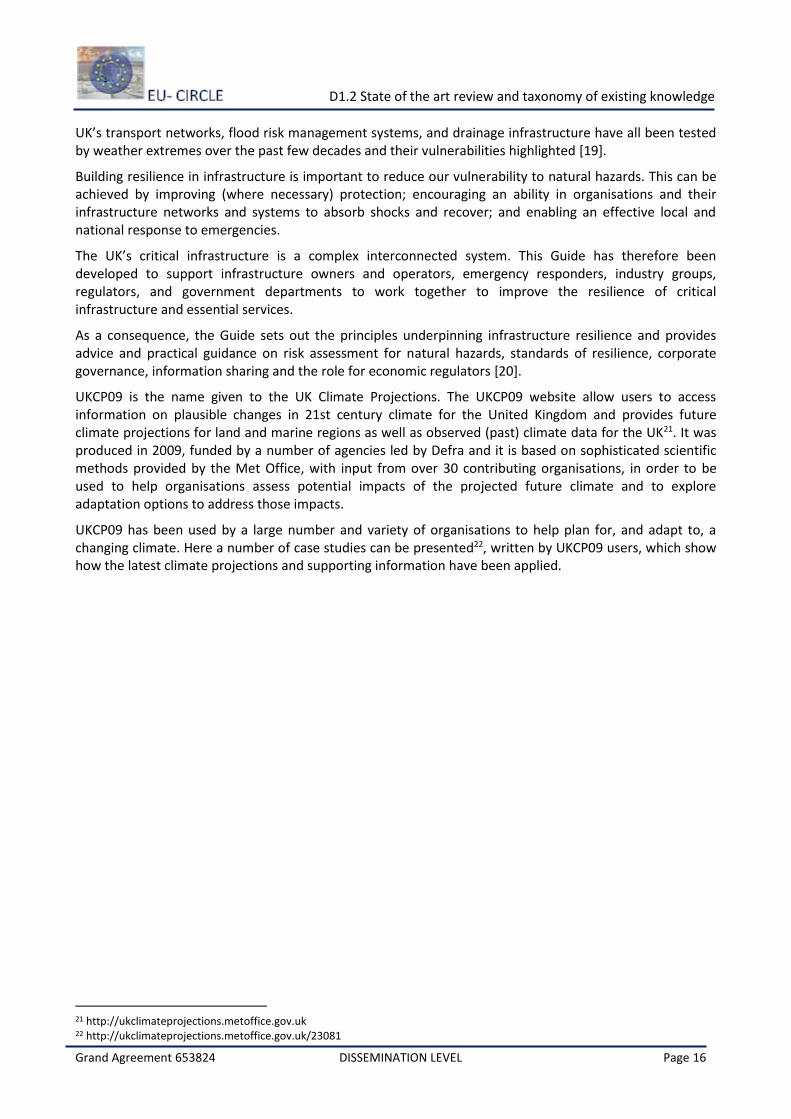
D1.2 State of the art review and taxonomy of existing knowledge
Grand Agreement 653824 DISSEMINATION LEVEL Page 16
UK’s transport networks, flood risk management systems, and drainage infrastructure have all been tested by weather extremes over the past few decades and their vulnerabilities highlighted [19].
Building resilience in infrastructure is important to reduce our vulnerability to natural hazards. This can be achieved by improving (where necessary) protection; encouraging an ability in organisations and their infrastructure networks and systems to absorb shocks and recover; and enabling an effective local and national response to emergencies.
The UK’s critical infrastructure is a complex interconnected system. This Guide has therefore been developed to support infrastructure owners and operators, emergency responders, industry groups, regulators, and government departments to work together to improve the resilience of critical infrastructure and essential services.
As a consequence, the Guide sets out the principles underpinning infrastructure resilience and provides advice and practical guidance on risk assessment for natural hazards, standards of resilience, corporate governance, information sharing and the role for economic regulators [20].
UKCP09 is the name given to the UK Climate Projections. The UKCP09 website allow users to access information on plausible changes in 21st century climate for the United Kingdom and provides future climate projections for land and marine regions as well as observed (past) climate data for the UK21. It was produced in 2009, funded by a number of agencies led by Defra and it is based on sophisticated scientific methods provided by the Met Office, with input from over 30 contributing organisations, in order to be used to help organisations assess potential impacts of the projected future climate and to explore adaptation options to address those impacts.
UKCP09 has been used by a large number and variety of organisations to help plan for, and adapt to, a changing climate. Here a number of case studies can be presented22, written by UKCP09 users, which show how the latest climate projections and supporting information have been applied.
21 http://ukclimateprojections.metoffice.gov.uk 22 http://ukclimateprojections.metoffice.gov.uk/23081
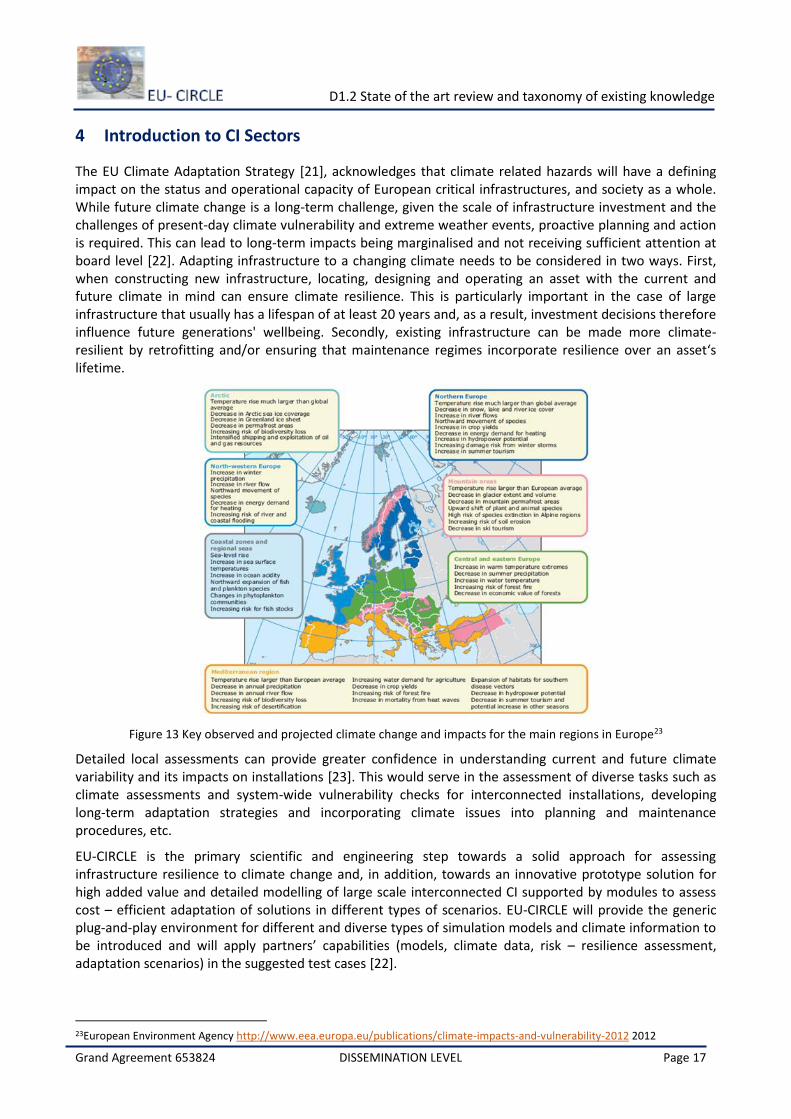
D1.2 State of the art review and taxonomy of existing knowledge
Grand Agreement 653824 DISSEMINATION LEVEL Page 17
4 Introduction to CI Sectors
The EU Climate Adaptation Strategy [21], acknowledges that climate related hazards will have a defining impact on the status and operational capacity of European critical infrastructures, and society as a whole. While future climate change is a long-term challenge, given the scale of infrastructure investment and the challenges of present-day climate vulnerability and extreme weather events, proactive planning and action is required. This can lead to long-term impacts being marginalised and not receiving sufficient attention at board level [22]. Adapting infrastructure to a changing climate needs to be considered in two ways. First, when constructing new infrastructure, locating, designing and operating an asset with the current and future climate in mind can ensure climate resilience. This is particularly important in the case of large infrastructure that usually has a lifespan of at least 20 years and, as a result, investment decisions therefore influence future generations' wellbeing. Secondly, existing infrastructure can be made more climate-resilient by retrofitting and/or ensuring that maintenance regimes incorporate resilience over an asset‘s lifetime.
Figure 13 Key observed and projected climate change and impacts for the main regions in Europe23
Detailed local assessments can provide greater confidence in understanding current and future climate variability and its impacts on installations [23]. This would serve in the assessment of diverse tasks such as climate assessments and system-wide vulnerability checks for interconnected installations, developing long-term adaptation strategies and incorporating climate issues into planning and maintenance procedures, etc.
EU-CIRCLE is the primary scientific and engineering step towards a solid approach for assessing infrastructure resilience to climate change and, in addition, towards an innovative prototype solution for high added value and detailed modelling of large scale interconnected CI supported by modules to assess cost – efficient adaptation of solutions in different types of scenarios. EU-CIRCLE will provide the generic plug-and-play environment for different and diverse types of simulation models and climate information to be introduced and will apply partners’ capabilities (models, climate data, risk – resilience assessment, adaptation scenarios) in the suggested test cases [22].
23European Environment Agency http://www.eea.europa.eu/publications/climate-impacts-and-vulnerability-2012 2012
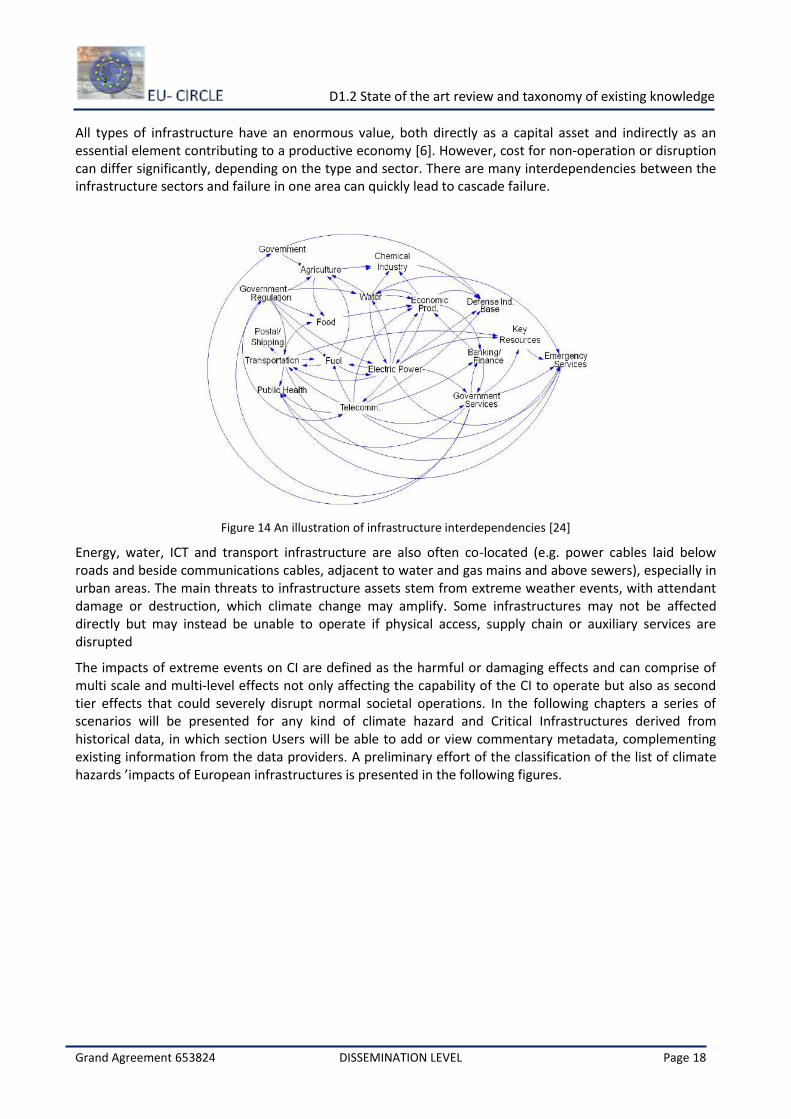
D1.2 State of the art review and taxonomy of existing knowledge
Grand Agreement 653824 DISSEMINATION LEVEL Page 18
All types of infrastructure have an enormous value, both directly as a capital asset and indirectly as an essential element contributing to a productive economy [6]. However, cost for non-operation or disruption can differ significantly, depending on the type and sector. There are many interdependencies between the infrastructure sectors and failure in one area can quickly lead to cascade failure.
Figure 14 An illustration of infrastructure interdependencies [24]
Energy, water, ICT and transport infrastructure are also often co-located (e.g. power cables laid below roads and beside communications cables, adjacent to water and gas mains and above sewers), especially in urban areas. The main threats to infrastructure assets stem from extreme weather events, with attendant damage or destruction, which climate change may amplify. Some infrastructures may not be affected directly but may instead be unable to operate if physical access, supply chain or auxiliary services are disrupted
The impacts of extreme events on CI are defined as the harmful or damaging effects and can comprise of multi scale and multi-level effects not only affecting the capability of the CI to operate but also as second tier effects that could severely disrupt normal societal operations. In the following chapters a series of scenarios will be presented for any kind of climate hazard and Critical Infrastructures derived from historical data, in which section Users will be able to add or view commentary metadata, complementing existing information from the data providers. A preliminary effort of the classification of the list of climate hazards ’impacts of European infrastructures is presented in the following figures.
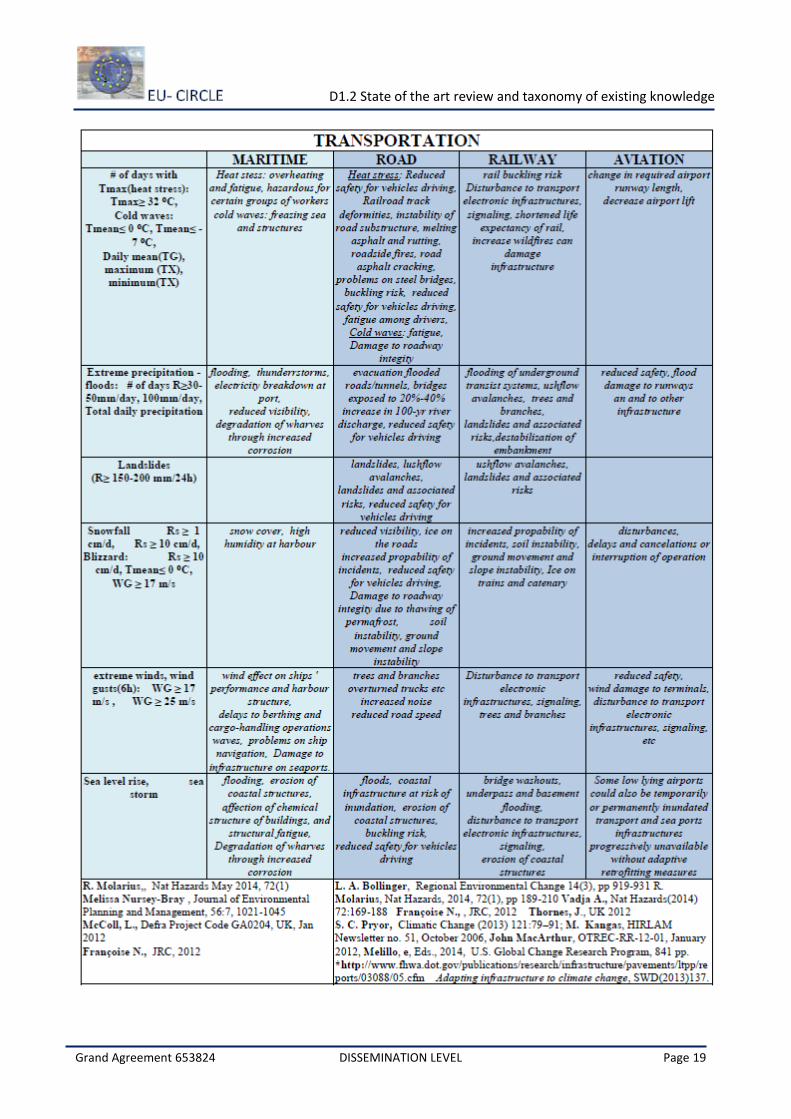
D1.2 State of the art review and taxonomy of existing knowledge
Grand Agreement 653824 DISSEMINATION LEVEL Page 19
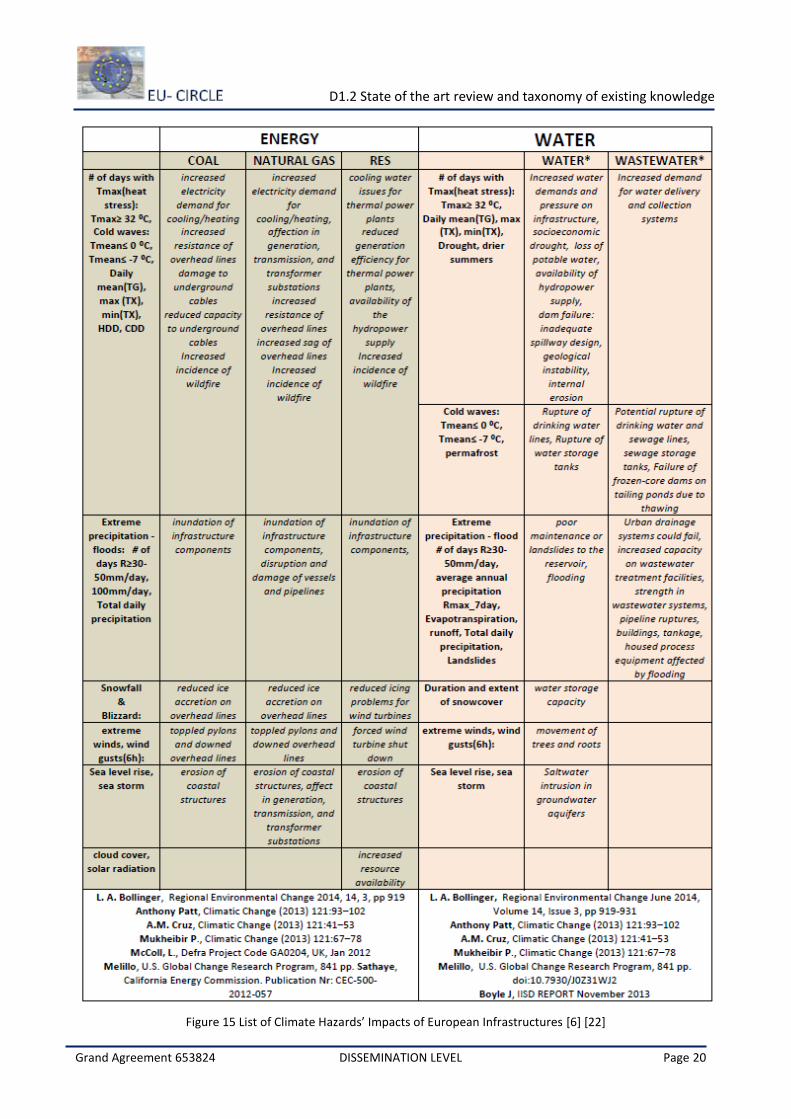
D1.2 State of the art review and taxonomy of existing knowledge
Grand Agreement 653824 DISSEMINATION LEVEL Page 20
Figure 15 List of Climate Hazards’ Impacts of European Infrastructures [6] [22]
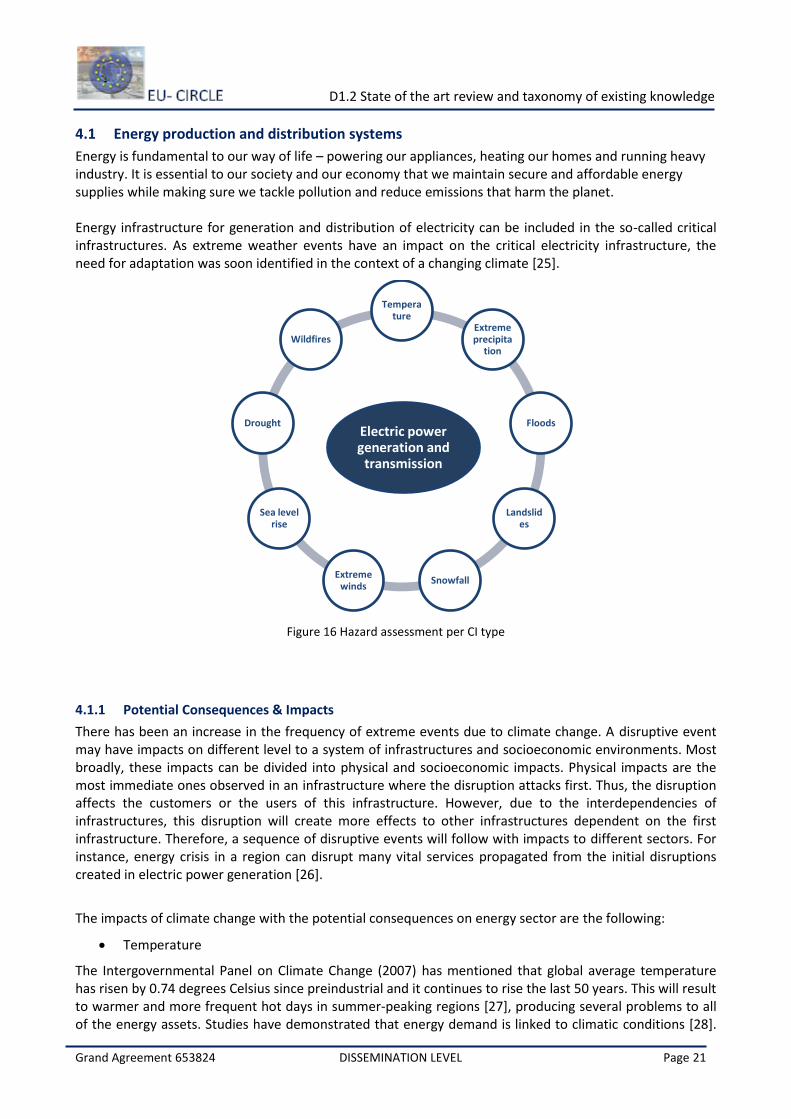
D1.2 State of the art review and taxonomy of existing knowledge
Grand Agreement 653824 DISSEMINATION LEVEL Page 21
4.1 Energy production and distribution systems
Energy is fundamental to our way of life – powering our appliances, heating our homes and running heavy industry. It is essential to our society and our economy that we maintain secure and affordable energy supplies while making sure we tackle pollution and reduce emissions that harm the planet. Energy infrastructure for generation and distribution of electricity can be included in the so-called critical infrastructures. As extreme weather events have an impact on the critical electricity infrastructure, the need for adaptation was soon identified in the context of a changing climate [25].
Figure 16 Hazard assessment per CI type
4.1.1 Potential Consequences & Impacts
There has been an increase in the frequency of extreme events due to climate change. A disruptive event may have impacts on different level to a system of infrastructures and socioeconomic environments. Most broadly, these impacts can be divided into physical and socioeconomic impacts. Physical impacts are the most immediate ones observed in an infrastructure where the disruption attacks first. Thus, the disruption affects the customers or the users of this infrastructure. However, due to the interdependencies of infrastructures, this disruption will create more effects to other infrastructures dependent on the first infrastructure. Therefore, a sequence of disruptive events will follow with impacts to different sectors. For instance, energy crisis in a region can disrupt many vital services propagated from the initial disruptions created in electric power generation [26].
The impacts of climate change with the potential consequences on energy sector are the following:
Temperature
The Intergovernmental Panel on Climate Change (2007) has mentioned that global average temperature has risen by 0.74 degrees Celsius since preindustrial and it continues to rise the last 50 years. This will result to warmer and more frequent hot days in summer-peaking regions [27], producing several problems to all of the energy assets. Studies have demonstrated that energy demand is linked to climatic conditions [28].
Electric power generation and
transmission
Temperature
Extreme precipita
tion
Floods
Landslides
SnowfallExtreme
winds
Sea level rise
Drought
Wildfires
D1.2 State of the art review and taxonomy of existing knowledge
Grand Agreement 653824 DISSEMINATION LEVEL Page 22
Regarding electricity sector, electricity transmission infrastructure works less efficiently during hot days because of the additional resistance induced [29]. For example, in summer of 2003, due to the heatwave, more than 30 nuclear power plant units in Europe forced to reduced their production because of limitations to discharge cooling water [30]. In particular, if equipment cannot cool off sufficiently during night, this may even lead to a breakdown of the equipment and service disruption [31]. Impacts on energy demand for heating and cooling are expected to be considerable, even in central Europe: in Switzerland, a 33-44% decrease in the annual heating energy demand is foreseen for the period 2050-2100 for residential buildings, but the cooling demand for office buildings will increase by 223 - 1050% [32]. There are, however, important regional differences [33] depending on the climate zone and the building quality, as well as cultural and sociological factors.
Moreover, regards to electricity transmission, there could be an impact on equipment ratings (e.g. switchgear, transformers & control centre equipment) which may lead to a possible reduction in the flexibility of the network, increased air conditioning demand or potential health risks. Examining electricity generators in high temperature scenarios, this could have an impact on gas turbine or steam turbine efficiency & net output.
Extreme precipitation
Increased frequency and intensity of extreme precipitation might increase the flood risk to infrastructure power plants, substations and underground transmission infrastructure having as a result the infrastructure components inundation. As it is reported on [34] there has been significantly increased precipitation over northern Europe between 1900 and 2005, particularly noticeable since about 1979. There have been more frequent spells of very wet weather and an increase in total precipitation, at least during the last 40 years. Furthermore, it is considered likely that winters will become significantly wetter and that extreme winter precipitation will increase.
Extreme precipitation may affect renewables. Changing annual or seasonal patterns can affect river flows and water levels behind dams, either reducing or increasing power output [35]. Hydropower may be affected which makes up 20% of the total installed capacity for electricity generation in Europe [36]. Because of the reduction of solar radiation, solar photovoltaic power may be affected as well, reducing panel efficiency [35].
Floods
The main risk that flooding poses to the energy sector concerns power stations, electricity transmission and major distribution substations, as overhead lines, underground cables and gas pipelines appear to be less vulnerable to both fluvial and short-term coastal/tidal flooding [37]. Major fluvial and pluvial flooding events have occurred in the UK in recent years, with electricity supplies being affected.
Landslides
As it is well described in [20] the downward movement of ground under gravity may be relatively slow (slides) or fast (rockfalls) and may also affect flat ground above and below the moving slope. A slope remains stable while its strength is greater than the stress imposed by gravity. Other factors that determine the risk of landslides include the type of geological material; fractures and joints, the angle of the slope, and the position of the water table.
Landslides may damage infrastructure in two ways: a) if infrastructure is in the landslide runout zone is struck by moving debris, b) if infrastructure is placed on unstable ground and is moved suddenly or episodically as the main body of the landslide moves. In addition to that, landslides can affect energy production and delivery facilities, cause supply disruptions and affect infrastructure that depends on the energy supply [38].
D1.2 State of the art review and taxonomy of existing knowledge
Grand Agreement 653824 DISSEMINATION LEVEL Page 23
Snowfall
Snow and ice may damage transmission and distribution lines (e.g. through sagging) [35]. Unfortunately, there is a lack of information regarding impacts of snowfall on energy critical infrastructure.
Extreme winds
In general, with regard to wind energy, experts expect to see “winners” and “losers” – regions where wind energy development may benefit from climate change and regions, where the wind energy industry may be negatively impacted. Focusing on renewables, extreme winds may affect wind power by reducing generation because turbines cannot operate in very high winds. Additionally, they could produce higher waves which can threaten the structural integrity of off-shore wind turbines [39]. Regarding hydropower, extreme winds can increase surface evaporation, reducing water storage and power output [35]. In addition, thermal power infrastructure, transmission and distribution lines may be damaged due to these extreme winds [35].
Sea level rise
Climate change is likely to double the risk of coastal flooding by 2030 [40]. Moreover, higher sea levels increase the risk of coastal flooding from storm surges associated with hurricanes and coastal storms [41]. Sea level rise put at risk, low-lying plants and other electricity infrastructures [41]. As thermo-electric power plants are generally sited near water bodies in order to provide them with cooling water, they could become more vulnerable to coastal flooding due to rising sea levels and increasing storm surges [42].
Drought
Electricity sector is highly dependent on water for cooling. Nearly all thermal power plants—coal, natural gas, nuclear, biomass, geothermal, and solar thermal plants— require water for condensing the steam that drives the turbines. In fact, power production accounts for the single largest share—two-fifths—of all freshwater withdrawals in the United States. As average global temperatures continue to rise, droughts and reduced water supplies are likely to become the norm in some regions, as well as the thermal power plants rely heavily on water for cooling, a changing climate is likely to put them at higher risk from drought [41]. The availability of cooling water is the most limiting factor for the efficiency of thermal power plants. Therefore, the parameters air temperature, precipitation and combined events have the biggest influence [43]
Wildfires
Wildfires have important consequences for the power sector. They can directly damage transmission poles and other electricity infrastructure. However, the greatest risk comes from smoke and particulate matter. Smoke and ash from fires can ionize the air, creating an electrical path away from transmission lines [41]. Higher air temperatures have led to drier forests and earlier snowmelts, both of which contribute to wildfire risk [44] [45]. Droughts and higher air temperatures also help make wildfires more intense and longer-lasting.
The following table show the relationship between climate change projections and implications for the energy sector [46]:
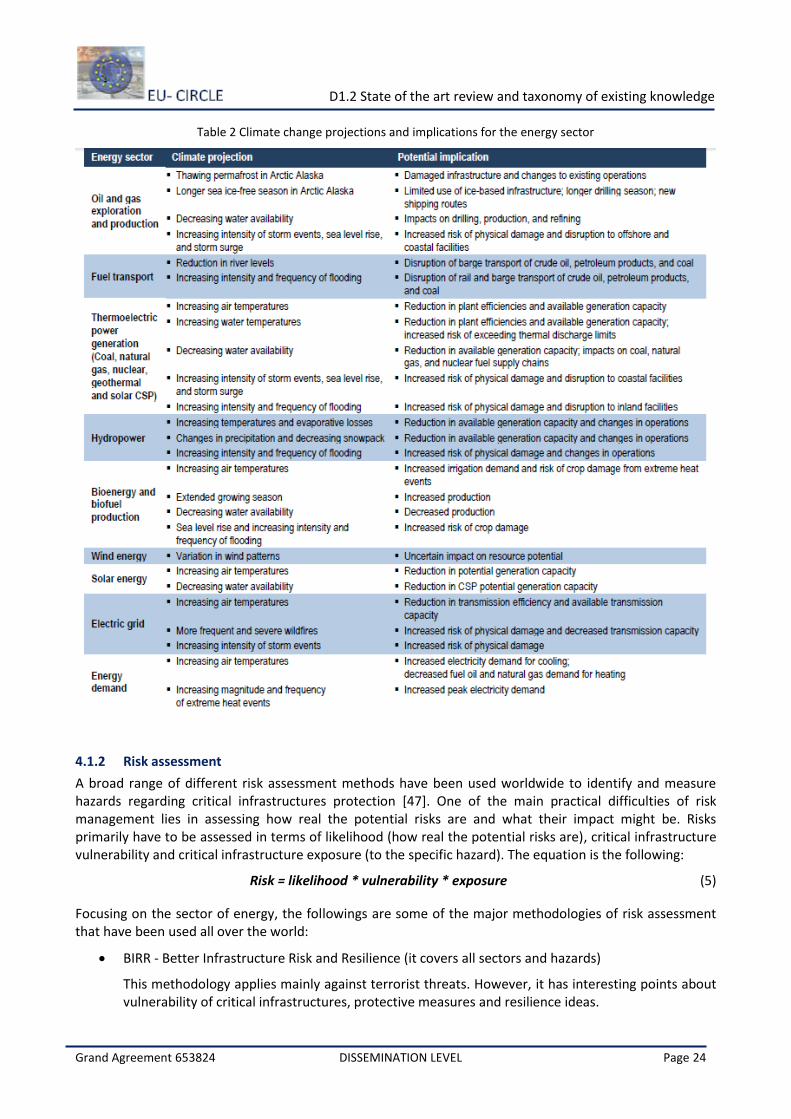
D1.2 State of the art review and taxonomy of existing knowledge
Grand Agreement 653824 DISSEMINATION LEVEL Page 24
Table 2 Climate change projections and implications for the energy sector
4.1.2 Risk assessment
A broad range of different risk assessment methods have been used worldwide to identify and measure hazards regarding critical infrastructures protection [47]. One of the main practical difficulties of risk management lies in assessing how real the potential risks are and what their impact might be. Risks primarily have to be assessed in terms of likelihood (how real the potential risks are), critical infrastructure vulnerability and critical infrastructure exposure (to the specific hazard). The equation is the following:
Risk = likelihood * vulnerability * exposure (5)
Focusing on the sector of energy, the followings are some of the major methodologies of risk assessment that have been used all over the world:
BIRR - Better Infrastructure Risk and Resilience (it covers all sectors and hazards)
This methodology applies mainly against terrorist threats. However, it has interesting points about vulnerability of critical infrastructures, protective measures and resilience ideas.
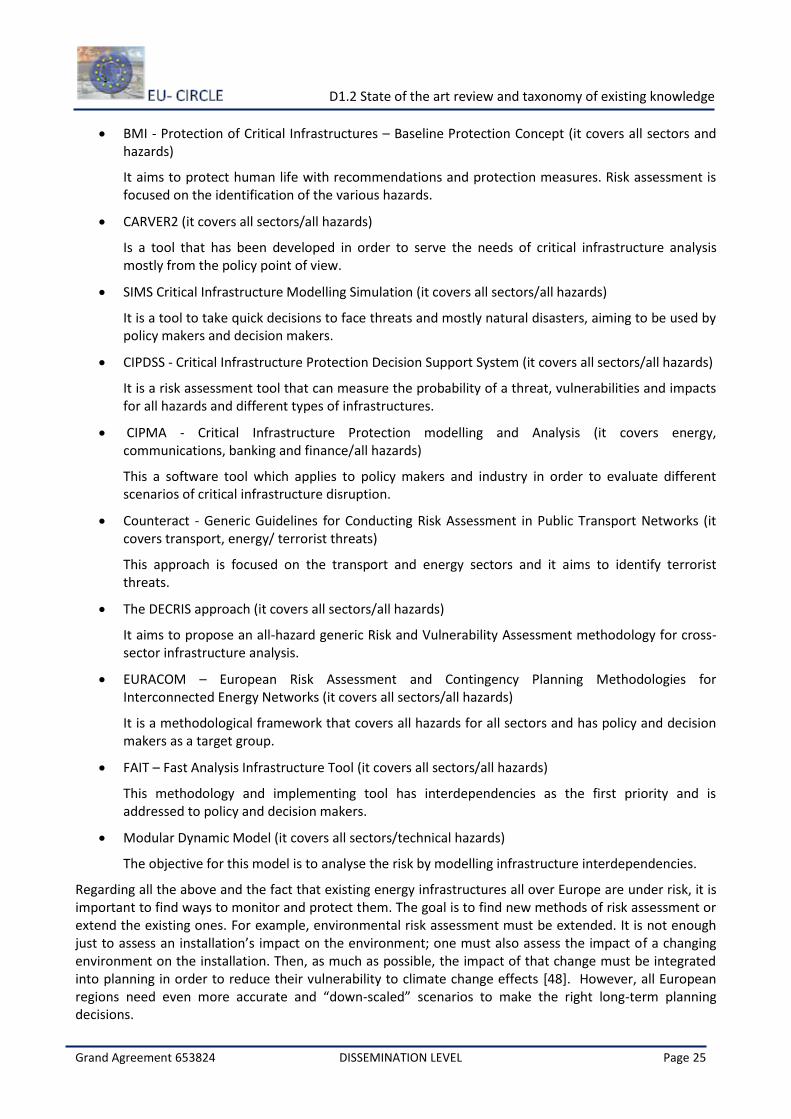
D1.2 State of the art review and taxonomy of existing knowledge
Grand Agreement 653824 DISSEMINATION LEVEL Page 25
BMI - Protection of Critical Infrastructures – Baseline Protection Concept (it covers all sectors and hazards)
It aims to protect human life with recommendations and protection measures. Risk assessment is focused on the identification of the various hazards.
CARVER2 (it covers all sectors/all hazards)
Is a tool that has been developed in order to serve the needs of critical infrastructure analysis mostly from the policy point of view.
SIMS Critical Infrastructure Modelling Simulation (it covers all sectors/all hazards)
It is a tool to take quick decisions to face threats and mostly natural disasters, aiming to be used by policy makers and decision makers.
CIPDSS - Critical Infrastructure Protection Decision Support System (it covers all sectors/all hazards)
It is a risk assessment tool that can measure the probability of a threat, vulnerabilities and impacts for all hazards and different types of infrastructures.
CIPMA - Critical Infrastructure Protection modelling and Analysis (it covers energy, communications, banking and finance/all hazards)
This a software tool which applies to policy makers and industry in order to evaluate different scenarios of critical infrastructure disruption.
Counteract - Generic Guidelines for Conducting Risk Assessment in Public Transport Networks (it covers transport, energy/ terrorist threats)
This approach is focused on the transport and energy sectors and it aims to identify terrorist threats.
The DECRIS approach (it covers all sectors/all hazards)
It aims to propose an all-hazard generic Risk and Vulnerability Assessment methodology for cross-sector infrastructure analysis.
EURACOM – European Risk Assessment and Contingency Planning Methodologies for Interconnected Energy Networks (it covers all sectors/all hazards)
It is a methodological framework that covers all hazards for all sectors and has policy and decision makers as a target group.
FAIT – Fast Analysis Infrastructure Tool (it covers all sectors/all hazards)
This methodology and implementing tool has interdependencies as the first priority and is addressed to policy and decision makers.
Modular Dynamic Model (it covers all sectors/technical hazards)
The objective for this model is to analyse the risk by modelling infrastructure interdependencies.
Regarding all the above and the fact that existing energy infrastructures all over Europe are under risk, it is important to find ways to monitor and protect them. The goal is to find new methods of risk assessment or extend the existing ones. For example, environmental risk assessment must be extended. It is not enough just to assess an installation’s impact on the environment; one must also assess the impact of a changing environment on the installation. Then, as much as possible, the impact of that change must be integrated into planning in order to reduce their vulnerability to climate change effects [48]. However, all European regions need even more accurate and “down-scaled” scenarios to make the right long-term planning decisions.
D1.2 State of the art review and taxonomy of existing knowledge
Grand Agreement 653824 DISSEMINATION LEVEL Page 26
4.1.3 Resilience strategies
To reduce vulnerability of energy critical infrastructure and ensure their future, the energy sector must be more resilient to climate-related risks. Human’s actions and energy choices will play a vital role in both improving the resilient of the energy sector and reducing global warming emissions.
Due to the fact that effects of climate change are unavoidable and already occurring, energy sector clearly needs to better prepare to withstand and recover from those effects. Some of the most common measures are known as “hardening” measures, as they can protect equipment from weather-related damage [41]. Examples of hardening measures are the building of protective sea walls and reinforcing aboveground poles with sturdier materials, to reduce damage during storms and wildfires.
Climate change is posing a great challenge to long-lived infrastructure investments, as the level of uncertainty surrounding its impacts cannot be compared to any other source of uncertainty [49]. Based on that, adaptive plans should be used as a concrete climate resilient investment decisions to limit negative impacts or exploit potential positive impacts of climate change to critical infrastructures’ services [49]. Regarding that statement, resilient measures for the energy sector require improved technologies, information to support decision-making, stakeholder’s engagement and an enabling policy framework [46]. Figure shows examples of illustrative technology opportunities to build more climate resilient energy critical infrastructures [46].
Figure 17 Examples of illustrative technology opportunities to build more climate resilient energy critical infrastructures [46]
In the face of a changing climate, most power plant operators need decision-support to choose valuable adaptation options for their specific site. The first step of such a decision-support is always the identification of the problem, and afterwards a well-structured process of the cyclic procedure of plan, do
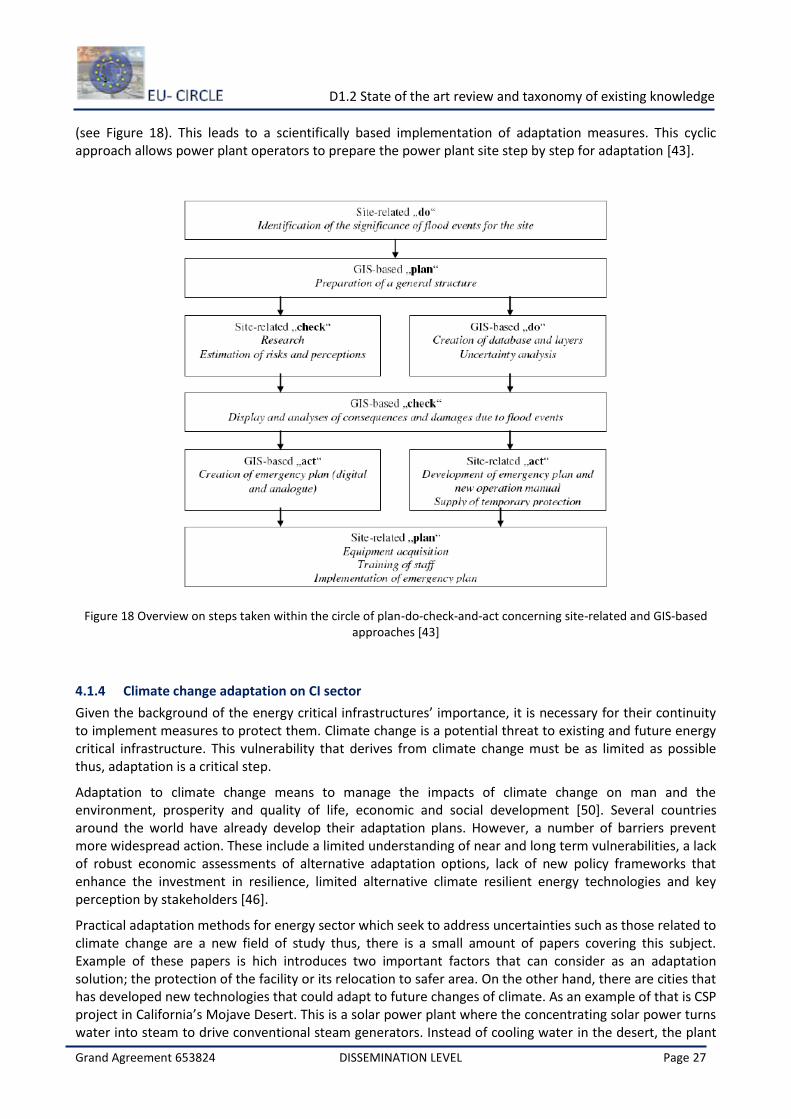
D1.2 State of the art review and taxonomy of existing knowledge
Grand Agreement 653824 DISSEMINATION LEVEL Page 27
(see Figure 18). This leads to a scientifically based implementation of adaptation measures. This cyclic approach allows power plant operators to prepare the power plant site step by step for adaptation [43].
Figure 18 Overview on steps taken within the circle of plan-do-check-and-act concerning site-related and GIS-based approaches [43]
4.1.4 Climate change adaptation on CI sector
Given the background of the energy critical infrastructures’ importance, it is necessary for their continuity to implement measures to protect them. Climate change is a potential threat to existing and future energy critical infrastructure. This vulnerability that derives from climate change must be as limited as possible thus, adaptation is a critical step.
Adaptation to climate change means to manage the impacts of climate change on man and the environment, prosperity and quality of life, economic and social development [50]. Several countries around the world have already develop their adaptation plans. However, a number of barriers prevent more widespread action. These include a limited understanding of near and long term vulnerabilities, a lack of robust economic assessments of alternative adaptation options, lack of new policy frameworks that enhance the investment in resilience, limited alternative climate resilient energy technologies and key perception by stakeholders [46].
Practical adaptation methods for energy sector which seek to address uncertainties such as those related to climate change are a new field of study thus, there is a small amount of papers covering this subject. Example of these papers is hich introduces two important factors that can consider as an adaptation solution; the protection of the facility or its relocation to safer area. On the other hand, there are cities that has developed new technologies that could adapt to future changes of climate. As an example of that is CSP project in California’s Mojave Desert. This is a solar power plant where the concentrating solar power turns water into steam to drive conventional steam generators. Instead of cooling water in the desert, the plant
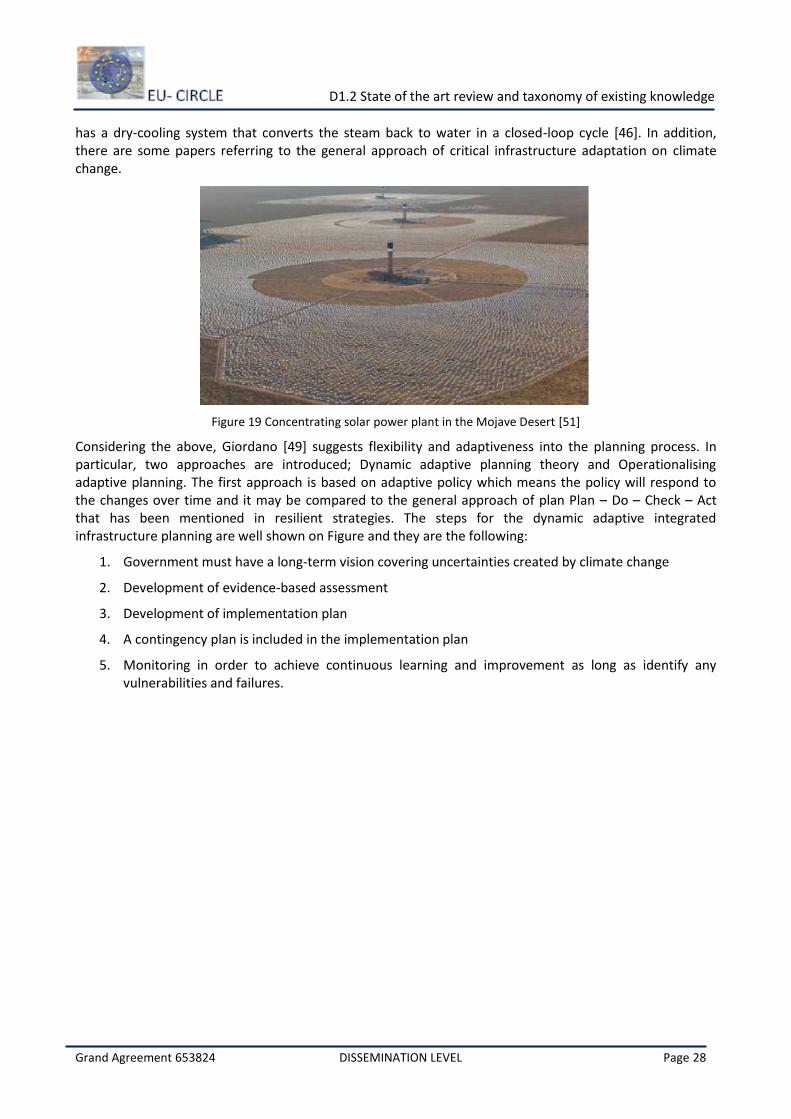
D1.2 State of the art review and taxonomy of existing knowledge
Grand Agreement 653824 DISSEMINATION LEVEL Page 28
has a dry-cooling system that converts the steam back to water in a closed-loop cycle [46]. In addition, there are some papers referring to the general approach of critical infrastructure adaptation on climate change.
Figure 19 Concentrating solar power plant in the Mojave Desert [51]
Considering the above, Giordano [49] suggests flexibility and adaptiveness into the planning process. In particular, two approaches are introduced; Dynamic adaptive planning theory and Operationalising adaptive planning. The first approach is based on adaptive policy which means the policy will respond to the changes over time and it may be compared to the general approach of plan Plan – Do – Check – Act that has been mentioned in resilient strategies. The steps for the dynamic adaptive integrated infrastructure planning are well shown on Figure and they are the following:
1. Government must have a long-term vision covering uncertainties created by climate change
2. Development of evidence-based assessment
3. Development of implementation plan
4. A contingency plan is included in the implementation plan
5. Monitoring in order to achieve continuous learning and improvement as long as identify any vulnerabilities and failures.
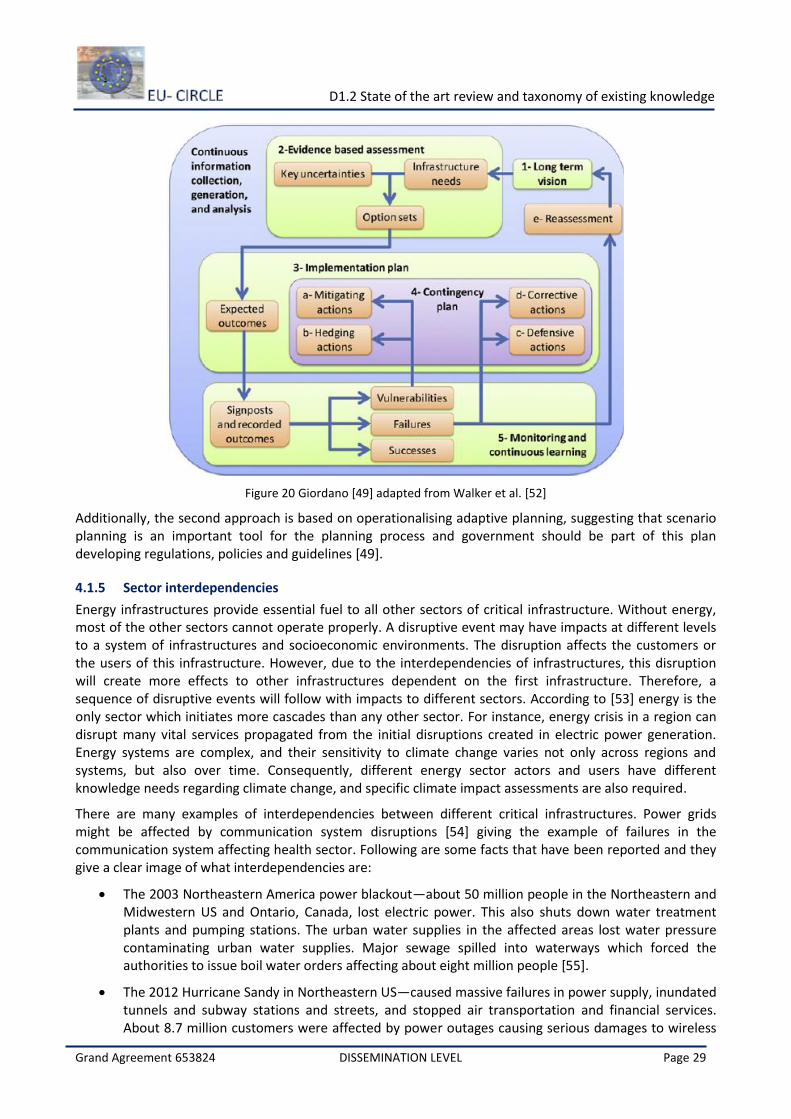
D1.2 State of the art review and taxonomy of existing knowledge
Grand Agreement 653824 DISSEMINATION LEVEL Page 29
Figure 20 Giordano [49] adapted from Walker et al. [52]
Additionally, the second approach is based on operationalising adaptive planning, suggesting that scenario planning is an important tool for the planning process and government should be part of this plan developing regulations, policies and guidelines [49].
4.1.5 Sector interdependencies
Energy infrastructures provide essential fuel to all other sectors of critical infrastructure. Without energy, most of the other sectors cannot operate properly. A disruptive event may have impacts at different levels to a system of infrastructures and socioeconomic environments. The disruption affects the customers or the users of this infrastructure. However, due to the interdependencies of infrastructures, this disruption will create more effects to other infrastructures dependent on the first infrastructure. Therefore, a sequence of disruptive events will follow with impacts to different sectors. According to [53] energy is the only sector which initiates more cascades than any other sector. For instance, energy crisis in a region can disrupt many vital services propagated from the initial disruptions created in electric power generation. Energy systems are complex, and their sensitivity to climate change varies not only across regions and systems, but also over time. Consequently, different energy sector actors and users have different knowledge needs regarding climate change, and specific climate impact assessments are also required.
There are many examples of interdependencies between different critical infrastructures. Power grids might be affected by communication system disruptions [54] giving the example of failures in the communication system affecting health sector. Following are some facts that have been reported and they give a clear image of what interdependencies are:
The 2003 Northeastern America power blackout—about 50 million people in the Northeastern and Midwestern US and Ontario, Canada, lost electric power. This also shuts down water treatment plants and pumping stations. The urban water supplies in the affected areas lost water pressure contaminating urban water supplies. Major sewage spilled into waterways which forced the authorities to issue boil water orders affecting about eight million people [55].
The 2012 Hurricane Sandy in Northeastern US—caused massive failures in power supply, inundated tunnels and subway stations and streets, and stopped air transportation and financial services. About 8.7 million customers were affected by power outages causing serious damages to wireless
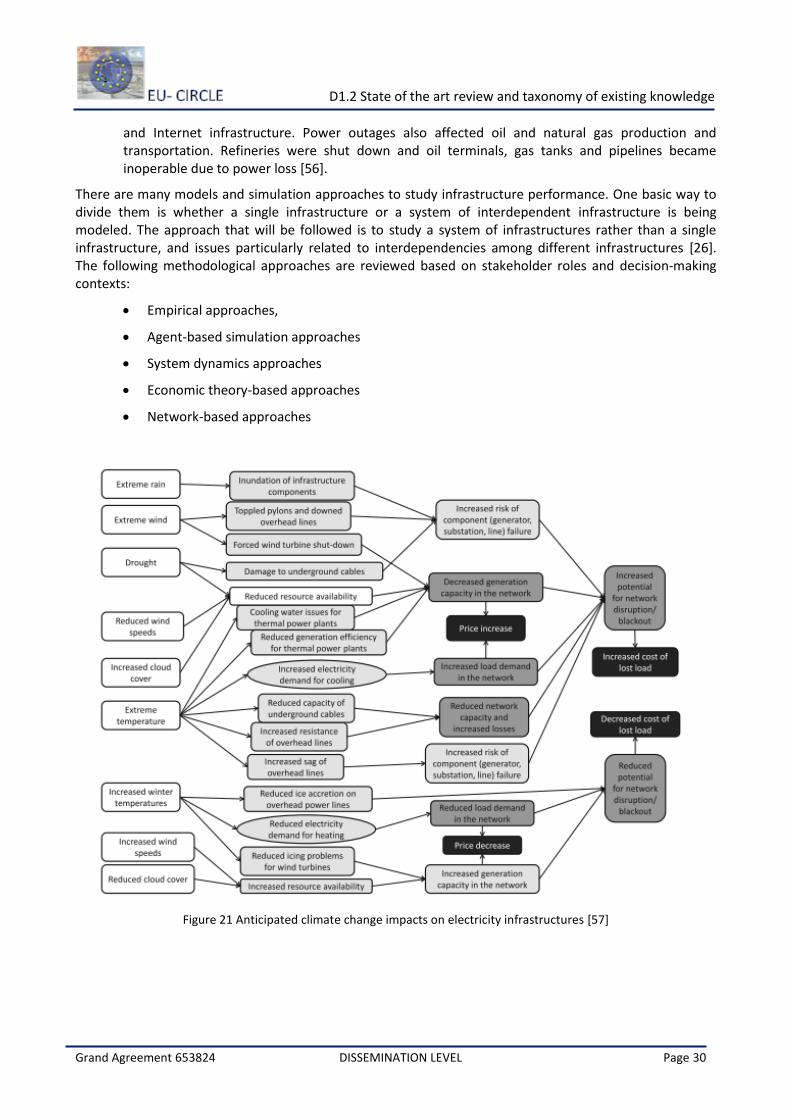
D1.2 State of the art review and taxonomy of existing knowledge
Grand Agreement 653824 DISSEMINATION LEVEL Page 30
and Internet infrastructure. Power outages also affected oil and natural gas production and transportation. Refineries were shut down and oil terminals, gas tanks and pipelines became inoperable due to power loss [56].
There are many models and simulation approaches to study infrastructure performance. One basic way to divide them is whether a single infrastructure or a system of interdependent infrastructure is being modeled. The approach that will be followed is to study a system of infrastructures rather than a single infrastructure, and issues particularly related to interdependencies among different infrastructures [26]. The following methodological approaches are reviewed based on stakeholder roles and decision-making contexts:
Empirical approaches,
Agent-based simulation approaches
System dynamics approaches
Economic theory-based approaches
Network-based approaches
Figure 21 Anticipated climate change impacts on electricity infrastructures [57]
D1.2 State of the art review and taxonomy of existing knowledge
Grand Agreement 653824 DISSEMINATION LEVEL Page 31
4.2 Chemical Industry
The chemicals industry is one of Europe’s largest manufacturing sectors. It:
represents around 7% of EU industrial production and 1.1% of EU GDP;
has sales amounting to EUR 527 billion (2013), ~ 17 % of global chemicals sales; and
provides 1.15 million direct highly-skilled jobs (2013).
It manufactures the following broad categories of chemicals: base chemicals, specialties, and consumer chemicals.
Base chemicals: Consists of petrochemicals, their polymers and basic inorganics. They are often commodity chemicals, and are produced in large volumes and sold within the chemical industry itself or to other industries.
Specialty chemicals: Consists of paints and inks, crop protection, dyes and pigments; these are produced in small volumes.
Consumer chemicals: Consists of soaps, detergents as well as perfumes and cosmetics; and are sold to final consumers.
The chemical industry is considered an ‘enabling industry’, as it supplies two-thirds of its production to other sectors within the manufacturing industry (e.g. base chemicals) (EU Commission, Cefic, the European Chemical Industry Council).
The chemical industry’s supply chain encompasses activities associated with the procurement of raw materials and with the design, manufacture, marketing, distribution, transport, customer support, use, recycling, and disposal of chemical products.
As such, the facilities that make up the Chemical Sector are typically organised according to one of four key functional areas: (1) manufacturing plants, (2) transport and distribution systems, (3) storage and warehousing systems, and (4) chemical end users (Homeland Security).
Manufacturing plants convert raw materials into intermediate and end-products. The chemical manufacturing process can be divided into five stages, each of which may contain one or more processing activities:
1. Receipt of chemical ingredients;
2. Temporary staging or storing of chemical ingredients awaiting use in production;
3. Processing of chemical ingredients into products or intermediates;
4. Temporary staging or storing of chemical products awaiting shipment; and
5. Staging for shipping chemical products.
Distribution and transportation within the Chemical Sector are the means for providing raw materials to the manufacturing plants, transporting intermediate products both within and among chemical facilities, and distributing products to end users. The transportation of chemicals involves cross-country, cross-border, and international commerce. The sector uses all modes of transportation—rail, highway, maritime, air, and pipeline.
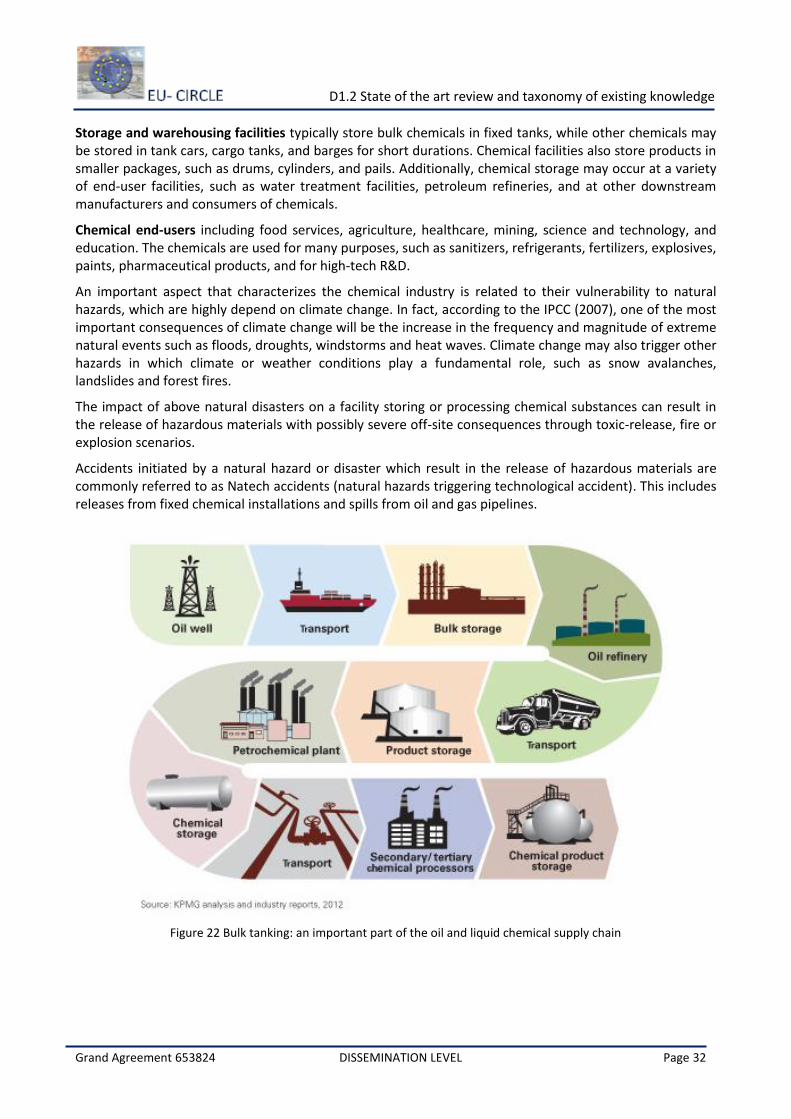
D1.2 State of the art review and taxonomy of existing knowledge
Grand Agreement 653824 DISSEMINATION LEVEL Page 32
Storage and warehousing facilities typically store bulk chemicals in fixed tanks, while other chemicals may be stored in tank cars, cargo tanks, and barges for short durations. Chemical facilities also store products in smaller packages, such as drums, cylinders, and pails. Additionally, chemical storage may occur at a variety of end-user facilities, such as water treatment facilities, petroleum refineries, and at other downstream manufacturers and consumers of chemicals.
Chemical end-users including food services, agriculture, healthcare, mining, science and technology, and education. The chemicals are used for many purposes, such as sanitizers, refrigerants, fertilizers, explosives, paints, pharmaceutical products, and for high-tech R&D.
An important aspect that characterizes the chemical industry is related to their vulnerability to natural hazards, which are highly depend on climate change. In fact, according to the IPCC (2007), one of the most important consequences of climate change will be the increase in the frequency and magnitude of extreme natural events such as floods, droughts, windstorms and heat waves. Climate change may also trigger other hazards in which climate or weather conditions play a fundamental role, such as snow avalanches, landslides and forest fires.
The impact of above natural disasters on a facility storing or processing chemical substances can result in the release of hazardous materials with possibly severe off-site consequences through toxic-release, fire or explosion scenarios.
Accidents initiated by a natural hazard or disaster which result in the release of hazardous materials are commonly referred to as Natech accidents (natural hazards triggering technological accident). This includes releases from fixed chemical installations and spills from oil and gas pipelines.
Figure 22 Bulk tanking: an important part of the oil and liquid chemical supply chain
D1.2 State of the art review and taxonomy of existing knowledge
Grand Agreement 653824 DISSEMINATION LEVEL Page 33
4.2.1 Potential Consequences & Impacts
The chemical industry is vulnerable to hydrometeorological disasters (such as flooding, storms etc.) which can affect and disrupt the industry’s operations, its supply chain as well as impact on the actual infrastructure of chemical facilities. As many chemical facilities store and use significant quantities of hazardous substances, occurrence of hydrometeorological events can lead to breaches of environmental permits or trigger major accidents, with potentially serious consequences [58].
Whilst climate change has been on the agenda of the chemical industry, to date its focus has been on mitigation and the ways in which the industry can reduce its own GHG emissions and contribute to wider mitigation efforts against climate change through innovative chemistry [59] [60] [61]. Very little attention and research has been conducted directly on the impacts of climate change to the industry itself. Some work has begun in the UK, with both the UK Chemicals Industry Association and the UK Government identifying the need to address the impacts of natural disasters and climate change. According, to the UK’s Climate Change Risk Assessment for the Business, Industry and Services Sector the chemical manufacturing industry is exposed to the following future physical risks due to climate change and the ensuing potential increase in the incidence of natural disasters:
Use of water and subsequent discharge in times of drought (affecting environmental compliance);
Accidental discharge due to floods (affecting environmental compliance);
Security of supply chains;
Impacts to the infrastructure of factories and depots;
Worker health and safety (e.g. heat stress);
Disruption to utility supplies (water, electricity and gas);
Price fluctuation and increases in raw materials and commodities;
Disruption and/or increase in the risk of transportation of volatile chemicals and the disposal of
hazardous waste;
Destruction of storage depots of volatile chemicals and hazardous waste, leading to loss of
containment (affecting environmental compliance).
Furthermore, the sector’s infrastructure is often concentrated along the coast and riverside ports due to its considerable reliance on maritime logistics and pipeline infrastructure. This exposes the sector’s infrastructure to coastal erosion and flooding by sea level rise, tidal and storm surges (Acclimatise, 2010). In addition, hydrometeorological events can cause damage and degradation to the industry’s buildings, grounds, plants and machinery; which is further complicated by the presence of ageing infrastructure as some of the sector’s plant and machinery have long lifetimes [62].
Perhaps the most important aspect of natural disasters in relation to the chemical industry is that they can trigger so-called Natech events [63]. A Natech is a technological disaster triggered by any type of natural disaster. The technological disaster can include damage to industrial facilities housing hazardous materials (hazmat), gas and oil pipelines, and lifeline systems resulting in significant adverse effects to the health of people, property, and/or the environment (ISPRA workshop). Adverse effects are usually a result of the release of hazardous substances that are either processed or stored on site. Large-scale releases may pose serious water, soil and air contamination, as well as extreme fire and explosion threats [64].
Natechs are characterised by several features which highlight their significance against other types of industrial accidents [65] [66]:
a) multiple hazmat releases may occur simultaneously as more than one chemical site may be affected throughout the impact zone;
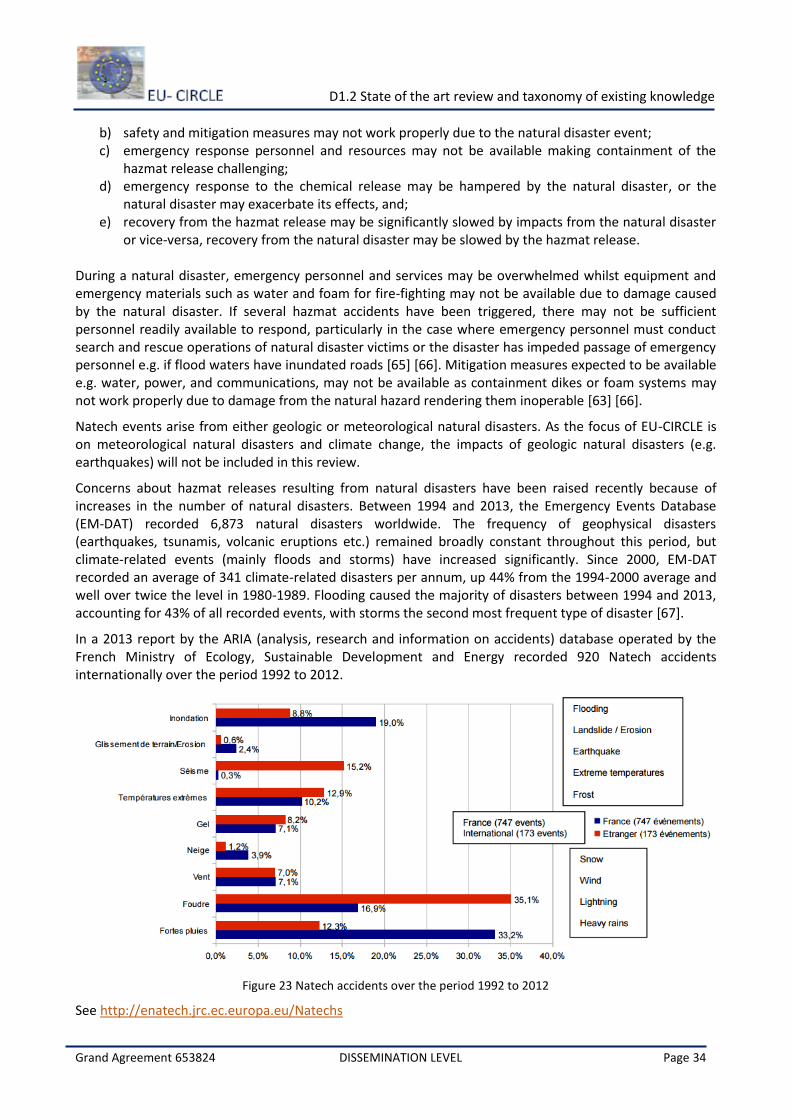
D1.2 State of the art review and taxonomy of existing knowledge
Grand Agreement 653824 DISSEMINATION LEVEL Page 34
b) safety and mitigation measures may not work properly due to the natural disaster event; c) emergency response personnel and resources may not be available making containment of the
hazmat release challenging; d) emergency response to the chemical release may be hampered by the natural disaster, or the
natural disaster may exacerbate its effects, and; e) recovery from the hazmat release may be significantly slowed by impacts from the natural disaster
or vice-versa, recovery from the natural disaster may be slowed by the hazmat release. During a natural disaster, emergency personnel and services may be overwhelmed whilst equipment and emergency materials such as water and foam for fire-fighting may not be available due to damage caused by the natural disaster. If several hazmat accidents have been triggered, there may not be sufficient personnel readily available to respond, particularly in the case where emergency personnel must conduct search and rescue operations of natural disaster victims or the disaster has impeded passage of emergency personnel e.g. if flood waters have inundated roads [65] [66]. Mitigation measures expected to be available e.g. water, power, and communications, may not be available as containment dikes or foam systems may not work properly due to damage from the natural hazard rendering them inoperable [63] [66].
Natech events arise from either geologic or meteorological natural disasters. As the focus of EU-CIRCLE is on meteorological natural disasters and climate change, the impacts of geologic natural disasters (e.g. earthquakes) will not be included in this review.
Concerns about hazmat releases resulting from natural disasters have been raised recently because of increases in the number of natural disasters. Between 1994 and 2013, the Emergency Events Database (EM-DAT) recorded 6,873 natural disasters worldwide. The frequency of geophysical disasters (earthquakes, tsunamis, volcanic eruptions etc.) remained broadly constant throughout this period, but climate-related events (mainly floods and storms) have increased significantly. Since 2000, EM-DAT recorded an average of 341 climate-related disasters per annum, up 44% from the 1994-2000 average and well over twice the level in 1980-1989. Flooding caused the majority of disasters between 1994 and 2013, accounting for 43% of all recorded events, with storms the second most frequent type of disaster [67].
In a 2013 report by the ARIA (analysis, research and information on accidents) database operated by the French Ministry of Ecology, Sustainable Development and Energy recorded 920 Natech accidents internationally over the period 1992 to 2012.
Figure 23 Natech accidents over the period 1992 to 2012
See http://enatech.jrc.ec.europa.eu/Natechs
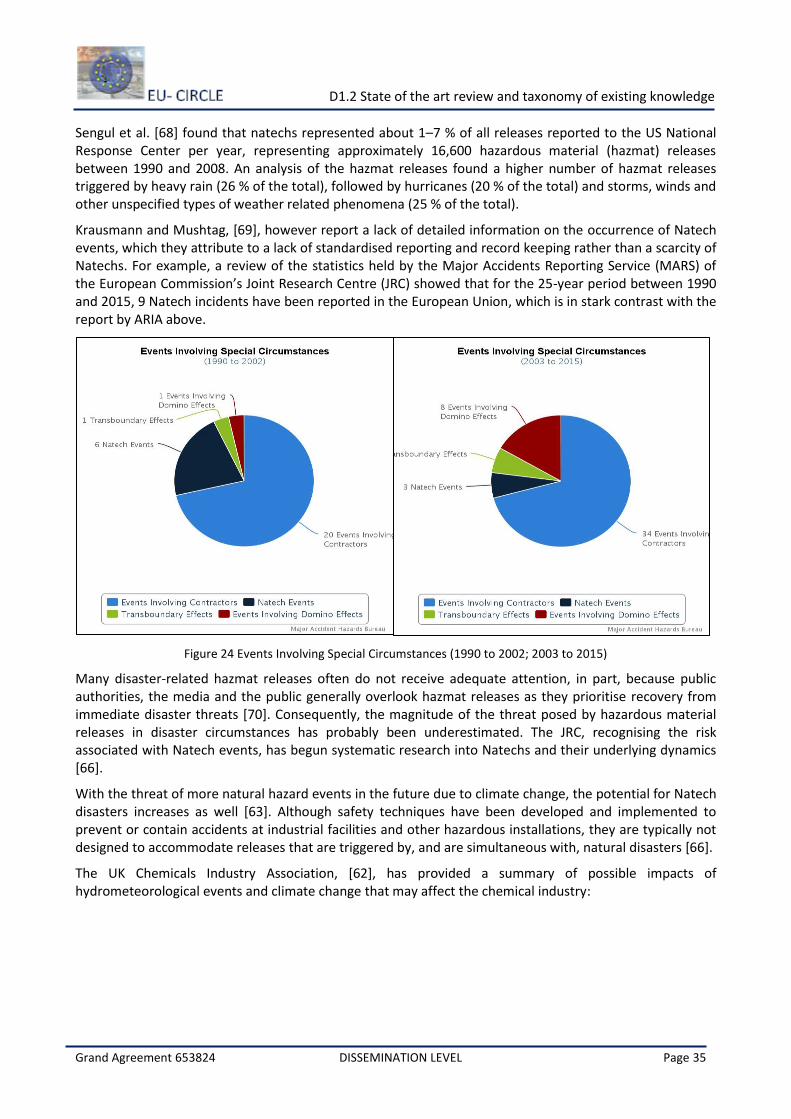
D1.2 State of the art review and taxonomy of existing knowledge
Grand Agreement 653824 DISSEMINATION LEVEL Page 35
Sengul et al. [68] found that natechs represented about 1–7 % of all releases reported to the US National Response Center per year, representing approximately 16,600 hazardous material (hazmat) releases between 1990 and 2008. An analysis of the hazmat releases found a higher number of hazmat releases triggered by heavy rain (26 % of the total), followed by hurricanes (20 % of the total) and storms, winds and other unspecified types of weather related phenomena (25 % of the total).
Krausmann and Mushtag, [69], however report a lack of detailed information on the occurrence of Natech events, which they attribute to a lack of standardised reporting and record keeping rather than a scarcity of Natechs. For example, a review of the statistics held by the Major Accidents Reporting Service (MARS) of the European Commission’s Joint Research Centre (JRC) showed that for the 25-year period between 1990 and 2015, 9 Natech incidents have been reported in the European Union, which is in stark contrast with the report by ARIA above.
Figure 24 Events Involving Special Circumstances (1990 to 2002; 2003 to 2015)
Many disaster-related hazmat releases often do not receive adequate attention, in part, because public authorities, the media and the public generally overlook hazmat releases as they prioritise recovery from immediate disaster threats [70]. Consequently, the magnitude of the threat posed by hazardous material releases in disaster circumstances has probably been underestimated. The JRC, recognising the risk associated with Natech events, has begun systematic research into Natechs and their underlying dynamics [66].
With the threat of more natural hazard events in the future due to climate change, the potential for Natech disasters increases as well [63]. Although safety techniques have been developed and implemented to prevent or contain accidents at industrial facilities and other hazardous installations, they are typically not designed to accommodate releases that are triggered by, and are simultaneous with, natural disasters [66].
The UK Chemicals Industry Association, [62], has provided a summary of possible impacts of hydrometeorological events and climate change that may affect the chemical industry:
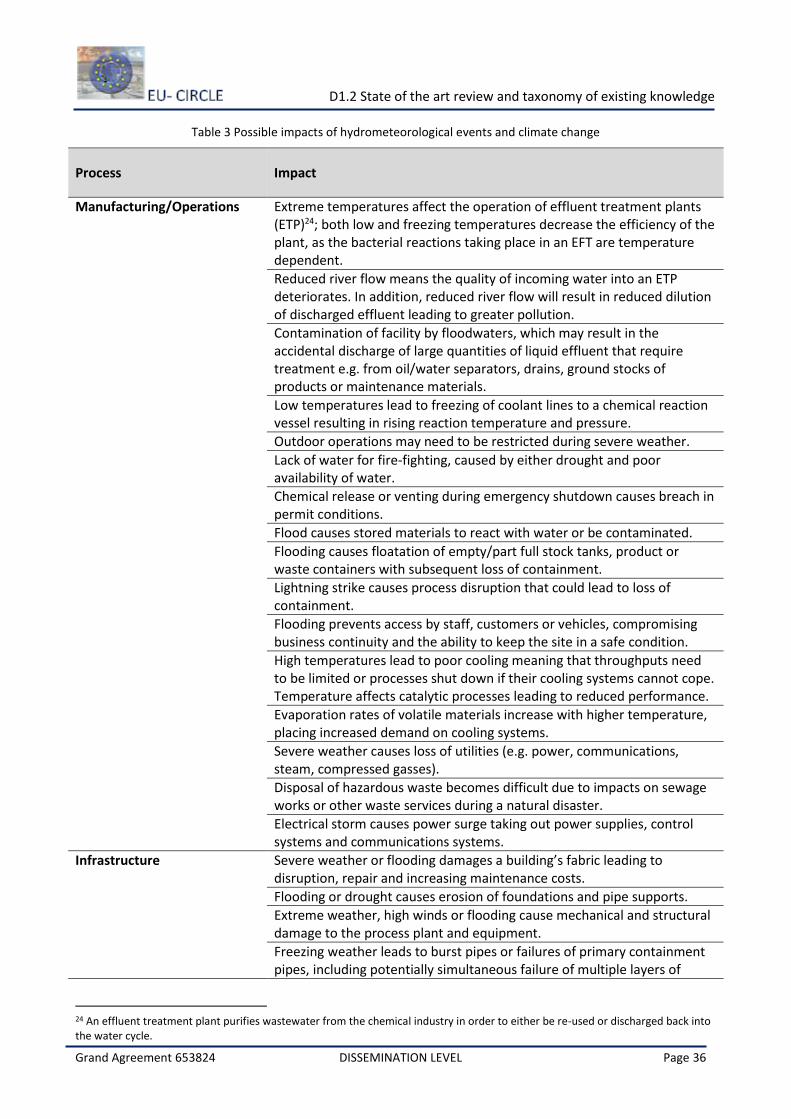
D1.2 State of the art review and taxonomy of existing knowledge
Grand Agreement 653824 DISSEMINATION LEVEL Page 36
Table 3 Possible impacts of hydrometeorological events and climate change
Process Impact
Manufacturing/Operations Extreme temperatures affect the operation of effluent treatment plants (ETP)24; both low and freezing temperatures decrease the efficiency of the plant, as the bacterial reactions taking place in an EFT are temperature dependent.
Reduced river flow means the quality of incoming water into an ETP deteriorates. In addition, reduced river flow will result in reduced dilution of discharged effluent leading to greater pollution.
Contamination of facility by floodwaters, which may result in the accidental discharge of large quantities of liquid effluent that require treatment e.g. from oil/water separators, drains, ground stocks of products or maintenance materials.
Low temperatures lead to freezing of coolant lines to a chemical reaction vessel resulting in rising reaction temperature and pressure.
Outdoor operations may need to be restricted during severe weather.
Lack of water for fire-fighting, caused by either drought and poor availability of water.
Chemical release or venting during emergency shutdown causes breach in permit conditions.
Flood causes stored materials to react with water or be contaminated.
Flooding causes floatation of empty/part full stock tanks, product or waste containers with subsequent loss of containment.
Lightning strike causes process disruption that could lead to loss of containment.
Flooding prevents access by staff, customers or vehicles, compromising business continuity and the ability to keep the site in a safe condition.
High temperatures lead to poor cooling meaning that throughputs need to be limited or processes shut down if their cooling systems cannot cope. Temperature affects catalytic processes leading to reduced performance.
Evaporation rates of volatile materials increase with higher temperature, placing increased demand on cooling systems.
Severe weather causes loss of utilities (e.g. power, communications, steam, compressed gasses).
Disposal of hazardous waste becomes difficult due to impacts on sewage works or other waste services during a natural disaster.
Electrical storm causes power surge taking out power supplies, control systems and communications systems.
Infrastructure
Severe weather or flooding damages a building’s fabric leading to disruption, repair and increasing maintenance costs.
Flooding or drought causes erosion of foundations and pipe supports.
Extreme weather, high winds or flooding cause mechanical and structural damage to the process plant and equipment.
Freezing weather leads to burst pipes or failures of primary containment pipes, including potentially simultaneous failure of multiple layers of
24 An effluent treatment plant purifies wastewater from the chemical industry in order to either be re-used or discharged back into the water cycle.
D1.2 State of the art review and taxonomy of existing knowledge
Grand Agreement 653824 DISSEMINATION LEVEL Page 37
protection against loss of containment.
Heavy rain, snow and ice causes water to collect on the roofs of stock tanks causing collapse and loss of containment of the tanks contents.
Flooding causes equipment or machinery to become inoperable. For example, electrical equipment, rotating mechanical equipment, control equipment etc.
Lightning causes fire due to direct action or provision of an ignition source.
Water and other ‘wet’ lines freeze, this can lead to frozen cooling towers and frozen sprinkler systems
High winds during a storm can blow site litter or contaminated debris off-site.
Flooding, heavy rain or drought can cause landslides or subsidence in the sites of chemical facilities as well as damage to pipelines.
Transportation and distribution
Emergency services are unable to access the site or are unavailable because they are responding to the natural disaster.
Increased road accidents involving transportation of chemicals due to bad weather.
Weather or climate impacts can affect the availability of raw materials. Business interruption can result, particularly if there is only a single source of a key material.
The temperature range of volatile chemicals is exceeded during transport. More refrigerated distribution is required, increasing costs.
Loss or hazard due to loss of containment during transport, such as of materials that are reactive or require refrigeration.
4.2.2 Risk assessment
Evidence [63] [71] [72] [73] indicates that in most countries industrial risk management practices for chemical accident prevention fall short in considering Natech accidents, particularly as most regulatory frameworks do not explicitly require chemical facilities to analyse the Natech risk in a given location. As stated previously, whilst Seveso III requires industrial establishments to consider external hazards in their hazard analyses, the Directive does not specify methodologies or actions that can be taken to achieve this requirement, resulting in patchy levels of preparedness among EU countries [63] [72]. Furthermore, the OECD (2006) reports that natural and technological disasters are generally studied as separate events with little information available on their interactions. For instance, even when local emergency response plans are designed for multiple hazards (natural, industrial etc.) the latter are usually not expected to occur simultaneously. Furthermore, standard Quantitative Risk Assessment (QRA) does not take into account climate change or, in the case of the chemical industry, the risk of a Natech event. Because of the multi-hazard nature of Natech risk, the QRA procedure must be extended to take into account the characteristics of Natech accident scenarios. Natech risk assessment differs from standard QRA in that it requires a detailed characterization of the triggering natural hazard/disaster and an analysis of the final accident scenarios. In addition, methodologies and tools for the assessment of Natech risk are scarce, and only limited guidance for industry and the authorities on how to assess Natech risk is available [73]. Thus, dedicated models and tools are required to extend the standard QRA procedure to Natech risk assessment, for example:
specific damage models to estimate the extent and probability of equipment damage caused by a natural event;
a specific procedure to account for the possibility of simultaneous releases from more than a single process or storage unit.
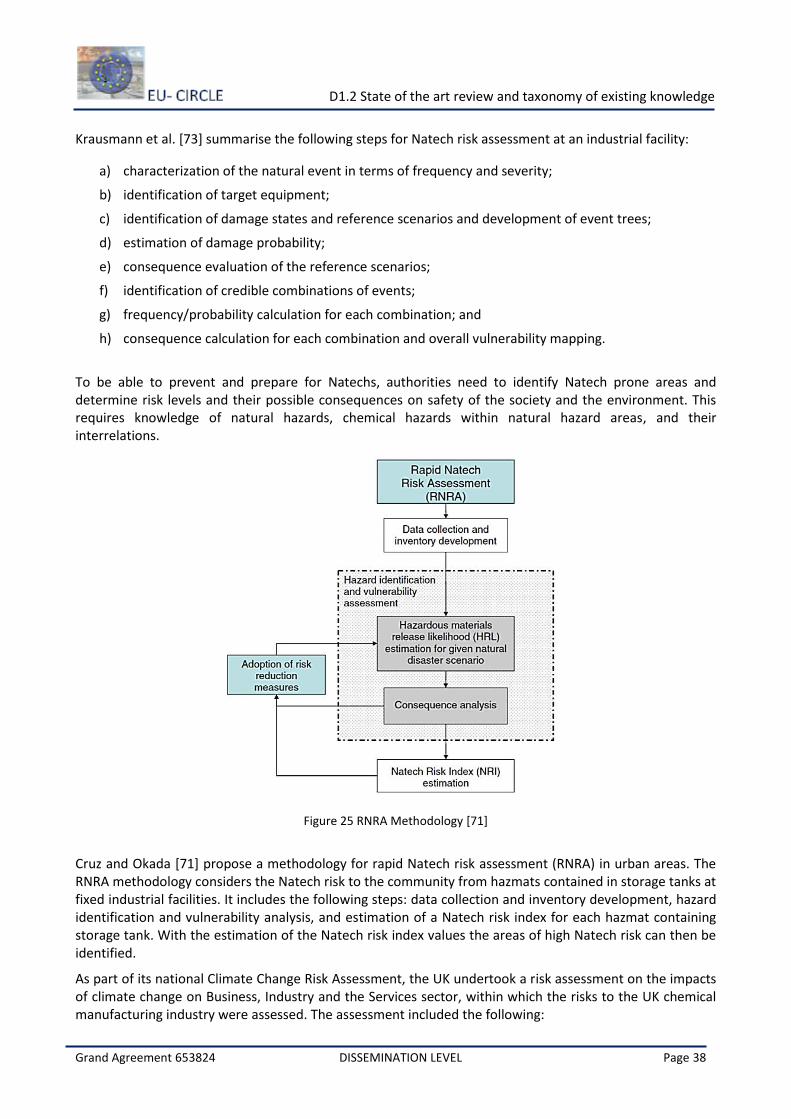
D1.2 State of the art review and taxonomy of existing knowledge
Grand Agreement 653824 DISSEMINATION LEVEL Page 38
Krausmann et al. [73] summarise the following steps for Natech risk assessment at an industrial facility:
a) characterization of the natural event in terms of frequency and severity;
b) identification of target equipment;
c) identification of damage states and reference scenarios and development of event trees;
d) estimation of damage probability;
e) consequence evaluation of the reference scenarios;
f) identification of credible combinations of events;
g) frequency/probability calculation for each combination; and
h) consequence calculation for each combination and overall vulnerability mapping.
To be able to prevent and prepare for Natechs, authorities need to identify Natech prone areas and determine risk levels and their possible consequences on safety of the society and the environment. This requires knowledge of natural hazards, chemical hazards within natural hazard areas, and their interrelations.
Figure 25 RNRA Methodology [71]
Cruz and Okada [71] propose a methodology for rapid Natech risk assessment (RNRA) in urban areas. The RNRA methodology considers the Natech risk to the community from hazmats contained in storage tanks at fixed industrial facilities. It includes the following steps: data collection and inventory development, hazard identification and vulnerability analysis, and estimation of a Natech risk index for each hazmat containing storage tank. With the estimation of the Natech risk index values the areas of high Natech risk can then be identified.
As part of its national Climate Change Risk Assessment, the UK undertook a risk assessment on the impacts of climate change on Business, Industry and the Services sector, within which the risks to the UK chemical manufacturing industry were assessed. The assessment included the following:
D1.2 State of the art review and taxonomy of existing knowledge
Grand Agreement 653824 DISSEMINATION LEVEL Page 39
Identification and characterisation of the impacts of climate change. Initially, a Tier 1 list of impacts
was developed, which included cross-sectoral and indirect consequences.
Identification of significant impacts from the Tier 1 list for closer analysis. The higher priority
impacts were selected by stakeholder groups based on the social, environmental and economic
magnitude of the impacts and the urgency of taking action.
Assessment of current and future risk by taking into account climate projections and socio-
economic factors.
Assessment of the vulnerability of the UK as a whole. This involved: 1) a high level review of
Government policy on climate change in the Business, Industry and the Services sector; 2)
assessment of social vulnerability; and 3) a high level assessment of the adaptive capacity25 of the
Business, Industry and the Services sector.
The JRC is currently piloting a natech risk assessment and mapping web tool called RAPID-N, which allows the user to rapidly assess Natech risks. RAPID-N currently only covers Natechs from earthquakes; the aim is to extend coverage to include floods.
With climate change predicted to increase the frequency of severe hydro-meteorological events [74], Natech risk is expected to increase in the future.
4.2.3 Resilience strategies
The chemical industry is vulnerable to the effects of meteorological hazards and climate change making resilience an important issue. The greatest potential impact identified in the literature is the incidence a Natech event; a risk which is expected to increase in the future due to the growing number of critical infrastructures, more natural hazards due to climate change, and the vulnerability of modern society which is becoming increasingly interconnected26.
In designing resilience strategies, the factors that cause a Natech must be considered. According to [66] the probability of a Natech accident depends on: 1) the type of natural hazard trigger and its magnitude/severity; 2) the extent of exposure; 3) the type and quantity of chemical; 4) the storage tank and storage conditions (pressure and temperature); 5) the structural integrity of the vessel/ structure containing the material and its design, age, maintenance and proximity to other structures.
In a workshop held by the JRC on Natechs in 2003, participants identified the following environmental, social and economic factors that affect vulnerability to Natechs [66]:
the presence of industrial establishments in high natural hazard risk areas,
rapid urbanization and industrialization,
inadequate or no land-use planning,
lack of regulations and/or lax enforcement of regulations concerning risk management practices at
industrial establishments,
lack of training of responders to deal with simultaneous hazmat releases from single or multiple
sources,
25 According to the CCRA: The adaptive capacity of a sector is the ability of the sector as a whole, including the organisations involved in working in the sector, to devise and implement effective adaptation strategies in response to information about potential future climate impacts 26 http://rapidn.jrc.ec.europa.eu/
D1.2 State of the art review and taxonomy of existing knowledge
Grand Agreement 653824 DISSEMINATION LEVEL Page 40
lack of information and education of the population on the potential threat of Natechs in their
areas and what to do in response to a Natech event,
interconnectivity between systems in modern cities which can contribute to making a region more
vulnerable to Natechs and other domino effects.
The findings of the JRC workshop are further supported by information collected via a survey carried out by [72] on Natech risk reduction in European Union Member States. Overall, the survey highlighted a number of factors that hinder effective Natech risk reduction, which correlate with those identified at the JRC workshop. Based on the survey [72] the authors recommend:
Raising awareness and improving risk communication in industry and at all levels of government
(national, regional, and local).
Training competent authorities on Natech risk reduction, both in the chemical-accident prevention
and the natural-disaster management communities.
Implementing and enforcing specific regulations for Natech risk reduction.
Preparing Natech-specific technical codes and guidelines for Natech risk assessment in industry.
Developing guidance on Natech risk assessment at the EU level.
Preparing Natech-specific emergency-management plans that consider the possible lack of utilities
(e.g. electricity, ICT etc.).
Developing Natech risk maps for informing land-use planning (to limit the construction of
hazardous installations in areas subject to high natural hazard risk) and emergency-management
decisions.
Developing methods and tools for Natech risk assessment.
Identifying best practices for Natech risk reduction and widely disseminating existing best practices.
Understanding the impact that climate change may have on future Natech risk.
As highlighted above, there is little guidance available on how Natechs should be prepared for or avoided. Only a few studies have been published regarding the mitigation of Natechs, and these have focused mostly on earthquakes. From a state-of-the-art review conducted by Cruz et al [75] for the JRC a series of safety and mitigation measures are summarised which can improve resilience, for example:
Use of containment walls or dikes and retrofitting existing ones
Use of anchoring mechanisms for tanks and equipment
Restraining straps or chains for barrels or pressure vessels
Strapping and anchoring of emergency equipment
Siting of emergency equipment to avoid damage and any falling debris
Redundancy in pipeline systems, in particular emergency water
Strategic placement of substances inside facility in order to avoid chemical incompatibility
Placement of storage tanks with Hazmats above the maximum height reachable by flood waters
Raising of electrical equipment such as motors, pumps, control panels etc. to avoid water damage
and avoid failure
Maintaining a Natech emergency response plan
Chemical facilities and other establishments housing Hazmats can, thus be protected against natural hazards through the adoption, monitoring and enforcement of design codes and standards that account for
D1.2 State of the art review and taxonomy of existing knowledge
Grand Agreement 653824 DISSEMINATION LEVEL Page 41
natural hazard loads (e.g. tsunami, wind, and flood loads) on buildings, steel support structures for processing equipment and storage tanks, and other structures [66].
4.2.4 Climate change adaptation on CI sector
A sector-specific guide on “How to prepare a Climate Change Adaptation Plan” [62] was prepared by a partnership between Chemical Business Association (CBA), Chemical Industries Association (CIA), and the Non-Ferrous Alliance (NFA) – led and supported by the UK Environment Agency’s Climate Ready Support Service, which is responsible for delivering the HM Government’s commitments under the National Adaptation Programme. Here, within the presentation of case studies, the experiences from recent storms in the USA are given as useful to further improve resilience of chemical facilities. Some examples of lessons learned as regards critical infrastructure, as identified by the Louisiana Chemicals Association, are:
focus on flood resistance and resilience as flood waters are usually the most serious obstacle to restarting operations;
prepare to quickly shut down key utility supplies like air, oxygen, nitrogen, steam, natural gas, and other raw material feeds;
since secondary containment systems are designed to prevent releases of materials, they also prevented release of the corrosive sea water after the flood waters receded;
for facilities flooded by seawater, many pipes, vessels, and electrical systems have been damaged, and companies will be spending a long time and significant expense to repair or replace them. For the future, companies prone to storm flooding should design secondary containment systems with a dewatering capability.
As highlighted by US EPA, flooding from more intense and frequent storms due to climate change increases the risk of releases from contaminated sites and facilities where chemicals are stored. Such areas include superfund sites, brownfields, and underground storage tank sites. The storms could also result in the generation of more disaster debris, further challenging local chemical management capacity. In response to this issue, the following adaptation strategies can be identified:
develop crisis management plans to anticipate and prepare for future extreme climatic events;
account for climate risks in brownfields clean-up and redevelopment activities;
integrate future flood risk projections into remedy selection for hazardous waste clean-up;
consider opportunities for toxic use reduction and safer chemical storage strategies (e.g., not storing chemicals in flood-prone locations such as basements) to reduce the potential for chemical release during flood events.
In 2011 during the Hurricane Irene dumped approximately 18 cm of rainfall in 48 hours were measured at the American Cyanamid Superfund site in New Jersey (US). The site, already in an exceedingly wet state prior to the hurricane, flooded. Although there was no major release of contaminants, the flooding still caused significant damage to the facility’s infrastructure. To anticipate and prepare for future events, officials decided to raise critical infrastructure components to several feet above previous flood events and decided to repair impoundments to withstand a 1-in-500 year flood event [76].
4.2.5 Sector interdependencies
The Chemical Sector is dependent on many other sectors to maintain full functionality. For instance, technology from the ICT sector (e.g. industrial automated systems, process safety systems, operating manufacturing processes, tracking inventory, and storing customer information) is crucial in the operation of and communication within the chemical industry supply chain. The sector is also heavily reliant on the transport network e.g. rail, road, maritime and pipeline services for the secure transport of its products to
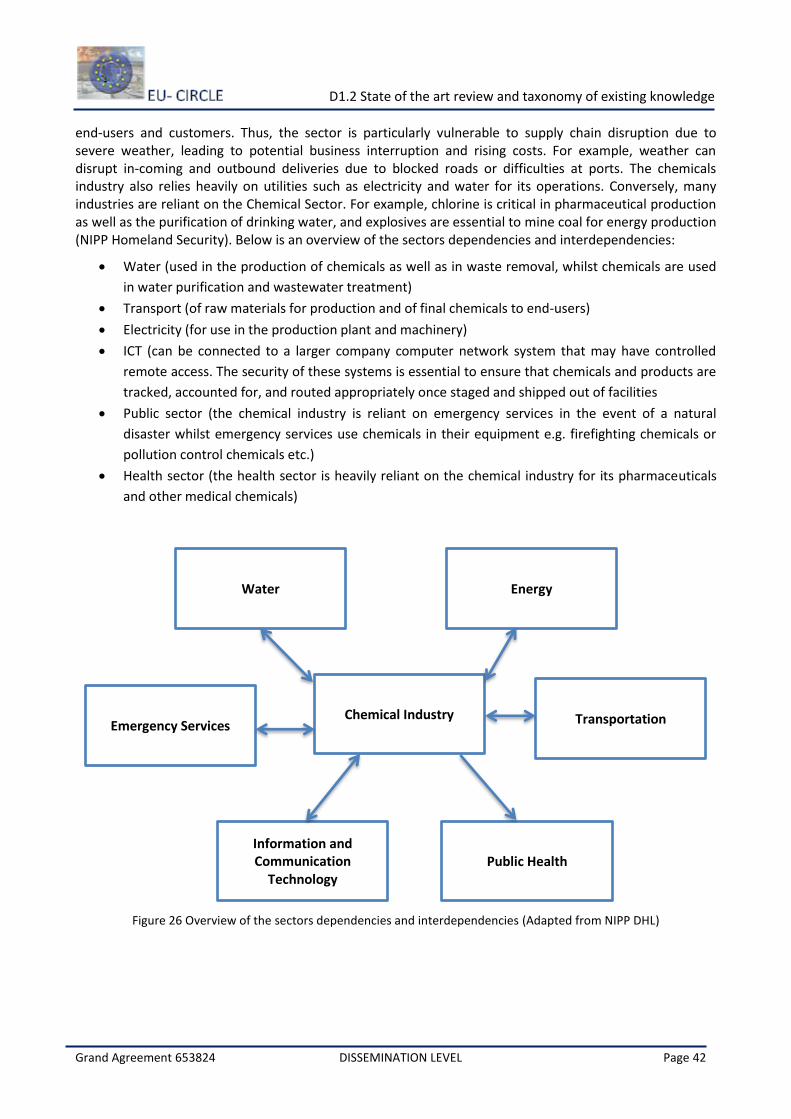
D1.2 State of the art review and taxonomy of existing knowledge
Grand Agreement 653824 DISSEMINATION LEVEL Page 42
end-users and customers. Thus, the sector is particularly vulnerable to supply chain disruption due to severe weather, leading to potential business interruption and rising costs. For example, weather can disrupt in-coming and outbound deliveries due to blocked roads or difficulties at ports. The chemicals industry also relies heavily on utilities such as electricity and water for its operations. Conversely, many industries are reliant on the Chemical Sector. For example, chlorine is critical in pharmaceutical production as well as the purification of drinking water, and explosives are essential to mine coal for energy production (NIPP Homeland Security). Below is an overview of the sectors dependencies and interdependencies:
Water (used in the production of chemicals as well as in waste removal, whilst chemicals are used
in water purification and wastewater treatment)
Transport (of raw materials for production and of final chemicals to end-users)
Electricity (for use in the production plant and machinery)
ICT (can be connected to a larger company computer network system that may have controlled
remote access. The security of these systems is essential to ensure that chemicals and products are
tracked, accounted for, and routed appropriately once staged and shipped out of facilities
Public sector (the chemical industry is reliant on emergency services in the event of a natural
disaster whilst emergency services use chemicals in their equipment e.g. firefighting chemicals or
pollution control chemicals etc.)
Health sector (the health sector is heavily reliant on the chemical industry for its pharmaceuticals
and other medical chemicals)
Figure 26 Overview of the sectors dependencies and interdependencies (Adapted from NIPP DHL)
Chemical Industry
Water Energy
Transportation
Information and Communication
Technology
Emergency Services
Public Health
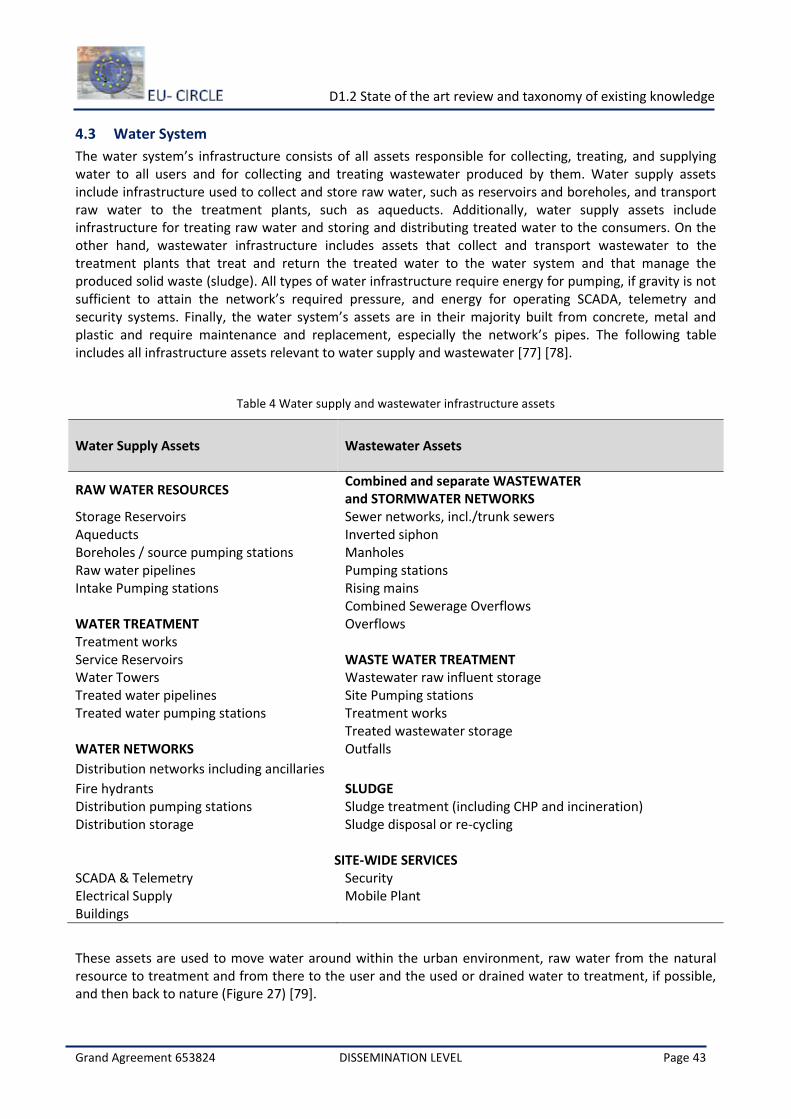
D1.2 State of the art review and taxonomy of existing knowledge
Grand Agreement 653824 DISSEMINATION LEVEL Page 43
4.3 Water System
The water system’s infrastructure consists of all assets responsible for collecting, treating, and supplying water to all users and for collecting and treating wastewater produced by them. Water supply assets include infrastructure used to collect and store raw water, such as reservoirs and boreholes, and transport raw water to the treatment plants, such as aqueducts. Additionally, water supply assets include infrastructure for treating raw water and storing and distributing treated water to the consumers. On the other hand, wastewater infrastructure includes assets that collect and transport wastewater to the treatment plants that treat and return the treated water to the water system and that manage the produced solid waste (sludge). All types of water infrastructure require energy for pumping, if gravity is not sufficient to attain the network’s required pressure, and energy for operating SCADA, telemetry and security systems. Finally, the water system’s assets are in their majority built from concrete, metal and plastic and require maintenance and replacement, especially the network’s pipes. The following table includes all infrastructure assets relevant to water supply and wastewater [77] [78].
Table 4 Water supply and wastewater infrastructure assets
Water Supply Assets Wastewater Assets
RAW WATER RESOURCES Combined and separate WASTEWATER and STORMWATER NETWORKS
Storage Reservoirs Sewer networks, incl./trunk sewers Aqueducts Inverted siphon Boreholes / source pumping stations Manholes Raw water pipelines Pumping stations Intake Pumping stations Rising mains Combined Sewerage Overflows WATER TREATMENT Overflows Treatment works Service Reservoirs WASTE WATER TREATMENT Water Towers Wastewater raw influent storage Treated water pipelines Site Pumping stations Treated water pumping stations Treatment works Treated wastewater storage WATER NETWORKS Outfalls
Distribution networks including ancillaries
Fire hydrants SLUDGE Distribution pumping stations Sludge treatment (including CHP and incineration) Distribution storage Sludge disposal or re-cycling
SITE-WIDE SERVICES SCADA & Telemetry Security Electrical Supply Mobile Plant Buildings
These assets are used to move water around within the urban environment, raw water from the natural resource to treatment and from there to the user and the used or drained water to treatment, if possible, and then back to nature (Figure 27) [79].
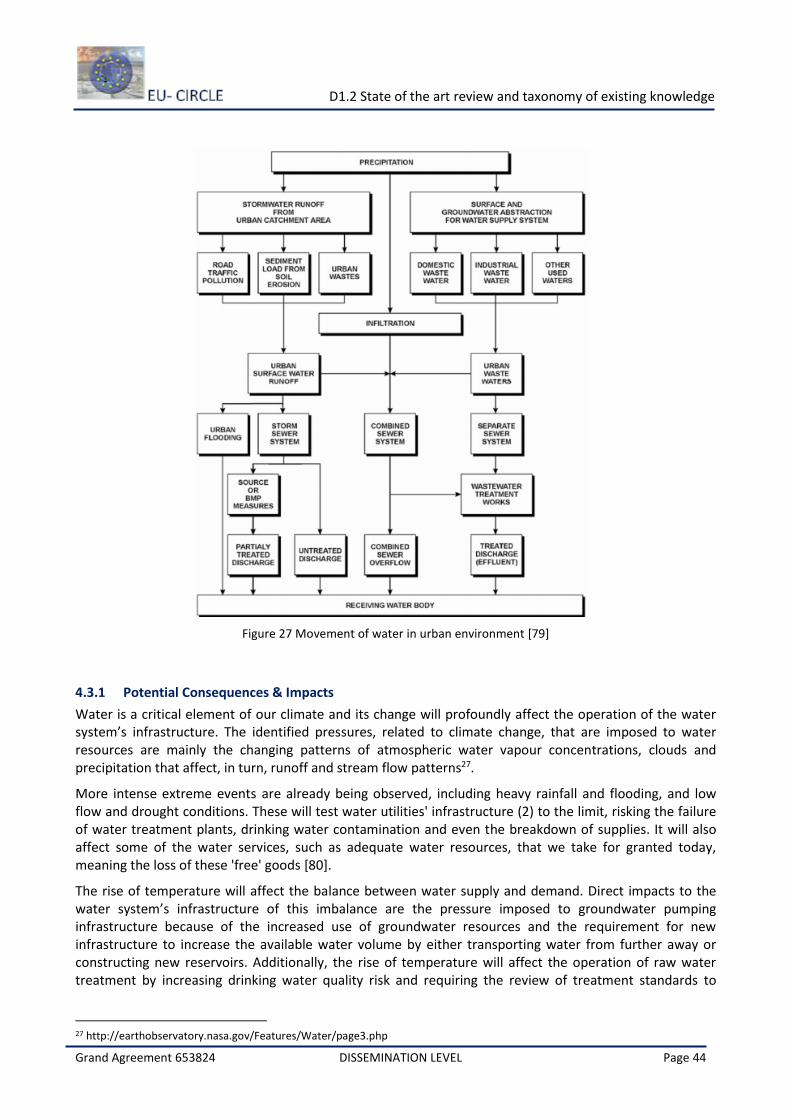
D1.2 State of the art review and taxonomy of existing knowledge
Grand Agreement 653824 DISSEMINATION LEVEL Page 44
Figure 27 Movement of water in urban environment [79]
4.3.1 Potential Consequences & Impacts
Water is a critical element of our climate and its change will profoundly affect the operation of the water system’s infrastructure. The identified pressures, related to climate change, that are imposed to water resources are mainly the changing patterns of atmospheric water vapour concentrations, clouds and precipitation that affect, in turn, runoff and stream flow patterns27.
More intense extreme events are already being observed, including heavy rainfall and flooding, and low flow and drought conditions. These will test water utilities' infrastructure (2) to the limit, risking the failure of water treatment plants, drinking water contamination and even the breakdown of supplies. It will also affect some of the water services, such as adequate water resources, that we take for granted today, meaning the loss of these 'free' goods [80].
The rise of temperature will affect the balance between water supply and demand. Direct impacts to the water system’s infrastructure of this imbalance are the pressure imposed to groundwater pumping infrastructure because of the increased use of groundwater resources and the requirement for new infrastructure to increase the available water volume by either transporting water from further away or constructing new reservoirs. Additionally, the rise of temperature will affect the operation of raw water treatment by increasing drinking water quality risk and requiring the review of treatment standards to
27 http://earthobservatory.nasa.gov/Features/Water/page3.php
D1.2 State of the art review and taxonomy of existing knowledge
Grand Agreement 653824 DISSEMINATION LEVEL Page 45
reduce the risk of public health impacts28. Finally, higher temperatures increase the microbial action in wastewater treatment plants that increase gas production that may even cause explosion incidents placing both infrastructure and plant personnel at risk [78].
Increased temperatures and decreased precipitation patterns create drought period that may create service failures, in some or all the water uses, since water availability is reduced, thus creating several socio-economic impacts. In terms of impacts to the water supply and wastewater infrastructure, the decrease of available water volume creates higher sedimentation rates that create blockages, lower dilution rates that risk water quality, and depressurisation of the distribution network that may lead to service loss due to pipe and pumps failures [78].
On the other hand, increased or extreme rainfall may cause flooding events that affect the critical water infrastructure in ways that are difficult to foresee [81]. Floods may affect water and wastewater treatment plants, if these assets are located in flood prone areas and are not adequately protected. Extreme rainfall may result in the breeching of reservoir dams, if their maximum storage elevation is exceeded [82]. Additionally, extreme rainfall may create conditions that exceed the capacity of the stormwater network flooding or even destroying parts of the stormwater network. To top all that, storm surges and sea level rise may affect assets situated close to the sea and in low elevation areas. In addition, sea level rise may affect the operation of water intakes and stormwater outlets to the sea, that will need to be redesigned to avoid backflows and sea water entering the water network system.
Furthermore, extreme winds may affect tall structures, such as water towers [83], but may also induce waves that may potentially risk the stability of dams and other water retention structures. Additionally, heavy snowfall and extreme cold weather may block access to water infrastructure, may create blockages and water intake failures due to frozen pipes and pumps.
Moreover, wildfires pose a direct risk to infrastructure mainly because of the sudden need of a bulk volume of water for firefighting and when the assets are close to the fire or the firefighting activities. Additionally, wildfires affect water infrastructure assets indirectly by increasing the volume of nutrients and debris transported by water and deposited in reservoirs and even reach treatment plants and distribution networks blocking pipes and affecting the lifespan of the assets [84] [85]. Finally, landslides damage infrastructure especially when the assets are within the affected land.
4.3.2 Risk assessment
The traditional water asset management planning approaches do not incorporate climate risks directly, however several utilities are changing how they quantify risks in asset management planning by using climate change projections [86]. Water infrastructure includes a variety of assets with different structures that are affected by climate change related hazards in different ways and that are linked with each other creating a “network of networks”. Even when an infrastructure is not directly affected from a hazard, it is possible that because of age, position, material etc the infrastructure is vulnerable to the environmental conditions in place. For example water networks bursting, because the soil beneath them dries out when high temperatures and/or drought conditions exist, not otherwise affected by these hazards. Therefore, it is necessary that planners take into consideration the age of the infrastructure they manage when planning.
Risks primarily have to be assessed in terms of likelihood, the probability of an event occurring like 1% chance which means every 100-years, 10% chance which means every 10-years, and 50% chance which means every 2-years29. Additionally, risks include the assessment of the severity of the expected impact by a qualitative, semi-qualitative or quantitative approach as it is mentioned on [18].
28 http://www.who.int/globalchange/summary/en/index4.html 29 http://water.usgs.gov/edu/100yearflood.html
D1.2 State of the art review and taxonomy of existing knowledge
Grand Agreement 653824 DISSEMINATION LEVEL Page 46
Since water infrastructure is responsible for collecting, transferring and treating one of the main elements of Earth’s climate the assets include within their design parameters acceptable limits relevant to water depths and temperature. For example, dams are designed to withstand a maximum storage, which is directly linked with rainfall events and upstream runoff, linked as well to a certain expected probability. The severity of a dam breaching depends on many different characteristics of the downstream land and is usually described for assessing the hazard level classification of the dam (if available). Additionally, stormwater networks are designed to withstand a maximum rainfall event and may collapse if temperature is high due to the changes affecting the soil beneath them. Finally, water assets require electrical power and telecommunications for their proper operation, thus increasing the probability of being damaged from a specific hazard due to their interdependencies with other sectors.
Several risk assessment methods exist for assessing the risk from different climate change hazards to water assets, mainly used by water and wastewater utilities. Amongst others, the UK Aglian Water company, responsible for water supply in east England and Wales assesses its vulnerabilities using an expert panel that assigns a qualitative score for a hazard’s likelihood and a qualitative score for an asset’s damage severity, their multiplication estimates the asset’s risk index. For example, the wastewater collection and treatment assets have a high risk index (of 8) for sea level rise, receiving a score of 2 out of a maximum of 5 for likelihood and a 4 out of a maximum of 5 for severity, since if affected they will be highly damaged [87]. Additionally, the City of London in Ontario, Canada has selected a risk index that multiplies probability of occurrence of the hazard event with the economic loss and a fraction of damage that is sustained for each different impact.
To assess the risk from different climate change hazards to the European critical infrastructure, it has been proposed by the JRC [88] to follow three steps. Firstly, estimate the vulnerability of the asset, based on fragility/damage curves if applicable. Then, assess the resilience of the asset, based on its ability to adapt, absorb the potential impacts, and recover from them. Finally, estimate the actual damage that the asset is expected to experience.
Fragility or damage curves for water infrastructure assets exist mainly for floods, connecting water depth with damage cost. Nevertheless, it is possible to create what if scenarios for water assets and the impact of hazards when quantitative data are not available. For example, for water treatment plants it is reasonable to link the effects of temperature increase and drought with a drought availability index, that will specify the severity of the event in terms of available water resources. The level of damage can be assessed either as a scenario or by consulting with water infrastructure experts.
4.3.3 Resilience strategies
Resilience is the “ability of a CI system to prevent, withstand and recover from the effects of climate hazards and climate change”30. Water infrastructure can build resilience by implementing measures of both mitigation and adaptation [89].
For example, WaterUK has created a guide for the UK water utilities companies, proposing a methodology for assessing the impacts of floods, droughts, sea level rise, and temperature increase to the different water infrastructure assets. The methodology assesses the impacts of the different hazards in terms of urgency and severity and proposes potential response adaptation options in order to increase the resilience of the water sector [78]. The following Table 5 Impacts of climate hazards to the water infrastructure assets and proposed responses for increasing resilience presents the most severe impacts to the water infrastructure and their linkage with different responses.
30 EU-CIRCLE, 2016, Deliverable 4.1
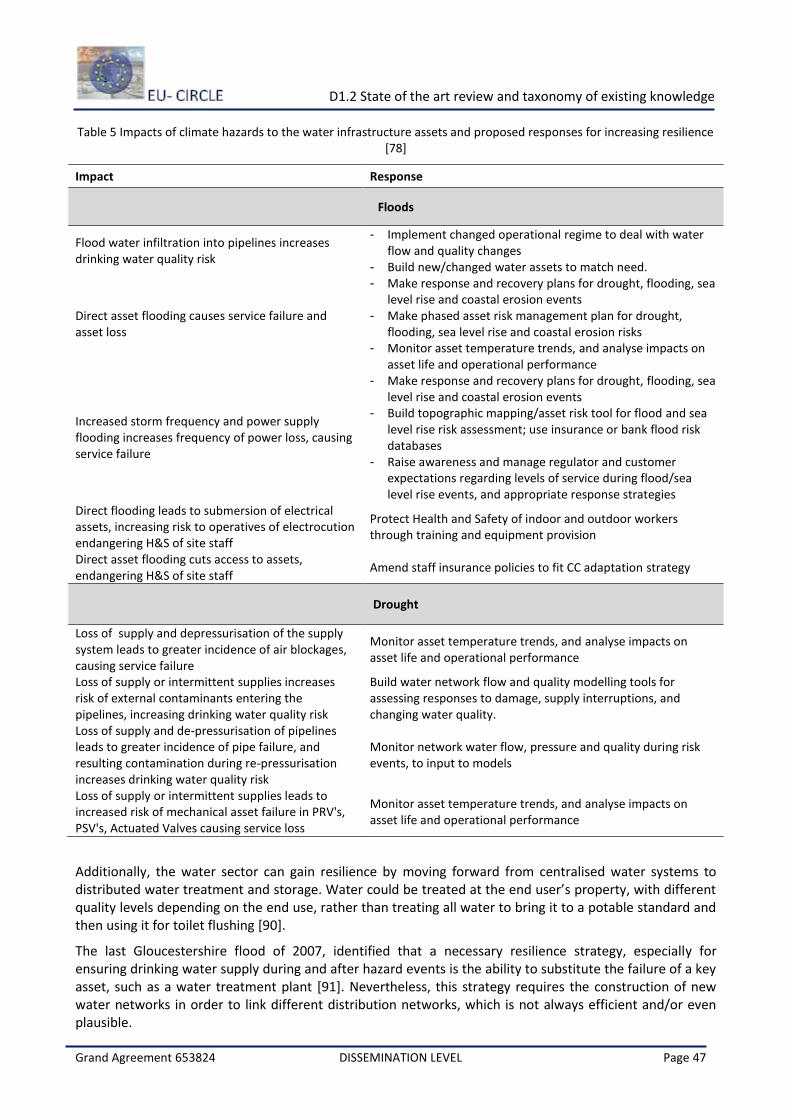
D1.2 State of the art review and taxonomy of existing knowledge
Grand Agreement 653824 DISSEMINATION LEVEL Page 47
Table 5 Impacts of climate hazards to the water infrastructure assets and proposed responses for increasing resilience [78]
Impact Response
Floods
Flood water infiltration into pipelines increases drinking water quality risk
- Implement changed operational regime to deal with water flow and quality changes
- Build new/changed water assets to match need.
Direct asset flooding causes service failure and asset loss
- Make response and recovery plans for drought, flooding, sea level rise and coastal erosion events
- Make phased asset risk management plan for drought, flooding, sea level rise and coastal erosion risks
- Monitor asset temperature trends, and analyse impacts on asset life and operational performance
Increased storm frequency and power supply flooding increases frequency of power loss, causing service failure
- Make response and recovery plans for drought, flooding, sea level rise and coastal erosion events
- Build topographic mapping/asset risk tool for flood and sea level rise risk assessment; use insurance or bank flood risk databases
- Raise awareness and manage regulator and customer expectations regarding levels of service during flood/sea level rise events, and appropriate response strategies
Direct flooding leads to submersion of electrical assets, increasing risk to operatives of electrocution endangering H&S of site staff
Protect Health and Safety of indoor and outdoor workers through training and equipment provision
Direct asset flooding cuts access to assets, endangering H&S of site staff
Amend staff insurance policies to fit CC adaptation strategy
Drought
Loss of supply and depressurisation of the supply system leads to greater incidence of air blockages, causing service failure
Monitor asset temperature trends, and analyse impacts on asset life and operational performance
Loss of supply or intermittent supplies increases risk of external contaminants entering the pipelines, increasing drinking water quality risk
Build water network flow and quality modelling tools for assessing responses to damage, supply interruptions, and changing water quality.
Loss of supply and de-pressurisation of pipelines leads to greater incidence of pipe failure, and resulting contamination during re-pressurisation increases drinking water quality risk
Monitor network water flow, pressure and quality during risk events, to input to models
Loss of supply or intermittent supplies leads to increased risk of mechanical asset failure in PRV's, PSV's, Actuated Valves causing service loss
Monitor asset temperature trends, and analyse impacts on asset life and operational performance
Additionally, the water sector can gain resilience by moving forward from centralised water systems to distributed water treatment and storage. Water could be treated at the end user’s property, with different quality levels depending on the end use, rather than treating all water to bring it to a potable standard and then using it for toilet flushing [90].
The last Gloucestershire flood of 2007, identified that a necessary resilience strategy, especially for ensuring drinking water supply during and after hazard events is the ability to substitute the failure of a key asset, such as a water treatment plant [91]. Nevertheless, this strategy requires the construction of new water networks in order to link different distribution networks, which is not always efficient and/or even plausible.
D1.2 State of the art review and taxonomy of existing knowledge
Grand Agreement 653824 DISSEMINATION LEVEL Page 48
4.3.4 Climate change adaptation on CI sector
In the water sector, climate change adaptation will mean, amongst others, an exchange of knowledge between regions of different climates. For example, lessons to be learned include Singapore’s use of recycled water and the Netherlands experience of adaptation to floods [90].
In June 2014 the US Army Corps of Engineers published a climate change adaptation report that identifies the differences between adaptation and mitigation and is acting to integrate climate adaptation (managing the unavoidable impacts) with mitigation (avoiding the unmanageable impacts). In respect to water infrastructure assets the report proposes, that the adaptation actions need to include [92]:
a) understanding climate change impacts b) assessing vulnerabilities to climate c) planning various responses d) engineering design of adaptation measures, and e) implementing adaptation
In addition, the uncertainty, regarding the climate change in the next 20 to 50 years, requires to have a trade-off between the designing and constructing of new infrastructure for uncertain events and project cost. Trade-offs between required new infrastructure and viable costs are applied by many water utilities when planning their climate change adaptation [93]. For instance, Aglian Water proposes that, if a particular solution requires 1000 m3 of attenuation storage, it is possible to first consider, if the installation of a 500 m3 would protect in the shorter term, for example to 2050, and plan to construct the remaining storage in accordance with any future improved assessments [87]. Other types of water infrastructure adaptation plans, that are both flexible and viable options, include [93]:
1. designing control systems conservatively to account for potential future increases in rainfall intensities;
2. maximizing the infiltration of runoff; 3. protecting existing wetlands and constructing more wetlands to hold runoff and recharge
groundwater; 4. improving the performance of existing systems through enhanced monitoring and improving
single-event and multiple-event modelling and feedback; 5. updating rainfall statistics frequently and simulate future scenarios accordingly, and; 6. implementing real-time internet-based information systems.
Other adaptation measures have been proposed for implementation in the UK [90]. For example, conservation/demand reduction, local re-use/rainwater collection can provide dual supply at the local scale, increase the use of sustainable urban drainage systems (SUDS) for drainage and make many urban and suburban paved surfaces porous to attenuate flows and reduced used water volumes [90]. 4.3.5 Sector interdependencies
Water is a vital component of the majority of urban services and as such if the water system fails this impacts all other critical infrastructure [94]. Additionally, water assets are dependent to power supply and telecommunications and damages to these sectors affect the water infrastructure. For example, water is used for cooling purposes in electric power production and distribution and in telecommunications and requires both for control systems.
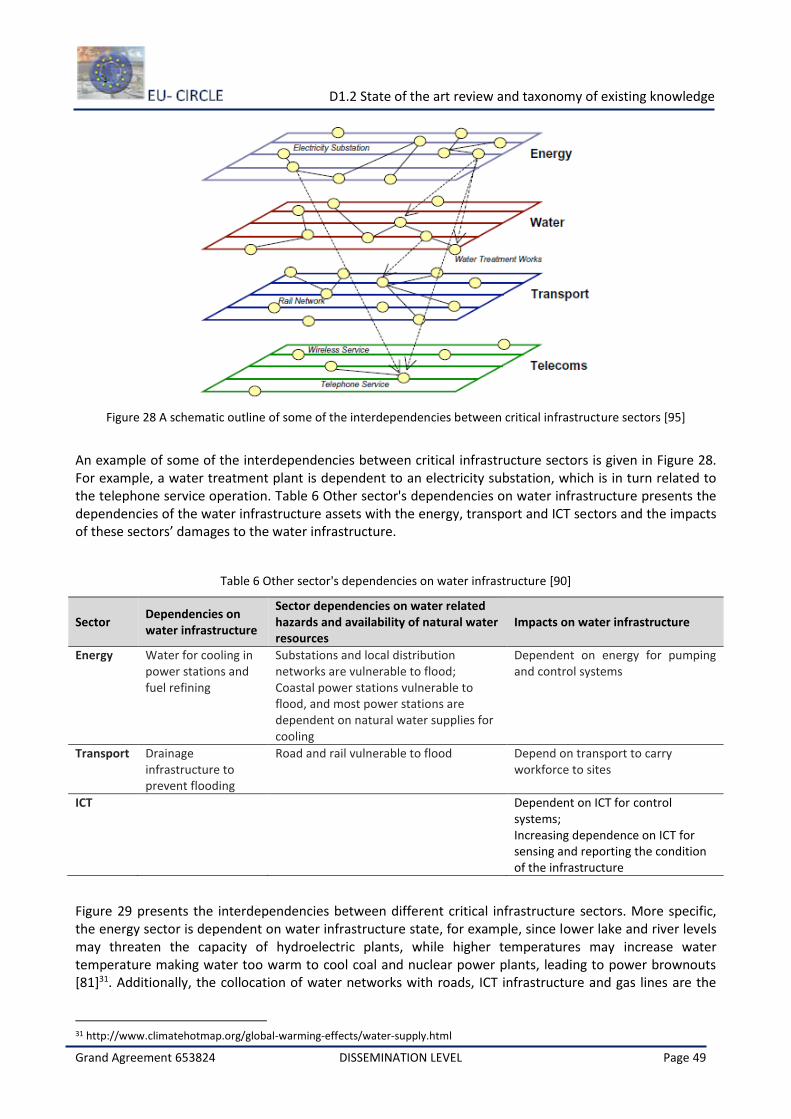
D1.2 State of the art review and taxonomy of existing knowledge
Grand Agreement 653824 DISSEMINATION LEVEL Page 49
Figure 28 A schematic outline of some of the interdependencies between critical infrastructure sectors [95]
An example of some of the interdependencies between critical infrastructure sectors is given in Figure 28. For example, a water treatment plant is dependent to an electricity substation, which is in turn related to the telephone service operation. Table 6 Other sector's dependencies on water infrastructure presents the dependencies of the water infrastructure assets with the energy, transport and ICT sectors and the impacts of these sectors’ damages to the water infrastructure.
Table 6 Other sector's dependencies on water infrastructure [90]
Sector Dependencies on water infrastructure
Sector dependencies on water related hazards and availability of natural water resources
Impacts on water infrastructure
Energy Water for cooling in power stations and fuel refining
Substations and local distribution networks are vulnerable to flood; Coastal power stations vulnerable to flood, and most power stations are dependent on natural water supplies for cooling
Dependent on energy for pumping and control systems
Transport
Drainage infrastructure to prevent flooding
Road and rail vulnerable to flood Depend on transport to carry workforce to sites
ICT Dependent on ICT for control systems; Increasing dependence on ICT for sensing and reporting the condition of the infrastructure
Figure 29 presents the interdependencies between different critical infrastructure sectors. More specific, the energy sector is dependent on water infrastructure state, for example, since lower lake and river levels may threaten the capacity of hydroelectric plants, while higher temperatures may increase water temperature making water too warm to cool coal and nuclear power plants, leading to power brownouts [81]31. Additionally, the collocation of water networks with roads, ICT infrastructure and gas lines are the
31 http://www.climatehotmap.org/global-warming-effects/water-supply.html
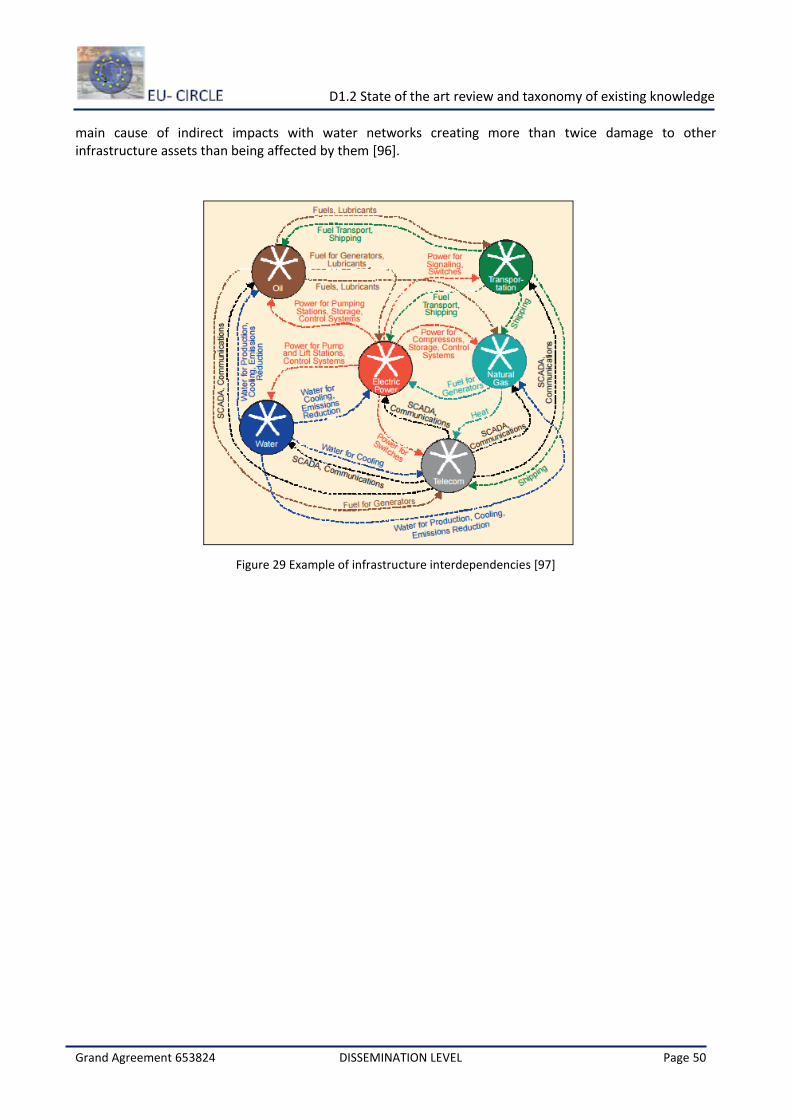
D1.2 State of the art review and taxonomy of existing knowledge
Grand Agreement 653824 DISSEMINATION LEVEL Page 50
main cause of indirect impacts with water networks creating more than twice damage to other infrastructure assets than being affected by them [96].
Figure 29 Example of infrastructure interdependencies [97]
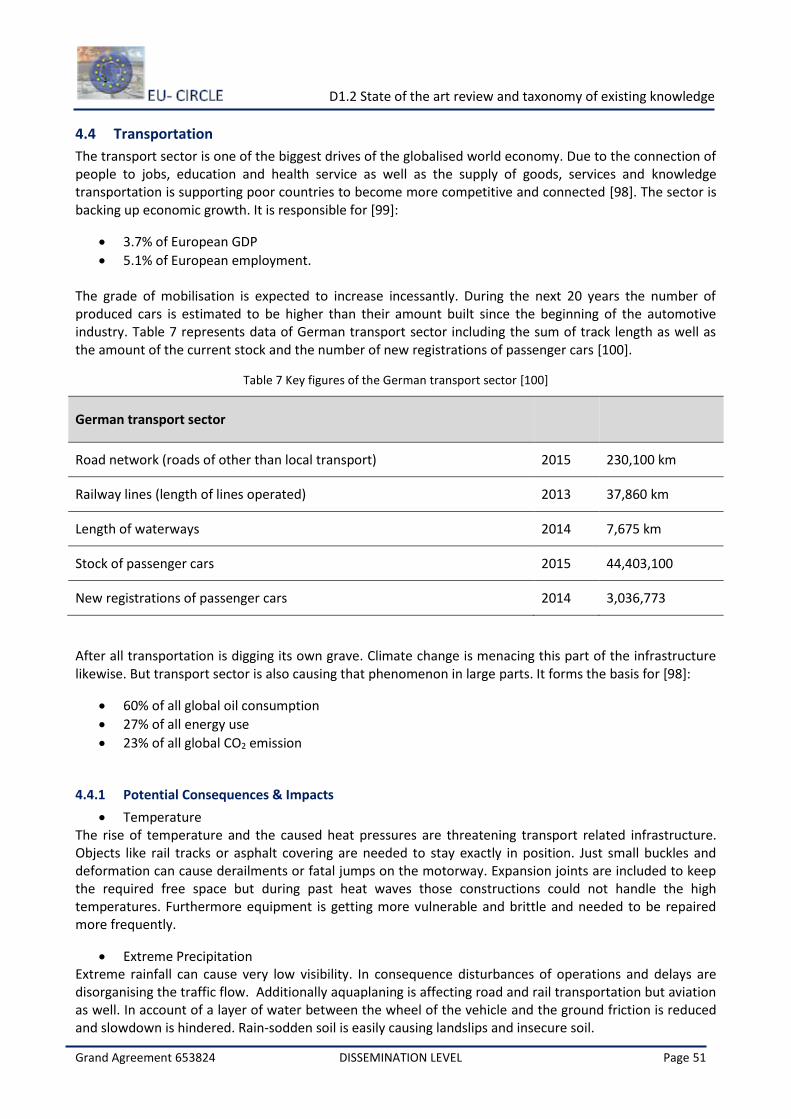
D1.2 State of the art review and taxonomy of existing knowledge
Grand Agreement 653824 DISSEMINATION LEVEL Page 51
4.4 Transportation
The transport sector is one of the biggest drives of the globalised world economy. Due to the connection of people to jobs, education and health service as well as the supply of goods, services and knowledge transportation is supporting poor countries to become more competitive and connected [98]. The sector is backing up economic growth. It is responsible for [99]:
3.7% of European GDP
5.1% of European employment.
The grade of mobilisation is expected to increase incessantly. During the next 20 years the number of produced cars is estimated to be higher than their amount built since the beginning of the automotive industry. Table 7 represents data of German transport sector including the sum of track length as well as the amount of the current stock and the number of new registrations of passenger cars [100].
Table 7 Key figures of the German transport sector [100]
German transport sector
Road network (roads of other than local transport) 2015 230,100 km
Railway lines (length of lines operated) 2013 37,860 km
Length of waterways 2014 7,675 km
Stock of passenger cars 2015 44,403,100
New registrations of passenger cars 2014 3,036,773
After all transportation is digging its own grave. Climate change is menacing this part of the infrastructure likewise. But transport sector is also causing that phenomenon in large parts. It forms the basis for [98]:
60% of all global oil consumption
27% of all energy use
23% of all global CO2 emission
4.4.1 Potential Consequences & Impacts
Temperature The rise of temperature and the caused heat pressures are threatening transport related infrastructure. Objects like rail tracks or asphalt covering are needed to stay exactly in position. Just small buckles and deformation can cause derailments or fatal jumps on the motorway. Expansion joints are included to keep the required free space but during past heat waves those constructions could not handle the high temperatures. Furthermore equipment is getting more vulnerable and brittle and needed to be repaired more frequently.
Extreme Precipitation Extreme rainfall can cause very low visibility. In consequence disturbances of operations and delays are disorganising the traffic flow. Additionally aquaplaning is affecting road and rail transportation but aviation as well. In account of a layer of water between the wheel of the vehicle and the ground friction is reduced and slowdown is hindered. Rain-sodden soil is easily causing landslips and insecure soil.
D1.2 State of the art review and taxonomy of existing knowledge
Grand Agreement 653824 DISSEMINATION LEVEL Page 52
Heavy rain, hail and other forms of precipitation are leading to other climate hazards threatening transportation. Flooding as well as the rise of the sea level is directly dependent on the extent of precipitation.
Floods Furthermore extreme rainfall can cause inundations which are damaging transport infrastructure facilities, too. Blocked streets due to floods can cost detours or destroy lanes completely. It already happened, that softened soil broke and tore the lane with itself or that bridges could not withstand the force of raging rivers. In combination with live conductors floods can cause short circuits and paralyze the energy supply needed for signalling equipment or the rail itself. Navigating can be hindered by flooding as well as high waters are reducing the space between the ceiling of the bridge and the ship.
Landslides In course of heavy rain and floods soil is macerating. Thereby it loses its stability and gets hazardous. The fall of debris as well as the slipping of earth is activated. The parts of infrastructure, like rail tracks or lanes, located in the active area of those avalanches are threatened by them. Blocked and buried roads as well as damages in course of fallen debris are a result. Soiled tracks are easily leading to derailments. Additionally the aviation and the maritime sector are not disrupted by landslides significantly.
Snowfall In contrast to the predicted increase of heat waves during the summer and the rise of mean temperatures during past winters the transport sector had to deal with unusual cold waves during the winter months. As a result, iced roads and waterways as well as the damage due to freezing of bridges and tunnels because of the extension of material in course of low temperatures are arising. De-icing salt to control those hazards is used but injuring affected material likewise. Infrastructure facilities are getting unstable, potholes are created. Branches and trees, heavily loaded by snow can break and tumble down. Blocked lines cause disruptions of operation and detours.
Extreme winds
Wind fanned trees and windbreak are causing disturbances of the transport sector. Those are blocking lanes, tracks and wires to supply facilities with electrical power. Furthermore signs and signalling lights can get damaged by gusts of wind. Vehicles are likely to sway and are more difficult to control and ride safely. Moreover extreme winds are creating strong waves harbour facilities are exposed to.
Sea level rise American studies detect the transport infrastructure is most vulnerable by the rise of the sea level. They states that by an increase of 4 feet 3 airports, 246 miles of railway and 2,400 miles of roadway are probably going to be inundated. By 2100 the global sea level could rise up to 0.97m. Infrastructure near the seaside is menaced by strong waves and flooding because they are undermining the embankments and eroding the soil. Especially in combination with high winds requirements to the harbor facilities are maximized.
Drought High temperatures are initiating high evaporation and cause droughts. Navigability of rivers can be limited in course of low tide. Ships are navigated not fully loaded or waterways are blocked completely because of the danger of running aground.
Wildfire Ashes and smoke because of wildfires are limiting visibility and restricting safety of transportation thereby. In extreme cases aviation can be disturbed by that as well. Additionally particulate matter is expected to damage constructions and technical equipment. Wildfires itself are also affecting infrastructure facilities by burning them or buckle them in course of heat extension.
D1.2 State of the art review and taxonomy of existing knowledge
Grand Agreement 653824 DISSEMINATION LEVEL Page 53
4.4.2 Risk assessment
The functioning of the transport network is essential for the movement of people, goods, and not at least for response activities and evacuation. Systematic overview studies over risk assessment methodologies developed and deployed for critical infrastructures among them the transport sector are provided for example by Pederson et al. [95], Giannopoulos et al. [47] and Yusta [101]. In the following, few exemplarly approaches are addressed in chronological order:
The DECRIS model [102] utilized experience from risk analyses within different critical infrastructures, to develop an all-hazard generic methodology suitable for cross-sector infra-structure analysis.
Haimes et al. [103] [104] proposed inoperability input-output model for the analysis of how pertur-bations (e.g., willful attacks, accidental events, or natural disasters) to a set of initially affected sectors impose adverse impacts on other sectors, due to their inherent interdependencies.
Haimes [105] proposes a so called Hierarchical Holographic Model (HHM) to consider the interdependencies of the highway transportation system: Emergency Response and Recovery (ERR), Intermodal, Physical, Economic, Functional, and Users, pertaining to industry sectors that depend on the transportation infrastructure.
The Hierarchical Coordinated Bayesian Model from Yan et al. [106] was developed as an analysis tool of sparse data inferencing extreme event likelihoods and consequences using hierarchical coordination.
A similar approach as utilized in UTne et al [102] was derived in the COUNTERACT [107] EU funded project. Generic security guidance was developed, focused exclusively on terrorist threats, using a human intent specific method to assess risks, based on harm (effect) and availability (vulnerability/threat). The approach lacked a mechanism to transfer the results of multiple risk assessments into a higher (hierarchical) level, in addition to the interconnected aspect of different infrastructures.
Pant et al. [108] described the interdependent adverse effects of disruptive events on inter-regional commodity flows resulting from disruptions at an inland port terminal, using a risk-based Multi-Regional Inoperability Input-Output Model. Zhang and Peeta [109] proposed a generalized modeling framework that combines a multilayer network concept with a market-based economic approach to capture the interdependencies among various infrastructure systems with disparate physical and operational characteristics.
The Risk Assessment Matrix is a classic tool to conduct semi-quantitative risk assessment, widely applied in many different frameworks. The output risk index is determined only by the mapping of the consequences and the likelihood to a single risk level, all of which can be divided into different levels.
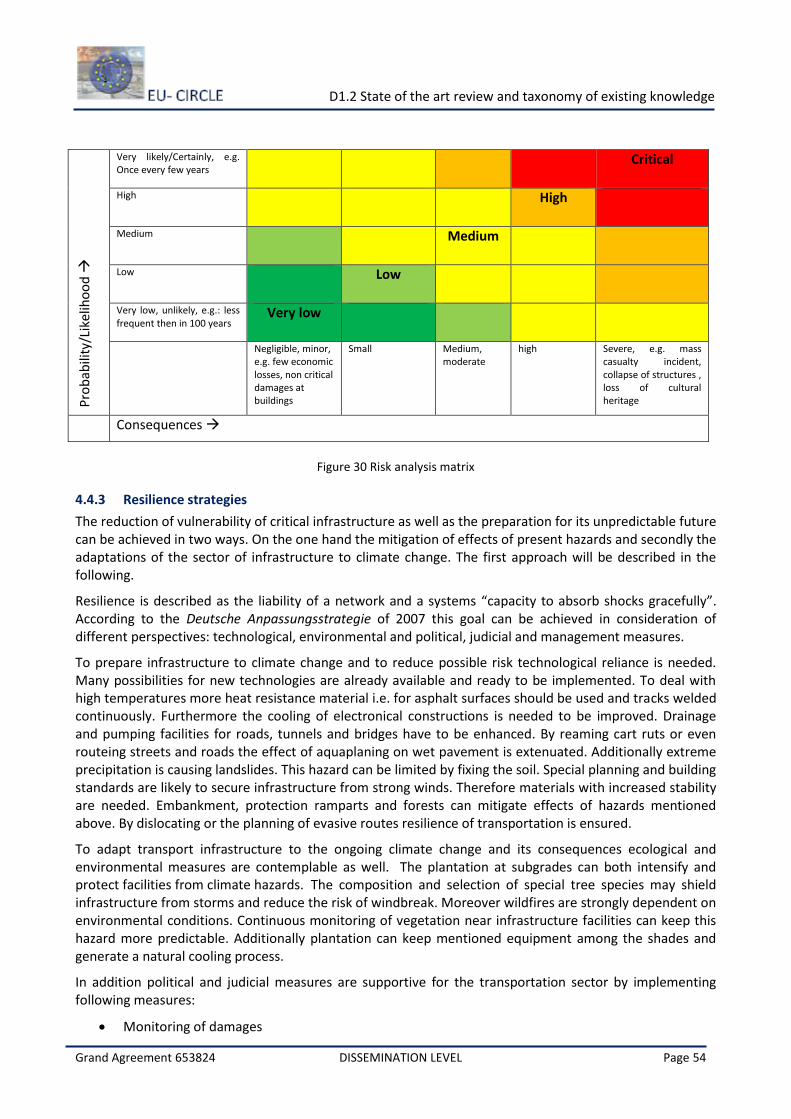
D1.2 State of the art review and taxonomy of existing knowledge
Grand Agreement 653824 DISSEMINATION LEVEL Page 54
Pro
bab
ility
/Lik
elih
oo
d
Very likely/Certainly, e.g. Once every few years
Critical
High High
Medium Medium
Low Low
Very low, unlikely, e.g.: less frequent then in 100 years
Very low
Negligible, minor, e.g. few economic losses, non critical damages at buildings
Small Medium, moderate
high Severe, e.g. mass casualty incident, collapse of structures , loss of cultural heritage
Consequences
Figure 30 Risk analysis matrix
4.4.3 Resilience strategies
The reduction of vulnerability of critical infrastructure as well as the preparation for its unpredictable future can be achieved in two ways. On the one hand the mitigation of effects of present hazards and secondly the adaptations of the sector of infrastructure to climate change. The first approach will be described in the following.
Resilience is described as the liability of a network and a systems “capacity to absorb shocks gracefully”. According to the Deutsche Anpassungsstrategie of 2007 this goal can be achieved in consideration of different perspectives: technological, environmental and political, judicial and management measures.
To prepare infrastructure to climate change and to reduce possible risk technological reliance is needed. Many possibilities for new technologies are already available and ready to be implemented. To deal with high temperatures more heat resistance material i.e. for asphalt surfaces should be used and tracks welded continuously. Furthermore the cooling of electronical constructions is needed to be improved. Drainage and pumping facilities for roads, tunnels and bridges have to be enhanced. By reaming cart ruts or even routeing streets and roads the effect of aquaplaning on wet pavement is extenuated. Additionally extreme precipitation is causing landslides. This hazard can be limited by fixing the soil. Special planning and building standards are likely to secure infrastructure from strong winds. Therefore materials with increased stability are needed. Embankment, protection ramparts and forests can mitigate effects of hazards mentioned above. By dislocating or the planning of evasive routes resilience of transportation is ensured.
To adapt transport infrastructure to the ongoing climate change and its consequences ecological and environmental measures are contemplable as well. The plantation at subgrades can both intensify and protect facilities from climate hazards. The composition and selection of special tree species may shield infrastructure from storms and reduce the risk of windbreak. Moreover wildfires are strongly dependent on environmental conditions. Continuous monitoring of vegetation near infrastructure facilities can keep this hazard more predictable. Additionally plantation can keep mentioned equipment among the shades and generate a natural cooling process.
In addition political and judicial measures are supportive for the transportation sector by implementing following measures:
Monitoring of damages
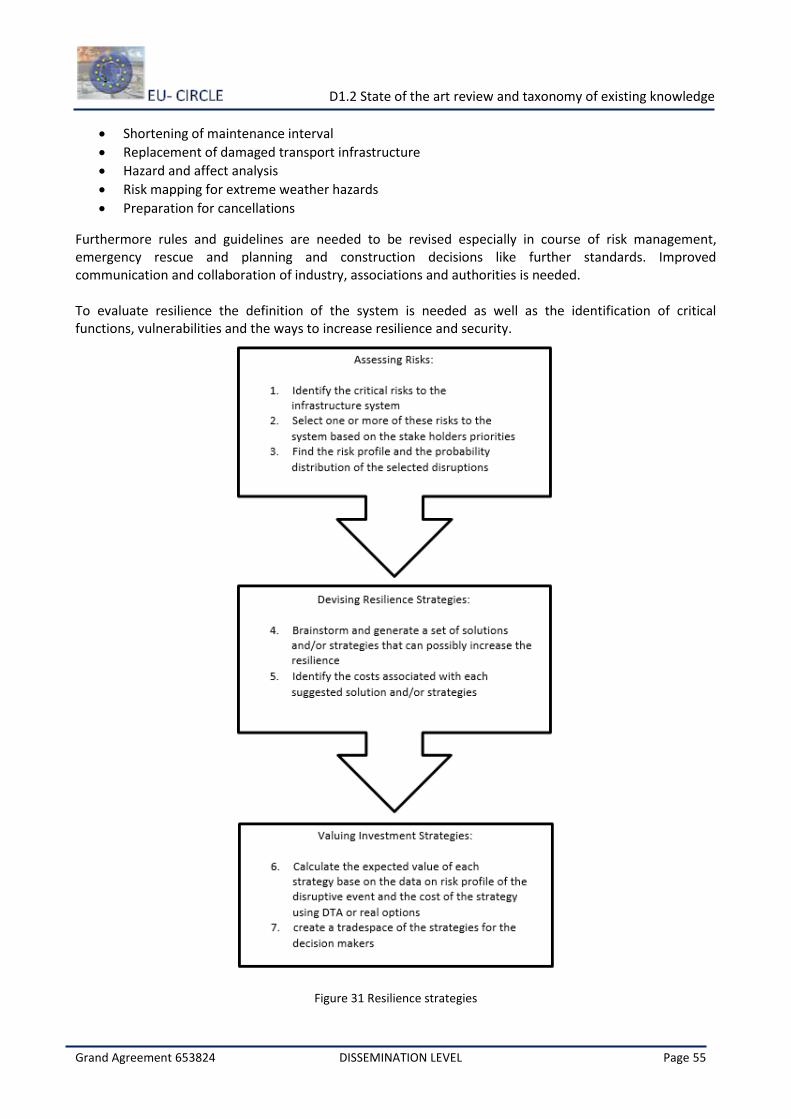
D1.2 State of the art review and taxonomy of existing knowledge
Grand Agreement 653824 DISSEMINATION LEVEL Page 55
Shortening of maintenance interval
Replacement of damaged transport infrastructure
Hazard and affect analysis
Risk mapping for extreme weather hazards
Preparation for cancellations
Furthermore rules and guidelines are needed to be revised especially in course of risk management, emergency rescue and planning and construction decisions like further standards. Improved communication and collaboration of industry, associations and authorities is needed. To evaluate resilience the definition of the system is needed as well as the identification of critical functions, vulnerabilities and the ways to increase resilience and security.
Figure 31 Resilience strategies
D1.2 State of the art review and taxonomy of existing knowledge
Grand Agreement 653824 DISSEMINATION LEVEL Page 56
4.4.4 Climate change adaptation on CI sector
The transportation sector is highly vulnerable to the physical impacts of climate change across its supply chain. Its major vulnerabilities include rising sea levels, changes in temperature, and extreme weather events, all of which can affect destinations and operations [110]. The transportation sector’s approach to climate change impact analysis and adaptation planning is based on risk management [111]. In the literature there are several challenges identified relating to the adaptation of transportation systems to climate change. These include:
Infrastructure investments, as the effective operation of the transport system relies heavily on hard and extensive infrastructures, like roads, rail tracks, bridges and ports [112].
Road infrastructures are intended to last several decades, in some cases far exceeding 100 years. Investments are usually costly and with long return rates [112]. Risk and risk management are an adopted practice to the transportation sectors that already utilize risk-based practices [113].
The consequences for transport can sometimes be negative and sometimes positive [112]. Rising temperatures and sea levels as well as an increasing frequency and intensity of extreme weather events (e.g. storms, heat waves, flooding), already have an impact on transport infrastructure and services in Europe. Transport demand is expected to change as a short-term reaction to delays and interruptions, but in addition long-term changes are also expected (e.g. due to tourism).
Transport adaptation is not yet a high-priority area in most national adaptation strategies and plans. In most countries, adaptation policies remain within the responsibility of environmental authorities, with transport administrations playing an implementing role.
The regulatory framework and operating practices may be subject to abrupt changes owing to pressures from the regulating agencies, customers and shareholders for immediate review and action on climate risks are driving rapid change within the sector. Europe is experiencing a mixture of responsible bodies with different (often competing) priorities, policy objectives and access to fudning.
USDoT 32, in the process of addressing the impact of climate change, proposes a set of different adaptation and resiliency strategies towards transportation planners and system operators:
Climate-conscious land-use planning;
Planning for new infrastructure;
Hardening of existing infrastructure;
Relocation or abandonment of at-risk infrastructure;
Adding redundancy to reduce impacts to the system; and
Provisions for rapid recovery. TEN-T Regulation33 call to account the contribution to climate change and the impact of climate change and of potential natural and man-made disasters on infrastructure, and they shall be planned, developed and operated in a resource-efficient way through, among others, adequate consideration of the vulnerability of transport infrastructure. The guidelines list includes more specific provisions for mainstreaming adaptation within the key components of this European policy:
• Funding of projects of common interest, through the inclusion of climate impacts within compulsory socioeconomic cost–benefit analysis.
32 US DoT, 2014 Climate Adaptation Plan 33 EU, 2013, Regulation (EU) No 1315/2013 of the European Parliament and of the Council of 11 December 2013 on Union guidelines for the development of the trans-European transport network and repealing Decision No 661/2010/EU
D1.2 State of the art review and taxonomy of existing knowledge
Grand Agreement 653824 DISSEMINATION LEVEL Page 57
• Development of the comprehensive network. Climate and resilience is considered as a development priority; technological development and innovation should also address the improvement of climate resilience.
• Core network corridors. The work plan for each corridor must include provisions on adaptation, with 'proposed measures to enhance resilience to climate change'.
The Risk Management for Roads in a Changing Climate (RIMAROCC) proposed a generic framework to meet the common needs of road owners and road administrators in Europe, an overall approach to adaptation to climate change [114].
The French , National Adaptation Strategy (2006) [115], presents the state's perspective, whereas concrete measures are given by the National Plan for Climate Change Adaptation (PNACC): These include revision of technical references; research on the impacts of climate change on transport demand and supply; vulnerability assessment; suggestions towards the revision and adaptation of standards and guidelines for transport infrastructure construction, maintenance and exploitation, etc.
The Transit Inundation Modeling Method (TIMM) is used to identify transit infrastructure systems that are vulnerable to sea level rise using GIS, [116] as an initial step of adapting, focusing on identifying at-risk links and nodes based on various sea level rise inundation levels.
4.4.5 Sector interdependencies
Section 4.3.5 already introduced interdependencies between water and transport infrastructures. Obviously, interdependencies between transport and most – if not all – other critical infrastructures exist. Furthermore, that the transport The major source of complexity in heterogeneous transport systems is defined by the way each asset affects the others as well as the intensity of that effect. All interdependencies can be categorized in he proposed RAF, based on the medium which each connection utilizes in order to manifest itself. These categories are [97]:
Physical Interdependency: Two networks / assets are physically interdependent if the state of one is dependent on the material output(s) of the other.
Systems Interdependency: Two networks / assets have a systems interdependency, if its state depends on the properties of a system transmitted through another asset.
Geographic Interdependency: Networks / assets are geographically interdependent if an incident in an asset may impact the state of assets in a defined spatial proximity.
Logical Interdependency: Two networks / assets are logically interdependent if the state of each depends on the state of the other via a mechanism that does not fall into any of the above.
Risk propagation: The core idea of the approach developed for modelling risk propagation in the framework is that a user defined security scenario which originates in an asset of any transportation network can cause diverse impacts and affect other interconnected assets or networks as shown in Figure 3. It builds upon the fundamentals of Markovian chain process, so that the state of a transportation asset will be dependent upon its previous state and/or the states of its interconnected assets. The state of an interconnected asset (Xn) is thus a result of the nature of the incident affecting the originating asset, the characteristics of the asset under consideration (risk counter-measures, means of immediate response, etc.) and the type of interconnection between the assets.
D1.2 State of the art review and taxonomy of existing knowledge
Grand Agreement 653824 DISSEMINATION LEVEL Page 58
4.5 ICT networks
ICT sector is extremely important for national and international economy and constitutes as an essential pillar for the functionality and operation of all sectors. During normal times, ICT is typically highly reliable [117]. However, ICT performance under stress can be very unpredictable and it is subject to node failure in which damage or compromise of a key element (i.e node, router, switch or exchange) causes a service failure to multiple users.
The ICT Infrastructure sector includes:
• Transmission infrastructure: Copper and fibre optic cables, exchanges, masts, aerials and antennae
• Wireless signals: Radio, satellite, microwaves, etc.
• System Devices: network switches, routers, wireless access points, etc.
• End-user devices: computers, mobile phones, hand-held devices, SCADA control devices, GPS
transmitters/receivers
• Buildings and equipment: data centers, etc.
• Services integral to the provision of ICT: call centers, electronic data interchange, on-line
commerce, etc.
4.5.1 Potential Consequences & Impacts
The impacts of climate change on the ICT sector can be the result of both acute manifestations (e.g. short-term extreme events such as cyclones and intense rainfall and flooding) and chronic trends (e.g. long-term changes in temperature, seasonality and sea level rise), which affect ICT operations, logistics and supply chains in a variety of ways.
From the impacts of climatic disruptions on the supply of raw materials and the availability and safety of industry personnel, to the degradation of ICT networks and infrastructure, climate change can potentially undermine the availability, reliability and quality of ICT services, ultimately affecting business costs. However, climate change impacts also have the potential to create new market opportunities and to generate cost reductions, and can act as drivers of sectoral innovation and change.
ICT structures and networks are potentially vulnerable to a number of current and future climate risks internationally. Rather than changes in average climate, it is extreme weather that poses the highest risk. The evidence base is limited and quantified studies are almost non-existent, but based on expert elicitation, the highest confidence risks arise from the impacts of flooding on structures and facilities located in vulnerable areas likely to become more susceptible to extreme weather in future.
However, while the direct impacts of climate change on components of ICT infrastructure are expected to be minor, some critical aspects warrant further investigation, not only to confirm the scale of potential impacts, but also to explore the potential for adaptations which can bring wider system benefits and enhanced resilience to extreme weather events.
Elements of infrastructure which are below ground are vulnerable to flooding, rising water tables, water ingress, subsidence caused by drought or flooding, and consequently risks arising from damage to the other elements of the infrastructure. On the other hand, elements that located above the ground such as masts, antennae, overhead wires, cables etc. are at risk from precipitation, wind, snow, unstable ground conditions and changes in humidity.
The impacts from climate change and extreme weather could degrade infrastructure, disrupt service, reduce service availability and quality, change operating and maintenance costs, and impact workers’ health and safety.
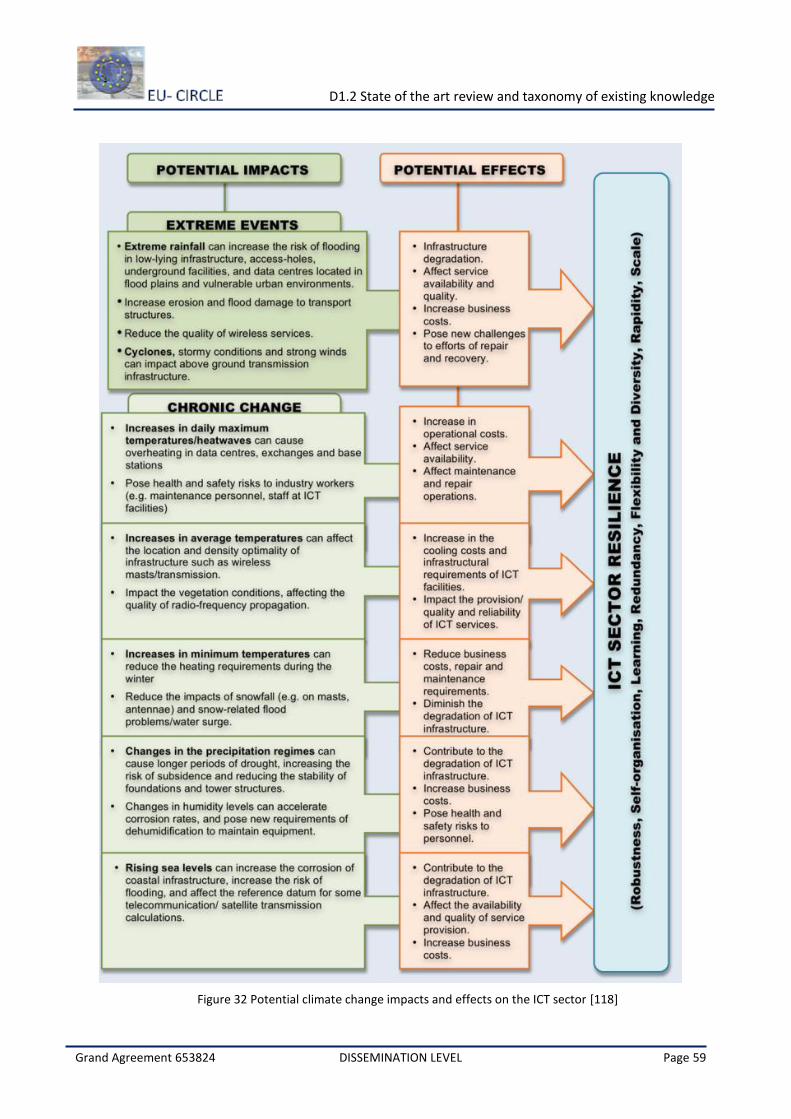
D1.2 State of the art review and taxonomy of existing knowledge
Grand Agreement 653824 DISSEMINATION LEVEL Page 59
Figure 32 Potential climate change impacts and effects on the ICT sector [118]
D1.2 State of the art review and taxonomy of existing knowledge
Grand Agreement 653824 DISSEMINATION LEVEL Page 60
• Temperature
Changes in daily temperatures could impact ICT sector, in some cases with negative consequences and some other cases with positive. Increases in all ranges of temperatures, including maximum, average and minimum temperatures could affect ICT sector.
Increases in daily maximum temperatures as well as the increasing of the frequency of the “hot” days could result in an increased risk of overheating in data centers, exchanges, base stations, etc. Also, the requirements and the cost regarding the air-conditioning will be increased. As ICT sector has a large amount of personnel working in the field (i.e. outdoor activities), heat-related health and safety risks are also increased. Beyond the structural and human assets of ICT sector, temperature changes could impact wireless transmission. This result in a sub-optimal location and density of wireless masts. Radio-frequency propagation could also be impacted if the vegetation type changes in response to climate. The potential consequences from the aforementioned impacts can be found on the availability of services as well as the quality of services, business costs, health and safety and to the repair and recovery time. On the other hand, increases in low temperatures (increase in minimum temperature) could result in impacts with potential positive effects. For example, the cost for space heating in assets during the winter period will be reduced. The maintenance of outdoor equipment such as masts, antennas and the requirement to cope with flood problems due to snow-melt water surge will be also reduced. Those impacts will drive to potential positive consequences like business costs, availability of services, degradation of infrastructure and health and safety issues.
• Extreme precipitation - Floods
Increasing in extreme participation and floods especially in winter season as well as the higher frequency of wet days could impact the regular operation of ICT sector. The risk of flooding of low-lying infrastructure, access-holes and underground facilities is increased as the precipitation is also increased. Assets that are located in flood plains or urban environments like data centers and exchanges are imposed with increased flood risk. Regarding the provided services, they could be affected from this type of climate change as the quality of wireless service is reduced with higher rainfall rates. Furthermore, due to increased precipitation a difficulty to repair faults and restore service with increasing volume of adverse weather-related problems is appeared. All those impacts could cause consequences such as degradation of infrastructure, reduce the availability and quality of services, repair and recovery and impose extra business costs.
• Snowfall
Heavy snowfall can cause failure of electricity transmission lines, causing power outage of ICT services through lack of local supply. These weather events can also be responsible for damage to the telecommunication lines, for example, when a branch breaks from a tree onto a telephone line. Radio systems are affected when antennas are covered in ice.
• Extreme winds
Changes in winds and periods of extreme winds could set ICT facilities at risk. The elements of ICT that are highly affected are those that located above ground and especially masts, antenna and overhead lines. Changes in wind do not appear to be very large so the adaptation measures may not be necessary in the ICT sector except where there is an increased risk of cyclone. Consequences of this phenomenon includes the degradation of infrastructure, the availability of services and can impose business costs.
• Drought
Drought that could appear during a period with decreased daily precipitation especially in summer period could impact the ICT sector as well. The risk of land subsidence is increased and implies a reduction in stability of foundations and tower structures. The potential consequence of this impact is the degradation of infrastructure and increase of business costs.
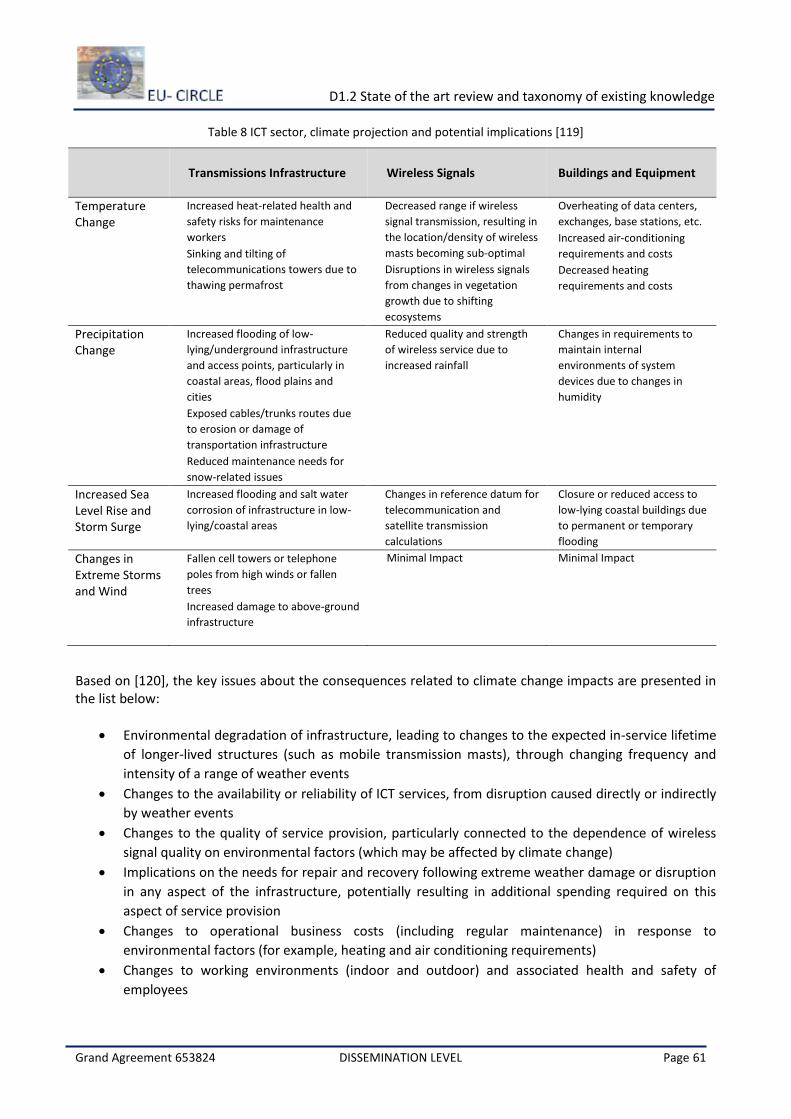
D1.2 State of the art review and taxonomy of existing knowledge
Grand Agreement 653824 DISSEMINATION LEVEL Page 61
Table 8 ICT sector, climate projection and potential implications [119]
Transmissions Infrastructure Wireless Signals Buildings and Equipment
Temperature Change
Increased heat-related health and
safety risks for maintenance
workers
Sinking and tilting of
telecommunications towers due to
thawing permafrost
Decreased range if wireless
signal transmission, resulting in
the location/density of wireless
masts becoming sub-optimal
Disruptions in wireless signals
from changes in vegetation
growth due to shifting
ecosystems
Overheating of data centers,
exchanges, base stations, etc.
Increased air-conditioning
requirements and costs
Decreased heating
requirements and costs
Precipitation Change
Increased flooding of low-
lying/underground infrastructure
and access points, particularly in
coastal areas, flood plains and
cities
Exposed cables/trunks routes due
to erosion or damage of
transportation infrastructure
Reduced maintenance needs for
snow-related issues
Reduced quality and strength
of wireless service due to
increased rainfall
Changes in requirements to
maintain internal
environments of system
devices due to changes in
humidity
Increased Sea Level Rise and Storm Surge
Increased flooding and salt water
corrosion of infrastructure in low-
lying/coastal areas
Changes in reference datum for
telecommunication and
satellite transmission
calculations
Closure or reduced access to
low-lying coastal buildings due
to permanent or temporary
flooding
Changes in Extreme Storms and Wind
Fallen cell towers or telephone
poles from high winds or fallen
trees
Increased damage to above-ground
infrastructure
Minimal Impact Minimal Impact
Based on [120], the key issues about the consequences related to climate change impacts are presented in the list below:
Environmental degradation of infrastructure, leading to changes to the expected in-service lifetime
of longer-lived structures (such as mobile transmission masts), through changing frequency and
intensity of a range of weather events
Changes to the availability or reliability of ICT services, from disruption caused directly or indirectly
by weather events
Changes to the quality of service provision, particularly connected to the dependence of wireless
signal quality on environmental factors (which may be affected by climate change)
Implications on the needs for repair and recovery following extreme weather damage or disruption
in any aspect of the infrastructure, potentially resulting in additional spending required on this
aspect of service provision
Changes to operational business costs (including regular maintenance) in response to
environmental factors (for example, heating and air conditioning requirements)
Changes to working environments (indoor and outdoor) and associated health and safety of
employees
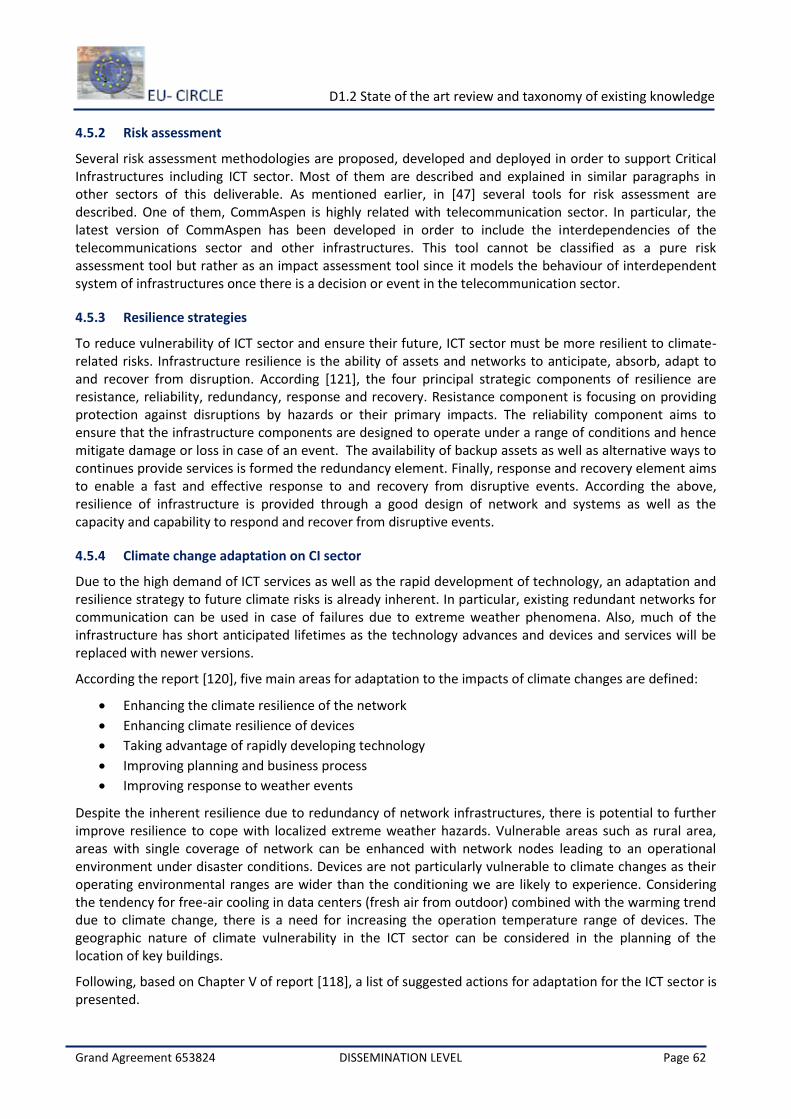
D1.2 State of the art review and taxonomy of existing knowledge
Grand Agreement 653824 DISSEMINATION LEVEL Page 62
4.5.2 Risk assessment
Several risk assessment methodologies are proposed, developed and deployed in order to support Critical Infrastructures including ICT sector. Most of them are described and explained in similar paragraphs in other sectors of this deliverable. As mentioned earlier, in [47] several tools for risk assessment are described. One of them, CommAspen is highly related with telecommunication sector. In particular, the latest version of CommAspen has been developed in order to include the interdependencies of the telecommunications sector and other infrastructures. This tool cannot be classified as a pure risk assessment tool but rather as an impact assessment tool since it models the behaviour of interdependent system of infrastructures once there is a decision or event in the telecommunication sector.
4.5.3 Resilience strategies
To reduce vulnerability of ICT sector and ensure their future, ICT sector must be more resilient to climate-related risks. Infrastructure resilience is the ability of assets and networks to anticipate, absorb, adapt to and recover from disruption. According [121], the four principal strategic components of resilience are resistance, reliability, redundancy, response and recovery. Resistance component is focusing on providing protection against disruptions by hazards or their primary impacts. The reliability component aims to ensure that the infrastructure components are designed to operate under a range of conditions and hence mitigate damage or loss in case of an event. The availability of backup assets as well as alternative ways to continues provide services is formed the redundancy element. Finally, response and recovery element aims to enable a fast and effective response to and recovery from disruptive events. According the above, resilience of infrastructure is provided through a good design of network and systems as well as the capacity and capability to respond and recover from disruptive events.
4.5.4 Climate change adaptation on CI sector
Due to the high demand of ICT services as well as the rapid development of technology, an adaptation and resilience strategy to future climate risks is already inherent. In particular, existing redundant networks for communication can be used in case of failures due to extreme weather phenomena. Also, much of the infrastructure has short anticipated lifetimes as the technology advances and devices and services will be replaced with newer versions.
According the report [120], five main areas for adaptation to the impacts of climate changes are defined:
Enhancing the climate resilience of the network
Enhancing climate resilience of devices
Taking advantage of rapidly developing technology
Improving planning and business process
Improving response to weather events
Despite the inherent resilience due to redundancy of network infrastructures, there is potential to further improve resilience to cope with localized extreme weather hazards. Vulnerable areas such as rural area, areas with single coverage of network can be enhanced with network nodes leading to an operational environment under disaster conditions. Devices are not particularly vulnerable to climate changes as their operating environmental ranges are wider than the conditioning we are likely to experience. Considering the tendency for free-air cooling in data centers (fresh air from outdoor) combined with the warming trend due to climate change, there is a need for increasing the operation temperature range of devices. The geographic nature of climate vulnerability in the ICT sector can be considered in the planning of the location of key buildings.
Following, based on Chapter V of report [118], a list of suggested actions for adaptation for the ICT sector is presented.
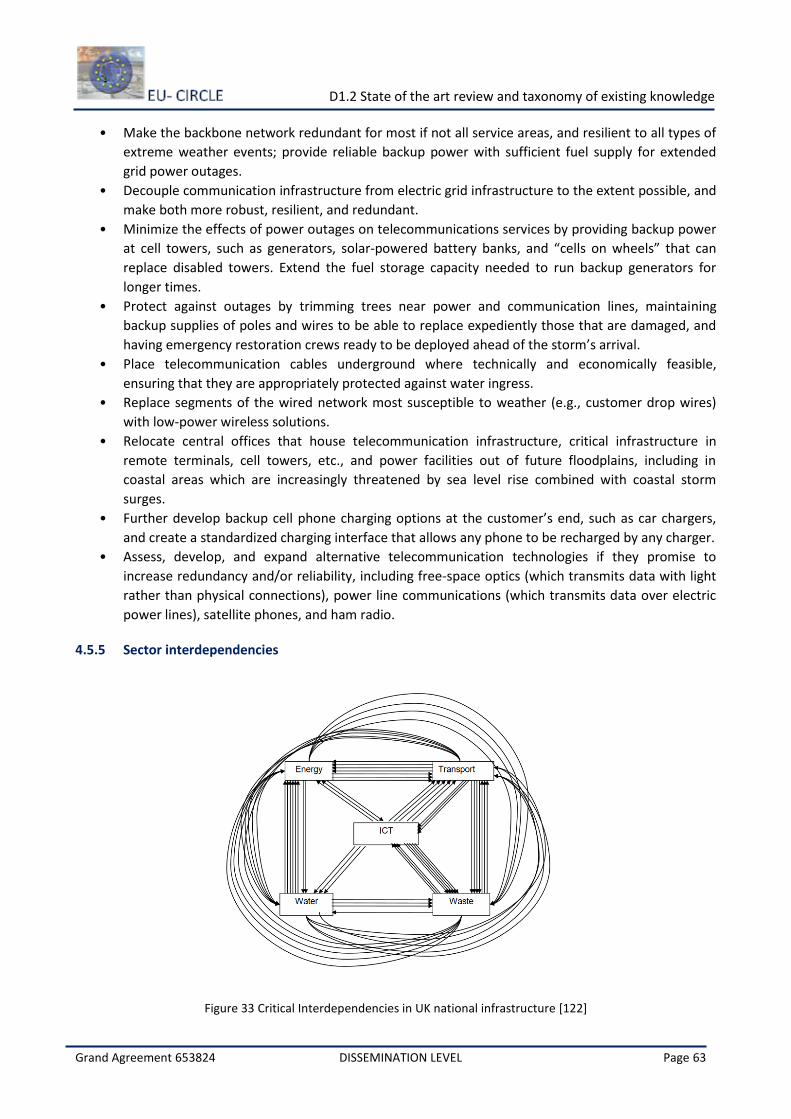
D1.2 State of the art review and taxonomy of existing knowledge
Grand Agreement 653824 DISSEMINATION LEVEL Page 63
• Make the backbone network redundant for most if not all service areas, and resilient to all types of
extreme weather events; provide reliable backup power with sufficient fuel supply for extended
grid power outages.
• Decouple communication infrastructure from electric grid infrastructure to the extent possible, and
make both more robust, resilient, and redundant.
• Minimize the effects of power outages on telecommunications services by providing backup power
at cell towers, such as generators, solar-powered battery banks, and “cells on wheels” that can
replace disabled towers. Extend the fuel storage capacity needed to run backup generators for
longer times.
• Protect against outages by trimming trees near power and communication lines, maintaining
backup supplies of poles and wires to be able to replace expediently those that are damaged, and
having emergency restoration crews ready to be deployed ahead of the storm’s arrival.
• Place telecommunication cables underground where technically and economically feasible,
ensuring that they are appropriately protected against water ingress.
• Replace segments of the wired network most susceptible to weather (e.g., customer drop wires)
with low-power wireless solutions.
• Relocate central offices that house telecommunication infrastructure, critical infrastructure in
remote terminals, cell towers, etc., and power facilities out of future floodplains, including in
coastal areas which are increasingly threatened by sea level rise combined with coastal storm
surges.
• Further develop backup cell phone charging options at the customer’s end, such as car chargers,
and create a standardized charging interface that allows any phone to be recharged by any charger.
• Assess, develop, and expand alternative telecommunication technologies if they promise to
increase redundancy and/or reliability, including free-space optics (which transmits data with light
rather than physical connections), power line communications (which transmits data over electric
power lines), satellite phones, and ham radio.
4.5.5 Sector interdependencies
Figure 33 Critical Interdependencies in UK national infrastructure [122]
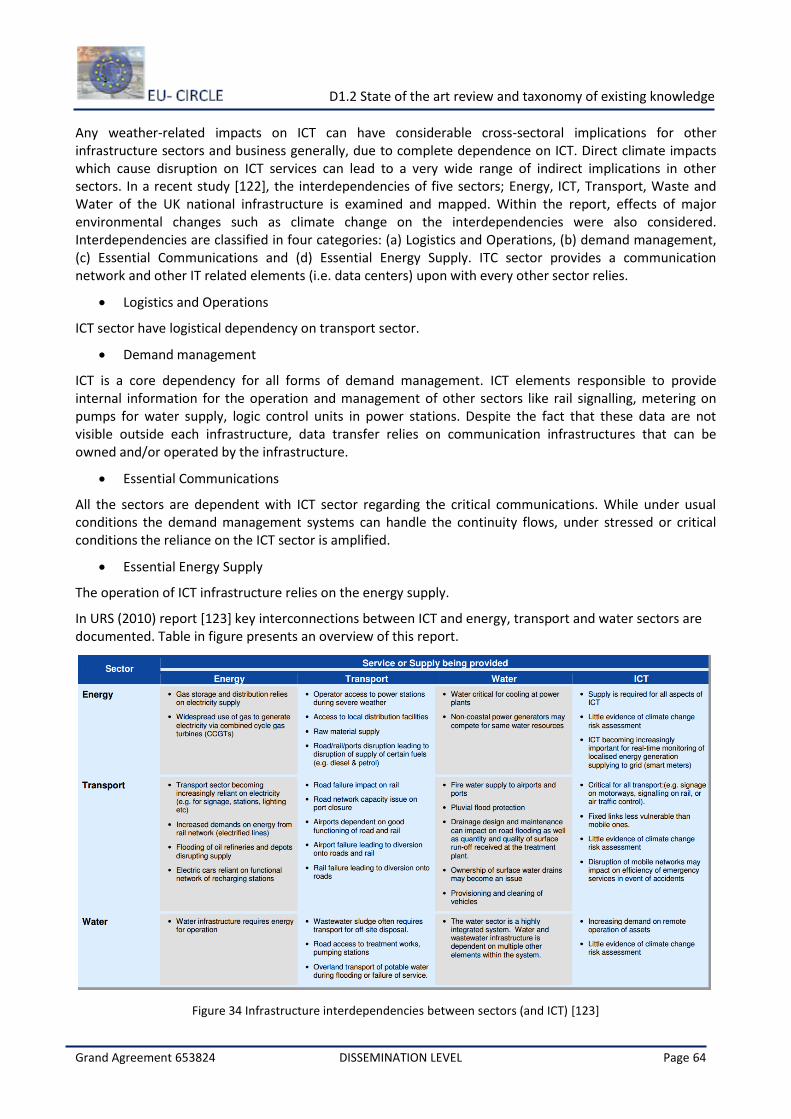
D1.2 State of the art review and taxonomy of existing knowledge
Grand Agreement 653824 DISSEMINATION LEVEL Page 64
Any weather-related impacts on ICT can have considerable cross-sectoral implications for other infrastructure sectors and business generally, due to complete dependence on ICT. Direct climate impacts which cause disruption on ICT services can lead to a very wide range of indirect implications in other sectors. In a recent study [122], the interdependencies of five sectors; Energy, ICT, Transport, Waste and Water of the UK national infrastructure is examined and mapped. Within the report, effects of major environmental changes such as climate change on the interdependencies were also considered. Interdependencies are classified in four categories: (a) Logistics and Operations, (b) demand management, (c) Essential Communications and (d) Essential Energy Supply. ITC sector provides a communication network and other IT related elements (i.e. data centers) upon with every other sector relies.
Logistics and Operations
ICT sector have logistical dependency on transport sector.
Demand management
ICT is a core dependency for all forms of demand management. ICT elements responsible to provide internal information for the operation and management of other sectors like rail signalling, metering on pumps for water supply, logic control units in power stations. Despite the fact that these data are not visible outside each infrastructure, data transfer relies on communication infrastructures that can be owned and/or operated by the infrastructure.
Essential Communications
All the sectors are dependent with ICT sector regarding the critical communications. While under usual conditions the demand management systems can handle the continuity flows, under stressed or critical conditions the reliance on the ICT sector is amplified.
Essential Energy Supply
The operation of ICT infrastructure relies on the energy supply.
In URS (2010) report [123] key interconnections between ICT and energy, transport and water sectors are documented. Table in figure presents an overview of this report.
Figure 34 Infrastructure interdependencies between sectors (and ICT) [123]
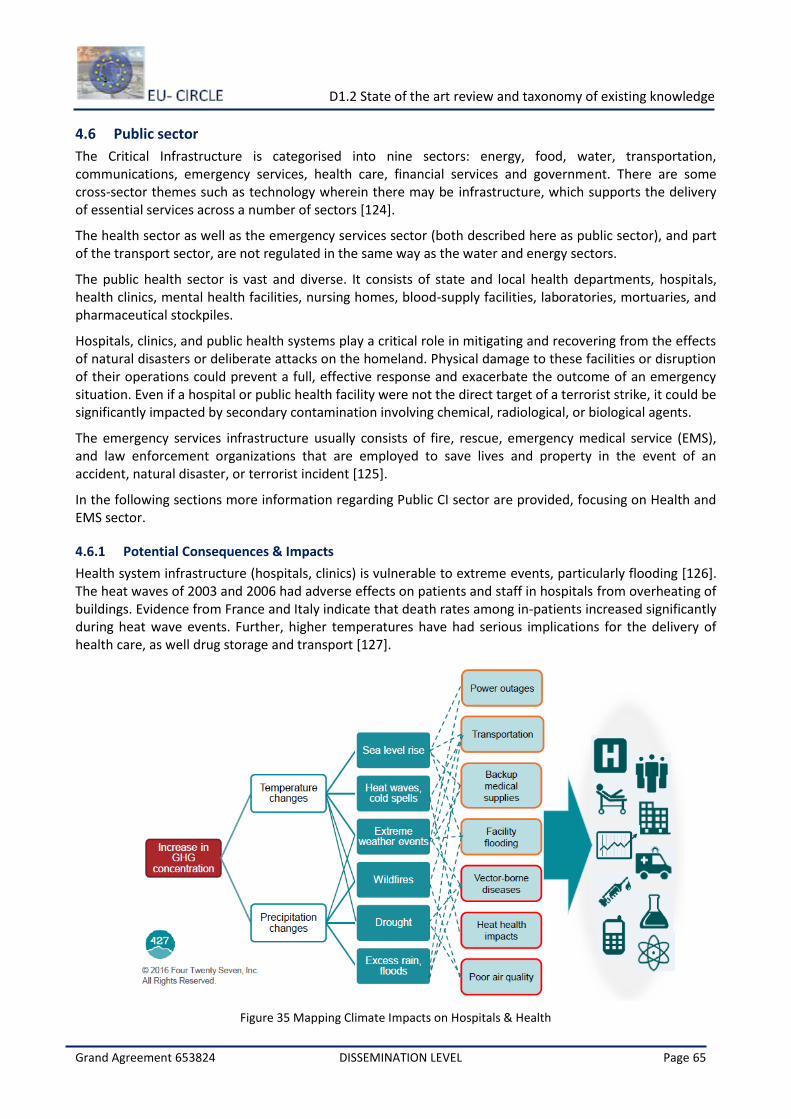
D1.2 State of the art review and taxonomy of existing knowledge
Grand Agreement 653824 DISSEMINATION LEVEL Page 65
4.6 Public sector
The Critical Infrastructure is categorised into nine sectors: energy, food, water, transportation, communications, emergency services, health care, financial services and government. There are some cross-sector themes such as technology wherein there may be infrastructure, which supports the delivery of essential services across a number of sectors [124].
The health sector as well as the emergency services sector (both described here as public sector), and part of the transport sector, are not regulated in the same way as the water and energy sectors.
The public health sector is vast and diverse. It consists of state and local health departments, hospitals, health clinics, mental health facilities, nursing homes, blood-supply facilities, laboratories, mortuaries, and pharmaceutical stockpiles.
Hospitals, clinics, and public health systems play a critical role in mitigating and recovering from the effects of natural disasters or deliberate attacks on the homeland. Physical damage to these facilities or disruption of their operations could prevent a full, effective response and exacerbate the outcome of an emergency situation. Even if a hospital or public health facility were not the direct target of a terrorist strike, it could be significantly impacted by secondary contamination involving chemical, radiological, or biological agents.
The emergency services infrastructure usually consists of fire, rescue, emergency medical service (EMS), and law enforcement organizations that are employed to save lives and property in the event of an accident, natural disaster, or terrorist incident [125].
In the following sections more information regarding Public CI sector are provided, focusing on Health and EMS sector.
4.6.1 Potential Consequences & Impacts
Health system infrastructure (hospitals, clinics) is vulnerable to extreme events, particularly flooding [126]. The heat waves of 2003 and 2006 had adverse effects on patients and staff in hospitals from overheating of buildings. Evidence from France and Italy indicate that death rates among in-patients increased significantly during heat wave events. Further, higher temperatures have had serious implications for the delivery of health care, as well drug storage and transport [127].
Figure 35 Mapping Climate Impacts on Hospitals & Health
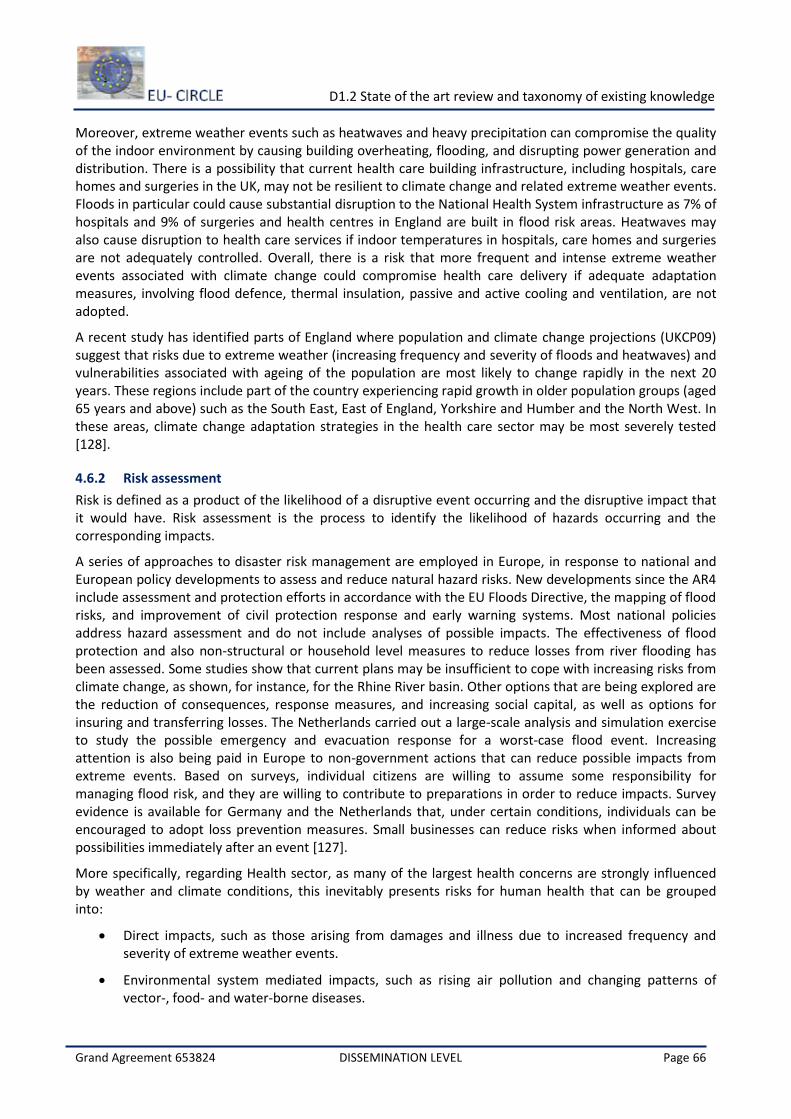
D1.2 State of the art review and taxonomy of existing knowledge
Grand Agreement 653824 DISSEMINATION LEVEL Page 66
Moreover, extreme weather events such as heatwaves and heavy precipitation can compromise the quality of the indoor environment by causing building overheating, flooding, and disrupting power generation and distribution. There is a possibility that current health care building infrastructure, including hospitals, care homes and surgeries in the UK, may not be resilient to climate change and related extreme weather events. Floods in particular could cause substantial disruption to the National Health System infrastructure as 7% of hospitals and 9% of surgeries and health centres in England are built in flood risk areas. Heatwaves may also cause disruption to health care services if indoor temperatures in hospitals, care homes and surgeries are not adequately controlled. Overall, there is a risk that more frequent and intense extreme weather events associated with climate change could compromise health care delivery if adequate adaptation measures, involving flood defence, thermal insulation, passive and active cooling and ventilation, are not adopted.
A recent study has identified parts of England where population and climate change projections (UKCP09) suggest that risks due to extreme weather (increasing frequency and severity of floods and heatwaves) and vulnerabilities associated with ageing of the population are most likely to change rapidly in the next 20 years. These regions include part of the country experiencing rapid growth in older population groups (aged 65 years and above) such as the South East, East of England, Yorkshire and Humber and the North West. In these areas, climate change adaptation strategies in the health care sector may be most severely tested [128].
4.6.2 Risk assessment
Risk is defined as a product of the likelihood of a disruptive event occurring and the disruptive impact that it would have. Risk assessment is the process to identify the likelihood of hazards occurring and the corresponding impacts.
A series of approaches to disaster risk management are employed in Europe, in response to national and European policy developments to assess and reduce natural hazard risks. New developments since the AR4 include assessment and protection efforts in accordance with the EU Floods Directive, the mapping of flood risks, and improvement of civil protection response and early warning systems. Most national policies address hazard assessment and do not include analyses of possible impacts. The effectiveness of flood protection and also non-structural or household level measures to reduce losses from river flooding has been assessed. Some studies show that current plans may be insufficient to cope with increasing risks from climate change, as shown, for instance, for the Rhine River basin. Other options that are being explored are the reduction of consequences, response measures, and increasing social capital, as well as options for insuring and transferring losses. The Netherlands carried out a large-scale analysis and simulation exercise to study the possible emergency and evacuation response for a worst-case flood event. Increasing attention is also being paid in Europe to non-government actions that can reduce possible impacts from extreme events. Based on surveys, individual citizens are willing to assume some responsibility for managing flood risk, and they are willing to contribute to preparations in order to reduce impacts. Survey evidence is available for Germany and the Netherlands that, under certain conditions, individuals can be encouraged to adopt loss prevention measures. Small businesses can reduce risks when informed about possibilities immediately after an event [127].
More specifically, regarding Health sector, as many of the largest health concerns are strongly influenced by weather and climate conditions, this inevitably presents risks for human health that can be grouped into:
Direct impacts, such as those arising from damages and illness due to increased frequency and severity of extreme weather events.
Environmental system mediated impacts, such as rising air pollution and changing patterns of vector-, food- and water-borne diseases.
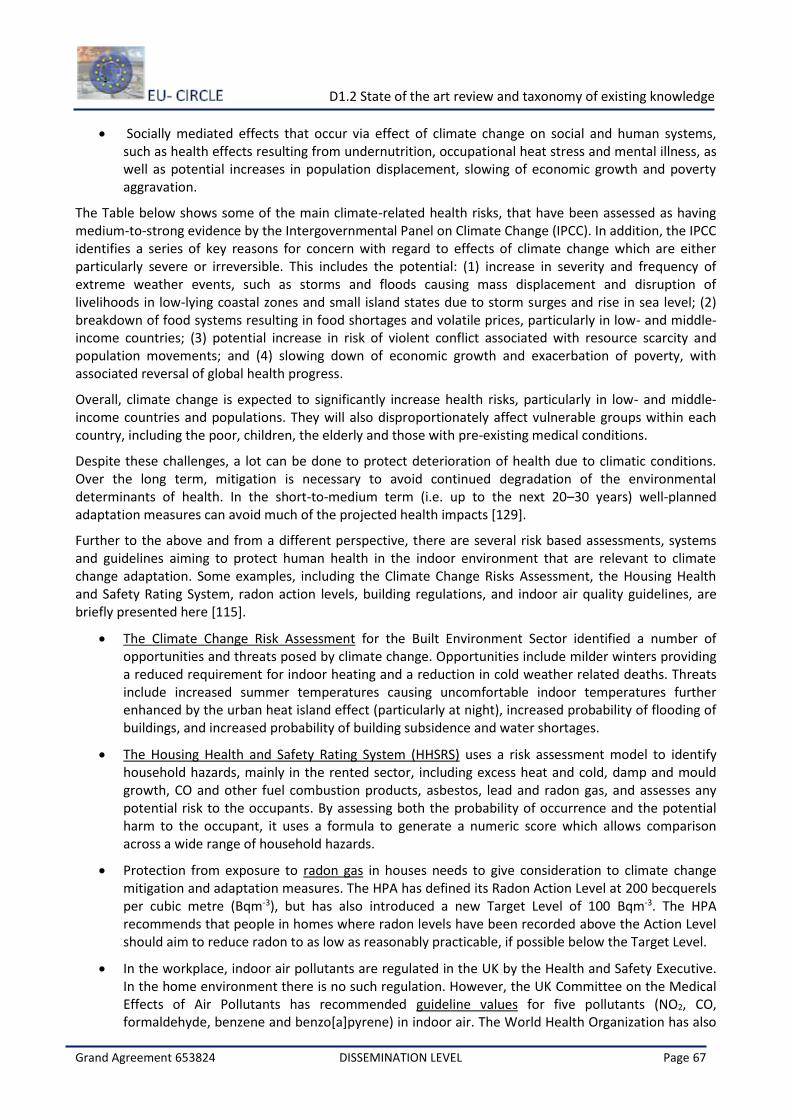
D1.2 State of the art review and taxonomy of existing knowledge
Grand Agreement 653824 DISSEMINATION LEVEL Page 67
Socially mediated effects that occur via effect of climate change on social and human systems, such as health effects resulting from undernutrition, occupational heat stress and mental illness, as well as potential increases in population displacement, slowing of economic growth and poverty aggravation.
The Table below shows some of the main climate-related health risks, that have been assessed as having medium-to-strong evidence by the Intergovernmental Panel on Climate Change (IPCC). In addition, the IPCC identifies a series of key reasons for concern with regard to effects of climate change which are either particularly severe or irreversible. This includes the potential: (1) increase in severity and frequency of extreme weather events, such as storms and floods causing mass displacement and disruption of livelihoods in low-lying coastal zones and small island states due to storm surges and rise in sea level; (2) breakdown of food systems resulting in food shortages and volatile prices, particularly in low- and middle-income countries; (3) potential increase in risk of violent conflict associated with resource scarcity and population movements; and (4) slowing down of economic growth and exacerbation of poverty, with associated reversal of global health progress.
Overall, climate change is expected to significantly increase health risks, particularly in low- and middle-income countries and populations. They will also disproportionately affect vulnerable groups within each country, including the poor, children, the elderly and those with pre-existing medical conditions.
Despite these challenges, a lot can be done to protect deterioration of health due to climatic conditions. Over the long term, mitigation is necessary to avoid continued degradation of the environmental determinants of health. In the short-to-medium term (i.e. up to the next 20–30 years) well-planned adaptation measures can avoid much of the projected health impacts [129].
Further to the above and from a different perspective, there are several risk based assessments, systems and guidelines aiming to protect human health in the indoor environment that are relevant to climate change adaptation. Some examples, including the Climate Change Risks Assessment, the Housing Health and Safety Rating System, radon action levels, building regulations, and indoor air quality guidelines, are briefly presented here [115].
The Climate Change Risk Assessment for the Built Environment Sector identified a number of opportunities and threats posed by climate change. Opportunities include milder winters providing a reduced requirement for indoor heating and a reduction in cold weather related deaths. Threats include increased summer temperatures causing uncomfortable indoor temperatures further enhanced by the urban heat island effect (particularly at night), increased probability of flooding of buildings, and increased probability of building subsidence and water shortages.
The Housing Health and Safety Rating System (HHSRS) uses a risk assessment model to identify household hazards, mainly in the rented sector, including excess heat and cold, damp and mould growth, CO and other fuel combustion products, asbestos, lead and radon gas, and assesses any potential risk to the occupants. By assessing both the probability of occurrence and the potential harm to the occupant, it uses a formula to generate a numeric score which allows comparison across a wide range of household hazards.
Protection from exposure to radon gas in houses needs to give consideration to climate change mitigation and adaptation measures. The HPA has defined its Radon Action Level at 200 becquerels per cubic metre (Bqm-3), but has also introduced a new Target Level of 100 Bqm-3. The HPA recommends that people in homes where radon levels have been recorded above the Action Level should aim to reduce radon to as low as reasonably practicable, if possible below the Target Level.
In the workplace, indoor air pollutants are regulated in the UK by the Health and Safety Executive. In the home environment there is no such regulation. However, the UK Committee on the Medical Effects of Air Pollutants has recommended guideline values for five pollutants (NO2, CO, formaldehyde, benzene and benzo[a]pyrene) in indoor air. The World Health Organization has also
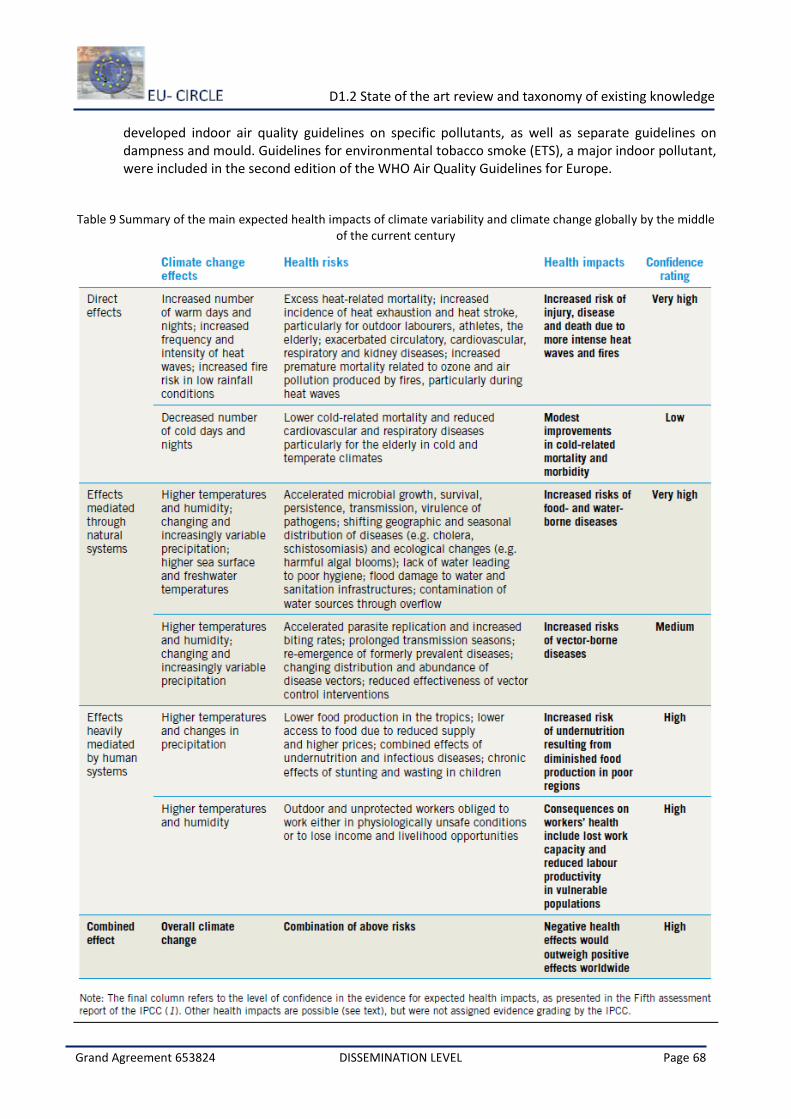
D1.2 State of the art review and taxonomy of existing knowledge
Grand Agreement 653824 DISSEMINATION LEVEL Page 68
developed indoor air quality guidelines on specific pollutants, as well as separate guidelines on dampness and mould. Guidelines for environmental tobacco smoke (ETS), a major indoor pollutant, were included in the second edition of the WHO Air Quality Guidelines for Europe.
Table 9 Summary of the main expected health impacts of climate variability and climate change globally by the middle of the current century
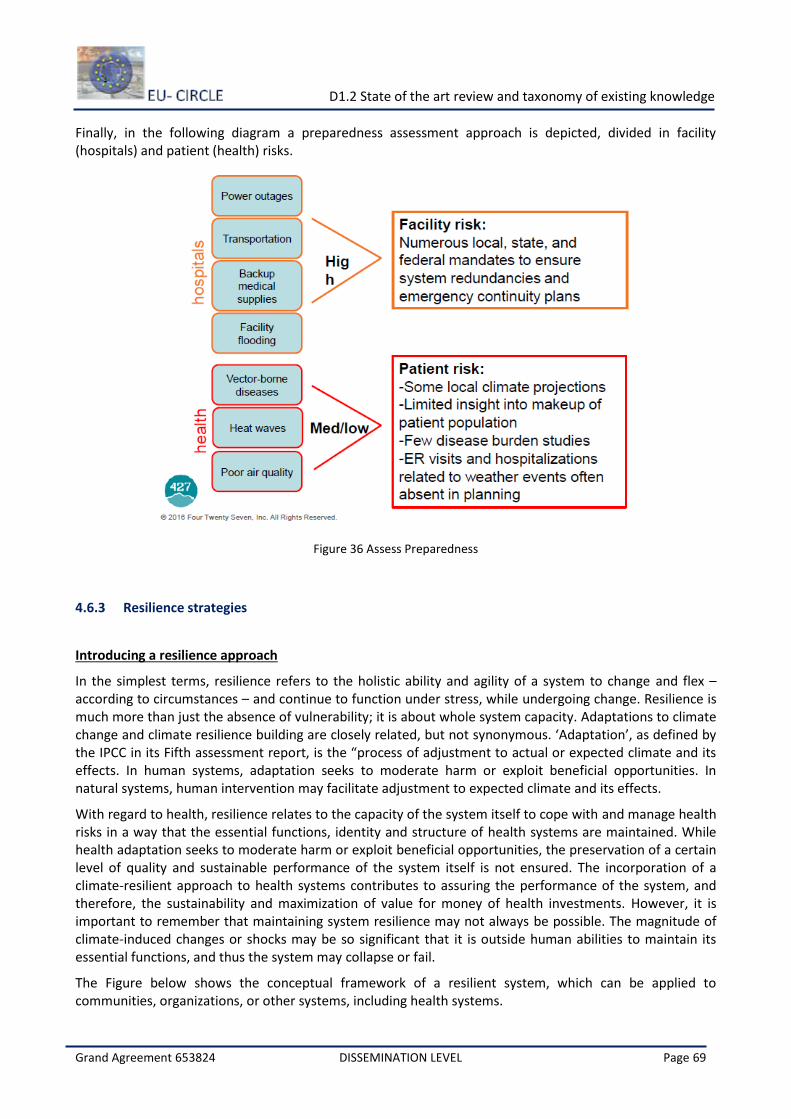
D1.2 State of the art review and taxonomy of existing knowledge
Grand Agreement 653824 DISSEMINATION LEVEL Page 69
Finally, in the following diagram a preparedness assessment approach is depicted, divided in facility (hospitals) and patient (health) risks.
Figure 36 Assess Preparedness
4.6.3 Resilience strategies
Introducing a resilience approach
In the simplest terms, resilience refers to the holistic ability and agility of a system to change and flex – according to circumstances – and continue to function under stress, while undergoing change. Resilience is much more than just the absence of vulnerability; it is about whole system capacity. Adaptations to climate change and climate resilience building are closely related, but not synonymous. ‘Adaptation’, as defined by the IPCC in its Fifth assessment report, is the “process of adjustment to actual or expected climate and its effects. In human systems, adaptation seeks to moderate harm or exploit beneficial opportunities. In natural systems, human intervention may facilitate adjustment to expected climate and its effects.
With regard to health, resilience relates to the capacity of the system itself to cope with and manage health risks in a way that the essential functions, identity and structure of health systems are maintained. While health adaptation seeks to moderate harm or exploit beneficial opportunities, the preservation of a certain level of quality and sustainable performance of the system itself is not ensured. The incorporation of a climate-resilient approach to health systems contributes to assuring the performance of the system, and therefore, the sustainability and maximization of value for money of health investments. However, it is important to remember that maintaining system resilience may not always be possible. The magnitude of climate-induced changes or shocks may be so significant that it is outside human abilities to maintain its essential functions, and thus the system may collapse or fail.
The Figure below shows the conceptual framework of a resilient system, which can be applied to communities, organizations, or other systems, including health systems.
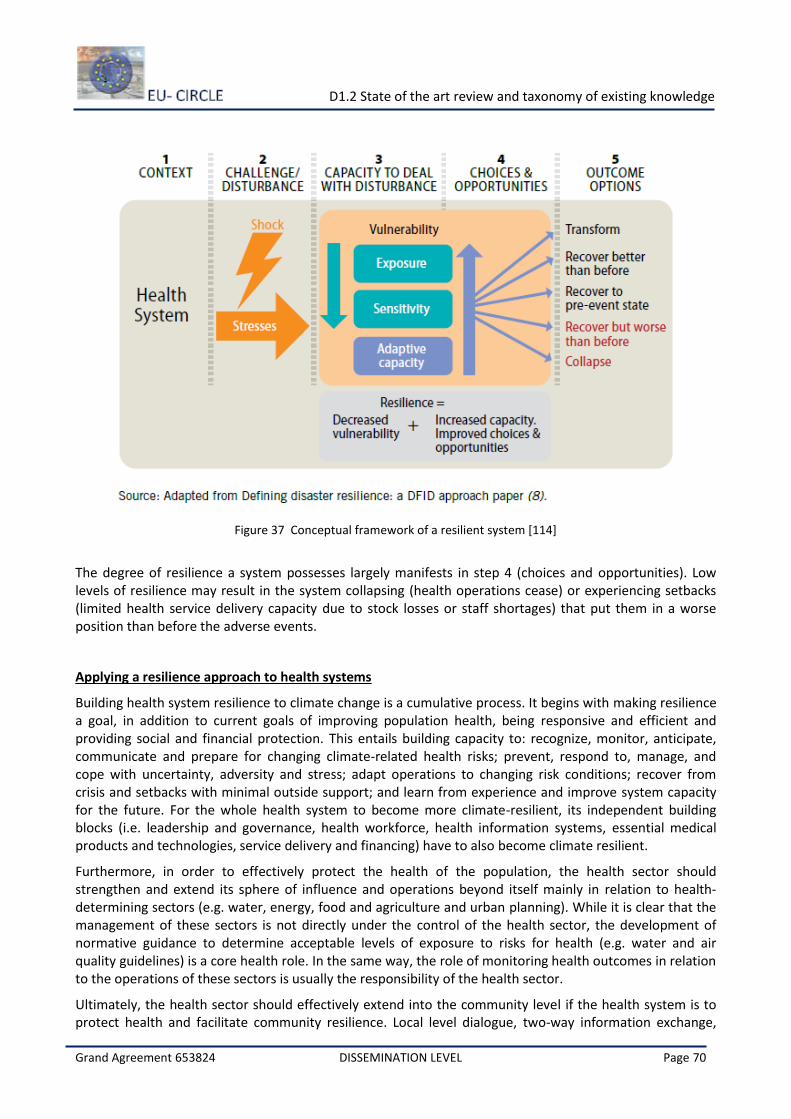
D1.2 State of the art review and taxonomy of existing knowledge
Grand Agreement 653824 DISSEMINATION LEVEL Page 70
Figure 37 Conceptual framework of a resilient system [114]
The degree of resilience a system possesses largely manifests in step 4 (choices and opportunities). Low levels of resilience may result in the system collapsing (health operations cease) or experiencing setbacks (limited health service delivery capacity due to stock losses or staff shortages) that put them in a worse position than before the adverse events.
Applying a resilience approach to health systems
Building health system resilience to climate change is a cumulative process. It begins with making resilience a goal, in addition to current goals of improving population health, being responsive and efficient and providing social and financial protection. This entails building capacity to: recognize, monitor, anticipate, communicate and prepare for changing climate-related health risks; prevent, respond to, manage, and cope with uncertainty, adversity and stress; adapt operations to changing risk conditions; recover from crisis and setbacks with minimal outside support; and learn from experience and improve system capacity for the future. For the whole health system to become more climate-resilient, its independent building blocks (i.e. leadership and governance, health workforce, health information systems, essential medical products and technologies, service delivery and financing) have to also become climate resilient.
Furthermore, in order to effectively protect the health of the population, the health sector should strengthen and extend its sphere of influence and operations beyond itself mainly in relation to health-determining sectors (e.g. water, energy, food and agriculture and urban planning). While it is clear that the management of these sectors is not directly under the control of the health sector, the development of normative guidance to determine acceptable levels of exposure to risks for health (e.g. water and air quality guidelines) is a core health role. In the same way, the role of monitoring health outcomes in relation to the operations of these sectors is usually the responsibility of the health sector.
Ultimately, the health sector should effectively extend into the community level if the health system is to protect health and facilitate community resilience. Local level dialogue, two-way information exchange,
D1.2 State of the art review and taxonomy of existing knowledge
Grand Agreement 653824 DISSEMINATION LEVEL Page 71
and community mobilization should be considered essential functions of the health system. Community empowerment can activate local capacity, increase the scope of available information, improve understanding of vulnerability and build foundations for local resilience.
4.6.4 Climate change adaptation on CI sector
Some National Policies on Climate Change Adaptation in Health (CCAH) stipulated the need to upgrade hospitals and other health facilities to make them CC-proof, in adherence to infrastructural and service standards. One of the major concerns in CCAH is to ensure that the health care delivery system remains ready and functional in the event that climate change brings its toll on the health of the population. The hospitals, as major providers of healthcare services, including other health services need to be fortified for these events [130].
Strategies, key result areas and activities, that can be adapted in order to be adapted in climate change are presented below:
Strategy 1. Develop/modify policy instruments, plans and package of interventions responsive to health impacts of climate change
Enhancing the adaptive capacity of the health care delivery system to the health impacts of climate change encompasses the development or modification of existing health program policies and guides and the packaging of appropriate interventions that address CC’s potential health outcomes. Strategy 1 calls for a systematic review of existing program policies and guidelines and identify specific components that need to be modified in order to become CC-responsive, be it during disasters or emergencies or in anticipation of extreme events that may occur especially in high risk or hazard-prone localities. It also requires the mapping and identification of high-risk/hazard-prone areas where the intervention/s will be applied or implemented. Package of interventions and alternative technologies or health care delivery schemes need to be pretested or piloted before these are scaled up to other vulnerable areas. It is equally important for these modified policies/guides and package of interventions to be widely disseminated among those concerned and for compliance to be monitored at appropriate levels of implementation.
Strategy 2. Build-up the capacity of the network of health care providers and facilities to be climate change-responsive
Strategy 2 requires strengthening the capacity of the network of health care providers (both health staff and facilities) to implement the modified or newly-developed policies/guides, intervention packages or alternative health delivery schemes. Capacity building would entail series of orientations and training of health care providers on these revised policies/guidelines, intervention packages and alternative health delivery schemes. It would also necessitate equipping the health staff with the necessary tools which they can use as they prepare for and respond to health impacts of climate change. On the other hand, health facilities had to be retro-fitted if necessary or provided with the necessary equipment or systems to make them CC-resilient.
Strategy 3. Strengthen CCAH Monitoring and Evaluation (M and E)
Central to the adaptation of program policies/guides and package of interventions and the design of alternative health delivery schemes responsive to the health impacts of climate change is an up-to-date, accurate, reliable and accessible information to guide key decisions and actions. This necessitates the development of a CCAH Monitoring and Evaluation Framework with corresponding guidelines and tools applicable at each level of administration. The M and E Framework is expected to generate the needed information through the conduct of researches/studies, the strengthening of the functionality of disease surveillance system, particularly on climate-sensitive diseases and through regular CCAH reporting and field monitoring. More local researches are needed to establish health impacts of climate change and measure
D1.2 State of the art review and taxonomy of existing knowledge
Grand Agreement 653824 DISSEMINATION LEVEL Page 72
cost-effectiveness and efficiency of different CCAH interventions. On the other hand, the disease surveillance system allows the study of CC parameters’ influence on the incidence of climate-sensitive diseases or on the behaviours of the disease vectors. As the national, sub-national and local levels intensify their respective actions on CCAH, it is imperative that reporting and monitoring of their implementation status is established or conducted on a regular basis.
Strategy 4. Establish financing mechanisms to support CCAH initiatives
Adaptation measures on climate change for health including support for mitigation efforts require a gargantuan amount of resources. Strategy 4 requires that all possible sources of funds be tapped, mobilized and secured to sustain CCAH operations at various levels of administration. It is necessary therefore that an overall investment plan is prepared in support the CCAH implementation and be able to mobilize funds from various sources.
Strategy 5. Strengthen multi-sector coordination of CCAH efforts at all levels
Besides Ministries/Departments of Health, support of other national government agencies, development partners, health care managers and providers both in the public and private sectors, the civil society (e.g. academe, non-government organizations, professional societies, etc.) and Local Government Units. In this regard, there is a need to strengthen the coordination of CCAH-related efforts, which must also be established and functional at the sub-national and local levels. Coordination must also be established with the other government agencies to ensure that CCAH-related efforts are harmonized with the programs/activities of the other sectors and at the local level.
Strategy 6. Improve awareness of communities on the impact of CC and their readiness to respond to health risks brought about by CC
While the first two strategies address the readiness and capability of the supply side (network of health care providers and facilities) in responding to health impacts of climate change, there is equally a need for the community members to be made aware of the effects of climate change on their welfare and health and the key measures they can undertake to cope with these impacts. The poor and marginalized population need more attention and assistance as they are the most hardly hit during disasters and calamities. For this purpose, there is a need to design and develop appropriate key messages related to climate change and identify strategic communication/information channels to reach them. Equipping them with the necessary skills to cope with the challenges of climate change is utmost important.
Strategy 7. Ensure availability of resources to protect the community from the health impacts of climate change
The poor are the hardest hit during disasters and calamities. Prior to the occurrence of extreme events, the poor are already highly vulnerable to diseases and infections. They also have the least means to access health and services given their limited knowledge, lack of resources and the physical barriers as they most likely reside in geographically-challenged localities. In addition to raising their awareness of the impact of climate change and equipping them with certain skills to cope when disasters hit, they need to be socially protected to ensure their continuous access to basic health care and services. Mechanisms must be mounted (e.g. transportation) and expanded and be oriented on how to avail said benefits. Other vulnerable groups (e.g. people with disabilities, the elderly, pregnant women, infants) who have the least ability to cope and survive during these situations should be mapped out and their special needs be identified.

D1.2 State of the art review and taxonomy of existing knowledge
Grand Agreement 653824 DISSEMINATION LEVEL Page 73
Further to the above strategic suggestions, a more focused example is presented. The figure below, provides a qualitative assessment of the future burden (for the period 2030–2040) of ill-health due to current climate change, in which the world will inevitably experience approximately 1.5 °C of warming due to past and present greenhouse gas emissions (1.5). Figure below, also presents the period 2080–2100, for which the global mean temperature is expected to increase by approximately 4 °C above preindustrial levels, unless vigorous mitigation efforts are undertaken soon (1.5). The different colours indicate the extent to which disease burdens could be avoided by effective adaptation measures in each period.
Figure 38 Conceptual presentation of health risks due to climate change and the potential for risk reduction through adaptation [129]
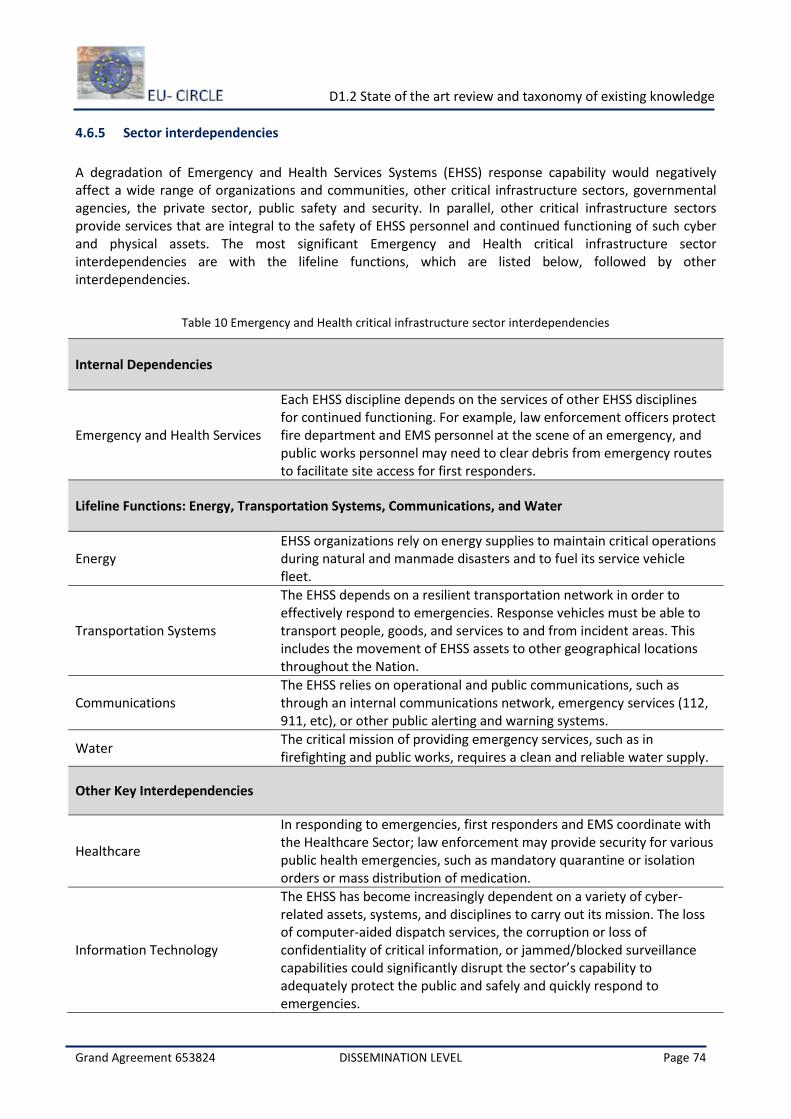
D1.2 State of the art review and taxonomy of existing knowledge
Grand Agreement 653824 DISSEMINATION LEVEL Page 74
4.6.5 Sector interdependencies
A degradation of Emergency and Health Services Systems (EHSS) response capability would negatively affect a wide range of organizations and communities, other critical infrastructure sectors, governmental agencies, the private sector, public safety and security. In parallel, other critical infrastructure sectors provide services that are integral to the safety of EHSS personnel and continued functioning of such cyber and physical assets. The most significant Emergency and Health critical infrastructure sector interdependencies are with the lifeline functions, which are listed below, followed by other interdependencies.
Table 10 Emergency and Health critical infrastructure sector interdependencies
Internal Dependencies
Emergency and Health Services
Each EHSS discipline depends on the services of other EHSS disciplines for continued functioning. For example, law enforcement officers protect fire department and EMS personnel at the scene of an emergency, and public works personnel may need to clear debris from emergency routes to facilitate site access for first responders.
Lifeline Functions: Energy, Transportation Systems, Communications, and Water
Energy EHSS organizations rely on energy supplies to maintain critical operations during natural and manmade disasters and to fuel its service vehicle fleet.
Transportation Systems
The EHSS depends on a resilient transportation network in order to effectively respond to emergencies. Response vehicles must be able to transport people, goods, and services to and from incident areas. This includes the movement of EHSS assets to other geographical locations throughout the Nation.
Communications The EHSS relies on operational and public communications, such as through an internal communications network, emergency services (112, 911, etc), or other public alerting and warning systems.
Water The critical mission of providing emergency services, such as in firefighting and public works, requires a clean and reliable water supply.
Other Key Interdependencies
Healthcare
In responding to emergencies, first responders and EMS coordinate with the Healthcare Sector; law enforcement may provide security for various public health emergencies, such as mandatory quarantine or isolation orders or mass distribution of medication.
Information Technology
The EHSS has become increasingly dependent on a variety of cyber-related assets, systems, and disciplines to carry out its mission. The loss of computer-aided dispatch services, the corruption or loss of confidentiality of critical information, or jammed/blocked surveillance capabilities could significantly disrupt the sector’s capability to adequately protect the public and safely and quickly respond to emergencies.
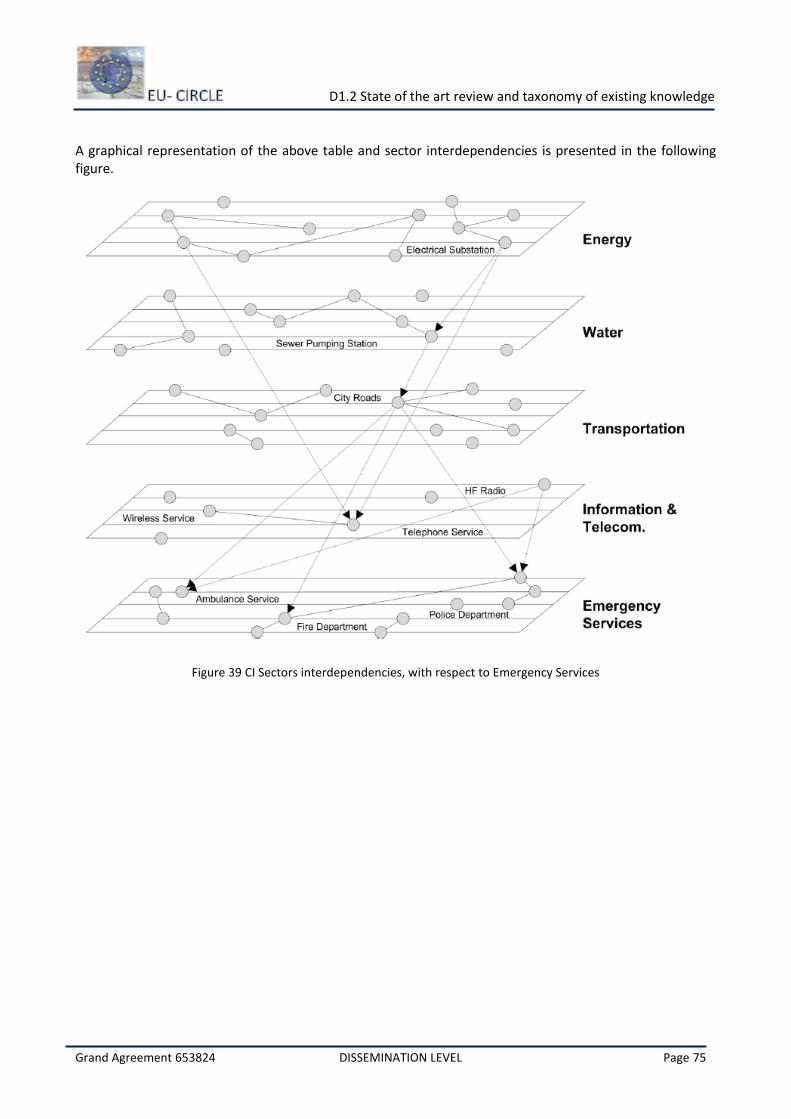
D1.2 State of the art review and taxonomy of existing knowledge
Grand Agreement 653824 DISSEMINATION LEVEL Page 75
A graphical representation of the above table and sector interdependencies is presented in the following figure.
Figure 39 CI Sectors interdependencies, with respect to Emergency Services
D1.2 State of the art review and taxonomy of existing knowledge
Grand Agreement 653824 DISSEMINATION LEVEL Page 76
5 Related Software
The demand for risk assessment data and modelling tools in the disaster risk management (DRM) community is high, and many open access software packages for natural hazards have been created over the last few decades [131]. The main goal of these activities is to build capacity among national and local governments and international development professionals working in disaster risk management. A key decision in these activities is the choice of modelling tool that will be used to address the hazard, exposure, and/or risk question under consideration.
The CAPRA Program uses a modular, free platform for probabilistic risk assessment of natural hazards. This platform is a Geographic Information System oriented to risk calculations based on hazard, exposure and physical vulnerability data. Through hazard mapping, risk assessment and cost-benefit analysis tools, the platform allows the user to determine conjoint or cascade risk on an inter-related multi-hazard basis (which distinguishes the platform from previous single hazard analyses) and to support pro-active risk management. It can also be used to design risk-financing strategies34. The software calculates deterministic and event set probabilistic risk for buildings using continuous fragility functions. CAPRA is an initiative that aims to strengthen institutional capacity in disaster risk assessment with the objective of integrating risk information into development policies and programs. The hazard modules include a set of software tools to model hazard frequency and intensity for earthquakes, tsunamis, cyclone, floods, landslides and volcanic hazards. CAPRA-Hurricane is the hazard module that can create a set of events for hurricane paths, CAPRA-Flood model is a simple tool for determining flood hazard, CAPRA-Earthquake is the software that can create a set of events for earthquake events and CAPRA-Tsunami and Storm Surge which calculates deterministic and event set probabilistic risk for tsunamis, using continuous fragility functions [131].
Hazus Multi-Hazard (Hazus-MH) produces loss estimates based on state-of-the-art scientific and engineering knowledge and software architecture. These estimates are essential for decision-making at all levels of government and are a basis for developing mitigation plans and policies, emergency preparedness and response and recovery planning. During the past decade, Hazus has evolved into a powerful tool for mitigation and recovery planning and analysis. Hazus-MH is highly sensitive to hazard input. Priority needs to be given to procedures for obtaining the most accurate hazard data from the National Hurricane Center and other sources35. The Hazus-MH Earthquake Model is used to estimate damages and loss of buildings and essential facilities from earthquake events, in a regional scale. Results are most accurate when aggregated on a county or regional level36,. The Hazus-MH Flood Model allows planners and other practitioners to carry out a wide range of flood hazard analyses. The flood loss estimation methodology consists of two modules that carry out basic analytical processes: flood hazard analysis and flood loss estimation analysis37. The Hazus-MH Hurricane Wind Model makes use of an existing state-of-the-art windfield model, which has been calibrated and validated using full-scale hurricane data. The model incorporates sea surface temperature in the boundary layer analysis and calculates wind speed as a function of central pressure, translation speed and surface roughness38.
RiskScape provides a modular framework to estimate impacts and losses for assets exposed to natural hazards. The software combines hazard, asset and vulnerability modules through a data selection process to quantify a range of economic and social consequences. This helps practitioners make informed decisions on natural hazard management activities. RiskScape’s tools enable users to easily import natural hazard models and asset inventories into the software program as modules. The software provides a modular framework for impact and loss modelling and standard module attribute code that allows any RiskScape or imported module combination to be used without need to reconfigure the software39. It is a family of
34 http://www.ecapra.org/software 35 http://www.fema.gov/hazus-detail 36 http://www.fema.gov/hazus-mh-earthquake-model 37 http://www.fema.gov/hazus-mh-flood-model 38 http://www.fema.gov/hazus-mh-hurricane-wind-model 39 https://riskscape.niwa.co.nz/how-it-works/why-use-riskscape
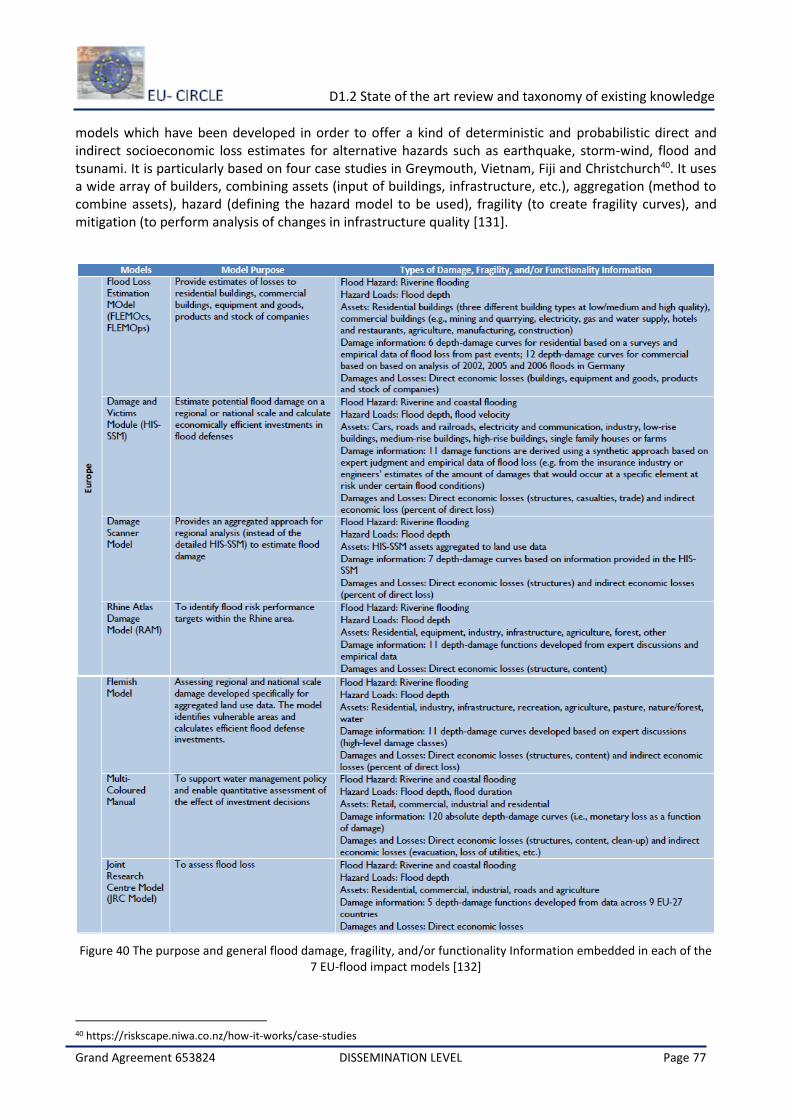
D1.2 State of the art review and taxonomy of existing knowledge
Grand Agreement 653824 DISSEMINATION LEVEL Page 77
models which have been developed in order to offer a kind of deterministic and probabilistic direct and indirect socioeconomic loss estimates for alternative hazards such as earthquake, storm-wind, flood and tsunami. It is particularly based on four case studies in Greymouth, Vietnam, Fiji and Christchurch40. It uses a wide array of builders, combining assets (input of buildings, infrastructure, etc.), aggregation (method to combine assets), hazard (defining the hazard model to be used), fragility (to create fragility curves), and mitigation (to perform analysis of changes in infrastructure quality [131].
Figure 40 The purpose and general flood damage, fragility, and/or functionality Information embedded in each of the 7 EU-flood impact models [132]
40 https://riskscape.niwa.co.nz/how-it-works/case-studies
D1.2 State of the art review and taxonomy of existing knowledge
Grand Agreement 653824 DISSEMINATION LEVEL Page 78
The TCRM (Tropical Cyclone Risk Model) is a stochastic event simulator for tropical cyclone hazard. It uses wind field modelling distributions, which can be mathematically and statistically derived from a variety of methods, to simulate a user-input number of years of activity and create either a probabilistic view of wind speeds or just a single scenario. Although created in Australia, this software could potentially be used anywhere. Lists of historical events can be input from the IBTrACS data set using tropical cyclone serial numbers and locations, and then defining radius of maximum wind, mean sea level pressure, and distribution to fit the wind field profile and boundary layer method. Different return periods are then input for the wind hazard calculation [131].
D1.2 State of the art review and taxonomy of existing knowledge
Grand Agreement 653824 DISSEMINATION LEVEL Page 79
6 Conclusions
This deliverable, D1.2 state of the art review and taxonomy of existing knowledge, and taxonomy of the existing knowledge in order to provide an extensive assessment of the impacts from climate hazards and extreme weather on critical infrastructures, on a categorized way. Critical infrastructures such as telecommunications, electric power generation and transmission, chemical industry, water supply systems, transportation, ICT networks and emergency services have become the components of a larger interconnected system.
For each one of the CI sector a review about the climate changes and their impact is performed. In particular, the potential consequences and impacts of climate phenomena such as temperature, extreme winds, floods, wild fires, etc. are presented. Furthermore, for each sector, a relevant risk assessment, resilience strategies as well as a climate change adaptation framework are also provided. Beyond the analysis of each CI sector provided in Section 4, a further analysis on climate impacts including all the possible weather phenomena on each CI type and sub-type has been covered and placed on the ANNEXES part.
Furthermore, in this deliverable an extensive analysis of related EU-Funded and international projects as well as holistic frameworks on CI risk and resilience assessment due to climate change are included. Finally, last section of this deliverable, provides the state of the art overview of risk assessment data and modelling tools including open access software packages for natural hazards.

D1.2 State of the art review and taxonomy of existing knowledge
Grand Agreement 653824 DISSEMINATION LEVEL Page 80
7 Bibliography
[1] European Policy Center, “The climate is changing – is Europe ready? Building a common approach to adaptation,” EPC Issue paper No. 70, 2012.
[2] HM Government, “Climate Resilient Infrastructure: Preparing for a Changing Climate,” London, 2011.
[3] Guha-Sapir D, Hoyois F, Below R, “Annual disaster statistical review 2012: the numbers and trends,” Brussels, Belgium, 2013.
[4] Sundermann L, Schelske O, Hausmann P, “Mind the risk—a global ranking of cities under threat from natural disaster,” Swiss Reinsurance Company Ltd, Zurich, 2013.
[5] Rinaldi SM, Peerenboom JP, Kelly TK, “Identifying, understanding, and analyzing critical infrastructure interdependencies,” IEEE Control Syst Mag 21(6):11–25, 2001.
[6] European Commission, “Adapting infrastructure to climate change,” COMMISSION STAFF WORKING DOCUMENT, Brussels, 2013.
[7] National Research Council (NRC), “Facing Hazards and Disasters: Understanding Human Dimensions,” vol. The National Academies Press, 2006.
[8] Susan L. Cutter, Christopher T. Emrich, Jennifer J. Webb, and Daniel Morath, “Social Vulnerability to Climate Variability Hazards: A Review of the Literature,” Hazards and Vulnerability Research Institute Department of Geography University of South Carolina, Columbia, Oxfam America, 2009.
[9] G. F. a. J. E. H. White, “Assessment of Research on Natural Hazards,” MA: MIT Press, Cambridge, 1975.
[10] Government of Canada, “Threats To Canada’s Critical Infrastructure,” Canada, 2003.
[11] Hill A. A. and S. L. Cutter, ““Methods for determining disaster proneness”, in S. L. Cutter (ed.), American Hazardscapes: The Regionalization of Hazards and Disasters.,” J Washington D.C.: The oseph Henry Press, pp. 13-36., 2001.
[12] Birkmann J, “Measuring Vulnerability to Natural Hazards: Towards Disaster Resilient,” Societies. New York: United Nations Publications, 2006.
[13] Flax L. K., R. W. Jackson, and D. N. Stein, ““Community vulnerability assessment tool methodology.”,” Natural Hazards Review 3 (4): 163-176., 2002.
[14] A. Council, “Natural Hazard Risk Communications Toolbox],” 2014.
[15] MATRIX, “Deliverable D8.4, New Multi-Hazard and Multi-Risk Assessment Methods for Europe,” 2013.
[16] D. A. M. D. N. K. a. N. K. C.J. van Westen (end), “Multi-hazard risk Assessment,” in Distance education course, Guide book, United Nations University – ITC School on Disaster Geoinformation Management, 2011.
[17] F. Charles Scawthorn, N. Blais2, H. Seligson3, E. Tate4, E. Mifflin5, W. Thomas6, J. Murphy7 and a. C. Jones8, “HAZUS-MH Flood Loss Estimation Methodology I: Overview and Flood Hazard Characterization,” NATURAL HAZARDS REVIEW, 2006.
[18] U. N. D. P. UNDR, “DISASTER RESILIENCE MEASUREMENTS, STOCKTAKING OF ONGOING EFFORTS IN DEVELOPING SYSTEMS FOR MEASURING RESILIENCE,” Thomas Winderl, 2014.
[19] (. P. C. Climate Change Risk Assessment, “The UK Climate Change Risk Assessment 2012 Evidence Report,” 2012.
[20] Cabinet Office, “Keeping the Country Running: Natural Hazards and Infrastructure,” 70 Whitehall London, 2011.
[21] SWD, “Adapting infrastructure to climate change,” EUROPEAN COMMISSION , COMMISSION STAFF WORKING DOCUMENT, 2013.
[22] E. C. EU CIRCLE, “Description of Action,” 2015.
[23] OECD, “Integrating Climate Change Adaptation into Development Co-operation,” POLICY GUIDANCE, 2009.
[24] Tom Wilbanks, ORNL Steve Fernandez, ORNL, “CLIMATE CHANGE AND INFRASTRUCTURE, URBAN SYSTEMS, AND VULNERABILITIES,” Technical Report for the U.S. Department of Energy in Support of the National Climate Assessment, US, 2012.
D1.2 State of the art review and taxonomy of existing knowledge
Grand Agreement 653824 DISSEMINATION LEVEL Page 81
[25] Jeannette Sieber, “Influence of extreme weather on electricity infrastructure and adaptation options a GIS-based approach,” European Institute for Energy Research, Karlsruhe, Germany, 2011.
[26] Samiul Hasan, Greg Foliente, “Modeling infrastructure system interdependencies and socioeconomic impacts of failure in extreme events:emerging R&D challenges,” Springer Science+Business Media Dordrecht, 2015.
[27] N.C. Abi-Samra, Senior Member IEEE, K.R. Forsten, Member IEEE, and R. Entriken, Senior Member IEEE, “Sample Effects of Extreme Weather on Power Systems and Components, Part I: Sample Effects on Distribution Systems”.
[28] D. J. Sailor, “Relating residential and commercial sector electricity loads to climate evaluating state level sensitivities and vulnerabilities,” Energy, vol. 26, pp. 645-657, 2001.
[29] K. v. d. L. J. B. S. L. W. Rademaekers, “Investment Needs for Future Adaptation Measures in EU Nuclear Power Plants and Other Electricity Generation Technologies due to Effects of Climate Change,” European Commission Directorate - General for Energy, 2011.
[30] IAEA, Operating Experience with Nuclear Power Stations in Member States in 2003, 2004.
[31] L. K. A. Godden, “Electricity network development: new challenges for Australia,” Oxford, Energy networks and the Law: Innovative Solutions in Changing Markets Oxford University Press, pp. 292-312.
[32] Frank Th, “Climate change impacts on building heating and cooling energy demand in Switzerland,” Published in: Energy and Buildings 37, 2005.
[33] Christenson M, Manz, H, Gyalistras D, “Climate warming impact on degree-days and bulding energy demand in Switzerland,” Published in Energy Conversion and Management 47 (2006) 671-686, 2006.
[34] Ramsbottom D, Sayers P, and Panzeri M, “Climate Change Risk Assessment for the Floods and Coastal Erosion Sector,” Climate Change Risk Assessment UK, 2012.
[35] ADB (Asian Development Bank), Guidelines for Climate Proofing Investment in the Energy Sector, Asian Development Bank, 2013.
[36] European Commission, Energy in Europe - 1999 Annual Energy Review, Directorate - General for Energy, 2000.
[37] McColl L, Angelini T, Betts R, “Climate Change Risk Assessment for the Energy Sector,” Defra Project Code GA0204, Cimate change risk assessment UK, 2012.
[38] D. C. M. Geertsema, “Rock movements in northeastern British Columbia,” in Landslide Processes: From Geomorphologic Mapping to Dynamic Modelling, Strasbourg, France , 2009.
[39] Pryon, S.C., Barthelmie, R.J., “Climate change impacts on wind energy: a review,” Renewable and Sustainable Energy Reviews, vol. 14, no. 1, pp. 430-437, 2010.
[40] Climate Central, “Energy infrastructure threat from sea level,” Online at http://sealevel.climatecentral.org, Princeton, NJ, 2012.
[41] Michelle Davis, Steve Clemmer, “How Climate Change Puts Our Electricity at Risk,” Power Failure, union of concerned scientists, 2014.
[42] N. S. C.A, “Envisioning resilient electrical infrastructure: A policy framework for incorporating future climate change into electricity sector planning,” Environmental Science & Policy, vol. 40, pp. 78-84, 2014.
[43] Jeannette Sieber née Schulz, “Adaptation Options and Decision-Support for Electricity Infrastructure Operators under Influence of Extreme Hydro-Meteorological Events,” Journal of Integrated Disaster Risk Management, Special IDRiM2010 Conference Paper, 2011.
[44] Tebaldi C, D. Adams-Smith, and N. Heller, “The heat is on: U.S. temperature trends,” Climate Central. Online at www.climatecentral.org/news/the-heat-is-on/., Princeton, NJ, 2012.
[45] I. D. C. a. M. D. Stewart, “Changes toward earlier streamflow timing across western North America,” Journal of Climate 18:1136–1155. , 2005.
[46] U.S. Department of Energ, U.S. Energy Sector Vulnerabilities to Climate Change and Extreme Weather, U.S. Department of Energy, 2013.
[47] R. F. M. S. G. Giannopoulos, Risk assessment methodologies for Critical Infrastructure Protection. Part I: A state of the art, European Commission, 2012.
D1.2 State of the art review and taxonomy of existing knowledge
Grand Agreement 653824 DISSEMINATION LEVEL Page 82
[48] Paskal Cleo, “The Vulnerability of Energy Infrastructure to Environmental Change,” Published in Chatham House Briefing Paper, April 2009, 2009.
[49] T. Giordano, “Adaptive planning for climate resilient long-lived infrastructures,” Utilities Policy, vol. 23, pp. 80-89, 2012.
[50] The Federal Government , German Strategy for Adaptation to Climate Change, The Federal Government , 2008.
[51] BrightSource, Generating Clean Energy Reliably and Responsibly, Oakland, California: BrightSource , 2013.
[52] S. A. R. J. C. W. E. Walker, “Adaptive policies, policy analysis, and policy-making,” European Journal of Operational Research, vol. 128, no. 2, pp. 282-289, 2001.
[53] A. N. M. K. M. v. E. E. C. E. Luiijf, “Empirical Findings on Critical Infrastructure Dependencies in Europe,” Springer - Verlag Berlin Heidelberg, vol. 5508, pp. 302-310, 2009.
[54] D. Watts, “Security and vulnerability in electric power systems,” in 35th North American power symposium, 2003.
[55] Wilbanks T, Fernandez S, Backus G, Garcia P, Jonietz K, Kirshen P, Savonis M, Solecki W, Toole L, “Climate change and infrastructure, urban systems, and vulnerabilities,” Technical Report for the US Department of Energy in Support of the National Climate Assessment, 2013.
[56] Comes T, Van de Walle B, “Measuring disaster resilience: the impact of hurricane sandy on critical infrastructure systems,” In: Proceedings of the 11th international ISCRAM conference, 2014.
[57] L. A. Bollinger, C. W. J. Bogmans, E. J. L. Chappin, G. P. J. Dijkema, J. N. Huibregtse, N. Maas, T. Schenk, M. Snelder, P. van Thienen, S. de Wit, B. Wols, L. A.Tavasszy, “Climate adaptation of interconnected infrastructures:a framework for supporting governance,” Reg Environ Change (2014) 14:919–931, 2013.
[58] Chemical Industries Association, “Safeguarding chemical businesses in a changing climate,” 2015, 2015.
[59] Germany Trade & Invest, “The Chemical Industry in Germany,” Federal Ministry of Economics and Technology and the Federal Government Commissioner, Berlin, 2015.
[60] H. P.-,. E. e. H. K. n. Engel, “ow companies can adapt to climate change,” McKinsey & Company, 2015.
[61] KPMG, “The Outlook for the US Chemical Industry,” KPMG International Cooperative, 2010.
[62] Chemical Industries Association, “Safeguarding chemical business in a changing climate - How to prepare a Climate Change Adaptation Plan,” London, 2015.
[63] A. S. L. &. V. A. Cruz, “Emerging issues for natech disaster risk management in Europe,” vol. 9, no. 5, pp. 483-501, 2006.
[64] S. B. L. &. M. J. Young, “Natural and technologic hazardous material releases during and after natural disasters: a review,” Science of the total environment, vol. 322, no. 1, pp. 3-20, 2004.
[65] L. S. H. &. C. A. Steinberg, “Natech risk and management: an assessment of the state of the art,” Natural Hazards, vol. 46, no. 2, pp. 143-152, 2008.
[66] A. K. Y. &. T. H. Cruz, “Natech Disaster Risk Reduction: Can Integrated Risk Governance Help?,” Risk Governance Springer, pp. 441-462, 2015.
[67] Centre for Research on the Epidemiology of Disasters, “Human cost of natural disasters : 2015 a global perspective,” Centre for Research on the Epidemiology of Disasters, 2015.
[68] H. S. N. S. L. &. C. A. Sengul, “Analysis of hazardous material releases due to natural hazards in the United States,” Disasters, vol. 36, no. 4, pp. 723-743, 2012.
[69] E. &. M. F. Krausmann, “A qualitative Natech damage scale for the impact of floods on selected industrial facilities,” Natural Hazards, vol. 46, no. 2, pp. 179-197, 2008.
[70] K. Breslin, “Natural disasters and man-made responses: are we protecting environmental health?,” Environmental health perspectives, vol. 101, no. 7, pp. 590-592, 1993.
[71] A. M. &. O. N. Cruz, “Methodology for preliminary assessment of natechrisk in urban areas,” Natural Hazards, vol. 46, pp. 199-220, 2008.
[72] E. &. B. D. Krausmann, “Natech risk reduction in the European Union,” Journal of Risk Research, vol. 15, no. 8, pp.
D1.2 State of the art review and taxonomy of existing knowledge
Grand Agreement 653824 DISSEMINATION LEVEL Page 83
1027-1047, 2012.
[73] E. Krausmann, V. Cozzani, E. Salzano and E. Renni, “Industrial accidents triggered by natural hazards: an emerging risk issue,” Natural Hazards and Earth System Sciences, 2011.
[74] O. C. J. P. P. v. d. L. a. C. H. M.L. Parry, “IPCC Fourth Assessment Report: Climate Change 2007,” Cambridge University Press, Cambridge, United Kingdom and New York, NY, USA, 2007.
[75] A. S. L. V. A. A. N. J. &. P. F. Cruz, “State of the art in Natech risk management,” Report EUR vol. 21292., 2004.
[76] US EPA, “Community-Based Adaptation to a Changing Climate,” 2015.
[77] Homeland Security, Infrastructure taxonomy, 2008.
[78] Water UK, A WATER UK adaptation approach for asset management planning, 2007.
[79] UNESCO, “Guidelines on non-structural measures in urban flood management,” Technical Documents in Hydrology, vol. 50, 2001.
[80] EEA, “Safe water and healthy water services in a changing environment,” vol. 7, 2011.
[81] A. P. F. M. D. C. P.-L. T. (. R. K. R. K. W. a. D. Y. Georgakakos, “Water Resources. Climate Change Impacts in the United States: The Third National Climate Assessment,” 2014.
[82] WSDE, “Dam break inundation analysis and downstream hazard classification,” Dam Safety Guidelines, vol. 1, 2007.
[83] V. S. P. H. J. Kala, “Response of Water Tower on Wind Induced Vibration Considering Interaction of Fluid and Structure,” Trans Tech Publications In Applied Mechanics and Materials, vol. 284, pp. 1269-1272, 2013.
[84] WRF, “Effects of Wildfire on Drinking Water Utilities and Best Practices for Wildfire Risk Reduction and Mitigation,” Water Research Foundation and Environmental Protection Agency, 2013.
[85] EPA, “Incident Action Checklist – Wildfires,” 2015.
[86] W. W. K. Heyn, “Climate Risks to Water Utility Built Assets and Infrastructure: A synthesis of interviews with national and international water utilities,” Portland Water Bureau, 2015.
[87] AnglianWater, “Climate Change Adaptation Report,” 2011.
[88] Joint Research Centre, “Risk assessment methodologies for critical infrastructure protection,” 2015.
[89] EPA, “Flood Resilience: A Basic Guide for Water and Wastewater Utilities,” 2014.
[90] RAE, “Infrastructure, Engineering and Climate Change Adaptation – ensuring services in an uncertain future,” Royal Academy of Engineering, 2011.
[91] S. T. Water, “The impact of the July Floods on the Water Infrastructure and Customer Service,” 2007.
[92] USACE, “Climate Change Adaptation Report,” US Army Corps of Engineers, 2014.
[93] ASCE, “Adapting Infrastructure and Civil Engineering Practice to a Changing Climate,” Committee on Adaptation to a Changing Climate, 2015.
[94] J. P. P. &. T. K. K. S. M. Rinaldi, “Identifying, understanding, and analyzing critical infrastructure interdependencies,” IEEE Control Systems, vol. 21, no. 6, pp. 11-25, 2001.
[95] D. H. a. P. Pederson, “Critical Infrastructure Interdependency Modelling: A Survey of US and International Research,” Idaho National Laboratory Critical Infrastructure Protection Division, 2006.
[96] R. Zimmerman, “Decision-making and the vulnerability of interdependent critical infrastructure,” IEEE International Conference on Systems, Man and Cybernetics, vol. 5, 2004.
[97] P. J. K. T. Rinaldi SM, “Identifying, understanding, and analyzing critical infrastructure interdependencies,” IEEE Control Syst Mag , 2001.
[98] The World Bank, “Transport – Overview”.
[99] European Comission, “Transport – Overview,” 2015.
[100] destatis, “Transport”.
[101] M. C. G. L.-A. R. Yusta, “Methodologies and applications for critical infrastructure protection: State-of-the-art,”
D1.2 State of the art review and taxonomy of existing knowledge
Grand Agreement 653824 DISSEMINATION LEVEL Page 84
Energy Policy 39 , 2011.
[102] I. B. H. P. a. V. J. Utne, “A method for risk modeling of interdependencies in critical infrastructures,” Reliability Engineering and System Safety2011, vol. 96, no. 6, pp. 671-678.
[103] P. J. Y. Y. Haimes, “Leontief-based model of risk in complex interconnected infrastructures,” Journal of Infrastructure Systems, vol. 7, pp. 1-12, 2001.
[104] Y. J. S. K. C. M. H. C. L. a. Y. Z. Haimes, “Risk analysis in interdependent infrastructures,” in Critical Infrastructure Protection, New York, NY, Springer, 2007, pp. 297-310.
[105] Y. Y. Haimes, Risk Modeling, Assessment and Management, New York, NY: Wiley, 2004.
[106] Y. H. M. W. Z. Yan, “Hierarchical coordinated Bayesian model for risk analysis with sparse data,” in Society of Risk Analysis, Annual Meeting, Baltimore, Maryland, USA, 2006.
[107] COUNTERACT Consortium, “Cluster Of User Networks in Transport and Energy Relating to Anti-terrorist ACTivities,” 2009.
[108] K. B. F. H. G. T. L. R. Pant, “Interdependent impacts of inoperability at multi-modal transportation container terminals,” Transportation Research Part E: Logistics and Transportation Review, vol. 47 , no. 5, pp. 722-737, 2011.
[109] S. P. P. Zhang, “A generalized modeling framework to analyze interdependencies among infrastructure systems,” Transportation Research Part B: Methodological, vol. 45, no. 3, pp. 553-579, 2011.
[110] Intergovernmental Panel on Climate Change, “Climate Change 2007 Impacts, Adaptation, and Vulnerability,” Cambridge University Press, 2007.
[111] R. a. R. C. Willows, “Climate Adaptation: Risk, Uncertainty and Decision-Making,” UKCIP Technical Report, UKCIP, Oxford, U.K, 2003.
[112] EEA, “Adaptation of transport to climate change in Europe, Challenges and options across transport modes and stakeholders,” 2014.
[113] M. D. M. Thomas A. Wall, “Risk-Based Adaptation Frameworks for Climate Change Planning in the Transportation Sector A Synthesis of Practice,” TRANSPORTATION RESEARCH CIRCULAR E-C181, 2013.
[114] Bles Thomas, Ennesser Yves, et al,, “A Guidebook to the RIMAROCC Method,” Funded under ROAD ERA-NET. .
[115] ONERC, “Évaluation à mi-parcours du Plan national d'adaptation au changement climatique (PNACC),” Observatoire National sur les Effets du Réchauffement Climatique, 2013.
[116] M. a. C. T. Oswald, “Identifying sea level rise vulnerability using GIS: development of a transit inundation modeling method,” International Journal of Geoinformatics, vol. 9, no. 1, pp. 1-10, 2013.
[117] I. C. Society, “IEEE Standard for Local and Metropolitan Area Networks: Overview and Architecture,” 2002.
[118] ITU, “Resilient pathways: the adaptation of the ICT sector to climate change,” ITU, 2014.
[119] USAID, “Addressing Climate Change Impacts on Infrastructure: Preparing for Change - Information and Communications Technology (ICT),” 2012.
[120] AEA, “Adapting the ICT Sector to the Impacts of Climate Change,” 2010.
[121] Cabinet Office, “Keeping the Country Running: Natural Hazards and Infrastructure,” A Guide to improving the resilience of critical infrastructure and essential services, 2011.
[122] AEA, “An Overview of Systemic Interdependencies of the UK National Infrastructure,” Report to the Chief Scientific Advisor of DfT and BIS, 2009.
[123] URS, “Adapting Energy, Transport and Water Infrastructure to the Long-term Impacts of Climate Change,” URS Corporation Limited, 2010.
[124] C. Office, “Strategic Framework and Policy Statement on Improving the Resilience of Critical Infrastructure to Disruption from Natural Hazards,” Cabinet Office, London, 2010.
[125] “The Physical Protection of Critical Infrastructures and Key Assets,” 2003.
[126] V. K. V. a. P. T. Radovic, “Health facilities safety in natural,” International Journal of Environmental Research and
D1.2 State of the art review and taxonomy of existing knowledge
Grand Agreement 653824 DISSEMINATION LEVEL Page 85
Public Health, vol. 9, no. 5, pp. 1677-1686, 2012.
[127] V. F. D. D. M. M. K. M. T. B. M. C. E. Y. E. R. G. B. G. E. K. A. L. S. M. M. a. L. W. (. IPCC:Barros, “Climate Change 2014: Impacts, Adaptation, and Vulnerability. Part B:Regional Aspects. Contribution of Working Group II to the Fifth Assessment Report of the Intergovernmental Panel on Climate Change,” Cambridge University Press, Cambridge,United Kingdom and New York, NY, USA, 2014.
[128] S. V. a. C. Heaviside, “Health Effects of Climate Change in the UK 2012,” HPA, 2012.
[129] W. H. Organization, “Operational framework for building climate resilient health systems,” World Health Organization, Geneva, 2015.
[130] P. G. t. D. o. H. (DOH), “National Climate Change Adaptation in Health (CCAH) Strategic Plan,” Philippine Government the Department of Health (DOH), 2014-2016.
[131] GFDRR, “Understanding Risk- Review of Open Source and Open Access Software Packages Available to Quantify Risk from Natural Hazards,” International Bank for Reconstruction and, 2014.
[132] SERDP REPORT, Infrastructure Damage/Fragility Models and Data Quality Issues Associated with Department of Defense Climate Vulnerability and Impact Assessment, SERDP Office ICF International HydroGeoLogic, Inc., 2015.
[133] I. P. o. C. C. IPCC, “TheWorkingGroupIII Contribution totheIPCCFourthAssessmentReportClimateChange2007 Mitigation ofclimatechange.,” Cambridge University Press,Cambridge., 2007a.
[134] Hewer F, “Climate change and energy management:a scoping study on the impacts ofclimatechangeontheUK energy industry,” UKMetOffice, 2006.
[135] Torben K.Mideksa, Steffen Kallbekken, “The impact of climate change on the electricity market :A review,” Energy Policy38 (2010)3579–3585, 2010.
[136] German Weather Service, “Wetterlexikon. Search keyword, [Online] http://www.dwd.de/bvbw/appmanager/bvbw/dwdwwwDesktop?_nfpb=true&_pageLabel=dwdwww_menu2_wetterlexikon&_nfls=false [Accessed 2009-09-14],” 2009.
[137] MetOffice, “Key to flash warning criteria.,” [Online] http://www.metoffice.gov.uk/weather/uk/guide/key_warnings.html [Accessed 2009-09-14], 2009a.
[138] IEEE Std 493-1997, “IEEE Recommended Practice for the Design of Reliable Industrial and Commercial Power Systems,” The Institute of Electrical and Electronics Engineers, Inc., 345 East 47th Street, New York, NY.
[139] EPRI, “Improved Cellulosic Insulation for Distribution and Power Transformers,” EPRI Report EL-4935, 1987.
[140] Z. u. Szabó, “Comparative Thermal & Economical Evaluation of Heller System serving a 800 MWe CCPP Block .,” 2010.
[141] ENA, “Electricity Networks Climate Change Adaptation Report. Adaptation Reporting Power report prepared for Defra.,” 2011.
[142] FACILITIES INSTRUCTIONS STANDARDS AND TECHNIQUES Volume 1-5, “PERMISSIBLE LOADING OF OIL-IMMERSED TRANSFORMERS AND REGULATORS,” NITED STATES DEPARTMENT OF THE INTERIOR BUREAU OF RECLAMATION, DENVER, COLORADO, APRIL 1991.
[143] Feeley III T.J, Skone T. J, Striegel Jr G.J, McNemar A, Nemeth M, Schimmoller B, Murphy J.T, Manfredo L, “Water: A critical resource in the thermoelectric power industry,” 2008.
[144] Hoffmann B, Häfele S, Müller U, Karl U, “Analysis of the impact of changing hydrometeorological parameters on the electricity production of once-through cooled thermal power plants in Germany- A System Dynamics modelling approach.,” International Conference on Energy, Environment and Health., Copenhagen. 5., 2010.
[145] EIA, “Annual coal distribution report Transportation,” US Energy Information Administration,, 2011.
[146] The Parliamentary Office of Science and Technology, Resilience of UK Infrastructure, POSTNOTE Number 362, 2010.
[147] T. A. a. M. A. Amod Sagar Dhakal, “Landslide Hazard Mapping and its Evaluation Using GIS: An Investigation of Sampling Schemes for a Grid-Cell Based Quantitative Method,” Photogrammetric Engineering & Remote Sensing, vol. 66, no. 8, pp. 981-989, 2000.
D1.2 State of the art review and taxonomy of existing knowledge
Grand Agreement 653824 DISSEMINATION LEVEL Page 86
[148] Schuster, R.L., Salcedo, D.A., Valenzuela, L. , “Overview of catastrophic landslides of South America in the twentieth century,” Reviews in Engineering Geology, 2002.
[149] Impacts of Severe Storms on Electric Grids, Task Force on Power Outages, Ref : 2006-181-0001, 2006.
[150] Blake E, T. Kimberlain, R. Berg, J. Cangialosi, and J. Beven II, “Tropical cyclone report: Hurricane Sandy,” National Hurricane Center, National Oceanic and Atmospheric Administration, Miami, FL, 2013.
[151] D. o. E. DOE, “U.S. energy sector vulnerabilities to climate change and extreme weather,” Washington, DC., 2013.
[152] PlaNYC, “A stronger more resilient New York,” Online at www.nyc.gov/html/sirr/html/report/report.shtml, New York, NY, 2013.
[153] Rogers J, K. Averyt, S. Clemmer, M. Davis, F. Flores-Lopez, P. Frumhoff,D. Kenney, J. Macknick, N. Madden, J. Meldrum, J. Overpeck, S, Sattler, E. Spanger-Siegfried, and D. Yates, “Water-smart power: Strengthening the U.S. electricity system in a warming world,” Cambridge, MA: Union of Concerned Scientists. Online at www.ucsusa.org/clean_energy/our-energy-choices/energy-and-water-use/water-smart-power.html, 2013.
[154] Ward D, “The effect of weather on grid systems and the reliability of electricity supply,” Climatic Change 121:103–113, 2013.
[155] Sathaye J, L. Dale, P. Larsen, G. Fitts, K. Koy, S. Lewis, and A. Lucena, “Estimating risk to California energy infrastructure from projected climate change.,” CEC-500-2012-057, Sacramento, CA, California Energy Commission., 2012.
[156] Samenow J, “Las Conchas fire near Los Alamos largest in New Mexico history. July 1.,” Washington Post, Online at www.washingtonpost.com/blogs/capital-weather-gang/post/las-conchasfire-near-los-alamos-largest-in-new-mexico-history/2011/07/01/AGcNXptH_blog.html, 2011.
[157] PPIC (Public Policy Institute of California), “Adaptation of California's Electricity Sector to Climate Change,” Public Policy Institute of California, 2008.
[158] IPIECA, “Addressing adaptation in the oil and gas industry,” London, 2013.
[159] FORFAS, “Adaptation to Climate Change: Issues for Business Summary Report,” 2010.
[160] M. H. Smith, “Assessing Climate Change Risk and Opportunities for Investors - Oil and Gas Sector,” Australian National University.
[161] National Wildlife Federation, “More Extreme Weather and the U.S. Energy Infrastructure,” 2011.
[162] U.S. Department of Energy, “U.S. energy sector vulnerabilities to climate change and extreme weather,” July 2013.
[163] David Gardiner & Associates, “Physical Risks from Climate Change - A guide for companies and investors on disclosure and management of climate impacts,” 2011.
[164] “AGU.Blogosphere,” American Geophysical Union, 12 June 2013. [Online]. Available: http://blogs.agu.org/landslideblog/2013/06/12/a-catastrophic-landslide-induced-oil-spill-in-ecuador-including-two-shocking-videos-of-the-pollution/.
[165] N. B. COLUMBIA, “Climate Risk Assessment for the Oil & Gas Sector,” 2015.
[166] H. L. J. Locat, “Submarine Landslides: Advances and Challenges,” Proceedings of the 8th International Symposium on Landslides, Cardiff, U.K, 2000.
[167] J. S. M. G. A. Blais-Stevens, “The Khyex River rapid earth flow, a catastrophic landslide near Prince Rupert, British Columbia, Canada,” Geophysical Research Abstracts, 2005.
[168] L. Bell, “Oil&Gas Journal - Winter weather effects,” 17 03 2014. [Online].
[169] A. M. Cruz, Preventing Natech catastrophes: Country Practices and Case Studies of Chemical Accident Prevention during Natural Disasters, Toronto: Joint Research Centre, 2006.
[170] J. Firth, “Understanding the investment implications of adapting to climate change,” acclimatise - managing your climate risks, 2009.
[171] S. V. Rottem, “Climate Change in the North and the Oil Industry,” Fridtjof Nansens Institutt, 2007.
D1.2 State of the art review and taxonomy of existing knowledge
Grand Agreement 653824 DISSEMINATION LEVEL Page 87
[172] IPCC, “Climate Change 2014: Synthesis Report. Contribution of Working Groups I, II and III to the Fifth Assessment Report of the Intergovernmental Panel on Climate Change [Core Writing Team, R.K. Pachauri and L.A. Meyer (eds.)]. IPCC, Geneva, Switzerland, 151 pp,” 2014.
[173] Center for Climate and Energy Solution, “Impacts and Adaptation Options in the Gulf Coast,” 2012.
[174] Chloeta, “Mitigating the Wildfire Risk in the Oil & Natural Gas Industry,” 2015.
[175] ARIA Newsflash, “Heat waves, intense heat: Risk alerts, and not just for fire,” French Ministry for sustainable development, 2012.
[176] A. Newsflash, “Intense cold weather: beware of freezing… and then thawing,” French Ministry for sustainable development, 2012.
[177] S. Mara, “Lessons Learnt from the Baia Mare Cyanide Spill,” in Joint Research Centre, Ispra, 2000.
[178] G. B. S. S. G. &. C. V. Antonioni, “Development of a framework for the risk assessment of Na-Tech accidental events,” Reliability Engineering & System Safety, vol. 94, no. 9, pp. 1442-1450, 2009.
[179] A. VALLEE, “Natech disasters risk management in France,” in JRC, Ispra, 2003.
[180] A. Poschinger, “Large rockslides in the Alps: A commentary on the contribuiton of G. Abele (1937-1994) and a review of some recent developments, Reviews in Engineering Geology,” 2002.
[181] Homeland Security, “Chemical Sector-Specific Plan: An Annex to the National Infrastructure Protection Plan,” U.S. Department of Homeland Security, 2010.
[182] WHO, “Guidance on Water Supply and Sanitation In Extreme Weather Events,” WHO Regional Office for Europe, 2011.
[183] C. M. E. Rozos, “Source to tap urban water cycle modelling,” Environmental modelling & software, 2013.
[184] Climate Change Impacts Review Group, “Review of the Potential Effects of Climate Change in the United Kingdom,” Department of the Environment, London, 1996.
[185] EEA, “Water and food-borne diseases,” 2008.
[186] QFCI, “Guidelines on Acceptable Flood Capacity for Dams,” Queensland Floods Commission of Inquiry, 2007.
[187] D. Safety, “Living with Dams: Extreme Rainfall Events An informational booklet for policymakers, dam owners and downstream communities,” 2015.
[188] F. training, “Chapter 2. Types of floods and floodplains”.
[189] DEFRA, “Draft Engineering Guide to Emergency Planning for UK Reservoirs,” 2006.
[190] The Pitt Review, “Section 5 - Maintaining power and water supplies and protecting essential services,” in Learning Lessons from the 2007 floods, 2008.
[191] M. J. H. S. D. D. B. Albert S. Chen, “FLOOD DAMAGE ASSESSMENT FOR URBAN GROWTH SCENARIOS,” in International Conference on Flood Resilience: Experiences in Asia and Europe, Exeter, UK, 2013.
[192] GoA, “Flood Recovery Plan,,” 2007.
[193] B. M. K. M. B. P. Jonkman S, “Integrated hydrodynamic and economic modelling of flood damage in the Netherlands.,” Ecological Economics, 2008.
[194] FEMA, “Hazus MH MR4 Techical manual,” Federal Emergency Management Agency., Washington, 2010.
[195] J. Admiraal, “Flood damage to port industry Case study: vulnerability of the port of Rotterdam to climate change,” Vrije University, 2011.
[196] E. Petrova, “Critical infrastructure in Russia: geographical analysis of accidents triggered by natural hazards,” Environmental Engineering and Management Journal, vol. 10, pp. 53-58, 2011.
[197] C. S. M. T. L. J. Z. Y. Zhang, “1983 Sale Mountain landslide, Gansu Province, China,” Reviews in Engineering Geology, vol. XV, 2002.
[198] A. Blumenau, Effects of sea level rise on water treatment & wastewater treatment facilities, 2011.
[199] D. A. S. M. D. &. H. M. J. Wilhite, “Understanding the complex impacts of drought: a key to enhancing drought mitigation and preparedness.,” Water Resources Management, vol. 21, no. 5, pp. 763-774, 2007.
D1.2 State of the art review and taxonomy of existing knowledge
Grand Agreement 653824 DISSEMINATION LEVEL Page 88
[200] EWA, “A PRELIMINARY OPINION OF THE EUROPEAN WATER ASSOCIATION (EWA) ON THE SUBJECT OF THE CONSEQUENCES OF CLIMATE CHANGE FOR WATER MANAGEMENT,” 2007.
[201] M. H. Gerardi, Settleability Problems and Loss of Solids in the Activated Sludge Process, Hoboken, NJ: John Wiley and Sons, 2002.
[202] GWP, “Impacts of Climate on Wastewater Management,” Global Water Partnership, 2014 .
[203] Nevada County Environmental Health Department, “Cascade Shores Wastewater Treatment Plant Damaged by Landslide,” 2005.
[204] M. M. N. Schmidt, “Incorporating climate change considerations into transportation planning.,” Journal of the Transportation Research Board, 2009.
[205] Transport for London, “Transport Emissions Roadmap -Cleaner transport for a cleaner London,” 2014.
[206] D. Bundesregierung, “Deutsche Anpassungsstrategie an den Klimawandel,” Vom Bundeskabinett am, 2008.
[207] S. Zeitung, “Hitze-Gefahr auf Autobahnen - Experten warnen vor Straßenschäden,” 2013.
[208] F. M. N. GmbH, “Hitze bremst Bahn - Zugausfälle wegen defekter Klimaanlagen,” 2015.
[209] Klimascout, “Verkehr - Auswirkungen des Klimawandels,” 2012.
[210] Federal Highway Administration, “How Do Weather Events Impact Roads?,” 2016.
[211] S. &. A. A. Keller, “Mapping Natural Hazard Impacts on Road Infrastructure—The Extreme Precipitation in Baden-Württemberg,” International Journal of Disaster Risk Science, 2013.
[212] G. Bachner, “Österreichs Straßen- und Schienenverkehr unter Klimawandel: Eine makroökonomische Analyse möglicher Auswirkungen und Anpassungsoptionen,” 2008.
[213] N. Raq, “FLOOD ALERT: Drivers in 15 MILES of tailbacks in M25 collapse hell as weather turns nasty,” 2014.
[214] R. Davies, “Flooding in northern Spain as Ebro river breaks its banks,” 2015.
[215] N24, “Deiche, Polder, Schutzmauern - Wie stoppt man die Flut?,” 2013.
[216] A. Bowden, “Milan – San Remo diverted after landslide on route,” 2016.
[217] J. Hervás, “Lessons learnt from landslide disasters in Europe,” European Commission, Joint Research Centre, 2003.
[218] The Huffington Post, “Wind verursacht Schäden und Verkehrsbehinderungen”.
[219] B. News, “Cold weather death toll passes 100 in Ukraine,” 2012.
[220] M. Weggässer, “KYRILL über Thüringen (Teil 3: Schäden und Bilder),” 2007.
[221] S. G, “Nasa satellite captures intense smoke from Chios wildfires as Greek secret service investigates more than 20 major blazes,” 2012.
[222] R. T. Magazine, “Climate change to affect resilience of GB rail network says RSSB,” 2015.
[223] N. Rail, “Dawlish - Around 100 metres of sea wall was destroyed by storms in early 2014 causing a significant stretch of railway to collapse into the sea,” 2014.
[224] N. Rail, “Weather and climate change resilience - How our routes are mitigating the impact of weather and climate change to maintain an efficient service”.
[225] G. E., “Can the US rediscover rail to tackle climate change?,” 2016.
[226] C. Esveld, “The significance of track resilience,” EUROPEAN RAILWAY REVIEW NEWS, 2009.
[227] Zeit, “Deutsche Bahn: In 20 Zügen fällt die Klimaanlage aus,” 2011.
[228] T. M. Group, “China high-speed rail track collapses - A section of China's beleaguered high-speed railway track has collapsed following heavy rains, the latest such incident such a crush last summer killed 40 people,” 2012.
[229] U. S. E. P. Agency, “Climate Impacts on Transportation,” 2016.
[230] N. Rail, “Flooding - How flooded tracks cause delays - and what we're doing to reduce them,” 2016.
[231] B. News, “Flooding: Christmas rail travel resuming in south Wales,” 2012.
[232] Spiegel, “Hochwasser-Folgen: Wo Bahnstrecken und Straßen gesperrt sind,” 2013.
D1.2 State of the art review and taxonomy of existing knowledge
Grand Agreement 653824 DISSEMINATION LEVEL Page 89
[233] N. rail, “Landslip - How landslips can cause delays - and what we're doing to reduce them,” 2016.
[234] Spiegel, “Bahnunglück in der Schweiz: Personenzug nach Erdrutsch entgleist - mehrere Verletzte,” 2014.
[235] B. News, “Landslip closes railway line between Banbury-Leamington Spa,” 2015.
[236] T. C. K. P. Taalab, “Assessing the risk landslides pose to road and rail networks,” in 23rd GIS Research UK conference, Leeds, 2015.
[237] N. Rail, “Snow and ice - How snow and ice can cause delays – and what we're doing to reduce them”.
[238] M. &. M. D. Prigg, “Storm Hits Rail and Roads with Worse to Come; Blocked: A Tree across the Road near Uckfield in East Sussex Today,” 2008.
[239] T. Willmot, “Climate change and transport: effects of sea-level rise on an English railway line,” 2016.
[240] DB Umwelt, “Naturschutzgerechte Pflege am Gleis,” 2016.
[241] Eurocontrol, “Environmental issues for aviation,” 2016.
[242] Eurocontrol, “Adapting Aviation to a Changing Climate - Key Climate Change Risks for Aviation,” 2014.
[243] M. Velasquez-Manoff, “A warmer world could make current airport runways too short,” 2009.
[244] Johner Institut, “Risikobeherrschung und Risikominimierung,” 2016.
[245] Transport for London, “Heavy snow brings travel chaos in Germany,” 2014.
[246] Flughafen München GmbH, “Interesting facts on de-icing - Your questions, our answers,” 2016.
[247] B. News, “Heavy snow brings travel chaos in Germany,” 2010.
[248] Spiegel, “Orkan "Kyrill": Flugverkehr ist massiv beeinträchtigt,” 2007.
[249] Eurocontrol, “Adapting Aviation to a Changing Climate - Key Climate Change Risks for Aviation,” 2014.
[250] M. Velasquez-Manoff, “A warmer world could make current airport runways too short,” 2009.
[251] B. News, “Scottish, Irish and Northern Irish airports shut by ash,” 2010.
[252] Wikinews, “Ausbruch des Vulkans Eyjafjallajökull behindert Luftverkehr”.
[253] European Commission, “Maritime - What do we want to achieve?,” 2016.
[254] United Nations Conference on Trade and Development, “Maritime Transport and the Climate Change Challenge,” 2009.
[255] N. Rundfunk, “Zerstörte Friesenbrücke: Schiff hatte keine Mängel,” 2015.
[256] H. L. J. Locat, “Submarine landslides: advances and challenges,” Can. Geotech., 2002.
[257] Daily Mail, “Big freeze in Europe shows no signs of letting up as Venice's famous waterways ice over,” 2012.
[258] Zeitungsverlag Schwerin GmbH & Co, “KG: Häfen in MV: Seewege winterfest gemacht,” 2011.
[259] G. Peters, “Maritime infrastructure: navigating a changing climate,” 2016.
[260] Mitteldeutscher Rundfunk, “Niedrigwasser auf der Elbe - Weiter Einschränkungen im Schiffsverkehr,” 2015.
[261] The Local Europe GmbH, “Drought chokes shipping, sparks forest fire,” 2011.
[262] C. Gannon, “Climate Change and the Maritime Industry,” 2016.
[263] N. D. Richard Blish, “Semiconductor Device Reliability Failure Models,” International SEMATECH, 2000.
[264] IPCC Fourth Assessment Report, “Chapter 11: Regional Climate Projections,” in Climate Change 2007: Working Group I: The Physical Science Basis, IPCC Fourth Assessment Report.
[265] H. Lehpamer, Transmission Systems Design Handbook for Wireless Networks, Norwood: Artech House, INC, 2002.
[266] O. K. P. P. C. H. C. J. Farrokh Nadim, “Global landslide and avalanche hotspots,” Journal of the International Consortium on Landslides , vol. 3, no. 2, pp. 159-173, 2006.
[267] IPCC Fourth Assessment Report, “Climate Change 2007: Synthesis Report,” IPCC Fourth Assessment Report, 2007.
[268] EEA - European Environment Agency, “Mapping the impacts of natural hazards and technological accidents in Europe,” 2010.
[269] M. D. B. a. M. V. Eeten, “Systems that should have failed: Critical Infrastructure Protection in an institutionally
D1.2 State of the art review and taxonomy of existing knowledge
Grand Agreement 653824 DISSEMINATION LEVEL Page 90
fragmented environment,” Journal of Contingencies and Crisis Management, vol. 15, pp. 18-29, 2007.
[270] v. D. R. V. W. D. S. Stone K., “Sensitivity and vulnerability of urban systems,” Assessment of climate change impact to urban systems, Reseacrh programme, DELTARES, 2011.
[271] IRGC, “Risk Governance Deficits: an analysis and illustration of the most common deficits in Risk Governance,” Geneve, 2009.
[272] T. S. C. o. A. &. I. S. S. a. Equipment, “Exchangeable image file format for digital still cameras: EXIF version 2.2,” Standard of Japan Electronics and Information Technology Industries Association, 2002.
[273] K. T. C. D. Eames M, “On the creation of future probabilistic design weather years from UKCP09,” Building Serv. Eng. Res. Technology, 2010.
[274] T. J. F. F. O. F. P. P. B. B. J. E. F. a. H. L. C. C. C. Sampson, “The impact of uncertain precipitation data on insurance loss estimates using a flood catastrophe model,” Hydrol. Earth Syst. Sci., vol. 19, pp. 2305-2320, 2014.
[275] USAID, “Buildings: Addressing Climate Change Impacts on Infrastructure:,” Preparing for change, 2012.
[276] Q. Z. J. J. L. a. K. A.-N. Anders Skovgård Olsen, “Comparing Methods of Calculating Expected Annual Damage in Urban Pluvial Flood Risk Assessments,” Water, vol. 7, pp. 255-270, 2015.
[277] L. L. G. F. a. G. L. L. Vincenza Notaro, “Uncertainty Analysis in the Evaluation of Extreme Rainfall Trends and Its Implications on Urban Drainage System Design,” Water, vol. 7, pp. 6931-6945, 2015.
[278] M. K. F. H. L. R. C. a. J. A. E. t. V. M. H. Spekkers, “A statistical analysis of insurance damage claims related to rainfall extremes,” Hydrol. Earth Syst. Sci., vol. 17, p. 913–922, 2013.
[279] K. J. R. L. R. O. R. D. W. C. Boettle M, “About the influence of elevation model quality and small-scale damage functions on flood damage estimation,” Natural Hazards and Earth System Sciences, vol. 11, no. 12, pp. 3327-3334, 2011.
[280] R. D. K. J. Boettle Μ, “How changing sea level extremes and protection measures alter coastal flood damages,” Water Resources Research, vol. 49, pp. 1199-1210, 2013.
[281] F. P. B. N. S. H. T. E. C. S. M. E. T. W. M. J. J. C. L. M. Scawthorn C, “HAZUS-MH Flood Loss Estimation Methodology. II. Damage and Loss Assessment,” Natural Hazards Review, vol. 7, no. 2, p. 72–81, 2006.
[282] C. R., Hierarchical Modelling of Flood Risk for Engineering Decision Analysis, PhD Thesis, Technical University of Denmark, Department of Civil Engineering, 2015.
[283] K. N. K. Custer R., “Flood vulnerability assessment of residential buildings by explicit damage process modelling,” Natural Hazards, vol. 78, no. 1, pp. 461-496, 2015.
[284] D. P. L. V. M. Berning C, “Loss functions for structural flood mitigation measures,” Water SA, vol. 27, no. 1, pp. 35-38, 2001.
[285] F. P-957, “Snow Load Safety Guide,” Risk Management Series, 2013.
[286] N. M. B. M. Bertrand D., “Physical vulnerability of reinforced concrete buildings impacted by snow avalanches,” Nat. Hazards Earth Syst. Sci, vol. 10, p. 1531–1545, 2010.
[287] K. M. Z. A. B. M. Fuchs S., “The long-term development of avalanche risk in settlements considering the temporal variability odamage potential Natural Hazards and Earth System Sciences,” vol. 5, p. 893–901, 2005.
[288] D. R. O. B. J. P. K. B. F. Prahl, “Comparison of storm damage functions and their performance,” Nat. Hazards Earth Syst. Sci., vol. 15, p. 769–788, 2015.
[289] M. G. Khanduri A.C., “Vulnerability of buildings to windstorms and insurance loss estimation,” Journal of Wind Engineering and Industrial Aerodynamics, vol. 91 , p. 455–467, 2003.
[290] v. D. R. V. W. D. S. Stone K., “Sensitivity and vulnerability of urban systems,” Assessment of climate change impact to urban systems, Reseacrh programme, DELTARES, 2011.
[291] S. D. Papakosta P., “A Bayesian network approach to assessing wildfire consequences”.
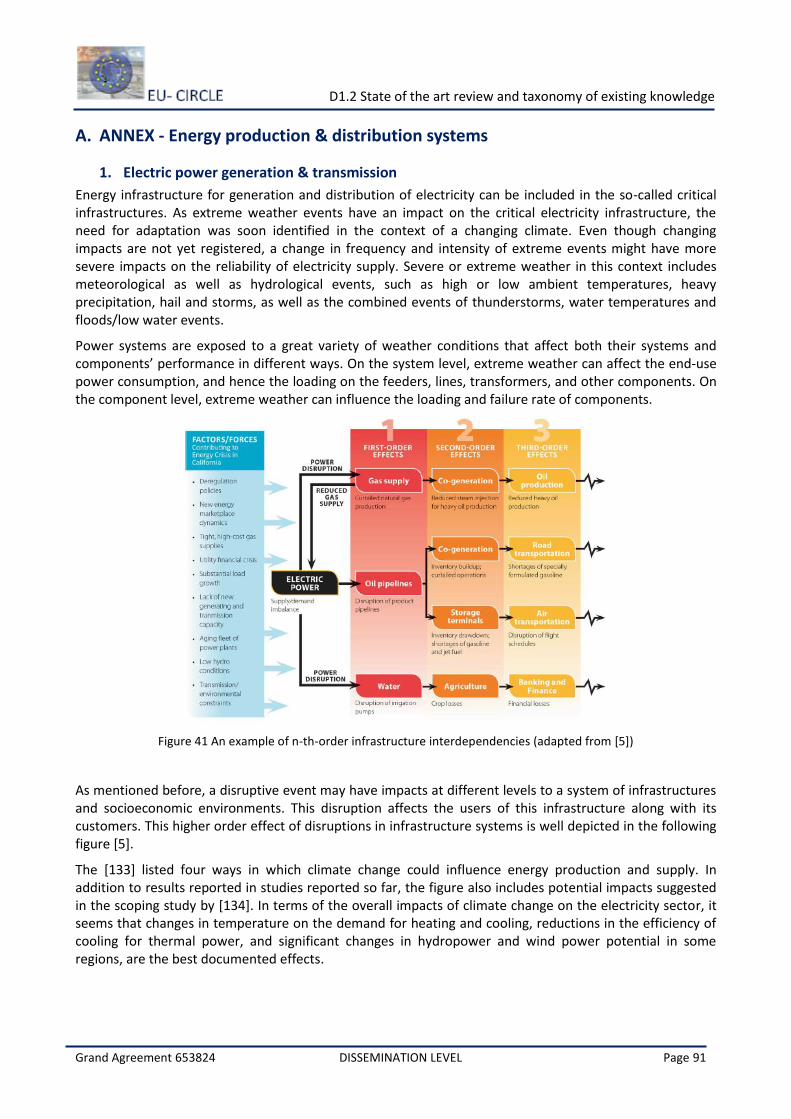
D1.2 State of the art review and taxonomy of existing knowledge
Grand Agreement 653824 DISSEMINATION LEVEL Page 91
A. ANNEX - Energy production & distribution systems
1. Electric power generation & transmission
Energy infrastructure for generation and distribution of electricity can be included in the so-called critical infrastructures. As extreme weather events have an impact on the critical electricity infrastructure, the need for adaptation was soon identified in the context of a changing climate. Even though changing impacts are not yet registered, a change in frequency and intensity of extreme events might have more severe impacts on the reliability of electricity supply. Severe or extreme weather in this context includes meteorological as well as hydrological events, such as high or low ambient temperatures, heavy precipitation, hail and storms, as well as the combined events of thunderstorms, water temperatures and floods/low water events.
Power systems are exposed to a great variety of weather conditions that affect both their systems and components’ performance in different ways. On the system level, extreme weather can affect the end-use power consumption, and hence the loading on the feeders, lines, transformers, and other components. On the component level, extreme weather can influence the loading and failure rate of components.
Figure 41 An example of n-th-order infrastructure interdependencies (adapted from [5])
As mentioned before, a disruptive event may have impacts at different levels to a system of infrastructures and socioeconomic environments. This disruption affects the users of this infrastructure along with its customers. This higher order effect of disruptions in infrastructure systems is well depicted in the following figure [5].
The [133] listed four ways in which climate change could influence energy production and supply. In addition to results reported in studies reported so far, the figure also includes potential impacts suggested in the scoping study by [134]. In terms of the overall impacts of climate change on the electricity sector, it seems that changes in temperature on the demand for heating and cooling, reductions in the efficiency of cooling for thermal power, and significant changes in hydropower and wind power potential in some regions, are the best documented effects.
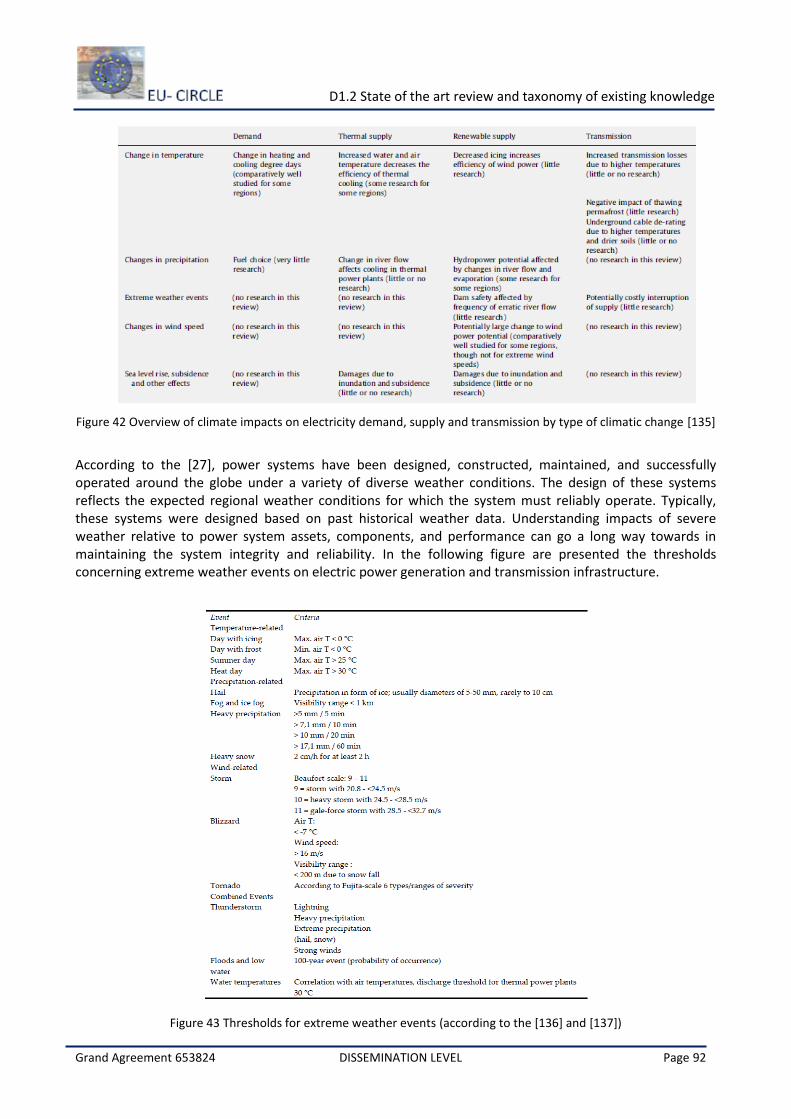
D1.2 State of the art review and taxonomy of existing knowledge
Grand Agreement 653824 DISSEMINATION LEVEL Page 92
Figure 42 Overview of climate impacts on electricity demand, supply and transmission by type of climatic change [135]
According to the [27], power systems have been designed, constructed, maintained, and successfully operated around the globe under a variety of diverse weather conditions. The design of these systems reflects the expected regional weather conditions for which the system must reliably operate. Typically, these systems were designed based on past historical weather data. Understanding impacts of severe weather relative to power system assets, components, and performance can go a long way towards in maintaining the system integrity and reliability. In the following figure are presented the thresholds concerning extreme weather events on electric power generation and transmission infrastructure.
Figure 43 Thresholds for extreme weather events (according to the [136] and [137])
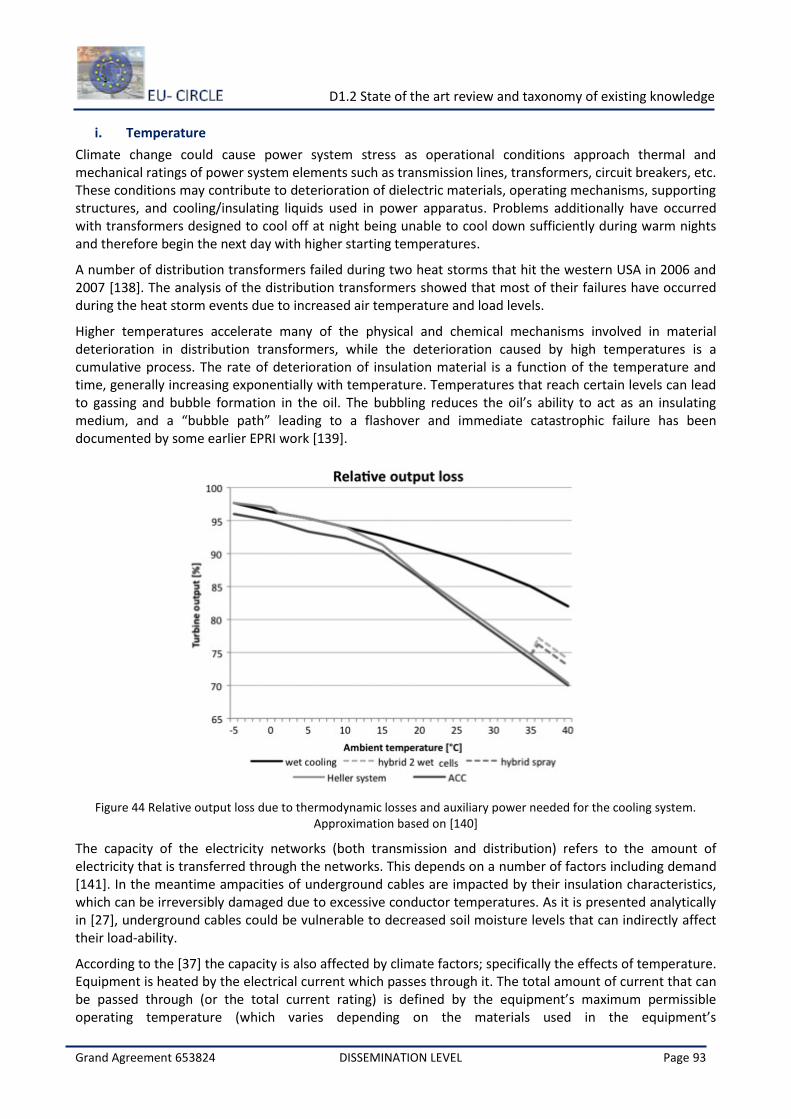
D1.2 State of the art review and taxonomy of existing knowledge
Grand Agreement 653824 DISSEMINATION LEVEL Page 93
i. Temperature
Climate change could cause power system stress as operational conditions approach thermal and mechanical ratings of power system elements such as transmission lines, transformers, circuit breakers, etc. These conditions may contribute to deterioration of dielectric materials, operating mechanisms, supporting structures, and cooling/insulating liquids used in power apparatus. Problems additionally have occurred with transformers designed to cool off at night being unable to cool down sufficiently during warm nights and therefore begin the next day with higher starting temperatures.
A number of distribution transformers failed during two heat storms that hit the western USA in 2006 and 2007 [138]. The analysis of the distribution transformers showed that most of their failures have occurred during the heat storm events due to increased air temperature and load levels.
Higher temperatures accelerate many of the physical and chemical mechanisms involved in material deterioration in distribution transformers, while the deterioration caused by high temperatures is a cumulative process. The rate of deterioration of insulation material is a function of the temperature and time, generally increasing exponentially with temperature. Temperatures that reach certain levels can lead to gassing and bubble formation in the oil. The bubbling reduces the oil’s ability to act as an insulating medium, and a “bubble path” leading to a flashover and immediate catastrophic failure has been documented by some earlier EPRI work [139].
Figure 44 Relative output loss due to thermodynamic losses and auxiliary power needed for the cooling system. Approximation based on [140]
The capacity of the electricity networks (both transmission and distribution) refers to the amount of electricity that is transferred through the networks. This depends on a number of factors including demand [141]. In the meantime ampacities of underground cables are impacted by their insulation characteristics, which can be irreversibly damaged due to excessive conductor temperatures. As it is presented analytically in [27], underground cables could be vulnerable to decreased soil moisture levels that can indirectly affect their load-ability.
According to the [37] the capacity is also affected by climate factors; specifically the effects of temperature. Equipment is heated by the electrical current which passes through it. The total amount of current that can be passed through (or the total current rating) is defined by the equipment’s maximum permissible operating temperature (which varies depending on the materials used in the equipment’s
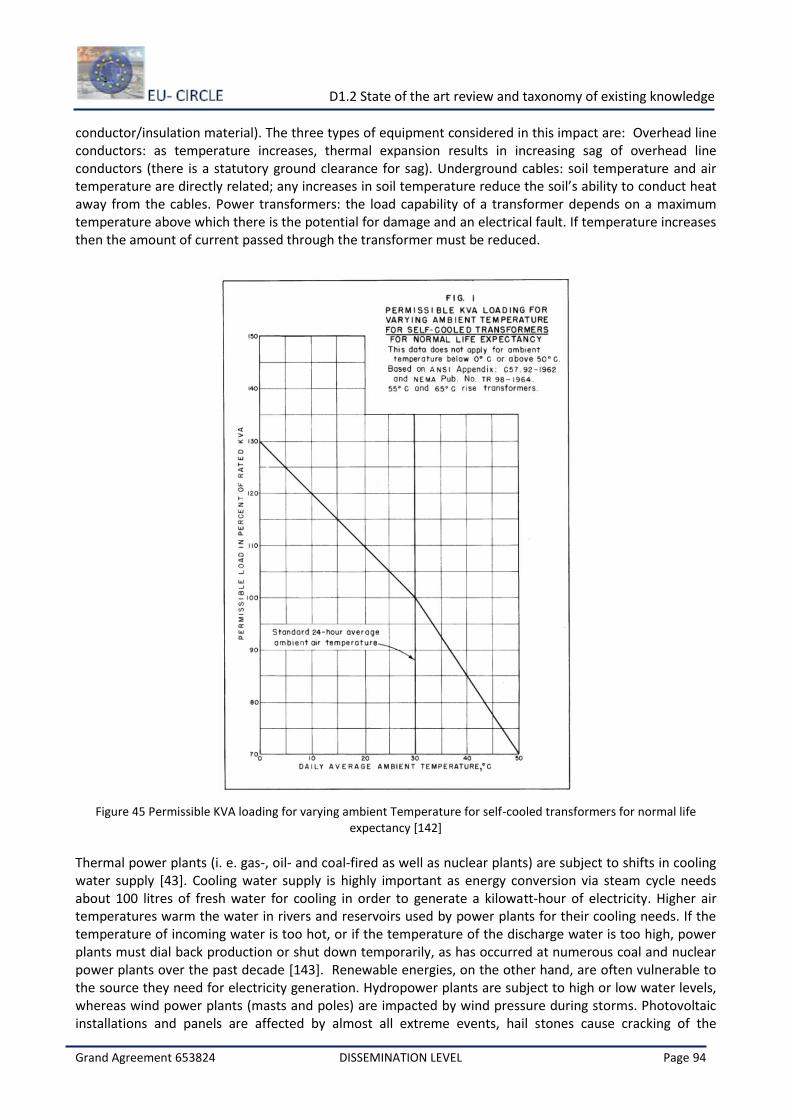
D1.2 State of the art review and taxonomy of existing knowledge
Grand Agreement 653824 DISSEMINATION LEVEL Page 94
conductor/insulation material). The three types of equipment considered in this impact are: Overhead line conductors: as temperature increases, thermal expansion results in increasing sag of overhead line conductors (there is a statutory ground clearance for sag). Underground cables: soil temperature and air temperature are directly related; any increases in soil temperature reduce the soil’s ability to conduct heat away from the cables. Power transformers: the load capability of a transformer depends on a maximum temperature above which there is the potential for damage and an electrical fault. If temperature increases then the amount of current passed through the transformer must be reduced.
Figure 45 Permissible KVA loading for varying ambient Temperature for self-cooled transformers for normal life expectancy [142]
Thermal power plants (i. e. gas-, oil- and coal-fired as well as nuclear plants) are subject to shifts in cooling water supply [43]. Cooling water supply is highly important as energy conversion via steam cycle needs about 100 litres of fresh water for cooling in order to generate a kilowatt-hour of electricity. Higher air temperatures warm the water in rivers and reservoirs used by power plants for their cooling needs. If the temperature of incoming water is too hot, or if the temperature of the discharge water is too high, power plants must dial back production or shut down temporarily, as has occurred at numerous coal and nuclear power plants over the past decade [143]. Renewable energies, on the other hand, are often vulnerable to the source they need for electricity generation. Hydropower plants are subject to high or low water levels, whereas wind power plants (masts and poles) are impacted by wind pressure during storms. Photovoltaic installations and panels are affected by almost all extreme events, hail stones cause cracking of the
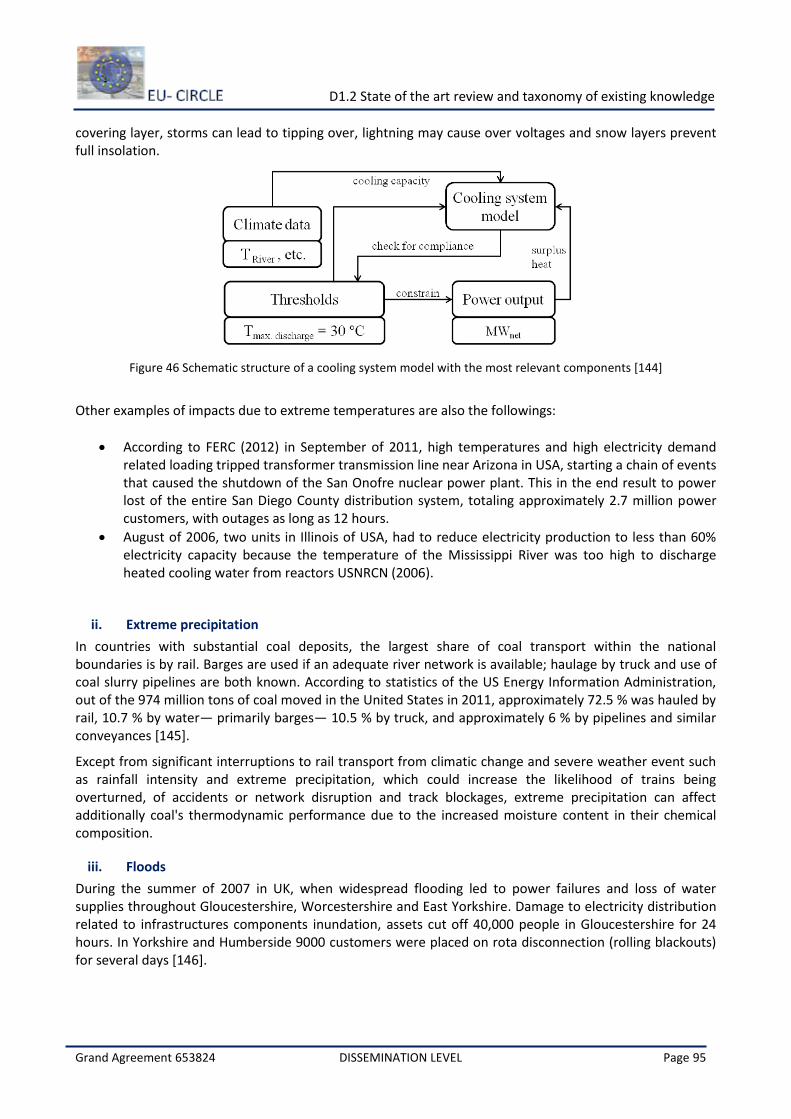
D1.2 State of the art review and taxonomy of existing knowledge
Grand Agreement 653824 DISSEMINATION LEVEL Page 95
covering layer, storms can lead to tipping over, lightning may cause over voltages and snow layers prevent full insolation.
Figure 46 Schematic structure of a cooling system model with the most relevant components [144]
Other examples of impacts due to extreme temperatures are also the followings:
According to FERC (2012) in September of 2011, high temperatures and high electricity demand related loading tripped transformer transmission line near Arizona in USA, starting a chain of events that caused the shutdown of the San Onofre nuclear power plant. This in the end result to power lost of the entire San Diego County distribution system, totaling approximately 2.7 million power customers, with outages as long as 12 hours.
August of 2006, two units in Illinois of USA, had to reduce electricity production to less than 60% electricity capacity because the temperature of the Mississippi River was too high to discharge heated cooling water from reactors USNRCN (2006).
ii. Extreme precipitation
In countries with substantial coal deposits, the largest share of coal transport within the national boundaries is by rail. Barges are used if an adequate river network is available; haulage by truck and use of coal slurry pipelines are both known. According to statistics of the US Energy Information Administration, out of the 974 million tons of coal moved in the United States in 2011, approximately 72.5 % was hauled by rail, 10.7 % by water— primarily barges— 10.5 % by truck, and approximately 6 % by pipelines and similar conveyances [145].
Except from significant interruptions to rail transport from climatic change and severe weather event such as rainfall intensity and extreme precipitation, which could increase the likelihood of trains being overturned, of accidents or network disruption and track blockages, extreme precipitation can affect additionally coal's thermodynamic performance due to the increased moisture content in their chemical composition.
iii. Floods
During the summer of 2007 in UK, when widespread flooding led to power failures and loss of water supplies throughout Gloucestershire, Worcestershire and East Yorkshire. Damage to electricity distribution related to infrastructures components inundation, assets cut off 40,000 people in Gloucestershire for 24 hours. In Yorkshire and Humberside 9000 customers were placed on rota disconnection (rolling blackouts) for several days [146].
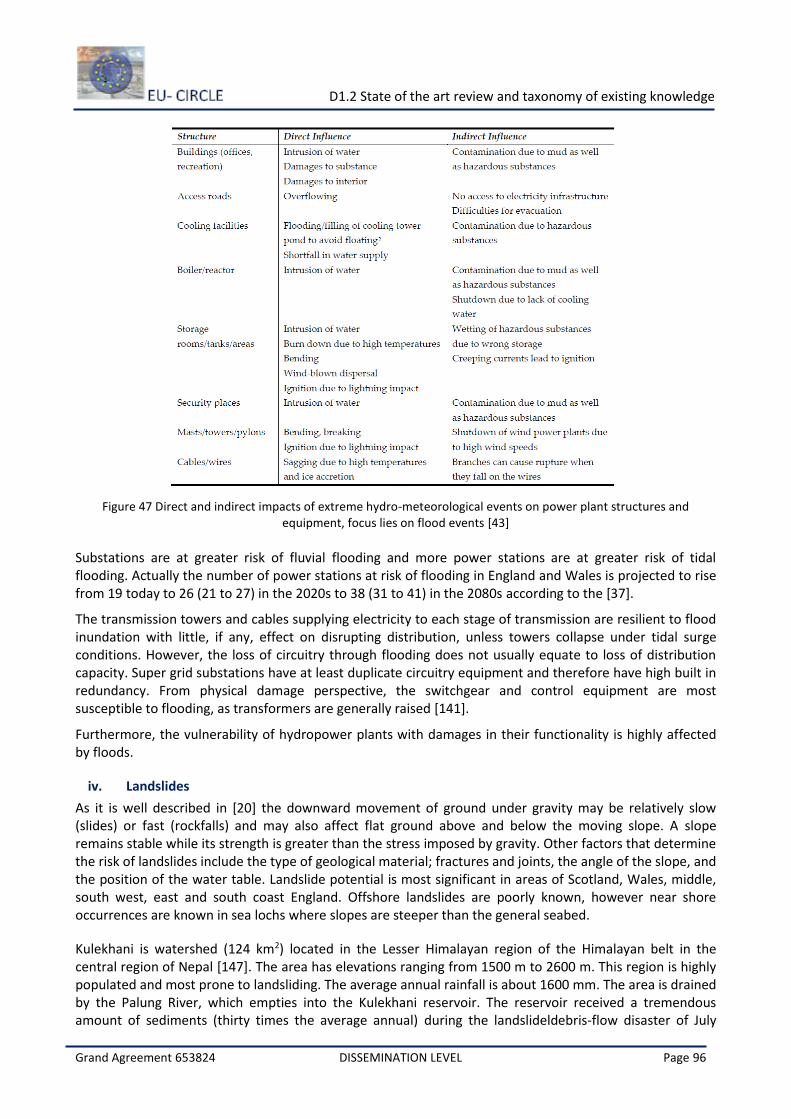
D1.2 State of the art review and taxonomy of existing knowledge
Grand Agreement 653824 DISSEMINATION LEVEL Page 96
Figure 47 Direct and indirect impacts of extreme hydro-meteorological events on power plant structures and equipment, focus lies on flood events [43]
Substations are at greater risk of fluvial flooding and more power stations are at greater risk of tidal flooding. Actually the number of power stations at risk of flooding in England and Wales is projected to rise from 19 today to 26 (21 to 27) in the 2020s to 38 (31 to 41) in the 2080s according to the [37].
The transmission towers and cables supplying electricity to each stage of transmission are resilient to flood inundation with little, if any, effect on disrupting distribution, unless towers collapse under tidal surge conditions. However, the loss of circuitry through flooding does not usually equate to loss of distribution capacity. Super grid substations have at least duplicate circuitry equipment and therefore have high built in redundancy. From physical damage perspective, the switchgear and control equipment are most susceptible to flooding, as transformers are generally raised [141].
Furthermore, the vulnerability of hydropower plants with damages in their functionality is highly affected by floods.
iv. Landslides
As it is well described in [20] the downward movement of ground under gravity may be relatively slow (slides) or fast (rockfalls) and may also affect flat ground above and below the moving slope. A slope remains stable while its strength is greater than the stress imposed by gravity. Other factors that determine the risk of landslides include the type of geological material; fractures and joints, the angle of the slope, and the position of the water table. Landslide potential is most significant in areas of Scotland, Wales, middle, south west, east and south coast England. Offshore landslides are poorly known, however near shore occurrences are known in sea lochs where slopes are steeper than the general seabed.
Kulekhani is watershed (124 km2) located in the Lesser Himalayan region of the Himalayan belt in the central region of Nepal [147]. The area has elevations ranging from 1500 m to 2600 m. This region is highly populated and most prone to landsliding. The average annual rainfall is about 1600 mm. The area is drained by the Palung River, which empties into the Kulekhani reservoir. The reservoir received a tremendous amount of sediments (thirty times the average annual) during the landslideldebris-flow disaster of July
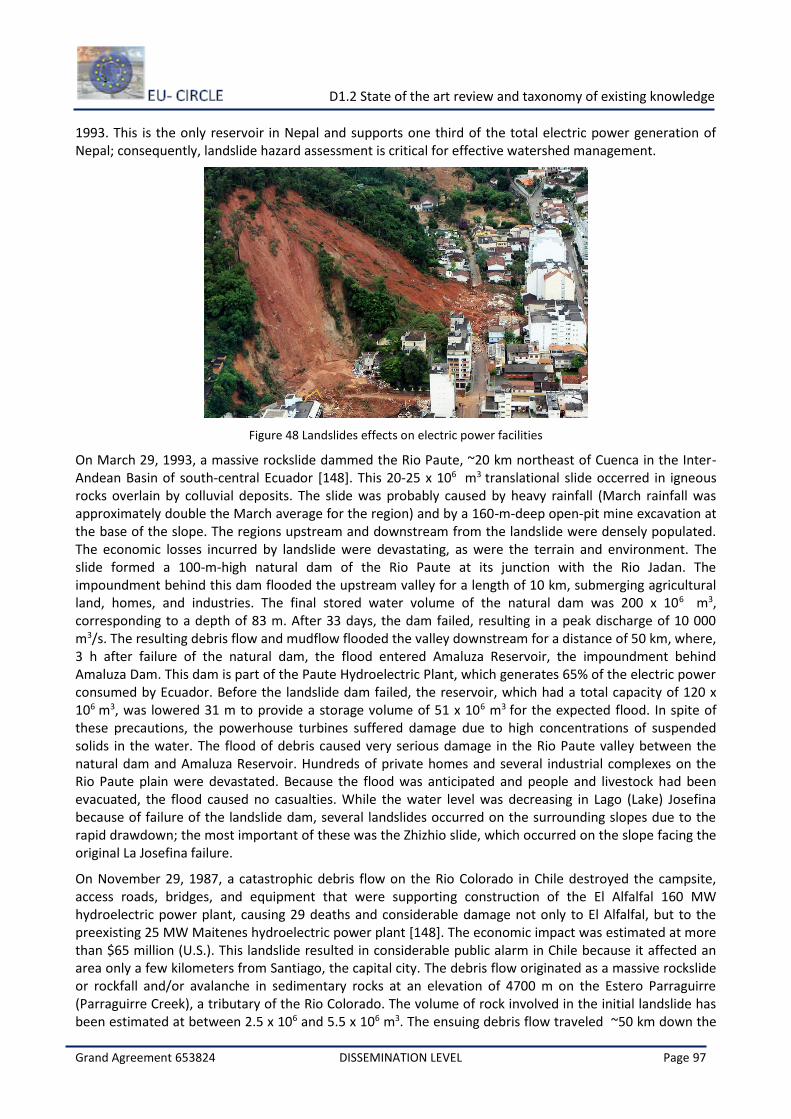
D1.2 State of the art review and taxonomy of existing knowledge
Grand Agreement 653824 DISSEMINATION LEVEL Page 97
1993. This is the only reservoir in Nepal and supports one third of the total electric power generation of Nepal; consequently, landslide hazard assessment is critical for effective watershed management.
Figure 48 Landslides effects on electric power facilities
On March 29, 1993, a massive rockslide dammed the Rio Paute, ~20 km northeast of Cuenca in the Inter-Andean Basin of south-central Ecuador [148]. This 20-25 x 106 m3 translational slide occerred in igneous rocks overlain by colluvial deposits. The slide was probably caused by heavy rainfall (March rainfall was approximately double the March average for the region) and by a 160-m-deep open-pit mine excavation at the base of the slope. The regions upstream and downstream from the landslide were densely populated. The economic losses incurred by landslide were devastating, as were the terrain and environment. The slide formed a 100-m-high natural dam of the Rio Paute at its junction with the Rio Jadan. The impoundment behind this dam flooded the upstream valley for a length of 10 km, submerging agricultural land, homes, and industries. The final stored water volume of the natural dam was 200 x 106 m3, corresponding to a depth of 83 m. After 33 days, the dam failed, resulting in a peak discharge of 10 000 m3/s. The resulting debris flow and mudflow flooded the valley downstream for a distance of 50 km, where, 3 h after failure of the natural dam, the flood entered Amaluza Reservoir, the impoundment behind Amaluza Dam. This dam is part of the Paute Hydroelectric Plant, which generates 65% of the electric power consumed by Ecuador. Before the landslide dam failed, the reservoir, which had a total capacity of 120 x 106 m3, was lowered 31 m to provide a storage volume of 51 x 106 m3 for the expected flood. In spite of these precautions, the powerhouse turbines suffered damage due to high concentrations of suspended solids in the water. The flood of debris caused very serious damage in the Rio Paute valley between the natural dam and Amaluza Reservoir. Hundreds of private homes and several industrial complexes on the Rio Paute plain were devastated. Because the flood was anticipated and people and livestock had been evacuated, the flood caused no casualties. While the water level was decreasing in Lago (Lake) Josefina because of failure of the landslide dam, several landslides occurred on the surrounding slopes due to the rapid drawdown; the most important of these was the Zhizhio slide, which occurred on the slope facing the original La Josefina failure.
On November 29, 1987, a catastrophic debris flow on the Rio Colorado in Chile destroyed the campsite, access roads, bridges, and equipment that were supporting construction of the El Alfalfal 160 MW hydroelectric power plant, causing 29 deaths and considerable damage not only to El Alfalfal, but to the preexisting 25 MW Maitenes hydroelectric power plant [148]. The economic impact was estimated at more than $65 million (U.S.). This landslide resulted in considerable public alarm in Chile because it affected an area only a few kilometers from Santiago, the capital city. The debris flow originated as a massive rockslide or rockfall and/or avalanche in sedimentary rocks at an elevation of 4700 m on the Estero Parraguirre (Parraguirre Creek), a tributary of the Rio Colorado. The volume of rock involved in the initial landslide has been estimated at between 2.5 x 10⁶ and 5.5 x 10⁶ m3. The ensuing debris flow traveled ~50 km down the
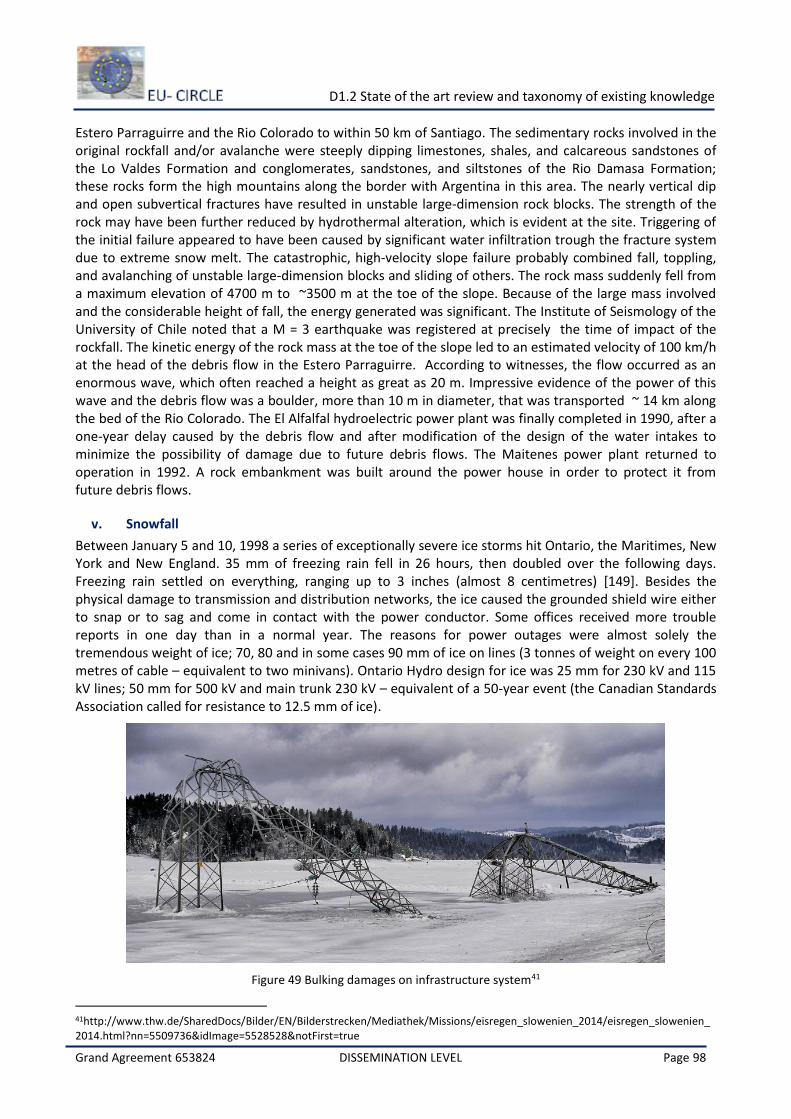
D1.2 State of the art review and taxonomy of existing knowledge
Grand Agreement 653824 DISSEMINATION LEVEL Page 98
Estero Parraguirre and the Rio Colorado to within 50 km of Santiago. The sedimentary rocks involved in the original rockfall and/or avalanche were steeply dipping limestones, shales, and calcareous sandstones of the Lo Valdes Formation and conglomerates, sandstones, and siltstones of the Rio Damasa Formation; these rocks form the high mountains along the border with Argentina in this area. The nearly vertical dip and open subvertical fractures have resulted in unstable large-dimension rock blocks. The strength of the rock may have been further reduced by hydrothermal alteration, which is evident at the site. Triggering of the initial failure appeared to have been caused by significant water infiltration trough the fracture system due to extreme snow melt. The catastrophic, high-velocity slope failure probably combined fall, toppling, and avalanching of unstable large-dimension blocks and sliding of others. The rock mass suddenly fell from a maximum elevation of 4700 m to ~3500 m at the toe of the slope. Because of the large mass involved and the considerable height of fall, the energy generated was significant. The Institute of Seismology of the University of Chile noted that a M = 3 earthquake was registered at precisely the time of impact of the rockfall. The kinetic energy of the rock mass at the toe of the slope led to an estimated velocity of 100 km/h at the head of the debris flow in the Estero Parraguirre. According to witnesses, the flow occurred as an enormous wave, which often reached a height as great as 20 m. Impressive evidence of the power of this wave and the debris flow was a boulder, more than 10 m in diameter, that was transported ~ 14 km along the bed of the Rio Colorado. The El Alfalfal hydroelectric power plant was finally completed in 1990, after a one-year delay caused by the debris flow and after modification of the design of the water intakes to minimize the possibility of damage due to future debris flows. The Maitenes power plant returned to operation in 1992. A rock embankment was built around the power house in order to protect it from future debris flows.
v. Snowfall
Between January 5 and 10, 1998 a series of exceptionally severe ice storms hit Ontario, the Maritimes, New York and New England. 35 mm of freezing rain fell in 26 hours, then doubled over the following days. Freezing rain settled on everything, ranging up to 3 inches (almost 8 centimetres) [149]. Besides the physical damage to transmission and distribution networks, the ice caused the grounded shield wire either to snap or to sag and come in contact with the power conductor. Some offices received more trouble reports in one day than in a normal year. The reasons for power outages were almost solely the tremendous weight of ice; 70, 80 and in some cases 90 mm of ice on lines (3 tonnes of weight on every 100 metres of cable – equivalent to two minivans). Ontario Hydro design for ice was 25 mm for 230 kV and 115 kV lines; 50 mm for 500 kV and main trunk 230 kV – equivalent of a 50-year event (the Canadian Standards Association called for resistance to 12.5 mm of ice).
Figure 49 Bulking damages on infrastructure system41
41http://www.thw.de/SharedDocs/Bilder/EN/Bilderstrecken/Mediathek/Missions/eisregen_slowenien_2014/eisregen_slowenien_2014.html?nn=5509736&idImage=5528528¬First=true
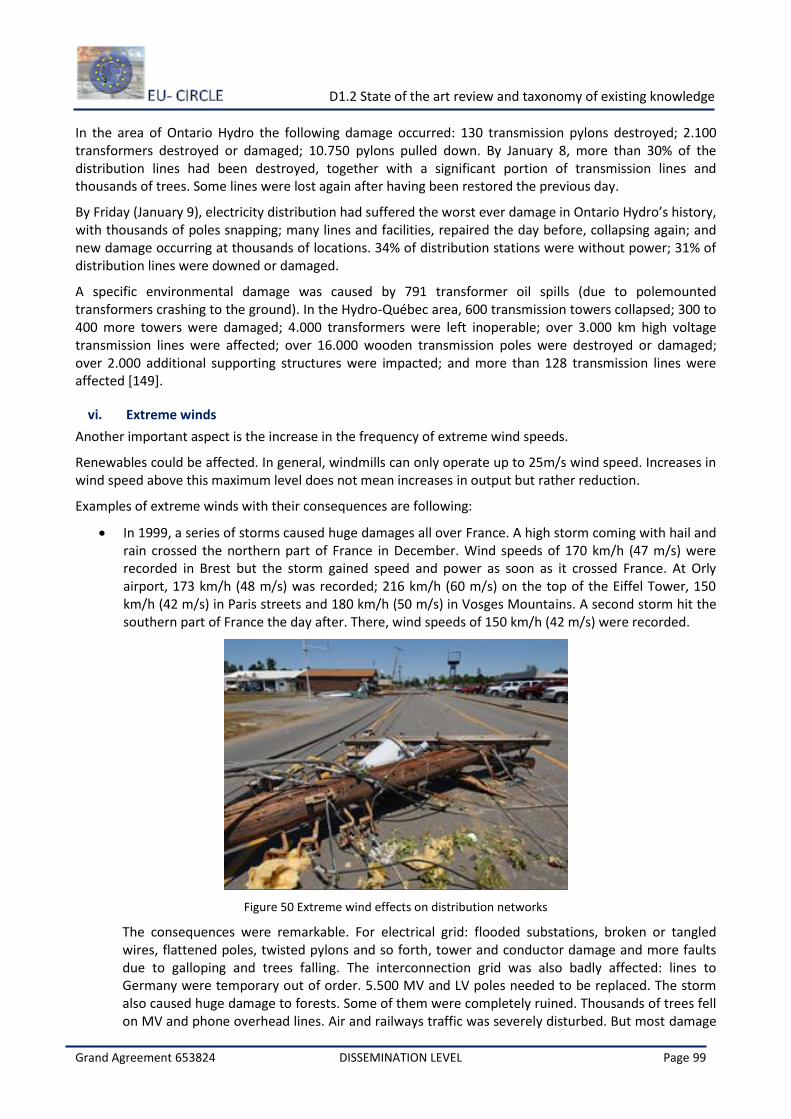
D1.2 State of the art review and taxonomy of existing knowledge
Grand Agreement 653824 DISSEMINATION LEVEL Page 99
In the area of Ontario Hydro the following damage occurred: 130 transmission pylons destroyed; 2.100 transformers destroyed or damaged; 10.750 pylons pulled down. By January 8, more than 30% of the distribution lines had been destroyed, together with a significant portion of transmission lines and thousands of trees. Some lines were lost again after having been restored the previous day.
By Friday (January 9), electricity distribution had suffered the worst ever damage in Ontario Hydro’s history, with thousands of poles snapping; many lines and facilities, repaired the day before, collapsing again; and new damage occurring at thousands of locations. 34% of distribution stations were without power; 31% of distribution lines were downed or damaged.
A specific environmental damage was caused by 791 transformer oil spills (due to polemounted transformers crashing to the ground). In the Hydro-Québec area, 600 transmission towers collapsed; 300 to 400 more towers were damaged; 4.000 transformers were left inoperable; over 3.000 km high voltage transmission lines were affected; over 16.000 wooden transmission poles were destroyed or damaged; over 2.000 additional supporting structures were impacted; and more than 128 transmission lines were affected [149].
vi. Extreme winds
Another important aspect is the increase in the frequency of extreme wind speeds.
Renewables could be affected. In general, windmills can only operate up to 25m/s wind speed. Increases in wind speed above this maximum level does not mean increases in output but rather reduction.
Examples of extreme winds with their consequences are following:
In 1999, a series of storms caused huge damages all over France. A high storm coming with hail and rain crossed the northern part of France in December. Wind speeds of 170 km/h (47 m/s) were recorded in Brest but the storm gained speed and power as soon as it crossed France. At Orly airport, 173 km/h (48 m/s) was recorded; 216 km/h (60 m/s) on the top of the Eiffel Tower, 150 km/h (42 m/s) in Paris streets and 180 km/h (50 m/s) in Vosges Mountains. A second storm hit the southern part of France the day after. There, wind speeds of 150 km/h (42 m/s) were recorded.
Figure 50 Extreme wind effects on distribution networks
The consequences were remarkable. For electrical grid: flooded substations, broken or tangled wires, flattened poles, twisted pylons and so forth, tower and conductor damage and more faults due to galloping and trees falling. The interconnection grid was also badly affected: lines to Germany were temporary out of order. 5.500 MV and LV poles needed to be replaced. The storm also caused huge damage to forests. Some of them were completely ruined. Thousands of trees fell on MV and phone overhead lines. Air and railways traffic was severely disturbed. But most damage
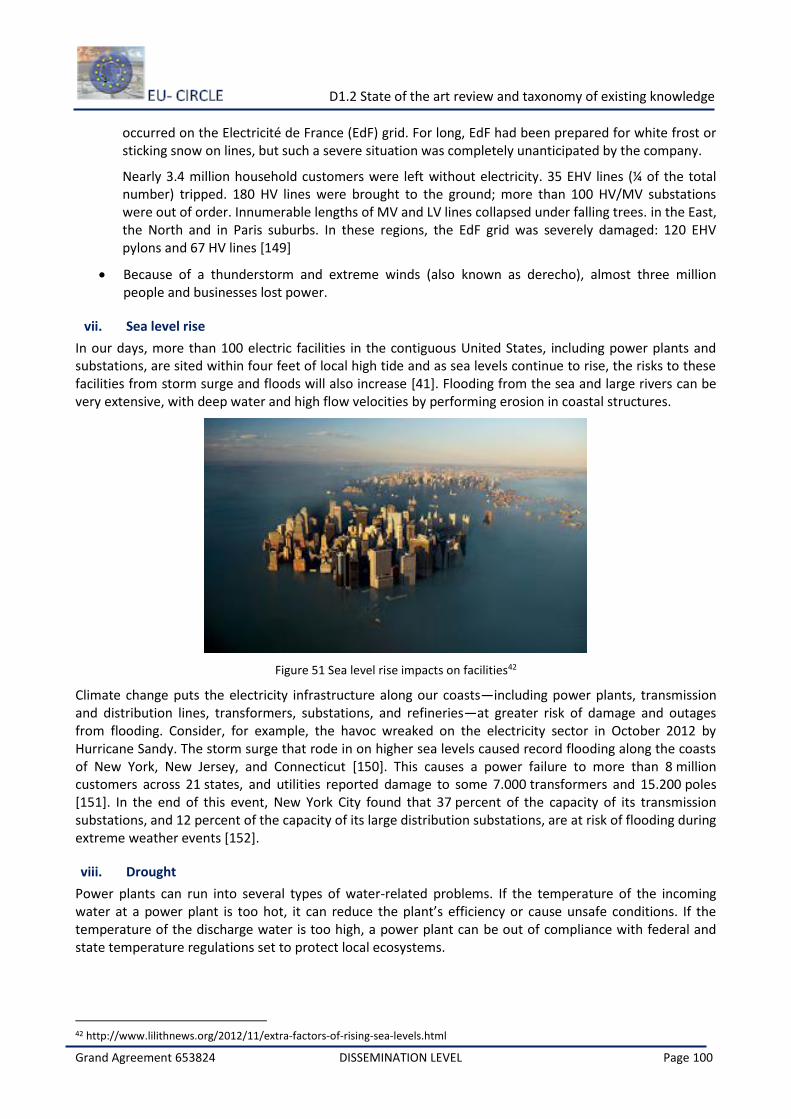
D1.2 State of the art review and taxonomy of existing knowledge
Grand Agreement 653824 DISSEMINATION LEVEL Page 100
occurred on the Electricité de France (EdF) grid. For long, EdF had been prepared for white frost or sticking snow on lines, but such a severe situation was completely unanticipated by the company.
Nearly 3.4 million household customers were left without electricity. 35 EHV lines (¼ of the total number) tripped. 180 HV lines were brought to the ground; more than 100 HV/MV substations were out of order. Innumerable lengths of MV and LV lines collapsed under falling trees. in the East, the North and in Paris suburbs. In these regions, the EdF grid was severely damaged: 120 EHV pylons and 67 HV lines [149]
Because of a thunderstorm and extreme winds (also known as derecho), almost three million people and businesses lost power.
vii. Sea level rise
In our days, more than 100 electric facilities in the contiguous United States, including power plants and substations, are sited within four feet of local high tide and as sea levels continue to rise, the risks to these facilities from storm surge and floods will also increase [41]. Flooding from the sea and large rivers can be very extensive, with deep water and high flow velocities by performing erosion in coastal structures.
Figure 51 Sea level rise impacts on facilities42
Climate change puts the electricity infrastructure along our coasts—including power plants, transmission and distribution lines, transformers, substations, and refineries—at greater risk of damage and outages from flooding. Consider, for example, the havoc wreaked on the electricity sector in October 2012 by Hurricane Sandy. The storm surge that rode in on higher sea levels caused record flooding along the coasts of New York, New Jersey, and Connecticut [150]. This causes a power failure to more than 8 million customers across 21 states, and utilities reported damage to some 7.000 transformers and 15.200 poles [151]. In the end of this event, New York City found that 37 percent of the capacity of its transmission substations, and 12 percent of the capacity of its large distribution substations, are at risk of flooding during extreme weather events [152].
viii. Drought
Power plants can run into several types of water-related problems. If the temperature of the incoming water at a power plant is too hot, it can reduce the plant’s efficiency or cause unsafe conditions. If the temperature of the discharge water is too high, a power plant can be out of compliance with federal and state temperature regulations set to protect local ecosystems.
42 http://www.lilithnews.org/2012/11/extra-factors-of-rising-sea-levels.html
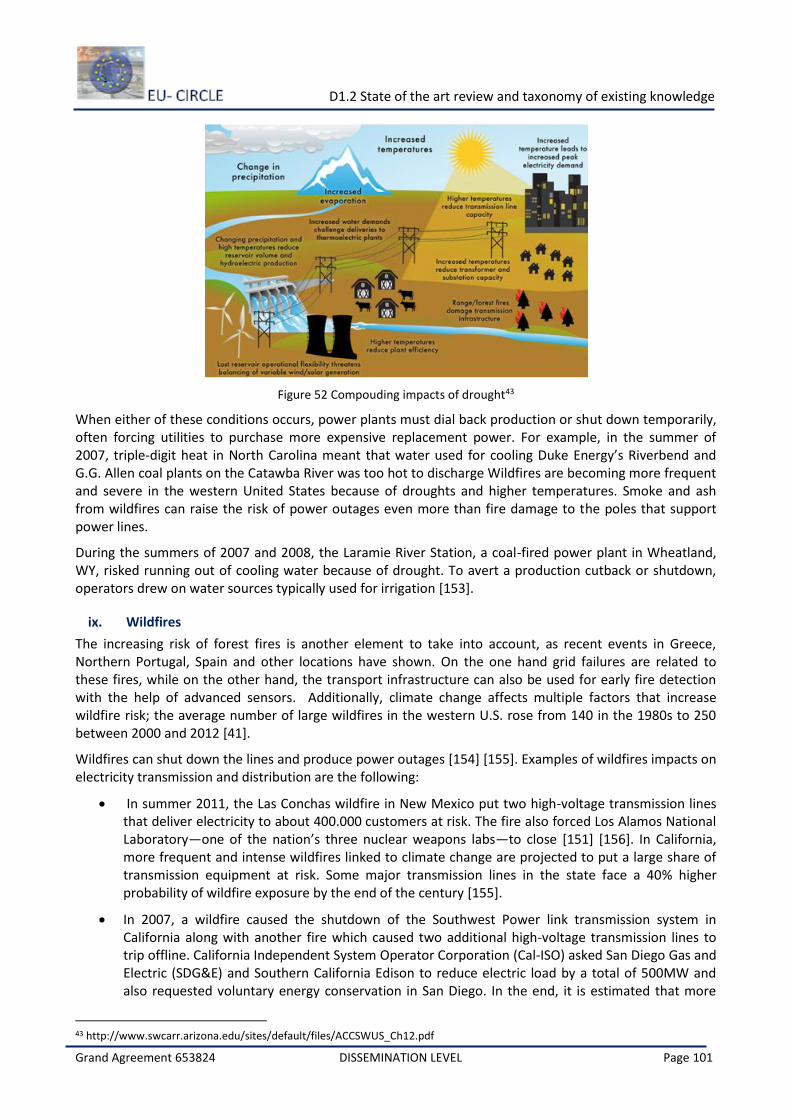
D1.2 State of the art review and taxonomy of existing knowledge
Grand Agreement 653824 DISSEMINATION LEVEL Page 101
Figure 52 Compouding impacts of drought43
When either of these conditions occurs, power plants must dial back production or shut down temporarily, often forcing utilities to purchase more expensive replacement power. For example, in the summer of 2007, triple-digit heat in North Carolina meant that water used for cooling Duke Energy’s Riverbend and G.G. Allen coal plants on the Catawba River was too hot to discharge Wildfires are becoming more frequent and severe in the western United States because of droughts and higher temperatures. Smoke and ash from wildfires can raise the risk of power outages even more than fire damage to the poles that support power lines.
During the summers of 2007 and 2008, the Laramie River Station, a coal-fired power plant in Wheatland, WY, risked running out of cooling water because of drought. To avert a production cutback or shutdown, operators drew on water sources typically used for irrigation [153].
ix. Wildfires
The increasing risk of forest fires is another element to take into account, as recent events in Greece, Northern Portugal, Spain and other locations have shown. On the one hand grid failures are related to these fires, while on the other hand, the transport infrastructure can also be used for early fire detection with the help of advanced sensors. Additionally, climate change affects multiple factors that increase wildfire risk; the average number of large wildfires in the western U.S. rose from 140 in the 1980s to 250 between 2000 and 2012 [41].
Wildfires can shut down the lines and produce power outages [154] [155]. Examples of wildfires impacts on electricity transmission and distribution are the following:
In summer 2011, the Las Conchas wildfire in New Mexico put two high-voltage transmission lines that deliver electricity to about 400.000 customers at risk. The fire also forced Los Alamos National Laboratory—one of the nation’s three nuclear weapons labs—to close [151] [156]. In California, more frequent and intense wildfires linked to climate change are projected to put a large share of transmission equipment at risk. Some major transmission lines in the state face a 40% higher probability of wildfire exposure by the end of the century [155].
In 2007, a wildfire caused the shutdown of the Southwest Power link transmission system in California along with another fire which caused two additional high-voltage transmission lines to trip offline. California Independent System Operator Corporation (Cal-ISO) asked San Diego Gas and Electric (SDG&E) and Southern California Edison to reduce electric load by a total of 500MW and also requested voluntary energy conservation in San Diego. In the end, it is estimated that more
43 http://www.swcarr.arizona.edu/sites/default/files/ACCSWUS_Ch12.pdf
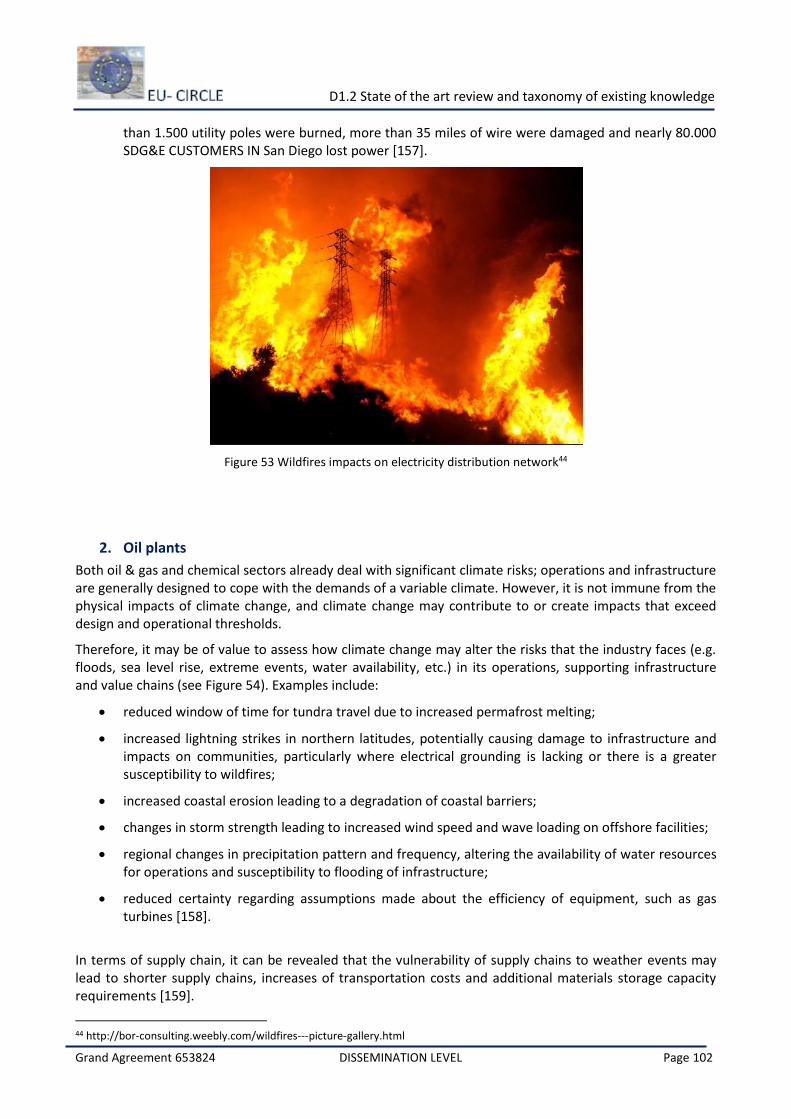
D1.2 State of the art review and taxonomy of existing knowledge
Grand Agreement 653824 DISSEMINATION LEVEL Page 102
than 1.500 utility poles were burned, more than 35 miles of wire were damaged and nearly 80.000 SDG&E CUSTOMERS IN San Diego lost power [157].
Figure 53 Wildfires impacts on electricity distribution network44
2. Oil plants
Both oil & gas and chemical sectors already deal with significant climate risks; operations and infrastructure are generally designed to cope with the demands of a variable climate. However, it is not immune from the physical impacts of climate change, and climate change may contribute to or create impacts that exceed design and operational thresholds.
Therefore, it may be of value to assess how climate change may alter the risks that the industry faces (e.g. floods, sea level rise, extreme events, water availability, etc.) in its operations, supporting infrastructure and value chains (see Figure 54). Examples include:
reduced window of time for tundra travel due to increased permafrost melting;
increased lightning strikes in northern latitudes, potentially causing damage to infrastructure and impacts on communities, particularly where electrical grounding is lacking or there is a greater susceptibility to wildfires;
increased coastal erosion leading to a degradation of coastal barriers;
changes in storm strength leading to increased wind speed and wave loading on offshore facilities;
regional changes in precipitation pattern and frequency, altering the availability of water resources for operations and susceptibility to flooding of infrastructure;
reduced certainty regarding assumptions made about the efficiency of equipment, such as gas turbines [158].
In terms of supply chain, it can be revealed that the vulnerability of supply chains to weather events may lead to shorter supply chains, increases of transportation costs and additional materials storage capacity requirements [159].
44 http://bor-consulting.weebly.com/wildfires---picture-gallery.html
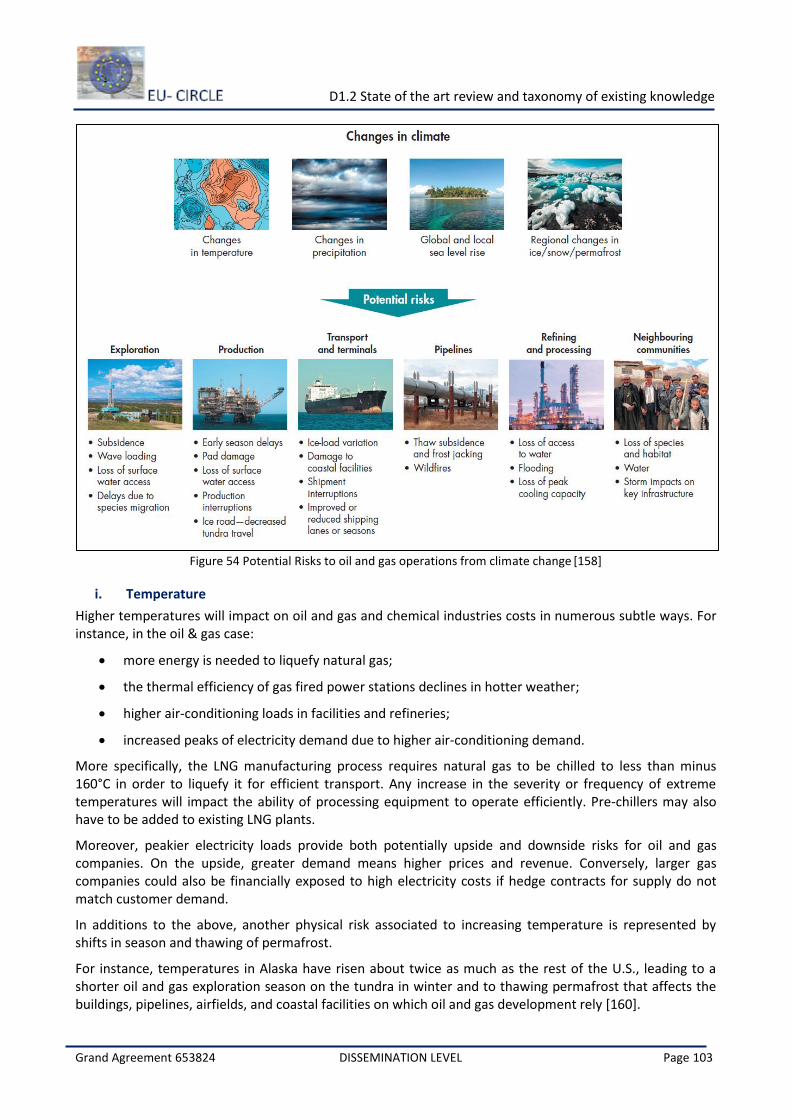
D1.2 State of the art review and taxonomy of existing knowledge
Grand Agreement 653824 DISSEMINATION LEVEL Page 103
Figure 54 Potential Risks to oil and gas operations from climate change [158]
i. Temperature
Higher temperatures will impact on oil and gas and chemical industries costs in numerous subtle ways. For instance, in the oil & gas case:
more energy is needed to liquefy natural gas;
the thermal efficiency of gas fired power stations declines in hotter weather;
higher air-conditioning loads in facilities and refineries;
increased peaks of electricity demand due to higher air-conditioning demand.
More specifically, the LNG manufacturing process requires natural gas to be chilled to less than minus 160°C in order to liquefy it for efficient transport. Any increase in the severity or frequency of extreme temperatures will impact the ability of processing equipment to operate efficiently. Pre-chillers may also have to be added to existing LNG plants.
Moreover, peakier electricity loads provide both potentially upside and downside risks for oil and gas companies. On the upside, greater demand means higher prices and revenue. Conversely, larger gas companies could also be financially exposed to high electricity costs if hedge contracts for supply do not match customer demand.
In additions to the above, another physical risk associated to increasing temperature is represented by shifts in season and thawing of permafrost.
For instance, temperatures in Alaska have risen about twice as much as the rest of the U.S., leading to a shorter oil and gas exploration season on the tundra in winter and to thawing permafrost that affects the buildings, pipelines, airfields, and coastal facilities on which oil and gas development rely [160].
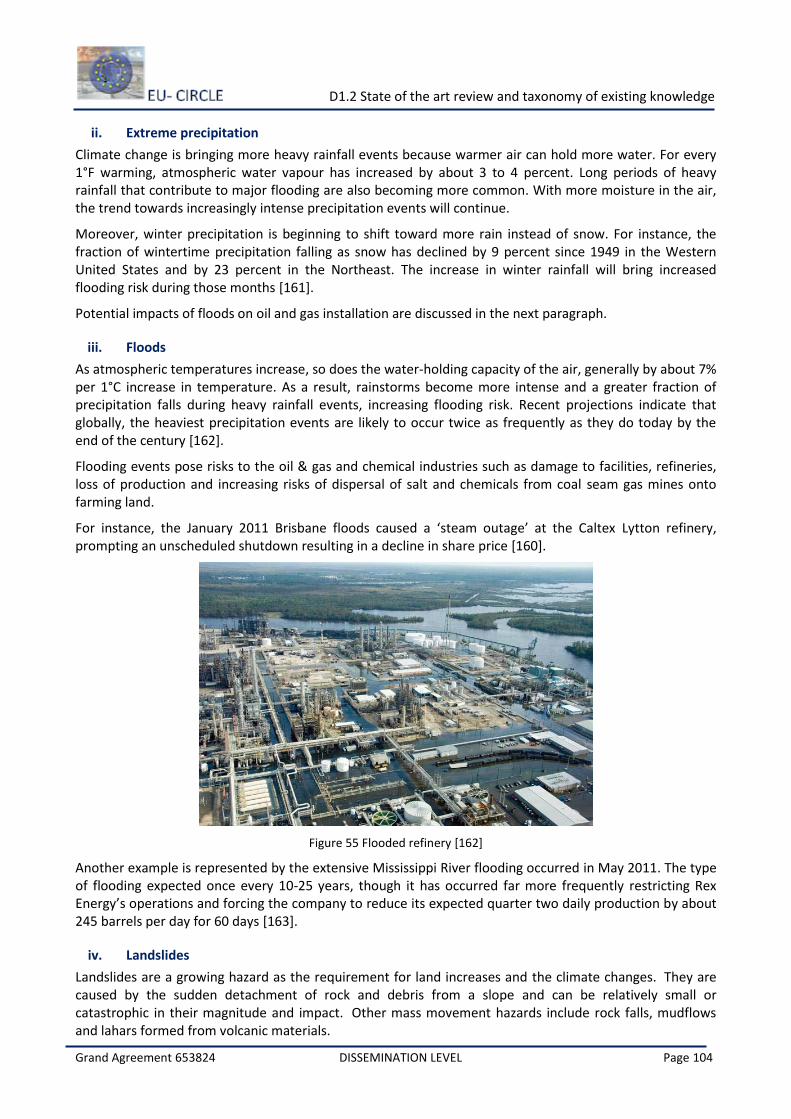
D1.2 State of the art review and taxonomy of existing knowledge
Grand Agreement 653824 DISSEMINATION LEVEL Page 104
ii. Extreme precipitation
Climate change is bringing more heavy rainfall events because warmer air can hold more water. For every 1°F warming, atmospheric water vapour has increased by about 3 to 4 percent. Long periods of heavy rainfall that contribute to major flooding are also becoming more common. With more moisture in the air, the trend towards increasingly intense precipitation events will continue.
Moreover, winter precipitation is beginning to shift toward more rain instead of snow. For instance, the fraction of wintertime precipitation falling as snow has declined by 9 percent since 1949 in the Western United States and by 23 percent in the Northeast. The increase in winter rainfall will bring increased flooding risk during those months [161].
Potential impacts of floods on oil and gas installation are discussed in the next paragraph.
iii. Floods
As atmospheric temperatures increase, so does the water-holding capacity of the air, generally by about 7% per 1°C increase in temperature. As a result, rainstorms become more intense and a greater fraction of precipitation falls during heavy rainfall events, increasing flooding risk. Recent projections indicate that globally, the heaviest precipitation events are likely to occur twice as frequently as they do today by the end of the century [162].
Flooding events pose risks to the oil & gas and chemical industries such as damage to facilities, refineries, loss of production and increasing risks of dispersal of salt and chemicals from coal seam gas mines onto farming land.
For instance, the January 2011 Brisbane floods caused a ‘steam outage’ at the Caltex Lytton refinery, prompting an unscheduled shutdown resulting in a decline in share price [160].
Figure 55 Flooded refinery [162]
Another example is represented by the extensive Mississippi River flooding occurred in May 2011. The type of flooding expected once every 10-25 years, though it has occurred far more frequently restricting Rex Energy’s operations and forcing the company to reduce its expected quarter two daily production by about 245 barrels per day for 60 days [163].
iv. Landslides
Landslides are a growing hazard as the requirement for land increases and the climate changes. They are caused by the sudden detachment of rock and debris from a slope and can be relatively small or catastrophic in their magnitude and impact. Other mass movement hazards include rock falls, mudflows and lahars formed from volcanic materials.
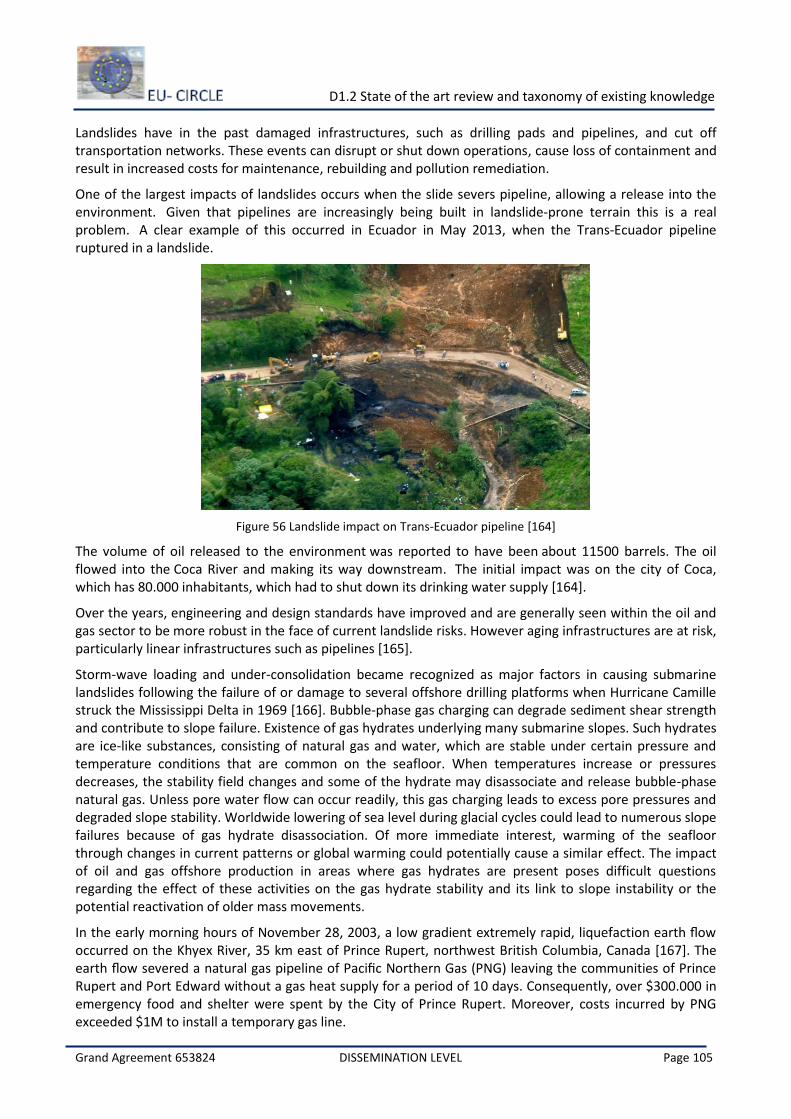
D1.2 State of the art review and taxonomy of existing knowledge
Grand Agreement 653824 DISSEMINATION LEVEL Page 105
Landslides have in the past damaged infrastructures, such as drilling pads and pipelines, and cut off transportation networks. These events can disrupt or shut down operations, cause loss of containment and result in increased costs for maintenance, rebuilding and pollution remediation.
One of the largest impacts of landslides occurs when the slide severs pipeline, allowing a release into the environment. Given that pipelines are increasingly being built in landslide-prone terrain this is a real problem. A clear example of this occurred in Ecuador in May 2013, when the Trans-Ecuador pipeline ruptured in a landslide.
Figure 56 Landslide impact on Trans-Ecuador pipeline [164]
The volume of oil released to the environment was reported to have been about 11500 barrels. The oil flowed into the Coca River and making its way downstream. The initial impact was on the city of Coca, which has 80.000 inhabitants, which had to shut down its drinking water supply [164].
Over the years, engineering and design standards have improved and are generally seen within the oil and gas sector to be more robust in the face of current landslide risks. However aging infrastructures are at risk, particularly linear infrastructures such as pipelines [165].
Storm-wave loading and under-consolidation became recognized as major factors in causing submarine landslides following the failure of or damage to several offshore drilling platforms when Hurricane Camille struck the Mississippi Delta in 1969 [166]. Bubble-phase gas charging can degrade sediment shear strength and contribute to slope failure. Existence of gas hydrates underlying many submarine slopes. Such hydrates are ice-like substances, consisting of natural gas and water, which are stable under certain pressure and temperature conditions that are common on the seafloor. When temperatures increase or pressures decreases, the stability field changes and some of the hydrate may disassociate and release bubble-phase natural gas. Unless pore water flow can occur readily, this gas charging leads to excess pore pressures and degraded slope stability. Worldwide lowering of sea level during glacial cycles could lead to numerous slope failures because of gas hydrate disassociation. Of more immediate interest, warming of the seafloor through changes in current patterns or global warming could potentially cause a similar effect. The impact of oil and gas offshore production in areas where gas hydrates are present poses difficult questions regarding the effect of these activities on the gas hydrate stability and its link to slope instability or the potential reactivation of older mass movements.
In the early morning hours of November 28, 2003, a low gradient extremely rapid, liquefaction earth flow occurred on the Khyex River, 35 km east of Prince Rupert, northwest British Columbia, Canada [167]. The earth flow severed a natural gas pipeline of Pacific Northern Gas (PNG) leaving the communities of Prince Rupert and Port Edward without a gas heat supply for a period of 10 days. Consequently, over $300.000 in emergency food and shelter were spent by the City of Prince Rupert. Moreover, costs incurred by PNG exceeded $1M to install a temporary gas line.
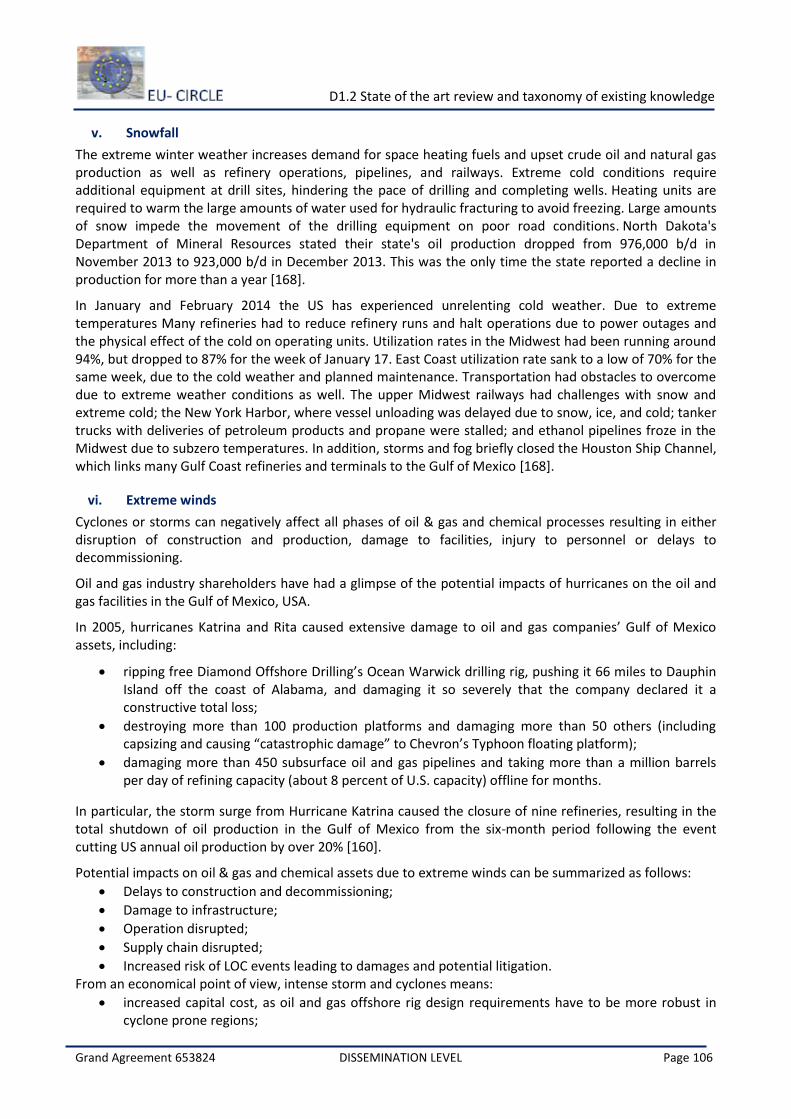
D1.2 State of the art review and taxonomy of existing knowledge
Grand Agreement 653824 DISSEMINATION LEVEL Page 106
v. Snowfall
The extreme winter weather increases demand for space heating fuels and upset crude oil and natural gas production as well as refinery operations, pipelines, and railways. Extreme cold conditions require additional equipment at drill sites, hindering the pace of drilling and completing wells. Heating units are required to warm the large amounts of water used for hydraulic fracturing to avoid freezing. Large amounts of snow impede the movement of the drilling equipment on poor road conditions. North Dakota's Department of Mineral Resources stated their state's oil production dropped from 976,000 b/d in November 2013 to 923,000 b/d in December 2013. This was the only time the state reported a decline in production for more than a year [168].
In January and February 2014 the US has experienced unrelenting cold weather. Due to extreme temperatures Many refineries had to reduce refinery runs and halt operations due to power outages and the physical effect of the cold on operating units. Utilization rates in the Midwest had been running around 94%, but dropped to 87% for the week of January 17. East Coast utilization rate sank to a low of 70% for the same week, due to the cold weather and planned maintenance. Transportation had obstacles to overcome due to extreme weather conditions as well. The upper Midwest railways had challenges with snow and extreme cold; the New York Harbor, where vessel unloading was delayed due to snow, ice, and cold; tanker trucks with deliveries of petroleum products and propane were stalled; and ethanol pipelines froze in the Midwest due to subzero temperatures. In addition, storms and fog briefly closed the Houston Ship Channel, which links many Gulf Coast refineries and terminals to the Gulf of Mexico [168].
vi. Extreme winds
Cyclones or storms can negatively affect all phases of oil & gas and chemical processes resulting in either disruption of construction and production, damage to facilities, injury to personnel or delays to decommissioning.
Oil and gas industry shareholders have had a glimpse of the potential impacts of hurricanes on the oil and gas facilities in the Gulf of Mexico, USA.
In 2005, hurricanes Katrina and Rita caused extensive damage to oil and gas companies’ Gulf of Mexico assets, including:
ripping free Diamond Offshore Drilling’s Ocean Warwick drilling rig, pushing it 66 miles to Dauphin Island off the coast of Alabama, and damaging it so severely that the company declared it a constructive total loss;
destroying more than 100 production platforms and damaging more than 50 others (including capsizing and causing “catastrophic damage” to Chevron’s Typhoon floating platform);
damaging more than 450 subsurface oil and gas pipelines and taking more than a million barrels per day of refining capacity (about 8 percent of U.S. capacity) offline for months.
In particular, the storm surge from Hurricane Katrina caused the closure of nine refineries, resulting in the total shutdown of oil production in the Gulf of Mexico from the six-month period following the event cutting US annual oil production by over 20% [160].
Potential impacts on oil & gas and chemical assets due to extreme winds can be summarized as follows:
Delays to construction and decommissioning;
Damage to infrastructure;
Operation disrupted;
Supply chain disrupted;
Increased risk of LOC events leading to damages and potential litigation. From an economical point of view, intense storm and cyclones means:
increased capital cost, as oil and gas offshore rig design requirements have to be more robust in cyclone prone regions;
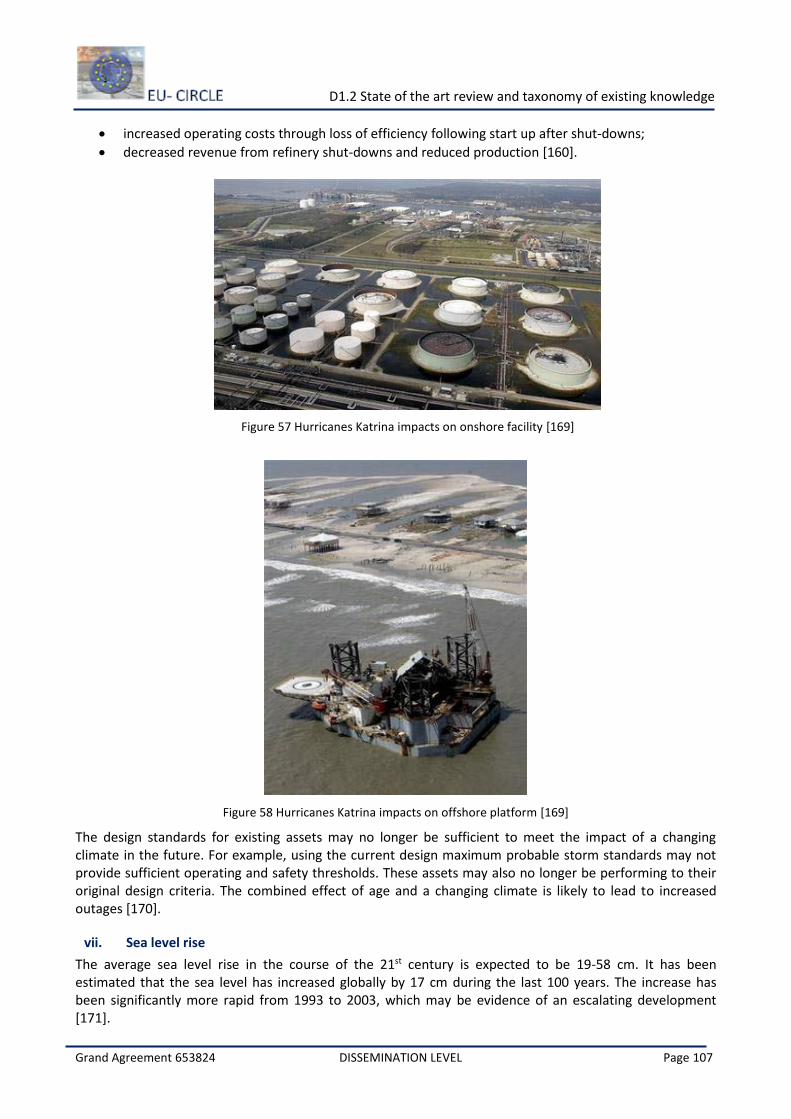
D1.2 State of the art review and taxonomy of existing knowledge
Grand Agreement 653824 DISSEMINATION LEVEL Page 107
increased operating costs through loss of efficiency following start up after shut-downs;
decreased revenue from refinery shut-downs and reduced production [160].
Figure 57 Hurricanes Katrina impacts on onshore facility [169]
Figure 58 Hurricanes Katrina impacts on offshore platform [169]
The design standards for existing assets may no longer be sufficient to meet the impact of a changing climate in the future. For example, using the current design maximum probable storm standards may not provide sufficient operating and safety thresholds. These assets may also no longer be performing to their original design criteria. The combined effect of age and a changing climate is likely to lead to increased outages [170].
vii. Sea level rise
The average sea level rise in the course of the 21st century is expected to be 19-58 cm. It has been estimated that the sea level has increased globally by 17 cm during the last 100 years. The increase has been significantly more rapid from 1993 to 2003, which may be evidence of an escalating development [171].
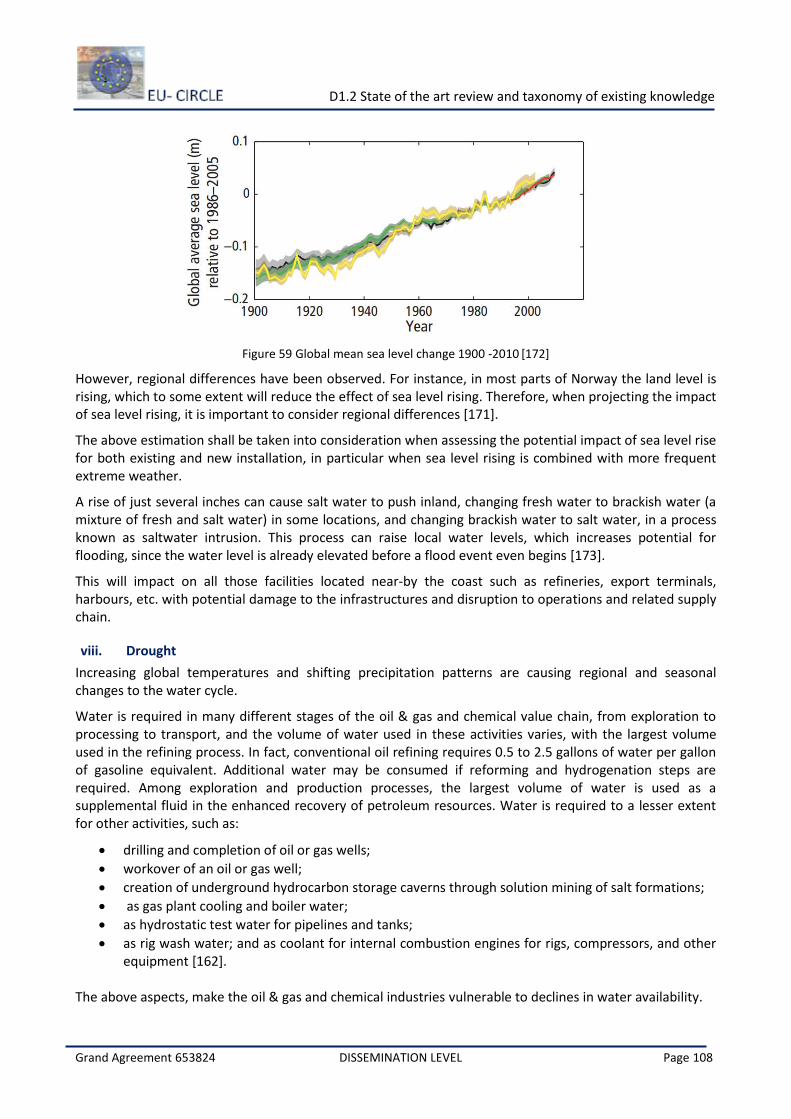
D1.2 State of the art review and taxonomy of existing knowledge
Grand Agreement 653824 DISSEMINATION LEVEL Page 108
Figure 59 Global mean sea level change 1900 -2010 [172]
However, regional differences have been observed. For instance, in most parts of Norway the land level is rising, which to some extent will reduce the effect of sea level rising. Therefore, when projecting the impact of sea level rising, it is important to consider regional differences [171].
The above estimation shall be taken into consideration when assessing the potential impact of sea level rise for both existing and new installation, in particular when sea level rising is combined with more frequent extreme weather.
A rise of just several inches can cause salt water to push inland, changing fresh water to brackish water (a mixture of fresh and salt water) in some locations, and changing brackish water to salt water, in a process known as saltwater intrusion. This process can raise local water levels, which increases potential for flooding, since the water level is already elevated before a flood event even begins [173].
This will impact on all those facilities located near-by the coast such as refineries, export terminals, harbours, etc. with potential damage to the infrastructures and disruption to operations and related supply chain.
viii. Drought
Increasing global temperatures and shifting precipitation patterns are causing regional and seasonal changes to the water cycle.
Water is required in many different stages of the oil & gas and chemical value chain, from exploration to processing to transport, and the volume of water used in these activities varies, with the largest volume used in the refining process. In fact, conventional oil refining requires 0.5 to 2.5 gallons of water per gallon of gasoline equivalent. Additional water may be consumed if reforming and hydrogenation steps are required. Among exploration and production processes, the largest volume of water is used as a supplemental fluid in the enhanced recovery of petroleum resources. Water is required to a lesser extent for other activities, such as:
drilling and completion of oil or gas wells;
workover of an oil or gas well;
creation of underground hydrocarbon storage caverns through solution mining of salt formations;
as gas plant cooling and boiler water;
as hydrostatic test water for pipelines and tanks;
as rig wash water; and as coolant for internal combustion engines for rigs, compressors, and other equipment [162].
The above aspects, make the oil & gas and chemical industries vulnerable to declines in water availability.
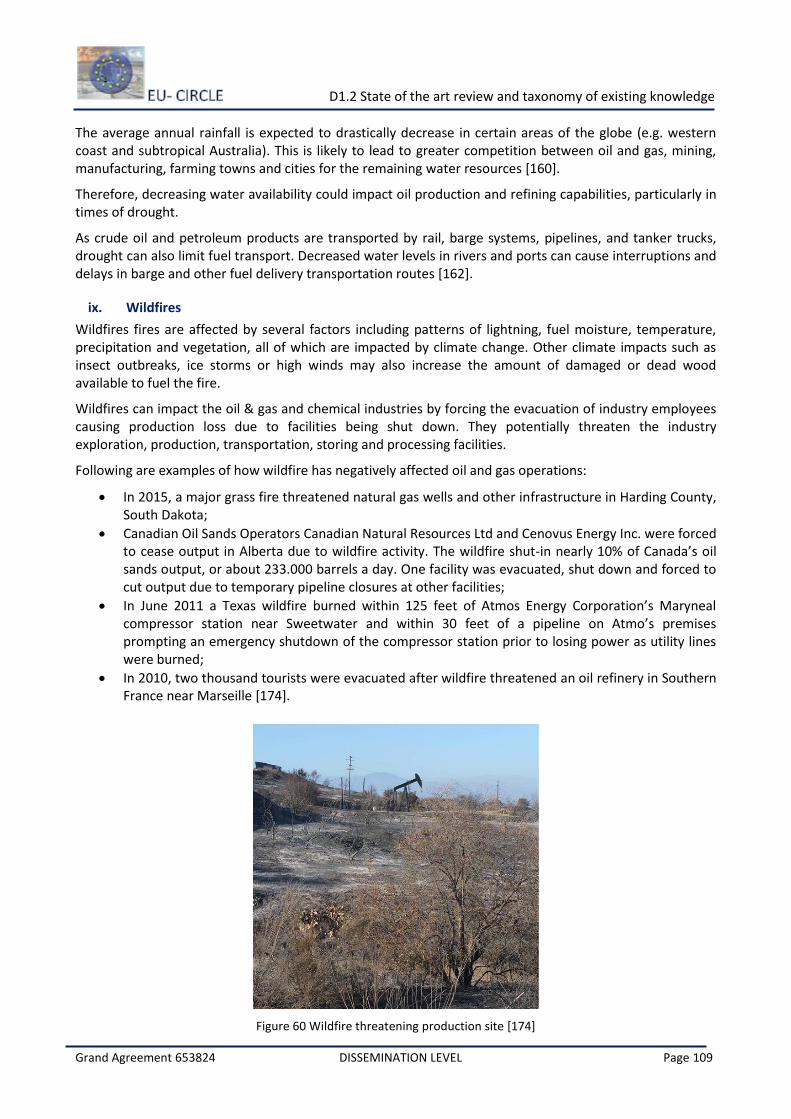
D1.2 State of the art review and taxonomy of existing knowledge
Grand Agreement 653824 DISSEMINATION LEVEL Page 109
The average annual rainfall is expected to drastically decrease in certain areas of the globe (e.g. western coast and subtropical Australia). This is likely to lead to greater competition between oil and gas, mining, manufacturing, farming towns and cities for the remaining water resources [160].
Therefore, decreasing water availability could impact oil production and refining capabilities, particularly in times of drought.
As crude oil and petroleum products are transported by rail, barge systems, pipelines, and tanker trucks, drought can also limit fuel transport. Decreased water levels in rivers and ports can cause interruptions and delays in barge and other fuel delivery transportation routes [162].
ix. Wildfires
Wildfires fires are affected by several factors including patterns of lightning, fuel moisture, temperature, precipitation and vegetation, all of which are impacted by climate change. Other climate impacts such as insect outbreaks, ice storms or high winds may also increase the amount of damaged or dead wood available to fuel the fire.
Wildfires can impact the oil & gas and chemical industries by forcing the evacuation of industry employees causing production loss due to facilities being shut down. They potentially threaten the industry exploration, production, transportation, storing and processing facilities.
Following are examples of how wildfire has negatively affected oil and gas operations:
In 2015, a major grass fire threatened natural gas wells and other infrastructure in Harding County, South Dakota;
Canadian Oil Sands Operators Canadian Natural Resources Ltd and Cenovus Energy Inc. were forced to cease output in Alberta due to wildfire activity. The wildfire shut-in nearly 10% of Canada’s oil sands output, or about 233.000 barrels a day. One facility was evacuated, shut down and forced to cut output due to temporary pipeline closures at other facilities;
In June 2011 a Texas wildfire burned within 125 feet of Atmos Energy Corporation’s Maryneal compressor station near Sweetwater and within 30 feet of a pipeline on Atmo’s premises prompting an emergency shutdown of the compressor station prior to losing power as utility lines were burned;
In 2010, two thousand tourists were evacuated after wildfire threatened an oil refinery in Southern France near Marseille [174].
Figure 60 Wildfire threatening production site [174]
D1.2 State of the art review and taxonomy of existing knowledge
Grand Agreement 653824 DISSEMINATION LEVEL Page 110
B. ANNEX- Chemical Industry
i. Temperature
High temperatures and periods of intense heat cause many wildfires, which can trigger explosions, destruction of chemical facilities and release of Hazmats. A heat wave can also give rise to other phenomena such as: solvent evaporation within warehouses containing sensitive substances; the accumulation of inflammable vapours in confined spaces (storage sites); and the uncontrolled heating of stored materials; wastes or even refrigeration systems which could trigger a Natech event [175] [176].
ii. Extreme precipitation
The increasing risk of heavy rainfall is another element to take into account while assessing the impact of natural event in the chemical industry. For instance, in January 2000, a dam broke at the Aurul Mine Tailings Recovery Plant near Baia Mare in north-western Romania, (due to liquid precipitation fallen on a thick snow layer). Approximately 100.000 m³ of a high cyanide and heavy metal containing wastewater were discharged into the receiving creeks, and from there onwards into the river network of the Danube Basin [177].
iii. Floods
Floods may cause severe damages to chemical and process facilities, triggering major accidents (fires, explosions, and toxic release) [69] [178]. Research on floods and their associated impacts on chemical facilities have identified the following impacts:
floods have the potential to cause flotation and the displacement of storage tanks, thereby tearing pipe connections resulting in hazmat releases
collisions with debris transported by floodwaters may cause tanks to breach resulting in hazmat releases
Flooding of electrical equipment may cause short-circuiting and power outages, which could result in the failure of cooling units, pumps and electrically operated safety systems
flooding of internal plant drainage systems containing waste oil, the oil may be lifted by the floodwaters and may spark fires and explosions upon contact with ignition sources (e.g. hot refinery parts)
River floods, storm surge or flash floods can impact storage tank systems by causing them to float, collapse or move laterally, thereby leading to a direct release of potentially hazardous liquids or vapours from the failed tank or indirectly through severed pipe connections [69]
Atmospheric storage tanks, pressurized tanks and pipelines were the units most frequently damaged by past flood events [178].
Many of the on-site substances are flammable liquids or liquefied gases that may also be explosive, whilst others may be highly toxic and eco-toxic. Therefore, the risk of ancillary on-site and off-site pollution, fires and explosions from leaks is significant. The release of (eco-)toxic substances is particularly problematic, as they may be carried away by floodwaters contaminating larger areas. Another consideration is the potential incompatibility of substances stored within a site, which might lead to undesirable reactions upon accidental mixing and possibly toxic by-products. In the presence of an ignition source the released flammable vapours can catch fire. The sheer amount of materials may make a spill, a fire or an unforeseen chemical reaction difficult to contain or may lead to the escalation of an initially small event. Under these circumstances there is the risk of spreading of an event to adjoining buildings or vessels and tanks. Chemical installations are frequently sited next to oil refineries which increases the risk of a so-called domino effect where the primary accident sets off one or more secondary events [178]. A representative example is the series of storms occurred in December 1999 in France. In particular, the concurrence of high tide and violent winds caused the flooding of many industrial establishments, especially in the Gironde estuary, in the north-west of Bordeaux [179].
D1.2 State of the art review and taxonomy of existing knowledge
Grand Agreement 653824 DISSEMINATION LEVEL Page 111
Some examples of the observed damages on the industrial facilities were as follows:
Flood in alcohol production factory: o Tanks of H2SO4, HCl and NaOH, located in basement, were spilled; o Loss of processing systems and paper documents; o No electricity on the industrial site for 3 days.
Flood in a manufacturing plant of fertilizers: o The cuts of electricity threatened the cooling system of the cryogenic storage of ammonia; o The electricity supply of the plant was stopped for 7 days, the plant functioned for this
period thanks to its own cogeneration; o Damaged loading arm, an empty wagon ran off the line, unusable railway.
Flood in a hydrocarbon deposit: o Damage to electric installations (electrical equipment boxes, pumps, gas detectors); o Basin of storm was submerged; o Drainage pipes were saturated and blocked; o The deposit's exploitation was suspended for 7 days [179].
iv. Landslides
Landslides have in the past damaged chemical and oil and gas infrastructures and cut off transportation networks. These events can disrupt or shut down operations, cause loss of containment and result in increased costs for maintenance, rebuilding and pollution remediation.
One of the largest impacts of landslides occurs when the slide severs an oil or gas pipeline, allowing a release into the environment. A clear example of this occurred in Ecuador in May 2013, when the Trans-Ecuador pipeline ruptured in a landslide.
On the morning of April 18, 1991, a rockfall occurred on the west side of the Matter Valley near the village of Randa, in Switzerland [180]. The mass of approximately 20 x 106 m3, mostly of gneiss, failed without clear warning signals, except for an increase in rockfall activity that began just before the event. It blocked the valley floor and the only road to Zermatt. The Vispa River was dammed by the rock mass, and the possible rupture of this dam threatened the dwellings and the chemical industry facilities downstream. The interest of this first Randa event is in the fact that the failure did not occur in the moment, but was obviously a continuing rockfall lasting some hours. The rock masses did not travel far, but formed a steep cone at the foot of the slope. They destroyed only some stables and holiday chalets without harming any people. The second failure, on May 5, enlarged the steep cone and increased the problems in the valley. The lower parts of the village of Randa were flooded by the lake dammed by the rockslide, before an artificial channel through the rock debris restored the runoff of the Vispa River. To avoid future problems caused by potential further rockfalls, a 3.6 km bypass tunnel was built. The Randa rockfall scar involves two geological formations: massive orthogneisses at the bottom and schistose paragneisses with amphibolites on the top. It is assumed that watter entered into the upper parts of the series, which show deep stress-relief joints parallel to the surface due to stress-relaxation movements on the steep valley slope. The loss of former pemafrost in the adjacent higher slopes might have caused the breakdown. The loss of permafrost enabled the infiltration of surface water, and consequently raised the joint water pressures and caused the erosion of cohesive joint fills.
v. Sea level rise
Rising sea levels and storm surges from more frequent extreme weather events increase the vulnerability to flooding and destruction of chemical infrastructure in low-lying areas. Chemical storage facilities and warehouses sited in low-lying areas near ports along the seafront, rivers, and other waterways are also at risk [181].
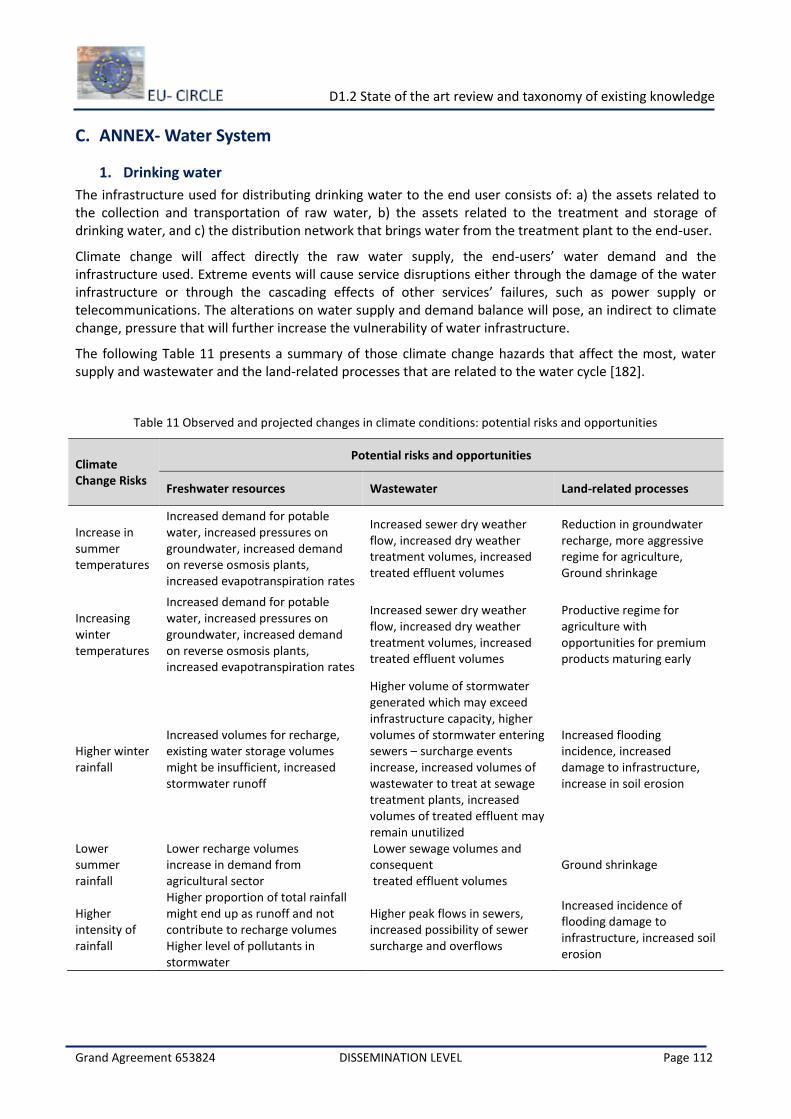
D1.2 State of the art review and taxonomy of existing knowledge
Grand Agreement 653824 DISSEMINATION LEVEL Page 112
C. ANNEX- Water System
1. Drinking water
The infrastructure used for distributing drinking water to the end user consists of: a) the assets related to the collection and transportation of raw water, b) the assets related to the treatment and storage of drinking water, and c) the distribution network that brings water from the treatment plant to the end-user.
Climate change will affect directly the raw water supply, the end-users’ water demand and the infrastructure used. Extreme events will cause service disruptions either through the damage of the water infrastructure or through the cascading effects of other services’ failures, such as power supply or telecommunications. The alterations on water supply and demand balance will pose, an indirect to climate change, pressure that will further increase the vulnerability of water infrastructure.
The following Table 11 presents a summary of those climate change hazards that affect the most, water supply and wastewater and the land-related processes that are related to the water cycle [182].
Table 11 Observed and projected changes in climate conditions: potential risks and opportunities
Climate Change Risks
Potential risks and opportunities
Freshwater resources Wastewater Land-related processes
Increase in summer temperatures
Increased demand for potable water, increased pressures on groundwater, increased demand on reverse osmosis plants, increased evapotranspiration rates
Increased sewer dry weather flow, increased dry weather treatment volumes, increased treated effluent volumes
Reduction in groundwater recharge, more aggressive regime for agriculture, Ground shrinkage
Increasing winter temperatures
Increased demand for potable water, increased pressures on groundwater, increased demand on reverse osmosis plants, increased evapotranspiration rates
Increased sewer dry weather flow, increased dry weather treatment volumes, increased treated effluent volumes
Productive regime for agriculture with opportunities for premium products maturing early
Higher winter rainfall
Increased volumes for recharge, existing water storage volumes might be insufficient, increased stormwater runoff
Higher volume of stormwater generated which may exceed infrastructure capacity, higher volumes of stormwater entering sewers – surcharge events increase, increased volumes of wastewater to treat at sewage treatment plants, increased volumes of treated effluent may remain unutilized
Increased flooding incidence, increased damage to infrastructure, increase in soil erosion
Lower summer rainfall
Lower recharge volumes increase in demand from agricultural sector
Lower sewage volumes and consequent treated effluent volumes
Ground shrinkage
Higher intensity of rainfall
Higher proportion of total rainfall might end up as runoff and not contribute to recharge volumes Higher level of pollutants in stormwater
Higher peak flows in sewers, increased possibility of sewer surcharge and overflows
Increased incidence of flooding damage to infrastructure, increased soil erosion
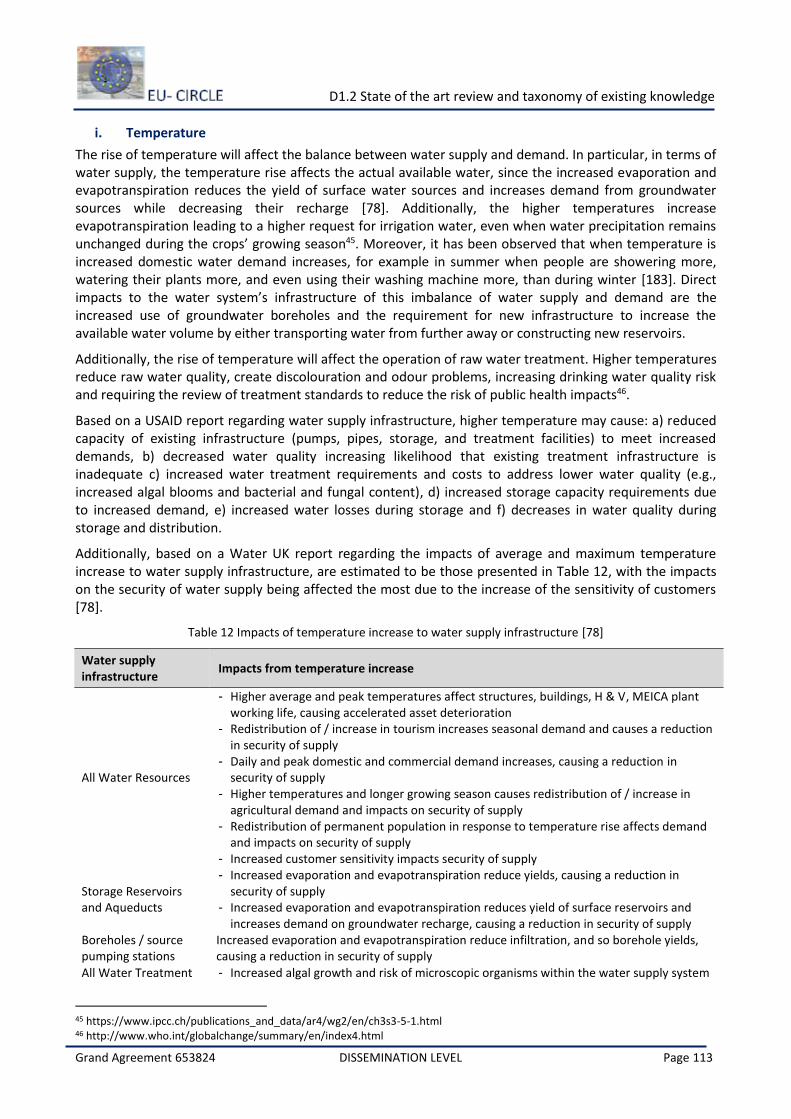
D1.2 State of the art review and taxonomy of existing knowledge
Grand Agreement 653824 DISSEMINATION LEVEL Page 113
i. Temperature
The rise of temperature will affect the balance between water supply and demand. In particular, in terms of water supply, the temperature rise affects the actual available water, since the increased evaporation and evapotranspiration reduces the yield of surface water sources and increases demand from groundwater sources while decreasing their recharge [78]. Additionally, the higher temperatures increase evapotranspiration leading to a higher request for irrigation water, even when water precipitation remains unchanged during the crops’ growing season45. Moreover, it has been observed that when temperature is increased domestic water demand increases, for example in summer when people are showering more, watering their plants more, and even using their washing machine more, than during winter [183]. Direct impacts to the water system’s infrastructure of this imbalance of water supply and demand are the increased use of groundwater boreholes and the requirement for new infrastructure to increase the available water volume by either transporting water from further away or constructing new reservoirs.
Additionally, the rise of temperature will affect the operation of raw water treatment. Higher temperatures reduce raw water quality, create discolouration and odour problems, increasing drinking water quality risk and requiring the review of treatment standards to reduce the risk of public health impacts46.
Based on a USAID report regarding water supply infrastructure, higher temperature may cause: a) reduced capacity of existing infrastructure (pumps, pipes, storage, and treatment facilities) to meet increased demands, b) decreased water quality increasing likelihood that existing treatment infrastructure is inadequate c) increased water treatment requirements and costs to address lower water quality (e.g., increased algal blooms and bacterial and fungal content), d) increased storage capacity requirements due to increased demand, e) increased water losses during storage and f) decreases in water quality during storage and distribution.
Additionally, based on a Water UK report regarding the impacts of average and maximum temperature increase to water supply infrastructure, are estimated to be those presented in Table 12, with the impacts on the security of water supply being affected the most due to the increase of the sensitivity of customers [78].
Table 12 Impacts of temperature increase to water supply infrastructure [78]
Water supply infrastructure
Impacts from temperature increase
All Water Resources
- Higher average and peak temperatures affect structures, buildings, H & V, MEICA plant working life, causing accelerated asset deterioration
- Redistribution of / increase in tourism increases seasonal demand and causes a reduction in security of supply
- Daily and peak domestic and commercial demand increases, causing a reduction in security of supply
- Higher temperatures and longer growing season causes redistribution of / increase in agricultural demand and impacts on security of supply
- Redistribution of permanent population in response to temperature rise affects demand and impacts on security of supply
- Increased customer sensitivity impacts security of supply
Storage Reservoirs and Aqueducts
- Increased evaporation and evapotranspiration reduce yields, causing a reduction in security of supply
- Increased evaporation and evapotranspiration reduces yield of surface reservoirs and increases demand on groundwater recharge, causing a reduction in security of supply
Boreholes / source pumping stations
Increased evaporation and evapotranspiration reduce infiltration, and so borehole yields, causing a reduction in security of supply
All Water Treatment - Increased algal growth and risk of microscopic organisms within the water supply system
45 https://www.ipcc.ch/publications_and_data/ar4/wg2/en/ch3s3-5-1.html 46 http://www.who.int/globalchange/summary/en/index4.html
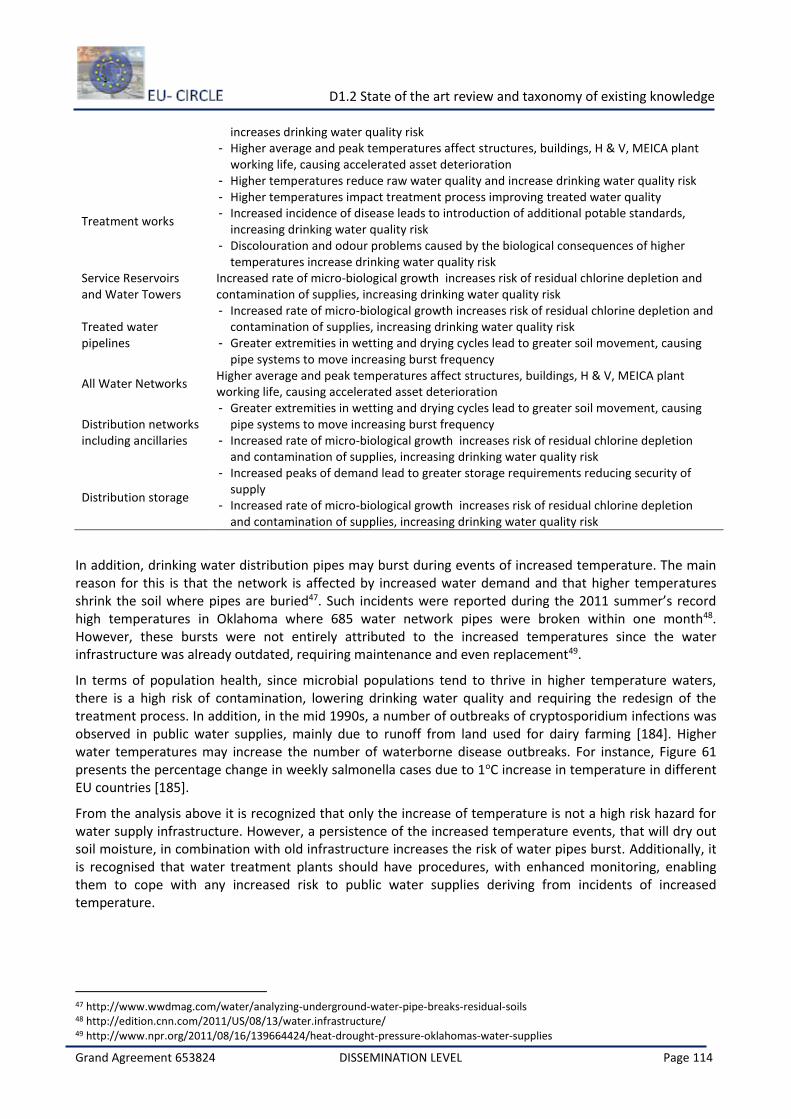
D1.2 State of the art review and taxonomy of existing knowledge
Grand Agreement 653824 DISSEMINATION LEVEL Page 114
increases drinking water quality risk - Higher average and peak temperatures affect structures, buildings, H & V, MEICA plant
working life, causing accelerated asset deterioration
Treatment works
- Higher temperatures reduce raw water quality and increase drinking water quality risk - Higher temperatures impact treatment process improving treated water quality - Increased incidence of disease leads to introduction of additional potable standards,
increasing drinking water quality risk - Discolouration and odour problems caused by the biological consequences of higher
temperatures increase drinking water quality risk Service Reservoirs and Water Towers
Increased rate of micro-biological growth increases risk of residual chlorine depletion and contamination of supplies, increasing drinking water quality risk
Treated water pipelines
- Increased rate of micro-biological growth increases risk of residual chlorine depletion and contamination of supplies, increasing drinking water quality risk
- Greater extremities in wetting and drying cycles lead to greater soil movement, causing pipe systems to move increasing burst frequency
All Water Networks Higher average and peak temperatures affect structures, buildings, H & V, MEICA plant working life, causing accelerated asset deterioration
Distribution networks including ancillaries
- Greater extremities in wetting and drying cycles lead to greater soil movement, causing pipe systems to move increasing burst frequency
- Increased rate of micro-biological growth increases risk of residual chlorine depletion and contamination of supplies, increasing drinking water quality risk
Distribution storage
- Increased peaks of demand lead to greater storage requirements reducing security of supply
- Increased rate of micro-biological growth increases risk of residual chlorine depletion and contamination of supplies, increasing drinking water quality risk
In addition, drinking water distribution pipes may burst during events of increased temperature. The main reason for this is that the network is affected by increased water demand and that higher temperatures shrink the soil where pipes are buried47. Such incidents were reported during the 2011 summer’s record high temperatures in Oklahoma where 685 water network pipes were broken within one month48. However, these bursts were not entirely attributed to the increased temperatures since the water infrastructure was already outdated, requiring maintenance and even replacement49.
In terms of population health, since microbial populations tend to thrive in higher temperature waters, there is a high risk of contamination, lowering drinking water quality and requiring the redesign of the treatment process. In addition, in the mid 1990s, a number of outbreaks of cryptosporidium infections was observed in public water supplies, mainly due to runoff from land used for dairy farming [184]. Higher water temperatures may increase the number of waterborne disease outbreaks. For instance, Figure 61 presents the percentage change in weekly salmonella cases due to 1oC increase in temperature in different EU countries [185].
From the analysis above it is recognized that only the increase of temperature is not a high risk hazard for water supply infrastructure. However, a persistence of the increased temperature events, that will dry out soil moisture, in combination with old infrastructure increases the risk of water pipes burst. Additionally, it is recognised that water treatment plants should have procedures, with enhanced monitoring, enabling them to cope with any increased risk to public water supplies deriving from incidents of increased temperature.
47 http://www.wwdmag.com/water/analyzing-underground-water-pipe-breaks-residual-soils 48 http://edition.cnn.com/2011/US/08/13/water.infrastructure/ 49 http://www.npr.org/2011/08/16/139664424/heat-drought-pressure-oklahomas-water-supplies
D1.2 State of the art review and taxonomy of existing knowledge
Grand Agreement 653824 DISSEMINATION LEVEL Page 115
Figure 61 Percentage change in weekly salmonella cases due to 1°C increase in temperature
ii. Extreme precipitation
Events of extreme precipitation may hinder the safe operation of water assets that are designed to withstand specific probable maximum precipitations such as dams. Every dam is designed based on its specific geographical position, upstream land features and climatological conditions. For that reason, in the designing process the annual exceedance probability (AEP), of different precipitation depths that the basin receives, are estimated in order to select the theoretically greatest depth of precipitation that the basin may receive and design the dam to be able to retain at least this amount of probable maximum precipitation [186]. However, even a low probability of a 1% chance of a specific rainfall event to occur every year is equal to a 26% chance of occurring in a 30 years period [187]. Therefore, dams need to be maintained and their design criteria re-evaluated to assess their risk of breeching. It is necessary to take into account the dam’s age, since as dams get older, the deterioration of the dam’s infrastructure increases with metal pipes rusting and losing their structural integrity (approximately after 50 years of life) and the upstream land’s characteristics changing affecting the volume of runoff received by the dam [187]. Nevertheless, a dam usually fails because it was designed poorly or because it had foundation problems, thus maintained poorly, and less commonly because the received water was in excess (Figure 62).
Figure 62 Causes of dam failure [188]
D1.2 State of the art review and taxonomy of existing knowledge
Grand Agreement 653824 DISSEMINATION LEVEL Page 116
In UK, a Dam Break Hazard Analysis is drafted providing information on the consequences of a possible dam break and is used in both emergency planning and risk analysis (downstream risks to population, property and environment) [189]. In addition, in the US, a Hazard Potential Classification is undertaken to rank a dam based on the damage its malfunction may cause. Highest hazard categories correspond to dams that their breach are a potential threat to human lives and low hazard categories are those that the failure affects mainly the dam owner and operator [189].
In the UK, there have been 14 dam failures that resulted in the deaths of 465 people in the last 200 years, and 10 dam failures that did not cause loss of life between 1960 and 1971. Additionally, in England and Wales only, exist over 2.000 reservoirs, of which 956 are ranked as high hazard posing a risk to human life [190].
iii. Floods
There are different types of floods that are characterised based on their main cause, such as: pluvial and flash floods for rain-related floods; fluvial for river-related floods; and coastal or storm-surge for sea-related floods50. Floods are a threat to infrastructure mainly because of the water depth and velocity damaging the structures of built assets [191]. Additionally, some assets of water supply infrastructure are in particular vulnerable to flood, especially those that store and treat surface water, such as reservoirs and treatment plants.
Additionally, based on a Water UK report regarding the impacts of flooding events to water supply infrastructure, these are estimated to be those presented in Error! Reference source not found., with the increased frequency of power losses and the direct flooding of the assets being the most significant impacts of flood causing failures in the water supply service [78].
Table 13 Impacts of floods to water supply infrastructure
Water supply infrastructure
Impacts of floods
All Water Resources
- Direct asset flooding causes service failure and asset loss - Increased storm frequency and power supply flooding increases frequency of power loss,
causing service failure - Flooding in certain areas causes redistribution of permanent population (eg away from
flood plains) and tourism, which affects demand and impacts on security of supply - The threat of treatment works being flooded (with subsequent service loss) increases
customer expectations for visible hard engineering adaptation solutions
All Water Treatment - Direct asset flooding causes service failure and asset loss - Increased storm frequency increases frequency of power loss, causing service failure
All Water Networks Direct asset flooding causes service failure and asset loss Increased storm frequency and power supply flooding increases frequency of power loss, causing service failure
Raw water pipelines Flood water infiltration into pipelines increases drinking water quality risk
Boreholes / source pumping stations
More intense rainfall events compact upper soil layers, increasing run-off, reducing recharge of aquifers and reducing security of supply
Intake Pumping stations
Greater volumes of storm water cause increased pumping where pumps are part of the infrastructure, leading to increased asset usage and accelerated asset deterioration
Storage Reservoirs and Aqueducts
- More intense rainfall events & changes to soil conditions lead to the slippage of soil dams, causing service failure, customer flooding and asset loss
- More intense rainfall events exceed capacity of spillways to deal with increased storm intensity, causing service failure, customer flooding and asset loss
- Increased soil erosion causes the siltation of dams, causing accelerated asset deterioration and asset loss
50 http://www.nssl.noaa.gov/education/svrwx101/floods/types/
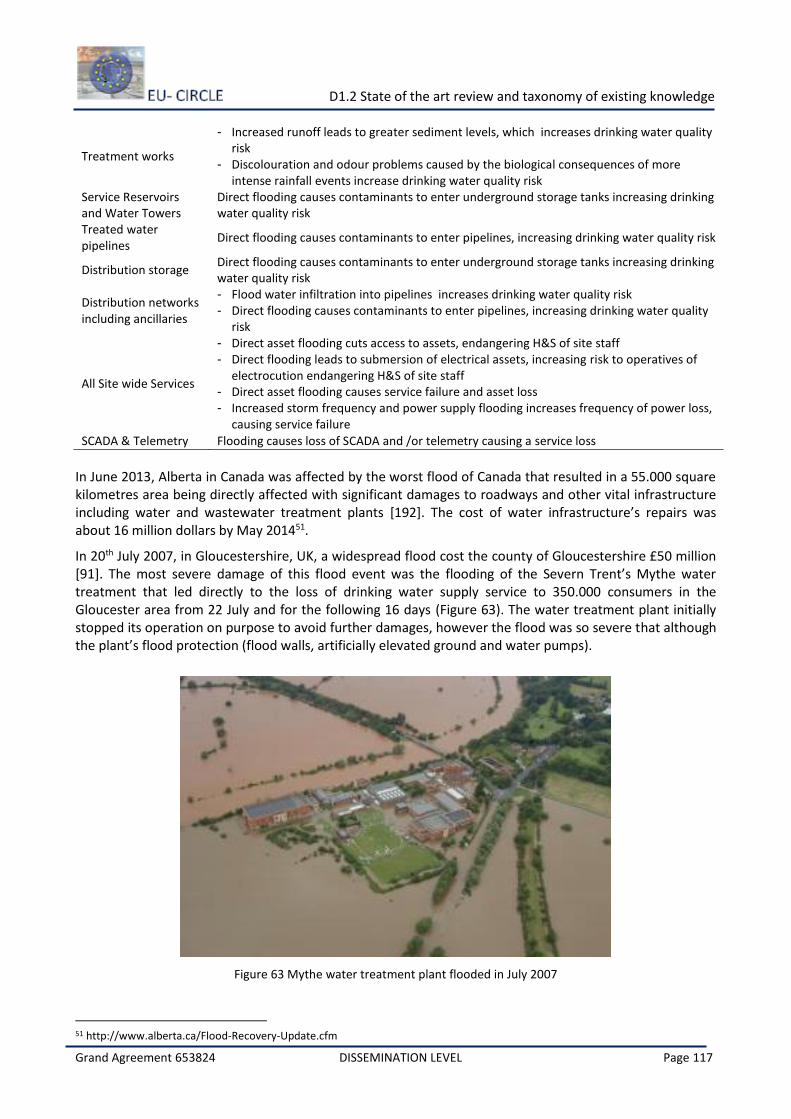
D1.2 State of the art review and taxonomy of existing knowledge
Grand Agreement 653824 DISSEMINATION LEVEL Page 117
Treatment works
- Increased runoff leads to greater sediment levels, which increases drinking water quality risk
- Discolouration and odour problems caused by the biological consequences of more intense rainfall events increase drinking water quality risk
Service Reservoirs and Water Towers
Direct flooding causes contaminants to enter underground storage tanks increasing drinking water quality risk
Treated water pipelines
Direct flooding causes contaminants to enter pipelines, increasing drinking water quality risk
Distribution storage Direct flooding causes contaminants to enter underground storage tanks increasing drinking water quality risk
Distribution networks including ancillaries
- Flood water infiltration into pipelines increases drinking water quality risk - Direct flooding causes contaminants to enter pipelines, increasing drinking water quality
risk
All Site wide Services
- Direct asset flooding cuts access to assets, endangering H&S of site staff - Direct flooding leads to submersion of electrical assets, increasing risk to operatives of
electrocution endangering H&S of site staff - Direct asset flooding causes service failure and asset loss - Increased storm frequency and power supply flooding increases frequency of power loss,
causing service failure
SCADA & Telemetry Flooding causes loss of SCADA and /or telemetry causing a service loss
In June 2013, Alberta in Canada was affected by the worst flood of Canada that resulted in a 55.000 square kilometres area being directly affected with significant damages to roadways and other vital infrastructure including water and wastewater treatment plants [192]. The cost of water infrastructure’s repairs was about 16 million dollars by May 201451.
In 20th July 2007, in Gloucestershire, UK, a widespread flood cost the county of Gloucestershire £50 million [91]. The most severe damage of this flood event was the flooding of the Severn Trent’s Mythe water treatment that led directly to the loss of drinking water supply service to 350.000 consumers in the Gloucester area from 22 July and for the following 16 days (Figure 63). The water treatment plant initially stopped its operation on purpose to avoid further damages, however the flood was so severe that although the plant’s flood protection (flood walls, artificially elevated ground and water pumps).
Figure 63 Mythe water treatment plant flooded in July 2007
51 http://www.alberta.ca/Flood-Recovery-Update.cfm
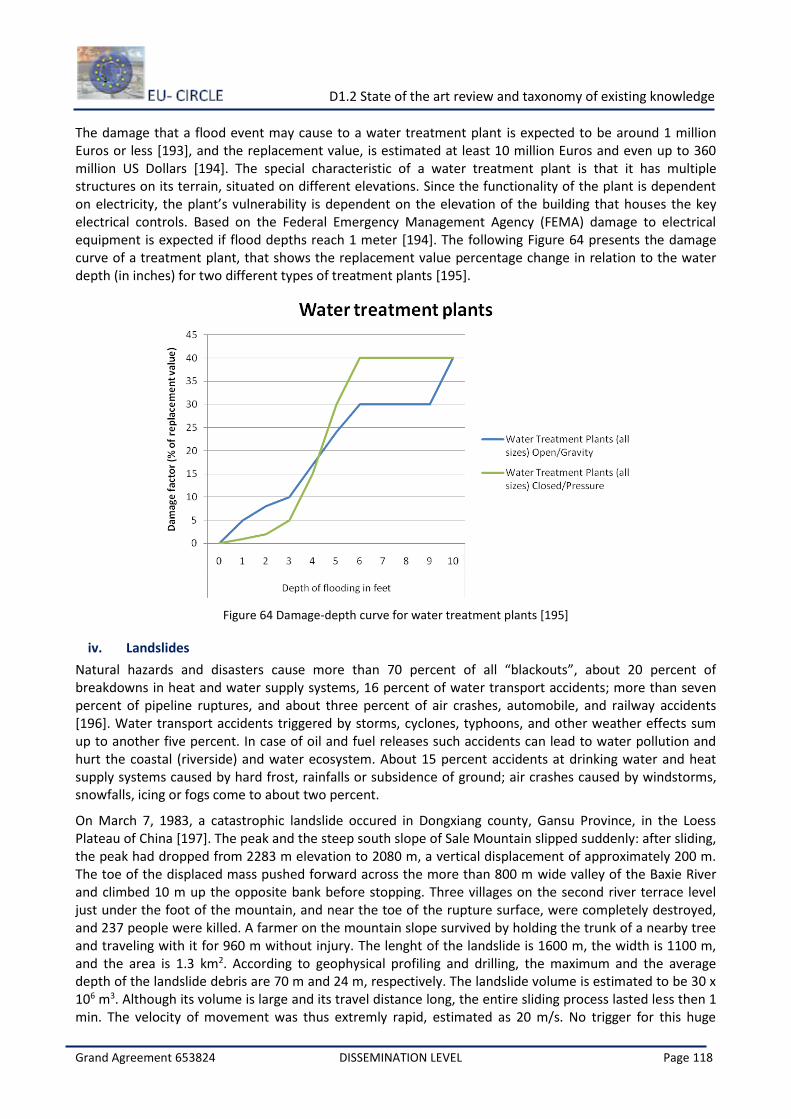
D1.2 State of the art review and taxonomy of existing knowledge
Grand Agreement 653824 DISSEMINATION LEVEL Page 118
The damage that a flood event may cause to a water treatment plant is expected to be around 1 million Euros or less [193], and the replacement value, is estimated at least 10 million Euros and even up to 360 million US Dollars [194]. The special characteristic of a water treatment plant is that it has multiple structures on its terrain, situated on different elevations. Since the functionality of the plant is dependent on electricity, the plant’s vulnerability is dependent on the elevation of the building that houses the key electrical controls. Based on the Federal Emergency Management Agency (FEMA) damage to electrical equipment is expected if flood depths reach 1 meter [194]. The following Figure 64 presents the damage curve of a treatment plant, that shows the replacement value percentage change in relation to the water depth (in inches) for two different types of treatment plants [195].
Figure 64 Damage-depth curve for water treatment plants [195]
iv. Landslides
Natural hazards and disasters cause more than 70 percent of all “blackouts”, about 20 percent of breakdowns in heat and water supply systems, 16 percent of water transport accidents; more than seven percent of pipeline ruptures, and about three percent of air crashes, automobile, and railway accidents [196]. Water transport accidents triggered by storms, cyclones, typhoons, and other weather effects sum up to another five percent. In case of oil and fuel releases such accidents can lead to water pollution and hurt the coastal (riverside) and water ecosystem. About 15 percent accidents at drinking water and heat supply systems caused by hard frost, rainfalls or subsidence of ground; air crashes caused by windstorms, snowfalls, icing or fogs come to about two percent.
On March 7, 1983, a catastrophic landslide occured in Dongxiang county, Gansu Province, in the Loess Plateau of China [197]. The peak and the steep south slope of Sale Mountain slipped suddenly: after sliding, the peak had dropped from 2283 m elevation to 2080 m, a vertical displacement of approximately 200 m. The toe of the displaced mass pushed forward across the more than 800 m wide valley of the Baxie River and climbed 10 m up the opposite bank before stopping. Three villages on the second river terrace level just under the foot of the mountain, and near the toe of the rupture surface, were completely destroyed, and 237 people were killed. A farmer on the mountain slope survived by holding the trunk of a nearby tree and traveling with it for 960 m without injury. The lenght of the landslide is 1600 m, the width is 1100 m, and the area is 1.3 km2. According to geophysical profiling and drilling, the maximum and the average depth of the landslide debris are 70 m and 24 m, respectively. The landslide volume is estimated to be 30 x 106 m3. Although its volume is large and its travel distance long, the entire sliding process lasted less then 1 min. The velocity of movement was thus extremly rapid, estimated as 20 m/s. No trigger for this huge
D1.2 State of the art review and taxonomy of existing knowledge
Grand Agreement 653824 DISSEMINATION LEVEL Page 119
landslide is evident. The Loess Plateau of China is a semiarid region and spring is a dry season. No rainfall or earthquake was associated with the sudden catastrophe.
On June 18, 1991, after unusually heavy rain, Antofagasta, a coastal city of Chile 1300 km north of Santiago, was hit by several debris flows [148]. The flows and associated flash floods killed 101 people and resulted in another 48 missing. They destroyed 402 houses and damaged more then 2.000. In addition, Antofagasta´s water-supply system, roads, and railway lines were damaged, affecting a total of 21.000 people. Total losses were estimated at $27 million (U.S.).
The debris flows came from a dozen normally dry ravines that drain the western edge of the Cordillera de la Costa. The ravines cut through Antofagasta before reaching the Pacific Ocean. The estimated velocity of the flows along the Quebrada El Jardin (Jardin Creek) was 30 km/h. Erosion caused by the flows affected streets, culverts, and construction along the courses of the ravines. At the same time, debris transported by the flows destroyed many houses. The total mass of detrital material in the flows was estimated at 500.000-700.000 m3.
These debris flows were triggered by precipitation that ranged from 14 to 60 mm in 3 h. Historical records indicate that this was the equivalent of a 100 yr storm. These records also indicate the occurrence of similar flows at least five times since 1940 in this area; however, none of these previous flows caused as much damage to Antofagasta because the city was smaller at that time.
It will be difficult to prevent similar damage in future occurrences of debris flows in Antofagasta and other coastal cities in northern Chile because of their particularly susceptible locations and the practice of constructing low-income housing in ravines in the narrow strip of land between the western edge of the Cordillera de la Costa and the Pacific Ocean. At present, a series of studies is under way to determine proper designs for diversion and retaining structures intended to minimize the effects of future debris flows in Antofagasta and nearby cities. These studies are being complemented by more appropriate land planning and zoning than have been used in the past.
v. Snowfall
Extreme and prolonged cold periods and snowfall affect short term availability of water due to freezing, operation failures due to freezing of pipes, and contraction related mains failures. Additionally, snowfall depth creates operational failures in both service reservoirs and water treatment plants. Finally, the inability of the personnel to reach the water supply infrastructure assets create delays in the maintenance programmes that lead to local failures [182].
vi. Extreme winds
Extreme winds may affect tall structures, such as water towers [83], but may also induce waves that may potentially risk the stability of dams and other water retention structures.
vii. Sea level rise
Rising sea levels may cause both gradual and sudden effects on water supply infrastructure. For example, flooding, as a sudden effect of rising sea levels and storms, can become a problem for water treatment facilities. Additionally, gradually rising sea levels may lead to saltwater intrusion in the groundwater damaging essential raw water resources [198].
The following Error! Reference source not found. presents the impacts of sea level rise to different water supply infrastructure’s assets, as reported by Water UK [78]. Based on this analysis, the most severe impact to the water supply assets from sea level rise is the damage of the assets, networks mainly, and as a consequence the service failure due to the direct asset flooding, storm damage and coastal erosion.
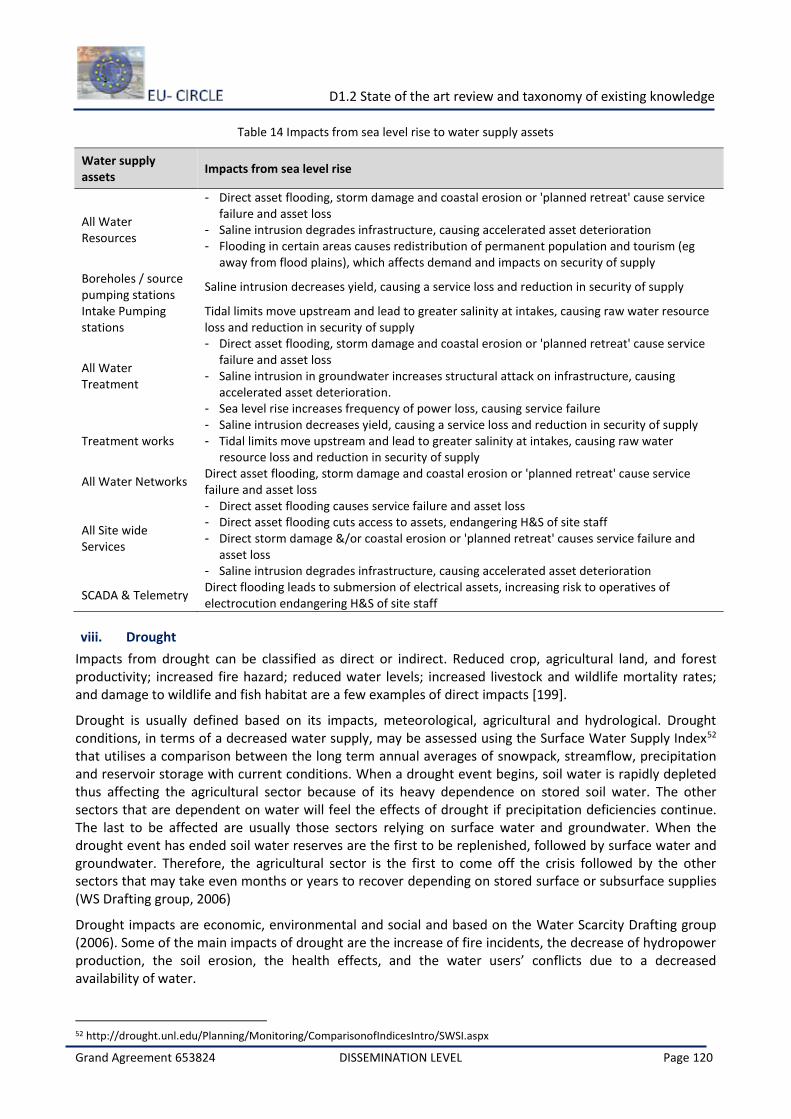
D1.2 State of the art review and taxonomy of existing knowledge
Grand Agreement 653824 DISSEMINATION LEVEL Page 120
Table 14 Impacts from sea level rise to water supply assets
Water supply assets
Impacts from sea level rise
All Water Resources
- Direct asset flooding, storm damage and coastal erosion or 'planned retreat' cause service failure and asset loss
- Saline intrusion degrades infrastructure, causing accelerated asset deterioration - Flooding in certain areas causes redistribution of permanent population and tourism (eg
away from flood plains), which affects demand and impacts on security of supply Boreholes / source pumping stations
Saline intrusion decreases yield, causing a service loss and reduction in security of supply
Intake Pumping stations
Tidal limits move upstream and lead to greater salinity at intakes, causing raw water resource loss and reduction in security of supply
All Water Treatment
- Direct asset flooding, storm damage and coastal erosion or 'planned retreat' cause service failure and asset loss
- Saline intrusion in groundwater increases structural attack on infrastructure, causing accelerated asset deterioration.
- Sea level rise increases frequency of power loss, causing service failure
Treatment works - Saline intrusion decreases yield, causing a service loss and reduction in security of supply - Tidal limits move upstream and lead to greater salinity at intakes, causing raw water
resource loss and reduction in security of supply
All Water Networks Direct asset flooding, storm damage and coastal erosion or 'planned retreat' cause service failure and asset loss
All Site wide Services
- Direct asset flooding causes service failure and asset loss - Direct asset flooding cuts access to assets, endangering H&S of site staff - Direct storm damage &/or coastal erosion or 'planned retreat' causes service failure and
asset loss - Saline intrusion degrades infrastructure, causing accelerated asset deterioration
SCADA & Telemetry Direct flooding leads to submersion of electrical assets, increasing risk to operatives of electrocution endangering H&S of site staff
viii. Drought
Impacts from drought can be classified as direct or indirect. Reduced crop, agricultural land, and forest productivity; increased fire hazard; reduced water levels; increased livestock and wildlife mortality rates; and damage to wildlife and fish habitat are a few examples of direct impacts [199].
Drought is usually defined based on its impacts, meteorological, agricultural and hydrological. Drought conditions, in terms of a decreased water supply, may be assessed using the Surface Water Supply Index52 that utilises a comparison between the long term annual averages of snowpack, streamflow, precipitation and reservoir storage with current conditions. When a drought event begins, soil water is rapidly depleted thus affecting the agricultural sector because of its heavy dependence on stored soil water. The other sectors that are dependent on water will feel the effects of drought if precipitation deficiencies continue. The last to be affected are usually those sectors relying on surface water and groundwater. When the drought event has ended soil water reserves are the first to be replenished, followed by surface water and groundwater. Therefore, the agricultural sector is the first to come off the crisis followed by the other sectors that may take even months or years to recover depending on stored surface or subsurface supplies (WS Drafting group, 2006)
Drought impacts are economic, environmental and social and based on the Water Scarcity Drafting group (2006). Some of the main impacts of drought are the increase of fire incidents, the decrease of hydropower production, the soil erosion, the health effects, and the water users’ conflicts due to a decreased availability of water.
52 http://drought.unl.edu/Planning/Monitoring/ComparisonofIndicesIntro/SWSI.aspx
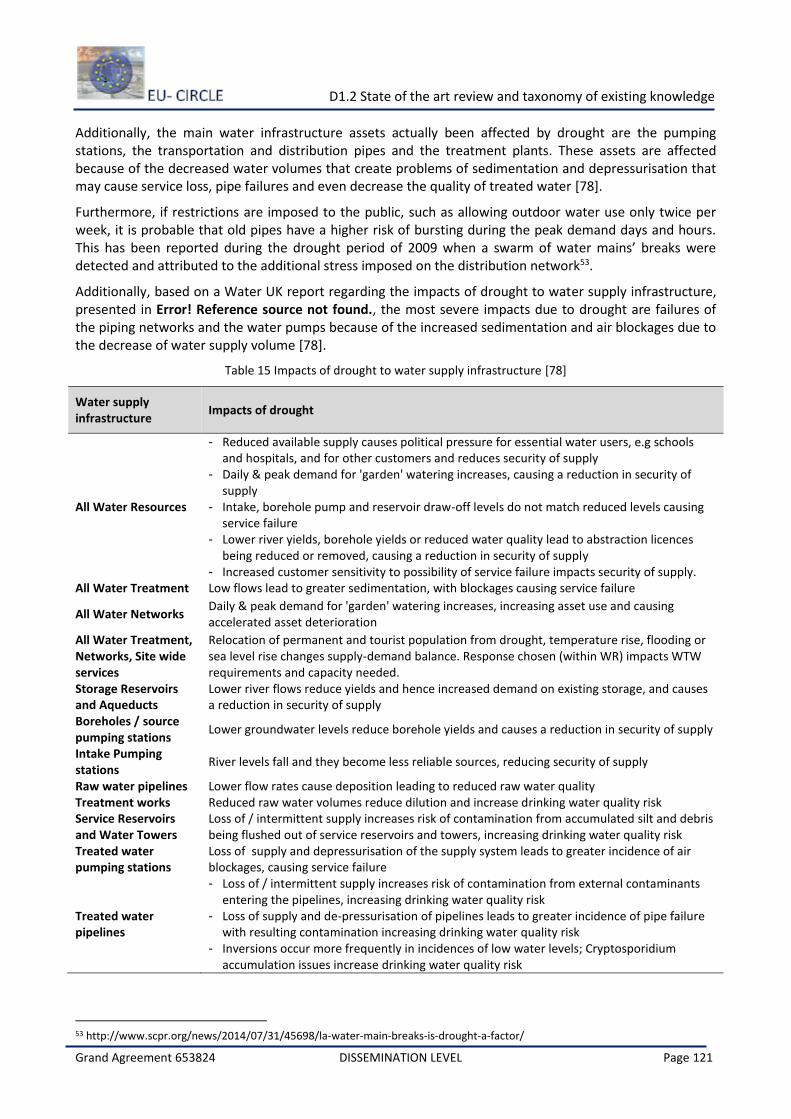
D1.2 State of the art review and taxonomy of existing knowledge
Grand Agreement 653824 DISSEMINATION LEVEL Page 121
Additionally, the main water infrastructure assets actually been affected by drought are the pumping stations, the transportation and distribution pipes and the treatment plants. These assets are affected because of the decreased water volumes that create problems of sedimentation and depressurisation that may cause service loss, pipe failures and even decrease the quality of treated water [78].
Furthermore, if restrictions are imposed to the public, such as allowing outdoor water use only twice per week, it is probable that old pipes have a higher risk of bursting during the peak demand days and hours. This has been reported during the drought period of 2009 when a swarm of water mains’ breaks were detected and attributed to the additional stress imposed on the distribution network53.
Additionally, based on a Water UK report regarding the impacts of drought to water supply infrastructure, presented in Error! Reference source not found., the most severe impacts due to drought are failures of the piping networks and the water pumps because of the increased sedimentation and air blockages due to the decrease of water supply volume [78].
Table 15 Impacts of drought to water supply infrastructure [78]
Water supply infrastructure
Impacts of drought
All Water Resources
- Reduced available supply causes political pressure for essential water users, e.g schools and hospitals, and for other customers and reduces security of supply
- Daily & peak demand for 'garden' watering increases, causing a reduction in security of supply
- Intake, borehole pump and reservoir draw-off levels do not match reduced levels causing service failure
- Lower river yields, borehole yields or reduced water quality lead to abstraction licences being reduced or removed, causing a reduction in security of supply
- Increased customer sensitivity to possibility of service failure impacts security of supply. All Water Treatment Low flows lead to greater sedimentation, with blockages causing service failure
All Water Networks Daily & peak demand for 'garden' watering increases, increasing asset use and causing accelerated asset deterioration
All Water Treatment, Networks, Site wide services
Relocation of permanent and tourist population from drought, temperature rise, flooding or sea level rise changes supply-demand balance. Response chosen (within WR) impacts WTW requirements and capacity needed.
Storage Reservoirs and Aqueducts
Lower river flows reduce yields and hence increased demand on existing storage, and causes a reduction in security of supply
Boreholes / source pumping stations
Lower groundwater levels reduce borehole yields and causes a reduction in security of supply
Intake Pumping stations
River levels fall and they become less reliable sources, reducing security of supply
Raw water pipelines Lower flow rates cause deposition leading to reduced raw water quality Treatment works Reduced raw water volumes reduce dilution and increase drinking water quality risk Service Reservoirs and Water Towers
Loss of / intermittent supply increases risk of contamination from accumulated silt and debris being flushed out of service reservoirs and towers, increasing drinking water quality risk
Treated water pumping stations
Loss of supply and depressurisation of the supply system leads to greater incidence of air blockages, causing service failure
Treated water pipelines
- Loss of / intermittent supply increases risk of contamination from external contaminants entering the pipelines, increasing drinking water quality risk
- Loss of supply and de-pressurisation of pipelines leads to greater incidence of pipe failure with resulting contamination increasing drinking water quality risk
- Inversions occur more frequently in incidences of low water levels; Cryptosporidium accumulation issues increase drinking water quality risk
53 http://www.scpr.org/news/2014/07/31/45698/la-water-main-breaks-is-drought-a-factor/
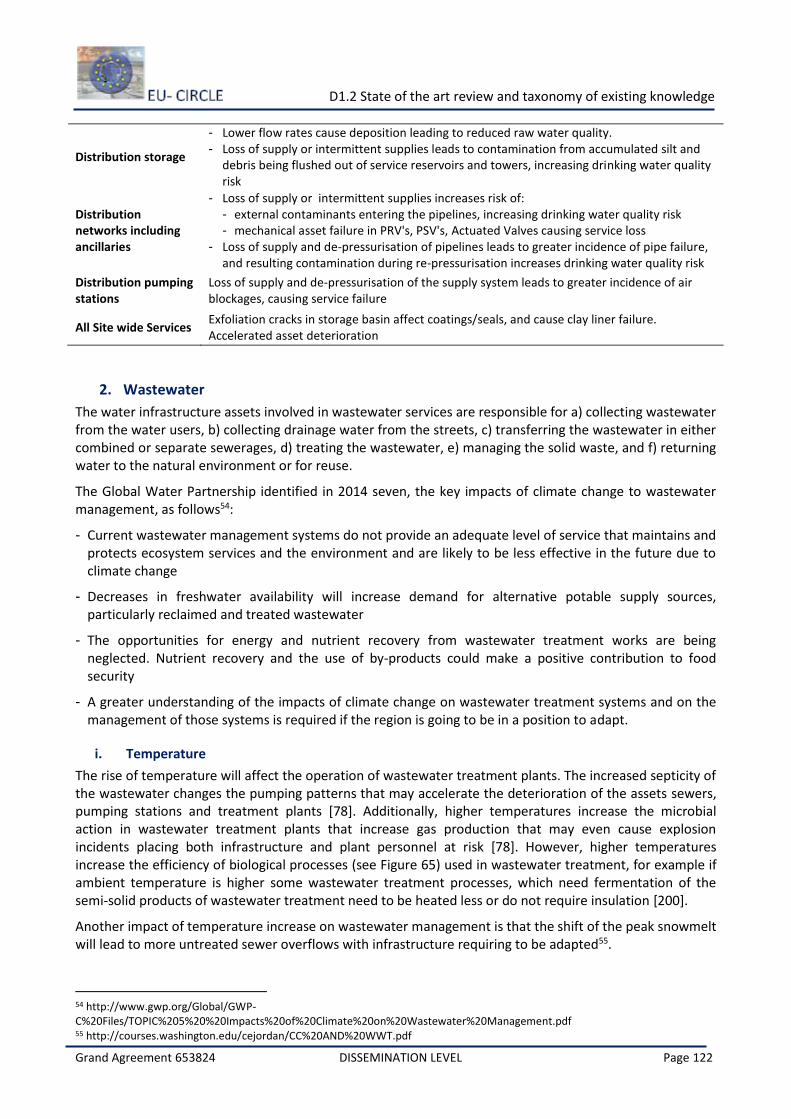
D1.2 State of the art review and taxonomy of existing knowledge
Grand Agreement 653824 DISSEMINATION LEVEL Page 122
Distribution storage
- Lower flow rates cause deposition leading to reduced raw water quality. - Loss of supply or intermittent supplies leads to contamination from accumulated silt and
debris being flushed out of service reservoirs and towers, increasing drinking water quality risk
Distribution networks including ancillaries
- Loss of supply or intermittent supplies increases risk of: - external contaminants entering the pipelines, increasing drinking water quality risk - mechanical asset failure in PRV's, PSV's, Actuated Valves causing service loss
- Loss of supply and de-pressurisation of pipelines leads to greater incidence of pipe failure, and resulting contamination during re-pressurisation increases drinking water quality risk
Distribution pumping stations
Loss of supply and de-pressurisation of the supply system leads to greater incidence of air blockages, causing service failure
All Site wide Services Exfoliation cracks in storage basin affect coatings/seals, and cause clay liner failure. Accelerated asset deterioration
2. Wastewater
The water infrastructure assets involved in wastewater services are responsible for a) collecting wastewater from the water users, b) collecting drainage water from the streets, c) transferring the wastewater in either combined or separate sewerages, d) treating the wastewater, e) managing the solid waste, and f) returning water to the natural environment or for reuse.
The Global Water Partnership identified in 2014 seven, the key impacts of climate change to wastewater management, as follows54:
- Current wastewater management systems do not provide an adequate level of service that maintains and protects ecosystem services and the environment and are likely to be less effective in the future due to climate change
- Decreases in freshwater availability will increase demand for alternative potable supply sources, particularly reclaimed and treated wastewater
- The opportunities for energy and nutrient recovery from wastewater treatment works are being neglected. Nutrient recovery and the use of by-products could make a positive contribution to food security
- A greater understanding of the impacts of climate change on wastewater treatment systems and on the management of those systems is required if the region is going to be in a position to adapt.
i. Temperature
The rise of temperature will affect the operation of wastewater treatment plants. The increased septicity of the wastewater changes the pumping patterns that may accelerate the deterioration of the assets sewers, pumping stations and treatment plants [78]. Additionally, higher temperatures increase the microbial action in wastewater treatment plants that increase gas production that may even cause explosion incidents placing both infrastructure and plant personnel at risk [78]. However, higher temperatures increase the efficiency of biological processes (see Figure 65) used in wastewater treatment, for example if ambient temperature is higher some wastewater treatment processes, which need fermentation of the semi-solid products of wastewater treatment need to be heated less or do not require insulation [200].
Another impact of temperature increase on wastewater management is that the shift of the peak snowmelt will lead to more untreated sewer overflows with infrastructure requiring to be adapted55.
54 http://www.gwp.org/Global/GWP-C%20Files/TOPIC%205%20%20Impacts%20of%20Climate%20on%20Wastewater%20Management.pdf 55 http://courses.washington.edu/cejordan/CC%20AND%20WWT.pdf
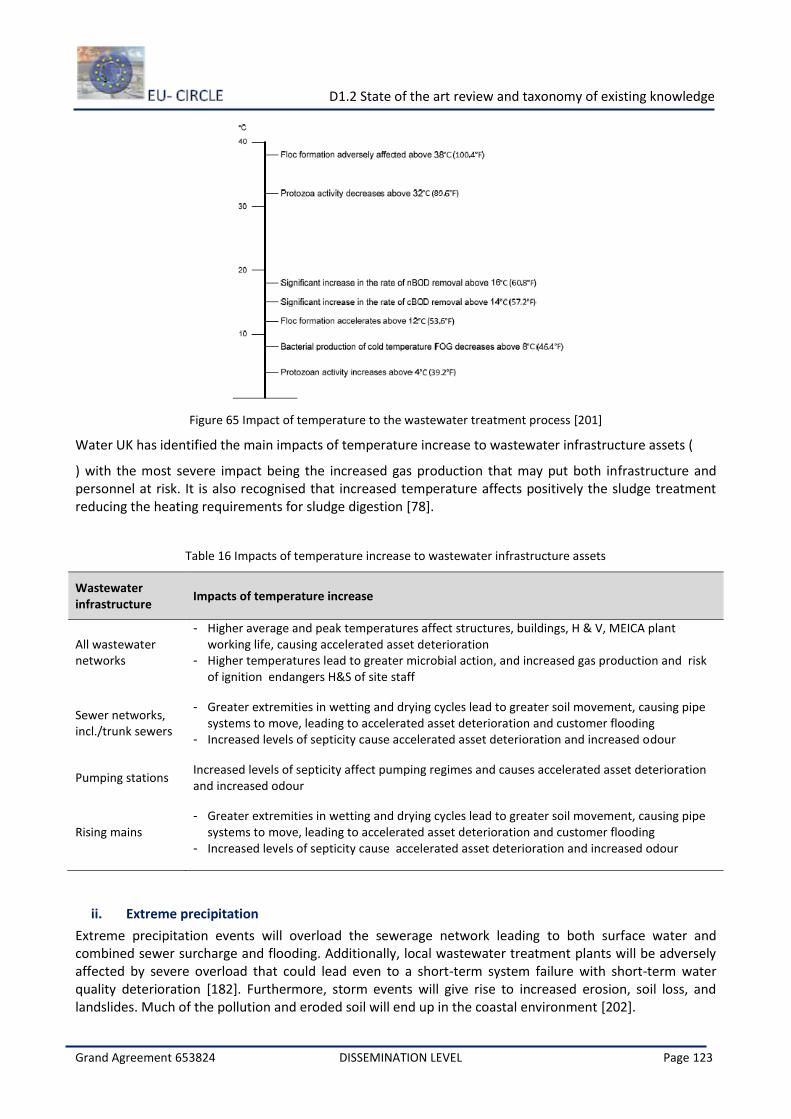
D1.2 State of the art review and taxonomy of existing knowledge
Grand Agreement 653824 DISSEMINATION LEVEL Page 123
Figure 65 Impact of temperature to the wastewater treatment process [201]
Water UK has identified the main impacts of temperature increase to wastewater infrastructure assets (
) with the most severe impact being the increased gas production that may put both infrastructure and personnel at risk. It is also recognised that increased temperature affects positively the sludge treatment reducing the heating requirements for sludge digestion [78].
Table 16 Impacts of temperature increase to wastewater infrastructure assets
Wastewater infrastructure
Impacts of temperature increase
All wastewater networks
- Higher average and peak temperatures affect structures, buildings, H & V, MEICA plant working life, causing accelerated asset deterioration
- Higher temperatures lead to greater microbial action, and increased gas production and risk of ignition endangers H&S of site staff
Sewer networks, incl./trunk sewers
- Greater extremities in wetting and drying cycles lead to greater soil movement, causing pipe systems to move, leading to accelerated asset deterioration and customer flooding
- Increased levels of septicity cause accelerated asset deterioration and increased odour
Pumping stations Increased levels of septicity affect pumping regimes and causes accelerated asset deterioration and increased odour
Rising mains - Greater extremities in wetting and drying cycles lead to greater soil movement, causing pipe
systems to move, leading to accelerated asset deterioration and customer flooding - Increased levels of septicity cause accelerated asset deterioration and increased odour
ii. Extreme precipitation
Extreme precipitation events will overload the sewerage network leading to both surface water and combined sewer surcharge and flooding. Additionally, local wastewater treatment plants will be adversely affected by severe overload that could lead even to a short-term system failure with short-term water quality deterioration [182]. Furthermore, storm events will give rise to increased erosion, soil loss, and landslides. Much of the pollution and eroded soil will end up in the coastal environment [202].
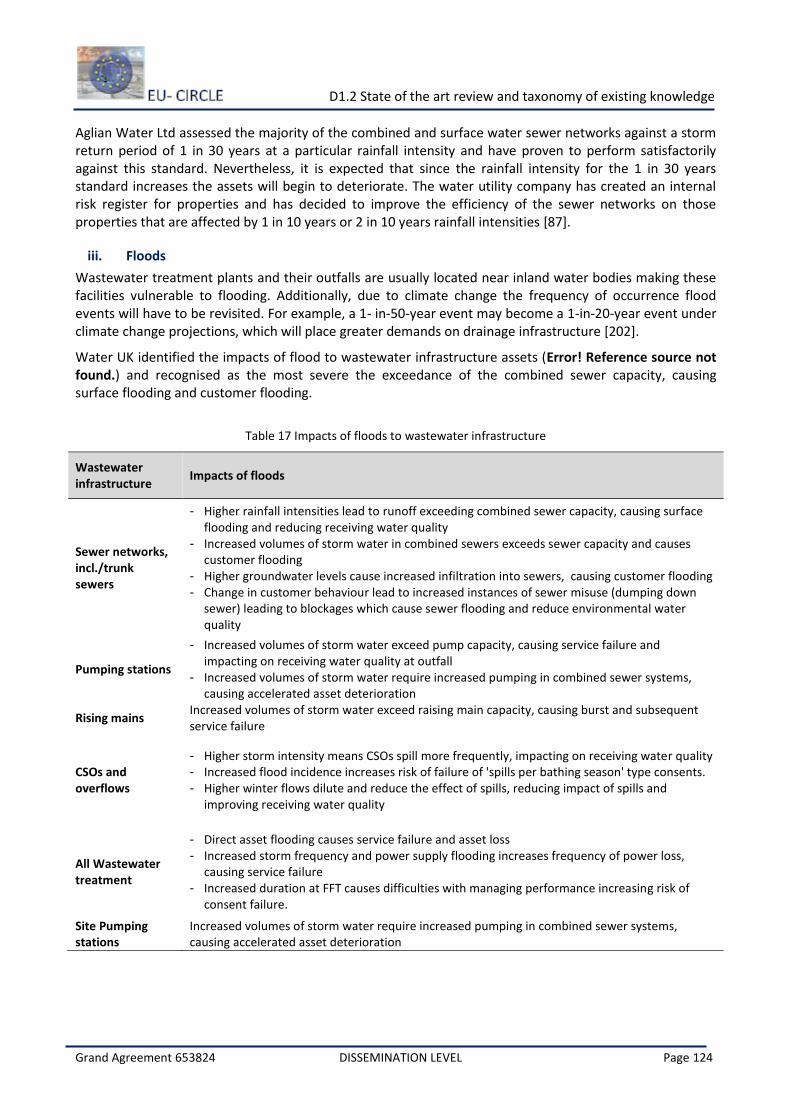
D1.2 State of the art review and taxonomy of existing knowledge
Grand Agreement 653824 DISSEMINATION LEVEL Page 124
Aglian Water Ltd assessed the majority of the combined and surface water sewer networks against a storm return period of 1 in 30 years at a particular rainfall intensity and have proven to perform satisfactorily against this standard. Nevertheless, it is expected that since the rainfall intensity for the 1 in 30 years standard increases the assets will begin to deteriorate. The water utility company has created an internal risk register for properties and has decided to improve the efficiency of the sewer networks on those properties that are affected by 1 in 10 years or 2 in 10 years rainfall intensities [87].
iii. Floods
Wastewater treatment plants and their outfalls are usually located near inland water bodies making these facilities vulnerable to flooding. Additionally, due to climate change the frequency of occurrence flood events will have to be revisited. For example, a 1- in-50-year event may become a 1-in-20-year event under climate change projections, which will place greater demands on drainage infrastructure [202].
Water UK identified the impacts of flood to wastewater infrastructure assets (Error! Reference source not found.) and recognised as the most severe the exceedance of the combined sewer capacity, causing surface flooding and customer flooding.
Table 17 Impacts of floods to wastewater infrastructure
Wastewater infrastructure
Impacts of floods
Sewer networks, incl./trunk sewers
- Higher rainfall intensities lead to runoff exceeding combined sewer capacity, causing surface flooding and reducing receiving water quality
- Increased volumes of storm water in combined sewers exceeds sewer capacity and causes customer flooding
- Higher groundwater levels cause increased infiltration into sewers, causing customer flooding - Change in customer behaviour lead to increased instances of sewer misuse (dumping down
sewer) leading to blockages which cause sewer flooding and reduce environmental water quality
Pumping stations
- Increased volumes of storm water exceed pump capacity, causing service failure and impacting on receiving water quality at outfall
- Increased volumes of storm water require increased pumping in combined sewer systems, causing accelerated asset deterioration
Rising mains Increased volumes of storm water exceed raising main capacity, causing burst and subsequent service failure
CSOs and overflows
- Higher storm intensity means CSOs spill more frequently, impacting on receiving water quality - Increased flood incidence increases risk of failure of 'spills per bathing season' type consents. - Higher winter flows dilute and reduce the effect of spills, reducing impact of spills and
improving receiving water quality
All Wastewater treatment
- Direct asset flooding causes service failure and asset loss - Increased storm frequency and power supply flooding increases frequency of power loss,
causing service failure - Increased duration at FFT causes difficulties with managing performance increasing risk of
consent failure.
Site Pumping stations
Increased volumes of storm water require increased pumping in combined sewer systems, causing accelerated asset deterioration
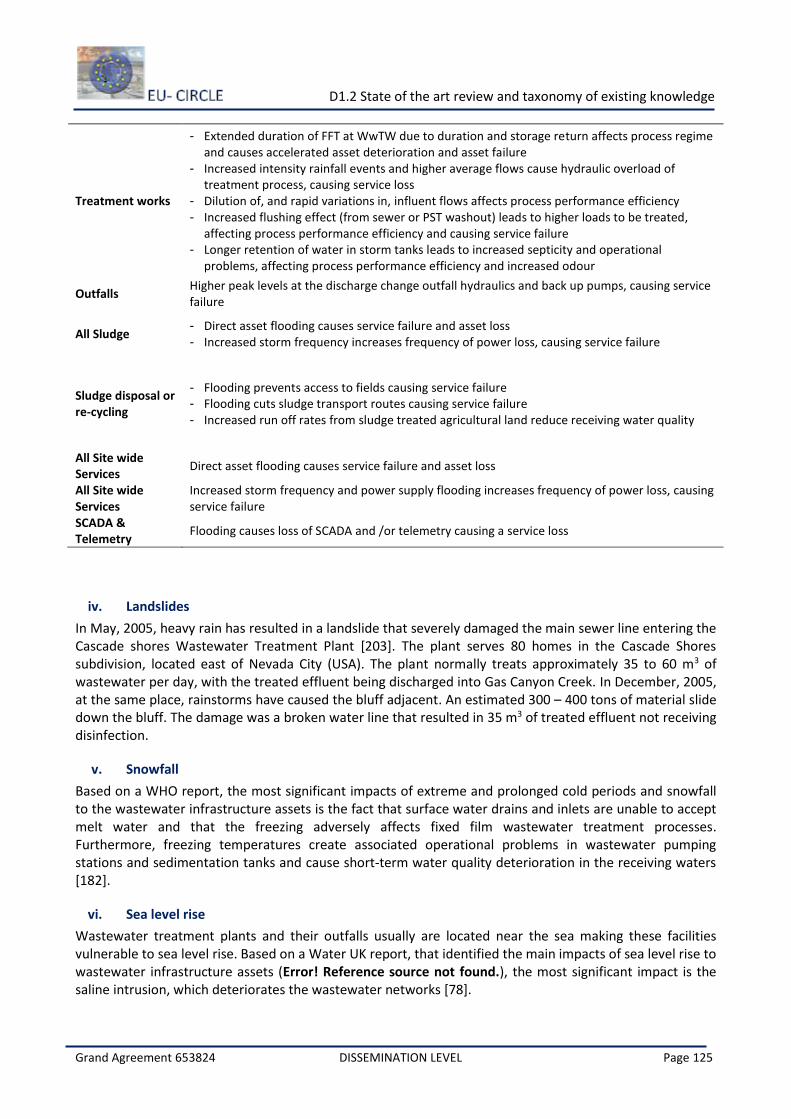
D1.2 State of the art review and taxonomy of existing knowledge
Grand Agreement 653824 DISSEMINATION LEVEL Page 125
Treatment works
- Extended duration of FFT at WwTW due to duration and storage return affects process regime and causes accelerated asset deterioration and asset failure
- Increased intensity rainfall events and higher average flows cause hydraulic overload of treatment process, causing service loss
- Dilution of, and rapid variations in, influent flows affects process performance efficiency - Increased flushing effect (from sewer or PST washout) leads to higher loads to be treated,
affecting process performance efficiency and causing service failure - Longer retention of water in storm tanks leads to increased septicity and operational
problems, affecting process performance efficiency and increased odour
Outfalls Higher peak levels at the discharge change outfall hydraulics and back up pumps, causing service failure
All Sludge - Direct asset flooding causes service failure and asset loss - Increased storm frequency increases frequency of power loss, causing service failure
Sludge disposal or re-cycling
- Flooding prevents access to fields causing service failure - Flooding cuts sludge transport routes causing service failure - Increased run off rates from sludge treated agricultural land reduce receiving water quality
All Site wide Services
Direct asset flooding causes service failure and asset loss
All Site wide Services
Increased storm frequency and power supply flooding increases frequency of power loss, causing service failure
SCADA & Telemetry
Flooding causes loss of SCADA and /or telemetry causing a service loss
iv. Landslides
In May, 2005, heavy rain has resulted in a landslide that severely damaged the main sewer line entering the Cascade shores Wastewater Treatment Plant [203]. The plant serves 80 homes in the Cascade Shores subdivision, located east of Nevada City (USA). The plant normally treats approximately 35 to 60 m3 of wastewater per day, with the treated effluent being discharged into Gas Canyon Creek. In December, 2005, at the same place, rainstorms have caused the bluff adjacent. An estimated 300 – 400 tons of material slide down the bluff. The damage was a broken water line that resulted in 35 m3 of treated effluent not receiving disinfection.
v. Snowfall
Based on a WHO report, the most significant impacts of extreme and prolonged cold periods and snowfall to the wastewater infrastructure assets is the fact that surface water drains and inlets are unable to accept melt water and that the freezing adversely affects fixed film wastewater treatment processes. Furthermore, freezing temperatures create associated operational problems in wastewater pumping stations and sedimentation tanks and cause short-term water quality deterioration in the receiving waters [182].
vi. Sea level rise
Wastewater treatment plants and their outfalls usually are located near the sea making these facilities vulnerable to sea level rise. Based on a Water UK report, that identified the main impacts of sea level rise to wastewater infrastructure assets (Error! Reference source not found.), the most significant impact is the saline intrusion, which deteriorates the wastewater networks [78].
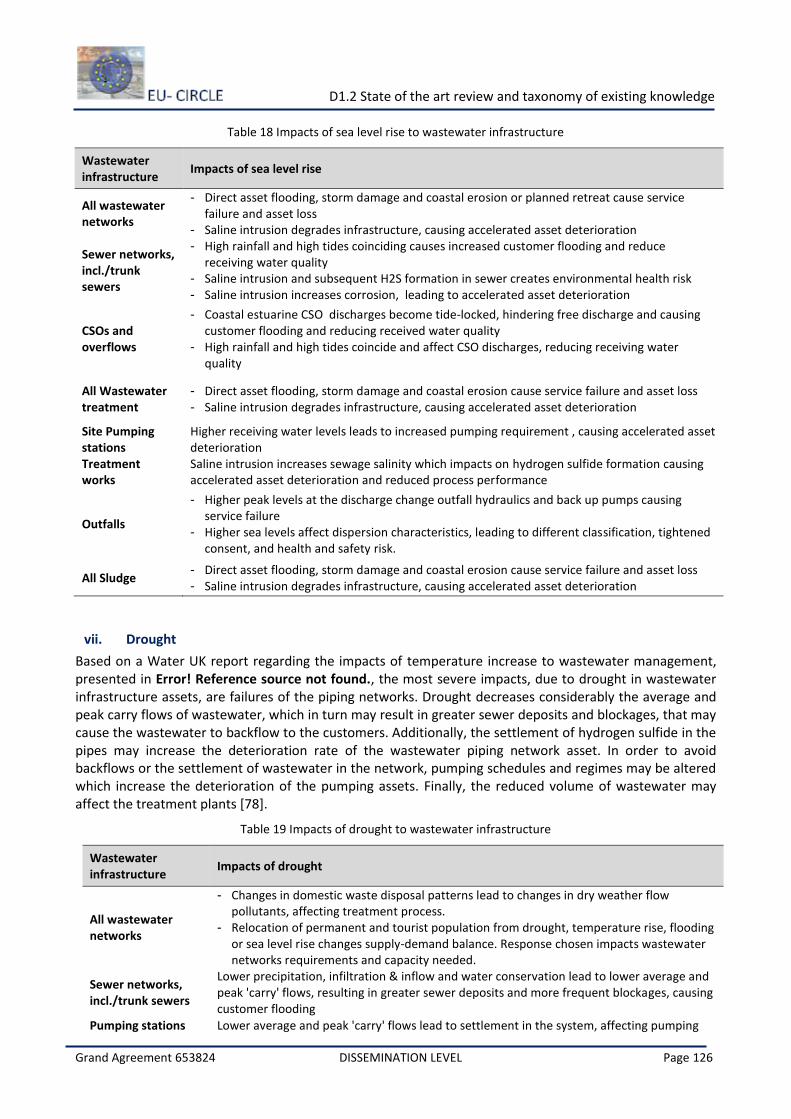
D1.2 State of the art review and taxonomy of existing knowledge
Grand Agreement 653824 DISSEMINATION LEVEL Page 126
Table 18 Impacts of sea level rise to wastewater infrastructure
Wastewater infrastructure
Impacts of sea level rise
All wastewater networks
- Direct asset flooding, storm damage and coastal erosion or planned retreat cause service failure and asset loss
- Saline intrusion degrades infrastructure, causing accelerated asset deterioration
Sewer networks, incl./trunk sewers
- High rainfall and high tides coinciding causes increased customer flooding and reduce receiving water quality
- Saline intrusion and subsequent H2S formation in sewer creates environmental health risk - Saline intrusion increases corrosion, leading to accelerated asset deterioration
CSOs and overflows
- Coastal estuarine CSO discharges become tide-locked, hindering free discharge and causing customer flooding and reducing received water quality
- High rainfall and high tides coincide and affect CSO discharges, reducing receiving water quality
All Wastewater treatment
- Direct asset flooding, storm damage and coastal erosion cause service failure and asset loss - Saline intrusion degrades infrastructure, causing accelerated asset deterioration
Site Pumping stations
Higher receiving water levels leads to increased pumping requirement , causing accelerated asset deterioration
Treatment works
Saline intrusion increases sewage salinity which impacts on hydrogen sulfide formation causing accelerated asset deterioration and reduced process performance
Outfalls
- Higher peak levels at the discharge change outfall hydraulics and back up pumps causing service failure
- Higher sea levels affect dispersion characteristics, leading to different classification, tightened consent, and health and safety risk.
All Sludge - Direct asset flooding, storm damage and coastal erosion cause service failure and asset loss - Saline intrusion degrades infrastructure, causing accelerated asset deterioration
vii. Drought
Based on a Water UK report regarding the impacts of temperature increase to wastewater management, presented in Error! Reference source not found., the most severe impacts, due to drought in wastewater infrastructure assets, are failures of the piping networks. Drought decreases considerably the average and peak carry flows of wastewater, which in turn may result in greater sewer deposits and blockages, that may cause the wastewater to backflow to the customers. Additionally, the settlement of hydrogen sulfide in the pipes may increase the deterioration rate of the wastewater piping network asset. In order to avoid backflows or the settlement of wastewater in the network, pumping schedules and regimes may be altered which increase the deterioration of the pumping assets. Finally, the reduced volume of wastewater may affect the treatment plants [78].
Table 19 Impacts of drought to wastewater infrastructure
Wastewater infrastructure
Impacts of drought
All wastewater networks
- Changes in domestic waste disposal patterns lead to changes in dry weather flow pollutants, affecting treatment process.
- Relocation of permanent and tourist population from drought, temperature rise, flooding or sea level rise changes supply-demand balance. Response chosen impacts wastewater networks requirements and capacity needed.
Sewer networks, incl./trunk sewers
Lower precipitation, infiltration & inflow and water conservation lead to lower average and peak 'carry' flows, resulting in greater sewer deposits and more frequent blockages, causing customer flooding
Pumping stations Lower average and peak 'carry' flows lead to settlement in the system, affecting pumping
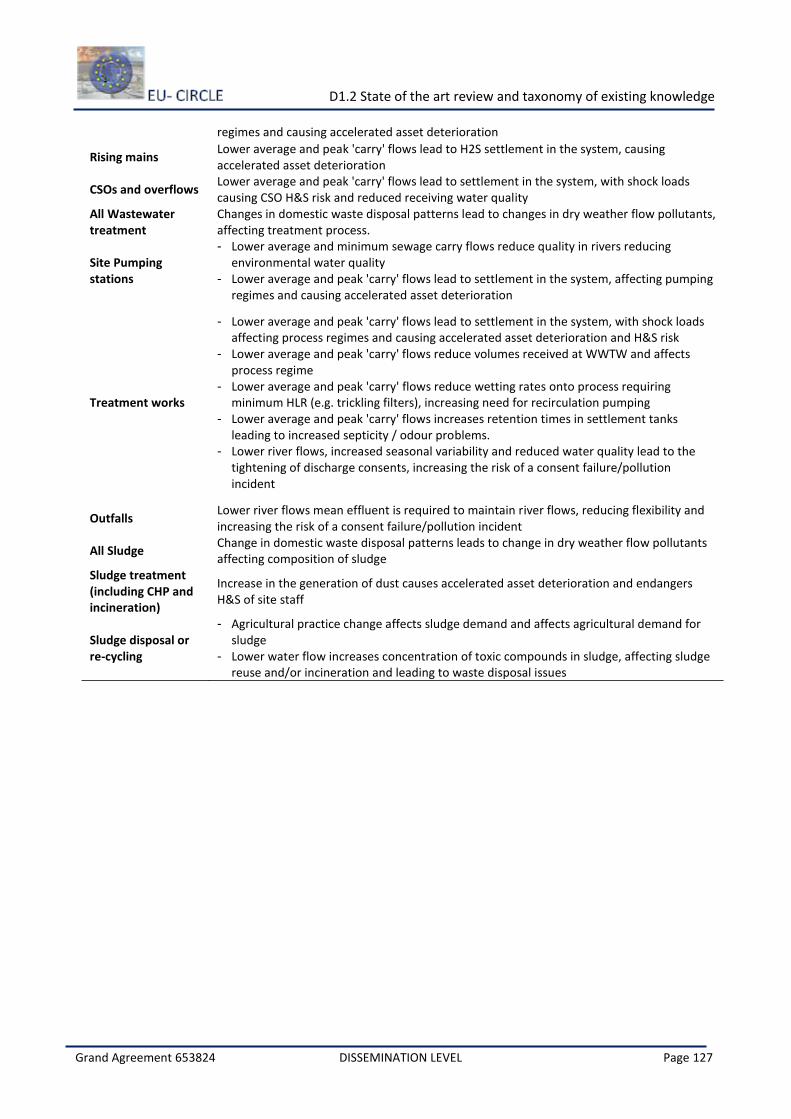
D1.2 State of the art review and taxonomy of existing knowledge
Grand Agreement 653824 DISSEMINATION LEVEL Page 127
regimes and causing accelerated asset deterioration
Rising mains Lower average and peak 'carry' flows lead to H2S settlement in the system, causing accelerated asset deterioration
CSOs and overflows Lower average and peak 'carry' flows lead to settlement in the system, with shock loads causing CSO H&S risk and reduced receiving water quality
All Wastewater treatment
Changes in domestic waste disposal patterns lead to changes in dry weather flow pollutants, affecting treatment process.
Site Pumping stations
- Lower average and minimum sewage carry flows reduce quality in rivers reducing environmental water quality
- Lower average and peak 'carry' flows lead to settlement in the system, affecting pumping regimes and causing accelerated asset deterioration
Treatment works
- Lower average and peak 'carry' flows lead to settlement in the system, with shock loads affecting process regimes and causing accelerated asset deterioration and H&S risk
- Lower average and peak 'carry' flows reduce volumes received at WWTW and affects process regime
- Lower average and peak 'carry' flows reduce wetting rates onto process requiring minimum HLR (e.g. trickling filters), increasing need for recirculation pumping
- Lower average and peak 'carry' flows increases retention times in settlement tanks leading to increased septicity / odour problems.
- Lower river flows, increased seasonal variability and reduced water quality lead to the tightening of discharge consents, increasing the risk of a consent failure/pollution incident
Outfalls Lower river flows mean effluent is required to maintain river flows, reducing flexibility and increasing the risk of a consent failure/pollution incident
All Sludge Change in domestic waste disposal patterns leads to change in dry weather flow pollutants affecting composition of sludge
Sludge treatment (including CHP and incineration)
Increase in the generation of dust causes accelerated asset deterioration and endangers H&S of site staff
Sludge disposal or re-cycling
- Agricultural practice change affects sludge demand and affects agricultural demand for sludge
- Lower water flow increases concentration of toxic compounds in sludge, affecting sludge reuse and/or incineration and leading to waste disposal issues
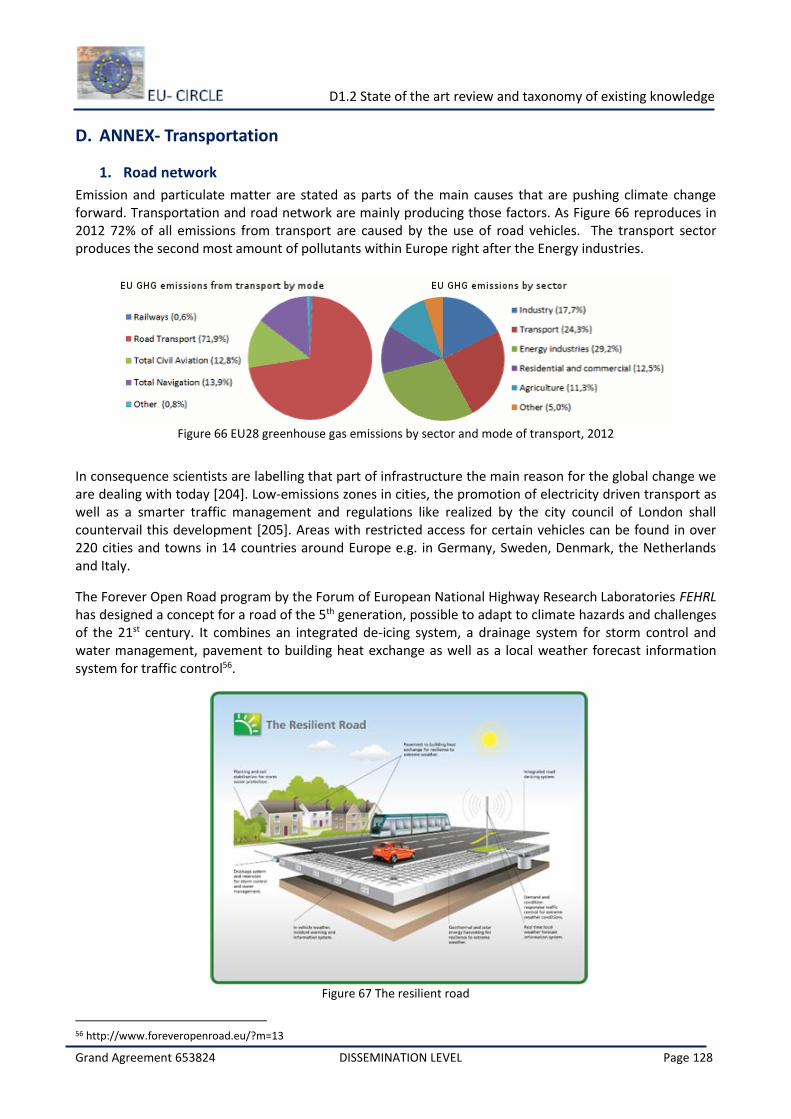
D1.2 State of the art review and taxonomy of existing knowledge
Grand Agreement 653824 DISSEMINATION LEVEL Page 128
D. ANNEX- Transportation
1. Road network
Emission and particulate matter are stated as parts of the main causes that are pushing climate change forward. Transportation and road network are mainly producing those factors. As Figure 66 reproduces in 2012 72% of all emissions from transport are caused by the use of road vehicles. The transport sector produces the second most amount of pollutants within Europe right after the Energy industries.
Figure 66 EU28 greenhouse gas emissions by sector and mode of transport, 2012
In consequence scientists are labelling that part of infrastructure the main reason for the global change we are dealing with today [204]. Low-emissions zones in cities, the promotion of electricity driven transport as well as a smarter traffic management and regulations like realized by the city council of London shall countervail this development [205]. Areas with restricted access for certain vehicles can be found in over 220 cities and towns in 14 countries around Europe e.g. in Germany, Sweden, Denmark, the Netherlands and Italy.
The Forever Open Road program by the Forum of European National Highway Research Laboratories FEHRL has designed a concept for a road of the 5th generation, possible to adapt to climate hazards and challenges of the 21st century. It combines an integrated de-icing system, a drainage system for storm control and water management, pavement to building heat exchange as well as a local weather forecast information system for traffic control56.
Figure 67 The resilient road
56 http://www.foreveropenroad.eu/?m=13
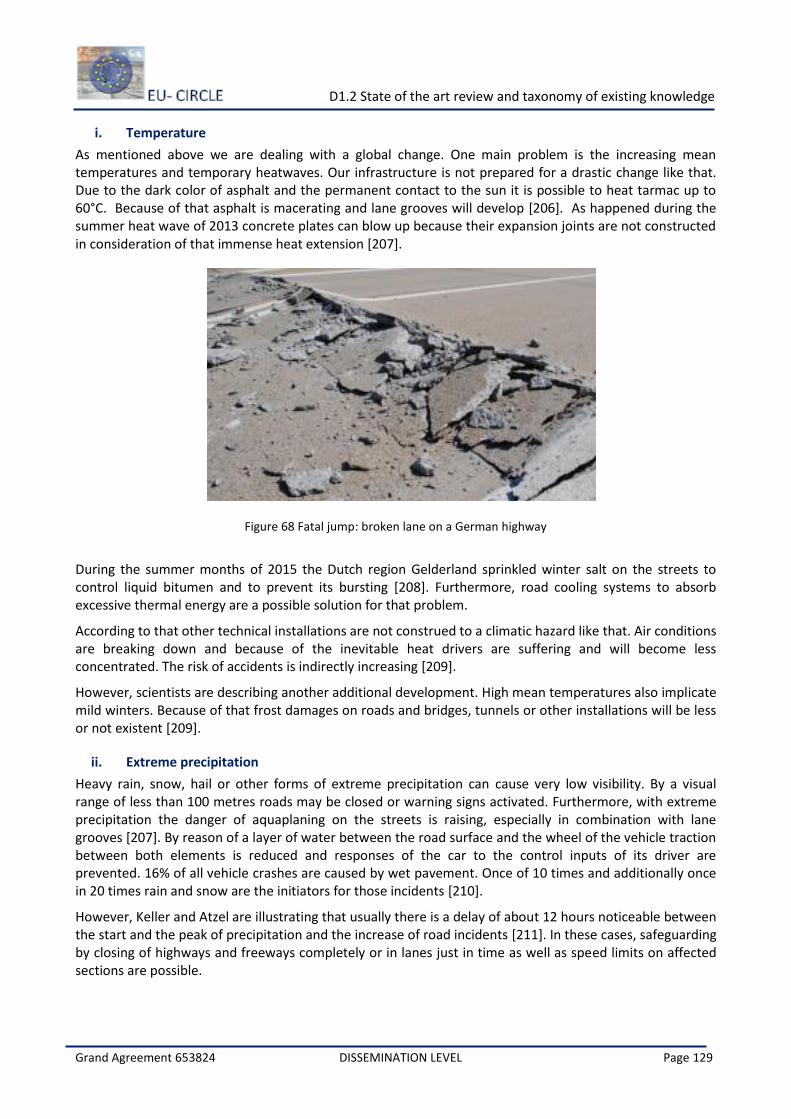
D1.2 State of the art review and taxonomy of existing knowledge
Grand Agreement 653824 DISSEMINATION LEVEL Page 129
i. Temperature
As mentioned above we are dealing with a global change. One main problem is the increasing mean temperatures and temporary heatwaves. Our infrastructure is not prepared for a drastic change like that. Due to the dark color of asphalt and the permanent contact to the sun it is possible to heat tarmac up to 60°C. Because of that asphalt is macerating and lane grooves will develop [206]. As happened during the summer heat wave of 2013 concrete plates can blow up because their expansion joints are not constructed in consideration of that immense heat extension [207].
Figure 68 Fatal jump: broken lane on a German highway
During the summer months of 2015 the Dutch region Gelderland sprinkled winter salt on the streets to control liquid bitumen and to prevent its bursting [208]. Furthermore, road cooling systems to absorb excessive thermal energy are a possible solution for that problem.
According to that other technical installations are not construed to a climatic hazard like that. Air conditions are breaking down and because of the inevitable heat drivers are suffering and will become less concentrated. The risk of accidents is indirectly increasing [209].
However, scientists are describing another additional development. High mean temperatures also implicate mild winters. Because of that frost damages on roads and bridges, tunnels or other installations will be less or not existent [209].
ii. Extreme precipitation
Heavy rain, snow, hail or other forms of extreme precipitation can cause very low visibility. By a visual range of less than 100 metres roads may be closed or warning signs activated. Furthermore, with extreme precipitation the danger of aquaplaning on the streets is raising, especially in combination with lane grooves [207]. By reason of a layer of water between the road surface and the wheel of the vehicle traction between both elements is reduced and responses of the car to the control inputs of its driver are prevented. 16% of all vehicle crashes are caused by wet pavement. Once of 10 times and additionally once in 20 times rain and snow are the initiators for those incidents [210].
However, Keller and Atzel are illustrating that usually there is a delay of about 12 hours noticeable between the start and the peak of precipitation and the increase of road incidents [211]. In these cases, safeguarding by closing of highways and freeways completely or in lanes just in time as well as speed limits on affected sections are possible.
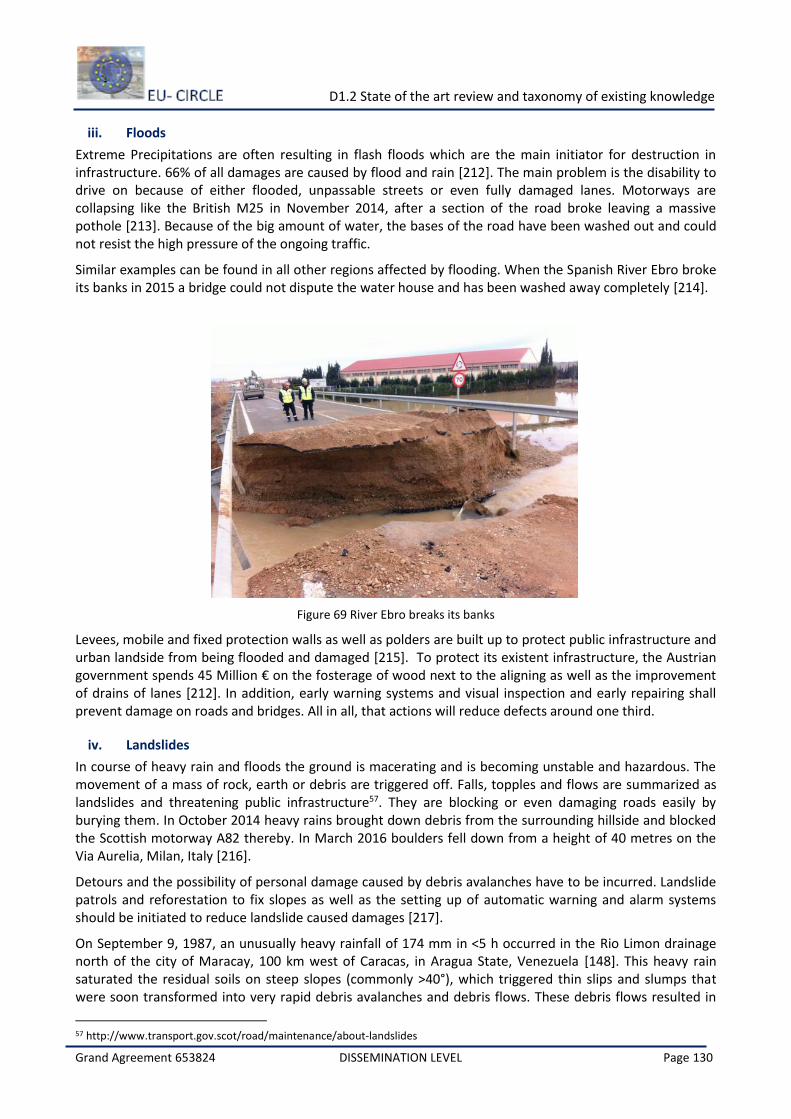
D1.2 State of the art review and taxonomy of existing knowledge
Grand Agreement 653824 DISSEMINATION LEVEL Page 130
iii. Floods
Extreme Precipitations are often resulting in flash floods which are the main initiator for destruction in infrastructure. 66% of all damages are caused by flood and rain [212]. The main problem is the disability to drive on because of either flooded, unpassable streets or even fully damaged lanes. Motorways are collapsing like the British M25 in November 2014, after a section of the road broke leaving a massive pothole [213]. Because of the big amount of water, the bases of the road have been washed out and could not resist the high pressure of the ongoing traffic.
Similar examples can be found in all other regions affected by flooding. When the Spanish River Ebro broke its banks in 2015 a bridge could not dispute the water house and has been washed away completely [214].
Figure 69 River Ebro breaks its banks
Levees, mobile and fixed protection walls as well as polders are built up to protect public infrastructure and urban landside from being flooded and damaged [215]. To protect its existent infrastructure, the Austrian government spends 45 Million € on the fosterage of wood next to the aligning as well as the improvement of drains of lanes [212]. In addition, early warning systems and visual inspection and early repairing shall prevent damage on roads and bridges. All in all, that actions will reduce defects around one third.
iv. Landslides
In course of heavy rain and floods the ground is macerating and is becoming unstable and hazardous. The movement of a mass of rock, earth or debris are triggered off. Falls, topples and flows are summarized as landslides and threatening public infrastructure57. They are blocking or even damaging roads easily by burying them. In October 2014 heavy rains brought down debris from the surrounding hillside and blocked the Scottish motorway A82 thereby. In March 2016 boulders fell down from a height of 40 metres on the Via Aurelia, Milan, Italy [216].
Detours and the possibility of personal damage caused by debris avalanches have to be incurred. Landslide patrols and reforestation to fix slopes as well as the setting up of automatic warning and alarm systems should be initiated to reduce landslide caused damages [217].
On September 9, 1987, an unusually heavy rainfall of 174 mm in <5 h occurred in the Rio Limon drainage north of the city of Maracay, 100 km west of Caracas, in Aragua State, Venezuela [148]. This heavy rain saturated the residual soils on steep slopes (commonly >40°), which triggered thin slips and slumps that were soon transformed into very rapid debris avalanches and debris flows. These debris flows resulted in
57 http://www.transport.gov.scot/road/maintenance/about-landslides
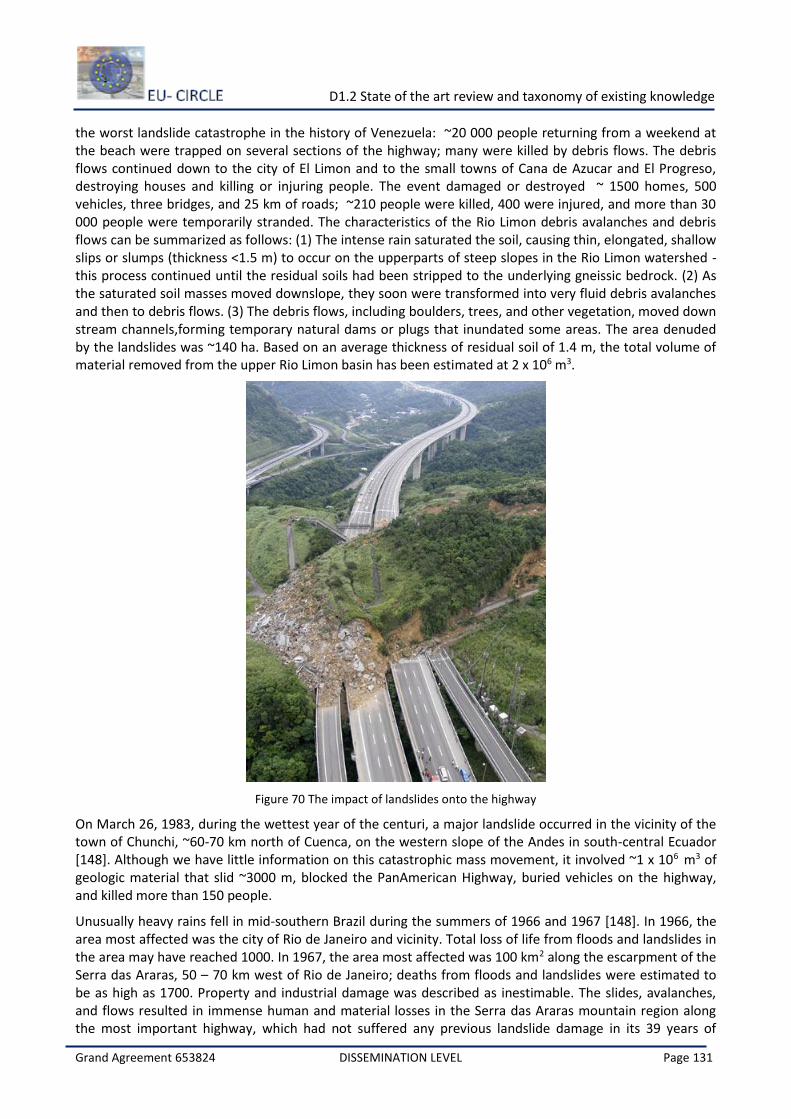
D1.2 State of the art review and taxonomy of existing knowledge
Grand Agreement 653824 DISSEMINATION LEVEL Page 131
the worst landslide catastrophe in the history of Venezuela: ~20 000 people returning from a weekend at the beach were trapped on several sections of the highway; many were killed by debris flows. The debris flows continued down to the city of El Limon and to the small towns of Cana de Azucar and El Progreso, destroying houses and killing or injuring people. The event damaged or destroyed ~ 1500 homes, 500 vehicles, three bridges, and 25 km of roads; ~210 people were killed, 400 were injured, and more than 30 000 people were temporarily stranded. The characteristics of the Rio Limon debris avalanches and debris flows can be summarized as follows: (1) The intense rain saturated the soil, causing thin, elongated, shallow slips or slumps (thickness <1.5 m) to occur on the upperparts of steep slopes in the Rio Limon watershed - this process continued until the residual soils had been stripped to the underlying gneissic bedrock. (2) As the saturated soil masses moved downslope, they soon were transformed into very fluid debris avalanches and then to debris flows. (3) The debris flows, including boulders, trees, and other vegetation, moved down stream channels,forming temporary natural dams or plugs that inundated some areas. The area denuded by the landslides was ~140 ha. Based on an average thickness of residual soil of 1.4 m, the total volume of material removed from the upper Rio Limon basin has been estimated at 2 x 10⁶ m3.
Figure 70 The impact of landslides onto the highway
On March 26, 1983, during the wettest year of the centuri, a major landslide occurred in the vicinity of the town of Chunchi, ~60-70 km north of Cuenca, on the western slope of the Andes in south-central Ecuador [148]. Although we have little information on this catastrophic mass movement, it involved ~1 x 10⁶ m3 of geologic material that slid ~3000 m, blocked the PanAmerican Highway, buried vehicles on the highway, and killed more than 150 people.
Unusually heavy rains fell in mid-southern Brazil during the summers of 1966 and 1967 [148]. In 1966, the area most affected was the city of Rio de Janeiro and vicinity. Total loss of life from floods and landslides in the area may have reached 1000. In 1967, the area most affected was 100 km2 along the escarpment of the Serra das Araras, 50 – 70 km west of Rio de Janeiro; deaths from floods and landslides were estimated to be as high as 1700. Property and industrial damage was described as inestimable. The slides, avalanches, and flows resulted in immense human and material losses in the Serra das Araras mountain region along the most important highway, which had not suffered any previous landslide damage in its 39 years of
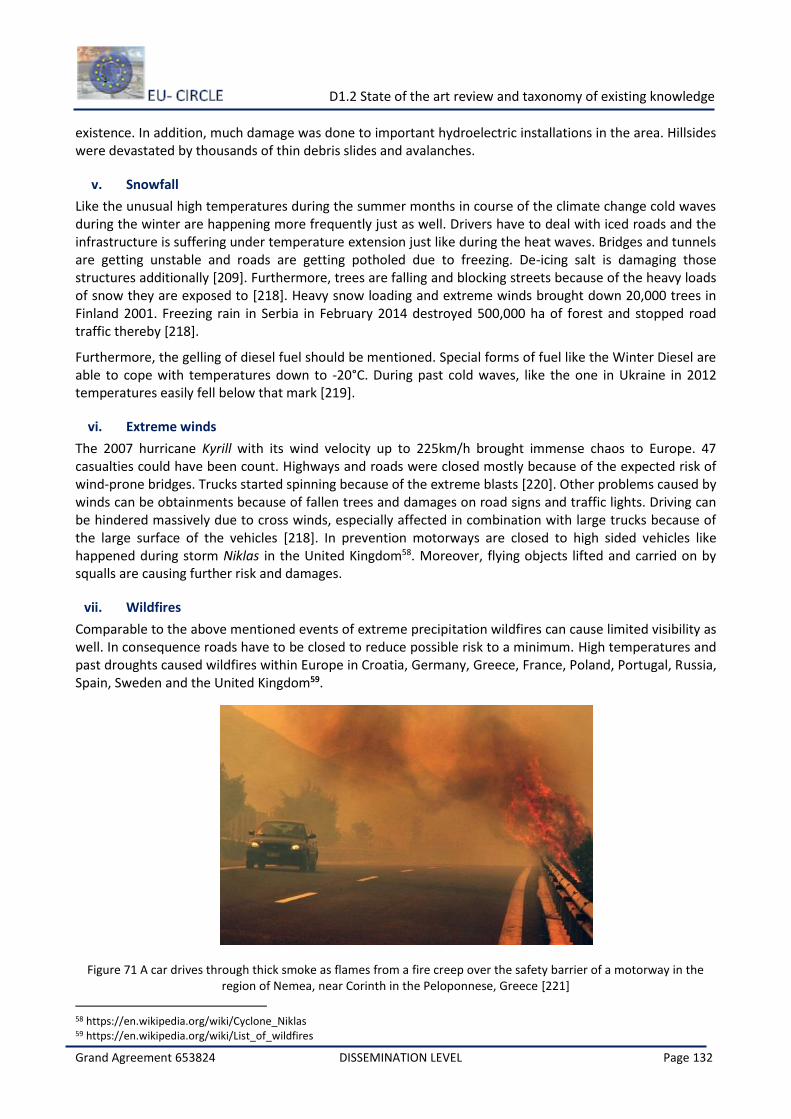
D1.2 State of the art review and taxonomy of existing knowledge
Grand Agreement 653824 DISSEMINATION LEVEL Page 132
existence. In addition, much damage was done to important hydroelectric installations in the area. Hillsides were devastated by thousands of thin debris slides and avalanches.
v. Snowfall
Like the unusual high temperatures during the summer months in course of the climate change cold waves during the winter are happening more frequently just as well. Drivers have to deal with iced roads and the infrastructure is suffering under temperature extension just like during the heat waves. Bridges and tunnels are getting unstable and roads are getting potholed due to freezing. De-icing salt is damaging those structures additionally [209]. Furthermore, trees are falling and blocking streets because of the heavy loads of snow they are exposed to [218]. Heavy snow loading and extreme winds brought down 20,000 trees in Finland 2001. Freezing rain in Serbia in February 2014 destroyed 500,000 ha of forest and stopped road traffic thereby [218].
Furthermore, the gelling of diesel fuel should be mentioned. Special forms of fuel like the Winter Diesel are able to cope with temperatures down to -20°C. During past cold waves, like the one in Ukraine in 2012 temperatures easily fell below that mark [219].
vi. Extreme winds
The 2007 hurricane Kyrill with its wind velocity up to 225km/h brought immense chaos to Europe. 47 casualties could have been count. Highways and roads were closed mostly because of the expected risk of wind-prone bridges. Trucks started spinning because of the extreme blasts [220]. Other problems caused by winds can be obtainments because of fallen trees and damages on road signs and traffic lights. Driving can be hindered massively due to cross winds, especially affected in combination with large trucks because of the large surface of the vehicles [218]. In prevention motorways are closed to high sided vehicles like happened during storm Niklas in the United Kingdom58. Moreover, flying objects lifted and carried on by squalls are causing further risk and damages.
vii. Wildfires
Comparable to the above mentioned events of extreme precipitation wildfires can cause limited visibility as well. In consequence roads have to be closed to reduce possible risk to a minimum. High temperatures and past droughts caused wildfires within Europe in Croatia, Germany, Greece, France, Poland, Portugal, Russia, Spain, Sweden and the United Kingdom59.
Figure 71 A car drives through thick smoke as flames from a fire creep over the safety barrier of a motorway in the
region of Nemea, near Corinth in the Peloponnese, Greece [221]
58 https://en.wikipedia.org/wiki/Cyclone_Niklas 59 https://en.wikipedia.org/wiki/List_of_wildfires
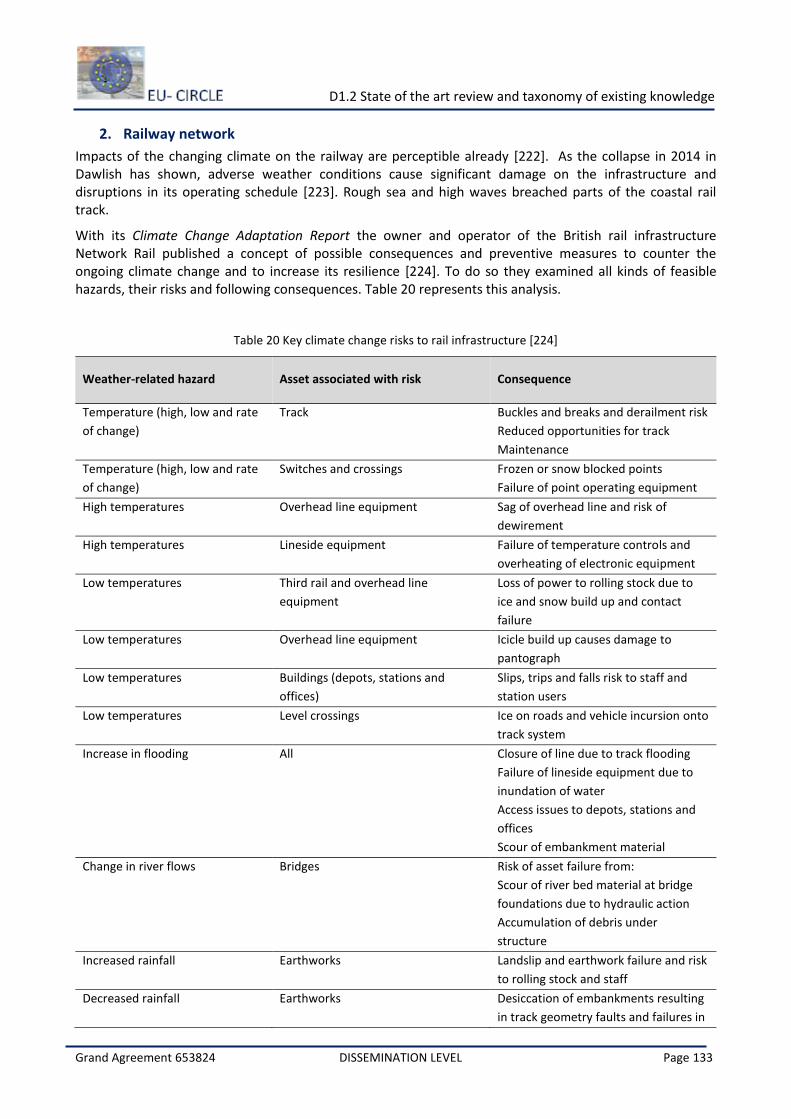
D1.2 State of the art review and taxonomy of existing knowledge
Grand Agreement 653824 DISSEMINATION LEVEL Page 133
2. Railway network
Impacts of the changing climate on the railway are perceptible already [222]. As the collapse in 2014 in Dawlish has shown, adverse weather conditions cause significant damage on the infrastructure and disruptions in its operating schedule [223]. Rough sea and high waves breached parts of the coastal rail track.
With its Climate Change Adaptation Report the owner and operator of the British rail infrastructure Network Rail published a concept of possible consequences and preventive measures to counter the ongoing climate change and to increase its resilience [224]. To do so they examined all kinds of feasible hazards, their risks and following consequences. Table 20 represents this analysis.
Table 20 Key climate change risks to rail infrastructure [224]
Weather-related hazard Asset associated with risk Consequence
Temperature (high, low and rate
of change)
Track Buckles and breaks and derailment risk
Reduced opportunities for track
Maintenance
Temperature (high, low and rate
of change)
Switches and crossings Frozen or snow blocked points
Failure of point operating equipment
High temperatures Overhead line equipment Sag of overhead line and risk of
dewirement
High temperatures Lineside equipment Failure of temperature controls and
overheating of electronic equipment
Low temperatures Third rail and overhead line
equipment
Loss of power to rolling stock due to
ice and snow build up and contact
failure
Low temperatures Overhead line equipment Icicle build up causes damage to
pantograph
Low temperatures Buildings (depots, stations and
offices)
Slips, trips and falls risk to staff and
station users
Low temperatures Level crossings Ice on roads and vehicle incursion onto
track system
Increase in flooding All Closure of line due to track flooding
Failure of lineside equipment due to
inundation of water
Access issues to depots, stations and
offices
Scour of embankment material
Change in river flows Bridges Risk of asset failure from:
Scour of river bed material at bridge
foundations due to hydraulic action
Accumulation of debris under
structure
Increased rainfall Earthworks Landslip and earthwork failure and risk
to rolling stock and staff
Decreased rainfall Earthworks Desiccation of embankments resulting
in track geometry faults and failures in
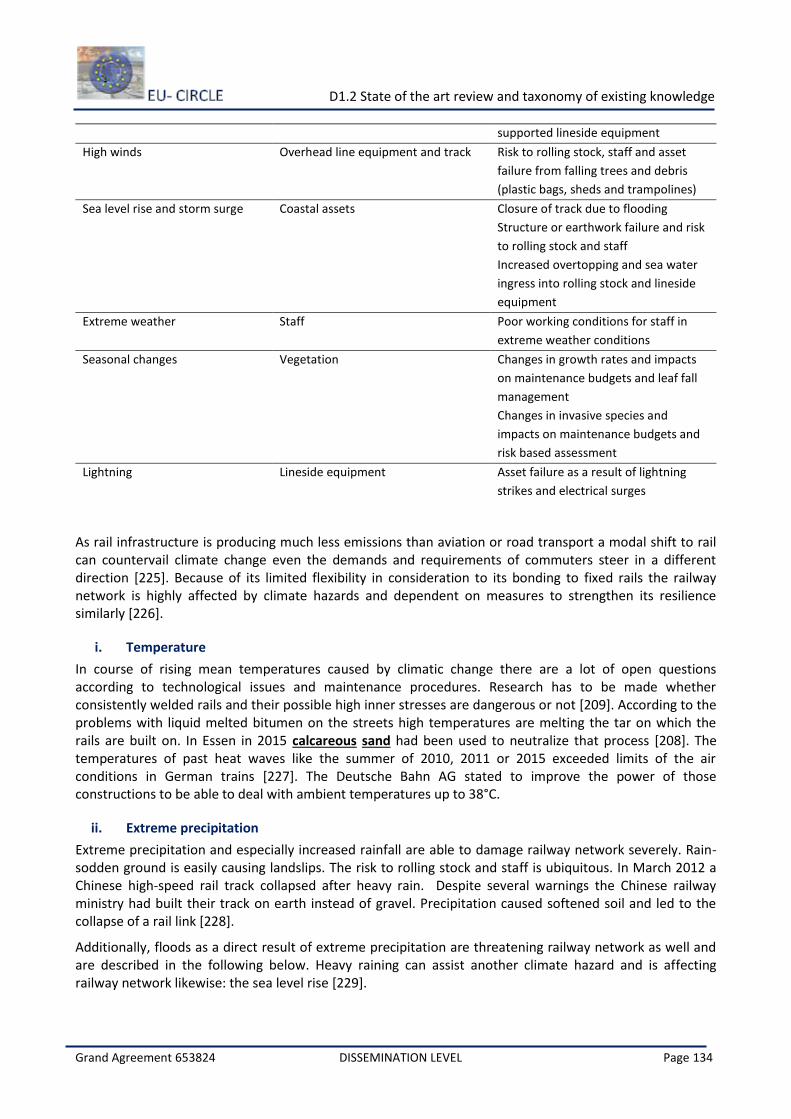
D1.2 State of the art review and taxonomy of existing knowledge
Grand Agreement 653824 DISSEMINATION LEVEL Page 134
As rail infrastructure is producing much less emissions than aviation or road transport a modal shift to rail can countervail climate change even the demands and requirements of commuters steer in a different direction [225]. Because of its limited flexibility in consideration to its bonding to fixed rails the railway network is highly affected by climate hazards and dependent on measures to strengthen its resilience similarly [226].
i. Temperature
In course of rising mean temperatures caused by climatic change there are a lot of open questions according to technological issues and maintenance procedures. Research has to be made whether consistently welded rails and their possible high inner stresses are dangerous or not [209]. According to the problems with liquid melted bitumen on the streets high temperatures are melting the tar on which the rails are built on. In Essen in 2015 calcareous sand had been used to neutralize that process [208]. The temperatures of past heat waves like the summer of 2010, 2011 or 2015 exceeded limits of the air conditions in German trains [227]. The Deutsche Bahn AG stated to improve the power of those constructions to be able to deal with ambient temperatures up to 38°C.
ii. Extreme precipitation
Extreme precipitation and especially increased rainfall are able to damage railway network severely. Rain-sodden ground is easily causing landslips. The risk to rolling stock and staff is ubiquitous. In March 2012 a Chinese high-speed rail track collapsed after heavy rain. Despite several warnings the Chinese railway ministry had built their track on earth instead of gravel. Precipitation caused softened soil and led to the collapse of a rail link [228].
Additionally, floods as a direct result of extreme precipitation are threatening railway network as well and are described in the following below. Heavy raining can assist another climate hazard and is affecting railway network likewise: the sea level rise [229].
supported lineside equipment
High winds Overhead line equipment and track Risk to rolling stock, staff and asset
failure from falling trees and debris
(plastic bags, sheds and trampolines)
Sea level rise and storm surge Coastal assets Closure of track due to flooding
Structure or earthwork failure and risk
to rolling stock and staff
Increased overtopping and sea water
ingress into rolling stock and lineside
equipment
Extreme weather Staff Poor working conditions for staff in
extreme weather conditions
Seasonal changes Vegetation Changes in growth rates and impacts
on maintenance budgets and leaf fall
management
Changes in invasive species and
impacts on maintenance budgets and
risk based assessment
Lightning Lineside equipment Asset failure as a result of lightning
strikes and electrical surges
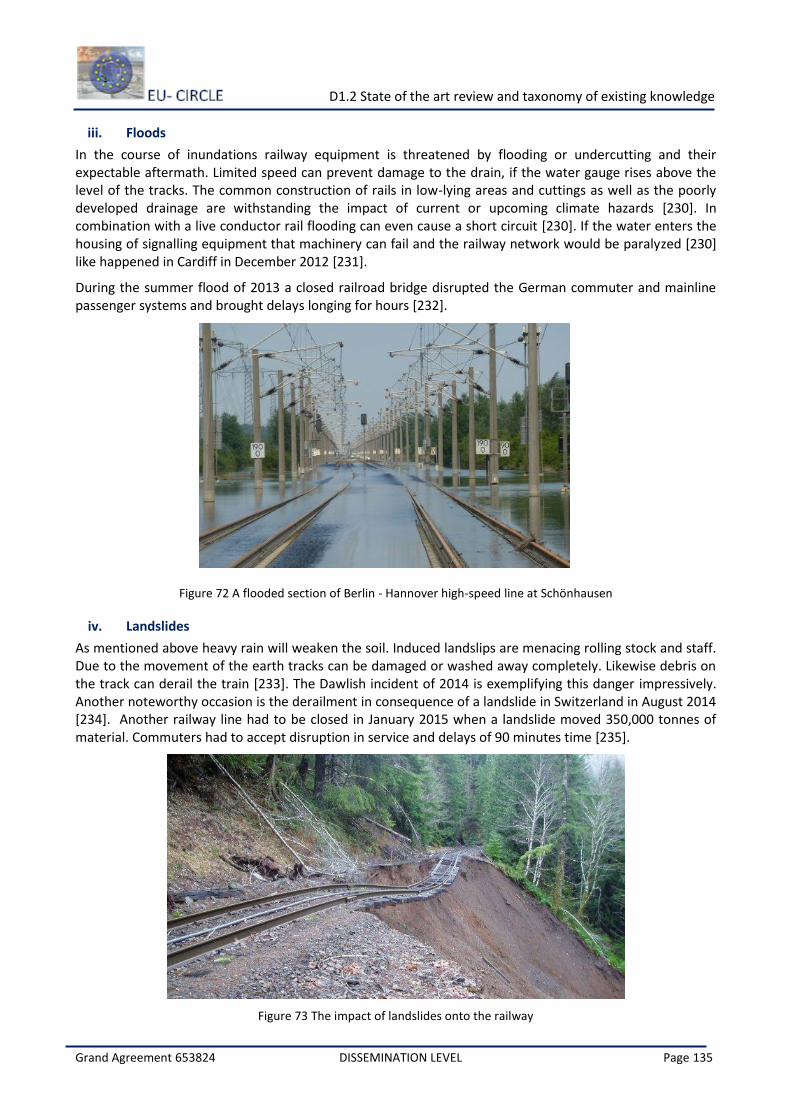
D1.2 State of the art review and taxonomy of existing knowledge
Grand Agreement 653824 DISSEMINATION LEVEL Page 135
iii. Floods
In the course of inundations railway equipment is threatened by flooding or undercutting and their expectable aftermath. Limited speed can prevent damage to the drain, if the water gauge rises above the level of the tracks. The common construction of rails in low-lying areas and cuttings as well as the poorly developed drainage are withstanding the impact of current or upcoming climate hazards [230]. In combination with a live conductor rail flooding can even cause a short circuit [230]. If the water enters the housing of signalling equipment that machinery can fail and the railway network would be paralyzed [230] like happened in Cardiff in December 2012 [231].
During the summer flood of 2013 a closed railroad bridge disrupted the German commuter and mainline passenger systems and brought delays longing for hours [232].
Figure 72 A flooded section of Berlin - Hannover high-speed line at Schönhausen
iv. Landslides
As mentioned above heavy rain will weaken the soil. Induced landslips are menacing rolling stock and staff. Due to the movement of the earth tracks can be damaged or washed away completely. Likewise debris on the track can derail the train [233]. The Dawlish incident of 2014 is exemplifying this danger impressively. Another noteworthy occasion is the derailment in consequence of a landslide in Switzerland in August 2014 [234]. Another railway line had to be closed in January 2015 when a landslide moved 350,000 tonnes of material. Commuters had to accept disruption in service and delays of 90 minutes time [235].
Figure 73 The impact of landslides onto the railway
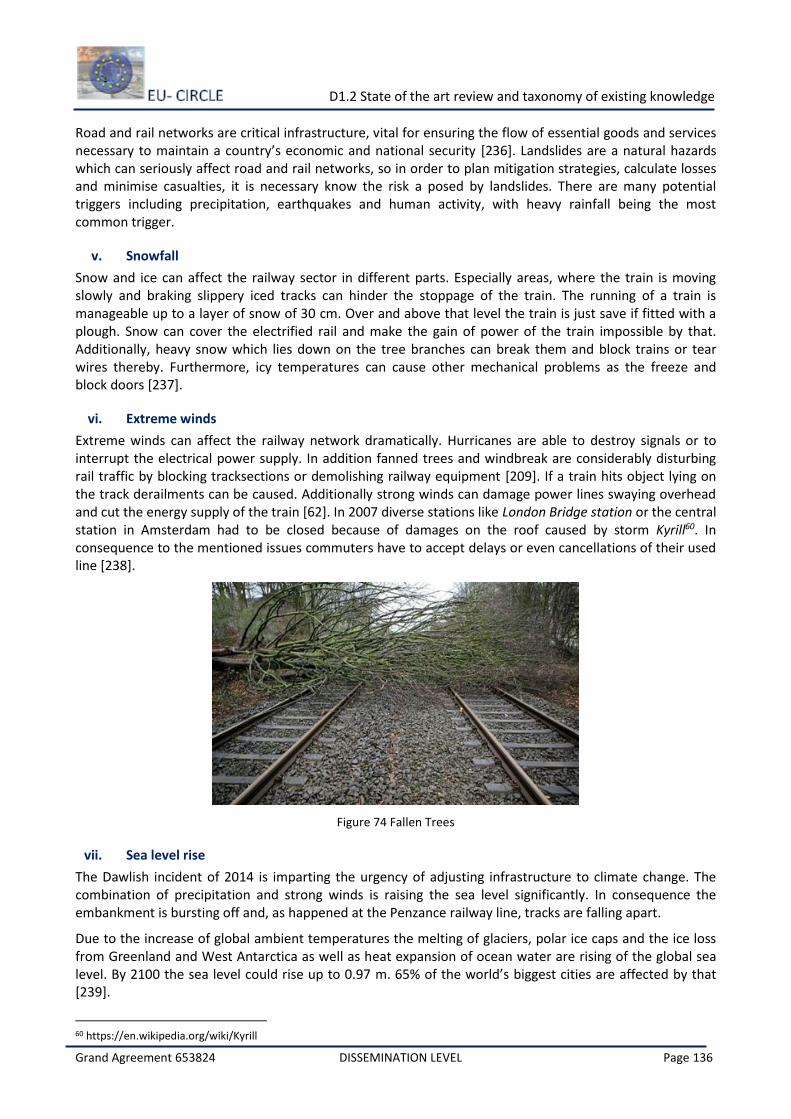
D1.2 State of the art review and taxonomy of existing knowledge
Grand Agreement 653824 DISSEMINATION LEVEL Page 136
Road and rail networks are critical infrastructure, vital for ensuring the flow of essential goods and services necessary to maintain a country’s economic and national security [236]. Landslides are a natural hazards which can seriously affect road and rail networks, so in order to plan mitigation strategies, calculate losses and minimise casualties, it is necessary know the risk a posed by landslides. There are many potential triggers including precipitation, earthquakes and human activity, with heavy rainfall being the most common trigger.
v. Snowfall
Snow and ice can affect the railway sector in different parts. Especially areas, where the train is moving slowly and braking slippery iced tracks can hinder the stoppage of the train. The running of a train is manageable up to a layer of snow of 30 cm. Over and above that level the train is just save if fitted with a plough. Snow can cover the electrified rail and make the gain of power of the train impossible by that. Additionally, heavy snow which lies down on the tree branches can break them and block trains or tear wires thereby. Furthermore, icy temperatures can cause other mechanical problems as the freeze and block doors [237].
vi. Extreme winds
Extreme winds can affect the railway network dramatically. Hurricanes are able to destroy signals or to interrupt the electrical power supply. In addition fanned trees and windbreak are considerably disturbing rail traffic by blocking tracksections or demolishing railway equipment [209]. If a train hits object lying on the track derailments can be caused. Additionally strong winds can damage power lines swaying overhead and cut the energy supply of the train [62]. In 2007 diverse stations like London Bridge station or the central station in Amsterdam had to be closed because of damages on the roof caused by storm Kyrill60. In consequence to the mentioned issues commuters have to accept delays or even cancellations of their used line [238].
Figure 74 Fallen Trees
vii. Sea level rise
The Dawlish incident of 2014 is imparting the urgency of adjusting infrastructure to climate change. The combination of precipitation and strong winds is raising the sea level significantly. In consequence the embankment is bursting off and, as happened at the Penzance railway line, tracks are falling apart.
Due to the increase of global ambient temperatures the melting of glaciers, polar ice caps and the ice loss from Greenland and West Antarctica as well as heat expansion of ocean water are rising of the global sea level. By 2100 the sea level could rise up to 0.97 m. 65% of the world’s biggest cities are affected by that [239].
60 https://en.wikipedia.org/wiki/Kyrill
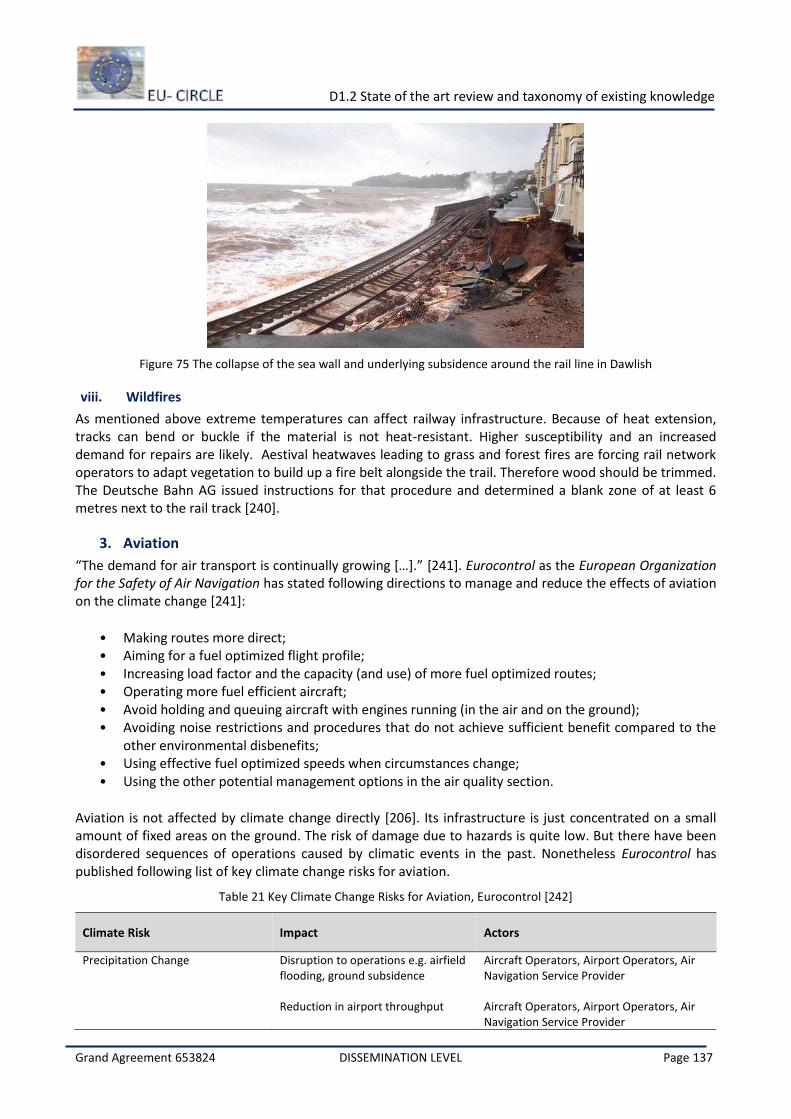
D1.2 State of the art review and taxonomy of existing knowledge
Grand Agreement 653824 DISSEMINATION LEVEL Page 137
Figure 75 The collapse of the sea wall and underlying subsidence around the rail line in Dawlish
viii. Wildfires
As mentioned above extreme temperatures can affect railway infrastructure. Because of heat extension, tracks can bend or buckle if the material is not heat-resistant. Higher susceptibility and an increased demand for repairs are likely. Aestival heatwaves leading to grass and forest fires are forcing rail network operators to adapt vegetation to build up a fire belt alongside the trail. Therefore wood should be trimmed. The Deutsche Bahn AG issued instructions for that procedure and determined a blank zone of at least 6 metres next to the rail track [240].
3. Aviation
“The demand for air transport is continually growing […].” [241]. Eurocontrol as the European Organization for the Safety of Air Navigation has stated following directions to manage and reduce the effects of aviation on the climate change [241]:
• Making routes more direct; • Aiming for a fuel optimized flight profile; • Increasing load factor and the capacity (and use) of more fuel optimized routes; • Operating more fuel efficient aircraft; • Avoid holding and queuing aircraft with engines running (in the air and on the ground); • Avoiding noise restrictions and procedures that do not achieve sufficient benefit compared to the
other environmental disbenefits; • Using effective fuel optimized speeds when circumstances change; • Using the other potential management options in the air quality section.
Aviation is not affected by climate change directly [206]. Its infrastructure is just concentrated on a small amount of fixed areas on the ground. The risk of damage due to hazards is quite low. But there have been disordered sequences of operations caused by climatic events in the past. Nonetheless Eurocontrol has published following list of key climate change risks for aviation.
Table 21 Key Climate Change Risks for Aviation, Eurocontrol [242]
Climate Risk Impact Actors
Precipitation Change Disruption to operations e.g. airfield flooding, ground subsidence Reduction in airport throughput
Aircraft Operators, Airport Operators, Air Navigation Service Provider Aircraft Operators, Airport Operators, Air Navigation Service Provider
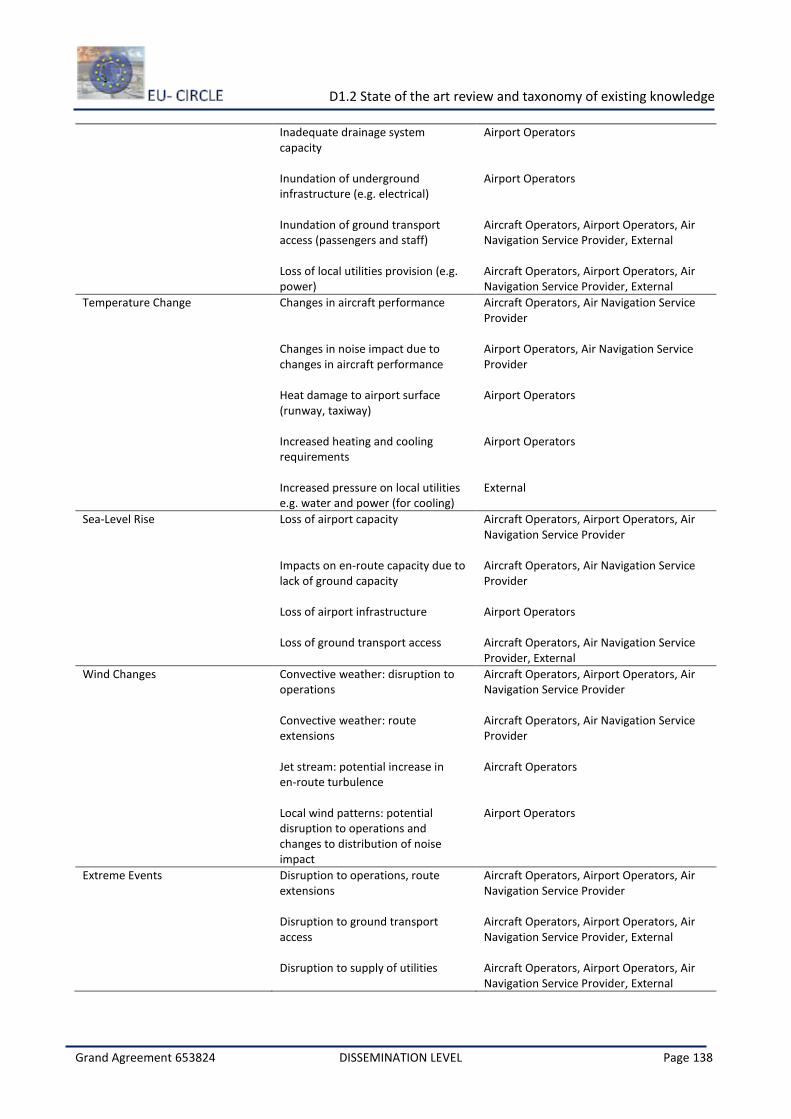
D1.2 State of the art review and taxonomy of existing knowledge
Grand Agreement 653824 DISSEMINATION LEVEL Page 138
Inadequate drainage system capacity Inundation of underground infrastructure (e.g. electrical) Inundation of ground transport access (passengers and staff) Loss of local utilities provision (e.g. power)
Airport Operators Airport Operators Aircraft Operators, Airport Operators, Air Navigation Service Provider, External Aircraft Operators, Airport Operators, Air Navigation Service Provider, External
Temperature Change Changes in aircraft performance Changes in noise impact due to changes in aircraft performance Heat damage to airport surface (runway, taxiway) Increased heating and cooling requirements Increased pressure on local utilities e.g. water and power (for cooling)
Aircraft Operators, Air Navigation Service Provider Airport Operators, Air Navigation Service Provider Airport Operators Airport Operators External
Sea-Level Rise Loss of airport capacity Impacts on en-route capacity due to lack of ground capacity Loss of airport infrastructure Loss of ground transport access
Aircraft Operators, Airport Operators, Air Navigation Service Provider Aircraft Operators, Air Navigation Service Provider Airport Operators Aircraft Operators, Air Navigation Service Provider, External
Wind Changes Convective weather: disruption to operations Convective weather: route extensions Jet stream: potential increase in en-route turbulence Local wind patterns: potential disruption to operations and changes to distribution of noise impact
Aircraft Operators, Airport Operators, Air Navigation Service Provider Aircraft Operators, Air Navigation Service Provider Aircraft Operators Airport Operators
Extreme Events Disruption to operations, route extensions Disruption to ground transport access Disruption to supply of utilities
Aircraft Operators, Airport Operators, Air Navigation Service Provider Aircraft Operators, Airport Operators, Air Navigation Service Provider, External Aircraft Operators, Airport Operators, Air Navigation Service Provider, External
D1.2 State of the art review and taxonomy of existing knowledge
Grand Agreement 653824 DISSEMINATION LEVEL Page 139
i. Temperature
The increase of ambient temperatures due to climate change can cause significant issues for aviation. This development causes a reduction of air density. In account of this the ability of the aircraft to lift up is hindered. Longer runways are needed to deal with those new circumstances. Moreover, the aircraft cargo carrying capacities could be reduced [243].
ii. Extreme precipitation
Severe raining and other disturbances of the visibility are resulting in disordered sequences of operations and cancelled flights. The takeoff by a visibility of zero is not acceptable and compromises like limited speed as possible in road network are not manageable in aviation. Additionally, extreme precipitation could cause disruptions to operations e.g. airfield flooding, ground subsidence, the reduction in airport throughput, inadequate drainage system capacity, the inundation of underground infrastructure (e.g. electrical), the inundation of ground transport access (passengers and staff) and the loss of local utilities provision (e.g. power).
iii. Floods
Airside infrastructure is just indirectly threatened by climate change. The trajectory is not affected by flooding at the ground. Nonetheless waterside airport facilities like the Lakefront Airport in New Orleans are protected by floodwalls to keep possible damage at a minimum. Flooded runways can cause difficulties in landing the airport safely. Just like mentioned above aquaplaning is reducing friction between the wheel and the wet runway and is hindering the brake application [244]. Additionally damaged facilities because of flooding can cause interruptions of operations.
In 2013 15 flights had been cancelled due to power outages at the airport of Gatwick in the United Kingdom induced by the flooding of airfield substations and the North Terminal. Transport for London stated to adapt new airport infrastructure, especially those below sea level to be prepared for the uncertainty of sea level rise and climate change [245].
iv. Snowfall
On the contrary to the increase of mean temperatures cold waves are appearing more freezing than usual airports are expecting them to be. In the following during past winters runways or airports as a whole had to be closed. The main task in times like these is to keep the runway free of ice. Airplanes could be hindered in slowing down as well as they are threatened by skipping of the feeder street while taxiing. To do so snow ploughs, snow blowers and runway sweepers are used in the first place to remove fallen snow of the landing strip. Furthermore to free the runway from ice Potassium- and Acetone-based de-icers are used. Alternatively strips heated by under lying aquifers are discussed to keep aviation running during cold waves [67].
Additionally aircrafts have to be prepared for freezing temperatures as well. A layer of ice or snow on the surface of the wing can disrupt aerodynamics of the vehicle. Longer take-offs and delays or even cancelled flights can be caused thereby. De-icing fluids are sprayed on the aircraft by special de-icing vehicles. Those glycol-based mixtures prevent the aircraft of the formation of new ice for a certain period of time, dependent on the weather conditions. The preparation is carried out at special pads. Thereby fluids are collected and recycled to produce new mixtures [246].
In January 2015 the Manchester Airport had to be closed for several hours because of heavy snowfall impairing visibility as well as safety conditions by producing a slippery runway. Prevailed by freezing temperatures of -13°C 4 British airports had to be closed and hundreds of flights were delayed in January 2013. The Airport of Nurnberg in Germany had been closed in 2010 after an aircraft skipped of the runway and was stuck in snow [247].
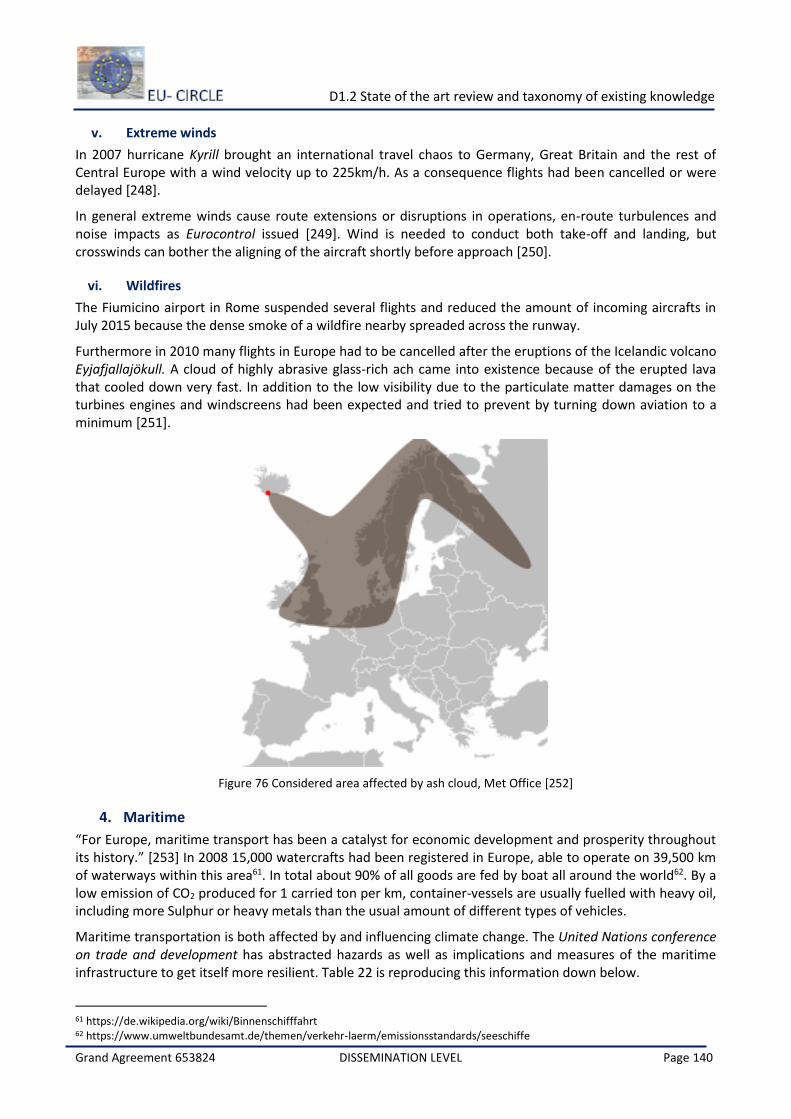
D1.2 State of the art review and taxonomy of existing knowledge
Grand Agreement 653824 DISSEMINATION LEVEL Page 140
v. Extreme winds
In 2007 hurricane Kyrill brought an international travel chaos to Germany, Great Britain and the rest of Central Europe with a wind velocity up to 225km/h. As a consequence flights had been cancelled or were delayed [248].
In general extreme winds cause route extensions or disruptions in operations, en-route turbulences and noise impacts as Eurocontrol issued [249]. Wind is needed to conduct both take-off and landing, but crosswinds can bother the aligning of the aircraft shortly before approach [250].
vi. Wildfires
The Fiumicino airport in Rome suspended several flights and reduced the amount of incoming aircrafts in July 2015 because the dense smoke of a wildfire nearby spreaded across the runway.
Furthermore in 2010 many flights in Europe had to be cancelled after the eruptions of the Icelandic volcano Eyjafjallajökull. A cloud of highly abrasive glass-rich ach came into existence because of the erupted lava that cooled down very fast. In addition to the low visibility due to the particulate matter damages on the turbines engines and windscreens had been expected and tried to prevent by turning down aviation to a minimum [251].
Figure 76 Considered area affected by ash cloud, Met Office [252]
4. Maritime
“For Europe, maritime transport has been a catalyst for economic development and prosperity throughout its history.” [253] In 2008 15,000 watercrafts had been registered in Europe, able to operate on 39,500 km of waterways within this area61. In total about 90% of all goods are fed by boat all around the world62. By a low emission of CO2 produced for 1 carried ton per km, container-vessels are usually fuelled with heavy oil, including more Sulphur or heavy metals than the usual amount of different types of vehicles.
Maritime transportation is both affected by and influencing climate change. The United Nations conference on trade and development has abstracted hazards as well as implications and measures of the maritime infrastructure to get itself more resilient. Table 22 is reproducing this information down below.
61 https://de.wikipedia.org/wiki/Binnenschifffahrt 62 https://www.umweltbundesamt.de/themen/verkehr-laerm/emissionsstandards/seeschiffe
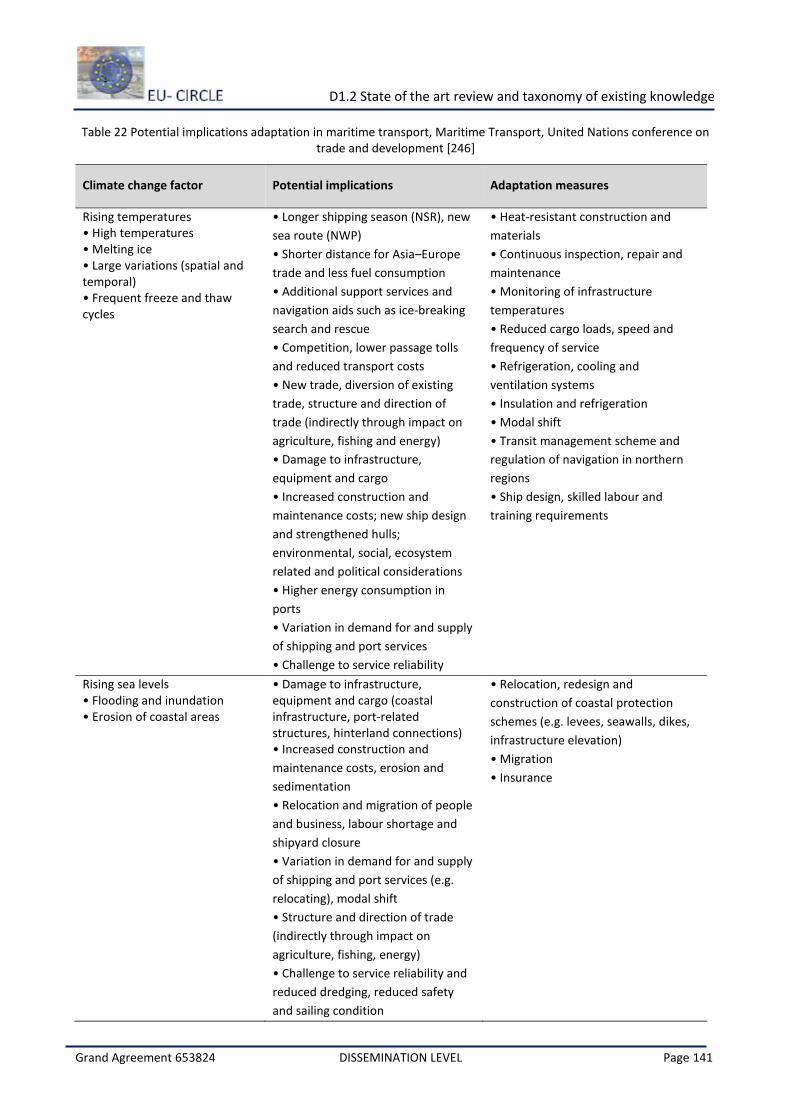
D1.2 State of the art review and taxonomy of existing knowledge
Grand Agreement 653824 DISSEMINATION LEVEL Page 141
Table 22 Potential implications adaptation in maritime transport, Maritime Transport, United Nations conference on trade and development [246]
Climate change factor Potential implications Adaptation measures
Rising temperatures • High temperatures • Melting ice • Large variations (spatial and temporal) • Frequent freeze and thaw cycles
• Longer shipping season (NSR), new
sea route (NWP)
• Shorter distance for Asia–Europe
trade and less fuel consumption
• Additional support services and
navigation aids such as ice-breaking
search and rescue
• Competition, lower passage tolls
and reduced transport costs
• New trade, diversion of existing
trade, structure and direction of
trade (indirectly through impact on
agriculture, fishing and energy)
• Damage to infrastructure,
equipment and cargo
• Increased construction and
maintenance costs; new ship design
and strengthened hulls;
environmental, social, ecosystem
related and political considerations
• Higher energy consumption in
ports
• Variation in demand for and supply
of shipping and port services
• Challenge to service reliability
• Heat-resistant construction and
materials
• Continuous inspection, repair and
maintenance
• Monitoring of infrastructure
temperatures
• Reduced cargo loads, speed and
frequency of service
• Refrigeration, cooling and
ventilation systems
• Insulation and refrigeration
• Modal shift
• Transit management scheme and
regulation of navigation in northern
regions
• Ship design, skilled labour and
training requirements
Rising sea levels • Flooding and inundation • Erosion of coastal areas
• Damage to infrastructure, equipment and cargo (coastal infrastructure, port-related structures, hinterland connections) • Increased construction and
maintenance costs, erosion and
sedimentation
• Relocation and migration of people
and business, labour shortage and
shipyard closure
• Variation in demand for and supply
of shipping and port services (e.g.
relocating), modal shift
• Structure and direction of trade
(indirectly through impact on
agriculture, fishing, energy)
• Challenge to service reliability and
reduced dredging, reduced safety
and sailing condition
• Relocation, redesign and
construction of coastal protection
schemes (e.g. levees, seawalls, dikes,
infrastructure elevation)
• Migration
• Insurance
D1.2 State of the art review and taxonomy of existing knowledge
Grand Agreement 653824 DISSEMINATION LEVEL Page 142
Extreme weather conditions
• Hurricanes
• Storms
• Floods
• Increased precipitation
• Wind
• Damage to infrastructure,
equipment and cargo (coastal
infrastructure, port-related
structures, hinterland connections)
• Erosion and sedimentation,
subsidence and landslide
• Damage to infrastructure,
equipment, cargo
• Relocation and migration of people
and business
• Labour shortage and shipyard
closure
• Reduced safety and sailing
conditions, challenge to service
reliability
• Modal shift, variation in demand
for and supply of shipping and port
services
• Change in trade structure and
direction
• Integrate emergency evacuation
procedures into operations
• Set up barriers and protection
structures
• Relocate infrastructure, ensure the
functioning of alternatives routes
• Increase monitoring of
infrastructure conditions
• Restrict development and
settlement in low-lying areas
• Construct slope-retention structures
• Prepare for service delays or
cancellations
• Strengthen foundations, raising dock
and wharf levels
• Smart technologies for abnormal
events detection
• New design for sturdier ship
i. Temperature
High temperatures and large variations, induced and intensified by climate change, are severely disturbing maritime transportation. Ships and equipment, especially metal based ones, are more prone to interferences because of the heat and inspection, repair and maintenance have to be done more continuously. Heat resistant material and constructions are needed to avoid these issues [254]. Additionally cooling systems and air condition is needed to transport perishables safely over long distances. But those effects can implicate new chances and challenges for the maritime transport sector. As a result of the melting of ice new waterways will come into being as they become passable [209]. Especially the thawing of the North Sea can change the cargo sector from scratch.
ii. Extreme precipitation
Just as similar as the examples mentioned above poor visual conditions caused by extreme precipitation can interfere and hinder the operating schedules of shipping. Concealed obstacles like covered bridges abutments can cause immense dangers. Interferences in the operating procedure can cost have to be accepted. In December 2015 a container vessel crashed the Friesenbrücke on the river Ems in Lower Saxony, Germany [255].
iii. Floods
In comparison to issues in shipping caused by low tide flooded waterways and harbours can interfere and hinder the operating schedules of that sector as well. By a stage close to the highest navigable water level shipping is just admissible with reduced speed or in the middle of the river. The crossing of bridges is dangerous because in case of high tide the ceiling of the bridge and the roof of the ship are converging strongly. Unpassable waterways are causing detour or delays as well as inadvertent demurrages and high costs of transportation. Floods, surges and strong waves are very challenging for sailors because of the erratic sea they are generating.
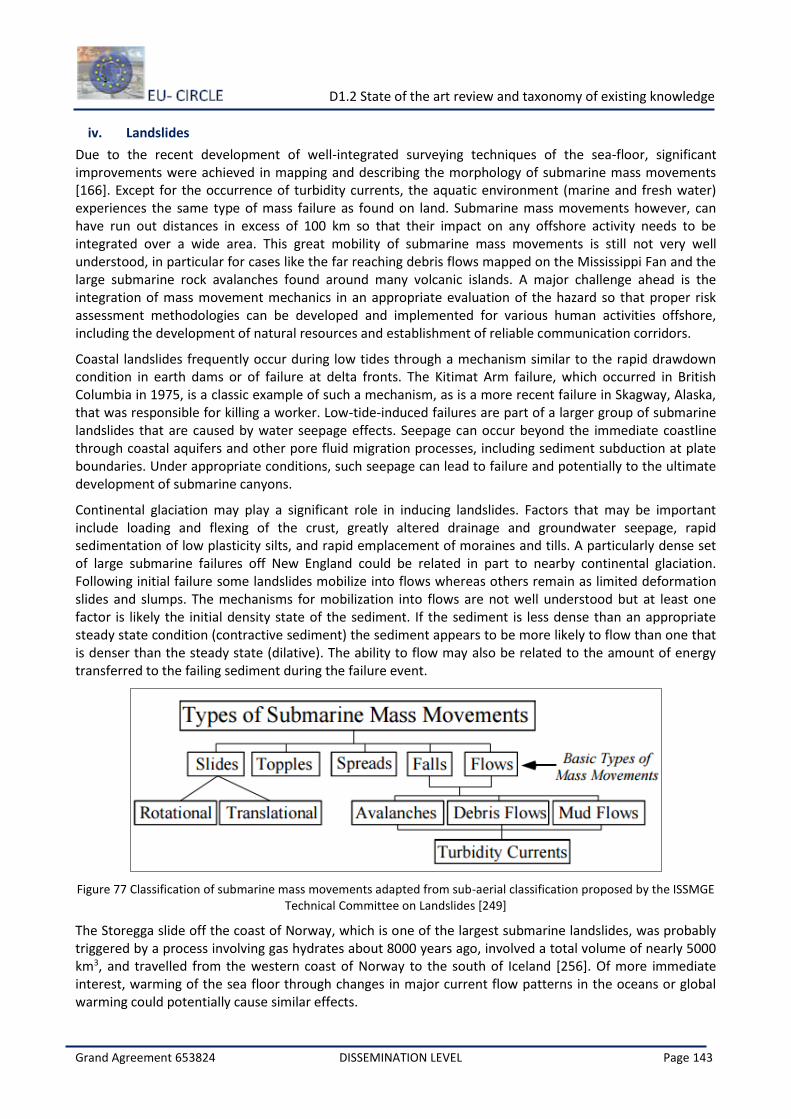
D1.2 State of the art review and taxonomy of existing knowledge
Grand Agreement 653824 DISSEMINATION LEVEL Page 143
iv. Landslides
Due to the recent development of well-integrated surveying techniques of the sea-floor, significant improvements were achieved in mapping and describing the morphology of submarine mass movements [166]. Except for the occurrence of turbidity currents, the aquatic environment (marine and fresh water) experiences the same type of mass failure as found on land. Submarine mass movements however, can have run out distances in excess of 100 km so that their impact on any offshore activity needs to be integrated over a wide area. This great mobility of submarine mass movements is still not very well understood, in particular for cases like the far reaching debris flows mapped on the Mississippi Fan and the large submarine rock avalanches found around many volcanic islands. A major challenge ahead is the integration of mass movement mechanics in an appropriate evaluation of the hazard so that proper risk assessment methodologies can be developed and implemented for various human activities offshore, including the development of natural resources and establishment of reliable communication corridors.
Coastal landslides frequently occur during low tides through a mechanism similar to the rapid drawdown condition in earth dams or of failure at delta fronts. The Kitimat Arm failure, which occurred in British Columbia in 1975, is a classic example of such a mechanism, as is a more recent failure in Skagway, Alaska, that was responsible for killing a worker. Low-tide-induced failures are part of a larger group of submarine landslides that are caused by water seepage effects. Seepage can occur beyond the immediate coastline through coastal aquifers and other pore fluid migration processes, including sediment subduction at plate boundaries. Under appropriate conditions, such seepage can lead to failure and potentially to the ultimate development of submarine canyons.
Continental glaciation may play a significant role in inducing landslides. Factors that may be important include loading and flexing of the crust, greatly altered drainage and groundwater seepage, rapid sedimentation of low plasticity silts, and rapid emplacement of moraines and tills. A particularly dense set of large submarine failures off New England could be related in part to nearby continental glaciation. Following initial failure some landslides mobilize into flows whereas others remain as limited deformation slides and slumps. The mechanisms for mobilization into flows are not well understood but at least one factor is likely the initial density state of the sediment. If the sediment is less dense than an appropriate steady state condition (contractive sediment) the sediment appears to be more likely to flow than one that is denser than the steady state (dilative). The ability to flow may also be related to the amount of energy transferred to the failing sediment during the failure event.
Figure 77 Classification of submarine mass movements adapted from sub-aerial classification proposed by the ISSMGE Technical Committee on Landslides [249]
The Storegga slide off the coast of Norway, which is one of the largest submarine landslides, was probably triggered by a process involving gas hydrates about 8000 years ago, involved a total volume of nearly 5000 km3, and travelled from the western coast of Norway to the south of Iceland [256]. Of more immediate interest, warming of the sea floor through changes in major current flow patterns in the oceans or global warming could potentially cause similar effects.
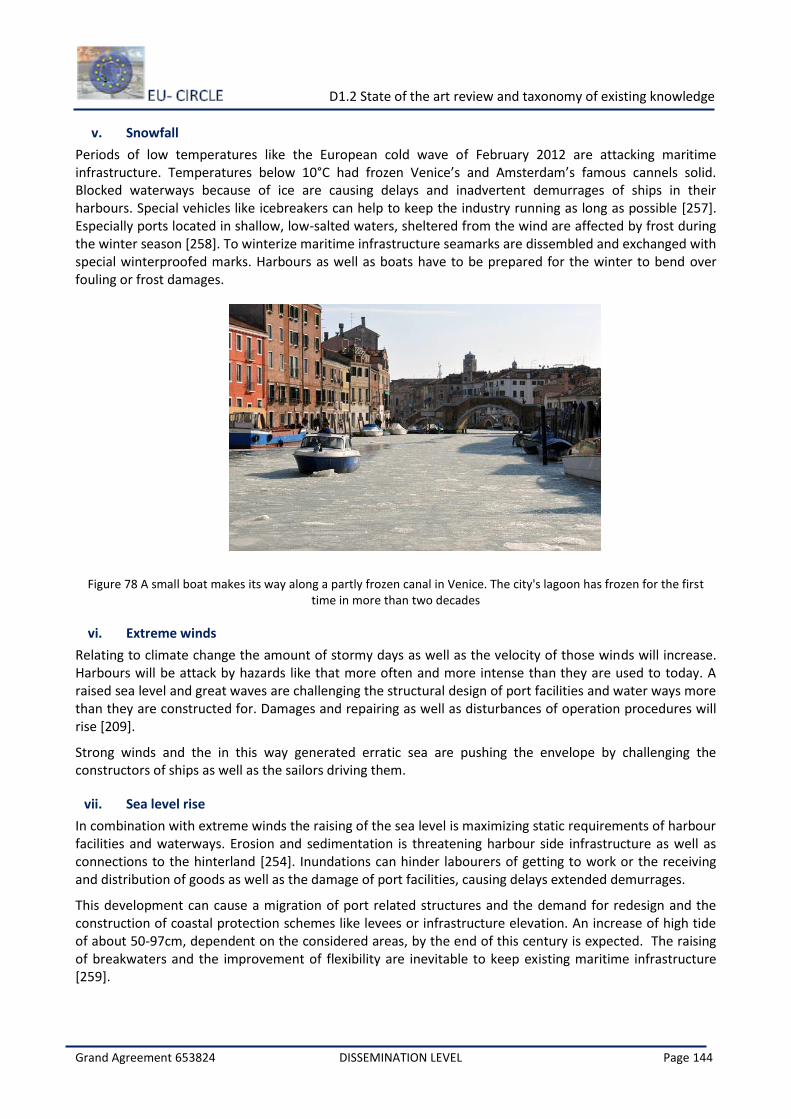
D1.2 State of the art review and taxonomy of existing knowledge
Grand Agreement 653824 DISSEMINATION LEVEL Page 144
v. Snowfall
Periods of low temperatures like the European cold wave of February 2012 are attacking maritime infrastructure. Temperatures below 10°C had frozen Venice’s and Amsterdam’s famous cannels solid. Blocked waterways because of ice are causing delays and inadvertent demurrages of ships in their harbours. Special vehicles like icebreakers can help to keep the industry running as long as possible [257]. Especially ports located in shallow, low-salted waters, sheltered from the wind are affected by frost during the winter season [258]. To winterize maritime infrastructure seamarks are dissembled and exchanged with special winterproofed marks. Harbours as well as boats have to be prepared for the winter to bend over fouling or frost damages.
Figure 78 A small boat makes its way along a partly frozen canal in Venice. The city's lagoon has frozen for the first time in more than two decades
vi. Extreme winds
Relating to climate change the amount of stormy days as well as the velocity of those winds will increase. Harbours will be attack by hazards like that more often and more intense than they are used to today. A raised sea level and great waves are challenging the structural design of port facilities and water ways more than they are constructed for. Damages and repairing as well as disturbances of operation procedures will rise [209].
Strong winds and the in this way generated erratic sea are pushing the envelope by challenging the constructors of ships as well as the sailors driving them.
vii. Sea level rise
In combination with extreme winds the raising of the sea level is maximizing static requirements of harbour facilities and waterways. Erosion and sedimentation is threatening harbour side infrastructure as well as connections to the hinterland [254]. Inundations can hinder labourers of getting to work or the receiving and distribution of goods as well as the damage of port facilities, causing delays extended demurrages.
This development can cause a migration of port related structures and the demand for redesign and the construction of coastal protection schemes like levees or infrastructure elevation. An increase of high tide of about 50-97cm, dependent on the considered areas, by the end of this century is expected. The raising of breakwaters and the improvement of flexibility are inevitable to keep existing maritime infrastructure [259].
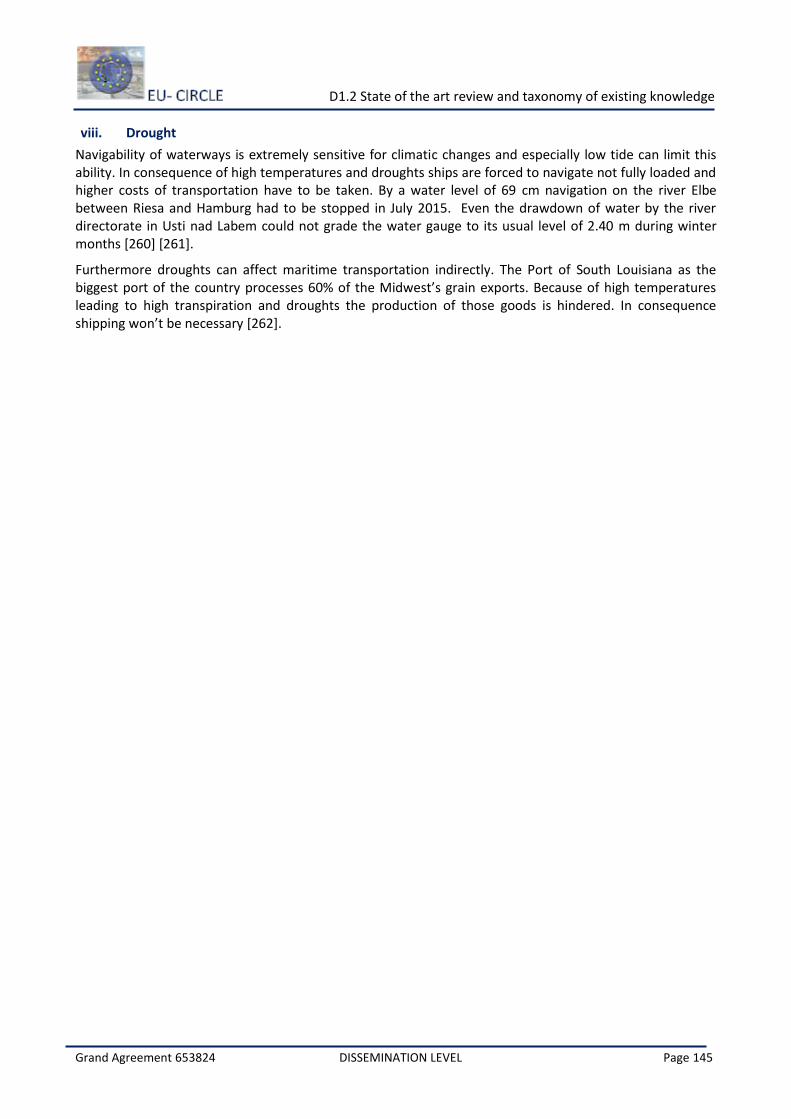
D1.2 State of the art review and taxonomy of existing knowledge
Grand Agreement 653824 DISSEMINATION LEVEL Page 145
viii. Drought
Navigability of waterways is extremely sensitive for climatic changes and especially low tide can limit this ability. In consequence of high temperatures and droughts ships are forced to navigate not fully loaded and higher costs of transportation have to be taken. By a water level of 69 cm navigation on the river Elbe between Riesa and Hamburg had to be stopped in July 2015. Even the drawdown of water by the river directorate in Usti nad Labem could not grade the water gauge to its usual level of 2.40 m during winter months [260] [261].
Furthermore droughts can affect maritime transportation indirectly. The Port of South Louisiana as the biggest port of the country processes 60% of the Midwest’s grain exports. Because of high temperatures leading to high transpiration and droughts the production of those goods is hindered. In consequence shipping won’t be necessary [262].
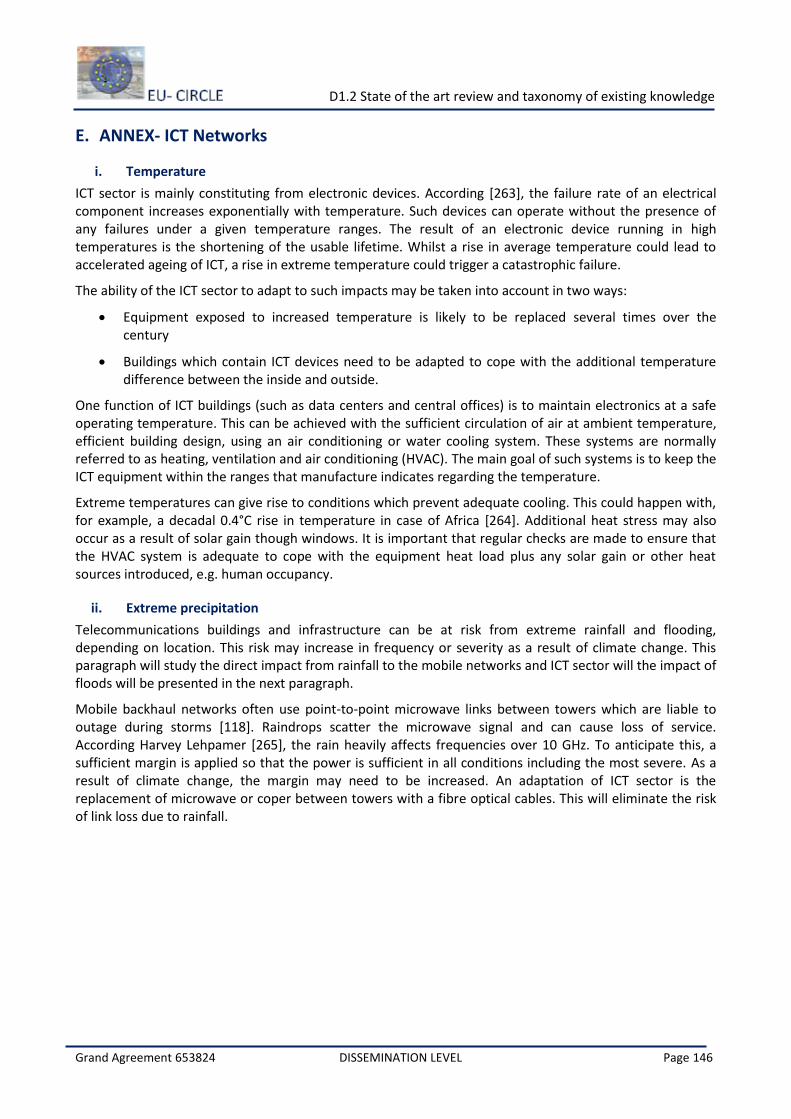
D1.2 State of the art review and taxonomy of existing knowledge
Grand Agreement 653824 DISSEMINATION LEVEL Page 146
E. ANNEX- ICT Networks
i. Temperature
ICT sector is mainly constituting from electronic devices. According [263], the failure rate of an electrical component increases exponentially with temperature. Such devices can operate without the presence of any failures under a given temperature ranges. The result of an electronic device running in high temperatures is the shortening of the usable lifetime. Whilst a rise in average temperature could lead to accelerated ageing of ICT, a rise in extreme temperature could trigger a catastrophic failure.
The ability of the ICT sector to adapt to such impacts may be taken into account in two ways:
Equipment exposed to increased temperature is likely to be replaced several times over the century
Buildings which contain ICT devices need to be adapted to cope with the additional temperature difference between the inside and outside.
One function of ICT buildings (such as data centers and central offices) is to maintain electronics at a safe operating temperature. This can be achieved with the sufficient circulation of air at ambient temperature, efficient building design, using an air conditioning or water cooling system. These systems are normally referred to as heating, ventilation and air conditioning (HVAC). The main goal of such systems is to keep the ICT equipment within the ranges that manufacture indicates regarding the temperature.
Extreme temperatures can give rise to conditions which prevent adequate cooling. This could happen with, for example, a decadal 0.4°C rise in temperature in case of Africa [264]. Additional heat stress may also occur as a result of solar gain though windows. It is important that regular checks are made to ensure that the HVAC system is adequate to cope with the equipment heat load plus any solar gain or other heat sources introduced, e.g. human occupancy.
ii. Extreme precipitation
Telecommunications buildings and infrastructure can be at risk from extreme rainfall and flooding, depending on location. This risk may increase in frequency or severity as a result of climate change. This paragraph will study the direct impact from rainfall to the mobile networks and ICT sector will the impact of floods will be presented in the next paragraph.
Mobile backhaul networks often use point-to-point microwave links between towers which are liable to outage during storms [118]. Raindrops scatter the microwave signal and can cause loss of service. According Harvey Lehpamer [265], the rain heavily affects frequencies over 10 GHz. To anticipate this, a sufficient margin is applied so that the power is sufficient in all conditions including the most severe. As a result of climate change, the margin may need to be increased. An adaptation of ICT sector is the replacement of microwave or coper between towers with a fibre optical cables. This will eliminate the risk of link loss due to rainfall.
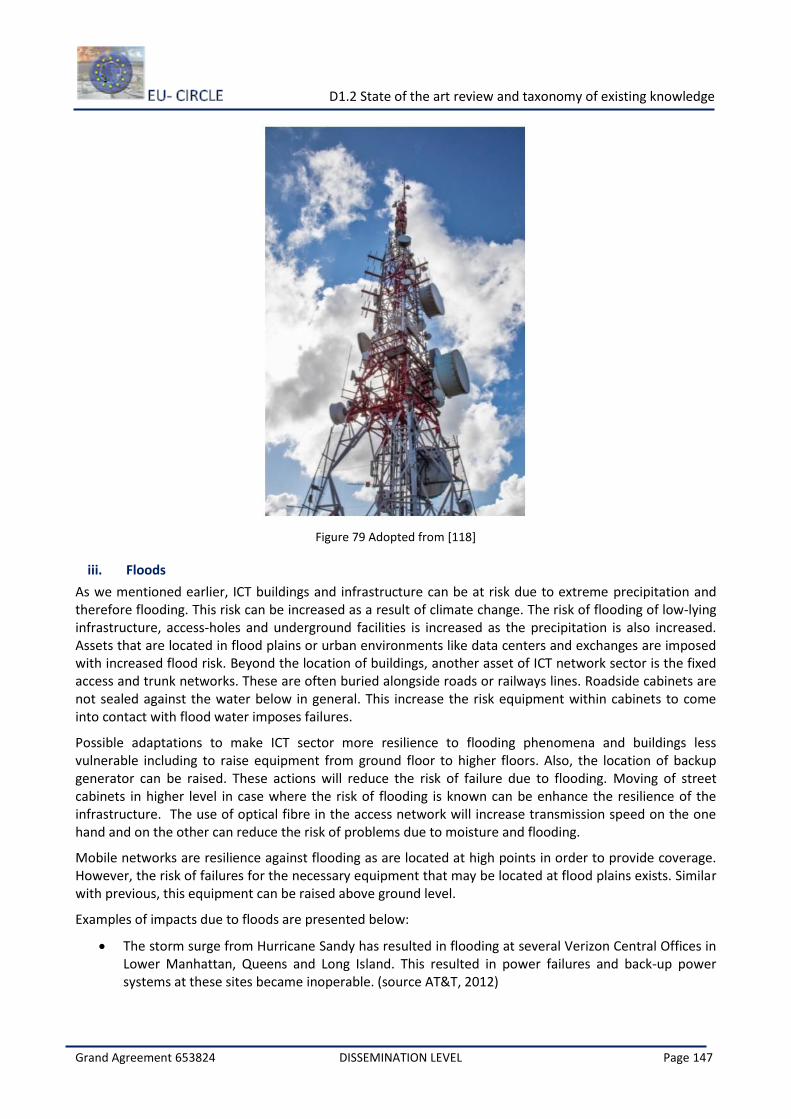
D1.2 State of the art review and taxonomy of existing knowledge
Grand Agreement 653824 DISSEMINATION LEVEL Page 147
Figure 79 Adopted from [118]
iii. Floods
As we mentioned earlier, ICT buildings and infrastructure can be at risk due to extreme precipitation and therefore flooding. This risk can be increased as a result of climate change. The risk of flooding of low-lying infrastructure, access-holes and underground facilities is increased as the precipitation is also increased. Assets that are located in flood plains or urban environments like data centers and exchanges are imposed with increased flood risk. Beyond the location of buildings, another asset of ICT network sector is the fixed access and trunk networks. These are often buried alongside roads or railways lines. Roadside cabinets are not sealed against the water below in general. This increase the risk equipment within cabinets to come into contact with flood water imposes failures.
Possible adaptations to make ICT sector more resilience to flooding phenomena and buildings less vulnerable including to raise equipment from ground floor to higher floors. Also, the location of backup generator can be raised. These actions will reduce the risk of failure due to flooding. Moving of street cabinets in higher level in case where the risk of flooding is known can be enhance the resilience of the infrastructure. The use of optical fibre in the access network will increase transmission speed on the one hand and on the other can reduce the risk of problems due to moisture and flooding.
Mobile networks are resilience against flooding as are located at high points in order to provide coverage. However, the risk of failures for the necessary equipment that may be located at flood plains exists. Similar with previous, this equipment can be raised above ground level.
Examples of impacts due to floods are presented below:
The storm surge from Hurricane Sandy has resulted in flooding at several Verizon Central Offices in Lower Manhattan, Queens and Long Island. This resulted in power failures and back-up power systems at these sites became inoperable. (source AT&T, 2012)
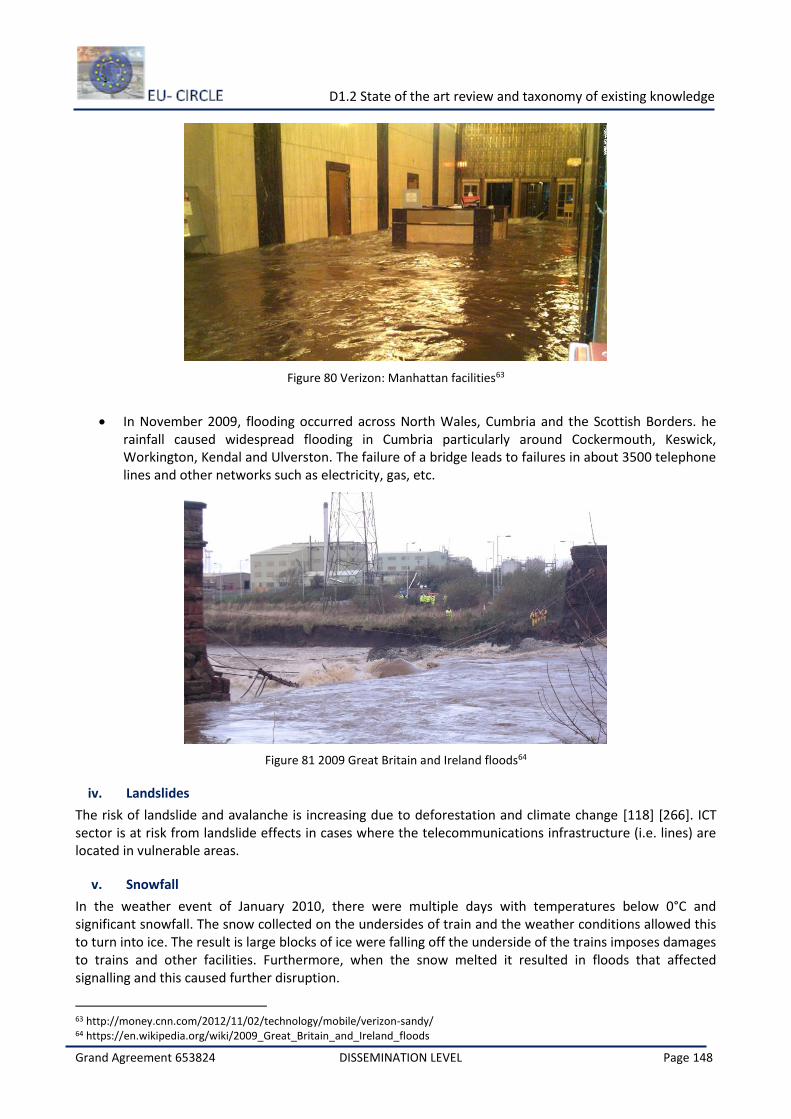
D1.2 State of the art review and taxonomy of existing knowledge
Grand Agreement 653824 DISSEMINATION LEVEL Page 148
Figure 80 Verizon: Manhattan facilities63
In November 2009, flooding occurred across North Wales, Cumbria and the Scottish Borders. he rainfall caused widespread flooding in Cumbria particularly around Cockermouth, Keswick, Workington, Kendal and Ulverston. The failure of a bridge leads to failures in about 3500 telephone lines and other networks such as electricity, gas, etc.
Figure 81 2009 Great Britain and Ireland floods64
iv. Landslides
The risk of landslide and avalanche is increasing due to deforestation and climate change [118] [266]. ICT sector is at risk from landslide effects in cases where the telecommunications infrastructure (i.e. lines) are located in vulnerable areas.
v. Snowfall
In the weather event of January 2010, there were multiple days with temperatures below 0°C and significant snowfall. The snow collected on the undersides of train and the weather conditions allowed this to turn into ice. The result is large blocks of ice were falling off the underside of the trains imposes damages to trains and other facilities. Furthermore, when the snow melted it resulted in floods that affected signalling and this caused further disruption.
63 http://money.cnn.com/2012/11/02/technology/mobile/verizon-sandy/ 64 https://en.wikipedia.org/wiki/2009_Great_Britain_and_Ireland_floods
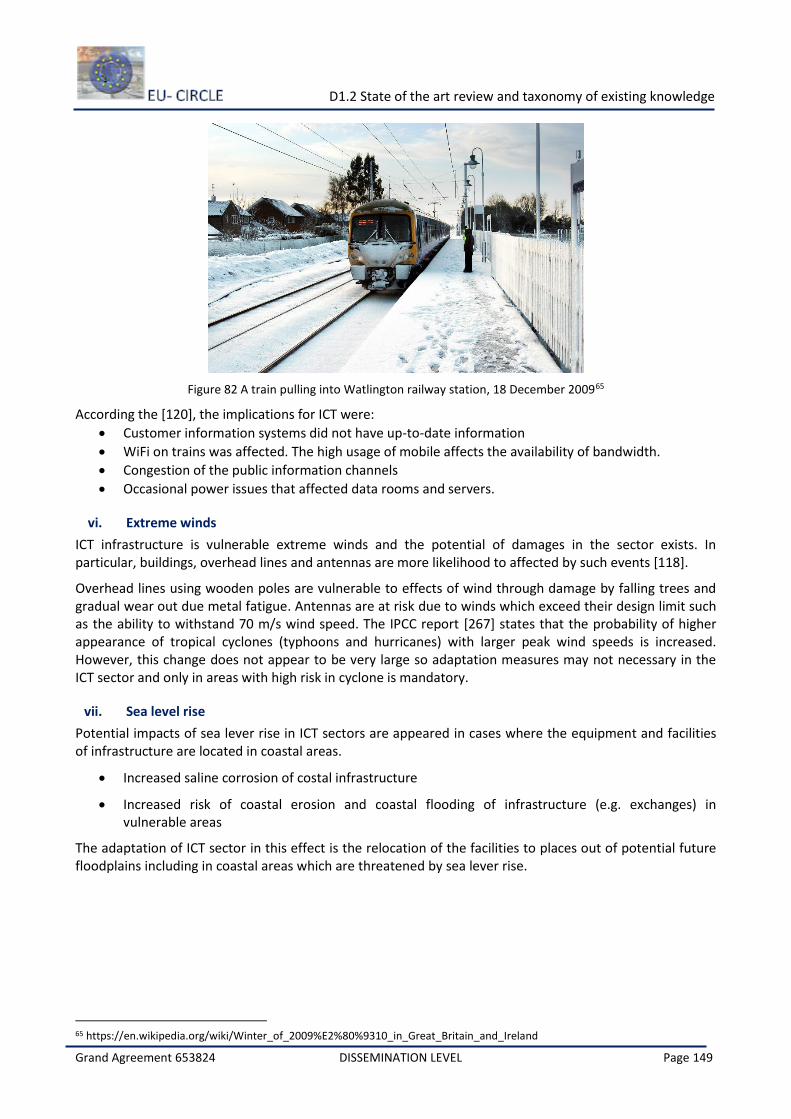
D1.2 State of the art review and taxonomy of existing knowledge
Grand Agreement 653824 DISSEMINATION LEVEL Page 149
Figure 82 A train pulling into Watlington railway station, 18 December 200965
According the [120], the implications for ICT were:
Customer information systems did not have up-to-date information
WiFi on trains was affected. The high usage of mobile affects the availability of bandwidth.
Congestion of the public information channels
Occasional power issues that affected data rooms and servers.
vi. Extreme winds
ICT infrastructure is vulnerable extreme winds and the potential of damages in the sector exists. In particular, buildings, overhead lines and antennas are more likelihood to affected by such events [118].
Overhead lines using wooden poles are vulnerable to effects of wind through damage by falling trees and gradual wear out due metal fatigue. Antennas are at risk due to winds which exceed their design limit such as the ability to withstand 70 m/s wind speed. The IPCC report [267] states that the probability of higher appearance of tropical cyclones (typhoons and hurricanes) with larger peak wind speeds is increased. However, this change does not appear to be very large so adaptation measures may not necessary in the ICT sector and only in areas with high risk in cyclone is mandatory.
vii. Sea level rise
Potential impacts of sea lever rise in ICT sectors are appeared in cases where the equipment and facilities of infrastructure are located in coastal areas.
Increased saline corrosion of costal infrastructure
Increased risk of coastal erosion and coastal flooding of infrastructure (e.g. exchanges) in vulnerable areas
The adaptation of ICT sector in this effect is the relocation of the facilities to places out of potential future floodplains including in coastal areas which are threatened by sea lever rise.
65 https://en.wikipedia.org/wiki/Winter_of_2009%E2%80%9310_in_Great_Britain_and_Ireland
D1.2 State of the art review and taxonomy of existing knowledge
Grand Agreement 653824 DISSEMINATION LEVEL Page 150
F. ANNEX- Buildings
Building characteristics and response
Buildings are one of the most important groups of elements at risk. They house the population and the behavior of a building under a hazard event, determines whether the people in the building might be injured or killed. In order to be able to assess the potential losses and degree of damage of buildings that are exposed to a certain type of hazardous event, it is important to define two things:
The type of negative effect that the event might have on the building which is exposed to it.
The characteristics of the building that define the degree of damage due to the hazard exposure.
The type of negative influence of the exposure can be in many different forms, which depend on the type of hazard that will occur. Various hazard processes may occur and have a different effect on buildings. The following types can be differentiated [268]:
Mass Impact: the building is impacted by phenomena that may have different characteristics:
o Speed of impact. This could vary from a slow impact, for instance by a slow moving lava flow, to an extremely fast impact (e.g. snow avalanche, rock fall, or pyroclastic flow)
o Medium of impact: impact can be by rock (rock fall), soil or debris (landslide), mud (volcanic lahar), snow, water (e.g. flashflood) or objects (e.g. airplane crash)
Wind impact: the building is impacted by air, which may also create un under-pressure or overpressure inside the building, which could lead to implosion/explosion of the building. Difference processes can be differentiated, such as tornadoes, cyclones or explosions.
Undercutting: the building loses support because the soil below the foundation is eroded away by erosion (e.g. along coastlines, or along river channels) or landslides.
Shaking: the building is subjective to ground shaking, as is the case in an earthquake.
Inundation: the building is flooded, which can be suddenly and violently, in which case also the impact effect of water is important (e.g. flashfloods or tsunami). The flooding can also be slow and with a long duration, which will have a deriorating effect on the construction materials of the building.
Fires: the building is subjected to fire, for instance in the case of a bushfire/forestfire, or in the case of an industrial accident.
Loss of support: the building is subsiding as a result of underground cavities (e.g. due to mining), liquefaction or because the building is on a slow landslide.
Gasses: the building is filled by toxic gasses, e.g. caused by industrial accidents nearby.
Covering by materials: the building is covered by materials which may weight on the roofs and would lead to roof collapse, as in the case of snow or volcanic ash.
To assign vulnerability functions to the construction classes defined in the exposure model, the following variables play important role [269]:
The construction class assigned, based on the information available in the exposure database
The seismic design level that defines the construction class load capacity and horizontal ductility capacity.
The number of floors and the general description of the stiffness of the building.
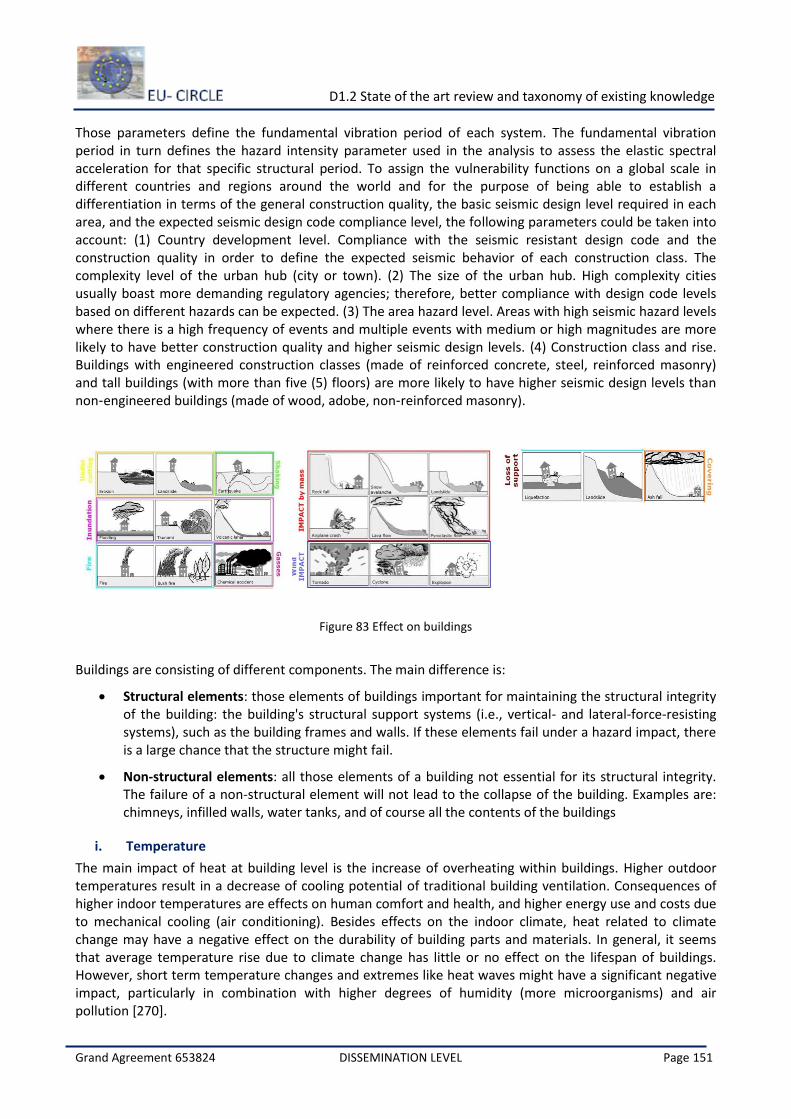
D1.2 State of the art review and taxonomy of existing knowledge
Grand Agreement 653824 DISSEMINATION LEVEL Page 151
Those parameters define the fundamental vibration period of each system. The fundamental vibration period in turn defines the hazard intensity parameter used in the analysis to assess the elastic spectral acceleration for that specific structural period. To assign the vulnerability functions on a global scale in different countries and regions around the world and for the purpose of being able to establish a differentiation in terms of the general construction quality, the basic seismic design level required in each area, and the expected seismic design code compliance level, the following parameters could be taken into account: (1) Country development level. Compliance with the seismic resistant design code and the construction quality in order to define the expected seismic behavior of each construction class. The complexity level of the urban hub (city or town). (2) The size of the urban hub. High complexity cities usually boast more demanding regulatory agencies; therefore, better compliance with design code levels based on different hazards can be expected. (3) The area hazard level. Areas with high seismic hazard levels where there is a high frequency of events and multiple events with medium or high magnitudes are more likely to have better construction quality and higher seismic design levels. (4) Construction class and rise. Buildings with engineered construction classes (made of reinforced concrete, steel, reinforced masonry) and tall buildings (with more than five (5) floors) are more likely to have higher seismic design levels than non‐engineered buildings (made of wood, adobe, non‐reinforced masonry).
Figure 83 Effect on buildings
Buildings are consisting of different components. The main difference is:
Structural elements: those elements of buildings important for maintaining the structural integrity of the building: the building's structural support systems (i.e., vertical- and lateral-force-resisting systems), such as the building frames and walls. If these elements fail under a hazard impact, there is a large chance that the structure might fail.
Non-structural elements: all those elements of a building not essential for its structural integrity. The failure of a non-structural element will not lead to the collapse of the building. Examples are: chimneys, infilled walls, water tanks, and of course all the contents of the buildings
i. Temperature
The main impact of heat at building level is the increase of overheating within buildings. Higher outdoor temperatures result in a decrease of cooling potential of traditional building ventilation. Consequences of higher indoor temperatures are effects on human comfort and health, and higher energy use and costs due to mechanical cooling (air conditioning). Besides effects on the indoor climate, heat related to climate change may have a negative effect on the durability of building parts and materials. In general, it seems that average temperature rise due to climate change has little or no effect on the lifespan of buildings. However, short term temperature changes and extremes like heat waves might have a significant negative impact, particularly in combination with higher degrees of humidity (more microorganisms) and air pollution [270].
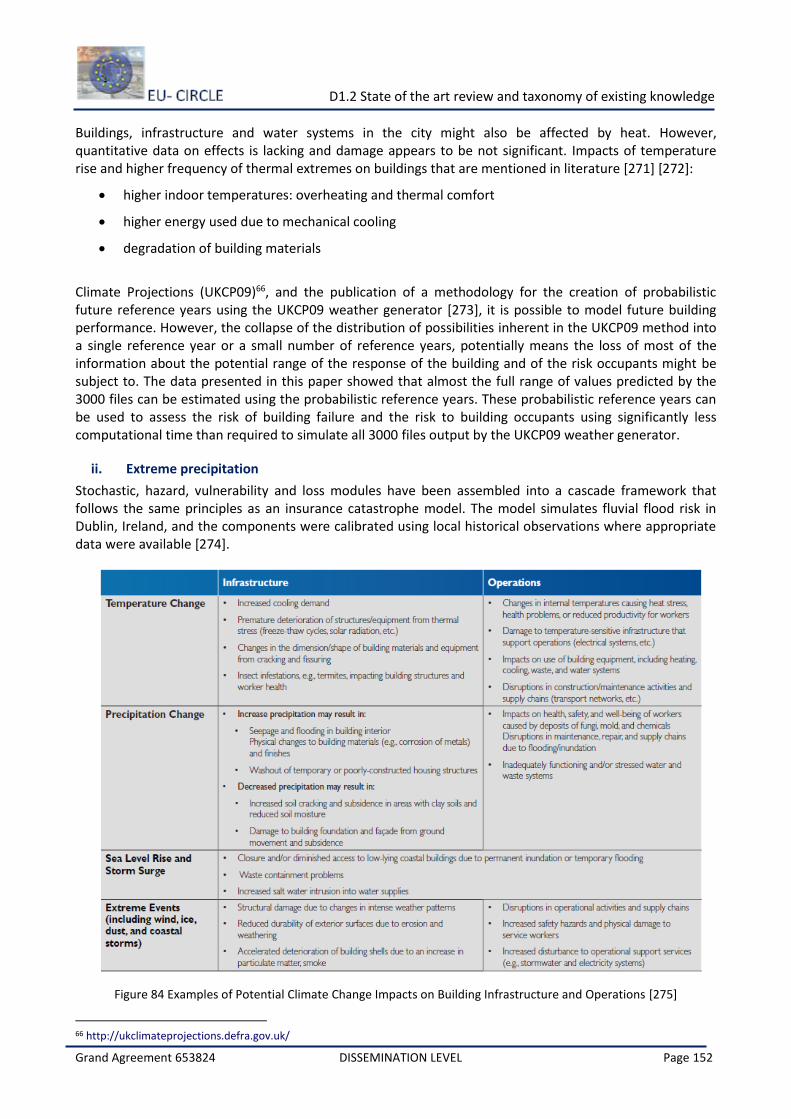
D1.2 State of the art review and taxonomy of existing knowledge
Grand Agreement 653824 DISSEMINATION LEVEL Page 152
Buildings, infrastructure and water systems in the city might also be affected by heat. However, quantitative data on effects is lacking and damage appears to be not significant. Impacts of temperature rise and higher frequency of thermal extremes on buildings that are mentioned in literature [271] [272]:
higher indoor temperatures: overheating and thermal comfort
higher energy used due to mechanical cooling
degradation of building materials
Climate Projections (UKCP09)66, and the publication of a methodology for the creation of probabilistic future reference years using the UKCP09 weather generator [273], it is possible to model future building performance. However, the collapse of the distribution of possibilities inherent in the UKCP09 method into a single reference year or a small number of reference years, potentially means the loss of most of the information about the potential range of the response of the building and of the risk occupants might be subject to. The data presented in this paper showed that almost the full range of values predicted by the 3000 files can be estimated using the probabilistic reference years. These probabilistic reference years can be used to assess the risk of building failure and the risk to building occupants using significantly less computational time than required to simulate all 3000 files output by the UKCP09 weather generator.
ii. Extreme precipitation
Stochastic, hazard, vulnerability and loss modules have been assembled into a cascade framework that follows the same principles as an insurance catastrophe model. The model simulates fluvial flood risk in Dublin, Ireland, and the components were calibrated using local historical observations where appropriate data were available [274].
Figure 84 Examples of Potential Climate Change Impacts on Building Infrastructure and Operations [275]
66 http://ukclimateprojections.defra.gov.uk/
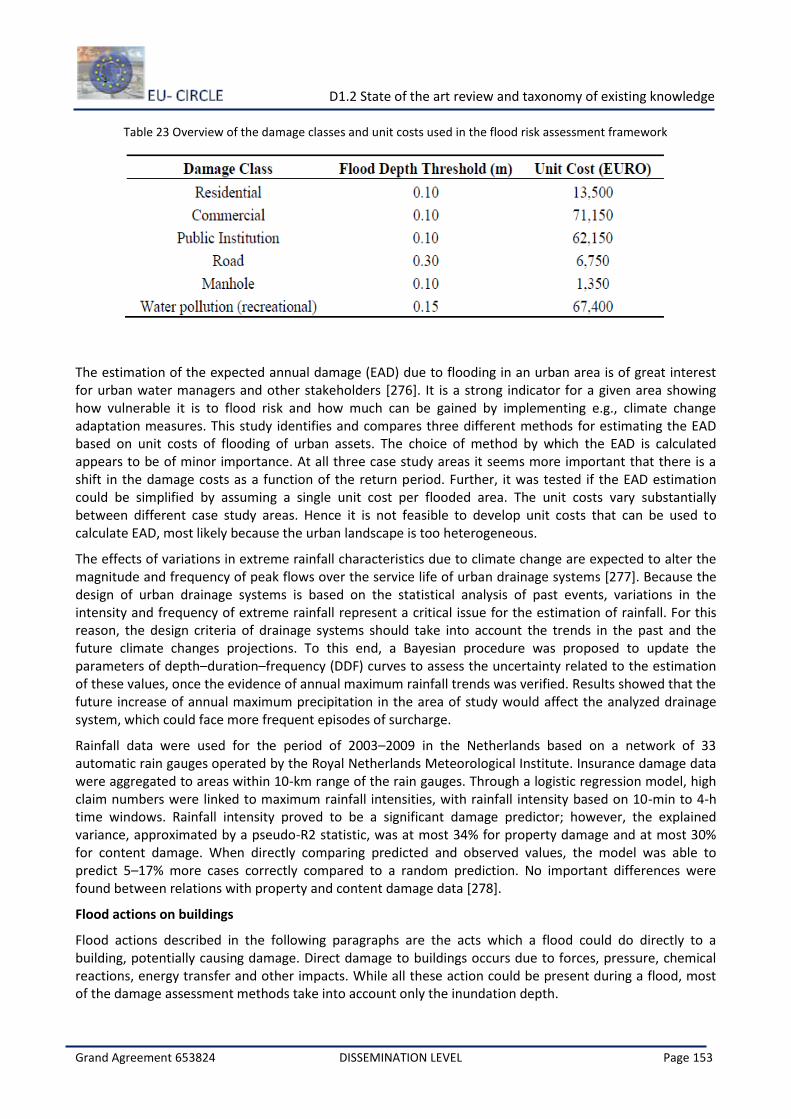
D1.2 State of the art review and taxonomy of existing knowledge
Grand Agreement 653824 DISSEMINATION LEVEL Page 153
Table 23 Overview of the damage classes and unit costs used in the flood risk assessment framework
The estimation of the expected annual damage (EAD) due to flooding in an urban area is of great interest for urban water managers and other stakeholders [276]. It is a strong indicator for a given area showing how vulnerable it is to flood risk and how much can be gained by implementing e.g., climate change adaptation measures. This study identifies and compares three different methods for estimating the EAD based on unit costs of flooding of urban assets. The choice of method by which the EAD is calculated appears to be of minor importance. At all three case study areas it seems more important that there is a shift in the damage costs as a function of the return period. Further, it was tested if the EAD estimation could be simplified by assuming a single unit cost per flooded area. The unit costs vary substantially between different case study areas. Hence it is not feasible to develop unit costs that can be used to calculate EAD, most likely because the urban landscape is too heterogeneous.
The effects of variations in extreme rainfall characteristics due to climate change are expected to alter the magnitude and frequency of peak flows over the service life of urban drainage systems [277]. Because the design of urban drainage systems is based on the statistical analysis of past events, variations in the intensity and frequency of extreme rainfall represent a critical issue for the estimation of rainfall. For this reason, the design criteria of drainage systems should take into account the trends in the past and the future climate changes projections. To this end, a Bayesian procedure was proposed to update the parameters of depth–duration–frequency (DDF) curves to assess the uncertainty related to the estimation of these values, once the evidence of annual maximum rainfall trends was verified. Results showed that the future increase of annual maximum precipitation in the area of study would affect the analyzed drainage system, which could face more frequent episodes of surcharge.
Rainfall data were used for the period of 2003–2009 in the Netherlands based on a network of 33 automatic rain gauges operated by the Royal Netherlands Meteorological Institute. Insurance damage data were aggregated to areas within 10-km range of the rain gauges. Through a logistic regression model, high claim numbers were linked to maximum rainfall intensities, with rainfall intensity based on 10-min to 4-h time windows. Rainfall intensity proved to be a significant damage predictor; however, the explained variance, approximated by a pseudo-R2 statistic, was at most 34% for property damage and at most 30% for content damage. When directly comparing predicted and observed values, the model was able to predict 5–17% more cases correctly compared to a random prediction. No important differences were found between relations with property and content damage data [278].
Flood actions on buildings
Flood actions described in the following paragraphs are the acts which a flood could do directly to a building, potentially causing damage. Direct damage to buildings occurs due to forces, pressure, chemical reactions, energy transfer and other impacts. While all these action could be present during a flood, most of the damage assessment methods take into account only the inundation depth.
D1.2 State of the art review and taxonomy of existing knowledge
Grand Agreement 653824 DISSEMINATION LEVEL Page 154
Hydrostatic actions
(1) Lateral pressure. The lateral pressure results from differences in interior and exterior water surface elevations. (2) Capillary rise. Capillary rise can cause damage higher than the level that flood water has contacted the building’s components.
Buoyancy
The buoyant forces are the vertical uplift of the structure due to the displacement of water. When the buoyant forces exceed the weight of the building components and the connections to the foundation, the structure may float from its foundation. The floating building or parts of the building can be displaced by hydrodynamic actions or the lateral pressure causing damage and destabilization
iii. Floods
Damage to buildings from flooding is caused by a number of factors:
Type: different flood types may cause different degrees of damage to buildings and their contents, e.g. coastal flooding, riverine flooding, flashflood. They will determine a number of the following factors.
Velocity: fast flowing waters will have the capacity to impact the structure, and the lateral forces caused by the flood may produce collapse of buildings. High velocity floods may cause erosion/scouring of embankments, slopes, levees, and building foundations;
Height: flood depth is an important factor as it will determine how much of the building will be submerged under water, and together with the velocity will determine the impulse of flooding. Impulse is velocity multiplied by height.
Duration: flood duration is very important in relation to the construction materials of the building and the way they may deteriorate under the influence of water. For example masonry buildings will be heavily affected by salt water in the case of coastal flooding, which may have a long duration effect on the building.
Sediment: the amount of sediments will determine the way in which a building and its contents is damaged and it will determine the clean-up costs.
Pollution: polluted water will have a deteriorating effect on buildings and its contents. The following building characteristics are important for determining the damage due to flooding:
Building use: the use of the building will determine the number of people present in the building in different periods of time, and the contents and the value of the contents. This was already discussed in the previous section of this session.
Building materials: the type of building materials will determine how they behave under water saturation, also with a long duration. Wood and masonry materials will have substantial large damage compared to steel or concrete.
Structural type: the structural type, as mentioned in the previous section will determine whether the building can withstand the impact of fast floods.
Height above the ground: the height above the surface will determine the degree of flooding and which types of building contents are damaged.
Maintenance level. As discussed before poor maintenance weakens the building.
Location of doors and openings: the location of openings will determine if and where flood waters can enter the building.
Presence of a basement: the presence of a basement, and whether a basement has windows or not will determine the degree of damage even when the floodwaters are very low.
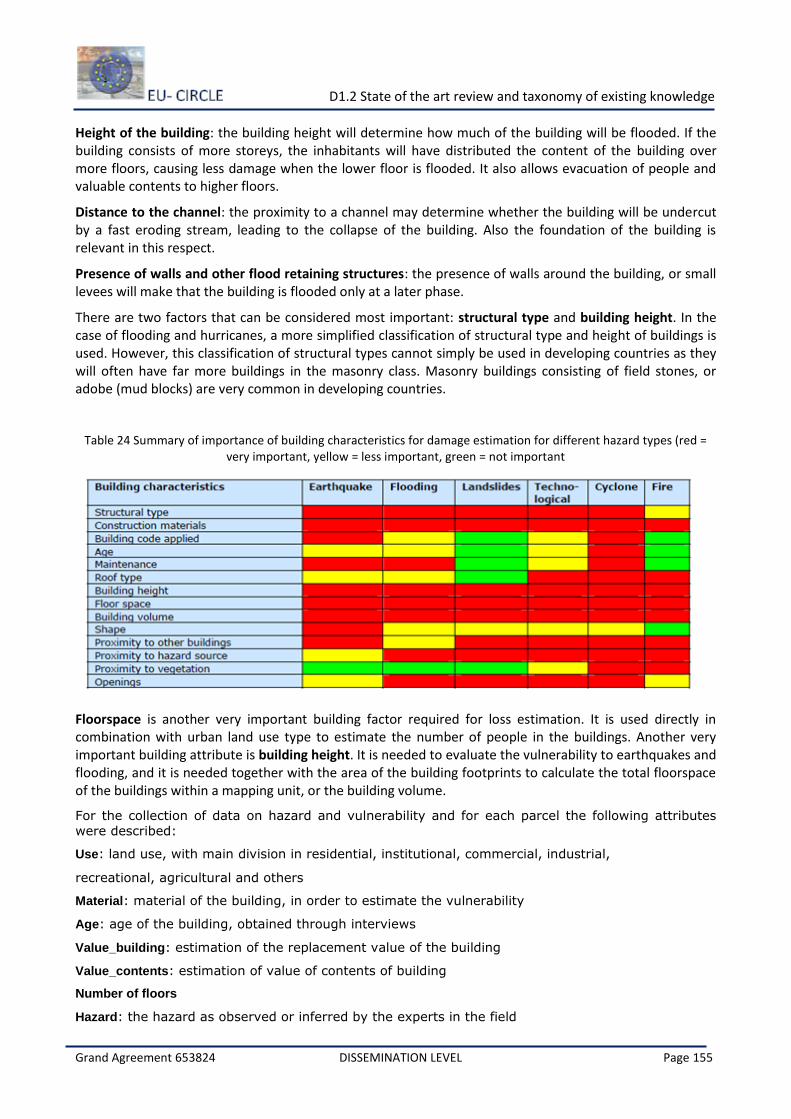
D1.2 State of the art review and taxonomy of existing knowledge
Grand Agreement 653824 DISSEMINATION LEVEL Page 155
Height of the building: the building height will determine how much of the building will be flooded. If the building consists of more storeys, the inhabitants will have distributed the content of the building over more floors, causing less damage when the lower floor is flooded. It also allows evacuation of people and valuable contents to higher floors.
Distance to the channel: the proximity to a channel may determine whether the building will be undercut by a fast eroding stream, leading to the collapse of the building. Also the foundation of the building is relevant in this respect.
Presence of walls and other flood retaining structures: the presence of walls around the building, or small levees will make that the building is flooded only at a later phase.
There are two factors that can be considered most important: structural type and building height. In the case of flooding and hurricanes, a more simplified classification of structural type and height of buildings is used. However, this classification of structural types cannot simply be used in developing countries as they will often have far more buildings in the masonry class. Masonry buildings consisting of field stones, or adobe (mud blocks) are very common in developing countries.
Table 24 Summary of importance of building characteristics for damage estimation for different hazard types (red = very important, yellow = less important, green = not important
Floorspace is another very important building factor required for loss estimation. It is used directly in combination with urban land use type to estimate the number of people in the buildings. Another very important building attribute is building height. It is needed to evaluate the vulnerability to earthquakes and flooding, and it is needed together with the area of the building footprints to calculate the total floorspace of the buildings within a mapping unit, or the building volume.
For the collection of data on hazard and vulnerability and for each parcel the following attributes
were described:
Use: land use, with main division in residential, institutional, commercial, industrial,
recreational, agricultural and others
Material: material of the building, in order to estimate the vulnerability
Age: age of the building, obtained through interviews
Value_building: estimation of the replacement value of the building
Value_contents: estimation of value of contents of building
Number of floors
Hazard: the hazard as observed or inferred by the experts in the field
D1.2 State of the art review and taxonomy of existing knowledge
Grand Agreement 653824 DISSEMINATION LEVEL Page 156
Damage: reported damage due to natural or human-induced hazardous events.
In the case of flooding, vulnerability functions were used to relate flooding depths with expected degrees of damage, using information for the construction of the buildings and for the contents of each building separately. On the basis of historical information, flood depth maps were generated for different return periods. These were combined with the vulnerability values and the cost information for the generation of cost maps. These were combined with the probability information in order to derive annual risk maps.
The assessment of coastal flood risks in a particular region requires the estimation of typical damages caused by storm surges of certain characteristics and annualities. Although the damage depends on a multitude of factors, including flow velocity, duration of flood, precaution, etc., the relationship between flood events and the corresponding average damages is usually described by a stage-damage function, which considers the maximum water level as the only damage influencing factor. For small events, the macroscopic damage function mostly depends on the properties of the elevation model, while for large events it strongly depends on the assumed building damage function. In general, the damage in the case study increases exponentially up to a certain level and then less steep [279].
Extreme floods are influenced by climate change in two ways: via sea level rise and via meteorological changes. The distribution of extreme sea levels is translated via the damage function into the distribution of damages, i.e., the probability that a damage higher than a certain value occurs is related to the probability that the annual maximum flood exceeds a certain level. Additionally, climate change could alter meteorological patterns, which induces a change of variability of extreme events and in turn affects the damage distribution. Most commonly, a damage function describes the damage to an asset, given a certain inundation depth, either as a percentage damage rate (relative) or as a monetary value (absolute). When one wants to calculate the total damage from a certain flood event, the inundation heights at each asset in the affected region need to be determined (e.g., by hydrodynamic modeling) and the single damages (obtained by small-scale damage functions) are aggregated. We call such a damage function, providing the total damage in a case study region as a function of the sea level, macroscopic. Expressions have been derived for the expected damage from coastal floods and its standard deviation for a general case study region as a function of varying location and scale parameters. The findings are complemented with the corresponding expressions as a function of the protection height, i.e., the value below which any damage is suppressed. Flood damage functions describe the relationship between hydraulic parameters and the relative damage or damage factor of the element at risk. Three different scale levels are defined micro, meso and macro [280].
The algorithm for estimating direct physical damage to the general building stock is quite simple, and is computed for each occupancy class in a given census block, with default damage functions along with estimated water depths _either riverine or coastal_ to determine the associated percent damage. The estimated percent damage is then multiplied by the total replacement value or the depreciated replacement value of the occupancy class in question to produce estimates of total damage, or total depreciated damage [281].
A categorization of different flood types and sources is given [282]:
River floods – River floods occur when a water stream carries excessive water, which may leave the river bed. They generally occur due to heavy rainfall in the river catchment, sometimes in combination with other causes, e.g. snow melt, blockage of the river bed by ice jams, landslides or a breach in a flood protection structure. River floods may be categorised as “slow rising” or “flash flood”. The former occur in the lower course of rivers and are characterised by slow water rise and slow water flow velocity. Slow rising floods can usually be predicted several hours or days in advance, thus allowing emergency risk management measures to be put in place, e.g. evacuations and local flood barriers. In contrast, flash floods occur in mountainous regions and are characterised by very quick water rise, high water flow velocity and debris flow. They are generally the consequence of extreme rainfall, but can also have other causes, e.g. landslides into a water basin. The warning time before a flash flood is often very short.
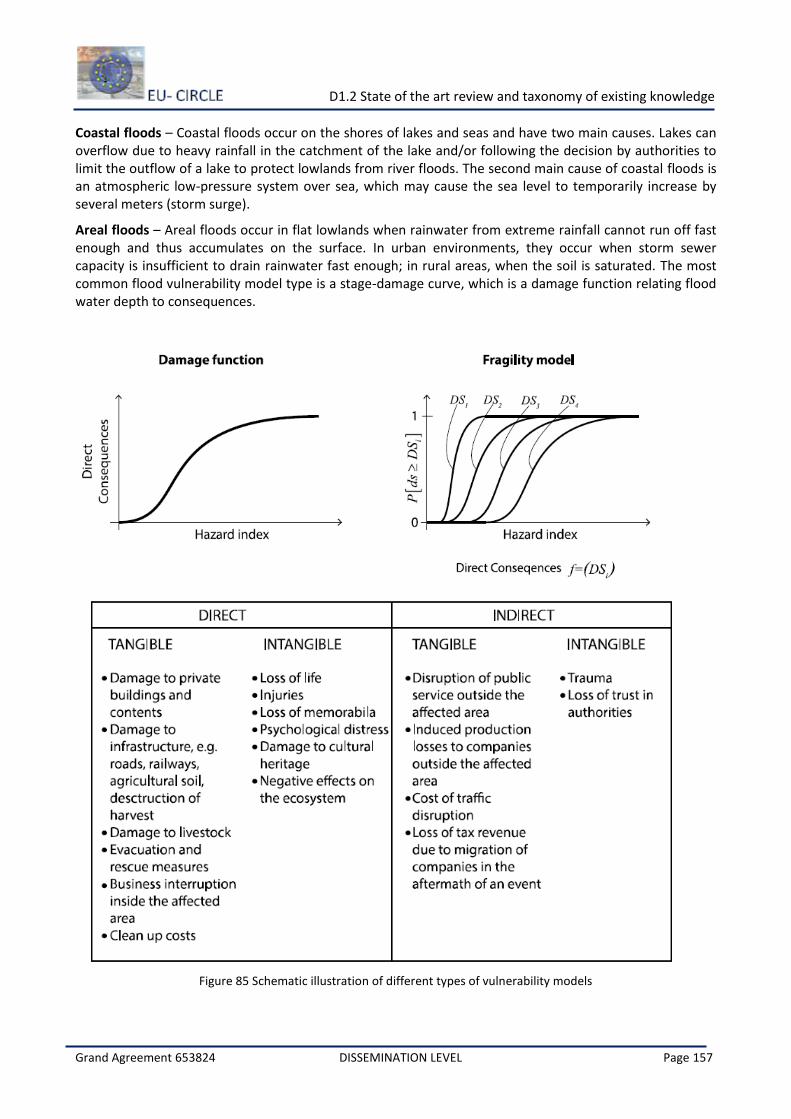
D1.2 State of the art review and taxonomy of existing knowledge
Grand Agreement 653824 DISSEMINATION LEVEL Page 157
Coastal floods – Coastal floods occur on the shores of lakes and seas and have two main causes. Lakes can overflow due to heavy rainfall in the catchment of the lake and/or following the decision by authorities to limit the outflow of a lake to protect lowlands from river floods. The second main cause of coastal floods is an atmospheric low-pressure system over sea, which may cause the sea level to temporarily increase by several meters (storm surge).
Areal floods – Areal floods occur in flat lowlands when rainwater from extreme rainfall cannot run off fast enough and thus accumulates on the surface. In urban environments, they occur when storm sewer capacity is insufficient to drain rainwater fast enough; in rural areas, when the soil is saturated. The most common flood vulnerability model type is a stage-damage curve, which is a damage function relating flood water depth to consequences.
Figure 85 Schematic illustration of different types of vulnerability models
D1.2 State of the art review and taxonomy of existing knowledge
Grand Agreement 653824 DISSEMINATION LEVEL Page 158
Two common vulnerability modelling approaches are the damage function approach and fragility approach. Ιn the damage function approach, consequences are modelled in function of one or more hazard indices. Damage functions can either be relative (expressing consequences as a percentage of the value of the underlying asset) or absolute (consequences are directly expressed in monetary terms), and they are often derived from statistical analysis of empirical damage data from past hazard events. Alternatively, damage functions can be determined through expert knowledge with what-if analyses and engineering models on hypothetical systems. In the second type of vulnerability modelling, the fragility approach, consequences are characterised in two modelling steps. In the first step, a fragility model describes the probability of the system being in a physical damage state i DS (physical damages may be defined in descriptive terms, e.g. “No damage”, “Cracking in walls and broken windows”, “Partial wall failure”, “Total collapse”) for given hazard index. In the second step, the direct consequences D are quantified in function of the physical damage state of the system, D [ f /DSi ]. Similar to damage functions, fragility models can be statistically inferred from empirical damage data. However, when considering engineered systems, it is common to characterise the probability of the system being in each damage state with an engineering model.
Building characteristics with the largest influence on flood damage include building type, building material and whether flood proofing measures are in place. Building type indicators can include information on the occupancy of the building (i.e. residential, commercial or industrial), on the construction type, (e.g. detached house, row house, terrace house, apartment house) and the number of stories. The role of building material is emphasised where a categorisation of buildings according to their vulnerability is proposed. The building material is relevant in two regards: firstly, it is decisive in determining how fast water infiltrates the building; secondly, when the building is subject to large hydrostatic and hydrodynamic pressure, structural damage may occur depending on the building material. Next to the main building characteristics, relatively minor building details play a significant role in determining vulnerability. For instance, the presence or absence of a basement, window or an airbrick can determine whether building interiors get flooded or not [283].
Flood actions on a building follow from flood characteristics in proximity of the building, i.e. water depth, water flow velocity, flood rise rate and flood duration, debris flow and water contamination. Water depth is the flood characteristic with the largest correlation with damages, followed by water flow velocity, event duration and water contamination. Moreover, large emphasis is given to the flood rise rate and the water head differential, i.e. the difference between water depth inside and outside a building. According to an expert survey, flood water depth and contaminant content are the most relevant flood characteristics for damage estimation. According to other research water flow velocity is only relevant in rare cases of structural failure. Water flow velocity shows limited correlation with building damage, and indicates that derived criteria combining water depth and water flow velocity perform better in explaining damages. From the multitude of flood actions a variety of damage mechanisms arise; Most important damage mechanisms are: physical and chemical deterioration through water contact, failure of an external wall or windows from lateral hydrostatic and hydrodynamic pressure, contamination, scour of foundation and buoyancy. Damage to building components from water contact can arise through a number of different chemical or physical processes, e.g. metal corrosion, wood rotting, etc.
Loss functions define the relationship between flood damage and certain characteristics of a flood. Flood damage to infrastructure is assessed as the cost of repairing infrastructure to that of pre-flood conditions. The two most significant factors that determine the extent of flood damage are the size of the flood, in terms of volume of water that flows through the flood-plain, and the length of roads, drains, and other structures, within the boundaries of the flood-line. Flood damage estimates for drains, levees, roads, tramlines, spillways and bridges for the major floods between 1984 and 1993. Estimates were based on the actual flood repair cost for floods, which occurred in the past, and were adapted to present conditions (improved levees and spillway) and escalated to 1994 values [284].
D1.2 State of the art review and taxonomy of existing knowledge
Grand Agreement 653824 DISSEMINATION LEVEL Page 159
Damage functions
In developing flood damage models two main approaches can be distinguished: empirical approaches which use damage data collected after flood events and synthetic approaches which use damage data collected via what-if-questions. What-if analyses estimate the damage which is expected in case of a certain flood situation, e.g.: “Which damage would you expect if the water depth was 2 m above the building floor?” It is possible to combine both approaches or to evaluate synthetic models with empirical data. Both approaches have advantages and disadvantages. Besides the choice of empirical or synthetic damage functions, a choice has to be made between relative or absolute functions. Which of both approaches is chosen may depend on the kind of available data. A further possibility are index values, e.g. the damage may be expressed as an equivalent to the number of median-sized family houses totally destroyed.
iv. Landslides
Landslide vulnerability assessment
Lack of useful hazard intensity scales. Μass movements are a wide variety of processes (fall, slide, flow, creep, spread) that may occur under different conditions and with different velocities. Therefore it is very difficult to find good scales for expressing the hazard intensity of landslides. Attempts have been made to use velocity, impact (rockfall), depth (debris flow) or volume as hazard indicators, but still there is no universal hazard intensity scale that is applicable everywhere.
Lack of historical damage databases. Mass movements generally occur as isolated features that do not cover very large areas, and therefore it is difficult to use direct observations of damage in order to build vulnerability curves. It is not really possible to use aggregated damage data over large areas, because the hazard types are different and the elements at risk are very different.
V = 1. Mass movements very often result in collapse or burial of the buildings that are directly in the path or on top of a fast moving landslide, therefore very often a vulnerability of 1 is used. In practice most of the methods for landslide vulnerability assessment use an expert opinion approach.
v. Snowfall
EN 1991-1-3 provides guidance for the determination of the snow load to be used for the structural design of buildings and civil engineering works for sites at altitudes under 1500 m. In the case of altitudes above 1500 m advice may be found in the appropriate National Annex. Snow loads in general are classified as variable/accidental, direct, fixed, static actions. The snow load on the roof is derived from the snow load on the ground (sk), multiplying by appropriate conversion factors (shape, thermal and exposure coefficients). EN 1991-1-3 does not give guidance on the following specialist aspects of snow loading: “impact loads” due to snow sliding off or falling from a higher roof;‰ additional wind loads resulting from changes in shape or size of the roof profile due to presence of snow or to the accretion of ice; ‰ loads in areas where snow is present all the year; ‰ loads due to ice; ‰ lateral loading due to snow (e.g. lateral loads due to dirfts); ‰ snow loads on bridges. The snow load on the roof is derived from the snow load on the ground , multiplying by appropriate conversion factors (shape, thermal and exposure coefficients).
The risk of structural failure from snow load is influenced by the characteristics of the building. Some roof structures and materials are more susceptible to snow-induced collapse than others. Building configurations create conditions in which drifting and sliding snow may pose a risk.
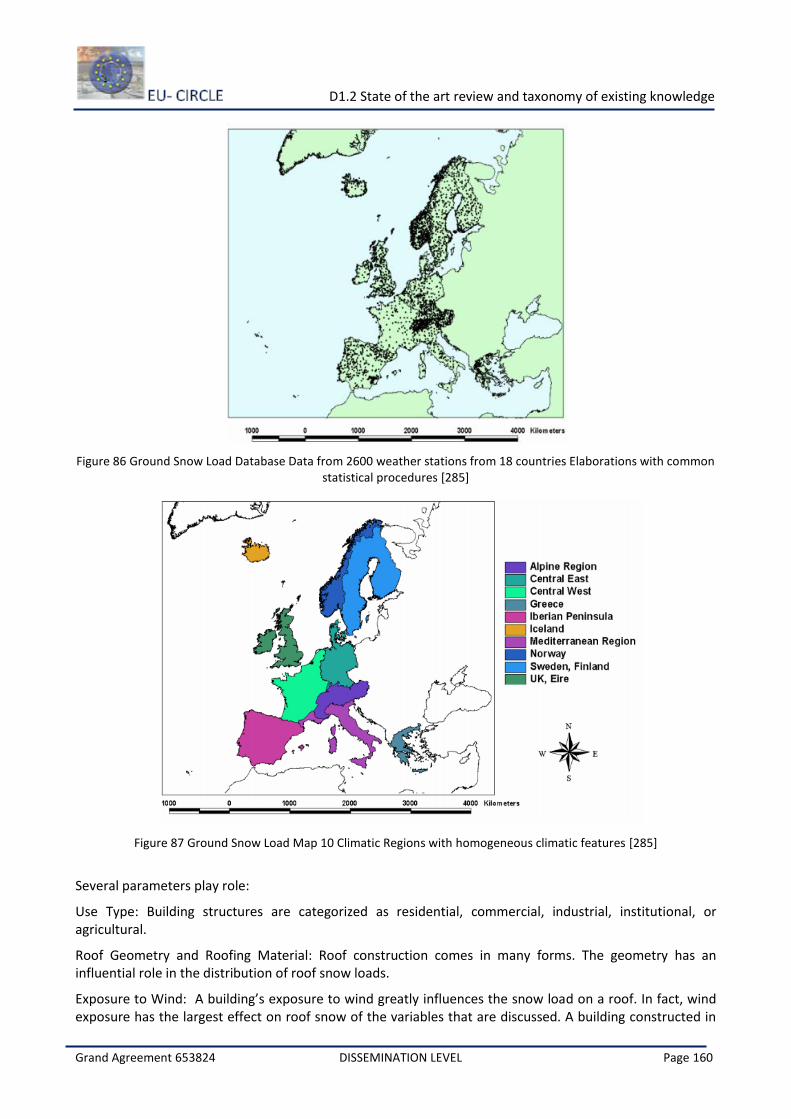
D1.2 State of the art review and taxonomy of existing knowledge
Grand Agreement 653824 DISSEMINATION LEVEL Page 160
Figure 86 Ground Snow Load Database Data from 2600 weather stations from 18 countries Elaborations with common statistical procedures [285]
Figure 87 Ground Snow Load Map 10 Climatic Regions with homogeneous climatic features [285]
Several parameters play role:
Use Type: Building structures are categorized as residential, commercial, industrial, institutional, or agricultural.
Roof Geometry and Roofing Material: Roof construction comes in many forms. The geometry has an influential role in the distribution of roof snow loads.
Exposure to Wind: A building’s exposure to wind greatly influences the snow load on a roof. In fact, wind exposure has the largest effect on roof snow of the variables that are discussed. A building constructed in
D1.2 State of the art review and taxonomy of existing knowledge
Grand Agreement 653824 DISSEMINATION LEVEL Page 161
an open area is less likely to retain snow on the roof than a building in a sheltered location. However, wind also dictates snow drifting. If a building in an open area has varying roof elevations, parapets, or rooftop equipment, snow drifting may occur at these locations resulting in an unbalanced loading condition.
Insulation: A roof assembly’s thermal properties affect roof snow load in several ways. A well-insulated or well-ventilated roof typically retains more snow than a poorly insulated roof or a roof over a poorly ventilated attic. Well-insulated roofs do not permit heat from within a building to melt roof snow from beneath. Similarly, a well-ventilated attic space has a temperature similar to ambient air; therefore, as illustrated in the bottom graphic of
Age and Building Code Considerations Knowing the age or approximate age of a building is valuable in determining the structural basis of design for the roof framing with regard to snow loads.
Roof Conditions: Span length, structure, material.
Alpine hazards such as debris flow, floods, snow avalanches, rock falls, and landslides pose a significant threat to local communities. The assessment of the vulnerability of the built environment to these hazards in the context of risk analysis is a topic that is growing in importance due to global environmental change impacts as well as socioeconomic changes. Hence, the vulnerability is essential for the development of efficient risk reduction strategies. The assessment of the intensity of the debris flow has been done on the basis of the deposition height. However, more parameters, such as velocity or pressure, play also a very important role and are commonly assessed by modeling analysis because real measurements of these parameters are mostly not available from the event records. Nevertheless, due to lack of other field data, the intensity is assessed on the basis of the debris height in the present study. The degree of loss is expressed as the percentage of the value of the building that was lost due to the impact of the process. Thus, this requires evaluating the impact on the building in form of damaging costs, which are often not recorded after an event, as well as the building values.
The vulnerability of the element at risk is defined by its damage level expressed on a scale from 0 (no damage) to 1 (total destruction). The vulnerability of a building depends on its structure and flow features (geometry, mechanical properties, type of avalanche, topography, etc.). This makes it difficult to obtain vulnerability relations. Most existing vulnerability relations have been built from field observations. The damage cannot have a general definition adapted for all civil engineering structures. Loaded by a snow avalanche, the failure mode of a structure is control by its technology, the construction materials used and its geometry. To define a suitable damage index for a given structure, a preliminary mechanical study is required to identify the relevant structure response [286].
Analyses on probable maximum losses in avalanche-prone areas of the municipality of Davos (CH) were used as an indicator for the long-term development of values at risk. Even if the results were subject to significant uncertainties, they underlined the dependency of today’s risk on the historical development of land-use: Small changes in the lateral extent of endangered areas had a considerable impact on the exposure of values. In a second step, temporal variations in damage potential between 1950 and 2000 were compared in two different study areas representing typical alpine socio-economic development patterns: Davos (CH) and Galtur (A). The resulting trends were found to be similar; the damage potential increased significantly in number and value. Thus, the development of natural risk in settlements can for a major part be attributed to long-term shifts in potential [287].
vi. Extreme winds
EN 1991-1-4 gives guidance on the determination of natural wind actions for the structural design of building and civil engineering works for each of the loaded areas under consideration. This includes the whole structure or parts of the structure or elements attached to the structure, e.g. components, cladding units and their fixings, safety and noise barriers. Wind Actions are classified as variable, fixed, direct actions. According to the structural response: - quasi-static response (the majority of building structures) -
D1.2 State of the art review and taxonomy of existing knowledge
Grand Agreement 653824 DISSEMINATION LEVEL Page 162
dynamic aeroelastic response (lightweight structures e.g. steel chimneys). The field application of EN 1991-1-4 for buildings with maximum height 200m and for bridges with maximum span 200 m.
Vulnerability functions for wind caused by cyclones enable estimating the mean damage ratio (MDR) for different maximum wind velocities sustained for five (5) seconds at a reference height of 10 meters above ground level on a relatively flat terrain.
Defining the geometry and physical characteristics of each construction class, in terms of roofing, outer walls, windows, and other elements susceptible to damage caused by cyclone winds.
Estimating the approximate resistance and capacity of the main individual components for each construction class for resisting the pressure or suction forces imposed by the wind. In general, this estimation is made for engineered construction classes with a high design level.
Determining the distribution of maximum pressure on the different components for each construction class, for varying levels of reference maximum wind velocity (corresponding to the estimated hazard intensity parameter)
Estimating an expected damage sequence according to the capacity‐demand ratios of the critical components.
Assessing the total damage level for each intensity level, stated in terms of mean damage ratios, taking into account the weighting that the damage represents out of the total value of the building.
Given that, for a global risk model, the exposure data resolution is very limited and does not allow the level of detail required for considering all of the above variables, this study has assigned vulnerability functions that are representative of the construction classes. For analysis at a global level, the vulnerability functions given by HAZUS are considered to be the set of curves for a high construction quality level, corresponding, in this case, to typical constructions in the United States, which generally include specific design requirements for wind resistance (in United States areas prone to hurricanes).
Damage bands are developed for 1-3 story (low-rise) buildings as well as 4-10 story (mid-rise) buildings. The damage bands reveal that the wind damage response of individual 1-3 story buildings is most easily distinguished in the 43-60 m/s (sustained one-min mean) wind regime and that above 73 m/s sustained one-minute wind speed, 1-3 story buildings experience near-total destruction of their superstructures, with the damage response of the most wind-resistant and least wind-resistant building approaching each other. In contrast, the damage response of individual mid-rise buildings is most easily distinguished in the 60}81 m/s wind regime, and continues to depend largely upon the components and connections. Wind damage bands form the basis for new methods of wind damage prediction of individual buildings and groups of buildings, wind damage mitigation, and emergency management planning.
Winter storms are the costliest natural hazard for European residential property. Four distinct storm damage functions are compared with respect to their forecast accuracy and variability, with particular regard to the most severe winter storms. The analysis focuses on daily loss estimates under differing spatial aggregation, ranging from district to country level. The performance of the storm loss models is evaluated for two sources of wind gust data, direct observations by the German Weather Service and ERAInterim reanalysis data. While the choice of gust data has little impact on the evaluation of German storm loss, spatially resolved coefficients of variation reveal dependence between model and data choice [288].
A methodology for the disaggregation of a generic vulnerability curve into several curves that cover various range of building classes has been developed. The methodology disaggregates the generic vulnerability curve of a particular region based on loss data and the building inventory of the region as well as the relative methodology can provide a quick estimate of the detailed building vulnerabilities for a region with minimum available information [289].
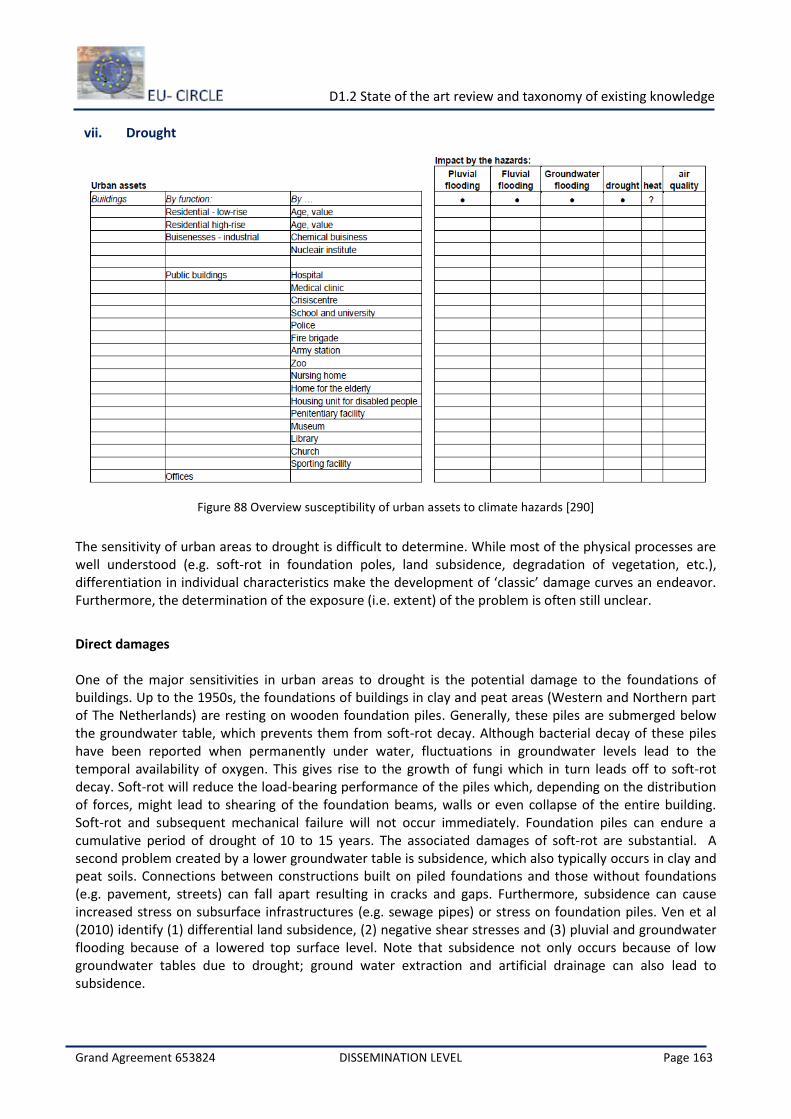
D1.2 State of the art review and taxonomy of existing knowledge
Grand Agreement 653824 DISSEMINATION LEVEL Page 163
vii. Drought
Figure 88 Overview susceptibility of urban assets to climate hazards [290]
The sensitivity of urban areas to drought is difficult to determine. While most of the physical processes are well understood (e.g. soft-rot in foundation poles, land subsidence, degradation of vegetation, etc.), differentiation in individual characteristics make the development of ‘classic’ damage curves an endeavor. Furthermore, the determination of the exposure (i.e. extent) of the problem is often still unclear.
Direct damages One of the major sensitivities in urban areas to drought is the potential damage to the foundations of buildings. Up to the 1950s, the foundations of buildings in clay and peat areas (Western and Northern part of The Netherlands) are resting on wooden foundation piles. Generally, these piles are submerged below the groundwater table, which prevents them from soft-rot decay. Although bacterial decay of these piles have been reported when permanently under water, fluctuations in groundwater levels lead to the temporal availability of oxygen. This gives rise to the growth of fungi which in turn leads off to soft-rot decay. Soft-rot will reduce the load-bearing performance of the piles which, depending on the distribution of forces, might lead to shearing of the foundation beams, walls or even collapse of the entire building. Soft-rot and subsequent mechanical failure will not occur immediately. Foundation piles can endure a cumulative period of drought of 10 to 15 years. The associated damages of soft-rot are substantial. A second problem created by a lower groundwater table is subsidence, which also typically occurs in clay and peat soils. Connections between constructions built on piled foundations and those without foundations (e.g. pavement, streets) can fall apart resulting in cracks and gaps. Furthermore, subsidence can cause increased stress on subsurface infrastructures (e.g. sewage pipes) or stress on foundation piles. Ven et al (2010) identify (1) differential land subsidence, (2) negative shear stresses and (3) pluvial and groundwater flooding because of a lowered top surface level. Note that subsidence not only occurs because of low groundwater tables due to drought; ground water extraction and artificial drainage can also lead to subsidence.
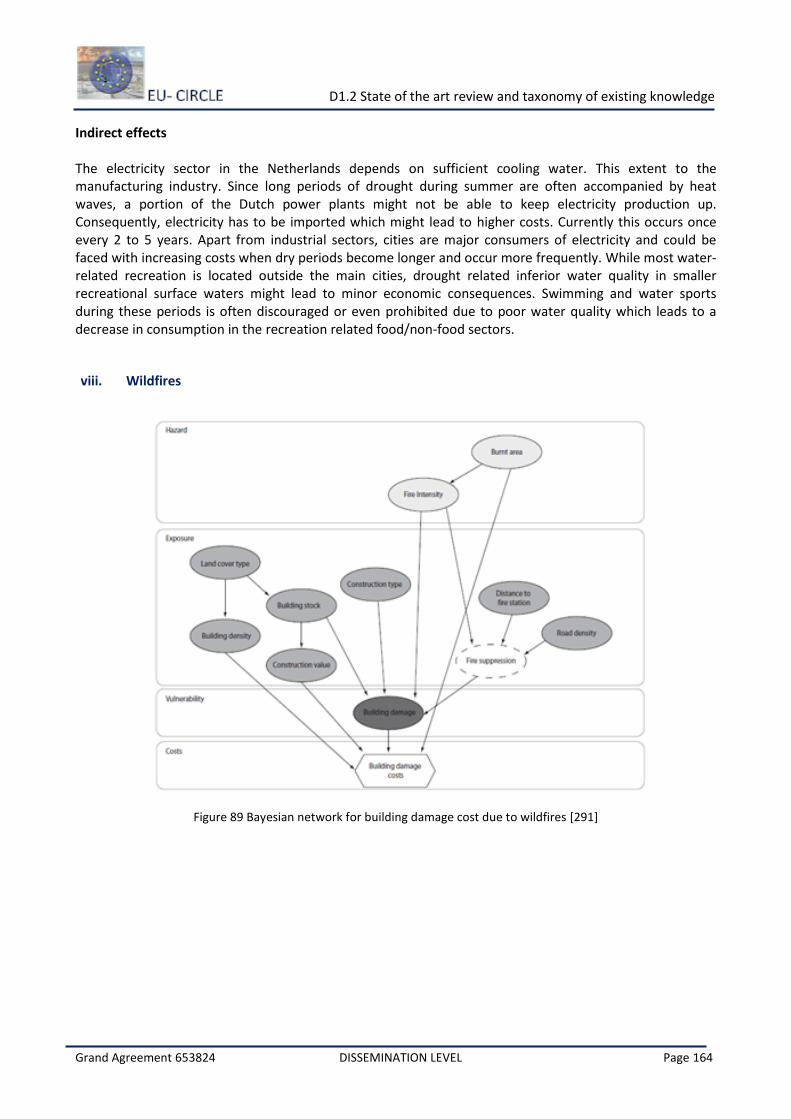
D1.2 State of the art review and taxonomy of existing knowledge
Grand Agreement 653824 DISSEMINATION LEVEL Page 164
Indirect effects The electricity sector in the Netherlands depends on sufficient cooling water. This extent to the manufacturing industry. Since long periods of drought during summer are often accompanied by heat waves, a portion of the Dutch power plants might not be able to keep electricity production up. Consequently, electricity has to be imported which might lead to higher costs. Currently this occurs once every 2 to 5 years. Apart from industrial sectors, cities are major consumers of electricity and could be faced with increasing costs when dry periods become longer and occur more frequently. While most water-related recreation is located outside the main cities, drought related inferior water quality in smaller recreational surface waters might lead to minor economic consequences. Swimming and water sports during these periods is often discouraged or even prohibited due to poor water quality which leads to a decrease in consumption in the recreation related food/non-food sectors.
viii. Wildfires
Figure 89 Bayesian network for building damage cost due to wildfires [291]