Papyrus harvesting and temporal biomass regeneration potential in Winam Gulf of Lake Victoria
Upload
khangminh22Category
view
2download
0
Journal of the Geographical Association of Tanzania, Vol. 36 No. 2: 73–88
Cyperus papyrus in Lake Victoria: Genetic Information,
Utilisation and Resource Sustainability
Justin Lusasi*
Abstract
Many wetlands in the Lake Victoria basin are dominated by Cyperuspapyrus, which are very productive and, therefore, have an important roleboth ecologically and socially. The increasing harvesting pressure ofpapyrus threatens its future. Thus, a conservation approach was employedto determine the intensity of the pressure and threat to the papyrusdiversity at clonal level. Eight microsatellite loci were used for analysingthe clonal diversity and genetic diversity of Cyperus papyrus in 6 swampsof Mwanza bay (Tanzania) and 5 swamps of Nyanza bay (Kenya). From304 individuals, we observed a total of 49 alleles in Mwanza bay and 44alleles in Nyanza bay, a high clonal diversity (R = 0.64 to 1 Mwanza bayand R=0.70 to 1 in Nyanza bay), and a high genetic diversity (HE) with anaverage of 0.558 and 0.493 for Mwanza and Nyanza bay, respectively. Theanalysis of molecular variance showed that most of the allelic varianceswere within individuals. This resulted in a moderate differentiation (FST,0.126 and Nm, 1.7) from all studied population in Lake Victoria. Gene flowwas high between populations within each bay of the Lake (Nm > 4). Theobserved disturbance in the swamps showed no effects on any of thepapyrus diversity variables. The clonal diversity (R) was even higher in thedisturbed swamps than in pristine ones, with values ranging from 0.78 to 1for disturbed, and 0.64 to 1 for pristine swamps. This explains that,although it is a clonal plant, papyrus maintains sexual reproduction andsuccessful seed dispersal, making them resilient to even strongenvironmental and anthropogenic disturbance.
Keywords: Cyperus papyrus, macrophytes, resilience, disturbed,harvesting, diverse
Introduction
Wetlands are described as intermediate areas of neither fully terrestrial
nor fully aquatic. They are the most productive ecosystems with a wide
range of natural functions, which are valuable to humanity. Unfortunately,
they are the most threatened due to their vulnerability and attractiveness
to development (Hollis et al., 1988).
* Department of Geography, Stella Maris Mtwara University College (STEMMUCO):

Justin Lusasi
74
Since wetlands are characterised by vegetation type, water and soil conditions,
influences such as presence or absence of grazing biotic groups—for example,
fish, macro invertebrates and amphibians—still they are important for
planetary and human health. They provide vital ecosystem services, for
example, water purification, nutrient cycling and large quantities of carbon
storage, flood reduction, recharging ground water supplies and protection of
the shoreline (Ryan et al., 2011). Mitsch et al. (2000) described wetlands as
multiple value systems with public luxuries, valuable products, and wetland
values that are potentially long lasting. However, unsustainable and resource
depleting human practices of agriculture and industrial or commercial
activities in wetlands render the loss of wetlands, and the loss of these
functions and values is often irreversible.
Tanzania has a vast area of wetlands (Bakobi, 2003). The Lake Victoria basin,
the second largest surface fresh water body on earth with an area of
68,800km2 (Newell, 1960), has about 10,235.17km2 of wetlands shared by
three East African countries (Tanzania - 49%, Uganda - 45% and Kenya -6%).
About 80% of these wetlands is papyrus dominated (Kansiime et al., 1999).
Papyrus reproduces both sexually by seed formation from the umbels and
asexually by vegetative reproduction through the rhizome. Boar et al.,
(2006) explained the germination of papyrus seeds in twelve days and their
inability to germinate in standing water.
As they create a buffer zone between terrestrial and aquatic ecosystems,
papyrus swamps play a great hydrological, ecological and economic role in
Central tropical and West African wetlands (Gaudet, 1980). The ongoing
unwise utilization of wetlands and wetland resources in the Lake Victoria
basin hampers their persistence. Such activities as agriculture, pollution,
wetland drainage and settlement expansion have converted wetlands to
settlement areas in Mwanza, Bukoba, Musoma, Kahama and Bunda all in
Tanzania (Kassenga, 1997). Burning of papyrus wetlands in Lake Victoria
basin contribute 5.2 × 10⁷ tons of carbon dioxide in the atmosphere. In
general, the future of the lake and wellbeing of the people living around the
lake depends on the status of the papyrus wetlands (Kiwango, 2007).
The utilization of papyrus for socio-economic purposes is diverse, from the
papyrus wetland to the plant itself. Terer et al., (2012) documented the
utilization of papyrus swamps for farming and livestock grazing; and
papyrus for making mats, fodder, roofing materials, fishing activities and
for fuel (Fig.1).

Cyperus papyrus in Lake Victoria: Utilisation and Resource Sustainability
75
Fig. 1: Some of papyrus uses. Top: Houses and fence made of papyrus
stems; Bottom: Cattle grazing on papyrus swamp (photo by Lusasi J)
Most of the riparian communities use papyrus as a resource or raw material
for developmental activities. As mentioned earlier, the current unsustainable
harvesting of papyrus in freshwater wetlands threatens the future of the
resource and wetlands at large (Terer et al., 2012). The determination of the
effects of disturbance in papyrus swamps is a good attempt to sustainably
conserve this resource. Sustainable utilisation of papyrus will eventually
lead to maintaining the wetland ecosystem services.
The information on papyrus in Tanzania and Kenya is limited (Kiwango &
Wolanski, 2008). There is no published information on the population
genetic status. Due to the lack of enough scientific information on

Justin Lusasi
76
sustainable utilisation of Cyperus papyrus and its clonal status, it is hard
also to plan for its conservation. The loss of papyrus due to unsustainable
utilisation will lead to loss of genetic resource.
While the loss of connectivity between landscapes—i.e., habitat
fragmentation—leads to loss of natural communities and biological diversity,
the loss of population leads to a loss of unique genetic information, genetic
diversity and, eventually, decline of total biological diversity in an area. This
kind of loss is normally not recoverable (Ferar, 2002). Usually, small
populations have low genetic diversity and are genetically threatened.
Studies on the genetics of aquatic plants are very wide as shown by a body
of literature (Ouborg et al., 2006), which documented low and high genetic
variation among aquatic plants.
Using microsatellite marker, Terer (2011) observed high genetic diversity
for Cyperus papyrus due to high sexual reproduction and seed recruitment.
Although Zielder (1994) observed high level of genetic variation and
structure among Phragmites australis population as a result of sexual
reproduction using RFLP marker, Pellegrin and Hauber (1999) observed
the lack of genetic variation among populations due to insignificant sexual
reproduction in the same species.
Plants in Cyperaceae family have high clonal diversity (Ohsako, 2010); with
moderate level of genetic diversity and less inbreeding due to outcrossing
among dioecious plants of Carex kobomugi.
This study focused on three main objectives, namely to:
1. Determine the genotypic richness/clonal diversity, genetic diversity
and structure of Cyperus papyrus in selected wetlands of Lake
Victoria.
2. Determine the genotypic richness and genetic diversity between
disturb and pristine papyrus swamps of Lake Victoria.
3. Assess the community local ecological knowledge (LEK) on
utilisation, perception of sustainability and management practice of
papyrus swamps in Tanzania.
Materials and Methods
In Tanzania, the study was conducted in Kamanga, Mwanza bay, namely in
Kabagombe (KBTZ), Uswahilini (USTZ), Mabatini (MATZ), Chigoto (CHGTZ),
Chamagati (CHATZ), and Luchelele (LUTZ) (Fig. 2).

Cyperus papyrus in Lake Victoria: Utilisation and Resource Sustainability
77
Fig. 2: Map of Tanzania showing the Mwanza bay sampling sites
Other samples were collected in five swamps of Nyanza bay, Kenya: Sondu
(LVSO), Nyando (LVNY), Kibosi (LVKI), Kenya Marine Fisheries Institute
(LVKK) and Usengi (LVUS) (Fig. 3) and are described in Terer et al. (2011).
Fig. 3: Map of Kenya showing the sampling sites in Nyanza bay
Justin Lusasi
78
Sampling Design
At each site, 30 stems of mature plants were randomly selected at a
distance of >3m from each other. From the mature stem, about 3cm of the
stem was peeled, dried and kept for genetic analysis.
DNA Extraction
DNA extraction was done in the Plant Biology and Nature Management
(APNA) laboratory by grinding 0.02gm of each dried sample, which was
followed by E.Z.N.A SP plant DNA Mini Kit (Omega bio-tek) protocol for
DNA extraction on dry samples.
Polymerase Chain Reaction (PCR)
The extracted DNA was amplified using eight Cyperus papyrus
microsatellite loci isolate (8 pair of primers) prepared as described by
Frerot et al. (2010). The PCR process was conducted using a Bio-Rad
Thermal Cycler machine following the calibrated Cyppap protocol. With
the cover lid maintained at 105oC, the first denaturation was at 95oC for 5
minutes, followed by 95oC for 0.40minutes, and then annealing step was
done at 54oC for 1 minute and then extension at 72oC for 1 minute, followed
by 36 cycles at 95oC for 40sec, then 72oC for 10 minutes, and lastly 12oC for
infinite hold time. The PCR product was kept in a fridge.
Gel Electrophoresis
Thereafter fluorescent gel electrophoresis was conducted. This was
preceded by denaturation of the PCR product by adding 2l of the
formamide loading dyeand 1l of the PCR product, and then incubating it
at 95oC for 4 minutes.
The denaturing gel mix 6% was prepared by mixing 21g of Urea, 3.0ml of
10 × TBE, 7.5ml of Acrylamide and 50ml of Deionized water. The gel
volume was 15ml with the length of 18cm, thus, 10l of TEMED
(Tetramethyl EthyleneDiamine 99%) and 100l of 10% APS (Ammonium
per Sulfate) were added to 25ml of the degassed gel mix. The computer
programmes Gel Scan and ONEDscan were used to run the electrophoresis
and to open the electrophoresis results (visible DNA segments),
respectively. The Gel Scan was run at 40OC, 1200V for 60 minutes.
Data Analysis
The genetic diversity and structure of papyrus populations were analysed
by the GenAlex 6.41 software (Peakall et al., 2006) and FSTAT (Goudet,
2002); while the genotypic richness (R=G-1/N-1) was calculated by
GenClone 2.0 (Arnaud-Haond & Belkhir, 2007).
Cyperus papyrus in Lake Victoria: Utilisation and Resource Sustainability
79
Socio-economic Survey
The information on papyrus utilisation, perception of sustainability,
regeneration and management practices was gathered through prepared
questionnaires that consisted of about 50 questions. Thirty-three people
(young <45yrs, and elders >45yrs) of both genders were interviewed. The
statistical analysis was done by CANOCO 4.5 software (Ter et al., 2002).
The Principal Coordinate Analysis (PCA) was performed according to the
Canoco guideline manual.
Results
Clonal Diversity
There were 172 and 132 ramets, 155 and 118 genets from populations of
Lake Victoria Mwanza bay and Nyanza bay respectively. The clonal
diversity R was high in both regions with values ranging from 0.64 to 1 for
Mwanza bay, and R 0.70 to 1 for Nyanza bay. Genetic diversity HE was
high 0.558 in Mwanza bay and 0.493 in Nyanza bay swamps.
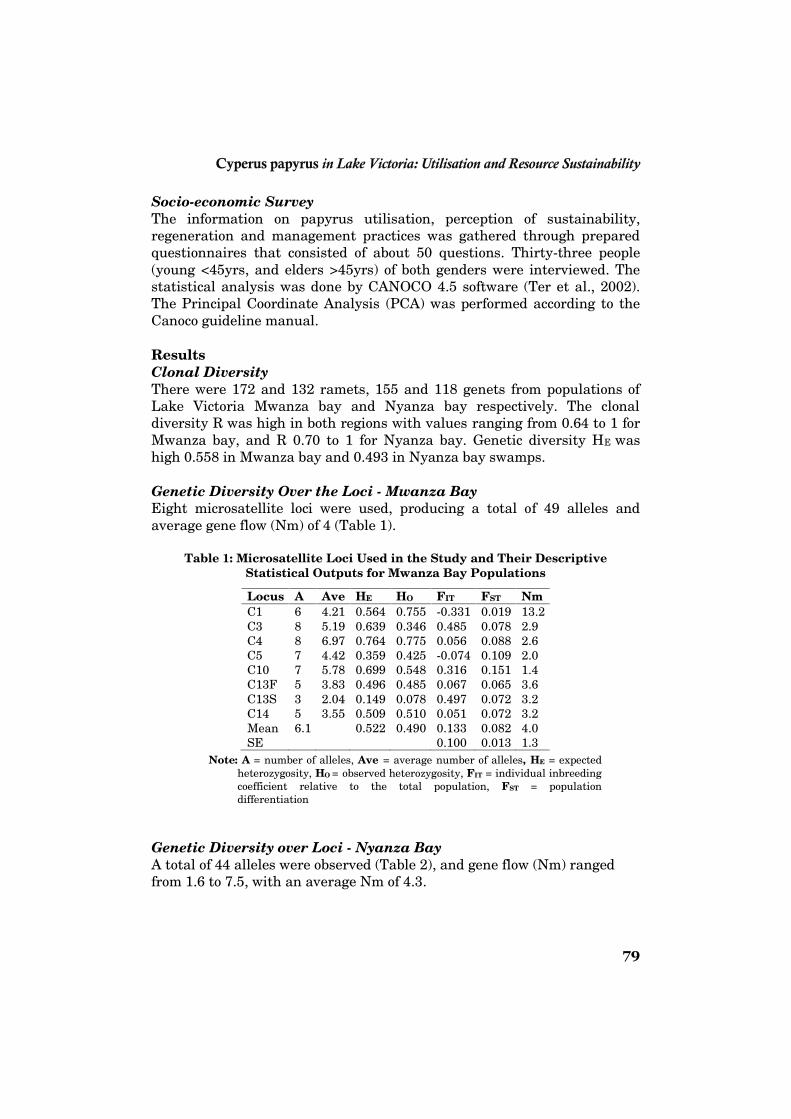
Genetic Diversity Over the Loci - Mwanza Bay
Eight microsatellite loci were used, producing a total of 49 alleles and
average gene flow (Nm) of 4 (Table 1).
Table 1: Microsatellite Loci Used in the Study and Their Descriptive
Statistical Outputs for Mwanza Bay Populations
Locus A Ave HE HO FIT FST Nm
C1 6 4.21 0.564 0.755 -0.331 0.019 13.2
C3 8 5.19 0.639 0.346 0.485 0.078 2.9
C4 8 6.97 0.764 0.775 0.056 0.088 2.6
C5 7 4.42 0.359 0.425 -0.074 0.109 2.0
C10 7 5.78 0.699 0.548 0.316 0.151 1.4
C13F 5 3.83 0.496 0.485 0.067 0.065 3.6
C13S 3 2.04 0.149 0.078 0.497 0.072 3.2
C14 5 3.55 0.509 0.510 0.051 0.072 3.2
Mean 6.1 0.522 0.490 0.133 0.082 4.0
SE 0.100 0.013 1.3
Note: A = number of alleles, Ave = average number of alleles, HE = expected
heterozygosity, HO = observed heterozygosity, FIT = individual inbreeding
coefficient relative to the total population, FST = population
differentiation
Genetic Diversity over Loci - Nyanza Bay
A total of 44 alleles were observed (Table 2), and gene flow (Nm) ranged
from 1.6 to 7.5, with an average Nm of 4.3.

Justin Lusasi
80
Table 2: Microsatellite Loci Output for Samples from Lake
Victoria Nyanza Bay - Kenya
Locus A Ave HE HO FIT FST Nm
C1 5 4.03 0.593 0.663 -0.031 0.095 2.4
C3 7 4.56 0.553 0.461 0.188 0.052 4.5
C4 10 7.81 0.826 0.872 -0.030 0.044 5.4
C5 5 4.26 0.278 0.204 0.348 0.135 1.6
C10 6 3.92 0.625 0.664 -0.007 0.073 3.2
C13F 4 2.62 0.145 0.131 0.101 0.032 7.5
C13S 4 2.89 0.353 0.236 0.351 0.056 4.2
C14 3 2.06 0.073 0.030 0.594 0.043 5.5
Mean 5.5 0.431 0.408 0.189 0.066 4.3
SE 0.080 0.012 0.7
Note: A = number of alleles, Ave = average number of alleles, HE = expected
heterozygosity, HO = observed heterozygosity, FIT = individual inbreeding
coefficient relative to the total population, FST = population
differentiation
Analysis of Molecular Variance (AMOVA)
The analysis of molecular variance (AMOVA) provides a hierarchical
partitioning of genetic variation among populations. The AMOVA for
Nyanza bay and Mwanza bay showed higher molecular variation within
individuals (84% and 85% respectively) than the variation among
populations and among individuals (Tables 3 and 4).
Table 3: Summary of AMOVA among Five Cyperus Papyrus Populations
Of Lake Victoria Nyanza bay-Kenya
Source df Est. Var. % F-stat P-value
Among Pops 4 0.156 8% FST=0.078 0.001
Among Indiv 111 0.170 8% FIS=0.092 0.001
Within Indiv 116 1.685 84% FIT=0.162 0.001
Total 231 2.011 100% Nm=3
Table 4: Summary of AMOVA among six Cyperus Papyrus Populations
of Lake Victoria Mwanza Bay Tanzania
The results show a moderate genetic differentiation: FST=0.078, (p=0.001)
and FST=0.073, (p=0.001) for Nyanza bay and Mwanza bay populations
respectively, with an estimate of gene flow Nm=3 in each population.
Source df Est. Var. % F-stat P-value
Among Pops 5 0.166 7% FST=0.073 0.001
Among Indiv 149 0.171 8% FIS=0.081 0.001
Within Indiv 155 1.929 85% FIT=0.149 0.001
Total 309 2.266 100% Nm=3.2
Cyperus papyrus in Lake Victoria: Utilisation and Resource Sustainability
81
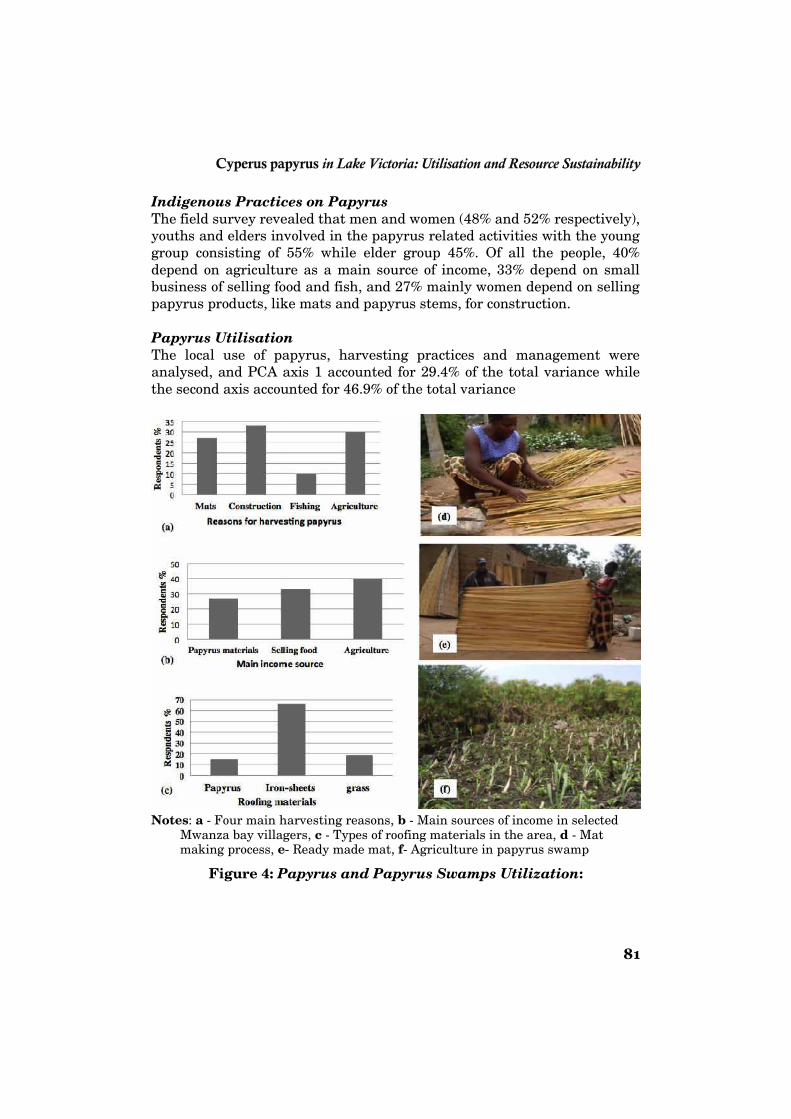
Indigenous Practices on Papyrus
The field survey revealed that men and women (48% and 52% respectively),
youths and elders involved in the papyrus related activities with the young
group consisting of 55% while elder group 45%. Of all the people, 40%
depend on agriculture as a main source of income, 33% depend on small
business of selling food and fish, and 27% mainly women depend on selling
papyrus products, like mats and papyrus stems, for construction.
Papyrus Utilisation
The local use of papyrus, harvesting practices and management were
analysed, and PCA axis 1 accounted for 29.4% of the total variance while
the second axis accounted for 46.9% of the total variance
Notes: a - Four main harvesting reasons, b - Main sources of income in selectedMwanza bay villagers, c - Types of roofing materials in the area, d - Matmaking process, e- Ready made mat, f- Agriculture in papyrus swamp
Figure 4: Papyrus and Papyrus Swamps Utilization:
Cyperus papyrus in Lake Victoria: Utilisation and Resource Sustainability
81
Indigenous Practices on Papyrus
The field survey revealed that men and women (48% and 52% respectively),
youths and elders involved in the papyrus related activities with the young
group consisting of 55% while elder group 45%. Of all the people, 40%
depend on agriculture as a main source of income, 33% depend on small
business of selling food and fish, and 27% mainly women depend on selling
papyrus products, like mats and papyrus stems, for construction.
Papyrus Utilisation
The local use of papyrus, harvesting practices and management were
analysed, and PCA axis 1 accounted for 29.4% of the total variance while
the second axis accounted for 46.9% of the total variance
Notes: a - Four main harvesting reasons, b - Main sources of income in selectedMwanza bay villagers, c - Types of roofing materials in the area, d - Matmaking process, e- Ready made mat, f- Agriculture in papyrus swamp
Figure 4: Papyrus and Papyrus Swamps Utilization:

Justin Lusasi
82
The PCA results showed three groups of harvesters in Mwanza bay
populations. Two groups are based on gender, with different harvesting
priorities. When men mainly harvest papyrus for agriculture related
activities, women harvesting practices were based on home use activities,
such as making mats and for firewood. The third group includes both men
and women in mixed activities of fisheries, construction and priority on
swamps management practices, as shown in Fig. 5.
Figure 5: The PCA plot showing variety of priorities regarding the
papyrus utilization in Mwanza bay Lake Victoria
Discussion
The current study of eleven populations of Cyperus papyrus in Lake
Victoria showed high genotypic diversity (R ranging 0.64 to 1), an average
of 0.89, similar to the results obtained by Terer et al. (2011), which suggest
that papyrus have highly successful sexual reproduction with seeds
dispersal mechanism that enables the plant to colonise new areas (Ohsako,
2010; Triest et al., 2010).
Sexual Reproduction and Clonal Diversity in Papyrus
Although the average clonal diversity values are high in Lake Victoria
populations, some individual populations have low values of R (KBTZ,
CHGTZ and LVUS, LVKK), with higher than the average value of 21 clonal
plant species, which is 0.62 for a population with limited sexual
recruitment (Ellstrand & Roose, 1987, as cited by Tang et al., 2007).
Although some populations were observed to be disturbed, the effect was
not observed in their clonal diversity. The situation describes papyrus as
highly resilient to disturbances.

Cyperus papyrus in Lake Victoria: Utilisation and Resource Sustainability
83
Most clonal plants experience low genotypic diversity due to limited
sexual reproduction. Unsuccessful pollen and seed dispersal due to seed
size, negative buoyance for aquatic plants and rough sediment (Alberto et
al., 2005) limit sexual recruitment while favouring clonal growth. This
could be the reason for the observed low genotypic diversity in CHGTZ
and KBTZ populations with rocky substrate and high water levels,
respectively. The KBTZ swamp is always inundated. Therefore, the
environment limits the chances for seeds to germinate, and, thus, the
vegetative reproduction sustains the population (Boar, 2006). On the
other hand, CHGTZ swamp is established in rocky sediments with less
soil to support seedling establishment. These are part of environmental
limitations for population variability (Triest, 2008). Thus, the high
genetic and genotypic diversity is attributed to high gene flow within and
between papyrus populations. Some clonal plants, like sea grass
meadows, exhibit different levels of clonal richness from monoclonal
stands (Alberto et al., 2005; Waycott et al., 1996), to a multiclonal stand
(Arnaud-Haond et al., 2005). Furthermore, the current analysis of clonal
diversity in Cyperus papyrus is comprehensive. It is a microsatellite-
based study conducted with eight-microsatellite loci. Being a powerful
molecular marker, microsatellite was used to avoid the introduction of
both qualitative and quantitative errors, and underestimation of results,
(Arnaud-Haond et al., 2005; Honnay & Jacquemyn, 2007) as advised in
avoiding the use of molecular markers with less efficiency.
Although some populations were disturbed by anthropogenic activities, for
example, burning, extensive harvesting and constructions, no effects of such
disturbances were observed in genotypic richness and gene diversity. This
suggests the ability of papyrus to reproduce sexually and resist even strong
anthropogenic disturbances. According to Stocklin et al. (2009), disturbance
is not always detrimental to plants because disturbance opens gaps and
spaces for new seedlings to germinate, thus bringing genetic combination.
Therefore, the study suggests taking precaution to the current papyrus
swamps status since the current results could be attributed to events, like
historical gene flow and population contacts. More information on growth
strategies, seed dispersal and seedling establishment in papyrus is required
to increase ecological understanding of Cyperus papyrus.
The local community responses to the structured questions were aimed at
raising awareness of the current status of papyrus as a natural capital
especially to the impoverished riparian communities (Morrison et al., 2011)
and wetlands at large, with the target of incorporating management and
conservation measures where the deterioration cannot be compromised.
Generally, agricultural practices in wetlands were pointed out as the most
Justin Lusasi
84
unsustainable practices. Therefore, it is useful to adapt the anthroposystem
approach (Dahdouh et al., 2006) and incorporate indigenous communities
and their conservation knowledge (LEK) in papers (environmental acts,
conservation priorities and local authorities responsibilities) in the
management and conservation plans.
The analysis of molecular variance revealed a moderate but significant
population differentiation between Cyperus papyrus swamps within both
Mwanza bay (FST=0.073, p=0.001 Nm=3.2), and within Nyanza bay
(FST=0.078, p=001 Nm=3) (Tables 3 and 4). Although the two regions are
far away from each other (about 800km apart of distance along the coast),
they are still genetically connected (FST=0.111, p=0.001, Nm=2). When
grouped as one big papyrus population in Lake Victoria (all eleven
papulations), we still observed a moderate but significant population
differentiation with Nm=1.7. The observed similarity between Cyperus
papyrus populations in the present issue can be attributed to successful
seed dispersal at long distances and the continuity of population contact
over a long time, and historical gene flow (Hedgecock et al., 2007; Terer et
al., 2011).
Some irregularities were observed regarding genetic distances and
differentiation between sub-populations in both Mwanza and Nyanza bays.
The populations USTZ and LUTZ, about 32km apart, were genetically closer
than USTZ and MATZ populations which were less than 1km apart. Similar
observation was made by Krzakowa and Michalak (2010) when they studied
the common reed P.australis as attributed to possible gene flow pattern in
the genetically related populations. The observation was also supported by
population structure analysis, showing that the two populations were
genetically very close, with Nm=9.5. Generally, population similarity
describes the past time gene flow rather than contemporary (Hedgecock et
al., 2007). This situation can be due to the geographical locations of the two
related populations (Fig. 2), and the nature of water currents in the lake that
transport seeds/propagules from the source to other proximities. It is thus
possible that currents drifting more east southward of the channel transport
seeds and propagules from USTZ to LUTZ, creating a gap between USTZ
population and the nearby populations. Furthermore, the current
observation can be attributed to historical gene flow as FST does not
differentiate between populations with long divergent time and with recent
shared history even when there is no gene flow (Pearse & Crandall, 2004). To
avoid this ambiguity, a more sophisticated approach that can tell the
significance of the current gene flow to the historical association among
populations and demographic information on population history, growth and
viability should be employed.

Cyperus papyrus in Lake Victoria: Utilisation and Resource Sustainability
85
Papyrus Utilisation and Sustainability Take Points
This study gives information on sustainable harvesting practices, which
among other things, promotes environmental sustainability concern as
provided by the Millennium Development Goals (MDG 7). It combines
genetics and socio-economics. The study gives way to sustainable
management of wetlands and wetland resources. This helps people to
alleviate poverty and make a better living.
As part of this study, the local community responses to the structured
questions were aimed at raising awareness of the current status of papyrus
as a natural capital, especially to the ‘impoverished riparian communities’
(Morrison et al., 2011) and wetland at large, with the target of
incorporating management and conservation measures where the
deterioration cannot be compromised. The plot (Fig. 4) demonstrates the
responses we obtained from the local community questionnaire. To be more
focused, men and women have different priorities in papyrus and the
papyrus swamps. While men use papyrus swamps mainly for agriculture,
construction and fishing; women use the resource for making mats as a
source of income, for fuel as it burns quickly and it is cheap, accessible, and
more important, easy to collect. Since most of the peasants earn more from
agricultural activities in such a fertile wetland soil, they have their houses
roofed in iron sheet and papyrus-fenced, while artisanal fishermen
(normally small-scale fishermen with unsophisticated tools) have their
houses thatched roofed with grass or papyrus and fenced. The current
results are similar to previous studies conducted in papyrus swamps (Terer
et al., 2012). Indeed, local people make their lives from papyrus through
construction, cooking and warming, and selling products (like mats and
agriculture) in papyrus swamps.
Agriculture in the papyrus wetlands was pointed as unsustainable. Since the
wetland is perceived as an open space, the local communities themselves
cannot manage the undesired practices unless the government intervenes. The
lack of responsibility in the administration of people limits information flow.
In the study area wetlands are taken as a common pool or open access. This
might cause resource collapse if mitigation measures are not put in place at
the right time (Hardin, 1968). In the presence of water, papyrus will never be
exhausted by cutting for fishing activities and construction or for making
mats, but clearing for agricultural activities is among the destructive practices
observed in wetland ecosystems (Terer et al., 2004).
Although the frequency of destructive harvesting depends on the location of
the swamp, altitude, micro and local climatic conditions (Morrison et al.,
2011), papyrus harvesting regime has been intensively discussed with

Justin Lusasi
86
different opinions on regeneration time. While some studies observed a six
month regeneration interval when papyrus grows back to maturity (Dam et
al., 2011), some studies suggest more time for harvesting revisit (Owino &
Ryan, 2007; Terer et al., 2011, 2012; Osumba, et al., 2010). In the current
study, the majority of harvesters (54%) said a one-month interval is
sufficient for a second harvest, similar to other local communities (Osumba
et al., 2010). Since they also reported to experience difficulties in getting
the right stem size, we suggested that the time allocated for revisit of 1-6
months is too short for the plant to recover its ordinary status. Thus, this
needs extension to at least 24 months as suggested by Terer et al. (2011).
In general, most of the degradation in papyrus swamps are anthropogenic,
accelerated by limited knowledge of sustainable resource use. Both local
community knowledge and scientific information on papyrus are of vital
importance when planning for resource management since without this
conservation and management strategies will not be successful (Terer et al.,
2004; Dahdouh-Guebas et al., 2006). Since papyrus depends on the water
level and conditions for vegetation expansion, it is not only human activities
on papyrus swamps, but also natural variations in hydrological regime that
reduce the papyrus covered area, which take long time to reverse.
References
Arnaud-Haond S. & K. Belkhir 2007. GENCLONE: A computer program to analyze
genotypic data, test for clonality and describe spatial clonal organization. Molecular
Ecology Notes 7:15-17
Bakobi B.L.M. 2003. Conservation of Wetlands of Tanzania. A report for NEMC.
Barrat-Segretain, M. H. 1996. Strategies of Reproduction, Dispersion, And Competition
in River Plants : A Review. Vegetatio. Kluwer Academic Publishers.123:13-37.
Boar, R. R. 2006. Responses of a Fringing Cyperus Papyrus L. swamp to Changes in
Water Level. Aquatic Botany, 84:85-89
Dahdouh-Guebas, F., S. Collin, D. Lo Seen, P. Rönnbäck, D. Depommier, T.
Ravishankar & N. Koedam. 2006. Analysing Ethnobotanical and Fishery-Related
Importance of Mangroves of the East-Godavari Delta (Andhra Pradesh, India) for
Conservation and Management Purposes. Journal of Ethnobiology and
Ethnomedicine, 2(24). doi:10.1186/1746-4269-2-24

Cyperus papyrus in Lake Victoria: Utilisation and Resource Sustainability
87
Ferar, Jean-pierre. 2002. How Useful Are the Genetic Markers in Attempts to
Understand and Manage Marine Biodiversity ? Journal of Experimental Marine
Biology and Ecology, 268: 121-145.
Frerot H., M-P. Faucon, G. Willems, C. Gode, A. Courseaux, A. Darracq, N. Verbruggen
& P. Saumitou-Laprade. 2010. Genetic Architecture of Zinc Hyperaccumulation in
Arabidopsis Halleri: The Essential Role of QTL x Environment Interactions. New
Phytologist, 187:355-367.
Gaudet, J. J. 1980. Papyrus and Ecology of Lake Naivasha. National Geographic
Society, Research Reports
Goudet J. 2002. FSTAT: a program to estimate and test gene diversities and fixation
indices. Version 2.9.3.2
Hollis G. E, M. M. Holland, E. Maltby & J. S. Larson. 1988. Wise Use of Wetlands
Nature and Resources. (UNESCO), Vol. XXIV, No. 1, January-March 1988, pp. 2-12.
Kansiime F., M. & Nalubega, 1999. Wastewater Treatment by a Natural Wetland: The
Nakivubo Swamp, Uganda. Process and Implications. PhD Dissertation, University
of Wageningen, Netherlands.
Kassenga G. R. 1997. A Descriptive Assessment of the Wetlands of the Lake Victoria
Basin in Tanzania. Journal of Ecology, 20:127-121.
Kiwango, Y. A., 2007. The Role of Papyrus Plants (Cyperus Papyrus) and Internal
Waves in the Nutrient Balance of Lake Victoria, East Africa. Master thesis,
University of Algarve.
Kiwango Y. A. & E. Wolanski. 2008. Papyrus Wetlands, Nutrients Balance, Fisheries
Collapse, Food Security, and Lake Victoria Level Decline in 2000–2006. Wetlands
Ecology and Management, 16(2): 89-96.
Mitsch W. J., & J. G. Gosselink. 2000. The Value of Wetlands: Importance of Scale and
Landscape Setting. Ecological Economics, 35(200): 25–33.
Morrison, E. H. J., C. Upton, K. Odhiambo-K’oyooh, & D. M. Harper, 2011. Managing
the Natural Capital of Papyrus Within Riparian Zones of Lake Victoria, Kenya.
Hydrobiologia, 692(1), 5–17. doi:10.1007/s10750-011-0839-5
Newell B. S. 1960. The Hydrology of Lake Victoria. East Africa Fisheries Research
Organisation, Jinja, Uganda.
Ohsako, T. 2010. Clonal and spatial genetic structure within populations of a coastal
plant, Carex kobomugi (Cyperaceae). American journal of botany, 97(3), 458–70.
Ouborg N. J., P. Vergeer & C. Mix. 2006. The Rough Edges of the Conservation Genetics
Paradigm for Plants. Journal of Ecology, 94: 1223-1248.
Ryan P. P., G. J. Hay, G. Chen. 2011. How Wetland Type and Area Differ Through
Scale: A GEOBIA Case Study in Alberta's Boreal Plains.
Terer T. 2011. Conservation Genetics, Utilization and Effects of Cyperus Papyrus
Harvesting: Making Ecosystem Management Work in Kenyan Wetlands. PhD
thesis, Vrije Universiteit Brussel. Uitgeverj VUBPRESS Brussels University Press,
Brussels.

Justin Lusasi
88
Terer T., A. Muthama Muasya, F. Dahdouh-Guebas, G. George Ndiritu & L. Triest.
2012. Integrating Local Ecological Knowledge and Management Practices of an
Isolated Semi-Arid Papyrus Swamp (Loboi, Kenya) into a Wider Conservation
Framework. Journal of Environmental Management, 93(1): 71-84.
Terer, T., L. Triest & A. Muthama Muasya. 2011. Effects of Harvesting Cyperus
Papyrus in Undisturbed Wetland, Lake Naivasha, Kenya. Hydrobiologia, 680(1):
135–148.
Triest, L., V. T. Thi & D. Le. 2010. Genetic Differentiation of Submerged Plant
Populations and Taxa between Habitats. Hydrobiologia, 656:15–27.
Zeidler, A. 1994. The Use of DNA Fingerprinting in Ecological Studies of Phragmites
Australis Trin. Ex Strudel. Botanica Acta, 107: 107:237

Journal of the Geographical Association of Tanzania, Vol. 36 No. 2: 89–104
The Contribution of REDD Pilot Project to Community
Livelihoods: A Case Study of Kondoa District, Tanzania
Erasto Mang’enya* & Enock Makupa†
Abstract
Tanzania has been implementing a project to reduce emission from
deforestation and degradation (REDD). The REDD pilot project has been
considered as a viable option in enhancing conservation and community
livelihoods. Moreover, the contribution of REDD to community livelihoods
has not been critically investigated. This study attempts to fill this
information gap by using a case study of Kondoa District. The study use
mixed methods to capture information from the field, including household
surveys, focus group discussions, and key informant interviews.
Quantitative data were analyzed using Statistical Package for Social
Science (SPSS), while descriptive and content analysis were used for
qualitative data. The findings reveal high awareness of the REDD pilot
project by the communities. It was further observed that the REDD project
has contributed income to the community from carbon sales, improved
agricultural production, and has introduced income generating activities.
The study concludes that for the REDD project to be successful, community
participation should be strengthened in planning and designing strategies
for the REDD project. It further suggests that for the REDD project to gain
more support from the community, tangible benefits and more income
generating activities should be given priority.
Keywords; REDD, community, livelihoods, Kondoa District
Introduction
Developing countries are currently in the process of establishing reduced
emission from deforestation and degradation (REDD) initiatives to be able to
meet the new climate regime and benefit from opportunities that REDD
potentially presents. Currently, Tanzania is exploring and identifying a
range of actions from pilot activities to address the drivers of deforestation
(URT, 2010). The needs of local and indigenous communities should also be
addressed when action is taken to reduce emissions from deforestation and
forest degradation (UNFCC, 2008). Being one of the nine countries piloting
*Geography Department University of Dodoma†Geography Department, Univeristy of Dodoma

Erasto Mang’enya & Enock Makupa
90
the United Nation’s REDD programme, Tanzania developed a REDD
strategy in 2008 with the assistance of the REDD secretariat in the country
(Burgess et al., 2010). It aims to reduce emission from deforestation, and
degradation, to enhance forest carbon stock and to deliver livelihoods
benefits to forest adjacent communities by rewarding them for forest
conservation. There are now a number of ongoing REDD activities in the
country. In addition, there is a capacity building, where UN-REDD
programme in Tanzania is working in collaboration with the World Bank
institute, the Forest Carbon Partnership facility and the agro-forestry
centre, to conduct training and workshop on the opportunity cost for
REDD (UN-REDD, 2010). Through the initiative there are several pilot
projects currently going on in the country, for example in Kilosa, Lindi,
Meatu, Pemba and Unguja. In these districts, community members have
been practicing shifting cultivation and extraction of other forest
resources, for example firewood and charcoal (Government of Norway,
2009). Kondoa District is one of the REDD pilot project by the name of
“advancing REDD in the Kolo Hills forests” involving about 18,000
hectares implemented in several villages. The Project aims to reduce
greenhouse gases emission as a result of deforestation and degradation.
At present, REDD is seen as an opportunity to enhance support for forest
conservation as well as promoting sustainable livelihood options as a way
to minimize pressure on forest resources. It is argued that REDD system
could offer benefits to poor people particularly in terms of increased stable
and long-term financial and non-financial benefit flows to rural areas
(Peskett et al., 2008).
However, the likely impacts of REDD on forest dependent livelihoods
particularly the communities adjacent to the forests in rural areas, has not
been critically addressed. Both climate change itself and related policies
are likely to have wide- ranging effects on local communities in rural areas,
particularly in developing countries (Terry, 2009). To date, forest
dependent communities in rural areas have hardly featured in the
international policy discourse, including UN-framework convention on
climate change and its Kyoto protocol (Terry, 2009).
Current discussion on socio- economic impact of REDD is weak, with respect
to community livelihoods in rural areas (Gurung, 2009). The rural
communities may suffer especially from the inappropriate solution for
climate change, which are being negotiated internationally. In addition,
there has been inadequate empirical evidence to test this fear. Indeed, the
contribution of the pilot project against its set objectives remains unclear in
assessing its effectiveness (Terry, 2009). Therefore understanding the
contribution of REDD on community livelihoods is important before the
The Contribution of REDD Pilot Project to Community Livelihoods
91
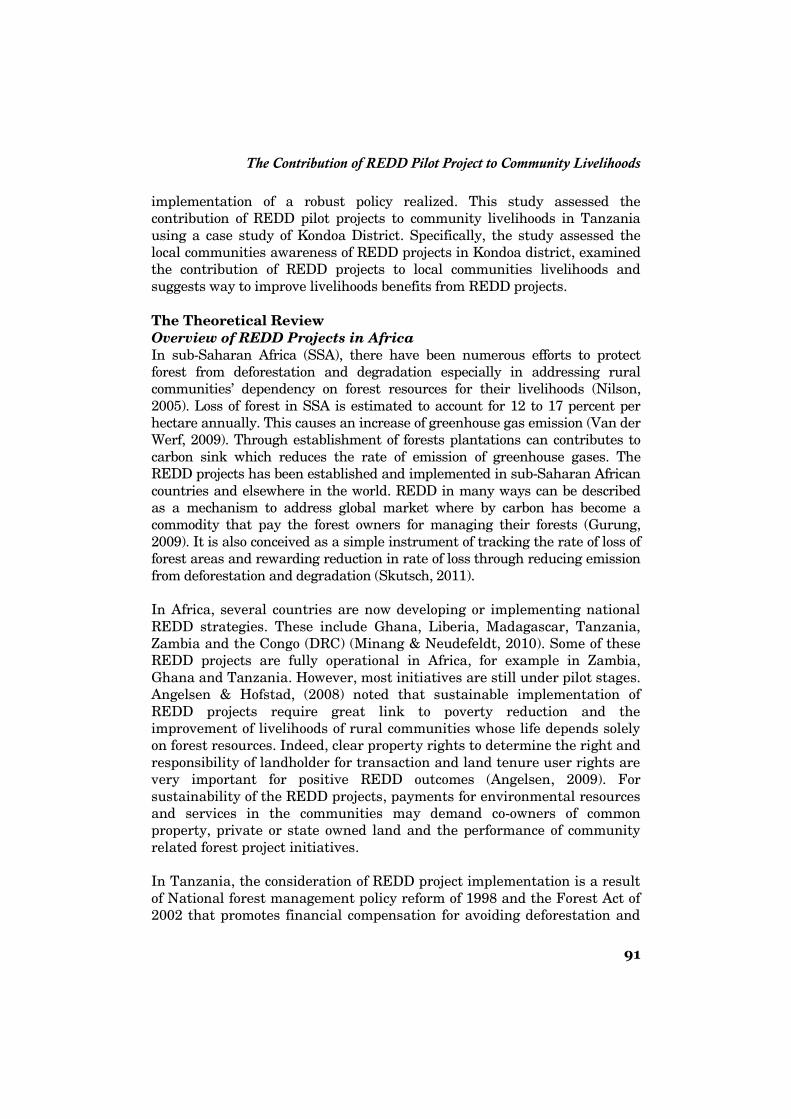
implementation of a robust policy realized. This study assessed the
contribution of REDD pilot projects to community livelihoods in Tanzania
using a case study of Kondoa District. Specifically, the study assessed the
local communities awareness of REDD projects in Kondoa district, examined
the contribution of REDD projects to local communities livelihoods and
suggests way to improve livelihoods benefits from REDD projects.
The Theoretical Review
Overview of REDD Projects in Africa
In sub-Saharan Africa (SSA), there have been numerous efforts to protect
forest from deforestation and degradation especially in addressing rural
communities’ dependency on forest resources for their livelihoods (Nilson,
2005). Loss of forest in SSA is estimated to account for 12 to 17 percent per
hectare annually. This causes an increase of greenhouse gas emission (Van der
Werf, 2009). Through establishment of forests plantations can contributes to
carbon sink which reduces the rate of emission of greenhouse gases. The
REDD projects has been established and implemented in sub-Saharan African
countries and elsewhere in the world. REDD in many ways can be described
as a mechanism to address global market where by carbon has become a
commodity that pay the forest owners for managing their forests (Gurung,
2009). It is also conceived as a simple instrument of tracking the rate of loss of
forest areas and rewarding reduction in rate of loss through reducing emission
from deforestation and degradation (Skutsch, 2011).
In Africa, several countries are now developing or implementing national
REDD strategies. These include Ghana, Liberia, Madagascar, Tanzania,
Zambia and the Congo (DRC) (Minang & Neudefeldt, 2010). Some of these
REDD projects are fully operational in Africa, for example in Zambia,
Ghana and Tanzania. However, most initiatives are still under pilot stages.
Angelsen & Hofstad, (2008) noted that sustainable implementation of
REDD projects require great link to poverty reduction and the
improvement of livelihoods of rural communities whose life depends solely
on forest resources. Indeed, clear property rights to determine the right and
responsibility of landholder for transaction and land tenure user rights are
very important for positive REDD outcomes (Angelsen, 2009). For
sustainability of the REDD projects, payments for environmental resources
and services in the communities may demand co-owners of common
property, private or state owned land and the performance of community
related forest project initiatives.
In Tanzania, the consideration of REDD project implementation is a result
of National forest management policy reform of 1998 and the Forest Act of
2002 that promotes financial compensation for avoiding deforestation and

Erasto Mang’enya & Enock Makupa
92
degradation by reducing the unwanted activities in the forest resources
(URT, 2010). The reformed forest policy and Act emphasize about the
importance of ensuring that people in rural areas adjacent to the forests,
voluntarily participate in and benefits from REDD projects as an approach
to enhance forest management and reduce poverty in rural areas (URT,
2009). The REDD projects should present opportunities to create new
benefits from forest resources to local forest managers and incentives in
exchange for the carbon credit (IPC, 2007).
However, the extent of how REDD strategy affects stakeholders participation
in forest management and contribute to poverty reduction remain unclear: at
the same time, sustainable forest management continues to surface in on-
going international climate change regime (Schmidt, 2009). This poses the
challenge whether REDD implementation will succeed in creating
appropriate incentives to support local livelihoods that will ensure the
reduction in the rate of loss of forest biomass (Ryan et al., 2011).
REDD and Livelihood
The livelihood approach dates back to the work of Chambers in the mid-1980s,
and the concept was later developed to sustainable livelihood approach by the
British Development for International Development (Collminar & Gamper,
2002). Livelihood comprises the component of capability, assets (Stores,
resources, claims and access) and activities required for means of earning a
living (Chamber & Conway, 1992). According to Ellis (2002), the concept of
livelihoods is widely used in relation to poverty and rural development, and
considered as a means of living. The livelihoods concept is adopted to express
the complex processes and factors affecting livelihood of rural people. The
concept linked well to the study, as REDD intends to deliver tangible benefits
such as income from carbon sales, sustainable supplies of household products
such as fire woods and poles from dry woods, conservation benefits at local
level which might be associated with ecotourism (Vyamana, 2009). It is
designed to play the role as an alternative to top down state managed
approach which has been proved over the years to be associated with limited
effectiveness in natural resources management (URT, 2011; Makupa, 2013).
Methods
The study was carried in 2014 in Kondoa district, Dodoma region, Tanzania
(Fig. 1). The district was considered worth for the study because of being
among the REDD pilot project districts in the country; and thus its
contribution to rural livelihood could be easily assessed. The district is located
between latitude 4 -120 and 53 -850 South, and longitude 35-60 and 36- 20 East
of Greenwich (URT, 2009).

The Contribution of REDD Pilot Project to Community Livelihoods
93
Figure 1: Study Area Map
The district covers a total area of 13,210km2, of which 50.5% is suitable for
agriculture, 25.5% is under natural pasture, 16% under forest reserve, and
the remaining 8% comprises of urban areas and water swamps (URT,
2012). More than 80% of the district population is employed in agricultural
activities. According to the population housing census (URT, 2012), a few
people are employed in formal sectors, while the majority are involved with
livestock keeping and doing small businesses (kiosk type). Specifically, the
study was carried in two villages, namely Kolo and Mnenia of the Kolo
ward. The study villages were selected purposively based on the
consideration of villages that are involved in the REDD project.
The sample size for household survey was obtained through the use of
Slovin’s formula, n= N/1 +Ne2, where n is the sample size, N is the total
number of households in the area, and e is the margin of error. Based on
this formula, a total of 80 households in two villages was obtained, which
presents 5% of all the households found in each of the village (Table 1).
Study area
Minor roadsMajor roads
District Headquarter0
Scale
20 40
kilometres
N
Study area
Minor roadsMajor roads
District Headquarter0
Scale
20 40
kilometres
NLEGEND
35° 15' E
Mnenia
Kolo
36° E4° 15' S
35° 15' E 36° E
4° 15'S
4° 30' S 4° 30' S
Kondoa

Erasto Mang’enya & Enock Makupa
94
Table 1: Sample Size
Village No of households
per each village
Total Sample size
per each Village
Kolo 564 40
Mnenia 713 40
Total 1277 80
The simple random technique was employed to obtain actual household to be
surveyed in the study area as the method provides equal chance for all
households in the study area to be included into sample (Evans et al., 2000).
The study also interviewed 8 key informants who were selected accordingto
their title/job position in the study area; and were thought to be more
knowledgeable about the study topic. These included village leaders from two
study villages, REDD project coordinators, and district officials. Six focus
group discussions were also conducted; three from each study village. Group
participants were selected based on age and gender; and were categorized
into three groups (youth, adult, and elders)so as to effective elicit information
that respond to key research questions and capture dynamic view of
respondents perception of REDD based on their age and gender.
Quantitative data from the household survey were coded, entered into SPSS
software for data analysis; while description and content analysis were used
for data obtained from group discussions and interviews.
Findings and Discussion
The study had a total of 80 respondents of whom 80% were males and 20%
were females from both villages. The reasons for male to participate more in
this study could not be established. However, this could have happened by
chance. Regarding the age of the respondents, the majority of the
respondents (93.5%) were aged between 18 and 55 years. This indicated that
most of the people were economically active. In terms of education, the
majority (82.6%) of the respondents had informal or primary education. This
implied that most of the villagers had low level of education which might
have implication on forest resource management in the study area.
The findings about low education level of the respondents is not far from the
study done by Mwakaje (2013), which indicated that majority of local
communities in rural areas have informal or primary education. Thus, there
is a need for intervention, like REDD+ projects (REDD+ is essentially a
vehicle to financially reward developing countries for their verified efforts to
reduce emissions and enhance removals of greenhouse gases through a
variety of forest management options) to focus on education. This will
improve people livelihoods in the study area. As for the household size in the
study area, 67 % of the respondents had the size of between 1 and 6 people.

The Contribution of REDD Pilot Project to Community Livelihoods
95
Examination of economic activities revealed that most (73.7%) of the
respondents were farmers engaging in various livelihood activities including
livestock keeping (45.5%) of the respondents) and some 40.6% engage in non-
farm activities such as small kiosk business and timber harvesting. This
suggests that a significant number of respondents in the study area depend
more on the forest for subsistence and commercial gain such as selling
timber, fuelwood and timber products.
Community Awareness of the REDD+ Project
The result of this study indicated that, overall, a majority (95%) of the
communities were aware of the REDD+ project in their area (see Fig. 2).
The high awareness could probably be due to the involvement of project
stakeholders at the early beginning of the project.
Figure 2: Community Awareness of REDD+ Project
When further probed on their understanding of REDD+, overall a majority
(57.8%) of the community members associated the REDD+ project with
forest protection, (28.8%) with environmental protection and (13.4%) with
improving community livelihoods (Table 2).
Table 2: Meaning of REDD+ project
What REDD+ meant to local
communities
Reponses in % per
Villages
Average
%
Kolo
(n = 40)
Mnenia
(n = 40)
What REDD+ meant to them
Forest protection 55 60.5 57.8
Environmental Protection 30 27.5 28.8
Improving community’s livelihoods 15 12 13.4
Total 100 100 100
Source: Field data survey, 2014 n=sample size

Erasto Mang’enya & Enock Makupa
96
During focus group discussions one discussant had this to say on the
meaning of REDD+:
“I understand REDD+ as a project for climate change mitigation through
forest protection”
This implies that local communities in the study area were not aware of the
meaning of REDD+. As mentioned earlier, REDD+ is a strategy that has
been proposed in developing countries as a viable option for reducing
emission from deforestation and degradation; as well as enhancing forest
carbon stock in addressing climate impacts on community livelihoods.
According Burges et al. (2010), REDD+ offers a significant potential for
conserving forest to reduce climate the impacts change. On their part,
Hirrado and Tanner (2011) considered REDD+ initiatives as a means
through which local communities in developing countries can be financially
rewarded through forest protection.
This mixed local perception on understanding the meaning of REDD+ projects
could be due to a low awareness campaigns during the initiation of the project
in the study area. Kaswamila et al., (2010) noted that various conservation
practices in Africa, local communities normally remained peripheral to
defining ways in which conservation is perceived, defined and managed. This
is evident that although conservation projects are initiated in many areas, the
local community’s awareness and participation remain elusive or passive in
nature. Thus, there is a need for conservation projects, like REDD+ project, to
create awareness of local communities through education to ensure its
sustainability and to gain support from local communities.
REDD+ and Community Livelihood
Access and Sales of Non-Timber Products
Respondents were asked whether they had an access to non-timber
products under REDD+ project in the study area. Results indicate that the
majority (67%) of them had an access to forest products (Table 3). This was
mentioned by 73.5%, and 60.4% of the respondents from Kolo and Mnenia
villages, respectively.
Table 3: Accessibility to Non-timber Product under REDD+ Project Forests
Access to non-timber
products
Residence response
in terms of %
Average
%
Kolo(n=40) Mnenia(n=40)
Yes 73.5 60.4 66.95
No 26.5 39.6 33.05
Total 100 100 100

The Contribution of REDD Pilot Project to Community Livelihoods
97
Similar findings were revealed during group discussions, which indicate
that local communities access non-timber products from the REDD+
project. This is indicted in the following statement from one discussant
when responding to the question about accessibility to forest products:
“Non-timber products contribute significantly to the enhancement of the
livelihoods of the people in our community. The REDD+ project should enhance
sustainable harvesting practices by strengthening the natural resources
committee of all participating villages of the Joint Forest Management. ”
Respondents were further probed to mention type of non-timber products
that they could access. Results indicate that these products included honey,
medicinal plants and wild fruits (Table 4).
Table 4: Income from Non-timber Product fromREDD+ Project Forests
Variables Annual Income per year perhousehold (TZS)
Residencein %
Average%
Kolo(n=40)
Mnenia(n=40)
Honey 100,000–250,000 67.5 56 61.8260,000–600,000 26 31 28.5>600,000 6.5 13 9.8
Medicinalproduct
20,000–100,000 74 60 67
110,000–200,000 20 28 24> 200,000 6 12 9
Wild fruits 20,000–100,000 24 21 22.5110,000–200,000 72 68 70
>200,000 4 11 7.5
Table 4 above indicates income realized from non-timber products which
include honey, medicinal products and wild fruits sales. On average, the
income range between TZS20,000 to 250,000 per annum. This income was
too low for any meaningful strategies for forest conservation. However,
statistics from Kondoa District natural resource office indicated relatively a
higher income from that obtained in the field. District report indicated that
income realized from non-timber products was between TZS300,000 and
1,000,000 per annum. The difference in statistics could be attributed to the
estimates that were made by the district officials in accordance with price
value of non-timber product in the district and Dodoma Municipality.
The difference of income from that mentioned by local communities in the
study villages and that reported at district level may imply that most of the
value of non-timber products had not been captured in these figures. People
were not very open in revealing the actual consumption and marketing of
non-timber products. Findings tally with those of Mwakaje (2013) who

Erasto Mang’enya & Enock Makupa
98
reported that most of the values of non-timber products have not been
captured in assessing the impacts of REDD+ initiatives, simply because
local communities are not aware of the actual consumption rates and
market price of the products. Thus, the REDD+ project should assist the
local communities in the study villages, in recognizing the value of non-
timber products to people’s livelihoods.
Payments from Carbon Sales
Carbon sale/exchange is carbon-based compensation mechanism for project
that result in reduced carbon emissions or enhance carbon sinks or both in
tropical forests. Results from this study indicated that between 2012 and
2013 carbon sales ranged between TZS5,600,000 to 7,937,200 per annum
(Table 5), with Kolo village realizing the highest amount. The difference in
the amount of sales was attributed to the area under forest cover, which
was used to compute payments for each year. According to statistics from
African Wildlife Foundation report, the area under forest in Kolo was about
1,150ha, while that of Mnenia was 900ha (AWF, 2014).
Table 5: Carbon Sales from 2012 and 2013
Village Sales in each year in (TZS)
Year 2012 2013
Mnenia 5,600,000 7,937,200
Kolo 6,400,000 6,491,821
Total 12,000,000 14,429,021
Taking into account the number of people in these villages, the amountrealized per household per annum is about TZS2,000. This again is a verysmall amount for poverty reduction strategy. In addition, secondary data oncarbon sales indicated that payment received was TZS749,998 in 2014(African Wildlife Foundation report, 2014). These funds were used for socio-economic development, including village office building and construction ofclassrooms. However, the amount received is equivalent to TZS 50,122 per ha,which is less to motivate local people interest to engage in afforestation andhave significant improvement to their livelihood. To improve the situation,measures should be put in place. Some of the measures could be regulation ofconditions for carbon payment in compliance and voluntary market so thatprovision of compensation for improving livelihood to be reasonable andoutweigh the cost of managing the forest. The REDD+ should direct pay thecommunity so that they could benefit more rather than money beingchanneled to the state, and other non-governmental organizations. Studies byKonlan (2012) indicate that, the regulation of carbon payment conditions in avoluntary market could help the project to fair well. In other words, this couldbring significant changes to people’s livelihood.

The Contribution of REDD Pilot Project to Community Livelihoods
99
Improved Agricultural Production
Statistics on the impacts of agricultural projects supported by REDD+,
could not be obtained. However, the perception of local communities
indicated that the initiative had helped to improve people’s livelihoods. For
example Kolo, 75% of respondents thought that, the agriculture project had
improved their livelihood, while in Mnenia village was 66% (Fig. 3).
Figure 3: Agricultural Improvement by REDD+ project
The perception of local communities on the initiative for improving people’s
livelihoods through agriculture projects can perhaps be attributed to the
training of farmers on new agricultural technologies and application by
farmers in agriculture activities. According to statistics from AWF office,
the project used a pilot farmer approach. The project trained 173 farmers
on new techniques that would help farmers to reduce the area for
cultivation. This could then reduce farm expansion pressure. In addition,
farmers were supported to establish and run demonstration farms, and
they were given improved maize seeds (AWF, 2014). During focus group
discussion, one discussant had this to say for training farmers on new
agricultural technologies:
“The REDD+ project should build up this success and train more farmers by
using current pilot farmers as trainers. ”
Meaning that, farmers who were trained should be employed by the REDD+
project, to train other farmers in their area. The secondary data from the
African Wildlife Foundation Report (2014) on an improved agriculture in the
study area indicated that sixty farmers harvested, found an average maize
yield to increase eight-fold from 30 to 39 bags/ha to 40 to 47 bags/ha in Kolo
and Mnenia respectively. Thus, the additional yield have increased farmers’
earning for an average of TZS640,000/= per ha. The surplus produced were
Percent
The Contribution of REDD Pilot Project to Community Livelihoods
99
Improved Agricultural Production
Statistics on the impacts of agricultural projects supported by REDD+,
could not be obtained. However, the perception of local communities
indicated that the initiative had helped to improve people’s livelihoods. For
example Kolo, 75% of respondents thought that, the agriculture project had
improved their livelihood, while in Mnenia village was 66% (Fig. 3).
Figure 3: Agricultural Improvement by REDD+ project
The perception of local communities on the initiative for improving people’s
livelihoods through agriculture projects can perhaps be attributed to the
training of farmers on new agricultural technologies and application by
farmers in agriculture activities. According to statistics from AWF office,
the project used a pilot farmer approach. The project trained 173 farmers
on new techniques that would help farmers to reduce the area for
cultivation. This could then reduce farm expansion pressure. In addition,
farmers were supported to establish and run demonstration farms, and
they were given improved maize seeds (AWF, 2014). During focus group
discussion, one discussant had this to say for training farmers on new
agricultural technologies:
“The REDD+ project should build up this success and train more farmers by
using current pilot farmers as trainers. ”
Meaning that, farmers who were trained should be employed by the REDD+
project, to train other farmers in their area. The secondary data from the
African Wildlife Foundation Report (2014) on an improved agriculture in the
study area indicated that sixty farmers harvested, found an average maize
yield to increase eight-fold from 30 to 39 bags/ha to 40 to 47 bags/ha in Kolo
and Mnenia respectively. Thus, the additional yield have increased farmers’
earning for an average of TZS640,000/= per ha. The surplus produced were
0
20
40
60
80
Kolo Mnenia
7566
2534
Village
Yes
No
The Contribution of REDD Pilot Project to Community Livelihoods
99
Improved Agricultural Production
Statistics on the impacts of agricultural projects supported by REDD+,
could not be obtained. However, the perception of local communities
indicated that the initiative had helped to improve people’s livelihoods. For
example Kolo, 75% of respondents thought that, the agriculture project had
improved their livelihood, while in Mnenia village was 66% (Fig. 3).
Figure 3: Agricultural Improvement by REDD+ project
The perception of local communities on the initiative for improving people’s
livelihoods through agriculture projects can perhaps be attributed to the
training of farmers on new agricultural technologies and application by
farmers in agriculture activities. According to statistics from AWF office,
the project used a pilot farmer approach. The project trained 173 farmers
on new techniques that would help farmers to reduce the area for
cultivation. This could then reduce farm expansion pressure. In addition,
farmers were supported to establish and run demonstration farms, and
they were given improved maize seeds (AWF, 2014). During focus group
discussion, one discussant had this to say for training farmers on new
agricultural technologies:
“The REDD+ project should build up this success and train more farmers by
using current pilot farmers as trainers. ”
Meaning that, farmers who were trained should be employed by the REDD+
project, to train other farmers in their area. The secondary data from the
African Wildlife Foundation Report (2014) on an improved agriculture in the
study area indicated that sixty farmers harvested, found an average maize
yield to increase eight-fold from 30 to 39 bags/ha to 40 to 47 bags/ha in Kolo
and Mnenia respectively. Thus, the additional yield have increased farmers’
earning for an average of TZS640,000/= per ha. The surplus produced were

Erasto Mang’enya & Enock Makupa
100
either taken to the market or sold within the village. It can be argued that
REDD+ contribution to improve agricultural, is still insignificant given that
there a lot of factors determining agricultural productivity. However, in order
to improve agricultural activities in the study area, the REDD+ projects could
facilitate the supply of agricultural inputs in the study villages including
improved seeds, fertilizers and manure.
On top of that, an access to market for agricultural produce should also be
taken as one of the project strategy in improving people’s livelihoods in the two
study villages. Since the main activity in the two villages was farming, then,
even though households members tend to engage in other activities, they still
kept land for cultivation. Mswima (2012) indicates that the supply of farming
inputs including fertilizers and improved seeds could be one of the potential
impacts of REDD+ initiative in Kilosa. This improved people’s livelihoods
through agricultural production. Even though farmers had been trained, there
is also a need for a REDD+ project to have strategies for supplying farm inputs
and facilitating access to a reliable market. This will enhance improved
agricultural production. Such strategies are very important, if the market for
carbon sale fails, communities could still relay their livelihoods from
agricultural production instead of relay on forest resources.
Employment
From this study, statistics on employment opportunities provided by REDD+
project were also identified. Many of the respondents (53%) were not
employed in various opportunities provided by REDD+ project (Table 6).
Those who were employed were in agro-forestry and bricks making. During a
discussion with project officials, the agro forestry was an established activity
in the project area, where African Wildlife Foundation Organization (AWFO)
was promoting its expansion through supporting farmers and women groups
in the study villages. The AWFO have created a system of giving subsidies to
agricultural inputs to farmers, and buying seedlings from the women’s
groups. This could attract more villagers to be employed in agro forest
activities in the study villages (AWF, 2014). However, income realized from
these employment opportunities could not be established.
Nonetheless, taking into account the number villagers, the percentage of
those who were employed was very low to warrant any meaningful
conclusion in poverty reduction. This implies that the contribution of
REDD+ to community livelihoods through employment was insignificant.
To improve the situation, the REDD+ project should offer more
employment opportunities. These employment opportunities can include
sustainable charcoal-making, fuel efficient stove-making, and fish farming.
The findings about employment opportunities from the respondents was

The Contribution of REDD Pilot Project to Community Livelihoods
101
not far from those of the study done by UNDP (2011), which indicated that
REDD+ initiatives should contribute to the employment of many of 1.2
billion people living in extreme poverty in rural areas, who are largely poor.
Thus, it is important for the REDD+ project to provide alternative means of
improving people’s livelihoods through employment.
Suggestions to Make REDD+ Project Effective
Respondents were further probed to propose measures that could make the
REDD+ project more effective. Their responses are presented in Table 7.
Table 7: Communities Member’s Suggestions to Make
REDD+ Project Effective
Variable Responseper villagein (%)
Average
Mechanisms/ suggestions Kolo(n=40)
Mnenia(n=40)
More income generating activities 65 50 57.5Alternative sources of energy 38.8 36.5 37.7Enforcement of forest by laws. 30.5 33.3 31.9Trainings on carbon assessment 25 30 27.5Innovation and introduction of environmentalfriendly project.
25.6 26.3 26
Extension of project to nearby villages 17.9 2.6 10.3Land use plan 0 10.7 5.4
Note: Data based on multiple responses, n= Sample size
Results show that an introduction of more income generating activities, the
use of alternative energy sources, and the enforcement of bylaws could
make REDD+ project more effective. Others include training on carbon
assessments, innovation and introduction of environmental friendly
projects and land use planning.
As for income generating activities, communities suggested poultry
keeping, eco-tourism and aquaculture as activities that could help them
generate more income in improving their livelihoods. Kajembe et al. (2003)
argues that the REDD+ initiative should improve livelihoods of forest
Table 6: Activities in Which Respondents are Employed
Under REDD+ Project
Employment Opportunities
Villages %
Average %Kolo
(n=40)
Mnenia
(n=40)
Agroforestry 32.5 43.5 38
Brick making 10.5 7.5 9
Not employed 57 49 53
Total 100 100 100

Erasto Mang’enya & Enock Makupa
102
adjacent communities through the introduction of alternative income
generating activities. Regarding energy sources, communities stressed on
the use of bio-gas, solar power and wind power, to mention a few. These
sources are naturally found in the study area at a low cost. Thus, they
could be used by many villagers in the study area at a low cost in
enhancing the REDD+ forest sustainability.
Conclusion and Recommendations
REDD projects are viable options in improving local community’s
livelihoods through participation of all stakeholders. This study
demonstrated that, in order to make REDD+ project effective and
successful then, more options of income generating activities which include:
eco-tourism, fish farming, poetry keeping and tree nurseries should be
introduced to the communities as a way of generating income in improving
people’s livelihoods. In addition, usage of alternative sources of energy such
as bio-gas, solar energy and wind energy could help the local communities
in reducing the cost of energy in order to improve people’s livelihoods. Also,
conditions for carbon payments in compliance with and voluntary market
should be regulated. This will enable the reasonable provision of
compensation for lost livelihood opportunities from forest resources. This
will reasonably outweigh the cost of protecting forests. Further,
compensation programmes should consider various forms of payments
whereby the community could directly benefit from those various forms of
compensation rather than money being given through the state and other
Non-governmental Organizations. This would help to prevent financial
leakage of the REDD+ benefits targeted to local communities.
References
Ahrends, A., N. D. Burgess, S. A. H. Milledge & M. T. Bulling, 2010. Predictable
Waves of Sequential Forest Degradation and Biodiversity Loss in Spreading
From an African City. Proceedings of the National Academy of Science (US) 107:
14556–14561.
AWF. 2014. Advancing REDD++ in Kolo Hill. Midterm review Report.
Angelsen, A. & O. Hofstad. 2008. Inputs to the Development of a National REDD+
strategy in Tanzania. Norwegian University of Life Sciences (UMB) report for
the Norwegian Embassy in Tanzania.

The Contribution of REDD Pilot Project to Community Livelihoods
103
Burgess, N. D., B. Bahane, T. Clairs, F. Danielsen, S. Dalsgaard, M. Funder, N.
Hagelberg, P. Harrison, C. Haule, K. Kabalimu, F. Kilahama, E. Kilawe, S. L.
Lewis, J. C. Lovett, G. Lyatuu, A. R. Marshall, C. Meshack, L. Miles, S. A. H.
Milledge, P. K. T. Munishi, E. Nashanda, DShirima, R. D. Swetnam, S.
Willcock, A. Williams & E. Zahabu. 2010. Getting ready for REDD+ in
Tanzania: A Case Study of Progress and Challenges. Oryx, 44(03): 339–351.
Creswell, J. W. 2003. Research Design: Qualitative, Quantitative, and Mixed
Methods Approaches (2nd Ed). London: Sage Publication.
Ellis, F. 2000. Rural Livelihoods and Diversity in Developing Countries. Oxford:
Oxford University Press.
Forestry and Beekeeping Division. 2008. Support to the National Forest and
Beekeeping Programme Implementation - Phase II 2009 – 2011. Dar es Salaam:
United Republic of Tanzania: Ministry of Natural Resources and Tourism.
Gurung, J. 2011. Assessment of Gender and REDD+ in Asia. Results of a USAID
study. http: //www. scribd. com/doc/51782534/Assessment-of-Gender-and-
REDD+-in-Asia-Results-of-a-USAID-Study.
Hiraldo, R. & T. Tanner. 2011. Forest Voices: Competing Narratives over
REDD++. IDS Bulletin. Special Issue. Political Economy of Climate Change. 42
(3): 42–51.
IPCC. 2007. Working Group I Report. The Physical Science Basis. Summary for
Policymakers. Cambridge University Press.
Kajembe, G. C., J. Nduwamungu & E. J. Luoga. 2003. The Impact of Community-
Based Forest Management and Joint Forest Management on Forest Resource
Base and Local Peoples’ Livelihoods: Case Studies from Tanzania. CASS/PLAAS
Occasional Paper Series No. 8.
Kaswamila, A. L., I. Kikula, D. Mwamfupe & J. Nyahongo. 2010. WMA
Implementation Strategy, Draft Report. MNRT/AWF, Dar es Salaam.
Kothari, C. R. 2004. Research Methodology: Methods and Techniques. 2nd ed. New
Delhi: Willey Eastern Limited.
Konlan, S. 2012. Potential of REDD+ in Ghana. MAthesis in Environmental
Studies at the Norwegian University of Life Science.
Makupa, E. 2013. Conservation efforts and local livelihoods in western Serengeti,
Tanzania: Experience from Ikona community wildlife management area, PhD
Dissertation of University of Victoria, Canada
Minang, P. & H. Neufeldt, 2010. Forestry and REDD+ in Africa. Joto Afrika,
September 2010, Issue 4.
Mwakaje, A. G., G. Kahyarara, C. G. Mung’ong’o & A. Kauzen, 2010. The Role of
Reducing Emissions from Deforestation and Degradation (REDD+) for Rural
Development in Tanzania: The Case of Babati, Hai and KilosaDistricts. A
Consultancy Report submitted to the REDD+ Task Force Tanzania.

Erasto Mang’enya & Enock Makupa
104
Mwakaje, A. 2013. Can REDD+ Compensate Adequately the Forest Dependent
Livelihoods in Tanzania: Insights from Choice Model Analysis in Kilosa Distict.
International Journal of Advanced Research, 1(10): 435–450.
Mswima, J. 2012. The Contribution of REDD+ Initiatives on Local Community’s
Livelihoods in Kilosa District. NRM Dissertation University of Dodoma.
Nilsson, S. 2005. Experiences of Policy Reforms of the Forest Sector in Transition
and Other Countries. Forest Policy and Economics 7: 831–847
NORAD. 2011. Country Report: Tanzania. Real-Time Evaluation of
Norway'sInternational Climate and Forest Initiative - Contribution to National
REDD++ Processes 2007–2010.
Peskett, L., D. Huberman, E. Bowen-Jones, G. Edwards & J. Brown. 2008. Making
REDD+ Work for the Poor: Advancing Knowledge, Shaping Policy and Inspiring
Practice: http: //www. odi. org. uk/resources/details. asp?id=2580 & title=
making-REDD+-work-poor accessed on 14th May 2012.
Ryan, C., T. Hill, E. Woollen, C. Ghee, G. Mitchard, J. Cassells, I. Grace, H.
Woodhouse & M. Williams. 2011. Quantifying Small-scale Deforestation and
Forest Degradation in African Woodlands Using Radar Imagery. Global Change
Biology, Doi: 10. 1111/j. 1365-2486. 2011. 02551
Skutsch, M. 2011. Community Forest Monitoring for the Carbon Market:
Opportunities Under REDD+. London: Earth Scan.
Terry, G. 2009. No Climate Justice Without Gender Justice: An Overview of the
Issues. Gender Development, 17(1): 5–18.
UN-REDD+. 2010. Putting Forests First: Global Forest Initiatives Enhance
Collaborationwith Forest-Rich Developing Countries. From [http: //www.
unREDD+. org/NewsCentre/] site visited on 24/05/2014
Collaboration_Press_Releas
Vatn, A. & P. Vedeld. 2011. Getting Ready - A Study of National Governance
Structures for REDD+. Noragric Report, University of Live Science (UMB).
Vyamana, V. G. 2009. Participatory Forest Management in the Eastern Arc
Mountains of Tanzania: Who Benefits? International Forestry Review, 11(2):
239–253.
Journal of the Geographical Association of Tanzania, Vol. 36 No. 2: 105–118
Climate Change Adaptation Practices for Sustainable
Food Production in Rombo District, Tanzania
Venosa A. Mushi* & Mamkwe C. Edward**
Abstract
Although various studies on climate change and food production have been
conducted, information on how households in Tanzania respond to climate
change for sustainable food production is scarce. This paper investigates
climate change adaptation practices in enhancing sustainable food
production in Rombo District, Tanzania. The study adopted a cross-
sectional research design. Quantitative data were analysed by using the
Statistical Package for Social Sciences software, while the qualitative data
were analysed through factual and logical interpretation of the findings.
Results show that drought was the main effect of climate change as
reported by 65.7% of the respondents in the study area. Furthermore, the
findings show that 81.4% of the respondents applied artificial fertilizers to
their farms in efforts to adapt to climate change. Study results also show a
significant association between the education level of the respondents and
use of improved seeds (P = 0.08) and soil water conservation (P = 0.09) as
adaptation measures to climate change. In adapting to the changing
climate, respondents also experienced some challenges such as lack of
resources in terms of financial, material and human labour. Proper
knowledge on the adaptation measures is recommended to be given to
farmers through various methods.
Introduction
The world is facing multiple crises such as hunger, poverty, economic crisis,
climate change and other environmental crises. The destruction of the
environment, including climate change, is the biggest long-term threat against
the possibilities to end poverty, especially in aspects of hunger and
malnutrition as stated in one of the targets of the Millennium Development
Goal (MDG) One (UN, 2009). According to the United Nations’ panel of climate
experts, Africa is highly vulnerable to the impacts of climate change because of
factors such as widespread poverty, recurrent droughts, inequitable land
distribution and over-dependence on rain-fed agriculture (IPCC, 2001). FAO
(2008) observed that in the tropical countries like Tanzania, food production is
*Institute of Development Studies, Mzumbe University, Tanzania:: [email protected]/
[email protected] (corresponding author).

Venosa A. Mushi & Mamkwe C. Edward
106
affected mainly by climate change impacts such as rainfall scarcity and high
temperatures. Other factors include low soil fertility, poor technology, low
levels of input use and poor mechanization. Normally, climate change affects
food production in most developing countries that engage in the cultivation of
crops in rain-fed systems. Thus, one of the great challenges of the 21st century
is on how to increase food supply to accommodate the world’s growing
population while mitigating climate change (Easterling, 2007). Likewise,
reduced food production in developing countries remains a challenge towards
attaining MDGs, of which the foremost is to eradicate extreme poverty and
hunger by 2015 (UN, 2008; Gregory et al., 2005).
Some studies have predicted the levels of climate change that are expected to
occur in Tanzania in the coming years. For instance, according to a study
commissioned by the government of Tanzania, climate change is expected to
raise mean annual temperatures by 3-5ºC, and average daily temperatures by
2-4ºC by 2075 (Yanda & Moshy, 2007). It has been proposed that developing
countries will be hit harder than developed countries, and the most food-
insecure regions -- Sub-Saharan Africa (SSA) and South Asia -- will be hit
hardest. FAO (2009) reported that by July 2009 the global total number of
undernourished people surpassed 1 billion for the first time. In Tanzania
specifically, out of more than 75% of people who depend on agricultural
production for food and other household needs, 44% are undernourished (FAO,
2007). Due to this problem, all the development strategies conform to the
commitment of the government to reduce the vulnerability of the agricultural
and food security sectors to the adverse impacts of climate change (Kilembe et
al., 2013). According to Yanda and Moshy (2007), the government puts a lot of
efforts for adapting to climate change at both national and local levels for
livestock-keepers and crop farmers.
Several studies have been conducted on relationship between climate
change and crop yield (Gregory et al., 2005; Morton, 2007; Sultana et al.,
2008). Despite all these studies on climate change and food production,
information on how households in developing countries like Tanzania
respond to climate change in order to sustain food production is still scarce.
Unfortunately, food production in Tanzania, and particularly in Rombo
District, is highly dependent on rain-fed agriculture, which makes the
district vulnerable to the adverse impacts of climate change on crop
production. This study, therefore, aims at finding out climate change
adaptation practices for sustainable food production in Rombo District,
Tanzania. The study specifically sought to: (i) describe the background
characteristics with respect to adaptation to climate change; (ii) determine
the effects of climate change; (iii) find out the adaptation practices used in
the study area; and (iv) to determine the challenges experienced in

Climate Change Adaptation Practices for Sustainable Food Production
107
adapting to climate change. The findings of this study are expected to
provide useful information to policy makers and development planners in
suggesting practical tools to develop implementable policies, programmes
and technologies that minimize households’ vulnerability to food insecurity.
Conceptualization of Climate Change and Adaptation
Climate change and adaptation are inseparable because adaptation
measures are normally taken as a remedy to changes in climatic conditions.
Phillips (2006) define climate change as regional or global-scale changes in
historical climate patterns arising from natural and/or man-made causes.
The concept is often used synonymously with global warming and the
greenhouse effect, although the concepts have different meanings. While
global warming refers to any change in global average surface temperature,
greenhouse effect is a natural system that regulates the temperature on
earth. Global climate change facts include: increasing temperatures,
melting polar icecaps, uncontrolled forest fires, and annual average
increase in sea level. It is assumed that African countries that depend on
natural resources and rain-fed agriculture for their economy are more
vulnerable to the risk of climate change.
Adaptation has been described by Lambrou and Piana (2006) as changes in
processes or structures to moderate/offset potential dangers, or to take
advantage of opportunities associated with changes in climate. It also
implies various actions taken to help communities and ecosystems deal with
changing climate conditions. Such actions may include the construction of
flood walls to protect property from sea level rise, or the planting of
agricultural crops and trees more suited to warmer temperatures and drier
soil conditions (Skinner, 2011; Skinner & Brody, 2011).
Methodology
The study was conducted in Rombo District, which is located in the Eastern
part of Kilimanjaro Region, Tanzania. The study covered two villages,
Kirongochini and Ikuini from Usseri and Mkuu divisions, respectively. The
study villages were selected based on their semi-aridity conditions, and
how they contribute to the district’s vulnerability to food shortage. Food
shortage results from crop failure due to inadequate and unreliable rainfall
(URT, 2000). The study employed a cross sectional research design, which
allows data to be collected at single point without repetition from a study
sample. The design is also flexible in terms of data collection and less
expensive in terms of time and funds (Kothari, 2004).
Multistage sampling technique was adopted whereby the sampling stages
included division, village and finally the household. According to Fowler

Venosa A. Mushi & Mamkwe C. Edward
108
(1993), this technique is convenient for studying large and diverse
populations in which the list of actual individuals to be studied is not
available, as was the case in this study. Usseri and Mkuu divisions were
selected based on their climatic conditions, followed by a selection of one
village Kirongochini and Ikuini from each division. Thereafter, a sample of
70 households was randomly selected from a sampling frame constructed
from the village register books. This sample size was relevant according to
Bryman (2004) who suggested sample of 30 units to be a minimum sample
size that can be statistically tested. The respondents comprised of heads of
households and some key informants: one agricultural extension officer,
district agricultural and livestock development officer and four elderly
people from each study village. Two focus group discussions, made up of
five people, were also conducted for each study village.
Primary data were collected by using various methods such as
questionnaire administration, in-depth interviews and focus group
discussions. The instruments included a questionnaire, interview guide and
a checklist of questions. On the other hand, secondary data was collected
through documentary review of various documents on climate change,
adaptation strategies and food production. Quantitative data was analysed
by the Statistical Package for Social Sciences (SPSS) computer programme.
Descriptive statistics such as frequencies and percentages were
determined. Further analysis involved cross tabulation with Chi-square
test to show association between adaptation measures and respondents’
background characteristics. A qualitative method was used in the analysis
of qualitative data where the use of factual and logical interpretation of the
study findings was employed.
Results and Discussion
Respondents’ Background Characteristics
It is important to analyse the background characteristics of a study
population as it helps in data interpretation. The background characteristics
involved under this study include sex, main source of income, income status,
size of household and level of education.
Sex
The study findings show that 57.1% of the respondents were men, while
women comprised 42.9%. This is contributed by the fact that the society in
the study area is patriarchal in nature, thus the majority of households
heads are men. Due to the nature of the society, it was however expected
that the proportion of female respondents could be lower than what is
found in this study. This was not so due to the fact that some respondents

Climate Change Adaptation Practices for Sustainable Food Production
109
were widows, and in some household men were not available at home
during data collection, hence women had to respond on their behalf.
Main Source of Income
The study findings show that more than half (57.1%) of the respondents in the
study area used both farming and animal keeping as their main source of
income. The types of animals kept were mainly poultry, sheep and goats. Only
35.7% of the respondents depend on farming alone as the main source of
income. The rest, 4.3% and 2.9% depend on off-farm and small business,
respectively. This result shows the real image of any rural Tanzanian
community, which mainly depends on farming for livelihood. This engagement
of large proportion of the population in agricultural sector reflects the outcome
of low education level of the rural people that denies them other alternatives
for survival. It has been explained in the 2002 Household Budget Survey that
80% of the poor are rural; and 81% of the same belong to households where the
main economic activity of the head of a household is agriculture.
Table 1: Distribution of Respondents by Background Variables (N = 70)
Variable Frequency Percent (%)
Sex
Male 40 57.1
Female 30 42.9
Main source of income
Crop farming and animal keeping 40 57.1
Crop farming only 25 35.7
Crop farming and off farm activities 3 4.3
Crop farming and small business 2 2.9
Income status
Low 45 64.3
Medium 25 35.7
High 0 0
Household size
1-3 8 11.4
4-6 43 61.4
7-9 17 24.3
10 and above 2 2.9
Level of education
4 years in primary schooling 10 14.3
Completed std. Seven 45 64.3
Completed form four 4 5.7
Never attended school 11 15.7
Source: Field survey, 2010

Venosa A. Mushi & Mamkwe C. Edward
110
Tanzania has recently recognized that agriculture plays a pivotal role in thereduction of poverty through increased food production. This recognitionmade the government in 2009 to embark on agricultural productionimprovement by its famous slogan of Kilimo Kwanza,1 to realise a greenrevolution. Among the activities in pillar number one of the ten pillars ofKilimo Kwanza is to modernise and commercialise agriculture for peasant,small, medium and large scale farm producers (RAWG, 2009)., Under KilimoKwanza, farmers expect to get subsidies that will assist them in cash cropproduction. However, the practise of subsidising farmers had been inexistence in Tanzania for some years, but was abandoned in 1980s and 1990sdue to policy reforms, introduced in the form of Structural AdjustmentProgrammes (SAPs). Specific measures were taken in 1993/94 when prices ofcash crops were decontrolled by the government to allow private traders andinstitutions to participate in the marketing of the crops (Ponte, 2001).
Household Income StatusAccording to the results of this study, there were only two categories of incomestatus; low (less than TZS50,000 per month),2 and medium income level(between TZS50,000 and 150,000 per month), which comprised 64.3% and35.7% of the respondents, respectively. The findings show that there was norespondent with high level of income status (more than TZS50,000 per month).This portrays the actual situation of the rural poor who depends on peasantryfarming as a source of income. The low levels of income forces households ofpoor peasants to consume less. For instance, the Poverty and HumanDevelopment Report of 2009 puts it that almost 98% of households spend lessthan TZS58,000 per month per adult equivalent on food and basic necessitiesaccording to 2007 prices, and approximately 80% spend less than TZS38,600per month. This situation is a result of too much dependence on agriculture,which is the least remunerative sector in the economy (RAWG, 2009).
Household SizeStudy results show that 61.4% of the respondents had a household sizewith a number of people ranging from 4 to 6 members. On the other hand,only 2.9% of the respondents had a household size above 10 members, whilethe remaining 11.4% and 24.3% had a household size ranging from 1 - 3and 7 – 9, respectively. This finding deviates from the district averagehousehold size, which is 4.4 according to the national census (URT, 2013).This could be due to the small sample size used. Large household size isexpected to contribute to increased food production by working together inhousehold economic activities. However, this could be possible when almostall of the household members take part in the production process.
1A Swahili name meaning Agriculture first
2 1USD was equivalent to approximately TZS1500 during the study time
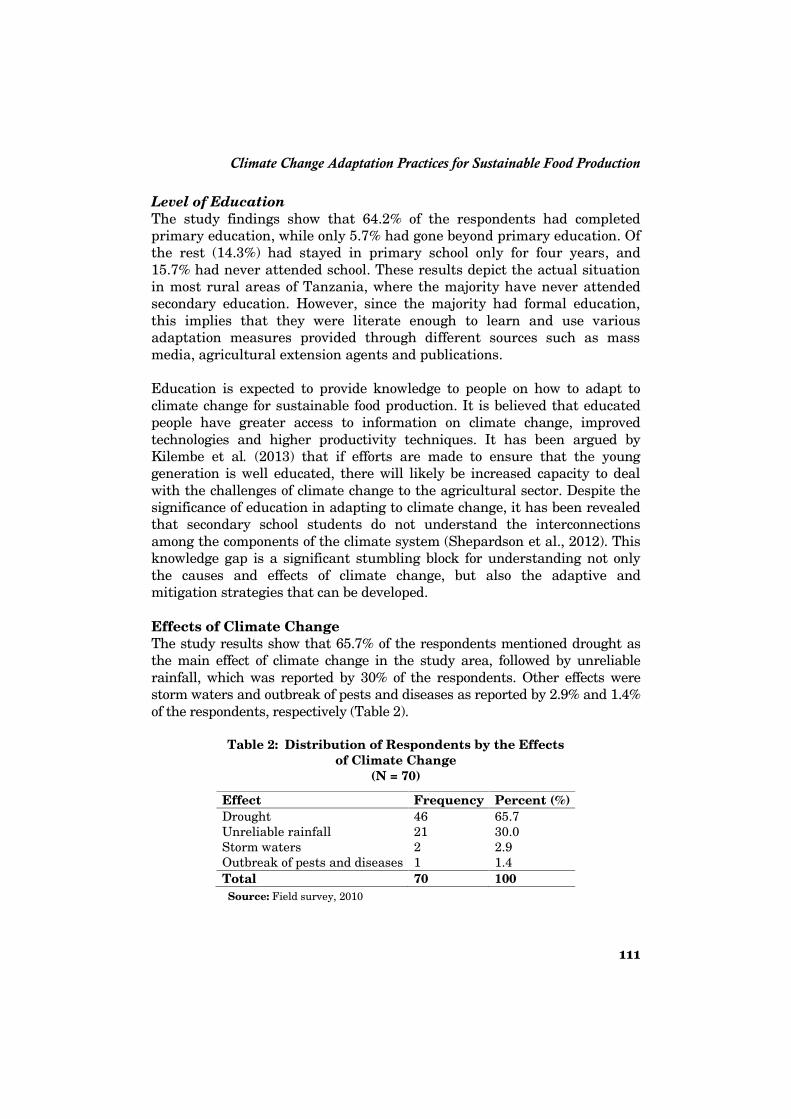
Climate Change Adaptation Practices for Sustainable Food Production
111
Level of Education
The study findings show that 64.2% of the respondents had completed
primary education, while only 5.7% had gone beyond primary education. Of
the rest (14.3%) had stayed in primary school only for four years, and
15.7% had never attended school. These results depict the actual situation
in most rural areas of Tanzania, where the majority have never attended
secondary education. However, since the majority had formal education,
this implies that they were literate enough to learn and use various
adaptation measures provided through different sources such as mass
media, agricultural extension agents and publications.
Education is expected to provide knowledge to people on how to adapt to
climate change for sustainable food production. It is believed that educated
people have greater access to information on climate change, improved
technologies and higher productivity techniques. It has been argued by
Kilembe et al. (2013) that if efforts are made to ensure that the young
generation is well educated, there will likely be increased capacity to deal
with the challenges of climate change to the agricultural sector. Despite the
significance of education in adapting to climate change, it has been revealed
that secondary school students do not understand the interconnections
among the components of the climate system (Shepardson et al., 2012). This
knowledge gap is a significant stumbling block for understanding not only
the causes and effects of climate change, but also the adaptive and
mitigation strategies that can be developed.
Effects of Climate Change
The study results show that 65.7% of the respondents mentioned drought as
the main effect of climate change in the study area, followed by unreliable
rainfall, which was reported by 30% of the respondents. Other effects were
storm waters and outbreak of pests and diseases as reported by 2.9% and 1.4%
of the respondents, respectively (Table 2).
Table 2: Distribution of Respondents by the Effects
of Climate Change
(N = 70)
Effect Frequency Percent (%)
Drought 46 65.7
Unreliable rainfall 21 30.0
Storm waters 2 2.9
Outbreak of pests and diseases 1 1.4
Total 70 100
Source: Field survey, 2010

Venosa A. Mushi & Mamkwe C. Edward
112
From these findings, drought is the major effect of climate change due to
the fact that people in the study area perceives climate change as reduction
in amount of rainfall, together with the changes in duration of rains. In
this respect, people had the idea that droughts in recent years are more
severe than in the past. The respondents claimed that droughts repeat
after 2 to 3 years, while in the past it could repeat after 6 to 10 years. They
further claimed that droughts are usually accompanied with severe food
shortage as majority of households’ food consumption depends directly on
what they produce from their farms.
With regard to unreliable rainfall, respondents were highly food unsecured
in the study area as narrated by one key informant in Box 1.
Although outbreak of pests and diseases was mentioned by one respondent
only, it also came out during focus group discussion. The group participants
claimed that banana production has been affected by the outbreak of insect
pests such as black ants, which destroy roots and stems of banana plants.
It is possible that food production can be affected by other factors like
deteriorating soil fertility due continuous use of the same land for
cultivation, low use of inputs, destructive animals and small farm size due
to population increase. However, in the case of this study rain shortage is
the more striking factor that threatens maize production in the area. All
these effects of climate change make farmers to adapt to some practices to
ensure sustainable food production as discussed in the next section.
Adaptation Practices towards Climate Change
The study results show that farmers in the study area were forced to
change their traditional way of crop production due to climate change. By
so doing, they sought to adapt to some practices as shown in Table 3.
BOX 1:RELATIONSHIP BETWEEN RAINFALL AND HOUSEHOLD FOOD AVAILABILITY
When there is enough rainfall, household food is also sufficient but the crops are
sold at very low prices. The reverse is also true; when there is insufficient
rainfall, household food availability becomes an issue and the food prices boom.
In my case for example, I put all my efforts in agricultural production but lack of
rains lets me down. Nowadays it is not possible to have assurance of harvesting
in order to have enough food for the household consumption and surplus to sell
to meet other needs. As a farmer I do not have anything else to sell in order to
meet my basic needs. So I found compelled to sell the food I produce even if it is
not enough for household consumption. Consequently, my household always
suffers from frequent food shortages.

Climate Change Adaptation Practices for Sustainable Food Production
113
Table 3: Distribution of Respondents by Adaptation Practices (N = 70)
Practice Frequency Percent (%)*
Use of fertilizers 57 81.4
Use of improved seeds 43 61.4
On-farm rain water harvest 33 47.1
Crop diversification 13 18.6
Notes: *Percentages add up to more than 100 due to multiple responses
Source: Field survey, 2010
According to the results, a majority (81.4%) of the respondents mentioned
the use of fertilizers as the main adaptation practice; followed by the use of
improved seeds, which was mentioned by 61.4% of the respondents. Other
practices were on-farm rain water harvest and crop diversification, which
were mentioned by 47.1% and 18.6% of the respondents, respectively.
Use of Fertilizers
According to focus group discussions and key informant interviews, the use
of fertilizers was not practiced in the past. This was because the farms
were fertile enough to support plant growth and obtain sufficient crop
yield. Application of fertilizers is one of the inputs that enhance crop
productivity when appropriately used and supported with sufficient soil
moisture content. However, the use of fertilizers, although mentioned by
the majority of respondents as one of the measures to adapt to climate
change, is not easily affordable especially for the poorest farmers. Although
the government introduced a voucher system through which fertilizers
were sold at cheaper prices, farmers were just buying some small amounts
of fertilizer that they could afford, but not sufficient for their farms.
It has been argued in RAWG (2007) that the cost and availability of
fertilizers and other agricultural inputs have been the major hurdles in
agricultural production in Tanzania. Although the use of manure as an
alternative to artificial fertilizer could be cheaper, it was unfortunate that
the respondents in the study villages (Kirongochini and Ikuini) could not
opt for it. They were poor farmers in the low land area of Rombo District,
who mostly keep poultry and very few animals like goats and sheep, which
were not capable to produce enough manure.
Use of Improved Seeds
The respondents argued that this practice was used after they had notedthat there are some changes in the duration and amount of rainfall in theirarea. They also decided to use improved seeds after they had observed thathouseholds that use modern seeds tend to have high chance of harvesting

Venosa A. Mushi & Mamkwe C. Edward
114
than those that use traditional seeds. Improved seeds are essentialcomponents in increasing productivity in agriculture. The seeds include twocategories: (i) higher yields with greater resistance to pests and diseases; and(ii) shorter crop duration varieties. This practice is especially important incountries like Tanzania, where the agricultural sector is dominated by smallsubsistence farmers who cannot afford other more costly practices. However,the cost element also appears here again, thus not all farmers were able toapply this practice, unless assisted by the government.
On-farm Rain Water Harvest
Rain water harvesting was done either by directing run-off water from roadsto farms, or by the use of terraces as a mechanism to retain rain water infarms. The use of terraces helped to reduce the speed of run-off water andallow rain water to penetrate into the soil for plant use instead of wastage inthe form of storm water. The two traditional practices were developed byfarmers as a response to rain shortages and frequent droughts. They involveharvesting surface run-off water and increasing water infiltration into theirfarms. The intention was to increase soil moisture content, and at the sametime reduce flash floods that occur during heavy rain seasons.
Crop Diversification
Crop diversification as an adaptation measure to climate change by therespondents involves cultivation of a variety of crops like cassava, pigeon peas,groundnuts and sunflower, which were not traditionally grown in the studyarea. Cassava, for instance, was believed to be poisonous in the past, thuspeople were not using it as food. Rarely, it was dried up during food shortagesand used as flour for stiff porridge by some very poor families. The studyfurther discovered that people in the study area had changed their staple foodfrom banana based meals to cereal based meals, mostly maize, for a long time.This was attributed to the fact that banana production has been affected byclimatic change such as decrease in rainfall and frequent prolonged drought.Thus, other crops were introduced after discovering that maize productionalone was not sufficient in dealing with the problems of food shortage. Therespondents reported that they currently concentrate on the production ofcassava and maize as alternative staple crops to banana. This is in line withOrindi and Eriksen (2005) who found out that crop choice is climate sensitive,and farmers adapt to changes in climate by switching crops.
Association between Adaptation Measures and Background
Characteristics
It was also revealed from cross tabulation that there was an associationbetween the level of education of respondents and taking measures foradaptation to climate change. The Chi-square test results indicated that

Climate Change Adaptation Practices for Sustainable Food Production
115
there was significant association between the education level of therespondents and the use of adaptation measures to climate change such asthe use of improved seeds (P = 0.08) and on-farm rain water harvest (P =0.09). This implies that education increases climate change awareness andthe likelihood of taking some adaptation measures to enhance foodsecurity. Thus education is an important asset in enabling poor people tocome out of poverty, especially in the face of climate change. It is expectedthat the impact of climate change on people’s livelihoods will require peoplebeing innovative, for example, by adopting modern production technologiesfor higher food crop productivity in agricultural. However, the Chi-squaretest results revealed no significant association between the adaptationmeasures and other background variables.
Challenges in Adapting to Changes in Climate
The results in Table 4 show that 51.4% of the respondents reported that
households fail to adapt to climate changes primarily due to the lack of
resources. These resources include financial, material and human labour.
Lack of financial resources in terms of households’ own cash, or in the form
of credit, was claimed by the respondents to hinder household’s ability to
adapt to climate change. This is due to the fact that many adaptation
activities involve the use of money, especially in buying some inputs like
fertilizers and improved seeds to enhance crop productivity.
Table 4: Distribution of Respondents According to Challenges
In Adapting to Climate Change (N = 70)
Challenge Frequency Percent (%)Lack of resources 36 51.4Lack of awareness 22 31.4Irresponsible behaviour 9 12.9Others 3 4.3Total 70 100
Source: Field survey, 2010
Furthermore, 31.4% of the respondents said that the lack of awareness about
climate change was the challenge in adapting to changes in climate. These
respondents said that they lack information on climate change impacts and
adaptation options. Due to this, some people get satisfied with the changes
and claim that these are according to God’s will, as revealed by one key
informant who claimed that the solution for adverse climate changes is to
pray more to God for His mercy. Another key informant further said that in
the past they were used to offer sacrifices to the ancestors, asking for
forgiveness and favour and they were heard; but currently they have stopped
performing such kinds of rituals due to interventions from religious people
who preach that the performance of the rituals are against God’s will.

Venosa A. Mushi & Mamkwe C. Edward
116
Additionally, about 13% of respondents mentioned irresponsible behaviour
as one of the challenges. This is the tendency of some people to ignore
things in their surroundings even if they interfere with their livelihoods. In
this case it means some people have noted that there are some changes in
rainfall in terms of onset and distribution but they may not take any
initiative to cope with the changes.
Other challenges such as small size of the farms, old age and superstition
were mentioned by 4.3% of the respondents. They claimed for example that
they fail to plant variety of crops because their farms are small. This is the
problem in the study area that land fragmentation is very high due to
population growth and low mobility of the poor households. Consequently,
high population pressures force farmers to intensively farm small plots of
land, making it difficult to adopt adaptation practices, such as planting
trees, which require more land. Old age as another challenge was
mentioned in the sense that some of the adaptation measures involve
intensive land management, for example making terraces for rain water
harvests is laborious work for the aged ones.
On the side of superstition it was lamented that some people associate the
shortage of rains with some beliefs that some people have the power to
inhibit raining. As a result they take no action of adapting with the
expectation that when those people in power are pleased with some
offerings then the rains will fall as usual and they will have good harvests.
This shows that people are not aware with the climatic change that is why
they tend to associate the changes with some beliefs. It implies that these
people need to be informed of the climatic changes.
The challenges identified under this study are common, not only to the
study area but in most developing countries. For instance, Kilembe et al.
(2013) in a comprehensive analysis of East African agriculture and climate
change identified challenges commonly faced that limit adaptation to
climate change such as weak infrastructure and economies; the dependence
of food security on rainfall; severe poverty and deteriorating livelihoods;
limited reliable, accurate, and updated statistical information; only to
mention a few. The author added that a major challenge is increasing
agricultural production among resource-poor farmers without exacerbating
environmental problems and simultaneously coping with climate change.
Conclusion and Recommendations
Climate change results in large losses in productivity of food crops in various
parts of Tanzania. Hence, communities need to adapt to climate change in
order to attain sustainable food production at both local and national levels,

Climate Change Adaptation Practices for Sustainable Food Production
117
notwithstanding the various challenges they experience. The occurrence of
climate change in Rombo District has made people to change their
traditional food production practices as one of coping measures.
Since adaptation measures are associated with literacy level, it is important
to ensure that proper knowledge on the measures is given to farmers
through various methods such as the use of radio, television or provision of
seminars. Knowledge can also be imparted to students at various levels of
education by incorporating in the syllabus a topic on climate change.
Furthermore, the government, through sectoral policy formulation, should
give sufficient account on climate change adaptation practices. This can be
achieved through conducting site-specific studies to facilitate the attainment
of relevant information on how the community responds to the situation of
low food production as a result of climate change. The government should
also give enough support to the agricultural sector, especially in assisting
poor farmers through the provision of subsidies.
References
Bryman, A. 2004. Social Research Methods (2nd Edition). Oxford: Oxford University
Press.
Easterling, W. E.. 2007. Climate Change and the Adequacy of Food and Timber in
the 21st Century. Department of Geography and the Earth and Environmental
Systems Institute, Pennsylvania State University, University Park.
FAO. 2009. “1.02 Billion People Hungry”. News release, 19 June. At: http://
www.fao.org/news/story/en/item/20568/icode/. Accessed on 5th January. 2010.
—. 2008. High Level Conference on World Food Security: The Challenges of
Climate Change and Bioenergy. Climate Change, Bioenergy and food Security:
Civil Society and Private Sector Perspectives. Rome: FAO.
—. 2007. The State of Food and Agriculture. Paying Farmers for Environmental
Services. FAO Agriculture Series No. 38. Rome: FAO.
Fowler, F.J., Jr. 1993. Survey Research Methods. Second Edition. California: SAGE
Publications.
Gregory, P. J., J. S. I. Ingram & M. Brklacich. 2005. Climate Change and Food
Security. Philosophical Transactions of the Royal Society B. (360) 2139–2148.
Venosa A. Mushi & Mamkwe C. Edward
118
Kilembe, C., T. S. Thomas, M. Waithaka, M. Kyotalimye & S. Tumbo. 2013.
Tanzania. In M. Waithaka, G. C. Nelson, T. S. Thomas & M. Kyotalimye, (eds.).
East African Agriculture and Climate Change: A Comprehensive Analysis.
International Food Policy Research Institute: Washington, DC. 313-345.
Kothari, C. R.. 2004. Research Methodology Methods and Techniques, 2nd Ed. New
Delhi: Age International Limited.
Morton, J. F. 2007. Climate Change and Food Security Special Feature: The Impact
of Climate Change on Smallholder and Subsistence Agriculture. Proceedings of
the National Academy of Sciences, 104: 19680-19685.
Orindi, V. & S. Eriksen. 2005. Mainstreaming Adaptation to Climate Change in the
Development Process in Uganda. Ecopolicy No. 15. African Centre for
Technology Studies: Nairobi.
Phillips, E. 2006. Climate Change in Mexico: Implications for Smallholders, Food
Security and the Future. International Agriculture and Rural Development
Program, Cornell University.
Ponte, S.. 2001. Policy Reforms, Market Failures and Inputs Use in African
Smallholder Agriculture. The European Journal of Development Research, 3: 1-29.
Research and Analysis Working Group (RAWG). 2009. Poverty and Human
Development Report. REPOA: Dar es Salaam.
Shepardson, D. P., D. Niyogi, A. Roychoudhury & A. Hirsch. 2012. Conceptualizing
Climate Change in the Context of a Climate System: Implications for Climate and
Environmental Education. Environmental Education Research, 18:323-352.
Sultana, W., M. A. Aziz & F. Ahmed. 2008. Climate Change: Impact on Crop
Production and its Coping Strategies. Agronomy Division, Bangladesh
Agricultural Research Institute (BARI) Joydebpur, Gazpur: Bangladesh.
United Nations (UN). 2008. The Millennium Development Goals Report. New York.
United Republic of Tanzania (URT). 2013. The 2012 Population and Housing
Census Population Distribution by Administrative Areas. Dar es Salaam:
National Bureau of Statistics.
—. 2000. National Agricultural Extension Project phase II (NAEP II). Proposal for
Pilot Project on Demand Driven and Sustainable Extension Services for Rombo
District, Kilimanjaro Region.
Yanda, P. Z. & V. H. Moshy. 2007. Adaptation to Climate Change: A Case of
Tanzania. Institute of Resource Assessment.
Copyright © 2022 FDOKUMEN