Customer Perceptions of Mediating Role of Ownership Cost in ...
18
Customer Perceptions of Mediating Role of Ownership Cost in Garvin’s Dimensions of Quality Erialdi SYAHRIAL †1 , Hideo SUZUKI †1 , Shane J. SCHVANEVELDT †2 and Mitsuki MASUDA †1 Abstract: In relation to Garvin’s dimensions of quality, this paper investiga tes the influence of ownership cost on automobiles customers’ perspective through maintenance, service and repair. A quantitative survey approach was applied and the results were analyzed using Exploratory Factor Analysis (EFA) and Confirmatory Factor Analysis (CFA). Both analyses were conducted in Japan using different sets of sample sizes (n = 300 for EFA and n = 668 for CFA). Structural Equation Modeling (SEM) was employed for examining the relationships between various constructs in the conceptual model, including six different dimensions of product quality, ownership cost, customer satisfaction, and customer loyalty. From the structural model, nine out of twelve hypotheses were supported, and the ownership cost factor was revealed as playing a significant role in enhancing customer loyalty. In addition to empirically examining this new conceptual model, this research discusses the managerial implications corresponding to the research outcomes. Key words: serviceability, vehicle, customer satisfaction and loyalty, survey, Japan 1 INTRODUCTION Customers are increasingly demanding in their evalua- tion of products, especially for similar products offered by multiple manufacturers. This reality forces manufacturers to deliver high value-added products without compromises in quality [1]. For example, automobile manufacturers are required to deliver high-quality products with reasonable price, which may lead to low ownership cost, high cus- tomer satisfaction, and loyalty as well as indirectly im- proving market share position. Automobiles are a product that is particularly important to consumers throughout the global economy. Automobiles have been prominent in the history and development of quality management, product design, and lean manufacturing, with Japan as the source of many progressive innovations [2-4]. Several Japanese automobiles are undoubtedly a role model for other manu- facturers to strengthen business processes from new prod- uct development until after-sales service. Various coun- tries have recognized Japan’s achievements and initiative- ly started collaboration mainly on manufacturing-based industries. In terms of ownership cost, several main elements are reflected in automobiles such as service cost, repair cost, maintenance cost, price of product, loans from financial institutions, annual insurance premium cost, driving li- cense renewal, registration cost, road tax, protection cost (anti-theft), toll charge and parking charge. Even though all of these elements are mostly acknowledged by the cus- tomers, they are still given significant attention to avoid or minimize additional costs that could incur during the au- tomobile product lifecycle. Customers may have no choice in avoiding such compulsory elements (e.g., price of prod- uct, loans from financial institutions, annual insurance premium cost, driving license renewal, registration cost and road tax) due to basic requirements but they still be- lieve that service, repair, and maintenance costs are ad- justable and subjective, depending on the product condi- tion. Hence, ownership cost is anticipated to become the critical success factor for manufacturers to attract custom- ers with economical vehicles as a value-added characteris- tic compared to other competitors. The economical vehi- cles can help customers in terms of cost saving during product lifecycle as an alternative way to cover hidden ownership costs such as depreciation of 25% in the first year and then every 10% in the following years [5]. Toward pursuing better quality of products, Japanese quality management has been recognized globally, particu- larly for its successes in improving efficiency, and reduc- ing cost [6, 7]. For this purpose, it is helpful to consider all of the various dimensions of quality, such as originally proposed by Garvin [8] with his eight dimensions of prod- uct quality, including performance, features, conformance, aesthetics, perceived quality, reliability, durability, and serviceability. Recently, other scholars (e.g., [9-10]) have continued to examine Garvin’s quality dimensions in di f- ferent fields as a way to understand and meet customer requirements for product quality and to fill the gap of changing consumer demands. †1 Faculty of Science and Technology, Keio University †2 Goddard School of Business and Economics, Weber State University Received: May 23, 2017 Accepted: November 28, 2017 J Jpn Ind Manage Assoc 69, 95-112, 2018 Vol. 69 No. 2E (2018) 95 Original Paper
-
Upload
khangminh22 -
Category
Documents
-
view
3 -
download
0
Transcript of Customer Perceptions of Mediating Role of Ownership Cost in ...
Customer Perceptions of Mediating Role of Ownership Cost in Garvin’s
Dimensions of Quality
Erialdi SYAHRIAL †1, Hideo SUZUKI †1, Shane J. SCHVANEVELDT †2 and Mitsuki MASUDA †1
Abstract: In relation to Garvin’s dimensions of quality, this paper investigates the influence of ownership
cost on automobiles customers’ perspective through maintenance, service and repair. A quantitative survey
approach was applied and the results were analyzed using Exploratory Factor Analysis (EFA) and
Confirmatory Factor Analysis (CFA). Both analyses were conducted in Japan using different sets of sample
sizes (n = 300 for EFA and n = 668 for CFA). Structural Equation Modeling (SEM) was employed for
examining the relationships between various constructs in the conceptual model, including six different
dimensions of product quality, ownership cost, customer satisfaction, and customer loyalty. From the
structural model, nine out of twelve hypotheses were supported, and the ownership cost factor was revealed
as playing a significant role in enhancing customer loyalty. In addition to empirically examining this new
conceptual model, this research discusses the managerial implications corresponding to the research
outcomes.
Key words: serviceability, vehicle, customer satisfaction and loyalty, survey, Japan
1 INTRODUCTION
Customers are increasingly demanding in their evalua-
tion of products, especially for similar products offered by
multiple manufacturers. This reality forces manufacturers
to deliver high value-added products without compromises
in quality [1]. For example, automobile manufacturers are
required to deliver high-quality products with reasonable
price, which may lead to low ownership cost, high cus-
tomer satisfaction, and loyalty as well as indirectly im-
proving market share position. Automobiles are a product
that is particularly important to consumers throughout the
global economy. Automobiles have been prominent in the
history and development of quality management, product
design, and lean manufacturing, with Japan as the source
of many progressive innovations [2-4]. Several Japanese
automobiles are undoubtedly a role model for other manu-
facturers to strengthen business processes from new prod-
uct development until after-sales service. Various coun-
tries have recognized Japan’s achievements and initiative-
ly started collaboration mainly on manufacturing-based
industries.
In terms of ownership cost, several main elements are
reflected in automobiles such as service cost, repair cost,
maintenance cost, price of product, loans from financial
institutions, annual insurance premium cost, driving li-
cense renewal, registration cost, road tax, protection cost
(anti-theft), toll charge and parking charge. Even though
all of these elements are mostly acknowledged by the cus-
tomers, they are still given significant attention to avoid or
minimize additional costs that could incur during the au-
tomobile product lifecycle. Customers may have no choice
in avoiding such compulsory elements (e.g., price of prod-
uct, loans from financial institutions, annual insurance
premium cost, driving license renewal, registration cost
and road tax) due to basic requirements but they still be-
lieve that service, repair, and maintenance costs are ad-
justable and subjective, depending on the product condi-
tion. Hence, ownership cost is anticipated to become the
critical success factor for manufacturers to attract custom-
ers with economical vehicles as a value-added characteris-
tic compared to other competitors. The economical vehi-
cles can help customers in terms of cost saving during
product lifecycle as an alternative way to cover hidden
ownership costs such as depreciation of 25% in the first
year and then every 10% in the following years [5].
Toward pursuing better quality of products, Japanese
quality management has been recognized globally, particu-
larly for its successes in improving efficiency, and reduc-
ing cost [6, 7]. For this purpose, it is helpful to consider all
of the various dimensions of quality, such as originally
proposed by Garvin [8] with his eight dimensions of prod-
uct quality, including performance, features, conformance,
aesthetics, perceived quality, reliability, durability, and
serviceability. Recently, other scholars (e.g., [9-10]) have
continued to examine Garvin’s quality dimensions in dif-
ferent fields as a way to understand and meet customer
requirements for product quality and to fill the gap of
changing consumer demands.
†1Faculty of Science and Technology, Keio University†2Goddard School of Business and Economics, Weber State University Received: May 23, 2017
Accepted: November 28, 2017
J Jpn Ind Manage Assoc 69, 95-112, 2018
Vol. 69 No. 2E (2018) 95
Original Paper

Given this background, further research on customer
perspectives of quality of automobiles is important for
continued development and success in the automobile in-
dustry. Even though existing studies revealed that Garv-
in’s quality dimension displays significant benefits to the
manufactured products, no study has been conducted per-
taining to the application of adopting Garvin’s quality di-
mensions in the context of customer perspectives upon
ownership cost. Hence, a detailed research in creating bet-
ter comprehension of Garvin’s quality dimensions and
customers’ perception about the benefits of ownership cost
dimension is important toward facing this challenging
decade.
Thus, this research describes several objectives. First,
relevant variables of quality dimensions, ownership cost,
customer satisfaction and customer loyalty have to be de-
termined through factor analysis. Second, an empirical
study needs to be conducted to test the hypotheses for en-
tire relationships. Third, a framework representing the
relationships among quality dimensions, ownership cost,
customer satisfaction, and customer loyalty needs to be
constructed as new research contribution for practitioners.
The following sections are structured as follows. In Sec-
tion 2, literatures of Garvin’s eight quality dimensions,
ownership cost, customer satisfaction, and customer loyal-
ty are explained according to previous research followed
by the hypotheses and conceptual model. In Section 3, the
research methodology associated with exploratory factor
analysis (EFA) and confirmatory factor analysis (CFA) is
described as well as results and analyses are interpreted. In
Section 4, the discussion is explained. Finally, in Section 5,
conclusion, limitation and suggestions for future research
are elaborated.
2 LITERATURE REVIEW
Although scholars have defined product quality differ-
ently, most of them introduced product quality based on
the meanings of quality given by Juran [11], who stated
that quality is fitness for use, and Deming [12], who be-
lieved that only customers could define quality based on
judgment of the product or service. Through eight dimen-
sions of quality, Garvin [8] sought to bring together these
and other definitions of quality, as a form of guidance to
manufacturers in providing high-quality products.
2.1 Performance
As Garvin’s first dimension of product quality, perfor-
mance is a “primary operating characteristic” of a product
[8]. Performance is also defined as the ability of a custom-
er to operate and utilize the product smoothly based on the
instructions provided [13]. For an automobile, perfor-
mance is usually measured according to the power of en-
gine during traveling on the road. The car speed is calcu-
lated based on the maximum power produced by the en-
gine. A quality engine can generate high power when
overtaking other cars, as well as support the driver for
smooth handling and braking to prevent accidents. Other
than that, customers are able to evaluate the car when
climbing uphill, since car acceleration reduces due to the
high load. Usually, vehicle with high engine efficiency
consumes less fuel during operation. However, some cus-
tomers may think that a quality engine requires high fuel
consumption. Therefore, production of many types of elec-
tric vehicles (Battery Electric Vehicle (BEV), Hybrid
Electric Vehicle (HEV) and Plug-in Hybrid Electric Vehi-
cle (PHEV)) instead of gasoline engine vehicles is one of
the constructive initiatives that offer better performance of
the fuel economy to the customers. Definitely, perfor-
mance between electric vehicles and gasoline engine vehi-
cles may differ since they are in different vehicle segments. Hence, if the car is designed with good performance, it is
anticipated that it could enhance customer satisfaction and
exceed their initial expectations.
2.2 Features
Features are categorized as a secondary aspect of per-
formance [8]. However, Brucks et al. [13] identified that
features are the most important dimension for certain
products due to the variability of functions that could en-
hance product quality. Thus, manufacturers are forming
new attractions by producing more high-end products in
order to customize the products based on customers’
changing demands. From the customer’s point of view of
automobiles, security, air-conditioner, and seat systems are
also essential value-added elements, which may increase
customer satisfaction during traveling.
2.3 Conformance
Conformance is the degree in which a product meets
design specification [14]. Products or processes that are
able to meet the established design standard are considered
as fulfilling the required specification. Once the specifica-
tion of the product meets the customers’ desire, it repre-
sents that the product has met the specified standard and
fulfilled the definition of conformance. For automobiles, if
the designed products are manufactured according to certi-
fied international standards such as ISO 9001 or TS 16949,
the organization assures high-quality products to the cus-
tomers, which subsequently impacts customer satisfaction.
2.4 Aesthetics
Aesthetic is a customer’s judgment about product ap-
pearance and how the customer feels, tastes, hears or
smells the product during utilization [8]. Thus, aesthetic is
an intangible characteristic and customers evaluate the
product subjectively according to their preference. For
automobiles, aesthetics can be evaluated by customers
while operating some functions such as interior buttons.
Customers are expected to feel delighted if the button is
easily touched without pain and the automobiles are
equipped with many attractive exterior and interior designs.
Several choices of colors and unique features could also
attract customers to the products during product sales.
Hence, a high aesthetics value can potentially build an
96 J Jpn Ind Manage Assoc
initial stage of customer satisfaction on the product before
examining other mandatory product characteristics.
2.5 Perceived quality
Perceived quality represents how influenced the cus-
tomer is to product images, advertisement or brand name
[8]. Moreover, perceived quality is a subjective dimension
[15] and is associated with product reputation or previous
experience, which may encourage or discourage the cus-
tomer to purchase the product. These elements contribute
to the customer’s first impression and may influence their
behavior to purchase a product [16]. Various messages
should be provided to potential customers so that they may
switch their intention to consider purchasing the advertised
product in the future. For example, the reputation of an
automobile manufacturer is anticipated to increase during
its employees’ direct involvement in social activities such
as “green” programs. Hence, customers’ perceived quality
is reliant on how successful the product brand is in the
customers’ perspective towards meeting customer satisfac-
tion.
2.6 Reliability
Reliability is the probability of product failure within a
specified time [14]. Reliability can be evaluated as the
mean time to the first failure, mean time between failures,
and failure rate per unit time [1], [8], [16]. Since reliability
is reflected in product failure, breakable parts of an auto-
mobile such as the bumper, dashboard, and signal handle
have to be designed using robust materials. If there are
fewer failures in parts or components, high frequency of
usage on particular vehicles can be realized. Hence, cus-
tomers who have experienced high reliability of product
are expected to bear lower ownership cost due to less re-
pair or service. In this situation, a reliable product is antic-
ipated to influence customer satisfaction and low owner-
ship cost throughout the product lifecycle.
2.7 Durability
Durability is the lifespan of product usage before the
product becomes unstable and unrepairable [8]. Further-
more, durability represents the ability of the product to be
utilized during its lifespan until it physically deteriorates
or requires replacement [1], [8], [14]. Brucks et al. [13]
explained that product durability level can be determined
based on the number of failure cases. According to Sin-
clair et al. [16], durability is also affiliated to the cost of
repair, downtime, and spare parts because the malfunc-
tioned products require a repairing process in after-sales
service. Hence, the automobile is considered to surpass
customer satisfaction with a reasonable ownership cost
when the entire systems are consistently functioning as
expected.
2.8 Serviceability
Serviceability refers to “speed, courtesy and compe-
tence of repair” [8]. Serviceability is mostly examined by
customers after product’s purchase until its end of life.
According to the recommended procedures, a product with
good serviceability is easily serviced or repaired [14] in
after-sales service. Brucks et al. [13] described that the
service personnel of a service center are able to perform
parts replacement on malfunctioned products. However,
some minor services or repairs could be also fixed by cus-
tomers, which are classified as Do It Yourself (DIY) ser-
vices or repairs. Apart from that, good serviceability also
covers the ease of obtaining spare parts in after-sales ser-
vice. Moreover, services, repairs or diagnostic tasks can be
performed by any service center smoothly within a speci-
fied time and at a competitive service or repair cost. Since
efficient after-sales service is essential from customer’s
perspective, serviceability is expected to impact customer
satisfaction, ownership cost, and customer loyalty.
2.9 Ownership cost
Ownership cost is the total cost of purchasing and
maintaining a product over its lifetime. Ownership cost is
a philosophy that describes the entire subsequent customer
costs along the product life, which are beyond the initial
product purchase [17]. In this study, the examples of cost
consist of cost of maintenance, service, repair, spare part,
and fuel. Since the costs are related to after-sales service,
the most studied ownership cost in literatures was associ-
ated with the automobile industry and a source of concern
by potential customers prior to vehicle purchase.
According to Faria et al. [5], the new purchase of a ve-
hicle directly impacts the ownership cost of vehicle and
customers need to consider the cost due to depreciation as
well. Other than depreciation, fuel consumption for prod-
uct operation significantly affects the customer’s financial
aspect. However, since it is difficult for a customer to per-
sonally evaluate depreciation, this research excluded de-
preciation as one of the ownership cost elements in access-
ing the benefits of ownership cost upon customer satisfac-
tion and customer loyalty.
Even though the total cost of fuel consumption is also
subjected to fuel price and type, a vehicle that is designed
with an economical fuel consumption generates high fuel
efficiency and subsequently influences the customer’s
daily cost saving. However, the vehicle fuel efficiency is
still reduced if there is less awareness for routine mainte-
nance (e.g., engine oil changes) and replacement processes
on short lifespan parts (e.g., spark plug). In the context of after-sales services, especially in ser-
vice centers, elements of ownership cost differ from the
product quality dimensions. Even though the ownership
cost can also vary between customers, they still require
good serviceability aspects (e.g., easy maintenance, ser-
vice and repair) as well as highly reliable and durable
products since the three factors (serviceability, reliability
and durability) may reduce ownership cost, prolong vehi-
cle lifetime and more critically prevent potential safety
issues during vehicle operation.
In this study, ownership cost represents how customers
judge the total expenses spent related to two most im-
Vol. 69 No. 2E (2018) 97

portant aspects, which are service-related costs (e.g.,
maintenance, service, repair and spare parts) and operating
cost (e.g., fuel consumption) during the product life cycle
of the automobile purchased.
2.10 Customer satisfaction
Customer satisfaction is a customer’s evaluation based
on cumulative experiences with the product or service.
The utilized product or service may influences customer
satisfaction. According to Crosby, Evans and Cowles [18],
customer satisfaction is the result from the evaluation of
quality of the previous transaction between the customer
and organization [19], and it can subsequently create a
future expectation on the quality of the product or service.
Rust and Oliver [20] described customer satisfaction as a
customer’s response associated with the buying feeling or
purchasing experience of a product or service. Once high
customer satisfaction is achieved, customer complaints to
the organizations decrease and this subsequently increases
customer loyalty on the products [21].
2.11 Customer loyalty
Customer loyalty corresponds to customer intention to
repurchase the similar product or service in future [22].
Various studies have proven that a positive relationship
existed between customer satisfaction and customer loyal-
ty (e.g., [23]). Customers reacted voluntarily to promote
the product or service experienced to third parties (e.g.,
family, friends, and other people) who seek their advice.
Positive word of mouth is a strong expression by custom-
ers and is anticipated can enhance the image of the manu-
facturers. Fig. 1 represents the conceptual model. The re-
lated hypotheses are proposed as follows:
Hypothesis 1a: Serviceability has a positive effect upon
ownership cost
Hypothesis 1b: Serviceability has a positive effect upon
customer satisfaction
Hypothesis 1c: Serviceability has a positive effect upon
customer loyalty
Hypothesis 2a: Reliability has a positive effect upon own-
ership cost
Hypothesis 2b: Reliability has a positive effect upon cus-
tomer satisfaction
Hypothesis 3: Performance has a positive effect upon cus-
tomer satisfaction
Hypothesis 4: Features have a positive effect upon cus-
tomer satisfaction
Hypothesis 5: Aesthetics have a positive effect upon cus-
tomer satisfaction
Hypothesis 6: Perceived quality has a positive effect upon
customer satisfaction
Hypothesis 7a: Ownership cost has a positive effect upon
customer satisfaction
Hypothesis 7b: Ownership cost has a positive effect upon
customer loyalty
Hypothesis 8: Customer satisfaction has a positive effect
upon customer loyalty
Fig. 1 Conceptual model.
98 J Jpn Ind Manage Assoc
3 RESEARCH METHODOLOGY
In order to analyze customer’s perspective about the
quality of automobiles and ownership cost, a quantitative
research was conducted among automobile users in Japan.
One of the quantitative research methods, survey, was
performed similarly with previous studies (e.g., [9]) to
achieve the research objectives.
3.1 Development of measurement items and survey
instrument
Measurement items were developed by adopting most
of the established measurement scale items and then
slightly modifying them to suit to this research field. Most
of the measurement scale items were aligned with the orig-
inal description by Garvin [8], adapted from literature (e.g.,
[10], [24]), and then further enhanced with the associated
field of study. The remaining scale items, especially for
ownership cost, were designed according to the automo-
biles and after-sales services context.
Elements of performance were described by Yogi [10],
Bruck et al. [13], Chen [25] and Shaharudin et al. [65].
For example, performance of automobiles could be meas-
ured through overtaking other cars, climbing a hill, accel-
eration, braking system, handling and fuel consumption.
For features, literatures from Hazen et al. [9], Kianpour et
al. [24], Shaharudin et al. [65] and Hazen et al. [66] were
studied, whereby some of the scale items were closely
related to motor vehicle since customers might experience
their main features (e.g., seat, interior space and air-
conditioning system). For conformance, literature from
Hazen et al. [9], Yogi [10], Sebastianelli and Tamimi [15],
Sinclair et al. [16], Kianpour et al. [24], Chen [25],
Curkovic et al. [26], Sweeney and Soutar [27] and Hazen
et al. [66] were referred to and three scale items were uti-
lized in this study. For durability, existing literature [1],
[9], [10], [13], [14], [16], [65], [66] also supported the
development of the measurement scale items since they
examined the durability factor for product quality such as
part breakdown and failures within a certain period. For
reliability, all the scale items were based on previous
scholars [9], [13], [14], [16], [66] in order to evaluate the
reliability of parts (including plastic parts) associated with
time. For serviceability, automobiles were evaluated by
customers on how to clean and inspect promptly as well as
how to obtain accurate spare parts in services [9], [10],
[13], [14], [16], [24], [25], [65], [66]. All of the processes
were closely related to maintenance, service and repair at
the service center.
For ownership cost, elements associated with costs,
which included the reasonability of maintenance cost, ser-
vice or repair cost, spare part cost and fuel consumption,
represented the main running expenses after product pur-
chase. Hence, Yogi’s [10], Sweeney and Soutar [27], Sha-
harudin et al. [65] and Kuo et al. [67] survey instrument
were adapted for this study. For aesthetic, Garvin’s [8]
explanation related to aesthetic was considered in order to
develop suitable scale items for aesthetic. Most of the
scale items in this study were also applied by Yogi [10],
Sinclair et al. [16], Kianpour et al. [24], Yuen and Chan
[28] and Shaharudin et al. [65]. For perceived quality,
Garvin’s [8] introduction was very supportive in under-
standing the concept. Subsequently, the survey instrument
by Hansen and Bush [1], Sinclair et al. [16], Kianpour et
al. [24] and Shaharudin et al. [65] were adapted.
With respect to measurement scale items for the cus-
tomer satisfaction and customer loyalty, existing empirical
studies consisting of questionnaires were referred to before
being adopted to suit with this research field. For customer
satisfaction, measurement scale items that have been used
to measure customer satisfaction from Sweeney and Sout-
ar [27], Devaraj et al. [29], Caruana [30], Hallowell [31],
Roberts et al. [32], Olorunniwo et al. [33], Yang et al. [34],
Janda et al. [35], Cronin, Jr. et al. [36] and Kuo et al. [67]
were referred to. The scholars described how satisfied a
customer was with the product or service was closely re-
lated to measuring customer satisfaction. The scale items
require judgment from customers in order to measure the
customer satisfaction relationship with other constructs
(e.g., product quality factors).
For customer loyalty, a similar practice was applied to
identify suitable measurement items for customer loyalty.
These items were also proven to be applied by several
other researchers [27], [28], [30], [33], [35], [37], [67].
The customer loyalty construct consists of items related to
respondents’ perspectives in terms of saying positive
things about the product or organization, such as recom-
mending the product or organization to other people and
encouraging other people to select the product or organiza-
tion. Appendix A shows the measurement scale items and
the related literature.
Throughout those measurement scale items, respective
hypotheses were able to be tested empirically so that effec-
tive research could be demonstrated for future reference.
Prior to conducting this survey, an online survey company
was appointed to manage the distribution of a question-
naire nationwide. The original questionnaire consisting of
two sections; demographic section and evaluation of
measurement scale items. Only customers who had pur-
chased a Japanese car for more than five years and drive
the same car every month (e.g., at least once a month),
whereby the cars were among the six Japanese car manu-
facturers (Toyota, Honda, Nissan, Subaru, Mitsubishi and
Mazda) were eligible to answer the survey questions. The
demographic section also consisted of other elements such
as gender, age, and model of the vehicle. For the second
section, the measurement scale items were listed with a
ten-point Likert-type scale, ranging from 1 (strongly disa-
gree) to 10 (strongly agree), aligned with previous studies’
approach (e.g., [39]). The questionnaire was initially draft-
ed in Japanese to ensure good similarity with the referred
literature.
3.2 Content validity
Academicians and automobile users engaged in survey
instrument verification or pre-test toward producing read-
Vol. 69 No. 2E (2018) 99

able questions, understandable content, and no ambiguity
[40]. Both groups suggested significant comments for fur-
ther refinement regarding the consistency, structure of
instrument, and use of easy-to-understand sentences. Upon
completing the pre-test, a pilot study was conducted by
involving a group of customers to evaluate the content
validity and readability. The main purpose was to ensure
no difficulties or confusion from one question to another
since every customer has different interpretations. Taking
all of the feedback that was obtained into consideration,
the survey was further enhanced, and it was argued that all
measurement scale items fit the survey’s purpose and were
collectively validated.
3.3 Data collection and demography
An online survey was conducted in early December
2016. In total, 1002 questionnaires were returned and 968
were found useful for analysis since the excluded 34 ques-
tionnaires (1002-968 = 34) provided inappropriate answers
(e.g., same answer for all questions). The 968 automobile
users (n = 968) were from all regions of Japan, and pro-
vided full response to the survey questions for EFA and
CFA. Thus, demographic results displayed the respond-
ents’ background and the car characteristics.
Out of 968 respondents, this study split the sample into
two prior to performing two analyses: exploratory factor
analysis (n = 300) and confirmatory factor analysis (n =
668). The 300 data samples for EFA were likely suitable
because the minimum requirement for EFA is 300 [41].
Then, the remaining 668 samples were applied for CFA.
The reason for splitting the samples was to ensure both
analyses used different sample sizes (e.g., [42]) since both
had different purposes. EFA was conducted as a pre-test to
examine the measurement scale items and identify the
number of factors, while CFA was to confirm whether or
not the scale items retained in EFA were really fit, valid
and reliable to the data. This concern was highlighted by
Rugutt [42] who emphasized the importance of splitting
the data into two separate analyses, as well as underlining
that the second sample set of data for CFA should require
a larger size than the first set of sample data for EFA. Fur-
thermore, the application of split-sample size for EFA and
CFA was also practiced by various recent scholars (e.g.,
[43-46]).
From the survey data, 75% of the respondents were
male. Among the total respondents, middle-aged respond-
ents (40 to 59 years old) contributed 60% to the survey
data, followed by retired or elderly respondents (34.3% for
EFA, 30.4% for CFA) and youth (6.4% for EFA and 9.4%
for CFA). Since the survey was a public survey conducted
throughout Japan, the most interested respondents were
working people (e.g., company employees, medical staffs,
salespersons and civil servants) and less than 0.5 % were
students. Almost all of the respondents had more than 10
years of driving experience and frequently drive for many
purposes monthly. Due to the very long driving experience,
the participated customers were anticipated to have the
knowledge to evaluate every scale item in the survey in-
struments in order to produce better findings that are clos-
er to reality.
In terms of vehicle characteristics, this study targeted
various vehicle manufacturers and vehicle models. The
respondents drove Toyota, Honda, Nissan, Subaru,
Mitsubishi and Mazda. The respondents were identified to
drive various types of models, such as compacts or hatch-
backs (27.0% for EFA and 26.2% for CFA), minivans
(28.0% for EFA and 22.5% for CFA), sedans (17.0% for
EFA and 14.4% for CFA) and mini cars, wagons and
SUVs, with 91% of the cars being powered by gasoline
engine type, followed by hybrid (7%) and diesel (1%).
Thus, this study examined the customers’ point of view,
regardless of vehicle manufacturer (the six Japanese car
manufacturers) or vehicle model, even though some cus-
tomers might have driven popular or luxury cars, which
may differ in terms of vehicle performance, features, aes-
thetic or other product quality factors.
Hence, considering the variety of the customers’ back-
grounds, vehicle manufacturers and vehicle models, this
survey represented a generalization of survey results with
regards to automobile experience in Japan. Table 1 shows
the demographic data of survey respondents.
3.4 Construct validity
The Kaiser-Meyer-Olkin (KMO) was applied to test
the normality and outliers. KMO measures the sampling
accuracy and Bartlett Test of Sphericity. For sampling
accuracy, a KMO value closer to 1 represents a more accu-
rate sample size [47]. In terms of Barlett’s Test of Spheric-
ity, p-value was used as an indicator to measure the signif-
icance of correlation between factors. The KMO value of
this study was 0.943 while the chi-square value of Bart-
lett’s Test was 21,341.116 at a p-value of < 0.05. Hence,
multi-collinearity was unlikely a concern and all meas-
urement scale items were highly appropriate to be ana-
lyzed through factor analysis.
3.5 Reliability
Reliability means the overall consistency of a meas-
urement test, which produces certain results. The reliabil-
ity for each factor was measured using Cronbach’s alpha
test. Factors with an alpha value of more than 0.7 are con-
sidered reliable, which also represents that the respective
measurement scale items are appropriate for survey in-
strument.
3.6 Exploratory factor analysis (EFA)
EFA is a statistical procedure to identify minimum
number of factors extracted from received data. EFA is
most appropriate to produce new theories and hypotheses
by analyzing the factors extracted and the respective
measurement scales items. The measurement scale items
were grouped into each factor extracted, which shared one
variance. A total of 300 data samples were analyze
through EFA using the principal components extracted
method [26] and Varimax as the rotation method. In this
study, nine factors were extracted with 75.89% of total
100 J Jpn Ind Manage Assoc

variance explained. All of the factors yielded Eigen values
of more than 1.0 (e.g., [48]). For example, the first factor
accounted for 15.37%, followed by the second factor with
11.65%, and the third factor with 8.29%. The factor load-
ing for all of the variables was also positive and exceeded
the 0.5 cut-off point (e.g., [47]). Table 2 shows that nine
new factors with high factor loading variables (factor load-
ing >0.05) were identified: Reliability (11 items), Perfor-
mance (8 items), Ownership cost (6 items), Serviceability
(7 items), Customer loyalty (4 items), Features (5 items),
Aesthetics (6 items), Customer satisfaction (5 items), and
Perceived quality (4 items).
Hence, the sufficient factor loading for the variables
indicated that all variables contributed significantly to
each respective factor. In order to evaluate the reliability, a
reliability coefficient or Cronbach’s alpha was measured
for each factor. From Table 2, it can also be seen that the
reliability coefficient for all of the factors was higher than
the cut-off point of 0.7 [49], which means that the meas-
urement scale had a relatively high reliability. For example,
reliability consisted of 11 variables with factor loadings
ranging from 0.628 to 0.862, and a reliability coefficient
of (α value) 0.954.
Furthermore, a basic relationship between constructs
can be identified as initial evidence through the factor cor-
relation matrix. Based on the correlation matrix results,
there were positive correlations between all of the con-
structs and significant at 0.01 level (two-tailed). For ex-
ample, the correlation between performance and reliability
was 0.439 at p-value < 0.01. Table 3 displays the factor
correlation matrix for all of the constructs.
3.7 Common method bias
Common method bias is a possible problem in every
survey conducted (e.g., [50]). The common test to measure
the common method bias is Harman’s one-factor test [51].
Since the extracted factors accounted to 75.89% of the
total variance, where the first factor was 15.37% of the
variance, it is determined that a single factor did not exist
to represent most of the variance. Thus, there is no signifi-
cant problem for common method bias in this research.
3.8 Confirmatory factor analysis (CFA)
CFA is a multivariate statistical technique used to
evaluate how well each of the measurement scales item
represents each factor. According to Gerbing and Ander-
son [52], CFA was conducted to validate each factor stud-
ied and two stages of CFA, which are the measurement
model and structural model, are required in order to test
the conceptual model. The measurement model is applied
by scholars to identify the relationship between factors and
corresponding measurement scale items (observed varia-
bles) and subsequently perform structural model for test-
ing the hypothesized relationship. The following sub-
sections discuss common procedures, corresponding to
CFA data validation.
3.8.1 Non-response bias
In order to assess non-response bias, the early and late
respondents were compared [53] by selecting the first 10%
of respondents and the last 10% of respondents. T-test was
used for these two types of samples, and it was concluded
that a significant difference did not exist. Both methods
had proven that non-response bias was not an issue in this
research.
3.8.2 Measurement model assessment
The goodness-of-fit statistics were examined using the
measurement model. Each fit index had a cut-off point
with the ratio of chi-square to the degree of freedom
(x2/df) that should be less than 5.0; Comparative Fit Index
(CFI) and Incremental Fit Index (IFI) should be more or
equal to 0.9 and close to 1.0; and the Root Mean Square
Error of Approximation (RMSEA) values should be less
or equal to 0.080. The results for the model fit indices pre-
sented the relative chi-square of 4.476, CFI = 0.906, IFI =
0.906, and RMSEA = 0.072. These indices concluded that
the measurement model was relatively fit and established
unidimensionality.
Throughout exploratory factor analysis, which was fol-
lowed by the measurement model in confirmatory factor
analysis, this study identified several measurement scale
items which did not directly measure the factors, and
hence, were excluded from further analysis. The respective
scale items are also listed in Appendix A. Thus, the re-
maining 45 scale items in the fit measurement model
strongly represented the characteristics of each factor as
follows: performance (6 items), features (5 items), reliabil-
ity (6 items), serviceability (5 items), aesthetic (6 items)
and perceived quality (4 items), ownership cost (4 items),
customer satisfaction (5 items) and customer loyalty (4
items). All of the remaining 45 scale items can also be
identified in Appendix A and Appendix B.
3.8.3 Tests for construct validity
Construct validity comprises convergent validity and
discriminant validity. Of these, convergent validity is the
degree to which the observed variables measure the inher-
ent factor. A well-known test to evaluate convergent valid-
ity is average variance extracted (AVE). AVE is a value of
variance yielded by factors relative to measurement errors
[54]. Since all of the standardized factor loadings for each
factor were greater than 0.7, this directly accounted for a
higher AVE and construct reliability, which then subse-
quently contributed to adequate convergent validity. The
threshold for AVE is 0.5, while construct reliability is 0.7.
In this study, the AVE ranged from 0.673 to 0.898 and
construct reliability ranged from 0.924 to 0.972. Hence,
convergent validity was established. Discriminant validity
corresponds to the value of square root of AVE and inter-
construct correlation. Hair et al. [55] suggested to use the
square root value of AVE and to compare it with the
square correlation between factors.
Vol. 69 No. 2E (2018) 101
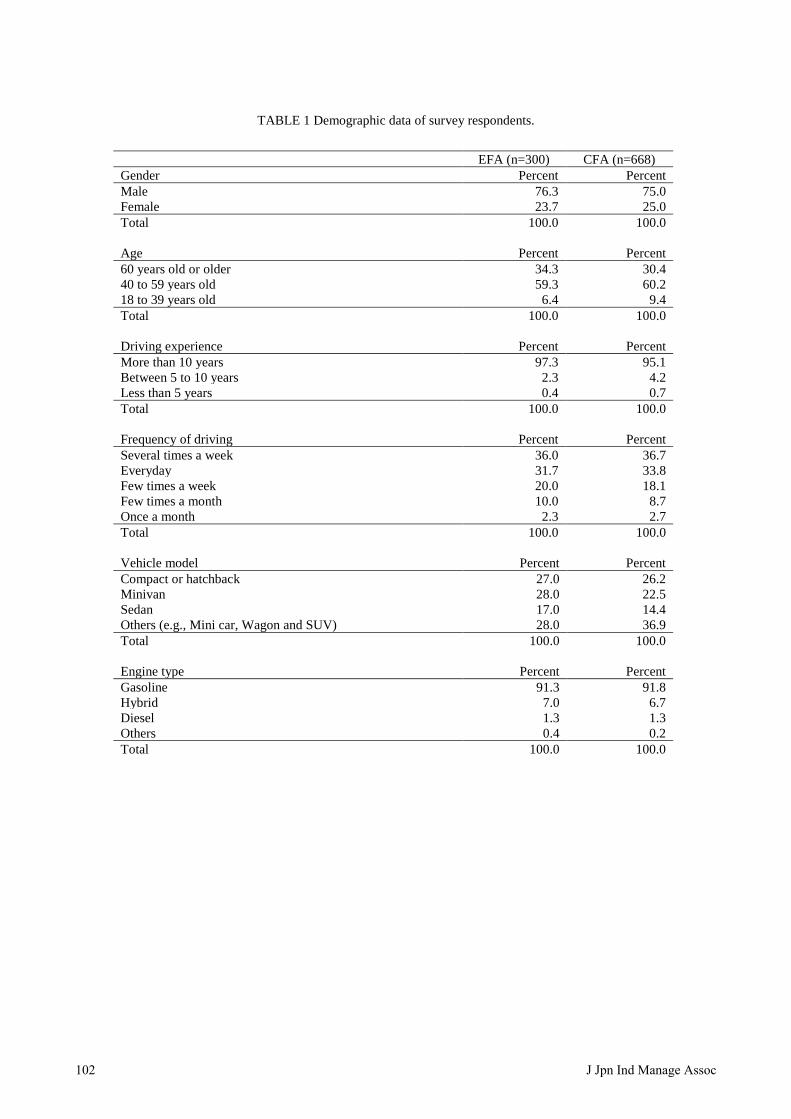
TABLE 1 Demographic data of survey respondents.
EFA (n=300) CFA (n=668)
Gender Percent Percent
Male 76.3 75.0
Female 23.7 25.0
Total 100.0 100.0
Age Percent Percent
60 years old or older 34.3 30.4
40 to 59 years old 59.3 60.2
18 to 39 years old 6.4 9.4
Total 100.0 100.0
Driving experience Percent Percent
More than 10 years 97.3 95.1
Between 5 to 10 years 2.3 4.2
Less than 5 years 0.4 0.7
Total 100.0 100.0
Frequency of driving Percent Percent
Several times a week 36.0 36.7
Everyday 31.7 33.8
Few times a week 20.0 18.1
Few times a month 10.0 8.7
Once a month 2.3 2.7
Total 100.0 100.0
Vehicle model Percent Percent
Compact or hatchback 27.0 26.2
Minivan 28.0 22.5
Sedan 17.0 14.4
Others (e.g., Mini car, Wagon and SUV) 28.0 36.9
Total 100.0 100.0
Engine type Percent Percent
Gasoline 91.3 91.8
Hybrid 7.0 6.7
Diesel 1.3 1.3
Others 0.4 0.2
Total 100.0 100.0
102 J Jpn Ind Manage Assoc
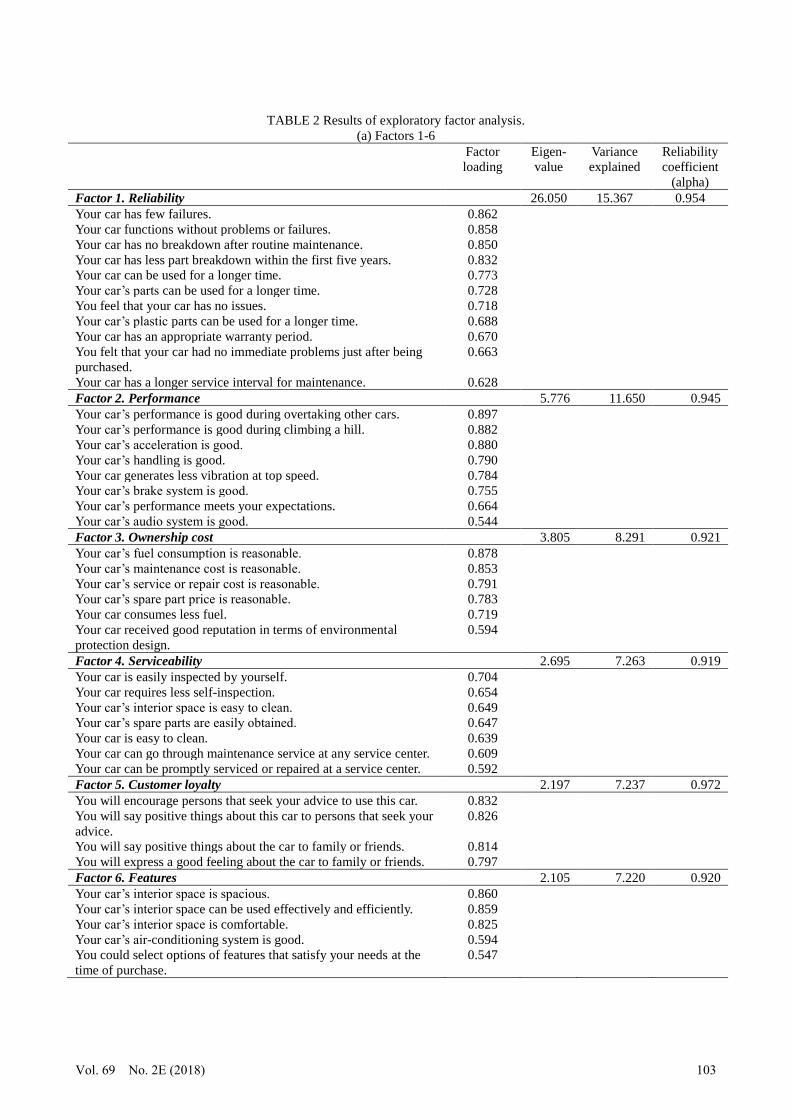
TABLE 2 Results of exploratory factor analysis.
(a) Factors 1-6
Factor
loading
Eigen-
value
Variance
explained
Reliability
coefficient
(alpha)
Factor 1. Reliability 26.050 15.367 0.954
Your car has few failures. 0.862
Your car functions without problems or failures. 0.858
Your car has no breakdown after routine maintenance. 0.850
Your car has less part breakdown within the first five years. 0.832
Your car can be used for a longer time. 0.773
Your car’s parts can be used for a longer time. 0.728
You feel that your car has no issues. 0.718
Your car’s plastic parts can be used for a longer time. 0.688
Your car has an appropriate warranty period. 0.670
You felt that your car had no immediate problems just after being
purchased.
0.663
Your car has a longer service interval for maintenance. 0.628
Factor 2. Performance 5.776 11.650 0.945
Your car’s performance is good during overtaking other cars. 0.897
Your car’s performance is good during climbing a hill. 0.882
Your car’s acceleration is good. 0.880
Your car’s handling is good. 0.790
Your car generates less vibration at top speed. 0.784
Your car’s brake system is good. 0.755
Your car’s performance meets your expectations. 0.664
Your car’s audio system is good. 0.544
Factor 3. Ownership cost 3.805 8.291 0.921
Your car’s fuel consumption is reasonable. 0.878
Your car’s maintenance cost is reasonable. 0.853
Your car’s service or repair cost is reasonable. 0.791
Your car’s spare part price is reasonable. 0.783
Your car consumes less fuel. 0.719
Your car received good reputation in terms of environmental
protection design.
0.594
Factor 4. Serviceability 2.695 7.263 0.919
Your car is easily inspected by yourself. 0.704
Your car requires less self-inspection. 0.654
Your car’s interior space is easy to clean. 0.649
Your car’s spare parts are easily obtained. 0.647
Your car is easy to clean. 0.639
Your car can go through maintenance service at any service center. 0.609
Your car can be promptly serviced or repaired at a service center. 0.592
Factor 5. Customer loyalty 2.197 7.237 0.972
You will encourage persons that seek your advice to use this car. 0.832
You will say positive things about this car to persons that seek your
advice.
0.826
You will say positive things about the car to family or friends. 0.814
You will express a good feeling about the car to family or friends. 0.797
Factor 6. Features 2.105 7.220 0.920
Your car’s interior space is spacious. 0.860
Your car’s interior space can be used effectively and efficiently. 0.859
Your car’s interior space is comfortable. 0.825
Your car’s air-conditioning system is good. 0.594
You could select options of features that satisfy your needs at the
time of purchase.
0.547
Vol. 69 No. 2E (2018) 103
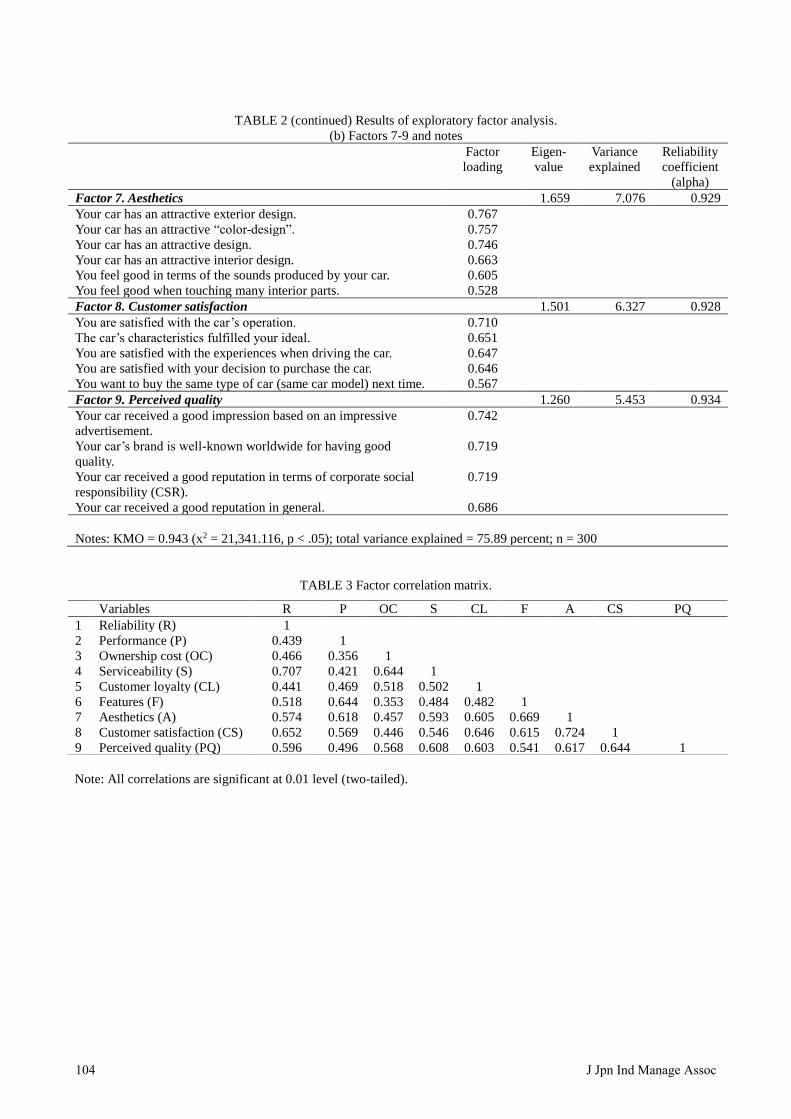
TABLE 2 (continued) Results of exploratory factor analysis.
(b) Factors 7-9 and notes
Factor
loading
Eigen-
value
Variance
explained
Reliability
coefficient
(alpha)
Factor 7. Aesthetics 1.659 7.076 0.929
Your car has an attractive exterior design. 0.767
Your car has an attractive “color-design”. 0.757
Your car has an attractive design. 0.746
Your car has an attractive interior design. 0.663
You feel good in terms of the sounds produced by your car. 0.605
You feel good when touching many interior parts. 0.528
Factor 8. Customer satisfaction 1.501 6.327 0.928
You are satisfied with the car’s operation. 0.710
The car’s characteristics fulfilled your ideal. 0.651
You are satisfied with the experiences when driving the car. 0.647
You are satisfied with your decision to purchase the car. 0.646
You want to buy the same type of car (same car model) next time. 0.567
Factor 9. Perceived quality 1.260 5.453 0.934
Your car received a good impression based on an impressive
advertisement.
0.742
Your car’s brand is well-known worldwide for having good
quality.
0.719
Your car received a good reputation in terms of corporate social
responsibility (CSR).
0.719
Your car received a good reputation in general. 0.686
Notes: KMO = 0.943 (x2 = 21,341.116, p < .05); total variance explained = 75.89 percent; n = 300
TABLE 3 Factor correlation matrix.
Note: All correlations are significant at 0.01 level (two-tailed).
Variables R P OC S CL F A CS PQ
1 Reliability (R) 1
2 Performance (P) 0.439 1
3 Ownership cost (OC) 0.466 0.356 1
4 Serviceability (S) 0.707 0.421 0.644 1
5 Customer loyalty (CL) 0.441 0.469 0.518 0.502 1
6 Features (F) 0.518 0.644 0.353 0.484 0.482 1
7 Aesthetics (A) 0.574 0.618 0.457 0.593 0.605 0.669 1
8 Customer satisfaction (CS) 0.652 0.569 0.446 0.546 0.646 0.615 0.724 1
9 Perceived quality (PQ) 0.596 0.496 0.568 0.608 0.603 0.541 0.617 0.644 1
104 J Jpn Ind Manage Assoc
The diagonal values are the square roots of the AVEs
for each factor. In this study, each diagonal value exceed-
ed the respective inter-construct correlation; the discrimi-
nant validity was supported.
3.9 Structural model
Structural equation modeling (SEM) was applied to
evaluate the conceptual model proposed. In order to run a
comprehensive analysis, a large sample size was highly
recommended, and with 668 samples of reliable data, this
study exceeded 200 as the minimum sample size (e.g.,
[56]). Similar to the measurement model, goodness-of-fit
indices were also evaluated to prove the fitness of the
structural model. The results for all of the fit indices are as
follows: ratio of chi-square to degrees of freedom (x2/df) =
4.543, CFI = 0.903, IFI = 0.903, and RMSEA = 0.073.
Since the fit indices values were within the cut-off point
[57], the structural model was statistically significant at a
p-value of 0.01. Several hypotheses were tested, which
represented a direct relationship between Garvin’s quality
dimensions, ownership cost, customer satisfaction, and
customer loyalty using SPSS version 23 and AMOS soft-
ware version 23. Subsequently, a mediation test was per-
formed to evaluate the role of ownership cost as the medi-
ator between two constructs.
In this study, Hypothesis 1a indicated that serviceabil-
ity highly influences ownership cost (standardized coeffi-
cient = 0.73, p-value < 0.01). This hypothesis is supported
by previous studies (e.g., [58]), that investigated servicea-
bility elements such as total labor cost, spare part availa-
bility, and Do-It-Yourself (DIY) item contributing to low
cost of ownership during maintenance. However, Hypoth-
esis 1b reported that there was no significant relationship
between serviceability and customer satisfaction (stand-
ardized coefficient = –0.07, p-value > 0.05). This result is
contrary to Cavalieri, Gajardelli and Ierace [59], who ex-
plored that after-sales service is important for manufactur-
ers in delivering quality service to customers and subse-
quently establishing customer satisfaction [60]. According
to Hypothesis 1c, this study detected that serviceability
influenced customer loyalty. Hence, Hypothesis 1c was
supported (standardized coefficient = 0.14, p-value was in
between 0.05 and 0.01).
Reliability was hypothesized and no significant rela-
tionship was found between reliability and ownership cost
(standardized coefficient = –0.03, p-value > 0.05). How-
ever, reliability was detected to strongly influence custom-
er satisfaction (standardized coefficient = 0.30, p-value <
0.01). Hence, Hypothesis 2a and Hypothesis 2b were not
supported and supported, respectively. The result of Hy-
pothesis 2a is inconsistent with JD Power and Associates
(2007), who reported that automobile manufacturers that
focused on product reliability directly impacted ownership
cost. With regard to Hypothesis 2b, Ugboro and Obeng
[61] considered reliability while measuring customer satis-
faction in manufacturing and service industries. Both in-
dustries presented that reliability was important upon cus-
tomer satisfaction.
Hypothesis 3 represented a relationship between per-
formance and customer satisfaction. Since the standard-
ized coefficient was 0.07 at p-value between 0.05 and 0.01,
a direct relationship existed, and thus, Hypothesis 3 was
supported [15]. Similar to Hypothesis 3, Hypothesis 4
(features have a positive effect upon customer satisfaction)
was also supported [62] since the path coefficient 0.09 was
significant (p-value was between 0.05 and 0.01). Hypothe-
sis 5 presented a positive impact of aesthetics upon cus-
tomer satisfaction at 0.01 level (standardized coefficient =
0.38) [24]. Perceived quality had a positive effect upon
customer satisfaction (standardized coefficient was 0.23
and p-value was less than 0.01), which presented strong
support for Hypothesis 6 [15].
The structural model also tested Hypothesis 7a, which
examined the impact of ownership cost upon customer
satisfaction. The hypothesis was not supported (standard-
ized coefficient = 0.01, p-value > 0.05), representing that
customers were not really satisfied with any payments in
after-sales service. However, there was a significant rela-
tionship between ownership cost and customer loyalty that
supported Hypothesis 7b (standardized coefficient = 0.18,
p-value < 0.01) [63]. Similar to previous studies (e.g.,
[38]), customer satisfaction is very significant to customer
loyalty (standardized coefficient = 0.48, p-value < 0.01).
Thus, Hypothesis 8 was also supported.
In terms of the mediation test, serviceability and cus-
tomer loyalty were significantly partially mediated by
ownership cost (standardized coefficient = 0.10, p-value
was in between 0.05 and 0.01). The relationships between
serviceability and customer satisfaction as well as reliabil-
ity and customer satisfaction were not mediated by owner-
ship cost since the p-values for both relationships were not
less than 0.05. Appendix B displays the structural model
produced. In summary, the hypotheses, the path, the
standardized coefficient, and the results of hypotheses
(direct effect and mediation) are listed in Table 4 and Ta-
ble 5.
4 DISCUSSION AND IMPLICATIONS
This research discovered the significance of practicing
Garvin’s quality dimensions toward ownership cost, cus-
tomer satisfaction, and customer loyalty. Even though
numerous researches have been conducted by experts (e.g.,
[1], [9], [10], [13]) with regards to Garvin’s contribution,
this research presented additional new findings associated
with automobile in after-sales service. Additionally, the 65
questions used in the survey instrument were proven un-
derstandable due to the high response rate from users of
automobile within a short period and no ambiguous ques-
tions were highlighted by respondents.
Based on the hypothesis results, the most important
quality dimension is serviceability, which displayed a
strong effect upon ownership cost (standardized coeffi-
cient = 0.73, p-value < 0.01). This dimension is considered
as a new contribution to this research because customers
realized that, by utilizing a high serviceability-oriented
Vol. 69 No. 2E (2018) 105
vehicle, service-related tasks could be performed promptly
and efficiently by service personnel at service centers.
Subsequently, they could gain reasonable service, repair,
and maintenance costs in after-sales service. Moreover, for
minor DIY items such as air filter inspection and interior
surface cleaning, customers are also capable of acting
promptly without sending their automobile to the service
center. This advantage conveyed a positive perception
from customers since no labor cost is incurred. Further-
more, being easy to obtain spare parts during maintenance,
service and repair contributes to additional cost-saving
because customers have the option to compare spare part
prices at different automobile part premises. Besides,
ownership cost was closely related to fuel consumption.
For example, fuel consumption may vary depending on
type of cars, which may require frequent maintenance and
service in order to ensure all systems are operating effi-
ciently. Subsequently, customers could avoid extra fuel
consumption caused by an inefficient car. Thus, reasona-
ble fuel consumption was required by customers since the
cost financially impacts expenses when using the existing
cars.
Furthermore, the relationship between serviceability
and customer loyalty was supported by the mediation test
conducted, whereby partial mediation was identified from
serviceability to customer loyalty since the ownership cost
acted as a mediator. Since serviceability has a direct rela-
tionship with customer loyalty and is partially mediated by
ownership cost, a strong relation was noticed between
ownership cost and customer loyalty. When the customers
incur reasonable costs in the after-sales service, they tend
to express their happiness through a willingness to convey
positive messages to surrounding people, especially family
and friends, or encourage them to purchase the same prod-
uct.
Besides serviceability, this research also explored that
aesthetics were an essential quality dimension which
strongly affected customer satisfaction (standardized coef-
ficient = 0.38, p-value < 0.01). This result shows that cus-
tomers were interested in experiencing value-added factors
in their vehicles, such as sound system, and attractive col-
ors and design. Since entertainment increases people’s
happiness, having the best sound system in the vehicle
may further increase customer satisfaction. Due to high
competition among manufacturers, aesthetics become an
essential factor for every new model launched, in addition
to introducing attractive designs and colors. Another im-
portant quality dimension that strongly affected customer
satisfaction was reliability (standardized coefficient = 0.30,
p-value < 0.01). Customers realized that, by utilizing a
highly reliable vehicle, it may continuously function as
desired for a longer period. However, it was found that
reliability was not supported in avoiding high ownership
cost. This finding was unexpected because when the num-
ber of part failures is minimum, fewer repairs and part
replacements due to malfunctions are required. This means
that higher product reliability supports customer cost-
savings.
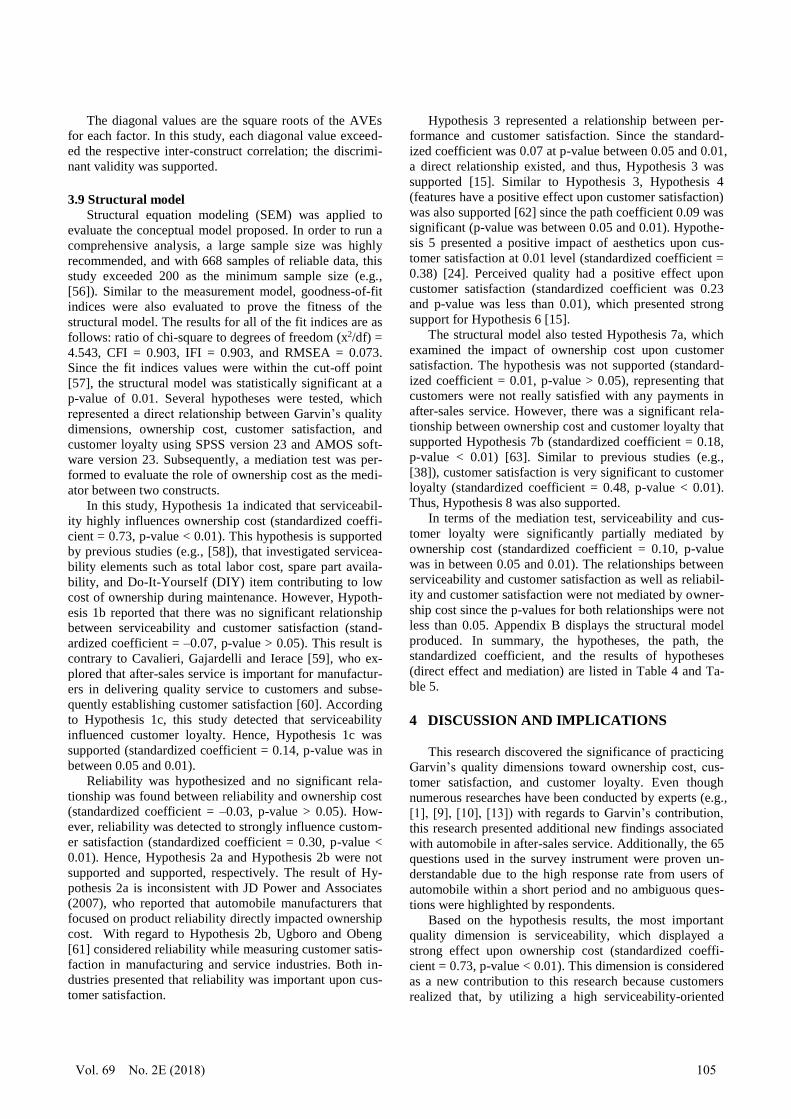
TABLE 4 Summary of hypotheses test results for structural model.
Hypotheses Path Standardized
coefficient
Hypotheses
supported?
H1a Serviceability (S)-> Ownership cost (OC) 0.73*** Yes
H1b Serviceability (S)-> Customer satisfaction (CS) -0.07 No
H1c Serviceability (S)-> Customer loyalty (CL) 0.14** Yes
H2a Reliability (R) -> Ownership cost (OC) -0.03 No
H2b Reliability (R) -> Customer satisfaction (CS) 0.30*** Yes
H3 Performance (P) -> Customer satisfaction (CS) 0.07** Yes
H4 Features (F) -> Customer satisfaction (CS) 0.09** Yes
H5 Aesthetics (A) -> Customer satisfaction (CS) 0.38*** Yes
H6 Perceived quality (PQ) -> Customer satisfaction (CS) 0.23*** Yes
H7a Ownership cost (OC) -> Customer satisfaction (CS) 0.01 No
H7b Ownership cost (OC) -> Customer loyalty (CL) 0.18*** Yes
H8 Customer satisfaction (CS) -> Customer loyalty (CL) 0.48*** Yes
Path significant at: **p < 0.05; ***p < 0.01,
TABLE 5 Summary of mediation test results for structural model.
Path Description Standardized
coefficient
Significant
S->OC->CS OC mediates the relationship between S and CS 0.01 No
S->OC->CL OC mediates the relationship between S and CL 0.10** Yes
R->OC->CS OC mediates the relationship between R and CS 0.00 No
Path significant at: **p < 0.05; ***p < 0.01,
106 J Jpn Ind Manage Assoc

In terms of performance, this research identified that
customers in Japan are empirically satisfied with vehicles
that provide good performance, which was a crucial factor
to smoothen the transportation mode. From the customer’s
perspective, good vehicle performance was represented by
five physical characteristics: easy to overtake other vehi-
cles, good acceleration, easy to climb a hill, less vibration
at top speed and good handling. Those characteristics were
aligned with Japan since, geographically, Japan has many
hills and various types of routes. Accordingly, vehicles
have to be embedded with highly advanced systems for
high stability and smooth handling during climbing and
maneuvering, especially in urban areas, which require low
vehicle speeds [64]. However, even though performance
was related to fuel efficiency, this research revealed that
vehicle with less fuel consumption was not directly meas-
ured the vehicle performance. Hence, as described in this
section and displayed in Appendix B, fuel consumption
was measuring ownership cost instead of performance.
Meanwhile, in view of features, the similarity percep-
tion with performance exists from the Japanese driver’s
point of view. Based on the result of the hypothesis, fea-
tures equipped on vehicles such as good air-conditioning
system and interior space significantly delighted custom-
ers. Customers realized that all of the features designed by
manufacturers met their expectations for experiencing
convenient and comfortable driving. Perceived quality in
this research identified that customers felt highly confident
and were willing to purchase a vehicle as frequently as it is
advertised in the media. The good reputation of manufac-
turers through efficient after-sales service and active par-
ticipation in social events was associated with positive
customer impression.
In terms of managerial implications, several approach-
es are appropriate for the management of automobile
manufacturers to ensure that the products marketed are
aligned with the market trend. This effort was empirically
proven in this study, whereby from the customers’ per-
spective, the embedded serviceability aspects of the auto-
mobiles formed a very significant and positive relationship
upon ownership cost. Hence, service managers require a
continuous attention to ensure a safe and efficient mainte-
nance of the service and repair processes at service centers.
With respect to practical implications, marketing managers
shall play important roles in strategizing new methods of
business; for example, by offering several service packag-
es or a service menu instead of stand-alone service, repair,
and maintenance, as part of the organisation’s initiatives to
avoid high ownership costs for customers. Subsequently,
this study also empirically revealed that customers believe
that easy service and low cost of ownership may attract
them to stay continuously loyal to the product or organiza-
tion. This finding was represented by the framework that a
positive relationship existed between ownership cost and
customer loyalty. Therefore, management is encouraged to
continuously support the organization in producing ser-
vice-friendly products such as easily cleaned and inspected,
as well as the high availability of different levels of spare
parts in order to satisfy existing customers by offering an
economical service cost during the product life cycle.
Moreover, this study reveals wider opportunities for
service centers to strategies any service promotions such
as offering steeper discounts on spare parts or free product
inspection. Unequivocally, promotions impact the extent
that customers are more delighted in utilizing the products
or even persuaded to purchase genuine spare parts. Subse-
quently, this impact increases product demand by attract-
ing a higher number of customers to consistently follow up
with routine maintenance, which directly contributes to
high profit margin and market share. This study also noti-
fied organizations to continue embedding five product
quality dimensions; performance, features, aesthetic, per-
ceived quality and reliability in automobiles towards pro-
ducing a customer-oriented product. The study outcomes
revealed that customers felt delighted on the five dimen-
sions to be considered for automobiles. Moreover, product
robustness required further enhancement. Hence, man-
agements have to produce robust quality vehicles with
high reliability, since it was underscored that customers
felt satisfied on reliable vehicles (e.g., fewer failures along
the life cycle) and may anticipate influences less service,
repair and maintenance in the future.
5 CONCLUSION
This research investigated the influence of ownership
cost on automobiles customers’ perspective through
maintenance, service and repair. This research also found
benefit in utilizing Garvin’s quality dimensions for under-
standing customer perspectives of product quality for Jap-
anese automobiles and examined the impact of ownership
cost in after-sales service. Since customers provided opin-
ions and comments differently [13], the research displayed
additional outcomes in manufacturing context as an exten-
sion of previous studies. The employed EFA and CFA
were used comprehensively. Based on the EFA results, six
out of eight Garvin quality dimensions (i.e., performance,
features, aesthetics, perceived quality, reliability, and ser-
viceability) were extracted, whereas the other two dimen-
sions (conformance and durability) did not stand as strong
individual factors, but instead were shared in a reliability
factor. This finding is aligned with Garvin [8], who men-
tioned that durability and reliability were inter-related, and
with other studies where they loaded onto one factor [9],
[15].
Through CFA, this research reported the hypothesized
structural model results. Using a large sample size from
actual automobile users throughout all regions in Japan,
the structural model tested was deemed fit. The model
interpreted the connections between the six quality dimen-
sions extracted, ownership cost, customer satisfaction, and
customer loyalty. Twelve hypotheses were tested and nine
hypotheses displayed a significant relationship between
two constructs. Most importantly, six out of the nine hy-
Vol. 69 No. 2E (2018) 107

potheses had a strong positive relationship (p-value <
0.01) and the remaining three hypotheses yielded a signifi-
cantly p-value between 0.05 and 0.01.
Hence, customer requirements remain one of the im-
portant criteria for a manufacturer in consideration of the
latest characteristics with reasonable costs. Products with
visible characteristics are more attractive when it comes to
prompt decision-making and influencing customers to
make an immediate purchase. That is the reason customers
realized that the importance of serviceability can avoid
high ownership cost. Other than that, serviceability-
embedded design represents a product with easy service,
repair and maintenance at service centers and then con-
tributes to lower labor costs. Due to these reasons, they are
willing to recommend the advantages of purchasing the
same product to other people.
Regarding ownership cost, this research explored own-
ership cost as a new dimension. For instance, ownership
cost plays an important factor toward influencing customer
loyalty. Due to this reason, ownership cost is clearly rec-
ognized as one of the effective factors in the customer’s
purchasing decision and might be a powerful instrument
for consideration in a marketing strategy. Proactive manu-
facturers may entertain their customers promptly, politely,
and consistently to establish a strong relationship with
them. Hence, overall customer satisfaction should be mon-
itored by manufacturers to increase the number of loyal
customers and attract new customers.
This research also had its limitations. Due to time and
financial constraints, this study only analyzed customers’
perspectives of automobiles in a single country. Since 90%
of the respondents owned gasoline engine vehicles, the
results were mainly represented how the customers judged
the importance of ownership cost and other product quali-
ty dimensions based upon the gasoline engine vehicles.
Hence, further studies specifically targeting customers of
EVs, HVs and PHEVs are anticipated to reveal new re-
search findings that may significantly support the reduc-
tion of ownership cost and high protection of the environ-
ment. Additionally, future studies on other products that
require periodic maintenance (e.g., air-conditioners and
photocopy machines) might be appropriate in order to ex-
plore new outcomes and subsequently extend the literature
of ownership cost in after-sales services.
ACKNOWLEDGMENTS
We are grateful for the research grant provided by
Keio University, Japan. We would like to take this oppor-
tunity to thank Keio University staff for their continuous
support during this research. This work was also supported
by Grant-in-Aid JP 16K03939.
REFERENCES
[1] Hansen, E. and Bush, R. J.: “Understanding Customer
Quality Requirements: Model and Application,” Ind.
Mark. Manage., Vol. 28, pp. 119-130 (1999)
[2] Womack, J. P., Jones, D. T., and Roos, D.: The Ma-
chine that Changed the World, Harper Perennial, NY
(1990)
[3] Clark, K. B. and Fujimoto, T.: Product Development
Performance: Strategy, Organization, and Manage-
ment in the World Auto Industry, Harvard Business
Press, Boston (1991)
[4] Fujimoto, T.: The Evolution of a Manufacturing Sys-
tem at Toyota, Oxford University Press, NY (1999)
[5] Faria, R., Moura, P., Delgado, J., and Almeida, A. T.
D.: “A Sustainability Assessment of Electric Vehicles
as a Personal Mobility System,” Energy Convers.
Manage., Vol. 61, pp. 19-30 (2012)
[6] Ishikawa, K.: What Is Total Quality Control? : The
Japanese Way, Englewood Cliffs, Prentice-Hall, NJ,
(1985)
[7] Akiba, M., Schvaneveldt, S. J., and Enkawa, T.: Ser-
vice Quality: Methodology and Japanese Perspectives,
Handbook of Industrial Engineering, Second Edition,
Wiley, NY, pp. 2349-2371 (1992)
[8] Garvin, D. A.: “Competing on the Eight Dimensions of
Quality,” Harv. Bus. Rev., Vol. 65, No. 6, pp. 101-109
(1987)
[9] Hazen, B. T., Boone, C. A., Wang, Y., and Khor, K.
S.: “Perceived Quality of Remanufactured Products:
Construct and Measure Development,” J. Clean.
Prod., Vol. 142, No. 2, pp. 716-726 (2016)
[10] Yogi, K. S.: “An Empirical and Fuzzy Logic Ap-
proach to Product Quality and Purchase Intention of
Customers in Two Wheelers,” Pac. Sci. Rev. B: Hum.
Soc. Sci., Vol. 1, No. 1, pp. 57-69 (2016)
[11] Juran, J. M..: Quality Control Handbook, McGraw-
Hill, NY (1974)
[12] Deming, W. E.: Quality, Productivity and Competi-
tive Position, Center for Advanced Engineering
Study, MIT, Cambridge (MA) (1982)
[13] Brucks, M., Zeithmal, V. A. and Naylor, G.: “Price
and Brand Name as Indicators of Quality Dimen-
sions for Consumer Durables,” J. Acad. Mark. Sci.,
Vol. 28, No. 3, pp. 359-374 (2000)
[14] Larson, P. D.: “Buyer-supplier Co-operation, Prod-
uct Quality and Total Costs,” Int. J. Phys. Distrib.
Logist. Manage., Vol. 24, No. 6, pp. 4-10 (1993)
[15] Sebastianelli, R. and Tamimi, N.: “How Product
Quality Dimensions Relate to Defining Quality,” Int.
J. Qual. Reliab. Manage., Vol. 19, No. 4, pp. 442-
452 (2002)
[16] Sinclair, S. A., Hansen, B. G., and Fern, E. F.: “In-
dustrial Forest Product Quality: An Empirical Test of
Garvin’s Eight Quality Dimensions,” Wood Fiber
Sci., Vol. 25, No. 1, pp. 66-76 (1993)
[17] Ellram, L.: “A Taxonomy of Total Cost of Owner-
ship Models,” J. Bus. Logist., Vol. 15, No. 1, pp.
171-191 (1994)
[18] Crosby, L. A., Evans, K. R. and Cowles, D.: “Rela-
tionship Quality in Services Selling: An Interperson-
al Influence Perspective,” J. Mark., Vol. 54, pp. 68-
81 (1990)
108 J Jpn Ind Manage Assoc
[19] Boulding, W., Kalra, A., Richard, S., and Zeithaml,
V. A.: “A Dynamic Process Model of Service Quali-
ty: From Expectations to Behavioral Intentions,” J.
Mark. Res., Vol. 30, No. 1, pp. 7-27 (1993)
[20] Rust, R. T., and Oliver, R. L.: “Service Quality: In-
sights and Managerial Implications from the Fron-
tier” in Rust, R. T. and Oliver, R. L. (Eds): Service
Quality: New Directions in Theory and Practice,
Sage Publications, Thousand Oaks, CA (1994)
[21] Fornell, C. and Wernerfelt, B.: “Defensive Market-
ing Strategy by Customer Complaint Management:
A Theoretical Analysis,” J. Mark. Res., Vol. 24, pp.
337-346 (1987)
[22] Zeithaml, V. A., Berry, L. L., and Parasuraman, A.:
“The Behavioral Consequences of Service Quality,”
J. Mark. Res., Vol. 60, No. 2, pp. 31-46 (1996)
[23] Flint, D. J., Blocker, C. P., Boutin, Jr., and Philip, J.:
“Customer Value Anticipation, Customer Satisfac-
tion and Loyalty: An Empirical Examination,” Ind.
Mark. Manage., Vol. 40, pp. 219-230 (2011)
[24] Kianpour, K., Jusoh, A., and Asghari, M.: “Environ-
mentally Friendly as a New Dimension of Product
Quality," Int. J. Qual. Reliab. Manage., Vol. 31, Is-
sue 5, pp.547-565 (2000)
[25] Chen, S. C.: “Process Performance Estimation on the
Quality Characteristics of Auto Engines,” Int. J. Adv.
Manuf. Technol., Vol. 32, pp. 492-499 (2007)
[26] Curkovic, S., Vickery, S. K., and Droge, C.: “An Em-
pirical Analysis of the Competitive Dimensions of
Quality Performance in the Automotive Supply In-
dustry,” Int. J. Oper. Prod. Manage., Vol. 20, Issue 3,
pp. 386-403 (2000)
[27] Sweeney, J. C. and Soutar, G. N.: “Consumer Per-
ceived Value: The Development of a Multiple Item
Scale,” J. Retailing, Vol. 77, pp. 203-220 (2001)
[28] Yuen, E. F. T. and Chan, S. S. L.: “The Effect of Re-
tail Service Quality and Product Quality on Custom-
er Loyalty,” J. Database Mark. Customer Strategy
Manage., Vol. 17, pp. 222-240 (2010)
[29] Devaraj, S., Matta, K. F., and Conlon, E.: “Product
and Service Quality: The Antecedents of Customer
Loyalty in the Automotive Industry,” Prod. Oper.
Manage., Vol. 10, No. 4, pp. 424-439 (2001)
[30] Caruana, A.: “Service Loyalty,” Eur. J. Mark., Vol.
36, Issue 7/8, pp. 811-828 (2002)
[31] Hallowell, R.: “The Relationships of Customer Satis-
faction, Customer Loyalty, and Profitability: An
Empirical Study,” Int. J. Serv. Ind. Manage., Vol. 7,
Issue 4, pp. 27-42 (1996)
[32] Roberts, K., Varki, S., and Brodie, R.: “Measuring the
Quality of Relationships in Consumer Services: An
Empirical Study,” Eur. J. Mark., Vol. 37, Issue 1/2,
pp. 169-196 (2003)
[33] Olorunniwo, F., Hsu, M. K., and Udo, G. J.: “Service
Quality, Customer Satisfaction, and Behavioral In-
tentions in the Service Factory,” J. Serv. Mark., Vol.
20, Issue 1, pp. 59-72 (2006)
[34] Yang, Z., Jun, M. and Peterson, R. T.: “Measuring
Customer Perceived Online Service Quality,” Int. J.
Oper. Prod. Manage., Vol. 24, Issue 11, pp. 1149-
1174 (2004)
[35] Janda, S., Trocchia, P. J., and Gwinner, K. P.: “Con-
sumer Perceptions of Internet Retail Service Quali-
ty,” Int. J. Serv. Ind. Manage., Vol. 13, Issue 5, pp.
412-431 (2002)
[36] Cronin, Jr., Brady, M. K., and Hult, G. T. M.: “As-
sessing the Effects of Quality, Value, and Customer
Satisfaction on Consumer Behavioral Intentions in
Service Environments,” J. Retailing, Vol. 76, No. 2,
pp. 193–218 (2000)
[37] Parasuraman, A., Zeithaml, V. A., and Malhotra, A.:
“E-S-QUAL: A Multiple-item Scale for Assessing
Electronic Service Quality,” J. Serv. Res., Vol. 7, No.
3, pp. 213-233 (2005)
[38] Cronin, Jr. J. J. and Taylor, S. A.: “Measuring Ser-
vice Quality: A Reexamination and Extension,” J.
Mark., Vol. 56, No. 3, pp. 55-68 (1992)
[39] Srinivasan, R., Lilien, G. L., Rangaswamy, A.,
Pingitore, G. M., and Seldin, D.: “The Total Product
Design Concept and an Application to the Auto
Market,” J. Prod. Innov. Manage., Vol. 29, pp. 3-20
(2012)
[40] Dillman, D. R.: Mail and Internet Surveys: The Tai-
lored Design Method. John Wiley & Sons, NY
(2000)
[41] Comrey, A., and Lee, H.: A First Course in Factor
Analysis. Hillsdale, NJ (1992)
[42] Rugutt, J. K.: “Linking Teaching and Learning Envi-
ronment Variables to Higher Order Thinking Skills,”
in Khine, M. S. (Ed): Application of Structural
Equation Modeling in Educational Research and
Practice, pp. 217-239 (2013)
[43] Yu, T. and Richardson, J. C.: “Examining Reliability
and Validity of a Korean Version of the Community
of Inquiry Instrument Using Exploratory and Con-
firmatory Factor Analysis,” Internet Higher Educ.,
Vol. 25, pp. 45-52 (2015)
[44] Schroder, J., Sautier, L, Kriston, L., Berger, T., Mey-
er, B., Spath, C., Kother, U., Nestoriuc, Y., Klein, J.
P., and Moritz, S.: “Development of a Questionnaire
Measuring Attitudes towards Psychological Online
Interventions-the APOI,” J. Affective Disord., Vol.
187, pp. 136-141 (2015)
[45] Koch, A. S., Kleiman, A., Wegener, I., Zur, B., Im-
bierowicz, K., Geiser, F., and Conrad, R.: “Factorial
Structure of the 20-item Toronto Alexithymia Scale
in a Large Sample of Somatoform Patients,” Psychi-
atry Res., Vol. 225, pp. 355-363 (2015)
[46] Pontes, H. M., and Griffiths, M. D.: “Measuring
DSM-5 Internet Gaming Disorder: Development
Validation of a Short Psychometric Scale,” Comput.
Hum. Behav., Vol. 45, pp. 137-143 (2015)
[47] Tabachnick, B. G. and Fidell, L. S.: Using Multivari-
ate Statistics, Pearson Fifth Edition, Allyn & Bacon,
Boston (2007)
Vol. 69 No. 2E (2018) 109

[48] Hair Jr., J. F., Anderson, R. E., Tatham, R. L. and
Black, W. C.: Multivariate Data Analysis, Fifth Edi-
tion, Prentice Hall, Upper Saddle River, NJ (1998)
[49] Nunnally, J. C.: Psychometric Theory, Second Edi-
tion, McGraw-Hill, NY (1978) [50] Flynn, B. B., Sakakibara, S., Schroeder, R. G., Bates,
K. A., and Flynn, E. J.: “Empirical Research Meth-
ods is Operations Management,” J. Oper. Manage.,
Vol. 9, No. 2, pp. 250–284 (1990) [51] Podsakoff, P. M. and Organ, D. W.: “Self-reports in
Organizational Research: Problems and Prospects,” J.
Manage., Vol. 12, No. 2, pp. 531-544 (1986)
[52] Gerbing, D. W. and Anderson, J. C.: “An Updated
Paradigm for Scale Development Incorporating Uni-
dimensionality and Its Assessment,” J. Mark. Res.,
Vol. 25 (May), pp. 186-192 (1988)
[53] Armstrong, J. S. and Overton. T. S.: “Estimating
Non-response Bias in Mail Surveys,” J. Mark. Res.,
Vol. 14, No. 3, pp. 396–402 (1977)
[54] Fornel, C. and Larcker, D. F.: “Evaluating Structural
Equation Models with Unobservable Variables and
Measurement Error,” J. Mark. Res., Vol. 18, No. 1,
pp. 39-50 (1981)
[55] Hair Jr, J. F., Sarstedt, M., Hopkins, L. and Kuppel-
wieser, V. G.: “Partial Least Squares Structural
Equation Modeling (PLS-SEM): An Emerging Tool
in Business Research,” Eur. Bus. Rev., Vol. 26, No.
2, pp. 106-121 (2014)
[56] Hussey, D. M. and Eagan, P. D.: “Using Structural
Equation Modelling to Test Environmental Perfor-
mance in Small and Medium-sized Manufacturers:
Can SEM Help SMEs?,” J. Clean. Prod., Vol. 15, pp.
303-312 (2007)
[57] Hu, L. T. and Bentler, P. M.: “Cutoff Criteria for Fit
Indexes in Covariance Structure Analysis: Conven-
tional Criteria versus New Alternatives,” Struct. Equ.
Model., Vol. 6, No. 1, pp. 1-55 (1999)
[58] Sundin, E., Lindahl, M., and Ijomah, W.: “Product
Design for Product/service Systems: Design Experi-
ences from Swedish Industry,” J. Manuf. Technol.
Manage., Vol. 20, No. 5, pp. 723-753 (2009)
[59] Cavalieri, S., Gaiardelli, P., and Ierace, S.: “Aligning
Strategic Profiles with Operational Metrics in After-
sales Service,” Int. J. Prod. Perform. Manage., Vol.
56, No. 5/6, pp. 436-455 (2007)
[60] Kurata, H. and Nam, S. H.: “After-sales Service
Competition in a Supply Chain: Optimization of
Customer Satisfaction Level or Profit or Both,” Int. J.
Prod. Econ., Vol. 127, No. 1, pp. 136-146 (2010)
[61] Ugboro, I. O. and Obeng, K.: “Top Management
Leadership, Employee Empowerment, Job Satisfac-
tion, and Customer Satisfaction in TQM Organiza-
tions: An Empirical Study,” J. Qual. Manage., Vol. 5,
pp. 247-272 (2000)
[62] Churchill, G. A., Jr., and Surprenant, C.: “An Inves-
tigation into the Determinants of Customer Satisfac-
tion,” J. Mark. Res., Vol. 19, No. 4, pp. 491-504
(1982)
[63] Al-Alawi, B. M., and Bradley, T. H.: “Total Cost of
Ownership, Payback and Consumer Preference
Modeling of Plug-in Hybrid Electric Vehicle,” Appl.
Energy, Vol. 103, pp. 488-506 (2013)
[64] Tsugawa, S.: “An Overview on Energy Conservation
in Automobile Traffic and Transportation with ITS,”
Proceeding IEEE International Vehicle Electronics
Conference, Tottori, Japan, pp. 25–28 (2001)
[65] Shaharudin, M. R., Wan Mansor, S., Abu Hassan, A.,
Wan Omar, M. and Harun, E. H.: “The Relationship
between Product Quality and Purchase Intention:
The Case of Malaysia’s National Motorcycle/scooter
Manufacturer,” Afr. J. Bus. Manage., Vol. 5, No. 20,
pp. 8163-8176 (2011)
[66] Hazen, B. T., Overstreet, R. E., Jones-Farmer, L. A.,
and Field, H. S.: “The Role of Ambiguity Tolerance
in Consumer Perception of Remanufactured Prod-
ucts,” Int. J. Prod. Econ., Vol. 135, pp. 781-790
(2012)
[67] Kuo, Y. F., Wu, C. M. and Deng, W. J.: “The Rela-
tionships among Service Quality, Perceived Value,
Customer Satisfaction, and Post-purchase Intention
in Mobile Value-added Services,” Comput. Hum.
Behav., Vol. 25, pp. 887-896 (2009)
Appendix A.
Factors and measurement scale items References
Q1_1. Your car’s performance is good during overtaking other cars.
[10],[13],[25],[65]
Q1_2. Your car’s performance is good during climbing a hill.
Q1_3. Your car generates less vibration at top speed.
Q1_4. Your car’s acceleration is good.
Q1_5. Your car’s brake system is good.
Q1_6. Your car’s handling is good.
Q1_7. Your car consumes less fuel.
Q1_8. Your car’s performance meets your expectations.
110 J Jpn Ind Manage Assoc
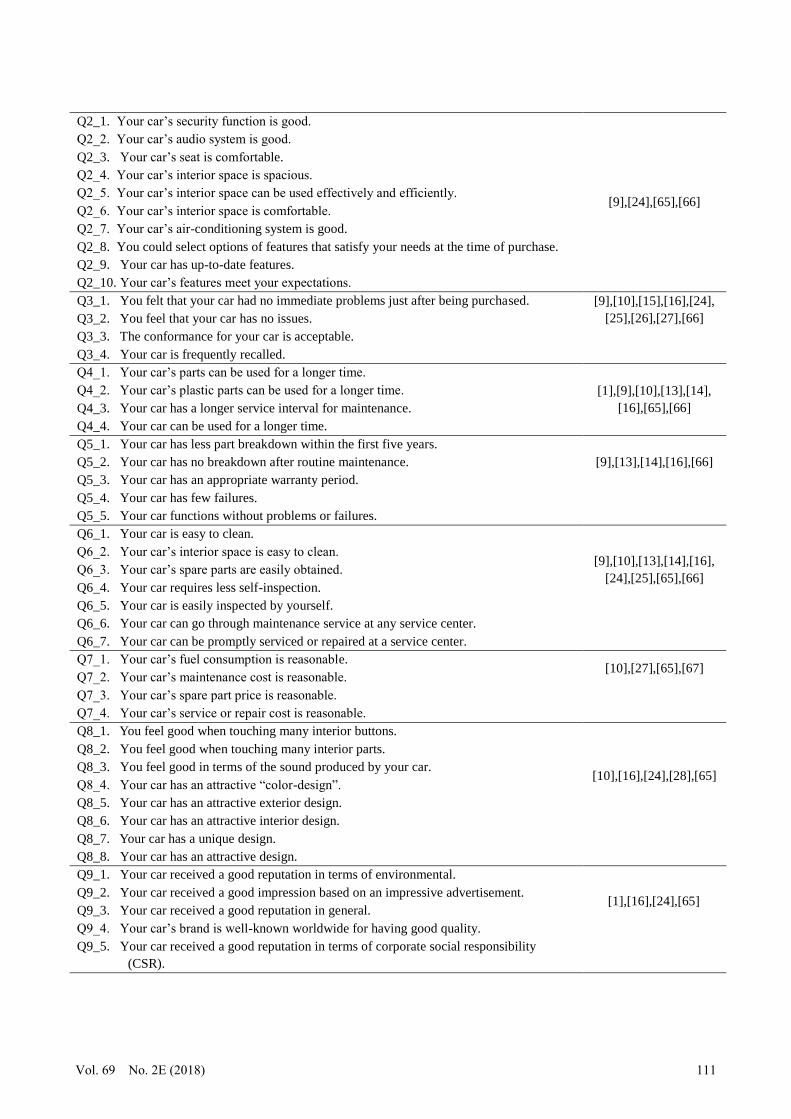
Q2_1. Your car’s security function is good.
[9],[24],[65],[66]
Q2_2. Your car’s audio system is good.
Q2_3. Your car’s seat is comfortable.
Q2_4. Your car’s interior space is spacious.
Q2_5. Your car’s interior space can be used effectively and efficiently.
Q2_6. Your car’s interior space is comfortable.
Q2_7. Your car’s air-conditioning system is good.
Q2_8. You could select options of features that satisfy your needs at the time of purchase.
Q2_9. Your car has up-to-date features.
Q2_10. Your car’s features meet your expectations.
Q3_1. You felt that your car had no immediate problems just after being purchased. [9],[10],[15],[16],[24],
[25],[26],[27],[66]
Q3_2. You feel that your car has no issues.
Q3_3. The conformance for your car is acceptable.
Q3_4. Your car is frequently recalled.
Q4_1. Your car’s parts can be used for a longer time.
[1],[9],[10],[13],[14],
[16],[65],[66]
Q4_2. Your car’s plastic parts can be used for a longer time.
Q4_3. Your car has a longer service interval for maintenance.
Q4_4. Your car can be used for a longer time.
Q5_1. Your car has less part breakdown within the first five years.
[9],[13],[14],[16],[66]
Q5_2. Your car has no breakdown after routine maintenance.
Q5_3. Your car has an appropriate warranty period.
Q5_4. Your car has few failures.
Q5_5. Your car functions without problems or failures.
Q6_1. Your car is easy to clean.
[9],[10],[13],[14],[16],
[24],[25],[65],[66]
Q6_2. Your car’s interior space is easy to clean.
Q6_3. Your car’s spare parts are easily obtained.
Q6_4. Your car requires less self-inspection.
Q6_5. Your car is easily inspected by yourself.
Q6_6. Your car can go through maintenance service at any service center.
Q6_7. Your car can be promptly serviced or repaired at a service center.
Q7_1. Your car’s fuel consumption is reasonable. [10],[27],[65],[67]
Q7_2. Your car’s maintenance cost is reasonable.
Q7_3. Your car’s spare part price is reasonable.
Q7_4. Your car’s service or repair cost is reasonable.
Q8_1. You feel good when touching many interior buttons.
[10],[16],[24],[28],[65]
Q8_2. You feel good when touching many interior parts.
Q8_3. You feel good in terms of the sound produced by your car.
Q8_4. Your car has an attractive “color-design”.
Q8_5. Your car has an attractive exterior design.
Q8_6. Your car has an attractive interior design.
Q8_7. Your car has a unique design.
Q8_8. Your car has an attractive design.
Q9_1. Your car received a good reputation in terms of environmental.
[1],[16],[24],[65]
Q9_2. Your car received a good impression based on an impressive advertisement.
Q9_3. Your car received a good reputation in general.
Q9_4. Your car’s brand is well-known worldwide for having good quality.
Q9_5. Your car received a good reputation in terms of corporate social responsibility
(CSR).
Vol. 69 No. 2E (2018) 111

Q10_1. You will say positive things about this car to persons that seek your advice.
[17],[27],[28],[29],[30],
[31],[32],[33],[34],[35],
[37],[38],[67]
Q10_2. You will encourage persons that seek your advice to use this car.
Q10_3. You will express a good feeling about the car to family or friends.
Q10_4. You will say positive things about the car to family or friends.
Q10_5. You are satisfied with the experiences when driving the car.
Q10_6. You are satisfied with your decision to purchase the car.
Q10_7. You are satisfied with the car’s operation.
Q10_8. The car’s characteristics fulfilled your ideal.
Q10_9. You want to buy the same type of car (same car model) next time.
Q10_10. You want to buy a car from the same manufacturer next time.
Appendix B.
Structural model.
112 J Jpn Ind Manage Assoc