Current Trends of Poisoning: An Experience at a Tertiary Care ...
14
Volume 6 • Issue 3• 1000306 J Clinic Toxicol ISSN: 2161-0495 JCT, an open access journal Research Article Open Access Brochu and Facetti Socol, J Clinic Toxicol 2016, 6:3 DOI: 10.4172/2161-0495.1000306 Research Article Open Access Journal of Clinical Toxicology J o u r n a l o f C li n i c a l T o x i c o l o g y ISSN: 2161-0495 Ventilation Rates during the Aggregate Daytime Activities of Working Females in Hospitals: Data before their Pregnancy and at their 9 th , 22 nd and 36 th Week of Gestation Pierre Brochu* and Angel Facetti Socol Département de santé environnementale et santé au travail, École de santé publique, Université de Montréal, pavillon Marguerite d’Youville, C.P. 6128, succursale Centre-Ville, Montréal, QC, H3C 3J7, Canada *Corresponding author: Pierre Brochu, Département de santé environnementale et santé au travail, École de santé publique, Université de Montréal, pavillon Marguerite d’Youville, C.P. 6128, succursale Centre-Ville, Montréal, QC, H3C 3J7, Canada, Tel: (514) 343-6111, ext. 39832; E-mail: [email protected] Received February 18, 2016; Accepted May 25, 2016; Published June 08, 2016 Citation: Brochu P, Facetti Socol A (2016) Ventilation Rates during the Aggregate Daytime Activities of Working Females in Hospitals: Data before their Pregnancy and at their 9 th , 22 nd and 36 th Week of Gestation. J Clinic Toxicol 6: 306. doi:10.4172/2161-0495.1000306 Copyright: © 2016 Brochu P, et al. This is an open-access article distributed under the terms of the Creative Commons Attribution License, which permits unrestricted use, distribution, and reproduction in any medium, provided the original author and source are credited. Abstract Working females in hospitals may inhale pharmaceutical agents, chirurgical smokes, organic solvents, bacteria and/ or viruses. These inhaled agents may generate adverse effects in gravid females, their embryo or fetus. Therefore, minute ventilation rates (VE) during the aggregate daytime activities of under (n=68), normal (n=268), overweight (n=42), obese class 1 (n=68) and classes 2-3 (n=51) females working in hospitals were determined before and during their pregnancy using published measurements of energy expenditures. For comparison purposes, VE values were also calculated for the same females at rest. Activity energy expenditures were based on disappearance rates of oral doses of water isotopes (i.e. 2 H 2 O, H 2 18 O) monitored in urine samples of free-living hospital workers during 175 days by gas-isotope-ratio mass spectrometry. Basal energy expenditures were obtained by indirect calorimetry, whereas energy costs for pregnancy were measured in a room calorimeter. Sleep durations (7.30 ± 1.59 to 8.09 ± 1.25 hours/day; mean ± standard deviation) and ventilatory equivalents (31.7 ± 0.93 to 39.3 ± 3.3 L of air inhaled/L of oxygen consumed) during pregnancy were determined and integrated into the calculation process. Based on VE percentiles some non-pregnant and pregnant female workers inhale more air (thus more air pollutants), than the default VE value of 20.83 L/min (i.e. 10 m 3 in an 8 hour workday) notably used for calculations of hygienic standards for airborne xenobiotics. Highest 99 th percentiles of 34.28, 29.27 26.49 and 29.52 L/min were found in obese classes 2-3 female workers, before their pregnancy and at their 9 th , 22 nd and 36 th week of gestation, respectively. Considering what precedes and the fact that the human chorionic gonadotropin is detected in the blood or urine samples of women after the implantation of their blastocyst, which occurs many days after fertilization, the non-exposure of female workers to teratogenic agents in hospitals is recommended before and during their pregnancy. The same applies for the exposure to carcinogens which may generate procarcinogenic DNA damage in the fetus. Keywords: Ventilation rates; Oxygen consumption rates; Female workers in hospitals; Pregnancy; Physical activity levels; Risk assessment; Ventilatory equivalent; Energy expenditure Abbreviations α: Data for the aggregate daytime activities of females; β: Data for females under resting conditions; AEE: Activity Energy Expenditure; BEE: Basal Energy Expenditure (BMR expressed on a 24-hour basis); BMI: Body Mass Index; BMR: Basal Metabolic Rate (punctual measurement); BSA: Body Surface Area; BTPS: Body Temperature and Saturated with water vapour; Bw: Body Weight; DLW: Doubly Labeled Water; H: oxygen uptake factor; volume of oxygen (at STPD) consumed to produce 1 kcal of energy expended, PAL: Physical Activity Level Based on a 24-h period (TDEE/BEE ratio); PALVO 2 : Physical Activity Level during the aggregate daytime activities; Sld: Sleep Duration; STPD: Standard Temperature and Pressure Dry air; TDEE: Total Daily Energy Expenditure; VCO 2 carbon dioxide production rate; VE: Minute Ventilation Rate; VO 2 : Oxygen consumption rate (also known as the oxygen uptake); VQ: Ventilatory Equivalent for VO 2 (VE at BTPS /VO 2 at STPD) Introduction Pregnancy in the workplace has become a relatively common occurrence over the last three decades [1-26]. However, acceptable working conditions in non-pregnant females may no longer be so in gravid females, notably by considering respiratory parameters for the latter compared to those for the former. Oxygen consumption rates (VO 2 in L/min) in pregnant females at rest and during submaximal weight-bearing exercises (e.g. walking, stepping, and treadmill exercise) are significantly increased, compared with the non-gravid state [27-30]. e same applies for minute ventilation rates (VE) when expressed in L/min [29,31-42]. ese higher VE values result from an increase of tidal volumes with little or no change of respiratory frequencies [34,35,39]. Since the physiological dead space to tidal volume ratio in pregnancy remains unchanged, alveolar ventilation rates (VA) also increase as a function of incremental VE values [32,36,42-48]. Higher respiratory drive during the reproductive cycle has been showed to increase the intake of inhaled air pollutants on a 24 h basis in gravid females [49]. e same conclusion could be observed in pregnant workers. In spite of what precedes, VE values during the aggregate daytime activities of working pregnant females have never been determined. ese calculations can be conducted by converting activity energy expenditures (AEE) of gravid females into VE values, as done by Brochu et al. [50,51] for males and non-gravid females. e AEE value corresponds to the subtractions of the basal energy expenditure (BEE) from the total daily energy expenditure (TDEE), both data obtained by indirect calorimetry and spectrometric values respectively measured in the same subjects during the doubly labeled water (DLW) method (IDECG 1990) [52]. In turn, AEE values can be converted into VE data by using three key input parameters [50,51], namely the oxygen
-
Upload
khangminh22 -
Category
Documents
-
view
1 -
download
0
Transcript of Current Trends of Poisoning: An Experience at a Tertiary Care ...

Volume 6 • Issue 3• 1000306J Clinic ToxicolISSN: 2161-0495 JCT, an open access journal
Research Article Open Access
Brochu and Facetti Socol, J Clinic Toxicol 2016, 6:3DOI: 10.4172/2161-0495.1000306
Research Article Open Access
Journal of Clinical ToxicologyJour
nal of Clinical Toxicology
ISSN: 2161-0495
Ventilation Rates during the Aggregate Daytime Activities of Working Females in Hospitals: Data before their Pregnancy and at their 9th, 22nd and 36th Week of GestationPierre Brochu* and Angel Facetti SocolDépartement de santé environnementale et santé au travail, École de santé publique, Université de Montréal, pavillon Marguerite d’Youville, C.P. 6128, succursale Centre-Ville, Montréal, QC, H3C 3J7, Canada
*Corresponding author: Pierre Brochu, Département de santé environnementale et santé au travail, École de santé publique, Université de Montréal, pavillonMarguerite d’Youville, C.P. 6128, succursale Centre-Ville, Montréal, QC, H3C 3J7, Canada, Tel: (514) 343-6111, ext. 39832; E-mail: [email protected]
Received February 18, 2016; Accepted May 25, 2016; Published June 08, 2016Citation: Brochu P, Facetti Socol A (2016) Ventilation Rates during the Aggregate Daytime Activities of Working Females in Hospitals: Data before their Pregnancy and at their 9th, 22nd and 36th Week of Gestation. J Clinic Toxicol 6: 306. doi:10.4172/2161-0495.1000306Copyright: © 2016 Brochu P, et al. This is an open-access article distributed under the terms of the Creative Commons Attribution License, which permits unrestricted use, distribution, and reproduction in any medium, provided the original author and source are credited.
AbstractWorking females in hospitals may inhale pharmaceutical agents, chirurgical smokes, organic solvents, bacteria and/
or viruses. These inhaled agents may generate adverse effects in gravid females, their embryo or fetus. Therefore, minute ventilation rates (VE) during the aggregate daytime activities of under (n=68), normal (n=268), overweight (n=42), obese class 1 (n=68) and classes 2-3 (n=51) females working in hospitals were determined before and during their pregnancy using published measurements of energy expenditures. For comparison purposes, VE values were also calculated for the same females at rest. Activity energy expenditures were based on disappearance rates of oral doses of water isotopes (i.e. 2H2O, H2
18O) monitored in urine samples of free-living hospital workers during 175 days by gas-isotope-ratio mass spectrometry. Basal energy expenditures were obtained by indirect calorimetry, whereas energy costs for pregnancy were measured in a room calorimeter. Sleep durations (7.30 ± 1.59 to 8.09 ± 1.25 hours/day; mean ± standard deviation) and ventilatory equivalents (31.7 ± 0.93 to 39.3 ± 3.3 L of air inhaled/L of oxygen consumed) during pregnancy were determined and integrated into the calculation process. Based on VE percentiles some non-pregnant and pregnant female workers inhale more air (thus more air pollutants), than the default VE value of 20.83 L/min (i.e. 10 m3 in an 8 hour workday) notably used for calculations of hygienic standards for airborne xenobiotics. Highest 99th percentiles of 34.28, 29.27 26.49 and 29.52 L/min were found in obese classes 2-3 female workers, before their pregnancy and at their 9th, 22nd and 36th week of gestation, respectively. Considering what precedes and the fact that the human chorionic gonadotropin is detected in the blood or urine samples of women after the implantation of their blastocyst, which occurs many days after fertilization, the non-exposure of female workers to teratogenic agents in hospitals is recommended before and during their pregnancy. The same applies for the exposure to carcinogens which may generate procarcinogenic DNA damage in the fetus.
Keywords: Ventilation rates; Oxygen consumption rates; Femaleworkers in hospitals; Pregnancy; Physical activity levels; Risk assessment; Ventilatory equivalent; Energy expenditure
Abbreviationsα: Data for the aggregate daytime activities of females; β: Data for
females under resting conditions; AEE: Activity Energy Expenditure; BEE: Basal Energy Expenditure (BMR expressed on a 24-hour basis); BMI: Body Mass Index; BMR: Basal Metabolic Rate (punctual measurement); BSA: Body Surface Area; BTPS: Body Temperature and Saturated with water vapour; Bw: Body Weight; DLW: Doubly Labeled Water; H: oxygen uptake factor; volume of oxygen (at STPD) consumed to produce 1 kcal of energy expended, PAL: Physical Activity Level Based on a 24-h period (TDEE/BEE ratio); PALVO2: Physical Activity Level during the aggregate daytime activities; Sld: Sleep Duration; STPD: Standard Temperature and Pressure Dry air; TDEE: Total Daily Energy Expenditure; VCO2 carbon dioxide production rate; VE: Minute Ventilation Rate; VO2: Oxygen consumption rate (also known as the oxygen uptake); VQ: Ventilatory Equivalent for VO2 (VE at BTPS /VO2 at STPD)
IntroductionPregnancy in the workplace has become a relatively common
occurrence over the last three decades [1-26]. However, acceptable working conditions in non-pregnant females may no longer be so in gravid females, notably by considering respiratory parameters for the latter compared to those for the former. Oxygen consumption rates (VO2 in L/min) in pregnant females at rest and during submaximal weight-bearing exercises (e.g. walking, stepping, and treadmill exercise) are significantly increased, compared with the non-gravid state [27-30]. The same applies for minute ventilation rates (VE) when expressed
in L/min [29,31-42]. These higher VE values result from an increase of tidal volumes with little or no change of respiratory frequencies [34,35,39]. Since the physiological dead space to tidal volume ratio in pregnancy remains unchanged, alveolar ventilation rates (VA) also increase as a function of incremental VE values [32,36,42-48]. Higher respiratory drive during the reproductive cycle has been showed to increase the intake of inhaled air pollutants on a 24 h basis in gravid females [49]. The same conclusion could be observed in pregnant workers. In spite of what precedes, VE values during the aggregate daytime activities of working pregnant females have never been determined. These calculations can be conducted by converting activity energy expenditures (AEE) of gravid females into VE values, as done by Brochu et al. [50,51] for males and non-gravid females. The AEE value corresponds to the subtractions of the basal energy expenditure (BEE) from the total daily energy expenditure (TDEE), both data obtained by indirect calorimetry and spectrometric values respectively measured in the same subjects during the doubly labeled water (DLW) method (IDECG 1990) [52]. In turn, AEE values can be converted into VE data by using three key input parameters [50,51], namely the oxygen
Page 2 of 14
Volume 6 • Issue 3 • 1000306J Clinic ToxicolISSN: 2161-0495 JCT, an open access journal
Citation: Brochu P, Facetti Socol A (2016) Ventilation Rates during the Aggregate Daytime Activities of Working Females in Hospitals: Data before their Pregnancy and at their 9th, 22nd and 36th Week of Gestation. J Clinic Toxicol 6: 306. doi:10.4172/2161-0495.1000306
uptake factor (H in L of O2 consumed/kcal expended), the ventilatory equivalent (VQ in L of air inhaled/L of oxygen consumed) and the sleep duration (Sld in hours/day). The order of magnitude of H data already has been published and depends on types of combusted metabolic fuels [53]. Values for VQ and Sld have been determined for non-gravid women [51,53], but not for pregnant females.
An impressive number of women are working in hospitals [15,54-65], even during their pregnancy [1,15,23,66-68], and notably as cleaners, nurses, physicians, pharmacists, laboratory or pharmacy technicians. They notably may be exposed to and affected by 1) bacteria and/or viruses [54,67,69,70], 2) pharmaceutical agents including antineoplastic agents, aerosolized drugs, volatile anesthetic gases [71-80], 3) chirurgical smokes [81-86], 4) organic solvents for cleaning and sterilization of workplaces and operation rooms [8,9,87-91], and finally, 4) ionizing radiations during radiology, nuclear medicine, tomography, cancer therapy or cardiac catheterization [92-95]. The breathing process allows the penetration of occupational air pollutants and notably viruses into the respiratory airways [96]. Therefore, the aim of this study is to determine mean, standard deviation (S.D.) and percentile values for VE during the aggregate daytime activities of working pregnant females in hospitals. Prior observations indicate that heavier subjects inhale more air (thus more air pollutants during similar exposure conditions), compared to their thinner counterparts [51]. Consequently, calculations in this study will be performed for under-weight, normal-weight, overweight and obese females. Prior to these calculations, values for VQ, Sld, AEE, VO2 and physical activity levels (PAL) will be determined for pregnant females.
Methodology Study design
Mean, S.D. and percentile values for VO2 and VE were calculated in the same non-pregnant and pregnant females aged 18 to 45 years (n=457) at rest (referred to as β) and during their aggregate daytime activities (referred to as α), when having full-time hospital jobs (referred to as active females). Values for VO2 and VE during pregnancy were calculated at the 9th, 22nd and 36th week of gestation. These calculations have been performed for five cohorts of women classified according to following body mass index (BMI) cut-offs recommended for ideal pregnancies (IOM 1990): under-weight (BMI <19.8 kg/m2; n=68), normal weight (BMI from 19.8 to <27 kg/m2; n=268), overweight (BMI from 27 to <30 kg/m2; n=42), obese class 1 (BMI from 30 to <35 kg/m2; n=68), obese classes 2 and 3 (BMI ≥ 35 kg/m2; n=51) females. VO2β and VEβ data were calculated in fasting subjects, whereas their VO2α and VEα values were determined during their postprandial phase. These respiratory values (in L/min) were expressed in terms of BEE (in kcal/day), TDEE (in kcal/day) and Sld (in hours/day) values by using following equations [51]:
2 1440 F
BEEVO Hé ùê ú= ´ê úë û
β (1)
( )2 (24 ) 60 1440 P
TDEE BEE BEEVO HSld
é ù-ê ú= + ´ê ú- ´ë ûα
(2)
1440 F
BEEVE H VQé ùê ú= ´ ´ bê úë û
β
(3)
( ) ( )(24 ) 60 1440 P
TDEE BEE BEEVE H VQ
Sld
é ù-ê úa = + ´ ´ aê ú- ´ë û (4)
where, 1440 and 60 are the conversion factors from days to minutes and hours to minutes respectively and 24 is the number of hours in a day.
The H value corresponds to the volume of oxygen consumed at standard temperature and pressure, dry air (STPD) to produce 1 kcal of energy expended. HF and HP correspond to H values for subjects during fasting and postprandial phases respectively. The combustion of metabolic fuels (i.e. glycogen, glucose, 3-hydroxybutyric acid, acetoacetic acid, triacylglycerol) in fasting subjects required 0.2057 ± 0.0018 L of O2 per kcal of energy expended (mean for HF ± S.D.; n=31). A HP value of 0.2059 ± 0.0019 L of O2/kcal (n=1245) has been calculated during the postprandial combustion of carbohydrates, proteins and fats. These HF and HP data have been determined using published sets of VO2 and CO2 production rates (VCO2) measured by indirect calorimetry at STPD in the same subjects [53]. VQ is the ratio of the VE at body temperature and saturated with water vapour (BTPS) to the VO2 at STPD. The following published data for non-gravid females aged 18 to 45 years were used in this study: VQβ of 30.1 ± 2.3 (n=307) and VQα of 32.6 ± 3.7 (n=450) for under-/normal-weight females [53], VQβ of 34.2 ± 9.5 (n= 145) and VQα of 31.9 ± 9.2 (n=220) for overweight/obese women [51] and Sld of 8.28 ± 0.61 hours/day (n=1668) [53].
Values for VO2 and VE (in L/min) were expressed per unit of body surface area (BSA in m2) using the following formula expressed in terms of height (cm) and body weight (Bw in kg) values [96]:
0.5
3600height BwBSAé ù´ê ú=ê úë û
(5)
This equation is preferentially recommended for accurate BSA calculations in adults, compared to other algorithms [24,97].
Input data in non-gravid females
Published sets of body weight, height and BEE values (Table 2) that have been systematically measured for the same non-gravid females (n=497) have been used to determine the baseline pre-pregnancy input data for the resting state [98-109]. Published sets of BEE and TDEE values measured in the same non-gravid workers (n=11) by the DLW method were used to calculate an AEE mean of 1242.9 ± 600.0 kcal/day (i.e. AEE=TDEE-BEE) for full-time jobs in hospitals during the postprandial phase, with minimal and maximal values of 389.3 and 2132.9 kcal/day, respectively [98,100-102]. BEE values (in kcal/day) correspond to basal metabolic rates (BMRs in kcal/min) expressed on a 24 hr basis. BMR values are calculated from the respiratory gas-exchange rates of oxygen (O2) and carbon dioxide (CO2) monitored by indirect calorimetry in fasting subjects usually 40 minutes immediately after waking-up [110-113]. TDEE values were systematically encompassing voluntary and involuntary energy expended in hospitals workers (i.e. notably for BEE, thermogenesis, physical activities, synthetic cost of growth) during real-life situations and their normal surroundings each minute of the day, 24-hours per day, on a daily basis for 175 days: 60 days in nurses and medical doctors, as well as 14, 15, 15, 31 and 40 days in pharmacy technicians, cleaners, clinical teachers, hospital clerks, and laboratory technicians, respectively [98,100-102,114-116]. TDEE data were calculated by using gas-isotope-ratio mass spectrometric measurements of disappearance rates of oral doses of water isotopes (i.e. 2H2O and H2
18O) in urine

Page 3 of 14
Volume 6 • Issue 3 • 1000306J Clinic ToxicolISSN: 2161-0495 JCT, an open access journal
Citation: Brochu P, Facetti Socol A (2016) Ventilation Rates during the Aggregate Daytime Activities of Working Females in Hospitals: Data before their Pregnancy and at their 9th, 22nd and 36th Week of Gestation. J Clinic Toxicol 6: 306. doi:10.4172/2161-0495.1000306
Weight classifications of pregnant females n Progression of the
reproductive cycleWeight gainsa (kg/week) MFECP
b (unitless)Mean ± S.D. Min Max Mean ± S.D.c Mind Maxd
Under-weight 179th week 2.00 ± 2.69 2.08 8.25 1.027 ± 0.025 0.982 1.086
22nd week 7.80 ± 4.51 6.16 18.29 1.107 ± 0.024 1.050 1.16436th week 13.10 ± 4.62 11.42 23.84 1.310 ± 0.026 1.169 1.371
Normal-weight 349th week 0.90 ± 2.73 0.43 7.26 1.020 ± 0.028 0.982 1.086
22nd week 5.80 ± 4.47 4.03 16.20 1.068 ± 0.041 1.050 1.16436th week 12.90 ± 5.19 12.02 24.97 1.265 ± 0.046 1.169 1.371
Overweight/obesity 129th week 4.50 ± 4.26 4.29 14.42 1.063 ± 0.010 0.982 1.086
22nd week 8.50 ± 8.19 5.34 27.55 1.125 ± 0.017 1.050 1.16436th week 16.50 ± 6.00 13.49 30.46 1.340 ± 0.014 1.169 1.371
Table 1: Weight gains and energy costs of pregnancy in healthy females aged 18 to 40 years. aWeight gains in pregnant females compared to their baseline values before pregnancy measured by Butte et al. [106]. bMFECP=multiplying factors for energy costs of pregnancy. MFECP=(BEEgravid/BEEnon-gravid). BEE=basal energy expenditure measured by Butte et al. [106] in females during 24-hour periods, before (BEEnon-gravid) and during their pregnancy (BEEgravid) in a room calorimeter at the 9th, 22nd and 36th week of gestation. cData taken from Butte et al. [106]. dValues based on data reported in Durnin et al., Forsum et al., Goldberg et al., Spaaij et al., de Groot et al. and Butte et al. [113,119-123]. n=number of individuals; S.D=standard deviation; Min=minimal value; Max=maximal value.
Weight classifications of
femalesan Progression of the
reproductive cycle
Body weight(kg) Height (cm) BSAg (m2) BEEh
(kcal/day)TDEEi (kcal/day)
Full-time hospital jobsl
Mean ± S.D. Mean ± S.D. Mean ± S.D. Mean ± S.D. Mean ± S.D. Min Max
Under-weight femalesb 68
0 week 50.75 ± 2.73 164.5 ± 3.8
1.52 ± 0.06 1256.8 ± 79.3 2358.6 ± 398.8 1527.4 3524.19th week 54.54 ± 3.00 1.58 ± 0.05 1294.4 ± 86.9 2396.9 ± 380.9 1578.4 3582.2
22nd week 60.42 ± 3.79 1.66 ± 0.06 1393.5 ± 93.2 2496.0 ± 382.3 1624.8 3685.736th week 66.20 ± 4.06 1.74 ± 0.06 1648.5 ± 110.1 2751.1 ± 383.8 1916.0 3945.1
Normal-weight femalesc 268
0 week 59.55 ± 3.81 164.4 ± 3.8
1.65 ± 0.06 1349.8 ± 124.8 2449.7 ± 413.7 1523.6 3834.79th week 61.03 ± 4.06 1.67 ± 0.06 1384.1 ± 129.9 2466.7 ± 395.7 1549.8 3761.3
22nd week 66.86 ± 4.81 1.75 ± 0.06 1472.5 ± 139.9 2555.0 ± 395.0 1651.2 3850.736th week 75.69 ± 4.86 1.86 ± 0.06 1709.6 ± 167.5 2792.1 ± 398.6 1815.2 3983.9
Overweight femalesd 42
0 week 74.71 ± 6.37 164.3 ± 6.7
1.85 ± 0.11 1484.0 ± 184.1 2596.3 ± 435.6 1689.3 3959.99th week 81.45 ± 6.26 1.92 ± 0.08 1595.0 ± 181.5 2694.3 ± 420.4 1819.7 4010.3
22nd week 85.32 ± 7.56 1.96 ± 0.09 1687.8 ± 192.1 2787.1 ± 422.1 1904.1 4122.536th week 92.90 ± 6.98 2.05 ± 0.08 2009.7 ± 229.0 3109.0 ± 424.8 2210.0 4408.9
Obese class 1 femalese 68
0 week 86.49 ± 8.54 164.8 ± 6.6
1.99 ± 0.13 1626.1 ± 271.0 2772.5 ± 453.7 1796.1 4270.69th week 94.42 ± 8.35 2.07 ± 0.10 1778.6 ± 260.6 2892.5 ± 456.9 1880.5 4375.6
22nd week 98.29 ± 9.50 2.11 ± 0.11 1882.2 ± 276.6 2996.1 ± 459.6 1983.8 4498.636th week 105.87 ± 8.98 2.20 ± 0.10 2240.8 ± 326.6 3354.7 ± 465.2 2277.4 4921.7
Obese classes 2-3 femalesf 51
0 week 124.67 ± 5.71 165.1 ± 1.9
2.38 ± 0.06 2036.4 ± 153.8 3139.1 ± 410.6 2161.5 4341.79th week 131.78 ± 6.16 2.46 ± 0.06 2161.7 ± 162.4 3271.6 ± 406.1 2273.8 4422.5
22nd week 135.65 ± 7.66 2.49 ± 0.07 2287.5 ± 172.7 3397.4 ± 406.3 2446.6 4547.636th week 143.23 ± 6.89 2.57 ± 0.06 2723.7 ± 204.7 3833.6 ± 409.7 2854.6 4998.5
Table 2: Anthropometric and energetic measurements in healthy non-pregnant and pregnant females aged 18 to 45 years. aBased on body mass index (BMI) cut-offs for an ideal pregnancy in females. bBMI <19.8 kg/m2. cBMI from 19.8 to <27 kg/m2. dBMI from 27 to <30 kg/m2. eBMI from 30 to <35 kg/m2. fBMI ≥ 35 kg/m2. gBSA=body surface area. hBEE=basal energy expenditure (i.e. basal metabolic rate expressed on a 24-hour basis) measured by indirect calorimetry. BEE values were taken from the literature [98-104,108,109]. iTDEE=BEE+AEE. AEE=Activity energy expenditures based on indirect calorimetric and spectrometric measurements in the same subjects. The gas-isotope-ratio mass spectrometry has been used to measure disappearance rates of oral doses of 2H2O and H2
18O from urine samples in free-living adults. AEE values are based on published data [98,100-102]. n, S.D. min and max acronyms are defined in Table 1.
samples of each free-living worker over a period of 10 to 31 days [52]. During the DLW method the disappearance rate of deuterium (2H or D) reflects water output and that of heavy oxygen-18 (18O) corresponds to water output plus CO2 production rates [52]. The difference between the two disappearance rates represents the CO2 production rate, which is converted into units of energy (i.e. TDEE in kcal/day) by using the average respiratory quotient of the diet (RQ). The RQ value may be determined by a complete diet record over the duration of the study or respiratory gas-exchange measurements (RQ=CO2 produced/O2 consumed). The DLW method is notably described in detail in IDECG (1990) [52].
Input data during pregnancy
Energy costs of pregnancy were calculated by comparing 24-h energy expenditures of females measured in a room calorimeter by
Butte et al. [106], before their pregnancy and at their 9th, 22nd and 36th week of gestation (Table 1). The latter study has been conducted in under (n=17), normal weight (n=34) and overweight/obese pregnant women (n=12). Resulting energy expenditures have been computed by using continuous measurements of VO2, VCO2 and urinary nitrogen excretion in females according to the procedure of Livesey and Elia [117]. The performance of the calorimeter for such measurements is described in Moon et al. [118]. The baseline BEE values of under, normal and overweight/obese non-pregnant women were increased by mean multiplying factors (MFECP) varying from 1.020 ± 0.028 to 1.063 ± 0.010, 1.068 ± 0.041 to 1.125 ± 0.017 and 1.265 ± 0.046 to 1.340 ± 0.014 at the 9th, 22th and 36th week of gestation respectively (Table 1). Minimal and maximal MFECP values are based on data reported in Durnin et al., Forsum et al., Goldberg et al., Spaaij et al., de Groot et al. and Butte et al. [101,112,113,119-123]. TDEEs values in pregnant females (TDEE

Page 4 of 14
Volume 6 • Issue 3 • 1000306J Clinic ToxicolISSN: 2161-0495 JCT, an open access journal
Citation: Brochu P, Facetti Socol A (2016) Ventilation Rates during the Aggregate Daytime Activities of Working Females in Hospitals: Data before their Pregnancy and at their 9th, 22nd and 36th Week of Gestation. J Clinic Toxicol 6: 306. doi:10.4172/2161-0495.1000306
Accuracy of input data
The accuracy of BEE and TDEE data vary from +1 to +2 and -1.0 to +3.3%, respectively [52,137], whereas the one for HP and HF values range from -2 to +2% [53]. In the worst case scenario, simultaneous minimal and maximal mean errors associated with input BEE, TDEE, HP and HF data were shown to have a combined effect varying from +1 to +2.6% on the accuracy of VO2β, VEβ, VO2α and VEα values [53]. The possible shorter sleep durations in overweight/obese females compared to their normal-weight counterparts was found to have a negligible influence (less than -0.2%) on the order of magnitude of inhalation rates [53].
ResultsVO2 data in resting and active females increase from 0.180 ±
0.012 to 0.390 ± 0.030 (Table 5) and 0.420 ± 0.083 to 0.616 ± 0.085 L/min (Table 6), respectively as the pregnancy progresses. To support such oxygen demands, VE values in these women raise from 5.43 ± 0.57 to 13.91 ± 1.19 (Table 7) and 13.75 ± 3.17 to 21.68 ± 3.07 L/min, respectively (Table 8). Highest VO2 and VE absolute means and percentiles (i.e. expressed in L/min) are observed at the 36th week of gestation of obese classes 2-3 women (Tables 5-8). CI95% for VO2 values in resting and active gravid females vary from 0.160 to 0.450 and 0.278 to 0.801 L/min, respectively (Tables 5 and 6). Those for VE values in the former and the latter groups of females range from 5.81 to 16.37 and 9.27 to 28.19 L/min respectively (Tables 7 and 8). Absolute VE data increase as a function of the increase of BMI values. For instance, lowest and highest mean values of active under-weight and obese classes 2-3 gravid females range from 14.07 ± 2.82 to 15.22 ± 2.71 and 20.19 ± 3.54 to 21.68 ± 3.07 L/min respectively (Table 8). The inverse tendency is observed when data are expressed per unit of body weight (Tables 7 and 9). For instance, lowest and highest VE means are found in active obese classes 2-3 (0.138 ± 0.024 to 0.153 ± 0.028 L/kg-min) and under-weight gravid females (0.231 ± 0.043 to 0.259 ± 0.054 L/kg-min) respectively (Table 9). VE means expressed per unit of body surface area in under-weight (8.28 ± 1.63 to 9.05 ± 2.11 L/m2-min), normal-weight (8.11 ± 1.67 to 8.77 ± 1.88 L/m2-min), overweight (7.80 ± 1.57 to 8.38 ± 1.52 L/m2/min), obese class 1 (7.74 ± 1.53 to 8.48 ± 1.50 L/m2/min) and obese classes 2-3 active females (7.17 ± 2.38 to 8.46 ± 1.22 L/m2/min) do not show a clear tendency as a function of BMI values, nor as the pregnancy progresses (Table 10). The same conclusion applies for data expressed in L/m2-min in females at rest (Table 7).
DiscussionData of Melzer et al. [138] indicate that females aged 20 to 40 years
(n=27) perform a low intensity of activity levels in late pregnancy (38.2 ± 1.5 weeks of gestation) during 20.37 h/day (85%) with metabolic equivalents (METs) less than 2. This is consistent with our data. In the present study, the percentage of active females performing low levels of exertions during daytime activities (PALVO2 <2) increases as the pregnancy progresses (Table 4). For instance, 37, 43 and 59% of active normal-weight females (n=268) at the 9th, 22nd and 36th week of gestation respectively have PALVO2 values lower than 2 (Table 4). In accordance with data reported in Brochu et al. [51] for non-gravid individuals, most percentages of active gravid females performing low intensity of activity levels (PALVO2 <2) reported in this study increases as a function of the increase of overweight levels based on BMI cutoffs. For instance, 39, 43, 54, 60 and 81% of active under, normal, overweight, obese class 1 and obese classes 2-3 females at 22nd week of gestation respectively have PALVO2 values lower than 2 (Table 4).
pregnancy) were calculated in terms of MFECP (Table 1), BEE (Table 2) and AEE values by using the following equation:
[ ]pregnancy ECPTDEE BEE MF AEE= ´ + (6)
Weight gains varying form 2.00 ± 2.69 to 13.10 ± 4.62, 0.90 ± 2.73 to 12.90 ± 5.19, 4.50 ± 4.26 to 16.50 ± 6.00 kg/week of pregnancy measured by Butte et al. [105] in under, normal-weight and overweight/obese gravid females respectively (Table 1) were added to body weights of non-gravid females in order to obtain adequate total weight values at the 9th, 22nd and 36th week of gestation.
Values for Sld of 8.09 ± 1.25 (n=122), 7.83 ± 1.36 (n=1397) and 7.30 ± 1.59 hours/day (n=684) were calculated for pregnant females at the 9th, 22nd and 36th week of gestation respectively (Table 3) by using data reported in Williams et al., Ko et al., Kızılırmak et al. and Shiga et al. [124-127]. For the same classification of weeks of gestation, VQβ of 39.3 ± 3.3 (n=33), 34.2 ± 1.8 (n=157) and 35.7 ± 1.3 (n=213) were determined (Table 3) according to respiratory data measured in pregnant females at rest by Cugell et al., Knuttgen et al., Pernoll et al., Pivarnik et al., Lotgering et al., Jaque-Fortunato et al., Heenan et al. and Jensen et al. [27,29,31,32,36,37,128,129].
PAL values for 24-hour periods are frequently calculated based on TDEE/BEE ratios [101,104-106,120,123,130-136]. However, PAL values in this study were not calculated for a 24-hour basis, but during the aggregate daytime activities of females (referred to as PALVO2, unit less) as follows:
2
2
2VO
VOPALVO
é ùaê ú= ê úbë û (7)
A mean VQα value (referred to as VQα Level) with S.D., minimal and maximal data was determined for each level of PALVO2 (i.e. 1 ≤ 2, 2 ≤ 2.5, 2.5 ≤ 3, 3 ≤ 3.5 and 3.5 ≤ 4.5) that could be performed during daytime activities of females at their 9th, 22nd and 36th week of gestation. These calculations were conducted by using published sets of VO2 and VE values that have been simultaneously measured in gravid females [27,29,31,32,36,37,128,129]. Distributions of PALVO2 percentiles were then calculated for under, normal, overweight, obese class 1 and obese classes 2-3 females at their 9th, 22nd and 36th week of gestation. Based on these percentiles, percentages of pregnant females (Table 4) performing daytime activities at each VQα Level were determined. Mean VQα values for each category of body weights at the 9th, 22nd and 36th week of gestation (Table 4) were then obtained by multiplying VQαLevel (not reported in Tables) by former percentages.
Statistical analysis
Monte Carlo simulations were necessary to integrate S.D. values of input data into the calculation process of parameters of interest. They were conducted based on random sampling involving 10 000 iterations for each calculation process. A normal distribution for HF values and lognormal distributions for other input data (i.e. values for HP, BEE, AEE, TDEE, body weight, body surface area, Sld, VQβ VQα, as well as weight gains and MFECP during pregnancy) were considered during calculations of mean, S.D. and percentile values for VO2 and VE. The best fit distribution (i.e. lognormal or normal) per type of values has been determined in our previous studies [49,51,53] notably by carrying out Anderson-Darling goodness-of-fit tests on individual data. Spans of values between 2.5nd and 97.5th VO2 and VE percentiles were calculated in order to obtain 95% confidence intervals (CI95%).

Page 5 of 14
Volume 6 • Issue 3 • 1000306J Clinic ToxicolISSN: 2161-0495 JCT, an open access journal
Citation: Brochu P, Facetti Socol A (2016) Ventilation Rates during the Aggregate Daytime Activities of Working Females in Hospitals: Data before their Pregnancy and at their 9th, 22nd and 36th Week of Gestation. J Clinic Toxicol 6: 306. doi:10.4172/2161-0495.1000306
Weight classifications, and progression of the reproductive
cycle
Sleep durationa (hours/day) VQβ for females at restb (unitless) VQα for active femalesb (unitless)
n Mean ± S.D. Min Max n Mean ± S.D. Min Max n Mean ± S.D. Min Max
Under/normal weight NP femalesc
1668 8.28 ± 0.61 5.23 13.56307 30.1 ± 2.3 18.0 64.0 450 32.6 ± 3.7 15.3 100.5
Overweight/obese NP femalesc 145 34.2 ± 9.5 18.0 100.5 220 31.9 ± 9.2 15.7 100.5
9th week 122 8.09 ± 1.25 4.00 11.00 33 39.3 ± 3.3 23.6 47.1
see Table 422nd week 1397 7.83 ± 1.36 4.00 11.00 157 34.2 ± 1.8 23.6 52.0
36th week 684 7.30 ± 1.59 4.00 11.00 213 35.7 ± 1.3 21.1 63.8
Table 3. Sleep duration and ventilatory equivalent (VQ) values in healthy non-pregnant and pregnant females aged 18 to 45 years. aValues for non-pregnant females have been calculated according to data reported in Brochu et al. [50]. Sleep durations of gestating females are based on published values [124-127]. bVQ=ratio of the minute ventilation rate (VE in L/min at BTPS) to the oxygen uptake (VO2 in L/min at STPD). VQβ and VQα=ventilatory equivalent values in females at rest and during their aggregate daytime activities respectively. bVQβ and VQα for non-pregnant females have been calculated according to data reported in Brochu et al. [50,51]. VQβ for gravid females were based on values reported in the literature [27,29,31,32,36-38,128]. cNP=Non-pregnant. n=number of individuals; S.D.=standard deviation; Min=minimal value; Max=maximal value.
Progression of the reproductive cycle
Weight classifications of femalesa
Percentageb of cohorts performing daytime activities at various PALVO2
c Ventilatory equivalentsd (VQα) (unitless)
PALVO2 from 1 to less than 4.5n Mean ± S.D. Min Max
n 1 < 2 2 < 2.5 2.5 < 3 3 < 3.5 3.5 <4.5
9th week
Under-weight 68 33% 37% 22% 5% 3%
333
33.28 ± 1.24 22.10 47.06Normal-weight 268 37% 35% 20% 6% 2% 33.63 ± 1.33 22.10 47.06
Overweight 42 47% 33% 15% 4% 1% 34.45 ± 1.60 22.10 47.06Obese class 1 68 56% 28% 12% 3% 1% 35.26 ± 1.85 22.10 47.06
Obese classes 2-3 51 76% 21% 2% 1% 0% 36.96 ± 2.44 22.10 47.06
22nd week
Under-weight 68 39% 39% 17% 4% 1%
457
31.70 ± 0.93 22.10 51.97Normal-weight 268 43% 35% 17% 4% 1% 31.90 ± 0.96 22.10 51.97
Overweight 42 54% 29% 14% 2% 1% 32.33 ± 1.08 22.10 51.97Obese class 1 68 60% 29% 8% 2% 1% 32.47 ± 1.15 22.10 51.97
Obese classes 2-3 51 81% 17% 1% 1% 0% 33.30 ± 1.47 22.10 51.97
36th week
Under-weight 68 59% 32% 8% 1% 0%
510
32.94 ± 1.26 21.11 63.81Normal-weight 268 59% 32% 8% 1% 0% 32.94 ± 1.26 21.11 63.81
Overweight 42 70% 26% 3% 1% 0% 33.59 ± 1.20 21.11 63.81Obese class 1 68 76% 20% 3% 1% 0% 34.03 ± 1.14 21.11 63.81
Obese classes 2-3 51 93% 6% 1% 0% 0% 35.18 ± 1.16 21.11 63.81
Table 4: Physical activity levels and ventilatory equivalents during daytime activities of pregnant females with full-time hospital jobs. aDefined in Table 2. bBased on percentiles of PALVO2.
cPALVO2=VO2α/VO2β ratio. VO2β=(BEE/1440) x HF. VO2α=[(TDEE-BEE)/((24-Sld) x 60)+(BEE)/1440] x HP, where, HF and HP=oxygen uptake factor during fasting and postprandial phases respectively. HF (0.2057 ± 0.0018 L of O2/kcal) and HP (0.2059 ± 0.0019 L of O2/kcal) are reported in Brochu et al. [53]. TDEE and BEE are defined in Table 2. Sld=Sleep duration (in hours/day). Sld values appear in Table 3. dVQα=ratio of the minute ventilation rate (VEα in L/min at BTPS) to the oxygen uptake (VO2α in L/min at STPD) during the aggregate daytime activities of pregnant females. The simultaneous VEα and VO2α measurements used for VQα calculations were taken from the literature [27,29,31,32,36-38,128]. n=number of individuals; S.D.=standard deviation; Min=minimal value; Max=maximal value.
Weight classifications of
females
Progression of the
reproductive cycle
Oxygen consumption ratesa
(L/min) (L/kg-min)b (L/m2-min)b
Mean ± S.D.Percentiles
Mean ± S.D.Percentiles
Mean ± S.D.Percentiles
2.5nd 97.5th 99th 2.5nd 97.5th 99th 2.5nd 97.5th 99th
Under-weight females
0 week 0.180 ± 0.012 0.157 0.205 0.210 0.0036 ± 0.0003 0.0030 0.0042 0.0043 0.118 ± 0.009 0.101 0.137 0.1419th week 0.185 ± 0.013 0.160 0.214 0.218 0.0034 ± 0.0003 0.0028 0.0040 0.0042 0.117 ± 0.009 0.101 0.136 0.139
22nd week 0.199 ± 0.014 0.172 0.228 0.234 0.0033 ± 0.0003 0.0027 0.0040 0.0041 0.120 ± 0.009 0.102 0.139 0.14336th week 0.236 ± 0.017 0.205 0.270 0.277 0.0036 ± 0.0003 0.0030 0.0043 0.0044 0.136 ± 0.010 0.116 0.157 0.161
Normal-weight females
0 week 0.193 ± 0.018 0.160 0.233 0.241 0.0033 ± 0.0004 0.0026 0.0040 0.0042 0.117 ± 0.012 0.096 0.143 0.1489th week 0.198 ± 0.019 0.163 0.240 0.248 0.0033 ± 0.0004 0.0026 0.0041 0.0042 0.119 ± 0.012 0.097 0.144 0.150
22nd week 0.211 ± 0.021 0.172 0.257 0.264 0.0032 ± 0.0004 0.0024 0.0039 0.0041 0.121 ± 0.012 0.098 0.147 0.15236th week 0.245 ± 0.025 0.200 0.300 0.313 0.0032 ± 0.0004 0.0025 0.0041 0.0042 0.132 ± 0.014 0.107 0.161 0.167
Overweight females
0 week 0.215 ± 0.025 0.175 0.272 0.283 0.0029 ± 0.0004 0.0022 0.0038 0.0040 0.118 ± 0.015 0.093 0.150 0.1579th week 0.228 ± 0.026 0.187 0.288 0.301 0.0028 ± 0.0004 0.0022 0.0037 0.0038 0.119 ± 0.015 0.095 0.152 0.160
22nd week 0.241 ± 0.028 0.198 0.306 0.321 0.0029 ± 0.0004 0.0021 0.0037 0.0039 0.123 ± 0.015 0.098 0.158 0.16636th week 0.287 ± 0.033 0.234 0.363 0.380 0.0031 ± 0.0004 0.0024 0.0041 0.0043 0.140 ± 0.017 0.112 0.179 0.188
Page 6 of 14
Volume 6 • Issue 3 • 1000306J Clinic ToxicolISSN: 2161-0495 JCT, an open access journal
Citation: Brochu P, Facetti Socol A (2016) Ventilation Rates during the Aggregate Daytime Activities of Working Females in Hospitals: Data before their Pregnancy and at their 9th, 22nd and 36th Week of Gestation. J Clinic Toxicol 6: 306. doi:10.4172/2161-0495.1000306
Obese class 1 females
0 week 0.239 ± 0.035 0.186 0.317 0.345 0.0028 ± 0.0005 0.0020 0.0039 0.0041 0.120 ± 0.019 0.091 0.162 0.1739th week 0.254 ± 0.038 0.198 0.338 0.368 0.0027 ± 0.0005 0.0020 0.0038 0.0040 0.123 ± 0.019 0.094 0.166 0.177
22nd week 0.269 ± 0.040 0.210 0.360 0.389 0.0028 ± 0.0005 0.0020 0.0038 0.0042 0.127 ± 0.020 0.097 0.172 0.18436th week 0.320 ± 0.047 0.250 0.426 0.458 0.0030 ± 0.0005 0.0022 0.0042 0.0046 0.146 ± 0.022 0.112 0.196 0.209
Obese classes 2-3 females
0 week 0.291 ± 0.022 0.250 0.337 0.346 0.0023 ± 0.0002 0.0020 0.0028 0.0029 0.122 ± 0.010 0.104 0.143 0.1489th week 0.309 ± 0.024 0.265 0.358 0.367 0.0024 ± 0.0002 0.0020 0.0028 0.0029 0.126 ± 0.010 0.107 0.148 0.152
22nd week 0.327 ± 0.026 0.280 0.378 0.392 0.0024 ± 0.0002 0.0020 0.0029 0.0030 0.131 ± 0.011 0.111 0.155 0.16036th week 0.390 ± 0.030 0.335 0.450 0.464 0.0027 ± 0.0003 0.0023 0.0032 0.0034 0.152 ± 0.013 0.129 0.179 0.184
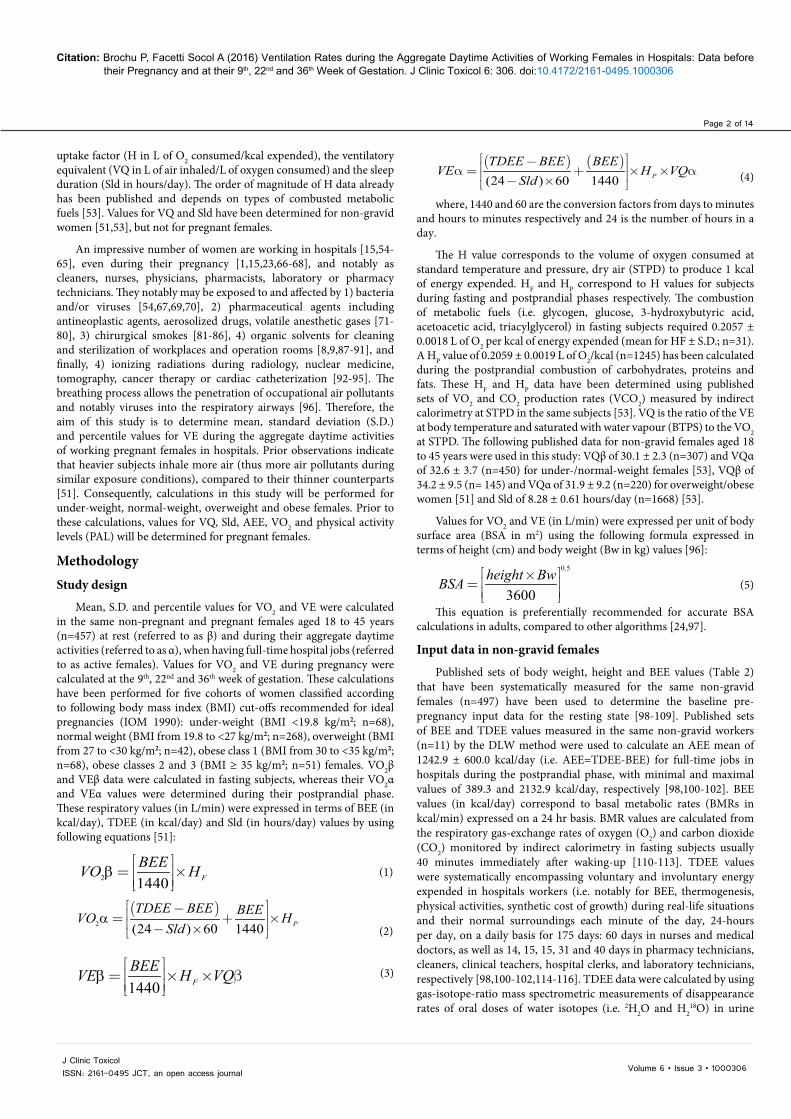
Table 5: Means and percentiles of oxygen consumption rates in fasting females at rest aged 18 to 45 years during pregnancy. aVO2β=(BEE/1440) x HF. BEE values are given in Table 2. HF=oxygen uptake factor during fasting phase. HF of 0.2057 ± 0.0018 L of O2/kcal is defined in Table 4. bOxygen consumption rates in L/min were divided by body weight and body surface area values reported in Table 2 in order to obtain values expressed in L/kg-min and L/m2-min respectively. S.D=standard deviation.
Weight classifications of
females
Progression of the
reproductive cycle
Oxygen consumption ratesa
(L/min) (L/kg-min)b (L/m2-min)b
Mean ± S.D.Percentiles
Mean ± S.D.Percentiles
Mean ± S.D.Percentiles
2.5nd 97.5th 99th 2.5nd 97.5th 99th 2.5nd 97.5th 99th
Under-weight females
0 week 0.420 ± 0.083 0.276 0.599 0.633 0.0083 ± 0.0017 0.0054 0.0120 0.0128 0.277 ± 0.056 0.181 0.397 0.4209th week 0.422 ± 0.084 0.278 0.605 0.637 0.0078 ± 0.0016 0.0050 0.0113 0.0120 0.268 ± 0.054 0.177 0.384 0.408
22nd week 0.432 ± 0.083 0.293 0.614 0.647 0.0072 ± 0.0015 0.0047 0.0104 0.0111 0.261 ± 0.051 0.175 0.374 0.39436th week 0.461 ± 0.081 0.324 0.641 0.672 0.0070 ± 0.0013 0.0048 0.0099 0.0104 0.266 ± 0.047 0.186 0.371 0.392
Normal-weight females
0 week 0.434 ± 0.089 0.279 0.633 0.670 0.0073 ± 0.0016 0.0046 0.0108 0.0115 0.263 ± 0.055 0.170 0.385 0.4129th week 0.436 ± 0.089 0.281 0.631 0.668 0.0072 ± 0.0016 0.0046 0.0106 0.0113 0.261 ± 0.055 0.168 0.384 0.409
22nd week 0.445 ± 0.088 0.293 0.640 0.681 0.0067 ± 0.0014 0.0043 0.0099 0.0105 0.254 ± 0.052 0.167 0.370 0.39636th week 0.471 ± 0.086 0.323 0.662 0.700 0.0063 ± 0.0012 0.0042 0.0090 0.0096 0.254 ± 0.048 0.174 0.362 0.385
Overweight females
0 week 0.455 ± 0.093 0.296 0.658 0.697 0.0062 ± 0.0013 0.0039 0.0091 0.0097 0.247 ± 0.052 0.158 0.362 0.3859th week 0.466 ± 0.092 0.307 0.666 0.709 0.0058 ± 0.0012 0.0037 0.0084 0.0090 0.241 ± 0.049 0.157 0.352 0.369
22nd week 0.475 ± 0.091 0.320 0.677 0.713 0.0056 ± 0.0012 0.0036 0.0082 0.0088 0.241 ± 0.048 0.160 0.348 0.36936th week 0.514 ± 0.089 0.365 0.708 0.751 0.0056 ± 0.0010 0.0038 0.0079 0.0084 0.249 ± 0.045 0.174 0.348 0.366
Obese class 1 females
0 week 0.480 ± 0.098 0.308 0.698 0.738 0.0056 ± 0.0012 0.0035 0.0084 0.0090 0.242 ± 0.051 0.153 0.351 0.3759th week 0.492 ± 0.098 0.323 0.711 0.754 0.0053 ± 0.0011 0.0033 0.0079 0.0084 0.238 ± 0.048 0.156 0.342 0.366
22nd week 0.503 ± 0.097 0.337 0.720 0.767 0.0052 ± 0.0011 0.0033 0.0077 0.0083 0.238 ± 0.046 0.160 0.337 0.36236th week 0.547 ± 0.093 0.389 0.756 0.797 0.0052 ± 0.0010 0.0036 0.0074 0.0079 0.249 ± 0.043 0.176 0.344 0.368
Obese classes 2-3 females
0 week 0.531 ± 0.089 0.372 0.717 0.750 0.0043 ± 0.0007 0.0030 0.0058 0.0062 0.223 ± 0.038 0.156 0.302 0.3189th week 0.546 ± 0.089 0.389 0.736 0.775 0.0042 ± 0.0007 0.0029 0.0057 0.0060 0.222 ± 0.036 0.159 0.301 0.316
22nd week 0.561 ± 0.087 0.405 0.747 0.783 0.0042 ± 0.0007 0.0029 0.0057 0.0059 0.225 ± 0.036 0.163 0.302 0.31936th week 0.616 ± 0.085 0.468 0.801 0.836 0.0043 ± 0.0006 0.0032 0.0057 0.0060 0.240 ± 0.034 0.182 0.312 0.325
Table 6: Means and percentiles of oxygen consumption rates during the aggregate daytime activities of females aged 18 to 45 years. aVO2α=[(TDEE-BEE)/((24-Sld) x 60)+(BEE)/1440] x HP. BEEs and TDEEs appear in Table 2. Sld=sleep duration (hours/day). Sld values are presented in Table 3. HP of 0.2059 ± 0.0019 L of O2/kcal is defined in Table 4. bOxygen consumption rates in L/min were divided by body weight and body surface area values reported in Table 2 in order to obtain values expressed in L/kg-min and L/m2-min respectively. S.D=standard deviation.
Weight classifications of
females
Progression of the
reproductive cycle
Minute ventilation ratesa
Mean ± S.D.(L/min)
Percentiles Mean ± S.D.(L/kg-min)b
Percentiles Mean ± S.D.(L/m2-min)b
Percentiles2.5nd 97.5th 99th 2.5nd 97.5th 99th 2.5nd 97.5th 99th
Under-weight females
0 week 5.43 ± 0.57 4.47 6.63 6.92 0.107 ± 0.013 0.085 0.133 0.139 3.56 ± 0.39 2.86 4.37 4.519th week 7.30 ± 0.82 5.81 9.08 9.28 0.134 ± 0.017 0.103 0.171 0.177 4.60 ± 0.51 3.67 5.65 5.83
22nd week 6.83 ± 0.61 5.71 8.09 8.35 0.113 ± 0.013 0.09 0.138 0.145 4.10 ± 0.39 3.39 4.89 5.0836th week 8.42 ± 0.66 7.20 9.72 9.97 0.128 ± 0.013 0.105 0.153 0.158 4.83 ± 0.41 4.07 5.69 5.85
Normal-weight females
0 week 5.84 ± 0.69 4.59 7.33 7.69 0.098 ± 0.014 0.075 0.128 0.132 3.53 ± 0.45 2.73 4.49 4.709th week 7.80 ± 1.02 5.94 9.97 10.60 0.128 ± 0.019 0.095 0.171 0.179 4.65 ± 0.61 3.55 5.94 6.23
22nd week 7.22 ± 0.83 5.72 8.95 9.38 0.108 ± 0.015 0.082 0.141 0.145 4.13 ± 0.48 3.28 5.15 5.4036th week 8.73 ± 0.92 7.13 10.78 11.26 0.116 ± 0.014 0.092 0.147 0.154 4.70 ± 0.52 3.77 5.80 6.04
Overweight females
0 week 7.35 ± 2.14 4.12 12.37 13.43 0.100 ± 0.030 0.053 0.170 0.193 4.05 ± 1.23 2.25 7.04 7.789th week 8.99 ± 1.28 6.81 11.78 12.64 0.111 ± 0.018 0.080 0.149 0.157 4.67 ± 0.68 3.53 6.15 6.51
22nd week 8.27 ± 1.09 6.51 10.55 11.32 0.098 ± 0.016 0.072 0.131 0.139 4.22 ± 0.57 3.27 5.50 5.7636th week 10.27 ± 1.25 8.26 13.13 13.69 0.111 ± 0.016 0.084 0.146 0.155 5.00 ± 0.64 3.96 6.44 6.76
Obese class 1 females
0 week 8.21 ± 2.53 4.46 14.07 15.41 0.095 ± 0.031 0.050 0.172 0.186 4.14 ± 1.31 2.23 7.31 8.169th week 10.02 ± 1.71 7.33 14.05 14.80 0.107 ± 0.021 0.075 0.156 0.168 4.81 ± 0.83 3.50 6.68 7.10
22nd week 9.22 ± 1.45 7.03 12.51 13.27 0.095 ± 0.018 0.068 0.134 0.147 4.36 ± 0.71 3.26 5.99 6.3736th week 11.45 ± 1.73 8.81 15.42 16.50 0.109 ± 0.019 0.079 0.151 0.164 5.19 ± 0.81 3.95 7.05 7.49

Page 7 of 14
Volume 6 • Issue 3 • 1000306J Clinic ToxicolISSN: 2161-0495 JCT, an open access journal
Citation: Brochu P, Facetti Socol A (2016) Ventilation Rates during the Aggregate Daytime Activities of Working Females in Hospitals: Data before their Pregnancy and at their 9th, 22nd and 36th Week of Gestation. J Clinic Toxicol 6: 306. doi:10.4172/2161-0495.1000306
Table 7: Means and percentiles of minute ventilation rates in fasting females at rest aged 18 to 45 years during pregnancy. aVEβ=(BEE/1440) x HF x VQβ. BEE and VQβ values are given in Tables 2 and 3 respectively. HF of 0.2057 ± 0.0018 L of O2/kcal is defined in Table 4. bMinute ventilation rates in L/min were divided by body weight and body surface area values reported in Table 2 in order to obtain values expressed in L/kg-min and L/m2-min respectively. S.D=standard deviation. Min.=minimum, Max.=maximum.
Obese classes 2-3 females
0 week 9.98 ± 2.84 5.64 16.26 18.79 0.080 ± 0.023 0.045 0.133 0.152 4.21 ± 1.21 2.41 7.12 7.889th week 12.19 ± 1.41 9.63 15.07 15.74 0.093 ± 0.012 0.072 0.117 0.122 4.93 ± 0.57 3.91 6.12 6.38
22nd week 11.21 ± 1.07 9.24 13.52 13.96 0.083 ± 0.009 0.066 0.103 0.106 4.50 ± 0.44 3.70 5.43 5.6136th week 13.91 ± 1.19 11.69 16.37 16.76 0.097 ± 0.010 0.08 0.117 0.122 5.42 ± 0.49 4.53 6.44 6.65
weight women as well as 10, 15 and 50% of overweight, obese class 1 and classes 2-3 females of our cohorts at the 36th week of gestation respectively inhale more air (thus more air pollutants) than the default VE value of 20.83 L/min (i.e. 10 m3 in an 8-hour workday) that can be used for conducting occupational exposure assessments and/or hygienic standards for airborne toxic chemicals [147-150].
All adults are expected to have residues of organic chemicals and/or metals stored in their tissues resulting from sporadic exposures to environmental pollutants since their childhood: mainly by the ingestion of food, drinking water, dust and/or soil; and/or the inhalation of indoor and/or outdoor air [149,151-188]. For instance, cadmium and lead are stored in kidneys and bones respectively [189] and an impressive number of fat soluble environmental xenobiotics are stored in the adipose tissue including notably organochlorine pesticides and organic solvents [168,190-201].
As observed with organic environmental pollutants [195,199,202], drugs tend to dissolve into lipid-rich spaces [203] as shown by their lipophilic octanol-water partition coefficients [204-207]. Consequently, workers in hospitals inhaled concentrations of organic lipophilic toxic chemicals that are absorbed into their body and stored in their adipose tissue, including notably pharmaceutical aerosolized medications, volatile anesthetic gases, aromatic components of chirurgical smokes
Such data are also consistent with the fact that overstrain and overwork in pregnant females are usually avoided by reducing physical activity, increasing work efficiency and adjusting daily physical activities [101,105,110,122,134-136,139,140-146]. Values for VQβ (based on respiratory measurements in pregnant females at rest) and VQα (based on percentages of gravid females per cohort performing daytime activities at various PALVO2) are consistent with VQ as well as sets of VE and VO2 measurements reported in the literature for gravid women [27,29,31,32,36-38,128].
The pregnancy requires absolute oxygen demands (in L/min) with VO2 mean values increasing by 2.4 to 6.3, 8.8 to 12.5 and 26.4 to 33.9% at the 9th, 22nd and 36th week of gestation respectively compared to baseline values for non-gravid females (Table 5). To support such oxygenation rates VE means increase by 22.1 to 34.3, 12.2 to 25.6 and 39.4 to 55.0% for the same classification of weeks of gestation respectively (Table 6). Moreover, absolute VE means during aggregate daytime activities of non-pregnant and pregnant females at rest (Table 7: 5.43 ± 0.57 to 13.91 ± 1.19 L/min) increase by 1.6 to 2.5 folds when they have full-time hospital jobs (Table 8: 13.75 ± 3.17 to 21.68 ± 3.07 L/min). These working females inhale 7.77 to 8.32 L of additional volumes of air per minute in order to be adequately oxygenated during their aggregate daytime activities compared to baseline values at rest (Tables 7 and 8). Based on our percentiles (Table 8), about 2.5% of under and normal
Weight classifications
of females
Progression of the
reproductive cycle
Minute ventilation ratesa
(L/min)
Mean ± S.D.Percentiles
1st 2.5nd 5th 10th 25th 50th 65th 75th 85th 90th 95th 97.5th 99th
Under-weight females
0 week 13.75 ± 3.17 7.91 8.52 9.13 9.95 11.47 13.42 14.69 15.69 17.04 17.99 19.52 21.01 22.479th week 14.07 ± 2.82 8.67 9.27 9.85 10.62 12.02 13.82 14.96 15.87 17.06 17.91 19.17 20.28 21.56
22nd week 13.74 ± 2.66 8.69 9.21 9.79 10.50 11.79 13.48 14.56 15.44 16.57 17.36 18.55 19.62 20.7736th week 15.22 ± 2.71 10.07 10.60 11.21 11.89 13.24 14.95 16.05 16.91 18.07 18.92 20.14 21.18 22.44
Normal-weight females
0 week 14.14 ± 3.34 7.86 8.53 9.27 10.11 11.76 13.82 15.11 16.16 17.55 18.58 20.15 21.55 23.359th week 14.62 ± 3.09 8.73 9.38 10.04 10.86 12.43 14.34 15.52 16.52 17.81 18.76 20.17 21.59 23.20
22nd week 14.14 ± 2.85 8.67 9.34 9.95 10.67 12.08 13.89 15.00 15.89 17.09 17.95 19.25 20.51 21.9536th week 15.49 ± 2.91 9.95 10.60 11.19 11.91 13.42 15.22 16.35 17.26 18.45 19.40 20.78 22.05 23.45
Overweight females
0 week 14.55 ± 5.15 6.20 7.08 7.78 8.78 10.86 13.62 15.69 17.34 19.65 21.46 24.21 26.90 30.119th week 15.94 ± 3.28 9.67 10.37 11.05 11.93 13.56 15.65 16.95 17.97 19.40 20.35 21.90 23.26 24.65
22nd week 15.28 ± 2.98 9.59 10.13 10.80 11.64 13.11 15.04 16.19 17.14 18.44 19.31 20.63 21.89 23.1036th week 17.18 ± 3.03 11.47 12.02 12.66 13.45 15.00 16.89 18.12 19.08 20.36 21.26 22.68 23.82 25.23
Obese class 1 females
0 week 15.40 ± 5.41 6.72 7.48 8.28 9.35 11.45 14.53 16.62 18.35 20.74 22.49 25.44 28.17 32.079th week 17.31 ± 3.52 10.54 11.40 12.07 12.98 14.74 17.03 18.43 19.53 20.96 22.00 23.65 25.04 26.74
22nd week 16.31 ± 3.13 10.36 11.05 11.62 12.46 14.03 16.03 17.33 18.30 19.61 20.52 21.96 23.14 24.6236th week 18.59 ± 3.20 12.57 13.23 13.87 14.66 16.25 18.3 19.59 20.60 21.92 22.82 24.32 25.64 27.01
Obese classes 2-3 females
0 week 17.08 ± 5.64 7.77 8.66 9.53 10.77 12.98 16.24 18.36 20.21 22.71 24.55 27.60 30.53 34.289th week 20.19 ± 3.54 13.26 13.99 14.82 15.90 17.65 19.90 21.33 22.46 23.86 24.91 26.56 27.84 29.27
22nd week 18.67 ± 3.00 12.64 13.39 14.09 14.96 16.51 18.47 19.66 20.60 21.79 22.67 23.89 25.02 26.4936th week 21.68 ± 3.07 15.57 16.30 17.04 17.89 19.51 21.47 22.66 23.59 24.93 25.84 27.20 28.19 29.52
Table 8: Distribution of minute ventilation rate (L/min) percentiles during the aggregate daytime activities of females aged 18 to 45 years. aVEα=[(TDEE-BEE)/((24-Sld) x 60)+(BEE)/1440] x HP x VQα. BEEs and TDEEs are reported in Table 2. Sld data appear in Table 3. HP of 0.2059 ± 0.0019 L of O2/kcal is defined in Table 4. S.D.=standard deviation.
Page 8 of 14
Volume 6 • Issue 3 • 1000306J Clinic ToxicolISSN: 2161-0495 JCT, an open access journal
Citation: Brochu P, Facetti Socol A (2016) Ventilation Rates during the Aggregate Daytime Activities of Working Females in Hospitals: Data before their Pregnancy and at their 9th, 22nd and 36th Week of Gestation. J Clinic Toxicol 6: 306. doi:10.4172/2161-0495.1000306
Weight classifications of
females
Progression of the
reproductive cycle
Minute ventilation ratesa
(L/kg-min)b
Mean ± S.D.Percentiles
1st 2.5nd 5th 10th 25th 50th 65th 75th 85th 90th 95th 97.5th 99th
Under-weight females
0 week 0.272 ± 0.064 0.155 0.166 0.177 0.195 0.226 0.265 0.290 0.310 0.338 0.358 0.389 0.417 0.4519th week 0.259 ± 0.054 0.158 0.167 0.179 0.193 0.220 0.254 0.276 0.293 0.316 0.331 0.356 0.377 0.403
22nd week 0.228 ± 0.047 0.140 0.150 0.160 0.172 0.195 0.223 0.242 0.257 0.278 0.291 0.311 0.332 0.35236th week 0.231 ± 0.043 0.150 0.159 0.168 0.179 0.199 0.227 0.244 0.258 0.277 0.289 0.311 0.328 0.348
Normal-weight females
0 week 0.238 ± 0.058 0.129 0.141 0.154 0.168 0.197 0.233 0.255 0.273 0.298 0.316 0.343 0.370 0.4039th week 0.240 ± 0.053 0.141 0.151 0.162 0.175 0.203 0.235 0.256 0.273 0.295 0.312 0.337 0.361 0.389
22nd week 0.213 ± 0.046 0.126 0.137 0.146 0.158 0.180 0.208 0.226 0.240 0.260 0.272 0.294 0.317 0.34036th week 0.206 ± 0.041 0.129 0.138 0.146 0.156 0.177 0.202 0.218 0.231 0.247 0.260 0.281 0.300 0.320
Overweight females
0 week 0.197 ± 0.071 0.083 0.093 0.104 0.118 0.146 0.184 0.213 0.236 0.267 0.292 0.331 0.367 0.4189th week 0.197 ± 0.044 0.116 0.124 0.134 0.145 0.166 0.193 0.210 0.224 0.242 0.256 0.276 0.295 0.317
22nd week 0.181 ± 0.039 0.108 0.116 0.123 0.134 0.153 0.177 0.193 0.205 0.221 0.233 0.251 0.268 0.28536th week 0.185 ± 0.036 0.119 0.126 0.133 0.142 0.160 0.182 0.196 0.207 0.223 0.234 0.250 0.266 0.281
Obese class 1 females
0 week 0.179 ± 0.065 0.076 0.085 0.094 0.107 0.131 0.168 0.193 0.214 0.242 0.265 0.300 0.333 0.3809th week 0.186 ± 0.041 0.109 0.118 0.126 0.136 0.156 0.182 0.198 0.211 0.228 0.239 0.258 0.274 0.295
22nd week 0.168 ± 0.036 0.100 0.109 0.116 0.125 0.143 0.165 0.179 0.190 0.205 0.216 0.232 0.246 0.26436th week 0.177 ± 0.033 0.113 0.121 0.127 0.136 0.153 0.174 0.187 0.198 0.212 0.222 0.237 0.250 0.267
Obese classes 2-3 females
0 week 0.137 ± 0.046 0.062 0.069 0.076 0.086 0.104 0.130 0.148 0.163 0.183 0.198 0.223 0.245 0.2759th week 0.153 ± 0.028 0.099 0.105 0.112 0.119 0.133 0.151 0.162 0.171 0.183 0.190 0.203 0.214 0.226
22nd week 0.138 ± 0.024 0.091 0.097 0.103 0.109 0.121 0.136 0.146 0.153 0.162 0.169 0.179 0.189 0.20036th week 0.151 ± 0.023 0.107 0.112 0.117 0.123 0.135 0.150 0.158 0.166 0.175 0.182 0.192 0.200 0.211
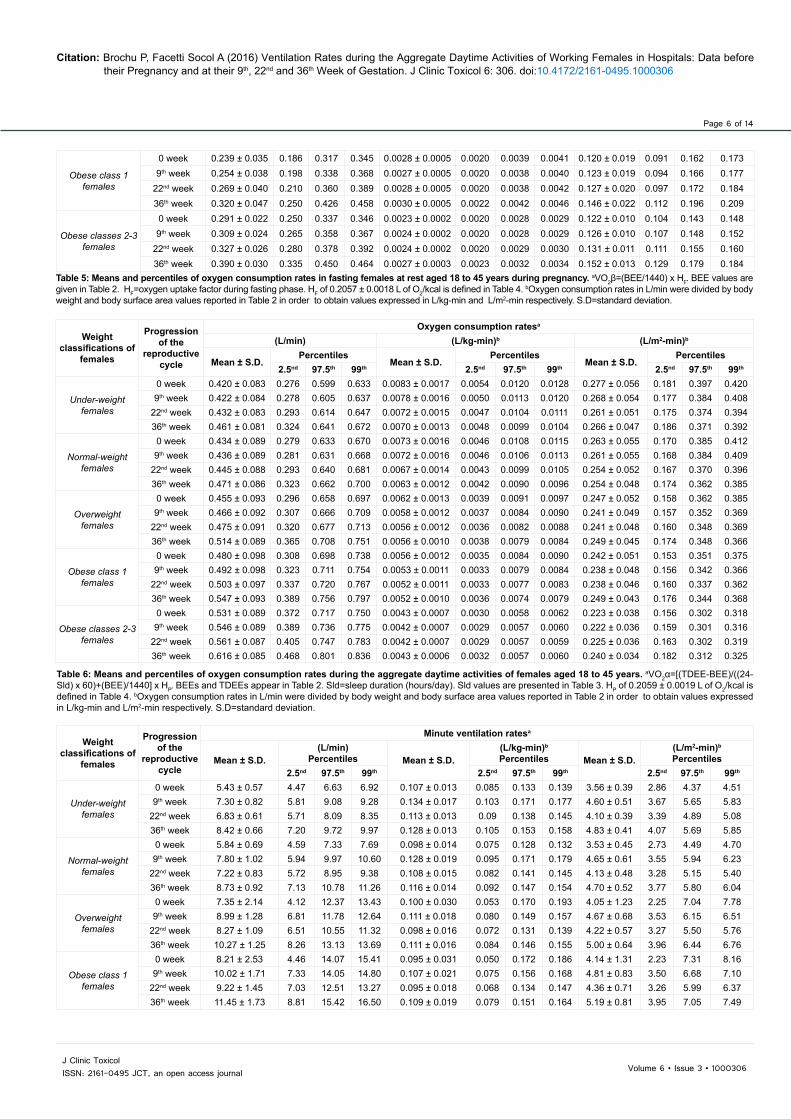
Table 9: Distribution of minute ventilation rate (L/kg-min) percentiles during the aggregate daytime activities of females aged 18 to 45 years. aVEα=[(TDEE-BEE)/((24-Sld) x 60)+(BEE)/1440] x HP x VQα. BEEs and TDEEs are reported in Table 2. Sld data appear in Table 3. HP of 0.2059 ± 0.0019 L of O2/kcal is defined in Table 4. bValues expressed in L/kg-min were obtained by dividing VEα in L/min of Table 7 by body weight values presented in Table 2. S.D=standard deviation.
Weight classifications of
females
Progression of the
reproductive cycle
Minute ventilation ratesa
(L/m2-min)b
Mean ± S.D.Percentiles
1st 2.5nd 5th 10th 25th 50th 65th 75th 85th 90th 95th 97.5th 99th
Under-weight females
0 week 9.05 ± 2.11 5.16 5.61 5.98 6.53 7.52 8.81 9.67 10.34 11.23 11.87 12.96 13.84 14.889th week 8.93 ± 1.81 5.48 5.86 6.23 6.72 7.62 8.75 9.51 10.07 10.86 11.37 12.19 12.90 13.66
22nd week 8.28 ± 1.63 5.20 5.52 5.87 6.31 7.10 8.12 8.79 9.30 10.00 10.48 11.22 11.89 12.5736th week 8.77 ± 1.59 5.79 6.09 6.44 6.84 7.62 8.62 9.26 9.76 10.44 10.91 11.65 12.30 12.99
Normal-weight females
0 week 8.59 ± 2.05 4.75 5.14 5.56 6.14 7.12 8.38 9.19 9.82 10.69 11.29 12.27 13.22 14.239th week 8.77 ± 1.88 5.23 5.58 6.00 6.48 7.43 8.59 9.31 9.94 10.70 11.28 12.12 13.02 14.07
22nd week 8.11 ± 1.67 4.94 5.32 5.67 6.09 6.90 7.96 8.62 9.13 9.83 10.31 11.12 11.85 12.7236th week 8.35 ± 1.60 5.35 5.69 6.00 6.41 7.20 8.21 8.83 9.31 9.98 10.48 11.26 12.02 12.75
Overweight females
0 week 7.96 ± 2.86 3.36 3.80 4.22 4.79 5.92 7.45 8.58 9.50 10.77 11.78 13.24 14.78 16.799th week 8.32 ± 1.75 4.98 5.37 5.72 6.18 7.06 8.15 8.85 9.41 10.14 10.66 11.48 12.25 13.06
22nd week 7.80 ± 1.57 4.83 5.13 5.44 5.88 6.67 7.65 8.28 8.78 9.44 9.90 10.63 11.25 11.9736th week 8.38 ± 1.52 5.55 5.82 6.11 6.51 7.28 8.24 8.84 9.32 9.96 10.44 11.18 11.73 12.37
Obese class 1 females
0 week 7.76 ± 2.78 3.32 3.71 4.10 4.66 5.76 7.31 8.37 9.26 10.48 11.40 12.96 14.36 16.539th week 8.38 ± 1.74 5.06 5.44 5.79 6.24 7.13 8.23 8.93 9.46 10.18 10.68 11.47 12.19 13.05
22nd week 7.74 ± 1.53 4.81 5.16 5.47 5.85 6.64 7.59 8.22 8.71 9.34 9.80 10.47 11.05 11.7836th week 8.48 ± 1.50 5.65 5.95 6.26 6.64 7.39 8.35 8.94 9.43 10.03 10.47 11.15 11.79 12.53
Obese classes 2-3 females
0 week 7.17 ± 2.38 3.26 3.63 4.01 4.50 5.44 6.82 7.71 8.50 9.53 10.32 11.62 12.87 14.339th week 8.22 ± 1.45 5.37 5.68 6.02 6.44 7.17 8.10 8.68 9.15 9.74 10.15 10.82 11.39 11.98
22nd week 7.49 ± 1.22 5.06 5.33 5.63 5.99 6.61 7.40 7.90 8.28 8.77 9.12 9.62 10.11 10.7236th week 8.46 ± 1.22 6.06 6.33 6.62 6.95 7.58 8.38 8.85 9.21 9.74 10.10 10.60 11.05 11.57
Table 10: Distribution of minute ventilation rate (L/m2-min) percentiles during the aggregate daytime activities of females aged 18 to 45 years. aVEα=[(TDEE-BEE)/((24-Sld) x 60)+(BEE)/1440] x HP x VQα. BEEs and TDEEs are reported in Table 2. Sld data appear in Table 3. HP of 0.2059 ± 0.0019 L of O2/kcal is defined in Table 4. bValues expressed in L/m2-min were obtained by dividing VEα in L/min of Table 7 by body surface area values presented in Table 2. S.D=standard deviation.
(including notably benzene, toluene, ethyl benzene, xylene, styrene and aromatic polycyclic hydrocarbons) and organic solvents of cleaning products [203,208-213]. These chemicals and fat soluble
environmental xenobiotics sequestered in adipose tissues as well as lead stored in bones are released into the bloodstream of female workers during their pregnancy, lactation and menopause and workers

Page 9 of 14
Volume 6 • Issue 3 • 1000306J Clinic ToxicolISSN: 2161-0495 JCT, an open access journal
Citation: Brochu P, Facetti Socol A (2016) Ventilation Rates during the Aggregate Daytime Activities of Working Females in Hospitals: Data before their Pregnancy and at their 9th, 22nd and 36th Week of Gestation. J Clinic Toxicol 6: 306. doi:10.4172/2161-0495.1000306
of both genders during weight loss resulting from an energy-restricted diet [168,174,214]. The mobilization of lead from bone tissues increases during calcium-deficient diets [215-220].
The adipose tissue may act as a reservoir for the accumulation of fat soluble drugs and toxicants. Large fat storage sites in obese women could increase their body’s capacity for the accumulation of lipophilic xenobiotics, compared to those in under and normal weight females [221-223]. Moreover, published plasma levels of organochlorines suggest that high circulating concentrations of fat soluble pollutants mobilized from the adipose tissue could be related to high BMI values [221]. Therefore, obese female workers are at risk to have higher blood concentrations of total toxicants during their pregnancy, compared to their thinner counterparts, considering their high intakes and uptakes of air pollutants resulting from their high minute ventilation rates and blood concentrations of xenobiotics released from their adipose tissue. These blood concentrations of chemicals may generate adverse effects in gravid females, their embryo or fetus and even their newborns [224,225]. This is explained by the fact that most of these chemicals may be transferred to the embryos or fetus by the umbilical cord after crossing the placenta, or transferred to newborns during the breastfeeding [168,225]. Prenatal exposure to carcinogens could results in differentially higher levels of procarcinogenic DNA damage in the fetus [226]. This may disproportionately increase the probability of the latter to develop a cancer over his lifetime. The inhalation and absorption of teratogenic chemicals by pregnant female workers, after the implantation of their blastocyst may lead to genetic damages, structural defects, malformation of systems or growth retardations in newborns [182,223,227-229]. Diseases and developmental disorders could also occur in children, during their life course and in future generations [228]. The embryonic death occurs when future mothers absorb in their bloodstream teratogenic chemicals mainly by the inhalation process, before the implantation of their blastocyst [223]. For instance, the exposure to anesthetic gases, antineoplastic drugs and sterilizing agents were associated to high risks of spontaneous abortions in exposed working females in hospitals, compared to those that were not exposed [68,226,230-234]. Significantly more congenital abnormalities were also found in children of some exposed female workers [232,233,235]. These high risks of spontaneous abortions are enhanced by the fact that working women in hospitals cannot know exactly when their pregnancy begins: the human chorionic gonadotropin (hCG) being only detected in the blood or urine samples after the implantation of the blastocyst, which occurs six to twelve days after the fertilization [222,223].
ConclusionThe present study provides a complete and original set of PALVO2,
VQβ, VQα, VO2 and VE values during the aggregate daytime activity of under (n=68), normal (n=268), overweight (n=42), obese class 1 (n=68) and obese classes 2-3 (n=51) females with full-time hospital jobs, before their pregnancy, and at their 9th, 22nd and 36th week of gestation. The integration into the calculation process of BEE, TDEE and H data has assured mean low potential errors on VE data varying from +1 to +2.6%. The use of published BEE, TDEE, body weight and height values that have been systematically measured in the same females has allowed accurate calculations of VE data per unit of body weight or body surface area. Therefore, VE percentiles reported in this study are recommended for conducting occupational health risk assessment and management of potential toxic air pollutants in non-pregnant and pregnant females working in hospitals. However, the non-exposure of female workers to teratogenic and carcinogenic agents in hospitals is recommended before and during their pregnancy.
Acknowledgments
The authors thank Dr Dennis Jensen from the McGill University in Montreal for his data that he has shared with us and that he had published in McAuley et al. (2005). The authors are also grateful to Mrs. Jessie Ménard from the School of Public Health of the University of Montreal for her contribution to this project.
Declaration of Interest
The authors report no declarations of interest.
References1. McDonald JC, Lavoie J, Côté R, McDonald AD (1987) Chemical exposures at
work in early pregnancy and congenital defect: a case-referent study. Br J Ind Med 44: 527-533.
2. Saurel-Cubizolles MJ, Kaminski M (1987) Pregnant women’s working conditions and their changes during pregnancy: a national study in France. Br J Ind Med 44: 236-243.
3. Olsen J, Hemminki K, Ahlborg G, Bjerkedal T, Kyyrönen P, et al. (1990) Low birthweight, congenital malformations, and spontaneous abortions among dry-cleaning workers in Scandinavia. Scand J Work Environ Health 16: 163-168.
4. Bentur Y, Koren G (1991) The three most common occupational exposures reported by pregnant women: an update. Am J Obstet Gynecol 165: 429-437.
5. Lipscomb JA, Fenster L, Wrensch M, Shusterman D, Swan S (1991) Pregnancy outcomes in women potentially exposed to occupational solvents and women working in the electronics industry. J Occup Med 33: 597-604.
6. Schaumburg I, Olsen J (1991) Birth weight and gestational age among children of Danish pharmacy assistants. J Epidemiol Community Health 45: 49-51.
7. Temperton DH (1992) Pregnancy and Work in Diagnostic Imaging Departments. The British Institute of Radiology, 2nd ed. Dublin, Pa.
8. Arrieta MJ, Infante-Rivard C (1999) Organic solvent exposure during pregnancy and congenital malformations. JAMA 282: 1033.
9. Khattak S, Moghtader GK, McMartin K, Barrera M, Kennedy D, et al. (1999) Pregnancy outcome following gestational exposure to organic solvents: a prospective controlled study. JAMA 281: 1106-1109.
10. Adams L, McAndrew F, Winterbotham M (2005) Pregnant & Productive. Pregnancy discrimination at work: a survey of women. EOC Working paper series 24: 1-78.
11. Pompeii LA, Savitz DA, Evenson KR, Rogers B, McMahon M (2005) Physical exertion at work and the risk of preterm delivery and small-for-gestational-age birth. Obstet Gynecol 106: 1279-1288.
12. Zhu JL, Knudsen LE, Andersen AM, Hjollund NH, Olsen J (2006) Laboratory work and pregnancy outcomes: a study within the National Birth Cohort in Denmark. Occup Environ Med 63: 53-58.
13. Zhu JL, Vestergaard M, Hjollund NH, Olsen J (2006) Pregnancy outcomes among female hairdressers who participated in the Danish National Birth Cohort. Scand J Work Environ Health 32: 61-66.
14. Torres-Arreola Ldel P, Constantino-Casas P, Villa-Barragán JP, Doubova SV (2007) Health and working conditions of pregnant women working inside and outside the home in Mexico City. BMC Public Health 7: 25.
15. Whelan EA, Lawson CC, Grajewski B, Hibert EN, Spiegelman D, et al. (2007) Work schedule during pregnancy and spontaneous abortion. Epidemiology 18: 350-355.
16. Cheng PL, Pantel M, Smith JT, Dumas GA, Leger AB, et al. (2009) Back pain of working pregnant women: identification of associated occupational factors. Appl Ergon 40: 419-423.
17. Garlantézec R, Monfort C, Rouget F, Cordier S (2009) Maternal occupational exposure to solvents and congenital malformations: a prospective study in the general population. Occup Environ Med 66: 456-463.
18. Burdorf A, Brand T, Jaddoe VW, Hofman A, Mackenbach JP, et al. (2011) The effects of work-related maternal risk factors on time to pregnancy, preterm birth and birth weight: the Generation R Study. Occup Environ Med 68: 197-204.
19. Laughlin L (2011) Maternity Leave and Employment Patterns: 2006-2008. Current Population Report, U.S. Census Bureau, Washington, DC. P 70-128.
20. Russell H, Banks J (2011) Pregnancy and Employment: A Literature Review. HSE Crisis Pregnancy Program. Capel Street, Dublin 1.
Page 10 of 14
Volume 6 • Issue 3 • 1000306J Clinic ToxicolISSN: 2161-0495 JCT, an open access journal
Citation: Brochu P, Facetti Socol A (2016) Ventilation Rates during the Aggregate Daytime Activities of Working Females in Hospitals: Data before their Pregnancy and at their 9th, 22nd and 36th Week of Gestation. J Clinic Toxicol 6: 306. doi:10.4172/2161-0495.1000306
21. Bonde JP, Jørgensen KT, Bonzini M, Palmer KT (2013) Miscarriage and occupational activity: a systematic review and meta-analysis regarding shift work, working hours, lifting, standing, and physical workload. Scand J Work Environ Health 39: 325-334.
22. Palmer KT, Bonzini M, Harris EC, Linaker C, Bonde JP (2013) Work activities and risk of prematurity, low birth weight and pre-eclampsia: an updated review with meta-analysis. Occup Environ Med 70: 213-222.
23. Takeuchi M, Rahman M, Ishiguro A, Nomura K (2014) Long working hours and pregnancy complications: women physicians survey in Japan. BMC Pregnancy Childbirth 14: 245.
24. Vaktskjold A, Talykova LV, Chashchin VP, Nieboer E, Thomassen Y, et al. (2006) Genital malformations in newborns of female nickel-refinery workers. Scand J Work Environ Health 32: 41-50.
25. Vaktskjold A, Talykova LV, Nieboer E (2011) Congenital anomalies in newborns to women employed in jobs with frequent exposure to organic solvents--a register-based prospective study. BMC Pregnancy Childbirth 11: 83.
26. Vaktskjold A, Talykova LV, Nieboer E (2014) Low birth weight in newborns to women employed in jobs with frequent exposure to organic solvents. Int J Environ Health Res 24: 44-55.
27. Heenan AP, Wolfe LA, Davies GA (2001) Maximal exercise testing in late gestation: maternal responses. Obstet Gynecol 97: 127-134.
28. Suresh L, Radfar L (2004) Pregnancy and lactation. Oral Surg Oral Med Oral Pathol Oral Radiol Endod 97: 672-682.
29. Jensen D, Webb KA, Wolfe LA, O’Donnell DE (2007) Effects of human pregnancy and advancing gestation on respiratory discomfort during exercise. Respir Physiol Neurobiol 156: 85-93.
30. Melzer K, Schutz Y, Boulvain M, Kayser B (2010) Physical activity and pregnancy: cardiovascular adaptations, recommendations and pregnancy outcomes. Sports Med 40: 493-507.
31. Knuttgen HG, Emerson K Jr (1974) Physiological response to pregnancy at rest and during exercise. J Appl Physiol 36: 549-553.
32. Pernoll ML, Metcalfe J, Kovach PA, Wachtel R, Dunham MJ (1975) Ventilation during rest and exercise in pregnancy and postpartum. Respir Physiol 25: 295-310.
33. Edwards MJ, Metcalfe J, Dunham MJ, Paul MS (1981) Accelerated respiratory response to moderate exercise in late pregnancy. Respir Physiol 45: 229-241.
34. Contreras G, Gutiérrez M, Beroíza T, Fantín A, Oddó H, et al. (1991) Ventilatory drive and respiratory muscle function in pregnancy. Am Rev Respir Dis 144: 837-841.
35. Field SK, Bell SG, Cenaiko DF, Whitelaw WA (1991) Relationship between inspiratory effort and breathlessness in pregnancy. J Appl Physiol (1985) 71: 1897-1902.
36. Pivarnik JM, Lee W, Spillman T, Clark SL, Cotton DB, et al. (1992) Maternal respiration and blood gases during aerobic exercise performed at moderate altitude. Med Sci Sports Exerc 24: 868-872.
37. Jaque-Fortunato SV, Wiswell RA, Khodiguian N, Artal R (1996) A comparison of the ventilatory responses to exercise in pregnant, postpartum, and nonpregnant women. Semin Perinatol 20: 263-276.
38. Lotgering FK, Spinnewijn WE, Struijk PC, Boomsma F, Wallenburg HC (1998) Respiratory and metabolic responses to endurance cycle exercise in pregnant and postpartum women. Int J Sports Med 19: 193-198.
39. Ohtake PJ, Wolfe LA (1998) Physical conditioning attenuates respiratory responses to steady-state exercise in late gestation. Med Sci Sports Exerc 30: 17-27.
40. Wolfe LA, Walker RM, Bonen A, McGrath MJ (1994) Effects of pregnancy and chronic exercise on respiratory responses to graded exercise. J Appl Physiol 76: 1928-1936.
41. Wolfe LA, Kemp JG, Heenan AP, Preston RJ, Ohtake PJ (1998) Acid-base regulation and control of ventilation in human pregnancy. Can J Physiol Pharmacol 76: 815-827.
42. Artal R, O’Toole M (2003) Guidelines of the American College of Obstetricians and Gynecologists for exercise during pregnancy and the postpartum period. Br J Sports Med 37: 6-12.
43. Prowse CM, gaensler EA (1965) Respiratory and acid-base changes during pregnancy. Anesthesiology 26: 381-392.
44. Templeton A, Kelman GR (1976) Maternal blood-gases, PAo2--Pao2), hysiological shunt and VD/VT in normal pregnancy. Br J Anaesth 48: 1001-1004.
45. Sady SP, Carpenter MW, Thompson PD, Sady MA, Haydon B, et al. (1989) Cardiovascular response to cycle exercise during and after pregnancy. J Appl Physiol 66: 336-341.
46. Crapo RO (1996) Normal cardiopulmonary physiology during pregnancy. Clin Obstet Gynecol 39: 3-16.
47. Ciliberto CF, Marx GF (1998) Physiological changes associated with pregnancy. Anesthesia 9: 1-3.
48. Hegewald MJ, Crapo RO (2011) Respiratory physiology in pregnancy. Clin Chest Med 32: 1-13, vii.
49. Brochu P, Ducré-Robitaille JF, Brodeur J (2006) Physiological daily inhalation rates for free-living pregnant and lactating adolescents and women aged 11 to 55 years, using data from doubly labeled water measurements for use in health risk assessment. HERA 12: 702-735.
50. Brochu P, Brodeur J, Krishnan K (2012) Derivation of cardiac output and alveolar ventilation rate based on energy expenditure measurements in healthy males and females. J Appl Toxicol 32: 564-580.
51. Brochu P, Bouchard M, Haddad S (2014) Physiological daily inhalation rates for health risk assessment in overweight/obese children, adults, and elderly. Risk Anal 34: 567-582.
52. International Dietary Energy Consultancy Group (IDECG) (1990) The Doubly-labelled Water Method for Measuring Energy Expenditure: A consensus Report by the IDECG working group. Technical recommendation for use in humans. NAHRES-4, IAEA. Ed. Prentice AM, Vienna, Austria.
53. Brochu P, Brodeur J, Krishnan K (2011) Derivation of physiological inhalation rates in children, adults, and elderly based on nighttime and daytime respiratory parameters. Inhal Toxicol 23: 74-94.
54. Porter S (2008) Women in a women’s job: the gendered experience of nurses. Sociology of Health & Illness. 14: 510-527.
55. Bolyard EA, Tablan OC, Williams WW, Pearson ML, Shapiro CN, et al. (1998) Guideline for infection control in healthcare personnel, 1998. Hospital Infection Control Practices Advisory Committee. Infect Control Hosp Epidemiol 19: 407-463.
56. Ozcan S, Hornby P (1999) Determining Hospital Workforce Requirements: A Case Study. Hum. Resour. Health 3: 210-220.
57. Stone PW, Clarke SP, Cimiotti J, Correa-de-Araujo R (2004) Nurses’ working conditions: implications for infectious disease. Emerg Infect Dis 10: 1984-1989.
58. Kitt MM, Khalid G, Rahimi S, McCarthy BJ (2006) An occupational health services initiative at a women’s hospital in Kabul, Afghanistan. Public Health Rep 121: 650-657.
59. Sveinsdóttir H (2006) Self-assessed quality of sleep, occupational health, working environment, illness experience and job satisfaction of female nurses working different combination of shifts. Scand J Caring Sci 20: 229-237.
60. Black AA, Brauer SG, Bell RA, Economidis AJ, Haines TP (2011) Insights into the climate of safety towards the prevention of falls among hospital staff. J Clin Nurs 20: 2924-2930.
61. United State Department of Health and Human Services Health Resources and Services Administration (USDHSA) (2010) The Registered Nurse Population Initial Findings from the 2008 National Sample Survey of Registered Nurses.
62. Barden AM, Griffin MT, Donahue M, Fitzpatrick JJ (2011) Shared governance and empowerment in registered nurses working in a hospital setting. Nurs Adm Q 35: 212-218.
63. Lee KJ, Kim JJ, Kim JI (2011) Prevalence of Low Back Symptom and Impact of Job Stress among Working Women as Clinical Nurses in University Hospitals. Korean J. Women Health Nurs 17: 484-490.
64. Milosevic M, Golubic R, Knezevic B, Golubic K, Bubas M, et al. (2011) Work ability as a major determinant of clinical nurses’ quality of life. J Clin Nurs 20: 2931-2938.
65. Health and Social Care Information Centre (HSCIC) (2014) Non-medical, medical and dental staff in England – 2003-2013 as at 30 September. Overview bulletin no. 13724. NHS Workforce Statistics in England. NHS Hospital and Community Health Services.
66. Baltzar B, Ericson A, Källen B (1979) Pregnancy outcome among women working in Swedish hospitals. N Engl J Med 300: 627-628.

Page 11 of 14
Volume 6 • Issue 3 • 1000306J Clinic ToxicolISSN: 2161-0495 JCT, an open access journal
Citation: Brochu P, Facetti Socol A (2016) Ventilation Rates during the Aggregate Daytime Activities of Working Females in Hospitals: Data before their Pregnancy and at their 9th, 22nd and 36th Week of Gestation. J Clinic Toxicol 6: 306. doi:10.4172/2161-0495.1000306
67. Alex MR (2011) Occupational hazards for pregnant nurses. Am J Nurs 111: 28-37.
68. Lawson CC, Rocheleau CM, Whelan EA, Lividoti Hibert EN, Grajewski B, et al. (2012) Occupational exposures among nurses and risk of spontaneous abortion. Am J Obstet Gynecol 206: 327.
69. National Institute for Occupational Safety and Health (NIOSH) (1999) The effects of workplace hazards on female reproductive health. Publication No. 99.104. Atlanta: Centers for Disease Control and Prevention.
70. Centers for Disease Control and Prevention (CDCP) (2003) Appendix B. Immunizations Strongly Recommended for Health-Care Personnel. In Morbidity and Mortality Weekly Report 52(RR17); 65. CDC.
71. Centers for Disease Control (CDC) (1988) Assessing exposures of health-care personnel to aerosols of ribavirin--California. MMWR Morb Mortal Wkly Rep 37: 560-563.
72. Seitz TA, Deitchman S (1992) Health hazard evaluation report. George Washington University Medical Center, Washington, D.C. Atlanta: National Institute for Occupational Safety and Health, Centers for Disease Control and Prevention. Evaluation Report No. 90-140.
73. Koren G, King S, Knowles S, Phillips E (2003) Ribavirin in the treatment of SARS: A new trick for an old drug? CMAJ 168: 1289-1292.
74. Decker J (1998) Health Hazard Evaluation Report. The Children`s Hospital Denver, Colorado. NIOSH Cincinnati, Ohio Report 98-00480-2688.
75. Occupational Safety & Health Administration (OSHA) (1999) Anesthetic gases: guidelines for workplace exposures. Directorate of technical support and emergency management. U.S. Department of Labor, Occupational Safety and Health Administration. 1999.
76. Shuhaiber S, Koren G (2000) Occupational exposure to inhaled anesthetic. Is it a concern for pregnant women? Can Fam Physician 46: 2391-2392.
77. National Institute for Occupational Safety and Health (NIOSH) (2004) Preventing occupational exposures to antineoplastic and other hazardous drugs in health care settings. Publication Number 2004-165. Atlanta. Centers for Disease Control and Prevention.
78. National Institute for Occupational Safety and Health (NIOSH) (2007) Waste anesthetic gases: occupational hazards in hospitals. Publication No. 2007–151. Atlanta Centers for Disease Control and Prevention.
79. Timpe EM, Motl SE, Hogan ML (2004) Environmental exposure of health care workers to category D and X medications. Am J Health Syst Pharm 61: 1556-1557, 1560-1.
80. Hood J (2008) The pregnant health care worker--an evidence-based approach to job assignment and reassignment. AAOHN J 56: 329-333.
81. National Institute for Occupational Safety and Health (NIOSH) (2006) Health hazard evaluation Report 2001-0066-3019, Morton plant hospital Dunedin, Florida. The Hazard Evaluation and Technical Assistance Branch. Health Hazard Evaluation Report No. 2001-0066-3019. Centers for Disease Control and Prevention. Atlanta, p 29.
82. Spearman J, Tsavellas G, Nichols P (2007) Current attitudes and practices towards diathermy smoke. Ann R Coll Surg Engl 89: 162-165.
83. Ball K (2010) Compliance with surgical smoke evacuation guidelines: implications for practice. AORN J 92: 142-149.
84. Eickmann U, Falcy M, Fokuhl I, Rüegger M, Bloch M (2011) Fumée chirurgicales. Risques et mesures de prévention. Dossier médico-technique, TC 137. INRS 127: 383-395.
85. Hamel M, Coulumbe M, Rhainds M (2011) Évaluation des risques associés à l’exposition aux fumées chirurgicales. Centre Hospitalier Universitaire de Québec. 03-11: 1-22p.
86. Sanderson C (2012) Surgical smoke. J Perioper Pract 22: 122-128.
87. McMartin KI, Chu M, Kopecky E, Einarson TR, Koren G (1998) Pregnancy outcome following maternal organic solvent exposure: a meta-analysis of epidemiologic studies. Am J Ind Med 34: 288-292.
88. Wennborg H, Bonde JP, Stenbeck M, Olsen J (2002) Adverse reproduction outcomes among employees working in biomedical research laboratories. Scand J Work Environ Health 28: 5-11.
89. Laslo-Baker D, Barrera M, Knittel-Keren D, Kozer E, Wolpin J, et al. (2004)
Child neurodevelopmental outcome and maternal occupational exposure to solvents. Arch Pediatr Adolesc Med 158: 956-961.
90. Till C, Westall CA, Koren G, Nulman I, Rovet JF (2005) Vision abnormalities in young children exposed prenatally to organic solvents. Neurotoxicology 26: 599-613.
91. Ahmed P, Jaakkola JJ (2007) Exposure to organic solvents and adverse pregnancy outcomes. Hum Reprod 22: 2751-2757.
92. Barber RW, Parkin A, Goldstone KE (2003) Is it safe to work with iodine-131 if you are pregnant? A risk assessment for nuclear medicine staff involved with cleaning and decontamination. Nucl Med Commun 24: 571-574.
93. Gomez-Palacios M, Terrón JA, Domínguez P, Vera DR, Osuna RF (2005) Radiation doses in the surroundings of patients undergoing nuclear medicine diagnostic studies. Health Phys 89: S27-34.
94. Teschke K, Chow Y, Chung J, Ratner P, Spinelli J, et al. (2008) Estimating nurses’ exposures to ionizing radiation: the elusive gold standard. J Occup Environ Hyg 5: 75-84.
95. Brent RL (2009) Saving lives and changing family histories: appropriate counseling of pregnant women and men and women of reproductive age, concerning the risk of diagnostic radiation exposures during and before pregnancy. Am J Obstet Gynecol 200: 4-24.
96. Guyton AC (1991) Unit VII Respiration. In Textbook of Medical Physiology, pp 401-443. 8th ed., W.B. Saunders Company Harcourt Brace Jovanovich Inc., Philadelphia, PA.
97. Mosteller RD (1987) Simplified calculation of body-surface area. N Engl J Med 317: 1098.
98. Livingstone MB, Strain JJ, Prentice AM, Coward WA, Nevin GB, et al. (1991) Potential contribution of leisure activity to the energy expenditure patterns of sedentary populations. Br J Nutr 65: 145-155.
99. Ravussin E, Burnand B, Schutz Y, Jéquier E (1985) Energy expenditure before and during energy restriction in obese patients. Am J Clin Nutr 41: 753-759.
100. Prentice AM, Black AE, Coward WA, Davies HL, Goldberg GR, et al. (1986) High levels of energy expenditure in obese women. Br Med J (Clin Res Ed) 292: 983-987.
101. Goldberg GR, Prentice AM, Coward WA, Davies HL, Murgatroyd PR, et al. (1991) Longitudinal assessment of the components of energy balance in well-nourished lactating women. Am J Clin Nutr 54: 788-798.
102. Haggarty P, McNeill G, Manneh MK, Davidson L, Milne E, et al. (1994) The influence of exercise on the energy requirements of adult males in the UK. Br J Nutr 72: 799-813.
103. Hibbert JM, Broemeling LD, Isenberg JN, Wolfe RR (1994) Determinants of free-living energy expenditure in normal weight and obese women measured by doubly labeled water. Obes Res 2: 44-53.
104. Welle S, Forbes GB, Statt M, Barnard RR, Amatruda JM (1992) Energy expenditure under free-living conditions in normal-weight and overweight women. Am J Clin Nutr 55: 14-21.
105. Butte NF, Treuth MS, Mehta NR, Wong WW, Hopkinson JM, et al. (2003) Energy requirements of women of reproductive age. Am J Clin Nutr 77: 630-638.
106. Butte NF, Wong WW, Treuth MS, Ellis KJ, O’Brian Smith E (2004) Energy requirements during pregnancy based on total energy expenditure and energy deposition. Am J Clin Nutr 79: 1078-1087.
107. Das SK, Saltzman E, McCrory MA, Hsu LK, Shikora SA, et al. (2004) Energy expenditure is very high in extremely obese women. J Nutr 134: 1412-1416.
108. Snodgrass JJ, Leonard WR, Tarskaia LA, Schoeller DA (2006) Total energy expenditure in the Yakut (Sakha) of Siberia as measured by the doubly labeled water method. Am J Clin Nutr 84: 798-806.
109. Institute of Medicine (IOM) (2002) Appendix I: doubly labeled water data used to predict energy expenditure. In Dietary Reference Intakes for Energy, Carbohydrate, Fiber, Fat, Fatty Acids, Cholesterol, Protein, and Amino Acids (Macronutrients), Food and Nutrition Board. National Academies Press, Washington, DC. pp. 839-802.
110. Prentice AM, Goldberg GR, Davies HL, Murgatroyd PR, Scott W (1989) Energy-sparing adaptations in human pregnancy assessed by whole-body calorimetry. Br J Nutr 62: 5-22.

Page 12 of 14
Volume 6 • Issue 3 • 1000306J Clinic ToxicolISSN: 2161-0495 JCT, an open access journal
Citation: Brochu P, Facetti Socol A (2016) Ventilation Rates during the Aggregate Daytime Activities of Working Females in Hospitals: Data before their Pregnancy and at their 9th, 22nd and 36th Week of Gestation. J Clinic Toxicol 6: 306. doi:10.4172/2161-0495.1000306
111. Ferrannini E (1988) The theoretical bases of indirect calorimetry: a review. Metabolism 37: 287-301.
112. Bursztein S, Elwyn D, Askanazi J, Kinney J (1989) Energy Metabolism, Indirect Calorimetry, and Nutrition. Williams & Wilkins. Philadelphia, PA 10: 177.
113. Butte NF, King JC (2005) Energy requirements during pregnancy and lactation. Public Health Nutr 8: 1010-1027.
114. Butte NF, Wong WW, Garza C (1989) Energy cost of growth during infancy. Proc Nutr Soc 48: 303-312.
115. Butte NF, Wong WW, Hopkinson JM, Heinz CJ, Mehta NR, et al. (2000) Energy requirements derived from total energy expenditure and energy deposition during the first 2 y of life. Am J Clin Nutr 72: 1558-1569.
116. California Environmental Protection Agency (Cal/EPA) (2012) Chapter 3: Daily Breathing Rates. In Air Toxics Hot Spots Program Risk Assessment Guidelines. Technical Support Document for Exposure Assessment and Stochastic Analysis. Scientific Review Panel Draft 3: 1-55.
117. Livesey G, Elia M (1988) Estimation of energy expenditure, net carbohydrate utilization, and net fat oxidation and synthesis by indirect calorimetry: evaluation of errors with special reference to the detailed composition of fuels. Am J Clin Nutr 47: 608-628.
118. Moon JK, Vohra FA, Valerio Jimenez OS, Puyau MR, Butte NF (1995) Closed-loop control of carbon dioxide concentration and pressure improves response of room respiration calorimeters. J Nutr 125: 220-228.
119. Durnin JV, McKillop FM, Grant S, Fitzgerald G (1987) Energy requirements of pregnancy in Scotland. Lancet 2: 897-900.
120. Forsum E, Kabir N, Sadurskis A, Westerterp K (1992) Total energy expenditure of healthy Swedish women during pregnancy and lactation. Am J Clin Nutr 56: 334-342.
121. Goldberg GR, Prentice AM, Coward WA, Davies HL, Murgatroyd PR, et al. (1993) Longitudinal assessment of energy expenditure in pregnancy by the doubly labeled water method. Am J Clin Nutr 57: 494-505.
122. Spaaij CJK (1993) The efficiency of energy metabolism during pregnancy and lactation in well-nourished Dutch women. The University of Wageningen, Wageningen, Netherlands.
123. de Groot LC, Boekholt HA, Spaaij CK, van Raaij JM, Drijvers JJ, et al. (1994) Energy balances of healthy Dutch women before and during pregnancy: limited scope for metabolic adaptations in pregnancy. Am J Clin Nutr 59: 827-832.
124. Williams MA, Aurora SK, Frederick IO, Qiu C, Gelaye B, et al. (2010) Sleep duration, vital exhaustion and perceived stress among pregnant migraineurs and non-migraineurs. BMC Pregnancy Childbirth 10: 72.
125. Ko H, Shin J, Kim MY, Kim YH, Lee J, et al. (2012) Sleep disturbances in Korean pregnant and postpartum women. J Psychosom Obstet Gynaecol 33: 85-90.
126. Kızılırmak A, Timur S, Kartal B (2012) Insomnia in pregnancy and factors related to insomnia. ScientificWorldJournal 2012: 197093.
127. Shiga K, Murata K, Kodama H (2012) Effects of sleep disturbances during pregnancy on cardiac autonomic modulation in the resting state. Int J Gynaecol Obstet 119: 149-153.
128. Cugell DW, Frank NR, Gaensler EA, Badger T (1953) Pulmonary function in pregnancy. I. Serial observations in normal women. Am Rev Tuberc 67: 568-597.
129. Lotgering FK, Struijk PC, van Doorn MB, Spinnewijn WE, Wallenburg HC (1995) Anaerobic threshold and respiratory compensation in pregnant women. J Appl Physiol 78: 1772-1777.
130. Lovelady CA, Meredith CN, McCrory MA, Nommsen LA, Joseph LJ, et al. (1993) Energy expenditure in lactating women: a comparison of doubly labeled water and heart-rate-monitoring methods. Am J Clin Nutr 57: 512-518.
131. Panter-Brick C (1993) Seasonality of energy expenditure during pregnancy and lactation for rural Nepali women. Am J Clin Nutr 57: 620-628.
132. Dufour DL, Reina JC, Spurr G (1999) Energy intake and expenditure of free-living, pregnant Colombian women in an urban setting. Am J Clin Nutr 70: 269-276.
133. Kopp-Hoolihan LE, van Loan MD, Wong WW, King JC (1999) Longitudinal assessment of energy balance in well-nourished, pregnant women. Am J Clin Nutr 69: 697-704.
134. Butte NF, Hopkinson JM, Ellis KJ, Wong WW, Smith EO (1997) Changes in fat-free mass and fat mass in postpartum women: a comparison of body composition models. Int J Obes Relat Metab Disord 21: 874-880.
135. Butte NF, Hopkinson JM, Mehta N, Moon JK, Smith EO (1999) Adjustments in energy expenditure and substrate utilization during late pregnancy and lactation. Am J Clin Nutr 69: 299-307.
136. Butte NF, Wong WW, Hopkinson JM (2001) Energy requirements of lactating women derived from doubly labeled water and milk energy output. J Nutr 131: 53-58.
137. Turell DJ, Alexander JK (1964) Experimental evaluation of weir’s formula for estimating metabolic rate in man. J Appl Physiol 19: 946-948.
138. Melzer K, Schutz Y, Boulvain M, Kayser B (2009) Pregnancy-related changes in activity energy expenditure and resting metabolic rate in Switzerland. Eur J Clin Nutr 63: 1185-1191.
139. Thongprasert K, Tanphaichitre V, Valyasevi A, Kittigool J, Durnin JV (1987) Energy requirements of pregnancy in rural Thailand. Lancet 2: 1010-1012.
140. van Raaij JM, Schonk CM, Vermaat-Miedema SH, Peek ME, Hautvast JG (1991) Energy cost of lactation, and energy balances of well-nourished Dutch lactating women: reappraisal of the extra energy requirements of lactation. Am J Clin Nutr 53: 612-619.
141. Prentice AM, Prentice A (1988) Energy costs of lactation. Annu Rev Nutr 8: 63-79.
142. Prentice AM, Poppitt SD, Goldberg GR, Murgatroyd PR, Black AE, et al. (1994) Energy balance in pregnancy and lactation. In: (ed.) Allen L, King J, Lonnerdal B; Nutrient regulation in pregnancy, lactation and infant growth. New York: Plenum Press:11-26.
143. Poppitt SD, Prentice AM, Jéquier E, Schutz Y, Whitehead RG (1993) Evidence of energy sparing in Gambian women during pregnancy: a longitudinal study using whole-body calorimetry. Am J Clin Nutr 57: 353-364.
144. Poppitt SD, Prentice AM, Goldberg GR, Whitehead RG (1994) Energy-sparing strategies to protect human fetal growth. Am J Obstet Gynecol 171: 118-125.
145. Spaaij CJ, van Raaij JM, de Groot LC, van der Heijden LJ, Boekholt HA, et al. (1994) Effect of lactation on resting metabolic rate and on diet- and work-induced thermogenesis. Am J Clin Nutr 59: 42-47.
146. Butte NF, Barbosa L, Villalpando S, Wong WW, Smith EO (1997) Total energy expenditure and physical activity level of lactating Mesoamerindians. J Nutr 127: 299-305.
147. Federal Register Notices (1980) November 28. 45: 79318-79379.
148. United State Environmental Protection Agency (USEPA) (1992) Guideline for exposure assessment; Notice. Fed. Reg., 104: 22888-22938.
149. Paustenbach DJ (2001) The practice of exposure assessment. In Principles and methods of toxicology. A.W. Hayes, 4: 387-448.
150. Organization for economic eo-operation and development (OECD) (2010) Join Meeting of the chemicals committee and the working party on chemicals, pesticides and biotechnology. Inter-organization program for the sound management of chemicals. Environment, health and Safety Publications. Series on Emission Scenario Documents Number 26. Series on Emission Scenario Documents Blending of Fragrance Oils into commercial and consumer products. Environment directorate, Paris. ENV/JM/MONO (2010) 38.
151. Dockery DW, Speizer FE, Stram DO, Ware JH, Spengler JD, et al. (1989) Effects of inhalable particles on respiratory health of children. Am Rev Respir Dis 139: 587-594.
152. Dockery DW, Pope CA 3rd, Xu X, Spengler JD, Ware JH, et al. (1993) An association between air pollution and mortality in six U.S. cities. N Engl J Med 329: 1753-1759.
153. Dockery DW, Cunningham J, Damokosh AI, Neas LM, Spengler JD, et al. (1996) Health effects of acid aerosols on North American children: respiratory symptoms. Environ Health Perspect 104: 500-505.
154. Wilson NK, Kuhlman MR, Chuang JC, Mack GA, Howes JE (1989) A quiet sampler for the collection of semivolatile organic pollutants in indoor air. Environ Sci Technol 23: 1112-1116.
155. Calabrese EJ, Stanek EJ, Gilbert CE (1991) Evidence of soil-pica behaviour and quantification of soil ingested. Hum Exp Toxicol 10: 245-249.

Page 13 of 14
Volume 6 • Issue 3 • 1000306J Clinic ToxicolISSN: 2161-0495 JCT, an open access journal
Citation: Brochu P, Facetti Socol A (2016) Ventilation Rates during the Aggregate Daytime Activities of Working Females in Hospitals: Data before their Pregnancy and at their 9th, 22nd and 36th Week of Gestation. J Clinic Toxicol 6: 306. doi:10.4172/2161-0495.1000306
156. Calabrese EJ, Stanek EJ 3rd, Pekow P, Barnes RM (1997) Soil ingestion estimates for children residing on a superfund site. Ecotoxicol Environ Saf 36: 258-268.
157. Gagné D (1994) Blood lead levels in Noranda children following removal of smelter-contaminated yard soil. Can J Public Health 85: 163-166.
158. Bascom R, Bromberg P, Costa D, Devlin R, Dockery D, et al. (1996) Health effects of outdoor pollution. Part 1. Am J Respir Crit Care Med. 153: 3-50.
159. Bascom R, Bromberg P, Costa D, Devlin R, Dockery D, et al. (1996) Health effects of outdoor pollution. Part 2. Am J Respir Crit Care Med 153: 477-498.
160. Braun-Fahrländer C, Vuille JC, Sennhauser FH, Neu U, Künzle T, et al. (1997) Respiratory health and long-term exposure to air pollutants in Swiss schoolchildren. SCARPOL Team. Swiss Study on Childhood Allergy and Respiratory Symptoms with Respect to Air Pollution, Climate and Pollen. Am J Respir Crit Care Med 155: 1042-1049.
161. Brunekreef B, Janssen NA, de Hartog J, Harssema H, Knape M, et al. (1997) Air pollution from truck traffic and lung function in children living near motorways. Epidemiology 8: 298-303.
162. Burnett RT, Cakmak S, Brook JR, Krewski D (1997) The role of particulate size and chemistry in the association between summertime ambient air pollution and hospitalization for cardiorespiratory diseases. Environ Health Perspect 105: 614-620.
163. Burnett RT, Cakmak S, Brook JR (1998) The effect of the urban ambient air pollution mix on daily mortality rates in 11 Canadian cities. Can J Public Health 89: 152-156.
164. Burnett R, Ma R, Jerrett M, Goldberg MS, Cakmak S, et al. (2001) The spatial association between community air pollution and mortality: a new method of analyzing correlated geographic cohort data. Environ Health Perspect 109 Suppl 3: 375-380.
165. Chen PC, Lai YM, Wang JD, Yang CY, Hwang JS, et al. (1998) Adverse effect of air pollution on respiratory health of primary school children in Taiwan. Environ Health Perspect 106: 331-335.
166. Walker S, Griffin S (1998) Site-specific data confirm arsenic exposure predicted by the U.S. Environmental Protection Agency. Environ Health Perspect 106: 133-139.
167. Abbey DE, Nishino N, McDonnell WF, Burchette RJ, Knutsen SF, et al. (1999) Long-term inhalable particles and other air pollutants related to mortality in nonsmokers. Am J Respir Crit Care Med 159: 373-382.
168. Waliszewski SM, Aguirre AA, Infanzón RM, Siliceo J (2000) Carry-over of persistent organochlorine pesticides through placenta to fetus. Salud Publica Mex 42: 384-390.
169. Josephson J (2002) The slow poisoning of Bangladesh: metals in drinking water. Environ Health Perspect 110: A690-691.
170. Coyle D, Stieb D, Burnett RT, DeCivita P, Krewski D, et al. (2003) Impact of particulate air pollution on quality-adjusted life expectancy in Canada. J Toxicol Environ Health A 66: 1847-1863.
171. Huijbregts MA, Lundi S, McKone TE, van de Meent D (2003) Geographical scenario uncertainty in generic fate and exposure factors of toxic pollutants for life-cycle impact assessment. Chemosphere 51: 501-508.
172. Matthies M, Berding V, Beyer A (2004) Probabilistic uncertainty analysis of the European Union system for the evaluation of substances multimedia regional distribution model. Environ Toxicol Chem 23: 2494-2502.
173. Bohlin P, Jones KC, Tovalin H, Strandberg B (2008) Observations on persistent organic pollutants in indoor and outdoor air using passive polyurethane foam samplers. Atmos Environ 42: 7234-7241.
174. Dórea JG (2008) Persistent, bioaccumulative and toxic substances in fish: human health considerations. Sci Total Environ 400: 93-114.
175. Engelhaupt E (2008) Happy birthday, Love Canal. Environ Sci Technol 42: 8179-8186.
176. Austin AA, Fitzgerald EF, Pantea CI, Gensburg LJ, Kim NK, et al. (2011) Reproductive outcomes among former Love Canal residents, Niagara Falls, New York. Environ Res 111: 693-701.
177. Sarigiannis DA, Karakitsios SP, Gotti A, Liakos IL, Katsoyiannis A (2011) Exposure to major volatile organic compounds and carbonyls in European indoor environments and associated health risk. Environ Int 37: 743-765.
178. Sofuoglu SC, Aslan G, Inal F, Sofuoglu A (2011) An assessment of indoor air concentrations and health risks of volatile organic compounds in three primary schools. Int J Hyg Environ Health 214: 36-46.
179. United State Environmental Protection Agency (USEPA) (2011) Exposure Factors Handbook: 2011. National Center for Environmental Assessment. Office of Research and Development. U.S. Environmental Protection Agency, Washington, DC 20460. EPA/600/R-09/052F. 1466 pages.
180. Zhou J, You Y, Bai Z, Hu Y, Zhang J, et al. (2011) Health risk assessment of personal inhalation exposure to volatile organic compounds in Tianjin, China. Sci Total Environ 409: 452-459.
181. Banerjee S, Annesi-Maesano I (2012) Spatial variability of indoor air pollutants in schools. A multilevel approach. Atmos Environ 61: 558-561.
182. Balbus JM, Barouki R, Birnbaum LS, Etzel RA, Gluckman PD Sr, et al. (2013) Early-life prevention of non-communicable diseases. Lancet 381: 3-4.
183. Elnabris KJ, Muzyed SK, El-Ashgar NM (2013) Heavy metal concentrations in some commercially important fishes and their contribution to heavy metals exposure in Palestinian people of Gaza Strip (Palestine). J Assn Arab Univ Basic Appl Sci 13: 44-51.
184. Rivas I, Viana M, Moreno T, Pandolfi M, Amato F, et al. (2014) Child exposure to indoor and outdoor air pollutants in schools in Barcelona, Spain. Environ Int 69: 200-212.
185. Marku K (2015) China’s choking cocktail: cleaning up city and indoor air will require a deeper understanding of the unprecedented chemical reactions between pollutants. Nature 526: 497.
186. Whitehead TP, Metayer C, Ward MH, Colt JS, Gunier RB, et al. (2014) Persistent organic pollutants in dust from older homes: learning from lead. Am J Public Health 104: 1320-1326.
187. Whitehead TP, Crispo Smith S, Park JS, Petreas MX Rappaport SM, et al. (2015) Concentrations of Persistent Organic Pollutants in California Children’s Whole Blood and Residential Dust. Environ Sci Technol 49: 9331-9340.
188. Olguín MT, Deng S (2016) Ce-Fe-modified zeolite-rich tuff to remove Ba(2+)-like (226)Ra(2+) in presence of As(V) and F(-) from aqueous media as pollutants of drinking water. J Hazard Mater 302: 341-350.
189. Lauwerys RR, Haufroid V, Hoet P, Lison D (2007) Toxicologie industrielle et intoxications professionnelles. 5e édition. Elsevier Masson SAS, Cedex, 1259.
190. Abraini JH, Campo P, Kriem B, Rostain JC, Vincent A (1999) Sigmoidal admission rate-dependence of toluene narcotic potency in rats: comparison with nitrous oxide. Neurosci Lett 275: 211-214.
191. Griffin S, Wyllie SG, Markham J (1999) Determination of octanol-water partition coefficient for terpenoids using reversed-phase high-performance liquid chromatography. J Chromatogr A 864: 221-228.
192. Finizio A, Vighi M, Sandroni D (1997) Determination of n-octanol/water partition coefficient (Kow) of pesticide critical review and comparison of methods. Chemosphere 34: 131-161.
193. Jandacek RJ, Tso P (2001) Factors affecting the storage and excretion of toxic lipophilic xenobiotics. Lipids 36: 1289-1305.
194. Klotz WL, Schure MR, Foley JP (2001) Determination of octanol-water partition coefficients of pesticides by microemulsion electrokinetic chromatography. J Chromatogr A 930: 145-154.
195. Paschke A, Manz M, Schüürmann G (2001) Application of different RP-HPLC methods for the determination of the octanol/water partition coefficient of selected tetrachlorobenzyltoluenes. Chemosphere 45: 721-728.
196. EWG (Environmental Working Group) (2005) Body Burden – The Pollution in People.
197. Jia Z, Mei L, Lin F, Huang S, Killion RB (2003) Screening of octanol-water partition coefficients for pharmaceuticals by pressure-assisted microemulsion electrokinetic chromatography. Journal of Chromatography A 1007: 03-208.
198. Hyman M (2007) Managing Biotransformation: The Metabolic, Genomic, and Detoxification Balance Points. Systems Biology, Toxins, Obesity, and Functional Medicine. 13th International Symposium of The Institute for Functional Medicine, 134-139.
199. Han SY, Qiao JQ, Zhang YY, Yang LL, Lian HZ, et al. (2011) Determination of n-octanol/water partition coefficient for DDT-related compounds by RP-HPLC with a novel dual-point retention time correction. Chemosphere 83: 131-136.

Page 14 of 14
Volume 6 • Issue 3 • 1000306J Clinic ToxicolISSN: 2161-0495 JCT, an open access journal
Citation: Brochu P, Facetti Socol A (2016) Ventilation Rates during the Aggregate Daytime Activities of Working Females in Hospitals: Data before their Pregnancy and at their 9th, 22nd and 36th Week of Gestation. J Clinic Toxicol 6: 306. doi:10.4172/2161-0495.1000306
200. Lind L, Lind PM (2012) Can persistent organic pollutants and plastic-associated chemicals cause cardiovascular disease? J Intern Med 271: 537-553.
201. Shi JQ, Cheng J, Wang FY, Flamm A, Wang ZY, et al. (2012) Acute toxicity and n-octanol/water partition coefficients of substituted thiophenols: Determination and QSAR analysis. Ecotoxicol Environ Safe 78: 134-141.
202. Ruelle P (2000) The n-octanol and n-hexane/water partition coefficient of environmentally relevant chemicals predicted from the mobile order anddisorder (MOD) thermodynamics. Chemosphere 40: 457-512.
203. Cecchini M, LoPresti V (2007) Drug residues store in the body followingcessation of use: impacts on neuroendocrine balance and behavior--use of the Hubbard sauna regimen to remove toxins and restore health. Med Hypotheses 68: 868-879.
204. Scheytt T, Mersmann P, Lindstädt R, Heberer T (2005) 1-octanol/water partition coefficients of 5 pharmaceuticals from human medical care: carbamazepine, clofibric acid, diclofenac, ibuprofen, and propyphenazone. Water Air Soil Poll 165: 3-11.
205. Mo H, Balko KM, Colby DA (2010) A practical deuterium-free NMR methodfor the rapid determination of 1-octanol/water partition coefficients of pharmaceutical agents. Bioorg Med Chem Lett 20: 6712-6715.
206. Lee S, Kang SI, Lim JL, Huh YJ, Kim KS, et al. (2011) Evaluating controllability of pharmaceuticals and metabolites in biologically engineered processes,using corresponding octanol-water distribution coefficient. Ecological Engineering 37: 1595-1600.
207. Shawahna R, Rahman NU (2011) Evaluation of the use of partitioncoefficients and molecular surface properties as predictors of drug absorption : a provisional biopharmaceutical classification of the list of national essential medicines of Pakistan. Daru 19: 83-99.
208. Alp E, Bijl D, Bleichrodt RP, Hansson B, Voss A (2006) Surgical smoke andinfection control. J Hosp Infect 62: 1-5.
209. Al Sahaf OS, Vega-Carrascal I, Cunningham FO, McGrath JP, Bloomfield FJ (2007) Chemical composition of smoke produced by high-frequencyelectrosurgery. Ir J Med Sci 176: 229-232.
210. Fan JK, Chan FS, Chu KM (2009) Surgical smoke. Asian J Surg 32: 253-257.
211. Sear JW (2009) What makes a molecule an anaesthetic? Studies on themechanisms of anaesthesia using a physicochemical approach. Br J Anaesth 103: 50-60.
212. Weston R, Stephenson RN, Kutarski PW, Parr NJ (2009) Chemicalcomposition of gases surgeons are exposed to during endoscopic urologicalresections. Urology 74: 1152-1154.
213. Lewin JM, Brauer JA, Ostad A (2011) Surgical smoke and the dermatologist.J Am Acad Dermatol 65: 636-641.
214. Pelletier C, Doucet E, Imbeault P, Tremblay A (2002) Associations betweenweight loss-induced changes in plasma organochlorine concentrations, serum T3 concentration, and resting metabolic rate. Toxicological Sciences 67: 46-51.
215. Kostial K, DekaniÄ D, Telisman S, Blanusa M, DuvanciÄ S, et al. (1991)Dietary calcium and blood lead levels in women. Biol Trace Elem Res 28:181-185.
216. Silbergeld EK (1991) Lead in bone: implications for toxicology duringpregnancy and lactation. Environ Health Perspect 91: 63-70.
217. Goldman RH, White R, Kales SN, Hu H (1994) Lead poisoning frommobilization of bone stores during thyrotoxicosis. Am J Ind Med 25: 417-424.
218. Han S, Pfizenmaier DH, Garcia E, Eguez ML, Ling M, et al. (2000) Effects oflead exposure before pregnancy and dietary calcium during pregnancy on fetal development and lead accumulation. Environ Health Perspect 108: 527-531.
219. Hertz-Picciotto I, Schramm M, Watt-Morse M, Chantala K, Anderson J, et al. (2000) Patterns and determinants of blood lead during pregnancy. Am JEpidemiol 152: 829-837.
220. Schell LM, Denham M, Stark AD, Gomez M, Ravenscroft J, et al. (2003)Maternal blood lead concentration, diet during pregnancy, and anthropometry predict neonatal blood lead in a socioeconomically disadvantaged population. Environ. Health Perspect 111: 195-200.
221. Schildkraut JM, Demark-Wahnefried W, De Voto E, Hughes C, Laseter JL,et al. (1999) Environmental contaminants and body fat distribution. CancerEpidemiol Biomarkers Prev 8: 179-183.
222. Hsieh PS (2011) Obesity and Carcinogenesis. J Cancer Res Pract 27: 242-256.
223. Cullen A, Ferguson A (2012) Perioperative management of the severely obese patient: a selective pathophysiological review. Can J Anaesth 59: 974-996.
224. Ellenhorn MJ, Barceloux DG (1988) Medical Toxicology. Diagnosis andTreatment of Human poisoning. Elsevier London.
225. Scialli AR (1992) A clinical guide to reproductive and developmental toxicology. CRC Press Inc. pp 1-27.
226. Perera FP, Tang D, Tu YH, Cruz LA, Borjas M, et al. (2004) Biomarkersin maternal and newborn blood indicate heightened fetal susceptibility toprocarcinogenic DNA damage. Environ Health Perspect 112: 1133-1136.
227. Boivin JF (1997) Risk of spontaneous abortion in women occupationallyexposed to anaesthetic gases: a meta-analysis. Occup Environ Med 54: 541-548.
228. Hoerauf K, Lierz M, Wiesner G, Schroegendorfer K, Lierz P, et al. (1999)Genetic damage in operating room personnel exposed to isoflurane and nitrous oxide. Occup Environ Med 56: 433-437.
229. Perera F, Herbstman J (2011) Prenatal environmental exposures, epigenetics, and disease. Reprod Toxicol 31: 363-373.
230. Valanis B, Vollmer WM, Steele P (1999) Occupational exposure toantineoplastic agents: self-reported miscarriages and stillbirths among nurses and pharmacists. J Occup Environ Med 41: 632-638.
231. Selevan SG, Lindbohm ML, Hornung RW, Hemminki K (1985) A study ofoccupational exposure to antineoplastic drugs and fetal loss in nurses. N Engl J Med 313: 1173-1178.
232. McDonald AD, McDonald JC, Armstrong B, Cherry NM, Côté R, et al. (1988)Fetal death and work in pregnancy. Br J Ind Med 45: 148-157.
233. Guirguis SS, Pelmear PL, Roy ML, Wong L (1990) Health effects associatedwith exposure to anaesthetic gases in Ontario hospital personnel. Br J IndMed 47: 490-497.
234. Quansah R (2011) Occupational determinants of adverse pregnancyoutcomes: work in healthcare and exposure to welding fumes and metal dust. Thesis. University of Birmingham.
235. Hemminki K, Kyyrönen P, Lindbohm ML (1985) Spontaneous abortionsand malformations in the offspring of nurses exposed to anaesthetic gases,cytostatic drugs, and other potential hazards in hospitals, based on registered information of outcome. J Epidemiol Community Health 39: 141-147.