Current-Oriented Swimming by Jellyfish and Its Role in Bloom Maintenance
28
Report Current-Oriented Swimming by Jellyfish and Its Role in Bloom Maintenance Highlights d Wild Rhizostoma jellyfish were equipped for the first time with accelerometers d These jellyfish can orientate their movements with respect to currents d They can actively swim countercurrent in response to current drift d This behavior is adaptive for jellyfish bloom maintenance and survival Authors Sabrina Fossette, Adrian Christopher Gleiss, ..., Mikhail Karpytchev, Graeme Clive Hays Correspondence [email protected] In Brief Current drift can have major and potentially negative effects on the lives of weakly swimming species in particular. Fossette et al. show that jellyfish modulate their swimming behavior in relation to current. Such oriented swimming has significant life-history benefits, such as increased bloom formation and a reduction of probability of stranding. Fossette et al., 2015, Current Biology 25, 342–347 February 2, 2015 ª2015 Elsevier Ltd All rights reserved http://dx.doi.org/10.1016/j.cub.2014.11.050
-
Upload
independent -
Category
Documents
-
view
2 -
download
0
Transcript of Current-Oriented Swimming by Jellyfish and Its Role in Bloom Maintenance

Report
Current-Oriented Swimming by Jellyfish and Its Rolein Bloom Maintenance
Highlights
d Wild Rhizostoma jellyfish were equipped for the first time
with accelerometers
d These jellyfish can orientate their movements with respect to
currents
d They can actively swim countercurrent in response to current
drift
d This behavior is adaptive for jellyfish bloommaintenance and
survival
Fossette et al., 2015, Current Biology 25, 342–347February 2, 2015 ª2015 Elsevier Ltd All rights reservedhttp://dx.doi.org/10.1016/j.cub.2014.11.050
Authors
Sabrina Fossette,
Adrian Christopher Gleiss, ...,
Mikhail Karpytchev, Graeme Clive Hays
In Brief
Current drift can have major and
potentially negative effects on the lives of
weakly swimming species in particular.
Fossette et al. show that jellyfish
modulate their swimming behavior in
relation to current. Such oriented
swimming has significant life-history
benefits, such as increased bloom
formation and a reduction of probability
of stranding.

Current Biology 25, 342–347, February 2, 2015 ª2015 Elsevier Ltd All rights reserved http://dx.doi.org/10.1016/j.cub.2014.11.050
ReportCurrent-Oriented Swimming by Jellyfishand Its Role in Bloom Maintenance
Sabrina Fossette,1,4,5,* Adrian Christopher Gleiss,1,4,6
Julien Chalumeau,2 Thomas Bastian,1,7
Claire Denise Armstrong,1 Sylvie Vandenabeele,1
Mikhail Karpytchev,2 and Graeme Clive Hays1,3
1Swansea Laboratory for Animal Movement, Biosciences,College of Science, Swansea University, Singleton Park, SA28PP Swansea, UK2Universite de la Rochelle, UFR Sciences, LIENSs UMR 7266,17000 La Rochelle, France3Centre for Integrative Ecology, School of Life andEnvironmental Sciences, Deakin University, Warnambool,VIC 3280, Australia
Summary
Cross-flows (winds or currents) affect animal movements[1–3]. Animals can temporarily becarriedoff courseor perma-
nently carried away from their preferred habitat by drift de-
pending on their own traveling speed in relation to that ofthe flow [1]. Animals able to only weakly fly or swim will be
the most impacted (e.g., [4]). To circumvent this problem, an-imalsmust be able to detect the effects of flow on their move-
ments and respond to it [1, 2]. Here, we show that a weaklyswimming organism, the jellyfish Rhizostoma octopus, can
orientate its movements with respect to currents and thatthis behavior is key to themaintenance of blooms and essen-
tial to reduce theprobabilityofstranding.Wecombined insituobservationswithfirst-timedeploymentof accelerometerson
free-ranging jellyfish and simulated the behavior observed inwild jellyfish within a high-resolution hydrodynamic model.
Our results show that jellyfish can actively swim counter-current in response to current drift, leading to significant
life-history benefits, i.e., increased chance of survival andfacilitated bloom formation. Current-oriented swimming may
be achievedby jellyfish either directly detecting current shearacross their body surface [5] or indirectly assessing drift di-
rection using other cues (e.g., magnetic, infrasound). Ourcoupled behavioral-hydrodynamic model provides new evi-
dence that current-oriented swimming contributes to jellyfishbeing able to form aggregations of hundreds tomillions of in-
dividuals for up to several months, which may have substan-tial ecosystem and socioeconomic consequences [6, 7]. It
also contributes to improve predictions of jellyfish blooms’magnitude and movements in coastal waters.
Results
Scyphozoan jellyfish form aggregations of hundreds to mil-lions of individuals mostly in coastal areas [8], where they
face the risk of stranding if carried onshore by currents. Aggre-gations play a critical role in the ecology of jellyfish by facili-tating reproduction and reducing predation [9]. Aggregationsmay be caused by the combination of the drifting action of acurrent and the active swimming behavior of the jellyfish them-selves [10], but the fine-scale mechanism is not well under-stood. Previous studies have suggested that jellyfish mightchange their swimming direction with respect to current orien-tation [11–17]; however, in most cases, currents were notmeasured in situ but were simply inferred, making any re-ported relationship ambiguous. Directional swimming againstvertical shears has only been demonstrated in the jellyfishAurelia aurita [5], but the benefits of such oriented swimmingin jellyfish are unknown. Here we tackled both of these issues:for the first time, jellyfish swimming direction in changing hor-izontal flows and the adaptive value of this behavior were as-sessed. Massive aggregations of the jellyfish Rhizostomaoctopus are observed every summer in the Pertuis Breton,Bay of Biscay, France (Figure 1) [19]. Eighteen of these jellyfishwere captured at sea and equipped with acceleration data log-gers recording diving behavior, activity, and body orientationfor amaximumof 6.6 hr (Figure 1 and Table S1 available online;see the Supplemental Experimental Procedures). Jellyfishspent on average 14.0% (SD = 20.6%, range = 0%–73%) oftheir time performing V-shaped dives and 82.9% (SD =21.6%, range = 19.8%–100%) swimming horizontally between0 and 2 m, independently of the state of the tide (Table S1).Accordingly, we found no significant difference in jellyfishdepth in relation to sea state (generalized additive model[GAM], tSeasate = 1.750, PSeastate = 0.083) or flow index (productof magnitude of the current and the amplitude of the presenttide; GAM, FFlowIndex = 1.447, PFlowIndex = 0.223). During theseperiods of shallow horizontal swimming, the mean bell pulsefrequency of the jellyfish was 0.80 pulses/s (SD = 0.23pulses/s; range = 0.43–1.39 pulses/s). The routine swimmingspeed (see the Supplemental Experimental Procedures) was0.05 m/s (SD = 0.02 m/s; range 0.03–0.08 m/s; Figure S1 andTable S2), i.e., an order of magnitude slower than the tidal cur-rents in the Pertuis (w20–50 cm/s). All tracked jellyfish wereactive almost continuously (mean partial dynamic body accel-eration = 0.03 g, SD = 0.02 g, range = 0.019–0.107 g; Table S2)without significant effect of sea state (p = 0.0584). However,state of the tide significantly impacted mean activity level,which peaked during slack waters (i.e., lowest flow indexvalues; GAM, FFlowIndex = 2.933, PFlowIndex = 0.008; Figure S2).As jellyfish spent most of their time swimming horizontally
close to the surface, wemeasured the instantaneous compassheadings of their longitudinal body axis and compared thesewith the direction of local currents (measured with surfacedrifting buoys). Nineteen 30 min transects were performedduring slack water (n = 7), ebb (n = 6), and flood (n = 6) tides,during which two observers used hand-held compasses to re-cord the swimming direction of 844 jellyfish passing within 3 mof the boat (mean = 44 jellyfish/transect, SD = 14; Table S3; seethe Supplemental Experimental Procedures). In all transects,the distribution of the jellyfish swimming directions was signif-icantly different from random (Rayleigh test, p < 0.05 in allcases), and in five cases the distribution was bimodal (TableS3). The correlation between the mean swimming direction
4Co-first author5Present address: Environmental Research Division, Southwest Fisheries
Science Center, National Oceanic and Atmospheric Administration/National
Marine Fisheries Service, Monterey, CA 93940, USA6Present address: Hopkins Marine Station, Stanford University, 120 Ocean
View Boulevard, Pacific Grove, CA 93950, USA7Present address: Universite du Littoral Cote d’Opale, LOG UMR 8187,
MREN, 32 Avenue Foch, 62930 Wimereux, France
*Correspondence: [email protected]

of the jellyfish and the mean current heading along each tran-sect was statistically significant on the ebb tide (circular-circu-lar correlation, r = 0.463, p < 0.05, n = 5 pairedmeasures; TableS3) and on the flood tide (r = 0.508, p < 0.05, n = 7 paired mea-sures, Table S3), but not during slack water (r = 0.108, p > 0.05,n = 9 paired measures; Table S3).
On the ebb tide, the mean jellyfish swimming direction wascountercurrent (mean jellyfish direction = 89.2�, SD = 61.8�;n = 241 individuals, r = 0.559, Rayleigh test, p < 0.01; versusmean current direction = 268.2�, SD = 11.9�; n = 4 buoys, r =0.979, p < 0.01; Figure 2A). On the flood tide, the jellyfishwere either swimming with (80.6�, SD = 38.8�, n = 118 individ-uals, r = 0.795, p < 0.01) or against (273.0�, SD = 34.8�, n = 155,r = 0.832, p < 0.01) the current (106.2�, SD = 15.1�; n = 6 buoys,r = 0.966, p < 0.01; Figure 2B). Jellyfish swimming against thecurrent were observed in areas significantly shallower (meanbottom depth = 5.87 m, SD = 0.41 m) than areas where jellyfishwere swimming with the current (8.06 m, SD = 1.72 m, Mann-Whitney test, p = 0.0259, n = 7 transects). During slack water,mean current direction (115.9�, SD = 68.2�, n = 7 buoys, r =0.492, p > 0.05) and mean jellyfish direction (96.9�, SD =79.8�, r = 0.379, n = 330 individuals, p < 0.05) were more vari-able (Figure 2C). Therefore, jellyfish orientation seems to bemodulated by tidal currents.
The impact of this current-oriented swimming behavior bythe jellyfish on bloommaintenance, spatial dynamics, and indi-vidual survival was investigated by running a particle-trackingmodel simulating the movements of virtual jellyfish within amodeled velocity field [20]. The hydrodynamic circulation inthe Pertuis is well studied ([21] and references therein), result-ing in accurate models for the area. A total of 4,800 virtual par-ticles were released in the area (Figure 3) and tracked for90 days (see the Supplemental Experimental Procedures).Our goal was to understand how, once a bloom has formed,it can remain in an area, disappear from this area, and/orspread toward other areas (i.e., ‘‘apparent’’ blooms [10]) viatransport by currents and jellyfish’s behavior. Accordingly,we assumed that jellyfish dispersed from the north of the Per-tuis Breton, where bloomswere observed during the aerial sur-vey preceding our fieldwork and where the boat transectswere performed (Figures 1 and 3).
We ran two scenarios: (1) the virtual jellyfish were passiveand (2) the virtual jellyfish swam against the current at a swim-ming speed of 0.05 m/s on both the flood and ebb tides and in
random directions during slack water (see the SupplementalExperimental Procedures). In both scenarios, the spatial dis-tribution of the virtual jellyfish was relatively similar, but pas-sive virtual jellyfish dispersed further south (w45.8�N) thanactive virtual jellyfish (w46.2�N). The distribution pattern ofactive virtual jellyfish matched more closely historical and cur-rent distributional patterns of real R. octopus as documentedby boat and/or aerial surveys (Figures 1 and 3). An aerial sur-vey preceding our fieldwork revealed a total of 12 jellyfishblooms in the Pertuis (Figures 1 and 3). During the 3-monthsimulation, active virtual jellyfish aggregated in seven of these12 areas, compared to five for passive virtual jellyfish(Figure S3A).To quantitatively compare dispersal, we computed an index
of aggregation following [22]. This index varied throughout thesimulation for both scenarios with peaks, suggesting the for-mation of large, transient aggregations (Figure 4A). It washigher for active jellyfish than for passive jellyfish on 81% ofthe days, indicating that active virtual jellyfish were more oftenaggregated than passive virtual jellyfish. Finally, we found asignificant difference in the incidence of jellyfish stranding(Figure 4B). After 1 month, w4% of passive particles werestranded compared to zero active particles. At the end of the3-month simulation, 43.2% of passive particles were strandedcompared to 3.7% of active particles (see the SupplementalExperimental Procedures for results from models underdifferent wind forcing conditions and Figures S3 and S4).
Discussion
In situ observations and first-time deployment of accelerome-ters on free-ranging jellyfish reveal that the jellyfishRhizostomaoctopus can actively change its swimming direction in res-ponse to current drift and changing current flows. Therefore,jellyfish orientation seems to be modulated by tidal currents,with a likely scenario of direct current detection. This resultcorroborates previous studies that described directional swim-ming in other jellyfish species [11–17], suggesting that this abil-ity may be widespread in bloom-forming jellyfish. Behavioralsimulations within a high-resolution hydrodynamic modelalso demonstrate that there may be a strong adaptive benefitto this current-oriented swimming behavior by keeping bloomforming species in particular areas rather than dispersed orwashed ashore.
Figure 1. Rhizostoma octopus, Distribution and
Abundance
(A) Distribution and abundance of scyphozoan
jellyfish Rhizostoma octopus in the Pertuis
Breton and Pertuis d’Antioche, Bay of Biscay,
France, estimated during an aerial survey per-
formed on August 22, 2011. The size of the co-
lor-coded dots is proportional to the number of
jellyfish observed within 5 min survey periods.
The dotted gray areas indicate areas where jelly-
fish aggregationswere observed during boat sur-
veys fromApril to September 1983 (datamodified
from [18]). The solid black box shows the area
where the boat transects were performed in
August and September 2011.
(B) Picture of a scyphozoan jellyfish, Rhizostoma
octopus, equipped with a triaxial acceleration
data logger recording diving behavior, activity,
and body orientation. The float allows the whole
package to be close to neutral buoyancy.
See also Tables S1 and S2.
343

There is significant interest in understanding the ecosystemimpacts of jellyfish blooms, which are being reported morefrequently around the world [7, 23, 24]. Our results show thatcurrent-oriented swimming is key to the maintenance of theseblooms, as hypothesized by [10, 17], and will allow blooms topersist even in high-flow areas. For larger jellyfish, not only doindividuals actively swim, but this behavior is consistentacross individuals and hence influences the distribution ofblooms as a whole.
A similar mechanism has been described for the accumu-lation of smaller zooplankton species, e.g., copepods andmollusks, at frontal zones in coastal waters. These animalsmaintain their depth in the water column by detecting andswimming against upwelling and downwelling currents [25],but not horizontal flows like the jellyfish in our study. Howdepth and current direction are sensed is currently unknownformost of these species. Copepodsmay detect flowdirectionas a fluid velocity difference between their sensory setae posi-tioned along their antennae and the ambient water [26–28] andcan exhibit positive rheotaxis (i.e., countercurrent swimming)in other contexts [29]. This behavior may reduce passive driftto help maintain position in a river, for instance [29]. Somefish can also perform positive rheotaxis by using visual, olfac-tory, and sometimes tactile cues [30–32].
A possible mechanism for the jellyfish’s ability to orientatetheir movements with respect to currents may thus be thedirect detection of current shears at the air-water interfaceacross the body surface (see also [10]). The jellyfish in ourstudy spent >80% of their time swimming horizontally at thesurface, a position that may allow them to sense these shears.Evidence for this mechanism exists in the jellyfish Aureliaaurita [5]; under laboratory conditions, individual jellyfishorient directionally against vertical velocity shears via asym-metric bell pulsing. In a similar way, high-flying nocturnal in-sects may use microturbulences within the airstream as amechanism for direct wind detection [33]. In addition, these in-sects are better at orientating in the downwind direction whenmigrating in layers and flying at the altitude of maximum windspeed [34], suggesting that flight altitude, or swimming depthin our case, may affect the ability of animals to detect thesecues.
Several other mechanisms could help jellyfish indirectlyassess their drift and current direction. They may detect theorbital motion of waves, which can be linked with the directionof water flow at the surface layer, as previously described inhatchling turtles (e.g., [35]). Relative changes in the magneticfield could also provide jellyfish with an indication of their driftdirection as described in other species (e.g., [36, 37]). Whetherjellyfish can detect such changes over half a tidal cycle and a
horizontal displacement of a few kilometers remains to betested. Jellyfish may also use infrasounds to orientate them-selves, as shown in birds (e.g., [38]) and several marine spe-cies (review in [39]). The statocysts, organs located at themargin of the jellyfish’s bell, enable jellyfish to detect gravity[40], sense vibrations [41], and potentially sense pressure var-iations [42] and may therefore contribute to the ability of jelly-fish to directly or indirectly detect current flow. Rhizostomaejellyfish do not possess ocelli (i.e., photoreception organs[43]) and are therefore unlikely to use the sunlight as a visualcue as suggested in other scyphozoan and cubozoan species(e.g., [44, 45]).Our results show that current-oriented swimming as a
response to current drift may have important life-history con-sequences for jellyfish. Such a response to current drift alsoexists in fish and crustacean larvae or juveniles, where itmay also have consequences in terms of population dy-namics influencing survival, connectivity, and recruitment(e.g., [46–50]). Oriented swimming in hatchling turtles, usinggeomagnetic cues [36] and/or by direct detection of currentdrift [51], may also allow them to remain within warm-watercurrents favorable for growth and survival and avoid driftinginto areas where thermal conditions may pose threats to theirsurvival [52, 53]. It seems, therefore, that diverse weaklyswimming animals (i.e., swimming speed varying betweena few millimeters per second to tens of centimeters per sec-ond), but also weakly flying animals such as insects [33, 34],whose movements have often been assumed to be dictatedexclusively by flows may, in fact, employ similar strategies,i.e., active flow-oriented movements and potentially directflow sensing, to mitigate flow drift and improve their chanceof survival and/or of reaching favorable habitat. In contrast,animals that can outswim or outfly the flow, such as migratingadult sea turtles or migrating birds, may not show strong and/or immediate response to current drift as their travelingspeed may allow them to compensate for drift and/or reorien-tate later in their journey. For instance, loggerhead turtlesmay use a goal-oriented strategy while crossing the Mediter-ranean Sea. They do not seem to detect current flow, andconsequently drift off course, reorienting later in the journey[3]. Birds migrating across oceans may also follow a constantcompass bearing and do not compensate for wind driftuntil nearer to the goal (e.g., [1, 2, 54]). In both cases, thesestrategies do not prevent migrants from eventually reachingtheir goal, nor do they directly impact their survival, as wouldbe the case for slow-moving species. Even though manydifferent strategies exist among fast-moving species [1],having continuous access to navigational cues to be able tohead toward their goal may be more important than being
A B C Figure 2. Jellyfish Swimming Directions in Rela-
tion to Current Directions
Circular diagrams of the swimming directions of
jellyfish Rhizostoma octopus (black) and the cur-
rent direction (blue) measured on the ebb tide (n =
6 transects, n = 4 buoys, and n = 241 jellyfish; A),
the flood tide (n = 6 transects, n = 6 buoys, and n =
273 jellyfish; B) and the slack water (n = 7 tran-
sects, n = 7 buoys, and n = 330 jellyfish; C) in
the Pertuis Breton, Bay of Biscay, France. Direc-
tions are shown by individual dots stacked in 10�
intervals of total circular range. In each figure, the
mean swimming direction of the jellyfish and the mean current direction are depicted as black and blue arrows, respectively. On the flood tide, the distri-
bution of the jellyfish swimming directions was bimodal, hence the two black arrows. The arrow length is proportional to the magnitude of the mean vector r
(i.e., a measure of the variation around the mean value), with the radius of the circle corresponding to r = 1. See also Table S3.
344

able to continuously detect flow drift throughout their journey[2]. The impact of flow drift, and ultimately the costs or ben-efits associated with it, may thus largely depend on the ratioof animal speed to flow speed [1]. Selective pressure on an-imals to adopt strategies to detect and respond to flow driftmay be stronger in slow-moving than in fast-moving species[2, 4].
The predicted distribution of the active virtual jellyfish inthe Pertuis was in good agreement with historical and currentdistributional patterns. To date, the three other attempts tomodel the formation and dispersal of jellyfish blooms haveassumed that jellyfish drift passively [19, 55, 56]. Thesemodels have provided useful information about jellyfish ecol-ogy and patterns of connectivity between populations, butour study has revealed that including the empirically derivedbehavior of jellyfish in particle-tracking models can signi-ficantly modify predicted patterns of distribution and abun-dance. Similarly, including the behavior of small flyinganimals (insects) in particle-tracking models may have verysubstantial effects on the distance and direction of move-ment of these animals, and thus on their population dynamics(e.g., [57]). Achieving more realistic predictions of jellyfishdispersal would improve our ability to forecast the time of
Latit
ude
(°N
)
Longitude (°W)
DAY 21
1.61 1.43 1.25 1.61 1.43 1.25
Num
ber of particles
A B
C D
E F
G H
DAY 21
100
250
2545.92
46.30
5 km
45.92
46.30
45.92
46.30
45.92
46.30
DAY 42
DAY 63
DAY 42
DAY 63
DAY 84 DAY 84
100
250
25
100
250
25
100
250
25
PASSIVE ACTIVE Figure 3. Computer Simulations of Active versus
Passive Virtual Jellyfish Movements
Distribution of 4,800 particles (i.e., virtual jellyfish)
with either a passive, non-oriented swimming
behavior (A, C, E, and G) or an active, oriented
swimming behavior (B, D, F, and H) tracked for
90 days in the Pertuis Breton and Pertuis
d’Antioche, Bay of Biscay, France. The particles
were initially released within the black doted
box at a rate of 40 particles every 3 hr for the first
15 days. The colors indicate the number of parti-
cles within each 1 3 1 km cell throughout the
simulation. The purple cells indicate a bloom
(i.e., >250 particles/cell in one day). The red stars
indicate the location of the 12 major jellyfish
blooms observed during an aerial survey at the
start of this study’s fieldwork in the Pertuis Breton
and Pertuis d’Antioche (cf. Figure 1). A purple cell
overlapping a red star indicates that the model
correctly predicted the location of one of the 12
observed blooms. The model was forced with
tides and a west wind of 4 m/s (see the Supple-
mental Experimental Procedures for details).
See also Figure S3.
arrival or the magnitude of harmful jelly-fish blooms near major tourist areas[56], aquaculture facilities [58], or po-wer plants [6]. Understanding theswimming and orientation behavior ofthese organisms is therefore imperativeif negative socioeconomic impacts areto be reduced.
To conclude, our results show thatjellyfish exhibit complex current-modu-lated orientation strategies that playimportant roles in bloom maintenance.The fact that free-living jellyfish canactively change their swimming direc-tion in response to current drift andchanging current flows poses ques-tions of how widespread this ability is
among other slow-moving taxa and what the adaptive signif-icance of this strategy might be for each taxon. Such ques-tions are essential for understanding the evolution of animalorientation strategies.
Supplemental Information
Supplemental Information includes Supplemental Experimental Proce-
dures, four figures, and three tables and can be found with this article online
at http://dx.doi.org/10.1016/j.cub.2014.11.050.
Author Contributions
G.C.H., S.F., and A.C.G. conceived the study; S.F., G.C.H., T.B., and S.V.
completed the fieldwork; J.C. and M.K. ran the particle tracking models;
S.F., G.C.H., A.C.G., and C.D.A. led the data analysis and interpretation;
and S.F., A.C.G., and G.C.H. led the writing with contributions from all
authors.
Acknowledgments
G.C.H. was supported by the Climate Change Consortium for Wales (C3W),
the Natural Environment Research Council of the UK (NERC), and the Esmee
Fairbairn Foundation. J.C. was supported through a PhD Fellowship from
the Charente-Maritime General Council (France).
345

Received: September 2, 2014
Revised: October 27, 2014
Accepted: November 19, 2014
Published: January 22, 2015
References
1. Chapman, J.W., Klaassen, R.H., Drake, V.A., Fossette, S., Hays, G.C.,
Metcalfe, J.D., Reynolds, A.M., Reynolds, D.R., and Alerstam, T.
(2011). Animal orientation strategies for movement in flows. Curr. Biol.
21, R861–R870.
2. McLaren, J.D., Shamoun-Baranes, J., Dokter, A.M., Klaassen, R.H., and
Bouten, W. (2014). Optimal orientation in flows: providing a benchmark
for animal movement strategies. J. R. Soc. Interface 11, 20140588.
3. Hays, G.C., Christensen, A., Fossette, S., Schofield, G., Talbot, J., and
Mariani, P. (2014). Route optimisation and solving Zermelo’s navigation
problem during long distance migration in cross flows. Ecol. Lett. 17,
137–143.
4. Alerstam, T., Chapman, J.W., Backman, J., Smith, A.D., Karlsson, H.,
Nilsson, C., Reynolds, D.R., Klaassen, R.H., and Hill, J.K. (2011).
Convergent patterns of long-distance nocturnal migration in noctuid
moths and passerine birds. Proc. Biol. Sci. 278, 3074–3080.
5. Rakow, K.C., and Graham, W.M. (2006). Orientation and swimming me-
chanics by the scyphomedusa Aurelia sp. in shear flow. Limnol.
Oceanogr. 51, 1097–1106.
6. Purcell, J.E., Uye, S.I., and Lo, W.T. (2007). Anthropogenic causes of jel-
lyfish blooms and their direct consequences for humans: a review. Mar.
Ecol. Prog. Ser. 350, 153–174.
7. Richardson, A.J., Bakun, A., Hays, G.C., and Gibbons, M.J. (2009). The
jellyfish joyride: causes, consequences and management responses to
a more gelatinous future. Trends Ecol. Evol. 24, 312–322.
8. Lilley, M.K.S., Beggs, S., Doyle, T., Hobson, V., Stromberg, K.H.P., and
Hays, G. (2011). Global patterns of epipelagic gelatinous zooplankton
biomass. Mar. Biol. 158, 2429–2436.
9. Hamner, W.M., and Dawson, M.N. (2009). A review and synthesis on the
systematics and evolution of jellyfish blooms: advantageous aggrega-
tions and adaptive assemblages. In Jellyfish Blooms: Causes,
Consequences, and Recent Advances, K.A. Pitt and J.E. Purcell, eds.
(Dordrecht: Springer), pp. 161–191.
10. Graham, W.M., Pages, F., and Hamner, W.M. (2001). A physical context
for gelatinous zooplankton aggregations: a review. Hydrobiologia 451,
199–212.
11. Zavodnik, D. (1987). Spatial aggregations of the swarming jellyfish
Pelagia noctiluca (Scyphozoa). Mar. Biol. 94, 265–269.
12. Costello, J., Klos, E., and Ford, M. (1998). In situ time budgets of the scy-
phomedusae Aurelia aurita, Cyanea sp., and Chrysaora quinquecirrha.
J. Plankton Res. 20, 383–391.
13. Malej, A. (1989). Behaviour and trophic ecology of the jellyfish Pelagia
noctiluca (Forsskal, 1775). J. Exp. Mar. Biol. Ecol. 126, 259–270.
14. Albert, D.J. (2009). Aurelia labiata (Scyphozoa) jellyfish in Roscoe Bay:
their spatial distribution varies with population size and their behaviour
changes with water depth. J. Sea Res. 61, 140–143.
15. Shanks, A.L., and Graham, W.M. (1987). Orientated swimming in the jel-
lyfish Stomolopus meleagris L. Agassiz (Scyphozoan: Rhizostomida).
J. Exp. Mar. Biol. Ecol. 108, 159–169.
16. Graham,W.M.,Martin, D.L., andMartin, J.C. (2003). In situ quantification
and analysis of large jellyfish using a novel video profiler. Mar. Ecol.
Prog. Ser. 254, 129–140.
17. Graham, W.M. (1994). The physical oceanography and ecology of up-
welling shadows. PhD thesis (Santa Cruz: University of California).
18. Fay, S., and Husson, B. (1983). Repartition, frequence et regime alimen-
taire de la meduse Rhizostoma pulmo. Master’s thesis (Rennes: Ecole
Nationale Superieure Agronomique de Rennes), p. 67.
19. Lee, P.L., Dawson,M.N., Neill, S.P., Robins, P.E., Houghton, J.D., Doyle,
T.K., and Hays, G.C. (2013). Identification of genetically and oceano-
graphically distinct blooms of jellyfish. J. R. Soc. Interface 10, 20120920.
20. Chalumeau, J. (2014). Modelisation hydrodynamique du transport des
meduses en environnement cotier: le cas des Pertuis Charentais. PhD
thesis (La Rochelle: Universite de La Rochelle), p. 203.
21. Guizien, K., Dupuy, C., Ory, P., Montanie, H., Hartmann, H., Chatelain,
M., and Karpytchev, M. (2014). Microorganism dynamics during a rising
tide: disentangling effects of resuspension andmixingwith offshorewa-
ters above an intertidal mudflat. J. Mar. Syst. 129, 178–188.
22. Krebs, C.J. (1999). Ecological Methodology, Second Edition (New York:
Harper Collins).
23. Brotz, L., Cheung, W.W., Kleisner, K., Pakhomov, E., and Pauly, D.
(2012). Increasing jellyfish populations: trends in large marine ecosys-
tems. Hydrobiologia 690, 3–20.
24. Condon, R.H., Duarte, C.M., Pitt, K.A., Robinson, K.L., Lucas, C.H.,
Sutherland, K.R., Mianzan, H.W., Bogeberg, M., Purcell, J.E., Decker,
M.B., et al. (2013). Recurrent jellyfish blooms are a consequence of
global oscillations. Proc. Natl. Acad. Sci. USA 110, 1000–1005.
Figure 4. Aggregation Index and Stranding Rate of Active versus Passive
Virtual Jellyfish
(A) Aggregation index of 4,800 particles (i.e., virtual jellyfish) tracked for
90 days in the Pertuis Breton and Pertuis d’Antioche, Bay of Biscay, France.
The aggregation index isdefinedas the ratio between the varianceof thenum-
ber of particles per cell and the average number of particles per cell. A total of
2,538grid cellswereconsidered for the calculation of the index. The size of the
grid was based on the maximum extent of the jellyfish dispersion across all
simulations.When the index is high, theparticles are aggregated.When the in-
dex is low, the particles are dispersed. At the beginning of the simulation, the
index isclose tozeroandsteadily increasesasparticles are gradually released
in themodel at a rate of 40 particles every 3 hr over the first 15 days. The index
starts fluctuatingafter the15thday,whenall particleshavebeenreleased in the
model. Black line, aggregation index of particles with a passive, non-oriented
swimmingbehavior; gray line, aggregation indexof particleswith anactive ori-
entedswimmingbehavior. Themodelwas forcedwith tidesandawestwindof
4 m/s (see the Supplemental Experimental Procedures for details).
(B) Number of stranded particles (i.e., virtual jellyfish) in percentage through-
out the simulation. A total of 4,800 particles were tracked for 90 days in the
Pertuis Breton and Pertuis d’Antioche, Bay of Biscay, France. The number
of stranded particles was counted at every time step. Black line, number of
stranded particles with a passive, non-oriented swimming behavior; gray
line, number of stranded particleswith an active oriented swimmingbehavior.
In both simulations, themodel was forcedwith tides and a west wind of 4m/s
(see the Supplemental Experimental Procedures for details).
See also Figure S4.
346

25. Genin, A., Jaffe, J.S., Reef, R., Richter, C., and Franks, P.J. (2005).
Swimming against the flow: a mechanism of zooplankton aggregation.
Science 308, 860–862.
26. Strickler, J.R., and Bal, A.K. (1973). Setae of the first antennae of the
copepod Cyclops scutifer (Sars): their structure and importance. Proc.
Natl. Acad. Sci. USA 70, 2656–2659.
27. Fields, D.M., and Yen, J. (2002). Fluid mechanosensory stimulation of
behaviour from a planktonic marine copepod, Euchaeta rimana
Bradford. J. Plankton Res. 24, 747–755.
28. Kiørboe, T., Saiz, E., and Visser, A. (1999). Hydrodynamic signal percep-
tion in the copepod Acartia tonsa. Mar. Ecol. Prog. Ser. 179, 97–111.
29. Richardson, W.B. (1992). Microcrustacea in flowing water: experimental
analysis of washout times and a field test. Freshw. Biol. 28, 217–230.
30. Baker, C., and Montgomery, J. (1999). The sensory basis of rheotaxis in
the blind Mexican cave fish, Astyanax fasciatus. J. Comp. Physiol. A
184, 519–527.
31. Montgomery, J., Carton, G., Voigt, R., Baker, C., and Diebel, C. (2000).
Sensory processing of water currents by fishes. Philos. Trans. R. Soc.
Lond. B Biol. Sci. 355, 1325–1327.
32. Gardiner, J.M., and Atema, J. (2007). Sharks need the lateral line to
locate odor sources: rheotaxis and eddy chemotaxis. J. Exp. Biol.
210, 1925–1934.
33. Reynolds, A.M., Reynolds, D.R., Smith, A.D., and Chapman, J.W. (2010).
A single wind-mediated mechanism explains high-altitude ‘non-goal
oriented’ headings and layering of nocturnally migrating insects. Proc.
Biol. Sci. 277, 765–772.
34. Aralimarad, P., Reynolds, A.M., Lim, K.S., Reynolds, D.R., and
Chapman, J.W. (2011). Flight altitude selection increases orientation
performance in high-flying nocturnal insect migrants. Anim. Behav.
82, 1221–1225.
35. Lohmann, K., Swartz, A., and Lohmann, C. (1995). Perception of ocean
wave direction by sea turtles. J. Exp. Biol. 198, 1079–1085.
36. Putman, N.F., Endres, C.S., Lohmann, C.M., and Lohmann, K.J. (2011).
Longitude perception and bicoordinate magnetic maps in sea turtles.
Curr. Biol. 21, 463–466.
37. Chernetsov, N., Kishkinev, D., andMouritsen, H. (2008). A long-distance
avian migrant compensates for longitudinal displacement during spring
migration. Curr. Biol. 18, 188–190.
38. Hagstrum, J.T. (2013). Atmospheric propagation modeling indicates
homing pigeons use loft-specific infrasonic ‘map’ cues. J. Exp. Biol.
216, 687–699.
39. Sand, O., and Karlsen, H.E. (2000). Detection of infrasound and linear
acceleration in fishes. Philos. Trans. R. Soc. Lond. B Biol. Sci. 355,
1295–1298.
40. Sotje, I., Neues, F., Epple, M., Ludwig, W., Rack, A., Gordon, M., Boese,
R., and Tiemann, H. (2011). Comparison of the statolith structures of
Chironex fleckeri (Cnidaria, Cubozoa) and Periphylla periphylla
(Cnidaria, Scyphozoa): a phylogenetic approach. Mar. Biol. 158, 1149–
1161.
41. Horridge, G. (1966). Some recently discovered underwater vibration re-
ceptors in invertebrates. In Some Contemporary Studies in Marine
Science, H. Barnes, ed. (London: Allen and Unwin), pp. 395–405.
42. Rice, A. (1964). Observations on the effects of changes of hydrostatic
pressure on the behaviour of some marine animals. J. Mar. Biol.
Assoc. U. K. 44, 163–175.
43. Russell, F.S. (1970). The Medusae of the British Isles. II. Pelagic
Scyphozoa with a Supplement to the First Volume on Hydromedusae
(Cambridge: Cambridge University Press).
44. Hamner, W., Hamner, P., and Strand, S. (1994). Sun-compass migration
by Aurelia aurita (Scyphozoa): population retention and reproduction in
Saanich Inlet, British Columbia. Mar. Biol. 119, 347–356.
45. Garm, A., Oskarsson, M., and Nilsson, D.-E. (2011). Box jellyfish use
terrestrial visual cues for navigation. Curr. Biol. 21, 798–803.
46. Shanks, A.L., and Eckert, G.L. (2005). Population persistence of
California Current fishes and benthic crustaceans: a marine drift
paradox. Ecol. Monogr. 75, 505–524.
47. Hogan, J.D., Thiessen, R.J., Sale, P.F., and Heath, D.D. (2012). Local
retention, dispersal and fluctuating connectivity among populations of
a coral reef fish. Oecologia 168, 61–71.
48. Condie, S.A., Mansbridge, J.V., andCahill, M.L. (2011). Contrasting local
retention and cross-shore transports of the East Australian Current and
the Leeuwin Current and their relative influences on the life histories of
small pelagic fishes. Deep Sea Res. Part II Top. Stud. Oceanogr. 58,
606–615.
49. Fiksen, Ø., Jørgensen, C., Kristiansen, T., Vikebø, F., and Huse, G.
(2007). Linking behavioural ecology and oceanography: larval behaviour
determines growth, mortality and dispersal. Mar. Ecol. Prog. Ser. 347,
195–205.
50. Werner, F.E., Page, F.H., Lynch, D.R., Loder, J.W., Lough, R.G., Perry,
R., Greenberg, D.A., and Sinclair, M.M. (1993). Influences of mean
advection and simple behavior on the distribution of cod and haddock
early life stages on Georges Bank. Fish. Oceanogr. 2, 43–64.
51. Kobayashi, D.R., Farman, R., Polovina, J.J., Parker, D.M., Rice, M., and
Balazs, G.H. (2014). ‘‘Going with the flow’’ or not: evidence of positive
rheotaxis in oceanic juvenile loggerhead turtles (Caretta caretta) in the
South Pacific Ocean Using Satellite Tags and Ocean Circulation Data.
PLoS ONE 9, e103701.
52. Scott, R., Marsh, R., and Hays, G.C. (2011). A little movement orientated
to the geomagnetic field makes a big difference in strong flows. Mar.
Biol. 159, 481–488.
53. Putman, N.F., Verley, P., Shay, T.J., and Lohmann, K.J. (2012).
Simulating transoceanic migrations of young loggerhead sea turtles:
merging magnetic navigation behavior with an ocean circulation model.
J. Exp. Biol. 215, 1863–1870.
54. Williams, T., and Williams, J. (1990). The orientation of transoceanic mi-
grants. In Bird Migration: Physiology and Ecophysiology, E. Gwinner,
ed. (New York: Springer-Verlag), pp. 7–21.
55. Moon, J.H., Pang, I.C., Yang, J.Y., and Yoon,W.D. (2010). Behavior of the
giant jellyfishNemopilemanomurai in theEastChina Sea andEast/Japan
Seaduring the summer of 2005: a numericalmodel approach using a par-
ticle-tracking experiment. J. Mar. Syst. 80, 101–114.
56. Berline, L., Zakardjian, B., Molcard, A., Ourmieres, Y., and Guihou, K.
(2013). Modeling jellyfish Pelagia noctiluca transport and stranding in
the Ligurian Sea. Mar. Pollut. Bull. 70, 90–99.
57. Chapman, J.W., Bell, J.R., Burgin, L.E., Reynolds, D.R., Pettersson,
L.B., Hill, J.K., Bonsall, M.B., and Thomas, J.A. (2012). Seasonal migra-
tion to high latitudes results in major reproductive benefits in an insect.
Proc. Natl. Acad. Sci. USA 109, 14924–14929.
58. Bastian, T., Stokes, D., Kelleher, J.E., Hays, G.C., Davenport, J., and
Doyle, T.K. (2011). Fisheries bycatch data provide insights into the dis-
tribution of themauve stinger (Pelagia noctiluca) around Ireland. ICES J.
Mar. Sci. 68, 436–443.
347

Current Biology, Volume 25
Supplemental Information
Current-Oriented Swimming by Jellyfish
and Its Role in Bloom Maintenance
Sabrina Fossette, Adrian Christopher Gleiss, Julien Chalumeau, Thomas Bastian,
Claire Denise Armstrong, Sylvie Vandenabeele, Mikhail Karpytchev, and Graeme Clive
Hays

Supplemental Figures
Figure S1. Related to Figure 1. Instantaneous swimming velocity of the jellyfish can be estimated through simple algebra, as the depth transducer of the tri-axial accelerometer deployed on the jellyfish records the rate of change in depth (vertical velocity “VV”) while the accelerometer can estimate the pitch angle (α), i.e. the jellyfish’s swimming direction with regard to the horizontal. See Supplemental Experimental Procedures for details.

Figure S2. Related to Figures 1 and 2. Mean activity level (i.e. Partial Dynamic Body Acceleration, see Supplemental Experimental Procedures for details) throughout the tidal cycle of 18 barrel jellyfish (Rhizostoma octopus) equipped with tri-axial accelerometers between 22 August and 2 September 2011 in the Pertuis Breton and Pertuis d’Antioche, Bay of Biscay, France. The GAM showed that there was a significant effect of the state of the tide with mean activity level peaking during slack waters (i.e. lowest flow index values; GAM, FFlowIndex = 2.933, PFlowIndex = 0.008).

Figure S3A. See legend below

Figure S3B. See legend below

Figure S3C. See legend below

Figure S3. Related to Figure 3. A- Results from model forced with tides and a west wind of 4 m.s-1 (see Supplemental Experimental Procedures for details). The maps show the locations of blooms (purple cells) formed by 4800 passive particles (i.e. passive virtual jellyfish; left panel) or 4800 active particles (i.e. active virtual jellyfish; right panel) throughout the 90-day simulation period in the Pertuis Breton and Pertuis d’Antioche, Bay of Biscay, France. The orange stars indicate the location of the twelve major jellyfish blooms observed during an aerial survey at the start of this study’s fieldwork in the Pertuis Breton and Pertuis d’Antioche (cf. Fig. 1). A purple cell overlapping a red star indicates that the model correctly predicted the location of one of the 12 observed blooms. B- Results from model forced with tides but run without wind (see Supplemental Experimental Procedures for details). Distribution of 4800 particles (i.e. virtual jellyfish) with either a passive non-oriented swimming behavior (panels A, C, E, G) or an active oriented swimming behavior (panels B, D, F, H) tracked for 90 days in the Pertuis Breton and Pertuis d’Antioche, Bay of Biscay, France. The particles were initially released within the black doted box at a rate of 40 particles every 3 hours for the first 15 days. The colours indicate the number of particles within each 1 x 1 km cell throughout the simulation. The purple cells indicate blooms. C- Results from model forced with tides and a west wind of 10 m.s-1 (see Supplemental Experimental Procedures for details). Distribution of 4800 particles (i.e. virtual jellyfish) with either a passive non-oriented swimming behavior (panels A, C, E, G) or an active oriented swimming behavior (panels B, D, F, H) tracked for 90 days in the Pertuis Breton and Pertuis d’Antioche, Bay of Biscay, France. The particles were initially released within the black doted box at a rate of 40 particles every 3 hours for the first 15 days. The colours indicate the number of particles within each 1 x 1 km cell throughout the simulation. The purple cells indicate blooms.

Figure S4. Top panel. See legend below

Figure S4. Bottom panel. See legend below

Figure S4. Related to Figure 4. Top panel. Results from model run without wind forcing (see Supplemental Experimental Procedures for details). A- Aggregation index of 4800 particles (i.e. virtual jellyfish) tracked for 90 days in the Pertuis Breton and Pertuis d’Antioche, Bay of Biscay, France. The aggregation index is defined as the ratio between the variance of the number of particles per cell and the average number of particles per cell. A total of 2538 grid cells was considered for the calculation of the index. When the index is high, the particles are aggregated. When the index is low, the particles are dispersed. At the beginning of the simulation, the index is close to zero and steadily increases as particles are gradually released in the model at a rate of 40 particles every 3 hours over the first 15 days. The index starts fluctuating after the 15th day when all particles have been released in the model. Black line: Aggregation index of particles with a passive non-oriented swimming behavior. Grey line: Aggregation index of particles with an active oriented swimming behavior. B- Number of stranded particles (i.e. virtual jellyfish) in percentage throughout the simulation. A total of 4800 particles were tracked for 90 days in the Pertuis Breton and Pertuis d’Antioche, Bay of Biscay, France. The number of stranded particles was counted at every time step. Black line: number of stranded particles with a passive non-oriented swimming behavior. Grey line: number of stranded particles with an active oriented swimming behavior. Bottom panel. Same results as top panel but from model forced with a west wind of 10 m.s-1 (see Supplemental Experimental Procedures for details). A- Aggregation index of 4800 particles (i.e. virtual jellyfish) tracked for 90 days in the Pertuis Breton and Pertuis d’Antioche, Bay of Biscay, France. Black line: Aggregation index of particles with a passive non-oriented swimming behavior. Grey line: Aggregation index of particles with an active oriented swimming behavior. B- Number of stranded particles (i.e. virtual jellyfish) in percentage throughout the simulation. Black line: number of stranded particles with a passive non-oriented swimming behavior. Grey line: number of stranded particles with an active oriented swimming behavior.
Supplemental Tables
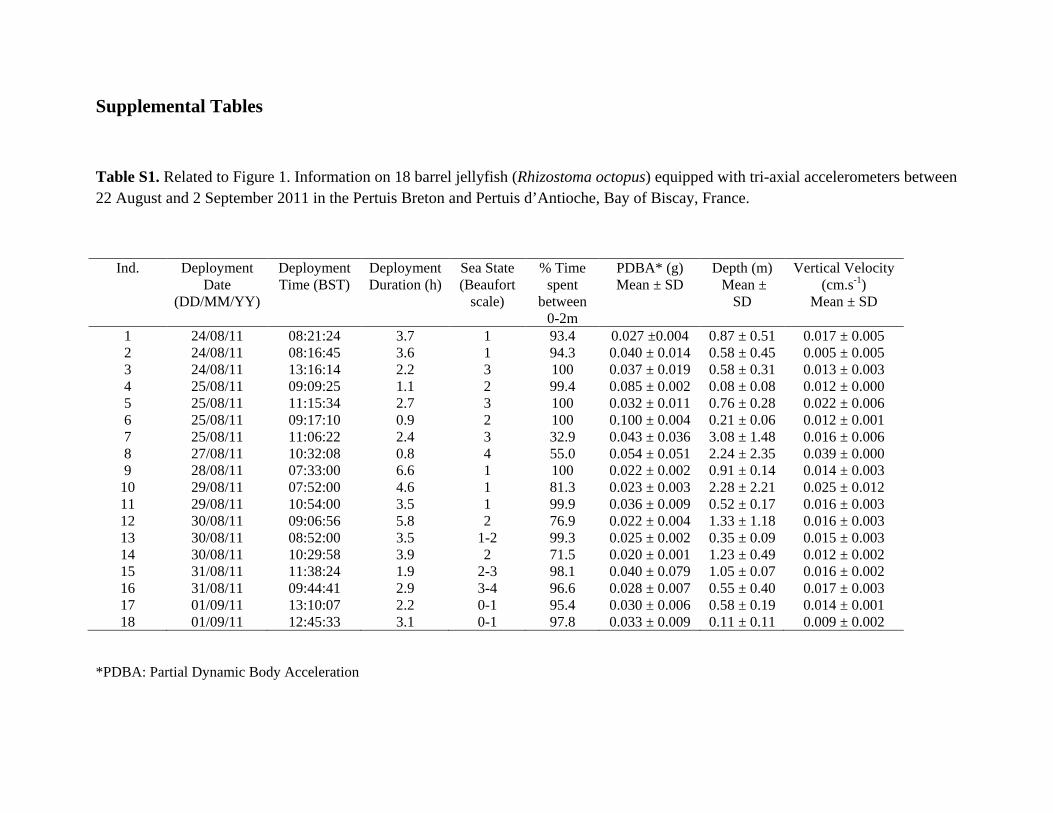
Table S1. Related to Figure 1. Information on 18 barrel jellyfish (Rhizostoma octopus) equipped with tri-axial accelerometers between 22 August and 2 September 2011 in the Pertuis Breton and Pertuis d’Antioche, Bay of Biscay, France.
*PDBA: Partial Dynamic Body Acceleration
Ind. Deployment Date
(DD/MM/YY)
Deployment Time (BST)
Deployment Duration (h)
Sea State (Beaufort
scale)
% Time spent
between 0-2m
PDBA* (g) Mean ± SD
Depth (m) Mean ±
SD
Vertical Velocity (cm.s-1)
Mean ± SD
1 24/08/11 08:21:24 3.7 1 93.4 0.027 ±0.004 0.87 ± 0.51 0.017 ± 0.005 2 24/08/11 08:16:45 3.6 1 94.3 0.040 ± 0.014 0.58 ± 0.45 0.005 ± 0.005 3 24/08/11 13:16:14 2.2 3 100 0.037 ± 0.019 0.58 ± 0.31 0.013 ± 0.003 4 25/08/11 09:09:25 1.1 2 99.4 0.085 ± 0.002 0.08 ± 0.08 0.012 ± 0.000 5 25/08/11 11:15:34 2.7 3 100 0.032 ± 0.011 0.76 ± 0.28 0.022 ± 0.006 6 25/08/11 09:17:10 0.9 2 100 0.100 ± 0.004 0.21 ± 0.06 0.012 ± 0.001 7 25/08/11 11:06:22 2.4 3 32.9 0.043 ± 0.036 3.08 ± 1.48 0.016 ± 0.006 8 27/08/11 10:32:08 0.8 4 55.0 0.054 ± 0.051 2.24 ± 2.35 0.039 ± 0.000 9 28/08/11 07:33:00 6.6 1 100 0.022 ± 0.002 0.91 ± 0.14 0.014 ± 0.003
10 29/08/11 07:52:00 4.6 1 81.3 0.023 ± 0.003 2.28 ± 2.21 0.025 ± 0.012 11 29/08/11 10:54:00 3.5 1 99.9 0.036 ± 0.009 0.52 ± 0.17 0.016 ± 0.003 12 30/08/11 09:06:56 5.8 2 76.9 0.022 ± 0.004 1.33 ± 1.18 0.016 ± 0.003 13 30/08/11 08:52:00 3.5 1-2 99.3 0.025 ± 0.002 0.35 ± 0.09 0.015 ± 0.003 14 30/08/11 10:29:58 3.9 2 71.5 0.020 ± 0.001 1.23 ± 0.49 0.012 ± 0.002 15 31/08/11 11:38:24 1.9 2-3 98.1 0.040 ± 0.079 1.05 ± 0.07 0.016 ± 0.002 16 31/08/11 09:44:41 2.9 3-4 96.6 0.028 ± 0.007 0.55 ± 0.40 0.017 ± 0.003 17 01/09/11 13:10:07 2.2 0-1 95.4 0.030 ± 0.006 0.58 ± 0.19 0.014 ± 0.001 18 01/09/11 12:45:33 3.1 0-1 97.8 0.033 ± 0.009 0.11 ± 0.11 0.009 ± 0.002

Table S2. Related to Figure 1. Information calculated from data collected by tri-axial accelerometers deployed on barrel jellyfish (Rhizostoma octopus) between 22 August and 2 September 2011 in the Pertuis Breton and Pertuis d’Antioche, Bay of Biscay, France. See supplemental Experimental Procedures for details.
Jelly ID n Offset Routine swimming Speed (95% prediction intervals)
in m.s-1 Pitch Range VV Range Statistics
2 1326 -0.5 0.050 (0.040–0.056) -55 – 48 -0.047 – 0.044 R = 0.27, F1,329=128.10
1 397 -6.0 0.032 (0.026–0.038) -45 – 63 -0.059 – 0.060 R = 0.22, F1,1326=219.31
7 7730 -3.3 0.073 (0.071–0.074) -55 – 58 -0.069 – 0.063 R = 0.62, F1,7729 = 1.23*104
8 2980 +8.6 0.035 (0.033–0.037) -74 – 90 -0.091 – 0.091 R = 0.26, F1,2979= 1.05*103
9 5120 +13.3 0.043 (0.042–0.045) -77 – 74 -0.081 – 0.107 R = 0.38, F1,5119= 2.12*103
12 5272 -8.3 0.078 (0.076–0.079) -23.8 – 28.48 -0.050 – 0.044 R = 0.60, F1,5271= 8.18*103
Grand Mean (±SD) 0.051 ± 0.019

Table S3. Related to Figure 2. Information collected during 19 boat transects conducted between 22 August and 2 September 2011 in the Pertuis Breton and Pertuis d’Antioche, Bay of Biscay, France. Transects were limited to 30 minutes in duration. The swimming directions, i.e. the instantaneous compass heading of the longitudinal body axis of jellyfish, of a total of 844 jellyfish which passed within 3 m of the boat were measured. Measurements were made to the nearest 10° with a hand-held sighting compass. The direction of the current along a transect was measured with two surface drifting buoys except for three transects where only one buoy was used. The buoys were deployed at the start of each transect and retrieved at the end allowing a mean current heading to be calculated for each transect. The distribution of the jellyfish swimming directions along a transect was tested against random with the Rayleigh test. If significantly different from random (i.e., p < 0.05), the circular mean swimming direction (Mean), the circular standard deviation (SD) and the length of mean vector (r) along the transect were calculated. For the five transects where the distributions of jellyfish swimming directions were bimodal, two sets of circular statistics are presented. For each state of the tide, the current direction varied slightly among transects depending on where we were in the bay. However the mean jellyfish swimming direction along a transect at ebb or flood tides was always correlated (positively or negatively) with the current direction along this same transect. There are therefore in our study at least two conditions in which ocean currents were in different directions but jellyfish maintained the same heading relative to current flow.

ID Transects Date Start Time (GMT)
Tide Nb of jellyfish observed
Jellyfish swimming direction (°)
Mean ± SD (r, p)
Current direction (°) Mean ± SD
1 21/08/2011 10:14:19 Ebb 24 109.1 ± 57.8° (0.601, <0.01) -* 2 21/08/2011 12:42:06 Ebb 24 36.3 ± 84.3° (0.339, <0.05) -* 3 21/08/2011 13:34:33 Slack 55 84.4 ± 95.0° (0.253, <0.05) -* 4 24/08/2011 08:15:23 Flood 46 267.3 ± 44.6° (0.738, <0.01) 83.3 ± 0.1° 5 24/08/2011 09:38:24 Flood 15
13 263.4 ± 21.7° (0.931, <0.01) 95.9 ± 36.3° (0.819, <0.01) 99.1 ± 4.6°
6 24/08/2011 11:11:09 Slack 55 147.7 ± 77.1° (0.404, <0.01) 120.0 ± 8.3° 7 24/08/2011 12:55:12 Slack 57 95.3 ± 48.9° (0.695, <0.01) 263.2 ± 1.7° 8 24/08/2011 14:02:26 Ebb 52 78.4 ± 32.7° (0.849, <0.01) 266.2 ± 0.4° 9 25/08/2011 07:22:41 Slack 60 95.6 ± 52.5° (0.657, <0.01) 79.9 ± 4.4° 10 28/08/2011 13:21:44 Flood 35 76.4 ± 43.2° (0.752, <0.01) 96.0 ± 2.4° 11 29/08/2011 07:26:13
Ebb 20
10 93.9 ± 33.5° (0.843, <0.01) 260.3 ± 30.1° (0.871, <0.01) 249.5 ± 0.1°
12 30/08/2011 07:18:25 Ebb 60 88.4 ± 29.2° (0.878, <0.01) 278.4 ± 0.1° 13 30/08/2011 08:24:25 Ebb 51 122.2 ± 91.5° (0.280, <0.05) 278.4 ± 0.1° 14 30/08/2011 10:09:01 Slack 20
21 273.3 ± 39.3° (0.790, <0.01) 103.8 ± 40.6° (0.778, <0.01) 226.3° and 104° **
15 30/08/2011 13:43:39 Flood 75 291.9 ± 79.0° (0.387, <0.01) 125.5 ± 4.9° 16 01/09/2011 10:37:06 Slack 16
9 88.7 ± 27.4° (0.892, <0.01) 318.7 ± 23.7° (0.918, <0.01) 93.8 ± 3.9°
17 01/09/2011 10:59:56 Slack 23 14
88.1 ± 30.6° (0.867, <0.01) 301.6 ± 42.2° (0.762, <0.01) 93.8 ± 3.9°
18 01/09/2011 13:58:28 Flood 35 301.2 ± 73.0° (0.989, <0.01) 109.7 ± 7.7° 19 01/09/2011 15:06:44 Flood 54 87.8 ± 88.2° (0.306, <0.01) 123.5 ± 9.2°
* The current direction was not measured along these 3 transects
**The current directions measured by the drifting buoys were opposite, hence the two values

Supplemental Experimental Procedures
1. Study site and in-situ observations
The fieldwork was conducted on scyphozoan jellyfish (Rhizostoma octopus) between 22 August and 2 September 2011 in the Pertuis Breton, Bay of Biscay, France (Fig. 1); a site known as having consistent large blooms of these jellyfish [S1]. On 22 August 2011, an aerial survey (following the method of Houghton et al. [S2]) was conducted in the Pertuis Breton and neighbouring Pertuis d’Antioche to (1) locate aggregations of jellyfish, (2) estimate jellyfish abundance, and (3) direct the location of subsequent boat-based work. The numbers of jellyfish observed within 5 min survey periods were recorded using the following categories: <10, 10 to 50, 51 to 100, 101 to 500, >500. Observations from this survey were compared with observations from previous surveys performed between April and September 1983 in the same area [S3]. The boat-based work was performed in the Pertuis Breton in three areas identified by aerial survey as high jellyfish density areas (i.e. > 100 jellyfish observed within a 5 min survey period, Fig. 1). A total of 19 transects were run with the boat while two observers, one on each side of the boat, recorded the swimming direction of the jellyfish, i.e. the instantaneous compass heading of the longitudinal body axis of jellyfish, which passed within 3 m of the boat. When at or close to the surface, the jellyfish swim horizontally and the heading of their body axis can thus be measured. Measurements were made to the nearest 10° with a hand-held sighting compass. Jellyfish were estimated to be a maximum of 2 m beneath the surface. Transects were limited to 30 minutes in duration. Seven transects were run during slack waters, six during ebb tide and six during flood tide (Table S3). The transects were uniformly distributed among the three jellyfish aggregations. For each transect, the sea state, bottom depth and time of day were recorded. The direction of the current along a transect was measured with two surface drifting buoys except for three transects where only one buoy was used. In addition, during the first three transects, the direction of the current was not directly measured. The buoys were deployed at the start of each transect and retrieved at the end allowing a mean current heading to be calculated for each transect.
The distribution of the jellyfish swimming directions along a transect was tested against random with the Rayleigh test [S4]. If significantly different from random, the mean swimming direction along the transect was calculated (Table S3). Along some transects, the jellyfish swimming directions had a bimodal distribution. A visual analysis of the circular histograms for each of these transects allowed us to distribute the jellyfish into two groups as the two modes were very clear and diametrally opposite. Therefore each group included all jellyfish with a swimming direction comprised between its mode ±90°. The subsequent mean values, small circular standard deviations and large r vectors calculated for each of the groups along the five transects with a bimodal distribution (see Table S3) supported this data partition. Each group was consequently

included as a separate data point in the circular-circular correlation and the method of doubling angles was used [S4]. Then, for each state of the tide , i.e. ebb tide, slack waters and flood tide, the mean current headings and mean jellyfish swimming directions along the transects were correlated using circular-circular correlations [S4]. Igor Pro 6.34 software was used to perform all circular statistics and the ggplot2 package in R [S5] was used to plot circular data.
2. Jellyfish tracking Tri-axial acceleration data-loggers (G6a, CEFAS Technology Ltd, http://www.cefastechnology.co.uk, 40×28×16 mm, 7.3 g in air) were attached to 18 jellyfish (Fig. 1 and Table S1, S2). The size of all tagged jellyfish was estimated to be between 0.30 and 0.40 m bell diameters corresponding to wet weights of between 5 and 10 kg [S6]. Devices were set to record all three acceleration channels at a frequency of 25 Hz (12 bit resolution, range ± 8 g, resolution 72 mg) and pressure every 1 s (0.04 m depth resolution, ±1 cm accuracy). Acceleration sensors were calibrated to g (9.8 m.s-2) by rotating devices through known angles in all three spatial planes.
Once jellyfish were spotted from boat observers, snorkel divers entered the water and deployed the tags in situ. Tags were attached to the jellyfish using a plastic cable tie tightly fitted around the peduncle that joins the swimming bell to the oral arms of the jellyfish (for details, see [S7]). A small plastic float was used to ensure that the entire attachment was close to neutral buoyancy (Fig. 1). In order to help us retrieve the tag, we attached a thin monofilament tether to the cable tie. At the other end of the tether we attached a small fishing float. The length of the tether was always twice the water depth (i.e. >20 m) to ensure the jellyfish could freely move. Tag attachment took a few seconds. After a maximum of 6 hours, jellyfish were recaptured at sea and the logger removed (Table S1). On return of tags, data were downloaded to a PC and visual exploration of each dataset was performed in Multitrace (Jensen Software Systems, Laboe, Germany) and Origin©. The loggers were re-calibrated after deployment following the method described by Wilson et al. [S8]. Acceleration data were first smoothed over a 3-s interval [S9] and then analysed following the methods described by [S8, S10] to yield partial dynamic body acceleration of the x (surge) and y (heave) planes (PDBAxy). PDBAxy constitutes a proxy for activity level (e.g. [S11, S12]). PDBAxy was averaged over 15-min intervals. Depth was also measured and averaged over 15-min intervals (Table S1). Quantification of jellyfish swimming behavior and swimming effort
Periods where jellyfish were swimming horizontally were identified based on the accelerometry signal from the three axes. Horizontal swimming was characterized by surge = 0g, heave = 1g and

sway = 0g. The proportion of time each jellyfish spent swimming horizontally in the uppermost two meters was then calculated during the whole tracking period (Table S1).
Bell pulses were manually counted from the heave axis and the instantaneous pulse frequency (IPF, i.e. number of pulses per second) was calculated. One bell pulse was defined as the time between the lowest values in the troughs on either side of a peak. Bell pulses were counted when jellyfish were swimming horizontally in the uppermost two meters. Bell pulses were counted during randomly selected bouts of horizontal swimming of 15 to 60 seconds each. An average of 5.6 bouts was analyzed per jellyfish. Bell pulses were previously visually observed, manually counted and simultaneously recorded in the field on several tag-equipped jellyfish over various lengths of time and under various sea states. This provided a comparative standard upon which the identification of actual bell pulses within the accelerometry signal could be reliably performed, and the risk of interpreting ‘noise’ in the accelerometer signal as bell pulses greatly reduced.
Estimation of jellyfish routine swimming speed
Swimming speeds (i.e. swimming velocities) of six tagged jellyfish were calculated based on jellyfish’s pitch and vertical velocity (“VV”) obtained from the acceleration and depth data. These individuals had the longest datasets allowing a reliable estimation of their swimming speed (Table S2). Accelerometers recorded the orientation of the jellyfish, therefore permitting the calculation of the swimming direction with regard to the horizontal, i.e. the jellyfish’s pitch. In addition, accelerometers recorded the rate of change in depth.
In order to avoid short-term changes in attitude (i.e. pitch) and environmental noise, such as wave action, biasing our estimates, we first down-sampled the pitch angle of the jellyfish to 10 s blocks represented by the mean. For the same period, we calculated the vertical velocity as the difference between the depth at the first and last data point in the 10 s block.
The vertical velocity can be combined with the orientation estimation (i.e. pitch) to calculate the routine swimming speed (see Fig. S1), through trigonometry:
(eqn.1)
This equation can be rearranged to take the shape of a simple linear equation (y= m * x +b) between vertical velocity (VV) and sin(Pitch) with the origin fixed as the intercept (no change in vertical velocity represents horizontal swimming with pitch angle 0°, b=0), where u represents the slope of the relationship.
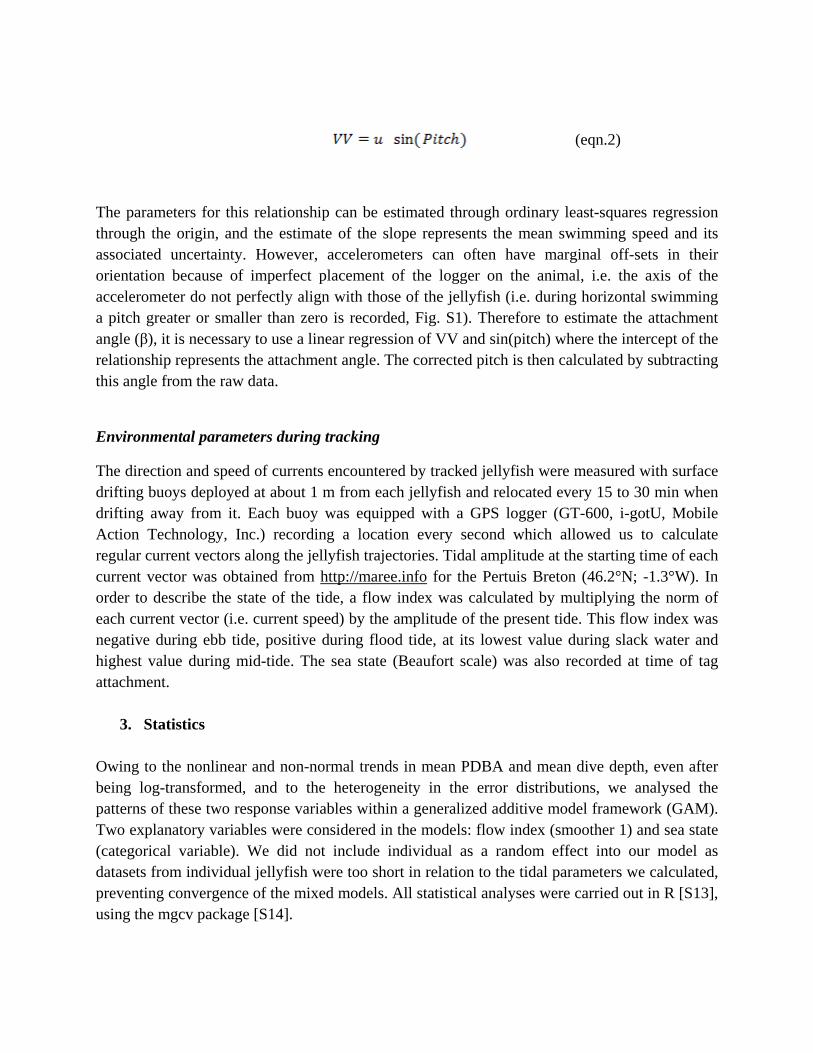
(eqn.2)
The parameters for this relationship can be estimated through ordinary least-squares regression through the origin, and the estimate of the slope represents the mean swimming speed and its associated uncertainty. However, accelerometers can often have marginal off-sets in their orientation because of imperfect placement of the logger on the animal, i.e. the axis of the accelerometer do not perfectly align with those of the jellyfish (i.e. during horizontal swimming a pitch greater or smaller than zero is recorded, Fig. S1). Therefore to estimate the attachment angle (β), it is necessary to use a linear regression of VV and sin(pitch) where the intercept of the relationship represents the attachment angle. The corrected pitch is then calculated by subtracting this angle from the raw data.
Environmental parameters during tracking
The direction and speed of currents encountered by tracked jellyfish were measured with surface drifting buoys deployed at about 1 m from each jellyfish and relocated every 15 to 30 min when drifting away from it. Each buoy was equipped with a GPS logger (GT-600, i-gotU, Mobile Action Technology, Inc.) recording a location every second which allowed us to calculate regular current vectors along the jellyfish trajectories. Tidal amplitude at the starting time of each current vector was obtained from http://maree.info for the Pertuis Breton (46.2°N; -1.3°W). In order to describe the state of the tide, a flow index was calculated by multiplying the norm of each current vector (i.e. current speed) by the amplitude of the present tide. This flow index was negative during ebb tide, positive during flood tide, at its lowest value during slack water and highest value during mid-tide. The sea state (Beaufort scale) was also recorded at time of tag attachment.
3. Statistics
Owing to the nonlinear and non-normal trends in mean PDBA and mean dive depth, even after being log-transformed, and to the heterogeneity in the error distributions, we analysed the patterns of these two response variables within a generalized additive model framework (GAM). Two explanatory variables were considered in the models: flow index (smoother 1) and sea state (categorical variable). We did not include individual as a random effect into our model as datasets from individual jellyfish were too short in relation to the tidal parameters we calculated, preventing convergence of the mixed models. All statistical analyses were carried out in R [S13], using the mgcv package [S14].

4. Numerical model In order to understand the impact of active current-orientated swimming behavior displayed by the jellyfish on bloom maintenance, we ran a particle-tracking model simulating the movements of virtual jellyfish within a modelled velocity field. The circulation in the Pertuis Breton and d’Antioche, as the whole Bay of Biscay, is dominated by the semi-diurnal tide with a tidal range of more than 6 m during spring tides. To simulate the tidal and wind-driven currents in the Pertuis Breton and d’Antioche, we used a numerical model calibrated previously for modelling tides and storm surges [S15, S16]. The model was recently refined by Chalumeau [S17] by including high-resolution bathymetry data and validating the modelled currents by the ADCP (Acoustic Doppler Current Profile) measurements of Stanisière et al. [S18]. The model solves the shallow water equations on a finite element triangular grid by using TELEMAC software [S19]. The characteristic size of triangles varies from about 100 m near the coast to 1-2 km in deep offshore waters. In addition to the ADCP measurements, a set of sea level records along with the water lines extracted from LANDSAT and SPOT images were used for model calibration [S17]. The model was also validated by current drifters released in the area. The fine-resolution spatial variations of the wind over the model area are not yet available; thus the model was either forced by offshore tides with no wind or with a spatially averaged west wind blowing at 4 m.s-1 (i.e. average wind speed over the simulation period and fieldwork) or 10 m.s-1 (i.e. maximum wind speed during the simulation period and fieldwork). No leeway effects were included as the wind observed during the studied period, was steady and rather weak (4-10 m/s) with prevailing direction from west. On the contrary, tides in this area are strong (i.e., range of tidal heights during the fieldwork = [0.5m-5m]) and had a major effect in the model. The model appeared to reproduce well the major surface circulation pattern in the Pertuis [S15, S17]. The particle, i.e. virtual jellyfish, displacement was described as the sum of two vector components: a drift, Dd, corresponding to Lagrangian transport of a passive particle by currents [S19] and a swimming component Ds due to jellyfish swimming For passive particles, the swimming component was set to Ds = 0 m.s-1 throughout the entire simulation. For active particles, the swimming component was set to Ds = 0 m.s-1 when current speed was slower than 0.005 m.s-1. When the current flowed faster than 0.005 m.s-1, Ds was set to 0.05 m.s-1 (i.e. value of jellyfish swimming speed calculated from acceleration data) with a direction opposite to the current. The total displacement D = Dd + Ds was computed within TELEMAC software for a total of 4800 passive particles and 4800 active particles released every 3 hours during 15 days in groups of 40 particles and tracked for 90 days from 27 August 2011 (i.e. date of the first boat transect). The particle trajectories were computed in TELEMAC at every time step in “online” mode, i.e. immediately after updating current velocities and sea surface height. We used the method of characteristics that provides unconditional stability and monotonicity of solution. At every time step, the model switches to the Lagrangian approach by searching a foot of the

characteristics that passes through a given point. Dividing the time step in 3 or more segments and using iterative relocation of the characteristic curve allows to track the trajectories with high accuracy. More details about the implementation of numerical algorithm are given in [S19]. The particles were released in the area where the boat transects were performed and the jellyfish blooms observed (Figs. 1, 3). If a tracked particle entered in coastal waters shallower than 1 m depth, it was considered as stranded an excluded from further simulations. On the flood tide, 60% of the jellyfish swam against the current and 40% swam with the current. There remains uncertainty however regarding the temporal stability of jellyfish swimming directions on the flood tide; i.e. whether some individuals would always swim against the current and others always swim with the current or if the same individual can switch between up and down current swimming and if so over what time scales this behavior switches. This may influence the results of the model but cannot be answered with the data at hand. In addition, a probability function would need to be added to the model in order to model this behavior which would add another level of complexity and make running the model computationally challenging. For these reasons, we did not add the second observed type of behavior to our model and focused on the consequences of the most prominent behavior (active counter-current swimming).
Supplemental References
S1. Lilley, M.K.S., Houghton, J.D.R., and Hays, G.C. (2009). Distribution, extent of inter-annual variability and diet of the bloom-forming jellyfish Rhizostoma in European waters. J. Mar. Biol. Assoc. U. K. 89, 39-48.
S2. Houghton, J.D.R., Doyle, T.K., Davenport, J., and Hays, G.C. (2006). Developing a simple, rapid method for identifying and monitoring jellyfish aggregations from the air. Mar. Ecol. Prog. Ser. 314, 159-170.
S3. Fay, S., and Husson, B. (1983). Repartition, frequence et regime alimentaire de la meduse Rhizostoma Pulmo. Volume Diplome d'Agronomie Approfondie. (Rennes, France: Ecole Nationale Superieure Agronomique de Rennes), p. 67.
S4. Batschelet, E. (1981). Circular statistics in Biology, (London: Academic Press). S5. Ginestet, C. (2011). ggplot2: Elegant Graphics for Data Analysis. J. R. Stat. Soc. Series A
174, 245-246. S6. Doyle, T.K., Houghton, J.D.R., McDevitt, R., Davenport, J., and Hays, G.C. (2007). The
energy density of jellyfish: estimates from bomb-calorimetry and proximate-composition. J. Exp. Mar. Biol. Ecol. 343, 239-252.
S7. Hays, G.C., Doyle, T.K., Houghton, J.D.R., Lilley, M.K.S., Metcalfe, J.D., and Righton, D. (2008). Diving behavior of jellyfish equipped with electronic tags. J. Plankton Res. 30, 325-331.
S8. Wilson, R.P., White, C.R., Quintana, F., Halsey, L.G., Liebsch, N., Martin, G.R., and Butler, P.J. (2006). Moving towards acceleration for estimates of activity-specific metabolic rate in free-living animals: the case of the cormorant. J. Anim. Ecol. 75, 1081-1090.

S9. Shepard, E.L.C., Wilson, R.P., Halsey, L.G., Quintana, F., Laich, A.G., Gleiss, A.C., Liebsch, N., Myers, A.E., and Norman, B. (2008). Derivation of body motion via appropriate smoothing of acceleration data. Aquat. Biol. 4, 235-241.
S10. Gleiss, A.C., Norman, B., and Wilson, R.P. (2011). Moved by that sinking feeling: variable diving geometry underlies movement strategies in whale sharks. Funct. Ecol. 25, 595-607.
S11. Halsey, L.G., Green, J.A., Wilson, R.P., and Frappell, P.B. (2008). Accelerometry to estimate energy expenditure during activity: best practice with data loggers. Physiol. Biochem. Zool. 82, 396-404.
S12. Gleiss, A.C., Dale, J.J., Holland, K.N., and Wilson, R.P. (2010). Accelerating estimates of activity-specific metabolic rate in fishes: Testing the applicability of acceleration data-loggers. J. Exp. Mar. Biol. Ecol. 385, 85-91.
S13. R Development Core Team (2010). R: A language and environment for statistical computing. (Vienna, Austria: R foundation for statistical computing).
S14. Wood, S.N. (2011). Fast stable restricted maximum likelihood and marginal likelihood estimation of semiparametric generalized linear models. J. R. Stat. Soc. Series B Stat. Methodol. 73, 3-36.
S15. Nicolle, A., and Karpytchev, M. (2007). Evidence for spatially variable friction from tidal amplification and asymmetry in the Pertuis Breton (France). Cont. Shelf Res. 27, 2346-2356.
S16. Nicolle, A., Karpytchev, M., and Benoit, M. (2009). Amplification of the storm surges in shallow waters of the Pertuis Charentais (Bay of Biscay, France). Ocean Dynam. 59, 921-935.
S17. Chalumeau, J. (2014). Modélisation hydrodynamique du transport des méduses en environnement côtier : le cas des Pertuis Charentais. Volume Ph.D Thesis. (France: Universite de La Rochelle), p. 203.
S18. Stanisière, J.-Y., Dumas, F., Maurer, D., and Robert, S. (2006). Caractérisation des composantes hydrodynamiques d'un système côtier semi-fermé: Le Bassin de Marennes-Oléron. (http://archimer.ifremer.fr/doc/00000/2353/).
S19. Hervouet, J.-M. (2007). Hydrodynamics of Free Surface Flows: Modelling with the finite element method, (West Sussex, England: John Wiley & Sons).