
CURRENT OPERATIONAL APPLICATIONS OF REMOTE ...
82
WORLD METEOROLOGICAL ORGANIZATION OPERATIONAL HYDROLOGY REPORT No. 43 CURRENT OPERATIONAL APPLICATIONS OF REMOTE SENSING IN HYDROLOGY by A. Rango and A.I. Shalaby WMO-No.884 Secretariat of the World Meteorological Organization - Geneva - Switzerland 1999
-
Upload
khangminh22 -
Category
Documents
-
view
1 -
download
0
Transcript of CURRENT OPERATIONAL APPLICATIONS OF REMOTE ...

WORLD METEOROLOGICAL ORGANIZATION
OPERATIONAL HYDROLOGY REPORT No. 43
CURRENT OPERATIONAL APPLICATIONSOF REMOTE SENSING
IN HYDROLOGY
by A. Rango and A.I. Shalaby
WMO-No.884
Secretariat of the World Meteorological Organization - Geneva - Switzerland1999

Cover: NOAA-AVHRRfalse color composite image illustrating extent offload waters on the Red River ofthe North in Minnesotaand North Dakota, USA during April 1997. Theflood waters are shown in white, remaining snow cover in red, clouds inyellow and orange, and open land in blue. The image was produced by the National Operational Hydrologic RemoteSensing Center, National Weather Service; National Oceanic and Atmospheric Administration (courtesy of T. Carroll andD. Cline)
© 1999, World Meteorological Organization
ISBN: 92-63-10884-6
NOTE
The designations employed and the presentation of material in this publication do not implythe expression of any opinion whatsoever on the part of the Secretariat of the WorldMeteorological Organization concerning the legal status of any country, territory, city or area, or of itsauthorities, or concerning the delimitation of its frontiers or boundaries.

2.2.52.2.6
CONTENTS
FOREWORD .
SUMMARY (English, French, Russian, Spanish) .
CHAPTER 1. INTRODUCTION .1.1 Literature on applications of remote sensing in hydrology , .1.2 Citations of operational applications of remote sensing in hydrology " , ..1.3 Remote sensing for hydrologists .
1.3.1 Background .1.3.2 Definitions .1.3.3 Theory .
1.4 Definition of operational applications of remote sensing in hydrology , .
CHAPTER 2. APPLICATIONS OF REMOTE SENSING IN HYDROLOGY ••••.•••..•••..•...•............2.1 Technical and economic aspects . .
2.1.2 Economic consideration . .2.2 Remote s.ensing measurements of hydrological variables .
2.2.1 Precipitation .2.2.1.1 Visible and infrared rainfall monitoring techniques .2.2.1.2 Passive microwave rainfall monitoring techniques .2.2.1.3 Multispectral/microwave sounding unit rainfall monitoring techniques . .2.2.1.4 Ground-based radar rainfall monitoring techniques . .2.2.1.5 Satellite radar rainfall monitoring . . . . . . . . . . . . . . . . . . . . . . . . . . . . . . . . . . . . . .2.2.1.6 Water vapor imagery rainfall monitoring techniques .
2.2.2 Soil moisture and groundwater , .2.2.2.1 Soil moisture . . . . . . . . . . . . . . . . . . . . . . . . . . . . . . . . . . . . . . . . . . . .2.2.2.2 Groundwater......................................... . .
2.2.3 Evapotranspiration. . . . . . . . . . . . . . . . . . . . . . . . . . . . . . . . . . . .2.2.3.1 Semi-empirical methods . . . . . . . . . . .2.2.3.2 Analytical methods . . . . .. . .. . .. . .. . . .. . .2.2.3.3 Numerical models . . . . . . . . . . . . . . . . . . . . . . . . . . . . . . . . . . . . . . . . . , .
2.2.4 Snow................................................................... . .2.2.4.1 Snow cover distribution , .2.2.4.2 Snow accumulation . . . . . . . . . . . . . . . . . . . . . . . . . . . . . . . . .2.2.4.3 Snow metamorphism. . . . . . . . . . . . . . . . . . . . . . . . . . . . . . . .2.2.4.4 Snowpack ablation and snowmelt runoff . .Ice on land . . . . . . . . . . . . . . . . . . . . . . . . . . . . . . , .Surface water . . . . . . . . . . . . . . . . . . . . . . .2.2.6.1 Surface water area .. . . . . . . . . . . .2.2.6.2 Surface water stagellevel . . . . . . . . . . . . . . . . .2.2.6.3 Surface water depth. . . . . . . . . . . . . . . . . . . . . . . . .2.2.6.4 Surface water temperature. . . . . . . . . . . . . . . . . . . . . . . . . . . . . . . . . . . . . . . . , .2.2.6.5 Surface water salinity and mineralization , ,. . . . . . . . . . . . .2.2.6.6 Surface water suspended sediments . .2.2.6.7 Surface water chlorophyll .2.2.6.8 Other pollutants in surface water .2.2.6.9 Surface water vegetation biomass
2.2.7 Basin characteristics .2.3 Remote sensing inputs for hydrological models2.4 Current operational applications ..
2.4.1 Precipitation .2.4.2 Soil moisture and groundwater .2.4.3 Evapotranspiration .2.4.4 Snow .2.4.5 Icc on land .2.4.6 Surface water .2.4.7 Basin characteristics
2.5 Future trends ...
Page
v
vii
11111112
3333344558888
1011121213131416171718192022222223232323242427282829292929293030

iv CONTENTS
Page
CHAPTER 3. NEW REMOTE SENSING ADVANCES.... .. .. .•.. ...••.•. .. .. .. .•..... .......•....... 313.1 Recent state-of-the-art remote sensing technology advances and ongoing research 31
3.1.1 Satellites .. .. .. .. .. . 313.1.2 Aircraft.. . . .. .. . . . . .. . . .. .. . . .. .. .. .. .. .. .. .. . .. 313.1.3 Ground-based methods and radars . .. .. .. .. . .. .. .. .. . . .. 32
3.2 Potential new applications in operational hydrology _. . . . . . . . . . . . . . . . . . . . . . . . 32
CHAPTER 4. PROBLEMS IN APPLICATIONS OF REMOTE SENSING IN OPERATIONAL HYDROLOGY ., 344.1 Current limitations of operational utilization ofremote sensing _. . . . . . . . . . . . . . . . . . . . . . . 34
4.1.1 Status in developed countries .. . .. .. .. .. .. . . 344.1.2 Status in developing countries _.. _ _. 34
4.2 Problem areas preventing the operational utilization of remote sensing in hydrology 344.2.1 Hydrological variables . . . . . . . . . . . . . . . . . . . . . . . . . . . . . . . . . . . . . . . . . . . . . . 344.2.2 Hydrological models 354.2.3 Remote sensing technology _. . __ _. . . 35
4.2.3.1 Limitations of the state-of-the-art , . _ , , 354.2.3.2 Consistency of data and need for calibration of new sensors ,........................ 36
4.2.4 Availability of data . .. .. . . .. .. .. .. . . . . . .. . . . .. . . . . .. .. . .. . .. . .. .. .. .. . .. . . .. . .. . . . .. . . 364.2.4.1 Geographical or climatological regions where remote sensing data are most applicable 364.2.4.2 Data acquisition and distribution capabilities of countries _, _ _. _. . . 36
4.2.5 Cost of data.. . .. .. . . . . .. .. . . .. . . . . . . .. .. .. .. . . .. .. . .. . . . .. . . .. .. .. .. .. .. 374.2.6 Computer data-processing capability .. _.. __ _. . . . . . . . . . . . . . . . . . . . . . 374.2.7 Data presentation/publication/dissemination _ , . . . . . . . . . . . . . . . 374.2.8 Human resources and training capability , ,..................... 37
CHAPTER S. A STRATEGY FOR ACCEPTANCE OF REMOTE SENSING IN OPERATIONAL HYDROLOGY 395.1 Past studies of operational hydrological observational needs and existing and future satellites. .. . . . . . . . . . . . . . . . . . . .. . 395.2 Development or modification of hydrological models based on remote sensing infonnation 395.3 Demonstration of significant technical and economic benefits _ , , . , . . . . 395.4 Targeting major hydrological services 40
CHAPTER 6. ELEMENTS OF SUCCESSFUL REMOTE SENSING IN OPERATIONAL HYDROLOGY •..••.•• 416.1 Financial resources . . . . . . . . . . . . . . . . . . . . . . . . . . . . . . . . . . . . . . . . . . . . . . . . . . . . . . . . . . 416.2 Regional remote sensing centers , "............. 41
6.2.1 Expert advice _. . . . . . . , . . . . . . .. 416.2.2 Training of personnel . __ . . . . . . . . . . . . _. . . . . . . . . . . . . . . . . . 42
6.3 Ground receiving stations . . . . . . . . . . . . . . . . . . . . .. . . . . . . . . . . . . . . . . . . . . . . . . . . . . 436.4 Groundtruth networks . , _. . . . . . . . . . . . . . . . . 436.5 Key ancillary support systems , , . . . . . . _. . . . . . . . . . . . . . . . . . . . . . . . . 43
CHAPTER 7. RECOMMENDATIONS 4S7.1 Key approaches to include in developed countries , , , , , _ 457.2 Key approaches to include in developing countries , . . . . . . . . . . . . . . . . . . . . . . . . . . . . . . . . . . . . . . . . . . . . 45
REFERENCES 46
APPENDIX 1. Cited literature on applications of remote sensing in hydrology •...•..•••••••......•••••.•..••• 58
APPENDIX 2. Hydrological observational requirements and existing and planned satellites and sensors forhydrological applications. • . . . . . . . . . • . . . . . . . • . . . • . . • • • • . . . . . • . • . . . • . . . . . • . • . . . . • . • . • . • . . . . 60
APPENDIX 3. Specific sensors which might be carried by EOS 6S
APPENDIX 4. StateMofatheaart of satellite data requirements and required capabilities of near-polar orbitingand geostationary satellites .....••.•.•.•..........•.••.... • . . • . . . . . . . . . . . • • • . • • • . . . . . . . . . 66
ACRONYMS 71

FOREWORD
Over the years, WMO has taken a particular interest in the potential of remote sensing for operational use in hydrology. Accordingly,WMO has issued a number of reports on the subject with the aim of advising national Hydrological Services of the current state of the art.In the past, the emphasis was mainly on the use of remote sensing for research, partly because the techniques had not been fully developedfor routine application and partly because the satellites themselves were often designated as being for research with no guarantee of futurecontinuity.
This situation has now changed and remote sensing is being widely used in hydrology for a range of purposes. The fact that the operational community does not publish its results so frequently makes it even more valuable that WMO, through its Commission forHydrology, maintains its role of monitoring and reporting on developments.
At its ninth session in 1993, the Commission appointed Mr A. Rango (United States of America) as its Rapporteur on Applications ofRemote Sensing and entrustred him with the task of preparing a report on "current applications of remote sensing in hydrology".
To complete this task, Mr Rango invited Professor A.I. Shalaby of Howard University to assist him in putting together the report. Itwas then recommended for publication by the Commission for Hydrology at its tenth session. I should like to place on record the gratitudeof th,e World Meteorological Organization to Drs Rango and Shalaby for the time and effort they have devoted to the preparation of thisvaluable report.
(G.O.P. Obasi)Secretary-General


SUMMARY
This report provides information on the most recent advances inoperational use of remote sensing in hydrology and waterresources management. The application of remote sensing datacan be termed operational if at least one of two conditions isfulfilled: 1) the application produces an output on a regular basis;or 2) the remote sensing data are used regularly on a continuingbasis as part of a procedure to solve a problem or make decisions.
The report consists of seven chapters. The first chapterintroduces the report and makes reference to operational remotesensing applications and various definitions of operational appli·cations. Chapter 2 surveys the subdisciplines of hydrology,
identifies applications of remote sensing in each subdiscipline, andidentifies those applications that qualify as operational. Newadvances in remote sensing are briefly surveyed in Chapter 3. Thevarious problems that hinder operational applications are coveredin Chapter 4. Chapter 5 sets forth a strategy for acceptance ofremote sensing in operational hydrology, while Chapter 6 lists theelements needed for successful operational remote sensing appli~
cations. Chapter 7 includes recommendations and key approachesto use in both developed and developing countries.
An extensive list of references as well as a listing ofrelevant literature are also included.
Ce rapport [ournit des informations sur les taus demiers progresaccomplis dans I'utilisation operationnelle de la t616d6tection aux finsde I'hydrologie et de la gestion des ressources en eau. L'applicationdes donnees de tel6detection pelit ctre qualifiee d'operationnelle sirune au moins des deux conditions ci-apres est remplie : 1) l'application genece regulierement des produits; ou 2) les donnees detel6d6tection sont utilisees de fa<;on suivie pour resoudre un problemeou prendre des decisions.
Le rapport se compose de sept chapitres. Le premier sertd'introduction, 6voque les applications operationnelles de la teledetection et en donne diverses definitions. Le Chapitre 2 recense lessousRdisciplines de I'hydrologie, indique quelles sont les applications
de la teledetection dans chacune d'eHes et detennine celles que l'onpeut qualifier d' operatioIUlelles. 1£ Chapitre 3 expose brievement lesfaits nouveaux survenus dans Ie domaine de la t6ledetection, apres quaile Chapitre 4 traite des problemes auxquels se heurtent les applicationsoperatioIUlelles. Le Chapitre 5 decrit une strategie pour l' adoption de lat61edetection en hydrologie operationnelle, tandis que Ie Chapitre 6dOIUle la liste des elements areuoir pour que les applications operationnelles de la t616detection soient couronn6es de succes. Le Chapitre 7 contient des recommandations et donne des exemples dedemarche asuivre dans les pays developpes et ceux en developpement.
Le rapport contient une liste tres complete de referencesainsi qu'une bibliographie de la litreranrre pertinente.
PE310ME
BHaeTOJIUJ;eM OT'IeTe npe)J;oCTaBillIeTCJI HH¢opMawul 0 caMblX nOCJIe.n;
HHX )J;oenDKeHIDIX B onepaTHBHoM HCUOlIb30BamfH .lUiCTaHl.\HOHHOro
30llJUlpOnaHIDI n o6nacTIl rHApOJJOrHH H HCnOJIh30naHHH BO)J;HblX pe~
cypCOB. ITpHMeHeHHe AaHHblX J]JlCTaJrn;HOIIHOfO 30HAHpoBaHIDI MO)KHO
Ha3BaTb onepaTHBHblM, eCJlli BbIII01IHJleTCJI no KpaMHeH Mepe OARO H3
AByX ycnomlli: 1) npHMeHeHJfe AueT pe3YJIbTaT Ha peryJUlpHO:l1: oeHOBe;
HJlli 2) AaHHble AHeTanUJfOIlHoro 30HJlHpOBaHHJI peryJlllpHO HCn01lb
3YlOTCn. Ha HenpephlBHoH oeROBe B Ka'leeTBe l.£aeTH npOUenypbI,
npellHa3HaQeHHOH wm perueHlHl npo6neMblMH q,OpMHpOBaHHJI peruemlH.
OT'IeT COCTOHT H3 ceMH maB. ITepBaJI maBa lIBllileTeJ'I BBe
JleUHeM B on:eT, B HeH nepe'lJICJImOTeH OnepaTJIBHble rrpHMeHeHHH
JlHCTaHUHOHHoro 30HJlHpOBamIH, a TaK)Ke COAep)KaTCH pa3JIH'IHbIe
onpeJleJIeHIDI onepaTHBHblX rrpHMeHeHH::it B maBe 2 npJIBOJ]JlTCH 0630P
nOApa3AenoB nmpOJIOrHH, onpe.nellilIOTCll npHMeHeHJlll JlHCTaHll;IlOHHoro
30HlI,HpOBaHI1H B KmKj:(oM no.npa3;:J;ene, a TaIOKe orrpe;:J;eJIHlOTCJl Te npH
MeHeHHH, KOTophle KBaJuHIHIIJ;IipYIoTeJl KaK orrepaTHBHbIe. HOBbIe
;:J;ocTH)I{eHHJl B JlHCTaHI..\HOHHOM 30H;:J;HpOBamm KpaTKo paCCMaT
pHBaIOTCJl B maBe 3. PaSJIH'lHble np06JIeMbI, KOTopble MellialOT
BHeJlpeHHIO onepaTHBHbIX npHMeHeHH:ti, OXBaTbIBalOTCll B maBe 4. BmaBe 5 YCTaHaBJIHBaeTCH cTpaTemJl rrpHeMneMocTH ,lUieTaHUHOHHoro
SOHj:(HpoBamm B orrepaTIlBHO:l1: rH.nponorI-rn, B TO BpeMH KaK B maBe 6rrepeqllCJIillOTCJl3J1eMeHTbl, Heo6xoj:(HMbre JlllJI ycnellIHhlX orrepaTHB
HhIX npHMeneHH:ti JlHCTaHUMoHHoro 30H;:J;HponaHHH. B many 7BKnIOqeH:bI peKoMeH,naI..\HJl, a TaK)Ke KJIIO'IeSble rrO}J.XOj:(bI K HCnOJIb30
BaHillO ,!lHCTaHUHOHHoro 30HJlMpOBaHIDl B pa3BHTbIX H pa3BHBaJOIUHXCJI
CTpauax.
B OT'IeT BKnIOqeH 0611IHPHbl:ti nepeqeHb CCblJIOK, a TaK
)fCe crrHCOK cooTBeTcTByww;efi JIJiTepaTypbI.
SUMARIO
En este informe se facilita infonnad6n sabre los progresos masrecientes en el usa operativo de la te1edetecci6n en hidrologfa ygesti6n de recursos hidricos. La aplicaci6n de datos obtenidos porteledetecci6n puede calificarse de operativa si al menos se cumple unade las dos condiciones siguientes: I) la aplicaci6n produce resultadocon caracter regular; 0 2) los datos obtenidos por teledetecci6n seutilizan regularmentc en forma continua como parte de un procedimiento para resolver un problema 0 para tomar decisiones.
EI informe consta de siete capitulos. En el primer capftulose presenta el informe y se hace referencia a las aplicaciones de teledetecci6n operativas, con diversas definiciones de las aplicacionespracticas. En el Capitulo 2 se analizan las subdisciplinas de la
hidrologia, se sefialan las aplicaciones de la teledetecci6n en carla unade elias y se indican las que se consideran operativas. En el Capftulo3 se examinan brcvemente nuevos avances en materia de teledetecci6n. Los diversos problemas que obstaculizan las aplicacionesoperativas se tratan en el Capitulo 4. En el Capitulo 5 se presenta unaestrategia para la aceptaci6n de la teledetecci6n en hidrologia operaR
tiva, en tanto que en el Capitulo 6 se enumeran los elementosnecesarios para aplicar con 6xito la teledetecci6n operativa. EICapitulo 7 comprende recomendaciones y m6todos esenciales parautilizarlos en los paises desarrollados y en desarrollo.
Tambien se incluye un amplia lista de referencias y unaenumeraci6n de la literatura de interes.


CHAPTER 1
INTRODUCTION
The science and practice of hydrology includes managing, assess
ing and forecasting the quantity and quality of water. Bothhistorical and real-time hydrological data are collected, stored and
analysed. The resulting information is provided to the decision·
makers to manage the water resources and to mitigate floods,droughts, pollution incidents and similar water-related hazards. An
important prerequisite is the availability of accurate and reliable
data. The International Conference on Hydrology (UNESCOIWMO/ICSU, 1993) recognized that a universal difficulty encoun
tered in the science and practice of hydrology is associated with
data.Up until a decade ago, hydrologists relied mostly on
conventional data network systems. However, characterized by
insufficient spatial and temporal coverage of the Earth's surface,the conventional networks are being supplemented by remotelysensed data network systems.
The most important areas of application in hydrologyand water management include the following:(a) precipitation;(b) soil moisture, groundwater and irrigation;(c) evapotranspiration;(d) snow;
(e) ice on land;(j) surface water; and(g) basin characteristics.
Although existing techniques for remote sensing applications in these areas are generally either preliminary and/ordependent upon data much less well suited to them than is desirable (Barrett et aI., 1990), remotely sensed data are now beingused operationally by a number of agencies for rainfall and snowmonitoring, flood forecasting and water balance assessments.
1.1 LITERATURE ON APPLICATIONS OF REMOTE
SENSING IN HYDROLOGY
The existing literature on the applications of remote sensing inhydrology are numerous and may be found in various types ofdocuments including textbooks, technical reports, proceedings,journals and others. Only a representative collection of such documents will be referenced in this report. Textbooks are listed inAppendix I, A. Technical reports, proceedings, journals and othersare listed in Appendix I, B, C, D and E, respectively.
1.2 Citations of operational applications ofremote sensing in hydrology
Many applications of remote sensing in hydrology have beenmade, but true operational applications are limited. Authorsreporting either operational or potentially operational applicationsof remote sensing for a specific area in hydrology are listed in thebox in Appendix I by specific area of application.
1.3 REMOTE SENSING FOR HYDROLOGISTS
This section contains information regarding background, theory,and definitions of remote sensing for hydrologists.
1.3.1 Background
The application of remote sensing techniques in hydrology isbecoming increasingly important mainly because of several uniqueaspects of remote sensing. First, remote sensing techniques havethe ability to measure spatial information as opposed to point data.Second, remote sensing teclmiques have the ability to measure thestate of the Earth's surface over large areas. State variables includesoil moisture, surface temperature, degree of frozen soil andsurface energy balance. Finally, remote sensing techniques, especially those which utilize satellite sensors, have the ability toassemble long-term data (Engman and Gurney, 1991).Furthermore, although the expense associated with remotelysensed data may seem to be -high at ftrst glance, upon close inspection the cost is very low when compared to acquiring the samespatial information using conventional means (Rango, 1994b).
1.3.2 Definitions
Remote sensing is the observation of a target by a sensor withoutphysical contact. The basis for all remote sensing is the electromagnetic spectrum (EMS) illustrated in Figure 1. Remote sensingtakes advantage of th~ unique interaction of radiation from thespecific regions in the spectrum and the Earth (Engman andGurney, 1991). There are four basic components of a radiationbased remote sensing system, given as follows: 1) radiation source(e.g. the sun, radar, laser); 2) transmission path (e.g. atmosphere,vegetation canopy, shallow soil surface); 3) target (e.g. river, soil,snowpack); and 4) sensor (e.g. multispectral scanner, thermalsensor, microwave sensor). Remote sensing is based on interpreting measurable variations in spectral, temporal and spatialcharacteristics of the Earth. Spectral characteristics (or signatures)of the target are the unique spectral reflectances for specific earthfeatures (Engman and Gurney, 1991).
1.3.3 Theory
Remote sensing techniques measure the reflective, thermal ordielectric properties of the Earth's surface, within the EMS (seeFigure 1). Different sensors can provide unique information aboutthe properties of the surface or upper layers of the soil (Engmanand Gurney, 1991). Aerial photography/cameras use the visible,near-infrared (IR) and thermal regions of the spectrum; photographic images provide information on sediment plumes, erosionfeatures, discharges from pipes and spills (Engman and Gurney,

2 CURRENT OPERATIONAL APPLICATIONS OF REMOTE SENSING IN HYDROLOGY
1991). Multispectral scanners (MSS) measure the reflected solar
radiation; the data are used to estimate land cover, land use, vegeta
tion biomass, soil type, vegetation type, snow cover, water area,impervious area and various water quality parameters (Engman and
Gurney, 1991). Thermal scanners (TSC) directly measure energy
emitted from the Earth's surface/surface temperature; the data are
used to estimate evapotranspiration, soil moisture, drainagepatterns. groundwater seepage zones, canopy temperatures, and
thermal plumes from thermoelectric power plants or industrialsources (Engman and Gurney, 1991). Gamma ray spectrometers
(radiometers) measure the gamma radiation flux by soil water or
snow; data are used to estimate snow water equivalent and change
in soil moisture. Microwave radiometers are passive sensors, which
work in the same way as thermal infrared (TIR) radiometers, and
can directly measure energy emitted from the Earth's surface and
the dielectric properties; data are used to estimate soil moisture,
vegetation type, snow water equivalent, condition of snowpack,
frozen soil and sea ice. Furthermore, active microwave remote
sensors or radars such as Side-looking Airborne Radar (SLAR),
Synthetic Aperture Radar (SAR), altimeters and scatterometers
measure the reflected or backscattered radiation (energy) propa
gated towards the Earth's surface by the radar (radiation source);
such data are used to measure rainfall (Engman and Gurney, 1991).
And, finally, laser remote sensors measure the energy reflected by
the Earth's surface from a laser beam (radiation source); data are
used to estimate high-density topographic information, canopy
height, vegetation cover, stream valley cross-sections, air pollution
and chlorophyll (Engman and Gurney, 1991).
1.4 DEFINITION OF OPERATIONAL APPLICATIONS
OF REMOTE SENSING IN HYDROLOGY
Based on Applications of remote sensting by satellite, radar and
other me/hods /0 hydrology (WMO-No. 804) (Rango, 1994b), afollow-up study has been undertaken of the current operational appli
cations of remote sensing in hydrology. According to Rango (l994a,
1994b), the application of remote sensing in hydrology may be
termed "operational" if: 1) the application produces an output on a
regular basis; or 2) the remote sensing approach is used regularly and
on a continuing basis as part of a procedure to solve a pr9blem.
However, according to Blyth (1993), for an application to be classi
fied as operational, it is not essential that the technique has already
been demonstrated operationally, but simply that current sensors and
knowledge are adequate to make incorporation into an operational
system feasible to a level where an improvement to that system can
be expected. As such, there are numerous examples of operational
applications of remote sensing in hydrology. Examples falling under
both definitions will be presented in the following chapters. The
reader can make the final decision on operational readiness.
HERTZI I I I I I I I I I I I I I I Frequency
10'0 10'9 10" 10" 1016 1015 1014 1013 1012 10" 10'0 109 10' 107 106(cycles per
I I I second)00 W
I~I~IZW
"~ ~ «'"l.L.I.1.. Q
" " ~~ 3:<;;; ;1i 0 5J:~'" '" =>z '">- x (IZI o~ u '"W« ~~~
I I METRESWavelength
1nm lmm 1m
Relative 1001 ~transmission 0...--------............-..
Transmissionthroughatmosphere
Totalgammaraycounts,gamma rayspectrometry
x-rayimaging
Atomicabsorbtionspectrophotometrymechanicallinescanning
Imagingsingle- andmulti-lenscamerasvarious filmemulsions,multispectralphotography
Radiometry,spectrometry,thermography
Passivemicrowaveradiometry,radarimaging
Electromagneticsensing
Principaltechniquesfor remotesensing
Figure 1-An illustration of the electromagnetic-spectrum showing the relationship between wavelength and frequency, the
common names for spectral bands, and the relative atmospheric transmission. The principal techniques used in remote sensing
are also shown for their respective spectral region (after Barrett and Curtis, 1976)

CHAPTER 2
APPLICATIONS OF REMOTE SENSING IN HYDROLOGY
2.1 TECHNICAL AND ECONOMIC ASPECTS
Remote sensing has shown promise for the observation of hydrological change over time and space. The hydrological variable is
indirectly measured~ the electromagnetic radiation which is sensedis related to the hydrologic variable either empirically or via some
form of transfer function.The hydrological observational requirements may be
viewed in more than one way. A summary of hydrological obser
vational requirements in relation to satellite monitoringopportunities is given in Appendix II, Table 1 (after Barrett et aI.,1990). The hydrological observational needs in relation to a hypo
thetical platform HYDROSAT is given in Appendix II, Table 2(after Onnsby and Engman, 1993). Furthermore, WMO (1993a)has highlighted the relationship amongst the required geophysicalparameters, observing technologies and candidate sensors, given
in Appendix II. Table 3. A more detailed set of similar tables ispresented in Remote sensing for hydrology - Progress andprospects (WMO-No. 773) (Kuittinen, 1992).
Although most of the existing and planned sensors coverthe visible through the thermal region of the spectrum (seeAppendix II, Table 4), the use of microwave sensors has been
shown to overcome cloud cover, a major factor limiting the use of
remote sensing. Blyth (1993) has summarized key satellites carrying microwave sensors suitable for hydrological monitoring (see
Appendix 11, Table 5). Blyth (1993) has classified applicationareas of microwave remote sensing as being either operationally
feasible, near-operational, or requiring development and multifre~
quency sensors (see Appendix 11, Table 6). Finally, Blyth (1993) in
Appendix II, Table 7 identified the most appropriate microwavesensor/frequency combination likely to be required for the hydrological variables. Furthermore. it was proposed that the
HYDROSAT platform would have only microwave sensors(Ormsby and Engman, 1993).
2.1.1 Economic consideration
Numerous studies have demonstrated how remote sensing can beused operationally and economically to replace. supplement. inter
pret and standardize data provided by conventional techniques.The Institute for Remote Sensing Applications (lRSA) (1992) has
reported success in four categories of application. The first is anagricultural study to provide rapid estimates of changes in acreage
and potential yield using high-resolution satellite data at samplesites scattered over Europe. The second is the operational land
cover mapping of Europe with a high degree of accuracy. Thethird is investigation of the role of the ocean in the global system
as well as on a local scale. The fourth is the monitoring of changesin the forests of the tropical belt.
According to Blyth (1993), the use of remote sensing
will yield the most benefit when used at the earliest opportunity inany study of hydrological catchments, hydrological basinprocesses or water resources requiring the selection of instrument
sites. For instance, an optimum strategy for siting hydrological
instruments may be developed only after a careful consideration ofthe basin characteristics. Remote sensing has proven to yield
necessary comprehensive map information not represented on
conventional maps (Ringrose and Matheson, 1991; Baker et at.•1991). Higuchi and Iozawa (1971) and Dozier (1989) illustrated
that an optimum design of snow sampling regimes is possiblewhen remote sensing is used to monitor snow accumulation and
melt patterns. Remote sensing of other variables such as glacierareas and landcover is quite useful in mountainous regions
because of restricted access to these regions. Collins and VanGenderen (1978) illustrated the use of remote sensing for
mapping, navigation and site selection in developing countrieswhere conventional maps may be poor. According to Blyth (1993),"considerable savings can be made during groundwater exploration by the targeting of test boreholes in areas having highgroundwater storage potential as identified by remote sensing"
(Gurney et al., 1982; Szekielda, 1988).In an effort to economize through remote sensing. the
Russian Federation has developed the ALMAZ programme.
Recent practices have shown that Earth remote sensing from spaceis the most effective method of providing data necessary to
develop the mineral resources and raw materials of Siberia and theFar North and other economy-related tasks (Viter, 1993).
"Microwave radar data will be of unique value in the
tropics or mountainous areas where cloud cov~r is usually persist
ent, or in arid areas where its sensitivity to surface roughnessenables spectrally similar surfaces to be differentiated" (Blyth,
1993). Low frequency radar has the unique ability to penetrateforest canopies (Chauhan and Lang. 1991; Kimura and Kodaira.
1992); this may facilitate the retrieval of soil and soil moistureinfonnation, wetland and floodwater extent.
2.2 REMOTE SENSING MEASUREMENTS OFHYDROLOGICAL VARIABLES
While some of the examples may be termed operational as defmedby Rango (1994a), others may have some operational potential
according to Blyth (1993).
2.2.1 Precipitation
Rainfall is one of the most important processes in the hydrological
cycle. Precipitation data is an important input to many environmental monitoring systems. The spatial and temporal depth ofrainfall is necessary for the management of water resources such
as rivers and reservoirs, irrigation, and weather forecasting.
Conventional raingauges provide direct yet only point rates and
depths of rainfall.Remote sensing techniques provide the capability of
observing precipitation in real- or near-real-time over relativelylarge areas and thus complementing the conventional more accu
rate point measurements. Useful data can be derived fromsatellites used primarily for meteorological purposes. including

4 CURRENT OPERATIONAL APPLICATIONS OF REMOTE SENSING IN HYDROLOGY
the polar-orbiting National Oceanic and AtmosphericAdministration (NOAA) and Defense Meteorological SatelliteProgram (DMSP) sateIIItcs, and the geostatIonary GOES, GMS
and Meteosat (Engman and- Gurney, 1991). The three types ofelectromagnetic radiation which have proven to be of special value
are the visible (VIS), thermal infrared and microwave. While thepassive microwave radiometers have been operational to date,plans exist for the use of active microwave rainfall radars on future
satellites, e.g. the Tropical Rainfall Measuring Mission (TRiVIlVl)
(Barrett, 1993). Also, the recent use of water vapour imagery (6.7mm) shows significant promise for the estimation of potentialprecipitation amounts (Thiao et af., 1993).
2.2.1.1 VISible and infrared rainfall monitoring techniques
Visible and infrared techniques use measurements of cloud top
reflectance and temperature to provide indirect estimates of rain·
rate. Operational applications of VIS and IR remote sensing
techniques in rainfall monitoring are given as follows:
The NESDIS (NOAA Environmental Satellite Data and
Information Service) interactive precipitation estimation tech
nique (also known as the Interactive Flash FloodAnalyser (IFFA)
technique) is one of the first and few techniques that can
currently be described as being in continuous operational use. It
originates from the Scofield-Oliver technique (1977). In this final
form it has been taught to forecasters and has been used opera
tionally for the real-time precipitation estimation of heavy
rainfalls using geostationary cloud images over the USA for
nearly a decade (D'Souzaetal., 1990). NESDIS (NOAA, 1994)
used the IFFA technique to make rainfall estimates resulting in
the Great Flood of 1993 of the Midwest US.
The Food and Agriculture Organization (FAO) of the United
Nations method was developed by the Remote Sensing Unit of
the University of Bristol and applied over Africa to assist the
FAD's desert-locust and drought monitoring programme.
Secondary data user's station data were analysed interactively
to produce maps of "probably precipitating clouds" (Barrett
and Hanison, 1986). Resulting montWy maps are being opera
tionally used by FAO for locust invasion warning (locusts are
attracted by moist soil) (WMO, 1993a). National personnel
have been trained for the fully operational programme which is
being implemented in a new remote sensing office in Algiers.
A new objective and internally self-calibrating geostationary
infrared method called "B4" (Bristol/Barrett, Beaumont,
Bellerby) is now being operationally tested over West Africa.
Raingauge data from real-time reporting Global Telecommuni
cation System (GTS) stations are being used to set rain/no-rain
boundaries and rain rates (Barrett, 1993).
An operational approach similar to the B4 method is being devel·
oped for the Nile Forecasting System (NFS) using rainfall
satellite imagery from the European Space Agency's (ESA)
Meteosat geostationary satellite (NOAA, 1993).
Lovejoy and Austin (1979a, b) developed a technique using real
time radar data and infrared imagery for rainfall area estimation.
It has been used quasi-operationally in two real-time (so-called
"nowcasting") rainfall estimating schemes: the large-scale
RAINSAT in Canada and the FRONTIERS system in the United
Kingdom (UK) (D'Souza et a!., 1990). WMO (1992a) reports
that RAINSAT2 has been an operational system for processing
and displaying the integrated data in Quebec since 1991.
The Finnish Meteorological Institute is applying a modified
neural network algorithm developed by the Swedish Meteoro
logical and Hydrological Institute to classify clouds using NOAA
Advanced Very High Resolution Radiometer (AVHRR) data.
Precipitation estimates are made in the operational phase (WMO,
1992a).
• The Polar-orbiting Effective Rainfall Monitoring Interactive
Technique (PERM11) is used operationally in Pakistan. Daily
rain/no-rain boundaries are determined using lR imagery.
PERMIT was originally developed for use over the Western
Sahel in Africa (D'Souza et at., 1990).
The Martin-Howland (Grid History) technique (1982) has been
designed more specifically for the estimation of daily rainfall in
the tropics and warm season mid-latitudes. Ithas been applied to
estimate daily rainfall over the South China Sea, Arabian Sea,
tropical North Atlantic Ocean, Amazonia, and for monsoon rain
fall situations along the east coast oflndia. WMO (l992a) reports
that Japan applies this technique to Geostationary Meteorological
Satellite~4 (GMS-4) IR data to analyse monsoon activities, inter
annual variations such as the El Nino/Southern Oscillation
(ENSO), inter-seasonal variations in the tropics and activities of
the frontal zone around East Asia.
Kilonsky and Ramage (1976) derived monthly estimates over the
data-sparse Pacific Ocean using a hard-copy NOAA archive of
polar-orbiting satellite Mercator mosaics - one per day. This
method was later used to provide rainfall maps over the GATE
(GARP Atlantic Tropical Experiment) area and the Atlantic
Ocean. Barrett et al. (1988a) used a similar technique to provide
a useful Atlas of Potential Rainclouds over Oman.
In the design and implementation of new operational satellite
based visible/infrared rainfall estimation techniques over large
regions, it is clear that no single technique would be able to
provide rainfall estimates at all the spatial and temporal scales
required. Thus, it seems appropriate that integrated or "hybrid"
techniques should be made available (D'Souza et al., 1990). As
an example, NESDIS is hoping to implement the Hierarchical
Objective Procedure (HOP) designed to guide objectively the
~electionof geographical windows within which the IFFA tech
nique should be applied. HOP incOlporates elements of several
other rainfall estimation techniques.
2.2.1.2 Passive microwave rainfall monitoring techniques
While all of the VIS/IR tedmiques suffer from the disadvantages of
indexing methods (i.e. indirectness), it is fortunate that imagery
from selected passive microwave bands can be exploited to provide
more direct information of alternative or additional value for rain
fall monitoring purposes (Kidd and Barrett, 1990). The greatest
constraints on the use of passive microwave techniques stem from
the fact that the data are available only once or twice daily in most
tropical and mid-latitudinal areas of the world; data are currently
obtained from military satellites. The spatial resolution of the
microwave footprints is much coarser than that of the VIS and IR
sensors. However, improvements in resolution continue; the latest
sensor, the Defense Meteorological Satellite Program-Special
Sensor Microwave/Imager (DMSP·SSrvIll), has a footprint of 15 x
13 km in the 85.5 OHz region (Kidd and Barrett, t 990). Further
into the future, the rainfall research community awaits a passive
microwave sensor on a geostationary platform (Kidd and Barrett,
1990). Additionally, the PRIRODA instrument package on the

CHAPTER 2 - APPLICATIONS OF REMOTE SENSING IN HYDROLOGY 5
Russian MIR space station included a 37 GHz band with an 8 kmresolution and an 85 GHz band with a 5 km resolution.
Since 1978, NESDIS has been operationally supplyingsatellite estimates and outlooks of heavy precipitation to theNational Weather Service (NWS) Forecasting Offices and RiverForecast Centers. New additional products include: 1) InfraredHistograms of the GOES Precipitation Index; 2) Global CloudLiquid Water from the Special Sensor Microwave/Temperature(SSMff) - over water only; and 3) Global Precipitation from theSSMJ] over land and water. A trispectral precipitation product isexpected over the next 3-5 years (Scofield, 1991).
It is generally assumed that a frequency algorithmshould be most appropriate over land while a polarization algorithm over water. The Remote Sensing Unit of the University of
Bristol is currently conducting research, based upon SSMII datafrom the DMSP Block 5D-2 satellite, aimed to evaluate rainfallover both land and sea simultaneously. The initial test area is theBritish Isles and the surrounding sea areas (Kidd and Barrett,1990). A combination of frequency and polarization algorithms isbeing explored in order to establish a physically-determinedrain/no-rain threshold. For the areas of simultaneous SSMII andradar coverage, the correspondence between both the areas and theintensities of rainfall in the radar and the radarMcalibrated satelliterainfall maps are very good.
Applications of passive microwave remote sensing tech-niques in rainfall monitoring arc given as follows:
Barrett (1991) used passive microwave data from the DMSPSSM!I over northwest Europe, calibrated by FRONTIERSradar with good results. He also processed NIMBUS-7Scanning Multichannel Microwave Radiometer (SMMR)data along with SSM!I data to provide historic (climatic)analyses of rainfall in the North Sea.
• Ferraro et al. (1986) utilized both the frequency algorithmtechniques and temperature thresholding to classify severalgeophysical parameters for a North American winter climate.Results proved good enough to distinguish sea ice, dry snow,flooded land, rain, dry land and open water.Kidd (1988) compared frequency and polarization algorithms. Three months (July 1979, and October and November1983) of surface rainfall data and microwave data wereanalysed on a rain/no-rain basis. The polarization algorithmprovidcd the most reliable results in the month of July. It wasconcluded, however, that this algorithm was seasonallydependent.Prabhakara et al. (1992) used microwave data from theSMMR and the SSMII which revealed information on rainand precipitation~sizcd icc; rain rates compared favourablywith radar observation.Italy is investigating the possibility of using microwaveimages from the SSMII on board the DMSP (possibly linkedto the Multifrequency Imaging Microwave Radiometer(MIMR) data) on an operational basis mainly for the identification of precipitation nuclei and sea state (WMO, 1992a).
Adler ef al. (1991) combined hourly IR data from theJapanese OMS geosynchronous satellite and microwave datafrom the DMSP SSM!I to produce IRlmierowave monthlyrainfall estimates.Negri et al. (1994) used a scattering-based algorithm of Adleret ai. (1991) to derive climatologies of convective precipitation from microwave observations from the SSMII for four
regions: Mexico, Amazonia, Western Africa and the westernequatorial Pacific Ocean (TOGA COARE area).Wilheit ef al. (1991) used operationally available SSMII datato derive monthly rainfall indices. Results comparedfavourably with the GATE radar observations.
2.2.1.3 Multispectral/microwave sounding unit rainfallmonitoring techniques
Simultaneously, capitalizing on the ability of passive microwavealgorithms and the temporal frequency of IR data, significantprogress has been made in using the TIROS~N Operational VerticalSounder (TOVS) retrievals in rainfall forecasting. The HungarianMeteorological Service successfully used atmospheric soundingsfrom the Microwave Sounding Unit (MSU) radiometer on board theTIROS-N to forecast ultra-short-range precipitation in theCarpathian Basin. This applied procedure can be incorporated intothe current operational rainfall forecasting procedure (Csistar andBonta, 1993). WMO (1992a) reported that the improvement ofTOVS retrievals has been a particular focus of many of the researchefforts found in the country progress reports. Examples ofoperational applications exist in the Russian Federation, Japan,Finland and Italy. Furthermore, Randall and Tjemkes (1991)favourably compared the results from a model which combinesSMMR and SSM!I data with actual TOVS data to estimateprecipitable water.
2.2.1.4 Ground-based radar-rainfall monitoring techniques
Ground-based radar is conceptually similar tp spaceborne radarexcept that the radar is stationary on the land surface and its areaof measurement is limited to a circle with a radius up to about 130kIn (Kuittinen, 1992). A recording raingauge is desirable for calibration. Thus, the rain rate, R, can be estimated according to
(1)
where Z is the measured radar reflectivity and a and b are calibration parameters.
According to D'Souza et ai. (1990), groundMbasedweather radars have been used operationally for more than 20years in some countries, mostly in combination with raingaugenetworks which are often used to calibrate them. Rainfall estimates made by weather radars arc sometimes more useful thanthose made by raingauges because they are continuous in time andspace and provide areal coverage. However, there are problemsassociated with them dealing with backscatter, attenuation,absorption and reflection, particularly in areas of varying relief
and signal calibration.Although the weather radar networks operated in coun
tries such as Europe and North America by the nationalmeteorological agencies adequately service the primary meteorological requirement of daily weather reporting and forecasting, theneed for quantitative estimates of rainfall to support applicationsin hydrology and water resources, especially flood forecasting, hasnot been so well serviced (Moore, 1993a). The visual images ofthe spatial extent and propagation of storms provided by radars arenow a familiar feature of weather reporting. Furthermore, the mostWidespread of all quantitative applications is the use of radar forrainfall forecasting. The majority of methods in operational useare based on an underlying advection model. Others include

6 CURRENT OPERATIONAL APPLICATIONS OF REMOTE SENSING IN HYDROLOGY
feature tracking· and human/machine interface methods. All ofthese methods are used particularly for flood warning in both rural
and urban areas. Radar is in widespread use as an informal meansof initial alert of impending flooding utilizing the moving imagesof storm systems that it provides. However, quantitative use ofradar data is much less common and is constrained by accuracylimitations, especially in mountainous areas and at times whenbright band effects are apparent (Moore, 1993a).
Some applications of radar data in rainfall reporting and
forecasting arc given as follows:
• The Ballistic Research Laboratory in the US conductedexperiments to measure the properties of rain backscatter at9.375, 35, 70 and 95 GHz. The experiment verified the Mie
Theory calculations; it was verified that there is a decrease inrain backscatter coefficient above 70 GHz. The 95-GHz radar"saw" the target in the rain better than the lower frequencyradars (Richard et al., 1988).Goldhirsh et al. (1987) compared radar-derived rain rateresults of a dual-polarization radar located at the NationalAeronautics and Space Administration (NASA) WallopsFlight Facility with in situ measurements of rain rate obtainedwith raingauges. The radar system gave relatively accuratemeasurements of rainfall for three rain days.
• Hogg (1989) proposed the design of a joint radar/radiometricsystem that can prove viable for quantitative operationalmeasurement of rainfall. Important design factors which mustbe considered in providing accurate rain measurementswith operational radars such as the next generation radar(NEXRAD) are discussed.
Smith and Krajewski (1991) used products of the NEXRAD
system to estimate hourly rainfall over Norman, Oklahoma.Walton et ai. (1990) discuss the ability of the three-stageNEXRAD system to issue more accurate forecasts of precipitation and their consequences, and to routinely measurerainfall with accuracies never before achieved over largeareas in real-time.According to WMO (1992a), the Republic of Korea has
undertaken a study on the development of the short-rangeprecipitation forecasting system using satellite and radarobservations".In the Russian Federation (WMO, 1992a) a manual is beingprepared for the diagnosis and prediction of dangerous andhazardous precipitation (hail and squalls) using data frommeteorological radar and satellites (WEFAX images);methods of applying data from the OKEAN side-looking
radar have been tested and improved.The UK has a short-term radar rainfall forecasting network,FRONTIERS, which is used in the context of flood forecasting(Walsh, 1993). The concept combines radar and Meteosat
display imagery with an experimental forecaster and developssoftware tools to support the forecaster in using the radarimagery to make rainfall forecasts (Moore, 1993a). Furthermore, ongoing developments aim to speed up the forecastingprocedures through greater automation, including consideration of expert system techniques and object programmingmethods (Conway, 1989). Ryall and Conway (1993) reviewed
the progress on the new automated scheme which eventuallyreplaced FRONTIERS in 1995 and is called NIMROD.
Italy is developing a technique to merge satellite and radar datain order to identify heavy convective clouds, and will develop
subsequent linear evaluation for nowcasting. The application ofalgorithms for determination of rainfall intensity and amount in
an operative procedure will be investigated (WMO, I992a).Although the infonnal use of radar for flood warning is
widespread, only two or three countries make quantitative use ofthe data as part of a flow forecasting system. Even then, the radaris used in a complementary way with additional information beingprovided by networks of raingauges. First, the radar data arecorrected for attenuation and other effects, then a raingauge calibration is applied to improve accuracy prior to use for floodforecasting. The development of distributed flood forecastingmodels (specially tailored to utilize the radar grid data through amodel grid formulation) are still at a pre-operational stage.Furthermore, real-time implementation should only be contemplated following detailed off-line assessment and proven improvedperformance relative to simpler and more conventional lumpedmodels (Moore, 1993a). Below are some applications of real-timerainfall data from operational radars for flash flood forecasting.
Joss and Lee (1994) reported that the Swiss MeteorologicalInstitute was to install during 1993/1995 three new radarstations on three mountain tops. These installations werecompleted in 1995. The new equipment should give operational flood warning in the Swiss Alps and improvedquantitative information in precipitation rate to be used in anational research programme on climate changes and naturalhazards.
• Walsh (1993) reports that weather radar has been activelyresearched and developed in the UK since the 1960s. One ofthe major indications leading to the weather radar hydrological application was the Dee Weather Radar and the Real-timeHydrological Forecasting Project which demonstratedsuccessful rainfall measurement. This was followed by theNorth West Weather Radar Project (NWWRP) starting in1978, which installed the first unmanned C-band radar andintegrated it with an operational flood forecasting andwarning service (Collinge and Kirby, 1987). The NWWRPinvolved meteorological, hydrological, operational andresearch agencies and recognized the need to continue theinitiatives on hydrological applications of weather radar.Furthermore, a need has been identified for an experimental
. basin, Hydrological Radar Experiment (HYREX), on which anumber of basic studies may be conducted.The CASCADE system of the UK National Rivers Authority
Thames Region (Haggett et at., 1992), which is one of themost advanced flood warning systems in terms of its use ofweather radar in Europe, is operated in support of floodwarning over the London metropolitan area and surroundingmore rural areas. It utilizes high-resolution (2 km, 5 minute)data from the C-band London weather radar at Chenies aswell as wider coverage radar (5 km, IS minute) in the form ofthe UK radar network composite image. The system incorporates the Institute of Hydrology's local rainfall forecastingsoftware as well as receiving the FRONTIERS national radarrainfall forecasts. Furthermore, a range of derived productsuseful to flood warning is generated, including displays ofradar-derived catchment average rainfalls. These can be inputto flood forecasting models to obtain forecasts at a variety oflocations to support flood warning decisions (Moore, 1993a).
• Unlike the CASCADE system, which can make model forecasts for specific catchments, the River Flow Forecasting

CHAPTER 2 - APPLICATIONS OF REMOTE SENSING IN HYDROLOGY 7
System (RFFS) (Moore and Jones, 1991; Moore, 1993b) has
been developed to coordinate the construction of forecastsdown the river network. Thus. the RFFS is widely regarded
as the most advanced flow forecasting system in use in theUK. An interface to the HYDrological RADar system(HYRAD) (Moore, 1993b), allows the RFFS to utilize data
for model input from one or more radars. in preprocessed,recalibrated and forecast form for grid square or catchment
areas (Moore, 1993a).• The Wessex Flood Forecasting in the UK prominently
features weather radar. This is based on the Wessex Radar
Information Project (WRIP) system and the STORM systemfor radar data acquisition and display, both developed at the
University of Salford. Furthermore, a river network form ofthe system is under development (Moore, 1993a).
Moore et al. (1993) studied the utility of the radar-derivedrainfall forecasts in the rainfall-rainoff models used operationally for flood forecasting over London. Based on using
five types of rainfall input to the Probability DistributedMoisture (PDM) model, the best overall performance wasobtained using the locally recalibrated radar forecasts
obtained from HYRAD.Fattorelli, et at. (1995) report that the countries of theEuropean Union depend upon the Flood Forecasting Warningand Response Systems (FFWRS) for managing flood hazards
within the European Union. Radar and satellite estimation ofrainfall are integrated within the FFWRS and flood forecast
ing within a real-time framework is performed through
conceptual models."Radar data have not yet been used to their full potential
in hydrological design studies" (Stewart, 1993). According toMoore (1993a), weather radar data are less immediately suited to
applications for design rainfall estimation, compared to their usefor flood forecasting, on account of the shortness of radar records
relative to the storm periods to be inferred. However, Moorepoints out this is in part compensated for by the complete spatialcoverage that radars provide. Furthermore, the advantages of the
high temporal and spatial resolution of radar data ought to be ofparticular importance for short duration design estimates.
The accuracy of radar data for very severe storms (often
associated with convective activity) can lead to considerable debate.When compared with raingauge estimates, it can lead to confusion(Moore, 1993a). However, the accuracy problem in design applicaH
tions of radar data has been helped in the UK by the development ofthe PARAGON data-processing system (May, 1988). TIlls system
created quality-controlled hourly rainfall values on a 5 km grid bycombining radar with daily raingauge records. Aerial reduction
factors and design temporal profiles are derived. Furthermore, thetiming accuracy associated with weather radar (data is commonly
available at five-minute intervals) can be used to good effect inobtaining better estimates of time-to-peak involved in design calcu
lations (Moore, 1993a). Cluckie et al. (1987) report adepth-area-duration (DAD) analysis of extreme events using hourly
radar rainfall totals for 5 km grid squares using the Clee Hill UKnetwork radar. The need to fIrst correct and calibrate radar data is
emphasized. DAD analysis is perfonned on individual stonns as ameans of classifying the flood producing potential.
Cluckie and Pessoa (1990) have used radar data fromnorthwest England to characterize actual storms which have then
been maximized and transposed to obtain probable maximum
precipitation (PMP) estimates for catchment areas of interest; thePMP is a concept that is often used in assessments of reservoir
safety. Such an approach capitalizes on radar's ability to delineatestorms in space and time. Furthermore, a programme called
RADMAX implements the procedure and incorporates visualization of the stann transposition step (Moore, 1993a). Collier (1993)
suggested the use of radar (and satellite data for cruder estimates)
to support PMP estimation by the stann model approach. Work isongoing in the UK to assess this stonn model approach utilizingradar data to support model parameterization.
According to Cluckie and Tyson (1989), the true poten
tial for the use of quantitative radar data in urban drainage systemshas yet to be fully evaluated and consequently developed. Moore
(1993a) states that this statement is still true. However, the use ofweather radar in urban applications is distinct because of the fine
spatial and temporal scale of interest. Furthennore, the potentialfor real-time control of urban drainage systems, supported byradar rainfall measurements and forecasts, has provided a particu
larly important stimulus for application. Verwom (1993) providesa recent state~of-the~art review on urban applications of weatherradar. Cluckie and Tyson (1989) conducted a review of research
activities concerned with the use of weather radar for urbandrainage system management. These included three Europeanstudies in France, Germany and Britain (Moore, 1993a). TheFrench project is the Seine~Saint-Denis region of northeast Paris.
A C-band radar at Trappes is used for rainfall measurement and
forecasts are produced from them using the SCOUT method. Asimilar project in Germany concerns the city of Bremen on the
River Bremen where storage in the drainage system will beutilized to minimize uncontrolled overflows to rivers. In the upper
reaches of the River Emscher an X-band radar called HydrologicalEmscher Radar Project (HERP) is being deployed in combination
with distrometers to support real-time control of urban drainage(Moore, 1993a; Kanuner, 1991). Rohlfing (1993) used data from
an X-band radar at a resolution of 600 m to provide rainfall estimates to conduct a sensitivity analysis of an optimal urbandrainage control strategy for part of the city of Essen to estimate
spatial variability in rain. In Britain much attention has been givento the use of weather radar to manage the drainage system forSt Hellier in the Channel Islands. A case study involving Greater
Manchester utilized radar data from the Hameldon Hill C-bandradar.
The interest in X-band for urban applications, as exem
plified in the two German case studies above, is common inseveral other European countries and in other parts of the world.This interest is a result of their higher resolution and greater
resilience to clutter over a restricted scanning range and to theirlower cost relative to the conventional network C-band radars.
Furthermore, the use of X-band continues to be a contentious
issue and the subject of a number of research investigations acrossEurope. These include the studies of the IMG group in France
(Delrieu et aI., 1989, 1992) and the Wageningen group in theNetherlands (Moore, 1993a). According to Moore (1993a), a prac
tical issue in the use of weather radar in urban drainage models isthat often the software, and possibly the model configuration,require modification to make best use of these distributed data.
However, Cluckie and Tyson (1989) report progress on the development of a front-end to the WASSP drainage model so that it canaccommodate distributed storm data from radar and apply recali
bration using local raingauges if required.
8 CURRENT OPERATIONAL APPLICATIONS OFREMOTE SENSING IN HYDROLOGY
Moore (1993a) reports that the real-time control ofcombined sewer overflows is of increasing concern as environmental pressures become more acute. Specifically, there is clearly animportant need to reduce surface flooding by contaminated waters
and to reduce the impact of llllcontrolled overflows on the qualityof receiving streams. Two case studies concerned with sewagedisposal control are as follows. Anderson and Anderson (1992)presented- the study undertaken by the Swedish Meteorological and
Hydrological Institute. The Kastrup Airport C~band weather radar
at Copenhagen was used for the efficient real-time operation of theMalmo Water and Sewage Works sewage systems. Ermolin (1992),on the other hand, working in Moscow, Russian Federation,
presented an algorithm for the operational control of an urbanhead~and-gravityflow sewage disposal system, but merely alludesto the prospect for radar application.
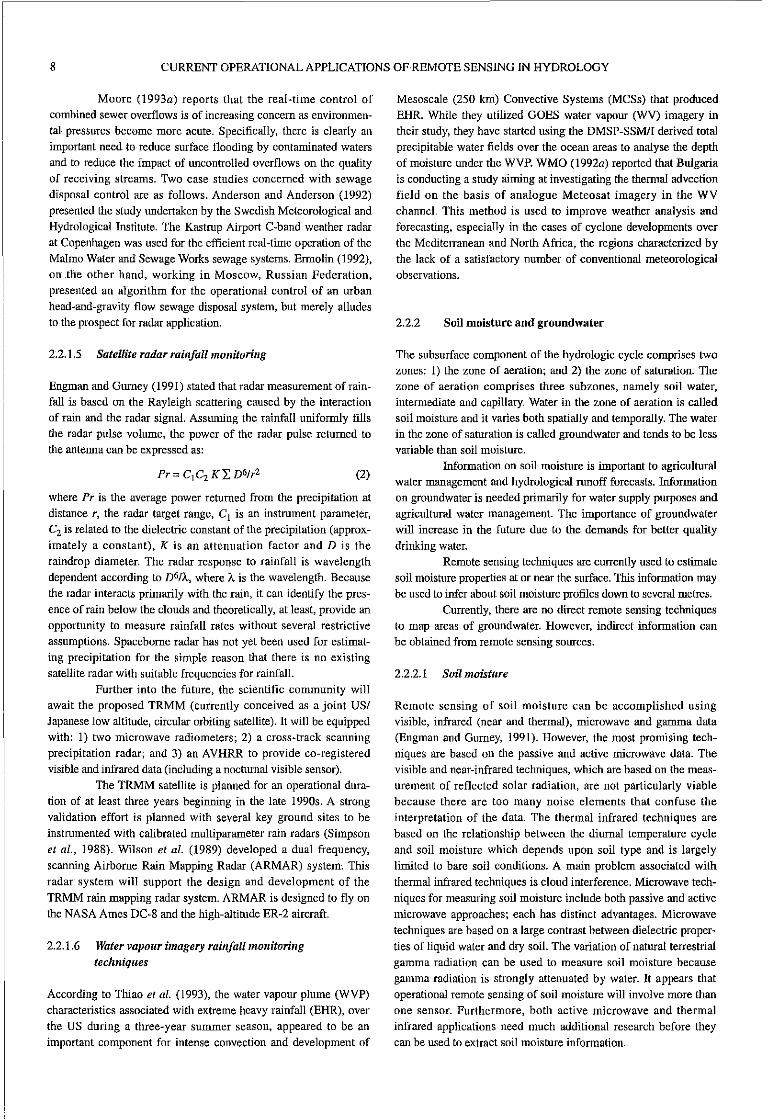
2.2.1.5 Satellite radar rainfall monitoring
Engman and Gurney (1991) stated that radar measurement of rainfall is based on the Rayleigh scattering caused by the interactionof rain and the radar signal. Assuming the rainfall uniformly fills
the radar pulse volume, the power of the radar pulse returned tothe antenna can be expressed as:
(2)
where Pr is the average power returned from the precipitation atdistance r, the radar target range, C1 is an instrument parameter,Cz is related to the dielectric constant of the precipitation (approx
imately a constant), K is an attenuation factor and D is theraindrop diameter. The radar response to rainfall is wavelength
dependent according to D6/A, where A is the wavelength. Becausethe radar interacts primarily with the rain, it can identify the pres
ence of rain below the clouds and theoretically, at least, provide anopportunity to measure rainfall rates without several restrictiveassumptions. Spaceborne radar has not yet been used for estimat
ing precipitation for the simple reason that there is no existingsatellite radar with suitable frequencies for rainfall.
Further into the future, the scientific community willawait the proposed TRMM (currently conceived as a joint US/Japanese low altitude, circular orbiting satellite). It will be equippedwith: 1) two microwave radiometers; 2) a cross-track scanning
precipitation radar; and 3) an AVHRR to provide co-registeredvisible and infrared data (including a nocturnal visible sensor).
The TRMM satellite is planned for an operational duration of at least three years beginning in the late 1990s. A strong
validation effort is planned with several key ground sites to beinstrumented with calibrated multiparameter rain radars (Simpson
et ai., 1988). Wilson et al. (1989) developed a dual frequency,scanning Airborne Rain Mapping Radar (ARMAR) system. This
radar system will support the design and development of the
TRMM rain mapping radar system. ARMAR is designed to fly onthe NASA Ames DC-8 and the high-altitude ER-2 aircraft.
2.2.1.6 Water vapour imagery rainfall monitoringtechniques
According to TIllao et al. (1993), the water vapour plume (WVP)
characteristics associated with extreme heavy rainfall (EHR), overthe US during a three-year summer season, appeared to be an
important component for intense convection and development of
Mesoscale (250 km) Convective Systems (MCSs) that produced
EHR. While they utilized GOES water vapour (WV) imagery intheir studYl they have started using the DMSP-SSMII derived totalprecipitable water fields over the ocean areas to analyse the depth
of moisture under the WVP. WMO (1992a) reported that Bulgariais conducting a study aiming at investigating the thermal advection
field on the basis of analogue Meteosat imagery in the WVchannel. This method is used to improve weather analysis andforecasting, especially in the cases of cyclone developments over
the Mediterranean and North Africa, the regions characterized bythe lack of a satisfactory number of conventional meteorological
observations.
2.2.2 Soil moisture and groundwater
The subsurface component of the hydrologic cycle comprises twozones: 1) the zone of aeration; and 2) the zone of saturation. Thezone of aeration comprises three subzones, namely soil water,
intermediate and capillary. Water in the zone of aeration is calledsoil moisture and it varies both spatially and temporally. The waterin the zone of saturation is called groundwater and tends to be lessvariable than soil moisture.
Information on soil moisture is important to agricultural
water management and hydrological runoff forecasts. Informationon groundwater is needed primarily for water supply purposes andagricultural water management. The importance of groundwater
will increase in the future due to the demands for better quality
drinking water.Remote sensing techniques are currently used to estimate
soil moisture properties at or near the surface. This information may
be used to infer about soil moisture profiles down to several metres.Currently, there are no direct remote sensing techniques
to map areas of groundwater. However, indirect information can
be obtained from remote sensing sources.
2.2.2.1 Soil moisture
Remote sensing of soil moisture can be accomplished using
visible, infrared (near and thermal), microwave and gamma data(Engman and Gurney, 1991). However, the most promising techniques are based on the passive and active microwave data. The
visible and near-infrared techniques, which are based on the measurement of reflected solar radiation, are not particularly viable
because there are too many noise elements that confuse theinterpretation of the data. The thermal infrared techniques are
based on the relationship between the diurnal temperature cycleand soil moisture which depends upon soil type and is largely
limited to bare soil conditions. A main problem associated with
thermal infrared techniques is cloud interference. Microwave techniques for measuring soil moisture include both passive and active
microwave approaches; each has distinct advantages. Microwave
techniques are based on a large contrast between dielectric properties of liquid water and dry soil. The variation of natural terrestrial
gamma radiation can be used to measure soil moisture becausegamma radiation is strongly attenuated by water. It appears that
operational remote sensing of soil moisture will involve more thanone sensor. Furthermore, both active microwave and thermalinfrared applications need much additional research before they
can be used to extract soil moisture information.
CHAPTER 2 - APPLICATIONS OF REMOTE SENSING IN HYDROLOGY 9
The reflection from bare soil. in the visible and nearinfrared parts of the electromagnetic spectrum, can only be used underlimited conditions to estimate soil moisture. The accuracy of thismethod is poor and absolute values of soil moisture cannot beobtained. More spectral bands and a much higher geometrical resolu
tion in the visible/near-infrared (VISINIR) range are needed for soil
moisture and agricultural purposes than that available from Landsat,SPOT and the NOAA satellites. Soil moisture has been estimated by
using precipitation indices; operational applications have been developed by FAO using geostationary imagery over intertropical regions
(WMO, 1993a). Furthermore, WMO (1993a) reports that with the
advent of the International Geosphere-Biosphere Programme (IGBP)
the need for high-resolution data is increasing.
Thermal infrared techniques have been successfully
used to measure the surface few centimetres of soil moisture
(Engman and Gurney, 1991). A limitation to the thermal approach
is that it cannot effectively be applied to surfaces with vegetation
cover. Idso et al. (1975) found that the volumetric moisture
content for soil layers between 2-4 cm thick was linearly related
to the amplitude of the diurnal soil temperature. Van de Griend et
at. (1985) demonstrated a relationship between night-time infrared
data and soil moisture and indicated that there was little sensitivity
to soil moisture when a vegetation cover is present. Seguin et a!.(1993) used thermal IR NOAA AVHRR data in parallel with the
Normalized Differential Vegetation Index (NDVI) to assess the
extension and severity of water shortage on cultivated crops in
France and Algeria. Attempts have been made to evaluate the soil
moisture through observation of the apparent thermal inertia using
both AVHRR data from Landsat and SPOT and geostationary
images; applications have been more pilot projects than opera
tioual (WMO, 1993a).
Microwave techniques have shown a lot of potential for
measuring soil moisture but still need varying amounts of research to
make them operational (Blyth, 1993). In order to progress to opera
tional soil moisture monitoring by remote sensing techniques,
multifrequency and multipolarization satellite data will be required;
such data are needed to quantify different swfaces and thus reduce the
amount ofground truth required. Jackson and Schmugge (1989) found
that for large river basin and global studies, satellite passive microwave
soil moisture measurements are closer to operational applications than
SAR because of their relative insensitivity to surface roughness.
Furthermore, with the operational Earth Observing System (EOS),
more suitable spatial and temporal passive microwave satellite data
may become available.
Only in the microwave region is there a direct physical
relationship between soil moisture and the reflection or emission of
radiation. A unique advantage of using the microwave region is that
at long wavelengths the soil moisture measurements can be made
through clouds. A passive microwave radiometer measures the
intensity of emission, which is proportional to the microwave
brightness temperature, TB' from the soil surface; while an active
microwave approach measures the radar backscatter, St' comprised
of backscatter from vegetation and soil, and the attenuation caused
by the vegetation canopy. At short wavelengths, vegetation affects
the microwave measurement through its biomass and structure.
However, biomass corrections may be made using indices based on
VIS/NIR data or a crop calendar. Myneni and Choudhury (1993)
have illustrated the synergistic use of optical and microwave data in
agrometeorological applications. During the MACHYDRO'90
experiment, which was a remote sensing aircraft campaign for
humid and semi-arid watersheds in the US, scientists conducted an
intercomparison between passive and active microwave remote
sensing of soil moisture (Wood et al., 1993; O'Neill et al., 1993).They concluded that the choice is based on the intended applica
tions and information that is available.
The passive microwave region has been exploited the
most so far. At present, microwave radiometers capable of measur
ing soil moisture are available only on aircraft. These are being
used in both research and a few operational applications. Available
satellite data (e.g. NIMBUS-SMMR or DMSP-SSM/I) have
frequent overpasses but have a rather low spatial resolution (50
km) at the best channel available in space for soil moisture meas
urement, Le. the C-band on NIMBUS-SMMR. The desired
resolution for large-scale studies is about 10 lan. Recent research
(Jackson and Schmugge, 1989; Kostov, 1992; Ijjas, 1992; Shutko,
1986; and Pampaloni et a!., 1990) using passive microwave for
observing soil moisture suggests the optimal wavelength falls in
the L-band range (20-30 em). The soil depth contributing to L
band measurements is primarily the top 5 em. However, it may be
possible to determine the soil moisture through a depth of one
metre if two microwave lengths are used in conjunction with a
priori information on local soil properties (Reutov and Shutko,
1986). Example research applications include preplanting soil
moisture condition assessment, irrigation management, water
management, and water balance studies (Jackson and Schmugge,
1989; Shutko, 1985, 1987). Kostov (1993) presented a brief review
of the current understanding of passive microwave remote sensing
of soil moisture and highlighted efforts towards operational use.
Several experiments have begun to demonstrate the potential for
operational application (Kondratyev et al., 1977; Jackson et aI.,
1987a; Kustas et aI., 1991). The first operational programmes
utilizing aircraft microwave radiometers were initiated in the
Russian Federation in the early 1980s for agricultural, hydrometeo
rological and land reclamation applications. The feasibility of these
capabilities has been widely demonstrated in countries such as
Bulgaria, Poland, Hungary, Germany, Viet Nam and Cuba (Shutko,
1985). In recent years, the Russian radiometers have been tested in
the US in the large-scale hydrology experiment called Monsoon 90
(Jackson et al., 1991). Scientists in the Russian Federation have
taken the advances in the passive microwave remote sensing of soil
moisture and developed a system for irrigation scheduling (Reutov
and Shutko, 1986). Using· algorithms developed in large area field
experiments, microwave radiometer data can be converted to areal
surface layer moisture maps (Jackson et al., 1993).
There are several aircraft systems available for obtaining
radar data, primarily for research. Satellite radar data for soil
moisture measurement include SAR data from short-term satel
lites and Space Shuttle radar missions, and more recently SAR
instruments on board the ERS-l, J-ERS-l and ALMAZ satellites.
Most research in the active microwave region has focused on the
C-band range (5-IO em) (Dobson and Ulaby, 1986), where only
the uppermost 5 crn of the soil surface can be observed (Kuittinen,
1992). These recent SAR instruments provide quasi-operational
radar data at resolutions of 15-30 m.
Soil moisture information at a depth of several metres
can be obtained from short pulse radar (wavelengths of 5-10 em)
techniques (Finkelstein et aI., 1987). In the Russian Federation,
this aircraft-based method is used for soil moisture measurements
in forested areas and for detecting zones of saturation down to a
depth of 5-10 m.

10 CURRENT OPERATIONAL APPLICATIONS OF REMOTE SENSING IN HYDROLOGY
The use of gamma radiation is potentially the mostaccurate of the remote sensing methods developed for soil moisture measurement. The attenuation of gamma radiation can beused to detennine changes in soil moisture in the top 20-30 em of
the ground. "This technique requires that some field measurements of soil moisture be made during the measurement flight,because it does not give the absolute values of soil moisture"(Kuittinen, 1992). According to Schultz and Barrett (1989), amajor advantage of this technique is that in contrast to microwave
measurements, gamma radiation is not affected by vegetation.which means that the technique is also applicable in forested areas(Jones and Carroll. 1983). Because air strongly attenuates gamma
radiation, measurements must be made from aircraft altitudes of50-150 m, which is a big disadvantage. The NWS maintains anoperational airborne gamma radiation snow survey programme in
the upper Midwest in which flights are also made to calculate realtime areal soil moisture values (Jones and Carroll, 1983). The dataare used to support the NWS hydrologic runoff forecastingprogramme (Carroll and Schaake, 1983). A study includinggamma radiation soil moisture measurements was conducted byPeck et al. (1990) as part of the First International Satellite LandSurface Climatology Project (lSLSCP) Field Experiment (FIFE).
2.2.2.2 Groundwater
Remote sensing techniques used to map areas of groundwaterinclude aerial and satellite imagery in the visible, infrared andmicrowave regions of the electromagnetic spectrum. In particular,
satellite imagery enables a view of very large areas and achieves aperspective not possible from ground surveys or even low-level
aerial photography. Although remote sensing is only one elementof any hydrogeological study, it is a very cost-effective approach
in prospecting and in preliminary surveys. Due to the interveningunsaturated zone of soil, most remote sensing data cannot be useddirectly, but require substantial interpretation. As a result, infer
ence of location of aquifers is made from surface features.Important surface features include topography, morphology andvegetation. According to Engman and Gurney (1991), ground
water information can be inferred from landforms, drainagepatterns, vegetation characteristics, landuse patterns, linear and
curvilinear features, and image tones and textures. Structuralfeatures such as faults, fracture traces and other linear features canindicate the possible presence of groundwater. Furthermore, other
features, such as sedimentary strata or certain rock outcrops, mayindicate potential aquifers. Furthermore, shallow groundwater can
be inferred by soil moisture measurements, changes in vegetationtypes and patterns. and changes in temperature (Engman and
Gurney, 1991). Groundwater recharge and discharge areas within
drainage basins can be inferred from soils, vegetation and shallowor perched groundwater (Engman and Gurney, 1991).
Engman and Gurney (1991) state that airborne explo
ration for groundwater has recently been conducted usingelectromagnetic prospecting sensors developed for the mineral
industry. This type of equipment has been used to map aquifers atdepths greater than 200 m (paterson and Bosschart, 1987).
Aerial photography supplemented by satellite data fromLandsat or SPOT are widely used for groundwater inventories,
primarily for locating potential sources of groundwater. This technique permits inferences to be made about rock types, structure
and stratigraphy (Engman and Gurney, 1991). Zevenbergen and
Rango (1992) analysed Landsat thematic mapper (TM) data overthe Nile Valley and Delta to assist in various phases of ground
water development in Egypt, including the production of agroundwater master plan for Egypt. They combined Landsat TMmaps with conventional maps to derive a hydrogeological map of
the study area. Kaufman et al. (1986) used high-resolutionLandsat TM data to define the karats drainage patterns in the
Peloponnesus area of Greece. The result was a structural map usedto identify major flow paths. Gurney et ai. (1982) used Landsatdata to assess groundwater resources in a poorly mapped area of
the Kalahari Plateau in Botswana. Zall and Russell (1981) usedLandsat imagery to identify linear features, fracture, faults anddrainage patterns for the Bobo-Dioulasso area in Burkina Faso.
El-Shazly el al. (1983) interpreted Landsat MSS imagery of theWadi Araba area of Egypt to provide criteria for locatingexploratory wells. Ahmed and co-workers (1984) combined satel
lite derived lineament maps and drainage maps for the Sudan tosuggest groundwater potential target areas for further research.Dutartre el al. (1993) illustrated the use of SPOT MSS and aerialphotography to identify a fractured basement area in the Sahelianclimatic zone of West Africa. Their result was discovery ofaquifers providing significant amounts of groundwater. Dutartre et
01. (1993) used SPOT imagery to supplement existing geophysicaldata to extract information on the groundwater potential over asedimentary intermontane basin in the Andes. El-Baz (1993)analysed Landsat TM images of the Arabian Desert and discov
ered a junction of two known ancient wadis (a stream course orvalley in a desert). "This ancient riverbed in Saudi Arabia and
Kuwait may indicate the presence of aquifers" (EI-Baz, 1993).Infrared images are valuable for mapping soil type and
vegetation surface features used in groundwater exploration.Springs can best be detected using infrared and thennal imagery.According to Guglielminetti et al. (1982), even underwater springs
can be detected by this method. Furthermore, through temperaturedifferences, thermal infrared imagery has the potential to deduce
information on subsurface moisture and perched water tables atshallow depths (Heilman aud Moore, 1981a aud 1981b;
Salomonson, 1983; van de Griend et 01., 1985).
Shallow groundwater tables can be measured usingpassive microwave radiometry. A dual frequency radiometer hasbeen used on an aircraft to measure water table depths of 2 m in
humid areas and 4 m in arid areas (Shutko, 1982, 1985, 1987).Radar has an all-weather capability and can be used to
detect subtle geomorphic features even over forested terrain (Parryand Piper, 1981). Radar is also capable of penetrating dry sand
sheets to disclose abandoned drainage channels (McCauley et ai.,1982, 1986), and can also provide information on soil moisture
(Harris et ai., 1984). Radar images may be used to detect waterwhich is some decimetres below the ground surface in arid areas,
due to the increase in soil moisture near the surface. According to
Finkelstein et ai. (1987), near-viewing short pulse radars installedon mobile ground or aircraft platforms provide information on the
depth to a shallow water table down to 5-50 10. Engman andGurney (1991) illustrated the potential of radar imagery to pene
trate the dense tropical rainforest and rainfall over Indonesia andproduced a geological map for use in groundwater exploration.
McCauley et al. (1982, 1986) illustrated the use of SIR-A data
taken over the eastern Sahara; the radar imagery revealed a vast.previously unchartered network of valleys and smaller channelsburied by the desert sands. Furthermore, this drainage network had
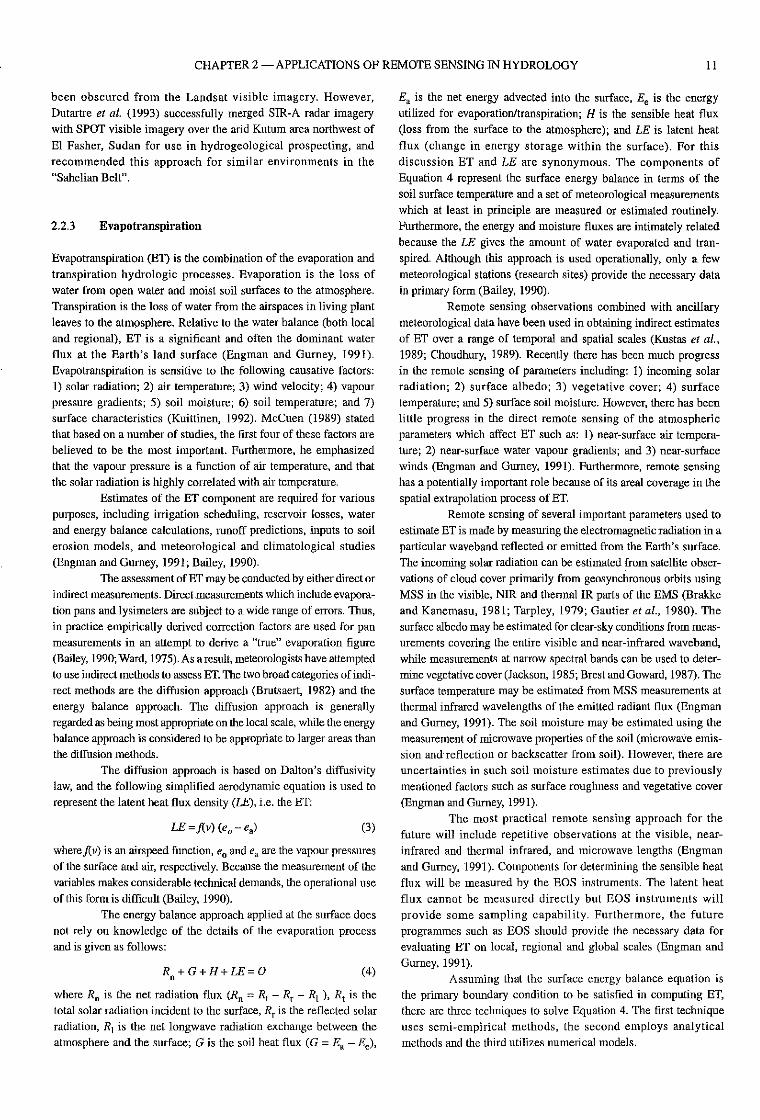
CHAPTER 2 - APPLICATIONS OF REMOTE SENSING IN HYDROLOGY II
2.2.3 Evapotranspiration
where Rn is the net radiation flux (Rn == Rt - Rr - Rt ), Rt is thetotal solar radiation incident to the surface, Rr is the reflected solarradiation, RI is the net longwave radiation exchange between the
atmosphere and the surface; G is the soil heat flux (G == Ea - Ee),
been obscured from the Landsat visible imagery. However,Dutartre et at. (1993) successfully merged SIR-A radar imagerywith SPOT visible imagery over the arid Kutum area northwest of
HI Fasher, Sudan for use in hydrogeological prospecting, andrecommended this approach for similar environments in the"Sahelian Belt".
Ea is the net energy advected into the surface, Ee is the energy
utilized for evaporation/transpiration; H is the sensible heat flux(loss from the surface to the atmosphere); and LE is latent heat
flux (change in energy storage within the surface). For thisdiscussion ET and LE are synonymous. The components of
Equation 4 represent the surface energy balance in terms of thesoil surface temperature and a set of meteorological measurements
which at least in principle are measured or estimated routinely.Furthermore, the energy and moisture fluxes are intimately related
because the LE gives the amount of water evaporated and tran
spired. Although this approach is used operationally, only a fewmeteorological stations (research sites) provide the necessary datain primary fonn (Bailey, 1990).
Remote sensing observations combined with ancillary
meteorological data have been used in obtaining indirect estimatesof ET over a range of temporal and spatial scales (Kustas et ai.,1989; Choudhury, 1989). Recently there has been much progress
in the remote sensing of parameters including: 1) incoming solarradiation; 2) surface albedo; 3) vegetative cover; 4) surfacetemperature; and 5) surface soil moisture. However, there has been
little progress in the direct remote sensing of the atmosphericparameters which affect ET such as: 1) near-slUface air temperature; 2) near-surface water vapour gradients; and 3) near-surfacewinds (Engman and Gurney, 1991). Furthermore, remote sensing
has a potentially important role because of its areal coverage in thespatial extrapolation process of ET.
Remote sensing of several important parameters used toestimate ET is made by measuring the electromagnetic radiation in a
particular waveband reflected or emitted from the Earth's surface.
The incoming solar radiation can be estimated ~rom satellite observations of cloud cover primarily from geosynchronous orbits usingMSS in the visible, NIR and thenna! IR parts of the EMS (Brakke
and Kanemasu, 1981; Tarpley, 1979; Gautier et al., 1980). Thesurface albedo may be estimated for clear-sky conditions from meas
urements covering the entire visible and near-infrared waveband,while measurements at narrow spectral bands can be used to deter
mine vegetative cover (Jackson, 1985; Brest and Goward, 1987). Thesurface temperature may be estimated from MSS measurements atthermal infrared wavelengths of the emitted radiant flux (Engman
and Gurney, 1991). The soil moisture may be estimated using themeasurement of microwave properties of the soil (microwave emission and- reflection or backscatter from soil). However, there are
uncertainties in such soil moisture estimates due to previouslymentioned factors such as surface roughness and vegetative cover(Engman and Gurney, 1991).
The most practical remote sensing approach for thefuture will include repetitive observations at the visible, near
infrared and thermal infrared, and microwave lengths (Engmanand Gurney, 1991). Components for detennining the sensible heat
flux will be measured by the EOS instruments. The latent heat
flux cannot be measured directly but EOS instruments willprovide some sampling capability. Furthermore, the future
programmes such as EOS should provide the necessary data forevaluating ET on local, regional and global scales (Engman and
Gurney, 1991).Assuming that the surface energy balance equation is
the primary boundary condition to be satisfied in computing ET,there are three techniques to solve Equation 4. The first techniqueuses semi-empirical methods, the second employs analytical
methods and the third utilizes numerical models.
(3)
(4)
Evapotranspiration (ET) is the combination of the evaporation and
transpiration hydrologic processes. Evaporation is the loss ofwater from open water and moist soil surfaces to the atmosphere.Transpiration is the loss of water from the airspaces in living plantleaves to the atmosphere. Relative to the water balance (both local
and regional), ET is a significant and often the dominant waterflux at the Earth's land surface (Engman and Gurney, 1991).Evapotranspiration is sensitive to the following causative factors:I) solar radiation; 2) air temperature; 3) wind velocity; 4) vapour
pressure gradients; 5) soil moisture; 6) soil temperature; and 7)surface characteristics (Kuittinen, 1992). McCuen (1989) statedthat based on a number of studies, the first four of these factors are
believed to be the most important. Furthermore, he emphasizedthat the vapour pressure is a function of air temperature, and thatthe solar radiation is highly correlated with air temperature.
Estimates of the ET component are required for variouspurposes, including irrigation scheduling, reservoir losses, water
and energy balance calculations, lUnoff predictions, inputs to soilerosion models, and meteorological and climatological studies
(Engman and Gurney, 1991; Bailey, 1990).
The assessment ofET may be conducted by either direct orindirect measurements. Direct measurements which include evapora
tion pans and Iysimeters are subject to a wide range of errors. Thus,in practice empirically derived correction factors are used for panmeasurements in an attempt to derive a "true" evaporation figure
(Bailey, 1990; Ward, 1975). As a result, meteorologists have attemptedto use indirect methods to assess ET. The two broad categories of indi
rect methods are the diffusion approach (BlUtsaert, 1982) and theenergy balance approach. The diffusion approach is generallyregarded as being most appropriate on the local scale, while the energy
balance approach is considered to be appropriate to larger areas thanthe diffusion methods.
The diffusion approach is based on Dalton's diffusivitylaw, and the following simplified aerodynamic equation is used to
represent the latent heat flux density (LE), i.e. the ET:
wherej(v) is an airspeed function, eo and ea are the vapour pressuresof the slUface and air, respectively. Because the measurement of the
variables makes considerable technical demands, the operational useof this fonn is difficult (Bailey, 1990).
The energy balance approach applied at the surface doesnot rely on knowledge of the details of the evaporation process
and is given as follows:

12 CURRENT OPERATIONAL APPUCATIONS OF REMOTE SENSING IN HYDROLOGY
2.2.3.1 Semi.empirical methods
The semi-empirical-methods represent an effort- to obtain a manageable model to estimate ET. 1bese modem operational approaches are
derived mainly from Penman's original formulation (penman, 1948),
which is a combination of the diffusion and energy balance approaches(Bailey, 1990). Penman (1948,1956) used a simplification of the
energy balance equation (Equation 4) for estimating ET. He further
reduced its complexity by making simplifying assumptions, fuld then
calibrated it to account, in part, for the loss of accuracy due its simpli
fications. Furthermore, empirical evaluations are used to fit the
coefficients for a particular location and set of conditions (McCuen,
1989). One particular condition is that ET estimates are for periods of
about one day. The modified form of the Penman formulation, referred
to as the Penman-Monteith equation or the combination equation, is
widely used in the calculation ofETfor operational purposes (Bailey,
1990; Monteith, 1965). Modification of Penman's original formula
tion resulted from doubts that underlie the basic assumptions of the
conventional meteorological methods. For instance, research by
Seginer (1971) and Thorn and Oliver (1977) illustrated that: I) the
effect of radiation has been over-emphasized and that of wind
underestimated; and 2) the regional ET is not independent of vegeta
tionheight (and thus surface roughness) in areas of substantial rainfall.
The following are current applications of remote
sensing assuming the semi-empirical methods to estimate ET.
Jackson et aI. (1977) proposed- the Jackson model and
later it was evaluated using empirical and theoretical results by
Seguin and Itier (1983). The energy balance model of Equation 4
is integrated over a 24-hour period and thus assumes that G is
negligible. Furthermore, observations by !tier and Riou (1982) and
more recently by BruneI (1989) suggest the daily ratio of HlRncan be approximated by HlRn estimated near midday under clear
sky conditions. With some further approximations Equation 4 can
be recast as:
(5)
where Ts is the surface temperature estimated remotely, say from a
satellite-based thermal infrared sensor, Ta is the near-surface air
temperature obtained from a nearby weather station, the subscript i
represents the "instantaneous" observation by the satellite over the
area of interest, and A and B constants which Caselles and
Delegido (1987) report as varying with location. In practice,
however, A and B vary with a wide range of both meteorological
and surface factors (Bailey, 1990). This expression and derivatives
of it have been tested and shown to produce reasonable estimates
of daily ET (Brunei, 1989; Kerr et al., 1987; Nieuwenhuis et al.,1985; Rambal el al., 1985; Thunuissen and Nieuwenhuis, 1990;
Riou et al., 1988). Although Equation 5 is characterized by low
demands for data provision and ease of operation, it is also charac
terized by limited spatial and temporal areas of application together
with poor accuracy especially in the presence of cloud when using
satellite thermal infrared methods to obtain T, (Bailey, 1990).
Jackson et al. (1983) proposed another form of the
Jackson model where ET was assumed to follow the temporal
trend in solar radiation throughout the daylight period. Remotely
sensed (low-level aircraft) reflected solar and emitted thermal
radiation data were used with ground-based measurements of
wind,. vapour pressure and incident solar radiation to estimate ET.
The estimated ET rates compared favourably with rates measured
with Bowen ratio instrumentation (Jackson et aI., 1987b).
Reginato et al. (1985) combined remotely sensed
reflected solar radiation and surface temperatures with ground
based meteorological data (incoming solar radiation, air
temperature, wind speed and vapour pressure) to estimate the net
radiation flux (Rn) and the sensible heat flux (ll) of Equation 4. The
soil heat flux (G) was estimated to be a fraction of the net radiation
and the height of the plant canopy through an empirical equation.
Using the energy budget approach of Equation 4, instantaneous
values of ET were calculated. Jackson et at. (1987b) extended this
method by collecting the reflected solar and emitted thermal energy
with low-level aircraft flights. Clothier et al. (1986) developed a
relationship for estimating G from a crop height measure and a
spectral vegetation index. Furthermore, Kustas and Daughtry (1989)
proposed a method for computing G based on multi-spectral data
that should be useful for regional energy budget studies.
Caselles and Delegido (1987) developed a procedure for
estimating ET for different crops. They used satellite-measured
global radiation and maximum air temperature. Values for the
maximwn ET for a given crop are a function of a crop coefficient.
Bausch and Neale (1987) developed a procedure for estimating the
real~time crop coefficient from reflectance properties of a crop/soil
scene. They also used a linear transformation of the normalized
difference vegetation index (Tucker et at., 1979) to produce a
seasonal curve. Caselles and Delegido (1987) applied their results
to the Valentian region of Spain.
Kotoda et al. (I983a, 1983b) used airbome MSS data to
map surface temperatures for a complex land cover in Japan. Using
the Priestly-Taylor (1972) relationship (an empirical solution of
Equation 4), they employed the remotely sensed temperature data to
estimate the vapour pressure/temperature ratio and the Rn term.
Dunkel and Vadasz (1993) used a simple statistical
method to calculate the daily ET in Hungary during the growing
season. The vegetation index and the surface temperature, derived
from the NOAA AVHRR images, were used to characterize the
regional distribution of the surface state. The ET is proportional to
the difference between surface temperature and air temperature
measured at 2 m height. However, for operational use and for
more precise monitoring of daily evaporation several improve
ments remain to be done.
Menenti (1993) used remote multispectral satellite
measurements for inputs to semi-empirical models to study and
map land surface ET in Egypt and Argentina.
2.2.3.2 Allalytical methods
The analytical methods seek to analytically evaluate the individual
elements of the energy balance equation. More physically-based
approaches are used over a 24-hour period to produce an analyti
cal solution (Pratt el al., 1980; Price, 1980). Both energy and
moisture fluxes are modelled in estimating ET.
The following are current applications of remote sensing
assuming the analytical methods to estimate ET.
In an effort to overcome problems presented by incom
plete canopies in estimating ET, Choudhury and Monteith (1988)
and van de Griend and van Boxe1 (1989) have used analytical
methods to evaluate the components of Equation 4 in multi-layer
models; soil and vegetation are treated separately using remotely
sensed data. Although their models yielded good results with
measured values, they may be difficult to use operationally
(Engman and Gumey, 1991).
CHAPTER 2 - APPLICATIONS OF REMOTE SENSING IN HYDROLOGY 13
2.2.4 Snow
where Q =: the net energy available for decreasing or increasing
the snowpack temperature or, if the temperature is already DOC,melting the snowpack; R =: net radiation of incoming solar and
emitted longwave radiation; H =: convective or sensible heat flux;
LE =: latent heat flux; G =: heat flux to or from the soil; and M =:
heat flux by advection (Rango, 1993). Most snowpack energy
balance studies have shown that the net radiation is the dominant
term (Rango, 1993). Temperature, operating through the sensible
flux, is also an important driving force. The latent heat flux can
also be an important melt factor at certain times. Combined, radia
tion and temperature are the causative factors for the vast majority
of melt. In general, the radiation effect prevails if temperatures are
only slightly above DOC, whereas sensible heat gains importance
when temperatures are high (Rango, 1993). As net radiation is
difficult to measure, and temperature is relatively easy to measure,
temperature has been used as an index in many models. The most
commonly used index is the degree-day value. The degree-day
method (as outlined by Linsley, 1943) has been used extensively
since and is the snowmelt algorithm employed in most detenninis
tic models for producing snowmelt (Rango, 1993; Kustas et al.,
1994). The degree-day method is a temperature index approach
that equates the daily decrease of the water equivalent of the
snowpack to a temperature difference between the daily averageair temperature and a base temperature (usually DOC) (Rango,
1994b). The snowmelt rate is computed as follows:
Snow is the occurrence of precipitation in the solid form. The water
stored in snow is held in cold storage on a basin for an extended
period of time.before it enters into the runoff process. During this
varying time period, the snow in storage can be augmented by addi
tional snow accumulation, redistributed by wind, changed in its
internal structure and affected by meteorological factors (Rango,
1993). The snowpack is removed from the basin by ablation
processes usually lasting several weeks to several months depending
on the amount of snow and location. The established snowpack
undergoes various transformations or metamorphic changes with
time. This includes a general decrease of surface albedo, an increase
in snow grain size and an eventual increase in snowpack liquid
water until snowmelt occurs (Rango, 1993). Other changes associ
ated with these metamorphic changes are a progressive warming of
the snowpack, an increase in snow density, a settling or decrease in
snow depth (if unaffected by new snow) and an increase in internal
snowpack strength at least up to the appearance of liquid water in
the snowpack. The snowmelt process takes place at various rates
depending on the aspect, slope, elevation, vegetation cover and
atmospheric conditions (Rango, 1993).
Predicting snowmelt runoff is required for various
purposes including water supply, flood control, hydropower gener
ation and water allocation for irrigation (Rango, 1994b). The
hydrologist generally wants to know how much water is stored in
a basin in the form of snow (Engman and Gurney, 1991).
The melting of snow is controlled by the net energy flux
exchange between the snowpack and the environment. The rate of
snowmelt is largely controlled by the rate at w_hich the net energy
flux is received by the snowpack. To place the various components
of the energy balance in perspective, the formulation by Dozier
(1987) is used.
Gash (1987) investigated and fonnalized the analytical
framework necessary to evaluate the spatial extrapolation of ET
values obtained at a reference point using remotely sensedhorizontal variations in surface temperature and reflected radiation. In an effort to seek operational applications. Gash makesseveral simplifying assumptions regarding some negligible terms.
Bernard et al. (1981) and Soares et al. (1988) used radar
estimates of soil moisture as the upper boundary condition in awater balance model that simulated flow using the Richards equa
tion in order to calculate ET rates.
Price (1980) assumed the 24-hour value of G to be
negligible. He used the Fourier expansion of the angle of solarincidence and linearized the Stefan-Boltzmann equations forincoming and outgoing longwave and the bulk resistance equation
for H. Price (1982) used this method with NOAA AVHRR data to
estimate a 24-hour average ET, and obtained favourable evalua
tions when compared with standard meteorological and pan
evaporation data.
2.2.3.3 Numerical models
The numerical models simulate the flow of heat and water in the soil
and use the surface energy balance as the boundary condition. The
advantage of this approach is that only initial conditions are needed to
detennine model parameters. Then, the temporal trace of the evapora
tive flux can be simulated and periodically updated (Rango, 1994b).
The following are current applications of remote sensing
assuming the numerical models to estimate ET.
In an effort to provide ET estimates on a routine and
timely basis, Soer (1980), Rosema et al. (1978), Carlson et al.(1981), Camillo et al. (1983), Raffy and Becker (1985) and
Taconet et al. (1986) numerically modelled Equation 4 and its
components. The moisture balance is inferred from the heat flow
in the soil. Furthermore, the analytical expressions for the
components of Equation 4 can be manipulated to obtain an
expression for the surface energy balance in tenus of the surface
temperature and a set of routinely measured meteorological
measurements. Initial estimates of the soil/crop surface tempera
ture, Ts' are optimized using an iterative numerical technique to
ensure that the boundary condition of Equation 4 is satisfied.
Taconet et al. (1986) illustrated the feasibility of this approach
with NOAA-7, AVHRR infrared data over an area of the Beauce
(France). More recently, Taconet and Vidal-Madjar (1988)
included geostationary satellite data (Meteosat) to increase the
stability of model inversion and atmospheric correction to thesatellite observations. Elkington and Hogg (1981) suggested that
a simplification in the initial and the boundary conditions would
make this numerical modelling approach to estimate ET poten
tially operational. Furthermore, Engman and Gurney (1991) point
out that the estimate of actual ET from remotely sensed measure
ments becomes feasible when it is possible to take initial
conditions from remote sensing measurements and boundary
conditions from either routine meteorological observations or
remotely sensed measurements.
According to WMO (1992a), Germany is utilizing
NOAA AVHRR data for input into numerical evaporation models
in small-scale agricultural areas. Satellite data include vegetation,
land-surface temperature gradients, soil moisture, diurnal tempera
ture variations and solar irradiance. Extrapolation of the model
results are to be tested (WMO, I992a).
Q=R+H+LE+G+M (6)

14 CURRENT OPERATIONAL APPLICATIONS OF REMOTE SENSING IN HYDROLOGY
M = a (T, - Tb) (7)
where a is a degree-day factor (cmrC/day), Ta is average dailytemperature cae), Tb is the base temperature COC), and M is thesnowmelt rate (em/day) (Kustas et aI., 1994). Because the aboveequation for snowmelt has to account for all terms of the energybudget that affeGt the mass balance of the snowpack, ex has a high
spatial and temporal variability, and is a function of snow density,
average daily air temperature range and mean wind speed (Kustas
et al~, 1994), Another snowmelt algorithm is the radiation-basedapproach (also known as the surface energy balance model), and is
used in some deterministic snowmelt runoff models (Leavesleyand:Stannard, 1990). The snowmelt depth is computed as follows:
where I1Q is the energy available for melt, Rn is the net radiation,His the sensible heat flux and LE is the latent heat flux, all inwatts per square metre; and mQ converts .6.Q to M, the snowmelt.According to Kustas et at. (1994), a statistical analysis by Zuzeland Cox (1975) indicated that daily snowmelt estimates improvedby incorporating net radiation, vapour pressure and wind in modelformulations rather than air temperature alone.
Snowmelt runoff procedures have followed two distinctpaths: an empirical approach and a deterministic modellingapproach. The choice of approach depends upon both the availability of data to quantify the snowpack and the extent of the detailrequired of the output (Engman and Gurney, 1991). In order tomake accurate estimates of snowmelt runoff, hydrologists need toquantify the snowmelt as follows: 1) the areal extent of the snow(snow cover area, S); 2) the snow water equivalent (HW); and 3)the condition/properties of the snow (such as depth, density, grainsize and presence of liquid water) (Engman and Gurney, 1991). Alist of snowpack properties and properties affecting albedo andemissivity of snow are given in Tables I and 2, respectively.
"The meltwater volume is a product of the melt depth andthe snow covered area" (Rango, 1992). The gradually decreasing arealextent is a characteristic feature of the seasonal snow cover. It shouldbe noted that for day-to-day simulations of snowmelt runoff, whetheran empirical approach (using historical data) or a deterministicapproach is used, it is sufficient to know the snow cover area in thebasin each day without knowing the initial accumulation of snow in
where
M=mQ
I1Q
I1Q = Rn +H +LE
(8)
(9)
tenns of water equivalent (Rango, 1994b). For many basins, there isa very goodrelationship between runoff and snow cover area (Engmanand Gurney, 1991). "For operational runoff forecasts, however, thewater equivalent must also be detennined" (Rango, 1994b). Use of theso-called modified depletion curves (the S measured is plotted againstthe accumulated melt depth or HW) enables a snowmelt runoffapproach to become a forecasting model as opposed to simply a simulation model (which uses conventional depletion curves). Furthermore,the indicators of snow which include S, HW, as well as the snowcondition, are generally difficult to measure and are likely to varyconsiderably from point to point, especially in mountainous terrain(Engman and Gurney, 1991). "Remote sensing offers a new valuabletool for obtaining snow data for predicting snowmelt runoff' (Engmanand Gurney, 1991).
Remote sensing of snow can be accomplished usinggamma rays, visible and near-infrared, thermal infrared andmicrowaves (Rango, 1993). Tables 1 and 2 give an overview of therelative sensor band responses to various snowpack properties. Itis evident from Tables 1 and 2 that the microwave band has thegreatest overall potential followed by the visible and near-infraredband. The gamma ray portion is extremely limited by the fact thatthe sensing must be carried out with low altitude aircraft, and to alesser extent that it is really only sensitive to a finite snow waterequivalent. Thennal infrared is also limited in potential, but it canbe used from space in night-time situations (Rango, 1993).According to Engman and Gurney (1991), "different approachesfor determining snow area, water equivalent and snow propertieshave been developed. These have been driven for the most part bythe availability of data from existing satellites or from experimental aircraft and truck programmes." According to Rango (1993),remote sensing data are currently being used operationally in snowcover and snow water equivalent assessments, and seasonalsnowmelt runoff forecasts. "The potential of satellites to provideuseable infonnation on snowpack dynamics is now widely recognized and today many schemes exist which employ satellitederived snow measurements for snowmelt-runoff prediction"(Lncas and Harrison, 1990).
2.2.4.1 Snow cover distribution
According to Rango (1994b), only satellites enable seasonal snowcover to be monitored periodically, efficiently and on a sufficiently
Table 1-Relative sensor band responses to various snowpack properties (Rango, 1993)
5emorband
5now property Gamma rays Vi5iblel Thermal Microwavesnear~infrared infrared
Snow cover area Low High Medium HighDepth Medium If very shallow Low MediumWater eqUivalent High If very shallow Low HighStratigraphy No No No HighAlbedo No High No NoUquid·water content No Low Low HighTemperature No No Medium LowSnowmelt No Low Low MediumSnow-soil interface Low No No HighAdditional factors- All weather capability No No No Yes- Current best spatial resolution Not possible 10 m 100 m 25 km passive- from space platform 10 km active

CHAPTER 2 -APPLICATIONS OF REMOTE SENSING IN HYDROLOGY
Table 2 - Properties affecting albedo and emissivity of snow (Warren, 1982)
Snow property Visible Near-infrared Thermal infrared Microwavereflectance reflectance emissivity emissivity
Grain size • Yes No YesZenith (or nadir) angle No Yes Yes YesDepth Yes No No YesContaminants Yes No No Noliquid water contact No • No YesDensity No No No YesTemperature No No No Yes
* Only for thin snowpack or if impurities present
15
large scale. Significant remote sensing data for operational snowmapping are available from satellites such as SPOT, Landsat,NOAA, GOES, Sky1ab and DMSP (Lncas and Harrison, 1990).According to Martinec (1987) and Rango et at. (1983), the choice
of satellite for snow mapping depends upon the smallest partialarea of the region to be monitored. While the accuracy of thesnowpack delineation and snow area estimation depends upon thespatial resolution of the sensors involved, operational snow
mapping schemes are rarely necessary for such small areas (Lucasand Harrison, 1990). As a result, the Landsat TM sensor is usuallyapplied within the context of research projects (Lucas and
Harrison, 1990); and in some cases, aerial photographs may bepreferred to TM imagery as these can be collected for selected
cloud-free days and for similar sized areas (Rango et al., 1983).The data from the Landsat and NOAA satellites are
characterized with a lower temporal resolution than, for instance,the GOES satellites. According to Rango et al. (1983), a high
temporal resolution is important, particularly for monitoringchanges in snow extent, due to melt or accumulation, and in the
provision of regular snow cover estimates between stationrecorded observations, such as for runoff forecasting. Rango
(1985) has recommended that the optimum frequency of observation of snow cover during depletion would be once a week.
Furthelmore, "multitemporal observations of a scene may allowthe identification of cloud and snow surfaces as clouds may alterin form and position over time whereas temporal variations in
snow cover are generally less extreme" (Lucas and Harrison,1990; Meier, 1975).
"The areal extent of the snow cover is mapped opera
tionally in many countries using weather satellite data" (Kuittinen,1992). Although snow cover can be detected and monitored with a
variety of remote sensing devices, the greatest application has beenfound in the visible and the near-infrared region of the EMS
(Rango, 1993). The reason is that "the reflectance of snow in thevisible and near-infrared parts of the EMS is much greater than that
of any other natural material on the ground and thus snow can easilybe detected and the extent of snow cover detennined" (Kuittinen,
1992). The reflectivity (albedo) depends upon snow properties such
as the grain size and shape, water content, surface roughness, depthand presence of impurities (Engman and Gurney, 1991). In particu·1ar, the visible red band (0.6-0.7 rom) of the MSS on the Landsat
has been used extensively for snow cover mapping because of itsstrong contrast with snow-free areas (Rango, 1993). Rango (1993)points out that although Landsat and SPOT may provide adequate
spatial resolution for snow mapping, their inadequate frequency ofcoverage hinders their snow mapping capabilities. As a result, manyusers have turned to the NOAA polar-orbiting satellites with the
AVHRR; although characterized with a much higher frequency of
coverage (every 12 hours as opposed to every 16-18 days), theproblem with the NOAA AVHRR data is that the resolution of 1 km
(in the visible red band (0.58-0.68 rom)) may be insufficient forsnow mapping on small basins.
Despite the spatial and temporal resolution problemsassociated with visible aircraft and satellite imagery, these have
proven to be very useful for monitoring both the buildup of snowcover and the disappearance of snow cover area in the spring(Rango, 1993). The NWS National Operational Hydrologic
Remote Sensing Center (NOHRSC) in Minneapolis uses NOAAAVHRR data to operationally provide periodic snow cover extentmaps on about 3 000 basins in North America (Carroll, 1990). The
maps and the map statistics are electronically. sent in near·realtime to a wide variety of users, mostly for hydrological forecasting
purposes (Rango, 1993; Carroll, 1990). Another operational
product by the NWS is the monthly mean .snow cover chartswhich are used for larger scale studies of regional and global
hydrology and climate (Rango, 1993; Dewey and Heim, 1981).METEOR (which has been used to delineate snow/no snow lines
for river basins and other areas in the Russian Federation) andNOAA data were combined to map snow cover area in basinsranging from 530 to more than 12 000 km2 (Shcheglova andChemov, 1982).
Ostrem et at. (1981) developed a method using NOAAand TIROS data for measuring the remaining snow and to predict
the corresponding snowmelt runoff volume for a number ofNorwegian high mountain basins. This work in Norway wasviewed with great interest because the country produces 99 per
cent of its electricity from hydropower with greater than 50 percent of the precipitation in the catchment areas occurring as snow.The largest hydropower company in Norway, Statkraft, used snow
cover extent maps from NOAA AVHRR on an operational basis as
input to its hydropower production planning (Andersen, 1991).Ramamoorthi (1983, 1987) has used snow cover data
from NOAA AVHRR in a regression model for operational forecasts of seasonal snowmelt runoff on the Sutlej River Basin
(43230 km2) in India; these forecasts have been extended to additional basins. Kumar et al. (1991) have used satellite snow cover
data as input to snowmelt runoff models (SRM) for use in operational forecasts of daily snowmelt runoff on the Beas and Parbati
Rivers in India.Although snow can be detected in the near-infrared
band, the contrast between a snow and a no-snow area is consider
ably lower than with the visible region of the EMS. However, thecontrast between clouds and snow is greater in the Landsat TMBand 5 (1.57-1.78 mm). Thus the near-infrared band, when

16 CURRENT OPERATIONAL APPLICATIONS OF REMOTE SENSING IN HYDROLOGY
available, serves as a useful discriminator between clouds andsnow (Engman and Gurney, 1991). Harrison and Lncas (1989) andLncas and Harrison (1989a, 1989b) nsed VIS/NIR difference datafrom NOAA-9 imagery of the UK to locate areas of complete orpartial snow cover and identify melt and accumulation zones.Daily snow area maps were produced and were subsequentlycomposited to generate weekly estimates of snow distribution."TIlls technique is currently being considered for operational usein the UK and elsewhere" (Lucas and Harrison, 1990). The recentinclusion ofa 1.6 mm channel (near-infrared) on the NOAAAVHRR sensor should allow more reliable derivations of snowarea; this may permit direct comparison with visible and/or nearinfrared data, and subsequent calibration of data for the evaluationof snow condition (Schultz and Barrett, 1989).
Thermal infrared data have limited importance for snowmapping and measuring properties because they are hindered bycloud cover, and the surface temperature of snow is not always thatmuch different from the surface temperatures of other surfaces(Rango, 1993). However, thermal infrared data can be useful forhelping identify snow/no-snow boundaries, and for discriminatingbetween clouds and snow with AVHRR data because the nearinfrared band has not been available on this sensor. Furthermore,Kuittinen (1992) stated that the best result in snowline mapping canbe achieved by combining the information of the thermal emissionand the reflectance in the visible part of the EMS.
Although the airborne gamma ray spectrometryapproach is a very accurate remote sensing method for measuringHW, its previously mentioned drawbacks limit its use. However,airborne gamma ray data and weather satellite data togetherprovide good possibilities for operational snow cover mapping(Carroll, 1990; Kuittinen, 1989).
''Although there are currently many problems with usingmicrowave sensing for mapping snow cover, one major advantageof the microwave approach is the ability to penetrate cloud coverand map snow extent" (Rango, 1993). Due to its cloud penetrationor all-weather capability, the microwave wavelength at about1.0 em has the greatest overall potential for snow mapping.However, the current major drawback is the poor passivemicrowave resolutions from space (about 25 km) so that only verylarge areas of snow cover can be detected (Rango, 1993). As resolutions of passive microwave sensors improve (a Russianmicrowave radiometer at about 0.8 cm wavelength with approximately 8 km resolution was launched in 1996), all-weathercapability will increasingly be exploited. The final advantage ofthe microwave spectrum is that night~time measurements areeasily made because of the reliance on emitted microwave radiation as opposed to reflected visible radiation (Rango, 1993).According to Kuittinen (1992), "emittance and backscattering ofmicrowave radiation are affected by almost all snow parameters,which complicates the measurement of the most needed parameters: water equivalent, areal extent, amount of free water."
Hallikainen (1984) and Rott and Knnzi (1983) havestudied the data of NIMBUS-7 SMMR radiometer, bnt its poorspatial resolution and lack of real-time data service do not allowany operational applications (Kuittinen, 1992). The JapaneseMOS-l satellite may change this situation, but its low repeat cycleand poor spatiai resolution may limit its use (Kuittinen, 1992).Chang et al. (1987) lIsed NIMBUS-7 SMMR data to produce asnow extent map of the whole of the Northern Hemisphere.According to Davis and Shi (1993), "large scale snow cover extent
maps are currently produced using geophysical algorithms on thedata from satellite microwave radiometers such as DMSP SSM/I.These maps are most reliable over large flat regions with little orlow-lying vegetation when snow is dry." According to Rango(1993), "the resolution problem can potentially be solved with theuse of high-resolution active microwave sensors. Unfortunately,few, if any; experiments with the short wavelength region of themicrowave spectrum (around 1 cm wavelength) that is sensitive tosnow have been reported." Davis and Shi (1993) found that usingradar, mapping snow in alpine regions by using single~polarization
SAR requires topographic information. Matzler and Schanda(1984) used X-band airborne radar data to map wet snow cover inthe Swiss Alps. RoU (1986) conducted some studies with 3 cmradar over snow with applications limited to a wet snowpack atthis wavelength. According to Kuittinen (1992), ''no space-borneradar exist at present and the usefulness of the planned SARs foroperational snow mapping will be limited by the lack of suitablewavelengths, narrow swath, high processing costs and veryrestricted imaging time per cycle."
2.2.4.2 Snow accumulation
"Even more important than snow extent and location for varioussnowpack processes is the vertical dimension of the snowpack.This vertical dimension essentially provides the informationneeded for estimating snow volume which relates directly to thepotential for snowmelt runoff' (Rango, 1993). There is a lot ofpotential in the capabilities of remote sensing of snow depth orwater equivalent.
According to McGinnis et ai. (1975), visible satelliteimagery can be used to estimate snow depth in areas of relativelyshallow snow accumulation of up to 25 cm; they found a directcorrelation between increasing brightness and increasing snowdepth in areas without tall vegetation cover in the southeasternUSA. Furthermore, this approach is only possible if the area isrelatively flat and has a fairly short vegetation cover (Rango,1994b). According to Rango (I994b), the combination offreqnentvisible satellite imagery and the accurate aerial gamma ray spectrometry can improve the knowledge of snow cover distribution.provide good areal averages for HW and offer real-time snow dataoyer large areas. In addition, it is possible to include the use of aGeographical Information System (GIS) to estimate the HW foreach pixel. Martinec and Rango (1981) used visible satellite snowcover data, a grid system of the basin and air temperatures foreach grid unit to estimate HW at the beginning of the melt season(e.g. I April).
"Airborne gamma ray spectrometry can be used to determine the snow-water equivalent values, because snow attenuatesthe terrestrial gamma radiation" (Kuittinen, 1992). "Backgroundgamma radiation of the soil is obtained before snowfalls, andsubsequent flights are flown to measure the gamma radiationthrough the attenuating snow cover. The degree of attenuation isrelated to the snow water equivalent through various calibrationgraphs" (Rango, 1993). According to Carroll and Vadnais (1980),NOAA's National Weather Service has an operational programmeto obtain such data on the shallow snowpacks of the high plains ofthe upper midwest USA. This operational programme currentlyflies over 1 400 flight lines in the USA and Canada (Carroll andCarroll, 1989). According to Vershinina (1985), the maximumdepth of snow water equivalent is limited to about 30-40 em and

CHAPTER 2 - APPLICATIONS OF REMOTE SENSING IN HYDROLOGY 17
interpretation of the data can be difficult if the background soil
moisture changes during the season. However, Carroll and Vase
(1984) reported measurements in a forest environment with a snow
water equivalent of 48 em. The water equivalent data generated by
this method are being used to calculate snowmelt (Vershinina,1985) and update forecasting models (Bergstrom and Brandt,1985). Furthermore, the technique also has significant importance
for the calibration of areal water equivalent measurements using
microwave sensors mounted on aircraft on space platfonns (Rango,
1993). In addition to the US and Canada, Norway, Finland and the
Russian Federation also use a gamma ray spectrometer to opera
tionally measure snow water equivalent (Rango, 1994b).
According to Lei et al. (1990) and Srivastav and Singh
(1991), "good relationships have been established between snow
depth and microwave emission and backscatter for snowpacks that
are dry and uniform with little evidence of layering" Blyth (1993).
Blyth (1993) further states that "such relationships are not so clear
once the snowpack has been subjected to thaw and re~freeze
cycles, whilst the presence of unfrozen water anywhere within the
snowpack results in marked changes in microwave response. In
general, the use of microwave radiometry appears more reliablethan radar for this type of measurement." Chang et al. (1990) used
NIMBUS SMMR data to divide the Northern Hemisphere snow
map into a number of depth categories. These authors also derived
regional relationships between microwave brightness temperature
and snow and vegetation parameters in order to map HW on aregional scale. "The sensitivity of microwave brightness tempera
ture to HW was found to decrease with increasing vegetation
cover, with forests causing the greatest problem" (Blyth, 1993).
"Additional research needs to be performed to correct for varia
tions in vegetation cover and snow grain size" (Rango, 1994a),because snow grain size also affects microwave measurement of
HW. According to Goodison et al. (1990), the new SSMII data are
being used operationally to produce HW maps of the Canadian
prairies; these maps are now supplied operationally to Canadian
users (Goodison and Walker, 1993).Various researchers, including Stiles et at. (1981),
Matzler and Schanda (1983) and Rou (1986) have indicated that
the active microwave region has a potential similar to the passive
microwave region. However, Rango (1993) points out that not
only are active microwave observations of the snowpack very
sparse and almost non-existent, but the analysis of active
microwave data is more complex than passive data because of the
confusion caused by the effect of surface characteristics (including
soils) and geometry considerations on the reflected radar wave.
However, the higher resolution (10 m from space) of the active
microwave is a considerable advantage over passive microwave.
The major problem, as Rango (1993) points out, is the lack of
sensors at about 0.8 em wavelength for experiments on any kind
of platform. Ullriksen (1985) has conducted research on measur
iug the thickness and water equivalent of snow from a helicopter
using short-pulse radar. Although satellite SAR can provide high
resolution data, current single-frequency systems such as ERS-l
are likely to be limited to the recognition of the onset of melt and
the delineation of wet snow extent (Blyth, 1993).
2.2.4.3 Snow metamorphism
The process of metamorphism occurs continually during the snow
accumulation and ablation seasons. Snow metamorphism is
influenced by the snowpack energy balance, snow and air temper
atures and vapour pressures, liquid water content and impurities
deposited on the surface of the snow (Rango, 1993). Important
snow properties associated with metamorphism include grain size,
albedo, layering, surface temperature and snowpack temperature.
"Remote sensing monitoring of these changes can be accom
plished to a certain degree by selecting the appropriate wavelength
bands" (Rango, 1993). Currently, grain sizes in the snowpack are
difficult to measure by remote sensing. Although microwave emis
sion is strongly influenced by the grain size (Chang et al., 1982),there is no dependable way to quantify grain size with microwave
measurements (Rango, 1993). Although the largest sensitivity of
snow reflectance to grain size occurs in the near- infrared wave
lengths (1.0-1.3 mm), no current satellite sensors make
measurements (Dozier, 1989). Furthermore, the capability of grain
size measurement should increase with the use of future sensors
such as the high-resolution imaging spectrometer onboard the
EOS platform (Rango, 1993). The albedo of the snow snrface
changes in time as grain sizes change and surface impurities
collect on the snow. Albedo is made up of light reflected in all
directions off the snow over all portions of the EMS. Albedo
decreases in the visible region as more impurities reach the snow
surface and in the near-infrared as the size of the individual grains
or clusters of grains increases. As of yet, remote sensing tech
niques have not come up with the total bidirectional reflectance
distribution albedo measurements (Rango, 1993). However,
Dozier et at. (1988) have conducted some research on albedo
measurements. The detection of snowpack layering is possible
using small portable microwave radar systems mounted on skis
and pulled over or beneath the snow surface (Rango, 1993).
Furthermore, similar active microwave wavelength measurements
from space should be possible because of the inherent high resolu
tion of radar (Rango, 1993). The surface temperature of the snow
can be measured with thermal infrared wavelengths from various
altitudes; required measurements are made with NOAA AVHRR
at least twice every 24 hours. When the surface temperature
persists at DOC throughout the diurnal cycle, it can be inferred that
the snowpack is at or near an isothermal condition (Rango, 1993).Microwave techniques can be used to identify the initiation of
melt metamorphosis in the snowpack. A passive microwave
radiometer measures a pronounced jump in the brightness temper
ature when even a small amount of liquid water is produced in a
dry snowpack (Rango, 1993). Finally, it may be noted by a glance
at Table 2 that in most cases simultaneous measurements may be
needed at several wavelengths to determine specific snow proper
ties. The combination of visible, near-infrared and microwave
measurements at various spatial scales as planned for the HOS
mission will provide much of the necessary data for sophisticated
snow measurements and analysis of the snowmelt process
(Engman and Gurney, 1991).
2.2.4.4 Snowpack ablation and snowmelt runoff
As described above, a combination of these wavelengths should
allow a good estimate of the time when the snowpack is ready to
transmit melt water from the surface to lower layers (ripe condi
tion) and to eventually produce runoff at the base of the snowpack
(Rango, 1993). The first empirical approach to estimate snowmelt
runoff using remote sensing was developed by Rango et at.(1977); they used satellite observed snow cover data in empirical

18 CURRENT OPERATIONAL APPLICATIONS OF REMOTE SENSING IN HYDROLOGY
regression models developed for the Indus and Kabul Rivers in the
Himalayas. Rango et at. (l975) used Landsat snow cover data forsome basins in the Wind River Mountains in Wyoming, USA todevelop an empirical curve to relate snow cover on a given date to
the seasonal runoff. Martinec et al. (1983), Martinec et al. (1994),and Martinec and Rango (1986) used remotely sensed snow extentdata from satellites to construct snow cover depletion curves for
use in the deterministic SRM for snowmelt runoff simulation inthe Rio Grande hasin. Martinec and Rango (1987) and Rango and
van Katwijk (1990) used remotely sensed HW and temperaturedata to construct modified snow cover depletion curves for use inthe SRM for snowmelt forecasts in the Rio Grande basin. Kawata
et al. (1988) used Landsat MSS data with SRM to predict runoffand manage water levels in the Sai River dam, near Kanazawa,Japan. The deterministic complex subalpine model, developed bythe US Forest Service to simulate daily streamflow (Leaf and
Brink, 1973) during the snowmelt season is updated by real-timesnow telemetry data and snow cover area data. Satellite snowcover data are being used operationally in the deterministicstreamflow synthesis and reservoir regulation (SSARR) model inthe Pacific north-western US (Engman and Gurney, 1991). TheNWS maintains a hydrologic simulation model in which a vital
component is the snow accumulation and ablation model (Carrollet al., 1993); it uses observed temperature and precipitation data tosimulate snow cover conditions. The simulated model states are
updated throughout the snow season using snow water equivalentestimates obtained from airborne and ground-based snow waterequivalent data (Carroll et at., 1993). Leavesley and Stannard
(1990) used remotely sensed snow cover extent to improve theirhydrograph generation in their energy balance based deterministicmodel PRMS (precipitation runoff modelling system). Marks
(1988) used remotely sensed albedo values in his energy balancesnowmelt runoff model. Finally, as Rango (1993) noted, "it is not
surprising that more of these snowmelt runoff models are turningto remote sensing input data. The remote sensing approach
supplies the kind of areal input that the deterministic, distributedmodels were originally designed to utilize."
In mountainous snow regions, snowmelt becomes animportant component of runoff, making up usually greater than
50 per cent of the total streamflow. In some mountain basins,snowmelt makes up 95 per cent of the runoff. Remote sensing is
usually very successful in mountain regions, especially when theobjective is the mapping of snow cover. This snow cover mappingis only hindered in regions with very dense forest cover.
Engman and Gurney (1991) state that new models thatare developed to use remote sensing data will also improve the
snow hydrology predictions. Engman and Gurney (1991) further
state that the merging of remote sensing data with digital elevationmodelling and GISs enables different types of data to be combined
objectively and systematically. Digital elevation modelling is used
to normalize imagery by using the elevation of the sun and theslope, aspect and elevation of the terrain (Baumgartner, 1988;
Miller et al., 1982). GISs are helpful for combining vegetationmasks with satellite imagery (Keller, 1987).
In order to properly address the problem of climatechange, as highlighted by the Second World Climate Conference
(SWCC) in Geneva, 1990, several important factors must beconsidered (Rango and Martinec, 1994). While the air temperature
will gradually increase in the next decades (Schneider, 1989), thefuture precipitation change is less predictable. In addition, an
important factor of the future climate is the areal extent of seasonalsnow cover. The SWCC concluded that the most important inputsof climate change will be the effects on the hydrological cycle and
water management systems along with attendant increases inextreme hydrological events (Askew, 1991). Rango and Martinec(1994) have used satellite areal snow cover extent data to evaluate
whether a given climate change scenario will speed up or slowdown the seasonal decrease of snow cover area. They have
developed a computer program which is now operational for use onreal basins and is demonstrated on the Rio Grande basin inColorado and the Illecillewaet River basin in British Columbia.
Rango (1992) reported on a worldwide testing of the SRM usingremote sensing inputs with applications for predicting the effects ofclimate change. His initial results show some potentially serious
problems involving water supply, flooding and drought.
2.2.5 Ice on land
Ice on land may exist in the fonn of glaciers, lake and river ice, and
permafrost as well as other more transitory fonns of ice like hoarfrost and rime ice. Land ice, a key component of the globalhydrologic cycle, represents both short- and long-teon storage offreshwater. According to Kuittinen (1992), glaciers consist of multi
year ice which partly melts in spring and increases the streamflow.In mountainous areas, long-term storage of water may result whenthe snow does not melt completely over a number of years, and
turns to fim and, with further compaction and movement, to glacierice. Glaciers cover about 10.8 per cent of the Earth's land surface
but only contain about 2.15 per cent of the Earth's water. However,glacier ice contains about 99 per cent of the Earth's surface freshwa
ter (Baumgartner and Reichel, 1975). Global and long-tenn glacierarea studies are important for the detection and monitoring ofclimate change. Furthermore, in some areas glaciers are an impor
tant source of water for irrigation, water supply and hydroelectricpower generation. Farnsworth et at. (1984) point out that ice cover
on lakes and rivers can significantly affect flows in the rivers. Icecover and the breaking up of icc cover impacts people living orworking along the banks when ice jams cause flooding or when
flowing blocks of ice cause mechanical damage to bridges and otherstructures. Ice cover also affects commercial and recreational trafficin lakes and rivers. Similarly, hydroelectric power generation is
influenced by ice, which at times controls the flow of water, and bythe damage that may be done to generating equipment. Kuittinen(1992) states that the presence of ice cover on lakes and rivers is
important to know when estimating the evaporation from lakes.
Lake ice in high latitudes may be of particular interest as an indicator of regional and even global climate because it can be monitored
for date of fonnation and melt each year. The dates of freeze-up and
break-up of lakes and lake ice thickness are very sensitive to airtemperature (Barry, 1984; Palecki and Barry, 1986). Long-term
storage of water may occur in permafrost regions if the permafrost
contains water in the form of ice. However, permafrost may becomprised of any material (e.g. rock, soil) that remains below ODCfor two consecutive years or longer. According to Kuittinen (1992),
the soil frost existing in winter in high latitudes and altitudes and the
permafrost in the Arctic regions cover about 20 per cent of the landarea of the Earth. Frost and pennafrost affect the infiltration, evapo
transpiration and moisture conditions of the ground. Permafrost alsoprevents groundwater movement (Ron et at., 1985).

CHAPTER 2 - APPLICATIONS OF REMOTE SENSING IN HYDROLOGY 19
"The important characteristics of ice are the extent,amount, temperature and melting rate. All these give valuableinformation, e.g. for predicting the streamflow. The area andthickness of the frozen ground are important to know whensurface runoff and infiltration are studied and estimated,"(Kuittinen, 1992).
Remote sensing techniques for detecting the characteris
tics of ice and frost are at experimental or pre-operational stages.The extent and concentration of lake and river ice can be monitored operationally if needed using air- and space-based methods.Glaciers can also be monitored, because the changes are not rapidand thus clouds do not prevent imaging too often. WMO (l993a)reports that well consolidated applications are reported in the useof AVHRR in ice surveillance and snow monitoring. Apart fromobvious contour detection, ice and snow maps are used to estimatewater reservoirs. Careful modelling of the hydrological basin isrequested, as well as physical models of the relationships betweensnow temperaturelbrightness and total-column water. The successof these applications is very dependent on the particular basin, andsometimes models can be very simple, e.g. in Scandanavia, andsometimes very complex, e.g. in the Alpine region. For large-scaleice surveillance, e.g. over Canada or in the polar caps, the SSM/Iresolution is sufficient to provide age and type classification. Themost commlidated use of SAR images is for ice surveillance inpolar and sub-polar regions, particularly to monitor navigationconditions in certain seas during the frosting and de-frostingseasons. WMO (1993a) reports that scientific works are datedfrom the early 1960s, based on global cloud mapping and polarice extents monitored by means of multi-temporal image analysis,generally calibrated against ground truth. The ISLSCP has established a long-standing database intensively used for evaluating theperformances of climate simulation models.
The areal extent and snow cover of glaciers may be detectedin the visible, infrared and the microwave regions of the EMS. Theareal extent of glaciers can be mapped best using satellite imagery.Today both weather satellites and earth observation satellites can offergood multispectral scanner data for this purpose. Ifparticularly accurate results are needed, stereographic images from space (SPOn oraerial photographs can be used (Kuittinen, 1992). Air- and spaceborne SAR images have also occasionally been used (Hall andOrmsby, 1983). Determination of the snow covered area of the glacieris based on the greater reflectance of snow than of ice in the visibleand near-infrared region. Snow can also be detected when it is wetusing radar (Ron et af., 1985). However, in many cases, clouds interfere with the imagery and snow covered ice is almost impossible todistinguish from clouds (Kuittinen, 1992). The amount of ice inglaciers can be estimated only if the area and the thickness can bemeasured. At present there is no remote sensing method for measuring the thickness of ice in glaciers, but future space-borne radaraltimeters should be able to measure the variation of the thickness ofglaciers. It is also possible to use stereoscopic images for measuringthe shape of the glacier, if the glacier is small (Kuittinen, 1992).Satellite imagery is used in the Russian Federation to estimate theareal extent of glaciers, their movement, traces of avalanches, and theextent and location ofriver icings (Desinov, 1980).
The area and thickness of lake and river ice may bedetected in the visible, thermal and the microwave region of theEMS. Remote sensing measurements of ice cover have beenperformed routinely for large rivers and lakes. In general,remote sensing of lake and river ice can be accomplished using
relatively high-resolution sensors such as Landsat MSS and 'I'M orSAR sensors (Sehneider ef aI., 1981). Gatto (1990) used photointerprelation of Landsat MSS, TM and Return Beam Vidicom(RBV) images to produce ice conditions on the Allegheny,Monongahela and Ohio Rivers in the central USA for the period1972-1985. Landsat-derived ice observations comparedfavourably with available ground and aerial observations 64-80per cent of the time. Lake and river ice is easy to detect when it issnow covered, but during periods of thaw and freezing up, theinterpretation of ice is very difficult (Sclmeider et al., 1981). Thisis due to low reflectance of new ice and snow-free wet ice in thevisible and near-JR regions. Ice can melt rapidly and thus only aweather satellite can provide data frequently enough for thehydrologist. The medium-grade spatial resolution of polar-orbitingweather satellite data limits the use of remote sensing to thelargest lakes and rivers if air-based methods are not used(McGinnis and Schneider, 1978). Cloudiness, however, spoils theimages in many cases, thus limiting the application of operationalice monitoring methods. Large-swath radars would greatlyimprove the operational ice-monitoring potential (Kuittinen,1992). Ice thickness has been measured using passive microwaveradiometers in helicopters and aircraft (Hall et aI., 1981) and pulseradar techniques (Finkelstein et al., 1987). The method is not inoperational use because its accuracy greatly depends on the icetype measured. The movement of ice can be detected only withfrequent observations. Weather satellite data can be used, but therelatively low spatial resolution and cloud cover limit the usefulness of these data. WMO (l993b) reports that charts of iceconditions based on METEORMderived data are used in theRussian Federation to refine forecasts on ice. formation and icedrift on large lakes and reservoirs. An all-weather sensor radarwould produce ideal data, but the amount of these data is and willcontinue to be limited due to the narrow swaths and small imagingtime per orbit (Kuittinen, 1992).
The areal extent of permafrost may be detected in thevisible, near-infrared and the microwave region of the EMS.According to Kuittinen (1992), frost and permafrost cannot bedetected directly by space-based remote sensing because in mostcases vegetation, snow and ice prevent observation of the grounditself and sufficiently low microwave frequencies cannot be used.From low-flying aircraft, however, the detection of permafrostduring summer is possible with low frequencies (489 MHz) usingshort-pulse radar (Hall, 1982). This is especially useful in thediscontinuous zone of permafrost. Vegetation, land forms andwatercourses are used as indicators of permafrost when multispectral scanner data are used (Hall and Ormsby, 1983).
Shuman et al. (1993) used SSMII brightness temperature trends and field observations to identify multiple hoardevelopment episodes in Central Greenland.
2.2.6 Surface water
Surface water which may occur in the fonn of lakes, ponds, reservoirs, rivers, streams and areas temporarily covered by water is amajor hydrological basin storage component. Important measurements regarding surface water include water quantity and waterquality. Quantitative measurements include surface area, volume,stage/level and depth. Qualitative measurements include temperature, salinity and mineralization, suspended sediments,

20 CURRENT OPERATIONAL APPLICATIONS OF REMOTE SENSING IN HYDROLOGY
chlorophyll, vegetation biomass and other man-made pollutants.The quantitative measurements play an important role in water
delivery and drainage to both agriculture and urban areas andflood control. The qualitative measurements play an importantrole in describing whether or not the water is usable or whether or
not the surrounding environment may be endangered by pollutantsin the water (Engman and Gnrney, 1991). In the past, virtually all
of the surface water measurements have, by neGessity, been esti·mated via point measurements. Point measurements can be madevery accurately and have the ability to sample the variablesextremely well in the temporal domain (through the use of electronic data logging, five-minute sampling rates are notuncommon) (Blyth, 1993). While these point measurements may
be well suited to the needs of process studies and small basinstudies where relatively dense instrument networks can besupported, as the area of interest increases, they are unable tosample spatial variability sufficiently. Although remote sensingcan never approach the point accuracy of groundmeasurements,
remote sensing techniques provide the most efficient means ofsampling the spatial domain. Furthermore, remote sensing techniques have the ability to monitor and inventory water bodiessynoptically in areas or situations that are difficult to monitorusing conventional methods, and multitemporal images can detectchanges in the extension of water bodies.
2.2.6.1 Surface water area
Mapping water surrace area is an important operational techniquerequired for two main objectives. One objective is to delineate the
land-water boundaries for the purpose of flood monitoring, measuring flooded areas, floodplain mapping and wetland mapping. A
second objective is to delineate the surface water bodies for thepurpose of surface water supply inventories. According to Hockeyet ai. (1990), while delineation of water surface areas in· theory is
relatively straightforward, in practice the poor availability of suitable imagery, and the lack of empirical calibrations for local
conditions, make operational use of this variable unlikely in thenear future. Furthermore, data on the required accuracy and spatialresolution and temporal sampling frequency for remote sensingpresented in Appendix II, Table 1 as compared to the specifica
tions for satellite sensors in the foreseeable future presented in thetable in Appendix III make this prospect clear. According to
Salomonson (1983), a rule of thnmb is that to be reliably detectedin an image, a water body should have dimensions double that ofthe pixel size.
The delineation of land-water boundaries depends on therelative spectral characteristics of soil, vegetation and water
(Engman and Gurney, 1991). Wavelengths in the near-infrared
region provide the best data for delineating the land-water interface because of the very low reflections of water in this region of
the EMS. Microwave data are also ideal for identifying land-water
boundaries because the dielectric constant for water is considerably greater than that for soil or vegetation-covered soil (Engman
and Gurney, 1991). The areal extent of flooding has successfullybeen mapped using black and white photography, infrared photo
graphy, thermal infrared data, multispectral scanner data and radar.For most of these remote sensing techniques, determining areas of
inundation depends upon measuring reductions in reflectivitycaused by standing or flowing water, high soil moisture, moisture
stressed v6getation and temperature changes. Because these
effects last for some time after inundation and may de detected forup to two weeks or longer after the passage of a flood, the need to
obtain data exactly during the flood "peak may not be necessary(Engman and Gurney, 1991). Flood damage may be estimated
from multiple images of the flooded area. Sediment-laden watermay give a considerably higher reflectance than clear water and
result in confusion when delineating the land-water boundary.Thus, Landsat may be a valuable source of data when no ground
surveys are available.Corbley (1993) used Landsat TM data for monitoring
the Great Flood of 1993 in the Midwest of the USA. NOAA(1994) highlights that high-resolntion satellite data from SPOT
and Landsat are extremely useful in assessing the extent ofdamage caused by natural disasters. EOSAT (1993c) reports that,during the 1993 flood in the Midwestern US, EOSAT and ERDAS
Inc. set up an emergency situation room at EOSAT headquarters toanalyse and interpret Landsat flood-zone imagery for the USAnny Corps of Engineers and Federal Emergency ManagementAdministration (FEMA). Staff members from EOSAT andERDAS input the Lands"at data into a GIS where these werecompared with archived imagery to create classification maps of
the flood areas. The Lands-at data provided comprehensive assessment of the devastation and provided a valuable resource toutilities, insurance companies, engineering and consulting firms,as well as government agencies for evaluating the damage and
making plans to rebuild. EOSAT (1993a) reports that Landsat TMimagery helped monitor and quantify the extent of flooding of theFitzroy River in Australia, and was an invaluable information
source for relief services and planners. Wiesnetand Deutsch(1985) nsed the NIMBUS-7 coastal zone colonr scanner (CZCS)
data to analyse the Parana River flood. They concluded that in theabsence of Landsat data, CZCS imagery provides a very suitable
alternative for delineating large floods even though its resolutiondoes not approach that of Landsat, although somewhat better thanthat of the NOAA AVHRR (825 m for the CZCS as compared
with 1 100 m for the NOAA AVHRR). In spite of the coarser resolution (1 100 ill versus 80 m for Landsat), the NOAA satellite
thermal infrared sensor has proved effective in measuring areas offlood innndation (Berg et al., 1981; NOAA, 1994). Fnrthermore,the NOAA satellites have the advantage of more frequent coverage(twice~daily average versus IS-day coverage for Landsat). Ali et
al. (1987) have nsed AVHRR Channel 2 data to delineate floodedareas in Bangladesh. Blasco et al. (1992) used SPOT data to esti
mate the extent of floods in Bangladesh. McKim et ai. (1972) usedERTS-1 imagery to map flood waters in the national programme
for the US for the inspection of dams. India used data from IRS aswell as Landsat, SPOT and NOAA satellites on a routine basis to
obtain near-real-time infonnation on damages due to floods. Flood
maps showing areas in standing water and wet areas and cropdamage information are being provided in India within a week to
district authorities entrusted with the task of providing relief (Rao,1989).
All-weather flood mapping is possible with active or
passive microwave data. Microwave data are ideal for this application because cloud cover frequently present during floods does not
obliterate the target area and in most cases a sharp land-waterbonndary can be defined. The NOAAlNESDlS scientists (NOAA,
1994) used passive microwave data from the DMSP F-10 andF-ll series of polar-orbiting satellites to monitor the Great Flood
of 1993 in the Midwest USA. Under similar situations, radar

CHAPTER 2 -APPLICATIONS OF REMOTE SENSING IN HYDROLOGY 21
systems are capable of higher spatial resolution than passivesystems. Although the NIR part of the EMS is most suitable for
delineating land-water boundaries, the dynamics of the land-waterboundary can best be monitored with cloud-penetrating radar.Blyth (1993) states that the most important factor determining theability of airborne or satellite radar to detect inland water bodies is
wind-induced roughness of the water surface. Furthermore.smooth water behaves as a specular surface feature which reflectsmost of the radar energy away from the antenna and results in the
water body appearing black in the radar image. In most situations,this is in sharp contrast to the surrounding land surface which is
rougher and results in much higher backscatter. Current satellite
ground resolution is about 25 m which restricts applications formajor river systems or poorly monitored areas (Blyth, 1993). Ofthe satellite SARs planned for the near future, RADARSAT maybe the most useful for operational purposes using the optionalScansar mode to provide complete coverage of the NorthernHemisphere north of 49°, with a three-day return period (Ahmedet al., 1990). Imhoff et al. (1987) used the Shuttle imaging radar(SIR-B) to map flood boundaries and assess damage over areas ofBangladesh. The digitally processed and geometrically rectifiedradar data were compared with earlier Landsat data to estimate theareas of inundation subsidence. Research in this area is stillneeded to understand how vegetation shadows, depressions, etc.affect the radar response before it can be used on a satellite system(Engman and Gurney, 1991). However, a study by Ormsby et al.(1985) has shown that L-band radar data acquired by SEASATand SIR-A can detect flooding under forest canopies. Richards et
al. (1987) proposed a backscatter model for L-band HH polarized
data that explains the increased backscatter observed from floodedforests. According to Engman and Gurney (1991), it appears thatradar will be extremely useful for monitoring floods and landwater boundaries under vegetative canopies, but there is still agreat deal of research needed to define all the system and targetparameters necessary for a useful system.
EOSAT (1993b) and RADARSAT Internatioual, Inc.
(RSI) (COSPAR, 1993) have illustrated the power of mergingSAR data from ERS-1 radar satellite with multispectral sensordata from Landsat and SPOT, respectively, to monitor the 14 July1993 floods in St Louis, MO. EOSAT (l994b) reports that duringthe late December 1993 torrential rains in France, Germany,Belgium and the Netherlands, which triggered the worst flood inEurope in more than 60 years, the ERS-I SAR image recorded theflooding as it occurred in the German cities of Cologne, Bonn andDusseldorf. Furthermore, the ERS-l SAR/Landsat TM mergedimage provides important infonnation for studying the effects ofthe swollen Rhine in the region south of Dusseldorf.
Floodplains have been delineated using remotely senseddata to infer the extent of the floodplain from vegetation changes,soils or some other cultural features commonly associated withfloodplains. Landsat-delineated floodprone area signatures werefound to have, as yet, a relatively unexplained correlation with the100-year flood boundaries. Furthermore, although Landsat TMand SPOT data give better results and more accurate delineation offloodprone areas, for many legal requirements it is necessary tomap floodprone areas from high-resolution aerial photography(Engman and Gurney, 1991). The environmental importance ofwetland mapping has led to an increased awareness of thisresource, and a primary requisite to management and protection ofthese areas is an accurate map and inventory. Any inventory
includes the area and volume of the water body, the boundaries,vegetation types and patterns, and water movement directions
(Reinhold and Linthurst, 1975). Remote sensing is a very usefultool to carry out this type of inventory because wetland studies aregenerally conducted for large and relatively inaccessible areas.Most large-scale applications involve delineation of the wetlandsin tenus of the upland boundary and mean high-water mark, aswell as the major species of vegetation. Generally, the vegetationis used to identify the boundaries since the species of vegetation isusually indicative of the depth and duration of inundation (Carterand Schubert, 1974). Because of the importance of vegetationidentification, most applications require the use of seasonal multispectral data that include visible and near-infrared measurements(Salomousou, 1983). Low-altitude black and white, panchromatic,colour, infrared and thermal photography have all been usedsuccessfully in wetlands mapping. The resolution of current satellite data limits some of their applications to wetlands (Engmanand Gurney, 1991). In many cases, Landsat data will not yield ashigh an accuracy as can be achieved with aerial photography(Werth and Meyer, 1981; Gammon er al., 1981). Furthermore,Ackleson et al. (1985) concluded that the higher-resolution SPOTdata delineated water masses with a high degree of accuracy.Landsat data have been used to make estimates of wetlands watervolumes on a monthly basis by combining depth/stage relationships with surface water area (Higer et al., 1974). Finally, anadditional aspect of wetlands management involves the extent ofdredging, lagoons drainage and other man·induced changes thathave an impact on the natural environment. Furthennore, remotesensing is well suited to operationally monitor these changes andto make preliminary estimates of the enviro~ental impact. Thetemporal aspect of Landsat data allows changes to be observedover time and in some cases predevelopment baseline data to beobtained from early scenes (Engman and Gurney, 1991).
The delineation of surface water bodies and the inventory of surface water supplies, including lakes, ponds andreservoirs, have historically been done using photointerpretationtechniques, but recently digital multispectral data have also beenused. Multispectral data can be used with an automated analysisprocedure to achieve repetitive, rapid results that in many casesalso meet the accuracy requirements. In general, the accuracy ofdetection and measuring water bodies has been largely a functionof proper identification of water and the sensor spatial resolution.Identification problems involve confusion with areas with similarappearance, such as cloud shadows, dark soils and urban areas.However, aerial photograph interpretation can be used to minimizethese errors and to check the initial results. Therefore, forextremely accurate work, aerial photographs provide the bestsources of data. Satellite data also provide good sources for determining morphometric parameters (such as length, width andsurface water area for different elevations) if the resolution is suitable for the specific use. From a remote sensing perspective, waterhas a relatively low reflectance, especially in both the nearinfrared and visible portions of the EMS. This fact will help toseparate urban areaS, fields and sometimes cloud shadows, andambiguities produced by variations in atmospheric transmission(Engman and Gurney, 1991). The use of TM data with its 30 mnominal resolution will increase these accuracies. Furthermore,the data from SPOT will be even better, with the expected accuracy being improved (Engman and Gurney, 1991). "Remotesensing, for the most part, can only determine the surface of the

22 CURRENT OPERATIONAL APPLICATIONS OF REMOTE SENSING IN HYDROLOGY
water and cannot measure the volume directly_ Mapping surfacewater area in reservoirs can be llsed to estimate the volume of
water in storage. The procedures that are used to estimate lakevolumes depend on an empirical relationship between surface areaor shoreline length and volume. Either an area/volume relationship
may be developed or topographic features can be used to estimatethe water stage in the reservoir and then relate the stage to water
volume. Government agencies can use this approach not only tosupplement data they obtain for the reservoirs they manage, butalso to maintain an awareness of reservoirs they do not control but
which may affect their own management strategies under extremeconditions such as major flooding. These techniques clearlydemand high .spatial resolution data except under extreme flood
conditions" (Engman and Gurney, 1991).
2.2.6.2 Surface water stageRevel
"Radar altimeters, as shown on the SEASAT and GEOSAT satellites, although designed for use over the oceans, have alsoprovided useful information on inland water level and extent"(Blyth, 1993). Such measurements from satellites require accurate information on the satellite position and atmosphericconditions. These satellite measurements are only applicable for
large water surfaces' due to spatial resolution. Mason et aI. (1990)
were able to monitor lake changes to +25 em. Cudlip et al. (1990)
found that in wetland regions, changes in water level could be
measured with a precision of 10-15 em if adjacent areas of fixedor known surface elevation were available to reduce the effect ofsatellite orbit error. According to Blyth (1993), preliminary
results from the ERS-l radar altimeter suggest that water levelprecision better than 10 em should be possible over approxi
mately 700 large lakes (> 100 km2) worldwide and over manysmaller lakes and wetland areas to a precision which will vary
according to the size and location of the water body. Furthermore,Mason et al. (1990), Birkett (1994) and Birkett (1995) state thatthrough global monitoring of such water bodies (and especially
'closed lakes') using radar altimeters, it may be possible to obtaina proxy measure of climate change. Morris (1993) reports thattemporal changes in the altimeter-derived lake levels are actually
a combination of real lake-level variation and altimeter error.Morris developed a technique to overcome this problem andapplied it to data collected over the Great Lakes by GEOSAT
(11/86-11188, 17-day repeat cycle) and Topex/Poseidon(9/92-7/93, 10-day repeat cycle). Lake levels obtained from theGreat Lakes Division, NOAAJNational Ocean Service, were used
as ground truth. The GEOSAT results have a root mean square
(RMS) error of 11.1 em, while the Topex/Poseidon provides asubstantial improvement with an RMS error of about 5 em. Not
only is the annual cycle of the lakes accurately measured, butsubtle changes in lake level are also detected. Furthermore, the
TopexIPoseidon is in place over more than 45 inland bodies of
water, which suggests that this satellite could provide a significant database for hydrological research. Laser profiling
techniques from airplanes can be used to measure water storageaccurately. With accurate knowledge of the altitude of the
airplane using Global Positioning System (GPS) navigation,accurate water stage can be measured. If GPS navigation is not
available, then water stage can be detennined with laser profilingby measuring a site of known elevation and relating water stage
elevation toJhe known elevation (Rango, 1994b).
2.2.6.3 Surface water depth
Surface water depth measurements are based on the penetration oflight into the water and reflectance of this light from the bottom tothe sensor. The best part of the EMS is between 0.5 to 0.7 mm
(Kuittinen, 1992). Saxena (1982) has studied the use of aerialphotography, multispectral scanners and lasers in this context. Themain difficulties in mapping water depth are the variations in
bottom types and water turbidity; these both interfere with thecalibration of the optical methods (Kuittinen, 1992). According to
Kuittinen and Sucksdorff (1984), using aerial photography, waterdepths up to several metres can be measured in lakes and theerrors are generally about 0.5 m. Ibrahim and Cracknell (1990)
used Landsat scanner data and aerial photography in the0.4-0.6 mm spectral range to measure the water depth nearPenang Island in Malaysia. Lyons et al. (1992) used airbornemultispectral data and models of the light interaction with water
for general assessment of river bottom soil types and water depthsin their study area in St Mary's River, Michigan. Penney et al.(1989) measured water depths up to 50 m using a dual-lasersystem. For the dual-laser system, one wavelength (usuallybetween 0.6 and 1.0 mm) is reflected by the surface water whilethe second wavelength (usually between 0.4 and 0.6 mm) pene'
trates the water and is reflected by the bottom sediments. Thedifference between the two laser measurements is water depth.Furthermore, water clarity (colour, turbidity, suspended sedimentsand chlorophyll) will limit the application of optical techniques
for measuring water depth (Rango, 1994b). Atcording toKuittinen (1992), the use of radar which gives only an indication
of water depth can sometimes be useful in turbid waters. Themeasurement of the bottom topography by radar is based on
observation of changes in waves and currents at the water surface,which are both affected by the bottom topography.
2.2.6.4 Surface water temperature
"Surface water temperatures have been detennined operationallyfor many years, mainly using weather satellites and airbornescanner data" (Kuittinen, 1992). For instance, Ibre et al. (1979)
used satellite infrared data to measure the daily surface watertemperatures of Lake Ontario in Canada. Remote sensing measurements of emitted thermal infrared and microwave radiation can be
used to estimate surface water temperatures. The surface temperature seldom represents the water temperatures farther below the
surface and, furthermore, the temperature profile cannot beobtained by the remote sensing techniques. However, Engman and
Gurney (1991) point out that thermal maps of surface temperatureshave been useful for siting discharge pipe from factories and
thermoelectric generating stations. The use of thermal infraredradiation requires calibration which is performed with data from
another channel to correct the attenuation effects of the atmos
pheric moisture. Gibbons et al. (1989) used thermal infraredradiation measurements from Landsat TM and the NOAA AVHRR
to measure surface water temperature. Lathrop and Lillesand(1987) used Landsat thennal TM to map surface temperature distri
butions in the Great Lakes. Gagliardini and Karszenbaum (1987)used NOAA AVHRR to map surface temperature in La Plata
estuary. Aircraft measurements of thermal infrared and microwaveradiation data have been used to measure surface water temperature
and to map thermal flows from dams and power plants {Rango,

CHAPTER 2 - APPLICATIONS OF REMOTE SENSING IN HYDROLOGY 23
1994b). Although microwave estimates of water surface temperature are less dependent on atmospheric conditions, they providecoarser resolution than thermal infrared data (Shutko, 1985, 1986).
Furthermore, Kuittinen (1992) reports that although the scanning
microwave radiometer of the satellite NIMBUS-7 has been used instudying water surface temperatures, the very poor spatial resolu
tion will continue to prevent the use of microwave radiometers in
mapping inland water temperatures.
2.2.6.5 Surface water salinity and mineralization
Shutko (1985, 1986, 1987) has shown by theoretical studies and
demonstrated by experiments in laboratories and on aircraft platforms that microwave radiometry can be used to measure salinity
and general mineralization of water. This application makes use of
the sensitivity of microwave emissivity to water conductivity variations caused by changes in concentrations of salts, acids andother chemicals including waste water outflows. In addition tomeasurements of microwave brightness temperature measurements, actual physical water temperatures must be estimated bythennal infrared techniques (Rango, 1994b). For obtaining quantitative estimates of salinity and mineralization, measurements haveto be conducted at microwave lengths of 10 em or longer (Shutko,1985, 1986, 1987). Furthermore, this approach works best wherethere is a strong contrast in the salinity, such as in coastal regions.
2.2.6.6 Surface water suspended sediments
The determination of the amount of sediment in water is based onthe reflectance of radiation in the visible and infrared parts of theEMS (Kuittinen, 1992). In general, reflection is a nonlinear funcLion of the concentration of suspended sediments with maximumreflectance dependent on wavelength and suspended sedimentconcentration. Because turbidity and suspended sediments areclosely linked in most water bodies, estimates of turbidity can alsobe made. Curran and Novo (1988) used satellite and aircraftscanner data to estimate suspended sediments. Scanner data couldbe used to develop a monitoring programme to follow changes insuspended sediments. A limitation on the use of this technique isthe need to collect field data to calibrate the relationship betweensuspended sediments and reflectance. Ritchie and Cooper (1991)report that calibration curves are not time dependent and may beapplicable to regional areas. Furthermore, scanner data can beused without calibration data to map relative suspended sedimentconcentrations in river plumes and draw conclusions about sediment deposition patterns in lakes and estuaries. Some examples ofsuspended sediment measurement from airplanes up to 50 mg/l
are given by Gitelson et al. (1988) and Shutko (1990). According
to Engman and Gurney (1991), water bodies that have highsuspended sediment concentrations would pinpoint upstreamwatersheds where major erosion problems are present. Thus,conservation agencies could use this information to plan erosioncontrol strategies and focus their efforts on the most seriouslyaffected areas. Soliman and Zaki (1986) observed the propagationof silts with the advancement of the Nile flood in the Aswan Damwith the aid of Landsat imagery. Manikiam et at. (1993) usedmulti-date data from the IRS-IA satellite to analyse sedimentationlevels and dispersal patterns for the coastal region of Mangalore inSouthern India. Digital techniques were used to bring out the varialions in sedimentation patterns (up to 14 levels) for the pre- and
post-monsoon seasons. SPOTLIGHT (1993) reports that usingspar data and GIS technology, the state of Maryland is monitoring sediment and nutrient runoff loads from agricultural areaswithin the Chesapeake Bay watershed.
2.2.6.7 Surface water chlorophyll
Concentration of chlorophyll can be estimated using aircraft orsatellite scanner data (Gitelson et aI., 1988; Shutko, 1990;Strumph and Taylor, 1988). Calibration data are needed to quan
tify the relationship between chlorophyll and reflectance.Estimates of chlorophyll in oceans and estuaries have been madeusing data from CZCS, AVHRR and other satellite scanners.Current satellite scanners provide only broad wavelength data thatmay be useful to determine chlorophyll in surface waters with low« 25 mgll) suspended sediments. At higher suspended sedimentconcentrations, the reflectance from suspended sediments willmask the chlorophyll reflections in these broad wavelengthsmaking estimates of chlorophyll very difficult (Ritchie et at.,1992). Future satellite scanners with higher spectral resolutionmay make it possible to determine chlorophyll in the presence ofsuspended sediments. Using the same principles, macophytes andother aquatic vegetation in surface water can be mapped(Ackleson and Klemas, 1987). Furthermore, laser-induced fluorescence has been used for observation of chlorophyll in terrestrialwater bodies (Brislow et al., 1985).
2.2.6.8 Other pollutants in surface water
Oil spill detection and monitoring on surface waters using scanner,laser or radar data are operational programmes (Cross, 1992).Remote sensing programmes are used routinely to follow the fateof oil spills in surface water. Changes in water colour due tonatural organic chemicals may change reflectance (Carder et at.,1991; Davies-Colley et al., 1988). Remote sensing of these colourchanges requires high spectral resolution data. Laser-inducedflourescence has been applied mainly in the marine environment,for example for the detection of oil pollution (Camagni, 1988).Huhnerfus (1986) points out the inadequacies of airborne radarand infrared radiometers and/or a LIDAR system in discriminatingbetween crude oil spills and monomolecular sea slicks.Furthermore, Vane and Goetz (1988) state that the availability ofincreasingly sophisticated devices may permit the identification ofmore pollutants and it will be interesting to see what the airborneimaging spectrometers have to offer in this regard.
Observations of colour are often made to evaluate theamounts of living and non-living substances in the water. Planktonalgae are commonly associated with specific colours: blue-greenalgae are linked to dark-green colours; diatoms impact a yellow oryellow-brown hue; some zooplanktons impact reddish hues;whereas humas can cause water colours to vary from green to darkbrown. Although dissolved chemicals can impact a specific colourto a water solution, these changes are frequently too subtle orobliterated to other sources of colour in natural water and theseare generally not detectable by common remote sensing techniques. Furthermore, inexact corrections for atmosphericabsorption of reflected light also inhibit the measurement of truecolour by remote sensing techniques (Engman and Gurney, 1991).The NIMBUS-7 CZCS and the Landsat and SPOT series canprovide valuable spatial and temporal maps of specific COIOUTS that

24 CURRENT OPERATIONAL APPLICATIONS OF REMOTE SENSING IN HYDROLOGY
can be related to specific water quality indicators (Engman and
Gurney, 1991). Feldman et al. (1984) used NIMBUS-7 data totrack changes in colour that they associated with phytoplanktonconcentrations. These data documented a major redistribution of
phytoplankton around the Galapagos Islands. Viollier et al. (1978)performed a series of ocean colour measurements with special
airborne radiometers to estimate the chlorophyll content over theGulfof Guinea.
WMO (1993a) reports that observations of water quality
have been attempted with AVHRR images, supported as practicable by Landsat and SPOT imagery. Direct observation of seapollution, e.g. oilspills and large algae extensions, is beingreported. The_results appear very occasionally, and are more suitable for scientific publications than for practical purposes.Convincing applications have been based on the CZCS data,
which are now only available from archives. The ability tomeasure chlorophyll concentration and suspended sediments,either inorganic or of an organic nature, has been well proven withCZCS. Future instruments should possibly combine the colour andtemperature measuring capabilities for a more comprehensiveobservation of coastal waters. Kondrat'ev (1992) has scoped
scientific priorities as a basis for developing a global ecologyobserving system in the US. Global monitoring of the land andworld ocean bioproductivity (phytoplankton and forest dynamics)is characterized as a high-priority task.
2.2.6.9 Surface water vegetation biomass
Airborne microwave radiometers, operating at centimetre anddecimetre wavelengths, may be used to detennine some character'
istics of vegetation above the surface of various water bodies.Biomass and density of the vegetation can be determined in river
deltas, marshy wetland areas and rice fields using Landsat TMimagery (Shutko, 1986, 1990; Gross ef aI., 1987). Freshwaterlakes and reservoirs in the southeastern US often produce large
beds of persistent and non-persistent aquatic macrophytes. Jensenet al. (1993) analysed multiple date SPOT panchromatic data
(10 x 10 ill spatial resolution) obtained in April and October of1988 through 1990 to inventory the spatial distribution of cattailand water lily beds in a freshwater reservoir located on theSavannah River Site in North Carolina.
2.2.7 Basin characteristics
Physical basin characteristics include basin boundary (shape),area, drainage density; length, slope (topography), land uselland
cover, soil type, vegetation canopy and channel cross-sectional
properties. Basin characteristics are required for the estimation ofhydrological model parameters. All hydrological models that are
to be applied at the basin scale require parameters that link thehydrological processes describing the input, storage and output of
water to the physical characteristics of the basin. Most of the basin
characteristics are either fixed or change only seasonally.Fiuthennore, conventional estimates of basin characteristics have
often been from inaccurate or obselete maps. Secondary to basincharacteristics are phenomena such as desertification, erosion,sedimentation and forest fires.
Remote sensing techniques, especially satellite based, offer
promising potentials of mapping basin characteristics on a repetitive
basis as needed. Data from satellites like Landsat TM andspar withtheir high spatial resolution are of particular value. Furthennore, withtheir aid, it is even possible to identify seasonal changes of model
parameters giving rise to different hydrological behavior (e.g.winter/summer infiltration behavior in rainfall-runoffmodelling).Therefore, newer distributed system models based on Landsat and
SPOT data allow hydrological computations with higher resolutionin space, thus rendering higher accuracy (Schultz and Barrett, 1989).
Important qualities of remotely sensed data to be used for basincharacteristic inventories include spatial and spectral resolution, arealcoverage, cost and timelines (Roller, 1984). However, Kuittinen
(1992) points out that all other infonnation available, e.g. maps andpossibly some field records, should also be used in the inventory to
obtain the best possible result. Because the use of remote sensing todetennine basin characteristics requires a significant amount of dataprocessing and interpretation in addition to various types of maps, theoptimal benefit of future inventories of basin characteristics will be
achieved if a GIS is used. Use of a GIS will allow the flexible use ofinfonnation and combination of all geocoded data with- the data onbasin characteristics. The combination of GISs with satellite imageryfonns the basis of detailed infonnation on hydrological systems andthus more accurate modelling. The ultimate value of a OIS, in regardsto the watershed, lies in its ability to organize and input data for
models that simulate hydrologic processes. Such systems or modelscan be used for analysing trends or for predicting consequences ofplanning decisions. For instance, the model parameters based on older
imagery will differ from those after landuse changes have occurred.Thus, the effect of landuse changes on hydrological processes can be
quantified with the aid of hydrological models; the model parametersare calibrated with the remote sensing data before and after these
changes (Schultz and Barrett, 1989). Although remote sensing inputsdo not represent the primary source of data, they do represent a
potential source of new data for the OIS. Therefore, the efforts tomodify or design hydrological models to be compatible with remotesensing data is easily justified on the basis of potential improved
simulation accuracies and a better understanding of physicalprocesses. Furthermore, because remote sensing methods are
sometimes expensive, they can be justified only if good hydrologicalmodels are available and these models have been proven to besufficiently useful (Kuittinen, 1992). The full advantage of remote
sensing lies in the ability to provide up~to-date landuse and basincharacteristics data for inclusion in distributed hydrological models(Blyth, 1993).
Remote sensing techniques used to estimate basin characteristics include aerial and satellite imagery in the visible,
infrared and microwave regions of the EMS. Also, laser remotesensing is a rapidly expanding research area with potential appli
cations for estimating several basin characteristics: Although
conventional aerial photography allows mapping of basin characteristics on the necessary scales, the use of aerial imagery will be
limited to some extent because of the high-resolution satellite
imagery. Furthennore, the spectral resolution attainable with scanners makes their data more suitable than cameras for various
mapping and inventory purposes. Electro-optical sensors will bethe main satellite-based sensors available for mapping purposes.
Scanning sensors with wavelengths ranging from shortwavevisible data to longwave microwave data are either currently in
orbit or being launched. The all-weather, day-night capability ofmicrowave data is especially advantageous and results of experi
mental inventories using radar (active microwave) data are quite

CHAPTER 2 - APPLICATIONS OF REMOTE SENSING IN HYDROLOGY 25
favourable (Brisco et af., 1983; Foster and Hall, 1981). But abetter understanding of how microwaves respond and react todifferent kinds of media is needed before these data can beutilizied in an operational way. According to Blyth (1993), themonitoring of basin characteristics using remote sensing is an area
which has seen slow progress in the past, mainly because of thelack of suitable satellite monitoring systems. However, this situation should improve as new microwave sensors come into use.Furthermore, most basin characteristics could be supplied foroperational purposes using remote sensing from aircraft becauserepeat coverage is not a prerequisite. Using satellite-based electrooptical systems, scales of up to 1:50000 may be obtained (Doyle,1984). Due to the stereoscopic capabilities of the SPOT satelliteand the high spatial resolution of its sensors (10 m), the smallesterrors achieved are now 5-20 m in both the vertical and horizontalplanes. For economic reasons, however, the most suitable scalesare those of I: 100 000 to 1:250000. It should be stressed thatincreasing spatial resolution means increased amounts of data andprocessing costs, and for each task the spatial resolution must beselected carefully. For watersheds larger than 10 000 km2, datafrom polar-orbiting satellites having reduced resolution capabilities are more practical (Tarpley, 1984).
Conventional aerial photography is still the most suitable remote sensing technique for measurement of channelcross-sectional properties/dimensions including channel erosionand profile, water depth and even flow rate; additionally, overlandflow and basin boundaries in flat areas. This requires large-scalephotographs, preferably stereoscopic images. Therefore, satelliteimages are less suitable for channel dimensions measurement dueto the picture element presentation of the images (Kuittinen,1992). Furthermore, although the best accuracy for landcovermapping can be achieved using aerial photography, the cost of thedata is much higher than with satellite imagery which, however,gives poorer results (Kuittinen, 1992). Kienegger (1992) developed a new system concept and method of implementation forfilm-based data capture and updating of geographic information.Use is made of a novel film scanning concept that permits thecomplete integration of aerial photographs into the data acquisition and maintenance task. The system was employedoperationally for the collection of impervious surface informationto build the basis for a billing system for the waste water servicecharge of the City and County of Denver, Colorado.
The visible and near-infrared region of the EMS iswidely used for mapping basin shape, area, drainage density,length, topography, landcover, soil type, vegetation canopy andchannel sinuosity. This is mainly due to its relative ease in interpretation since the energy that is sensed is reflected energy(Salomonson, 1983). The basin shape (boundary) supposedlyreflects the way that runoff will arrive at the basin outlet. Dividesbetween adjacent basins demarcate differences in drainage direction which can be readily observed from most earth resources-typesatellites. The basin area, which is probably the single mostimportant basin characteristic for hydrologic design, reflects thevolume of water that can be generated from rainfall. The drainagearea is the easiest basin characteristic to identify using satelliteimagery. Of the earth resources satellites which are currently operating, the SPOT satellite system with its stereoscopic viewingcapabilities and superior resolution (10 m) provides excellentmapping of drainage area and density. The Landsat TM hasgreater spectral range than the SPOT system which compensates
for its coarser resolution (30 m). Drainage density, which is thenumber of stream channels per unit area, can be extractedadequately in those areas where the landscape is sufficientlydissected to permit detailed drainage mapping. The drainagesystem is controlled by the slope of the surface and the type ofunderlying rock (Travaglia, 1989). Drainage patterns can provideuseful information concerning rock and soil relationships andlandform associations. The largest watercourses can be detectedeven using weather satellite images and the good quality ofLandsat TM and SPOT data allows very accurate mapping of thewater-covered area (Kuittinen, 1992). Foster and Hall (1981)concluded that when weather conditions were optimum, visibleand near-infrared imagery from Landsat RBV data provided moreinformation on drainage density of the Wind River Range area inWyoming than the SAR data. Furthermore, the inspection ofseasonal data over a given basin increases the chances thatdetailed.drainage network infonnation can be extracted. The basinlength is usually used in computing a time parameter, which is ameasure of the travel time of water through the basin. Topographyis required for the estimation of model parameters controllingprecipitation, vegetation, evapotranspiration and runoff. Petrie andEI Niweiri (1992) used six types of satellite imagery includingLandsat MSS, RBV, and TM sensors, the MOMS scanner, theESA Metric Camera and NASA's Large Format Camera for topographic mapping at 1:100 000 scale over a test area established inthe Red Sea Hills area of the Sudan. Further interpretation testswere carried out over the area of Khartoum and the Gezira.
Landuse inventories are needed for the estimation ofmodel parameters controlling infiltration, evaporation, interception and runoff. There are many landcover types and the accuracyof inventories using remote sensing depends greatly on the dataused. Also, landuse can change greatly in a short time and thusaffects the water balance of the area (Kuittinen, 1992). Accordingto Blyth (1993), in the majority of situations, conventional aerialphotography or VISINIR satellite imagery such as from Landsat orSPOT is most appropriate for landuse inventories when the timingof data acquisition is not critical. The Landsat TM is currently themost widely used satellite mapping system for landuse applications, primarily because its seven spectral bands are well chosenfor this purpose (Blyth, 1993). Mathematical techniques likemaximum likelihood estimates in a multidimensional featurespace (based on simultaneous information in several spectralbands) allow a rather accmate landuse classification or estimationof vegetation indices which are needed in modelling hydrologicalprocesses (Schultz and Barrett, 1989). Two of the most importantlanduse types are floodplains and wetlands. The identification andmapping of flood-prone areas or floodplains are critical for emergency preparedness and for flood insurance evaluation.Flood-inundation mapping using visible data has been successfulon many rivers. Wetlands are an essential component of the hydrologic system. Researchers at the National Remote Sensing Agencyin Hyderabad used Landsat MSS and IRS-IA data over a periodof 20 years to follow the development of the spit being createdfrom sediments deposited from the Ballaleru River in AndhraPradesh. The data show that vegetation cover has increased overthe years as the spits become broader and more stable. If theseprocesses continue, a lagoon will develop (EOSAT, 1994d). Athird important landuse type is impervious areas; urban areasaffect the hydrology at local scales by concentrating and enhancing runoff. Only data of good spatial resolution can be used

26 CURRENT OPERATIONAL APPLICATIONS OP REMOTE SENSING IN HYDROLOGY
because urban (and agricultural) areas cannot be detected with
sufficient accuracy using weather satellite data. EOSAT (1994c)
reports that the state of Sooth Carolina nsed Laudsat TM data to
develop a detailed landcover map that encompasses 19 classesversus 10 classes in an earlier map produced using SPOT data.
IRSA (1992) reported that the main emphasis of the work in theEnvironmental Mapping and Modelling Unit concerns usingLandsat TM data to map the various components of the Europeanlandscape and 011 development of methods for applying remotely
sensed data and GISs to management and protection of theEuropean environment. The British Institute of Terrestrial Ecology
(lTE) produced the first computer-compatible digital landcovermap of Great Britain using Landsat TM data in April 1993 (Fuller,
1993). The map is integrated with other data in Decision SupportSystems and GISs, such as the "Countryside Infonnation System"(Fuller. 1993). Corbley (1994) reports that the Forest Survey of
India is using IRS data to map the entire country's forest land eachyear. India has also' input IRS data into a GIS to classify its 20 percent wasteland into 13 categories, many of which will be targetedfor reclamation. Pulich and Hinson (1992) used Landsat TMimagery for classifying landcover in Texas coastal areas. TheRussian KVR satellite photograph of Cairo, Egypt with a resolu
tion of 2 m has been used for geological mapping of lineaments,regionallandcover identification, water resources mapping, andurban aud regional p1auuiug applications (EOSAT. 1994a). Soiltype inventories are needed for the estimation of model parameters
controlling infiltration, groundwater flow and runoff. According toKuittinen (1992), rock and soil types can be roughly mapped usingremotely sensed, data (especially multispectral scanner data) if
good field mapping can be carried out to help the interpretation ofthe images. Vegetation canopy inventories are needed for the esti
mation of model parameters controlling interception,evapotranspiration, infiltration and runoff. Vegetation which for
the most part absorbs visible light but reflects near-infrared lightcan be detected and classified on multispectral imagery. Becauseof the importance of vegetation identification, most applications
require the use of seasonal multispectral data that include visibleand near-infrared measurements (Salomonson, 1983). WMO(l993a) reports that the most popular application of NOAA
AVHRR imagery is vegetation monitoring by means of the NDVIderived from the VIS and NIR channels.
In a number of countries around the world, the national
meteorological services have introduced the NDVI map routinelyon a monthly basis in order to monitor the seasonal regularity of
vegetation development over large areas; the Sahel is a well documented case. According to Kuittinen (1992), if temporal data are
used, the accuracy of vegetation mapping increases and it is possible to obtain, for instance~ vegetation indices for hydrological and
climatological models. For large areas, weather satellite data can
be used, whereas local differences are in most cases detectableusing earth resources satellite data. A quasi-operational use of a
temporal NDVI was used by Rangoonwala et al. (1993), Gupta et
at. (1993) and Menenti et al. (1993) to monitor vegetal- cover and
crop growth in Pakistan, India and Zambia, respectively.NOAA/NESDIS: recently developed the Vegetation Condition
Index (VCI), using NOAA AVHRR data, for use in detecting andtracking droughts (Kogan and Sullivan, 1993). Congalton et at.(1993) incorporated the use of remotely sensed data to produce aGIS database and map of old growth forest lands on national
forest and p.ark lands in Oregon and Washington. The GIS layers
include slope, aspect, elevation, hydrology, location of researchand inventory plots, crown closure, size class/stand structure,
species, current vegetation type polygons and other information.The mapping was performed using field measurements, aerial
photography aud Laudsat TM satellite data. WMO (1993a) reportsthat AVHRR imagery has been applied in the discovery and monitoring of forest fi'res. Pilot projects have developed convincing
models of the overall warning system, within the framework of theInternational Decade for National Disaster Reduction. Roberts et
al. (1993) analysed SPOT aud aircraft imagery to determine thedistribution of the various vegetation types within the Balquhiddercatchment in the UK for water balance studies. Channel cross
sectional properties are needed for the computation of runoff.The thermal infrared region of the EMS is valuable for
mapping topography. Digital infrared data have been analysed to
correlate satellite-derived temperatures with local topography(Schneider et at., 1979). Flood-inundation mapping using thennalinfrared imagery has been successful on many rivers.
Passive microwave systems such as the SMMR on theNIMBUS-7 spacecraft cannot currently achieve adequate resolu~
tion for mapping watershed features. But, however, for basinslarger than 10000 km2, the snow cover area extent and snow
water equivalent can be estimated. This information is useful forforecasting streamflow in the spring for mountainous watershedswhere seasonal snowpacks form. However, Choudhury (1993)
used passive microwave SMMR and SSMII global data on boardthe DMSP satellite to document seasonal and interannual landsurface changes at spatial scales of 50 km or larger in Saharan
Africa; changes which would be expected due to known seasonalvegetation growth aud drought. Sippel et al. (1993) nsed SMMR
NIMBUS-7 satellite data to reveal the complex spatial and temporal variation in inundation patterns in large wetlands in Brazil.
Seasonal changes were mapped for the Amazon River floodplainand the Paraguay River floodplain.
Active microwave remote sensing alone may not be thebest method of measuring basin characteristics. but it is likely tobe used in conjunction with data from other sensors. Evans and
Smith (1991) found that a combination of airborne SAR andvisible data such as Landsat TM enabled the backscattering effectsof vegetation and soils to be more easily separated than with SAR
alone. The single most useful frequency for delineating basincharacteristics is likely to be the L-band because it is less affectedby vegetation than higher frequencies. However, many extensive
radar surveys have been carried out with airborne X- and K-bandsystems and these have proven to be extremely useful for mapping
hydrological features such as drainage networks (Trevett, 1986).The high resolution of SAR and radar altimeters can be used for
detailed watershed mapping. Radar images, if available, can be
used to determine the density of the drainage network. The abilityof SAR to penetrate clouds and snow, and its day or night data
acquisition ability, complements the use of VIS and NIR imagery
for mapping drainage density. Drainage density detail is good onSAR imagery because individual streams show up well due to
reparian vegetation causing higher radar reflections which resultfrom the "rough" surface which vegetation creates (Foster and
Hall, 1981). Radar is very sensitive to changes in surface rough-'ness and is thus capable of providing a qualitative measure of
roughness for stream channels and slopes required for rainfallrunoff models (Blyth, 1993). Multifrequency, multipolarization
and multi-incidence angle radar data are required to help separate

CHAPTER 2 - APPLICATIONS OF REMOTE SENSING IN HYDROLOGY 27
roughness groups (Oh el at., 1992) and a combination of L-, C
and X-band would generally cover a wide range of naturallyoccurring roughnesses. Such data are currently only availablefrom aircraft. Leber! (1983) showed that radar steroscopy usingeither aircraft or satellite SAR could provide topographic informa
tion that would be useful for hydrological modelling. Zebker et at.
(1992) described an interferometric airborne SAR which is beingdeveloped with the aim of providing topographic contouring at2-3 m accuracy, and this has also been demonstrated to be feasiblefrom space. According to Blyth (1993), microwave radar data will
be of unique value in the tropics or mountainous areas wherecloud cover is unusually persistent, or in arid areas where itssensitivity to surface roughness enables spectrally similar surfaces
to be differentiated. At low frequencies, radar has the uniqueability to penetrate forest canopies (Chauhan and Lang, 1991;
Kimura and Kodaira, 1992) which may facilitate the retrieval ofsoils, soil moisture information, wetland and flood water extent.Richards el al. (1987) fonnd that river flooding could be readily
detected beneath a forest canopy using SIR-B, L-band HH-polarized radar as flown on the Space Shuttle in 1984. Radar imageshave also been successfully used to map flood-inundated areas onmany rivers (EOSAT, 1993b; COSPAR, 1993). Although the NIR
part of the EMS is generally regarded as the most suitable fordelineating land/water boundaries, the hydrological interest lies inthe dynamics of the land/water boundary which can best be moni
tored with cloud-penetrating radar, the resolution of microwaveradiometers being too coarse for this application. Even for landuse
mapping, the cloud independence of satellite radar may prove tobe of critical importance in the future. Leak and Venugopal (1990)
reported that the success of Landsat and SPOT satellite imagery
for mapping urban landuse has been limited by the spectraloverlap of materials commonly occurring in the urban environ
ment. Fraysse and Hartl (1985) found that more categories ofurban landuse were depicted on radar images of SEASAT than onLandsat MSS (78 m resolution) imagery of the City of Cologne.
Therefore, Blyth (1993) snggests that while the high spatial andspectral resolution of an airborne multispectral scanner is the most
suitable for detailed urban landuse classification, the mapping ofLandsat TM or SPOT with future satellite radar data on digitalimage processing systems may provide a powerful method of
urban landuse mapping.Laser remote sensing measures the reflected energy of a
laser beam or by the Earth's surface. Airborne lasers have beenused to collect data which can be used to estimate high~density
topographic information, canopy height, vegetation cover andstream valley cross-sections. Application of these estimates may
include topographic changes that may delineate erosion sourcesand sinks, erosion and gulley studies, and defining channel geo
metry (Engman and Gorney, 1991). Menenti and Ritchie (1994)
presented a new method to estimate the effective aerodynamicroughness of a complex landscape. High-resolution elevation
profiles measured with an airborne laser altimeter have been usedto compute geometrical parameters of three landscape elements of
the Walnut Gulch experimental watershed, Arizona. Laser profIlesyielded geometrical parameters including mean crop height andspacing of taller shrubs and trees, mean amplitude and wavelengthof hillrocks and ridges. Weltz el a1. (1994) favourably compared
the laser-measured properties of plant height and canopy cover(> 0.3 m) with field measurements made using the line-intercept
method at seven of the eight sites evaluated on the US Department
of Agriculture's Agricultural Research Service Walnut Gulchexperimental watershed near Tombstone, Arizona. Ritchie et al.(1993a) used a laser altimeter mounted in a small twin-engineaeroplane to measure surface properties of the landscape in Texas
and Arizona. These airborne laser measurements were analysed toprovide infonnation on topography, vegetation canopy, and stream
and gully cross-sections. While conventional ground-based techniques may be used to make all these measurements, airborne
laser altimeter techniques allow the data to be collected in a quickand efficient way over large and inaccessible areas. Ritchie et al.(l993b) demonstrated the potential of digital airborne laser data tomeasure canopy structure and properties for large areas quickly
and quantitively. Ritchie et al. (1994) used a laser altimeter to
measure channel and gully morphology. The data are valuable formeasuring channel and gully cross-sections and roughness in rela
tion to the surrounding landscape, for assessing soil loss fromgullies and channels, and for providing input to the understandingof gully and channel dynamics in the landscape.
2,3 REMOTE SENSING INPUTS FORHYDROLOGICAL MODELS
All hydrological models, whether simple or complex, that are to beapplied at the basin scale, require parameters that link the hydrological processes ("primary hydrological variables") describing the
input, storage and output of water to the physical characteristics of
the basin. Physical basin characteristics include basin area, channellength, slope, land use and soil type. Hydrological basin inputs
include rainfall and snow. Hydrological basin ~torage componentsinclude surface water, lying snow and ice, vegetation moisture, soil
moisture and groundwater. Hydrological basin outputs includestreamflow, groundwater flow and evapotranspiration. Model
parameters are estimated using the physical basin characteristics.For instance, land use is an important physical basin characteristicwhich is required for the estimation of model parameters control
ling infiltration, evaporation, interception and runoff. Furthennore,"secondary hydrological variables," which are required mainly forthe calculation of evaporation and for snow studies, include solar
radiation, albedo, sulface temperature, air temperature, air humidity, atmosphere pressure; wind speed and direction, and waterqnality (Blyth, 1993).
Many of the physical basin characteristics are slowchanging and are conventionally extracted from maps. These
maps are now periodically updated with the use of remotesensing techniques.
Although the conventional point measurements of the
hydrological variables Eboth.primary and secondary) are higWyaccurate and have a high temporal sampling frequency, as the
basin area increases, they are unable to sample spatial variability
sufficiently. Remote sensing, on the other hand, provides the mostefficient means of sampling the spatial domain, but has in the past
sampled the time domain somewhat poorly; this is due mainly to
low satellite repeat coverage.In the application of remote sensing of hydrological
variables, it is most advantageous to combine both ground-basedand aerial measurements. Remote sensing of the hydrological variables provides an indirect measurement. The electromagnetic
radiation is sensed and is related to the hydrological variableeither empirically, or preferably via some form of transfer
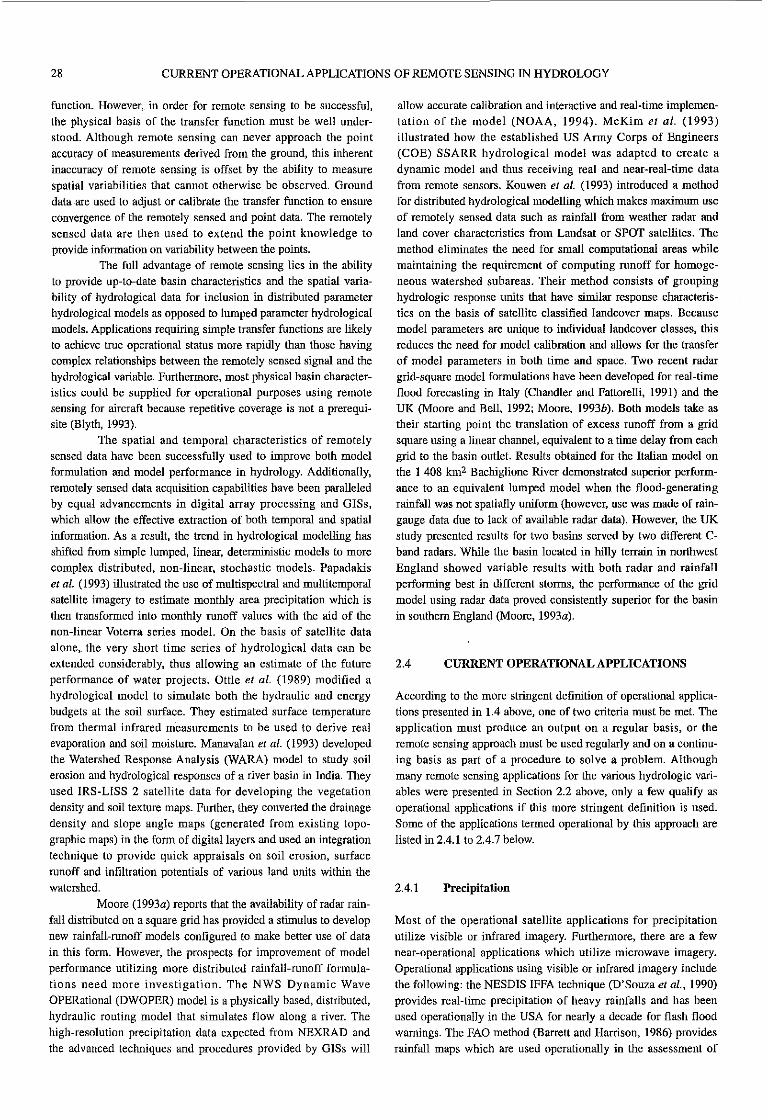
28 CURRENT OPERATIONAL APPLICATIONS OF REMOTE SENSING IN HYDROLOGY
function. However, in order for remote sensing to be successful,the physical basis of the transfer function must be well understood. Although remote sensing can never approach the pointaccuracy of measurements derived from the ground, this inherentinaccuracy of remote sensing is offset by the ability to measure
spatial variabilities that cannot otherwise be observed. Grounddata are used to adjust or calibrate the transfer function to ensure
convergence of the remotely sensed and point data. The remotelysensed data are then used to extend the point knowledge toprovide information on variability between the points.
The full advantage of remote sensing lies in the ability
to provide up-ta-date basin characteristics and the spatial variability of hydrological data for inclusion in distributed parameter
hydrological models as opposed to lumped parameter hydrologicalmodels. Applications requiring simple transfer functions are likelyto achieve true operational status more rapidly than those havingcomplex relationships between the remotely sensed signal and thehydrological variable. Furthermore, most physical basin characteristics could be supplied for operational purposes using remote
sensing for aircraft because repetitive coverage is not a prerequisite (Blyth, 1993).
The spatial and temporal characteristics of remotelysensed data have been successfully used to improve both modelformulation and model performance in hydrology. Additionally,
remotely sensed data acquisition capabilities have been paralleledby equal advancements in digital array processing and GISs,which allow the effective extraction of both temporal and spatial
information. As a result, the trend in hydrological modelling hasshifted from simple lwnped, linear, deterministic models to more
complex distributed, non-linear, stochastic models. Papadakiset al. (1993) illustrated the use of multispectral and multitemporalsatellite imagery to estimate monthly area precipitation which is
then transformed into monthly runoff values with the aid of thenon-linear Voterra series model. On the basis of satellite dataalone, the very short time series of hydrological data can be
extended considerably, thus allowing an estimate of the futureperformance of water projects. Ottle et al. (1989) modified a
hydrological model to simulate both the hydraulic and energybudgets at the soil surface. They estimated surface temperaturefrom thermal infrared measurements to be used to derive realevaporation and soil moisture. Manavalan et at. (1993) developed
the Watershed Response Analysis (WARA) model to study soilerosion and hydrological responses of a river basin in India. They
used IRS-LISS 2 satellite data for developing the vegetationdensity and soil texture maps. Further, they converted the drainage
density and slope angle maps (generated from existing topographic maps) in the form of digital layers and used an integration
technique to provide quick appraisals on soil erosion, surfacerunoff and infiltration potentials of various land units within the
watershed.
Moore (1993a) reports that the availability of radar rainfall distributed on a square grid has provided a stimulus to develop
new rainfall-runoff models configured to make better use of data
in this fonn. However, the prospects for improvement of modelperformance utilizing more distributed rainfall-runoff formula
tions need more investigation. The NWS Dynamic WaveOPERational (DWOPER) model is a physically based, distributed,hydraulic routing model that simulates flow along a river. The
high-resolution precipitation data expected from NEXRAD andthe advanced techniques and procedures provided by GISs will
allow accurate calibration and interactive and real-time implemen
tation of the model (NOAA, 1994). McKim ef al. (1993)
illustrated how the established US Army Corps of Engineers(COE) SSARR hydrological model was adapted to create a
dynamic model and thus receiving real and near-real-time datafrom remote sensors. Kouwen et at. (1993) introduced a methodfor distributed hydrological modelling which makes maximum use
of remotely sensed data such as rainfall from weather radar andland cover characteristics from Landsat or SPOT satellites. The
method eliminates the need for small computational areas whilemaintaining the requirement of computing runoff for homoge
neous watershed subareas. Their method consists of groupinghydrologic response units that have similar response characterisR
tics on the basis of satellite classified landcover maps. Becausemodel parameters are unique to individual landcover classes, this
reduces the need for model calibration and allows for the transferof model parameters in both time and space. Two recent radargrid-square model formulations have been developed for real-timeflood forecasting in Italy (Chandler and Fattorelli, 1991) and theUK (Moore and Bell, 1992; Moore, 1993b). Both models take astheir starting point the translation of excess runoff from a grid
square using a linear channel, equivalent to a time delay from eachgrid to the basin outlet. Results obtained for the Italian model onthe 1 408 km2 Bachiglione River demonstrated superior performance to an equivalent lumped model when the flood-generating
rainfall was not spatially uniform (however, use was made of raingauge data due to lack of available radar data). However, the UK
study presented results for two basins served by two different Cband radars. While the basin located in hilly terrain in northwestEngland showed variable results with both radar and rainfall
perfonning best in different storms, the performance of the gridmodel using radar data proved consistently superior for the basin
in southern England (Moore, 1993a).
2.4 CURRENT OPERATIONAL APPLICATIONS
According to the more stringent definition of operational applications presented in 1.4 above, one of two criteria must be met. Theapplication must produce an output on a regular basis, or the
remote sensing approach must be used regularly and on a continuing basis as part of a procedure to solve a problem. Althoughmany remote sensing applications for the various hydrologic vari
ables were presented in Section 2.2 above, only a few qualify asoperational applications if this more stringent definition is used.
Some of the applications termed operational by this approach arelisted in 2.4.1 to 2.4.7 below.
2.4.1 Precipitation
Most of the operational satellite applications for precipitationutilize visible or infrared imagery. Furthennore, there are a few
near-operational applications which utilize microwave imagery.Operational applications using visible or infrared imagery include
the following: the NESDIS IFFA technique (D'Souza ef aI., 1990)
provides real-time precipitation of heavy rainfalls and has been
used operationally in the USA for nearly a decade for flash floodwarnings. The FAO method (Barrett and Harrison, 1986) provides
rainfall maps which are used operationally in the assessment of
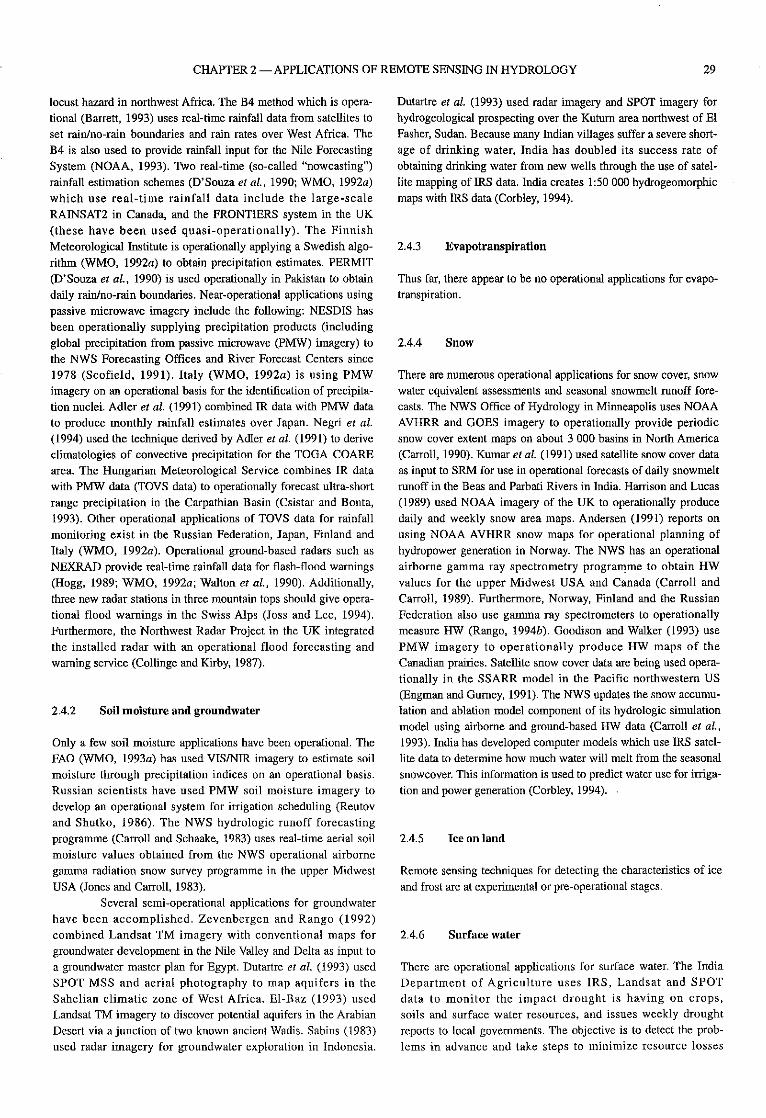
CHAPTER 2 - APPLICATIONS OF REMOTE SENSING IN HYDROLOGY 29
locust hazard in northwest Africa. The B4 method which is operational (Barrett, 1993) uses real-time rainfall data from satellites toset rain/no-rain boundaries and rain rates over West Africa. The
B4 is also used to provide rainfall input for the Nile ForecastingSystem (NOAA, 1993). Two real-time (so-called "nowcasting")
rainfall estimation schemes (D'Souza et al., 1990; WMO, 1992a)
which use real-time rainfall data include the large-scaleRAINSAT2 in Canada, and the FRONTIERS system in the UK
(these have been used quasi-operationally). The FinnishMeteorological Institute is operationally applying a Swedish algorithm (WMO, 1992a) to obtain precipitation estimates. PERMIT
(D'Souza et al., 1990) is used operationally in Pakistan to obtaindaily rain/no-rain boundaries. Near·operational applications usingpassive microwave imagery include the following: NESDIS hasbeen operationally supplying precipitation products (including
global precipitation from passive microwave (PMW) imagery) tothe NWS Forecasting Offices and River Forecast Centers since1978 (Scofield, 1991). Italy (WMO, 1992a) is using PMW
imagery on an operational basis for the identification of precipitation nuclei. Adler et at. (1991) combined IR data with PMW datato produce monthly rainfall estimates over Japan. Negri et at.(1994) used the technique derived by Adler et al. (1991) to derive
c1imatologies of convective precipitation for the TOGA COAREarea. The Hungarian Meteorological Service combines IR datawith PMW data (TOVS data) to operationally forecast ultra-short
range precipitation in the Carpathian Basin (Csistar and Bonta,
1993). Other operational applications of TOVS data for rainfallmonitoring exist in the Russian Federation, Japan, Finland andItaly (WMO, I992a). Operational ground-based radars such as
NEXRAD provide real-time rainfall data for flash-flood warnings(Hogg, 1989; WMO, 1992a; Walton et aI., 1990). Additionally,
three new radar stations in three mountain tops should give operational flood warnings in the Swiss Alps (Joss and Lee, 1994).
Furthermore, the Northwest Radar Project in the UK integrated
the installed radar with an operational flood forecasting andwarning service (Collinge and Kirby, 1987).
2.4.2 Soil moisture and groundwater
Only a few soil moisture applications have been operational. TheFAO (WMO, 1993a) has used VISINIR imagery to estimate soilmoisture through precipitation indices on an operational basis.
Russian scientists have used PMW soil moisture imagery todevelop an operational system for irrigation scheduling (Reutovand Shutko, 1986). The NWS hydrologic runoff forecasting
programme (Carroll and Schaake, 1983) uses real-time aerial soil
moisture values obtained from the NWS operational airbornegamma radiation snow survey programme in the upper MidwestUSA (Jones and Carroll, 1983).
Several semi-operational applications for groundwater
have been accomplished. Zevenbergen and Rango (1992)combined Landsat TM imagery with conventional maps for
groundwater development in the Nile Valley and Delta as input toa groundwater master plan for Egypt. Dutartre et al. (1993) usedSPOT MSS and aerial photography to map aquifers in theSahelian climatic zone of West Africa. EI-Baz (1993) used
Landsat TM imagery to discover potential aquifers in the ArabianDesert via a junction of two known ancient Wadis. Sabins (1983)
used radar imagery for groundwater exploration in Indonesia.
Dutartre et al. (1993) used radar imagery and SPOT imagery forhydrogeological prospecting over the Kuturn area northwest of ElFasher, Sudan. Because many Indian villages suffer a severe short
age of drinking water, India has doubled its success rate of
obtaining drinking water from new wells through the use of satellite mapping of IRS data. India creates 1:50 000 hydrogeomorphicmaps with IRS data (Cmbley, 1994).
2.4.3 Evapotranspiration
Thus far, there appear to be no operational applications for evapotranspiration.
2.4.4 Snow
There are numerous operational applications for snow cover, snowwater equivalent assessments and seasonal snowmelt runoff fore
casts. The NWS Office of Hydrology in Minneapolis uses NOAAAVHRR and GOES imagery to operationally provide periodic
snow cover extent maps on about 3 000 basins in North America(Carroll, 1990). Kumar et al. (1991) used satellite snow cover data
as input to SRM for use in operational forecasts of daily snowmeltrunoff in the Beas and Parbati Rivers in India. Harrison and Lucas
(1989) used NOAA imagery of the UK to operationally producedaily and weekly snow area maps. Andersen (1991) reports on
using NOAA AVHRR snow maps for operational planning ofhydropower generation in Norway. The NWS has an operational
airborne gamma ray spectrometry progra~me to obtain HWvalues for the upper Midwest USA and Canada (Carroll and
Carroll, 1989). Furthermore, Norway, Finland and the RussianFederation also use gamma ray spectrometers to operationallymeasure HW (Rango, I994b). Goodison and Walker (1993) use
PMW imagery to operationally produce HW maps of theCanadian prairies. Satellite snow cover data are being used opera
tionally in the SSARR model in the Pacific northwestern US(Engman and Gurney, 1991). The NWS updates the snow accumulation and ablation model component of its hydrologic simulation
model using airborne and ground-based HW data (Carroll et al.,
1993). India has developed computer models which use IRS satellite data to determine how much water will melt from the seasonalsnowcover. This information is used to predict water use for irriga
tion and power generation (Corbley, 1994).
2.4.5 Ice on land
Remote sensing techniques for detecting the characteristics of ice
and frost are at experimental or pre-operational stages.
2.4.6 Surface water
There are operational applications for surface water. The IndiaDepartment of Agriculture uses IRS, Landsat and SPOT
data to monitor the impact drought is having on crops,soils and surface water resources, and issues weekly droughtreports to local governments. The objective is to detect the prob
lems in advance and take steps to minimize resource losses

30 CURRENT OPERATIONAL APPLICATIONS OF REMOTE SENSING IN HYDROLOGY
(Corbley, 1994). McKim el al. (1972) operationally usedERTS~1 imagery to map flood waters in the national programmefor the US for the inspection of dams. NOAA (1994) uses passivemicrowave data from the DMSP series satellite to monitor theGreat Flood of 1993 in the Midwest USA. Furthermore, EOSAT(1993b) and Radarsat Intemationallnc. (COSPAR, 1993) mergedSAR data from ERS-l with multispectral data from Landsat andSPOT, respectively, to monitor the 14 July 1993 floods in StLonis, MO.
2.4.7 Basin characteristics
There are several operational applications for basin characteristics.
The Forest Survey of India is using IRS data to map the entirecountry's forest lands each year; India has experienced a severedeforestation problem in the last 20 years. Furthennore, India hasinput IRS data into a GIS to classify its 20 per cent wasteland into13 categories, many of which will be targeted for reclamation.Also, India has turned to satellite imagery to plan new infrastructure such as roads to meet the demands of the growing cities(since most of its cities are growing too fast for urban planners tokeep up) (Corbley, 1994). The British Institnte of TerrestrialEcology (lTE) produced the fIrst computer-compatible digital landcover map of Great Britain using Landsat TM data in April 1993(Fuller, 1993). The ITE has a wide range of users of the land covermap which include organizations concerned with environmentalimpact assessments, pollution control and water- resourcesmanagement. For instance, the map data are used to evaluate thethroughput of nitrates and pesticides to groundwater. Furthennore,the map is integrated with other data in Decision Support Systemsand GISs such as the "Countryside Infonnation System" (CIS).The administrators use the CIS for the assessment of quantitativeinformation and thus in the decision-making process (Fuller,1993). Roberts el al. (1993) analysed SPOT and aircraft imageryto determine the distribution of the various vegetation types withinthe Balquhidder catchment in the UK for use in water balancestudies. The Russian KVR satellite photograph of Cairo, Egyptwith a resolution of 2 m has been used for geological mapping oflineaments, regional landcover identification, water resourcesmapping, and urban and regional planning applications (EOSAT,1994a).
2.5 FUTURE TRENDS
The great Flood of 1993 of the enormous Mississippi River basinwas one of the first American emergencies in which remote sensingtechnologies were used to create "pictures" of the flood while theflood was happening. Although the satellite data coupled with newairborne technology gave scientists an opportunity to monitor andassess the extent of the flood's progress, it is presently unclear ifthese data can function as tools of instant crisis management (i.e.help predict flooding) for the flood-type of catastrophic event, themain reason being the inability of the data to provide coverage ondemand of the flood's continuing progress. However, this kind ofdata can identify precise flooded areas to prevent future disasters(Becker, 1994). The installed base of Weather Surveillance Radar88 Doppler (WSR-88D) systems under the Modernization and
Associated Restructuring (MAR) provided major benefits during theflood event, including flash flood warnings. However, maximumuse ofWSR-88D data for hydrologic forecast and warnings awaitscompletion of the NEXRAD (now called the WSR-88D) networkover the upper Mississippi River basin. In addition, AdvancedWeather Interactive Processing System (AWIPS), under MAR, isneeded at the River Forecast Centers (RFCs) to process and mosaicthe infonnation from multiple radars and other areas of forecastresponsibility (NOAA, 1994). One of the most signifIcant changeswill be in the way point precipitation observations will be mergedand processed with precipitation estimates from multiple WSR-88Dradars and information received from sateIlite observations. Theresult will be frequently updated, multisensor, high-resolutionprecipitation estimates. It is anticipated that RFCs will have thesehigh-resolution data sets for their entire areas of responsibilities.The availability and- use of these data sets will change the wayhydrologists interact and use hydrologic forecast models.Forecasters will change their "mind-set" from executing forecastsystems at six-hourly intervals, to running the model interactivelyin near-real-time. RFCs will also have access to gridded quantitativeprecipitation forecast (QPF) estimates for use in their forecastsystems (NOAA, 1994). The high-resolution precipitation data willallow hydrologists to re·examine how models are implemented.Rainfall-runoff models and runoff distribution models willeventually change from lumped parameter models to distributedparameter models based on gridded data. There is a major challengein order to implement distributed, physically basedhydrologiclhydraulic models that take maximum advantage of thenew observation systems (such as WSR-88D radars). The mainreason is the massive amount of time and effort needed to assemblethe information required to calibrate these models. However, it isimperative that resources be found to accomplish the transition fromstatisticalJempirical modelling to modelling the relevant physicalprocesses. Otherwise, the great progress made in observationsystems, communication links and computer power provided byMAR will never be fnlly realized by the NWS hydrologyprogranune (NOAA, 1994).
The development of Hurricane Andrew in August 1993,which has been described as one of the most destructive disastersof the 20th century, was monitored via satellites and researchaircraft by NOAA starting from its infancy to a more mature stage.These developments were monitored on computer screens at theNational Hurricane Center in Coral Gables, Florida and theNational Severe Stonns Forecast Center in Kansas City, Missouri.The NWS broadcast of the hurricane warnings and projectedstorm tracks saved thousands of lives and millions of dollars inproperty damage by making early evacuations possible (Becker,1993).
The late December 1993 torrential rains in France,Germany, Belgium and the Netherlands triggered the worst flooding in Western Europe in more than 60 years. Authorities relied onsatellite imagery for assessing this massive natural disaster, andthereby assisting in disaster relief, because of its large-area repetitive coverage (EOSAT, 1994b).
In February and March of 1993 one of the largest riversin Australia flooded its banks. Landsat TM imagery helpedmonitor and quantify the extent of the flooding of the FitzroyRiver and was an invaluable information source for relief servicesand planners (EOSAT, 1993a).

CHAPTER 3
NEW REMOTE SENSING ADVANCES
3.1 RECENT STATE·OF·THE·ART REMOTESENSING TECHNOLOGY ADVANCES AND
ONGOING RESEARCH
Remote sensing platforms can vary from ground~based systems toaircraft to satellites. In most cases, truck-mounted ground-based
and aircraft systems are used in sensor development to verifydesign characteristics and to learn how the sensor responds to thetarget characteristics (Engman and Gurney, 1991) (e.g.NEXRAD). Thus, the ultimate goal in most cases is to mount the
sensor on free-flying satellites.
3.1.1 Satellites
Up to now, there has been no launch of a hydrological satellite.
However, many past, present and future meteorological and earthresource satellites have provided data and sensors for use inhydrology (see Appendix 11, Table 4). Notable among the meteor
ological satellites are the geostationary GOES series, GMS series,Meteosat series, INSAT series and GOMS; and the polar-orbiting
NOAA series, DMSP, UARS and METEOR series. Notableamong the earth resources satellites are the polar-orbiting Landsat
series, SPOT series, J-ERS-1, MOS-1, ERS-1, METEOR·
PRIRODA and ALMAZ.At present, satellite sensors offer good resolution in
space or in time, but not both simultaneously. Sensors with highspatial resolution on board polar-orbiting satellites (both meteoro
logical such as DMSP and NOAA series and earth resources suchas Landsat and SPOT) provide information on hydrologicprocesses such as snowmelt, ice, land use and other hydrologic
parameters. Sensors with high temporal resolution on boardgeostationary satellites (meteorological, such as GOES andMeteosat) allow the monitoring of more dynamic processes such
as rainfall, runoff and floods. Furthermore, picture loops madefrom the geostationary satellite images provide information onmoisture and temperature fluxes for forecasting, detecting andtracking severe storms (Ormsby and Engman, 1993).
Recent advances have been made regarding continuity
of coverage of geostationary satellites. EUMETSAT's Meteosat-6and Meteosat Transition Programme (MTP) are committed up to2000-2002. A second generation of Meteosat, namely MSG, will
be developed by ESA and EUMETSAT and launched in 2000 andwill be flown by EUMETSAT up to the year 2012. USA's NOAA
started a new series, GOES-NEXT in 1994 and will be used up to
2005. Japan's GMS-5 is improved flight model was launched in1994. India's INSAT-ll system has been upgraded and is planned
to be continued through the 1990s. The Russian Federation'sGOMS was lannched in 1993. And, finally, China's FY-2 was
launched in June 1997.Recent plans for near-polar-orbiting satellites are given
as follows. ESA's ERS series was to be upgraded to focus onozone and atmospheric chemistry. A new series, ENVISAT, was to
replace ERS. ENVISAT-I was being prepared for launch in 1999;a second model is planned for 2004. USA's NOAA p.m. series
was upgraded with regard to a sounding mission in 1998 and will
be totally updated in 2001 with NOAA 0, P, and Q to be flown upto 2010. The NOAA a.m. series will continne up to 2003, at which
time it will be replaced by a European series METOP up to 2015.Japan's MOS series and I-ERS series are for ocean monitoring
and land observation. Noteworthy of mention are the activemicrowave systems on board both J-ERS-I and ERS-l which
provide all-weather observation capabilities. Japan's ADEOS-I
system, launched in 1996, complemented ESA's ENVISAT andNASA's EOS eIforts; a second ADEOS model was planned for
1999. The Russian Federation's METEOR-3M series is in preparation for flight in 2000. France's SPOT-4 was upgraded in 1997.USA's Landsat-6 and -7 are approved to cover np to 2000. TheNASA programme is based on a number of single- research
missions, some having relevance to hydrology: TOPEXIPOSEI~DON, in cooperation with France, for altimetry, and TRMM, incooperation with Japan, for tropical rainfalL Finally, countries
planning or developing satellite observing systems include India(IRS for earth resources), Brazil (MECB for data collection),China (FY-1 for meteorology), Canada (RADARSAT for multi
purpose imagery), and the Russian Federation (OKEAN for oceanand RESURS for land observations).
The EOS/Columbus Project started in 1998 and will
continue up to 2010; major space nations will work together to
provide a network of earth orbiting platforms (most important willbe the polar-orbiting platform in conjunction with a manned space
station). In an effort to meet the many hydrological requirementsas listed in Appendix II, Table 1, the hydrological community is
seeking specific sensors which might be carried by EOS (see tablein Appendix Ill). Furthermore, the TRMM results are needed to
complement the much more complex BOS mission.Ormsby and Engman (1993) have proposed a hydrology
specific series of sensors to fill the gaps not covered by the currentand planned systems. They have called this hypothetical platform
HYDROSAT. Assuming that the instruments planned on boardEOS will be in orbit by the year 2000, HYDROSAT wonld onlyneed to carry instruments to complement the existing scheduled
sensors. Specifically, it is proposed that HYDROSAT combinepassive microwave and a pointable SAR to meet the hydrology
needs. The chosen orbit would be a three-day repeat polar orbit.Although a geostationary orbit would be ideal for operational
hydrology, it would not provide adequate global coverage.
3.1.2 Aircraft
Although most aircraft sensors are used to test or calibrate satellite
sensors, there are numerous instances where aircraft remotesensing provides the only, or a more accurate source of, remotely
sensed hydrological data.NASA has a high altitude research aircraft which makes
measurements of the microwave brightness temperature for deter
minations of rainfall rate profiles.There have been a number of aircraft and only a few
satellite instruments that have demonstrated the feasibility of

32 CURRENT OPERATIONAL APPLICATIONS OF REMOTE SENSING IN HYDROLOGY
measuring soil moisture by remote sensing. At present, microwave
radiometers capable of measuring soil moisture (ideally at L-bandor 21 em) are available only on aircraft. The available soil moisture
gamma radiation techniques use low-flying aircraftsnil moisture
measurements. Furthermore, at present the- only operational soilmoisture techniques are the aircraft based gamma ray and passivemicrowave approaches (Engman and Gurney, 199-1).
Aerial photography has been used for many years forpreliminary slln'eys of groundwater, and has recently been supplemented by satellite data (especially from Landsat and SPOT).Recently, airborne exploration for groundwater has been conductedusing electromagnetic prospecting sensors developed for the
mineral industry. This equipment has been used to map aquifers atdepths greater than 200 m (Paterson and Bosschart, 1987).
Evapotranspiration is estimated using a combination ofground:"based and remote sensing data. Low-level aircraft flights
are used to collect reflected solar and emitted thermal radiation.'This remote sensing data is combined with ground-based measurements of wind, vapour pressure and incident solar radiation to
estimate evapotranspiration (Jackson et al., 1983).
Snow cover is readily identifiable from aerial photography; The water equivalent of snowpacks can be measured withlow-flying aircraft carrying sensitive gamma radiation detectors.
Satellite imagery of snow cover and low-flying aircraft gamma rayspectrometry have been combined to monitor short melt seasons.Furthermore, many microwave measurements of snow properties
have been conducted with both truck and aircraft experiments;passive microwave estimates of snow depth using aircraft are a
viable alternative to poor resolution satellite sensors.Laser profIling techniques from airplanes can be used to
accurately measure the stage of surface water. Aircraft measure
ments of thermal infrared and microwave radiation data have beenused to measure surface water temperature. Aircraft microwave
radiometers can be used to measure salinity and general mineralization of water and to detect some characteristics of vegetationabove the surface water. Special airborne radiometers/scanners
have been used to estimate the chlorophyll content and suspendedsediments in surface water. Finally, aircraft scanners and camerasare used routinely to follow the fate of oil spills in surface waters,
map the aerial extent of flooding, wetland mapping and maperosion.
There are aircraft sensor systems used to test and cali
brate sateI-lite s.ensor systems. Examples are as follows. TheARMAR is a radar system (designed to fly on the NASA Ames
DC-8 and the high altitude ER-2 aircraft) developed to support thedesign and development of the TRMM satellite rain mapping
radar system. Both the FRONTlERS radar system (designed bythe UK) and the GATE radar system have been used to calibrate
and validate the DMSP SSM/I passive microwave imagery andalgorithms used to estimate precipitation.
3,13 Ground-based methods and radars
Although satellite data are most useful in providing informationon the spatial distribution of potential rainfall, ground-based radarhas proven to be the most useful remote sensing technology for
estimating rainfall rates and locating regions of heavy rain.Notable is NEXRAD, which is a state-of-the-art data acquisition
system aime.d primarily at the severe storm warning problem. It is
one of the most important sources of precipitation data for the
future. Approximately 120 of these modem Doppler radars havebeen installed across the US (Hudlow, 1988). The NationalOperational Hydrologic Remote Sensing Center is currently devel
oping and refining precipitation products from NEXRAD; whichwill provide radar precipitation estimates far superior to estimates
currently available.Ground-based· radars serve the purpose for calibration
and validation of satellite sensors such as the TRMM, ERS:..1 and
J-ERS-I. A strong validation effort is planned for TRMM withseveral key ground sites to be instrumented with calibrated multiparameter rain radar. Key ground sites for the TRMM include
preliminary ground truthing at Kwajalein in the Marshall Islandsand in Darwin, Australia, and a prototype established in the vicinity of Cape Canaveral, Florida (Simpson et ai., 1988). As for theERS-l scatterometer radar, calibration and' validation activities
have been carried out at European Centre for Medium-rangeWeather Forecasts (ECMWF) complementary to the "Haltenbanken" field campaign held off the coast of Norway (Stoffelenand: Anderson, 1993). In order to assess the J-ERS-l satellite estimates of rainfall (a preliminary product of the Global PrecipitationClimatology Project), they were compared with ground~based
observations from a high-density radar network over Japan(Janowiak, 1992).
3.2 POTENTIAL NEW APPLICATIONS INOPERATIONAL HYDROLOGY
While hydrological applications have exploited remotely sensed
data from the visible through the thennal range, similar exploitation awaits the data from the microwave. Microwave data,
especially, will play an important role in hydrologic remotesensing applications in the immediate future. Notable are themicrowave remote sensors on board the ERS-I, J-ERS-l,
RADARSAT, ALMAZ and the Space Shuttle-based systemsSIR-C and X-SAR. A number of active and passive microwavesensors will be included within the EOS. In particular, satellite
SAR promises the greatest long-tenn advances in surface-orientedhydrological monitoring because of its unique ability to penetratecloud and to achieve high spatial resolution if required (Blyth,1993).
A reference to Appendix 11, Table 6 (after Blyth, 1993)
highlights hydrological applications that can use readily availablemicrowave data or data that will become available in the nearfuture, According to Blyth (1993), applications requiring simple
transfer functions are likely to achieve true operational status more
rapidly than those having complex relationships between theremotely sensed signal and the hydrological variable. Microwaves
at low frequencies can penetrate clouds, rain, dry snow and vege
tation to provide infonnation on the underlying soil (Eagleman,1975), while at high frequencies, precipitation can be measured
(Barrett et al., 1988b}
Blyth (1993) indicates that because satelIile-based
multifrequency SAR systems were unlikely to be available beforethe end of the century, applications requiring them have been
precluded from achieving operational status even though themethodology may have been demonstrated using airborne SAR.
Furthermore, Aluned el al. (1990) indicate that of the satellite SARsplanned for the near future, RADARSAT may be the most useful

CHAPTER 3 - NEW REMOTE SENSING ADVANCES 33
for operational purposes using the optional Scansar mode whichwill provide complete coverage of the Northern Hemisphere with a
three-day return period. Zebker et al. (1992) describe aninterferometric airborne SAR being developed with the aim ofproviding topographic contouring at 2-3 III accuracy; this has alsobeen demonstrated to be feasible from space.
While microwave remote sensing alone may not be thebest method of measuring hydrologic variables, when used inconjunction with data from other sensors it may become invaluable. "Microwave sensors will enable temporal changes in surfacefeatures to be studied in a way which has previously been imposs
ible, but the full benefit of remote sensing is likely to come fromthe integration of knowledge gained from a range of sensor types"(Blyth, 1993). Evans and Smith (1991) found that a combinationof airborne SAR and visible data (e.g. Landsat TM) enables thebackscattering effects of vegetation and soils to be more easilyseparated than with SAR alone. According to Blyth (1993), themost useful application for satellite SAR is river and coastal floodmapping. Once again, no single sensor can fully assess the location, severity or scope of impact of most natural disasters (becauseclouds, smoke and rain commonly interfere with the reception ofmany sensors). Both EOSAT (l993b) and RADARSATInternational Inc. (RSI) (COSPAR, 1993) have illustrated thepower of merging SAR data from ERS-I radar satellite withmultispectral sensor data from an optical satellite (from theLandsat TM and SPOT, respectively) to study the 14 Iuly 1993floods in St Louis, MO. The SAR radar can penetrate haze, lightrain and clouds, and is effective for terrain analysis, while themultispectral sensor (Landsat TM and SPOT) allows identificationand classification of surface features with a high degree of accuracy. Similarly; the authorities in France, Germany, Belgium andthe Netherlands relied upon ERS-I SAR and Landsat TM dataduring and after the late December 1993 torrential rain producedfloods, to assess situations and get reScue, clean up and reconstruction priorities (EOSAT, 1994b).
Satellites carrying passive microwave sensors offer thebest opportunity of obtaining repetitive observations of snowextent and snow depth. Chang et al. (1987, 1990) used the SMMRdata from NIMBUS-7 to produce a snow extent map of the wholeNorthern Hemisphere.
The most useful sensors for rainfall estimation havebeen the multifrequency scanning radiometers on board
NIMBUS-7 and the DMSP SSM/I. However, the temporalsampling of rainfall distribution will be improved through theTRMM so as to enable the true potential of this type of sensor tobe achieved for input to climate models.
According to Engman and Gurney (1991) some of thenew space initiatives will provide the maximum amount and typeof remote sensing data needed for further advances in estimatingthe global evapotranspiration fluxes.
The Advance Techniques Unit of the lRSA (1992) iscurrently active in outlining new and potential applications ofremote sensing. Among the progress are included the following: 1)the preparation and implementation of a new programme in canopychemistry and canopy structure by means of optical spectrometry(splitting the visible and infrared light into high spectral resolutionchannels); 2) intensive work on the first set of ERS-l SAR imagesover Europe and Africa test sites to include support in monitoringof environmental damage to the North Sea and in monitoring of thedeforestation in regions, including the tropical belt; 3) use intensivemethods (interferometric SAR data correlation) for the estimationof forest biomass in flat and mountainous regions; 4) synergy ofhigh-resolution airborne multiwsensor data with spaceborne SARdata sets from ERS-I and J-ERS-l for improved information onecological units at different scales (complemented by the evaluation of the potential advanced optical spectrometer methods); 5)use of the first geophysical radar signal processor for land applications; and 6) using the airborne time resolved LIDAR fluorosensordata to monitor the marine environment.
Thiao et al. (1993) have illustrated the use of GOESwater vapour imagery in predicting heavy precipitation. Theyconcluded that flash flood producing MeSs ~e a multi-scale andconcatenating event. Therefore, a better understanding of themulti-scale nature of heavy precipitation will be attainable withthe merging of the WSR-88D radar data with the various GOESmulti-spectral images, GOES-derived sounding data and SSMIIdata (Thiao et aI., 1993).
In an effort to optimize on the utilization of remotelysensed observations in hydrology, a number of programmes havebeen organized to study hydrological processes in conjunctionwith remote sensing. Examples of such programmes include theGlobal Energy and Water Cycle Experiment (GEWEX) and theTropical Ocean Global Atmosphere (TOGA) programme. TRMMresults are needed for conducting GEWEX.

CHAPTER 4
PROBLEMS IN APPLICATIONS OF REMOTE SENSING IN OPERATIONAL HYDROLOGY
4.1 CURRENT LIMITATIONS OF OPERATIONALUTILIZATION OF REMOTE SENSING
Most of the problems limiting the operational application ofremote sensing in hydrology are either financial or organizational
in natme. Financial problems result in limitations of funds necessary to: 1) further the technology of remote sensing for hydrologicapplications; 2) acquire, process, distribute and utilize remotesensing. data; and- 3) train and maintain personnel. Organizationalproblems result in: 1) a gap between the scientist (collecting thedata) and the decision maker (using the data); 2) a lack of an interdisciplinary approach; 3) a lack of inter-agency collaboration; and4) barriers between national government agencies and international
organizations (UNESCOIWMOI1CSU, 1993).In general, there is a problem of the lack of awareness of
remote sensing among managers and decision makers. According toVaughan (1994), even in Western Europe, people in high posts oftendo not appreciate the usefulness of maps and spatial data. Accordingto Konecny and Vetrella (1994), the organizational problems stem
from the fact that government and users have an organizational structure that does not take into account the uses of remote sensing. Thus,an organizational change needs to be introduced. For a long time, the
drive in remote sensing has come from the providers of data ratherthan the users. Although this situation is slowly changing, it is still
dependent on the support of governments. Furthermore, the fundingof information technology and data is a problem.
According to Cndlip (1994), the absence of high qnality
training in the management of information is holding up the development of remote sensing. Therefore, it can be difficult for
decision makers to introduce remote sensing into theirprogrammes. Furthermore, remote sensing will often be just asmall part of a project manager's job. However, if future managers
can be trained in the use of Management Information Systems(MIS), then this will automatically generate the demand forremote sensing systems· and stimulate the value-added industry
(Cndlip, 1994). As Konecny and Vetrella (1994) and Cudlip(1994) point out, remote sensing is not a discipline but rather it isa technique or tool which produces information for applications.
Cudlip (1994) points out that although the number ofpeople being trained in remote sensing is about right, the field of
training does not always match the current shortages. There is adefinite shortage of trained technicians for routine data-processing
tasks. In particular, the staffing of satellite receiving stations isproving difficult. Although several stations have been built in
developing countries, they are not being used due to the lack of
suitably trained personnel. Thus, a special remote sensing trainingeffort is necessary in developing countries (Demerliac, 1994).
4.1.1 Status in developedconntries
Most developed countries have the necessary resources and capa
bilities to collect, store, analyse, distribute and operationally applyremotely sensed data for hydrological purposes. Available to these
countries a!e the latest in remote sensing technology, data
transmission systems, computer hardware and software, and ahighly developed set of procedures for data collection and qualityassurance (UNESCOIWMOIICSU, 1993). However, organiza
tional problems hinder the operational utilization of remotesensing in hydrology.
4.1.2 Status in developing countries
Many developing countries do not have the financial resourcesandlor the organizational capabilities to benefit from the availableremote sensing technology. There is a competition for scarcefinancial resources in some countries which are struggling toprovide the basic amenities of life to their people(UNESCOIWMOI1CSU, 1993). According to UNESCOIWMOI
ICSU (1993), many developing countries do not have accessibilityto new remote sensing technologies because of their high initialcost, lack of high-level skills (needed to process and apply them)and lack of personnel training capabilities. According to WMO(1993a), the "reason" is the lack of efficient and reliable informa
tion systems such as global telecommunications and the relateduse of electronic mail, electronic bulletin boards and computer-to
computer file transfers. Other problems which contribute to theinability to benefit from the available remote sensing technologyinclude language difficulties, insufficient dissemination of
UNESCO and WMO publications to end-users (UNESCOIWMOIICSU, 1993) and organizational problems. An example of the last
problem is that operational hydrology is carried out in severalagencies with little or no coordination between agencies.
For instance, review of the remote sensing trainingneeds of Africa suggests that the amount of remote sensing isextremely variable among the different countries, and that there
has been a variable amount of cooperation with European organizations. In the past, remote sensing has been presented too muchas a tool while operational applications have not been stressed
sufficiently. The decision makers are also often not aware of theeconomic usefulness of remote sensing and they need to betargeted in training programmes just as much as technicians.
Furthermore. the cost of imagery inhibits the wider use of remotesensing (Kabbaj and Mehrez, 1994).
4.2 PROBLEM AREAS PREVENTING THE
OPERATIONAL UTILIZATION OF REMOTESENSING IN HYDROLOGY
4.2.1 Hydrological variables
Although hydrological studies are still needed to improve theunderstanding of the physical hydrological processes, operational
or near-operational applications of remote sensing techniques tomeasure hydrological variables have been successful in varying
degrees. According to UNESCOIWMOIICSU (1993), there is aclear and serious need for improved understanding of hydrologicprocesses everywhere in the world but particularly in nations of the

CHAPTER 4 - PROBLEMS IN APPLICATIONS OF REMOTE SENSING IN OPERATIONAL HYDROLOGY 35
4.2.2 Hydrological models
"South". Furthennore, the area concerning groundwater in both the
unsaturated and saturated zones still requires a great deal ofintensive studies. The application of remote sensing techniques todate has been more limited for the measurement of bothgroundwater and evaporation. However. operational applications ofremote sensing techniques have been most successful formeasurement of precipitation, soil moisture, snow and basincharacteristics. Operational applications of remote sensingtechniques to measure ice and surface water characteristics have
also been progressing.
Although the application of remote sensing data in hydrologyoffers numerous advantages over conventional data, the advent ofremote sensing caused some confusion among the modellers since
the remotely sensed data could not be used directly in existingmodels. The reasons were that: I) the input data consist of electromagnetic information instead of hydro-meteorological data; 2) theresolution in time and space is sometimes higher, sometimes lower
than necessary due to the available sensors; and 3) there was noinformation available in order to transform the electromagneticsignals into hydrological information with the aid of a model
(Schultz, 1993). A comprehensive study by Peck et al. (1981)
showed that most existing hydrological models were not suitable
for use of remotely sensed data. However, during the last twodecades one can observe the development of hydrological models
designed for acceptance and processing of remotely sensed data(Schultz, 1988). "The structure of hydrological models using
remote sensing data depends to a certain degree on the scale of the
system under consideration" (Schultz, 1993).The water balance equation contains several terms
which can be estimated with the aid of remotely sensed data:
where P is precipitation, E is evapotranspiration, Q is runoff, S iswater storage, and t is time (Schultz, 1993). There are various
techniques available which try to compute P or E with the aid ofremote sensing data. The runoff term Q is particularly difficult toestimate using remote sensing data because it is basically a measurement at a point on the stream. The tenn dSldt representing the
change of water storage on and in the earth contains severalhydrological variables: infiltration, soil moisture, groundwater
recharge, snow and ice. For these variables there are also modelsavailable to compute their values with the aid of remote sensing
data. Furthermore, it is important to distinguish between the estimation of model parameters on the basis of remote sensing data,
and the estimation of model input with the aid of remote sensinginformation (Schultz, 1993).
According Lo Schultz (1993), good hydrological modelshave a structure which does not change from region to region.
Only the "model parameters" are different in various regions andhave to be recalibrated for each region separately. In the case of
physically-based distributed system hydrological models, manymodel parameters depend on the characteristics of the hydrological system, e.g. the basin characteristics, aquifer characteristics
and river reach characteristics. There must be a correspondencebetween the resolution in space of the distributed system typemodel and the resolution of the input data. If the model input (e.g.
rainfall) is available only at one point (raingauge) within an areaof, say, 1 000 km2 while the hydrological model works on a basis
of Landsat pixels (30 x 30 m), then in such a case a simplelumped system model would do the job as well.
"Model input" data can also be estimated with the aid ofremote sensing. For instance, for the computation of snowmelt, the
snow cover area is a relevant model input; for the estimation ofevapotranspiration, radiation and temperature values are relevant model
inputs; and for the estimation of rainfall (as input to rainfall-runoff
models), cloud top temperature values are relevant model inputs.
In the modelling of hydrological processes there isusually never a direct mathematical relationship between the elec
tromagnetic signal and the hydrological variable. Usually, a morecomplex transformation of the electromagnetic signals is necessary,often combined with terrestrial information in order to
estimate hydrological variables. Sometimes data from differentchannels or from different platforms and sensors have to be used
in combination with terrestrial data.As in the case of conventional hydrological modelling prac
tices, the structure of the hydrological model using remote sensingdata is usually a function of the scale of the system under considera
tion. In the case of microscale « 100 km2) hydrological models, thestructure of the model should subdivide the hydrological systems intoarea elements ofpixel size, if the available spatial resolution ofremote
sensing data is to be fully utilized. It is advisable to combine theremote sensing information with other data derived from Digital
Elevation Models (DEM), for instance. In the case of mesoscale (100to 10 000 km2) hydrological models, file number of area elements has
to be reduced considerably as compared to the microscale models.There are many ways to aggregate small are~ elements, such as
Landsat pixels or grid cells of a DEM to larger units. Currently thereare many operational models available for the microscale and the
mesoscale and some of which use remote sensing information areunder development. However, no physically satisfactory models are
available for the macroscale (> 1M km2) except for more lumpedsystem approach models (Schultz, 1993).
There is an increasing interest particularly in macroscale
modelling. There is a need to couple atmospheric General CirculationModels (GCMs) with ocean models and hydrological models for thesimulation ofthe global water cycle. Since the OCMs work on a grid
basis with grid sizes of 500 to 200 km in length, there is at presentsome pressure on hydrologists to develop continental hydrologicalmodels creating information relevant for areas represented by such
grid cells. The GEWEX organized by WMO and ICSU is particularlyinterested in such combined atmospheric-ocean-hydrology models. In
this- context, a OEWEX Continental Scale International Project(OCIP) was initiated, in the framework of which such a combined
model for the total area of the Mississippi River catchment (3 M km2)
shall be developed. In this modelling effort it is intended to use remote
sensing information in order to estimate meteorological, oceanographic and hydrological parameters at continental and global scales
(Schultz, 1993).
According to WMO (l993a), in order for the remote sensing data
to have a real impact on the application, data quality has to be
4.2.3.1 Limitations ofthe state-of-the-art
4.2.3 Remote sensing technology
(10)P(t) - E(t) - Q(t) = dS(t)/dt

36 CURRENT OPERATIONAL APPLICATIONS OF REMOTE SENSING IN HYDROLOGY
specified (and fulfilled) at the same time as data requirement. Dataquality has to be specified in terms ofhorizontal resolution, vertical resolution (if applicable), frequency of the observation andaccuracy. Because quality parameters are different for the VariOllS
scales of application, two figures are generally quoted, for globalscale, G, and regional scale, R, respectively. Appendix IV, Table 1gives the Executive Council Panel of Experts on Satellites(ECSAT) list of satellite data requirements for upper air and forsurface. respectively. This table also lists the' user category of therequirement. Furthermore, these satellite requirements areexpressed in tenus of geophysical parameters, which are what theend-user needs. These requirements are different from the requiredcapabilities of near-polar-orbiting satellites and of geostationarysatellites (given in Appendix IV, Tables 2 and 3, respectively),which are much closer to the original measurements used to derivethe geophysical parameters.
4.2.3.2 Consistency ofdata and needfor calibrationofnew sensors
Given that the ECSAT requirements of Appendix IV, Tables 2 and3 are what WMO reasonably expects from satellites (and thussatellite-systems planners) in the near- and medium-term, WMO(1993a) has converted these data requirements (expressed in termsof geophysical parameters in Appendix IV, Table 1) into missionrequirements, as expressed in terms of observing techniques. Theuser requirements specified in terms of observing missions aregrouped as follows: 1) multi-purpose- imagery; 2) atmosphericsounding; 3) sea-surface observation; 4) radiation budget andatmospheric chemistry; 5) high-resolution imagery; and 6)telecommunications. Each mission has specific objectives, specified observation requirements, as well as specification of typicalinstrumentation/sensors either operational at present or proposedin order to fulfil the mission; these are given in Appendix IV,Table 4. The main objectives of the multi-purpose imagery,supported by the atmospheric sounding, the earth radiation budgetand the high-resolution imagery missions, are mainly driven byoperational hydrology. The corresponding observation requirements allow for the applications (objectives) to be implemented.Furthermore, the telecommunications mission supports the globald-ata acquisition, direct broadcast of data and distribution of datafrom all geostationary and near-polar-orbiting environmentalsatellites of interest for WMO programmes. In Appendix II,Table 3 is a summary table highlighting the relationships amongstthe required geophysical parameters, observing technologies andcandidate sensors.
4.2.4 Availability of data
4.2.4.1 Geographical or climatological regionswhere remote sensing data are most applicable
Because most techniques attempt to measure surface features,remote sensing works best in areas with little to obscure the surface(Rango, 1994a). Remote sensing tends to work best in arid andsemi-arid regions because vegetation is the most common featureobscuring the surface. Furthermore, in the area of snow hydrology,snow mapping- applications also tend to work best where there islittle vegetation to obscure the snowpack (Rango, 1994a).
4.2.4.2 Data acquisition and distribution capabilities ofcountries
The World Weather Watch (WWW) has become the basicprogramme of WMO and is of vital importance to the success ofother WMO programmes (WMO, 1992b). The Global ObservingSystem (GOS) is one of the main elements of the WWW. TheGaS is divided into the surface-based portion and the space-basedportion. The environmental satellites (near-polar-orbiting andgeostationary) constitute the space-based subsystem of the GaS,with the major goal of augmenting the information provided bythe surface-based subsystem (conventional data network) tocomplete the global coverage (WMO, 1992b). The two types ofenvironmental satellites are complementary. The ground segmentof the space-based subsystem of the GOS is composed of thesatellite-data ground receiving stations and these have two majorfunctions. The first function is to provide the reception of thesignals from satellites containing qualitative and quantitativeinformation, including observations from data collection platfonnsand other similar systems (e.g. for the ARGOS system). Thesecond function is to process, format, display and distribute theinformation received, either by direct broadcast via the satellitesthemselves, or over the GTS in pictorial or alphanumeric form tomeet the global, regional and national requirements of the WWW.
According to WMO (1992b), there are approximately700 established satellite receivers operated by WMO Membersthroughout the world. The large number of receivers is a result ofthe widely varying geographical location ofthe countries and theirmeteorological regimes. Furthermore, another factor contributingto this large number of receivers is the rapid technologicaladvances in satellites and in the equipment available for receiving,processing and presenting the quantitative and qualitative satellitedata.
A survey couducted in 1990 by WMO (I992b) throughnational Meteorological Services revealed information concerningthe status of satellite receiving equipment within WMO Regions.There are six Regional Associations (RAs): RA I (Africa), RA II(Asia), RA III (South America), RA IV (North and CeutralAmerica), RA V (South-West Pacific) and RA VI (Europe). Fourcategories of satellite receiving equipment were surveyed: lowresolution polar-orbit data (APT); high-resolution polar-orbit data(HRPT); low-resolution geostationary data (WEFAX); and highresolution geostationary data (RR). The goal for the WMORegions is that each WMO Member should be equipped with atleast one polar-orbiting satellite data receiver and one geostationary satellite data receiver. However, the Voluntary CooperationProgramme of WMO coordinates the needs of WMO Membersfrom developing countries with available resources from WMOMembers from developed countries. A fact highlighted in thesurvey is the lack of satellite ground receiving equipment registration with the national telecommunication administrations and theInternational Telecommunication Union's (lTV) InternationalFrequency Registration Board (lFRB). Registration is advised inorder to protect and preserve the present allocation. Furthermore,the present allocation is limited and new technologies areconstantly vying for frequency allocation.
Results of the survey indicated the geographical distribution of equipment as shown in Table 3 (WMO, 1992b).
Since it is recognized that the HRPT imagery is mostuseful to operational meteorological and hydrological forecasting,

CHAPTER 4 - PROBLEMS IN APPLICATIONS OF REMOTE SENSING IN OPERATIONAL HYDROLOGY 37
Table 3 - Geographical distribution of equipment
WMO Regional AssociationMembers
II III IV V VI
Total 55 30 13 25 16 37
Per cent of Membersequipped with:
APT receivers 80 80 85 76 38 57
HRPT receivers 13 27 15 20 31 46
WEFAX receivers 46 25 12 25 37 46
HR receivers 11 15 4 5 21 28
increasing the coverage is a first priority to enhance the implemen
tation of the WWW (WMO, 1992b). It may be noted that RA VI(Europe) has the best percentage of Members equipped with highresolution imagery receivers for both the polar-orbiting (HRPT)and the geostationary (RR) satellites.
The availability and access of remote sensing dataneeded for operational hydrological applications is difficult exceptwhen these applications arc run at large meteorological serviceswhich have responsibilities in those fields (WMO, 1993a). Highrate digital acquisition stations are required for near-real-timeapplications, otherwise data are obtained from archives, and thusonly for delayed-time applications. High geometrical resolutionsare required for operational hydrological applications, and areavailable from operational satellites such as LANDSAT and SPOT(using the VISINIR range). However, the technical complexity ofacquisition and distribution of these images seriously limits theaccess to these data beyond applications such as pilot projects.Furthermore, passive microwave radiometry, which could beextremely valuable in hydrology, is not available with the appropriate resolution (WMO, 1993a).
4.2.5 Cost of data
The financial aspects of remote sensing data include the direct costof acquiring data, cost trends and policy, and thus the capabilitiesof countries to purchase the data. In the developed countries,funding is provided mainly by national institutions and international grants. However, there is a need for better coordination in
order to make the best use of the funds available(UNESCOIWMO/ICSU, 1993). In many developing countries,there is a severe problem regarding financial constraints and it hasbecome worse over the last 10 years (UNESCOIWMO/ICSU,1993). Sufficient funds are not available to support either hydrological research or adequate data collection. Thus, there is a needfor support of sustained hydrological research and data collection,particularly in the humid, semi-arid and arid parts of the tropicalworld (UNESCOIWMO/ICSU, 1993). According to FAO (1989),the developing countries stand to benefit most from this remotesensing teclmology. They urgently need reliable resource inventories and maps to provide a basis for more rapid, geographicallybalanced and ecologically sound economic development (FAD,1989). According to WMO (1993a), most experimenters havereceived data free of charge, in connection with an Announcementof Opportunity process, and most of them are financiallysupported by their national space agencies. When this support
expires, only national meteorological centres connected to theGTS will continue to receive data free of charge.
4.2.6 Computer data-processing capability
Impressive developments have occurred in the field of imagehandling systems (WMO, 1993a). The traditional hardcopyoriented approach has been replaced by software.Hardware/software systems have been developed which allow forimage enhancement, multi-channel image handling, multi-temporal image sequencing, geofrequency in appropriate projections andmerging of images overlaid with other information (radar images,bulletins, maps, etc.) (WMO, 1993a). Geographical InformationSystems are used to supply all necessary background information,including DEMs. Furthermore, modern technology providesreasonably inexpensive workstations able to support these applications. WMO and national and international aid-to-developmentprogrammes are active in supporting developing countries for theacquisition and maintenance of processing facilities. Furthermore,the National Resources Institute (NRI) in the UK provides acomprehensive service for the interpretation and analysis ofremotely sensed imagery, from both satellite and airborne platforms. The latest technology including VAX, Sun and PC-basedimage processors in conjunction with GIS software to address avariety of environmental issues is used.
4.2.7 Data presentation/publication/dissemination
In order to communicate between the scientist collecting andprocessing the data, and the decision maker using the data, thedata must be published, presented and otherwise properly disseminated. WMO (1993a) points out that there is "difficulty inidentifying true end-users from others whose primary interest is to
transform information to be handed over, with added value, tosomebody who, in reality, has not been involved which makes itdifficult to get authoritative long-term validation of applicationstheoretically demonstrated".
4.2.8 Human resources and training capability
UNESCOIWMO/ICSU (1993) has identified a number of prob·lems affecting the human resources and training capabilities ofvarious countries. They are: 1) inadequate number and quality ofqualified hydrologists and technicians; 2) the "brain drain" affecting trained staff is too high; 3) technology is still unbalanced withskills of the users; and 4) UNESCO and WMO publications do notreach a sufficient number of end-users. However,UNESCOIWMO/ICSU points ont that the developed world hastried to make adjustments in the educational system to adapt to therapid and unpredictable changes taking place; this is reflected inthe increasing variety and contents of training courses andimproved training methods. Furthermore, UNESCO/WMO/ICSU
points out that in some developing countries, education is stillconventional and emphasizes knowledge rather than developingskills and professional attitudes. There is an inadequacy in staffand teaching facilities and thus poor results are attained fromeducation and training courses. However, the training

38 CURRENT OPERATIONAL APPLICATIONS OF REMOTE SENSING IN HYDROLOGY
opportunities and documents resulting from UNESCO (IHP)- and
WMO CORP) programmes have greatly contributed- to the coun
tries' human resources and training capabilities. Furthermore, there
is a need for an educational network which would put basic material
and data products at the disposal of educational entities (Fea, 1994).
According to Vaughan (1994), not only is thegeographic and thematic demand for remote sensing education
and training dispersed, but so is its present and future provision.
The requirements and stail.dards for remote sensitig education and
training vary, qualifications are not universally recognized and few
training programmes exist. However, the European Association of
Remote Sensing Laboratories (EARSeL), which has been involved
in education and training programmes for many years, has so far
taken the main initiatives on the European scale by identifying
gaps in the existing provision, analysing needs and developing
training materials (Konecny and Vertrella, 1994). Cudlip (1994)
recognized that training courses tend to concentrate too heavily on
technology and image processing. Rather, there needs to be an
improvement in the integration of remote sensing as a tool into
GISs and the various application disciplines. The aim should be to
raise the general level of awareness of remote sensing technology
across the disciplines and to provide specialist training for scien
tists and engineers (Mather, 1994). Furthennore, a prerequisite for
any proper training is the need to firstly instruct the instructor(Fea,. 1994}
The assessment of the costfbenefit aspects of remote
sensing education is difficult because the return on investment is
not easy to evaluate (Torlegard, 1994). The cost of remote sensing
images is a problem for many universities. For instance, so far it
was generally accepted in Europe that basic' education and
research should be paid by the State. However, the trend now is
towards education training and infonnation in specialized fields in
remote sensing as the responsibility of the economic agents, Le.
users, industrial and service companies (Demerliac, 1994).
According to WMO (1995), the comprehensive strategic
plan for systematically improving the utilization of satellite data
endorsed by the WMO Executive Council has started to work well
and is still valid for ongoing implementation over the next five to
10 years. The strength of the plan is that it provides a coordinated
approach to making more effective use of the large number of
satellite education and training activities. These activities have
been progressing independently at different rates within a large
number of different organizations. Further, WMO (1995) reports
that cooperation, the poolings of existing resources and a commit
ment to embrace the overall strategic goals of the plan was starting
to establish the critical mass of expertise and supporting infra
structure to make real progress in improving the application of
satellite data in meteorology and hydrology.
Two of the key issues for the WMO Congress in 1995
(WMO, 1995) were: I} to actively support the strengthening of the
Specialized Satellite Application Training Centres at the Regional
MeteorologiCal Training Centres (RMTCs) at Nairobi, Kenya and
Niamey, Niger in association with the sponsoring satellite operator
(EUMETSAT); and 2) to actively promote WMO's satellite educa
tion and training strategy in RAs II, III, IV and V and, in
particular, to try to obtain sponsorship for the establishment of at
least one specialized satellite applications training RMTC in each
of these Regions.

CHAPTERS
A STRATEGY FOR ACCEPTANCE OF REMOTE SENSING IN OPERATIONAL HYDROLOGY
In order to optimize the use ofremote sensing on an operational basis,we must identify the hydrological needs regarding data collection,
modelling and expected benefits. Furthennore. major hydrologicalservices of agiven country must be made the focal point of this strategy.
WMO (l993a) highlights that many applications of
satellite data ended when a paper was published or with the report
of a successful pilot project. However, the application neverarrives for the end-user to utilize operationally.
5.1 PAST STUDIES OF OPERATIONAL
HYDROLOGICAL OBSERVATIONAL NEEDS
AND EXISTING AND FUTURE SATELLITES
There is a definite need to extend the use of satellites for provision of
hydrological data sensors for the purpose of hydrological data acqui
sition (UNESCOIWMOIICSU, 1993). There is alsn a need to
implement the World Hydrological Cycle Observing System(WHYCOS) to facilitate access to global data and snpport hydrolog
ical services in need (Rodda et aI., 1993), and to improve forecasting
system effectiveness by incorporating weather radar information.
The wide range of operational hydrological observational
requirements and mission requirements presentedin4.2.3 above can only
be metby a greatnumber ofsatellites and instnunents and thus aneed for
new technological developments. Because of limited resources, ECSAT
has developed a "top-level statement" which attempts to indicate WMO
priorities and suggested a stnltegy. ECSAT (WMO, 1993a) has made the
following recommendations: 1) the continuation of the present/core oper
ational mission, including those improvements under way; 2) the
immediate addition, to the baseline, of observations which have proven
sufficiently mature for transition to an operational status; and 3) to under
take technological developments on the important data requirements for
WMO, which cannot be met with present operational or demonstrated
instruments. The core mission for the space-based subsystem of the
Global Observing System is based primarily on molti-purpose and high
resolution imagery and atmospheric sounding plus related subsystems for
data transmission to the ground together with the ancillary information
needed for data processing. The most important requirements for imme
diate addition are: 1) to improve monitoring and understanding of
atmospheric convection (from geostationary orbits); 2) to improve the
performance of atmospheric sounding through high spectral resolution
lR spectroscopy (from ncar-polar orbits); 3) to extend the molti-purpose
imagery mission into the microwave spectral domain; 4) to have access
to high-resolution active microwave images (from SAR); 5) to improve
the present shortwave and longwave instnnnentation; and 6) to study the
chemical processes in the troposphere. As for high-priority longer-term
requirements, these are as follows: 1) high-vertical resolution frequent
soundings using IR spectrometry (from geostationary-orbits); 2) wind
profiling (from near-polar-orbits); 3) use a backscatter LIDAR-based
imagery to drastically improve the accuracy of soundings; 4) use a low
inclination orbit wilh a rain-radar on board to improve global
measurements of precipitation rates in lhe tropics (namely the TRMM
mission launched by the US andJapan in 1997); and 5) use DIALLlDAR
and very-high-resolution spectroscopy in the 02A-band for measurement
of sUIface air pressure.
5.2 DEVELOPMENT OR MODIFICATION OF
HYDROLOGICAL MODELS BASED ON
REMOTE SENSING INFORMATION
Mathematical hydrological models started from simple linear lumped
deterministic models and have developed towards more complex
models containing non~linear and stochastic components as well as
high resolution in space represented by distributed system models
(Scholtz, 1993). Hydrological models based omemote sensing should
use a distributed system model with a high resolution in space in which
the basin area will be subdivided into a large number of area elements.
Furthermore, we can expect that future models will at certain times and
for certain applications require a high resolution in time (e.g. one hour
time increments). In this case it will be necessary that a transfOlmation
of model input into model output be achieved by the model in such a
way that for each time increment and each area element in the system,
the relevant mathematical computations have to be camed out.
Furthermore, the model input will not consist of hydrometeorological
data (e.g. rainfall, snowmelt, etc.) but rather in the form of electro
magnetic information obtained from various sensors. As a result, the
mathematical structure of a model being able to execute all these
numerous computations will be rather complex. Therefore, the model
builder is faced with a problem to reduce the tremendous amount of
information to the necessary quantities, e.g. by aggregation of similar
area elements. Furthermore, the historical structures of mathematical
models need new dimensions. Since hydrological distributed models
consider the areal diversity of the hydrological process, these models
are preferred over lumped models if remotely sensed data are used.
Although almost all hydrological processes are non-linear, many such
processes are not highly non-linear, which often allows the mathemat
ical representation of the process by a linear model. Finally, in the
process of the development of new hydrological models using remote
sensing information, it is advisable to test which model components
have to be deterministic and which model components can be repre
sented by a stochastic approach.
"There is an interdependency between the structure of the
hydrological models and the hydrorneteorological information avail
able to be used in such models. Therefore, it is necessary - in order
to make a statement on future developments - to look at both; rnath~
ematical structures ofpresently available models using remote sensing
data as well as new remote sensing platforms and sensors which we
can expect in the near future, from which new types ofhydrologically
relevant data can be obtained" (Schultz, 1993). Satellite imagery
allows recalibration of model parameters according to the relevant
seasons of the year. Additionally, future remote sensing information
opens even wider and more promising fields of hydrologic activity
within the framework of global research programmes such as IGBP
or GEWEX (Scholtz, 1988).
5.3 DEMONSTRATION OF SIGNIFICANT
TECHNICAL AND ECONOMIC BENEFITS
The development of sound basic data is a fundamental element in
understanding hydrological systems (UNESCOIWMOIICSU,

40 CURRENT OPERATIONAL APPLICATIONS OF REMOTE SENSING IN HYDROLOGY
1993). Ftrrthennore, the information/data gathered through remotesensing is vital to the resolution of many serious conventional data
problems including the following. Hydrological data is oftentimesscarce and the quality may be unreliable. The data are not usuallycollected with sufficient attention to protocol and are not stored in
such a way as to facilitate retrieval by subsequent users(UNESCOfWMO/ICSU, 1993). The degradation in hydrological
networks is due to insufficient funds to maintain and repairdamaged stations. Whereas remote sensing from satellites, tele
metry of data, weather radar, solid-state data loggers which can bedownloaded directly into computers, and state-of-the-art computersoftware can provide opportunities for acquiring information more
cheaply and efficiently, and to higher standards of quality(UNESCOfWMO/ICSU, 1993).
Remote sensing plays an important role in collecting upto-date information and data in both the spatial and temporaldomain. According to UNESCO/WMO/ICSU (1993), the mostsevere resource management issues exist under extreme conditions: in time, during floods and droughts; and in space, in arid,semi-arid and tropical areas and in coastal areas. The use of
remote sensing techniques is vital in the areal estimation especially of precipitation and soil moisture. Remote sensingtechniques enhance the seasonal forecasting capability and aid inthe development of storm surge forecasting, drought and low flow
forecasting and improve the risk management practices.
5.4 TARGETING MAJOR HYDROLOGICALSERVICES
In order to bridge the gap between scientists and decision makers,
an important strategy is to integrate the remote sensing information through a national archive to support the decision-making
process and to facilitate the education of decision makers(UNESCOfWMO/ICSU, 1993). Another important strategy is toprovide effective mechanisms for coordination among decision
making agencies. An additional strategy is to establish jointprogrammes among the agencies for publications, meetings andtraining (UNESCOfWMO/ICSU, 1993). Furthermore, there needs
to be an awareness of the needs for interdisciplinary collaborationin hydrology and water resources so as to avoid overlaps and
duplication of activities between agencies and disciplines. Toaccomplish this strategy requires overcoming financial constraintsand modification of current organizational and institutional
arrangements at both national and international levels.In order to improve the use of satellite data particularly
in developing countries, WMO (1993a) recommends the follow
ing strategies. First, well designed pilot projects should bepromoted, involving the end-user from the onset since it is the
end-user that will have to ensure the continuation of the activity if
the pilot project is successful. Second, improved information services should be developed to allow users, particularly from
developing countries, to be able to survey existing information and
know where it is and how to access it. Data from different sensorsor from more than one satellite can be combined with a GIS to
produce new products and applications. Third, education andtraining should reach the true end-users instead of stopping at an
intermediate level (often due to language difficulties). Databasesof training events, distribution of computerized training packages
and assimilation of satellite-focused education andtraining within the framework of the current local education and
training organization should be considered.According to Torlegard (1994), remote sensing technol
ogy developments and education should be more demand driven
in the future, but it is difficult for clients/users to formulaterequirements. This is an interactive process. The information
requirements of the users have to be established rather than theremote sensing requirements. Users should not have to be experts
in the field of remote sensing (Cudlip, 1994). When designingtraining programmes, the needs of the clistomers should be carefully considered. For instance, courses organized in institutions
and universities in Europe may not correlate with the level ofactivity within, for example. individual African countries. Whatmay be needed instead are well targeted, well prepared, in situcourses. These need to be designed to suit both the equipmentavailable and the particular problems of the users (Vaughan,1994). On the other hand, sometimes it is necessary to teach training courses in developed countries. At that time, the developingnations must make sure to send the end-users who need the hands
on experience and not use the training course as a reward forseniority. The attendee must truly be a user of the data.
Mather (1994) suggests that remote sensing is besttaught not as a stand-alone technology but as a part of a wideperspective which includes social, environmental, economic and
political aspects of environmental management, as well as GIStechniques. Remote sensing should be established as a basic
component of GISs. Thus, the concept of geo-managementcan beregarded as a discipline, and GIS the tool with which it can be
perfonned (Cudlip, 1994). Therefore, new management conceptsneed to be introduced into management schools. Educators need
to address the problem of information management. Furthermore,the design of remote sensing tools (e.g. GIS) needs to be user
driven and not produced by the manufacturers. The skills and thetools must fit the problems and not vice versa (Cudlip, 1994).
A workshop held in Strasbourg in 1993 by EURISYon
"Training in Remote Sensing: A European Proposal?" resulted intwo proposals. The first proposal was for the Integration of
Environmental Remote Sensing in European Secondary Schools.The plan is to establish five to seven schools in a number of countries and to provide training materials including distance learning,
where instructors may transmit training modules over telephonelines to remote learning locations. The second was related to aEuropean Network of Tertiary Education Centres in Remote
Sensing and was proposed by EARSeL. The project wouldemphasize needs and standards, and would involve a network of
about 10 universities to develop a curriculum and to establish a
pilot system. The pilot project would concentrate on applicationsas opposed to hardware and software, teaching a common stan
dard of understanding across disciplines (Mather, 1994). Mather
(1994) suggests that in the teaching of remote sensing in Europe,the role of national and European professional societies (EURISY.
EARSeL, British/French/ItalianiSpanish Remote Sensing and
Photogrammetry Societies) should be considered. Although it isnot essential that everyone be trained in remote sensing, the prin
ciples should be included as part of general education at schoollevels so that in the future, decision makers in particular have
sufficient background knowledge to understand the tools beingmade available to them (Cudlip, 1994).

CHAPTER 6
ELEMENTS OF SUCCESSFUL REMOTE SENSING IN OPERATIONAL HYDROLOGY
]n order for the smooth and rapid transfer of new developments inremote sensing into operational status, strategies for anticipatingfuture trends are essential (WMO, 1993a). The remote sensinginstruments planned to be on board the new generation of opera~
tional satellites scheduled up to the early 2000s have already been
decided and some are currently being tested on satellites in anexperimental mode (WMO, 19930). The high rate of developmentin the communication and computing technologies continues tohave significant benefits for satellite data utilization; these offerthe capability to receive, process. disseminate and display increasingly large amounts of data faster and faster, while at the sametime reducing costs and system size. Rapid advances are alsobeing made in education and training systems and technologieswith the experimental use of computer-assisted learning (CAL)systems. CD-ROM and video disc technology are now being usedfor satellite data archival and for production of satellite applicationmodels. These systems have the capacity to store and replay alarge amount of satellite imagery at relatively low cost and can beconnected to PCs to enable interaction with local applicationssoftware. WMO (1993a) further reports that small but quitepowerful and affordable desktop workstations are now in generaluse in the more developed countries and are penetrating into theleast developed countries. The Zeam Meteo Disc system,produced by the Freie Universitat Berlin, is being used in NewZealand and will be introduced soon for training in Australia. Thenew concept of Meteorological Data Distribution (MDD) systemworks and it has shown great potential in dissemination of weatherbulletins via the Meteosat satellite in Africa and the Middle East~
these have greatly enhanced meteorological data availability inAfrica. A project called MOSAIC has been initiated by EUMETSAT and is being developed by the University of Oxford fortraining on the use of MDDdata with specific emphasis on applications in devcloping countries. Data Collection Platfonns (DCP)and Data Retransmission Systems have also shown an improvement in the availability of data. However, WMO (l993a) pointsout that the introduction of Electronic Bulletin Boards for providing information on satellite-related activities and digitalinfonnation networks is beyond the capacity of many of the developing countries in the short term.
According to WMO (l993a), the new generation ofearth resources satellites which carry active sensors, such as SAR,open up new horizons for applications in land use, oceanography,hydrology and the general environmental impacts of climatechange; these offer substantial benefits for monitoring in thesefields in the developing countries. These satellites deliver moredata (orders of magnitude) than the current generation of meteorological satellites and thus require much larger and more expensiveground stations and extremely expensive data-processing, archivaland data access facilities. Furthennore, they open up a whole newfield of education and training much of which will require veryadvanced knowledge such as a thorough understanding of thecomplexities of interpreting remotely sensed radar imagery andassociated data. WMO (l993a) further states that it will take along time to impart such knowledge and interpretive skills to largenumbers of operational meteorologists and hydrologists.
6.1 FINANCIAL RESOURCES
In order to maintain applications of remote sensing on a long-termoperational basis, it is necessary to have sufficient financialresources available. International agencies need to provide fundsand leadership to assist developing nations in establishing andmaintaining long-term remote sensing data networks(UNESCOIWMO/ICSU, 1993). However, WMO (l993a) reportsthat programmes are being severely pruned and launch schedulessignificantly deferred now in almost all satellite operating countries due to economic pressure for the resources to be directedelsewhere (for instance to social welfare programmes). WMOfurther reports that the new expensive earth resources satellites,with their output focus on climate and environment, are nowcompeting for funds from the funding pool which was once theexclusive domain of the meteorological satellites, whose outputfocus is essentially on day-te-day weather forecasting.Furthermore, the development trend for the future of themeteorological satellite programme itself has flattened considerably in the past few years and has certainly not kept pace withtrends in the communications satellite programme or in the transfer of new technologies into satellite processing, applications andtraining systems (WMO, 19930).
6.2 REGIONAL REMOTE SENSING CENTRES
The establishment of regional remote sensing centres is an international effort which aims to ensure that all countries havesufficient remote sensing capabilities by transferring technologyand providing the appropriate technical assistance. Furthermore,the technology transfer process includes demonstration projectsand establishment of international databases to support projects onregional and global scales (WMO, 1993a). According toUNESCO/WMO/ICSU (1993), capacity-building programmesshould be flexible in approach and give due consideration todifferences between countries and their corresponding needs intime and space.
6.2.1 Expert advice
The report by UNESCOIWMO/ICSU (1993) suggests that thepromotion of the development and operational application of newremote sensing technology involves the cooperation of severaltypes of experts (i.e. a multidisciplinary approach) such as operational hydrologists/researchers, systems analysts, statisticians,geographers, remote sensing and GIS experts and computerspecialists. WMO has provided a list of experts (Appendix II ofAnnex II (WMO, 19930) report and Annex V (WMO, 1994)report) in the use of satellite data for meteorology and operationalhydrology. These experts could be used as consultants for developing special training modules or conducting special trainingcourses for RMTC inslructors. UNESCOIWMO/ICSU (1993)
highlights that important organizational and institutional matters

42 CURRENT OPERATIONAL APPLICATIONS OF REMOTE SENSING IN HYDROLOGY
requiring urgent consideration include the following: 1) effectivecoordination between United Nations (UN) agencies involved inthe water field; and 2) improved documentation elements of theHydrological Operational MnWpurpose System (HOMS)programme.
6.2.2 Training of personnel
According to WMO (1993a), ECSAT studied techniques toimprove the use of satellite data through more effective education
and training. Central to the techniques is the concept of training ofinstructors at the RMTCs in order to provide "on-the-spot training." ECSAT has proposed a strategy for education and training insatellite matters with the strategic goal to systematically improvethe use of satellite data for meteorological and hydrological applications over the next 10 years in all Member countries, with afocus on meeting the needs of developing countries. In order toachieve this goal, there are three major strategic objectives. Thefirst objective is to build on the existing infrastructure (includesfunctional responsibilities, organizational structure, managementprinciples and data quality control) in a way that the initiatives areconsistent with the users' capabilities to absorb and sustain themindependently in their own operational environment. With regardto implementing new technology in developing countries, threemain areas requiring training include: 1) the operation and maintenance of the facilities; 2) the use of the information; and 3) theinfrastructure supporting the facilities. The second objective is tofocus on the developing countries with particular attention tosystematically improving the level of expertise of instructors at allRMTCs in the use of satellite data. ESA offers a variety of satellite application training activities which could be used by RMTCinstructors. NOAA/NESDIS has proposed some initiatives forsatellite technology and applications training programmes andseminars for RMTCs over a five-year period. The third objective isto anticipate future trends in satellite data applications and. ineducation and training techniques, so that new developments canflow through to operational users quickly and efficiently. TheExecutive Council Pane1JCommission for Basic Systems (CBS)Working Group on Satellites has drafted a comprehensive set ofWMO satellite observation requirements up to the year 2010.
In order for ECSAT to implement the above proposedstrategy, it has highlighted two important points. First is the establishment of specialized satellite application training centres at sixRMTCs (strategically located around the globe). Second is thateach satellite operator participating in the space-based subsystemof the Global Observing System cooperates with at least one ofthe six specialized RMTCs with regard to satellite trainingprogrammes, facilities and expertise required. Furthennore, whilethe strategy aims to serve the full spectrum of needs, from theleast developed to the most developed countries, it is intended tobe applied in such a way that the focus is always on the needs ofthe developing countries (the least developed will benefit morethan the others). Thus, the gap in satellite data utilization capability between the least developed and the more developed countriesshould become continually narrower. Additionally, the proposedoverall funding strategy is based on a cost minimization strategyand a cooperative funding mechanism which strives for more efficient use of the existing funded projects and funding sources byfocusing them all on a few clearly identified high-priority satellite
education and training activities. The first priority should be tofocus as much funding as possible to upgrading the satelliteeducation and training facilities and capabilities of the sixRMTCs. According to WMO (1995), EUMETSAT has activelyinvestigated the possibility of co-sponsoring two SpecializedSatellite Applications Training Centres (SSTC), one at Nairobi inKenya and the other in at Niamey in Niger. These two SSTCswould operate for trial and evaluation and serve as a basis forconcentrated efforts to extend the concept to other parts of theworld.
According to WMO (1995), good progress is beingmade in implementing other components of the satellite educationand training strategy within WMO and in special organizations invarious parts of the world. The Japan Meteorological Agencysponsored a special international training seminar in Tokyo inNovember 1994 on the utilization of GMS satellite data. Most ofthe attendees were from developing Asia-Pacific countries. TheAustralian Bureau of Meteorology coordinated a follow-upseminar in Melbourne which was held in November 1996. WMOconducted a major satellite training event in Costa Rica in October1995. The China Meteorological Administration is planning tohave an international satellite applications training seminar inBeijing to focus on the utilization of FY-2 satellite data about ayear or two after its launch. Furthermore, EUMETSAT hosted aUsers' Forum at the Niamey RMTC in April 1995 during the weekfollowing a WMO training event for RA I.
The workshop held in Strasbourg in 1993 on Training inRemote Sensing: A European Proposal? revealed additionalsuccessful education and training accomplishments. The UNEconomic and Social Commission for Asia and the Pacific(ESCAP), based in Bangkok, provides various training courseswith remote sensing content for Asian and Pacific countries(Cudlip, 1994). Willemont (1994) presented and demonstratedFrance's interactive remote sensing training course on a PC stationwith a CD-ROM reader. He also presented PROMETE, a series ofmultimedia and multi-targeted programmes. These modularprogrammes are designed to meet the training needs of specialistsin remote sensing worldwide as well as non-specialists for whomremote sensing is becoming an important tool. Mather (1994)presented the Combined Higher Education Software Team(CHEST) arrangement in the UK, which provides access forhigher education teaching purposes to an archival of up-to-dateLandsat TM images of the UK for an annual fee. Furthermore,various universities in Europe, such as Dundee University in theUK, offer short courses in remote sensing for specific audiences.These short courses have been valuable in terms of continuingprofessional development of specialists working in industry andgovernment (Mather, 1994).
Significant progress has been made in two additionalareas of the WMO satellite education and training strategy. Theyboth involve the introduction of new technology and they are: 1) thedevelopment of CAL modules for satellite education and training;and 2) the development of electronic mail and bulletin boardsystems which open up worldwide access to satellite education andtraining infonnation (WMO, 1995). CAL activities are now beingheavily promoted at various international seminars and are beingcoordinated by various bodies including Meteo-France and theStanding Committee of Heads of Training Institutes of nationalMeteorological Services which has strong links with the WMOEducation and Training Programme. The German Foreign Aid

CHAPTER 6 - ELEMENTS OF SUCCESSFUL REMOTE SENSING IN OPERATIONAL HYDROLOGY 43
Programme (GTZ) has agreed to fund a project on CALdevelopment within the goals and objectives of the WMO satelliteeducation and training strategy. The expansion of electronic mail,
electronic bulletin board systems and Internet facilitiesincorporating items such as the World Wide Web is now opening up
easy access to huge amounts of satellite training information andtraining modules. WMO Headquarters is now connected to Internet
and has developed a series of useful home pages which provideinformation via the World Wide Web. NOAAlNESDIS has set up aWeb home page containing three satellite interpretation tutOliaIs.
EUMETSAT and several other organizations also have informationavailable for electronic access in this manner. The major immediateproblem is to put in place the basic communications and computinginfrastructure to enable the specialized satellite RMTCs to connectto these systems. This involves items of funding, technical knowhow and consideration of the problems of improving the basiccommunications technology in many developing countries.
A US company, AT&T, has begun marketing a newvideo-teleconferencing service which could make distance learning easier by enabling instructors to transmit CAL modules overtelephone lines from desktop computers equipped with smallvideo-conferencing cameras. Although this system is still in thedevelopment stages and would not be available immediately todeveloping countries because of cost and communications infrastructure factors, once established such a system would be anefficient, cost-effective way to train people who are geographically dispersed (WMO, 1995).
6.3 GROUND RECEIVING STATIONS
For a successful data acquisition system, there is a need for automated reliable, accurate field stations, telemetered for real-timeinfonnation where appropriate and simple manual observationnetworks where appropriate (UNESCO/WMO/ICSU, 1993).
According to WMO (1993a), there are certain data circulationrequirements regarding both the near-polar-orbiting and geostationary satellites and thus their respective ground receivingstations. For the near-polar-orbiting satellite there is a two-foldrequirement of direct broadcasting capability and global dataacquisition. Direct broadcasting benefits local processing (e.g.nowcasting) and other real-time applications. Global data acquisition is required without gaps in coverage or in time. Data may beavailable for applications within two hours of observation; this isachieved by on-board storage and successive transmission toCommand and Data Acquisition stations or by using Data RelaySatellites. As for the geostationary satellites, real-time services areone of their essential features, which are primarily used fornowcasting. The portions of the image for regional use must beavailable within a few minutes from the observation.Geostationary satellites must provide a relay service for datacollection from command-based DCPs. These satellites could alsobe used for telecommunications, such as EUMETSAT'sMeteorological Data Distribution. Furthermore, as a telecommunication facility, a geostationary satellite could be used to transferimage data from other geostationary satellites and near-polarorbiting satellites out of the acquisition range for local directread-out (WMO, 1993a). The NRI in the UK, in conjunction withother British organizations, has developed low-cost, simple-to~use
and robust systems for local satellite data reception and product
generation. The Local Applications of Remote SensingTechniques (LARST) systems allow reception of Meteosat and
NOAA satellite data locally, enabling users to interpret datarapidly using personal computers.
In an effort to maintain the polar-orbiting and geostationary satellite systems to ensure the continuity of operation,and the data dissemination and distribution services of those satellite systems, WMO (I993a) outlined the critical missionrequirements: 1) the contingency plans include coverage of thoseregions of the world where severe weather conditions (e.g.cyclones, tornadoes; etc.) develop; 2) the importance of directbroadcast services such as APT, WEFAX, HRPT continuity shouldbe considered; and 3) to ensure the continued availability of highresolution data, standardization of transmission links and fonnatsshould be considered.
6.4 GROUNDTRUTH NETWORKS
In the application of remotely sensed data for hydrological measurement problems, the advantages of both ground-based and aerialmeasurements are best combined. "Ground data are used to adjustor calibrate the transfer function to ensure convergence of theremotely sensed and point data" (Blyth, 1993). For instance, theUK developed procedures for the calibration of weather radarbased on fitting multiquadratic surfaces to the calibration factorvalues, conventionally defined as the ratio of raingauge to coincident weather radar grid~square estimates of rainfall. Using a gaugedensity of one gauge per 120 km2 area, the application of simpleraingauge calibration to the radar data improves the accuracy by15 per cent and the use of the more sophisticated surface fittingmethod increases this further to 22 per cent, on average. GISs areessential to relate the spatial and temporal remotely sensed data toground validation information.
6.5 KEY ANCILLARY SUPPORT SYSTEMS
In order for the application of remote sensing to be successful, keyancillary support systems must be available. Beyond the initialcomputer data processing- of the digital remote sensing imagery,GISs are used to supply all other important information (spatial,temporal and statistical) and further integrate and analyse theremote sensing information. A GIS is an organized collection ofcomputer hardware, software and geographic data designed toefficiently capture, store, update, manipulate, analyse and displayall forms of geographically referenced information (Johnson et al.,
1992). The information pertaining to various spatial or temporalfeatures is stored typic-ally as attributes in tabular files linked tothe feature, often in special database management systems(DBMSs). It is essential that efficient synergistic processing techniques be developed to cope with the large multisensor datavolumes and to allow efficient GIS integration. Remote sensingtechnology and GISs are both tools for managing spatially distributed infonnation in large quantities and at a variety of scales. Bothincrease the capabilities of human decision makers and planners tograsp relationships at larger scales and in more complex settingsthan has been possible before. In order for remote sensing andGISs to be integrated truly, several technical impediments stillneed to be overcome. A major problem is the raster/vector (remote

44 CURRENT OPERATIONAL APPLICATIONS OF REMmE SENSING IN HYDROLOGY
sensing/GIS) dichotomy; this is caused by the difference in the
structures to acquire and store the data. The most promising areas
that have emerged to date can be associated with the automatedgeneration of DEMs, change detection and database production of
GISs (Johnson et at., 1992). A characteristic of most successfulintegrated systems is that they are confined to very specific prob
lems and applications and specific case studies. Remote sensing
data from the Landsat, Shuttle and SPOT programmes have been
used successfully in a GIS environment for base map production,
automated DEM extraction, terrain visualization and map revision.
Areas which require special attention include development of new
fundamental geometric data structures (especially for multitempo
ral and three-dimensional data) and the development of an
integrated DBMS. Furthermore, the unification of these tecnolo
gies will inevitably lead to a synergistic integration of spatial data
handling (Johnson ef al., 1992).
The GIS market is currently growing very quickly.
Satellite-derived infonnation can be a prime source of data for
GISs if properly packaged. The GIS market is ten times larger
than that of remote sensing and so remote sensing can be incorpo
rated within it (Cudlip, 1994). Many preliminary efforts to unite
remote sensing and GISs into one technology for information
management have been made over the past few years, both in the
commercial and the academic worlds (Ehlers, 1992). Very reason
ably priced and versatile GIS software is now available. The NRI
in the UK provides a comprehensive service in the use of GISs for
the input, storage, retrieval, analysis and output of geographically
referenced spatial data.
Other important key ancillary support systems dealing
with data quality, acquisition, distribution and processing were
outlined by UNESCO/WMO/ICSU (1993) and are given asfollows: 1) a data quality control and assurance system; 2) accessi
ble integrated (multi-agency and multivariate) data banks; 3)
coordinated international data banks with free exchange of data
for international projects and provision of analytical methods for
use by countries; 4) improved delivery of accurate, scientifically
validated infonnation to decision makers, and 5) design methodol
ogy for cost-effective multi-purpose networks.

CHAPTER 7
RECOMMENDATIONS
There are several key recommendations for both developed and
developing countries with the goal to optimize the operationalutilization of remote sensing in operational hydrology. Although
most of the developed countries are not suffering from financialconstraints as badly as some of the developing countries, bothshare some organizational problems.
7.1 KEY APPROACHES TO INCLUDE INDEVELOPED COUNTRIES
There is a need for modification of current organizational and institutional arrangements at both national and international levels.First, there is a need for bettcr coordination and removal of barriers
between the national government agencies and international organizations that provide the funding for hydrological remote sensingand operational hydrology. Second, there is a need for inter-agency
and interdisciplinary collaboration in the research of hydrology andwater resources so as to avoid overlaps and duplication of activitiesbetween agencies and disciplines. 1bird, there is a need to bridge
the gap between the scientists (including satellite systems plannerscollecting the data) and the decision makers (end-users specifying
data requirements) by integrating remote sensing information/capabilities through a national archive. Fourth, there is a need for the
research hydrologist to continue development of hydrologicalmodels based on remote sensing inputs, demonstrate technical and
economic benefits from using remote sensing, and to improve thedesign of pilot projects (involving applications of remote sensing).
An improvement in the design of pilot projects could be accomplished by involving the true end-users (decision makers) from the
onset since they will have to give authoritative long-term validationof applications theoretically demonstrated and thus ensure thecontinuation of the activity (i.e. operational application) if the pilot
project is successful. This may be accomplished through:1) improved information services in order to allow the end-users toknow where the information is located and how to use it; 2) utiliza
tion of GISs to combine remote sensing data with other
information to produce -new products and applications; 3) education and training of the true end-users through databases of trainingevents, distribution of computerized training packages; and 4)
assimilation of satellite-focused education and training. Fifth, there
is a need to provide effective mechanisms for coordination amongdecision-making agencies. The second and fifth recommendations
each may be accomplished through joint programmes among theirrespective agencies for publications, meetings and training.
7.2 KEY APPROACHES TO INCLUDE INDEVELOPING COUNTRIES
In addition to the organizational and institutional modificationsrecommended above for the developed countries, there is also aneed for continued international financial assistance and modification of national financial arrangements. First, there is a need for
international agencies to continue to provide funds and leadershipto assist developing nations in establishing and maintaining longterm remote sensing data (acquisition and distribution) networks.Second, there is a need to facilitate the accessibility to new remote
sensing technologies by developing efficient and reliable information systems especially in relaying satellite-related activities.
Third, there is a need for national and international aid-to-develop
ment programmes to continue to actively support the acquisitionand maintenance of processing facilities. Fourth, there is a need to
continue effective education and training capability progranunessand documents such as those resulting from UNESCO (IHP) andWMO (OHP) programmess, thus encouraging the developing
nations to emphasize developing skills and professional attitudes.Fifth, there is a need to continue the establishment and develop
ment of regional remote sensing centres around the world, whichis an international effort to ensure technology transfer (throughdemonstration projects and establishment of databases to supportprojects on regional and global scales), to provide the appropriate
technical assistance and to train instructors at the RMTCs toprovide "on-the-spot training."

REFERENCES
Ackleson, S.G. and Klemas, V, 1987. Remote sensing of submerged
aquaticvegetation in- Lower Chesapeake Bay: A comparison of
Landsat MSS to TM imagery, Remote Sensing a/Environment;22, pp. 235"248.
Ackleson, S.G., Kkmas, V., McKim, H.L. and Merry, CT., 1985. A
comparison ofspar simulation data with Landsat MSS imagery
for delineating water masses in Delaware Hay, Broadkill River,
and adjacentwetlands, Photogram. Eng; Remote Sensing, 51, pp.
1123-1129'
Adler, R.E, Negri, A.J"J and Hakkarinen, I.M., 1991. Rain estimation
from combining geosynchronous IR and low-orbit microwave
data, Global and Planetary Change, 4(1/3), pp. 87-92.
Ahmed, E, Andrawis, A.S. and Hagaz, YA., 1984. Landsat model for
groundwater exploration in the Nuba Mountains, Sudan, Adv.Space Res., 4 (11), pp. 123 131.
Ahmed, S., Warren, M.D., Symonds, M.D. and Cox, RP., 1990. The
RADARSAT system, IEEE Transactions on Geoscience andRemote-Sensing, 28, pp; 598-602.
Ali, A., Quadir, D.A. and Huh, O.K., 1987. Agricultural, hydrologic
and oceanographic studies in Bangladesh with NOAA AVHRR
data, International Journal ofRemote Sensing, Tech. Note, 8, pp.
917-925.
Andersen, T., 1991. AVHRR data for snow mapping in Norway,
Proceedings of the 5th AVHRR Data User Meeting, Tromsoe,
Norway;
Anderson, T. andAnderson, B., 1992. Radar rain forecasts for sewer
age systems, 2nd Int. Symp. on Hydrological Applications of
Weather Radar, Univ. of Hanover, September 7-10, 1992, Paper
N1,lOpp.
Askew, A.J., 1991. Climate and water - a call for international action,
Hydrological Sciences Journal, 36, pp. 391-404.
Bailey, lo., 1990. The potential value of remotely sensed data on the
assessment of evapotranspiration and evaporation, RemoteSensing Reviews, 4 (2), pp. 349"377.
Baker, J.R, Briggs, SA, Gordon, V., Jones, A.R., Settle, J.J.,
Townsend, lR.G. and Wyatt, B.K., 1991. Advances in classifi
cation for land cover mapping using SPOT HRV imagery, Int. 1.
Remote Sens., 12, pp. 1071-1086.
Barrett; E.C., 1991. Diagnostic, historic, and predictive analysis of
rainfall using passive microwave image data, Global andPlanetary Change GPCRE 4, 4 (113), pp. 99-106.
Barrett, E.e., 1993. Precipitation measurement by satellites: towards
community algorithms. Adv. Space Res., 13(5), pp. (5)119
(5)136.
Barrett, E.C, Beaumont, MJ., and D'Souza, G., 19880. A system for
operational rainfall monitoring by Meteosat, Proceedings, VIIth
Annual Meteosat Scientific Users Meeting, Madrid, Spain, 28
30, Sept. 1988.
Barrett, E.C., Beaumont, MJ. and Herschy, R.W., 1990. Satellite
remote sensing for operational hydrology: present needs and
future opportunities, Remote Sensing Reviews, 4(2), pp. 451
466.
Barrett, E.C. and Curtis, L.E, 1976. Introduction to environmentalremote sensing, Chapman and Hall, London.
Barrett; E.C. and Harrison, A.R., 1986. Rainfall monitoring by
Meteosat in Africa, Consultant's Report, AGRT, FAO, ~ome,
16pp,
Barrett, E.C, Herschy, RW. andStewart, J.B., 1988b, Satellite remote
sensing requirements for hydrology and water management from
the mid~1990s, in relation to the Columbus Programme of the
European Space Agency, Journal ofHydrological Sciences, 33
(1)(2), pp. 1-17.
Barry, R.G., 1984. Possible CO2-produced wanning effects on the
cryosphere, in Climate Changes on a Yearly to Millennial Basis,Edited by N.A. Morner and W. Karlen, D. Reidel, Hingham,
Mass., pp. 571-604.
Baumgartner, A. and Reichel, E, 1975. DieWeitwasserbilanz (World
water balance), Oldenbourg, Munich.
Baumgartner, M.E, 1988. Snowmelt runoff simulation based on snow
cover mapping using digital Landsat-MSS and NOAAlAVHRR
data, USDA-ARS, Hydrology Lab. Tech. Rep.
Bausch, W.e. and Neale, CM.D., 1987. Crop coefficients derived
from reflected canopy radiation: a concept, Trans. AnL Soc.Agric. Eng., 30, pp. 701-709.
Becker, T.W., 1994. Remote sensing and the Arnerican flood of 1993,
Earth Space Review, 3 (4), pp. 8-11.
Becker, T.W., 1993. The Hurricane Andrew scenario, Earth SpaceReview, 2(4), pp. 7-10.
Berg, c.P., Matson, M. and Wiesnet, D.R., 1981. Assessing the Red
River of the North 1978 flooding from NOAA satellite data,
Satellite Hydrology, AWRA, Minneapolis, MN, pp. 309-315.
Bergstrom, S. and Brandt, M., 1985. Snow mapping and hydrologi
cal forecasting by airborne-ray spectrometry in northern Sweden,
Hydrological Applications ofRemote Sensing and Remote Data
Transmission (Proceedings of the Hamburg Symposium), lARS
Pub!. No. 145, pp. 421-428.
B"emard, R., Vauclin, M. and Vidal-Madjar, D., 1981. Possible use of
active microwave remote sensing data for prediction of regional
evaporation by numerical simulation of soil water movement in
the unsaturated zone, Water Resow: Res., 17, pp. 1603-1610.
Birkett, C.M., 1994. Radar Altimetry: A new concept in monitoring
lake level changes, EOS Transactions, AGU, Vol. 75, No. 24, pp.
273-275.
Birkett, e.M., 1995. The global remote sensing of lakes, wetlands and
rivers for hydrological and climate research,lEEE, 0-7803-2567,
pp.1979-1981.
Blasco, E, Bellan, ME and Choudhury, M.U., 1992. Estimating the
extent of floods in Bangladeshusing SPOT data, Remote SensingofEnvironment, 39, pp. 167-178.
Blyth, K., 1993. The use of microwave remote sensing to improve
spatial parameterization of hydrological models, Journal ofHydrology, 152, pp. 103-129.
Brakke, T.W. and Kanemasu, E.T., 1981. Insolation estimation from
satellite measurements of reflected radiation, Remote SensingEnviron., II, pp. 157-167.
Brest, c.L. and Goward, S.N., 1987. Deriving surface albedo meas
urements from narrow band satellite data, /1llernational JournalofRemote Sensing, 8, pp. 351-367.

REFERENCES 47
Brisco, B., Ulaby, RT and Dobson, M.C., 1982. Spaceborne SAR data
for land·cover classification and change detection, IGARSS1982, Munich, Germany.
"Bristow, M.P.E., et al., 1985. Airborne laser florosensor surveyof the Columbia and Snake Rivers: simultaneousmeasurement of chlorophyll, dissolved oxygen and opticalattenuation, lmemational Journal ofRemote Sensing, 6, pp.1707-1734.
BruneI, J.P., 1989. Estimation of sensible heat flux from measurements of surface radiative temperature and air temperature at twometers: application to determine actual evaporation rate.Agricultural and Forest Meteorology, 46, pp. 179-191.
Brutsaert, 1982. Evaporation into the atmosphere. Theory, history andapplications (Dordrecht. Boston, London: Reidel).
Camagni, P., 1988. Diagnostics ofoil pollution by laser-induced fluorescence, IEEE Transactions on Geoscience and Remote
Sensing, GE-26, pp. 22-26.
Camillo, P.J., Gurney, RJ. and Schmugge, T.J., 1983. A soil and
atmospheric boundary layer model for evapotransporation andsoil moisture studies, Water Resources Research, 19, pp. 371380.
Carder, K.L., Hawes, S.K., Baker, K.A., Smith, RC., Stewart, RG.
and Mitchell. B.G., 1991. Reflectance models for quantifyingchlorophyll a in the presence of productivity degradation products, Journal ofGeophysical Research, 96, pp. 20599-20611.
Carlson, TN., Dodd, J.K., Beujamin, S.G. and Cooper, J.N., 1981.
Satellite estimation of the surface energy balance, moisture availability and thermal inertia, Journal ofApplied Meteorology, 20,
pp.67-87.
Carroll, S.S. and Carroll, T.R, 1989. Effect of forest biomass on
airborne snow water equivalent estimates obtained by measuring terrestrial gamma radiation, Remote Sensing Environ., 7, pp.313-320.
Carroll, S.S., Day, G.N., and Carroll, TR., 1993. Incorporating
airborne data into the spatial model used to estimate snow waterequivalent, Geographic Information Systems and WaterResources, Journal of the Amer. Water Resources Association,
March, pp. 259-264.
Carroll, T.R., 1990. Operational remote sensing of snow cover in theUS and Canada, Proceedings of the 1990 National Conferenceon Hydraulic Engineering, American Society ofCivil Engineers,San Diego, CA.
Carroll, T.R. and Schaake, Jr., lC., 1983. Airborne snow water equivalent and soil moisture measurement using natural terrestrialgamma radiation, Proceedings of SPIE - The InternationalSociety for Optical Eugiueering, 414, pp. 208-213.
Carroll, T.R. and Vadnais, K.G., 1980. Operational airborne measurement of snow water equivalent using natural terrestrialgamma radiation, Proceedings ofthe 48thAnnual Western SnowConfereuce, Laramie, WY, pp. 97-106.
Carroll, T.R. and Vose, G.D., 1984. Airborne snow water equivalentmeasurements over a forested environment using terrestrialgamma radiation, Proc. 41st Annu. Eastern Snow Conf., NewCarrollton, MD, Eastern Snow Conference, p. 19.
Carter, Y. and Schubert, 1., 1974. Coastal wetlands analysis fromERTS MSS digital data and field spectral measurements,Proceedings of the Ninth International Symposium onRemote Sensing of Environment, Environmental ResearchInstitute of Michigan, Ann Arbor, MI, pp. 1241-1260.
Caselles, Y. and Delegido, l, 1987. A simple model to estimate thedaily value of the regional maximum evapotranspiration fromsatellite temperature and albedo images, International Journal
ofRemote Sensing 8 (8), pp. 1151-1162.
Chandler, S. and Fattorelli, S., 1991. Adaptive grid-square-based
geometrically distributed flood-forecasting model, J.D. Cluckieand C.G. Collier (Eds.), Hydrological Applications ofWeather
Radar, Chapter 38, pp. 424-439, Ellis Horwood.
Chang, A.TC., Foster, J.L. and Hall, D.K., 1987. NIMBUS-7 derived
global snow cover parameters, Ann. Glaciol., 9, pp. 39-44.Chang, A.T.C., Foster, J.L. and Hall, DK, 1990. Effect of vegetation
cover on microwave snow water equivalent estimates, Proc. Int.Symp. on Remote Sensing and Water Resources. Enschede,August 1990, Int. Assoc. Hydrogeologists and Netherlands Soc.
for Res. Sen., Enschede, pp. 137-145.
Chang, A.T.C., Foster, J.L., Hall, D.K., Rango, A. and Hartline, B.K.,
1982. Snow water equivalent estimation by microwave radiom~
etry, Coid Regions Res. Teclmol., 5, pp. 259-267.
Chauhan, N.S. and Lang, RH., 1991. Radar modelling of a boreal
forest. IEEE TransactiollS on Geoscience and Remote Sensing,
29, pp. 627-637.
Choudhury, BJ., 1989. Estimating evaporation and carbon assimilation using infrared temperature data: vistas in modeling, inTheory and Applications of Optical Remote Sensing (G. Asrar,Editor), John Wiley and Sons, New York, 734 pp.
Choudhury, B.J., 1993. Comparing SMMR and SMMII 37 Ghz
Observations for Monitoring Surface Change, EOS, AGU Fall
Meeting.Choudhury, B.J. and Monteith, J.L., 1988. A four-layer model for the
heat budget of homogeneous land surfacf?s, Q.J.R. Meteorol.
Soc., 114, pp. 373-398.
Clothier, B.E., Clawson, K.L., Pinter, Jr., P.I., Moran, M.S.,Reginato, R.J. and Jackson, R.D., 1986. Estimation of soilheat flux from net radiation during the growth of alfalfa,Agricultural and Forest Meteorology, 37. pp. 319-329.
Cluckie, J.D. and Pessoa,M.L., 1990. Dam safety: an evaluation ofsome procedures for design flood estimation, Hydrol. Sci. J., 35
(5), pp. 547-569.
Cluckie, I.D., Ede, P.E, Owens, M.D. and Bailey, A.C., 1987.
Some hydrological aspects of weather radar research in theUnited Kingdom, Hydrological Sciences Journal, 32, 3, 9,pp. 329-346.
Cluckie, J. and Tyson, J.M., 19.89. Weather radar and urban drainagesystems, Weather Radar and the Water Industry, BritishHydrological Society Occasional Paper No.2, Institute ofHydrology, pp. 65-73.
Collier, CG., 1993. Estimating Probable MaximwnPrecipitation (PMP)
using a stonn model and remotely-sensed data, BritishHydrological Society 4thNational Hydrology Symposium, Cardiff,
September 13-16, 1993,Institute ofHydrology, pp. 5.33-5.38.
Collinge, Y.K. and Kirby, C. (Eels.), 1987. Weather Radar and Flood
Forecasting, J. Wiley, 296 pp.Collins, W.G. and Van Genderen, J.L. (Editors), 1978. Remote sens
ing applications in developing countries, Remote SensingSociety, Reading, 10 pp.
Congalton, R.G., Green, J., Teply, J., 1993. Mapping old growth
forests in National Forest and Park lands in the Pacific northwestfrom remotely sensed data, Photogrammetric Engineering and
Remote Sensing, 59 (4), pp. 529-535.
48 CURRENT OPERATIONAL APPLICATIONS OF REMOTE SENSING IN HYDROLOGY
Conway, B.l., 1989. Expert systems on weather forecasting, Met.
Mag., 118, pp. 23-30.
Cooper, C.F.. 1965. Snow cover measurement, Photogr. Engin., 31,
pp.611-619.
Corbley, K.P., 1994. EOSAT -India partnership broadens interna
tional remote sensing market, Earth Space Review, 3 (4), pp.20-26.
eorbley, KP., 1993, Remote sensing and GIS provide rapid response
for flood relief, Earth Observation Magazine, September, pp.28-31.
CaSPAR, 1993. Observations from space of the Mississippi Flood,Infonnation Bulletin, 128,45 pp.
Cross, A.M., 1992. Monitoring marine oil pullution using AVHRRdata: observations off the east coast of Kuwait and Saudi Arabiaduring January 1991, International Journal ofRemote Sensing,
13, pp. 781-788.
Csistar,1. and Bonta, I., 1993. Use of satellite soundings in monitoring mesoscale precipitation systems, Adv. Space Res., 13(5), pp.(5)137-(5)141.
Cndlip,. w., Ridley, 1.K. and Rapley, C.G., 1990. The use of satellite
radar altimetry for monitoring wetlands, Remote Sensing andGl9bal Change, Proc. 16th Annual Conf. of the Remote SensingSociety, University College Swansea, September 19-21, RemoteSensing Society, Nottingham, pp. 207-216.
Cudlip, W., 1994. Rapporteur's summary of session 2: Manpowerrequirements and qualifications, International Journal ofRemoteSensing, 15 (15), pp. 3045-3047.
Curran, P.l. and Novo, E.M.M., 1988. The relationship between
suspended sediment concentration and remotely sensed,spectraldata: Areview, Journal ofCoastal Research, 4, pp. 351-368.
Davies-Colley, R.J., Vant, W.N. and Wilcock, R.I., 1988. Lake
water color:. Comparison of direct observations with underwater spectral irradiance, Water -Sesources Bulletin, 24, pp.11-18.
Davis, RE. and Shi, le., 1993. Microwave measurements of snowcover: progress towards operational hydrology, EOS, AGU FallMeeting.
Delrieu, G., Creutin, J.D. and Andrieu, H., 1989; Validation ofashortrange X-band radar for rainfall measurement over an urban area,Proc. Int. Symp. on Hydrological Applications ofWeather Radar,University of Salford, UK.
Delrieu, G., Creutin, J.D. and Andrieu, R., 1992. Analysis of variousalgorithms for correcting attenuation effects; 2nd Int. Symp. onHydrological Applications of Weather Radar, September 7-10,1992, University of Ranover, Germany, 15 pp.
Demerliac,Y., 1994. Rapporteur's summary of session 5: Cost/benefit aspects ofremote sensing education, International Journal of
Remote Sensing, 15 (15), pp. 3119-3121.
Desinov, L.V, 19.80. Use of satellite information in glaciology,Prnceedings of GGI, 276, Leningrad, Russian Federation, pp.
59-65.
Dewey; K.F. and Heim, Jr., R, 1981. Satellite observations of variations in northern hemisphere seasonal snow cover, NOAATechnical Report NESS 87, NOAA, Washington, DC, 83 pp.
Dobson, M.e. and Ulaby, EE, 1986. Active microwave soil moistureresearch, IIEEE Transactions on Geoscience and Remote
Sensing, GE-24, No. I, pp. 23-36.
Doyle, EJ., 1984. Surveying and mapping with space data, ITCJoumal, 4, pp. 314-321.
Dozier, J., 1987. Recent research in snow hydrology, Rev. Geophys.,
25, pp. 153-161.
Dozier, J., 1989. Spectral' signature of alpine snow cover from theLandsat Thermatic Mapper, Remote SellS. Environ., 28, pp. 9-22.
Dozier, J., Davis, RE., Chang, A.T.C. andBrown, K., 1988. The spectral bidirectional reflectance of snow, Spectral Signatures ofObjects in Remote Sensing, Fourth International Colloquium,ESA SP-287, European Space Agency, Paris, pp. 87-92.
D'Souza, G., Barrett, B.C. and Power, C.H., 1990. Satellite rainfallestimation techniques using visible and infrared imagery, Remote
Sel1sil1g Reviews, 4(2), pp. 379-414.
Dunkel, Z, andVadasz, v., 1993. Estimation of regional evapotranspiration over Hungary combining standard and satellite data,Adv. Space Res., 13 (5), pp.(5)257-(5)260.
Dutartre,P. Coudert, J.M. and Delpont, G., 1993. Evolution in the useof satellite data for the location and development of groundwater, Adv. Space Res., 13 (5), pp. (5)187-(5)195.
Eagleman, J.R., 1975. Detection of soil moisture and snow characteristics from Skylab. Final- Report, 239-23, EREPNo. 540-A2, Contract NAS 9-13273, Kansas UniversityCentre for Research. NASA; Lyndon B. Johnson SpaceCentre, Houston, TX, 313 pp.
Ehlers, M., 1992. Remote sensing and geographic informationsystems: image-integrated geographic information systems, Int.Symp. on Mapping and Geographic Information Systems,ASTM Special Technical Publication n. 1126, ASTM,
Philadelphia, PA, pp. 53-67.
EI-Baz, F.,1993. TM reveals Arabian Desert secrets,EOSATLandsatData Users Notes 8(2), Snmmer 1993, pp. 3.
Elkington, M.D. and Hogg, J., 1981. The characteristics of soilrnoisture content and actual evapotranspiration from crop canopiesusing thermal infrared remote sensing, Proc. Remote Sensing
Soc., Reading.EI Shazly, E.M., EI Raikaiby, M.M. and El Kassas, l.A., 1983.
Groundwater investigation of Wadi Araha area, Eastern Desertof Egypt, using Landsat imagery, Proc. 17th Symp. on RemoteSensing of the Environment, Ann Arbor, Michigan, May 9-13,1983, pp. 1003-1013.
Engman, B.T. and Gurney, R.I., 1991. Remote sensing in hydrology,
Chapman and Hall, 225 pp.
EOSAT, 1993a. Monitoring Australian Floods, EOSAT Notes, 8 (2),
p.7.
EOSAT, 1993b. Landsat and ERS-I data fusion, EOSAT Notes, 8
(3/4), p. 12.
EOSAT, 1993c. Government and Industry Team in an Emergency,EOSAT Notes, 8 (2), p. 4.
EOSAT, 1994a. Russian Photo Covers Cairo at 2 Meteors, EOSAT
Notes, 9 (I), p. 7.
EOSAT, 1994b. Floods Visit Western Europe, EOSAT Notes, 9 (I),
p.4.
EOSAT, 1994c. EOSAT's statewide purchase plan keeps South
Carolina residents in the know, EOSAT Notes, 9 (I), pp. 3
and 7.
EOSAT, 1994d. Ocean to lagoon to marshland, EOSAT Notes, 9 (I),
p.1OErmolin, Y.A., 1992. Operational control of urban sewage system of
Moscow, 2nd Int. Symp. on Hydrological Applications ofWeather Radar, Univ. of Hanover, September 7-1 0, 1992, PaperN3, 9 pp.

REFERENCES 49
Evans, D.L. and Smith, M.D., 1991. Separation of vegetation and rock
signatures in Thematic Mapper and polarimetric SAR images,Remote Sens. Environ., 37, pp. 63-75.
Farnsworth, RK, Barrett, E.C. and Dhanju, M.S., 1984. Application
of remote sensing to hydrology including groundwater,International Hydrological Programme, UNESCO, TechnicalDocuments in Hydrology, IHP-II project A.1.5, Paris, 122 pp.
Fattorelli, S., Casale, R., Borga, M and DaRos, D., 1995./lltegrating
radar and remote sensing techniques of rainfall estimation in
hydrological applications/orflood hazard mitigation, EuropeanCommission for Directorate General XII, Science, Research andDevelopment, Environment Programme, 72 pp.
Fea, M., 1994. Technological means to assist remote sensing training,International Journal of Remote Sensing, 15 (15), pp. 30793093.
Feldman, G., Clark, D. and Halpern, D., 1984. Satellite color obser
vations of the phytoplankton distribution in the EasternEquatorial Pacific during 1982-1983 EI Nifio, Science, 226, pp.
1069-1071.
Ferraro, R.I., Grody, N.C. and Kogut, J.A., 1986. Classification of
geophysical parameters using passive microwave satellite measurements, IEEE Transactions Oil Geoscience and Remote
Sensing, GE-24, 6.
Finkelstein, M.l, Mendelson, VL. and Kutev, VA., 1987. Radar sensing of stratified Earth's covers (in Russian), Soviet RadioPublishing House, Moscow, 174 pp.
Food and Agricultural Organization (FAD) of the United Nations,1989. Remote sensing applications to water resources, RemoteSensing Centre, RSC Series 50, Report of the 13thUN/FAOIUNESCO International Training Course in cooperationwith the Government ofltaly, Rome, Italy, September 12-30 andSassari, Jtaly, Octoher 2-7, 1988,393 pp.
Foster, J.L. and Hall, D.K., 1981. Multisensor analysis of hydrologic
features with emphasis on the SEASAT SAR, Photogrammetric
Engineering and Remote Sensing, 47 (5), pp. 655-664.Fraysse, G. and Hartl, P., 1985. Remote sensing correlation, CEC,
Joint Research Centre-IspraEstab. Rep. S.A.I.04.E2.85.32, Joint
Research Centre, Ispra, pp. 81-98.Fuller, R., 1993. The land cover map of Great Britain, Earth Space
Review, 2 (4), pp. 13-18.
Gagliardini, D.A. and Karszenbaum, H., 1987. The importance of the
NOAA-AVHRR data in resources inventories and environmental monitoring inArgentina and neighboring countries, Advances
in Space Research, 7 (3), pp. 7-10.
Gammon, PT., Rohde, w.G. and Carter, Y., 1981. Accuracy evalua
tion ofLandsat digital classification in the Great Dismal Swamp,Satellite Hydrology, AWRA, Minneapolis, MN, pp. 463-473.
Gash, lH.C., 1987. An analytical framework for extrapolating evaporation measurements by remote sensing surface temperature,Intemational Journal ofRemote Sensing, 8. pp. 1245-1249.
Gatto, L.W., 1990. Monitoring river ice with Landsat images, Remote
Sensing ofEnvironment, 32, pp. 1-16.Gautier, C., Diak, G. and Masse, S., 1980. A simple model to estimate
incident solar radiation at the surface from GOES satellite data,J. Appl. Meteorol., 19, pp. 1005-1011.
Gihbons, D.E., Wukelic, G.E., Leighton, J.P. and Doyle, M.J., 1989.
Application ofLandsat thematic mapper data for coastal thermalplume analysis at Diablo Canyon, Photogrammetric Engineering
and Remote Sensing, 66, pp. 903-909.
Gitelson, A.A., Dubovitsky, G.A., Keydan, G.P. and Lopatchenko,
L.L., 1988. Evaluation of water ecosystem quality by its radiation in the visible spectrum (in Russian), Ecologicalstandardization and modeling of anthropogeneous influence onwater ecosystem, Rostov-on-Don, Hydrochemical Institute,Leningrad, pp. 101-135.
Goldhirsh, 1., Rowland, J. and Musiani, B., 1987. Rain measurementresults derived from a two-polarization frequency-diversity Sband radar at Wallop Island, VA" IEEE Transactions on
Geoscience and Remote Sensing, GE-25 (6), pp. 654-661.Goodison, B. and Walker, A.E., 1993. Canadian development and use
of snow cover infonnation from passive microwave satellite data,Proceedings of the ESAINASA International Workshop on
Passive Microwave Remote Sensing Research Related to LandAtmosphere Interactions, 81. Lary, France.
Goodison, B., Walker, A.E. and Thirkettle, E, 1990. Determination of
snow water equivalent on the Canadian prairies using near realtime passive microwave data, Proceedings of the Workshop onApplication of Remote Sensing in Hydrology, NationalHydrology Research Institute, Saskatoon, Saskatchewan, pp.297-316.
Gross, M.E, Hardisky, M.A., Klemas, Y. and Wolf, P.L., 1987.
Quantification of biomass of marsh grass Spartina alternifloraLoisel using Landsat thematic mapper imagery, Photogrammetric
Engineering and Remote Sensing, 53, pp. 1577-1583.Guglielminetti, M., Boltri, R., Morino, C.M. and Lorenzo, S., 1982.
Remote sensing techniques applied to the study of fresh-watersprings in coastal areas of southern Italy, Proc. 16th Int. Symp.Remote Sensing of Environment. E.R.I.M., Ann Arbor,Michigan.
Gupta, R.K., Prasad, S., Nadharn, T.S.Y. and Rao, G.M., 1993.
Relative sensitivity of district mean RVI and NDVI over anagrometeorological zone, Adv. Space Res., 13 (5), pp. (5)261
(5)264.
Gurney, R.I., Dehney, A.G.P. and Gordon, M.R., 1982. The use of
Landsat data in groundwater study in Botswana, 1. Appl.
Photographic Eng., 8, pp. 138-141.
Haggett, C.M., May, B.C. and Crees, M.A., 1992. Advances in oper
ational flood forecasting in London, 2nd Int Symp. onHydrological Applications ofWeather Radar, Dniv. of Hanover,
September 7-10,.1992, Paper N2, 11 pp.
Hall, D.K., 1982. A review of the utility ofremote sensing in Alaskan
permafrost studies, IEEE Transactions on Geoscience and
Remote Sensing, GE-20 (3), pp. 390, 394.
Hall, D.K., et al., 1981. Freshwater ice thickness observations usingpassive microwave sensors, IIEEE Transactions on Geoscience
and Remote Sensing, GE-19 (4), pp. 189-193.
Hall, DK and Ormsby, J.P, 1983. Use of SEASAT synthetic aper
ture radar and Landsat multispectral scarmer system for Alaskanglaciology studies, J. ofGeophysical Research, 88 (3), pp. 1597
1607.
Hallikainen, M., 1984. Satellite microwave radiometry of snowcover, Proc. of the 18th Int. Symposium on RemoteSensing of Environment, October 1-5, Paris, France, pp.1405-1414.
Harris, R., Hobbs, A.J. and Munday, T.J., 1984. Study of microwave
remote sensing techniques for land surface and hydrologicalapplication, Report prepared for NERC under contractF60/G6/08, Durham University.

50 CURRENT OPERATIONAL APPLICATIONS OF REMOTE SENSING IN HYDROLOGY
Harrison, AR. and Lucas, R.M., 1989. Multi·spectral classification ofsnow using NOAA AVHRR imagery, International Journal ofRemote Sensing, 10, pp. 907"916.
Heilman, J.L. and Moore, D.C.. 1981a. Groundwater applications ofthe Heat Capacity Mapping Mission, Deutch, Weisnet and Rango(Eds.), Satellite Hydrology, pp. 446-449.
Heilman, IL. and Moore, D.C., 198th. Soil moisture applications ofthe Heat Capacity Mapping Mission, Deutsch, Weisnet andRango (&Is.), Satellite Hydrology, pp. 371-376.
Herschy, R.W., Barrett, E.C. and Roozerkrans, J.N., 1988. Remote
sensing in hydrology and water management. Final Report,ESA Contract No. 5769/A84/DIJS (Sc), EARSeL,
Strasbourg, 288 pp.
Herschy, R.W., Barrett, E.C. and Roozerkrans, J.N., 1985. T1le world's
water resources - a major neglect. ESA. BR-40 Paris.Higer, A.L., Coker; A.E. and Cordes, E.H., 1974. Watermanagement
models in Florida using ERTS-l data, Proc. 3rd Earth ResourcesTecbnology Satellite-I Symp., NASA SP-351-VI, pp. 1071
1088.
Higuchi, K. and Iozawa, T., 1971.Atlas ofperennial snow patches in
Central Japan. Report of Water Research Laboratory, NagoyaUniversity, Japan, 81 pp.
Hockey, B., Richards, T. and Osmaston, H., 1990. Prospects for operational remote sensing of surface water, Remote Sensing
Reviews, 4 (2), pp. 265-283.
Hogg, D.C., 1989. Rain, radiometry, and radar,IEEE Transactions on
Geoscience and Remote Sensing, 27 (5), pp. 576-585.Hudlow, M.D., 1988. Technological developments in real-time oper
ational hydrologic forecasting in the United States, Journal of
Hydrology, 102, pp. 69-92.
Huhnerfus, H., 1986. Discrimination between crude oil spills andmonomolecular sea slicks by airborne radar and infraredradiometer - possibilities and limitations, International Journal
ofRemote Sensing, 7 (8), pp. 1001-1013.
Ibrahim, M. and Cracknell, A.P., 1990. Bathymetry using Landsat
MSS data of Penang Island in Malaysia, International Journal
ofRemote Sensing, 11, pp. 557-560.
!bre, G.I., Morcette, 1.1. and Hogg, W.D., 1979. Surface water temper
ature of lakes from satellite infra-red data corrected foratmospheric attenuation, Canadian Climate Center, Report No.79-7, Canada.
Idso, S.B., Schmugge, TJ., Jackson, R.D. and Reginato, RI., 1975.
The utility of sUlface temperature measurements for remote sensingof surface soil water status, J. Geophys. Res., 80, pp.3044-3049.
Ijjas, G., 1992. Passive microwave remote sensing of soil moisturefrom aircraft in Hungary, International Journal of Remote
Sensing, 13 (3), pp. 471-479.
Imhoff, M.L., Vermillion, C., Story, M.H., Choudry, A.M., Gafoor,
A. and Polcyn, E, 1987. Monsoon flood boundary delin
eation and damage assessment using space borne imagingradar and Landsat data, Photogram. Eng. Remote Sensing,
53, pp. 405-413.
Institute for Remote Sensing Applications (IRSA), 1992. JointResearch Centre, Commission of the European Communities,Annual Report.
ltier, B. and Riou, e.R., 1982. Vne nouvelle methode de detennination de I' evapotranspiration reele par thermographic JR, Journal
de Recherches Atmospheriques, 14, pp. 113~125.
Jackson, R.D., 1985. Evaluating evapotranspiration at local andregional scales j IEEE Transactions on Geoscience and Remote
Sensing, GE-73, pp. 1086-1095.
Jackson, R.D., Hatfield, lL.; Reginato, R.I., Idso, S.B. and Pinter; Jr.•PJ., 1983. Estimates of daily evapotranspiration from one timeof day measurements, Agricultural Water Management, 7, pp.351-362.
lackson, RD., Moran, M.S., Gay, L.w. and Raymond, L.H., 1987b.
Evaluating evaporation from field crops using airborne radiometry and ground~based meteorological data, Irrig. Sci., 8, pp.81-90.
lackson, RD., Reginato, R.I. and Idso, S.B., 1977. Wheat canopy
temperature: a practical tool for evaluating waterrequirements, Water Resources Research, 13, pp. 651-662.
lackson, T.J., Hawley, M.E. and O'Neill, P.E., 1987a. Preplanting soil
moisture using passive microwave sensors, Water Resources
Bulletin, 23 (I), pp. 11-19.
Jackson, T., Levine, D., Griffis,A., Goodrich, D., Schmugge, T., Swift,C. and O'Neill, P., 1993. Soil moisture and rainfall estimationover a semiarid environment with the ESTAR microwaveradiometer, IEEE Transactions on Geoscience and Remote
Sensing, 31 (4).
Jack;mn, T.J. and Schmugge, T.J., 1989. Passive microwave remotesensing system for soil moisture: some supporting research,IEEE Transactions on Geoscience and Remote Sensing, 27 (2),
pp. 225-235.
Jackson, T.J., Shutko, A.M., Shiue, J.e., Schmugge, T.J., Davis,D.R., Parry, R., Haldin, A., Reutov, E., Novichikhim, E.,
Liberman, B., Kustas. W.P., Goodrich, D.C., Bach, L. andRitchie, le., 1991. Soil moisture observations using multifrequency passive microwave sensors in an arid rangelandenvironment: a cooperative US-USSR experiment,Proceedings of the American MeteorologiCal Society SpecialSession on Hydrometeorology, Salt Lake City, pp. 174-177.
Janowiak, J.E., 1992. Tropical rainfall: a comparison of satellitederived rainfall estimates with model precipitation forecasts,climatologies, and observations. Monthly Weather Review, 120(3), pp. 448-462.
Jensen, J.R, Narunalani, S., Weatherbee, 0., Mackey, H.E., Jr.. 1993.
Measurement of seasonal and yearly cattail and waterIilychanges using muItidate SPOT panchromatic data,Photogrammetric Engineering and Remote Sensing, 59 (4), pp.519-525.
lohnson, A.I., Petterson, C.B. and Fulton, I.L. (Eds.), 1992.
Geographic Information Systems (GIS) and mapping Practices and standards, ASTM Publication STP 1126, 346 pp.
Jones, W.K. and Carroll, T.R., 1983. Error analysis ofairborne gammaradiation soil moisture measurements, AgriculturalMeteorology,
28, pp. 19-30.
Joss, J. and Lee, R., 1994. Weather Radar: Operational Processing forNowcasting and Precipitation Estimation, Paper submitted tolAM, Feb. 21, 1994.
Kabbaj, M.M., and Mehrez, M.B., 1994. Remote sensing and developing countries, training and technology transfer Europe-Africa,International Journal of Remote Sensing. 15 (15), pp. 30033016.
Kammer, A., 1991. A low cost X-band radar system designed for usein urban hydrology, Proc. 25th Int. Conf. on Radar Meteorology,
Paris,lune 1991, pp. 844-847.

REFERENCES 51
Kaufman, H., Reichart, B. and Hotzl, H., 1986. Hydrological research
in Peloponnesus Karst area by support and completion ofLandsat-thematic data, Proc. !GARSS '86 Symp., Zurich,
September 8-11,1986, ESA SP-254, 1, pp. 437-441.
Kawata, Y. Kusaka. T. and Vena, S., 1988. Snowmelt runoff estimation using snow cover extent data and its application to optimumcontrol of dam water level, Proc. !GARSS '88 Symp. Edinburgh,
Scotland, ESA SP-284, pp. 439-440.
Keller, M., 1987. Ausaperungskartierung mit Landsat-MSS Daten zurErfassung oekologische Einflussgnessen in Gebirge, RemoteSensing Series, No. 10, PhD Thesis. University of Zurich.
Kerr, YH., Assad, E., Freleaud, J.P., Lagourde, J.P. and Seguin, B.,
1987. Estimation of evapotranspiration in the Sahelian zone bythe use of METEOSAT and NOAA AVHRR data, Advances in
Space Research, 7, pp. 161-164.
Kidd. C., 1988. Passive microwave rainfall monitoring over land. PhDThesis, University of Bristol, UK, June 1988.
Kidd, C. and Barrett, E.C., 1990. The use of passive microwaveimagery in rainfall monitoring, Remote Sensing Reviews, 4 (2),
pp.415-450.
Kilonsky, B.I. and Ramage, C.S., 1976. A technique for estimating
tropical open-ocean rainfall from satellite observations, Journal
ofAppiied Meteorology, 15, pp. 972-975.
Kienegger, E.H., 1992. Assessment of a Wastewater Service Chargeby Integrating Aerial Photography and GIS, Photogrammetric
Engineering and Remote Sensing, 58 (11), pp. 1601-1606.
Kimura, H. and Kodaira, N., 1992. Antenna pattern and penetrationmeasurements using spectrum analysers, IEEE Transactions on
Geoscience and Remote Sensing, 30, pp. 1153-1158.Kogan, F. and Sullivan, I., 1993. Development of global drought
watch system using NOAAlAVHRR data, Adv. Space Res., 13
(5), pp. (5)219-(5)222.
Kondrat'ev, KYa, 1992. Earth observing system (EOS); ecological
priorities and observation planning, Issledovanie Zemli iz
Kosmosa, n. 3, May-June, pp. 96~106.Kondratyev, KY., Melentyev, V.V, Rabiinovich, Y.I. and Shulginc,
E.M., 1977. Passive microwave remote sensing of soil moisture,Proceedings ofthe Eleventh Symposium ofRemote Sensing oj
Environment, pp. 1641-1661.Konecny, G., and Vetrella, S., 1994. Earth observation in education
and training - EARSeL's viewpoint, International Jaurnal of
Remote Sensing, 15 (15), pp. 2970-2971.
Kostov, KG., 1992. Passive microwave remote sensing of soil moisture-experimental and modeling results, Presented XXIXMeeting of the Committee on Space Research, Washington, DC,August 28-8eptember 5, 1992.
Kostov, KG., 1993. Passive microwave remote sensing of soil moisture-experimental and modeling results, Adv. Space Res., 13 (5),pp. (5)105-(5)114.
Kotoda, K, Nakagawa, S., Kai, K, Yoshino, M.M., Takeda, K
and Seki, K., 1983a. Application of equilibrium evaporationmodel to estimate evapotranspiration by remote sensing technique in remote sensing of snow and evapotranspiration, Part11, Proc. 2nd US/Japan Workshop on Remote Sensing ofSnow and Evapo-transpiration, Honolulu, Hawaii, NASACP-2363, pp. 115-123.
Kotoda, K, Nakagawa, S., Kai, K, Yoshino, M.M., Takeda, K. andSeki, K, 1983b. Estimation ofregional evapotranspiration usingremotely sensed land surface temperature, Proc. 2nd US/Japan
Workshop on Remote Sensing of Snow and Evapotranspiration,Honolulu, Hawaii, NASA CP-2363, pp. 99-114.
Kouwen, N., Soulis, E.D., Pietroniro, A., Donald, 1. and Harrington,RA., 1993. Grouped response units for distributed hydrologicmodelling, Journal of Water Resources Planning and
Management, 119 (3), pp. 289-305.
Kuittinen, R, 1989. Detennination of snow equivalent using NOAAsatellite images, gamma ray spectrometry and field measure~
ments, IAHS Pub!. No. 186.
Kuittinen, R, 1992. Remote sensing for hydrology - progress and
prospects, Operational Hydrology Report No. 36, WMO-No.
773, Prepared for WMO, Geneva, Switzerland.
Kuittinen, R. and Sucksdorff, Y., 1984. Detemrination of water depths
using aerial photography, Pub!. of the Water Research Institute
No. 60, Helsinki, Finland.
Kumar, V.S., Haefner, H. and Seidel, K., 1991. Satellite snow
cover mapping and snowmelt runoff modelling in BeasBasin. Snow, Hydrology and Forests in High Alpine Areas(Proceedings of the Vienna Symposium), IAHS PublicationNo. 205, pp. 101-109.
Kustas, WP., Cboudhury, B.I., Moran, M.S., Reginalo, R.I., Jackson,
R.D., Gay, L.W. andWeaver, H.L., 1989. Determination ofsensible heat flux over sparse canopy using thermal infrared data,Agricultural and Forest Meteorology, 44, pp. 197-216.
Kustas, WP. and Daughtry, C.S.T., 1989. Estimation of the soil beat
flux/net radiation ratio from spectral data, Agricultural Forest
Meteorology, 49, pp. 205-233.
Kustas, WP. Rango, A. and Uijlenhoet, R., 1994. A simple energy
budget algorithm for the snowmelt runoff model, Water
Resources Research, 30 (5), pp. 1515-1527.
Kustas, WP. (and 36 co-autbors), 1991. An interdisciplinary field
study of the energy and water fluxes in the atmosphere-biosphere system over semiarid range lands: descriptions andsome preliminary results, Bulletin of the American
Meteoroiogical Society, 72 (11), pp. 1683-1705.
Lathrop, R.G. and Lillesand, T.M., 1987. Calibration of Thematic
Mapper thermal data for water surface temperature mapping:case study in the Great Lakes, RSE 22, pp. 297-307.
Leaf, C.F. and Brink, G.E., 1973. Hydrologic simulation model of
Colorado SUbalpine forest, USDA Forest Service, Res. Pap. RM107, Fort Collins, CO.
Leak, S.M. and Venugopal, G., 1990. Thematic Mapper thermal
infrared data in discriminating selected urban features, Int. J.
Remote Sens., 11, pp. 841-857.
Leavesley, G.H. and Stannard, L.G., 1990. Application of remotely
sensed data on a distributed parameter watershed model,Proceedings ofthe Workshop on Applications ofRemote Sensing
in Hydrology, Editors: Kite, G.W. and Wankiewicz,A., NationalHydrology Research Institute, Saskatoon, Saskatchewan, pp. 47
68.Leberl, F., 1983. Photogrammetric aspects of remote sensing with
imaging radar, Remote Sensing Reviews, 1 (1), HarwoodAcademic, New York.
Lei, G., Moore, R.K. and Gogineni, S.P., 1990. A method for measuring snow depth using fine-resolution radars, Remote Sens.
Environ., 30, pp. 151-158.
Linsley, R.K., 1943. A single procedure for day-to-day forecasting ofrunoff from snowmelt, Trans. Am. Geophys. Union, Part III, pp.62-67.

52 CURRENT OPERATIONAL APPLICATIONS OF REMOTE SENSING IN HYDROLOGY
Lovejoy, S. and Austin, G.L., 1979a. The delineation of rain areasfrom visible and IR satellite data for GATE and mid-latitudes,Atmosphere-Ocean, 17, pp. 77-92.
Lovejoy, S. and Austin, G.L., 1979b. The sources of error in rainamount estimating schemes for GOES visible and IR satellitedata, Monthly Weather Review, 107, pp. 1048-1054.
Lucas, R.M. and Harrison, A.R., 1989a. A multispectral snow areaalgorithm for operational 7-day snow cover monitoring, RemoteSensing and Large-Scale Global Processes, Proceedings of thelAHS Third International Assembly, Baltimore, MD, May, 1989,
1AHS Pub!. No. 186, pp. 161-166.
Lucas, R.M. and Harrison, AR., 1989b. Snow detection and description using NOAA AVHRR imagery, Remote Sensing forOperational Applications. Proceedings of the 15th AnnualConference of the Remote Sensing Society, University ofBristol,
Sept. 13-15, 1989, pp. 263-268.
Lucas, R.M. and Harrison, A.R., 1990. Snow observation by satellite:areview, Remote Sensing Reviews, 4 (2), pp. 285-348.
Lyons, J.G., Lunetta, R.S. and Williams, D.C., 1992. Airborne multi
spectral scanner data for evaluating bottom sediment types andwater depths ofthe S1. Marys River, Michigan, Photogrammetric
Engineering and Remote Sensing, 58 (7), pp. 951-956.Manavalan, P., Krishnamurthy, J., Manikiam, B., Adiga, S.,
Radbakrishnan, K. and Chandrasekhar, M.G., 1993. Watershed
response analysis using digital data integration technique, Adv.
Space Res., 13 (5), pp. 5(177)-5(180).
Manikiam, B., Gowda, H.H., Manavalan, P., Jayaraman, Y. andChandrasekhar, M.G., 1993. Study of sediment dynamics using
satellite remote sensing, Adv. Space Res., 13 (5), pp. (5)75-(5)78.
Marks, D., 1988. Climate, energy exchange, and snowmelt on EmeraldLake watershed, Sierra Nevada, Unpublished PhD Dissertation,University ofCalifornia, Santa Barbara, CA, 149 pp.
Martin, D.W. and Howland, M.R., 1982. Rainfall over the Arabian Sea
during the onset of the 1979 monsoon, Nature, 300, pp. 628-630.Martinec, J., 1987. Importance and effects of seasonal snow cover,
Large scale effects of seasonal snow cover. Proceedings of theVanconver Symposium, August, 1987. 1AHS (Int'!. Assoc. of
Hydrological Sci), Pub!. No. 166, pp. 107-120.
Martinec, 1. and Rango, A., 1981. Areal distribution of snow waterequivalent evaluated by snow cover monitoring, Water Resources
Research, 17 (5), pp. 1480-1488.
Martinec, 1. and Rango, A., 1986. Parameter values for snowmeltrunoff modeling, J. Hydrol., 84, pp. 197-219.
Martinec, 1. and Rango, A., 1987. Interpretation and utilization of arealsnow cover data from satellites, Ann. Glacial., 9, pp. 166-169.
Martinec,1. and Rango, A. and Major, E., 1983. The snowmelt-runoffmodel (SRM) user's manual, NASA Ref. Pub!. 1100,
Washington, DC.
Martinec, J. Rango, A. and Roberts, R., 1994. Snowmelt-runoffmodel
(SRM) user's manual, Geographica Bernesia, P29, Departmentof Geography, University of Bern, 65 pp.
Mason, I., Harris, A., Birkett, C. Cudlip, Wand Rapley, C.G., 1990.
Remote sensing of lakes for the proxy monitoring of climatechange, Remote Sensing and Global Change, Proc. 16thAnnual
Com. of the Remote Sensing Society, University CollegeSwansea, September 19-21, Remote Sensing Society,Nottingham, pp. 314-324.
Mather, P.M., 1994. Rapporteur's summary of session 3: Towardscommon standards for training European education projects,
International Journal of Remote Sensing, 15 (15), pp. 30733075.
Matzler, C. and Schanda, E., 1983. Snow mapping with activemicrowave sensors, January Report, University of Berne,Institute of Applied Physics, Berne.
Matzler, C. and Schanda, E., 1984. Snow mapping with activemicrowave sensors, Int. 1 Remote Sens., 5, pp; 409-422.
May, B.R., 1988. Progress in the development o[PARAGON, Met.
Mag., 117, pp. 79-86.
McCauley, J.F., Breed, e.S., Schaber, G.G. and Issawi, B., 1986.Palaeodrainages of the eastern Sahara-shuttle imaging radarimplications for a mid-Tertiary Trans African drainage system,Paper given at 20th Int. Symp. on Remote Sensing ofEnvironment, Nairobi, Kenya, 4-10 Dec. 1986.
McCauley, J.F., Schaber, G.G., Breed, C.S., Grotier, MJ., Haynes,C.Y., Issawi, 8., Elachi, C. and Blom, R.. 1982. Subsurfacevalleys and geoarcheology of the eastern Sahara revealed byShuttle radar, Scielice, 218, pp. 1004-1020.
McCuen, R.H., 1989. Hydrologic analysis and design, Prentice Hall,867pp.
McGinnis, D.E, Pritchard, l.A. and Wiesnet, D.R., 1975.
Determination of snow depth and snow extent from NOAA-2satellite very high resolution radiometer data, Water Resources
Research, 1I (2), pp. 897-902.
McGinnis, D.F. and Schneider, S.R., 1978. Monitoring river icebreakup from space, Photogramm. Eng. andRemote Sensing, 44(3), pp. 1597-1607.
McKim, H.L., Cassell, E.A. and LaPotin, P.J., 1993. Water resourcemodelling using remote sensing and object-oriented simulation,Hydrological Processes, 7 (2), pp. 153-165.
McKim, H.L., Marlar, T.L. and Anderson, D.M., 1972. The use ofERTS-l imagery in the national program for inspection of dams,CRREL Special Report 183, US Army Cold Region Research
and Engineering Laboratory, Hanover, NH.Meier, M.P., 1975. Applications of remote sensing techniques to the
study of seasonal snowcover, Journal ofGlaciology, IS, pp. 251265.
Menenti, M., 1993. Understanding land surface evapotranspirationwith satellite multispectral measurements, Adv. Space Res., 13(5), pp. (5)89-(5)100.
Menenti, M., Azzali, S., Verhoef, W and van Swol, R., 1993. Mapping
agroecological zones and time lag in vegetation growth by meansof fourier analysis of time series of NDVI images, Adv. Space
Res., 13 (5), pp. (5)233-(5)237.
Menenti, M. and Ritchie, J.c., 1994. Estimation of effective aerodynamic roughness ofWalnut Gulch watershed with laser altimetermeasurements, Water Resources Research, 30 (5), pp. 13291337.
Miller, W.A., Shasby, M.B., Rhode, WG. and Johnson, G.R., 1982.
Developing inplace data bases by incorporating digital terraindata into the Landsat classification process. Place ResourceInventories: principles and practices, Proc. Workshop, August 914, 1981, University of Maine, Orono, Sponsored by the
American Society of Photogrammetry.Monteith, IL., 1965. Evaporation and environment, Symp. Soc. Exp.
Biol.1g., pp. 205-234.
Moore, R., 1993a. Applications ofWeather Radar Data to Hydrology
and Water Resources, WMO, Regional Association VI (Europe),Working Group on Hydrology, 26 pp.

REFERENCES 53
Moore, R.J., 1993b. Real-timefloodforecasting systems: perspectivesand prospects, British-Hungarian Workshop on Flood Defense,Budapest, September 6·10,1993,51 pp.
Moore, R.J. and Jones, D.A., 1991. A river flood forecastingsystem for region-wide application. In: MAFF Conference ofRiver and Coastal Engineers, Loughborough University,England, July 8-10, 1991, Ministry of Agriculture Fisheriesand Food, 122 pp.
Moore, R.J., Austin, R. and Carrington, D.S., 1993. Evaluation ofFRONTIERS and Local Radar Rainfall Forecasts for use inFlood Forecasting Models, R&D Note 225, ResearchContractor: Institute of Hydrology, National Rivers Authority,156 pp.
Moore, R.I. and Bell, v., 1992. A gridsquarerainfall-runoffmodelfor
use with weather radar data, Proc. Int. Workshop, November lIB. 1991, Lisbon, Portugal, Commission for the EuropeanCommunities, in press, 9 pp.
Morris, C.S., 1993. Measurement of Lake Level Variation Using
Satellite Altimetry, EOS, AGU Fall Meeting.Myueui, R.B. and Choudhury, B.J., 1993. Synergistic nse of optical
and microwave data in agrometeorological applications, Adv.Space Res., 13 (5), pp. (5)239-(5)248.
National Oceanic and Atmospheric Administration, US Department
of Commerce, 1994. The Great Flood of i993, Natural Disaster
Survey Report.
National Oceanic and Atmosphetic Administration, US Department
ofCommerce, 1993. Nileforecasting system - version 2, Edited
by Edward van Blargan.Negri, AJ., Adler, R.E, Nelkin, E.J. and Huffman, GJ., 1994.
Regional rainfall climatologies derived from special sensor
microwave images (SSM/]) data, Bulletin of the AmericanMeteorological Society, 75 (7).
Nieuwenhuis, G.l., Smidt, E.H. and Thannissen, H.A.M., 1985.
Estimation of regional evapotranspiration of arable crops from
thermal infrared images. International Journal of RemoteSensing, 6, pp. 1319-1334.
Oh, Y., Sarabandi, K. and Ulaby, ET., 1992. An empirical model andan inversion technique for radar scattering from bare soil
surfaces, IEEE Transactions on Geoscience and Remote Sensing,30, pp. 370-381.
O'Neill, P.E., Jackson, TJ., Chauhan, N.S. and Seyfried, M.S., 1993.
Microwave soil moisture estimation in humid and semiarid
watersheds,Adv. Space Res., 13 (5), pp. (5)115-(5)118.Ormsby, J.P., Blauchard, BJ. andBlanchard,AJ., 1985. Detection of
lowland flooding using active microwave systems, Photogram.Eng. Remote Sensing, 51, pp. 317-328.
Ormsby, J.P. and Engman, E.T., 1993. Hydrosat: an instrument platform for hydrology, Adv. Space Res., 13 (5), pp. (5)101-(5)104.
Ostrem, G., Anderson, T. and Odegaard, H., 1991. Operational use of
satellite data for snow inventory and runoff forecast, SatelliteHydrology, American Water Resources Association,
Minneapolis, MN, pp. 230-234.Ottle, e., Vidal-Madjar, D. and Girard, G., 1989. Remote sensing
applications by hydrological modeling, Journal of Hydrology,105, pp. 369-384.
Palecki, MA and Barry, RG., 1986. Freeze-up and break-up oflakesas an index of temperature changes during the transition seasons:
A case study for Finland, Journal of Climate and AppliedMeteorology, 25, pp. 893-902.
Pampaloni, P, Paloscia, S., Chiarantini, L., Coppo, 1'.., Gagliani, S. and
Luzi, G., 1990. Sampling depth of soil moisture content by
radiometric measurement at 21 em wavelength: some experi
mental results, international Journal ofRemote Sensing, II (6),pp. 1085-1092.
Papadakis, 1., Napiorkowski, J. and Schultz, G.A., 1993. Monthly
runoff generation by non-linear model using multispectral and
multitemporal satellite imagery, Adv. Space Res., 13 (5), pp.(5)181·(5)186.
Parry, D.E. and Piper, R., 1981. Application of remote sensing to
hydrogeology, A Survey of British Hydrogeology 1980, TheRoyal Society, London, pp. 61·73.
Paterson, N.R and Bosschart, RA., 1987. Airborne geophysical
exploration for groundwater, Groundwater, 25, pp. 41-50.
Peck, E.L., Carroll, T.R and Lipinski, D.M., 1990. Airborne gamma
radiation soil moisture measurements over short flight lines,
Symposium on the First 1SLSCP Field Experiment, February 79, 1990.
Peck, E.S., Keefer. T.N., and Johnson, E.R, 1981. Strategies for usingremotely sensed data in hydrologic models, NASA Rep. No.
CR·66729, Goddard Space Flight Center, Greenbelt, MD.
Penman, H.L., 1948. Natural evaporation from open water, bare soil
and grass, Proc. R Soc. Land., Ser. A., 193, pp. 120-145.Penman. H.L., 1956. Estimating evaporation, Trans. Amer. Geophys.
Union, 37(1).Penney, M.E, Billard, B. and Abbot, R.H., 1989. LADS - the
Australian Laser Airborne Depth Sounder, International JournalofRemote Sensing, 10, pp. 1463-1479.
Petrie, G. and El Niweiri, A.E., 1992. The applicability of spaceimagery to the small-scale topographic mapping of developing
countries. A case study - the Sudan, ISRRS J. ofPhotogrammetry and Remote Sensing, 47, pp. 1-42.
Prabhakara, e., Dalu, G., Liberti, G.L., Nucciarone, lJ. and Suhasini,
R., 1992. Rainfall estimation over oceans from SM:MR and
SSMII microwave data, Joumal ofApplied Meteorology, 31(6),
pp.532-552.Pratt, D.A., Foster, SJ. and Ellyet, e.D., 1980. A calibration proce
dure for fourier series thennal inertia models, PhotogrammetricEngineering and Remote Sensing, 46, pp. 529-538.
Price, le., 1980. The potential of remotely sensed thermal infrared
data to infer surface soil- moisture and evaporation, WaterResources Research, 16, pp. 787-795.
Price, J.e., 1982. Estimation ofregional scale evapotranspiration through
analysis of. satellite thermal infrared data, IEEE Transactions onGeoscience and Remote Sensing, GE-20, pp. 286-292.
Priestley, c.H.B. and Taylor, R.I., 1972. On the assessment of surface
heat flux and evaporation using large-scale parameters, MonthlyWeather Review, 100, pp. 82-92.
Pulich, w., Jr. and Hinson, J.M., 1992. Methodology for classifyinglandcover and habitats from Landsat TM imagery of the Texas
coastal zone, Proceedings of SPIE, the Int. Society for Optical
Engineering, 1930 (2), Bellingham, WA., pp. 855-868.
Raffy, M. and Becker, E, 1985. An inverse problem for remote sens
ing in the thermal infrared bands and its solution, Journal ofGeophysical Research, 90, pp. 5809-5819.
Ramamoorthi, A.S., 1983. Snowmelt runoff studies using remote sens
ing data, Proc. ladian Acad. Sci., 6, pp. 279·286.Ramamoorthi, A.S., 1987. Snow cover area (SCA) is the main factor
in forecasting snowmelt runoff from major basins, Large Scale

54 CURRENT OPERATIONAL APPLICATIONS OF REMOTE SENSING IN HYDROLOGY
Effects of Seasonal Snow Cover (Proceedings of the Vancouver
Symposium), IAHS Pub!. No. 166, pp. 187-198.
Rambal, S., Lacaze, B., Mazurek, H. and Debussche, G., 1985.
Comparison ofhydrologically simulated and remotely sensed
actual evapotranspiration from some Mediterranean vegetationfonnulations, International Journal of Remote Sensing, 6, pp.1475-1481.
Randall, D.A. and Tjemkes, S., 1991. Clouds, the Earth's radiation
budget, and the hydrologic cycle, Global and Planetary Change,
4 (1/3), pp. 3-9.
Rango, A., 1985. The snowmelt runoff model, Proceedings of the ARSNational Resources Modeling Symposium, USDA-ARS-30,Pingree Park, CO, pp. 321-325.
Rango; A. t 1992. Worldwide testing of the snowmelt runoff model
with applications for predicting the effects of climate change,Nordic Hydrology, 23, pp. 155-172.
Rango, A., 1993. Snow hydrology processes and remote sensing,Hydrological Processes, 7, pp. 121-138.
Rango, A., 1994a. Application of remote sensing methods to hydrol
ogy and water resources, Hydrological Sciences Journal, 39 (4),
pp.309-320.
Rango, A., 1994b. Applications of remote sensing by satellite, radar
and other methods to hydrology, Operational Hydrology Report
No. 39, WMO-No. 804, WMO, Geneva, 33 pp.
Rango, A and Martinec, 1, 1994. Areal extent of seasonal snow cover
in a changed climate, Nordic Hydrology, 25, pp. 233-246.
Rango, A., Martinec,J., Foster, 1 and Marks, D., 1983. Resolution in
operational remote sensing of snow cover, Hydrological
Applications of Remote Sensing and Remote Sensing Data
Transmission, Proceedings of Hamburg Symposium, August,
1983. IAHS Publ. No. 145, pp. 371-382.
Rango, A., Salomonson, V.V.·and Foster, J.I.., 1975. Employment of
satellite snow cover observations for improving seasonal runoff
estimates, Operational Applications of Satellite Snow Cover
Observations, NASA SP-391, Washington, DC, pp. 157-174.
Rango, A., Salomonson, V V. and Foster, J.L., 1977. Seasonal stream
flow estimation in the Himalayan region employing
meteorological- satellite snow cover observations, Water
Resources Research, 13, pp. 109-112.
Rango, A. and V van Katwijk, 1990. Development and testing of a
snowmelt-runoff forecasting technique, Water Resources
Sufietin, 26, pp. 135-144.
Rangoonwala, A., Ahmed, S., Nasir, A., Raouf, A. and Shahab, H.,
1993. Quasi-operational use ofNOAAJAVHRR vegetation index
to monitor vegetal cover and crop growth, Adv. Space Res., 13
(5), pp" (5)265-(5)268.
Rao, V.R., 1989. Space and Flood Management, Special Current
Event Session, International Astronautical Federation, 40th
Congress, Malaga, Spain, 7 pp.
Reginato, RJ., Jackson, R.D. and Pinter, Jr., P.J., 1985.
Evapotranspiration calculated from remote multispectral and
groud station meteorological data, Remote Sensing Envbvn., 18,
pp.75-89.
Reinhold, RJ. and Linthurst, RA., 1975. Use of remote sensing for
mapping wetlands, Am. Soc. Civil Eng. 1. Tramp. Eng., 101, TE
2, pp. 189-198.
Reutov, E.A. and Shutko, A.M., 1986. Prior knowledge based soil
moisture determination by microwave radiometry, Soviet Journal
ofRemote Sensing,S (I), pp. 100-125.
Richard, VW., Kammerer, lEo and Wallace, H.B., 1988. Rain
backscatter measurements at millimeter wavelength, IEEE
Transactions on Geoscience and Remote Sensing, 26 (3).Richards, JA, Woodgate, P.w. and Skidmore,A.K., 1987. An expla
nation ofenhanced radar backscattering from flooded forests, Int.
J. Remote Sens., 8, pp. 1093-1100.
Ringrose, S. and Matheson, W., 1991. A Landsat analysis of rangeconditions in the Botswana Kalahari drought, Int. 1. Remote
Sens., 12, pp. 1023-1052.
Riou, e., Itier, B. and Seguin, 8., 1988. The influence of surface
roughness on the simplified relationship between daily evapora
tion and surface temperature, International Journal ofRemote
Sensing, 9 (9), pp. 1529-1533.
Ritchie, l.e. and Cooper, C.M., 1991. An algorithm for using Landsat
MSS for estimating surface suspended sediments, Water
Resources Bulletin, 27, pp. 373-379.
Ritchie, J.C., Evans, D.L., Jacobs, D., Everitt, l.H. and Weltz, M.A.,
1993b. Measuring Canopy Structure with an Airborne Laser
Altimeter, Trans. ofthe ASAE, 36 (4), pp. 1235-1238.
Ritchie, J.e., Grissinger, E.H., Murphey, J.B. and Garbrecht, J.D.,
1994. Measuring channel and gully cross-sections with an
airborne laser altimeter, Hydrological Processes, 8, pp. 237-243.
Ritchie, J.e., Jackson, T.J., Garbrecht, J.D., Grissinger, E.H.,
Murphey, J.B., Everett, J.H., Escobar, D.E., Davis, M.R and
Weltz, M.A., 1993a. Studies using an airborne laser altimeter to
measure landscape properties, Hydrological Sciences Journal,
38 (5), pp. 403-416.
Ritchie, J.C., Schiebe, P.R, Cooper, e.M. and Harrington, J.A., Jr.,
1992. Landsat MSS studies of chlorophyll in sediment domi
nated lakes, Proceedings of IGARRS '92 Symposium, Vo!' II,
Clear Lake City, TIC, pp. 1514-1517.
Roberts, G., France, M., Johnson, R.e., and Law, J.T., 1993. The
analysis of remotely sensed images of the Balquidder catchments
for estimation of percentages of land cover types, Journal of
Hydroiogy, 145, pp. 259-265.
Rodda, J.e., Pieyns, SA, Sehmi, N.S. and Matthews, G., 1993.
Towards a world hydrological cycle observing system,
Hydroiogical Sciences Journal, 38 (5), pp. 373-378.
Rohlfing, R., 1993. Radar data based optimization of control strate
gies in an urban drainage system, Advances in Radar Hydrology,
Proc. Int. Workshop, November 11-13,1991, Lisbon, Portugal,
Commission for the European Communities, in press.
Roller, N.E., 1984. Effective integration of data sources for optimiz
ing reSOurce inventories, 18th Int. Symp. on Remote Sensing of
Environment, Paris, France.
Rosema, A, Bijleveld, l.R, Reiniger, P., Tassone, G., Blyth, K. and
Gurney, R.I., 1978. TELL-US, a combined surface temperature,
soil moisture and evaporation mapping approach, Proceedings
of the 12th International Symposium on Remote Sensing of
Environment, Ann Arbor, Michigan, pp. 2267-2276.
Rott, H., 1986. Prospects of microwave remote sensing for snow
hydrology, Hydrologic Applications of Space Technology
(Proceedings of the Cocoa Beach Workshop), IAHS Publication
No. 160, pp. 215-233.
Rott, H., Domik, G., Metzler, C., Miller, H. and Lenhart, K.G., 1985.
Study on use and characteristics of SAR for land snow and ice
applications, ESA Contract Report No. 5441183/D/IM/(SC).
Rott, H. and Kunzi, T., 1983. Properties of the global snowcover and
snow-free terrain from the NIMBVS-7 SMMR. First year data

REFERENCES 55
set. Proc. of the Specialist Meeting on Microwave Radiometryand Remote Sensing Applications, March 1-2, 1983, Rome, Italy.
Ryall, G. and Conway, BJ., 1993. Automated precipitation Ilowcasting at the UK Met Office. First European Conference onApplications of Meteorology, September 27-october 1, 1993,
University of Oxford, UK, 4 pp.
Sabins, EE, Jr., 1983. Geologic interpretation of space shuttle radarimages of Indonesia. American Association PetroleHm GeologyBulletin, 67, pp. 2076.
Salomonson, v.v. (compiler), 1983. Water resources assessment,Colwell, R.N. (ed.) Manual of Remote Sensing, 2nd Edition,American Assoc. Photogrammetry, Ch. 29, pp. 1497-1570.
Saxena, N., 1982. Hydrologic surveys of the 1990s, Allgemeine
Vennessungsnachrichten, 6, pp. 227-233.Schneider, S.R, McGinnis, D.E and Pritchard, J.A., 1979. Delineation
of drainage and physiographic features in North and SouthDakota using NOAA-5 infrared data, Satellite Hydrolagy (Edited
by Deutsch, D. Wiesnet and A. Rango), AWRA, Minneapolis,
Minnesota, pp. 324-329.
Schneider, S.A., 1989. Global wanning -are we entering the greenhouse century? Sierra Club Books, San Francisco, 317 pp.
Schneider, S.R., McGiunis, D.F. aud Gatlin, J.A., 1981. Use of
NOAAlAVHRR visible and near-infrared data for land remotesensng, NOAA Technical Report NESS 84, Washington, DC
20233, USA, 48 pp.
Schultz, G.A., 1993. Hydrological modeling based on remote sensinginformatiou,AdvancedSpace Research, 3 (5), pp. (5)149-(5)166.
Schultz, GA., 1988. Remote sensing in hydrology, Journal ofHydrology, 100, pp. 239-265.
Schultz, G.A. and Barrett, E.C., 1989. Advances in remote sensingforhydrology and water resources management, InternationalHydrological Programme, UNESCO Technical Documents onHydrology, IHP-llI Project 5.1, Paris, 102 pp.
Scofield, R.A., 1991. Operational estimation of precipitation fromsatellite data, Global and Planetary Change, 4(1/3), pp. 79-86.
Scofield, R.A. and Oliver, V.l, 1977. A scheme for estimating convective rainfall from -satellite imagery, NOAA TechnicalMemorandum, NESS-86, Washington, DC, 47 pp.
Seginer, I., 1971. Wind effect on evaporation rate, Journal ofAppliedMeteorology, (4).
Seguin, B., Courault, D. and Guerif, M., 1993. Satellite thennalinfrared data applications in agricultural meteorology, Adv. SpaceRes., 13 (5), pp. (5)207-(5)217.
Seguin, B. and !tier, B., 1983. Using midday surface temperature toestimate daily evaporation from satellite thennal IR data,International Journal ofRemote Sensing, 4 (2), pp. 371-383.
Shcheglova, G.P. and Chernov, V. Yu, 1982. Seasonal snow line withinthe Fergana Basin and possibilities for using it in hydrologicalforecasting. Izucheniye Gidrologicheskoga TsiklaAerokomicheskimi Metodami (Eds. K. Ya Kondratyev and Yu V.Kurilova), Academy of Sciences, Russian Federation, SovietGeophysical Conunittee, Moscow, pp. 36-41.
Shuman, C.A., Fitzpatrick, J., Mershon, G., Dibb, l. and Stearns, C.R,
1993. Identification of multiple hoar-development episodes inCentral Greenland with SSM!I brightness temperature trends andfield observations, EGS, AGU Fall Meeting.
Shutko, A.M., 1982. Microwave radiometry of lands under natural andartificial moistening, IEEE Transactions on Geoscience andRemote Sensing, 0E-20 0), pp. 18-23.
Shutko, A.M., 1985. Radiometry for farmers, Sciellce ill the USSR, 6,
pp.97-113.
Shutko, A.M., 1986. Microwave radiometry of water surface andgrounds, Publishing House 'Nauka', Moscow, RussianFederation, 192 pp. (English translation).
Shutko, A.M., 1987. Remote sensing of the waters and lands viamicrowave radiometry (the principles ofmethod, problems feasible for solving, economic use), in: Remote Sensing and ItsImpact on Developing Countries, Pontificia AcademiaScientiarum, Scripta Varia-68, Vatican City, pp. 413-441.
Shutko, A.M., 1990. Offer on hardware, software and services on surveyof soil, vegetation and water areas - from aircraft, Institute ofGeoinfonnatics, Nongovernmental Center for Research andInstitute of Radioengineering and Electronics, Academy ofSciences, Russian Federation, IGI, IRE, Moscow, 16 pp.
Simpson, J., Adler, RE and North, G.R, 1988. A propused tropical
rainfall measuring mission (TRMM) satellite, AmericanMeteorological Society, 69(3), pp. 278-295.
Sippel, S.l., Hamilton, S.K., Melack, J.M. and Choudhury, B.J., 1993.
Passive Microwave Satellite Observations of Inundation in thePantanal Wetland of Brazil, EOS, AGU Fall Meeting.
Smith, lA and Krajewski, W.E, 1991. Estimation of the mean field
bias of radar rainfall estimates, Journal ofApplied Meteorology,
30 (4), pp. 397-412.
Soliman, M.M. and Zaki, A.M., 1986. Verification of Lake Aswan
High Dam sediment model by Landsat imagery, AJ. Johnson(Editor), Hydrologic Applications of Space Technology, lAHSPub!. No. 160, pp. 245-248.
Soares, J.v., BernardR, Taconet, 0., Vidal-Madjar, D. and Weill, A.,
1988. Estimation ofbare soil evaporation fn?m microwave measurements, J. Hydrolagy, 99, pp. 281-296.
Soer, GJ.R., 1980. Estimation ofregional evapotranspiration and soilmoisture conditions using remotely sensed crop surface temperatures, Remote Sensing ofEnvironment, 9, pp. 27-45.
SparLIGHT, 1993. Bay Watch from Space, The SPOT Image
Corporation Newsletter, p.7.Srivastav, S.K. and Singh, R.P., 1991. Microwave radiometry ofsnow
covered terrains, Int. J. Remote Sens., 12, pp. 2117-2131.Stewart, E.J., 1993. Application of weather radar to hydrological
design studies, Advances in Radar Hydrology, Proc. Int.Workshop, November 11-13, 1991, Lisbon, Portugal,Commission for the European Communities, in press.
Stiles, W.H., Ulaby, F.T. and Rango, A., 1981. Microwave measurements of snowpack properties, Nordic Hydrol., 12, pp. 143-166.
Stoffelen, A. and Anderson, D.L.T., 1993. Wind retrieval and ERS-1
scatterometer radar backscatter measurements, Adv. Space Res.,13 (5), pp. (5)53-(5)60.
Strumph, R.P. and Taylor, M.A., 1988. Satellite detection of bloomand pigment distribution in estuaries, Remote Sensing ofEnvironment, 24, pp. 385-404.
Szekielda, K.B., 1988. Satellite moniton'ng ofthe Earth, John Wiley& Sons, New York, pp. 258-265.
Taconet, 0., Bernard, R. and Vidal-Madjar, D., 1986. Evapo
transpiration over an agricultural region using a surfaceflux/temperature model based on NOAA-AVHRR data, Journalof Climate and Applied Meteorology, 25, pp. 284·307.
Taconet, O. and Vidal-Madjar, D., 1988. Applications of a flux algorithm to a field-satellite campaign over vegetated area, RemoteSensing ofEnvironment, 26, pp. 227-239.

56 CURRENT OPERATIONAL APPLICATIONS OF REMOTE SENSING IN HYDROLOGY
Tarpley, J.D., 1979. Estimating incident solar radiation at the surface
from geostationarysatellite data, J. Appl. Meteorol., 18, pp. 1172
1181.
Tarpley, lD., 1984. Monitoring global vegetation from meteorologi
cal satellite data, Proc. 18th Int. Symp. on Remote Sensing of
Environment, Paris, France.
Thiao, W., Scofieid, R.A. and Robinson, J., 1993. The reiationship
between water vapor plumes and extreme rainfall events during
the summer season, NOAA Tech. Report, NESDIS-67,Washington, DC.
Thorn, A.S. and Oliver, HR., 1977. On Penman's equation for esti
mating regional evapotranspiration, Quarterly Journal Royal
MeteorologicalSociety, 103, pp, 345-357.
Thunnissen, H.A.M. and Nieuwenhuis, a.I.A., 1990. A simplified
method to estimate regional 24-h evapotranspiration from ther
mal infrared data, Remote Sensing of Environment, 31, pp.
2II-225.
Torlegard, K., 1994. Costlbenefit aspects of remote sensing education,
International Journal of Remote Sensing, 15 (15), pp. 3101
3109.
Travaglia, C, 1989. Drainage analysis, Remote Sensing Applications
to Land Resources, Report of the 14th UNIFAO International
Training Course, in cooperation with the Government of Italy,
Rome, Italy, RSC Series 54, pp. 101-106.
Trevett, lW., 1986. hnaging Radars for Resources Surveys, Remote
Sensing Applications Services, Chapman & Hall, London, pp.
145-149.
Tucker, C.I., Elgies, J.H., McMnrtrey, ill, I.E. and Fran, c.J., 1979.
Monitoring com and soybean crop development with hand-held
radiometric spectral data, Remote Sensing Environ., 8, pp. 237
248.
Ullriksen, P., 1985. Profiler genom snotacket registrerade i mars med
LTH's, 900 IvIhz impulsradarsystem, Vannet i Norden, 4, pp. 47
70.
UNESCOIWMOIICSU, 1993. Report of the UNESCOIWMOIICSU
International Conference on Hydrology, Towards the 21st
Century: Research and operational needs, March 22-26, 1993,
Paris.
van de Griend, A.A., Camillo, P.J. and Gnmey, R.I., 1985.
Discrimination of soil physical parameters, thermal inertia and
soil moisture from diurnal surface temperature fluctuations, Water
Resources Research, 21, pp. 997-1009.
van de Griend, A.A and van Boxel, lH., 1989. Water and surface
energy balance model with a multilayer canopy representation for
remote sensing purposes, Water Resour. Res., 25, pp. 949-971.
Vane, G. and Goetz,A.F.H, 1988. Terrestrial imaging spectroscopy,
Remote Sensing ofEnvironment, 24 (I), pp. 1-30.
Vaughan, RA., 1994. Rapporteur's summary of session 1: Remote
sensing education and training in Europe today, International
Joumal ofRemore Sensing, 15 (15), PP. 3017-3019.
Vershinina, L.K., 1985. The use of aerial gamma surveys of snowpack
for spring snowmelt runoff forecasts, Hydrological Applications
of Remote Sensing and Remote Data Transmission, Proc.
Hamburg Symp.,August 1985, lAHS Pubi. No. 145, pp. 4II-420.
Verwom, H., 1993. Urban applications of weather radar, Advances in
Radar Hydrology, Proc. Int. Workshop, November II-D, i991,
Lisbon, Portugal, Commission for the European Communities, in
press.
Viollier, M., Deschamps, P.Y. and Lecomte, P., 1978. Airborne remote
sensing of chlorophyll content under cloudy sky as applied to the
tropical waters in the Gulf of Guinea, Remote Sensing Environ.,
7, pp. 235-248.
Viter, V.v., 1993. The ALMAZ program and the development of
remote sensing techniques to study the Earth from space, Space
Builetin, 1(1).
Walton, M.L., Smith, JA. and Shedd, R.C., 1990. Remote sensing of
rainfall with NEXRAD, Hydraulics/Hydrology ofArid Lands,
American Society of Civil Engineers, New York,pp. 304-310.
Walsh, PD., 1993. New Directions in Radar Hydrology, WMO RA VI
Workshop on Requirements and Applications of Weather Radar
Data in Hydrology and Water Resources, 13 pp.
Ward, R.c., 1975. Principles ofhydrology, 2nd Ed., McGraw Hill,
London, 367 pp.
Warren, S.G., 1982. Optical properties of snow, Rev. Geophys. Space
Phys., 20, pp. 67-89.
Weltz, M.A., Ritchie, J.e. and Fox, HD., 1994. Comparison of laser
and field measurements of vegetation height and canopy cover,
Water Resources Research, 30 (5), pp.1311-1319.
Werth, L.P. and Meyer, M.P., 1981. A comparison of remote sensing
techniques for Minnesota wetlands classification, Satellite
Hydrology, AWRA, Minneapolis, MN, pp. 492-497.
Wiesnet, D.R and Deutsch, M., 1985. A new application ofNIMBUS
7 CZCS: Delineation of the 1983 Parana River flood in South
Amelica, Proc. of the American Society ofPhotogrammatry, 45th
Annu. Meet., Washington, DC, pp. 746-754.
Wilheit, T.T., Chang, A.T. and Chin, L.S., 1991. Retrieval of montbly
rainfall indices from microwave radiometric measurements using
probability distribution functions, Journal ofAtmospheric and
Oceanic Technology, 8 (1), pp. 118-136.
Willemont, J., 1994. PROMEfE, a. multimedia training programme inremote sensing, International Joumal ofRemote Sensing, 15 (15),
pp.3091-3093.
Wilson, w.J., 1m, E., Li, F. and Parks, G.S., 1989. Deveiopment of a
dual-frequency airborne rain radar, International Geoscience and
Remote Sensing Symposium, 3, pp. 1496-__.
Wood, BF., Lin, D.S., Mancini, M., Thongs, D., Troch, P.A., Jackson,
TJ., Famiglietti, J.S., and Engman, E.T., 1993. Intercomparisons
between passive and active microwave remote sensing, and
hydrological modeling for soil moisture, Adv. Space Res., 13 (5),
pp. (5)167-(5)176.
World Meteorological Organization, 1991. Executive Council Panel of
Experts on Satellites, Ninth Session. Geneva, March 18-22, 1991,
Final Report.
World Meteorological Organization, 1992a. Application of satellite
technology, Annual Progress Report, SAT-1O, Technical
Document, WMOrrD No. 569.
World Meteorological Organization, 1992b. Satellite ground receiving
equipment in WMO regions, Status Report SAT-I I, Tecbnical
Document, WMOrrD No. 576, 26 pp.
World Meteorological Organization, 1993a. Executive Council Panel
of Experts on Sateilites, Final Report, Geneva, March 9-10.
World Meteorological Organization, 1993b. Application of Satellite
Tecbnology, Annnal Progress Report, SAT-12, WMO/TD No.
628.
World Meteorological Organization, 1994. CBS Working Group on
Satellites, First Session, Geneva, March 7-11, 1994, Final
Report.
World Meteorological Organization, 1995. Progress Report on Action
From CBS WGSAT-1: Education and Training Rapporteurs,
Marcb 1995.

REFERENCES 57
Zall, L. and Russell, 0., 1981. Groundwater exploration programs inAfrica, Satellite Hydrology, American Water ResourcesAssociation, Minneapolis, MN, pp. 416-425.
Zebker, H.A., Madsen, S.N., Martin, 1., Wheeler, K.B., Miller, T., Lou,
Y., Alberti, G., Vetrella, S. and Cuci,A., 1992. The TOPSAR inter
ferometric radar topographic mapping instrument, IEEETransactions on Geoscience and Remote Sensing, 30, pp. 933~940.
Zevenbergen, A.W. and Rango, A., 1992. Applying Landsat
imagery for groundwater development in Egypt. Geocartolntemational-A Multidisciplinary Journal ofRemote Sensing,
7 (3), pp. 41-5 I.
Zuzel, 1.E and Cox, L.M., 1975. Relative importance ofmeteorolog
ical variables in snow melt, Water Resources Research, 11, pp.174-176.

APPENDIX I
CITED LITERATURE ON APPLICATIONS OF REMOTE SENSING IN HYDROLOGY
A. RECENT TEXTBOOKS ON THE APPLICATION OF REMOTE SENSING IN HYDROLOGY
1. Remote Sensing in Hydrology (Engman and Gurney, 1991)
2. Remote Sensing and Geographical Tnformation Systems forResource Management in Developing Countries (Edited by
Belward and Valenznela, 1991)
3. Microwave Imaging Techniques (Bernard and Subbaram,1991)
4. Satellite Remote Sensing for Hydrology and WaterManagement (Barrett, 1990)
5. Processing and Analysis of Commercial Satellite Image Dataof the Nuclear Accident Near Chernobyl, USSR (Sadowski
and Covington, 1987)
6. Microwave Radiometry of Water Surface and Grounds(Shutko, 1986)
7. Remote Sensing ofIce and Snow (Hall and Martinec, 1985)
8. The Use of Satellite Data in Rainfall Monitoring (Barrett.1981)
9. Applications of Remote Sensing in AgriCltlture (Edited by
Steveu, 1990)
10. Introduction to Environmental Remote Sensing, 3rd ed.
(Barrett and Curtis, 1992)
11. Spaceborne Radar Remote Sensing: Applications andTechniques (Elachi, 1987)
12. Manual of Remote Sensing, 2nd ed. (Edited by Colwell,
1983)
B. TECHNICAL REPORTS ON THE APPLICATION OF REMOTE SENSING IN HYDROLOGY
1. Applications ofRemote Sensing by Satellite, Radar, and OtherMethods to Hydroiogy. WMO-No. 804 (Rango, 1994)
2. Applications ofRemote Sensing to Hydrology. WMO-No. 773(Kuittineu, 1992)
3. Application of Satellite Data for Estimation of Precipitation.
WMOfID-300 (Kuittinen, 1992)
4. Executive Council Panel of Experts on Satellites. WMO Final
Report (1993)
5. Executive Council Panel of Experts/CBS Working Group on
Satellites, Tenth Session. WMO Final Report (1992)
6. Executive Council Panel of Experts on Satellites, Ninth Session.
WMO Final Report (1991)
7. Remote Sensing for Hydrology - Progress and Prospects.WMO-No. 773 (Kuittinen, 1992)
8. Application of Satellite Technology. Annual Progress ReportWMO SAT 10 (1992)
9. Satellite Ground Receiving Equipment in WMO Regions. Status
Report WMO SAT 11 (1992)
10. Advances in Remote Sensingfor Hydrology and Water ResourcesManagement. UNESCO IHP-Ill Project 5.1 (Schultz and Barrett,
1989)
11. Water and Environment Key to Africa's Development. llIEReport Series 29 (1993)
12. Institute for Remote Sensing Applications. Joint Research Centre
Aunual Report (1992)
13. Remote Sensing Applications to Water Resources. FAO RSC
Series 50 (1989)
14. Natural Resource and Environmental InfomJationfor Decision
making. The World Bank Report (Edited by Hassan and
Hutchiuson, 1992)
15. Hydrological Assessment ofSubSaharan Africa. The World Bank
Reports.
16. 1986/7 Sudan Crop Estimation Assisted by Remote SensingTechniques. US AID (Hassan, 1988)
17. Nile Forecasting System. NOAA Technical Manual (Edited by
Van Blargan, 1993)
18. The Relationship Between Water Vapor Plumes and ExtremeRainfall Events During the Summer Season. NOAA Tech Report
NESDIS 67 (Thiao €I al., 1993)
19. Satellite Derived Rainfall Estimates and PropagationCharacteristics Associated with Mesoscale Convective Systems(MeSs). NOAA Tech Memo NESDIS 25 (Iuying and Scofield,
1989)
20. A Geographic lnfonnation System to Support State-wideHydrologic and Nonpoim Pollution Modeling. Maryland DOT
(Ragan, 1991)
21. Feasibility ofUsing Remote Sensing Platfonns as anAid to WaterQuality Monitoring in the Tennessee Valley (Dierberg, 1992)
22. Applying Remote Sensing and GIS Techniques in SolvingRural County Infonnation Needs. Final Report (Johannsen et al.,1992)
23. A Remote Characterization System for Subsurface Mapping ofBuried Waste Sites (Sandness et al., 1992)
24. Space-based Remote Sensing ofthe Earth: A Report to Congress.NOAA, USDC, NASA, US AID (1987)
25. Scientific, Military, and Commercial Applications ofthe lAND
SAT Program. Conunittee on Science, Space, and Technology
(1991)
C. PROCEEDINGS OF CONFERENCES/SYMPOSIA ON THE APPLICATION OF REMOTE SENSING IN HYDROLOGY
1. Remote Sensing for Oceanography, Hydrology And Agriculture.
Advances in Space Research. COSPAR. (Edited by Gower,
Salomoson, Engman, Onnsby and Gupta, 1993)
2. Satellite Hydrology. AWRA (Edited by Deutsch, Wiesnet and
Rango, 1979)
3. Eastern Snow Conference. CRREL Special Report 90-44
(Carroll, 1990)
4. HydrauIicsIHydrology ofArid Lands. HY and IR Div.!ASCE (1990)
5. ISLSCP Field Experiment. American Meteorological Society
(1990)

APPENDIX I 59
6. Western Snow Conference (1989,1987,1983)7. Hydrometerology. American Meteorological Society (1990)8. Large Scale Effects of Seasonal Snow Cover. Vancouver
(IAHS Publ. No. 166)9. SPIE. The International Society for Optical Engineering
(1992, 1983)10. American Congress on Surveying and Mapping. American
Society for Photograrnmetry and Remote Sensing (1987)11. Remote Sensing Applications for Water Resources
Management. US Army Corps of Engineers (1985)12. International Conference on Hydrology. Towards the 21st
Century: Research and Operational Needs. UNESCO!WMOIICSU (1993)
13. Weather Analysis and Forecasting/Flash Floods. AmericanMeteorological Society (1993)
14. Hydrological Applications of Remote Sensing and RemoteData Transmission. Hamburg (lAHS Pub!. No. 145) (1983)
15. Remote Sensing Water Resources. IAH
16. International Symposium on Mapping and GeographicInformation Systems. ASTM Special Tech. Publ. No. 1126,ASTM, USGS (1992)
17. Irrigation and Drainage: Saving a Threatened Resource - InSearch of Solutions, ASCE (1992)
18. International Conference on Engineering, Construction, andOperations in Space 111. ASCE (1992)
19. Civil Engineering Applications of Remote Sensing andGeographic Information Systems. ASCE, US Army Corps ofEngineers (1991)
20. Earth and Atmospheric Remote Sensing. SPIE, CREOL!University of Central Florida (1991)
21. Remote Sensing, Global Monitoring for Earth Management.IGARSS (1991)
22. Optical Remote Sensing of the Atmosphere. Optical SocietyofAmerica, American Meteorological Society (1991)
D, JOURNALS CONTAINING ARTICLES ON THEAPPLICATION OF REMOTE SENSING IN HYDROLOGY
1. Earlh Space Review
2. Space Bulletin
3. Remote Sensing Reviews
4. Nordic Hydrology
5. Geographic Information Systems and Water Resources, AWRA6. Remote Sensing ofEnvironment
7. Hydrological Sciences
8. Agricultural Meteorology
9. IEEE Transactions on Geoscience and Remote Sensing
10. Water Resources Bulletin, AWRA11. Hydrological Processes
12. Geocarto International
13. Nature and Resources
14. Geophysical Research Letters
15. Journal ofHydrology
16. National Weather Digest, NWA, Satellite
17. Photogrammetric Engineering and Remote Sensing
18. International Journal ofRemote Sensing
19. Water Resources Planning and Management, ASCE20. Soviet Journal ofRemote Sensing, Translation of Isslendovannie
ZemU iz Kosmosa
21. Akusticheskii Zurnal
22. Journal ofAppliedMeteorology
23. Global and Planetary Change
24. South African Journal ofMarine Science
25. Journal ofAtmospheric and Oceanic Tec1mQlogy
26. Meteorological Magazine
27. National Technical Infonnation Service
28. Bulletin ofthe American Meteorological Society
29. Monthly Weather Review
30. HydraulicslHydrologyofAridLands, ASCE31. Water Resources Research
E. OTHER DOCUMENTS CONTAINING ARTICLESIINFORMATION THE APPLICATION OF SENSING IN HYDROLOGY
1. SPOTLight. The SPOT hnage Corporation Newsletter2. EOSATNotes. Earth ObservationSatelIite Company3. EOSATLandsat Data Users Notes
4. National Operational Hydrologic Remote Sensing Center, NOAA(Newsletter)
5. COSPAR Information Bulletin
AUTHORS REPORTING OPERATIONAL OR POTENTIALLY OPERATIONALAPPLICATIONSOF REMOTE SENSING IN HYDROLOGY
g - Basin CharacteristicsI. Corbley, 19942. EOSAT, 1994a3. Fuller, 19934. Roberts el al., 1993
e - Ice on Land
I. WMO,1993b
f - S1l1jace WaterI. Corbley, 19942. COSPAR, 19933. EOSAT, 1993a4. NOAA, 1993
d-SnowI. Carroll, 19902. Carroll and Carroll, 19893. Carroll el al., 19934. Corbley, 19945. Engman and Gurney, 19916. Goodison and Walker, 19937. Harrison and Lucas, 19898. Kumar et al., 19919. Rango,1995
c - Evapotranspiration
I. Dnnkel and Vadasz, 19932. Menenti, 1993
b - Soil Moisture and
Groundwater
Carroll and Schaake, 1983Corbley, 1994Dutartre el a!., 1993EI-Baz, 1993Engman and Gurney, 1991Jones and Carroll, 1983Reutov and Shutko, 1986WMO,1993Zevcnbergen and Rango,1992
a - Precipitation
I. Adler et al., 1991
2. Barrett, 1993 I.3. Barrett and Harrison, 1986 2.4. Csistar and Bonta, 1993 3.5. D'Souza el a!. , 1990 4.6. Hogg, 1989 5.7. Negri el al., 1994 6.8. NOAA, 1993 7.9. Scofield, 1991 8.10. Walton el of., 1990 9.11. WMO,1992a

APPENDIX II
HYDROLOGICAL OBSERVATIONAL REQUIREMENTS AND EXISTING AND PLANNEDSATELLITES AND SENSORS FOR HYDROLOGICAL APPLICATIONS
Table 1 - A summary of hydrology and water management observational requirements in relation tosatellite monitoring opportunities (see Herschy, Barrett and Roozekrans, 1985 a1U11988)
Parameter Resolution Frequency Accuracy
max. min. opt max. min. opt max. min. opt
Precipitation 100m 110 kml 1 km 5min ~ ~ 10% 30% 20%
Snow depth 30m 110 kml 1 km 12 h [1MJ 13~J1J 2cm110cml L5..~
Ice cover 10 m 11 km I 25m 12 h I 7;q 24 h 1% 1 20%1 [10% IGlaciers ~ ~oml 1~5j1lJ [iL] ~ [IY] 1% I 5% I I 2% I
Surface waterareal exlent 10m 100 m 30m 12 h @] 24 h 1% 5% 3%
Groundwater -50m 1 km 100m 1 y 5y 3y 5m 30m 10maquifer maps
Evaporation 100 m [ lOkml ~ [iill ~ D:TI 10% 130% I 120% IWater quality - turbidity 30 m
1300ml 100 m 3 h ~ 6h 10% 150% I [ 20%-1
--- ---
Drainage - drainage areal 0 m 1100 ml 20 m QL] ~ Qi] 0.1% 1% 0.5%
Frequency: h =hour; d =day; M =month; y =year
Feasibility: CJ =Requirement can be generally met by existing satellite(s)
-- =Requirment should be generally met by near future satellite(s)
Note: Where a value is neither boxed nor underlined the observational requirement cannot generally met either by existingor firmly expected future satellites, given the present state of the art.
Table 2 - Hydrological observational needs (Ormsby and Engman, 1993)
Parameter
Soil moisture
Vegetation• Identification• Areal extent• Condition (stress)
Snow• Water equivaient• Areal extent• Thickness
Radiation• Short and long wave
Precipitation
Evapotranspiration
Runoff
Wetland aeral extent
Approach
~ wave (passive/active)
Visible, NIR, TIR, ~ waveVisible, NIR, TIR, ~ waveVisibie, NIR, TIR, ~ wave
~wave
Visible, .~ wave~wave
Visible, TIR
J...l wave or in situ
TIR, visible, ~ wave, modeiling
TIR, visibie, ~ wave, modelling
Visible, NIR, TIR, ~ wave
Spatial resolution
1-10 km/30c 50 m
1 km30m30m
1 km1 km1 km
100 km2
1 km
1 km
30-100m
Observation frequency
2 days
7 days30 days3 days
7 days7 days7 days
6 hours
Daily
Daily
Daily
Monthly

APPENDIX II
Table 3 - WMO satellite data requirements (WMO, 1993a)
61
Measurement
Wind
Wind profile
Temperature profile
Humidity profile
Liquid water, total andprecipitation rate
Cloud top temperature
Cloud type and amount
Ozone total and profile
Radiation, net
Aerosol
Multi-purpose imagery
Pressure, sea surface
Sea-surface temperature (SST)
Temperature, surface
Ocean surface wind vector
Soil moisture
Earth surface albedo
Ocean wave height
Wave spectrum
Ice coverage, edge
Ice thickness
Snow coverage, edge
Snow depth, snow water equivalent
Instrument type
Geostationary imaging radiometer
(undetermined)
Atmospheric sounder (IR, microwave)
Atmospheric sounder (IR, microwave
Imaging multi-spectral (microwave)radiometer
Imaging multi-spectral (VIS, IR) radiometerAtmospheric sounder (IR)
Imaging multi-spectral (VIS, IR)radiometer
Atmospheric chemistry spectrometer
Earth radiation radiometer
Imaging multi-spectral (VIS, IR) radiometer
Imaging multi-spectral (VIS, IR) radiometer
(undetermined)
Imaging multi-spectral (VIS, IR) radiometerAtmospheric sounder (IR)Multi-directionai radiometer (lR)
Imaging multi-spectral (VIS, iR) radiometerMulti-directional radiometer (IR)
Wind (microwave) scatterometer
(undetermined)
Imaging mUlti-spectral (VIS, IR) radiometer
Radar altimeter
Mapping radar (SAR)
Imaging multi-spectral (VIS, IR, microwave)radiometer
(undetermined)
Imaging multi-spectral (VIS, microwave)radiometer
(undetermined)
Candidate sensor
VISSR, MVIRI
(undetermined)
HIRS, AIRS,IASI, MSU
HIRS, AIRS, IASI, MSU, MHS
SSM/I, TMI, MIMR
AVHRR, MODIS, MERIS, HIRS, AIRS,IASI
AVHRR, VISSR, MVIRI, SEVIRI,MODIS, MERIS
TOMS, GaME, GOMOS,SCIAMACHY, MOPITT, IMG,ILAS, HIRDLS, TES
CERES, SCARAB
AVHRR, MODIS, MERIS
AVHRR, SEVIRI, MODIS, MERIS
(undetermined)
AVHRR, aCTS, MODIS, MERISAIRS, lAS!, HIRSATSR
AVHRR, MODIS, MERISATSR
AMI, NSCAT, STIKSCAT
(undetermined)
MODIS, MERIS, AVHRR, AVNIR
ALT, RA
AMI
AVHRR, MODIS, MERIS, SSM/I,MIMR
(undetermined)
AVHRR, MODIS, MERIS, SSM/I,MIMR
(undetermined)
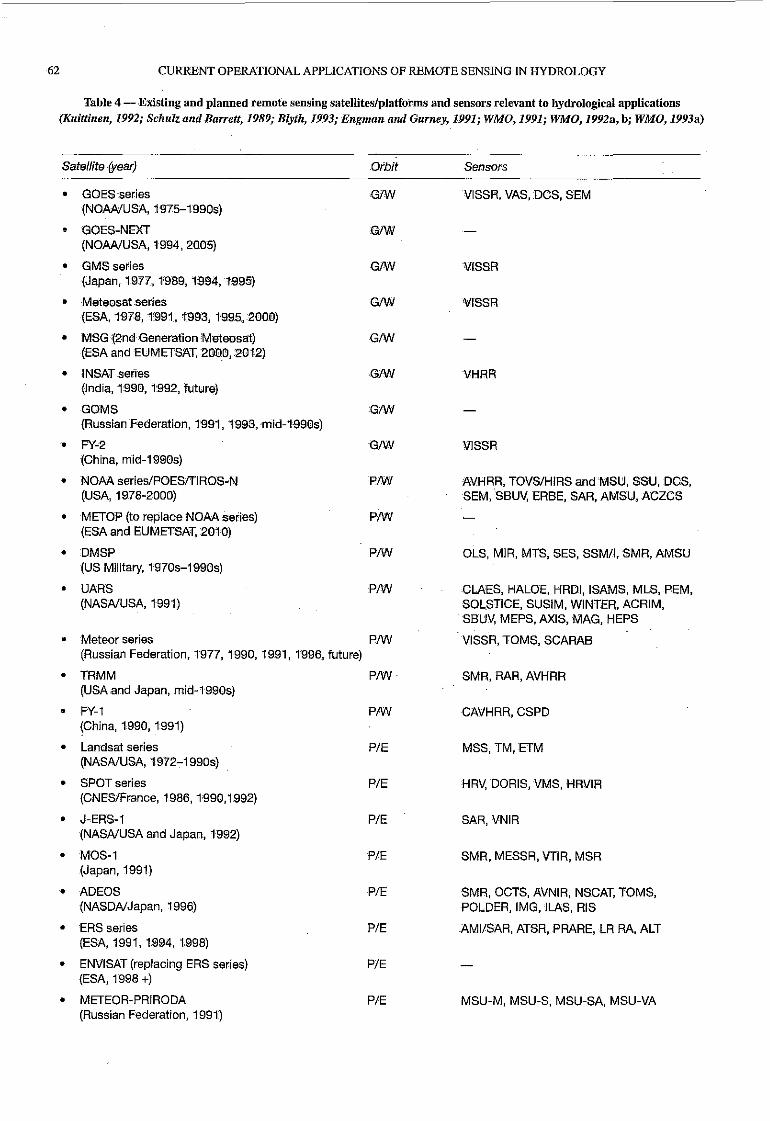
62 CURRENT OPERATIONAL APPLICATIONS OF REMOTE SENSING IN HYDROLOGY
Table 4 - Existing and plannedteJilote sensing satellites/platforms and sensors relevant to hydrological applications(Kuittinen, 1992; Schulz and Barrett, 1989; Blyth, 1993; Engman and Gurney, 1991; WMO, 1991; WMO, 1992a, hj WMO,1993a)
Satellite (year) Orbit Sensors
GfW
GIW
• GOES series(NOAA/USA, 1975-1990S)
~ GOES-NEXT(NOAA/USA, 1994, 2005)
• GMS series GJW(Japan, 19n, 1989, IB94, 1995)
• Meteosat -series GJW(ESA, 1978, 1991, 1993, 1'995,2000)
• MSG '(2nd Generation Meteosat) GIW(ESA and EUMETSAT,2000, ;2012)
• INSATseries ,GfW(India, 1990, 1992, future)
• GOMS 'OIW(Russian P"deration, 1991, 1993, mid-t990s)
• FY-2GIW(China, mid-1990s)
• NOAA series/POESITIROS·N PM(USA, 1978-2000)
• METOP (to repiace NOAA series) PM(ESA and EUMETSAT,2010)
• DMSP PIW(US Mil ital)', 1970s-1990s)
• UARS PIW(NASA/USA, 1991)
• Meteor series PIW(Russian Federation, 1977, 1990, 1991, 1996, future)
• TRMM PIW(USAand Japan, mid-1990s)
• FY-l PIW(China, 1990, 1991)
• landsat series PIE(NASA/USA, 1972-1990s)
• SPOT series PIE(CNES/France, 1986, 1990,1992)
• J-ERS-l PIE(NASA/USA and Japan, 1992)
• MOS-l PIE(Japan, 1991)
• ADEOS PIE(NASDA/Japan, 1996)
• ERS series PIE(ESA, 1991, 1994, 1998)
• ENVISAT (replacing ERS series) PIE(ESA, 1998 +)
• METEOR-PRIRODA PIE(Russian Federation, 1991)
VISSR, VAS, DCS, SEM
VISSR
VISSR
VHRR
VISSR
AVHRR, TOVS/HIRS and MSU, SSU, DCS,SEM,SBU\I, ERSE, SAR, AMSU, ACZCS
OlS, MIR, MTS, SES, SSM/I, SMR, AMSU
CLAES, HALOE, HRDI, ISAMS, MlS, PEM,SOLSTICE, SUSIM, WINTER, ACRIM,
.SSUV, MEPS, AXIS, MAG, HEPS
. VISSR, TOMS, SCARAB
SMR,RAR, AVHRR
CAVHRR,CSPD
MSS, TM, ETM
HR\I, DORIS, VMS, HRVIR
SAR,VNIR
SMR, MESSR, VTIR, MSR
SMR, OCTS, AVNIR, NSCAT, TOMS,POLDER, IMG, ILAS, RIS
AMI/SAR, ATSR, PRARE, lR RA, AlT
MSU-M, MSU-S, MSU-SA, MSU-VA

Satel/ite (year)
• ALMAZ(Russian Federation, 1991)
• RADARSAT(Canada, 1994-2000)
• IRS(India, future)
• RESURS series/COSMOS(Russian Federation, 1988, 2000)
• LAGEOS(USA and Italy, future)
• OKEAN series(Russian Federation, 1991, 1995)
• N-ROSS(NASA/USA, 1989)
• TOPEx/POSEIDON(USA and France, 1989, 1992)
• Sea Star(USA, future)
• TOMS/Earth Probe(USA, future)
• EOS/Columbus Project(USA, Europe, Japan and Canada, mid-1990s)
• X-SAR/SIR-C series/and L1DAR(USA, Germany and Italy, 1996)
• MECB(Brazil, future)
• ARABSAT(future)
APPENDIX II
Orbit
PIE
PIE
PIE
PIE
PIE
P/Ocean
P/Ocean
P/Ocean
P/Ocean
P/Ocean
P&G
Spaceshuttle
P/
Sensors
SAR,RS
SAR
L1SS, L1SS-1, L1SS-2
MSU-E, MSU-K, MSS
MSU-S, MSU-M
SSM/I, SCAn, ALT, LFMR
ALT, LRA, IMR, GPS
HIRIS, MODIS-T, MODIS-N, SMR, SSAR,AVHRR, TM, OCM, ESTAR, CERES, MIMR
SAR
63
P := polar-'orbiting G geostationary W:= weather satellite E Earth resources satellite
Table 5 - Key satellites carrying microwave sensors suitable for hydrological monitoring (Blyth, 1993)
Satellite Planned launch date Sensor type Waveband Ground resolution
MOS-1B February 1991 SMR K,Ka 32,23 kmDMSP December 1990 SMR K,Q,W 43-13 kmALMAZ March 1991 SAR S 15 mERS-1 July 1991 SAR C 12 m
+ 3 years ALT Ku < 10 cm (relative ht)J-ERS-1 February 1992 SAR L iBmSIR-C1 November 1993 + 7 days SAR L,C;X 60-10 mRADARSAT 1995 + 5 years SAR C 100-8 mERS-2 End 1994 + 3 years SAR C 12 mSIR-C2 November 1994 + 7 days SAR L,C,X 60-10 mADEOS 1995 SMR Ku 25 kmTRMM mid-1990s SMR K,O,W 10 km
RAR K 4kmSIR-C3 1996 + 7 days SAR L,C,X 60-10 mNASAEOS} 2000 Not yet finalizedPOEM
SAR := Synthetic aperture radar RAR := Real aperture radar SMR := Scanning microwave radiometer

64 CURRENT OPERATIONAL APPLICATIONS OF, REMOTE SENSING IN HYDROLOGY
Table 6 - Status of miCrowave remote sensing of hydrological-variables (Blyth, 1993)
Operational status
Operationally feasibleCatchment physical caracteristics
Catchment variables
Limited
Near operationalCatchment variables
Requiring developmentCatchment physicai characteristicsCatchment variables
S = Satellite; A = Aircraft
Variable
Watershed boundariesStream networksRiver channei slopeSlope elements
Surface water extent
{
Snow extentSnow depth
• Snow water equivalentRainfall over oceans
Rainfall over land
Impervious surfacesSurface roughnessSoil moistureVegetation moistureSnow extentSnow meltSnow water equivalent
Platform
AAAA
SSSSS
S
A&SA&SSSSSS
Sensor
SARSARStereo"SARStereo"SAR
SARPassivePassivePassive.Passive
Passive + SAR
SARM"freq SARPassive + SARPassive + SARPassive + SARPassive + SARPassive- + SAH
TABLE 7 - Key microwave frequencies for hydrological studies (Blyth, 1993)
Hydrological variable Pas_sive Active
Frequency (GHz) 104 6.6 10.7 18 21 37 90 0.2 OA 1.5 4.2 5.8 10:936.0
Band L X X K K Q W P S L C X K
Satellite resolution 18 10 6 5 3 1.5 18 8 20byyear2000 km km km km km km m m m
Catchment physical characteristics
Watershed boundaries • 0
Stream networks 0
Slope elements '0
River channel slope and roughness • • 0
Impervious surfaces • •Catchment variables
Soil moisture below:
- bare-so.il!short veg. .-' 0 a a •- crops .- 0,
-·trees, 0 nVegetation- moisture 0 • 0
Snow:
-extent • • a a • 0'
- onset ofmeit .- • 0 •_. water equivalent 0 0 0 0 0 0
Frozen ground 0 0
Surface water extent • 0 0.
Rainfall 0 • • •• =very useful; 0 =useful; 0 =helpfui

APPENDIX III
SPECIFIC SENSORS WmCH MIGHT BE CARRIED BY EOS
Specification and justification for satellite sensors deemed likely to be of special value for hydrology and water management inthe foreseeable future (from Barrett, Herschy and Stewart, 1988b).
Satellite type Orbit Sensor Spectral Spatial Imaging Principaltype regions resolution frequency applications
Environmental Geostationary Imaging 0.5 - 0.9 ~m 0.5 km' 48 d-l Meteorology, cloudRadiometer 5.7-7.1 ~m 4.0 km 24 d-l systems, rainfall, flash(GIR) 10.5 -12.5 ~m 0.5 km' 48 d-1 floods, thermal inertia,
surface water, ice andsnow cover, aridity,drought
Environmental Near-poiar Scanning 90 GHz 5 km' At least Cloud liquid water(Dual Microwave 37 GHz 10 km' 2 d-l ' contents, rain rates,polarized) Radiometer 25 GHz 10 km' 4 d-l snow cover, snow
(SMR) 19 Ghz 10km' preferabie' water equivalent,5 GHz 15 km' relative snow depth,
snow melt, sea ice andpoiymas
Environmental Near-polar Imaging 0.55 - 0.7 ~m 0.33 km' At least 2 d-' Meteorology, cloudRadiometer 0.725 -1.3 ~m 0.33 km' (0.3.15 h) systems, rainfall,(AVHRR) 3.55 - 3.95 ~m 0.33 km' 45 d-' surface temperatures,
10.5-11.5 ~m 0.33 km' preferable ice and snow cover,(0.3,09, major floods, aridity15,21 h) and drought,
vegetation indices
Environmental Near-polar Synthetic X-band 30m Every Extent of wet snow,Aperture C-band 30m 7-10 days: lake and river ice,Radar (SAR) L-band 30m 5 days glaciers, surface
preferable' water, soil mOisture,measurement andmonitoring
Environmental Near-polar Ocean 0.400 ~m 0.25 km Every three Water colour, qualityColour 0.445 ~m 0.25 km days* and turbidity,Monitor 0.520 ~m 0.25 km suspended sediments,(OCM) 0.565 ~m 0.25 km pollutants, phylo-
0.640 ~m 0,25 km plankton, surface0.685 ~m 0.25 km temperatures, iand0.785 ~m 0.25 km applications including1.020 ~m 0.25 km vegetation and land1,600 ~m 0,25 km use3.700 ~m 0.25 km8.500 ~m 0.25 km10.800 ~m 0.25 km12.000 ~m 0.25 km
Earth Near-polar Thermatic 0.45 - 0.52 ~m 30m Morphology, landresources Mapper (TM) 0.52 - 0.60 ~m 30m cover, surface water
0.63 - 0.69 ~m 30m extent and quality,0.76 - 0.90 ~m 30 m 4-5 days' giacier, lake and river1.55 - 1.75 ~m 30 m ice, snow cover,2.08 - 2.35 ~m 30m ground water, etc.10.4 -12.5 ~m 120 m
Space shuttle/ Various Modified Visiblet c. 10 m Occasional Relief drainage,Space lab aerial survey Infraredt c. 10 m c. every topographic mapping
cameras False colourt c. 10 m ten years(LFC)
Represents significant advance on capabilities of earlier/present sensor systems
t Depending on films and filters used

APPENDIX IV
STATE-OF-THE-ART OF SATELLITE DATA REQUIREMENTS AND REQUIRED CAPABILITIESOF NEAR·POLAR-ORBITING AND GEOSTATIONARY SATELLITES
Table 1 - ECSAT list of satellite reqlirements - upper air and surface (WMO, 1993a)
Requirement Horizontai resolution Vertical resolutIon Frequency Accuracy Use
UPPER AIR
Wind profile R 25 km 50 Ly 6 hr 1 m/s AG 100 km 15 Ly 12 hr 1 m/s A
Temperature profile R 25 km 50 Ly 6 hr 1.0 K AG 25km 15 Ly 6 hr 1.0 K A,B
Humidity profile R 25 km 10 Ly 6 hr 5% AG 50 km 10 Ly 6 hr 5% AB
Precipitation rate R 5 km 30 min 1 mm/d A B, CG 25 km 6 hr 3mm/d A,B,C
Liquid water, total G 25 km 5 Ly 6 hr 0.1 « 100 nm)2 (> 100 nm) A,B
Cloud top height R 5km 1 hr .2km AG 10 km 3 hr .2km A
Cloud top temperature R 5 km 1 hr 1 K AG 5 km 3 hr 1 K A
Cloud type and amount R 5km 10 Ly 1 hr 10% A, BG 5km 10 Ly 6 hr 10 % A, B
Heightof tropopause R 25km 6 hr 1 km AOzone total and profile G 50km 6 hr 5% BRadiation, net R 10 km 12 hr 5w/m2 A,B,C
G 50 km 12 hr 2.5 w/m2 A,B,CAerosol G .5 km 1 km. 6 hr 10% B
SURFACE
Multi-purpose imagery R 10 m 12 hr A,B,CG .4 km 6 hr A,B,C
Pressure, sea surface R 20km 1 hr .5mb AG 25 km 6 hr .5mb A
Temperature, sea surface R 1 km 6 hr .1 K AG 1 km 6 hr .1 K A,B
Temperature, surface R .5km 12 hr .1K A,B,CG 1 km 12 hr .5K A B, C
Sea surface wind R 10 km 6 hr 3 kts, 10 deg AG 25 km· 6 hr 2 kts, 10 deg A
Soil moisture R 20km 24 hr 6mm A,B,CG 25 km 24 hr 6mm A,B,C
Albedo, visible R 1 km - 6 hr 1% B,CG 5 km 24 hr 1% B,C
Aibedo, near IR G 2 x2 deg 1 mo 3% B,COcean wave height G 10 km 1 hr .3m AWave spectrum G 10 km 1 hr 10 deg (dir)
.5 s (period) AIce coverage R 10 km 1 d 2% A,B,CIce edge R 10 km 1 d 2% A,BIce thickness R 25 km 1 d 10% B,CSnow coverage R 1 km 1 d 2% A,B,C
G 1 km 1 d 10% A B, CSnow edge R 1 km 1 d 2% A B, CSnow depth R 1 km 1 d 5mm A B, C
G 1 km 12 hr 5mm A,B,CSnow water equivalent R 1 km 12 hr 2mm C
User category codes:A = operational meteoroiogy R = regionalB = climate and environmental monitoring and change G= globalC = hydrology/hydrometeoroiogy/agrometeorology

APPENDIX IV
Table 2 - Reqnired capabilities from near-polar-orbiting satellites {WMO, 1993a)
67
• On the surface and the Planetary Boundary layer (PBl):Air pressureWinds in the PBlAtmospheric instabilityHeight of the PBlSea-surface temperatureSea state: wave height and spectrumSea ievel, currents, fronts, eddiesSea salinityland temperaturelarge-scale soil moisturelarge-scale vegetation indexIce and snow characteristicsPrecipitation rate and accumulated rainfall
• Observations in the free atmosphere:Temperature profile
- Wind profile
Humidity profileUquid water, total and profileHeight of the tropopauseAerosol load and profiieOzone and other trace gases, total and profileClouds: coverage, brightness, top height, ice~iquid
• Climate related information:-Most of the parameters listed above
Radiation budget- Relevant sun/earth interactions
• Telecommunication functions:Globai acquisition of the total volume of dataBroadcasting of data to local users in real-timeData collection and locationSupport to the Search and Rescue mission
Table 3 - Reqnired capabilities from geostationary satellites (WMO, 1993a)
• Observations from geostationary orbit (primary):Ear[y detection of cyclone-genesisConvection development monitoringWinds as derived from motion of clouds or othertracersAtmospheric instability (temperature/moisture variation)Sea-surface temperature variations in coastal watersDiurnal variations of land temperatureBi-directiona[ reflectance properties of clouds and landDiurnal variation of earth radiation budget
• Observations complement[ng those from near-polar orbit:Oceanic sea-surface temperature
- Continental [and temperature
large-scale vegetation indexPrecipitation indexTemperature profileHumidity profileTota[ ozoneClouds: coverage, brightness, top heightRadiation budget
• Telecommunication functions:Broadcasting of data to loca[ users in near-real-timeData collection available all time (for alert service)Meteorologica[ data distributionContinuous support to Search and Rescue mission

68 CURRENT OPERATIONAL APPLICATIONS OF REMOTE SENSING IN HYDROLOGY
Table 4 _ Observing missions and their corresponding objectives, observation requirements andtypical instrumentation (WMO, 1993a)
1. THE MULTI-PURPOSE IMAGERY MISSION
The objectives' of this mission are (the term "inference" indicates that additionai processing is needed to get the information):
direct observation of cloud patternsinference ofcloud propertiesinference of precipitation rate and indexes
inference of land and sea-surface temperaturesinference of vegetation index and soil moisturedirect observation of ice and snow cover
inference of ice and snow parametersinference of c1oud~motionwinds
Inference of atmospheric instabiiity
The observation requirements to allow for these applications to be implemented are as follows:
spectral bands: atmospheric windows and specific absorption bands (particularly for water-vapour)in the visible (VIS), infrared (IR) and microwave
geometrical resoiution: 0.5 to 5 km (meteorology, oceanography, ice), 10 to 50 km (climatology)radiometric accuracy: signal-to-noise (SIN) ~ 10 at 1% albedo (short-waves), noise equivalent delta temperature(NED1) = 0.1 Kat 300 K (long-waves)spectral channels: 3-5 channels in VIS/NIR, 3-10 channels in IR, 4-8 channels In microwaverepeat cycle: 10-30 min (geostationary), 6 hours (polar)
Typical existing or proposed instruments to fulfil the mission are:
AVHRR, MODIS, for medium-resolution VIS/IHMIMR, for microwave imageryImagers from all geostationary satellites
2. THE ATMOSPHERIC SOUNDING MISSION
The objectives of this mission are mainly driven by operational meteorology. They are:vertical temperature profile
vertical humidity profilevertical wind profilelandwater (total and possibly profile)
atmospheric discontinuities (height of PBL and tropopause). It is understood that all of these parameters need intensive
processing for extraction and require support from the imagery mission and other-than-satellite information.
The observation requirements to allow for these applications to be implemented are as follows:spectral bands: absorption bands of CO2, O2, water vapour and nearby atmospheric windows
in IR and microwave; selected VIS/NIR and IR lines exploited in an active mode (L1DAR)horizontal resolution: 50 km global, 25 km local
vertical resolution: for profiles 1 km low-medium troposphere, 2 km medium-high troposphere,3 km above the troposphere; for discontinuities 100 m PBL, t km tropopause
spectral channels: 20 to 1000s channels in IR, 10 to 20 channels in microwave,2-3 channel L1DAR in VIS/NIR, 1 channel Doppler L1DAR in IR
repeat cycle: 6 hours
Typical existing or proposed instruments to fulfil the mission are:
HIRS, MODIS for coarse vertical resolution in IRIASI, AIRS for high vertical resolution in IR
AMSU-A and AMSU-B for all-weather sounding in microwave
Space L1DARs for wind profile and atmospheric discontinuities are not planned to be flown before 2000.

APPENDIX IV
3. SEA-SURFACE OBSERVATIONS
The objectives of this mission account for meteorological, oceanographic and ciimate appiications. They are:
accurate sea-surface temperature
wind stress and vector
wave height and spectrum, sea state
sea levei, currents, fronts, eddies
chlorophyll concentration and suspended sediments
air pressureaccurate precipitation rate
The sea-surface measurement requirements for these appiications to be implemented are:
spectral bands: atmospheric windows in VIS/NIR, in TIR and in microwave;
selected microwave channels exploited in active mode (radar)
geometrical resolution: 25 km (global), 5 km (local)
spectral channels: 5-10 in VIS/NIR, 3-5 in TIR, 5-8 in passive microwave; 2-3 in active microwave
repeat cycle: 6 hours
Typical existing or proposed instruments to fulfil the mission are:
ATSR, MODiS, for VIS/NIR and IR
MIMR, for passive microwave
MERiS, SeaWIFS, aCTS, for high spectral resolution VIS/NIR
ASCAT, NSCAT, for scatterometry in active microwave
RA-2, for altimetry In active microwave
ASAR, for active microwave imagery.
There are no plans to fly instruments for air pressure or accurate precipitation rate observations on the operational or near
operational satellites. Therefore, they have not been considered in this review.
4. RADIATION BUDGET AND ATMOSPHERIC CHEMISTRY
The objectives of this mission are driven by climatological and environmental monitoring and study. They are:
short-wave components of the Earth radiation budget
long-wave components of the Earth radiation budget
aerosol load and profile
accurate water vapour profile in high troposphere
greenhouse trace gases (total and rough profile)
ozone total and profile
stratospheric trace gases active on the ozone life cycle
tropospheric trace gases hazardous to humans and bio-masses
solar-terrestrial interactions
The observation requirements to allow for these applications to be implemented are as follows:
broad-band radiometry, accurately caiibrated, of all significant bands for energy budget: ultraviolet (UV),
VIS, near, thermal and far IR
scanning modes allowing multi-viewing angles to account for bi-directional reflectance properties and polarization
high-resolution spectroscopy across all fields of Uv, VIS, IR and sub-millimetre waves;
nadir-scanning for total-column observation and tropospheric profiling, and limb-scanning for
high vertical resolution in the upper atmosphere, also exploiting sun and star occultation
multi-platform observation (Including geostationary satellites) to account for diurnal variations
monitoring of solar particles and space environment
Typical existing or proposed instruments to fulfil the mission are:
ERBE, SCARAB, CERES, for broad-band UVNIS/IR
MERIS, POLDER, MISR, for reflectance properties
SBUV, GaME, TOMS, SCIAMACHY, for nadir-viewing UVNlS/NIR
GOMOS, SAGE, SCHIMACHY, ILAS, for limb-viewing UVNlS/NIR
IASI, AIRS, IMG, MOPITT, for nadir-viewing IR spectroscopy
MIPAS, ILAS, for iimb-viewing IR spectroscopy
SEM, for space environment monitoring
69

70 CURRENT OPERATIONAL APPLICATIONS OF REMOTE SENSING IN HYDROLOGY
5. HIGH-RESOLUTION IMAGERY
The objective of this mission, limited to certain fields of WMO interest is, in general, to complement the multi-purpose imagerymission by more accurate observation of surtace details on specific sites critical for global climate monitoring and study. Some of
these observations are:deforestation in tropical areas, desertificationland water, runoff, floods, coastal erosion
ice edge, thickness and type in the polar capssnow edge, depth and water equivalent in strategic basinscoastal~zone water dynamics (eddies, currents, ...j
The observation requirements to allow for these applications are generally met by systems which have been designed primarily for commercial applications (resources discovery, monitoring and management). For WMO purposes, they are:
specfral bands: VIS and NIR atmospheric windows, microwave in active mode (SAR)
horizontal resolution: 10 to 100 mspectral channels: 3-10 in VIS and NIR, 1-3 in TIR, 1-3 in active microwave (SAR) with two polarizationsrepeat cycle: one week to one month
The typical existing or proposed instruments to fulfil the mission are:lANDSAT TM, in VIS, NIR and TIRSPOT HRV, in VIS and NIR with stereo capabilityADEOS-1 VNIR, in VIS and NIREOS ASTER, in VIS, NiR and TIR with stereo capability
ENVISAT-1 ASAR, in C-band, with dual polarization
6. TELECOMMUNICATION FUNCTIONS
The objectives of this mission are:global data acquisition from all geostationary and near-polar-orbiting environmental satellites
of interest for WMO programmes
direct broadcast to local read-out stations of all data useful for operational meteorologydata collection from in situ automatic station and location of the platform if mobilemeteorological data distribution through geostationary satellites in support of the GTS
support to Search and Rescue
Most of the existing and planned systems either provide or will provide these services. The operational instrument for datacollection and location from NOM satellites is called ARGOS. The Search and Rescue support is being provided by NOMand METEOR satellites by a system called SARSAT within the framework of an international programme called COSPAS.

ACRONYMS
ACRIM Active cavity radiometer irradiance monitor ERR Extreme heavy rainfall
ACZCS Advanced coastal zone colour EMS Electromagnetic spectrum
ADEOS-! Advanced Earth Observing System (Japan) ENSO El Nino/Souther Oscillation
AIRS Advanced infrared sounder ENVISAT ESA enviroment satellite series
ALMAZ Newest Russian remote sensing satellite, means EOS Earth Observing System
"diamond" EOSAT Earth Observation Satellite Company
ALT Altimeter ERBE Earth Radiation Budget Experiment
AMI Active microwave instrument ERS Earth remote sensing satellite (ESA)
AMSU Advanced microwave sounding unit ERS-! First European remote sensing satellite
APT Low resolution polar-orbit data ERTS Earth resources satelliteARABSAT Arabian satellite ERTS-! First earth resources satellite
ARGOS Data relay and platform location system ESA European Space AgencyARMAR Airborne rain mapping radar ESCAP Economic and Social Conunission for Asia and
ASAR Advanced synthetic aperture radar the Pacific (United Nations)
ASCAT Advanced scatterometer ESTAR Electronically steered thinned array radiometer
ASTER Advanced space-borne thermal emission and ET Evapotranspiration
reflection radiometer ETM Enhanced thermatic mapper
ATSR Along-track scanning radiometer EUMETSAT European Organization for the Exploitation of
AVHRR Advanced very high resolution radiometer Meteorological Satellites
AVNIR Advanced visible and near-infrared radiometer EURISY European Association for the International Space
AWIPS Advanced weather interactive processing system Year
AXIS Atmospheric X-ray imaging spectrometer FAO Food and Agriculture Organization of the United
B4 Internally self-calibrating geostationary infrared Nations
method FEMA Federal Emergency Management Administration
CAL Computer-assisted learning (USA)
CASCADE Advanced flood warning system (UK) FFWRS Flood forecasting warning an9- response system
CAVRRR Sensor onboard FY-l FIFE First ISLSCP Field Experiment
CBS Commission for Basic Systems (WMO) FRONTIERS Forecasting rain optimized using new techniques
CD-ROM Compact disc peripheral device of interactively enhanced radar and satellite data
CERES 1\\10 broadband scanning radiometer FY-l, FY-2 Geostationary meteorological satellites (China)
CHEST Combined higher education software team (UK) GARP Global Atmospheric Research Programme
CIS Countryside information system GATE GARP Atlantic Tropical Experiment
CLAES Cryogenic limb array etalon spectrometer GCIP GEWEX Continental Scale International Project
CNES Centre national d'etudes spatiales (France) GEOSAT Geodesic satellite (USA)
COE Army Corps of Engineers (USA) GEWEX Global Energy and Water Cycle Experiment
COSMOS Russian Federation satellite GIR Geostationary imaging radar
COSPAR Committee on Space Research (ICSU) GIS Geographical Information System
COSPAS International programme which supports search GMS Geostationary meteorological satellite (Japan)
and rescue GOES, Geostationary operational environmental
CSPD Sensor onboard FY-I GOES-NEXT satellite (USA)
CZCS Coastal zone colour scanner GOME Global Ozone Monitoring Experiment (ESA)
DAD Depth-area-duration GOMOS Global ozone monitoring by occulaLion of stars
DBMS Database management system GOMS Geostationary operational meteorological
DCP Data collection platform satellite (Russian Federation)
DCS Data collection system GOS Global Observing System
DEM Digital elevation model GPS Global Positioning System
DIAL Differential absoption lidar GTS Global Telecommunication System
DMSP Defense Meteorological Satellite Program GTZ Agency for Technical Cooperation (Germany)
DORIS Dual Doppler receiver HALOE Halogen Occultation Experiment
DWOPER Dynamic wave OPERational model (NWS) HEPS High energy particle spectrometer
EARSeL European Association of Remote Sensing HERP Hydrological Emscher Radar Project
Laboratories HIRDLS Upper-atmosphere sounding instrument
ECMWF European Centre for Medium-range Weather HIRlS High-resolution infrared sounder
Forecasts HIRS High-resolution imaging spectrometer
ECSAT Executive Council Panel of Experts on Satellites HOMS Hydrological Operational Multipurpose System
(WMO) HOP Hierarchial Objective Procedure

72 CURRENT OPERATIONAL APPLICATIONS OF REMOTE SENSING IN HYDROLOGY
HR
HRDI
HRPT
HRV
HRVIR
HWHYDROSAT
HYRAD
HYREX
IASI
ICSU
lFFA
lFRB
lGBP
lHP
!LAS
lMG
lMRlNSAT
IR
IRS
IRSA
ISAMS
ISLSCP
ITE
ITUJ-ERS
J-ERS-l
KVR
LAGEOS
Landsat
LARST
LFC
LFMR
LHMA
LIDAR
LISS
LR
LRA
LRIT
MAG
MAR
MDD
MECB
MEPS
MERIS
MESSR
METEOR
METEOR
PRIRODA
METEOSAT
METOP
High-resolution geostationary dataHigh-resolution Doppler imagerHigh-resolution polar-orbit dataHigh-resolution visible imagerImproved high-resolution visible imagerSnow water equivalentHYDROlogical SATellite System
HYdrological RADar SystemHydrological Radar ExperimentAtmospheric sounder for measuring humidityprofileInternational Council for ScienceInteractive flash flood analyserInternational Frequency Registration Board(lTU)
International Geosphere-Biosphere Programme(ICSU)
International Hydrological Programme(UNESCO)
Improved limb atmospheric spectrometerInterferometric Monitor for Greenhouse GasesTOPEX microwave radiometerIndian national satellite (India)InfraredIndian remote sensing satellite (India)Institute for Remote Sensing ApplicationsImproved stratospheric and mesopheric sounderInternational Satellite Land Surface ClimatologyProjectBritish Institute of Terrestrial Ecology (UK)
International Telecommunication UnionEarth resources satellite (Japan)First Japan earth resources satelliteSatellite (Russian Federation)Laser geodynamics satelliteNASA/USA polar~orbiting earth resources satellite
Local applications of remote sensing techniquesLarge format cameraLow frequency microwave radiometerLatvian Hydrometeorology AgencyLight detection and rangingLinear imaging self scanLaser retroreflectorLaser retroreflector arrayLow rate infonnation transmissionFluxgate magnometerModernization and associated restructuringMeteorological data disseminationFuture near-polar-orbiting satellite (Brazil)Medium-energy particular spectrometerMedium resolution imaging spectrometerMultispectral electronic self-scanning radiometerPolar-orbiting weather satellite (RussianFederation)Environmental satellite (Russian Federation)
Geosynchronous weather satellite (ESA)Near-polar-orbiting meteorological satellite(ESA and EUMETSAT)
MHS
MIMR
MIPAS
MIR
MIS
MISR
MLS
MODIS
MOMS
MOPIIT
MOS
MOSAIC
MSG
MSR
MSS
MSU
MTP
MTS
MVIRI
NASA
NASDA
NDVI
NEDT
NERC
NESDIS
NEXRAD
NFS
NlMBUS-7
NIMROD
NIR
NOAA
NOAA-#
NOHRSC
NRI
N-ROSS
NSCAT
NWS
NWWRP
OCM
OCTS
OHP
OKEAN
OLS
PARAGON
PBL
PC
PDM
PEM
PERMIT
PMP
PMW
Microwave humidity sounderMultifrequency imaging microwave radiometerMichelson interferometer passive atmosphericsounderMultispectral infrared radiometerManagement information systemMulti-angle imaging spectro-radiometerMicrowave limb sounderModerate resolution imaging spectrometerModular optoelectronical multispectral scannerMeasurements of pollutants in the troposphereMaritime Observation Satellite (Japan)Mcteosat operational service for data aquisitionand interchange (EUMETSAT)
Meteosat second generationMicrowave scanning radiometerMultispectral scannerMicrowave sounding unitMeteosat Transition ProgrammeMicrowave temperature sounderGeostationary imaging radiometer to measurewindNational Aereonautics and Space Administration(USA)
National Aeronautics and Space DevelopmentAgencyNonnalized Differential Vegetation IndexNoise equivalent delta temperatureNational Environment Research Council (UK)NOAA Environmental Satellite Data andInfonnation ServiceNext generation radarNile Forecasting SystemCoastal satelliteNew scheme that replaced FRONTIERS
Near infraredNational Oceanic and AtmosphericAdministration (USA)
NOAA weather satellitesNational Operational Hydrologic RemoteSensing Center (NWS)
National Resources Institute (UK)Navy remote ocean sensing satelliteNaval scatterometerNational Weather Service (USA)North West Weather Radar ProjectOcean colour monitorOcean colour and temperature sensorOperational Hydrology Programme (WMO)
Oceanic satellite (Russian Federation)Operational linescan systemData-processing system (UK)Planetary boundary layerPersonal computerProbability distributed moistureParticle environment monitorPolar-orbiting effective rainfall monitoring interactive techniqueProbable maximum precipitationPassive microwave

111111111111111111111111111111111111111111111111

ACRONYMS 73
POEM NASA-EOS satellite SSARR Streamflow synthesis and reservoir regulation
POES Polar-orbiting operational environmental satellite SSMII Special sensor microwave/imager
POLDER Polarization and directionality of reflectances SSMIT Special sensor microwave/temperature
PRARE Precision Range and Range Rate Experiment SST Sea-surface temperature
PRIRODA Environmental satellite (Russian Federation) SSTC Specialized Satellite Applications Training Centre
PRMS Precipitation runoff modelling system SSU Stratospheric sounding unit
PROMETE Series of multimedia and multi-targeted STIKSCAT Wind microwave scatterometer
programmes SUSIM Solar-UV spectral irradiance monitorQPF Quantitative precipitation forecast SWCC Second WiJrld Climate Conference
RA Regional Association (WMO) TES Tropospheric composition instrument
RA Radar altimeter TIR Thermal infrared
RADARSAT Active and passive microwave satellite (Canada) TIROS Television and infrared observation satellite (USA)
RAINSAT Quasi-operational real-time (nowcasting) rainfall TM Thematic mapper
estimating scheme in Canada TMI Thermal multifrequency imager
RAR Real aperture radar TOGA Tropical Ocean Global Atmosphere Programme
RBV Return beam vidicom TOGA COARE TOGA Coupled Ocean-Atmosphere Response
RESURS Near-polar-orbiting earth resources satellite Experiment
(Russian Federation) TOMS Total ozone mapping spectrometer
RFFS River flow forecasting system TOPEXI Ocean Surface Topography Experiment
RIS Retroreflector in space POSEIDON (USAIFrance)
RMS Root mean square TOVS TIROS-N operational vertical sounder
RMTC Regional Meteorological Training Centre TOVSIHIRS TOVS ozone imagery(WMO) TRMM Tropical Rainfall Measuring Mission
RS Radiometric scanner TSC Thermal scarmer
RSI RADARSAT International Inc. UARS Upper atmospheric research satellite (NASA)
SAGE Stratospheric aerosol and gas experiment UK United Kingdom
SAR Synthetic aperture radar UN United Nations
SARSAT Search and rescue satellite-aided tracking UNESCO United Nations Educational, Scientific and
SBUV Solar backscatter UV radiometer Cultural Organization
S Snow cover area US, USA United States ofAmerica
SCARAB Scanner for earth's radiation budget UV Ultraviolet
SCATT Scattometer VAS VISSR atmospheric sounder
SCIAMACHY Scanning imaging absorption spectrometer for VCI Vegetation Condition Index
atmospheric cartography VHRR Very high resolution radiometer
SEASAT Earth-orbiting remote sensing satellite VIS Visible
SeaWIFS Sea-viewing wide field sensor VISSR Visible and infrared spin-scan radiometer
SEM Space environmental monitor VMS Vegetation monitoring sensor
SES Space environmental sensor VNIR Visible and near-infrared radiometer
SEVIRI Spinning enhanced visual infrared imager VTIR Visible and thermal infrared radiometer
SIR-A, SIR-B Shuttle imaging radar WARA Watershed response. analysis model
SIR-C Space Shuttle-based microwave remote sensor WEFAX Weather. facsimile (now LRIT)
SLAR Side-looking airborne radar WHYCOS World Hydrological Cycle Observing System
SMMR Scanning multichannel microwave radiometer WINTER Wind measurement in the mesosphere
SMR Scanning microwave radiometer WMO World Meteorological Organization
SIN Signal to noise ratio WRIP Wessex Radar Information Project
SOLSTICE Solar Stellar Irradiance Comparison Experiment WSR Weather surveillance radar
SPOT Systeme probatoire d' observation de la terre WV Water vapour(France) WVP Water vapour plume
SRM Snowmelt runoff model WWW World Weather Watch
SSAR Steerable synthetic aperture radar X-SAR Space Shuttle-based microwave remote sensors