Mapping Distinct Bone Marrow Niche Populations and Their ...
Upload
independentCategory
view
2download
0
Current and Future Niche of North and Central AmericanSand Flies (Diptera: Psychodidae) in Climate ChangeScenariosDavid Moo-Llanes1, Carlos N. Ibarra-Cerdena1,2, Eduardo A. Rebollar-Tellez3, Sergio Ibanez-Bernal4,
Camila Gonzalez5, Janine M. Ramsey1*
1 Centro Regional de Investigacion en Salud Publica (CRISP), Instituto Nacional de Salud Publica (INSP), Tapachula, Chiapas, Mexico, 2 Departamento de Ecologıa Humana,
Centro de Investigaciones y Estudios Avanzados del Instituto Politecnico Nacional (CINVESTAV), Merida, Yucatan, Mexico, 3 Universidad Autonoma de Nuevo Leon (UANL),
Facultad de Ciencias Biologicas, Zoologıa de Invertebrados, Cuidad Universitaria, San Nicolas de los Garzas, Nuevo Leon, Mexico, 4 Red Ambiente y Sustentabilidad,
Instituto de Ecologıa A.C. (INECOL), Veracruz, Mexico, 5 Departamento de Ciencias Biologicas, Centro de Investigaciones en Microbiologıa y Parasitologıa Tropical
(CIMPAT), Universidad de los Andes, Bogota, Colombia
Abstract
Ecological niche models are useful tools to infer potential spatial and temporal distributions in vector species and tomeasure epidemiological risk for infectious diseases such as the Leishmaniases. The ecological niche of 28 North and CentralAmerican sand fly species, including those with epidemiological relevance, can be used to analyze the vector’s ecology andits association with transmission risk, and plan integrated regional vector surveillance and control programs. In this study,we model the environmental requirements of the principal North and Central American phlebotomine species and analyzethree niche characteristics over future climate change scenarios: i) potential change in niche breadth, ii) direction andmagnitude of niche centroid shifts, iii) shifts in elevation range. Niche identity between confirmed or incriminatedLeishmania vector sand flies in Mexico, and human cases were analyzed. Niche models were constructed using sand flyoccurrence datapoints from Canada, USA, Mexico, Guatemala and Belize. Nine non-correlated bioclimatic and fourtopographic data layers were used as niche components using GARP in OpenModeller. Both B2 and A2 climate changescenarios were used with two general circulation models for each scenario (CSIRO and HadCM3), for 2020, 2050 and 2080.There was an increase in niche breadth to 2080 in both scenarios for all species with the exception of Lutzomyia vexator. Theprincipal direction of niche centroid displacement was to the northwest (64%), while the elevation range decreased greatestfor tropical, and least for broad-range species. Lutzomyia cruciata is the only epidemiologically important species with highniche identity with that of Leishmania spp. in Mexico. Continued landscape modification in future climate change willprovide an increased opportunity for the geographic expansion of NCA sand flys’ ENM and human exposure to vectors ofLeishmaniases.
Citation: Moo-Llanes D, Ibarra-Cerdena CN, Rebollar-Tellez EA, Ibanez-Bernal S, Gonzalez C, et al. (2013) Current and Future Niche of North and Central AmericanSand Flies (Diptera: Psychodidae) in Climate Change Scenarios. PLoS Negl Trop Dis 7(9): e2421. doi:10.1371/journal.pntd.0002421
Editor: Shaden Kamhawi, National Institutes of Health, United States of America
Received February 5, 2013; Accepted July 29, 2013; Published September 19, 2013
Copyright: � 2013 Moo-Llanes et al. This is an open-access article distributed under the terms of the Creative Commons Attribution License, which permitsunrestricted use, distribution, and reproduction in any medium, provided the original author and source are credited.
Funding: We thank the Consejo Nacional de Ciencia y Tecnologıa (CONACYT) for a scholarship to DML (2009–2011). The project was financed partially by a grantfrom CONACYT-SEMARNAT #108158 to JMR (Instituto Nacional de Salud Publica). The funders had no role in study design, data collection and analysis, decisionto publish, or preparation of the manuscript.
Competing Interests: The authors have declared that no competing interests exist.
* E-mail: [email protected]
Introduction
Leishmaniases are an increasingly important disease group
worldwide, based on case numbers, geographic expansion,
socioeconomic implications, psychological impact, and immuno-
suppression due to HIV infection which re-activates Leishmania
spp. patency [1]. There are four main clinical manifestations of
Leishmaniases: localized cutaneous leishmaniases (LCL), diffuse
cutaneous leishmaniases, mucocutaneous leishmaniases and vis-
ceral leishmaniases (VL); the first (LCL) and last (VL) cause the
greatest disease burden and mortality, respectively, for the disease
group [2].
Leishmania spp. are transmitted by female sand flies of the genus
Lutzomyia in the New World [2,3]. In North and Central America
(NCA) included in the North American tectonic plate which
extends to southern Guatemala, 62 species of sand flies have been
recorded [3–5], of which nine have been confirmed or incrimi-
nated as vectors of Leishmania [6–9]. The sand flies Lutzomyia
longipalpis and Lutzomyia evansi are confirmed primary VL vectors in
several countries [2,10], whereas Lutzomyia olmeca olmeca is a
confirmed vector of LCL in Mexico [6]. Other sand fly species,
such as Lutzomyia anthophora [8], Lutzomyia cruciata [9,11], Lutzomyia
diabolica [7], Lutzomyia ovallesi [12], Lutzomyia panamensis [9],
Lutzomyia shannoni [7,9], and Lutzomyia ylephiletor [9,13], however,
have been found naturally infected or experimentally infected with
Leishmania spp. [11]. Four species of Leishmania have been isolated
in NCA, and are responsible for all human and canine clinical
manifestations: Leishmania mexicana, Leishmania braziliensis, Leishmania
panamensis and Leishmania infantum chagasi [2,6,14]. Clinical symp-
toms depend on the host species, its immune-competence, parasite
species or strain, in addition to other as yet unidentified genetic
determinants [15].
PLOS Neglected Tropical Diseases | www.plosntds.org 1 September 2013 | Volume 7 | Issue 9 | e2421
Despite early studies on the taxonomy and geographic
distribution of sand flies in NCA, knowledge regarding the
biology, distribution, and ecology of new collections and species
continues to be registered from only a few regions [16].
Knowledge of current and potential sand fly distributions are
important to predict the impact of environmental modification,
the expansion of human settlements and migration, and climate
change (CC) or its variation on parasite and vector population
dynamics. Hence, there is a need for alternative tools to analyze
species’ distributions and potential sand fly dispersal areas [17,18].
The choice and use of prevention strategies in risk areas for all
Leishmaniases will depend on current and potential distributions
of epidemiologically relevant species (ERS) [19].
Generally, macroclimatic variables influence species distribu-
tions at coarse scales, topographic variables at regional scales, and
land use and biotic interactions at finer scales [20]. Whereas land
use and biotic interactions are more related to demographic
dynamics, macroclimatic variables determine the distributional
limits while topography delineates physical barriers for dispersal
[21,22]. Therefore, species’ geographic range shifts are predicted
in the forthcoming decades, as a result of the accelerated rate of
climate change [23] which reduces niche suitability in current
locations, while offering new suitable colonization sites [24]. The
change of at least two important attributes of a species’ ecological
niche, the niche breadth (the expressed geographic coverage of
the abiotic niche related to the available geographic space) and the
niche’s geographic centroid (the geometric central point of the
specie’s geographic range which indicates the latitudinal mid-point
of the range) would dramatically affect the geographic epidemi-
ology of Leishmaniases in North America (i.e. the emergence of
new regions where transmission cycles could be established due to
the convergence of mammal hosts, parasite and vectors, and
human population exposed to these vectors).
Ecological niche modeling (ENM) has already been used to
project the geographic distribution potential of epidemiologically
relevant Old World sand fly species: Phlebotomus papatasi [25],
Phlebotomus orientalis, Phlebotomus martini [26], and Phlebotomus
alexandri [25]. ENM have also been generated for a few New
World, such as Lutzomyia whitmani, Lutzomyia intermedia and
Lutzomyia migonei [17], and a few NCA species [16,18]. Multiple
abiotic and biotic factors have been associated with NCA sand fly
species’ distributions, in particular precipitation, temperature,
altitude, latitude, physical barriers, and host distributions and
abundance [27,28]. While certain sand fly species exhibit local
extinctions, others are predicted to adapt successfully and indeed
to increase their relative abundance in modified habitats [29]. All
of these factors also affect the spatial and temporal distribution of
vectors and reservoirs, which in turn affect the epidemiology and
dynamics of pathogen transmission to the human population [30].
Analysis of the impact of climate variability on Leishmaniases has
focused principally on vector distributional changes due to El Nino
[17,18,31], or using climate simulations [32].
All tropical and temperate NCA species from Guatemala and
Belize to Canada are modeled together in this study, and niche
characteristics as well as epidemiological associations of relevant
species are analyzed in two contrasting CC scenarios. We have
focused on analyzing potential change in species’ geographic
ranges as predicted by macroclimatic changes at the coarse-grain
level, since these provide greater model consistency and accuracy
for climate circulation models and their bioclimatic variables [33].
No reliable data layers for future land use changes are available to
be incorporated into the niche models, although we use the
differential between climate change scenarios to predict the impact
of local scale habitat changes.
Methods
Study areaThe study area for model construction and projection includes
Canada, USA, Mexico, Guatemala and Belize, limited by
14.07uN, 58.23uN and 2136.15uW, 256.29uW. The region was
divided into 7,536,074 pixels at a resolution of 30 arc-seconds
(0.008333u<1 km) for latitude and longitude. Ecological region
categories were assigned using the World Wildlife Fund (WWF)
shape files based en Terrestrial Eco-regions of the World [34].
Sand fly databaseA database was constructed from collections reported in
published scientific literature, entomological collections housed
in several academic institutions in Mexico (Universidad Autonoma
de Yucatan (UADY), El Colegio de la Frontera Sur (ECOSUR),
and Universidad Autonoma de Nuevo Leon (UANL)), the
Instituto Nacional de Diagnostico y Referencia Epidemiologica
(InDRE), and author’s unpublished collections (Table S1). The
database included 1,478 occurrence data points for 28 sand fly
species with $10 records in the NCA region: Belize (N = 230),
Canada (N = 2), USA (N = 208), Guatemala (N = 42) and Mexico
(N = 996). In order to analyze niche shift trends, all species were
assigned to one of three ecological region categories: tropical
(moist and dry forest, n = 22; 1,306 data points), temperate
(desert, grasslands, steppe, savanna, prairies, mountains forest,
scrubland, pine forest, conifer forest, swamps, mangroves and
mezquital, n = 4; 103 data points) and broad-range (species in both
regions; n = 2; 69 data points) (Table 1).
Ecological niche models (ENM)Thirteen environmental layers were used for the construction of
ENM. Nine bioclimatic data layers (annual mean temperature,
temperature seasonality, maximum temperature of warmest
month, minimum temperature of coldest month, temperature
annual range, annual precipitation, precipitation of wettest month,
precipitation of driest quarter and precipitation seasonality) were
obtained from the Worldclim- Global Climate Data (www.
worldclim.org; last accessed Nov, 2011) at a resolution of 30 arc-
seconds [35]. These bioclimatic variables were selected from 19 by
choosing the more meaningful variables hypothesized to limit
Author Summary
The present study models the niche of the most abundantsand fly species in North and Central America, including allproven and incriminated vectors of Leishmaniases, animportant neglected tropical disease of the region. Theexpansion and elevation or centroid shifts of the species’niche are modeled for extreme (A2) and conservative (B2)climate change scenarios to 2020, 2050 and 2080. Inclimate change scenarios, models predict significant nichebreadth changes in geographic space, principally intemperate sand fly species, while elevation shifts occurprincipally in tropical, and greatest, in vector species. Nichecentroid shifts for individual species were predominatelyto the northwest, and secondarily to the northeast. Thehighest proportion of human population at-risk for contactwith a vector species was with Lutzomyia diabolica andLutzomyia shannoni. Despite the fact that Lutzomyiaolmeca olmeca is the only confirmed vector species inMexico, the present study demonstrates a significant nicheidentity between Leishmania spp. and Lutzomyia cruciata.
American Sand Flies in Climate Change Scenarios
PLOS Neglected Tropical Diseases | www.plosntds.org 2 September 2013 | Volume 7 | Issue 9 | e2421
species distribution at coarse-grain scale, after analysis of multi-
colinearity in a correlation matrix [18]. The final dataset layer
includes variables with relatively low inter-correlation (r,0.75).
Additionally, four topographic layers (aspect, slope, topographic
index and elevation) obtained from the Hydro 1k data set (Earth
Resources Observations and Science- http://eros.usgs.gov/
products/elevation/gtopo30/gtopo30.html; last accessed Dec,
2011) were also used for ENM models.
ENM based on occurrence data, bioclimatic and topographic
layers were constructed using the Genetic Algorithm for Rule-set
Prediction (GARP) and best subsets implementation [36,37] from
the OpenModeller desktop ver. 1.1.0 [38]. In general, the
procedure focuses on modeling the set of ecological conditions in
which a species can maintain populations without immigration
[39]. GARP is the preferred model for datasets which may have
heterogeneous occurrence records across a broad geographic
range. The software randomly divides occurrence points into
training data for model building (75%) and test data for model
testing (25%). One hundred replicate models were developed for
each species and a soft omission threshold of 20% of the
distribution was used for all [37].
Each ENM was evaluated using two tests: accuracy, a measure
of performance, and the AUC (area under the receiver operating
curve [ROC]), as a test of predictive ability. Both tests are based
on two types of error: commission (areas of actual absence
predicted present) and omission (areas of actual presence predicted
absent) [37]. The internal (training data) and external (test data)
accuracy was calculated using the confusion matrix, equivalent to
‘‘sensitivity’’ [a/(a+c)]. The AUC (ROC curve) was calculated
using the values of ‘‘sensitivity’’ in the y-axis and the commission
error in the x-axis, measuring the maximum inflection point where
both errors are minimized. The AUC has a range of 0.0 to 1.0
(in general, acceptable models have AUC.0.85) [18]. We used
a minimum presence threshold criterion of 90% in order to
generate a binary map (presence/absence) of each projection from
the 0–100 range of the model output. To do this, we first selected a
set of 90% of random records per species and projected them onto
the model. Then, we selected a threshold that predicted the
presence of all of the 90% datapoints and converted the values$of
that number in ‘‘1’’ (presence) and the values,of that threshold in
‘‘0’’ (absence) to get a binary map of distribution. The binary maps
were tested on training and test datasets, using a binomial test
which evaluates the success rate of correct classification of
presence data in comparison with random expectation [40].
Since there is no active epidemiological surveillance for
Leishmaniases in Mexico, we use an identity test to identify niche
overlap of Leishmania spp. (PEN) and each vector [41]. ENM were
generated for all incriminated vector species: Lu. anthophora, Lu.
cruciata, Lu. diabolica, Lu. longipalpis, Lu. olmeca olmeca, Lu. ovallesi, Lu.
panamensis, Lu. shannoni and Lu. ylephiletor. Human cases of
Leishmaniases from multiple Mexican states, Campeche (N = 8),
Chiapas (N = 161), Guerrero (N = 10), Morelos (N = 2), Oaxaca
(N = 3), Puebla (N = 4), Quintana Roo (N = 101), Tabasco (N = 15)
and Veracruz (N = 37) were used as proxy to generate the PEN. A
maximum-entropy-based algorithm, MaxEnt [42] was used to
generate all vectors and PEN ENM using topographic and
bioclimatic variables previously mentioned, since this spatially
explicit test and corresponding statistical analyses are not available
for GARP. The parameters to measure identity were the random
test percentage (75%), replicated run type (bootstrap), maximum
iterations (500), and the threshold rule (minimum training
presence), using ENMtools ver.13.2 (http://enmtools.com/, last
accessed Mar, 2012; [43]).
Climate change models and scenariosTwo climate change scenarios were used: the A2 and B2
scenarios [44]. The A2 scenario assumes a rapid increase in
human population, economy, technology, land use change,
agriculture and energy consumption, while these parameters are
more moderate in the B2 scenario. In the A2 scenario, there is an
average of 3.4uC temperature increase for the year 2099, while in
the B2 scenario, this increase would not supercede 2.4uC [33,44].
Two general circulation models were used for both scenarios:
CSIRO (CSIRO Division of Marine and Atmospheric Research,
Australia [45]) and HadCM3 (Hadley Center for Climate
Prediction and Research, England [45,46]). Both models included
four primary characteristics (atmosphere, ocean, sea ice and land)
and feature a 1% increase to 26CO2 at time of doubling. The
CSIRO model uses an increase in 1.21uC, 2.05uC and 3.07uC for
2020, 2050, and 2080, respectively. The HadCM3 model uses an
increase of 1.21uC, 2.10uC and 3.17uC for the same years [44].
Generally, the CSIRO model has better performance at a global
level [45], while the HadCM3 model was chosen according to
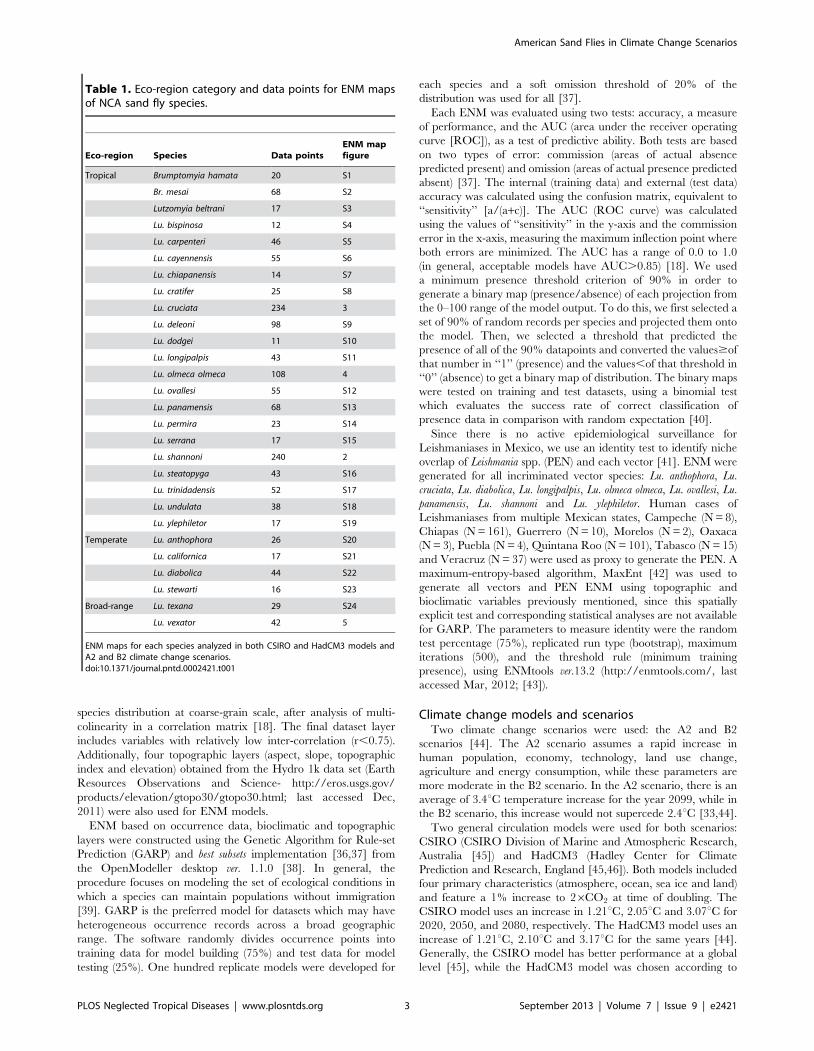
Table 1. Eco-region category and data points for ENM mapsof NCA sand fly species.
Eco-region Species Data pointsENM mapfigure
Tropical Brumptomyia hamata 20 S1
Br. mesai 68 S2
Lutzomyia beltrani 17 S3
Lu. bispinosa 12 S4
Lu. carpenteri 46 S5
Lu. cayennensis 55 S6
Lu. chiapanensis 14 S7
Lu. cratifer 25 S8
Lu. cruciata 234 3
Lu. deleoni 98 S9
Lu. dodgei 11 S10
Lu. longipalpis 43 S11
Lu. olmeca olmeca 108 4
Lu. ovallesi 55 S12
Lu. panamensis 68 S13
Lu. permira 23 S14
Lu. serrana 17 S15
Lu. shannoni 240 2
Lu. steatopyga 43 S16
Lu. trinidadensis 52 S17
Lu. undulata 38 S18
Lu. ylephiletor 17 S19
Temperate Lu. anthophora 26 S20
Lu. californica 17 S21
Lu. diabolica 44 S22
Lu. stewarti 16 S23
Broad-range Lu. texana 29 S24
Lu. vexator 42 5
ENM maps for each species analyzed in both CSIRO and HadCM3 models andA2 and B2 climate change scenarios.doi:10.1371/journal.pntd.0002421.t001
American Sand Flies in Climate Change Scenarios
PLOS Neglected Tropical Diseases | www.plosntds.org 3 September 2013 | Volume 7 | Issue 9 | e2421
performance in reproducing regional climate for Mexico, Central
America and the Caribbean [33].
Data analysesCharacteristics of the effects of CC on sand fly
ENM. Change in geographic niche breadth for each ENM
was calculated using the proportion of occupied pixels/total
number of pixels. The overlap for current, 2020, 2050, and the
2080 models was classified into three categories: 25–50%, 51–75%
and 76–100%. A shift in the niche centroid was measured using
the spatial analyst tool (Zonal.zonal geometry) of ESRI ArcMap
10.0 (www.esri.org; last accessed Sep, 2011). The centroid of each
ENM (current+future) was connected between the previous and
the azimuth of the trajectory measured for future scenarios. The
elevation range change for each ENM was also measured with the
spatial analyst tool (local.combine) from ArcMap.Hazard of human exposure to sand flies in Mexico. The
total population growth rate for Mexico was generated using
projections for fertility, mortality and international migration
[47]. The population growth rate in Mexico is projected to
increase by 30% for both 2030 and 2050. The current Mexican
population from the 2010 census was 112,336,537 inhabitants
(INEGI; www.censo2010.org.mx/; last accessed Feb, 2012). After
obtaining the ENM, population projections were calculated using
Hawth’s Analysis Tool version 3.27 (Analysis tools,Intersect
point tool) (www.spatialecology.com/htooldesc.php; last accessed
Feb, 2012).
Niche identity. We calculated the ‘‘Hellinger’s-based I’’ for all
pairwise combinations of vector-Leishmania spp. The empirical
measure of niche similarity between populations is compared to a
null distribution to test whether they are significantly different
from similarity generated from niche models constructed with data
points extracted randomly from the distribution range of the
compared species. The hypothesis of niche identity is rejected
when the empirically observed value for ‘‘Hellinger’s based I’’ is
significantly lower than the values expected from the pseudorep-
licate data sets [43,48].
Results
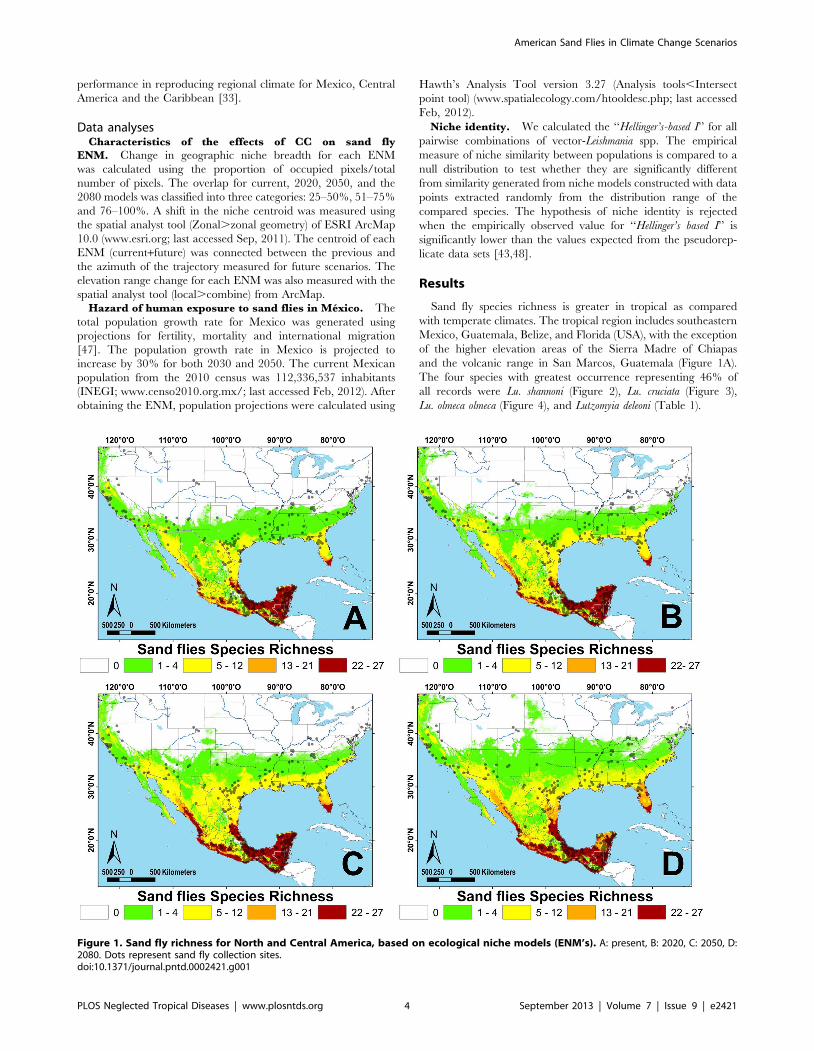
Sand fly species richness is greater in tropical as compared
with temperate climates. The tropical region includes southeastern
Mexico, Guatemala, Belize, and Florida (USA), with the exception
of the higher elevation areas of the Sierra Madre of Chiapas
and the volcanic range in San Marcos, Guatemala (Figure 1A).
The four species with greatest occurrence representing 46% of
all records were Lu. shannoni (Figure 2), Lu. cruciata (Figure 3),
Lu. olmeca olmeca (Figure 4), and Lutzomyia deleoni (Table 1).
Figure 1. Sand fly richness for North and Central America, based on ecological niche models (ENM’s). A: present, B: 2020, C: 2050, D:2080. Dots represent sand fly collection sites.doi:10.1371/journal.pntd.0002421.g001
American Sand Flies in Climate Change Scenarios
PLOS Neglected Tropical Diseases | www.plosntds.org 4 September 2013 | Volume 7 | Issue 9 | e2421
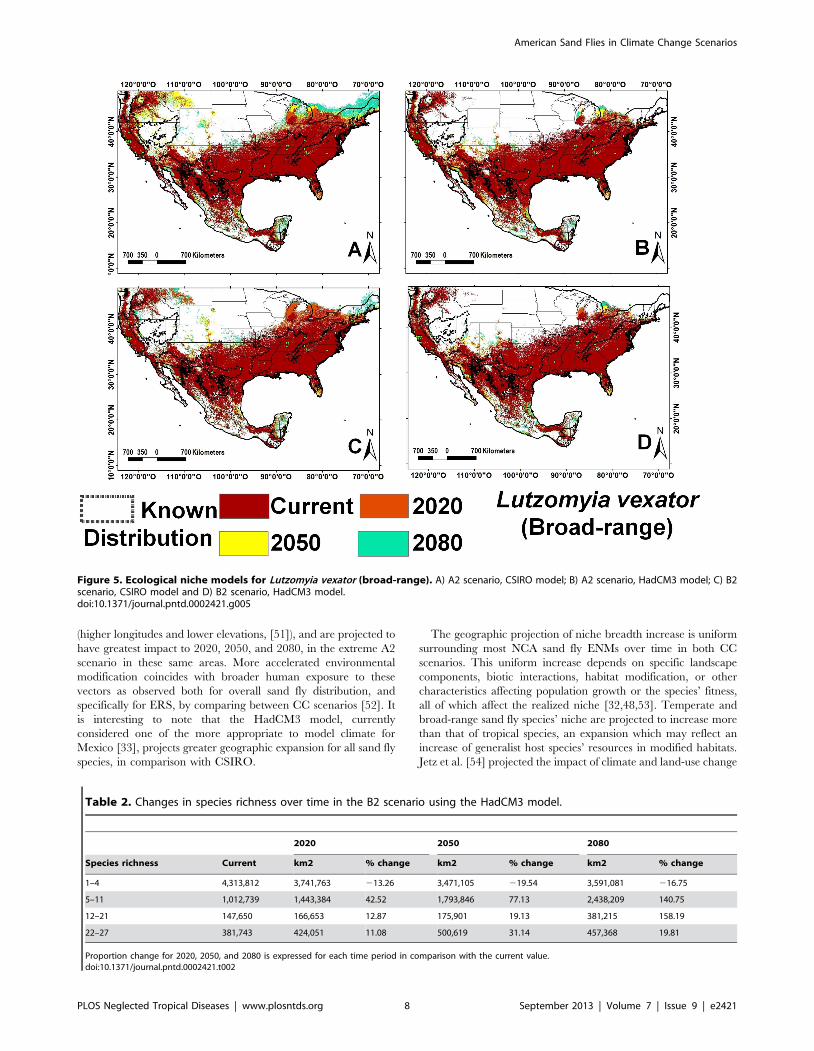
All vector ENM models had high accuracy and high AUC
values. The internal accuracy ranged from 0.83 to 1.00 (20 with an
accuracy = 1.00) and external accuracy from 0.57 to 1.00 (20 with
an accuracy = 1.00); the lowest accuracy values were calculated for
Lutzomyia vexator (Figure 5) and Lu. anthophora. The AUC ranged
from 0.80 to 0.99 (42 with an AUC higher than 0.96) for both
training and test data. The p-values for all species were highly
significant in predicting the known distribution of species (Table
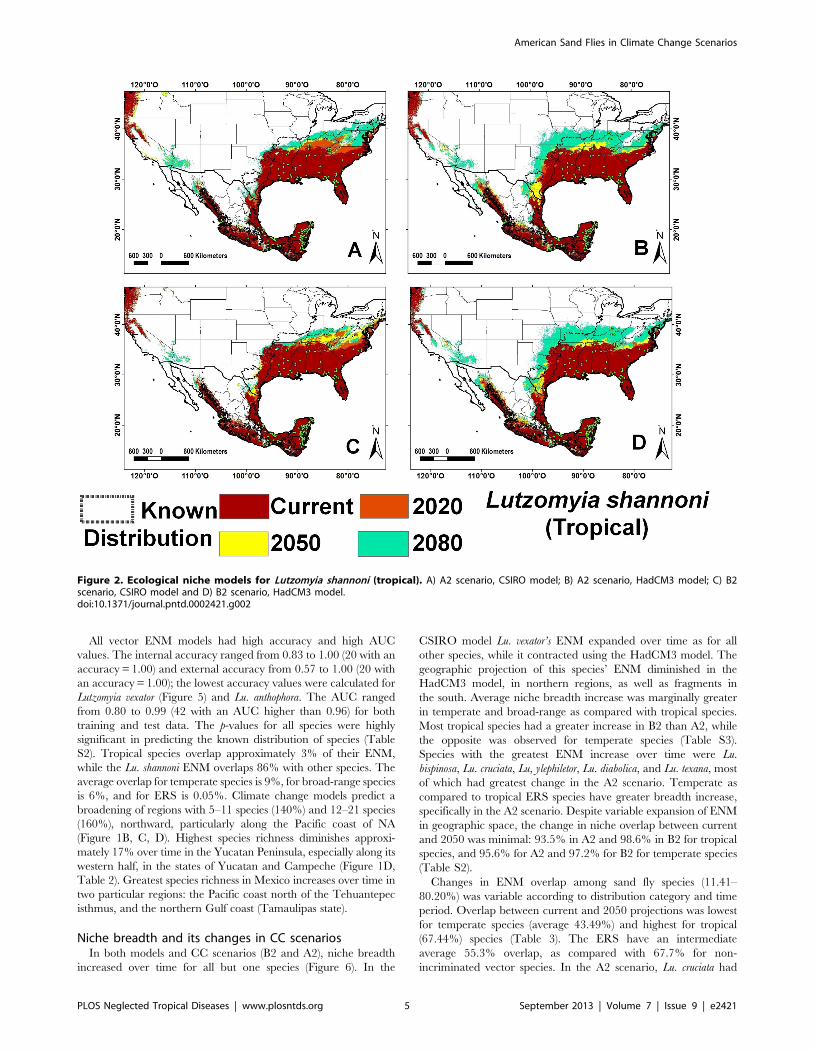
S2). Tropical species overlap approximately 3% of their ENM,
while the Lu. shannoni ENM overlaps 86% with other species. The
average overlap for temperate species is 9%, for broad-range species
is 6%, and for ERS is 0.05%. Climate change models predict a
broadening of regions with 5–11 species (140%) and 12–21 species
(160%), northward, particularly along the Pacific coast of NA
(Figure 1B, C, D). Highest species richness diminishes approxi-
mately 17% over time in the Yucatan Peninsula, especially along its
western half, in the states of Yucatan and Campeche (Figure 1D,
Table 2). Greatest species richness in Mexico increases over time in
two particular regions: the Pacific coast north of the Tehuantepec
isthmus, and the northern Gulf coast (Tamaulipas state).
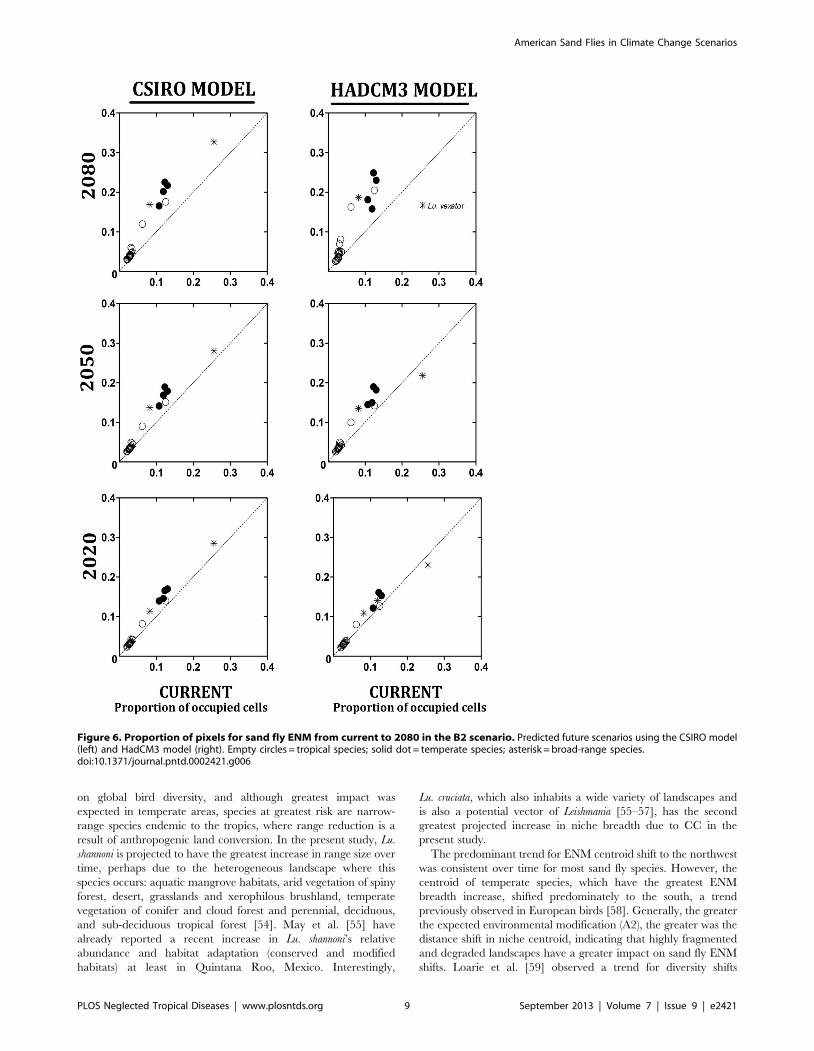
Niche breadth and its changes in CC scenariosIn both models and CC scenarios (B2 and A2), niche breadth
increased over time for all but one species (Figure 6). In the
CSIRO model Lu. vexator’s ENM expanded over time as for all
other species, while it contracted using the HadCM3 model. The
geographic projection of this species’ ENM diminished in the
HadCM3 model, in northern regions, as well as fragments in
the south. Average niche breadth increase was marginally greater
in temperate and broad-range as compared with tropical species.
Most tropical species had a greater increase in B2 than A2, while
the opposite was observed for temperate species (Table S3).
Species with the greatest ENM increase over time were Lu.
bispinosa, Lu. cruciata, Lu, ylephiletor, Lu. diabolica, and Lu. texana, most
of which had greatest change in the A2 scenario. Temperate as
compared to tropical ERS species have greater breadth increase,
specifically in the A2 scenario. Despite variable expansion of ENM
in geographic space, the change in niche overlap between current
and 2050 was minimal: 93.5% in A2 and 98.6% in B2 for tropical
species, and 95.6% for A2 and 97.2% for B2 for temperate species
(Table S2).
Changes in ENM overlap among sand fly species (11.41–
80.20%) was variable according to distribution category and time
period. Overlap between current and 2050 projections was lowest
for temperate species (average 43.49%) and highest for tropical
(67.44%) species (Table 3). The ERS have an intermediate
average 55.3% overlap, as compared with 67.7% for non-
incriminated vector species. In the A2 scenario, Lu. cruciata had
Figure 2. Ecological niche models for Lutzomyia shannoni (tropical). A) A2 scenario, CSIRO model; B) A2 scenario, HadCM3 model; C) B2scenario, CSIRO model and D) B2 scenario, HadCM3 model.doi:10.1371/journal.pntd.0002421.g002
American Sand Flies in Climate Change Scenarios
PLOS Neglected Tropical Diseases | www.plosntds.org 5 September 2013 | Volume 7 | Issue 9 | e2421
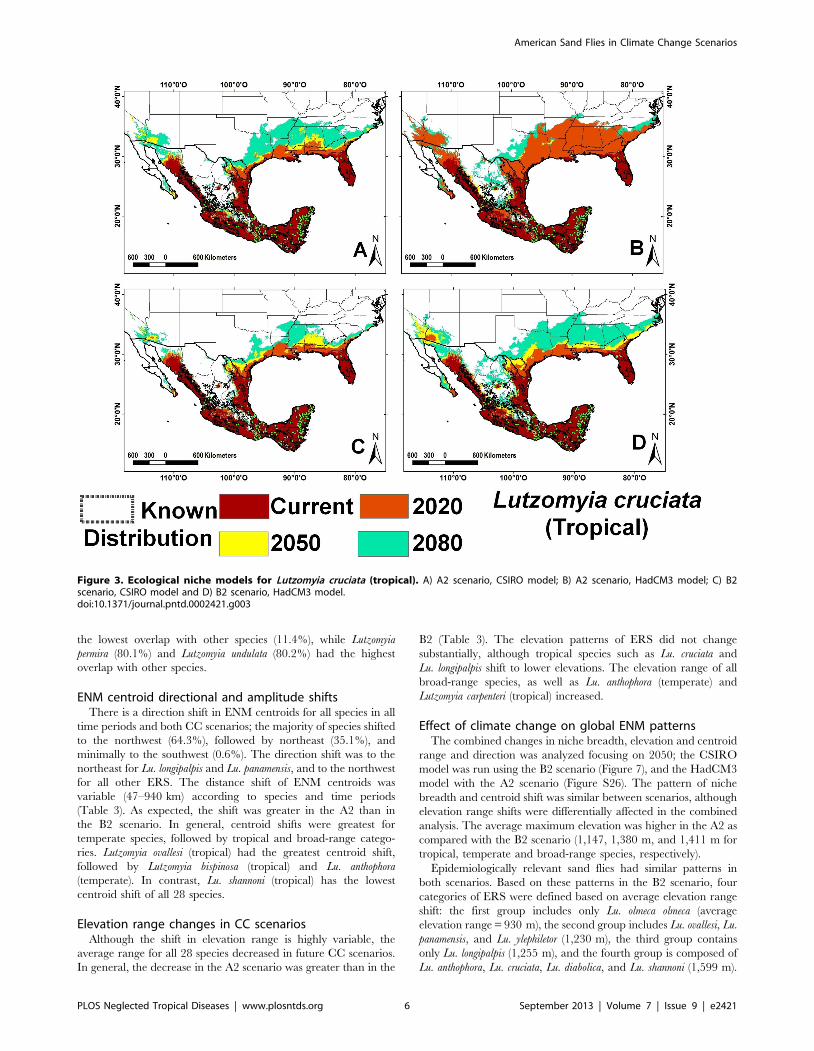
the lowest overlap with other species (11.4%), while Lutzomyia
permira (80.1%) and Lutzomyia undulata (80.2%) had the highest
overlap with other species.
ENM centroid directional and amplitude shiftsThere is a direction shift in ENM centroids for all species in all
time periods and both CC scenarios; the majority of species shifted
to the northwest (64.3%), followed by northeast (35.1%), and
minimally to the southwest (0.6%). The direction shift was to the
northeast for Lu. longipalpis and Lu. panamensis, and to the northwest
for all other ERS. The distance shift of ENM centroids was
variable (47–940 km) according to species and time periods
(Table 3). As expected, the shift was greater in the A2 than in
the B2 scenario. In general, centroid shifts were greatest for
temperate species, followed by tropical and broad-range catego-
ries. Lutzomyia ovallesi (tropical) had the greatest centroid shift,
followed by Lutzomyia bispinosa (tropical) and Lu. anthophora
(temperate). In contrast, Lu. shannoni (tropical) has the lowest
centroid shift of all 28 species.
Elevation range changes in CC scenariosAlthough the shift in elevation range is highly variable, the
average range for all 28 species decreased in future CC scenarios.
In general, the decrease in the A2 scenario was greater than in the
B2 (Table 3). The elevation patterns of ERS did not change
substantially, although tropical species such as Lu. cruciata and
Lu. longipalpis shift to lower elevations. The elevation range of all
broad-range species, as well as Lu. anthophora (temperate) and
Lutzomyia carpenteri (tropical) increased.
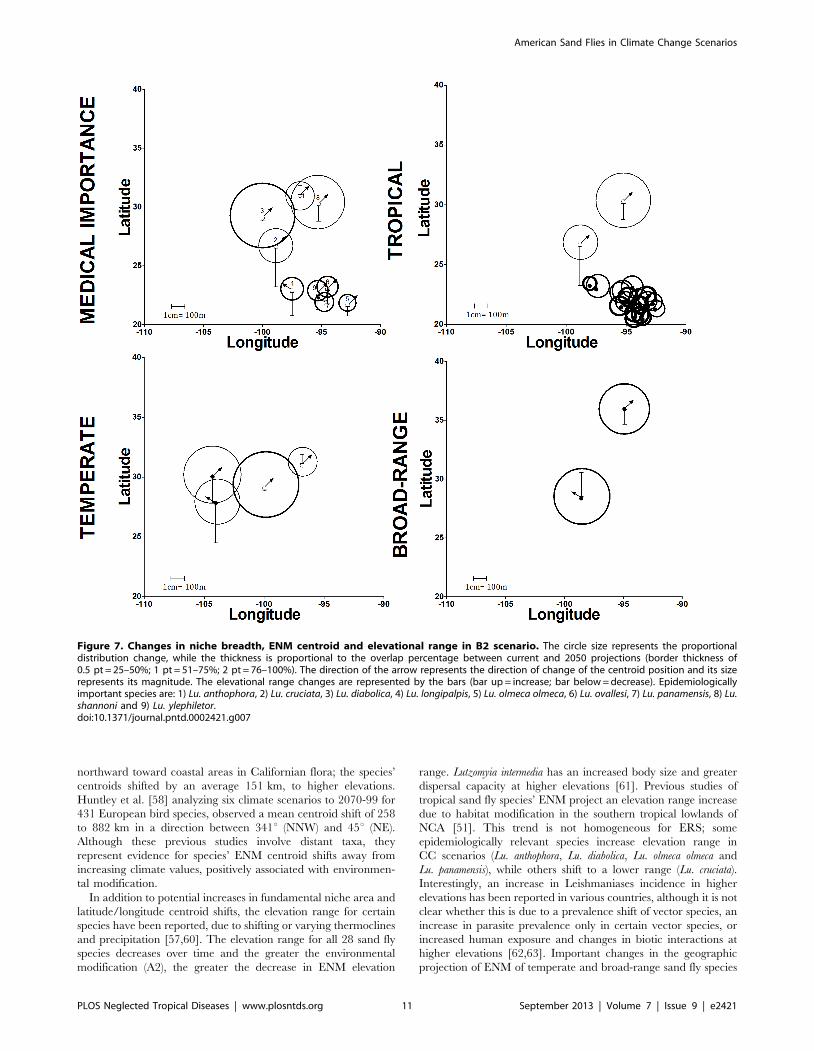
Effect of climate change on global ENM patternsThe combined changes in niche breadth, elevation and centroid
range and direction was analyzed focusing on 2050; the CSIRO
model was run using the B2 scenario (Figure 7), and the HadCM3
model with the A2 scenario (Figure S26). The pattern of niche
breadth and centroid shift was similar between scenarios, although
elevation range shifts were differentially affected in the combined
analysis. The average maximum elevation was higher in the A2 as
compared with the B2 scenario (1,147, 1,380 m, and 1,411 m for
tropical, temperate and broad-range species, respectively).
Epidemiologically relevant sand flies had similar patterns in
both scenarios. Based on these patterns in the B2 scenario, four
categories of ERS were defined based on average elevation range
shift: the first group includes only Lu. olmeca olmeca (average
elevation range = 930 m), the second group includes Lu. ovallesi, Lu.
panamensis, and Lu. ylephiletor (1,230 m), the third group contains
only Lu. longipalpis (1,255 m), and the fourth group is composed of
Lu. anthophora, Lu. cruciata, Lu. diabolica, and Lu. shannoni (1,599 m).
Figure 3. Ecological niche models for Lutzomyia cruciata (tropical). A) A2 scenario, CSIRO model; B) A2 scenario, HadCM3 model; C) B2scenario, CSIRO model and D) B2 scenario, HadCM3 model.doi:10.1371/journal.pntd.0002421.g003
American Sand Flies in Climate Change Scenarios
PLOS Neglected Tropical Diseases | www.plosntds.org 6 September 2013 | Volume 7 | Issue 9 | e2421
In the A2 scenario, the average shift for the four groups was
1,058 m, 1,156 m, 1,319 m, and 1,590 m, respectively (Table 3).
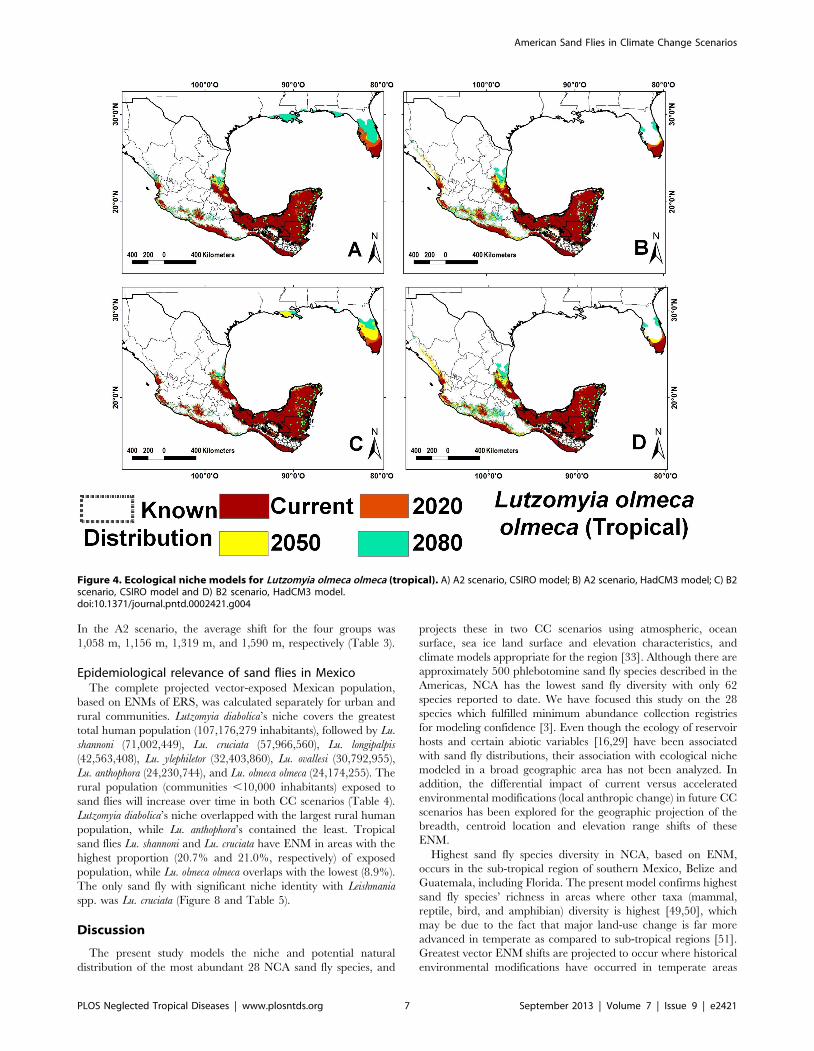
Epidemiological relevance of sand flies in MexicoThe complete projected vector-exposed Mexican population,
based on ENMs of ERS, was calculated separately for urban and
rural communities. Lutzomyia diabolica’s niche covers the greatest
total human population (107,176,279 inhabitants), followed by Lu.
shannoni (71,002,449), Lu. cruciata (57,966,560), Lu. longipalpis
(42,563,408), Lu. ylephiletor (32,403,860), Lu. ovallesi (30,792,955),
Lu. anthophora (24,230,744), and Lu. olmeca olmeca (24,174,255). The
rural population (communities ,10,000 inhabitants) exposed to
sand flies will increase over time in both CC scenarios (Table 4).
Lutzomyia diabolica’s niche overlapped with the largest rural human
population, while Lu. anthophora’s contained the least. Tropical
sand flies Lu. shannoni and Lu. cruciata have ENM in areas with the
highest proportion (20.7% and 21.0%, respectively) of exposed
population, while Lu. olmeca olmeca overlaps with the lowest (8.9%).
The only sand fly with significant niche identity with Leishmania
spp. was Lu. cruciata (Figure 8 and Table 5).
Discussion
The present study models the niche and potential natural
distribution of the most abundant 28 NCA sand fly species, and
projects these in two CC scenarios using atmospheric, ocean
surface, sea ice land surface and elevation characteristics, and
climate models appropriate for the region [33]. Although there are
approximately 500 phlebotomine sand fly species described in the
Americas, NCA has the lowest sand fly diversity with only 62
species reported to date. We have focused this study on the 28
species which fulfilled minimum abundance collection registries
for modeling confidence [3]. Even though the ecology of reservoir
hosts and certain abiotic variables [16,29] have been associated
with sand fly distributions, their association with ecological niche
modeled in a broad geographic area has not been analyzed. In
addition, the differential impact of current versus accelerated
environmental modifications (local anthropic change) in future CC
scenarios has been explored for the geographic projection of the
breadth, centroid location and elevation range shifts of these
ENM.
Highest sand fly species diversity in NCA, based on ENM,
occurs in the sub-tropical region of southern Mexico, Belize and
Guatemala, including Florida. The present model confirms highest
sand fly species’ richness in areas where other taxa (mammal,
reptile, bird, and amphibian) diversity is highest [49,50], which
may be due to the fact that major land-use change is far more
advanced in temperate as compared to sub-tropical regions [51].
Greatest vector ENM shifts are projected to occur where historical
environmental modifications have occurred in temperate areas
Figure 4. Ecological niche models for Lutzomyia olmeca olmeca (tropical). A) A2 scenario, CSIRO model; B) A2 scenario, HadCM3 model; C) B2scenario, CSIRO model and D) B2 scenario, HadCM3 model.doi:10.1371/journal.pntd.0002421.g004
American Sand Flies in Climate Change Scenarios
PLOS Neglected Tropical Diseases | www.plosntds.org 7 September 2013 | Volume 7 | Issue 9 | e2421
(higher longitudes and lower elevations, [51]), and are projected to
have greatest impact to 2020, 2050, and 2080, in the extreme A2
scenario in these same areas. More accelerated environmental
modification coincides with broader human exposure to these
vectors as observed both for overall sand fly distribution, and
specifically for ERS, by comparing between CC scenarios [52]. It
is interesting to note that the HadCM3 model, currently
considered one of the more appropriate to model climate for
Mexico [33], projects greater geographic expansion for all sand fly
species, in comparison with CSIRO.
The geographic projection of niche breadth increase is uniform
surrounding most NCA sand fly ENMs over time in both CC
scenarios. This uniform increase depends on specific landscape
components, biotic interactions, habitat modification, or other
characteristics affecting population growth or the species’ fitness,
all of which affect the realized niche [32,48,53]. Temperate and
broad-range sand fly species’ niche are projected to increase more
than that of tropical species, an expansion which may reflect an
increase of generalist host species’ resources in modified habitats.
Jetz et al. [54] projected the impact of climate and land-use change
Figure 5. Ecological niche models for Lutzomyia vexator (broad-range). A) A2 scenario, CSIRO model; B) A2 scenario, HadCM3 model; C) B2scenario, CSIRO model and D) B2 scenario, HadCM3 model.doi:10.1371/journal.pntd.0002421.g005
Table 2. Changes in species richness over time in the B2 scenario using the HadCM3 model.
2020 2050 2080
Species richness Current km2 % change km2 % change km2 % change
1–4 4,313,812 3,741,763 213.26 3,471,105 219.54 3,591,081 216.75
5–11 1,012,739 1,443,384 42.52 1,793,846 77.13 2,438,209 140.75
12–21 147,650 166,653 12.87 175,901 19.13 381,215 158.19
22–27 381,743 424,051 11.08 500,619 31.14 457,368 19.81
Proportion change for 2020, 2050, and 2080 is expressed for each time period in comparison with the current value.doi:10.1371/journal.pntd.0002421.t002
American Sand Flies in Climate Change Scenarios
PLOS Neglected Tropical Diseases | www.plosntds.org 8 September 2013 | Volume 7 | Issue 9 | e2421
on global bird diversity, and although greatest impact was
expected in temperate areas, species at greatest risk are narrow-
range species endemic to the tropics, where range reduction is a
result of anthropogenic land conversion. In the present study, Lu.
shannoni is projected to have the greatest increase in range size over
time, perhaps due to the heterogeneous landscape where this
species occurs: aquatic mangrove habitats, arid vegetation of spiny
forest, desert, grasslands and xerophilous brushland, temperate
vegetation of conifer and cloud forest and perennial, deciduous,
and sub-deciduous tropical forest [54]. May et al. [55] have
already reported a recent increase in Lu. shannoni’s relative
abundance and habitat adaptation (conserved and modified
habitats) at least in Quintana Roo, Mexico. Interestingly,
Lu. cruciata, which also inhabits a wide variety of landscapes and
is also a potential vector of Leishmania [55–57], has the second
greatest projected increase in niche breadth due to CC in the
present study.
The predominant trend for ENM centroid shift to the northwest
was consistent over time for most sand fly species. However, the
centroid of temperate species, which have the greatest ENM
breadth increase, shifted predominately to the south, a trend
previously observed in European birds [58]. Generally, the greater
the expected environmental modification (A2), the greater was the
distance shift in niche centroid, indicating that highly fragmented
and degraded landscapes have a greater impact on sand fly ENM
shifts. Loarie et al. [59] observed a trend for diversity shifts
Figure 6. Proportion of pixels for sand fly ENM from current to 2080 in the B2 scenario. Predicted future scenarios using the CSIRO model(left) and HadCM3 model (right). Empty circles = tropical species; solid dot = temperate species; asterisk = broad-range species.doi:10.1371/journal.pntd.0002421.g006
American Sand Flies in Climate Change Scenarios
PLOS Neglected Tropical Diseases | www.plosntds.org 9 September 2013 | Volume 7 | Issue 9 | e2421
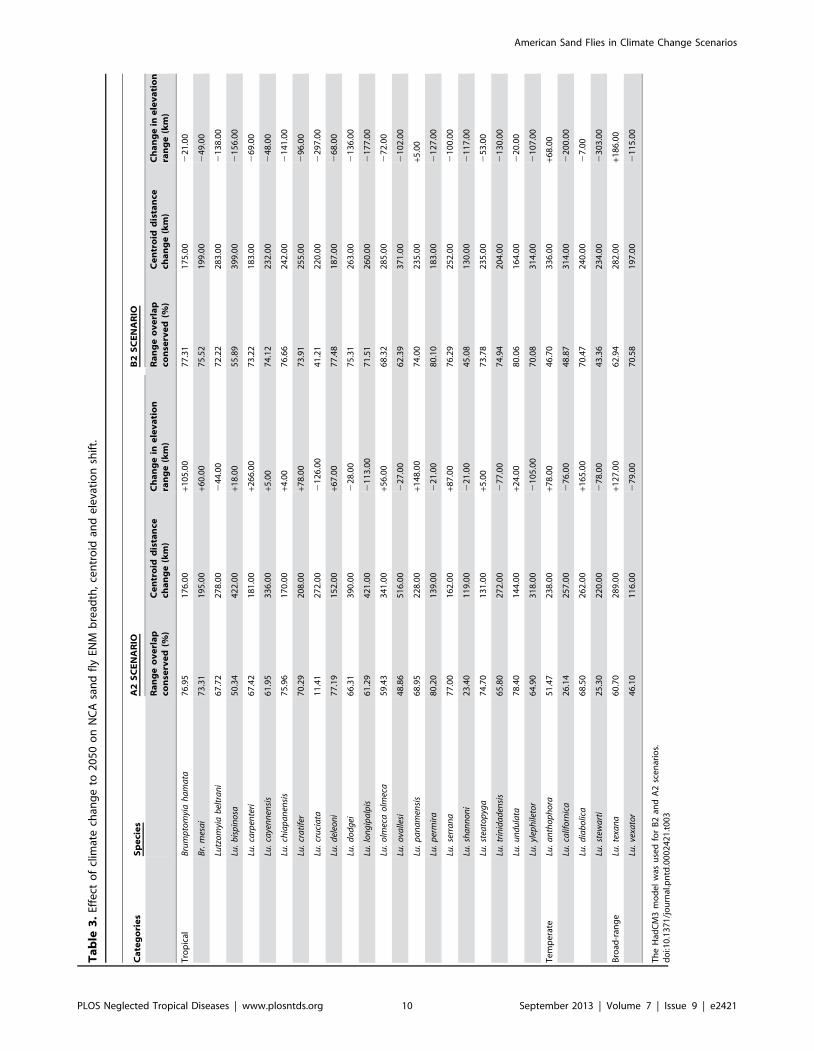
Ta
ble
3.
Effe
cto
fcl
imat
ech
ang
eto
20
50
on
NC
Asa
nd
fly
ENM
bre
adth
,ce
ntr
oid
and
ele
vati
on
shif
t.
Ca
teg
ori
es
Sp
eci
es
A2
SC
EN
AR
IOB
2S
CE
NA
RIO
Ra
ng
eo
ve
rla
pco
nse
rve
d(%
)C
en
tro
idd
ista
nce
cha
ng
e(k
m)
Ch
an
ge
ine
lev
ati
on
ran
ge
(km
)R
an
ge
ov
erl
ap
con
serv
ed
(%)
Ce
ntr
oid
dis
tan
cech
an
ge
(km
)C
ha
ng
ein
ele
va
tio
nra
ng
e(k
m)
Tro
pic
alB
rum
pto
myi
ah
am
ata
76
.95
17
6.0
0+1
05
.00
77
.31
17
5.0
02
21
.00
Br.
mes
ai
73
.31
19
5.0
0+6
0.0
07
5.5
21
99
.00
24
9.0
0
Lutz
om
yia
bel
tra
ni
67
.72
27
8.0
02
44
.00
72
.22
28
3.0
02
13
8.0
0
Lu.
bis
pin
osa
50
.34
42
2.0
0+1
8.0
05
5.8
93
99
.00
21
56
.00
Lu.
carp
ente
ri6
7.4
21
81
.00
+26
6.0
07
3.2
21
83
.00
26
9.0
0
Lu.
caye
nn
ensi
s6
1.9
53
36
.00
+5.0
07
4.1
22
32
.00
24
8.0
0
Lu.
chia
pa
nen
sis
75
.96
17
0.0
0+4
.00
76
.66
24
2.0
02
14
1.0
0
Lu.
cra
tife
r7
0.2
92
08
.00
+78
.00
73
.91
25
5.0
02
96
.00
Lu.
cru
cia
ta1
1.4
12
72
.00
21
26
.00
41
.21
22
0.0
02
29
7.0
0
Lu.
del
eon
i7
7.1
91
52
.00
+67
.00
77
.48
18
7.0
02
68
.00
Lu.
do
dg
ei6
6.3
13
90
.00
22
8.0
07
5.3
12
63
.00
21
36
.00
Lu.
lon
gip
alp
is6
1.2
94
21
.00
21
13
.00
71
.51
26
0.0
02
17
7.0
0
Lu.
olm
eca
olm
eca
59
.43
34
1.0
0+5
6.0
06
8.3
22
85
.00
27
2.0
0
Lu.
ova
llesi
48
.86
51
6.0
02
27
.00
62
.39
37
1.0
02
10
2.0
0
Lu.
pa
na
men
sis
68
.95
22
8.0
0+1
48
.00
74
.00
23
5.0
0+5
.00
Lu.
per
mir
a8
0.2
01
39
.00
22
1.0
08
0.1
01
83
.00
21
27
.00
Lu.
serr
an
a7
7.0
01
62
.00
+87
.00
76
.29
25
2.0
02
10
0.0
0
Lu.
sha
nn
on
i2
3.4
01
19
.00
22
1.0
04
5.0
81
30
.00
21
17
.00
Lu.
stea
top
yga
74
.70
13
1.0
0+5
.00
73
.78
23
5.0
02
53
.00
Lu.
trin
ida
den
sis
65
.80
27
2.0
02
77
.00
74
.94
20
4.0
02
13
0.0
0
Lu.
un
du
lata
78
.40
14
4.0
0+2
4.0
08
0.0
61
64
.00
22
0.0
0
Lu.
ylep
hile
tor
64
.90
31
8.0
02
10
5.0
07
0.0
83
14
.00
21
07
.00
Te
mp
era
teLu
.a
nth
op
ho
ra5
1.4
72
38
.00
+78
.00
46
.70
33
6.0
0+6
8.0
0
Lu.
calif
orn
ica
26
.14
25
7.0
02
76
.00
48
.87
31
4.0
02
20
0.0
0
Lu.
dia
bo
lica
68
.50
26
2.0
0+1
65
.00
70
.47
24
0.0
02
7.0
0
Lu.
stew
art
i2
5.3
02
20
.00
27
8.0
04
3.3
62
34
.00
23
03
.00
Bro
ad-r
ang
eLu
.te
xan
a6
0.7
02
89
.00
+12
7.0
06
2.9
42
82
.00
+18
6.0
0
Lu.
vexa
tor
46
.10
11
6.0
02
79
.00
70
.58
19
7.0
02
11
5.0
0
Th
eH
adC
M3
mo
de
lw
asu
sed
for
B2
and
A2
sce
nar
ios.
do
i:10
.13
71
/jo
urn
al.p
ntd
.00
02
42
1.t
00
3
American Sand Flies in Climate Change Scenarios
PLOS Neglected Tropical Diseases | www.plosntds.org 10 September 2013 | Volume 7 | Issue 9 | e2421
northward toward coastal areas in Californian flora; the species’
centroids shifted by an average 151 km, to higher elevations.
Huntley et al. [58] analyzing six climate scenarios to 2070-99 for
431 European bird species, observed a mean centroid shift of 258
to 882 km in a direction between 341u (NNW) and 45u (NE).
Although these previous studies involve distant taxa, they
represent evidence for species’ ENM centroid shifts away from
increasing climate values, positively associated with environmen-
tal modification.
In addition to potential increases in fundamental niche area and
latitude/longitude centroid shifts, the elevation range for certain
species have been reported, due to shifting or varying thermoclines
and precipitation [57,60]. The elevation range for all 28 sand fly
species decreases over time and the greater the environmental
modification (A2), the greater the decrease in ENM elevation
range. Lutzomyia intermedia has an increased body size and greater
dispersal capacity at higher elevations [61]. Previous studies of
tropical sand fly species’ ENM project an elevation range increase
due to habitat modification in the southern tropical lowlands of
NCA [51]. This trend is not homogeneous for ERS; some
epidemiologically relevant species increase elevation range in
CC scenarios (Lu. anthophora, Lu. diabolica, Lu. olmeca olmeca and
Lu. panamensis), while others shift to a lower range (Lu. cruciata).
Interestingly, an increase in Leishmaniases incidence in higher
elevations has been reported in various countries, although it is not
clear whether this is due to a prevalence shift of vector species, an
increase in parasite prevalence only in certain vector species, or
increased human exposure and changes in biotic interactions at
higher elevations [62,63]. Important changes in the geographic
projection of ENM of temperate and broad-range sand fly species
Figure 7. Changes in niche breadth, ENM centroid and elevational range in B2 scenario. The circle size represents the proportionaldistribution change, while the thickness is proportional to the overlap percentage between current and 2050 projections (border thickness of0.5 pt = 25–50%; 1 pt = 51–75%; 2 pt = 76–100%). The direction of the arrow represents the direction of change of the centroid position and its sizerepresents its magnitude. The elevational range changes are represented by the bars (bar up = increase; bar below = decrease). Epidemiologicallyimportant species are: 1) Lu. anthophora, 2) Lu. cruciata, 3) Lu. diabolica, 4) Lu. longipalpis, 5) Lu. olmeca olmeca, 6) Lu. ovallesi, 7) Lu. panamensis, 8) Lu.shannoni and 9) Lu. ylephiletor.doi:10.1371/journal.pntd.0002421.g007
American Sand Flies in Climate Change Scenarios
PLOS Neglected Tropical Diseases | www.plosntds.org 11 September 2013 | Volume 7 | Issue 9 | e2421
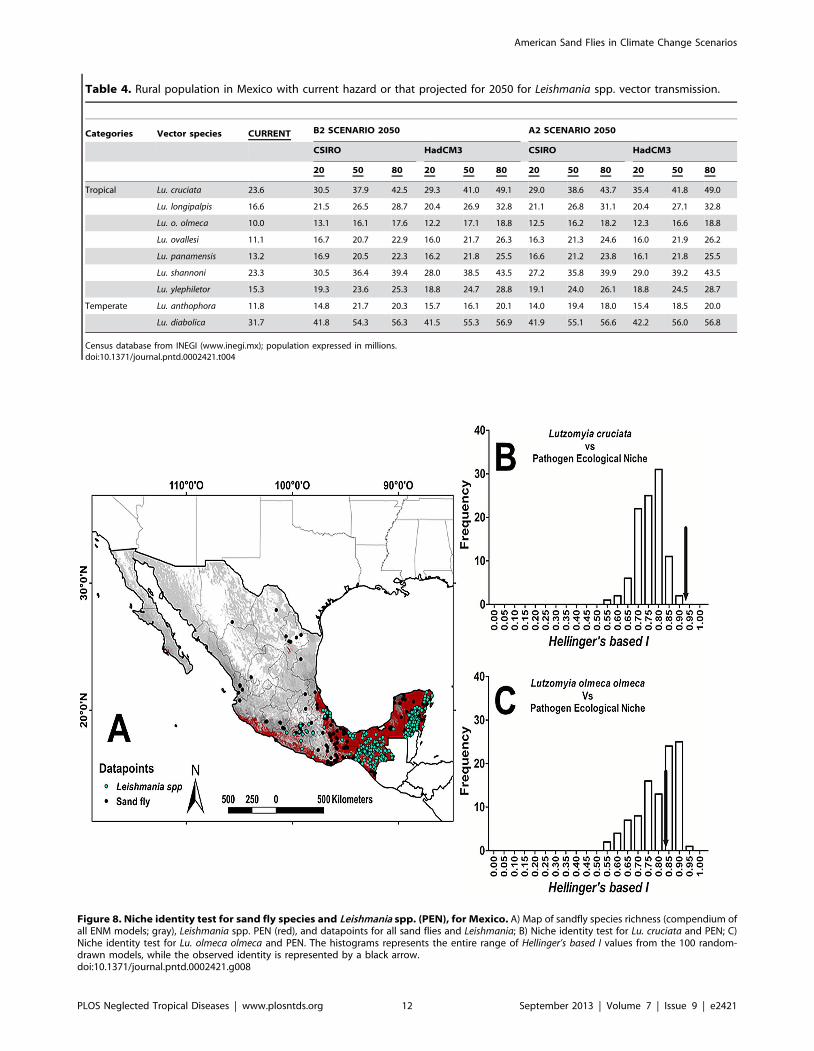
Table 4. Rural population in Mexico with current hazard or that projected for 2050 for Leishmania spp. vector transmission.
Categories Vector species CURRENT B2 SCENARIO 2050 A2 SCENARIO 2050
CSIRO HadCM3 CSIRO HadCM3
20 50 80 20 50 80 20 50 80 20 50 80
Tropical Lu. cruciata 23.6 30.5 37.9 42.5 29.3 41.0 49.1 29.0 38.6 43.7 35.4 41.8 49.0
Lu. longipalpis 16.6 21.5 26.5 28.7 20.4 26.9 32.8 21.1 26.8 31.1 20.4 27.1 32.8
Lu. o. olmeca 10.0 13.1 16.1 17.6 12.2 17.1 18.8 12.5 16.2 18.2 12.3 16.6 18.8
Lu. ovallesi 11.1 16.7 20.7 22.9 16.0 21.7 26.3 16.3 21.3 24.6 16.0 21.9 26.2
Lu. panamensis 13.2 16.9 20.5 22.3 16.2 21.8 25.5 16.6 21.2 23.8 16.1 21.8 25.5
Lu. shannoni 23.3 30.5 36.4 39.4 28.0 38.5 43.5 27.2 35.8 39.9 29.0 39.2 43.5
Lu. ylephiletor 15.3 19.3 23.6 25.3 18.8 24.7 28.8 19.1 24.0 26.1 18.8 24.5 28.7
Temperate Lu. anthophora 11.8 14.8 21.7 20.3 15.7 16.1 20.1 14.0 19.4 18.0 15.4 18.5 20.0
Lu. diabolica 31.7 41.8 54.3 56.3 41.5 55.3 56.9 41.9 55.1 56.6 42.2 56.0 56.8
Census database from INEGI (www.inegi.mx); population expressed in millions.doi:10.1371/journal.pntd.0002421.t004
Figure 8. Niche identity test for sand fly species and Leishmania spp. (PEN), for Mexico. A) Map of sandfly species richness (compendium ofall ENM models; gray), Leishmania spp. PEN (red), and datapoints for all sand flies and Leishmania; B) Niche identity test for Lu. cruciata and PEN; C)Niche identity test for Lu. olmeca olmeca and PEN. The histograms represents the entire range of Hellinger’s based I values from the 100 random-drawn models, while the observed identity is represented by a black arrow.doi:10.1371/journal.pntd.0002421.g008
American Sand Flies in Climate Change Scenarios
PLOS Neglected Tropical Diseases | www.plosntds.org 12 September 2013 | Volume 7 | Issue 9 | e2421
are also projected, although the dynamics and degree of these
projected shifts are species-specific, with ERS having the least
overall shift over time.
Niche breadth increase and centroid shifts of potential vector
species could contribute to an increase in parasite dispersal and
hence an increase in human transmission hazard. Even though
the fundamental niche is projected to expand, dispersal capacity
of the species will depend upon genetic plasticity, the availability
of dispersal routes, and host interactions [59,62]. The species
with the least shift over time in distribution centroid was Lu.
shannoni, which is the same species projected to have the greatest
increase in total niche breadth. Lutzomyia cruciata, an ERS
currently proposed to form a species complex [64], is the species
with the second largest niche breadth increase and centroid
shift.
The public health Secretariat in Mexico recognizes only 17,000
Leishmaniases cases over the last twenty-two years (CENA-
PRECE; www.dgepi.salud.gob.mx; last accessed Dec, 2012).
However, there is no effective surveillance program and very
poor knowledge by medical personnel of the diseases, and hence
the total number of officially recognized cases may be much
higher. Since rural populations are the principal group exposed to
vector contact [65], there may be as many as 32 million
inhabitants at-risk for exposure to transmission of Leishmaniases
in Mexico. Population at-risk is projected to increase to 2080 [18],
and based on significant niche identity, this increase corresponds
principally to exposure from Lu. diabolica, Lu. shannoni, and
Lu. cruciata.
Ecological niche modeling of pathogens has been applied to a
broad range of infectious and toxicity-related diseases in order to
project potential shifts to the end of the present century: dengue
fever and Aedes aegypti [66], malaria transmission in Africa [67],
plague and tularemia [68], and Loxosceles reclusa in the US [69].
Fundamental biodiversity analyses have used these same methods
to model biotic community interactions and the impact of
environmental modification, key issues affecting pathogen dispers-
al: Argentinian ants [70], Canadian butterfly species [71],
European birds [58], amphibians in Australia [72], mammals in
Spain [73], and maize races in Mexico [74]. In the present
analysis, only Lu. cruciata has significant niche identity with that of
human infection with Leishmania spp.. Gonzalez et al. [16] reported
an association between recurrent Leishmaniases transmission areas
and Lu. panamensis (91.08%) and Lu. olmeca olmeca (84.84%), based
only on geographic overlap. Additional studies will be required to
analyze landscape quality and its impact on niche overlap areas
where vector, reservoir, and parasite species interact, in order to
extend the use of niche identity analysis within fragmented
landscapes.
The present analysis of the distribution of NCA sand fly species
and their ENM shifts in climate change scenarios predicts range
shifts which may modify vector-host interactions and relation-
ships associated with habitat and future land use. Temperate sand
fly species, and therefore those with least epidemiological
importance, project the greatest ENM changes. Those changes
projected for certain epidemiologically relevant tropical species
support previous evidence for current, and also highlight future
importance of Lu. cruciata as an important vector of Leishmania
spp. in Mexico.
Supporting Information
Figure S1 Ecological niche models for Brumptomyiahamata (tropical). A) A2 scenario, CSIRO model; B) A2
scenario, HadCM3 model; C) B2 scenario, CSIRO model and D)
B2 scenario, HadCM3 model.
(TIF)
Figure S2 Ecological niche models for Brumptomyiamesai (tropical). A) A2 scenario, CSIRO model; B) A2
scenario, HadCM3 model; C) B2 scenario, CSIRO model and
D) B2 scenario, HadCM3 model.
(TIF)
Figure S3 Ecological niche models for Lutzomyia bel-trani (tropical). A) A2 scenario, CSIRO model; B) A2 scenario,
HadCM3 model; C) B2 scenario, CSIRO model and D) B2
scenario, HadCM3 model.
(TIF)
Figure S4 Ecological niche models for Lutzomyia bispi-nosa (tropical). A) A2 scenario, CSIRO model; B) A2 scenario,
HadCM3 model; C) B2 scenario, CSIRO model and D) B2
scenario, HadCM3 model.
(TIF)
Figure S5 Ecological niche models for Lutzomyia car-penteri (tropical). A) A2 scenario, CSIRO model; B) A2
scenario, HadCM3 model; C) B2 scenario, CSIRO model and D)
B2 scenario, HadCM3 model.
(TIF)
Figure S6 Ecological niche models for Lutzomyiacayennensis (tropical). A) A2 scenario, CSIRO model; B)
A2 scenario, HadCM3 model; C) B2 scenario, CSIRO model and
D) B2 scenario, HadCM3 model.
(TIF)
Figure S7 Ecological niche models for Lutzomyia chia-panensis (tropical). A) A2 scenario, CSIRO model; B) A2
scenario, HadCM3 model; C) B2 scenario, CSIRO model and D)
B2 scenario, HadCM3 model.
(TIF)
Figure S8 Ecological niche models for Lutzomyia crati-fer (tropical). A) A2 scenario, CSIRO model; B) A2 scenario,
HadCM3 model; C) B2 scenario, CSIRO model and D) B2
scenario, HadCM3 model.
(TIF)
Figure S9 Ecological niche models for Lutzomyia de-leoni (tropical). A) A2 scenario, CSIRO model; B) A2 scenario,
Table 5. Ecological niche similarity between ENM of sand flyspecies and Leishmania spp.
Vector sand flies Identity with PEN
Lu. anthophora 0.45+
Lu. cruciata 0.92*
Lu. diabolica 0.52+
Lu. longipalpis 0.83+
Lu. o. olmeca 0.82+
Lu. ovallesi 0.82+
Lu. panamensis 0.86+
Lu. shannoni 0.86+
Lu. ylephiletor 0.87+
Ecologically indistinct ENM have a significant value (p,0.05 = *), notsignificantly more distinct than expected at random (+), or when identity is notsignificant (p.0.05 = ns).doi:10.1371/journal.pntd.0002421.t005
American Sand Flies in Climate Change Scenarios
PLOS Neglected Tropical Diseases | www.plosntds.org 13 September 2013 | Volume 7 | Issue 9 | e2421
HadCM3 model; C) B2 scenario, CSIRO model and D) B2
scenario, HadCM3 model.
(TIF)
Figure S10 Ecological niche models for Lutzomyiadodgei (tropical). A) A2 scenario, CSIRO model; B) A2
scenario, HadCM3 model; C) B2 scenario, CSIRO model and D)
B2 scenario, HadCM3 model.
(TIF)
Figure S11 Ecological niche models for Lutzomyialongipalpis (tropical). A) A2 scenario, CSIRO model; B) A2
scenario, HadCM3 model; C) B2 scenario, CSIRO model and D)
B2 scenario, HadCM3 model.
(TIF)
Figure S12 Ecological niche models for Lutzomyiaovallesi (tropical). A) A2 scenario, CSIRO model; B) A2
scenario, HadCM3 model; C) B2 scenario, CSIRO model and D)
B2 scenario, HadCM3 model.
(TIF)
Figure S13 Ecological niche models for Lutzomyiapanamensis (tropical). A) A2 scenario, CSIRO model; B)
A2 scenario, HadCM3 model; C) B2 scenario, CSIRO model and
D) B2 scenario, HadCM3 model.
(TIF)
Figure S14 Ecological niche models for Lutzomyiapermira (tropical). A) A2 scenario, CSIRO model; B) A2
scenario, HadCM3 model; C) B2 scenario, CSIRO model and D)
B2 scenario, HadCM3 model.
(TIF)
Figure S15 Ecological niche models for Lutzomyiaserrana (tropical). A) A2 scenario, CSIRO model; B) A2
scenario, HadCM3 model; C) B2 scenario, CSIRO model and D)
B2 scenario, HadCM3 model.
(TIF)
Figure S16 Ecological niche models for Lutzomyiasteatopyga (tropical). A) A2 scenario, CSIRO model; B) A2
scenario, HadCM3 model; C) B2 scenario, CSIRO model and D)
B2 scenario, HadCM3 model.
(TIF)
Figure S17 Ecological niche models for Lutzomyiatrinidadensis (tropical). A) A2 scenario, CSIRO model; B)
A2 scenario, HadCM3 model; C) B2 scenario, CSIRO model and
D) B2 scenario, HadCM3 model.
(TIF)
Figure S18 Ecological niche models for Lutzomyiaundulata (tropical). A) A2 scenario, CSIRO model; B) A2
scenario, HadCM3 model; C) B2 scenario, CSIRO model and D)
B2 scenario, HadCM3 model.
(TIF)
Figure S19 Ecological niche models for Lutzomyiaylephiletor (tropical). A) A2 scenario, CSIRO model; B) A2
scenario, HadCM3 model; C) B2 scenario, CSIRO model and D)
B2 scenario, HadCM3 model.
(TIF)
Figure S20 Ecological niche models for Lutzomyiaanthophora (temperate). A) A2 scenario, CSIRO model; B)
A2 scenario, HadCM3 model; C) B2 scenario, CSIRO model and
D) B2 scenario, HadCM3 model.
(TIF)
Figure S21 Ecological niche models for Lutzomyiacalifornica (temperate). A) A2 scenario, CSIRO model; B)
A2 scenario, HadCM3 model; C) B2 scenario, CSIRO model and
D) B2 scenario, HadCM3 model.
(TIF)
Figure S22 Ecological niche models for Lutzomyiadiabolica (temperate). A) A2 scenario, CSIRO model; B) A2
scenario, HadCM3 model; C) B2 scenario, CSIRO model and D)
B2 scenario, HadCM3 model.
(TIF)
Figure S23 Ecological niche models for Lutzomyiastewarti (temperate). A) A2 scenario, CSIRO model; B) A2
scenario, HadCM3 model; C) B2 scenario, CSIRO model and D)
B2 scenario, HadCM3 model.
(TIF)
Figure S24 Ecological niche models for Lutzomyiatexana (broad-range). A) A2 scenario, CSIRO model; B) A2
scenario, HadCM3 model; C) B2 scenario, CSIRO model and D)
B2 scenario, HadCM3 model.
(TIF)
Figure S25 Proportion of pixels for sand fly ENM fromcurrent to 2080 in the A2 scenario. Predicted future scenarios
using the CSIRO model (left) and HadCM3 model (right). Empty
circles = tropical species; solid dot = temperate species; asterisk = b-
road-range species.
(TIF)
Figure S26 Changes in niche breadth, ENM centroidand elevational range in A2 scenario. The circle size
represents the proportional distribution change, while the thickness
is proportional to the overlap percentage between current and 2050
projections (border thickness of 0.5 pt = 25–50%; 1 pt = 51–75%;
2 pt = 76–100%). The direction of the arrow represents the
direction of change of the centroid position and its size represents
its magnitude. The elevational range changes are represented by the
bars (bar up = increase; bar below = decrease). Epidemiologically
important species are: 1) Lu. anthophora, 2) Lu. cruciata, 3) Lu. diabolica,
4) Lu. longipalpis, 5) Lu. olmeca olmeca, 6) Lu. ovallesi, 7) Lu. panamensis, 8)
Lu. shannoni and 9) Lu. ylephiletor.
(TIF)
Table S1 Reference points for sand fly collectionrecords used in ENM modeling of NCA species.(PDF)
Table S2 Test accuracy, AUC (ROC curve) and statis-tical significance.(PDF)
Table S3 Proportion of sand fly species’ ENM overlapand their territorial projection of change to 2050.(PDF)
Acknowledgments
The authors greatly appreciate the support of AT Peterson who provided
invaluable comments regarding the niche analysis, and Enrique Martınez-
Meyer for ideas and suggestions. We also thank Jose Francisco Pinto-Castillo
for GIS support and three anonymous reviewers for their comments.
Author Contributions
Conceived and designed the experiments: DML CNIC JMR EART.
Performed the experiments: DML CNIC JMR. Analyzed the data: DML
CNIC JMR EART. Contributed reagents/materials/analysis tools: DML
EART SIB CG JMR. Wrote the paper: DML JMR CNIC EART.
American Sand Flies in Climate Change Scenarios
PLOS Neglected Tropical Diseases | www.plosntds.org 14 September 2013 | Volume 7 | Issue 9 | e2421
References
1. World Health Organization (2010) Report of a meeting of the WHO Expert
Committee on the Control of Leishmaniases, Geneva, Switzerland. 201 pp.
2. Killick-Kendrick R (1999) The biology and control of Phlebotominae sand flies.
Clin Dermatol 17: 279–289.
3. Young DG, Duncan MA (1994) Guide to the identification and geographic
distribution of Lutzomyia sand flies in Mexico, the West Indies, Central and South
American (Diptera: Psychodidae). Mem Amer Ent Inst. Gainesville: Associated
Publishers. 881 pp.
4. Ibanez-Bernal S (2001) Notes on the Psychodidae (Diptera) of Belize:
Subfamilies Bruchomyiinae and Phlebotominae. Ann Entomol Soc Am 94:
367–385.
5. Ibanez-Bernal S, May-Uc E, Rebollar-Tellez EA (2010) Two new species of
phlebotomine sand flies (Diptera: Psychodidae, Phlebotominae) from Quintana
Roo, Mexico. Zootaxa 2448: 26–34.
6. Biagi F, de Biagi A, Beltran F (1965) Phlebotomus flaviscutellatus, transmisor natural
de Leishmania mexicana. Prensa Med Mex 30: 267–272.
7. Lawyer P, Young D, Butler J, Akin D (1987) Development of Leishmania mexicana
in Lutzomyia diabolica and Lutzomyia shannoni (Diptera: Psychodidae). J Med
Entomol 24: 347–355.
8. McHugh C, Grogl M, Kreutzer R (1993) Isolation of Leishmania mexicana
(Kinetoplastida: Trypanosomatidae) from Lutzomyia anthophora (Diptera: Psy-
chodidae) collected in Texas. J Med Entomol 30: 631–633.
9. Pech-May A, Escobedo F, Berzunza-Cruz M, Rebollar-Tellez EA (2010)
Incrimination of four sand fly previously unrecognized as vectors of Leishmania
parasites in Mexico. Med Vet Entomol 24: 150–161.
10. Travi B, Velez D, Brutus L, Segura I, Jaramillo C, et al. (1990) Lutzomyia evansi,
an alternate vector of Leishmania chagasi in a Colombian focus of visceral
leishmaniasis. Trans R Soc Trop Med Hyg 84: 676–677.
11. Williams P (1966) Experimental transmission of Leishmania mexicana by Lutzomyia
cruciata. Ann Trop Med Parasit 60:365–370.
12. Rowton E, de Mata M, Rizzo N, Porter C, Navin R (1992) Isolation of
Leishmania braziliensis from Lutzomyia ovallesi (Diptera: Psychodidae) in Guatemala.
Am J Trop Med Hyg 46: 465–468.
13. Porter C, Steurer FJ, Kreutzer RD (1987) Isolation of Leishmania mexicana
mexicana from Lutzomyia ylephiletor in Guatemala. Trans R Soc Trop Med Hyg 81:
929–930.
14. Lainson R (2010) The neotropical Leishmania species: a brief historical review of
the discovery, ecology and taxonomy. Rev Pan-Amaz Saude 1: 13–32.
15. Silveira FT, Lainson R, Corbett C (2004) Clinical and inmunopathological
spectrum of American cutaneous Leishmaniasis with special reference to the
disease in Amazonia Brazil- a review. Mem Inst Oswaldo Cruz 99: 239–251.
16. Gonzalez C, Rebollar-Tellez EA, Ibanez-Bernal S, Becker-Fauser I, Martınez-
Meyer E, et al. (2011) Current knowledge of Leishmania vector in Mexico: how
species’ geographic distributions relate to transmission areas. Am J Trop Med
Hyg 85: 839–846.
17. Peterson AT, Shaw J (2003) Lutzomyia vector for cutaneous leishmaniasis in
Southern Brazil: ecological niche models, predicted geographic distributions,
and climate change effects. Int J Parasitol 33: 919–931.
18. Gonzalez C, Wang O. Strutz S, Gonzalez-Salazar C, Sanchez-Cordero V, et al.
(2010) Climate change and risk of Leishmaniasis in North America: Predictions
from ecological niche models of vector and reservoirs species. PLoS Negl Trop
Dis 4: e585. doi:10.1371/journal.pntd.0000585.
19. Hartemink N, Vanwambeke SO, Heesterbeek H, Roger D, Morley D, et al.
(2011) Integrated mapping of establishment risk for emerging vector-borne
infections: A case study of canine Leishmaniasis in Southwest France. PLos ONE
6: e20817. doi:10.1371/journal.pone.0020817.
20. Peterson AT, Soberon J, Pearson RG, Anderson RP, Martınez-Meyer E, et al.
(2011) Ecological niches and geographic distributions. Princeton University
Press. 328 p.
21. Barve N, Barve V, Jimenez-Valverde A, Lira-Noriega A, Maher S, et al (2011)
The crucial role of the accessible area in ecological niche modeling and species
distribution modeling. Ecol Mod 222: 1810–1819.
22. Soberon J (2007) Grinnellian and Eltonian niches and geographic distributions
of species. Ecol Lett 10: 1115–1123.
23. Thuiller W (2007) Biodiversity: Climate change and the ecologist. Nature 448:
550–552.
24. Aitken SN, Yeaman S, Holliday J, Wang T, Curtis-McLane S (2008)
Adaptation, migration or extirpation: climate change outcomes for tree
populations. Evol Appl 1: 95–111.
25. Colacicco-Mayhugh M, Masuoka P, Grieco J (2010) Ecological niche model of
Phlebotomus alexandri and P. papatasi (Diptera: Psychodidae) in the Middle East.
Int J Health Geogr 9: 1–9.
26. Gebre-Michael T, Malone J. Balkew M, Ali A, Berhe N, et al. (2004) Mapping
the potential distribution of Phlebotomus martini and P. orientalis (Diptera:
Psychodidae), vectors of Kala-azar in East Africa by use of geographic
information systems. Acta Trop 90: 73–86.
27. Stephens CR, Heau JG, Gonzalez C, Ibarra-Cerdena CN, Sanchez-Cordero V,
et al. (2009) Using biotic interaction networks for prediction in Biodiversity and
Emerging Diseases. PLoS ONE 4: e5725 doi: 10.1371/journal.pone.0005725.
28. Gonzalez-Salazar C, Stephens CR (2012) Constructing ecological networks: A
tools to infer risk of transmission and dispersal of Leishmaniasis. Zoonoses Public
Hlth 59: 179–193.
29. Bejarano E, Uribe S, Rojas W, Velez I (2002) Phlebotomine sand flies (Diptera:
Psychodidae) associated with the appearance of urban Leishmaniasis in the City
of Sincelejo, Colombia. Mem Inst Oswaldo Cruz 97: 645–647.
30. Rohr J, Dobson A, Johnson P, Marm A, Paull S, et al. (2011) Frontier in climate
change-disease research. Trends Ecol Evol 26: 270–277.
31. Cardenas R, Sandoval C, Rodrıguez A, Franco C (2006) Impact of climate
variability in the occurrence of Leishmaniasis in northeastern Colombia.
Am J Trop Med Hyg 75: 273–277.
32. Chaves L, Cohen J, Pascual M, Wilson M (2008) Social exclusion modifies
climate and deforestation impacts on a vector-borne disease. PLoS Negl Trop
Dis 2: e176. doi:10.1371/journal.pntd.0000176.
33. Conde C, Estrada F, Martınez B, Sanchez O, Gay C (2011) Regional climate
change scenarios for Mexico. Atmosfera 24: 125–140.
34. Olson DM, Dinerstein E, Wikramanayake DE, Burgess ND, Powell GVN, et al.
(2001) Terrestrial ecoregions of the world: a new map of life on earth. BioScience
51: 933–938.
35. Hijmans RJ, Cameron SE, Parra JL, Jones PG, Jarvis A (2005) Very high
resolution interpolated climate surfaces for global land areas. Int J Climatol 25:
1965–1978.
36. Stockwell D, Peters D (1999) The GARP modelling systems: Problems and
solutions to automated spatial prediction. Int J Geogr Inf Syst 13: 143–158.
37. Anderson R, Lew D. Peterson AT (2003) Evaluating predictive models of
specie’s distributions: Criteria for selecting optimal models. Ecol Mod 162:
211–232.
38. de Souza M, de Giovanni R, Ferreira M, Sutton T, Brewer P, et al. (2011)
openModeller: a generic approach to specie’s potential distribution modelling.
Geoinformatica 15: 111–135.
39. Soberon J, Peterson AT (2005) Interpretation of models of fundamental
ecological niches and species’ distributional areas. Biodivers Inform 2: 1–10.
40. Raxworthy C, Martinez-Meyer E, Horning N, Nussbaum R, Schneider G, et al.
(2003) Predicting distributions of known and unknown reptile species in
Madagascar. Nature 426: 837–841.
41. Maher S, Ellis C, Gage K, Enscore R, Peterson AT (2010) Range-wide
determinants of plague distribution in North America. Am J Trop Med Hyg 83:
736–742.
42. Phillips S, Anderson R, Schapire R (2006) Maximum entropy modeling of
species geographic distributions. Ecol Mod 190: 231–259.
43. Warren D, Glor R, Turelli M (2010) ENMtools: a toolbox for comparative
studies of environmental niche models. Ecography 33: 607–611.
44. Intergovernmental Panel on Climate Change (2007) Cambio climatico 2007.
Informe de Sıntesis. Contribucion de los grupos de trabajo I, II y III al Cuarto
Informe de evaluacion del Grupo Intergubernamental de Expertos sobre el
Cambio climatico. Geneva, Switzerland. 104 pp.
45. Gordon HB, Rotstayn LD, McGregor JL, Dix MR, Kowalczyk EA, et al. (2002)
The CSIRO Mk3 Climate System Model [Electronic publication]. Aspendale:
CSIRO Atmospheric Research. (CSIRO Atmospheric Research technical
paper; no. 60). 130 pp.
46. Johns TC, Gregory JM, Ingram WJ, Johnson CE, Jones A, et al. (2003)
Anthropogenic climate change for 1860 to 2100 simulated with the HadCM3
model under updated emissions scenarios. Clim Dyn 20: 583–612.
47. Consejo Nacional de Poblacion (2005) Proyecciones de poblacion de Mexico
2005–2050. Mexico, D.F. 29 pp.
48. Warren D, Glor R, Turelli M (2008) Environmental niche equivalency
versus conservatism: quantitative approaches to niche evolution. Evolution 62:
2868–2883.
49. Rodrıguez P, Soberon J, Arita H (2003) El componente Beta de la diversidad de
mamıferos de Mexico. Acta Zool Mex 89: 241–259.
50. Trejo I, Martınez-Meyer E, Calixto-Perez E, Sanchez-Colon S, Vazquez de la
Torre R, et al. (2011) Analysis of the effects of climate change on plant
communities and mammals in Mexico. Atmosfera 24: 1–14.
51. Sala O, Stuart F, Armesto JJ, Berlow E, Bloomfield J, et al. (2000) Global
Biodiversity Scenarios for the year 2100. Science 287: 1770–1774.
DOI:10.1126/science.287.5459.1770.
52. Rousteenoja K, Carter T, Jylha K, Toumenvirta H (2003) Future climate in
World regions: An intercomparison of model-based projections for the New
IPCC Emission Scenarios. Finnish Environment Institute, Kelsinki. 83pp.
53. Pearman P, Guisan A, Broenninmann O, Randin C (2007) Niche dynamics in
space and time. Trends Ecol Evol 23: 149–158.
54. Jetz W, Wilcove D, Dobson A (2007) Projected impacts of climate change and
land-use change on the global diversity of birds. PLoS Biol 5: e157. doi:10.1371/
journal.pbio.0050157.
55. May E, Hernandez H, Rebollar-Tellez EA (2011) Distribucion de flebotomineos
(Diptera: Psychodidae) en Quintana Roo, Mexico. Acta Zool Mex 27: 273–289.
56. Rebollar-Tellez EA, Ramırez A, Andrade F (1996) A two years study on vectors
of cutaneous Leishmaniasis. Evidence for sylvatic transmission cycle in the state
of Campeche, Mexico. Mem Inst Oswaldo Cruz 91: 555–560.
American Sand Flies in Climate Change Scenarios
PLOS Neglected Tropical Diseases | www.plosntds.org 15 September 2013 | Volume 7 | Issue 9 | e2421
57. Rebollar-Tellez EA, Manrique-Saide P (2001) New distributional record of
Lutzomyia cruciata (Diptera: Psychodidae) in the state of Yucatan, Mexico.
Entomol News 112: 337–339.
58. Huntley B, Collingham Y, Willis S, Green R (2008) Potential impacts of climate
change on European breeding birds. PLoS One 3: e1439. doi:10.1371/
journal.pone.0001439.
59. Loarie S, Carter B, Hayhoe K, McMahon S, Moe R, et al. (2008) Climate
change and the future of California’s endemic flora. PLoS One 3: e2502. doi:
10.1371/journal.pone.0002502.
60. Baron S, Morilla F, Morales M, Dıaz V, Irigaray C, et al. (2011) Risk maps for
the presence and absence of Phlebotomus perniciosus in an endemic area of
Leishmaniasis in southern Spain: implications for the control of the disease.
Parasitol 138: 1234–1244.
61. Brisola C, Leuch A, Falqueto A, Brazil R, Galati E, et al. (1999) Influence of
Altitude, Latitude and season of collection (Bergmann’s Rule) on the dimensions
of Lutzomyia intermedia (Lutz & Neiva, 1912) (Diptera, Psychodidae, Phlebt-
ominae). Mem Inst Oswaldo Cruz 94: 693–700.
62. Elnaiem DE, Schorscher J, Bendall A, Obsomer V, Osman M, et al. (2003) Risk
mapping of visceral Leishmaniasis: The role of local variation in rainfall and
altitude on the presence and incidence of Kala-azar in eastern Sudan. Am J Trop
Med Hyg 68: 10–17.
63. Guernaoui S, Boumezzough A, Laamarani A (2006) Altitudinal structuring of
sand flies (Diptera: Psychodidae) in the High-Atlas mountains (Morocco) and its
relation to the risk of leishmaniasis transmission. Acta Trop 97: 346–351.
64. Pech-May A, Marina CF, Vazquez-Domınguez E, Berzunza-Cruz M, Rebollar-
Tellez EA, et al (2013) Genetic structure and divergence in populations of
Lutzomyia cruciata, a phlebotomine sand fly (Diptera: Psychodidae) vector of
Leishmania Mexicana in southeastern Mexico. Infect Gen Evol 16: 254–262.
65. Sanchez-Tejada G, Rodrıguez N, Parra C, Hernandez O, Barker D, et al. (2001)
Cutaneous leishmaniasis caused by members of Leishmania braziliensis complex inNayarit, State of Mexico. Mem Inst Oswaldo Cruz 96: 15–19.
66. Hales S, de Wet N, Maindonald J, Woodward A (2002) Potential effect of
population and climate change on global distribution of Dengue fever: anempirical model. Lancet 360: 830–834.
67. Tanser F, Sharp B, le Sueur D (2003) Potential effect of climate change onmalaria transmission in Africa. Lancet 362: 1792–1798.
68. Nakazawa Y, Williams R, Peterson AT, Mead P, Staples E, et al. (2007) Climate
change effects on Plague and Tularemia in the United States. Vector-BorneZoonotic Dis 7: 529–540.
69. Saupe E, Papes M, Selden P, Vetter R (2011) Tracking a medically importantspider: climate change, ecological niche modeling, and the Brown recluse
(Loxosceles reclusa). PLoS One 6: e17731. doi:10.1371/journal.pone.0017731.70. Roura-Pascual N, Suarez A, Gomez C, Pons P, Touyama Y, et al. (2004)
Geographical potential of Argentine ants (Linepithema himule Mays) in the face of
global climate change. Proc R Soc Lond B 271: 2527–2534.71. Peterson AT, Martınez-Meyer E, Gonzalez-Salazar C, Hall P (2004) Modeled
climate change effects on distributions of Canadian butterfly species. Can J Zool82: 851–858.
72. Kearney M, Phillips B, Tracy CR, Christian K, Betts G, et al. (2008) Modelling
species distributions without using species distributions: the cane toad inAustralia under current and future climates. Ecography 31: 423–434.
73. Morueta-Holme N, Flojgaard C, Svenning JC (2010) Climate change risks andconservation implications for a threatened small-range mammal species. PLoS
One 5: e10360. doi:10.1371/journal.pone.0010360.74. Ureta C, Martınez-Meyer E, Perales H, Alvarez-Buylla E (2012) Projecting the
effects of climate change on the distribution of maize races and their wild
relatives in Mexico. Glob Change Biol 18: 1073–1082.
American Sand Flies in Climate Change Scenarios
PLOS Neglected Tropical Diseases | www.plosntds.org 16 September 2013 | Volume 7 | Issue 9 | e2421
Copyright © 2022 FDOKUMEN