CULINARY WATER IMPACT FEE ANALYSIS (IFA) WOODS ...
16
DECEMBER 2014 CULINARY WATER IMPACT FEE ANALYSIS (IFA) WOODS CROSS CITY
-
Upload
khangminh22 -
Category
Documents
-
view
0 -
download
0
Transcript of CULINARY WATER IMPACT FEE ANALYSIS (IFA) WOODS ...

DECEMBER 2014
CULINARY WATER
IMPACT FEE ANALYSIS (IFA)
WOODS CROSS CITY

P a g e 2
CULINARY WATER IMPACT FEE ANALYSIS
WOODS CROSS CITY, UTAH DECEMBER 2014
TABLE OF CONTENTS
IMPACT FEE CERTIFICATION ..................................................................................................................................... 3 SECTION 1: EXECUTIVE SUMMARY .......................................................................................................................... 4
PROPOSED CULINARY WATER IMPACT FEE ............................................................................................................... 4 SECTION 2: GENERAL IMPACT FEE METHODOLOGY ............................................................................................ 6 SECTION 3: OVERVIEW OF SERVICE AREA, DEMAND, AND LOS ......................................................................... 8
SERVICE AREA ................................................................................................................................................................. 8 DEMAND UNITS ............................................................................................................................................................. 8 LEVEL OF SERVICE STANDARDS .................................................................................................................................... 8
SECTION 4: EXISTING FACILITIES INVENTORY ....................................................................................................... 9
EXCESS CAPACITY ......................................................................................................................................................... 9
SECTION 5: CAPITAL FACILITY ANALYSIS ............................................................................................................ 12
SYSTEM VS. PROJECT IMPROVEMENTS ........................................................................................................................ 13 FUNDING OF FUTURE FACILITIES ............................................................................................................................... 13 PROPOSED CREDITS OWED TO DEVELOPMENT ..................................................................................................... 14 EQUITY OF IMPACT FEES ............................................................................................................................................. 14 NECESSITY OF IMPACT FEES ........................................................................................................................................ 14
SECTION 6: CULINARY WATER IMPACT FEE CALCULATION .............................................................................. 15
PROPOSED CULINARY WATER IMPACT FEE ............................................................................................................. 15 CONSIDERATION OF ALL REVENUE SOURCES ......................................................................................................... 16 EXPENDITURE OF IMPACT FEES .................................................................................................................................. 16 GROWTH-DRIVEN EXTRAORDINARY COSTS.......................................................................................................... 16 SUMMARY OF TIME PRICE DIFFERENTIAL .................................................................................................................. 16

P a g e 3
CULINARY WATER IMPACT FEE ANALYSIS
WOODS CROSS CITY, UTAH DECEMBER 2014
IMPACT FEE CERTIFICATION
IFA CERTIFICATION Lewis Young Robertson & Burningham, Inc. certifies that the Impact Fee Analysis (“IFA”) prepared for culinary
water services:
1. includes only the costs of public facilities that are:
a. allowed under the Impact Fees Act; and
b. actually incurred; or
c. projected to be incurred or encumbered within six years after the day on which each impact fee
is paid;
2. does not include:
a. costs of operation and maintenance of public facilities;
b. costs for qualifying public facilities that will raise the level of service for the facilities, through
impact fees, above the level of service that is supported by existing residents;
c. an expense for overhead, unless the expense is calculated pursuant to a methodology that is
consistent with generally accepted cost accounting practices and the methodological standards
set forth by the federal Office of Management and Budget for federal grant reimbursement;
d. offsets costs with grants or other alternate sources of payment; and
3. complies in each and every relevant respect with the Impact Fees Act.
Lewis Young Robertson & Burningham, Inc. makes this certification with the following caveats:
1. All of recommendations for implementation of the IFFP made in the IFFP documents or in the IFA
documents are followed by City Staff and elected officials.
2. If all or a substantial portion of the IFFP or IFA is modified or amended by the City, this certification
is no longer valid.
3. All information provided to LYRB is assumed to be correct, complete, and accurate. This includes
information provided by the City as well as outside sources.
LEWIS YOUNG ROBERTSON & BURNINGHAM, INC.
P a g e 4
CULINARY WATER IMPACT FEE ANALYSIS
WOODS CROSS CITY, UTAH DECEMBER 2014
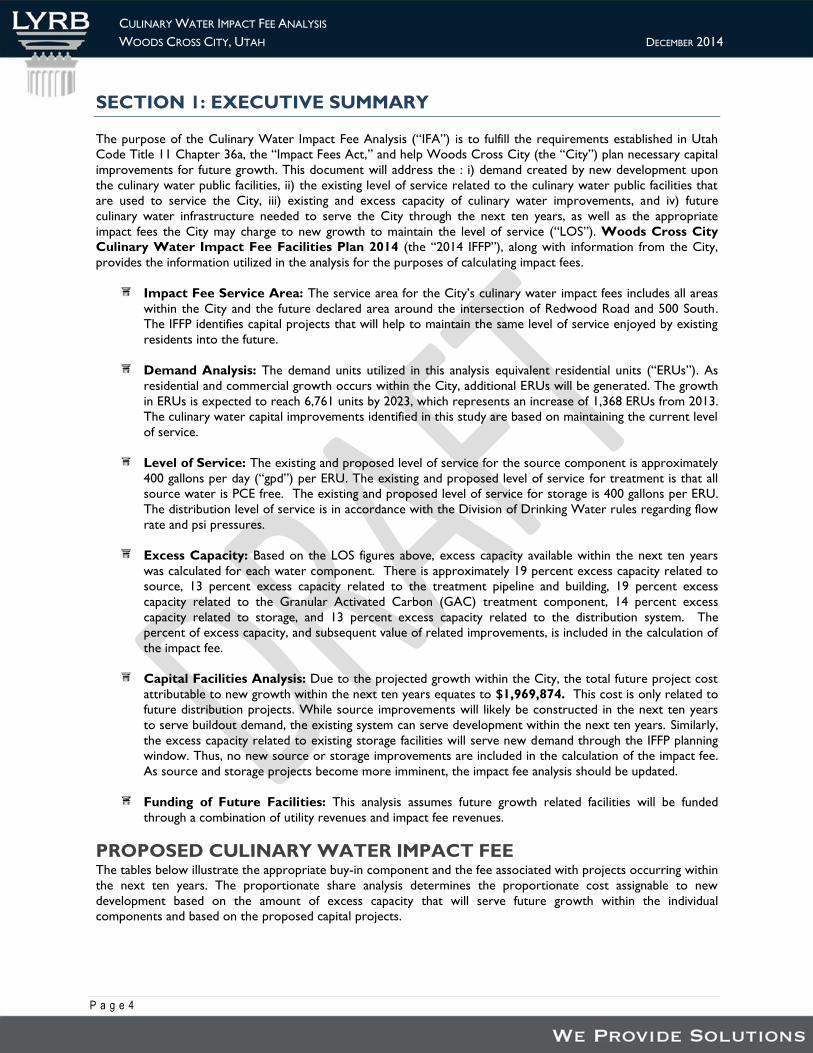
SECTION 1: EXECUTIVE SUMMARY
The purpose of the Culinary Water Impact Fee Analysis (“IFA”) is to fulfill the requirements established in Utah
Code Title 11 Chapter 36a, the “Impact Fees Act,” and help Woods Cross City (the “City”) plan necessary capital
improvements for future growth. This document will address the : i) demand created by new development upon
the culinary water public facilities, ii) the existing level of service related to the culinary water public facilities that
are used to service the City, iii) existing and excess capacity of culinary water improvements, and iv) future
culinary water infrastructure needed to serve the City through the next ten years, as well as the appropriate
impact fees the City may charge to new growth to maintain the level of service (“LOS”). Woods Cross City
Culinary Water Impact Fee Facilities Plan 2014 (the “2014 IFFP”), along with information from the City,
provides the information utilized in the analysis for the purposes of calculating impact fees.
Impact Fee Service Area: The service area for the City’s culinary water impact fees includes all areas
within the City and the future declared area around the intersection of Redwood Road and 500 South.
The IFFP identifies capital projects that will help to maintain the same level of service enjoyed by existing
residents into the future.
Demand Analysis: The demand units utilized in this analysis equivalent residential units (“ERUs”). As
residential and commercial growth occurs within the City, additional ERUs will be generated. The growth
in ERUs is expected to reach 6,761 units by 2023, which represents an increase of 1,368 ERUs from 2013.
The culinary water capital improvements identified in this study are based on maintaining the current level
of service.
Level of Service: The existing and proposed level of service for the source component is approximately
400 gallons per day (“gpd”) per ERU. The existing and proposed level of service for treatment is that all
source water is PCE free. The existing and proposed level of service for storage is 400 gallons per ERU.
The distribution level of service is in accordance with the Division of Drinking Water rules regarding flow
rate and psi pressures.
Excess Capacity: Based on the LOS figures above, excess capacity available within the next ten years
was calculated for each water component. There is approximately 19 percent excess capacity related to
source, 13 percent excess capacity related to the treatment pipeline and building, 19 percent excess
capacity related to the Granular Activated Carbon (GAC) treatment component, 14 percent excess
capacity related to storage, and 13 percent excess capacity related to the distribution system. The
percent of excess capacity, and subsequent value of related improvements, is included in the calculation of
the impact fee.
Capital Facilities Analysis: Due to the projected growth within the City, the total future project cost
attributable to new growth within the next ten years equates to $1,969,874. This cost is only related to
future distribution projects. While source improvements will likely be constructed in the next ten years
to serve buildout demand, the existing system can serve development within the next ten years. Similarly,
the excess capacity related to existing storage facilities will serve new demand through the IFFP planning
window. Thus, no new source or storage improvements are included in the calculation of the impact fee.
As source and storage projects become more imminent, the impact fee analysis should be updated.
Funding of Future Facilities: This analysis assumes future growth related facilities will be funded
through a combination of utility revenues and impact fee revenues.
PROPOSED CULINARY WATER IMPACT FEE The tables below illustrate the appropriate buy-in component and the fee associated with projects occurring within
the next ten years. The proportionate share analysis determines the proportionate cost assignable to new
development based on the amount of excess capacity that will serve future growth within the individual
components and based on the proposed capital projects.

P a g e 5
CULINARY WATER IMPACT FEE ANALYSIS
WOODS CROSS CITY, UTAH DECEMBER 2014
TABLE 1.1: IMPACT FEE PER ERU
GROWTH RELATED COSTS
WITHIN IFFP HORIZON ERUS SERVED FEE PER ERU
Source Excess Capacity $307,209 1,368 $225
Treatment Excess Capacity $671,178 1,368 $491
Storage Excess Capacity $1,134,687 1,368 $829
Distribution Excess Capacity $523,255 1,368 $382
Future Improvements
Source Future Improvements $0 1,368 $0
Storage Future Improvements $0 1,368 $0
Distribution Future Improvements $1,969,874 1,368 $1,440
Other
Professional Expense $3,788 1,368 $3
Impact Fee Fund Balance1 ($79,517) 1,368 ($58)
Total $4,530,475
$3,312
TABLE 1.2: IMPACT FEE SCHEDULE
LAND USE TYPE ERU MULTIPLIER IMPACT FEE PER UNIT EXISTING IMPACT FEE % CHANGE
Residential (per Unit)2
Single Family 1.00 $3,312 $2,123 56%
Multi-Family 0.75 $2,484 $2,123 17%
Land Use Type ERU Multiplier Impact Fee per
Meter Size
Existing Impact
Fee % Change
Commercial (Meter Size)
3/4 1.00 $3,312 $2,123 56%
1 2.50 $8,281 $5,309 56%
1 1/2 5.00 $16,558 $10,615 56%
2 8.00 $26,493 $16,984 56%
3 15.00 $49,674 $31,845 56%
4 25.00 $82,789 $53,087 56%
NON-STANDARD CULINARY WATER IMPACT FEES The City reserves the right under the Impact Fees Act to assess an adjusted fee that more closely matches the
true impact that the land use will have upon public facilities.3 This adjustment could result in a lower impact fee if
the City determines that a particular user may create a different impact than what is standard for its land use.
1 As of September 30, 2014, the impact fee fund balance was $79,517. This is expected to be spent on projects listed in the IFFP and is thus subtracted from the calculation of the impact fee. 2 The 2014 IFFP details the difference in water usage between a single family and multi-family unit. The difference in multi-family usage is determined to be 75% of single-family water usage. Thus the multiplier used to calculate the impact fee for multi-family units is 0.75. Specific usage data is described in Section 2.3 and Appendix C of the 2014 IFFP. 3 11-36a-402(1)(c)

P a g e 6
CULINARY WATER IMPACT FEE ANALYSIS
WOODS CROSS CITY, UTAH DECEMBER 2014
SECTION 2: GENERAL IMPACT FEE METHODOLOGY
The purpose of this study is to fulfill the requirements of the Impact Fees Act
regarding the establishment of an IFFP and IFA. The IFFP is designed to identify the
demands placed upon the City’s existing facilities by future development and evaluate
how these demands will be met by the City. The IFFP is also intended to outline the
improvements which are intended to be funded by impact fees. The IFA is designed
to proportionately allocate the cost of the new facilities and any excess capacity to
new development, while ensuring that all methods of financing are considered. Each
component must consider the historic level of service provided to existing
development and ensure that impact fees are not used to raise that level of service.
The following elements are important considerations when completing an IFFP and
IFA.
DEMAND ANALYSIS The demand analysis serves as the foundation for the IFFP. This element focuses on a
specific demand unit related to each public service – the existing demand on public
facilities and the future demand as a result of new development that will impact
public facilities.
LEVEL OF SERVICE ANALYSIS The demand placed upon existing public facilities by existing development is known
as the existing “Level of Service” (“LOS”). Through the inventory of existing
facilities, combined with the growth assumptions, this analysis identifies the level of
service which is provided to a community’s existing residents and ensures that future
facilities maintain these standards. Any excess capacity identified within existing
facilities can be apportioned to new development. Any demand generated from new
development that overburdens the existing system beyond the existing capacity
justifies the construction of new facilities.
EXISTING FACILITY INVENTORY In order to quantify the demands placed upon existing public facilities by new
development activity, to the extent possible the Impact Fee Facilities Plan provides
an inventory of the City’s existing system facilities. The inventory valuation should
include the original construction cost and estimated useful life of each facility. The
inventory of existing facilities is important to properly determine the excess capacity
of existing facilities and the utilization of excess capacity by new development.
FUTURE CAPITAL FACILITIES ANALYSIS The demand analysis, existing facility inventory and LOS analysis allow for the
development of a list of capital projects necessary to serve new growth and to
maintain the existing system. This list includes any excess capacity of existing facilities
as well as future system improvements necessary to maintain the level of service.
Any demand generated from new development that overburdens the existing system
beyond the existing capacity justifies the construction of new facilities.
FINANCING STRATEGY This analysis must also include a consideration of all revenue sources, including
impact fees, future debt costs, alternative funding sources and the dedication of
system improvements, which may be used to finance system improvements.4 In
conjunction with this revenue analysis, there must be a determination that impact
fees are necessary to achieve an equitable allocation of the costs of the new facilities
between the new and existing users.5
4 11-36a-302(2) 5 11-36a-302(3)
FIGURE 2.1: IMPACT FEE
METHODOLOGY
DEMAND ANALYSIS
LOS ANALYSIS
EXISTING FACILITIES
ANALYSIS
FUTURE FACILITIES
ANALYSIS
FINANCING STRATEGY
PROPORTIONATE SHARE
ANALYSIS

P a g e 7
CULINARY WATER IMPACT FEE ANALYSIS
WOODS CROSS CITY, UTAH DECEMBER 2014
PROPORTIONATE SHARE ANALYSIS The written impact fee analysis is required under the Impact Fees Act and must identify the impacts placed on the
facilities by development activity and how these impacts are reasonably related to the new development. The
written impact fee analysis must include a proportionate share analysis, clearly detailing each cost component and
the methodology used to calculate each impact fee. A local political subdivision or private entity may only impose
impact fees on development activities when its plan for financing system improvements establishes that impact fees
are necessary to achieve an equitable allocation to the costs borne in the past and to be borne in the future (UCA
11-36a-302).

P a g e 8
CULINARY WATER IMPACT FEE ANALYSIS
WOODS CROSS CITY, UTAH DECEMBER 2014
SECTION 3: OVERVIEW OF SERVICE AREA, DEMAND, AND LOS
SERVICE AREA Utah Code requires the impact fee enactment to establish one or more service areas within which impact fees will
be imposed.6 The 2014 IFFP states the following, “the future projects of this study take into account both the
current city boundary and the Annexation Declaration for the City. This future area is near the Legacy Highway
and 500 South.”
It is anticipated that the growth projected over the next ten years will impact the City’s existing services. Culinary
water infrastructure will need to be expanded in order to maintain the existing level of service. Impact fees have
become an ideal mechanism for funding growth-related infrastructure. This analysis is designed to accurately assess
the true impact of a particular user upon the City’s infrastructure and prevent existing users from subsidizing new
growth. This analysis also ensures that new growth isn’t paying for existing system deficiencies.
DEMAND UNITS As shown in Table 3.1, the growth in ERUs is expected to reach 6,761 units by 2023, based on a growth rate of
approximately 2.40 percent, as outlined in the 2014 IFFP. This represents an increase of 1,368 ERUs from 2013.
TABLE 3.1: CITY-WIDE ERU GROWTH PROJECTIONS
YEAR ERUS (BASED ON
USAGE)
ADDITIONAL
ERUS
2013 5,393
2023 6,761 1,368
Source: 2014 Culinary Water IFFP, page 5
LEVEL OF SERVICE STANDARDS Impact fees cannot be used to finance an increase in the level of service to current or future users of capital
improvements. Therefore, it is important to identify the existing and proposed culinary water level of service to
ensure that the new capacities of projects financed through impact fees do not exceed the established standard.
SOURCE According to the IFFP, water source requirements are typically defined by the State Division of Drinking Water as
800 gpd/ERU, However, the State recently agreed to a reduced source requirement of 400 gpd/ERU in an effort to
better match the actual usage needs for the wells and treatment facilities. Thus, the existing and proposed LOS for
the source component is 400 gpd/ERU. This equates to approximately 0.2778 gallons per minute (“gpm”) per
ERU.
TREATMENT The 2014 IFFP states the following, “the level of service for the City is that all source water is PCE
(perchloroethylene) free.”
STORAGE The 2014 IFFP shows the existing and proposed LOS for the storage component to be 400 gallons/ERU.7
DISTRIBUTION The distribution level of service is in accordance with the Division of Drinking Water rules regarding flow rate and
psi pressures. These are described in more detail in the 2014 IFFP.
6 UC 11-36a-402(a) 7 Based on indoor demand.

P a g e 9
CULINARY WATER IMPACT FEE ANALYSIS
WOODS CROSS CITY, UTAH DECEMBER 2014
SECTION 4: EXISTING FACILITIES INVENTORY
EXCESS CAPACITY The intent of the equity buy-in component is to recover the costs of the unused capacity in existing infrastructure
from new development. The calculation of excess capacity is shown in the 2014 IFFP and summarized below. In
addition, the tables below calculate the value of excess capacity assuming the existing system value and the percent
excess capacity.
SOURCE As shown in Table 3.2 of the 2014 IFFP, current source capacity is 1,961 gpm. Based on the level of service of 400
gpd/ERU (or 0.278 gpm/ERU), current source demand is approximately 1,498 gpm, leaving approximately 463 gpm
of excess capacity. Approximately 380 gpm will be used within 10 years which equates to 19 percent of total
capacity.
TABLE 4.1: SOURCE EXCESS CAPACITY
GPM ERUS SERVED % OF TOTAL CAPACITY
Total Capacity 1,961 7,060 100%
Current Source Demand (2013) 1,498 5,393 76%
Excess Capacity (2013) 463 1,667 24%
Demand from Future Growth (2013-2023) 380 1,368 19%
Remaining Capacity 83 299 4%
Total Demand at 2023 1,878 6,761 96%
The City has provided a list of all existing source improvements with a useful life of more than 10 years that were
paid for by City funds. The total value of these improvements is approximately $1.5 million. Thus, the excess
capacity value used within the next ten years equates to $307,209.
TABLE 4.2: SOURCE EXCESS CAPACITY VALUE
Existing Source Value $1,585,277
% Excess Capacity in IFFP Horizon 19%
Excess Capacity Value (2013-2023) $307,209
TREATMENT The City current has capacity in the treatment facility. However, this capacity varies between the pipelines,
building and GAC. According to Table 2.5.2 of the 2014 IFFP, the current capacity of the pipelines and building is
approximately 3,000 gpm while the capacity of the GAC is 2,000 gpm. The tables below illustrate current demand
as well as the calculation of excess capacity used within 10 years. Excess capacity used within 10 years amounts to
13% for the pipeline and building and 19% for the GAC.
TABLE 4.3: TREATMENT PIPELINE AND BUILDING EXCESS CAPACITY
PIPELINES & BUILDING GPM ERUS SERVED % OF TOTAL CAPACITY
Total Capacity 3,000 10,800 100%
Current Treatment Demand (2013) 1,498 5,393 50%
Excess Capacity (2013) 1,502 5,407 50%
Demand from Future Growth (2013-2023) 380 1,368 13%
*Pipelines, building and equipment (prefilter, chlorinator, etc.) sized for 3,000 gpm.

P a g e 1 0
CULINARY WATER IMPACT FEE ANALYSIS
WOODS CROSS CITY, UTAH DECEMBER 2014
TABLE 4.4: GAC EXCESS CAPACITY
GAC GPM ERUS SERVED % OF TOTAL CAPACITY
Total Capacity 2,000 7,200 100%
Current Treatment Demand (2013) 1,498 5,393 75%
Excess Capacity (2013) 502 1,807 25%
Demand from Future Growth (2013-2023) 380 1,368 19%
*GAC currently sized for approx 2,000 gpm because only 2 trains are currently active. Would need 3 trains to reach total capacity of building, pipeline, and other equipment.
The City has bonded for the construction of the treatment facility. The 2014 bond totaled $4,500,000 and was a
zero coupon bond, meaning no interest was included. In addition to the $4.5 million bond, the City contributed
$481,839 of cash toward the treatment facility. Thus, the total value of the treatment facility is $4,981,839. Of this
cost, $4,348,539 is related to pipelines and the treatment building, with $633,300 related to GAC, as shown in the
table below. Based on the proportion of excess capacity calculated in Table 4.3 and 4.4 for each component, the
excess capacity value used within the next ten years equates to $671,178.
TABLE 4.5: TREATMENT EXCESS CAPACITY VALUE
TOTAL ORIGINAL COST % EXCESS CAPACITY
(2013-2023) VALUE EXCESS
CAPACITY
Existing Pipeline and Building Value $4,348,539 13% $550,844
Existing GAC Value $633,300 19% $120,333
Total Value Excess Capacity (2013-2023) $4,981,839 $671,178
STORAGE As shown in Table 2.5.3 of the 2014 IFFP, current storage capacity is 7,040,000 gallons. However some of this
storage capacity is allocated to fire and emergency storage, resulting in total available capacity of 3,910,000 gallons.
Based on the level of service of 400 gallons, current storage demand is approximately 2,157,200 gallons, leaving
approximately 1,752,800 gallons of excess capacity. Approximately 547,229 gallons will be used within 10 years
which equates to 14 percent of total capacity (1,368 new ERCs multiplied by LOS of 400 gallons per ERC).
TABLE 4.6: STORAGE EXCESS CAPACITY
STORAGE EXCESS CAPACITY GALLONS ERUS SERVED % OF TOTAL CAPACITY
Total Capacity 7,040,000
Less Fire Storage 630,000
Less Emergency Storage 2,500,000
Available Total Capacity 3,910,000 9,775 100%
Current Storage Demand (2013) 2,157,200 5,393 55%
Excess Capacity (2013) 1,752,800 4,382 45%
Demand from Future Growth (2013-2023) 547,229 1,368 14%
The City has provided a list of all existing storage improvements with a useful life of more than 10 years that were
paid for by City funds. The total value of these improvements is approximately $6.3 million. Thus, the excess
capacity value used within the next ten years equates to $1,134,687.
TABLE 4.7: STORAGE EXCESS CAPACITY VALUE
% OF TOTAL VALUE
Existing Storage Value $6,349,697
Interest Expense (Outstanding Debt) $1,757,739
Total Existing Storage Value $8,107,436
Excess Capacity Used (2013-2023) 14%
Excess Capacity Value (2013-2023) $1,134,687

P a g e 1 1
CULINARY WATER IMPACT FEE ANALYSIS
WOODS CROSS CITY, UTAH DECEMBER 2014
DISTRIBUTION The table below, which is also shown in the 2014 IFFP, illustrates that current demand is using approximately 53%
of the distribution system which amounts to 47% excess capacity. Approximately 13% of the total capacity will be
used in the next 10 years.
TABLE 4.8: DISTRIBUTION EXCESS CAPACITY
YEAR 2013 YEAR 2023 AT-CAPACITY
Connections 5,393 ERU 6,761 ERU 10,118 ERU
Flow 2,912 gpm 3,636 gpm 5,463 gpm
% of Capacity 53% 67% 100%
Total Excess Capacity (2013) 47%
Excess Capacity Used (2013-2023) 13%
The City has provided a list of all existing distribution improvements with a useful life of more than 10 years that
were paid for by City funds. The total value of these improvements is approximately $4 million. Thus, the excess
capacity value used within the next ten years equates to $523,255.
TABLE 4.9: DISTRIBUTION EXCESS CAPACITY VALUE
Existing Distribution Value $3,948,266 % Excess Capacity in IFFP Horizon 13% Excess Capacity Value (2013-2023) $523,255
MANNER OF FINANCING EXISTING PUBLIC FACILITIES The City has funded its existing capital infrastructure through a combination of different revenue sources, including
general utility fund revenues, the issuance of debt, and grant monies. This analysis has removed all funding that has
come from federal grants and donations from non-resident citizens to ensure that none of those infrastructure
items are included in the level of service. Included is any interest expense to construct the existing facilities that
have excess capacity.
According to the City, the 2008 Water Revenue Bonds were used to fund improvements related to the storage
system. The City refinanced these bonds in 2012. The interest cost shown below is included in this analysis as an
applicable buy-in component for storage.
TABLE 4.10: DEBT UTILIZED TO FUND EXISTING SYSTEM STORAGE IMPROVEMENTS
Total Principal Interest Total
2008 Water Revenue Bond (Refunded with 2012 Bonds)* $714,000 $748,241 $1,462,241
2012 Water Revenue Refunding Bond $4,632,000 $1,009,498 $5,641,498
Total $5,346,000 $1,757,739 $7,103,739
Source: Woods Cross City, LYRB *Includes principal and interest paid prior to refunding.
P a g e 1 2
CULINARY WATER IMPACT FEE ANALYSIS
WOODS CROSS CITY, UTAH DECEMBER 2014
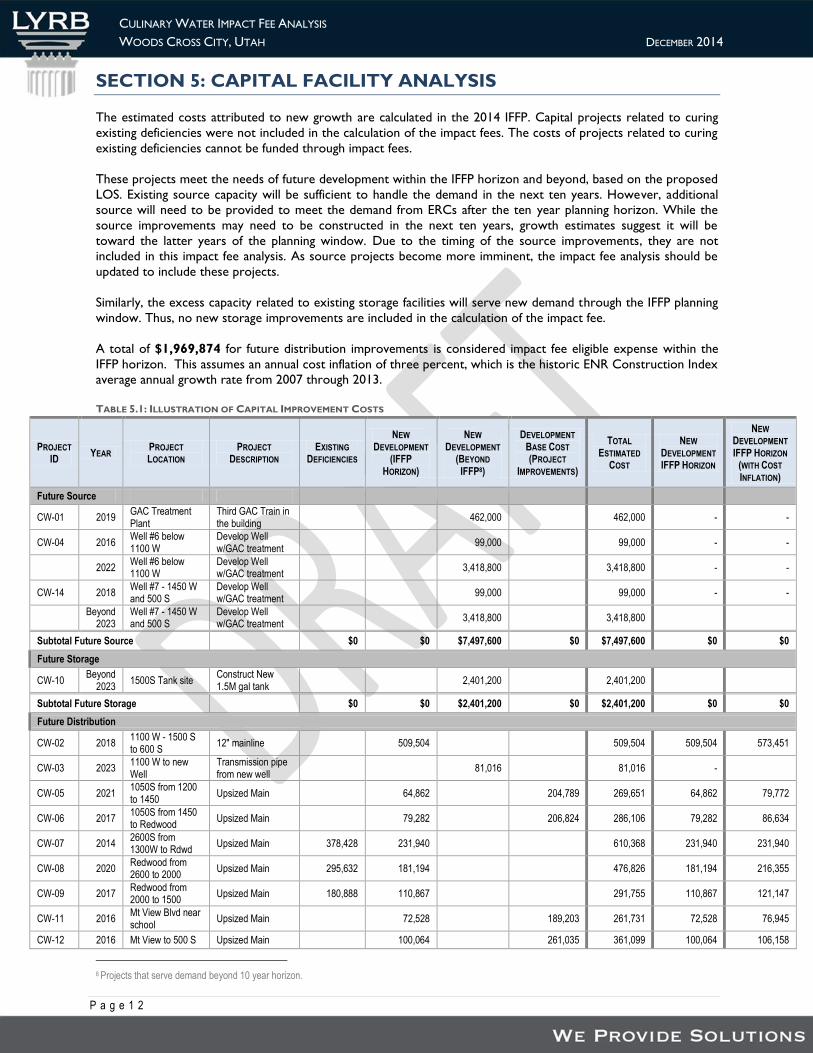
SECTION 5: CAPITAL FACILITY ANALYSIS
The estimated costs attributed to new growth are calculated in the 2014 IFFP. Capital projects related to curing
existing deficiencies were not included in the calculation of the impact fees. The costs of projects related to curing
existing deficiencies cannot be funded through impact fees.
These projects meet the needs of future development within the IFFP horizon and beyond, based on the proposed
LOS. Existing source capacity will be sufficient to handle the demand in the next ten years. However, additional
source will need to be provided to meet the demand from ERCs after the ten year planning horizon. While the
source improvements may need to be constructed in the next ten years, growth estimates suggest it will be
toward the latter years of the planning window. Due to the timing of the source improvements, they are not
included in this impact fee analysis. As source projects become more imminent, the impact fee analysis should be
updated to include these projects.
Similarly, the excess capacity related to existing storage facilities will serve new demand through the IFFP planning
window. Thus, no new storage improvements are included in the calculation of the impact fee.
A total of $1,969,874 for future distribution improvements is considered impact fee eligible expense within the
IFFP horizon. This assumes an annual cost inflation of three percent, which is the historic ENR Construction Index
average annual growth rate from 2007 through 2013.
TABLE 5.1: ILLUSTRATION OF CAPITAL IMPROVEMENT COSTS
PROJECT
ID YEAR
PROJECT
LOCATION PROJECT
DESCRIPTION EXISTING
DEFICIENCIES
NEW
DEVELOPMENT
(IFFP
HORIZON)
NEW
DEVELOPMENT
(BEYOND
IFFP8)
DEVELOPMENT
BASE COST
(PROJECT
IMPROVEMENTS)
TOTAL
ESTIMATED
COST
NEW
DEVELOPMENT
IFFP HORIZON
NEW
DEVELOPMENT
IFFP HORIZON
(WITH COST
INFLATION)
Future Source
CW-01 2019 GAC Treatment Plant
Third GAC Train in the building
462,000
462,000 - -
CW-04 2016 Well #6 below 1100 W
Develop Well w/GAC treatment
99,000
99,000 - -
2022
Well #6 below 1100 W
Develop Well w/GAC treatment
3,418,800
3,418,800 - -
CW-14 2018 Well #7 - 1450 W and 500 S
Develop Well w/GAC treatment
99,000
99,000 - -
Beyond
2023 Well #7 - 1450 W and 500 S
Develop Well w/GAC treatment
3,418,800
3,418,800
Subtotal Future Source
$0 $0 $7,497,600 $0 $7,497,600 $0 $0
Future Storage
CW-10 Beyond
2023 1500S Tank site
Construct New 1.5M gal tank
2,401,200
2,401,200
Subtotal Future Storage
$0 $0 $2,401,200 $0 $2,401,200 $0 $0
Future Distribution
CW-02 2018 1100 W - 1500 S to 600 S
12" mainline
509,504
509,504 509,504 573,451
CW-03 2023 1100 W to new Well
Transmission pipe from new well
81,016
81,016 -
CW-05 2021 1050S from 1200 to 1450
Upsized Main
64,862
204,789 269,651 64,862 79,772
CW-06 2017 1050S from 1450 to Redwood
Upsized Main
79,282
206,824 286,106 79,282 86,634
CW-07 2014 2600S from 1300W to Rdwd
Upsized Main 378,428 231,940
610,368 231,940 231,940
CW-08 2020 Redwood from 2600 to 2000
Upsized Main 295,632 181,194
476,826 181,194 216,355
CW-09 2017 Redwood from 2000 to 1500
Upsized Main 180,888 110,867
291,755 110,867 121,147
CW-11 2016 Mt View Blvd near school
Upsized Main
72,528
189,203 261,731 72,528 76,945
CW-12 2016 Mt View to 500 S Upsized Main
100,064
261,035 361,099 100,064 106,158
8 Projects that serve demand beyond 10 year horizon.

P a g e 1 3
CULINARY WATER IMPACT FEE ANALYSIS
WOODS CROSS CITY, UTAH DECEMBER 2014
PROJECT
ID YEAR
PROJECT
LOCATION PROJECT
DESCRIPTION EXISTING
DEFICIENCIES
NEW
DEVELOPMENT
(IFFP
HORIZON)
NEW
DEVELOPMENT
(BEYOND
IFFP8)
DEVELOPMENT
BASE COST
(PROJECT
IMPROVEMENTS)
TOTAL
ESTIMATED
COST
NEW
DEVELOPMENT
IFFP HORIZON
NEW
DEVELOPMENT
IFFP HORIZON
(WITH COST
INFLATION)
CW-13 2015 1800 W and 400 S Upsized Main and crossing
111,349
430,891 542,240 111,349 114,689
CW-15 2021 1900 South, 1425 W to 1300 W
Upsize Main for Future growth
173,640
173,640 173,640 213,555
CW-16 2018 1500 South, 1250 W to 1100 W
Upsize Main for Future growth
124,332 76,203
200,535 76,203 85,767
CW-17 2019 1450 W - 1000 S to 500 S
Install New 10" Waterline
24,634
149,189 173,823 24,634 28,558
CW-18 2017 450S from Redwood to 1500W
Install New 10" Waterline
31,941
191,647 223,588 31,941 34,903
Subtotal Future Distribution
$979,280 $1,768,008 $81,016 $1,633,578 $4,461,882 $1,768,008 $1,969,874
Total $979,280 $1,768,008 $9,979,816 $1,633,578 $14,360,682 $1,768,008 $1,969,874
The IFFP has detailed the projects included in this IFA using capital project and engineering data, planning analysis
and other information. The accuracy and correctness of this plan is contingent upon the accuracy of the data and
assumptions. Any deviations or changes in the assumptions due to changes in the economy or other relevant
information used by the City for this study may cause this plan to be inaccurate and require modifications.
SYSTEM VS. PROJECT IMPROVEMENTS System improvements are defined as existing and future public facilities designed to provide services to service
areas within the community at large.9 Project improvements are improvements and facilities that are planned and
designed to provide service for a specific development (resulting from a development activity) and considered
necessary for the use and convenience of the occupants or users of that development.10 To the extent possible,
this analysis only includes the costs of system improvements related to new growth within the proportionate share
analysis.
FUNDING OF FUTURE FACILITIES The IFA must also include a consideration of all revenue sources, including impact fees and the dedication of
system improvements, which may be used to finance system improvements.11 In conjunction with this revenue
analysis, there must be a determination that impact fees are necessary to achieve an equitable allocation of the
costs of the new facilities between the new and existing users.12
In considering the funding of future facilities, the City has determined the portion of future projects that will be
funded by impact fees as growth-related, system improvements. Impact fees are an appropriate funding and
repayment mechanism of the growth-related improvements. Where applicable, impact fees will offset the cost of
future facilities. However, impact fees cannot be used to fund non-qualified expenses (i.e. to cure existing
deficiencies, to raise the level of service, to recoup more than the actual cost of system improvements, or to fund
overhead). Other revenues such as utility rate revenues, property taxes, sales tax revenues, grants, or loans can be
used to fund these types of expenditures, as described below.
UTILITY RATE REVENUES Utility rate revenues serve as the primary funding mechanism within enterprise funds. Rates are established to
ensure appropriate coverage of all operations and maintenance expenses, debt service coverage, and capital
project needs. Impact fee revenues are generally considered non-operating revenues and help offset future capital
costs.
9 UC 11-36a-102(20) 10 UC 11-36a102(13) 11 11-36a-304(2)(c) 12 11-36a-302(3)

P a g e 1 4
CULINARY WATER IMPACT FEE ANALYSIS
WOODS CROSS CITY, UTAH DECEMBER 2014
PROPERTY TAX REVENUES Property tax revenues are not specifically identified in this analysis as a funding source for growth-related capital
projects, but inter-fund loans can be made from the general fund which would ultimately include some property
tax revenues. Inter-fund loans would be repaid once sufficient impact fee revenues have been collected.
GRANTS, DONATIONS AND DEVELOPER CONTRIBUTIONS Grants, donations or developer contributions are not currently contemplated in this IFA. However, the impact
fees should be adjusted if grant monies are received. New development may be entitled to a reimbursement for
any grants or donations received by the City for growth related projects, or for developer funded IFA projects.
IMPACT FEE REVENUES Impact fees have become an ideal mechanism for funding growth-related infrastructure. Impact fees are charged to
ensure that new growth pays its proportionate share of the costs for the development of public infrastructure.
Impact fee revenues can also be attributed to the future expansion of public infrastructure if the revenues are used
to maintain an existing level of service. Increases to an existing level of service cannot be funded with impact fee
revenues. Analysis is required to accurately assess the true impact of a particular user upon the City infrastructure
and to prevent existing users from subsidizing new growth.
DEBT FINANCING In the event the City has not amassed sufficient impact fees to pay for the construction of time sensitive or urgent
capital projects needed to accommodate new growth, the City must look to revenue sources other than impact
fees for funding. The Impact Fees Act allows for the costs related to the financing of future capital projects to be
legally included in the impact fee. This allows the City to finance and quickly construct infrastructure for new
development and reimburse itself later from impact fee revenues for the costs of principal and interest. Currently
the City is not planning to issue debt to fund growth related improvements and will utilize a pay-as-you-go
approach to funding projects.
PROPOSED CREDITS OWED TO DEVELOPMENT The Impact Fees Act requires a local political subdivision or private entity to ensure that the impact fee enactment
allows a developer, including a school district or a charter school, to receive a credit against or proportionate
reimbursement of an impact fee if the developer: (a) dedicates land for a system improvement; (b) builds and
dedicates some or all of a system improvement; or (c) dedicates a public facility that the local political subdivision
or private entity and the developer agree will reduce the need for a system improvement.13
The facilities must be considered system improvements or be dedicated to the public, and offset the need for an
improvement identified in the IFA.
EQUITY OF IMPACT FEES Impact fees are intended to recover the costs of capital infrastructure that relate to future growth. The impact fee
calculations are structured for impact fees to fund 100 percent of the growth-related facilities identified in the
proportionate share analysis as presented in the impact fee analysis. Even so, there may be years that impact fee
revenues cannot cover the annual growth-related expenses. In those years, other revenues such as general fund
revenues will be used to make up any annual deficits. Any borrowed funds are to be repaid in their entirety
through impact fees.
NECESSITY OF IMPACT FEES An entity may only impose impact fees on development activity if the entity’s plan for financing system
improvements establishes that impact fees are necessary to achieve parity between existing and new development.
This analysis has identified the improvements to public facilities and the funding mechanisms to complete the
suggested improvements. Impact fees are identified as a necessary funding mechanism to help offset the costs of
new capital improvements related to new growth. In addition, alternative funding mechanisms are identified to help
offset the cost of future capital improvements.
13 11-36a-402

P a g e 1 5
CULINARY WATER IMPACT FEE ANALYSIS
WOODS CROSS CITY, UTAH DECEMBER 2014
SECTION 6: CULINARY WATER IMPACT FEE CALCULATION
The calculation of impact fees relies upon the information contained in this analysis and in the IFFP. Impact fees are
calculated based on many variables centered on proportionality and level of service. The City currently provides
culinary water to its residents and businesses. As a result of new growth, the culinary system is in need of
expansion to perpetuate the level of service that the City has historically maintained. Section 5 outlines the
recommended capital projects that will maintain the established level of service.
PROPOSED CULINARY WATER IMPACT FEE PLAN BASED (FEE BASED ON DEFINED CIP) Impact fees can be calculated based on a defined set of costs specified for future development. The improvements
are identified in a capital plan as growth related projects. The total project costs are divided by the total demand
units the projects are designed to serve. Under this methodology, it is important to identify the existing level of
service and determine any excess capacity in existing facilities that could serve new growth. Impact fees are then
calculated based on many variables centered on proportionality share and level of service.
CULINARY WATER IMPACT FEE CALCULATION The tables below illustrate the appropriate buy-in component and the fee associated with projects occurring within
the next ten years. The proportionate share analysis determines the proportionate cost assignable to new
development based on the amount of excess capacity that will serve future growth within the individual
components and based on the proposed capital projects and the estimated ERUs served by the proposed projects. TABLE 6.1: IMPACT FEE PER ERU
GROWTH RELATED COSTS
WITHIN IFFP HORIZON ERUS SERVED FEE PER ERU
Source Excess Capacity $307,209 1,368 $225
Treatment Excess Capacity $671,178 1,368 $491
Storage Excess Capacity $1,134,687 1,368 $829
Distribution Excess Capacity $523,255 1,368 $382
Future Improvements
Source Future Improvements $0 1,368 $0
Storage Future Improvements $0 1,368 $0
Distribution Future Improvements $1,969,874 1,368 $1,440
Other
Professional Expense $3,788 1,368 $3
Impact Fee Fund Balance14 ($79,517) 1,368 ($58)
Total $4,530,475
$3,312
TABLE 6.2: IMPACT FEE SCHEDULE
LAND USE TYPE ERU MULTIPLIER IMPACT FEE PER METER
SIZE EXISTING IMPACT FEE % CHANGE
Residential (per Unit)15
Single Family 1.00 $3,312 $2,123 56%
Multi-Family 0.75 $2,484 $2,123 17%
Commercial (Meter Size)
3/4 1.00 $3,312 $2,123 56%
1 2.50 $8,281 $5,309 56%
1 1/2 5.00 $16,558 $10,615 56%
2 8.00 $26,493 $16,984 56%
3 15.00 $49,674 $31,845 56%
4 25.00 $82,789 $53,087 56%
14 As of September 30, 2014, the impact fee fund balance was $79,517. This is expected to be spent on projects listed in the IFFP and is thus subtracted from the calculation of the impact fee. 15 The 2014 IFFP details the difference in water usage between a single family and multi-family unit. The difference in multi-family usage is determined to be 75% of single-family water usage. Thus the multiplier used to calculate the impact fee for multi-family units is 0.75. Specific usage data is described in Section 2.3 and Appendix C of the 2014 IFFP.

P a g e 1 6
CULINARY WATER IMPACT FEE ANALYSIS
WOODS CROSS CITY, UTAH DECEMBER 2014
NON-STANDARD CULINARY WATER IMPACT FEES The City reserves the right under the Impact Fees Act to assess an adjusted fee that more closely matches the
true impact that the land use will have upon public facilities.16 This adjustment could result in a lower impact fee if
the City determines that a particular user may create a different impact than what is standard for its land use.
CONSIDERATION OF ALL REVENUE SOURCES The Impact Fees Act requires the proportionate share analysis to demonstrate that impact fees paid by new
development are the most equitable method of funding growth-related infrastructure. See Section 5 for further
discussion regarding the consideration of revenue sources.
EXPENDITURE OF IMPACT FEES Legislation requires that impact fees should be spent or encumbered with six years after each impact fee is paid.
Impact fees collected in the next five to six years should be spent only on those projects outlined in the IFFP as
growth related costs to maintain the LOS.
GROWTH-DRIVEN EXTRAORDINARY COSTS The City does not anticipate any extraordinary costs necessary to provide services to future development.
SUMMARY OF TIME PRICE DIFFERENTIAL The Impact Fees Act allows for the inclusion of a time price differential to ensure that the future value of costs
incurred at a later date are accurately calculated to include the costs of construction inflation. An inflation
component of three percent per year is applied to each project based on its construction year. The City has also
included the interest cost associated with its outstanding bonds.
16 11-36a-402(1)(c)