Ctrip.com International Positive progression towards future
10
Please refer to page 7 for important disclosures and analyst certification, or on our website www.macquarie.com/research/disclosures. 6 September 2018 United States EQUITIES CTRP US Outperform Price (at 03:00, 06 Sep 2018 GMT) US$36.97 Valuation US$ 54.00 - PER 12-month target US$ 54.00 12-month TSR % +46.1 GICS sector Retailing Market cap US$m 19,994 30-day avg turnover US$m 162.7 Number shares on issue m 540.8 Investment fundamentals Year end 31 Dec 2017A 2018E 2019E 2020E Revenue m 26,780 31,658 41,890 52,620 EBIT m 2,926 3,840 7,576 11,165 Reported profit m 2,142 5,302 6,736 9,952 Adjusted profit m 3,976 7,247 8,961 12,247 Gross cashflow m 4,859 8,190 9,913 13,199 CFPS Rmb 8.37 12.82 14.95 19.60 CFPS growth % 45.3 53.1 16.7 31.0 PGCFPS x 30.2 19.7 16.9 12.9 EPS adj Rmb 6.74 11.33 13.51 18.18 EPS adj growth % 66.2 68.2 19.3 34.6 PER adj x 37.5 22.3 18.7 13.9 Total DPS Rmb 0.00 0.00 0.00 0.00 Total div yield % 0.0 0.0 0.0 0.0 ROA % 3.1 3.6 6.0 7.8 ROE % 5.1 8.3 9.6 12.0 EV/EBITDA x 32.3 26.4 15.1 10.7 Net debt/equity % -3.0 -14.5 -24.5 -35.4 P/BV x 1.6 1.5 1.5 1.3 CTRP US vs S&P 500, & rec history Note: Recommendation timeline - if not a continuous line, then there was no Macquarie coverage at the time or there was an embargo period. Source: FactSet, Macquarie Research, September 2018 (all figures in Rmb unless noted, TP in USD) Analysts Macquarie Capital Limited Wendy Huang, CFA +852 3922 3378 [email protected] Ellie Jiang +852 3922 4110 [email protected] Marcus Yang +86 21 2412 9087 [email protected] John Wang +852 3922 3578 [email protected] Frank Chen +852 3922 1433 [email protected] Ctrip.com International Positive progression towards future Key points 2Q18 results came in-line; solid 3Q guidance. Solid progress in lower-tier cities with user penetration growing 40% YoY. International expansion remains solid; both international hotel and air volume increased 40% YoY in 2Q. Conclusion 2Q18 revenue registered 13% YoY growth to Rmb7.3bn, in line with MQ/consensus. Non-GAAP net profit beat MQ/consensus by 171%/236% due to gains from fair value change of equity investments. The company has guided for 3Q revenue growth of 13-18% YoY, in line with consensus. Impact Revenue recovery on track. Ctrip expanded its hotel coverage to about 1.4m properties during the second quarter, an increase of 26% over the same period last year. With growing accommodation reservation volume, among which low-end hotel volume increased rapidly at 40% YoY, its revenue increased 21% YoY in 2Q18. Transportation revenue remained relatively flat, contributed by strong volume growth but offset by air ticketing booking process adjustment. As we expect to see a gradual improvement of commission per room night and per ticket revenue with relatively easy comp in 2H18, we forecast accommodation will maintain steady growth at 21% YoY and expect transportation revenue to grow 5.5% YoY to Rmb3.6bn in 3Q18. Progress on lower-tier penetration. Ctrip’s average user penetration rate in targeted lower-tier cities increased 40% YoY during the quarter. It operates more than 7,000 offline stores in 200 cities. In mid-August, total gross merchandise volume from offline stores reached Rmb70m in a single day. Out of all bookings from offline, approximately 80% of customers have never booked Ctrip’s packaged tour products, which opened up new opportunities for user acquisition. Solid international expansion. During 2Q18, international tickets excluding Skyscanner, achieved ~40% YoY volume growth for both outbound travel and Trip.com, as Ctrip is also growing 2x faster than overall China outbound industry. International contributed ~20-25% of accommodation revenue and 50% of total air ticketing revenue. Majority of packaged tour revenue is also generated from international markets. Skyscanner maintained robust growth during the second quarter, with global MAU increasing 25% YoY and its direct booking program delivering 6x revenue growth from same quarter in 2017. Earnings and target price revision We lower our FY19E non-GAAP net profit by 4% to reflect higher long-term tax assumptions and cut our TP from US$59.00 to US$54.00. This is based on 1x PEG and 27% earnings CAGR over 2019-22E. Price catalyst 12-month price target: US$54.00 based on a PER methodology. Catalyst: Low-base comp in 4Q18 Action and recommendation Reiterate Outperform.
-
Upload
khangminh22 -
Category
Documents
-
view
0 -
download
0
Transcript of Ctrip.com International Positive progression towards future
Please refer to page 7 for important disclosures and analyst certification, or on our website www.macquarie.com/research/disclosures.
6 September 2018 United States
EQUITIES
CTRP US Outperform
Price (at 03:00, 06 Sep 2018 GMT) US$36.97
Valuation US$ 54.00 - PER
12-month target US$ 54.00
12-month TSR % +46.1
GICS sector Retailing
Market cap US$m 19,994
30-day avg turnover US$m 162.7
Number shares on issue m 540.8
Investment fundamentals
Year end 31 Dec 2017A 2018E 2019E 2020E
Revenue m 26,780 31,658 41,890 52,620
EBIT m 2,926 3,840 7,576 11,165
Reported profit m 2,142 5,302 6,736 9,952
Adjusted profit m 3,976 7,247 8,961 12,247
Gross cashflow m 4,859 8,190 9,913 13,199
CFPS Rmb 8.37 12.82 14.95 19.60
CFPS growth % 45.3 53.1 16.7 31.0
PGCFPS x 30.2 19.7 16.9 12.9
EPS adj Rmb 6.74 11.33 13.51 18.18
EPS adj growth % 66.2 68.2 19.3 34.6
PER adj x 37.5 22.3 18.7 13.9
Total DPS Rmb 0.00 0.00 0.00 0.00
Total div yield % 0.0 0.0 0.0 0.0
ROA % 3.1 3.6 6.0 7.8
ROE % 5.1 8.3 9.6 12.0
EV/EBITDA x 32.3 26.4 15.1 10.7
Net debt/equity % -3.0 -14.5 -24.5 -35.4
P/BV x 1.6 1.5 1.5 1.3
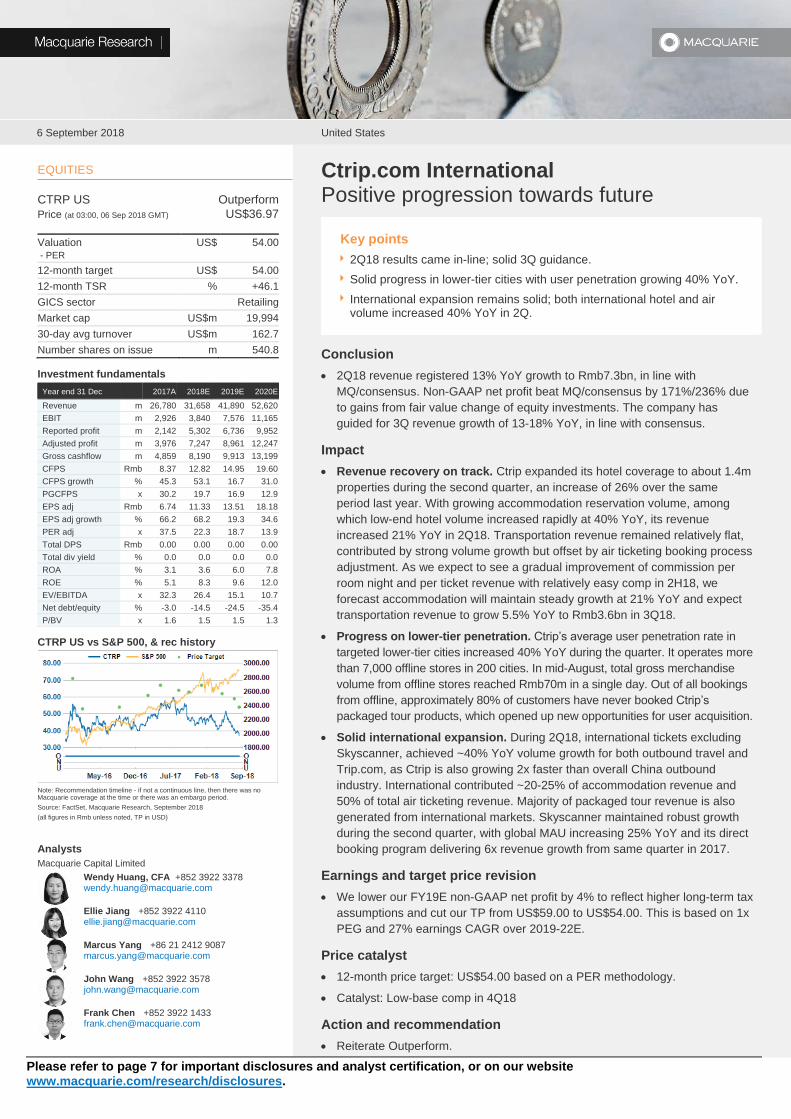
CTRP US vs S&P 500, & rec history
Note: Recommendation timeline - if not a continuous line, then there was no Macquarie coverage at the time or there was an embargo period.
Source: FactSet, Macquarie Research, September 2018
(all figures in Rmb unless noted, TP in USD)
Analysts
Macquarie Capital Limited
Wendy Huang, CFA +852 3922 3378 [email protected]
Ellie Jiang +852 3922 4110 [email protected]
Marcus Yang +86 21 2412 9087 [email protected]
John Wang +852 3922 3578 [email protected]
Frank Chen +852 3922 1433 [email protected]
Ctrip.com International Positive progression towards future
Key points
2Q18 results came in-line; solid 3Q guidance.
Solid progress in lower-tier cities with user penetration growing 40% YoY.
International expansion remains solid; both international hotel and air volume increased 40% YoY in 2Q.
Conclusion
2Q18 revenue registered 13% YoY growth to Rmb7.3bn, in line with
MQ/consensus. Non-GAAP net profit beat MQ/consensus by 171%/236% due
to gains from fair value change of equity investments. The company has
guided for 3Q revenue growth of 13-18% YoY, in line with consensus.
Impact
Revenue recovery on track. Ctrip expanded its hotel coverage to about 1.4m
properties during the second quarter, an increase of 26% over the same
period last year. With growing accommodation reservation volume, among
which low-end hotel volume increased rapidly at 40% YoY, its revenue
increased 21% YoY in 2Q18. Transportation revenue remained relatively flat,
contributed by strong volume growth but offset by air ticketing booking process
adjustment. As we expect to see a gradual improvement of commission per
room night and per ticket revenue with relatively easy comp in 2H18, we
forecast accommodation will maintain steady growth at 21% YoY and expect
transportation revenue to grow 5.5% YoY to Rmb3.6bn in 3Q18.
Progress on lower-tier penetration. Ctrip’s average user penetration rate in
targeted lower-tier cities increased 40% YoY during the quarter. It operates more
than 7,000 offline stores in 200 cities. In mid-August, total gross merchandise
volume from offline stores reached Rmb70m in a single day. Out of all bookings
from offline, approximately 80% of customers have never booked Ctrip’s
packaged tour products, which opened up new opportunities for user acquisition.
Solid international expansion. During 2Q18, international tickets excluding
Skyscanner, achieved ~40% YoY volume growth for both outbound travel and
Trip.com, as Ctrip is also growing 2x faster than overall China outbound
industry. International contributed ~20-25% of accommodation revenue and
50% of total air ticketing revenue. Majority of packaged tour revenue is also
generated from international markets. Skyscanner maintained robust growth
during the second quarter, with global MAU increasing 25% YoY and its direct
booking program delivering 6x revenue growth from same quarter in 2017.
Earnings and target price revision
We lower our FY19E non-GAAP net profit by 4% to reflect higher long-term tax
assumptions and cut our TP from US$59.00 to US$54.00. This is based on 1x
PEG and 27% earnings CAGR over 2019-22E.
Price catalyst
12-month price target: US$54.00 based on a PER methodology.
Catalyst: Low-base comp in 4Q18
Action and recommendation
Reiterate Outperform.
Macquarie Research Ctrip.com International
6 September 2018 2
Analysis
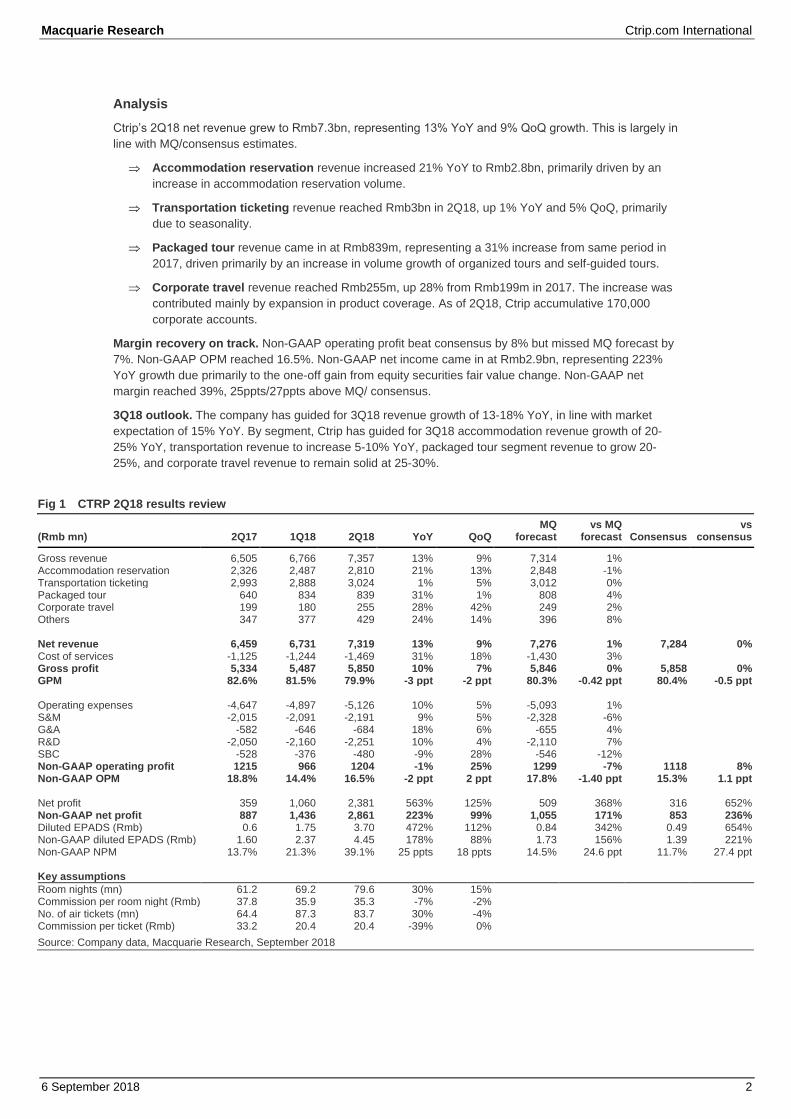
Ctrip’s 2Q18 net revenue grew to Rmb7.3bn, representing 13% YoY and 9% QoQ growth. This is largely in
line with MQ/consensus estimates.
Accommodation reservation revenue increased 21% YoY to Rmb2.8bn, primarily driven by an
increase in accommodation reservation volume.
Transportation ticketing revenue reached Rmb3bn in 2Q18, up 1% YoY and 5% QoQ, primarily
due to seasonality.
Packaged tour revenue came in at Rmb839m, representing a 31% increase from same period in
2017, driven primarily by an increase in volume growth of organized tours and self-guided tours.
Corporate travel revenue reached Rmb255m, up 28% from Rmb199m in 2017. The increase was
contributed mainly by expansion in product coverage. As of 2Q18, Ctrip accumulative 170,000
corporate accounts.
Margin recovery on track. Non-GAAP operating profit beat consensus by 8% but missed MQ forecast by
7%. Non-GAAP OPM reached 16.5%. Non-GAAP net income came in at Rmb2.9bn, representing 223%
YoY growth due primarily to the one-off gain from equity securities fair value change. Non-GAAP net
margin reached 39%, 25ppts/27ppts above MQ/ consensus.
3Q18 outlook. The company has guided for 3Q18 revenue growth of 13-18% YoY, in line with market
expectation of 15% YoY. By segment, Ctrip has guided for 3Q18 accommodation revenue growth of 20-
25% YoY, transportation revenue to increase 5-10% YoY, packaged tour segment revenue to grow 20-
25%, and corporate travel revenue to remain solid at 25-30%.
Fig 1 CTRP 2Q18 results review
(Rmb mn) 2Q17 1Q18 2Q18 YoY QoQ MQ
forecast vs MQ
forecast Consensus vs
consensus
Gross revenue 6,505 6,766 7,357 13% 9% 7,314 1% Accommodation reservation 2,326 2,487 2,810 21% 13% 2,848 -1% Transportation ticketing 2,993 2,888 3,024 1% 5% 3,012 0% Packaged tour 640 834 839 31% 1% 808 4% Corporate travel 199 180 255 28% 42% 249 2% Others 347 377 429 24% 14% 396 8% Net revenue 6,459 6,731 7,319 13% 9% 7,276 1% 7,284 0% Cost of services -1,125 -1,244 -1,469 31% 18% -1,430 3% Gross profit 5,334 5,487 5,850 10% 7% 5,846 0% 5,858 0% GPM 82.6% 81.5% 79.9% -3 ppt -2 ppt 80.3% -0.42 ppt 80.4% -0.5 ppt Operating expenses -4,647 -4,897 -5,126 10% 5% -5,093 1% S&M -2,015 -2,091 -2,191 9% 5% -2,328 -6% G&A -582 -646 -684 18% 6% -655 4% R&D -2,050 -2,160 -2,251 10% 4% -2,110 7% SBC -528 -376 -480 -9% 28% -546 -12% Non-GAAP operating profit 1215 966 1204 -1% 25% 1299 -7% 1118 8% Non-GAAP OPM 18.8% 14.4% 16.5% -2 ppt 2 ppt 17.8% -1.40 ppt 15.3% 1.1 ppt Net profit 359 1,060 2,381 563% 125% 509 368% 316 652% Non-GAAP net profit 887 1,436 2,861 223% 99% 1,055 171% 853 236% Diluted EPADS (Rmb) 0.6 1.75 3.70 472% 112% 0.84 342% 0.49 654% Non-GAAP diluted EPADS (Rmb) 1.60 2.37 4.45 178% 88% 1.73 156% 1.39 221% Non-GAAP NPM 13.7% 21.3% 39.1% 25 ppts 18 ppts 14.5% 24.6 ppt 11.7% 27.4 ppt Key assumptions
Room nights (mn) 61.2 69.2 79.6 30% 15% Commission per room night (Rmb) 37.8 35.9 35.3 -7% -2% No. of air tickets (mn) 64.4 87.3 83.7 30% -4% Commission per ticket (Rmb) 33.2 20.4 20.4 -39% 0%
Source: Company data, Macquarie Research, September 2018

Macquarie Research Ctrip.com International
6 September 2018 3
Estimate revisions
We increase our FY18 non-GAAP net profit by 28% mainly to reflect higher-than-expected gain from fair
value change of equity investments in 2Q.
However, we lower FY19/20E non-GAAP net profit by 4% to reflect higher tax assumptions in the long
term.
We maintain Outperform but cut our target price from US$59.00 to US$54.00, which is based on 1x
PEG and 27% earnings CAGR over 2019-22E.
Fig 2 Estimate revisions
New estimates
(Rmb mn) 3Q18E 2018E 2019E 2020E Net revenue 9,329 31,658 41,890 52,620 Gross profit 7,487 25,526 33,863 42,613 Non-GAAP operation profit 1,880 5,784 9,801 13,459 Non-GAAP operation margin 20.2% 18.3% 23.4% 25.6% Non-GAAP net profit 1,468 7,247 8,961 12,247 Non-GAAP diluted EPS (Rmb) 2.26 11.34 13.52 18.18 Old estimates
(Rmb mn) 3Q18E 2018E 2019E 2020E Net revenue 9,174 31,731 42,522 53,394 Gross profit 7,375 25,607 34,400 43,244 Non-GAAP operation profit 1,733 5,681 9,846 13,499 Non-GAAP operation margin 18.9% 17.9% 23.2% 25.3% Non-GAAP net profit 1,639 5,650 9,361 12,763 Non-GAAP diluted EPS (Rmb) 2.67 9.23 14.94 20.05 Revision
3Q18E 2018E 2019E 2020E Net revenue 2% 0% -1% -1% Gross profit 2% 0% -2% -1% Non-GAAP operation profit 8% 2% 0% 0% Non-GAAP operation margin 1.3 ppt 0.4 ppt 0.2 ppt 0.3 ppt Non-GAAP net profit -10% 28% -4% -4% Non-GAAP diluted EPS -15% 23% -10% -9%
Source: Macquarie Research, September 2018
Fig 3 Key assumptions
Key Revenue drivers 2015 2016 2017 2018E 2019E 2020E
Gross revenue (Rmb mn) 11,497 19,788 26,977 31,823 42,108 52,893 Accommodation reservation 4,617 7,309 9,517 11,934 16,144 20,923 Transportation ticketing 4,454 8,827 12,221 13,344 18,093 22,771 Packaged tour 1,668 2,310 2,970 3,762 4,703 5,737 Corporate travel 473 608 753 953 1,153 1,349 Others 285 734 1,515 1,830 2,015 2,113 Net revenue 10,898 19,228 26,780 31,658 41,890 52,620 % of total gross revenue
Accommodation reservation 40% 37% 35% 37% 38% 40% Transportation ticketing 39% 45% 45% 42% 43% 43% Packaged tour 15% 12% 11% 12% 11% 11% Corporate travel 4% 3% 3% 3% 3% 3% Others 2% 4% 6% 6% 5% 4% YoY growth
Total revenue 48% 72% 36% 18% 32% 26% Accommodation reservation 44% 58% 30% 25% 35% 30% Transportation ticketing 51% 98% 38% 9% 36% 26% Packaged tour 58% 39% 29% 27% 25% 22% Corporate travel 27% 29% 24% 27% 21% 17% Key assumptions
Room nights (mn) 100.0 189.0 251.0 331.0 435.8 550.0 Commission per room night (Rmb) 46.2 38.6 37.9 36.1 37.0 38.0 No. of tickets (mn) 99.4 226.6 270.2 354.1 446.1 544.3 Commission per ticket (Rmb) 40.0 34.8 32.5 23.7 26.4 26.9
Source: Company data, Macquarie Research, September 2018
Macquarie Research Ctrip.com International
6 September 2018 4
Fig 4 Ratios
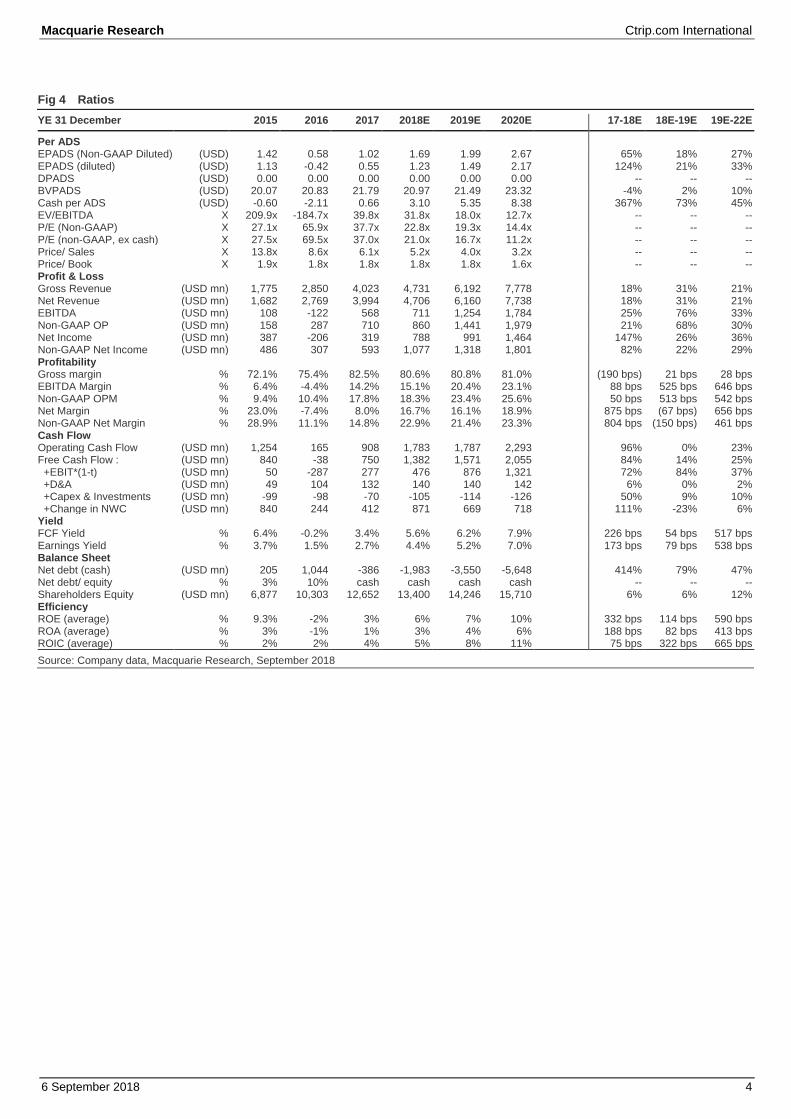
YE 31 December 2015 2016 2017 2018E 2019E 2020E 17-18E 18E-19E 19E-22E
Per ADS EPADS (Non-GAAP Diluted) (USD) 1.42 0.58 1.02 1.69 1.99 2.67 65% 18% 27% EPADS (diluted) (USD) 1.13 -0.42 0.55 1.23 1.49 2.17 124% 21% 33% DPADS (USD) 0.00 0.00 0.00 0.00 0.00 0.00 -- -- -- BVPADS (USD) 20.07 20.83 21.79 20.97 21.49 23.32 -4% 2% 10% Cash per ADS (USD) -0.60 -2.11 0.66 3.10 5.35 8.38 367% 73% 45% EV/EBITDA X 209.9x -184.7x 39.8x 31.8x 18.0x 12.7x -- -- -- P/E (Non-GAAP) X 27.1x 65.9x 37.7x 22.8x 19.3x 14.4x -- -- -- P/E (non-GAAP, ex cash) X 27.5x 69.5x 37.0x 21.0x 16.7x 11.2x -- -- -- Price/ Sales X 13.8x 8.6x 6.1x 5.2x 4.0x 3.2x -- -- -- Price/ Book X 1.9x 1.8x 1.8x 1.8x 1.8x 1.6x -- -- -- Profit & Loss Gross Revenue (USD mn) 1,775 2,850 4,023 4,731 6,192 7,778 18% 31% 21% Net Revenue (USD mn) 1,682 2,769 3,994 4,706 6,160 7,738 18% 31% 21% EBITDA (USD mn) 108 -122 568 711 1,254 1,784 25% 76% 33% Non-GAAP OP (USD mn) 158 287 710 860 1,441 1,979 21% 68% 30% Net Income (USD mn) 387 -206 319 788 991 1,464 147% 26% 36% Non-GAAP Net Income (USD mn) 486 307 593 1,077 1,318 1,801 82% 22% 29% Profitability Gross margin % 72.1% 75.4% 82.5% 80.6% 80.8% 81.0% (190 bps) 21 bps 28 bps EBITDA Margin % 6.4% -4.4% 14.2% 15.1% 20.4% 23.1% 88 bps 525 bps 646 bps Non-GAAP OPM % 9.4% 10.4% 17.8% 18.3% 23.4% 25.6% 50 bps 513 bps 542 bps Net Margin % 23.0% -7.4% 8.0% 16.7% 16.1% 18.9% 875 bps (67 bps) 656 bps Non-GAAP Net Margin % 28.9% 11.1% 14.8% 22.9% 21.4% 23.3% 804 bps (150 bps) 461 bps Cash Flow Operating Cash Flow (USD mn) 1,254 165 908 1,783 1,787 2,293 96% 0% 23% Free Cash Flow : (USD mn) 840 -38 750 1,382 1,571 2,055 84% 14% 25% +EBIT*(1-t) (USD mn) 50 -287 277 476 876 1,321 72% 84% 37% +D&A (USD mn) 49 104 132 140 140 142 6% 0% 2% +Capex & Investments (USD mn) -99 -98 -70 -105 -114 -126 50% 9% 10% +Change in NWC (USD mn) 840 244 412 871 669 718 111% -23% 6% Yield FCF Yield % 6.4% -0.2% 3.4% 5.6% 6.2% 7.9% 226 bps 54 bps 517 bps Earnings Yield % 3.7% 1.5% 2.7% 4.4% 5.2% 7.0% 173 bps 79 bps 538 bps Balance Sheet Net debt (cash) (USD mn) 205 1,044 -386 -1,983 -3,550 -5,648 414% 79% 47% Net debt/ equity % 3% 10% cash cash cash cash -- -- -- Shareholders Equity (USD mn) 6,877 10,303 12,652 13,400 14,246 15,710 6% 6% 12% Efficiency ROE (average) % 9.3% -2% 3% 6% 7% 10% 332 bps 114 bps 590 bps ROA (average) % 3% -1% 1% 3% 4% 6% 188 bps 82 bps 413 bps ROIC (average) % 2% 2% 4% 5% 8% 11% 75 bps 322 bps 665 bps
Source: Company data, Macquarie Research, September 2018
Macquarie Research Ctrip.com International
6 September 2018 5
Fig 5 Financials
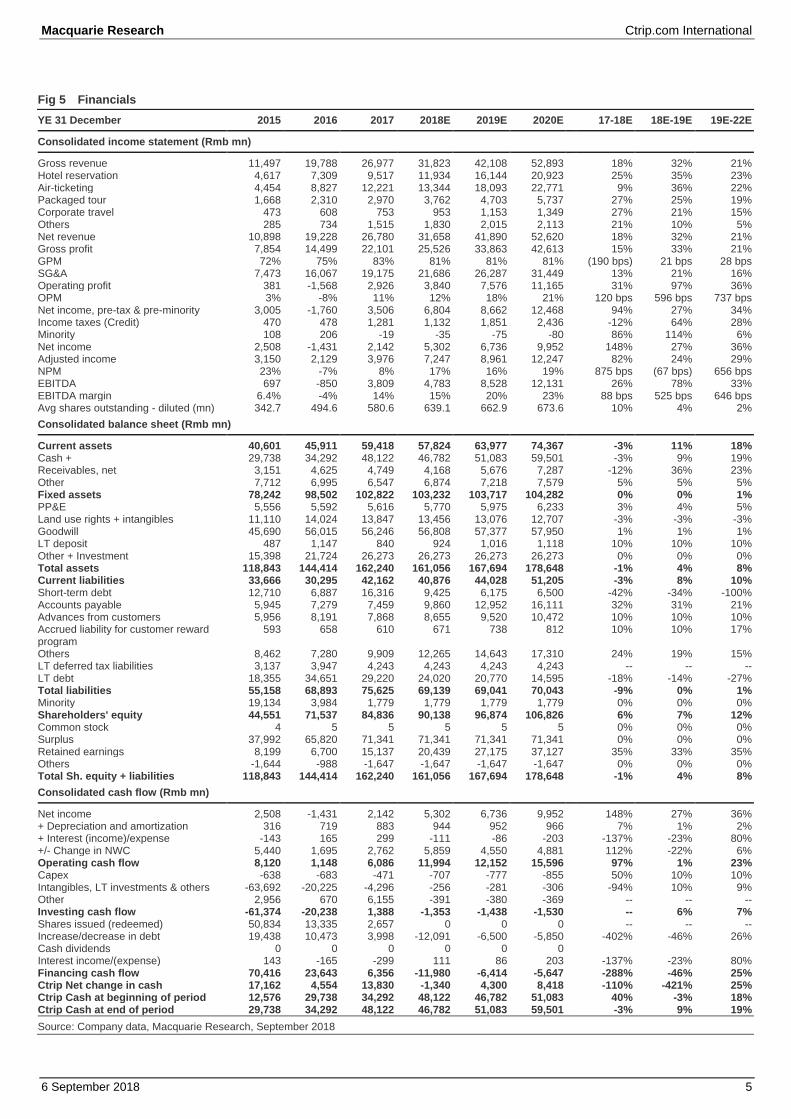
YE 31 December 2015 2016 2017 2018E 2019E 2020E 17-18E 18E-19E 19E-22E
Consolidated income statement (Rmb mn)
Gross revenue 11,497 19,788 26,977 31,823 42,108 52,893 18% 32% 21% Hotel reservation 4,617 7,309 9,517 11,934 16,144 20,923 25% 35% 23% Air-ticketing 4,454 8,827 12,221 13,344 18,093 22,771 9% 36% 22% Packaged tour 1,668 2,310 2,970 3,762 4,703 5,737 27% 25% 19% Corporate travel 473 608 753 953 1,153 1,349 27% 21% 15% Others 285 734 1,515 1,830 2,015 2,113 21% 10% 5% Net revenue 10,898 19,228 26,780 31,658 41,890 52,620 18% 32% 21% Gross profit 7,854 14,499 22,101 25,526 33,863 42,613 15% 33% 21% GPM 72% 75% 83% 81% 81% 81% (190 bps) 21 bps 28 bps SG&A 7,473 16,067 19,175 21,686 26,287 31,449 13% 21% 16% Operating profit 381 -1,568 2,926 3,840 7,576 11,165 31% 97% 36% OPM 3% -8% 11% 12% 18% 21% 120 bps 596 bps 737 bps Net income, pre-tax & pre-minority 3,005 -1,760 3,506 6,804 8,662 12,468 94% 27% 34% Income taxes (Credit) 470 478 1,281 1,132 1,851 2,436 -12% 64% 28% Minority 108 206 -19 -35 -75 -80 86% 114% 6% Net income 2,508 -1,431 2,142 5,302 6,736 9,952 148% 27% 36% Adjusted income 3,150 2,129 3,976 7,247 8,961 12,247 82% 24% 29% NPM 23% -7% 8% 17% 16% 19% 875 bps (67 bps) 656 bps EBITDA 697 -850 3,809 4,783 8,528 12,131 26% 78% 33% EBITDA margin 6.4% -4% 14% 15% 20% 23% 88 bps 525 bps 646 bps Avg shares outstanding - diluted (mn) 342.7 494.6 580.6 639.1 662.9 673.6 10% 4% 2%
Consolidated balance sheet (Rmb mn)
Current assets 40,601 45,911 59,418 57,824 63,977 74,367 -3% 11% 18% Cash + 29,738 34,292 48,122 46,782 51,083 59,501 -3% 9% 19% Receivables, net 3,151 4,625 4,749 4,168 5,676 7,287 -12% 36% 23% Other 7,712 6,995 6,547 6,874 7,218 7,579 5% 5% 5% Fixed assets 78,242 98,502 102,822 103,232 103,717 104,282 0% 0% 1% PP&E 5,556 5,592 5,616 5,770 5,975 6,233 3% 4% 5% Land use rights + intangibles 11,110 14,024 13,847 13,456 13,076 12,707 -3% -3% -3% Goodwill 45,690 56,015 56,246 56,808 57,377 57,950 1% 1% 1% LT deposit 487 1,147 840 924 1,016 1,118 10% 10% 10% Other + Investment 15,398 21,724 26,273 26,273 26,273 26,273 0% 0% 0% Total assets 118,843 144,414 162,240 161,056 167,694 178,648 -1% 4% 8% Current liabilities 33,666 30,295 42,162 40,876 44,028 51,205 -3% 8% 10% Short-term debt 12,710 6,887 16,316 9,425 6,175 6,500 -42% -34% -100% Accounts payable 5,945 7,279 7,459 9,860 12,952 16,111 32% 31% 21% Advances from customers 5,956 8,191 7,868 8,655 9,520 10,472 10% 10% 10% Accrued liability for customer reward program
593 658 610 671 738 812 10% 10% 17%
Others 8,462 7,280 9,909 12,265 14,643 17,310 24% 19% 15% LT deferred tax liabilities 3,137 3,947 4,243 4,243 4,243 4,243 -- -- -- LT debt 18,355 34,651 29,220 24,020 20,770 14,595 -18% -14% -27% Total liabilities 55,158 68,893 75,625 69,139 69,041 70,043 -9% 0% 1% Minority 19,134 3,984 1,779 1,779 1,779 1,779 0% 0% 0% Shareholders' equity 44,551 71,537 84,836 90,138 96,874 106,826 6% 7% 12% Common stock 4 5 5 5 5 5 0% 0% 0% Surplus 37,992 65,820 71,341 71,341 71,341 71,341 0% 0% 0% Retained earnings 8,199 6,700 15,137 20,439 27,175 37,127 35% 33% 35% Others -1,644 -988 -1,647 -1,647 -1,647 -1,647 0% 0% 0% Total Sh. equity + liabilities 118,843 144,414 162,240 161,056 167,694 178,648 -1% 4% 8%
Consolidated cash flow (Rmb mn)
Net income 2,508 -1,431 2,142 5,302 6,736 9,952 148% 27% 36% + Depreciation and amortization 316 719 883 944 952 966 7% 1% 2% + Interest (income)/expense -143 165 299 -111 -86 -203 -137% -23% 80% +/- Change in NWC 5,440 1,695 2,762 5,859 4,550 4,881 112% -22% 6% Operating cash flow 8,120 1,148 6,086 11,994 12,152 15,596 97% 1% 23% Capex -638 -683 -471 -707 -777 -855 50% 10% 10% Intangibles, LT investments & others -63,692 -20,225 -4,296 -256 -281 -306 -94% 10% 9% Other 2,956 670 6,155 -391 -380 -369 -- -- -- Investing cash flow -61,374 -20,238 1,388 -1,353 -1,438 -1,530 -- 6% 7% Shares issued (redeemed) 50,834 13,335 2,657 0 0 0 -- -- -- Increase/decrease in debt 19,438 10,473 3,998 -12,091 -6,500 -5,850 -402% -46% 26% Cash dividends 0 0 0 0 0 0 Interest income/(expense) 143 -165 -299 111 86 203 -137% -23% 80% Financing cash flow 70,416 23,643 6,356 -11,980 -6,414 -5,647 -288% -46% 25% Ctrip Net change in cash 17,162 4,554 13,830 -1,340 4,300 8,418 -110% -421% 25% Ctrip Cash at beginning of period 12,576 29,738 34,292 48,122 46,782 51,083 40% -3% 18% Ctrip Cash at end of period 29,738 34,292 48,122 46,782 51,083 59,501 -3% 9% 19%
Source: Company data, Macquarie Research, September 2018

Macquarie Research Ctrip.com International
6 September 2018 6
Macquarie Quant View
The Quant View page below has been derived from models that are developed and maintained by Sales and Trading
personnel at Macquarie. The models are not a product of the Macquarie Research Department.
The quant model currently holds a marginally negative view on Ctrip.com
International. The strongest style exposure is Earnings Momentum,
indicating this stock has received earnings upgrades and is well liked by sell
side analysts. The weakest style exposure is Valuations, indicating this stock
is over-priced in the market relative to its peers.
Displays where the
company’s ranked based on
the fundamental consensus
Price Target and
Macquarie’s Quantitative
Alpha model.
Two rankings: Local market
(China) and Global sector
(Retailing)
360/512 Global rank in
Retailing
% of BUY recommendations 79% (19/24)
Number of Price Target downgrades 2
Number of Price Target upgrades 3
Macquarie Alpha Model ranking Factors driving the Alpha Model
A list of comparable companies and their Macquarie Alpha model score
(higher is better).
For the comparable firms this chart shows the key underlying styles and their
contribution to the current overall Alpha score.
Macquarie Earnings Sentiment Indicator Drivers of Stock Return
The Macquarie Sentiment Indicator is an enhanced earnings revisions
signal that favours analysts who have more timely and higher conviction
revisions. Current score shown below.
Breakdown of 1 year total return (local currency) into returns from dividends, changes
in forward earnings estimates and the resulting change in earnings multiple.
What drove this Company in the last 5 years How it looks on the Alpha model
Which factor score has had the greatest correlation with the company’s
returns over the last 5 years.
A more granular view of the underlying style scores that drive the alpha (higher is
better) and the percentile rank relative to the sector and market.
Source (all charts): FactSet, Thomson Reuters, and Macquarie Quant. For more details on the Macquarie Alpha model or for more customised analysis and screens, please contact the Macquarie Global Quantitative/Custom Products Group ([email protected])
Fu
nd
am
en
tals
Quant
Local market rank Global sector rank
Attractive
-1.2
-0.2
0.3
0.8
-3.0 -2.0 -1.0 0.0 1.0 2.0 3.0
Tuniu
Ctrip.com International
Expedia Group
Booking Holdings
-100% -80% -60% -40% -20% 0% 20% 40% 60% 80% 100%
Tuniu
Ctrip.com International
Expedia Group
Booking Holdings
Valuations Growth Profitability Earnings
Momentum
Price
Momentum
Quality
0.3
0.1
0.4
-0.2
-3.0 -2.0 -1.0 0.0 1.0 2.0 3.0
Tuniu
Ctrip.com International
Expedia Group
Booking Holdings
-100% -50% 0% 50% 100%
Tuniu
Ctrip.com International
Expedia Group
Booking Holdings
Dividend Return Multiple Return Earnings Outlook 1Yr Total Return
-19%
-19%
-18%
-17%
22%
25%
25%
27%
-30% -20% -10% 0% 10% 20% 30%
⇐ Negatives Positives ⇒
Relative Turnover
Momentum 6 Month
Turnover (USD) 20 Day
Profit Margin NTM
Price Upside
Price to Cash NTM
Price to Sales NTM
Price to Sales FY1
0 1
Technicals & TradingRisk
LiquidityCapital & Funding
QualityPrice Momentum
Earnings MomentumProfitability
Growth
ValuationAlpha Model Score
0.01-0.11
-0.81-0.20
-0.32-0.12
0.10-0.31 0.06
-0.37-0.22
0 1
Normalized
Score
0 50 100
Percentile relative
to sector(/512)
0 50 100
Percentile relative
to market(/420)
Macquarie Research Ctrip.com International
6 September 2018 7
Important disclosures:
Recommendation definitions
Macquarie - Australia/New Zealand Outperform – return >3% in excess of benchmark return Neutral – return within 3% of benchmark return Underperform – return >3% below benchmark return Benchmark return is determined by long term nominal GDP growth plus 12 month forward market dividend yield, which is currently around 9%.
Macquarie – Asia/Europe Outperform – expected return >+10% Neutral – expected return from -10% to +10% Underperform – expected return <-10%
Mazi Macquarie – South Africa Outperform – expected return >+10% Neutral – expected return from -10% to +10% Underperform – expected return <-10%
Macquarie - Canada Outperform – return >5% in excess of benchmark return Neutral – return within 5% of benchmark return Underperform – return >5% below benchmark return
Macquarie - USA Outperform (Buy) – return >5% in excess of Russell 3000 index return Neutral (Hold) – return within 5% of Russell 3000 index return Underperform (Sell)– return >5% below Russell 3000 index return
Volatility index definition*
This is calculated from the volatility of historical price movements. Very high–highest risk – Stock should be expected to move up or down 60–100% in a year – investors should be aware this stock is highly speculative. High – stock should be expected to move up or down at least 40–60% in a year – investors should be aware this stock could be speculative. Medium – stock should be expected to move up or down at least 30–40% in a year. Low–medium – stock should be expected to move up or down at least 25–30% in a year. Low – stock should be expected to move up or down at least 15–25% in a year. * Applicable to Asia/Australian/NZ/Canada stocks only
Recommendations – 12 months Note: Quant recommendations may differ from Fundamental Analyst recommendations
Financial definitions
All "Adjusted" data items have had the following adjustments made: Added back: goodwill amortisation, provision for catastrophe reserves, IFRS derivatives & hedging, IFRS impairments & IFRS interest expense Excluded: non recurring items, asset revals, property revals, appraisal value uplift, preference dividends & minority interests EPS = adjusted net profit / efpowa* ROA = adjusted ebit / average total assets ROA Banks/Insurance = adjusted net profit /average total assets ROE = adjusted net profit / average shareholders funds Gross cashflow = adjusted net profit + depreciation *equivalent fully paid ordinary weighted average number of shares All Reported numbers for Australian/NZ listed stocks are modelled under IFRS (International Financial Reporting Standards).
Recommendation proportions – For quarter ending 30 June 2018
AU/NZ Asia RSA USA CA EUR Outperform 52.87% 61.26% 48.86% 47.54% 69.86% 46.61% (for global coverage by Macquarie, 3.51% of stocks followed are investment banking clients)
Neutral 34.10% 27.25% 36.36% 46.72% 21.92% 43.22% (for global coverage by Macquarie, 2.10% of stocks followed are investment banking clients)
Underperform 13.03% 11.49% 14.77% 5.74% 8.22% 10.17% (for global coverage by Macquarie, 0.00% of stocks followed are investment banking clients)
CTRP US vs S&P 500, & rec history
(all figures in USD currency unless noted)
Note: Recommendation timeline – if not a continuous line, then there was no Macquarie coverage at the time or there was an embargo period. Source: FactSet, Macquarie Research, September 2018
12-month target price methodology
CTRP US: US$54.00 based on a PER methodology
Company-specific disclosures: Important disclosure information regarding the subject companies covered in this report is available at www.macquarie.com/research/disclosures.
Date Stock Code (BBG code) Recommendation Target Price 07-Aug-2018 CTRP US Outperform US$59.00 24-May-2018 CTRP US Outperform US$62.00 18-Jan-2018 CTRP US Outperform US$67.00 02-Nov-2017 CTRP US Outperform US$63.00 31-Aug-2017 CTRP US Outperform US$64.00 11-May-2017 CTRP US Outperform US$67.00 24-Feb-2017 CTRP US Outperform US$61.00 01-Sep-2016 CTRP US Outperform US$54.00 19-Jan-2016 CTRP US Outperform US$53.00 20-Nov-2015 CTRP US Outperform US$71.00
Target price risk disclosures: CTRP US: Any inability to compete successfully in their markets may harm the business. This could be a result of many factors which may include geographic mix and introduction of improved products or service offerings by competitors. The results of operations may be materially affected by global economic conditions generally, including conditions in financial markets. The company is exposed to market risks, such as changes in interest rates, foreign exchange rates and input prices. From time to time, the company will enter into transactions, including transactions in derivative instruments, to manage certain of these exposures.
Analyst certification: We hereby certify that all of the views expressed in this report accurately reflect our personal views about the subject company or companies and its or their securities. We also certify that no part of our compensation was, is or will be, directly or indirectly, related to the specific recommendations or views expressed in this report. The Analysts responsible for preparing this report receive compensation from Macquarie that is based upon various factors including Macquarie Group Ltd total revenues, a portion of which are generated by Macquarie Group’s Investment Banking activities.
Macquarie Research Ctrip.com International
6 September 2018 8
General disclaimers: Macquarie Securities (Australia) Ltd; Macquarie Capital (Europe) Ltd; Macquarie Capital Markets Canada Ltd; Macquarie Capital Markets North America Ltd; Macquarie Capital (USA) Inc; Macquarie Capital Limited, Taiwan Securities Branch; Macquarie Capital Securities (Singapore) Pte Ltd; Macquarie Securities (NZ) Ltd; Mazi Macquarie Securities (RF) (Pty) Ltd; Macquarie Capital Securities (India) Pvt Ltd; Macquarie Capital Securities (Malaysia) Sdn Bhd; Macquarie Securities Korea Limited and Macquarie Securities (Thailand) Ltd are not authorized deposit-taking institutions for the purposes of the Banking Act 1959 (Commonwealth of Australia), and their obligations do not represent deposits or other liabilities of Macquarie Bank Limited ABN 46 008 583 542 (MBL) or MGL. MBL does not guarantee or otherwise provide assurance in respect of the obligations of any of the above mentioned entities. MGL provides a guarantee to the Monetary Authority of Singapore in respect of the obligations and liabilities of Macquarie Capital Securities (Singapore) Pte Ltd for up to SGD 35 million. This research has been prepared for the general use of the wholesale clients of the Macquarie Group and must not be copied, either in whole or in part, or distributed to any other person. If you are not the intended recipient you must not use or disclose the information in this research in any way. If you received it in error, please tell us immediately by return e-mail and delete the document. We do not guarantee the integrity of any e-mails or attached files and are not responsible for any changes made to them by any other person. MGL has established and implemented a conflicts policy at group level (which may be revised and updated from time to time) (the "Conflicts Policy") pursuant to regulatory requirements (including the FCA Rules) which sets out how we must seek to identify and manage all material conflicts of interest. Nothing in this research shall be construed as a solicitation to buy or sell any security or product, or to engage in or refrain from engaging in any transaction. In preparing this research, we did not take into account your investment objectives, financial situation or particular needs. Macquarie salespeople, traders and other professionals may provide oral or written market commentary or trading strategies to our clients that reflect opinions which are contrary to the opinions expressed in this research. Macquarie Research produces a variety of research products including, but not limited to, fundamental analysis, macro-economic analysis, quantitative analysis, and trade ideas. Recommendations contained in one type of research product may differ from recommendations contained in other types of research, whether as a result of differing time horizons, methodologies, or otherwise. Before making an investment decision on the basis of this research, you need to consider, with or without the assistance of an adviser, whether the advice is appropriate in light of your particular investment needs, objectives and financial circumstances. There are risks involved in securities trading. The price of securities can and does fluctuate, and an individual security may even become valueless. International investors are reminded of the additional risks inherent in international investments, such as currency fluctuations and international stock market or economic conditions, which may adversely affect the value of the investment. This research is based on information obtained from sources believed to be reliable but we do not make any representation or warranty that it is accurate, complete or up to date. We accept no obligation to correct or update the information or opinions in it. Opinions expressed are subject to change without notice. No member of the Macquarie Group accepts any liability whatsoever for any direct, indirect, consequential or other loss arising from any use of this research and/or further communication in relation to this research. Clients should contact analysts at, and execute transactions through, a Macquarie Group entity in their home jurisdiction unless governing law permits otherwise. The date and timestamp for above share price and market cap is the closed price of the price date. #CLOSE is the final price at which the security is traded in the relevant exchange on the date indicated. Members of the Macro Strategy team are Sales & Trading personnel who provide desk commentary that is not a product of the Macquarie Research department or subject to FINRA Rule 2241 or any other regulation regarding independence in the provision of equity research. Country-specific disclaimers: Australia: In Australia, research is issued and distributed by Macquarie Securities (Australia) Ltd (AFSL No. 238947), a participating organization of the Australian Securities Exchange. Macquarie Securities (Australia) Limited staff involved with the preparation of research have regular interaction with companies they cover. Additionally, Macquarie Group Limited does and seeks to do business with companies covered by Macquarie Research. There are robust information barriers in place to protect the independence of Macquarie Research’s product. However, recipients of Macquarie Research should be aware of this potential conflict of interest. New Zealand: In New Zealand, research is issued and distributed by Macquarie Securities (NZ) Ltd, a NZX Firm. Canada: In Canada, research is prepared, approved and distributed by Macquarie Capital Markets Canada Ltd., a (i) member of the Investment Industry Regulatory Organization of Canada and the Canadian Investor Protection Fund, and (ii) participating organisation of the Toronto Stock Exchange, TSX Venture Exchange & Montréal Exchange. This research is distributed in the United States, as third party research by Macquarie Capital Markets North America Ltd., which is a registered broker-dealer and member of Financial Industry Regulatory Authority and the Securities Investor Protection Corporation. Macquarie Capital Markets North America Ltd. accepts responsibility for the contents of reports issued by Macquarie Capital Markets Canada Ltd. in the United States and sent to US persons. Any US person wishing to effect transactions in the securities described in the reports issued by Macquarie Capital Markets Canada Ltd. should do so with Macquarie Capital Markets North America Ltd. This research is intended for distribution in the United States only to major Institutional Investors (as such term is defined in SEC 15a-6 and Section 15 of the Securities Exchange Act of 1934, as amended) and is not intended for the use of any person or entity that is not a major institutional investor. Research analysts of Macquarie Capital Markets Canada Ltd. are not registered/qualified as research analysts with FINRA. The Research Distribution Policy of Macquarie Capital Markets Canada Ltd. is to allow all clients that are entitled to have equal access to our research. United Kingdom: In the United Kingdom, research is issued and distributed by Macquarie Capital (Europe) Ltd, which is authorised and regulated by the Financial Conduct Authority (No. 193905). Germany: In Germany, this research is issued and/or distributed by Macquarie Capital (Europe) Limited, Niederlassung Deutschland, which is authorised and regulated by the UK Financial Conduct Authority (No. 193905). and in Germany by BaFin. France: In France, research is issued and distributed by Macquarie Capital (Europe) Ltd, which is authorised and regulated in the United Kingdom by the Financial Conduct Authority (No. 193905). Hong Kong & Mainland China: In Hong Kong, research is issued and distributed by Macquarie Capital Limited, which is licensed and regulated by the Securities and Futures Commission. In Mainland China, Macquarie Securities (Australia) Limited Shanghai Representative Office only engages in non-business operational activities excluding issuing and distributing research. Only non-A share research is distributed into Mainland China by Macquarie Capital Limited. Japan: In Japan, research is Issued and distributed by Macquarie Capital Securities (Japan) Limited, a member of the Tokyo Stock Exchange, Inc. and Osaka Exchange, Inc. (Financial Instruments Firm, Kanto Financial Bureau (kin-sho) No. 231, a member of Japan Securities Dealers Association). India: In India, research is issued and distributed by Macquarie Capital Securities (India) Pvt. Ltd. (CIN: U65920MH1995PTC090696), 92, Level 9, 2 North Avenue, Maker Maxity, Bandra Kurla Complex, Bandra (East), Mumbai – 400 051, India, which is a SEBI registered Research Analyst having registration no. INH000000545. Malaysia: In Malaysia, research is issued and distributed by Macquarie Capital Securities (Malaysia) Sdn. Bhd. (Company registration number: 463469-W) which is a Participating Organisation of Bursa Malaysia Berhad and a holder of Capital Markets Services License issued by the Securities Commission. Taiwan: In Taiwan, research is issued and distributed by Macquarie Capital Limited, Taiwan Securities Branch, which is licensed and regulated by the Financial Supervisory Commission. No portion of the report may be reproduced or quoted by the press or any other person without authorisation from Macquarie. Nothing in this research shall be construed as a solicitation to buy or sell any security or product. The recipient of this report shall not engage in any activities which may give rise to potential conflicts of interest to the report. Research Associate(s) in this report who are registered as Clerks only assist in the preparation of research and are not engaged in writing the research. Macquarie may be in past one year or now being an Issuer of Structured Warrants on securities mentioned in this report. Thailand: In Thailand, research is produced, issued and distributed by Macquarie Securities (Thailand) Ltd. Macquarie Securities (Thailand) Ltd. is a licensed securities company that is authorized by the Ministry of Finance, regulated by the Securities and Exchange Commission of Thailand and is an exchange member of the Stock Exchange of Thailand. The Thai Institute of Directors Association has disclosed the Corporate Governance Report of Thai Listed Companies made pursuant to the policy of the Securities and Exchange Commission of Thailand. Macquarie Securities (Thailand) Ltd does not endorse the result of the Corporate Governance Report of Thai Listed Companies but this Report can be accessed at: http://www.thai-iod.com/en/publications.asp?type=4. South Korea: In South Korea, unless otherwise stated, research is prepared, issued and distributed by Macquarie Securities Korea Limited, which is regulated by the Financial Supervisory Services. Information on analysts in MSKL is disclosed at http://dis.kofia.or.kr/websquare/index.jsp?w2xPath=/wq/fundMgr/DISFundMgrAnalystStut.xml&divisionId=MDIS03002001000000&serviceId=SDIS03002001000. South Africa: In South Africa, research is issued and distributed by Mazi Macquarie Securities (RF) (Pty) Ltd, a member of the JSE Limited. Singapore: In Singapore, research is issued and distributed by Macquarie Capital Securities (Singapore) Pte Ltd (Company Registration Number: 198702912C), a Capital Markets Services license holder under the Securities and Futures Act to deal in securities and provide custodial services in Singapore. Pursuant to the Financial Advisers (Amendment) Regulations 2005, Macquarie Capital Securities (Singapore) Pte Ltd is exempt from complying with sections 25, 27 and 36 of the Financial Advisers Act. All Singapore-based recipients of research produced by Macquarie Capital (Europe) Limited, Macquarie Capital Markets Canada Ltd, Mazi Macquarie Securities (RF) (Pty) Ltd and Macquarie Capital (USA) Inc. represent and warrant that they are institutional investors as defined in the Securities and Futures Act. United States: In the United States, research is issued and distributed by Macquarie Capital (USA) Inc., which is a registered broker-dealer and member of FINRA. Macquarie Capital (USA) Inc, accepts
Macquarie Research Ctrip.com International
6 September 2018 9
responsibility for the content of each research report prepared by one of its non-US affiliates when the research report is distributed in the United States by Macquarie Capital (USA) Inc. Macquarie Capital (USA) Inc.’s affiliate’s analysts are not registered as research analysts with FINRA, may not be associated persons of Macquarie Capital (USA) Inc., and therefore may not be subject to FINRA rule restrictions on communications with a subject company, public appearances, and trading securities held by a research analyst account. Information regarding futures is provided for reference purposes only and is not a solicitation for purchases or sales of futures. Any persons receiving this report directly from Macquarie Capital (USA) Inc. and wishing to effect a transaction in any security described herein should do so with Macquarie Capital (USA) Inc. Important disclosure information regarding the subject companies covered in this report is available at www.macquarie.com/research/disclosures, or contact your registered representative at 1-888-MAC-STOCK, or write to the Supervisory Analysts, Research Department, Macquarie Securities, 125 W.55th Street, New York, NY 10019. © Macquarie Group
Equities
Asia Research Head of Equity Research
Jake Lynch (Asia – Head) (852) 3922 3583
Hiroyuki Sakaida (Japan – Head) (813) 3512 6695
Conrad Werner (ASEAN – Head) (65) 6601 0182
Automobiles, Auto Parts
Janet Lewis (China, Japan) (813) 3512 7856
Allen Yuan (China) (8621) 2412 9009
James Hong (Korea) (822) 3705 8661
Amit Mishra (India) (9122) 6720 4084
Banks and Financials
Scott Russell (Asia) (852) 3922 3567
Dexter Hsu (China, Taiwan) (8862) 2734 7530
Keisuke Moriyama (Japan) (813) 3512 7476
Chan Hwang (Korea) (822) 3705 8643
Suresh Ganapathy (India) (9122) 6720 4078
Jayden Vantarakis (Indonesia) (6221) 2598 8310
Anand Pathmakanthan (Malaysia) (603) 2059 8833
Gilbert Lopez (Philippines) (632) 857 0892
Ken Ang (Singapore) (65) 6601 0836
Peach Patharavanakul (Thailand) (662) 694 7753
Basic Materials, Commodities
David Ching (China, Hong Kong) (852) 3922 1823
Yasuhiro Nakada (Japan) (813) 3512 7862
Anna Park (Korea) (822) 3705 8669
Sumangal Nevatia (India) (9122) 6720 4093
Jayden Vantarakis (Indonesia) (6221) 2598 8310
Farrah Aqlima (Malaysia) (603) 2059 8987
Conglomerates
David Ng (China, Hong Kong) (852) 3922 1291
Gilbert Lopez (Philippines) (632) 857 0892
Conrad Werner (Singapore) (65) 6601 0182
Consumer, Gaming
Linda Huang (Asia) (852) 3922 4068
Zibo Chen (China, Hong Kong) (852) 3922 1130
Terence Chang (China, Hong Kong) (852) 3922 3581
Sunny Chow (China, Hong Kong) (852) 3922 3768
Stella Li (China, Taiwan) (8862) 2734 7514
Leon Rapp (Japan) (813) 3512 7879
Kwang Cho (Korea) (822) 3705 4953
Amit Sinha (India) (9122) 6720 4085
Robert Pranata (Indonesia) (6221) 2598 8366
Richardo Walujo (Indonesia) (6221) 2598 8369
Denise Soon (Malaysia) (603) 2059 8845
Karisa Magpayo (Philippines) (632) 857 0899
Chalinee Congmuang (Thailand) (662) 694 7993
Emerging Leaders
Jake Lynch (Asia) (852) 3922 3583
Kwang Cho (Korea) (822) 3705 4953
Corinne Jian (Greater China) (8862) 2734 7522
Conrad Werner (ASEAN) (65) 6601 0182
Bo Denworalak (Thailand) (662) 694 7774
Infrastructure, Industrials, Transportation
Patrick Dai (China) (8621) 2412 9082
Eric Zong (China, Hong Kong) (852) 3922 4749
Kunio Sakaida (Japan) (813) 3512 7873
James Hong (Korea) (822) 3705 8661
Corinne Jian (Taiwan) (8862) 2734 7522
Inderjeetsingh Bhatia (India) (9122) 6720 4087
Azita Nazrene (ASEAN) (65) 6601 0560
Internet, Media and Software
Wendy Huang (Asia) (852) 3922 3378
Marcus Yang (Greater China) (8862) 2734 7532
John Wang (Hong Kong) (852) 3922 3578
Ellie Jiang (Hong Kong) (852) 3922 4110
Alankar Garude (India) (9122) 6720 4134
Oil, Gas and Petrochemicals
Aditya Suresh (Asia) (852) 3922 1265
Anna Park (Asia) (822) 3705 8669
Yasuhiro Nakada (Japan) (813) 3512 7862
Corinne Jian (Taiwan) (8862) 2734 7522
Ben Shane Lim (Malaysia) (603) 2059 8868
Yupapan Polpornprasert (Thailand) (662) 694 7729
Pharmaceuticals and Healthcare
David Ng (China, Hong Kong) (852) 3922 1291
Xiang Gao (China, Hong Kong) (8621) 2412 9006
Corinne Jian (China) (8862) 2734 7522
Alankar Garude (India) (9122) 6720 4134
Richardo Walujo (Indonesia) (6221) 259 88 369
Property, REIT
Tuck Yin Soong (Asia, Singapore) (65) 6601 0838
David Ng (China, Hong Kong) (852) 3922 1291
Kelvin Tam (China) (852) 3922 1181
Keisuke Moriyama (Japan) (813) 3512 7476
Tomoyoshi Omuro (Japan) (813) 3512 7474
Abhishek Bhandari (India) (9122) 6720 4088
Richard Danusaputra (Indonesia) (6221) 2598 8368
Aiman Mohamad (Malaysia) (603) 2059 8986
Kervin Sisayan (Philippines) (632) 857 0893
Bo Denworalak (Thailand) (662) 694 7774
Technology
Damian Thong (Asia, Japan) (813) 3512 7877
Allen Chang (Greater China) (852) 3922 1136
Jeffrey Ohlweiler (Greater China) (8862) 2734 7512
Chris Yu (Greater China) (8621) 2412 9024
Kaylin Tsai (Greater China) (8862) 2734 7523
Lynn Luo (Greater China) (8862) 2734 7534
Patrick Liao (Greater China) (8862) 2734 7515
Verena Jeng (Greater China) (852) 3922 3766
Daniel Kim (Korea) (822) 3705 8641
Abhishek Bhandari (India) (9122) 6720 4088
Farrah Aqlima (Malaysia) (603) 2059 8987
Telecoms
Allen Chang (Greater China) (852) 3922 1136
Prem Jearajasingam (ASEAN) (603) 2059 8989
Nathania Nurhalim (Indonesia) (6221) 2598 8365
Kervin Sisayan (Philippines) (632) 857 0893
Utilities, Renewables
Hiroyuki Sakaida (Japan) (813) 3512 6695
Patrick Dai (China) (8621) 2412 9082
Inderjeetsingh Bhatia (India) (9122) 6720 4087
Karisa Magpayo (Philippines) (632) 857 0899
Strategy, Country
Viktor Shvets (Asia, Global) (852) 3922 3883
David Ng (China, Hong Kong) (852) 3922 1291
Hiroyuki Sakaida (Japan) (813) 3512 6695
Chan Hwang (Korea) (822) 3705 8643
Jeffrey Ohlweiler (Taiwan) (8862) 2734 7512
Inderjeetsingh Bhatia (India) (9122) 6720 4087
Conrad Werner (ASEAN, Singapore) (65) 6601 0182
Jayden Vantarakis (Indonesia) (6221) 2598 8310
Anand Pathmakanthan (Malaysia) (603) 2059 8833
Gilbert Lopez (Philippines) (632) 857 0892
Peach Patharavanakul (Thailand) (662) 694 7753
Find our research at Macquarie: www.macquarieresearch.com Thomson: www.thomson.com/financial Reuters: www.knowledge.reuters.com Bloomberg: MAC GO Factset: http://www.factset.com/home.aspx CapitalIQ www.capitaliq.com Email [email protected] for access
Asia Sales Regional Heads of Sales
Miki Edelman (Global) (1 212) 231 6121
Amelia Mehta (Asia) (65) 6601 0211
Alan Chen (Asia) (852) 3922 2019
Sandeep Bhatia (India) (9122) 6720 4101
Tim Huang (Indonesia) (6221) 2598 8303
Thomas Renz (Geneva) (41 22) 818 7712
Tomohiro Takahashi (Japan) (813) 3512 7823
John Jay Lee (Korea) (822) 3705 9988
Nik Hadi (Malaysia) (603) 2059 8888
Gino C Rojas (Philippines) (632) 857 0861
Regional Heads of Sales cont’d
Paul Colaco (San Francisco) (1 415) 762 5003
Eric Lin (Taiwan) (8862) 2734 7590
Angus Kent (Thailand) (662) 694 7601
Mothlib Miah (UK/Europe) (44 20) 3037 4893
Christina Lee (US) (44 20) 3037 4873
Sales Trading
Mark Weekes (Asia) (852) 3922 2084
Stanley Dunda (Indonesia) (6221) 515 1555
Sales Trading cont’d
Suhaida Samsudin (Malaysia) (603) 2059 8888
Michael Santos (Philippines) (632) 857 0813
Chris Reale (New York) (1 212) 231 2555
Marc Rosa (New York) (1 212) 231 2555
Justin Morrison (Singapore) (65) 6601 0288
Brendan Rake (Thailand) (662) 694 7707
Mike Keen (UK/Europe) (44 20) 3037 4905
This publication was disseminated on 06 September 2018 at 10:02 UTC.