CSU Sacramento
107
CSU Sacramento College of Engineering & Computer Science End of Project Documentation B.A.N.E Benign Autonomous Neural Environment 05/02/22 Team 1 Team Members: Ramsey Alahmad, Justin Roldan, Shaan Wadhwa, Zaid Elias Instructor: Professor Tatro
-
Upload
khangminh22 -
Category
Documents
-
view
1 -
download
0
Transcript of CSU Sacramento

CSU Sacramento
College of Engineering & Computer Science
End of Project Documentation
B.A.N.E
Benign Autonomous Neural Environment
05/02/22
Team 1
Team Members: Ramsey Alahmad, Justin Roldan, Shaan Wadhwa, Zaid Elias
Instructor: Professor Tatro

i
TABLE OF CONTENTS
TABLE OF CONTENTS .................................................................................................................................. i
TABLE OF FIGURES ................................................................................................................................... iii
TABLE OF TABLES ....................................................................................................................................... v
EXECUTIVE SUMMARY ............................................................................................................................vii
ABSTRACT ..................................................................................................................................................... 1
I. INTRODUCTION ..................................................................................................................................... 1
A. Societal Problem ................................................................................................................................. 1
A. Design Idea ......................................................................................................................................... 2
B. Work Breakdown Structure ................................................................................................................ 2
C. Project Timeline ................................................................................................................................. 3
D. Risk Assessment ................................................................................................................................. 3
E. Problem Statement Revision .............................................................................................................. 4
F. Device Test Plan ................................................................................................................................. 4
G. Market Review .................................................................................................................................... 5
H. Testing Results .................................................................................................................................... 5
I. End of Project Documentation ........................................................................................................... 5
II. SOCIETAL PROBLEM ......................................................................................................................... 7
A. First Semester Interpretation of the Societal Problem ........................................................................ 7
B. Second Semester Improved Interpretation of Societal Problem ....................................................... 11
III. DESIGN IDEA ..................................................................................................................................... 16
A. Design Philosophy ............................................................................................................................ 16
B. Specific Design Components ............................................................................................................ 17
IV. FUNDING ............................................................................................................................................ 22
V. WORK BREAKDOWN STRUCTURE .............................................................................................. 23
VI. PROJECT MILESTONES AND TIMELINE ...................................................................................... 31
VII. RISK ASSESSMENT .......................................................................................................................... 36
A. Specific Technical Risks ................................................................................................................... 36
B. Broader Technical Risks ................................................................................................................... 38
C. Systematic Risks .............................................................................................................................. 39
VIII. DEPLOYABLE PROTOTYPE STATUS ........................................................................................ 41
IX. MARKETABILITY FORECAST ........................................................................................................ 48
X. CONCLUSION .................................................................................................................................... 52
A. Societal Problem ............................................................................................................................... 52

ii
B. Design Idea ....................................................................................................................................... 52
C. Work Breakdown Structure .............................................................................................................. 52
D. Project Timeline ................................................................................................................................ 53
E. Risk Assessment ............................................................................................................................... 53
F. Problem Statement Revision ............................................................................................................ 54
G. Device Test Plan ............................................................................................................................... 54
H. Market Review .................................................................................................................................. 54
I. Testing Results ................................................................................................................................. 55
J. End of Project Documentation ......................................................................................................... 56
REFERENCES ............................................................................................................................................... 58
GLOSSARY ................................................................................................................................................... 61
Appendix A. Hardware ................................................................................................................................A-1
Appendix B. Software .................................................................................................................................. B-1
Appendix C. Mechanical Aspect .................................................................................................................. C-1
Appendix D. Work Breakdown Structure ....................................................................................................D-1
Appendix E. Timeline Charts and PERT Diagram ...................................................................................... E-1
Appendix F. Resumes .................................................................................................................................. F-1
Appendix G. Vendor Contacts .....................................................................................................................G-1
Appendix H. Device Test Timeline ..............................................................................................................H-1
Appendix I. SWOT Analysis ........................................................................................................................ I-1

iii
TABLE OF FIGURES
Fig. 1. Zoonotic Emergencies….………………………………………………………………...…………...7
Fig. 2. Urbanization…………….……………...……………………………………………...……………...7
Fig. 3. Mask Wearing Effacacy Scenarios…………..……………………………………..…………….....8
Fig. 4. Transmission With and Without Masks……….…………………………………..………..……....9
Fig. 5. Mask Non-Linearity………………….…………………………………………...…………………10
Fig. 6. Initial Unemployment Claims and Vulnerable Jobs……………………..……..…………………...10
Fig. 7. Case Trends Before and After Mask Mandate………….……………………..……………………11
Fig. 8. Simple Neural Network graph……………………….………………………..…………………….12
Fig. 9. Business Industries that Reported Loss of Revenue………………………...………………………13
Fig. 10. Households Reporting Having Not Enough Food………………………..………………………..13
Fig. 11. Survey of Effect of Lifting Mask Mandates……………………………..………………………...14
Fig. 12. Effect of Lifting Mask Mandates……………………………………...…………………………...14
Fig. 13. Outbreak Data by Industry Sector…………………………………..……………………………..15
Fig. 14. Survey by the World Economic Forum…………………………..………………………………..48
Fig. A1. Overview of Diagram of Prototype...…………………………………………………………….A-1
Fig. A2. Jetson Nano Top Down View...………………………………………………………………….A-1
Fig. A3. C922 PRO HD Stream 1080p USB Logitech Camera…...……………………………………....A-2
Fig. A4. SONY SRSZ50 Speaker………………………………………………………………...….…….A-2
Fig. A5. PCA9685 16 Channel 12-Bit PWM Servo Motor Driver………………………………...……...A-2
Fig. A6. Hitech HS-422 Servo Motor……………………………………………………………….…….A-3
Fig. A7. MLX90640 Thermal Camera………………………………………………………………...…..A-3
Fig. B1. AI Algorithm Flowchart……………………………………………………………………….....B-1
Fig. B2. AI Training for Loss & Accuracy…………………………………………………..…………....B-2
Fig. B3. Temperature Sensor Flowchart………………………………………………………..…………B-3
Fig. C1. Servo Stand with Tripod………………………………………………………………..………..C-1

iv
Fig. C2. Servo Driver Connected to Jetson Nano……………………………………………..…………..C-2

v
TABLE OF TABLES
TABLE I. Punch List………………………………………………………………………………………..17
TABLE II. Budget List….…..………………………………………………………………………………22
TABLE III. Risk Assessment Matrix….……………………………………………………………………36
TABLE IV. Level Impact Descriptions for Risk Assessment………………………………………………36
TABLE V. Letter Symbolization……………………………………………………………………………36
TABLE VI. Average Accuracy Across Variations of Masks……….………………………………………42
TABLE VII. Distance Measured for Region of Interest…………….………………………………………42
TABLE VIII. Only Single Region of Interest Test………………….………………………………………43
TABLE IX. Thermal Camera Accuracy…………………………….………………………………………43
TABLE X. Thermal Camera Accuracy at Distance………………………………………………………...44
TABLE XI. Thermal Camera Accuracy with Mask……………………...…………………………………45
TABLE A-I. Temperature Sensor Accuracy…………………………...………………………………….A-4
TABLE A-II. Temperature Sensor Accuracy at Distance…………..……………………………………..A-4
TABLE A-III. Temperature Sensor with Mask…………………………...……………………………….A-4
TABLE B-I. Average Accuracy Across Variations of Masks…………….…………………………….…B-2
TABLE B-II. How long in Distance the AI can Detect a Region of Interest……………………………...B-3
TABLE B-III. AI Detecting Only One Client After Seeing Multiple Region of Interests in its View……B-3
TABLE D-I. Work Breakdown Structure for Features of Project………...………………………………D-1
TABLE D-II. Work Breakdown Structure for Future Assignments……...…......………………………...D-2
TABLE E-I. Project Timeline GANTT Chart…..………………...……………………………….….…...E-3
TABLE E-II. Detailed Tasks for Project Timeline GANTT Chart…………………...……...……...….…E-4
TABLE E-III. Detailed Tasks for Fall 2021 Assignment GANTT Chart….…………………..……...…...E-4
TABLE E-IV. Detailed Tasks for Spring 2022 GANTT Chart……………………………..……………..E-5

vi
TABLE E-V. Milestone PERT Diagram for Project……………...……………………….…………...….E-6
TABLE E-VI. Fall 2021 Assignments PERT Diagram...……………………..……….………….....…….E-7
TABLE E-VII. Spring 2022 Assignments PERT Diagram.…………...……………………….………….E-8
TABLE H-I. Device Test Timeline Chart……...………………………………………………………….H-1
TABLE I-I. SWOT Analysis Chart………………………………………………………………….......….I-1

vii
EXECUTIVE SUMMARY
Elevator Pitch: We are aiding businesses to monitor their customers and employees for compliance with
government-imposed mask mandates.
As the COVID-19 pandemic continues to threaten businesses, society must understand that this pandemic
is not just a random occurrence, but a growing and persistent threat to global welfare. The government
imposed pandemic restrictions, such as mask mandates, help society due to the efficacy of masks, but also
harm businesses. Engineers should aid businesses in ensuring that they foster a safe and legally compliant
workplace for customers and employees.
When creating our solution for businesses we focused on choosing hardware and software that properly
fulfil not only our goal of creating a face mask detector, but also on creating an accessible and efficient
solution. Once deciding on our hardware and software, we deliberated over features that we could
implement into our overall design to improve the scope and functionality of the product. We decided on
which features we could implement given our skills, resources, and the capability of measuring and testing
the feature. We acknowledged one another's strengths in either software or hardware interfacing and
assigned project responsibilities accordingly.
To improve our workflow and clearly define the outlook for the project and the group members’
responsibilities, we created a work breakdown structure. The work breakdown structure was broken down
first according to the design’s core features: the system’s individual detection, the system’s user interaction,
the physical mounting of the camera, and the fever temperature screening. We then further broke the
features into specific subtasks. The work breakdown structure allowed us to properly assign roles and set a
roadmap for product design.
To make a projection and forecast the future of our project we created a model for our project timeline.
The concept of our project timeline model was to divide certain features into tasks, and further break down
each task into work packages that are assigned to group members according to skill and comfort level. The
GANTT and PERT charts will aid us in fulfilling the projected timeline by giving us both a top-down
breakdown of our features and a timeline of when to complete each milestone.
To improve our workflow and better model the paths and potential pitfalls of our product development
process, we developed a Risk Assessment. The Risk Assessment is a broad view of all potential risks that
we can face in our project ranging from specific technical risks such as improperly working parts, to broad
technical risks that deal with deficiencies in a component or its implementation, and finally systematic risks
that are out of the control of the group members. With our project having many moving parts and many
unpredictable factors, it became increasingly necessary to develop a method for identifying risks that exist
along the critical path of our product development.
For our design there are four broader components to run tests on: artificial intelligence mask detection,
the thermal infrared camera, the rotating servo motor, and the user interface. The creation of a device test
plan provided a clear method for the product's features and measurable metrics to be confirmed or denied as
well as allowing the product to progress towards market review.
As the product development lifecycle approaches the prototype deployment stage, it is essential that we
as designers gauge the market that our product fills. We summarized our market review for our product by
creating a SWOT analysis that related the strengths, weaknesses, opportunities, and threats that our product
has. This market review process helped us as engineers determine the feasibility of our product when it
comes time for prototype deployment.
Given the quantitative nature of our device test plan, we needed to test our feature against our predefined
measurable metrics and aggregate the results. All tests returned successful results and satisfied the
measurable metrics. Overall, the device test plan was closely followed, and the test results of our features
satisfied our measurable metrics.

1
ABSTRACT
Over two years since COVID-19 was declared as
a pandemic, society is still in a position where
orders are needed to be put in place to prevent the
spreading of this virus. Face mask mandates play a
large role in trying to provide a form of safety to
citizens of states that have mask mandates in effect.
Alongside the state enforced face mask mandates,
private businesses also have the option to enforce a
mandate for facemasks to limit possible spreading
of a respiratory epidemic. With the use of computer
vision, or computers gaining high level image and
video understanding, our team has created a
product to determine if each person who is entering
a private business is wearing a mask or not. This
provides a solution for enforcing a private
business’s face mask mandate to protect both
customers and employees. Project B.A.N.E offers a
face mask detection algorithm with a 97%
confidence level, servo motors to properly tilt and
pan the camera to track the user’s face, a user
interface that tells the user whether they are
properly wearing a mask or not, and a thermal
sensor with +/- 1 degree F offset which measures
the user’s temperature to monitor if the user is in
fever range. Project B.A.N.E is a product that will
reduce the spread of respiratory epidemics such as
COVID-19 by enforcing face mask guidelines
autonomously and limit the need for close quarters
contact between employees and customers.
INDEX TERMS— Computer Vision, Face Mask
Mandate, Respiratory Epidemic, Deep Learning,
Pandemic, COVID-19, GPIO, Vulnerable jobs,
Unemployment
I. INTRODUCTION
A. Societal Problem
Society has been involved in a pandemic for
nearly two years. Hearing the word “COVID-19”,
several thoughts may come to mind such as fear,
panic, worry, or death. Such a strain of a virus has
disrupted the norms of our society, it has impacted
everyone in some way, mentally, financially, having
to die in isolation to not further spread the virus.
Likewise, as there became panic of hearing the
word “COVID-19”, each day, people began to
wonder what this virus is, its origins, how it
spreads, what can be done in the meantime to
prevent further spread. Generally known, is that the
virus is transmitted to another in respiratory
droplets. The virus can spread when an infected
person coughs or sneezes and spreads such droplets
in the air that can be caught onto individuals [1].
Likewise, the sooner the information of the topic
has been discussed, humanity was quick to adapt to
the situation. Society followed general patterns of
protocols when dealing with a virus, which include
keeping a distance, practicing safe hygiene, etc.
Further, as to how safe practices are performed, this
virus isn’t going any way anytime soon, considering
how the same practices are being dealt with for this
pandemic as of now will most likely repeat for
future pandemics since there’s a 2% chance every
year, and 40% chance every 20 years [2].
Unfortunately, COVID-19, has disrupted day to
day activities. Public places are either shut down or
can’t be enjoyed to normalcy, jobs must be beat
around the bush and be remote. There is an
inconvenience in socialization as everyone must be
widespread apart to practice safe hygiene in such a
time. And despite how vaccines are readily
available for the public, people can make the choice
whether to take it. By not taking it, it unfortunately
wreaks havoc on flattening the rate for the number
of cases there are and may even lead to mutations
introduced which can further prolong the state of
the pandemic. However, it does seem that to put the
best effort in stopping the pandemic it is to be
vaccinated and follow safety protocols whilst
wearing a mask. The least amount of effort that can
be done would be just wearing a mask. Even though
some people may not be infected with COVID-19
and may not feel the need to wear a mask, they
could be asymptotic and be able to spread
respiratory droplets on individuals and spread
further. Hence, why places require such masks to be
worn, to slow the spread.
Given enough knowledge that COVID-19 is
spread through respiratory droplets, masks were
seen as a vital way to help reduce of the virus.

2
Considering that the virus is respiratory, it can
easily spread from the mouth or nose, masks can
stop it from exiting the body through its layers of
materials. Thus, if someone sneezed or cough, the
droplets coming from the body are extremely
minimal. However, that’s not to say they are 100%
effective, they just slow the spread, and some
respiratory droplets can still go through. The
droplets are invisible to the eye and need
magnification to see. Surfaces having a chance to
contain COVID-19 bacteria make it extremely
difficult to avoid, and as we commonly touch our
face it is easy for the virus to slip through.
The worst part is that not only does it easily
spreads, but everyone’s body reacts differently
towards it with or without knowing which further
worsens the issue. Hence why it is so stressed out to
wear a mask in the case of how easily spreads is.
A. Design Idea
As the world is currently dealing with the
pandemic, restrictions were put in place. This is so
that it minimizes the rate or further transmission of
the virus, which include curfews, social distancing,
and most of all, wearing a mask. Despite vaccines
being widely available today, people unfortunately
have the power of choice to not take them as they
are not mandated to be taken. However, there is still
some form of mask mandate put in place one way or
another, whether nationwide, statewide, or even in
some places. Such mandates are put in places
considering human contact is inevitable. Even if an
individual may not feel the symptoms of the virus,
they may be asymptotic which puts others in
dangers, or may every so often touch surfaces,
which may contain the virus, then leads to
commonly touching their face without realizing it.
Hence why it is important to follow suggested CDC
guidelines to not risk transmitting or being
transmitted the virus.
Having to check for every person in place if they
are wearing a mask can be tiring, and even a risk
since there needs to be some form of human-to-
human interaction for there to ensure that someone
is wearing a mask, which again can put others
around them at risk. While yes, lockdown may help
slow the spread and offer little to no interaction as
possible, it’s inevitable to a matter of when
businesses and places reopening as it does indeed
hurt the economy. To provide a solution towards
this, the idea is to use some form of hardware and
software alike. This may include some facial
recognition algorithm that is able to detect who is
wearing a mask or not. The algorithm can handle
non-contactless human interactions which can keep
the employee checking for mask safe as they don’t
have to interact with a human which further
practices safe guidelines recommended by the CDC.
B. Work Breakdown Structure
Considering our group contains a fair and equal
amount of CPEs and EEEs, we decide to leave the
hardware components towards the EEEs and the
software side of things towards the CPEs. The
essence of the work breakdown structure is that it is
divide the broad features that revolve around the
project. However, first, we got to know each other’s
skills and weaknesses when it came towards
hardware and software. We wouldn’t want to have
someone who is weak in one area work on
something they aren’t familiar with. To get equal
amount of software and hardware, we decided that
we allow the EEEs to research what they thought
was important for the feature, and vice versa when
it comes towards the CPEs. What we came up with
is the idea of breaking down the tasks into further
tasks, to create a web-like style approach. How it
works is there would be one broad feature, which
then gets into the specifics, and further gets down to
more specifics that make up that feature. Our group
organized our workflow by assigning specific tasks
to one another according to their skills and comfort
level. It doesn’t have to be one person being
overwhelmed by the entire feature. For example,
instead of assigning an EEE in the group produce
the code to make the camera track the face, the
feature would be broken down to where someone
who is skilled enough in software develop the face
tracking and be able to pass onto the code towards
the member who is skilled enough in hardware thus
making the feature complete. This is so that it
alleviates the idea of being overwhelmed, utilizes
communication, and aids in lowering the number of
hours getting a feature completely done compared
to assigning a member to completely implement a
feature. Regarding the features, it’s decided that
Ramsey Alahmad and Justin Roldan will produce
the software components and subtasks, which then

3
leads to Zaid Elias and Shaan Wadhwa for the
hardware aspects like the servo motors to work in
conjunction with the code and wiring. As for
majority of the writing assignments, to prevent
appointing a scriber to being overwhelmed by
writing, we decided that each person gets a part to
do regarding the assignment. Like one person writes
the intro, abstract, etc. However, everyone in the
group pitches in towards the section the assignment
was dedicated towards.
C. Project Timeline
When discussing about the main features the
project should have, it mainly involved machine
learning and a camera in some way. However, each
of us had different ideas on what we should do with
the camera. Instead of assigning and waiting for
each feature finished completely and passed on to
the next member, we thought it was best to divide
work packages sequentially by work weeks. This is
so that each work week can be devoted towards a
work package that can be focused on by each
member before we blindly continue with another
work package that is yet to be completed. It is also
to prevent further chances of delaying features in
circles and being able to not get anything done.
The best way to visualize the progress of the
project would be the usage of a GANTT chart. It
displayed work packages in a timeline fashion and
what each task needed to be complete by each week
alongside doing further analyzation on work
packages on work week to find the priority. To
begin with, our project revolves mainly around the
camera. We can’t all focus on one big task to get
things done since there are many features to go
along with it. Work packages allow us to develop
steady progress that led up towards the big feature
for that project to be finished. For example,
considering there is an equal number of main
features that can be assigned to each person, it’d be
unfair to do that since it can be overwhelming. So,
to allow work packages to build up towards that
feature with consistent pacing would be a good
idea. On top of that, we also decided to include
future written assignments to help us indicate where
our project progress should be. Besides depending
on the GANTT chart, there is a PERT chart. This is
so that it gives us an idea on where realistically we
are heading towards a milestone and what we want
to achieve towards the closest milestone in hoping
of making remarkable progress. By taking the steps
to using these charts to ensure the success of current
work packages, we hope by this first semester is to
create some form of prototype that demonstrates the
features, and by second semester a polished and
deployable product. However, this would only be
achievable by organizing the design process and
checking in with our team members regarding the
tasks involved in the workweek. The total amount
of packages there are 33 work packages, and
roughly 111 hours excluding testing tasks to be
finished. Luckily, the work packages were finished
roughly around October 12th – 16th giving us a start
on good progress, and we hope to finish my mid-
February. Though this isn’t set in stone, and it is
subject to change depending on the flow of the tasks
completed.
D. Risk Assessment
Every project contains some form of risk
involved. It is inevitable for there to not be any
risk. Our team had all forms of risks, including
specific technical risk, broader technical risks, and
systematic risks. Thus, we needed to plan things out
accordingly for backup plans just in case those risks
are indeed a reality and executed. Our team got
together and first discussed any outside influences
that could impact our project, such as risk of fire
evacuation, medical procedures, or even a family
crisis. Risks like these would cost us days in
development in terms of the project and could hold
us back on features that were dependent on that
person. So, to prevent such delay we would need to
be notified a day of, or perhaps as soon as possible
and we would assign the absentees parts to another
person who has time for it in order to move
forward. Overall, we had to come up with the idea
of risk mitigation since it would be best to know
what procedures to follow if there’s a roadblock
within our critical paths as referring to Appendix E-
VI. The critical paths were, the core part to our
project towards the features of the punch list,
including the autonomous camera, the AI detecting
mask usage, and the LED/buzzers. Each of these
paths had been analyzed to determine what risk has
or could be involved when developing the features.
Likewise, since there has been development and
issues that had been solved, we were knowledgeable

4
enough of the possible risks, what can be done to
prevent them, but surely that doesn’t mean they
can’t happen again. For example, we analyzed how
there’s a high possibility that a microcontroller
could be bricked and jeopardize the entire project
due to undervoltage, or even with the amount of
hardware that will be added towards the project thus
we need to consider the voltage needed to power
these devices. Unfortunately, this did happen where
the microcontroller would crash and be shut down
since there was not enough voltage being delivered
to the hardware, so as a safety feature it would shut
down. Luckily, there was a feature where the
microcontroller can deliver more power, in which
other pieces of external hardware received and the
risk was overcome. However, in the case that it
does happen again, and the microcontroller is
beyond functioning, we’d have to find another
alternative as soon as possible and use prior
backups of microcontrollers that group members
own. On top of that, we figured that due to social
distancing, how we’re able to pass off the code, and
work on the microcontroller, was that we’d set up a
SSH server that is initialized to a GitHub repository
so that the group members are able to code and
develop on it and continuously uploading it to the
repository so there’s no need to worry about loss of
code. Truly, this idea of risk management allowed
us to realize the scope and magnitude that are bound
to occur within our project. Likewise, dealing with
these risks early and being knowledgeable of how
they happen is better than being unaware of the
unknown in order to help get the bigger picture of
the project. It helps us consider the risks to have a
backup plan and so that things go smooth.
E. Problem Statement Revision
Ever since COVID-19 has been widespread, it has
generated a global attention to emergency in which
the world hasn’t seen before. Industries of various
types were either discontinued or slowed down,
commerce had to be deeply managed, and
businesses had to be quickly adapted to this new
environment which prioritizes safety and health
first. Even so, that COVID-19 is now an epidemic,
that still doesn’t mean that it isn’t deadly in the way
of life. Vaccines have been available for a while
now, CDC guidelines are still in place, and masks
are by far more than a necessity when it comes to
entering places. At this rate, it’s inevitable to when
society accepts that COVID-19 is just something we
must adapt and live with for the rest of our lives
now like the common flu.
Returning from the first semester of senior
design, it is understood that the key point of the
societal problem revolves around mask usage. The
highlight of mask usage as recommended by CDC
guidelines is to prevent and slow the contamination
of COVID-19 as it is easily transmittable, especially
now with easily infectious variants that can
continue to prolong the life of the epidemic. It’s fair
knowledge to recognize that COVID-19 is spread
through respiratory droplets. It can be seen as
critical danger in establishment where people need
to move around in enclosed area as recognizing who
or who doesn’t have the infection is difficult as
some people may even be asymptotic. This risk of
an issue of spreading the virus in enclosed areas
within businesses is mainly what our project design
revolves around. Which indicates that the project
does not need any major changes applied towards it
considering it revolves around having to be placed
in an enclosed area of business. Without having to
risk contact of an employee enforcing CDC
guidelines, nor businesses having to depend on
financial means to have a cost-efficient means of
enforcing CDC guidelines in business.
F. Device Test Plan
The project has now been shifted from the
development stage and is now in the test and
validation process to make certain that measurable
metrics are met and rule out any deficiencies. For
each function of the deployable prototype, many
scenarios were brought up to question. Such
scenarios shall then be put towards the test in
upcoming days to have enough time to validate and
redevelop to prevent any deficiencies down the line.
The reason being that testing is urgent is since the
deployable prototype deals along the lines of
healthcare services alongside economical value in
businesses and areas of interest towards the public.
The idea is that both consumers and businesses
would feel safe to continue business operation
without feeling at risk, thus there is no room for
error in regards to validating the measurable
metrics.

5
Considering the design uses a fair amount of
hardware and software to make the artificial
intelligence functional, there were plentiful of
scenarios that came up that were critical towards the
artificial intelligence. Knowing that the prototype
revolves a key piece around it. Such scenarios
include: obtaining high accuracy for different
variations of masks, how far the region of interest is
detected, temperature variation, etc. Each scenario
of tests was assigned best towards the team
members skills and ability to validate with how
each component was developed by the members.
Majority of validation scenarios are conducted
during the days of 02/07/22 – 02/14/22, so that each
member can have room and time to develop
throughout the rest of the Spring semester.
G. Market Review
When it comes time to developing a product to
release to the market, the developers should also be
concerned regarding the marketability of the
product. The idea may be good, but yet there might
not be enough demand for the product which may
not end up be attractive towards the consumers and
investors of the product. With COVID-19 being
degraded from a pandemic to an epidemic, that
leaves to question on where does the deployable
prototype stand with reference to its market demand
for automation and artificial intelligence? What was
found from the research conducted, was that the
pandemic caved a path for an entirely new industry.
Artificial intelligence and automation are in great
demand knowing how powerful they are when it
comes to streamlining business operations and
saving financial costs, all while performing the
same tasks as a human employee. From this result,
it puts the deployable prototype in the green light,
as to how its core functions of artificial intelligence
and automation are valuable towards areas of
operations. However, before continuing to develop
the product, the development team should consider
further analysis of it, not just on where it stands in
terms of demand, but rather its core strength,
weaknesses, opportunities, and even threats,
especially competition.
H. Testing Results
After coming up with a plan regarding what needs
to be tested, when, and how, it came time to analyze
the results to see if it’s at a standard for the
measurable metrics. Though, before jumping right
into testing, there needed to be some changes to be
made prior. These changes include modifying the
dataset for the AI after realizing that the model was
overtrained and hogging too much performance.
What we did was we lowered the amount of images
there are, to 700 images each, people wearing a
mask and people not wearing a mask. This is so that
our model can be just as precise without having to
compensate for performance/speed, and without
risk of overtraining like our prior model, and to
potentially improve frames per second and the servo
motor skew rate. However, even though there was a
slight performance in frames per second, the skew
rate for the servo motors, didn’t improve as much.
One suggestion was to use a separate power source,
and even then, the Jetson Nano wasn’t able to
recognize the driver for the servo motors, because it
is originally serialized on the microcontroller.
Likewise, the measurable metrics were able to be
met, despite the cosmetic issues that were brought
to attention. The biggest concern revolving around
the testing was mainly the analyzation of the AI, in
regard to if it will meet measurable metrics or not.
Since the core project revolves around AI, all of the
tests needed to pass as soon as possible to give
leeway for further development and improvement.
These major tests include having higher than 97%
accuracy when recognizing different masks,
detecting regions of interest at least 3 feet or more,
stress testing the system, and finding only one
region of interest when there is multiple. Aside
from the major tests, each test was assigned to the
group members that originally worked on
developing the functions of the project and set to
the measurable metric.
I. End of Project Documentation
Looking back at Senior Project since day 1,
there’s a lot of philosophical aspects of it. Some of
which is self-reflectance back on what one is really
are interested in the field, and what’s their passion
is, in order to show understanding. Learning more
about oneself, such as people-skills, and tech skills
as well. We have learned so many skills that we
wouldn’t have expected, as there’s so much more
that goes within a project rather than just flat out
doing it. Some of which is the budget,
communication, time management, and risk
management. Which is often overlooked when it

6
comes towards planning, especially in the industry.
Likewise, now that the deployable prototype has
reached the final stage, it’s best to look back and
reflect what were some things to improve on within
the development of the project. During the
development of the project, COVID-19 was just
about to reach its peak, and yet many stores and
areas were on lockdown until further notice. To
help regulate the spread of COVID-19 and resume
business operations. The most common procedures
to help prevent public areas to become
superspreader events were temperatures being
taken, and the enforcement of masks. This gave the
group an idea to where these tasks can be further
automated through the usage of artificial
intelligence so that employees can resume their
tasks in the workplace without having to face fear
of infection. The group took this opportunity to see
how we can step out of our area of knowledge on
what we know, and take our prior understanding to
apply it towards new topics in regards to
microcontrollers, and artificial intelligence.
How the group began planning towards the
development of the deployable prototype was to
first recognize the strengths and weaknesses of each
group member. From there, each member was
assigned to the core functions of the project. For
example, a group member has experience with AI,
they would be assigned to conducting the AI model.
From there, we predicted that the core functions
would need to be finished as soon as possible before
developing anything further. One of which is that
there needs to be an AI model to be compiled, and
is able to be used before, having to create servo
drivers that track where the user’s face is. As the AI
model is able to control majority of the functions
that the project contains. Due to recognizing how
some functions demanded more priority than the
other, which caused a need for coming up with a
timeline to help us keep on track, and a part of the
timeline to conduct testing. Though, during the
development and validation phase regarding the
timeline, one of the biggest concerns for the project
was being able to improve the skew rate, and the
frames per second. To begin with, the main
predictions for the skew rate of the servo drivers,
were either the voltage, as there are many devices
that draw power out from the Jetson Nano.
Otherwise, it’s how the servo motor drivers depend
on the locations, and since the frame rate is slow, it
further makes the drivers slow in panning and
tilting. A group member tested using an external
power supply towards the GPIO pins of the servo
motor driver, and the driver actually rejected the
usage which overall caused the program to crashed,
as the driver is only serialized to the Jetson Nano.
This only left one option, which was to find a way
to increase the frames per second for the AI model.
One idea was to decrease the model size, which was
helpful, as it leaves room for the AI to work with
without having to overtrain. By doing further
research, it can be found that by using a pre-
compiled XML model, it does all the heavy lifting
by recognizing nodes of the face, while making
comparisons directly of what the model sees. From
doing this, it sees an significant increase in
performance, which further allows the servo motors
to skew properly. This was the big dilemma that the
team faced, in regards to the motors and AI.
Likewise, what the group realized was that there’s
an issue since there’s only so much one can do with
the resources available to the microcontroller, as it
is not a full-blown modern day computer that can
handle big applications such as the current project.
Other than that, senior project has been a big
revealing experience and has helped the group be
exposed to various elements when it comes to
project planning within industry. It’s fair to say that
a project can’t be just done by developing it, there
are many necessaries lines to draw such as
marketability forecast, risk management, cost, and
even the sole purpose of it. Throughout the rest of
this report, it shall guide the reader of the
challenges, and the point of view through the
development of the project.

7
II. SOCIETAL PROBLEM
A. First Semester Interpretation of the Societal
Problem
There is a prevailing sentiment that somehow the
COVID-19 pandemic is a hurdle that once society
overcomes it, will look back at it as nothing more
than history. The reality is that Coronavirus
pandemics are not extremely rare. In the past twenty
years the world has handled three different viral
respiratory coronaviruses; SARS, MERS, and
COVID. In fact, statistical analysis shows that the
risk for pandemics as impactful as COVID-19
stands at 2% in any year, and there is around a 40%
chance of a pandemic occurring every 20 years [1].
Due to multiple irreversible global realities such as
climate change, urbanization, and overpopulation
the risk of pandemics is only going to increase in
the future. Climate has an overwhelming effect on
both the formulation and impact of pandemics. The
drastic change in biodiversity of some regions in the
world because of climate change has led to massive
migration of fauna and a decrease in species
diversity. This results in an increase of human-
animal interaction and thus leads to an increase in
zoonotic spillover (transmission of pathogen from
animal to human).[2] The figure below shows that
the areas of the Earth that are most characterized by
their biodiversity and abundance of fauna have also
been most affected by zoonotic spillover events.
Fig. 1. Zoonotic emergencies (1940 – 2013) [2]
In the figure, the area to focus on is between the
Tropic of Cancer and the Tropic of Capricorn (the
dashed lines). These areas have a direct correlation
between their species diversity and humans infected
by zoonotic diseases. Also, the figure shows that
areas that are characterized by high urban
concentration, such as Eastern United States and
Western Europe, also experience a high rate of
zoonotic emergencies. While climate change can be
linked with the causing of the pandemic,
urbanization and overpopulation can be linked to
the rapid transmission of the COVID-19 virus. As
the global population continues to grow and as
people continue to migrate into urban centers to
fulfil their economic and resource needs, the risks
of viral respiratory illnesses increase. As of 2017,
55% (or 4.1 billion) of the World’s population live
in an urban setting. By 2050, it is expected that 68%
(or 7.1 billion when accounting population growth)
of the World’s population will be urbanized [3].
Fig. 2. Urbanization of the world and their likelihood of disaster [3]
Urbanization does not necessarily lead to
epidemiological disaster as urban populations are
often characterized as having access to better
sanitation and health care resources than the rural
areas. However, the problem is that urbanization is
happening rapidly in the developing world who are
struggling to match the infrastructure with the
rapidly growing urban population. This will
inevitably lead to large incidents of zoonotic
spillovers and thus leading to more global
epidemics [4]. As more research and statistical
modelling is done to forecast future pandemics and
explore the causes of global viral respiratory
illnesses, engineers are tasked with creating
solutions to help the general populace handle the
pandemics.
When looking for designing solutions to help the
population, engineers should look at how they can
help the implementation of mask mandates for all
private and public facilities. Masks have proven to
be very efficient at stopping the spread of COVID
as they are currently designed. Studies show that the
surgical masks recommended by most public health

8
bodies across the world have a 70%-80% efficacy at
protecting the wearer from air-borne illnesses the
more society complies with mask wearing [5].
Figure 3 demonstrates this:
Figure. 3. Mask wearing efficacy scenarios[5]
From this figure we see an exponential decay in
the effective reproduction rate of COVID-19,
toward disease containment, in the scenario of
proper mask usage and only average adherence of
public mask wearing. To expand on the non-linear
effects of mask wearing, Game Theory can be
applied. Specifically, the “Prisoner's Dilemma.
"You can begin by considering two people who
come into contact, person A and person B, and
make the consideration that both are most satisfied
(10/10) to be not infected (7/10) and unmasked
(3/10) in that specific order. If person A is infected
and B is not, B choosing to stay unmasked could
present them with the more sub-optimal result of
being unmasked and infected (3/10). While B
choosing to wear a mask would still be sub-optimal
(7/10) but would lead to greater satisfaction then if
they were infected. Therefore, the most optimal
solution is for both A and B to coordinate and wear
masks, ensuring they both have at least 7/10
satisfaction.
The non-linear efficacy of wearing masks also
extends to psycho-social reasoning. The more
people wear masks the less stigmatized it becomes
which in turn leads to more people practicing risk
reducing measures, which in turn leads to a
decrease in infectious disease rates [8].
While research on the specific SARS-COVID19
infectious droplets is limited, there has been
research done on facemask effectiveness on
blocking other coronaviruses infectious respiratory
droplets. A research study was done in 2020 that
included 246 subjects with 124 healthy individuals
and 122 individuals infected with a strand of
coronavirus: either seasonal coronavirus, rhinovirus,
or influenza [6]. The infected individuals provided
30-min of exhaled breathing with intermittent
coughing. The results of this study were compiled
into the figure below:
Fig. 4. Transmission with and without masks [6]
From the above figure the virus copies per sample
on the y-axis can be seen to have a direct relation
with whether the subject is wearing a mask on the
x-axis. One of the key findings from these results
was that the results for coronaviruses and influenza
were relatively similar, leading researchers to
believe that this data could be extrapolated to the
SARS-COVID-19 strand of coronavirus. The
researchers also found that seasonal coronavirus
droplets were present in 30% of the unmasked
samples and 0% of the masked. For the influenza
virus, 26% of unmasked individuals transmitted
droplets, while 4% of the masked did. Finally, no
significant difference was found in the case of
Rhinovirus infected droplets, with 28% of
unmasked transmitting, and 22% of unmasked
transmitting. The researchers concluded that the
efficacy of the surgical masks in reducing the
probability large respiratory droplets and aerosols
transmitting can be extrapolated to the similarly

9
large droplets of the COVID-19 strand of
coronavirus and help in controlling the spread of
viral respiratory diseases. This linearity is more
clearly demonstrated in the figure below[7]:
Fig. 5. Mask non-linearity [7]
From this figure, two individuals wearing proper
masks linearly increase the probability of infection
and always remain below 0.46. The results of two
masks are much more resistant to anomalies than
other possible scenarios. Given that the masks have
been proven to work, engineers should focus not on
improving mask design but on creating solutions to
help government and businesses enforce mask
mandates.
In the book, Medical Devices & Sensors [9], there
is a very in-depth overview of how particles from
your respiratory system can be transmitted to
another person. In this book it states, “While 95%
of droplets is smaller than 100 μm, the majority are
in the range from 4–8 μm (Morawska et al., 2009).
When the size threshold reaches a minimum around
5–10 μm, the droplets are usually denoted as the
respiratory droplets (World Health Organization,
2020). Bahl et al. (2020) summarized recent studies
on COVID-19 transmission and concluded that the
droplets spreading distance is increasing with the
decreasing droplets size. The droplets with sizes of
1 to 5 mm can generally spread in a distance over
1–2 m from the source of infection (Wang & Du,
2020). The research of Bourouiba et al. (2014)
showed that droplets of 30 μm can have a horizontal
range up to 2.5 m away from the cougher due to
cloud dynamics, while the smaller droplets may
even reach 4–6 m. According to these studies, the
range of respiratory droplets transmission appears to
be a major factor in virus transmission. Only with a
proper protection of a mask in daily life can a social
distancing of 1.8 m (or 6 feet) be reasonably
assumed an effective protection (Setti et al., 2020).”
The text goes on to describe the most common of
masks, N95 masks, and how effective it is with
regards to filtering against a respiratory epidemic.
“According to the standards of NIOSH, filtering
respirators can be classified as the N95, N99 and
N100 masks, which can respectively block at least
95%, 99% and 99.97% of particles with median
diameter of 0.3 μm from entering (CDC, 2020).”
When the pandemic happened it forced all non-
essential workers home due to the uncertain health
risks that we were dealing with at the time. This put
many people out of a job causing millions to go on
unemployment.
Fig. 6. Initial unemployment claims and vulnerable jobs [12]
Some Unemployment increased across the United
States leaving many out of work to practice social
distancing. This affected many, some more than
others but the jobs that had worker-client
interactions were the first people that were affected
by COVID. Which were the ones in retail, leisure,
and hospitality. “The most affected major
occupation group is service occupations with an
employment drop of one third from February to
April 2020.” [14] With so many people being
affected, it left questions on what would be the new
normal following unemployment.
Some workers struggled to look for new jobs
while others were able to just transition their work

10
from in the office to at home. Studies show that
income was correlated with the ability to stay at
home during the pandemic. Those with higher
income, have access to better resources, such as
internet speed. Having access to the internet during
the pandemic is a luxury with most work
transitioning to at home, it gives people the option
to feel safer as they were ordered to stay in place.
Those who don't have the luxury to stay in place are
the ones in danger of catching the deadly virus.
These people are generally labeled the low-skilled
workers. These workers are the ones who have a
higher risk of catching the virus because they are
out in public more and can't afford to stay home. COVID shook up the economy as we were not
ready to protect everybody equally. This experience
showed us how vulnerable we are when a crisis
arises. Everybody relies on job stability to keep on
striving in life. We have learned to adapt to life due
to COVID, making us more aware of our
surroundings. As the shelter in place came to an
end, stores were adapting to the times as well,
enforcing masks upon entrance and social
distancing of 6ft.
An article, written by Miriam Van Dyke for the
Morbidity and Mortality Weekly Report, did a
remarkable job illustrating how mask mandates play
a role in reducing spread of respiratory viruses as it
shows case increase/ decrease both before and after
the mandate was put in place.
Fig. 7. Case trends before and after mask mandate [10]
Indicated by the light blue plots with
corresponding colored trend lines related to
mandated counties, a sharp halt change of direction
occurred when the mandate became effective. The
counties under mandate were sharply increasing in
case numbers and it wasn't until masks became
mandatory that the trend switched directions for the
better. On the other hand, there are the dark blue
plots with corresponding colored trend lines which
represent counties not affected by the mask
mandate. In the case of unaffected counties, trends
can be seen steadily increasing, proving that
enforcement of masks has and continues to reduce
the number of cases documented. The image clearly
shows how masks cause a downward trend in cases
while unmasked areas continue to grow in cases.
This means that regulating masks and authorizing
entry, upon wearing a mask, into a private place of
business will impact the population by guiding the
trend illustrated by the light blue plots in the image
above.
Considering how the mask mandate is still in
effect, a possible suggestion would be to utilize the
genre of computer vision to detect who’s wearing a
mask or not. Some places, such as small businesses
may not be able to afford to have the technological
capacity to endure and keep track of who’s wearing
a mask or not. Unlike wealthy corporations who
have the financial stability and technology to deploy
on their campuses. The idea of using computer
vision especially during the pandemic, would
perhaps be utilized to train an algorithm with
sample photos or data on all different types of
masks, different people, to make the algorithm more
flexible on deciding what’s a mask and isn’t.
Machine learning, particularly its subset of deep
learning, can be used in conjunction with computer
vision for engineers to produce an autonomous
solution for mask mandate compliance. Deep
learning is a method of data processing that
converts inputted data into multiple layers of
abstraction. The layers are composed of
interconnected nodes. Each layer of interconnected
nodes is used to further refine the classification of
the input data. The large mass of inputted data that
has been processed by the abstraction layers can
then be outputted according to need.

11
Fig. 8. Simple neural network where “n” represents the dependent nodes that
receive the input from the input layer and processes it, creating a classification
that is then passed to the next hidden layer [9]
For example, if a large amount of data of different
living things was inputted into the deep learning
algorithm. The first abstraction layers can notice
similarities between all the images of birds vs. cats
vs. dogs vs. humans and classify them accordingly.
The next layers then continue to refine the datasets
from the previous abstraction layers into more
classifications until the algorithm outputs the data
according to the user's need.
B. Second Semester Improved Interpretation of
Societal Problem
In the development of pandemic action plans,
local political and medical officials are required to
identify the geographic location of emerging super-
spreaders. Super-spreader is a term that is often
used to describe an event or location that is the
epicenter of an epidemiological outbreak. These
events lead to a domino effect that causes hundreds
and sometimes thousands of people to get infected
by a viral disease. One example of a notable super-
spreader event during the first year of the recent
COVID-19 outbreak is the case of a woman in
South Korea that attended two Church services with
fever symptoms and caused one of the largest
COVID-19 outbreaks in the country at the time with
5,000 total people infected as a result. [16] The
danger of super-spreader events is that they are very
commonplace, and that any person can be the
potential catalyst of a large outbreak if they are
infected with a viral disease.
Anything from a Church service to a family
dinner has the capability to become a super-
spreader event. A Stanford Study from 2020 found
that in the largest metropolitan areas of America
such as Chicago, 10%, of what the study describes
as “points of interest,” businesses were linked to
85% of the areas COVID-19 cases. [17] These
businesses specifically refer to service restaurants,
gyms, hotels, bars, religious organizations, and
other highly trafficked localities. This study, due to
it being written in an early stage of the COVID-19
pandemic, recommended a limited occupancy
solution to these super-spreader events. However, as
the pandemic has progressed there has been a
growing resistance to limiting occupancy due to its
effect on both the economy at the national and local
scale, as well as its effect on the populace who are
approaching two years under pandemic restrictions.
While limited occupancy has become less common
as a policy, the risk of super spreader events
remains. Given that these super-spreader events can
very quickly cause outbreaks, local authorities must
be able to quickly detect and create reactive action
plans to counter. It is imperative that businesses are
equipped with a method for aiding the public with
super-spreader event response.
Our project has adapted to this constant threat of
super-spreader events, especially during the
transition away from limited occupancy mandates,
by adding a method of anonymous data logging to
our design. For ethical reasons, our project does not
give businesses any method of policing the public
into compliance with mask mandates. Rather, our
project allows businesses to simultaneously monitor
fever temperatures as well as mask compliance all
while logging cases where one or the other is not
satisfactory. This allows businesses to tacitly
acquire anonymous data that it can then send to
local authorities to craft local pandemic response
plans if necessary. The benefits of this for
businesses are multi-faceted; it allows businesses to
potentially avoid liability if their business becomes
a super-spreader, it helps businesses comply with
pandemic restrictions, and it potentially helps the
local medical and political institutions be more
reactive to outbreaks.
While COVID-19 has had a toll in all areas of life
in its aspects, one area that was devastated by the
virus, was the economy. Businesses lost financial

12
stability, supply shortages occurred, and there was
no confidence in investment. An example of how
much of an impact of COVID-19 was in businesses,
would be Australia’s first case. The first case was
identified on January 25, 2020, as it only took a
matter of a few weeks for cases to be caught and the
government had to intervene to contain the
outbreak. According to the Australian Bureau of
Statistics, it was reported that by March of 2020,
almost 50% of businesses had some form of
devastation from COVID-19. By June of 2020, 80%
of businesses had experienced significant loss of
revenue. [18].
Fig. 9. Business industries that reported loss of revenue in percent from
January 2020 to June 2020, by the Australian Bureau of Statistics. [18]
What has caused such a loss in revenue in
business could be that at the time, people were
panicking and knowledge of how the virus spread
was not quite known. As seen in figure 9 above, it
seems that education and training has suffered the
most in revenue loss. This could be from that
education often takes placed in an enclosed area
such as a classroom and that the risk would be too
high in that environment.
While one can imagine how dangerous it may be
to resume in-person classes during COVID-19, it
can also be dangerous in other places such as
supermarkets. Markets and businesses are extremely
vital towards the consumer and economy
considering how they are a main source where
families go to make purchases. It’s quite difficult to
purchase necessities to survive especially during
times where there are lockdowns. Even when
people are exposed to risk in tight areas of place.
Likewise, this in turn impacted families when it
comes to grocery shopping, as there were shortages,
and safety concerns and some outright could not
afford it.
Fig. 10. Survey conducted by Center on Budget and Policy Priorities and
House Hold Pulse Survey, where 20 million adults were surveyed, reported
that their household sometimes or didn’t have enough to eat for the days. [19]
From figure 10 above, the adults with children
didn’t get enough to eat were 12%, and the ones
without children being 8% from the Center on
Budget and Policy Priorities. It could be that the
families either couldn’t support themselves due to
income, supply shortages of prices, or flat out
weren’t willing to risk their health and family’s
health to go grocery shopping. However, with better
understanding of the virus overtime, vaccinated
individuals, and less of a fear, the idea of not being
able to sustain food supplies is bound to decrease.
Though, there are solutions for businesses that can
be implemented to have a cost-effective way of
enforcing CDC guidelines and individuals so that
customers can feel safe when shopping.
The project’s premise to enforce CDC guidelines
within the setting of a business would be to
constantly read through a video feed to check if a
client is wearing a mask or not. There would be no
need to have the financial means of employing
someone to enforce for masks, and yet risk that

13
employee of being at risk of infection from clients.
The machine learning and artificial intelligence,
using Tensorflow framework, gets to decide based
on the client's region of interest such as wearing a
mask or not from what it sees in the camera.
Businesses would save money using artificial
intelligence through a camera feed because there’d
be no worry of risking an individual's health, as
well as having to shell out money to pay them,
where the device could. It also works in conjunction
with the thermal camera, as that not only does it
screen clients for a mask but goes as far as to take
temperatures of clients who may be asymptomatic
and not visibly show symptoms such as coughing or
sneezing. This is so that extra measures are taken
not just for clients wearing a mask usage but for
high temperature as well. Plus, clients would feel
safer and confident shopping without having an
employee who they may or not be infected with
COVID-19 be near their vicinity.
As time has been progressing with COVID-19
there has been learning to cope around this deadly
virus that keeps on mutating and causing variants.
Individuals have endured through stay-at-home
orders, mask mandates, social distancing, online
working/learning and even vaccinations for some.
There is a constant effort to fight the battle with this
deadly virus as impactful as it is with new waves of
cases. Our device has the intent to stop and help
track people who are infected and are becoming
super spreaders. As some states have been
increasingly lifting their state mask mandates, mask
adherence has declined as well.
Fig. 11. Survey of effect on lifting mask mandates on adherence [20]
Fig. 12. Effect of lifting mask mandates on COVID-19 outcomes [20]
In lifting the state mask mandate there is a
jeopardy of health of others around as shown in
figure 12. In figure 12, there is a healthy pre-trend
of low cases appear during the state mandate. Once
the mandate was lifted, a slight rise between day 10
and 40 of the lifted mask mandate. This study
“observed a maximum increase in cases of 0.55
standard deviation 45 days after the
lifting…Corresponds to an increase of 12 cases per
100k, which amounts to 13% of the highest record
number in the observation period.” [20] Even
though there’s an increase in cases which could be
due to the variants, delta, and omicron, which are
more transmissible. There isn’t a significant effect
on hospitalization proportions and deaths. This
could be due to factors like vaccines taking an
effect and symptom management.
It is important to wear masks as new variants are
mutating, which can cause symptoms, especially if
individuals are vaccinated. Health is more at risk if
an individual is not vaccinated and continue to
disregard mask adherence. “97 percent of people
hospitalized for COVID-19 across the United States
are unvaccinated [21].” Our design will be able to
be deployed for small businesses throughout the
United States to help protect ourselves and the
community around us from spreading this virus.

14
The best way to help reduce the spread of COVID
has been by using the proper face mask suggested
by the CDC even when it's not mandated, which our
device will help keep track of. It will be able to
make separate text files that will help keep track of
the amount of people complying with the business
owners store regulations. This would be particularly
useful in states that don’t have mask mandates but
are still worried of the outbreak. The device will
have ability to store the data so we can get
information on mask adherence through the
prototype. The dataset will be able to determine if
someone entering is using a mask properly or not.
The prototype will play an alarm to notify you if
you’re not wearing a mask to better inform people
about mask adherence. The prototype could store
the data in a text file, to help collect data on mask
adherence and super-spreader breakouts. O
A study was done in the Journal of occupational
and environmental medicine where the methods
used were as follows, “Number, size, and duration
of outbreaks were described by sector, and outbreak
cases were compared to sporadic cases in the same
time frame. Address matching identified household
cases with onset ≥2 days before, ≥2 days after, or
within 1 day of the workplace outbreak case. There
were 199 workplace outbreaks declared by PHUs in
Ontario between January 21 and June 30, 2020,
with 1245 outbreak-associated cases (Table 1).
There were three or more outbreaks associated with
nine industry sectors, with the majority in
Manufacturing (45%), Agriculture, Forestry,
Fishing, and Hunting (12%), and Transportation and
Warehousing (11%), with cases in these sectors
accounting for 56%, 16%, and 8%, of all outbreak
cases, respectively. Outbreaks ranged in size from 1
to 140 cases (median: 3 cases), with 149 (75%)
having two or more cases. Median outbreak size
was largest in the Public Administration sector (9
cases) and smallest in the Retail sector (1 case), and
while Manufacturing had the largest outbreak (140
cases), its median size was 3 cases. Outbreak
duration ranged from zero days (50 outbreaks with a
single case) to 119 days, with Agriculture, Forestry,
Fishing, Hunting having the longest median
duration (13.5 days), and the Retail sector having
the shortest median duration (0 days), due to eight
outbreaks with only a single associated case.[22]”
Given these statistics along with figure 13 shown
below, not only should we be considering customers
at stores for mask and temperature readings, but
also employees. As seen in the Table 1,
Manufacturing facilities hold the majority of the
covid outbreaks totaling 89 outbreaks which caused
702 individual cases of covid. Using a method of
facemask detection and temperature monitoring
upon entrance at large facilities would be beneficial
to tackling covid spread by monitoring the sector
which results in the most covid outbreaks/ cases.
Fig. 13. Outbreak data by Industry Sector in Ontario [22]
An Article by NBC News “California to bring
back indoor mask mandate” talks about the reasons
that masks are still a necessity for safety purposes.
The article stated that, “Even without a significant
impact thus far from the omicron variant, the state's
seven-day average case rate has increased by 47
percent since Thanksgiving, the health department
said. Hospitalizations were up by 14 percent.[23]”
Especially during the holidays, businesses and
customers are at a greater risk to spread covid due
to high concentration gatherings. Monitoring of
correct facemask wearing and temperature reading
is even more essential during these times where

15
private social gathering rates increase. With a kiosk
taking the place of a worker, the safety of both the
worker and customer is secured by eliminating the
need for human interaction within a confined area
such as a small business.

16
III. DESIGN IDEA
A. Design Philosophy
Society is nearly two years from the start of the
pandemic, and we are still dealing with the
consequences of COVID-19. The pandemic caused
a lot of safety concerns for the community, like
whether people would be safe to return out in
public. The design is intended to make the
community feel better about themselves and their
surroundings. The design is focused for the
intention of using at an entrance of a small/private
business that are wanting to keep a safe
environment for workers and customers. Many big
corporations have the luxury to hire a person to
watch customers as they come in and warn them
about their masks. This design is to help companies
who can’t afford to hire help specifically for mask
safety, but it would allow small private businesses
the same environment as those who do.
Using the knowledge of Computer Engineering,
and Electrical Engineering, the plan is building a
device that can determine if a person is masked, not
masked, or an improperly worn mask. The design
will feature a high-resolution camera that will
autonomously tilt towards the adjusted height of the
designated user as they approach the door. The
camera will be able to detect if the user is wearing a
face mask or using another piece of clothing to
cover their face. The design will have a monitor that
guests will be able to check in at the entrance of the
store. The monitor will show live video to the user
so they can easily walk up to the monitor and check
in. The camera will be able to cross reference the
user’s appearance with previous users to obtain the
information of wearing a mask or not. If the camera
detects that the user is wearing a mask it will then
light up a green LED to let the user know they are
accepted into the building. If the camera detects that
you’re not wearing a mask it will then pop up a red
LED, informing you that you don’t have the proper
safety equipment to enter the building. Along with
having the camera monitor for masks, there’s a plan
on having a thermal detector so we can monitor the
temperature of those who enter the building.
The design is unique because it will give live
feedback to the guests whether they are in guide
with CDC guidelines of wearing a face mask in
public areas. We do plan on checking guests in
individually, which would allow our camera to
make a more efficient detection of the mask.
Cameras that read multiple faces at a time use a
different tracking algorithm that can lose track of
people if they are not facing the correct direction,
they also produce lower image quality that led to
blurry images. Checking in guests individually as
they come in will give us the highest percentage
accuracy because there are less objects for the
camera to read. Another unique feature that is
planned to integrate into our design is thermal
detection. This would give us the option to tell a
person’s temperature just in case a guest tried to
enter the store with a temperature that exceeded the
normal body temperature.
When our team was brainstorming ideas on ways
to implement this design, we first thought about
having a camera that would be placed high up on
the ceiling and monitor guests as they walked in.
The design was still designed to bring safety to the
public, but it would still allow access to non-mask
users inside. We wanted a device that would detect
a person’s mask or symptoms before they entered
the store and risked spreading the virus to others. If
a small private business was forced to shut down for
two weeks, the recommended time to quarantine if
you are infected with the virus, it could be
detrimental to sales for the business.
Another idea that came to mind while
brainstorming was to keep an occupancy count for
the business. This would help to maintain maximum
occupancy in a business in accordance with the
CDC guidelines. The trouble with this feature is
keeping an accurate count on total people inside a
business. This would require constant surveillance
on every entrance of the building to stay precise. A
way to implement this would be to designate
specific doors as entrance and exit doors. Once the
doors are designated, a motion sensor would need to
be put in place to trigger when a person triggers the
entrance and exit sensors that are placed at their
respective doors. With so many variables like
multiple people leaving/ entering at the same time,
and many different entrances to a place of business,
there would need to be custom set up for each
specific location to properly count total occupancy
inside the building. For these reasons, we decided

17
that it would not be a feasible feature to include in
our design idea, but just counting the total number
of people who have used our design to “check in” to
a private place of business could be a useful feature
that we might decide to implement at a later point of
our project.
TABLE I.
Punch List.
Facial Recognition Features
Feature Measurable Metric
Algorithm
detects faces
Algorithm detects a person at a
maximum of 3 ft away from the
Kiosk. This means that the user
will be told to stand 32.5 inches
away and will allow a person
with an approximate maximum
height of 7’0” and minimum
height of 4’10”. This results in
the tallest and shortest heights to
maintain the maximum distance
of 3 feet away from the kiosk.
Algorithm
detects mask
Algorithm to recognize if a
person is wearing a mask, based
on 2,400 training images, the
algorithm can expect to receive
97% accuracy in detection.
Thermal
detection
Detect the temperature of a
person who checks in at kiosk
within 3 ft with +/- 1 degrees F
offset.
Green LED Signals when mask is detected
properly, meaning there is an
acceptable facemask worn as
suggested by the CDC
guidelines, and both the nose and
mouth are covered by an
acceptable facemask.
Red LED/
Buzzer
Signals when a person is not
wearing a mask or lacking
proper wearing of a mask; plays
a buzzer to notify that they don’t
have a mask covering mouth or
nose alongside lighting up a red
LED.
Camera Tilt Camera autonomously tilts
vertically by +/- 25.5 degrees
with the person standing 32.5
inches away from the Kiosk.
This will maintain a maximum
distance from the camera of 36
inches.
B. Specific Design Components
The core of our design idea revolves around facial
detection. Facial detection will allow us to test our
cases (different faces) against our trained data set to

18
recognize whether the inputted data of the
individual's face matches one of our three cases.
Case one is that of a masked individual, case two is
that of an unmasked individual, and case three is
that of an individual who is improperly masked.
Improperly masked is defined as an individual
wearing the mask incorrectly (eg. underneath the
nose) or an individual wearing a non-satisfactory
mask (eg. a hand-woven mask). The most key item
needed to accomplish our face mask detection is a
camera. We opted for a USB camera as they are
more accessible, more affordable, and have
necessary drivers available that make it “plug-in
and use.” When choosing a camera, we focused on
choosing one that had a high video capture
resolution of 1080p so that the camera would be
able to discern different subjects it detects. We also
focused on the camera's image capture speed so that
the camera can keep pace with the rate at which
data will be inputted. Alternatively, we could make
use of a MIPI CSI-2 protocol camera. The benefits
of this type of camera are that it can handle higher
bandwidth video feeds and use lower CPU
resources due to its own internal processor.
However, the MIPI CSI-2 requires more initial
setup, can be complicated to interface with, and
comes at a higher cost then a USB camera for
machine vision applications.
The camera and all other hardware that will be
used as part of this product design idea, need a
central hub for all the components to be integrated
through. For this need our group opted to use a
single-board computer (SBC) that can allow us to
run multiple parallel neural networks for our
computer and machine vision needs. One of the
focuses was on the CPU architecture and speeds of
the chosen SBC. We searched for a computer that
used ARM Cortex architecture as this common
processor architecture in the field of embedded
system design, and computer vision work. Also,
when choosing the CPU, we focused one the clock
speed and power efficiency. Higher clock speed will
allow our CPU to perform much more processes
concurrently, while better power efficiency will
allow for our computer to integrate more peripheral
hardware components. The next key thing we
researched when looking for which SBC we will
use to integrate all our hardware was the onboard
RAM. What we found is that most of the options we
explored have a baseline of 4GB of RAM, which is
all that was necessary for our memory needs to
fulfil our product requirements. Then we researched
which SBC had a better Graphics Processing Unit
(GPU) that possessed greater capabilities for
artificial intelligence and computer vision work. We
focused on two aspects for the GPU: the
architecture and the number of Cores/Core speed.
One architecture we were specifically interested in
was the Nvidia ™ Maxwell architecture. This
architecture would allow us to interface using
CUDA platform, which would allow us to use a
method called general purpose computing. General
purpose computing is a method that allows a GPU
to work in conjunction with a CPU by performing
non-specialized calculations. This effectively
combines the processing power of the CPU and
GPU allowing for faster computing and rapid
processing of images which is extremely useful for
accomplishing computer vision and neural
networking goals. The CUDA platform is
dependent on the amount of GPU cores that the
GPU is fitted with. So, the more cores the more
effective the CUDA platform is. Aside from these
three main desires we had for our SBC we found
that every SBC was outfitted with other needs such
as General-Purpose Input and Output (GPIO) pins.
GPIO pins are very essential to refining our face
mask detector and making it a complete and useful
solution towards compliance with mask mandates.
While the camera and SBC will help us design a
face mask detector, the GPIO pins will allow us to
better interface with users along with
accommodating accessibility needs of different
users. GPIO pins are a standard interface that are
commonly found on integrated circuit boards. They
allow designers to incorporate different analog and
digital modules into their overall system design and
interact with them using software. GPIO pins are
often used to add sensors, motors, and LEDs to a
design. For our design we plan on taking advantage
of GPIO pins to incorporate a temperature sensor,
servo motor, and three different LEDs. The
temperature sensor will be incorporated to expand
the capabilities of our product design to further
assist businesses in fostering a safe and compliant
business environment. The temperature sensor will
be able to notify the individual it interacts with of
their body temperature so that they are made aware

19
of any anomalies. Next a motor would be
incorporated to satisfy accessibility needs of its
users. Creating a vertical panning servo motor that
autonomously detects and tracks the user will make
it so that any user of any height can interface with
the product. Finally, the LED lights that will be
incorporated into the design, will visually notify the
users of the detected state that they are in. A green
LED will notify the user that they are in a
satisfactory (ie. proper mask usage) state, while the
red LED notifies that user, they are in an
unacceptable state (ie. no mask detected), and
finally the yellow LED will notify the user that they
are in a neutral unsatisfactory state (ie. improper
mask usage). The GPIO pins will allow us to
expand our product's scope so that it can satisfy
many of the needs that a struggling business may
have during a period that requires mask compliance.
To be able to interface and maximize the
hardware for our design, our group also explored
the software side of our product. For one we knew
that we would be using Python for our project. For
one, we chose Python because most of the group
already had some familiarity with it if they were not
already well versed in it. Another reason we
selected Python as our language versus a more
commonly used embedded system design language
like C, is because of the available Python computer
vision and deep learning focused Python libraries.
We made sure that each Python Library we used
had an open-source license so that we do not
infringe upon any developer’s copyright.
The first of the main Python libraries our group
will be taking advantage of is GStremer. GStreamer
is an open-source framework that provides a
developer with the necessary tools to satisfy their
multimedia needs. Among the functionalities of
GStreamer is the ability for a developer to create
media players, video conferencing players,
streaming servers, and video editors. For our
project's use, we will be taking advantage of
GStreamer camera interface protocols. These
protocols will allow us to use GStreamer to set up a
live streaming feed using the USB (or MIPI) camera
that we have chosen for our project. This live
streaming will be what we base our computer vision
design around.
The next Python Library that will be used in our
project is OpenCV. This library is short for Open
Computer Vision which clearly describes it as an
open-sourced library with functionalities for use in
computer vision applications. This library being
part of the open-sourced community and being
licensed with the Berkeley Software Distribution
(BSD) license, helped satisfy our group's ethical
concern with computer vision technology and
development. OpenCV itself features thousands of
pre-made and optimized algorithms that can handle
any basic use of computer vision and machine
learning. It also provides the framework for a
developer to comfortably create their own
algorithms. Among the features of OpenCV are
algorithms that can be used to implement facial
detection and recognition, object classification,
movement detection, and much more. The
community is also large for this library, which
allows for expansion of the open-sourced features,
along with more guides and documentation on how
to use the library. Our group will be taking
advantage of this Python library to implement a face
detection algorithm using computer vision. Once we
develop the face detection, we will need to train it,
using deep learning neural networking, to detect the
three different cases for our face mask detector.
For our deep learning neural network our group
opted to use the PyTorch library. PyTorch is
specifically designed for Python due to the
language’s readability and community. PyTorch
modularizes and simplifies some of the more
complicated and resource intensive math that is
associated with designing deep learning algorithms.
That math includes high level matrix and vector
abstraction and generalization. This is known as
tensor computing. PyTorch is also open sourced and
was developed by a team of researchers that worked
at the Facebook Artificial Intelligence Research
(FAIR) Lab. Our group opted to use PyTorch rather
than its competitors such as NumPy, TensorFlow,
and Keras due to the integration that PyTorch has
with Python, and since PyTorch grew from
researchers who wanted to improve on the
alternatives. Also, PyTorch has a focus on
maximizing GPU efficiency which is important to
our group's design due to our use of a CUDA
integrated GPU. PyTorch will be used in our project
to create a deep learning model that trains our face

20
detection algorithm to detect whether an individual
is wearing a mask in one of the three cases; is, is
not, or improperly.
When dividing the work among our group we
took careful consideration of each member’s
different educational backgrounds. Our group is
composed of two Electrical and Electronics
Engineering (EEE) majors and two Computer
Engineering (CPE) majors. Given that both sets of
students have experience with hardware interfacing,
all are expected to contribute to the programming
aspect of this project. Ramsey programmed the deep
learning algorithm for face mask detection. Due to
his familiarity with Python and his preliminary
research on the GStreamer and OpenCV library,
Zaid programmed the face detection and camera
interfacing. Justin and Shaan coordinated to
implement the LEDs and the autonomous Servo
vertical tilting camera mount.
To implement our core face mask detector along
with its features, we anticipate 300 total work hours.
The total work hours will be broken down into two
halves of 150 hours. The first of the halves will be
dedicated to creating the face mask detection
algorithm and interfacing it with a camera. The
second half will be dedicated to implementing
accessibility features such as the LEDs and the
Servo motor. However, these hours are merely just
a rough estimation, and may change further
depending on each individual contributor’s progress
alongside possible features that will be implemented
later.
To determine if each feature is fully
implemented, a plan to use real time tracking of
calculations from the USB camera which relays
video input towards the algorithm to determine the
mask usage of the client. The idea is to mainly
focus on the individual rather than more than one
individual, so that the graphic processing can be
quicker to determine through the video client. If
there were more than one individual, it may be
complicated further as the data received from the
camera may require more of a bigger computation
to determine mask usage.
The first design will be able for the AI to detect
faces. It’s crucial to see if the feature works,
because if the main basis of detecting faces does not
work, it would be difficult to go anywhere else, as
the main subject of the project is detecting faces. To
ensure detecting faces work, a possible shape would
be drawn around the face that the camera detects,
often a square. If a camera can detect a face from
the camera, then it means that the design can
proceed further to be built off and can be trained to
detect mask usage.
The second design further branches towards the
rest of the project. It is if the algorithm can detect
mask usage. To measure if the client is wearing a
mask properly, is that the algorithm, will be
calculating if it is a proper mask through CDC
guidelines. To further have a variation of masks that
the algorithm can detect, a folder can be
implemented through various pictures of proper
mask usages. The algorithm can depend on the
folder to decide that the user is indeed wearing a
mask. To recognize that the algorithm is fully
implemented, could be from a console window that
is continuously running to signify if a user is
wearing a mask.
The third design idea is whether the algorithm
dictates whether a mask is properly worn or not. To
measure if it is, a folder for the algorithm to
categorize what dictates mask usage, and what
doesn’t. To get an output besides relying on a
monitor to display a green square for proper mask
usage of the client, a green LED will be lit up that is
connected to the microcontroller and breadboard to
display that the algorithm detects proper mask
usage.
The fourth design idea is like the third, however if
the algorithm does not detect the client to wear a
mask, then there will be a red square over the face.
The algorithm will still rely on a folder of pictures
that categorizes of what is not considered a mask.
To signify that the feature is fully implemented,
when a client does not wear a mask, the algorithm
will have a red square over the face, from the output
display window. Another way to determine if its
implemented is to send a signal to a red LED that
lights up when there is no mask usage.
The last design idea mainly depends on the first.
The idea is to have the camera autonomously tilt

21
when it detects a face. This is so that the camera can
be accessible anyone regardless of height. To ensure
that it works, Arduino motors and the motor driver
shall be connected to the microcontroller which
then runs to the algorithm to detect a face. The
camera then centers to where it detects a face and
continuously centers itself when the client moves in
the cameras field of view. Likewise, as there is
much software and hardware features involve, our
team is composed of the best of both worlds in their
software and hardware skills to determine on how to
breakup these features.
Shaan Wadhwa is an Electrical and Electronic
Engineering major with experience using
microcontrollers from various projects, including
parking sensors using proximity sensors and
outputting different results based on distance.
Heavy GPIO usage and familiarity from past
projects and various courses has solidified a strong
basis for GPIO integration for a project.
Zaid Elias is an Electrical Engineering major who
has programming experience through both
coursework and self-teaching. Specifically, he is
comfortable with C/C++ and Python. Also, his
experience with different hardware interfacing
protocols, such as HAL, UART, and ADC provides
valuable experience in embedded system design. He
also has researched and continues to familiarize
himself with the necessary Python libraries to
satisfy his section of the project. Due to his
familiarity with Linux, specifically Debian based
distributions, he can comfortably navigate Single-
Board Computer systems that use Ubuntu.
Justin Roldan is a computer engineer major who
will contribute to both software and hardware
aspects of design. Using his experience working
with diverse types of microcontrollers he will be
able to implement distinctive features to get the
monitor to tilt. Familiar with several types of coding
languages, like python, which will be useful to read
and write in many of the libraries that we plan to
use for our design. I’ve also worked on projects
where we have a sensor read how much light is
being projected and LEDs would turn on depending
on the amount of light being omitted.
Ramsey Alahmad is a computer engineer who
first started with Java and tended to explore further
languages such as Python. Due to his internship
experience in Intel Corporation, majority of his job
included automation of data using Python alongside
familiarity of utilizing UNIX systems for validation
which further adds to his experience on utilizing
microcontrollers. In his recent internship, Ramsey
validated NAND products through the usage of
software, specifically scripts in Python to test out
NAND products to ensure they will work and
proceed with the process in other teams involved
with the system design. Prior to his experience in
AI, Ramsey worked on projects involving
microcontrollers which include an automated
license plate reader which involved computer vision
to recognize the license plate of a vehicle and read
it. Further in his experience with microcontrollers,
he worked on a project involving a weather station
which uses a temperature system for the Raspberry
Pi, that sends analytics in time increments of the
current temperature while displaying it on a LED
matrix. Which makes him familiar with the overall
concept of machine vision and deep learning
especially within microcontrollers.

22
IV. FUNDING
Considering the group did not have any available
sponsors to cover the cost of the funding needed for
the project, the materials were divided by four and
were purchased out of pocket by team members.
Making each member invest roughly $84.42 in this
project.
TABLE II.
Budget List.
The idea is that the USB 1080p camera will be
used as an interface for the libraries in Python that
will be utilized for computer vision and deep
learning. The reason for a USB camera, is that it is
merely accessible by plugging into any port that has
a USB. Compared to competitor cameras where
may not include wire, yet thin lining which isn’t as
compatible with testing devices.
SD cards contain 64GB space. Microcontrollers
need some form of memory to help backup storage
and computation. Since there will be a training of
the facial detection algorithm, many pictures will be
needed to separate for the algorithm to determine
who’s wearing, not wearing, or improperly wearing
a mask. Considering, the python libraries that will
be utilized in the computation, they are quite big in
size, thus it is appropriate to use a 64GB micro-SD
card.
A WIFI USB port was seen more of a luxury item
to this project. It would be possible to rely on the
ethernet port to connect towards the Jetson Nano,
yet that would be by any means dedicating more
exclusive parts towards it such as a computer
monitor, keyboard, mouse, towards it. By utilizing
the needs for a WIFI USB port, it would allow for a
headless setup without the need for parts and allow
usage for a remote shell from the desktop. Which
allows multitasking from the usage of 1 computer.
Knowing that the primary premise of the design
will include the usage of machine learning,
computer vision, and artificial intelligence, a
decision has been made that the Jetson Nano
microcontroller shall be used. After, further
analyzation on microcontrollers and their specs in
hardware, it was a close tie between the usage of the
Raspberry Pi 4 model, and the Jetson Nano. The
reason why the Jetson Nano was picked was due to
their similar specs, the Jetson Nano is more prone to
handle artificial intelligence calculations due to its
minor improvement in GPU performance compared
to the Raspberry Pi. Making it worth the investment
despite the price difference.
To further make the project more accessible
towards clients, the servo mount brackets alongside
the motor driver shall be used to direct the camera
autonomously when it detects a face according to
their height.
The thermal camera shall be used so that not only
does the USB camera detect the usage of masks on
clients, but also record temperature to keep clients
of notice who may be asymptomatic or infected
with COVID-19 to prevent risk of dangers to others
and themselves.
Item Source Quantit
y
Price
Per
Unit
($)
Total
Cost
($)
USB
1080p
Camera
Amazon 1 72.99 72.99
SD Card Amazon 1 15.99 15.99
Wi-Fi
USB
Amazon 1 10.99 10.99
Jetson
Nano
Digikey 1 145.74 145.74
RGB
LEDs
Amazon 100 0.06 6
Servo
Mount
Bracket
Amazon 2 7 14
Servo
Motor
Driver
Amazon 1 14 14
Thermal
Camera
Amazon 1 30 30
Total 337.70

23
V. WORK BREAKDOWN STRUCTURE
To evaluate and breakdown the project into
divided tasks, it was best knowing each of the group
members in their background knowledge within
technology. Whether that means wiring and
hardware, or experience in software and coding,
specifically machine vision. Considering the group
has an equal number of electrical engineers and
computer engineers it was a fair combination of
which member gets which task to facilitate the task
in the best way possible. In the broad spectrum, the
tasks can be divided towards the specifics. Starting
from the top, the tasks include having an algorithm
to deal with the clients regarding their face, whether
they are following mask-etiquette or not, and further
optimization. Another feature is implementing some
form of system interface that reacts with both the
algorithm and hardware. More so, a graphical user
interface (GUI) would be needed since it is some
form of output that communicates with the camera
for information, and the output as a monitor to
display camera feedback alongside the algorithm
deciding if the user is following mask-etiquette. Not
only does the algorithm signal to the interface, but it
also delivers voltages towards LEDs just so there’s
extra clearances if the client does indeed practice
mask-etiquette. If the client doesn’t a red LED is
signaled alongside the buzzer to let them know.
Most of these features combined, do rely on the
facial detection algorithm considering another
feature is having the camera autonomously pan and
tilt towards the center of the client’s face. This is to
realize that not everyone may be able to be towards
the height of the camera, some people may be too
short, or may be too tall. Having someone touch and
adjust the camera especially in times we are
unknown of the risks involve touching surface can
be quite risky. Plus, with the camera adjust itself
autonomously it can be calibrated to achieve for
more accurate readings of the client without being
statis in one place, making it easier to receive
information and calculate it. Finally, there is a
feature that can take the temperature from the client
and relay it back to the algorithm which then
enables signals to the LEDs and buzzers if it meets
the conditions. With these general features, and
with four members in the group, it was best to
divide these broad features further where each
group member is assigned according to the best of
their background knowledge. Most of which is the
algorithm being the key feature, since then many
features can be built on top of it.
The key component is mainly the artificial
intelligence (AI). The primary usage of the AI is
being able to calculate and be able to decide from
the view of the camera if the client is practicing
mask-etiquette or not. How the AI makes a
calculation and decision is based off a training of a
dataset of images. However, what’s more important
is that there should be a simple basis applied where
the algorithm can at least detect faces. This could be
part in junction for the GUI, as well as the
autonomous camera to face the client as those rely
on some form of feedback from the algorithm to
signal and proceed through with the code on what’s
going on. To develop this task further, a large
dataset of images would be allocated towards
folders of people following mask-etiquette and not
following it, this is so the AI can learn and be
trained. And pass off signals towards other tasks
that depend on it. It’s estimated that due to
gathering, compilation, optimization of the key
feature of the AI, it would take roughly 15 hours to
20 hours to complete. Ramsey Alahmad shall be
responsible towards this development. This is so
that with some of his experienced machine vision
and AI, this concept shouldn’t be foreign towards
him and be able to be comfortable with the premise.
While it is given that masks are to be always
worn in places, it is inevitable to pick and choose
what type of masks people are allowed to wear
inside. There are many variants of mask people
wear and not everyone wants to abide by the blue
surgical mask standard. It is more than possible that
clients will wear masks that come in different
shapes in sizes, including a black facemask, KN95,
mesh, or even cloth. So there needs to be further
testing to ensure that clients do not get mistakenly
marked as not wearing a mask just because the
algorithm isn’t familiar with different variations of
masks. To get around this potential issue, there
needs to be some further compilation within the
dataset to include pictures taken from all different
angles and different masks so that the AI is aware of
the variations involved. However, there should be a
fine line drawn when it comes to amount towards
training the AI as that there can be overtraining

24
which leads to the algorithm losing track. With
finding the correct dataset, and further compilation
of the model, it may take up to 15 hours to ensure
that this feature can do basic tests according to
Ramsey Alahmad.
After compiling the dataset provided for the
model towards the algorithm, there should be some
time set aside regarding special cases. It intended to
make the algorithm as flexible as possible. As there
may be cases where the client is wearing a hat or
sunglasses and that can interfere with how the
algorithm gets to decide whether they are wearing a
mask. Telling a client to take off their glasses or hat
just so the algorithm can detect can be indeed tiring
and impractical when software can be further
improved for comfort and ease. To find how these
errors occur, it would be thinking of plentiful of
cases where there are abnormal features that would
prevent the algorithm from any calculation. As with
the vast datasets compiled there may be possibilities
where there aren’t enough cases for the algorithm to
detect that specific irregularity involved. To get
across this issue, Justin Roldan and Ramsey
Alahmad predict that it would be roughly 10 hours
to patch such an occurrence, including the test, and
images provided to compile towards the dataset for
the GUI.
We aim to use human ambient body temperature
to monitor fevers. This will allow us to expand the
scope of our product’s monitoring of permissible or
non-permissible cases. To accomplish this, we will
use a thermal camera. While it is a camera it does
not interface with our system, or code, in the way
that a USB camera does, using camera specific
hardware protocols. Rather, the thermal camera
contains an array of IR thermal sensors, where each
individual thermal sensor returns an array of
infrared temperature readings that can be interacted
with using hardware interface protocols. So, the
programmer will have to take this large amount of
returned data and process it bit by bit to return a
converted value of temperature in degrees
Fahrenheit. Given that we have a limited number of
bits that the thermal camera can receive we must
ensure that we reduce the noise in the data
collection stage, so that the targeted test subject’s
temperature can be measured as accurately as
possible. In this section of the project, noise comes
in the form of background subjects also having their
temperature measured. An example of this noise
would be if a desired test subject is standing off
centered from the camera’s range and another
undesired individual steps into the frame of the
camera, thus skewing the results due to the overlap
of two different subjects. This issue can be
remedied by the designer through both a hardware
and software solution. In terms of hardware, a
camera with a longer lens (narrower field of view)
can ensure that the desired test subject fills the field
of view thus reducing noise on the data collection
stage. In terms of software, the programmer can
design the system so that data collection can only
occur when the subject enters a specific distance
from the camera, thus causing the system to only
operate when the subject fills the frame. Zaid Elias
will work to integrate the thermal camera into the
overall system, and he will also work to limit the
effects of noise on the temperature data collection
stage. Zaid Elias anticipates that the implementation
and calibration of the thermal camera will take an
estimated 25 hours.
To satisfy our group and project’s emphasis on
accessibility and user interactions we aim to
integrate the thermal camera as a parallel camera
feed to our main mask detecting camera feed. To do
this we have to convert the array of thermal sensors
to a stream of images. This is best accomplished
using computer vision python libraries, specifically
the image processing functions. The computer
vision python library allows us to take a bitmap
(output from the temperature data algorithm), apply
a color map to it, and then output it to a camera
pipeline. To further improve the accessibility of our
design we will also overlay the calculated
temperature on top of the generated video feed. An
issue we will run into with the generated stream
from the bitmap is the fact that the thermal camera
has a relatively low bit count in comparison to a
typical USB camera. This low bit count directly
translates to a very low resolution for the camera
feed which will make it very difficult to discern

25
what the camera is viewing. This can be remedied
by the designer using interpolation and resizing
functions, provided by the open-source Python
library. Specifically, the designer would implement
a bicubic interpolation which takes a 4x4 array of
pixel around each single pixel and calculate the
average of those 4x4 pixels’ values (e.g., color) and
use that to upscale the single bit that the array
surrounds. This method of interpolation is chosen
due to its ability to upscale an image to a resolution
that is discernable while still not stressing our
processor. The designer will start by implementing
bicubic interpolation and see the quality of the
results, and if it produces undesirable results, other
methods of interpolation will be implemented. Zaid
Elias will be responsible for the conversion of our
temperature data into a camera feed along with the
resizing and interpolation of our results. Zaid Elias
anticipates that this will require 25 hours to
implement.
Our System interaction will be used through a
GUI that allows an algorithm to detect those
approaching the kiosk. This will allow our system
to observe and display the designated area on the
monitor in real time. The monitor will prompt the
user if they qualify to enter the building with visual
cues. We will be using a camera to display a
window of real time footage. We will need to finish
researching which open-source library we would
like to use for our project, specifically one that is
user friendly that everyone in our group can
understand. Once we choose the best open-source
library for our needs, we will be able to use our
coding skills to adjust the pre-existing libraries to
our needs. Once we can make a connection to our
camera in real time, we will be able to start making
the necessary adjustments to the code. We will be
able to use a detection architecture algorithm that
will help us pick up the detection of people's faces
and allow us to put a square frame around their
face. There are many different detection
architectures like SSD (Single Shot multibox
Detector) and YOLO (You only Look Once) that
we have been researching. They both are similar,
but we wanted to test which gives us the better
output clarity and accuracy of real time footage and
detection.
A feature that is necessary to have been some
form of user interaction between the algorithm and
the client to display whether the client is following
proper mask-etiquette or not. For us to get our GUI
to display boxes around a person's mouth we must
train it with a dataset. This dataset will contain a
wide range of pictures that will help our system get
a more accurate percentage of errors. These pictures
will show different angles of masks, assorted colors,
and several types of masks. For us to save some
time with this we will be using an open-source
library that has a diverse number of pictures and
angles of mask. Displaying the bounded box will
help emphasize what we are looking for on a person
when they approach the kiosk. When they get to
the kiosk the camera will be able to look at the
person's face, locate the mouth, and determine if the
person is wearing a proper facial covering. If the
person at the kiosk is not wearing the proper facial
covering the box will change to red indicating that
you’re not following the proper guidelines. It will
then begin to play a buzzer and flash a red light at
the top of the kiosk to notify you that you’re not
wearing a face mask.
We would like to display the accuracy of our
monitors real time detection. There are several
distinct types of detection methods in which we
have been researching and determining which is
best suitable. One option we are looking at is
feature-based, this form helps locate the face by
extracting structural features of the face, by
differentiating facial and non-facial regions.
Another option we were looking at is appearance-
based which uses a delegated set of images to find
our faces. We then would use a blob to input our
image and use a network to detect and predict the
accuracy of our image with an algorithm called
Eigenfaces. This algorithm is quite resourceful
because it be able to detect variances in faces and
calculate up to a 97% accuracy. It Compares the
faces and masks in our dataset it captures a lot of
variances in the eyes, hair, nose and lips, and cheek

26
structure. This will give us some complications as
we will be using ours to find variances with people
who have masks on.
This system interaction will be completed by
Justin Roldan. This portion of the project is
important because it will be calculating our
accuracy as people enter. Along with sending visual
cues to the user to determine if they are allowed in
the building. Being able to have our kiosk display
these cues to the customer is important for a
positive experience so they will be able to get in and
out without complications. This portion of the
project we expect to take about 15-20 hours to
properly upload our code and debug the remaining
issues.
Another feature that we are going to be working
on is a motorized tilt for both the USB and the
thermal cameras. This feature will allow a greater
number of people of various heights to be read
accurately from a fixed distance that is
predetermined. To accomplish this feature, we are
using a HS-422 Deluxe Servo motor. By connecting
the servo motor to the GPIO, we can use the Jetson
Nano to control the motor and therefore angle the
cameras however necessary. The focus of this motor
is to implement it in a way that will autonomously
tilt depending on the position of the face that is to
be read. To implement this, we will first need to
create the face tracking algorithm for our device to
know where the object of focus is. Once the facial
tracking is complete, we will be able to begin the
implementation of autonomously tilting the
cameras. The factors that will be considered for tilt
both up and down will be the maximum/minimum
height of a person that the group decided on, and
the distance we need the user to stand away from
the cameras to maintain accuracy in our readings.
There are a few tasks needed to appropriately
implement this autonomous tilting feature. One of
these tasks is the proper testing of different height
and distance scenarios to calculate the correct
distance from the camera. Preliminary calculations
of the user distances are given as followed,
Standing distance from the Kiosk = 32.5 inches,
Maximum Height of User = 84 inches, Minimum
Height of User = 58 inches. Given these distances
we will test that reading will be accurate enough for
the mask detection and thermal detection to be
correct.
The second task of this feature is to allow the
cameras to tilt enough to meet the desired heights
and distances found from the previous task. This
means that the tilt angles are needed to acquire the
entire face of the user. Based on the distances
desired, the Camera Tilt Angle will be +/- 25.5
degrees vertically. To achieve these heights and
angles, the cameras must be positioned 68.5 inches
above the ground. These calculated heights and
angles assure that the face being analyzed will be no
more than 3 feet from the camera, with the
maximum and minimum height of the user being
7’0” and 4’10” respectively. These are preliminary
calculations that do not take into consideration
testing on different heights and angles, so once
actual testing begins, these values are subject to
change.
The final task to implement this feature will be to
merge the autonomous camera with the face
detection algorithm. To do this, will need to output
different values to our servo motor depending on
the pixel position that our face detection algorithm
is reading. The goal will be to maintain the user’s
face in the center of the camera’s visible area, so if
the facial tracking is reading lower than the center, a
command to tilt the camera vertically down until the
facial tracking is reading in the center of the visible
area will be sent. This task will be given slight
leniencies to avoid very small, unnecessary tilting
based on the user’s inability to stand perfectly still.
Shaan Wadhwa will be tasked with implementing
the motorized tilt of the cameras to accommodate
different user heights. Making this kiosk accessible
to a large portion of users will increase the
efficiency of regulating masks. The anticipated time
needed to complete this feature will be
approximately 22 hours.

27
FALL 2021
Week 1: 8/30 - 9/05
In the first week of the semester, we messaged
different classmates on Microsoft teams to form a
group of two CPE and two EEE majors. After
discussing with each other our separate talents and
our course objectives we all agreed to form a group
together. We then decided on who would become
the first team leader, we agreed that Justin would be
the first team leader. After the first lecture we were
each assigned to choose our own individual social
problem that we would like to research and present
to our peers.
Week 2: 9/06 - 9/12
During this period of the week, we did not have
lectures due to Labor Day, but we still used this
time to prepare our individual societal problem
reports. We managed to schedule weekly meeting
times during the week to constantly stay in touch
with each other for any project ideas or questions.
Week 3: 9/13 - 9/19
This week we submitted assignment 1 and
performed our individual reports to our teammates.
Justin wrote his individual societal problem on the
increasing number of wildfires happening in
California. Ramsey researched his societal issue on
how sleep deprivation can be aided. Zaid read up
and presented the probability of future pandemics,
and whether our design would be antiquated. Shaan
investigated respiratory epidemics and how to
prevent spreading the virus. We all spent various
amounts of time on this portion of the assignment,
but it ranged from 10-15 hours each.
Week 4: 9/20 - 9/26
In week four of our assignments, we all agreed
and selected our team's societal problem of a kiosk
device that would detect facial masks that would
cover the mouth, nose, and just below the chin. The
device would also use a thermal camera to detect if
a person is showing a body temp of 100.4, which
would be considered a fever, and one of the major
signs of COVID. This week we all spent a
combined 60 hours finding more research on our
topic and deciding what features to add to our
design. We refreshed our python knowledge to help
us familiarize ourselves with OpenCV. In that
research we also began researching servos that we
can use with our jetson nano.
Week 5: 9/27 - 10/03
After choosing our topic, we discussed the
documentation portion of our assignment where we
split up writing the cover page, table of contents,
table of figures, table of tables, introduction,
societal problem, conclusion, references, and
glossary. We worked on our first team activity
report where we broke down what we did for the
past week and what we plan to do for the upcoming
weeks. We also had to prepare for a team
presentation where we would give a brief
walkthrough of our problem statement with data to
suggest why our topic is important and how it could
be helpful towards everyday needs. We also began
to research different algorithms that we would like
to implement into our design along with basic
recognition tests on the nano. We spent a combined
total of 64 hours working on this portion of the
assignment.
Week 6: 10/04 - 10/10
This week we edited our previous documentation
errors, along with finishing the next sections of
assignment 3, the design idea report. This section of
the documentation we further explained our design
idea with information on the type of software and
hardware we would be using to implement our
design. In this documentation we talk about how we
will address the problem of limiting the spread of
respiratory diseases like COVID for business to
start thriving again. In addition, we will be
explaining what kind of technology will be involved
in our design and what makes our design unique
compared to others. We created a punch list that
lists all our design idea features and its measurable
metrics. This week we spent a total of 60 hours total
as a group working on our documentation and
demoing our design.
Week 7: 10/11 - 10/17
This week we did some revising on our punch list
to meet our instructors' standards on the Design idea
“contract”. Once we were able to get the approval
for our punch list which included an autonomous
tilting camera, Algorithm to detect if a person is

28
wearing a mask, detect if a person is carrying a
fever, along with a system interaction. To train our
algorithm to detect masks we had to train our
system by uploading a wide range of masks,
varying for assorted colors to distinct types. We
also began some calculations to determine where
the best placement for our camera is to get a wider
range of readings from people. One thing we
struggled with finding was a thermal camera that
would display accurate readings as most readings
were unacceptable margins of error for our design.
We began looking into GPIO programming as we
will have portions of our project that will involve
Arduino motors and software that communicates
with our LEDs. Along with working on our Design
contract we also performed our team member
evaluation forums. This week our team's total
amount of hours working on our project was
roughly 60 hours.
Week 8: 10/18 - 10/24
This week we began working on our Work
breakdown structure and decided to distribute the
measurable metrics equally and continue to fill out
our design document sections. Ramsey talked about
the system algorithm and how the camera would be
able to detect people once they get into the range of
view of the camera. Justin talked about the system
interface and how a GUI will be inserted around a
person's mask once the camera is able to detect it
and will display a percentage of accuracy. Zaid
operated on the thermal camera and attempted to get
the live thermal imaging to work properly. Shaan
focused on getting the tilting portion of the Arduino
motor working and testing if it would autonomously
tilt with a person's face. During this week our team's
total hours completed were 58 hours.
Week 9: 10/25 - 10/31
Assignment 4 - Work Breakdown, Senior design
Project Safety Assessment Form
Week 10: 11/01 - 11/07
Assignment 5 Project Timeline
During this week we will be updating our
documentation for assignment 5, where we will
update section D the project timeline, for the
executive summary, abstract, introduction, and
conclusion. We will also be adding section VI.
project milestones and timeline specifics to our
project along with appendix E timeline charts and
PERT diagrams. We will also submit a week 10
activity report. We project this assignment will take
each of us 10-15 hours to get completed.
Week 11: 11/08 - 11/14
Assignment 6 Risk Assessment
This week we will be updating section E of the
risk assessment in the executive summary, abstract,
introduction and conclusion. We will also be filling
out “VII. Risk assessment” portion where will
introduce the potential risks of completing our
prototype on time. We should be able to detect
potential risks and strategize a way to minimize the
impact or risk. The estimated number of hours that
it will take to complete this is about 15 hours each.
Week 12: 11/15 - 11/21
Prototype Progress Review - Demonstrate project
and any unresolved Issues
During the week we will demonstrate our project
to our instructors and discuss any unresolved issues
or features by our final demo day. We will also
write a team activity report discussing what we have
achieved and our goals for the upcoming week. We
expect to work up to 20 hours each to have a
working prototype to demonstrate.
Week 13: 11/22 - 11/28
Outgoing Team Leader Report, Team Member
Evaluations
This week we will test our design for reliability
and fill out our team activity report. We will also
fill out our outgoing team leader report.
Week 14: 11/29 - 12/05
Teamwork Evaluation
This week we will look ahead and begin
preparing for the spring semester
Week 15: 12/06 - 12/10
Assignment 7- project Technical Evaluation,
Laboratory Prototype Presentation

29
Assignment 8- laboratory Prototype presentation
For assignment 7 we will use our design idea
feature set as a guide for the review flow. We will
present our technical details of our laboratory
prototype, where we will demonstrate the hardware
and software system and its functional blocks.
Assignment 8 will feature a summary video that is
3-5 minutes that highlights the features of our
team's project. We will also prepare a large-scale
poster PDF as a soft copy. We will then present our
project on zoom on Friday December 10.
SPRING 2022
Week 1: 1/24
Team-instructor meeting
Team Activity Report
During this week, the goal is to look back at
understanding the problem statement and to make
any necessary changes towards the project. It’s to
see if there has to be made any adjustments after
researching more about the problem statement.
Afterwards, adjust the timeline, work breakdown
structure, and PERT chart. In total we should have
about 8 sources, 4 peer-reviewed and 4 non-peer
reviewed.
Week 2: 1/31
Team Presentations
Assignment 1: Revised Problem Statement
Team Activity Report
On this week it is expected to work on the device
test plan to identify and correct weaknesses in the
build towards the deployable prototype. The group
must make improvement towards the prototype and
re-test to confirm the metrics accurately. Also, it is
expected to determine the necessary factors that
need testing, a test timeline. There will be a table
that include the test ID, test description, expected
results, actual results, and if it is a pass/fail to the
measurable metrics.
Week 3: 2/07
Team Instructor meetings
Assignment 2: Device Test Plan Report
Team Activity Report
For week 3, it is preparation for week 4 which is
to show and demonstrate the status of the project
build if it is well within the representation of the
testing results. It is it to be expected that each
feature shall be discussed, the tasks remaining for
the second semester, and videos to establish
prototype build progress.
Week 4: 2/14
Team Presentations
Prototype Progress Review
Team Activity Report
In this week, it can be seen as a work week. The
time can be used to test, and make modifications
towards any issues that may arise from the project.
Week 5: 2/21
Team Instructor Meetings
Team Activity Report
For week 5, it is to work on the market aspect for
our project. It’s to be assumed that the group shall
seek creative ways to leverage understanding of the
prototype with other people’s knowledge of the tech
industry. The group expects Shaan to work to
research of where our projects stands within the
market, who are the clients, and where the market
sector is heading towards the pandemic. Also a
presentation is expected.
Week 6: 2/28
Team Presentations
Assignment 3: Market Review
Team Activity Report
After the presentation is given for the market
review, each group member will write their own
brief report and present the team’s work. Each
member will write certain aspects of project/system
with personal technical aspects highlighted. For the
written report, it’s suggested to start with a brief
less than 30 seconds description of the societal
problem. Outline the entire system/project and its
complete feature set. Detail the technical
completion of the subset of features/components.
Conduct white box texting, and results of the
technical work. How the function integrated with
other components, and illustrations. Afterwards, the
presentation will contain an elevator pitch,
introduction, visual aids, delivery, content, and
conclusion, which is expected to be 6 minutes long.

30
Week 7: 3/7
Feature presentations
Assignment 4: Feature report
Team Activity Report
Team Member Evaluations Due by 3/11
This week is expected to hold feature presentations,
and teams are expected to continue testing and
development.
Week 8: 3/14
Feature Presentations
Outgoing Team Leader Written Report
Team Activity Report
Instructor feedback on team member evaluations,
and continuing of individual feature presentations.
Week 9: 3/21
Spring Recess
Expected to prepare for prototype build for week
10.
Week 10: 3/28
Team presentations
Prototype progress Review
Team Activity Report
After presenting, work on test results report.
Week 11: 4/4
Team-instructor Meetings
Assignment 5: Testing Results Report
Team Activity Report
Continue development and testing of project.
Week 12: 4/11
Team Instructor meeting
Team Activity Report
Team Member Evaluations due by 4/15
Finish the team activity report, evaluations, and
team leader report.
Week 13: 4/18
Team Instructor meeting
Fourth outgoing team Leader Report
Last Team Activity Report
Instructor feedback on team evaluations
Work towards the deployable prototype
presentation. Present the important features of the
project. Prepare a post-project audit, which answers
the questions of, the design measurement achieved
or not, if the project is on track, if the design
addressed the societal problem, deficiencies, budget
allocation, and issues.
Week 14: 4/25
Team Presentations
Assignment 7: Deployable Prototype Eval
On this week, the team should work on the end of
the project documentation. It is expected to
document all aspects of your senior design project
such as revising all interim work to create a
seamless narrative in each report that covers the two
semesters. Write about the development of the
project from start to finish, and describe the work
needed to develop the team’s design ideas. Also
record a video that highlights the project that is
roughly 2 minutes.
Week 15:
Documentation review
View end of project video
Assignment 8: End of project Report
Three-minute video and team picture
Prepare for deployable prototype presentation
depending on if it is in person or not.
Week 16: 5/9 - 5/13
No Lab
Assignment 9: Deployable Prototype Public
Presentation

31
VI. PROJECT MILESTONES AND
TIMELINE
FALL 2021
To better organize our work and delegate tasks
and responsibilities within the group, we broke
down our overall project from the beginning in Fall
2021 to the end of the project in Spring 2022 into
each of its individual milestones and documenting
what we accomplished within these individual
milestones. The Gantt and PERT chart associated
with the project milestones and timeline of our
product development appears in Appendix E-I and
E-XV respectively.
The priority that was necessary for us to reach to
create a functioning product in the span of two
semesters was picking a societal problem that we
wanted to address. Our group formed in July 2021,
one month before the beginning of the product
design course, and from that time we began
discussing what societal issues we would like to
address and what product can provide a solution.
We had an idea of what technology we would like
to use but we were not totally in agreement with
what issue we wanted to address. We all chose a
societal issue, researched both its context and
potential solutions, and presented it to the course
instructor and class. With consideration of the
professor, and colleague input and suggestion we
narrowed down our societal problems to one choice;
aiding business to monitor compliance with
government health mandates. We began researching
our issue more thoroughly and shared resources that
both addressed the context of health mandates and
of diseases, while also exploring the long-term
relevance of our societal issue. All our research was
combined into one team problem statement that we
submitted to our instructor. This official process
from individual societal problem research to team
societal problem began on September 6th and ended
on September 27th, 2021. Justin Roldan contributed
7.5 hours, Ramsey Alahmad 6 hours, Zaid Elias 6
hours, Shaan Wadhwa 4 hours for a total of 25.5
hours.
The next focus for our project was completing our
design idea contract. With our team societal
problem chosen and approved by the professor we
began formulating a design process that would
provide a solution to our societal issue. This process
began on September 27th, 2021. Given that we had
been discussing technologies that we were
interested in and comfortable with using prior to the
beginning of the societal problem section, we felt
that we already had a basic idea of the design path.
Given that our group is composed of an equal
number of Computer Engineers and Electrical
Engineers, our design process was agreed to have
an almost equal share of hardware and software
components. Also, at this point in the year (early
October) we knew that if we did not start
purchasing some of hardware, we would find
ourselves stuck in the holiday shipping bottleneck,
unable to purchase the hardware we need to create a
prototype. We were also concerned about the
prospects of global semiconductor shortages, so we
decided to purchase much of our most critical
hardware in late September and early October. With
our hardware requirements answered, we began
discussing and researching what software solutions
we would use within our design. This process did
not take longer than a few days (October 01- 03), as
the software necessary to create neural networks
and computer vision designs in the Python
programming language is very clearly defined as
there exists only a few options available. As we
researched the hardware and software options, the
group reached an important milestone in deciding
what they wanted on the feature list. We agreed to a
feature list with measurable metrics after much
deliberation with the professor and discussion of the
group's capabilities. Zaid Elias and Shaan Wadhwa
were tasked with exploring hardware solutions,
while Justin Roldan and Ramsey Alahmad were
tasked with exploring software solutions. This
process of creating a design idea ran from
September 27th to October 4th. Justin Roldan
contributed 7 hours, Ramsey Alahmad 4 hours, Zaid
Elias 7 hours, and Shaan Wadhwa 4 hours for a
total of 22 hours.
Something our group sought to complete sooner
rather than later was the Work Breakdown Structure
(WBS). We felt that if we were able to properly
organize our project in a top-down manner with
every feature being broken down into smaller
subtasks we would be able to plan out further
milestones. Ramsey Alahmad created the chart for

32
WBS while Shaan Wadhwa, Justin Roldan, and
Zaid Elias wrote the week-by-week task
breakdown. We began writing our WBS on October
18th and finished it on October 25th. The WBS
overall took 40 hours to complete with each group
member contributing 10 hours. Reaching this
milestone allowed us to plan for our future
milestones leading up to a functional prototype.
With the time that this project spans, an important
milestone for the development of our product was
creating a system for forecasting future tasks and
structuring our workflow. We created a GANT
chart too project our time dependent tasks and we
created a PERT diagram to be able to visualize our
project through a top-down breakdown from feature
to work packages. The GANT chart was completed
on October 29th by Ramsey Alahmad and the group
continued to fill out their sections for it until
November 1st. The GANT chart took approximately
4 hours to complete. The PERT chart was
completed on October 31st by Justin Roldan, and it
took approximately 3 hours to complete. The PERT
diagram outlined All members of the group
contributed to the dividing of the report writing so
that each can document both their personal project
milestones. By reaching this milestone the group
was able to properly plan out the rest of the product
development in a structured, ordered, and consistent
manner. Overall, the creation of the GANT, PERT,
and report writing ran from October 25th to
November 1st and took approximately 29 hours. We
will continue to build and add on the GANT and
PERT chart as necessary.
As we get further into the design process for our
product, the risk potential increases. With so many
parts continuously being added to our product and
with the semester entering a stressful period there
begins to be specific and broad technical risks,
along with systematic risks. For us to be able to
properly mitigate and navigate around this risk we
need to make a Risk Assessment. We plan on
meeting on November 1st, 3rd, and 5th to discuss
what risks both us and the product could potentially
face that would prevent us from being able to
deliver a prototype on December 10th, 2021. The
creation of the Risk Assessment Chart and the
report writing will involve each team member and
will take approximately 24 hours to complete with
each team member contributing about 6 hours. We
anticipate that the Risk Assessment will be started
on November 1st and completed on November 8th.
The Prototype Progress Review will be held on
November 15th at two possible time session, either
from noon to 1:55 pm, or 2 pm to 3:55 pm.
Whichever section our group will be attending to
present our prototype’s progress is to be determined
later. This will be a day designated to an in-person
demonstration of every feature that we have
included on our punch list. Considering that there
will be roughly 7 teams attending each session, that
leaves approximately 17 minutes designated to our
group’s presentation, found by dividing the
session’s total time of 2 hours by the number of
groups that are to present their prototypes.
The laboratory prototype evaluation is to be
conducted on the 6th of December. It is a day to
where we are supposed to demonstrate the
integrated components of the design idea in a
laboratory style. The goal of this is to gather up
whatever our team has regarding the prototype and
its features. This would be considered a milestone
in our project considering that with all the time
spent to crafting a prototype, means that by now we
have some form of prototype that is practical
enough. It also signifies that we have covered the
basis of the features that make up our project. How
we divided the work to reach that milestone was
that during that week of preparing for the
evaluation, we’d have our team member Ramsey
Alahmad prepare the presentation, Zaid Elias
discussing about the technical features, Justin
Roldan printing out the hardcopy of punch lists, and
Shaan calculating the statistics of the overall
outcome of the project.
SPRING 2022
Our first assignment of the new semester will
involve revising our problem statement from the
previous semester. After obtaining the knowledge
from first semester we should be able to revise our
problem statement accordingly. We will then
review our design idea contract to ensure we fully
implement all our features specified in our design
contract. If we want to change any of our features,
we will submit a change order of request. This will

33
only be needed if changes are needed. Lastly, we
will update our PERT diagram and critical paths
according to our changes to the WBS. We will also
need a minimum of 4 peer-reviewed articles that
involve news/popular magazines, articles/internet
postings that improve our understanding of our
societal problem. We will also be presenting an oral
presentation of our revised problem statement to our
entire senior design group. We will present our
presentation with visual aids that will be roughly 10
minutes with 5 minutes of questions. This is to be
worked on from January 24 to January 31.
The Device Test Plan Report will dedicate us to
analyzing our project and determine which aspects
of our prototype need further tests. These tests
involve a large range of factors that will transition
our lab prototype into a functioning prototype
without predetermined factors such as temperature
or humidity. It will take about 10 hours total,
divided between the group to accomplish this report
and is predicted to be worked on within the week of
January 31st through February 7th.
Our group will look at our deployable prototype
from a marketing perspective from multiple
viewpoints. We will ask ourselves who the
consumer is and how this product is going to
positively affect them. Perspectives from the
viewpoint of the user and analyze how our
“product” competes in the environment that it falls
in. Once our review is complete, we will present it
with visual aids and a one-page summary for the
instructor. Considering all the aspects of this
assignment, our total hours spent with be 26 hours
while working on it from the weeks starting from
February 7th to February 28.
We will prepare an individual written report that
summarizes the aspects of the technical completions
of a feature with topics including description of our
societal problem, outline the entire system/project
and its complete feature set, detail completion of
subset features, white box testing, interdependence,
and integration with other project components. We
will also present an oral presentation that will
demonstrate the mastery of the content presented.
The presentation will be 6 min long that has strong
key points that will make the take-home message
clear and is to be worked on from February 28th
through March 7th.
Incorporate our completed test plan and testing
results into the End of Project report. Along with
discussing the device testing results and how the
results impacted our project. We will then update
our test plan that will include modifications to our
design if any are applicable. The testing results will
be reported in the progressive writing End of
Project Report. We will then create a section in the
report called “IX. DEPLOYABLE PROTOTYPE
STATUS” with the additional headings Executive
Summary, Abstract, Introduction and Conclusion.
Through the weeks of March 7th and April 4th this
will be worked on.
Each student will complete a quiz on engineering
ethics on April 18.
The prototype evaluation will emphasize on the
functionality of our project hardware. We will
quickly present the importance of our features. We
will then prepare a post project audit, that will talk
about the full implementation of the feature set.
Other topics that will be included in the post-project
audit are, the budget allocation, project management
deficiencies, and if we adequately addressed our
societal problem. In addition, we will provide visual
aids such as real time data to show satisfactory
implementations of our features this is to be
conducted between the week of April 18 through
April 25.
For the deployable prototype documentation, we
will revise all interim work to create a seamless
narrative that covers both semesters of our senior
design project. We will prepare a written report that
tells an engineering story of our two-semester
developing our deployable prototype. We will then
document in the “End of Project” section that will
describe the work needed to develop our teams
design that consist of an assembled laboratory
prototype, perform appropriate testing, and research
that helped create the design. The PDF report will
include a team picture with all team member names
inserted into the graphic identifying each one of us.
We will also include a two-minute video that
highlights our project. This will be done on the
week of April 25 through May 02.

34
MAIN MILESTONES FOR PROJECT
Considering the project revolves around machine
learning and the camera, the biggest milestone of all
was to make the camera give input towards the
algorithm to determine if the client is wearing a
mask or not. It’s extremely import as to get this
done before November 15th regarding the progress
demonstration because without it, it would often
render the project to be worthless as that was the
main intention regarding it. As this feature by far
deserves the most priority it would be best to start
on it as early as possible. With so, Justin Roldan
and Ramsey Alahmad decided to start as early as
October 18th. This is so that Justin can research and
start with interfacing with the camera to establish a
connection towards the code, and so Ramsey can
use the time in conjunction to gather the images and
development of the training set so that the algorithm
can compile the model to depend on it when it
comes to identifying who is wearing a mask or not.
With the time focused on those weeks regarding the
Camera and algorithm, it is to be finished by
October 25th. It took another week since the fact
that there was a delay from figuring out how to
allocate enough memory towards the GPU since the
algorithm wasn’t functioning correctly. By thinking
of a solution to allocate enough memory, it was then
solved. However, referring to appendix E-XI, the
basic function of the algorithm to detect mask or no
mask was complete that doesn’t exactly signify it’s
complete all together. Rather, afterwards there will
be continuous testing until May so that there can be
polishing applied towards the code and overall, in
general where the other features can come together
as one. It’s expected that roughly around mid-
February the project shall be finished on top of the
continuous testing.
One of the earliest features that was started on
regarding the project was the usage of servo motors.
This is another feature that is very important to
complete before our November 15th deadline to
properly showcase our all of our features. The use
of servo motors is implemented to allow people of
various heights to use the product, if not properly
implemented, only a small portion of users will be
able to successfully use our product. Shaan has been
working on getting the servos to properly work
since they were delivered along with the required
driver board to connect the motor to the jetson nano,
which both arrived on October 12th. Since then, an
exclusive library for the servo motors was installed
to initialize channels. Reinitializations were needed
until the tilting was set up properly. To implement a
basic algorithm for tracking and following a face,
an open-source face model file was used which then
returns the location of the face. Once the location of
the face is obtained, calculations are done to attempt
to center the face in the frame by sending pan and
tilt commands until a certain degree depending on
the necessary amount that was calculated.
Implementing the autonomous tilt from the servo
motors took about 6 hours once facial tracking was
completed. Further testing and adjusting will be
made as we progress to fulfill the measurable
metrics of accounting for a maximum and minimum
height for a user while maintaining a maximum of
3ft from the kiosk. Our goal for this milestone is to
merge the autonomous camera tilting script with the
AI face mask script that detects if a facemask I
sufficiently worn or not. To complete this, Shaan
will work with Ramsey to properly integrate the
algorithms in order to both tell if a mask is/isn’t
worn and allow the product to account for variable
height and movement for clients. Projected dates for
the merger of these two key features is the week of
November 22nd where approximately 8 hours until it
is completed.
The next milestone was regarding making a
properly functioning temperature sensor. Among
the key features our group desired to integrate into
our projects was a method to monitor for fevers,
specifically through temperature sensing. It is very
important that our group can integrate this fever
screening solution prior to the group’s laboratory
prototype presentation on December 10th, 2021, as it
is one of our main advertised features. The
development for this feature of the project began on
October 18th by group member Zaid Elias. He
anticipates that the temperature sensing algorithm
design of version one of this feature will be
completed by November 4th, 2021. From there he
anticipates that the testing and calibrating of this
feature will be an ongoing process until the lab
prototype presentation on December 10th. Within
this milestone is the goal of calibrating the
temperature sensor to a margin of error of +/- 1-2°F.
During the beginning of the algorithm designing

35
process, the temperature sensor was deemed
incompatible with the main computer that it was
connected to, and thus on October 22nd, Zaid Elias
researched and purchased an alternative temperature
sensor that was compatible with the computer. This
temperature sensor avoided shipping bottlenecks
and was delivered on October 26th. Zaid anticipates
that the design of the algorithm will take him an
estimated 25 hours to complete, while the testing
and calibrating will be an ongoing process up to the
prototype delivery date.

36
VII. RISK ASSESSMENT
In every project, there is some form of risk
associated. Mitigating risk was urgently planned out
at the beginning of our semester considering
COVID-19 is still an issue and we’re not exactly
able to get the project flowing smoothly as if it were
in person, thus there needed to be some alternative.
It was best to have some foresight and backup plans
to adapt towards the risks associated regarding the
critical path, as it was mainly revolved around the
punch list. Further descriptions of the letters in
TABLE III are references in TABLE V to the right.
TABLE III.
Risk Assessment Matrix.
Probability Risk Matrix
5 J K
4 G L
3 E D H
2 B F I C
1 A
1 2 3 4 5
Impact
TABLE IV.
Level Impact Descriptions for Risk Assessment.
Level Impact
1 Minimum, or no impact
2 Impact can be tolerated
3 Limited impact
4 May jeopardize project
5 Will jeopardize project
TABLE V.
Letter Symbolization.
Letter Impact
A Buzzer not triggering when desired
B Microcontroller not having proper voltage
C Not properly understanding the usage of
microcontroller
D Not having proper voltage for the servo
E Overfitting dataset to be used in algorithm
F Temperature sensor not working
G LEDs/Buzzer Short Circuiting
H Incompatible libraries on Microcontroller
I Group member being overwhelmed by
courses
J Group member experiencing medical
procedure
K Fire emergency at group members area
L Family member health crisis
A. Specific Technical Risks
Risk H refers to having incompatible libraries
when developing on the microcontroller. When
developing the algorithm and compiling of the
model using Python, there’s a library made
especially for deep learning and artificial
intelligence that is available through various
platforms. However, just because it was made
available through various platforms with the latest
version doesn’t exactly mean the same case as for
us using the microcontroller. This issue was coming
across when developing the algorithm early in
development. The library which is “TensorFlow”
which is an open-source software library for
machine learning and artificial intelligence, was
updated for many platforms besides ours. The
incompatible library delayed an entire work week
earlier in development because there wasn’t as
much explanation in the documentation regarding
installation as to why it would not work. Eventually,
this took many days as to figuring out why, such as
reformatting the operating system, reinstalling the
library, downgrading which led to mismatched sub-
library versions. So, to find a workaround towards
this was doing looking deep within documentation
of the library and forums to find the issue and
finally it was able to work. We learned this the hard
way earlier of the semester which would’ve been

37
brutal mid-way as it would’ve costed crucial
amounts of time towards deadlines. For future risk
mitigation if this issue ever comes across would
first be researching if a library is compatible with
the platform through forums, documentation,
tutorials on how to install it properly if available, or
even look for alternatives in the meantime to
achieve the same result. When compiling the
models, the library “TensorFlow” was used in
junction with the Python coding language. To
achieve the same results there were possible other
libraries made available for the platform such as
OpenCV, Pytorch, and Keras. By not accounting for
this risk, it can ultimately impact the critical paths
of the project in which it relates towards the punch
list. The libraries itself effect the software which
then controls the hardware which makes the project
go nowhere. Surely, the person who is in charge of
developing the software portion of the project
should be responsible on what is the smoothest
open-source program in order to help achieve the
task and completing the project.
A specific technical risk that we produce is the
possibility that our power supply is incompatible
with the micro-controller. This is a lower-level risk
in our project and why we labeled it B, in the Risk
Assessment Table. If our microcontroller were not
able to connect to our power source, then our
project would not be able to function properly. The
autonomous sensor would not be able to detect
faces and properly and tilt the camera as needed. A
common mistake is connecting the 5V or 3.3V
power source to the wrong pin. Doing this would
cause the device to lose voltage through the
regulator, this could cause our device to run below
the required voltage and cause the device to crash.
Another issue we could run into is having our wires
running to our breadboard or microcontroller to get
disconnected, causing it to stop working. For us not
to run into these issues we should read up on the
equipment we are using to determine that it is in the
voltage range to be able to connect to the micro-
controller. Checking our inventories power source
should happen at the beginning of the project so we
do not make any mistakes in buying incompatible
equipment. We should also read up on our micro-
controller so we know which pins and USB ports
we will use to connect our device. The two group
members who are in control of the micro-controller
and camera will have the most impact on this
portion of the design as they will have the key
features that our group will be using to implement
into our design.
Risk A of the Risk Assessment Matrix in Table
III above denotes the specific risk of our buzzer not
triggering when we need it to or triggering by itself.
Considering that our project operates in one of
multiple states, with one of those states being
represented using a buzzer, having the buzzer not
trigger properly can skew our results and make our
product less effective. The microcontroller that our
project uses supplies 5 V across the whole system,
and thus supplies voltage across all its GPIO pins.
The risk from this is that we only want the buzzer to
trigger when we send a signal to it, and that the
buzzer is an active-high buzzer. So, if the computer
is supplying voltage to the pin that it will trigger the
buzzer by itself. This risk can be mitigated by
including pull-down resistors to the wiring of our
buzzer so that any voltage that passes through the
pin connecting the computer to the buzzer is
reduced to a voltage level that does not trigger the
buzzer. The group member tasked with the wiring
of the buzzer classifies this as low probability and
low impact because the solution for this involves
readily available resistors and the group member
has experience in basic circuitry to know what and
how pull-down resistors operate. This risk
mitigation can be done and tested during the
building process of the circuit.
Risk F of the Risk Assessment Matrix in Table III
represents the specific risk of our temperature
sensor not being able to interface with our
microcontroller. One of the key features of our
product is a fever screening solution which we
satisfy using a temperature sensor array. The
problem with using a temperature sensor array is
that it interfaces with our microcontroller using the
I2C communication protocol. The problem with the
I2C protocol is that it can sometimes be unreliable
when it comes to establishing a connection with
devices. Often the I2C protocol can fail due to being
short circuited, or due to having an address in
memory that interferes with other microcontroller
functionalities. Considering that the I2C
temperature sensing device is relatively high cost in
comparison to the team’s budget, a bricked or

38
incompatible temperature sensor can significantly
impact our product development path. The group
member responsible for implementing the
temperature sensor can mitigate the risk of having
an incompatible temperature sensor by researching
for temperatures sensors that either; have a low
defined operating voltage or have a voltage
regulator embedded to the device in order to avoid
the potential of having a short-circuited device.
Also, the group member can mitigate this risk by
ensuring that the memory address that the
temperature sensor’s I2C protocol operates at is not
being used by other processes of the
microcontroller. The group member responsible for
the temperature sensor classifies this risk as having
a level 2 probability and a level 3 impact. The lower
probability is since proper research can minimize
this risk factor and the higher impact is because the
fever screening feature of our product is dependent
on this one specific part.
B. Broader Technical Risks
Risk D, as found in Table III, represents our risk
of not regulating the voltage input for our servo
motor. Understanding the proper voltage needed to
be applied to our servo motor is very important due
to the risk of shorting the motor. If a voltage is too
high when being applied to the motor we will need
to replace it completely. This has already almost
been encountered during the process of configuring
the autonomous tilt of our cameras. A way to
mitigate this risk is solely to ensure that the
microcontroller is in the proper voltage mode, in
our case for the motor’s driver, 10V mode. This
could set the project back by weeks if supplies are
limited and or unavailable. A key feature such as
the autonomous tilting is needed in order to further
refine our project and without it, necessary
adjustments to both the thermal sensor and the face
mask detecting camera would be set back due to no
variable height of our tests. Double checking that
we are using the correct voltage modes, and that our
hardware is compatible to output the proper
voltages in order to have everything function
properly and without faults such as shorting
hardware and needing to replace them.
Risk G, as referring to Table III, is to be
symbolizing LEDs/Buzzer shorting circuiting.
Mainly any hardware piece attached towards the
microcontroller. This was mainly seen as a mid-
high-level concern regarding that the
microcontroller shuts off when a short circuit occurs
as a safety feature. How this might happen is that
since most hardware applications towards the
microcontroller rely on a 5V GPIO pin, one faulty
pin may receive more voltage than the rest of the
hardware components since the basic idea is that
voltage flows through the path of the least
resistance. To having 5V flow through LED/Buzzer
or whatever hardware component is reliant on the
5V GPIO pin, could circulate a short circuit.
Fortunately, we have had this issue encountered
before early in the project and we were lucky
enough that it didn’t do a significant amount of
damage to eventually stop the Microcontroller from
working. At the very most, it would just shut off the
microcontroller and we’d have to restart. Part of
what we found was that the microcontroller was
originally in 5V mode which is the bare minimum
to keep it functioning, and when the hardware piece
demanded more voltage, it would immediately short
circuit and crash. To fix this issue, we found out
that we can enable the microcontroller to deliver
more voltage necessary if needed and it was solved.
For the risk mitigation portion if this issue happens
again, is to immediately disconnect the power
source (if it has not already disconnected), and able
to assess the wiring in what wrong. The member
that should be held accountable is the one that wired
the GPIO pins towards the hardware component.
The accountable should consider using lower
voltage such as the 3.3V GPIO pin so that it is not
overwhelming towards the hardware piece,
alongside the usage of resistors so that there’s just
enough voltage that isn’t overwhelming the piece.
Unfortunately, there may be a chance that it could
in fact jeopardize the project and may end up
bricking the microcontroller. If that is the case, then
immediate steps should be taken. Considering our
group members have an alternative microcontroller
if the main one is destroyed, the components will
then be rewired towards it, and no loss of code nor
progress should happen due to having a backup
alternative. It’s good to have an alternative on hold
just in case considering that at the time there’s a
massive shortage in electronics and delivery can’t
be depended on as it can stall and make us lose
progress. Thus, by having a backup microcontroller

39
allows us to continue on and is just a matter of
rewiring the hardware correctly. Also, there’d be no
delay in coding development because we prioritized
the usage of GitHub, an internet host of software
development, so we can just utilize the repository
we made and continue developing without having to
do it all over again on an alternate microcontroller.
Risk C in the Risk Assessment Matrix on Table
III represents the broader technical risk of a group
member’s inexperience with microcontrollers or
power engineering leading to our main
microcontroller being bricked. Our whole project
revolves around and is implemented upon a single
expensive computer/microcontroller. If the
computer malfunctions and is “bricked” our project
will no longer be viable and we would not be able
to present anything to a potential client or advisor.
This risk is also heightened due to the different
experience levels and comfortabilities within our
group. Within our group we have two Electrical and
Electronics Engineering majors and two Computer
Engineering majors. While both sets of students
bring many of the same skills and experience
towards the project, key differences exist in terms
of the Computer Engineering students experience in
programming and the Electrical and Electronics
Engineers experience in power engineering. So,
Computer Engineering students may be less
accustomed to taking power considerations when
working with hardware which can potentially lead
to a bricked microcontroller. This risk can be
mitigated by choosing a microcontroller that
includes voltage and power regulating technologies
embedded into them in both hardware and software
forms. We can also mitigate this risk by setting
certain standards of what power supplies and levels
should be used. Ultimately our group decided to
classify this risk as being low in probability at a
level of 2 because the group agreed to choose a
microcontroller that has voltage and power
regulating technologies regardless of added price.
We also agreed to a high level of 5 for the impact
because the microcontroller is an expensive part and
is also the central component to our project, so if it
is bricked, we would struggle heavily to recover and
satisfy our project timeline.
A possible broader technical risk that is more
likely to happen and give us trouble is that our
algorithm produces a low accuracy. This would be
considered a low-mid risk and is labeled Risk E in
Table III. When coding our dataset there could be
several issues that arise like overfitting, data
leakage or faulty code. Overfitting occurs when our
algorithm picks up too much noise in the
background and causes it to negatively impact our
data. Our training data picks up the noise instead of
the signal and makes a prediction of that noise,
causing a low accuracy reading. We may also have
an issue when it comes to data leakage meaning that
information is being leaked into our dataset from a
point that should not be available during the training
phase. If we do not observe our code and check for
data leakage our predictive accuracy will fail to
meet our acceptable threshold standards. This
would cause us to have misleading information to
present when it comes to our accuracy prediction.
For us to avoid any of these possibilities the group
member in charge of the GUI along with the group
member in charge of the dataset will have to make
corrections accordingly. By retraining the model
and using a clearer dataset, the compilation of the
model can truly focus on the object that we are
implementing, face masks.
C. Systematic Risks
Risk I, shown on the Risk Matrix, discusses the
possible risk of a group member being
overwhelmed with work from other courses. A
group member, or even worse, multiple group
members becoming preoccupied with course work
can be detrimental to the progression of the Critical
Path of the project. If one or more of our group
members are rendered unable to progress the project
in some way, it could lead to a severe setback of our
project. With certain tasks and milestones being
reliant on the completion of others, a week of no
progress from one or more of the group members
could result in the other members waiting for
another task to be finished in order for them to
progress as well. Ways to mitigate this risk that
could potentially prevent us from finishing this
project is to be proactive with our studies.
Procrastination of any kind will affect our
teammates and should be taken seriously. If there is
no way of avoiding being overwhelmed my other
courses, the best way to mitigate the time and or
work loss would be to inform the group that you

40
will not be able to perform as expected for the
period of time until the other course work is
handled.
Risk J includes a group member having to deal
with medical procedures that involved some form of
short recovery periods until the next procedure. This
risk can have some impact on the project, especially
when the group member has high responsibility of
tasks to finish to allow the critical path to smooth
nicely without any bumps. By taking the time off to
recover, it can perhaps delay work packages that
were meant to be finished by said group member.
Not only does it delay, but it’s prone towards
miscommunication and confusion among group
members who depend on that person to get their
tasks done, especially when there are deadlines to
be met. To account for mitigations such as this one,
the group member has discussed with the group
ahead of time with the predicted recoveries on how
long they take, when the procedure takes places. If
the group member that is going through medical
procedures, they will need to pass off their tasks in
the meantime until they recover so that work is no
longer delayed. Tasks can be worked in parallel as
they recover by other members. The big key take
here is the process of communication and planning
out priorities that the group member recover is
responsible for. Perhaps that it the group member
has the most time available can take over while the
other member recovers so that the rest aren’t
overwhelmed by the responsibilities and tasks that
they already must deal with.
Risk K, shown in the matrix above, could happen
if there was a fire emergency at school or at a group
members' hometown. We all live in California, and
we have had an increasing number of wildfires in
the past few years. Even Sacramento State had to
close the campus due to the heavy smoke produced
by the massive wildfires in November of 2018. In
September 2020 there were wildfires happening all
throughout Napa County, where one of our team
members lives. Houses were burned down to the
ground and acres of land were burnt, causing many
people to lose valuables inside their homes. If a
wildfire were to happen our team members might
have to evacuate their house and could forget parts
of the project. Another possibility is that they might
not be able to communicate due to evacuating and
finding shelter. This could set us back a few days as
that person might not have access to their home or
lost it to the fire. A natural wildfire is not something
we can avoid if it happens, but a feasible way to
mitigate the situation is to buy spare parts of the
important components. Along with constantly
having shared their work with the group members
from the beginning so they would not lose any of
their data. This would be helpful so there would not
be any delay in the progress to the design to have
been completed by the due date. It would be helpful
to have bought the parts at the beginning of the
semester and kept them separately from each other
to avoid any delay to the project.
Risk L, shown in the Risk Matrix, represents the
risk of encountering a Family Member Health Crisis
in the red section. Especially in the time that we live
in now with Covid-19 still being a major issue,
hence our project attempting to limit the spread, a
teammate’s family member is at risk of falling ill.
Even for family member that have received a
vaccine, vaccines like the Pfizer vaccine have
reported an efficacy of 95%. This leaves a 5%
chance of vaccinated family members to contract
this respiratory virus. As of now, a group member’s
father has just been informed that one of his
employees have Covid-19. Mitigations are already
being put into place to ensure that this does not
affect the project including fully quarantine
themselves from each other to prevent the group
member from possible risk of Covid while awaiting
Covid test results. Depending on if his father
contracts covid as well and the severity of the
symptoms, the member is at risk of losing time to
work on the project because of needing to care for
his father if symptoms escalate. Other than just
Covid affected health crises, other mitigations may
include notifying the group as soon as possible to
allow the group time to allocate work in certain
areas that need to be addressed first in case the
affected group member will be unable to contribute
as much due to the illness of a family member. By
shifting focus to neglected portions of the project,
impact on the Critical Path at any point of our
project will be lessened and therefore reduce the
risk of not meeting deadlines.

41
VIII. DEPLOYABLE PROTOTYPE STATUS
As of now for the Spring semester regarding the
deployable prototype, there has been various
amounts of tests involving the hardware and
software components of the projects. These
components were stress tested and exhausted so that
it can over perform the measurable metrics, because
the idea was that if this were to be deployed in an
actual setting, there is no room for error when it
comes towards false positives and to be the lead
cause of a super spreader event. Though, while the
components have been tested in respect to the
measurable metrics, multiple cosmetic issues arose.
One of which is the frames per second for the
artificial intelligence when displaying if a client is
wearing a mask or not. While it may seem that it it’s
only impacting the frame rate for the window when
displaying the result, it’s also actually impacting
other components as well. For example, one of the
functions of the deployable prototype is to
autonomously pan and tilt the camera through servo
motors, which require a driver to send signals from
the source code towards the driver to adjust the
location of the region of interest. How this is a
problem is that, since the frames per second is
rather slow, it can take some time for the camera to
pan and tilt towards the exact client in real time.
This can be seen more of as a cosmetic issue, due to
how the prototype has its components functioning
fine and be able to go further beyond the
measurable metric standards, it’s just that a refined
process of higher frame rates can be seen as more
aesthetic and pleasing when presenting. Solutions
that were attempted to fix the framerate was being
attempting to decrease the model set to 700 images,
which in turn impacts accuracy, and there was a
slight improvement in the frame rate. Though what
brings up the question is how far can the model set
decrease to where it’s not accurate anymore for
better frames? That is one bottleneck that was came
across. Another solution that was attempted to fix
the skew rate aside from the frame rate issue, was
making the servo motors more responsive in real
time by supplying a foreign voltage source so that it
isn’t dependent on the driver. The idea was that
since the servo motors are so dependent on the
Jetson Nano for power and signals, it’d be better to
take less power consumption from it and depend on
another voltage source. In this case, the voltage
source was a Raspberry Pi, that was supplying it
through its GPIO pins. Unfortunately, the driver for
the servo motors rejected the foreign source, and the
source code for the AI wouldn’t work, because the
pins for the driver weren’t serialized for another
source. This puts the project in terms of cosmetics
at a roadblock as for further analyzation from
testing, is that the servo motors in all reality depend
on the source code when the AI retrieves and
returns a location. Since the frame rate is slow, and
it takes time for the servo motors to adjust based on
the location, hence it can be inferred that the reason
why the servo motors are slow to react is by the
FPS of the camera, while its waiting for the location
for the region of interest. Though, these issues are
ones when it comes towards presentation, there’s
not really any issues when it came towards testing
and validation for the measurable metrics.
The biggest asset when it came towards the
deployable prototype, was by far the artificial
intelligence model. The artificial intelligence,
signaled, and controlled where the servo motors
pan, and tilt, alongside audio output, and LED
output. When it came towards testing and validation
of the model, there were many scenarios that were
tested in regards to the AI, which include testing the
confidence accuracy with different masks, how far
it takes for the AI to detect the region of interest,
how long can the system run for, and being able to
detect one person at a time when there are multiple
regions of interest in the field of view (for further
information please see appendix H) . These tests
were to be analyzed and performed by Ramsey,
considering that he is the one who developed the
model and artificial intelligence, and be able to
decide what to do if a test failed. Ramsey wanted
these tests to be done as soon as possible during the
days of 02/07 – 02/14 to provide time for further
development and refine of the project when needed,
and to determine where the project heads based off
the test evaluations.
From outside evaluation during the pandemic, not
everyone wore surgical blue masks to help prevent
the spread of COVID-19. There were many
variations from evaluations such as black masks,
white masks, and KN95s. From the gathered

42
evaluation, Ramsey wanted to see how well the AI
model would react to various masks so that if the
deployable prototype were to be set in an industrial
setting, it wouldn’t have any issues in recognizing if
the clients are wearing a mask or not. How this test
was evaluated was that Ramsey stood away from
the camera by at least 1 foot and did around 10
trials each with different angles under bright
lighting to see how well the AI can react in deciding
and accuracy. Since there were 4 different
variations of the mask and 10 trials, it would then
make it 40 trials in total. The goal was that through
these evaluations the average would be held at least
higher than 97% accuracy. The reason why there’s
such a high standard regarding the measurable
metrics is so that when place in areas of high traffic,
the AI model can be so certain and adamant that
someone is wearing a mask or not. Knowing how
some business employees are busy with other tasks
and can’t be able to enforce mask usage at the same
time, this can give them a break while they focus.
Results can be seen in the table below.
TABLE VI.
Average Accuracy Across Variations of Masks.
Test Scenario Average Accuracy
Blue Mask 98.68%
Black Mask 98.31%
White Mask 99.86%
KN-95 98.82%
TOTAL 98.92%
As seen in the table above, it is to be seen that
each mask that was tested contained an average
accuracy above 97%. It wasn’t possible to test every
variation of a mask, such as gator, cloth/patterned,
as the only thing that was kept in mind were
common masks that the general population wears.
From using the dataset, 98.92% total average
accuracy was well above our measurable metrics.
It’s rather the sweet spot of how it handles different
masks, anything higher could be a result of
overtraining, and anything lower below our
measurable metric is a critical sign of revision,
especially undertraining. If the results did intend to
be lower than what is expected for the measurable
metric, than possible solutions would be to analyze
the chart of the validation accuracy when training
the model and include various photos of different
masks in the dataset and adjust the epoch cycles if
needed to avoid risk of overtraining.
The next major test that was conducted by
Ramsey was seeing how far it takes in length for the
AI to detect a region of interest. How this test was
performed was in a brightly lit room. The test
subject would wear any of the common masks, such
as KN95, white mask, black mask, blue mask, etc.
Start 1 feet facing the camera and analyze if there is
a frame to be detected, once a region of interested is
detected, then continue to go back 1 more feet until
the AI can no longer recognize the region of
interest. The goal was that the region of interest
would be detected at least 3 feet away, this is so that
in conjunction with the thermal camera running
alongside the main source code, the thermal camera
has a max temperature reading length of 3 feet.
TABLE VII.
Distance Measured for Region of Interest.
Test Scenario Distance Measured
Blue Mask 10.4 Ft
Black Mask 10.8 Ft
KN95 Mask 6.75 Ft
White Mask 6.41 Ft
No-Mask 8.83 Ft
When the test evaluations were performed, it was
fortunate enough to find out that the most common
masks that people wear, go beyond the span of
reaching 3 feet. This shows that the model is well
fitted under the right conditions of bright lighting
that can detect common face masks. In addition, as
it can detect regions of interest farther than 3 feet, it
is able to adjust for the cameras pan and tilt via
servo motors up to exclusive heights such as 4’10,
and 7’0. By doing so, it can make the clients life
simpler as they don’t have to put in extra work for
putting themselves towards the camera’s angles, for
it to see if they have a mask. Rather, the camera
does all the work for them, and they can continue to
enter. Though, one possible solution to make it
detectable at a longer range, could possibly include
various images in a dataset that include ranges of
people wearing a mask and not wearing a mask with
them being close, and far from the camera.
However, an issue that arises from that is during the
model training process, it resizes the images into a

43
224x224 pixel, and recognizes it, and by having
various photos that are far different from each other,
it can skew the accuracy of training.
The third test was a simple one, it was just a
realistic scenario where if the deployable prototype
were to be placed in an area of high traffic and
remain untouched. As it should, since the whole
purpose of the deployable prototype is to simulate
an employee checking for masks and temperature,
without having to employee someone while the rest
of the business could focus on their tasks. The
result of this test as conducted by Ramsey, was that
the source code was ran from 12 PM and ended at
around 8 PM. Making it a total of 8 hours ran,
which represents for the most part stores opening.
Though, it wasn’t a straightforward process when
analyzing, one common issue that was ran into, was
that when clicking away on a certain window, it’d
still think that the input was directed towards the UI
frame and would end up losing progress throughout
the day. To get around this issue, Ramsey did a SSH
into the machine and let run on a laptop, and simply
timed it with a command. If by far, the Jetson Nano
couldn’t last more than an hour, a high correlation
with this issue is that the Tensorflow framework in
which the framework uses up all the RAM, in which
the operating system halts the program to continue
functioning. In case if the scenario failed, what
would be done is to free up the cache left in the
machine and overclock it so that it uses all
maximum potential of the hardware to devote to the
source code.
The last major test regarding the AI that was
conducted by Ramsey was simply seeing if there
were more than 1 region of interest in the view of
the camera. It was an analysis to see if only one
region and only one region of interest being
detected when there is multiple. The idea behind
this, to attempt to stay towards realistic standards is
that, when there are multiple clients lined up, and
the camera can detect one person at a time rather
than multiple. There’d be no interference in giving a
false positive in what the camera is displaying. How
this test performed was that two people stand in
front of the camera, both would be wearing masks,
both would not be wearing a mask, and vice-versa
with one wearing a mask and the other wouldn’t.
The results can be seen from the table below.
TABLE VIII.
Only Single Region of Interest Detected Test.
Test Scenario Only One Region of
Interest Detected
Both Clients Masked Pass
Both Clients Not
Masked
Pass
Left Client Masked
Only
Pass
Right Client Masked
Only
Pass
One thing to note though is that when testing the
scenario, it seemed that whoever was closest to the
camera, even if it’s by a centimeter, gets detected. A
possible reason for this is that since the AI may
have multiple regions of interest, it can immediately
pick a decision on what has the highest confidence
by the amount of detail it works with when it comes
to processing it towards its internal database. Which
is good to realize, because further it pushes the
theory that if this were to be put in an industrial
setting, it can further detect the region of interest
closest to it, and not pay attention to prior regions of
regions that are obstructing the background.
Regarding the testing of the thermal camera, the
most important test for us to perform was on the
accuracy of the data collection, or Test ID 5 on
Table XV in Appendix H. This test was performed
by Zaid Elias, in the mid-operation stage of the
thermal camera process, and was conducted using
an oral thermometer with a sensitivity of around 0.5
F. Our goal was to keep the temperature sensor
collection value within +/- 1 F of the oral
thermometer value. To do this we collected 10
recordings from the oral thermometer along with a
corresponding 10 recordings from the thermal
camera. The results appear in the Table??? below:

44
TABLE IX.
Thermal Camera Accuracy.
Oral
Thermometer
(°F)
Thermal
Camera (°F)
Diff (°F)
98.0 98 0.00
98.2 98.3 0.30
98.1 98.1 0.50
97.8 97.8 0.20
98.0 98 0.40
97.9 97.9 0.00
97.8 97.8 0.00
98.1 98.1 0.40
97.9 97.9 0.40
98.3 98.3 0.20
When averaging the results of the difference
between the thermal camera and oral thermometer
results, we get a value of 0.24°F. Given that our
measurable metric for the accuracy of the
temperature collection was +/- 1°F, we can say that
our current design for the thermal temperature
sensor is satisfactory.
The next test, Test ID 6 was performed by Zaid
Elias and revolved around the pre-operation stage of
the thermal temperature sensor. Specifically, the test
checked whether the temperature sensor was
operating off the desired voltage of 3.3 V. Using the
voltmeter function of a digital oscilloscope, we
were able to register a value of 3.28 V +/- 0.02 V
being supplied to the thermal camera by the Jetson
Nano single-board computer. Therefore, we can say
that Test ID 6 passes.
Test ID 7 was also performed by Zaid Elias and
was crucial to the overall system integration of the
thermal temperature sensor. With the entire project
structured around an operating distance of
approximately 3 feet, the thermal temperature
sensor needed to capture accurate results from this
distance. For this test we took the average of 15
temperature collections from an operating distance
of 12, 24, and 36 inches and compared it to a
reference data set of 15 oral thermometer
collections. The table below summarizes the results
of this test:
TABLE X.
Thermal Camera Accuracy at Distance.
Set Average
Temp (°F)
Diff from
Ref (°F)
Reference 98.0 N/A
12 Inches 99.7 1.7
24 Inches 98.3 0.3
36 Inches 97.9 0.1
From these results in the table above we can see
that the thermal camera works within our
measurable metrics at both the range of 24 inches
and 36 inches but is outside our measurable metric
of +/- 1 F when only 12 inches away. We consider
this test to be successful because the project is
designed to operate at 36 inches away which is the
best performance range for the temperature sensor.
Test ID 8 and 11 were assessed by Zaid Elias
using a qualitative method as opposed to
quantitative as was done with the other tests. These
two tests addressed the post-operation stage of the
thermal camera, particularly the data logging
functionality. Test ID 8 revolved around the logging
of unhealthy temperature measurements (as defined
by the CDC). This test was successful as an
unhealthy temperature of above 100.4°F was
registered in the data log. For Test ID 11 we tested
if limiting the temperature sensors collection
parameters would help prevent anomalies in our
data such as non-human sources of heat. This test
provided successful results and all anomalies were
ignored in the overall system functionality.
Test ID 9 and 10 were performed simultaneously
as both tests were related to the function and
stability of the thermal camera over extended
periods of operation. The test was conducted by
running the thermal detection algorithm for 12
hours with sample temperature data being collected
at the initial time of operation and at the end of the
12 hours testing period. Firstly, Test ID 10 was
related to the frames per second of the camera. We
wanted it to maintain a framerate >3 fps during
extended runs, and the after 12 hours the camera
had run at an average of 4.14 fps. For Test ID 9 our

45
goal was for the thermal sensor to function for
extended periods of time with no compile errors or
drop in accuracy. After 12 hours we found that our
thermal sensor operated without returning any
errors. We also found an average difference of
+1.12°F from our initial results to our post 12-hour
operation results. This result falls slightly outside
our measurable metrics. Potential causes for this are
that the internal temperature of the temperature
sensor increases as the product is operating, or that
the environment that the thermal temperature sensor
was tested in was exceedingly elevated in ambient
temperature. These results were still deemed to be
an indicator of a success test as the +0.12°F from
our measurable metric would not disrupt its
function as a fever detector.
The final test for the thermal camera, Test ID 12,
was crucial as it related to the system integration of
the temperature sensor with the rest of the product.
We needed to ensure that the thermal temperature
sensor is not interrupted by the presence of a mask
and continues to register data within our measurable
metrics regardless of the user wearing a mask or
not. To perform this test, we took 10 sample
collections without a mask corresponding with 10
sample collections with a mask on.
TABLE XI.
Thermal Camera Accuracy with Mask.
With Mask (°F) Without
Mask (°F)
Diff (°F)
98.5 98.0 0.5
97.9 98.1 0.2
97.8 97.9 0.1
97.4 97.8 0.4
97.7 98.2 0.5
97.5 97.5 0.0
98.0 97.8 0.2
97.6 97.4 0.2
97.8 98.5 0.7
97.7 97.6 0.1
From the results in the table above we can
conclude that the presence of a mask does not
impact the accuracy of the data collection. The
average difference between a masked and unmasked
users' temperature was found to be 0.29°F. This
value falls well within the +/- 1.0°F that is stated in
the measurable metrics. Therefore, Test ID 12 was
deemed to be successful.
The first test conducted to verify the servo
motor’s ability to meet the measurable metrics is
Test ID 18, found in Appendix H and done by
Shaan Wadhwa on 2/10/22. Test ID 18 aimed to
provide evidence that the system can appropriately
detect if a mask is properly worn or not by user
between the heights of 4’10” and 7’0 tall. For this
test, a chair with variable height was used to
simulate the shorter heights up until the tester’s
standing height, from there, a step ladder was used
to properly simulate a user of height reaching 7’0
tall. The test results were found that for a 7’0
individual, the camera can tilt as far up at 70
degrees, being able to identify a masked and a no-
masked individual. At 4’10, the individual sitting
down, the camera can tilt as low as 105 degrees
with the face at roughly 3 ft away from the camera
while wearing a mask or no mask. Every test of
varying heights provided a confidence level of 97%
or above for detecting a facemask, which properly
conforms to the measurable metrics.
Test ID 19 of Appendix H, done by Shaan
Wadhwa on 3/15/22, was conducted for the servo
motors to address the issue of the slow ramp rates of
the servo motors. This test was meant to provide an
external power source to the servo motor driver to
relieve power usage directly from the Jetson Nano
and provide a higher voltage to the servo motors.
The issue found during this test is that the program
does not recognize the driver if it is not plugged in
within the power ports of the Jetson Nano via
GPIO. An external voltage supply would not work
for this application due to this circumstance.
Test ID 20 of Appendix H was done by both
Shaan Wadhwa and Ramsey Alahmad on 3/15/22 in
order to attempt to improve the slew rate of the
servo motors by reducing the Artificial Intelligence
model size. Decreasing the model size from 1200
images for each scenario of facemask on and
facemask off, to 700 images for each scenario has
proven to slightly improve the responsiveness of the
servo motors, while also slightly improving the

46
frame rate of the camera itself. The overall
confidence of the system was monitored during the
decrease of the dataset to ensure that it does not
drop below 97% to conform to the measurable
metrics of the project.
The final test conducted by Shaan Wadhwa on
3/18/22 for the servo motors was Test ID 21 of
Appendix H. This is a final test for the servo motors
after the previous tests have been conducted and
any changes to the system have been done relating
to the servo motors to ensure that the measurable
metrics are still met, and the user’s face is still able
to be maintained within the predetermined frame set
by the camera. Testing variable heights and
horizontal movement of the user were done, in
which all tests resulted in a facemask detection
confidence of 97% or higher while maintaining the
region of interest in the center of the camera’s
frame with the low slew rate still being an issue due
to hardware limitations regarding the artificial
intelligence.
When conducting our tests for the user interface
we expected that these tests would be able to
successfully pass our expectations as stated in
Appendix H, Test Id 13 and 14. The graphical user
interface was important as it helps the client
approaching the device know what the camera is
searching for. This would be done by the bounding
box that's placed around the face and displays a
message of accuracy on top of the box. The test for
this was simple, as we just had a teammate stand in
front of the camera to see if a bounding box would
appear. When the algorithms were being tested for
the mask, the bounding box would display around
the face of the person who is standing 3ft in front of
the camera. Although the bounding box was capable
of being detected further than 3ft we mainly focused
our interest on the region of 3ft as it was suited to
operate the best when obtaining the thermal temp.
This meant that our algorithm was successfully
capable of locating the person in front of the
camera. Another test that was configured for the
bounding box was its capabilities to accurately
change colors depending on if the client is using a
mask or not. When the client is using the device, the
bounding box should display a green bounding box
and a red bounding box when there is no mask
present on the user. The user must be in a brightly
lit area so the algorithm can detect the region of
interest or else the bounding box struggles to appear
on camera. When Ramsey tested different colored
masks on the device it was successfully capable of
displaying a green box when masks of different
colors and types were presented in front of the
camera. In between switching masks to see if the
algorithm would be capable of accurately detecting
different masks the bounding box would switch to
red when he took the mask off. This meant that the
user interface was successfully able to display to the
user on the monitor that it has a mask or doesn't
have a mask by displaying a red bounding box
around the face.
The device contains LEDs to help signal to the
user that if they pass the algorithm's metrics, it will
display the same colors on the monitor to identify if
you passed the requirements. As stated in Test Id 16
those colors would be red if they didn't have a mask
and a green LED if they were wearing a mask
properly. When we connected the LEDs on the
breadboard and connected the GPIO pins to the
Jetson Nano the LED would accurately turn on the
appropriate LEDs. On a separate occasion the LEDs
were tested by Justin to see if they would accurately
display the correct color when a user was wearing a
mask. When I was wearing a mask, the LED would
turn green, signaling that I passed the qualifications.
When the mask was removed the red LED
immediately switched on and turned the green LED
off. The two LEDs would turn on to the
appropriate situation meaning that the Jetson Nano
was providing enough voltage to the LEDs to
display to the user that they passed the necessary
requirements as predicted in Test Id 15 in Appendix
H.
While the design has visual cues to help with the
user interface, we felt that audio would help
tremendously to assist in making the design more
user friendly, it informs the user that the camera is
detecting a mask. To test if the sound card would
properly generate the text-to-speech Justin stood in
front of the camera with a mask to see if the
speakers would generate any sound. When he stood
in front of the camera the speakers would say
“Mask found!” When he removed the mask, the
speakers would no longer output the previous
message. It changes its output on the speakers to

47
“No mask detected!” This would verify that the
requirements for the audio portion of the user
interface passed successfully as stated in Test Id 17.
This would allow people to approach the device and
switch accordingly as people are not always
wearing masks.

48
IX. MARKETABILITY FORECAST
As society is still impacted by the damage
COVID-19 has done, there have been various
amounts of changes to how things work, especially
with mask mandates, lockdowns, and places with
once high activity, now resuming. Likewise, with
all the knowledge obtained regarding the virus, it is
clear and evident that society must adapt and live
among what was once a pandemic, to now an
endemic. To add on, society changed at an intense
rate, and has become laid back with restrictions. For
some, it is better to be safe than sorry after learning
the lessons of what harm COVID-19 can do towards
individuals and businesses and continue to practice
standard guidelines. Likewise, how the deployable
prototype aims to revolve the current situation our
society is facing, especially in businesses, is by
doing the functions an employee who enforces
mask usages and temperature checks would do. The
idea of the design would be to deploy in areas
where most consumers frequently visit, such as
grocery markets, local restaurants, and especially
essential places that do not have the financial means
of enforcing CDC guidelines.
The primary customers of the product would
mainly be local businesses, or companies that do
not exactly have the financial means of hiring an
employee to enforce CDC guidelines, rather
anything to make the stream of operations
smoother. Whether that can mean checking if each
customer is wearing a mask, and their temperature
to prevent a super spreader event. Also, not only
would the design save costs for businesses, but can
also be considered a safe measure to potentially
prevent contact between the employee and customer
for exposure to a virus. In general, ever since the
Covid-19 outbreak, there has been a demand for
strategy and solutions. One of which is streamlining
services without having the need to employ, and
risk liability for the employees. Mainly along the
lines of automation, and artificial intelligence.
Fig. 14. Survey conducted by the World Economic Forum by share of
companies across different sectors across America. Among the top 3 adoptions, various sectors averaged 93% in adopting artificial intelligence
[24].
As seen in the survey above, various sectors
across America have averaged to demanding 93%
of adopting artificial intelligence in the workplace
[24]. The reasoning behind it, is that by training an
artificial intelligence model, it can perform the same
tasks as any other employee precisely and would
not have to worry about financial costs for it to
work. This same mindset can be applied towards the
philosophy of the deployable prototype, considering
how the prototype is meant to reach out towards
applications where it can save cost, and risk as well.
Which is supportive in the prototype, from how the
demand for automation and artificial intelligence
adaptation is high, it pushes for more innovation
and it being common. It further makes the
adaptation for future pandemics more prepared and
a further streamline operation for businesses.
The pandemic has also generated a significant
amount of impact in recognizing the importance of
facial recognition programs. At the peak of the
pandemic when there were multiple lockdowns, and
people were concerned for their health, left room
for technology to grow to think of solutions on what
can be done further to streamline and automate
operations, without putting people at harm. With
room for solutions, this trailed a path to an entirely
new industry regarding facial recognition and is on
the rise. According to the Variant Market Research,
it claims that the Global Facial Recognition Market
is estimated to reach $15.4 billion by 2024, growing
at a CAGR of 21.4% from 2016 to 2024 [25]. With

49
an aggressively expanding market evaluation, it
gives large demand for such a niche market.
Especially how the idea is expanding beyond
government and defense, but in places such as
ATMs, airport, and shopping malls [25]. As one can
imagine, with the technology being more common
place than government acquisitions, it can be able to
be available towards common places. Which further
proves that the philosophy of the prototype design
can be implemented in more than enough places,
going beyond just local businesses wanting to
automate.
Likewise, as technology can be used for greater
good to aid life in make it easier, there’s quite some
competition within it. Some companies want to
investigate a fancier business models that can
ensure a safe and clean environment that goes above
and beyond by simulating actual human experience,
just without utilizing an actual human to simulate it.
Such example would be in China, a company by the
name of UBTECH, which is a robotics company
that integrates artificial intelligence. Regarding their
recent contributions in combating the pandemic,
their most notable robot, AIMBOT, simulates an
entire human experience by maneuvering around
the hospital and be able to conduct the same
operations as would a hospital worker do. To begin
with, AIMBOT, has infrared and a binocular
camera to identify the temperature of clients as well
as monitoring hallways to enforce facemask and
social distancing rules all while spraying
disinfectant [26]. This product takes loads off work
from hospital workers, while performing important
tasks to take care of patients. What’s crucial
regarding the robot, is that the robot is performing
the same work as humans and being able to go up
close towards clients and service them without risk
of contact. In regards to the competitions contrast
between the deployable prototype, the prototype is
mainly to be used at entrances, where people are
lined up and have their temperature and following
mask procedures. The AIMBOT robot is to be used
in hospital settings where they can take care of the
client before receiving medical attention, whereas
the deployable prototype is meant for general areas
of businesses to handle the job when people are
entering a facility and practice standard CDC
guideline. The prototype includes functions such as
scanning the client and outputting audio through a
speaker if they are wearing a mask or not. Since it’s
also stationary, to accommodate people of various
heights, the prototype would pan and tilt towards
the region of people’s faces when approaching the
prototype. The prototype can also gather people’s
temperature and log when there’s an anomaly when
it reaches the minimal temperature regarding a
fever, which can be used for statistical purposes to
notify authorities to further enforce the area, or for
statistical reasons to see if people are obeying CDC
guidelines or not. In other ways, our product can be
much similar towards UBTECH’s AIMBOT, it’s
just that they’re very different applications in where
they are deployed. One is for medical scenarios, and
the other is in high traffic scenarios where clients
frequent like markets, airports, etc.
When it comes to developing a product that is
deployed for industrial use, one should consider its
marketability, such as its strengths, weaknesses,
opportunities, and threats. By analyzing these
attributes regarding a product, it makes it clear
towards investors and stakeholders on what the
product is about, its worth of investment, and
possible situations a company has to deal with in
regard to problems with the product.
The SWOT analysis chart, located in Appendix I
of this report, outlines the strengths of the current
project design has along with the opportunities it
can best take advantage of. The strengths of product
design can best be divided into two categories. The
tech used and the capabilities of the participating
team members. Given that the project is heavily
based around AI we needed to find a software
library that was open source, regularly maintained,
and had wider use in industry. TensorFlow’s
Google roots and dedicated community
development team was the preferred choice for the
group and is a strength of the overall product’s
feasibility. The product’s heavy focus on software
rather than hardware is also considered a strength.
The emphasis on the software side allows for
maintenance updates and bug fixes to be better
delivered to the users, while an emphasis on
hardware would require more field technicians and
support. The group also felt that the heavy focus on
software allowed us to get daily tasks complete
more efficiently in a work-from-home environment,
while a heavy focus on hardware would force us to

50
coordinate in person work sessions at a time when
that was harder to do. In terms of the members of
the group's strengths, we felt that we had a balanced
team composition with two Electrical Engineer
majors and two Computer Engineer majors. This
meant we had a team with comfort in working with
and understanding power systems and signal
analysis along with members comfortable with
working on larger scale software projects. Also,
after dialogue among one another we found that
every member of the group had a level of comfort
with the Python programming language. We
maximized that strength of our team and decided to
write our entire project in Python. The strengths of
our product and team worked hand in hand with the
opportunities that our product presented us. For one,
we realized that an unmanned product that had a
heavy focus on software would have a low overhead
and allow us to comfortably maintain the product
given the team that we have. This is only a good
opportunity given the team’s familiarity with
Python and the product’s emphasis on software.
Also, the product can experience further crucial
improvements in performance and accuracy of
collection with future versions of the product. This
is only possible thanks to the TensorFlow libraries'
active development along with the fact that graphics
hardware, that is optimized for TensorFlow, is
being consistently introduced to the general market.
This opportunity would likely not have been present
for our project had we not made the TensorFlow
libraries a focal point of the software side of our
product.
The possibilities of having the design succeed in
the future is highly likely. Although we are at the
end of the COVID 19 pandemic, the possibility of
having another viral pandemic is possible. As we
have noticed through the pandemic, there are
setbacks where super spreader outbreaks occur,
causing places to re-shelter in place. Future
pandemics will cause businesses to look for
products that will help implement CDC guidelines
like wearing a face mask in public areas. As the
public tries to transition itself from mandatory mask
mandates to having the option of wearing one.
Businesses still have the option to enforce the
mandate to protect themselves and their customers
from others who are potentially carrying the virus.
Wearing a face mask, in addition to social
distancing, has proven to be the most effective
solution in lessening the spread of COVID. The use
of artificial intelligence and machine learning are
expected to be key factors to drive the face mask
detection market.
The face mask detection market is likely to grow
over the next several years as it is fragmented with a
substantial number of small businesses. In April
2020, a software solution provider, LeewayHertz,
unveiled an app that detects people who aren't
wearing a face mask using CCTV, computer vision,
and AI. If someone is discovered without a mask,
their photo is given to management to take
immediate action. The face mask detection market
has key players accounted for in Trident Info,
LeewayHertz, Sightcorp, Neromation, Accubits
technologies, LogMask, Intelligent Security
Systems, and NEC Corporation. In January 2021,
NEC corporation, introduced a facial recognition
system designed exclusively to recognize if people
are wearing masks. The Japanese biometrics
company claims its accuracy is 99.9% and takes
less than one second to verify. The current
technology on face mask detection is evolving and
providing it to be more accurate and precise.
According to an article by Research Dive Analysis
they predict that the software segment is to “have a
dominating market share in the global market with
revenue of $664.9 million in 2020 and register a
revenue of 1,731.5 million during the forecast
period [27]” of 2021-2028. In the Article by
Research Dive analysis, they also predict that the
“hardware sub-segment is predicted to have a
substantial growth rate in the global market with a
revenue of $526.7 million in 2020 and register a
revenue of $1,309.4 million during the forecast
period [27].” The software market occupies the
largest market share due to its ease to be used with
existing infrastructures. The prototype we are
presenting was intended for small business owners
along with retail stores. The retail market for face
mask detection is projected to reach 452.3 million
by 2028. Since we are coming to the end of the
pandemic, we are witnessing a growing number of
in-store shoppers which can lead to the increase of
COVID cases. If we wanted to expand our market,
we could possibly include airports to a possible
market target as they are predicted to have a market
share of $842 million by 2028. The use of a face

51
mask detector at airports will help stop the virus
from spreading to other countries. To mitigate the
spread of other airborne viruses like COVID, it's
imperative for authorities to be able to detect people
who are not wearing masks and showing
symptoms.
Another project which was submitted on
8/15/2021, Limiting COVID-19 Infection by
Automatic Remote Face Mask Monitoring and
Detection Using Deep Learning With IOT, has
created a face mask detecting product that uses
CCTV cameras to detect people who are not
wearing any facial mask [28]. An interesting aspect
of their project is that IoT, or Internet of Things,
was incorporated into the product. Internet of
Things is a network of physical objects that are
embedded with sensors, software, and other
technologies for the purpose of connecting and
exchanging data with other devices over the
internet. What this means is that this product is not
as restricted to a kiosk-like product as our team’s
product is. The benefit to incorporating an Internet
of Things network is that multiple places and
buildings can be under surveillance at the same time
due to using CCTV and Internet communication for
widespread coverage. Based on the trained
reference model used by this team, they were able
to achieve a 98.98% average for the proposed
prediction system. The work of this group was
published to the Eastern-European Journal of
Enterprise Technologies on 10/31/2021. This Team,
consisting of professors from Ninevah University,
have created a similar product to the one that our
group has created, however our current timeframe
and financial constraints have developed a much
more personalized way of face mask detection with
similar reported confidence in detection as the
group presented. Although the product presented is
able to detect more people without a facemask at a
time, our purpose is to prevent entry into a place of
business without properly wearing a face mask
which is where our product does provide
adequately.

52
X. CONCLUSION
A. Societal Problem
Countries have been researching ways to prevent
the spread of COVID-19 since it caused a global
pandemic. The pandemic has changed society to the
point that asking someone to wear a mask may be
offensive. Research has shown that wearing a mask
does help stop the spread of COVID, “from the
healthcare workers group, masks were shown to
have a reduced risk of infection by nearly 70%.”
[11]. Wearing something as simple as a face mask is
the simplest solution to help others stay protected
from this deadly virus. Other possible ways of
stopping the spread of COVID is by washing your
hands constantly for longer than 20 seconds, along
with socially distancing yourself 6 feet from others.
When we don't follow these guidelines, we put
others at risk and people can't afford to miss work
due to being ill in delicate times. Being ill due to
COVID puts somebody out of work for a minimum
of two weeks. Unemployment has increased due to
some businesses closing during the pandemic,
causing many people to start searching for new
jobs. “This decline in employment is enormous by
historical standards and is larger than the entire
decline in the employment to population ratio
experienced during the Great Recession.” [13]. The
only way to get unemployment back down is to
provide our community with a safe work
environment. The most effective method in
blocking these respiratory droplets from spreading
is wearing a mask. In addition to wearing a mask,
checking people's temperature is another great way
to protect the community. A common symptom is a
fever, which is considered if a person has a
temperature of 100.4 F or higher. If we can identify
which people have a high temperature before they
encounter others, then we would be able to provide
them with a safe environment. If we could
implement both of those safety parameters to our
design, then we would be able to deliver a device
that brings a safe work environment for all.
Allowing us to determine if people are wearing a
mask and their temperature, would significantly
help reduce the spread of COVID or any other
respiratory viruses.
B. Design Idea
With COVID looking more likely to keep
spreading we plan to implement a design that would
be able to determine if a person is safe to enter a
building. Our design is intended to be placed in
front of an entrance or at a back door that
employees would use. Our design is intended to
read one person at a time to get the clearest
imagery. It will contain a facial recognition
algorithm that will be able to detect the difference
between people with masks and without. Not only
will it be able to confirm if a person is wearing a
mask, but it will be able to tell if you are wearing it
correctly. It will also contain a thermal detection to
tell if the user is running a temperature. This design
will be touchless so that guests don’t have to worry
about touching the monitor. The monitor will be
user friendly, giving them clear instructions about
whether they are eligible to enter or not. We will
add multiple LED lights to signal to the guest that
they are clear to enter or not. The camera and
thermal detection sensor should work within
seconds so that guests are not wasting a lot of time
before they enter the store. The monitor will also tilt
autonomously to the height of the user. This feature
is beneficial because not all people are the same
height and to get the cleanest image, we need to be
able to see the entire face. With our design focusing
on facial recognition, we will be using different
algorithms along with different GPIO pins to make
a clear distinction if people are ready to start doing
their part in making our community safer.
C. Work Breakdown Structure
After brainstorming our ideas with each other, we
were able to break down our features up into
sections to begin our implementation of our design.
Our design has different levels of software and
hardware that we tried to disperse equally between
the group according to their respective majors and
skill set. We were able to breakdown the project
into four main categories. The first section we
talked about was our algorithm that can detect if a
person is in view of the camera. For this section of
the design, we let our computer engineers, Justin
Roldan and Ramsey Alahmad take control since
they had the most experience in programming in
python. They expect this portion of the coding to
take up to 10 hours to get done. The next feature we

53
wanted to implement was system interaction
between the machine and the guest. Justin will
program the device to give the customers visual
cues to enter the store with LED lights and prompts
on the screen to enter. Ramsey handled majority of
the AI, having some experience with it already,
along with the help of Justin for the system
interaction to display the bounding boxes that
predict accuracy. Shaan worked on the mounting of
the camera and hardware aspects that got the
camera to tilt autonomously. To successfully get our
camera to autonomously tilt it took 15 hours. Zaid
was responsible for thermal cameras that will be
detecting the temperatures of guests entering the
building as he has some experience in temperature
sensors. He predicts this could take 10 hours to test
out his algorithm of predicting someone’s body heat
in Fahrenheit. Breaking down our project into
subcategories helped us distribute the work, which
was essential to keeping everybody in the group
working cooperatively together.
D. Project Timeline
To create our project timeline, we had to
breakdown our project into sections that would
allow individuals to work on certain sections. Once
we were able to specify which task each one of us
was going to commit to, we needed to create a
timeline to have these features completed. We
decided that splitting our features up into separate
tasks would assist with keeping track of our
progress during the semester. These tasks were
assigned start dates, end dates, predicted hours for
assignment, and team member assigned. Our
numbers will change as the semester progress due to
misfortunes that could delay the project along with
some numbers being projections. The best way to
help us keep track of our milestones was with the
use of the GANT chart. The GANT chart allowed
us to refer to past assignment or upcoming
assignments to identify who is working on certain
aspects of the design. This was an especially useful
tool because as students we are not used to working
with a blank canvas, our assignments are broken
down to easily visualize and understand. Breaking
down the assignments using both the GANT and
PERT chart were useful, so we didn’t feel
overwhelmed with an excessive amount of work.
We were able to use the GANT chart to easily
layout our assignments starting from the Fall
semester starting on August 30, 2020, to Spring
semester ending in May. Since our project involved
many packets, we were able to use the PERT
diagram to help us reach key milestones in the
development of our project. After breaking each
section of our design down to smaller sections we
predict that our project will take up to 115 hours to
complete. Our goal with this project is to have a
functioning device that can determine if a person
showing symptoms of being ill.
E. Risk Assessment
The risk assessment section was extremely useful
as we had to brainstorm as a team and determine
unpredictable but plausible events that may occur to
delay our project. We then produced a list of twelve
risks that we thought could delay our project and
formed a matrix table that would inform you of the
probability and impact that each risk would have on
the project. Along with our risk matrix we added an
impact level description table for the risk matrix.
We have levels one through five, that describe
minimum, or no impact, to jeopardize the project.
We decided to break up our risks into three sections,
specific technical skills, broader technical skills,
and systematic risks. Once we were able to divide
our risks into appropriate sections, we decided on
how we would mitigate the risk to complete the
design by the deadline. The mitigation strategies
that required more attention to others were placed
higher up on our matrix table than the ones that
require a quick fix. Each event needed to be
discussed among the group to configure how high
we ranked each risk. The higher-ranking risks need
to have an immediate response to avoid any major
setbacks. One of the biggest risks we thought could
happen and set us back was if we would brick our
micro-controller and did not have a functioning
micro-controller when it comes to presentation day.
A way we were able avoid any major setback if we
do brick our micro-controller was that we able to
get a spare micro-controller from a previous
semester to use just in case anything happens to our
original. We are constantly in communication with
one another just in case a problem arises, we will be
able to mitigate the issue, so we will not be delayed
significantly to complete our critical paths.

54
F. Problem Statement Revision
In our second semester we are required to
reevaluate our team project, with COVID still
impacting us today, we should still enforce the
usage of masks in public. Since the pandemic has
begun COVID has mutated and caused several
different mutations like Delta and Omicron. These
mutations have demonstrated how unprepared we
are for airborne viruses. These mutated variants
have become easily transmittable and only reinforce
the reason for wearing face masks in person. Now
that mask mandates have begun to be lifted there is
a higher possibility of catching the virus in super-
spreader events. These super spreader events can
have a serious impact on an individual’s health and
towards the community if it requires people to stay
home and quarantine.
At the start of the pandemic various businesses
were shut down or lost profits due to stay at home
orders, which can cause a negative effect on the
economy. Now that events and business are opening
back up, we are starting to lose the awareness of
how influential masks can be for the community.
Vaccines have been introduced to help fight the
virus, but not to eliminate it. The best way to remain
on top of the virus is to remain covered with a
mask. Although it's great for the economy to have
the businesses back open so workers can provide for
their families, they should still be required to wear
masks to avoid spreading the virus through
respiratory droplets. Some businesses have the
luxury to hire a position to remind customers to
wear a mask but not all businesses can afford hiring
a position just to check for masks as people are
walking into stores. Now that mask mandates are
beginning to get lifted throughout the country it's
time that all businesses have the capability of
providing a safe environment. From our follow up
research, we decided our project is aimed at
improving mask awareness for small businesses, so
that businesses can help the community by
providing jobs and health awareness.
G. Device Test Plan
After researching our societal problem during the
break, the device came to a crucial point where it
needed to be tested on meeting the project goals.
The device must succumb to meeting certain tests
based upon the design guidelines to present the
project as deployable ready. When deciding what
device tests needed to be applied, we referred to the
measurable metrics for important cases that must be
identified to be considered deployable. The design
can test a variety of components that can be
categorized into four broad groups: artificial
intelligence mask detection, thermal infrared
camera, rotating servo motor, and the user interface.
Each member of the group was tasked with
identifying tests that would test the limitations of
the device. It's important to come up with a
contingency plan just in case one of the tests fails.
In that case we would be able to identify which
component is not meeting the test requirements and
act accordingly to its malfunction. In the
development of the AI, we created tests that would
test the stability of the AI over several hours to
simulate real life store hour operations. There has
been a surplus of businesses selling masks since the
beginning of COVID, so tests were designed to
confirm if the AI can detect a wide variety of
masks. Since the flu is a symptom of COVID, the
thermal infrared camera will be used to detect
accurate human body temperatures. The rotating
servo motor was another key component that
needed testing. For the servo motor to pass the
expected tests, the motor needs to be able to tilt on
its axis high and low enough so that users at
different heights will be able to be detected. The
motor will be tested at different operating voltages
to determine at which voltage the motor works most
effectively. Lastly our project will place tests along
the user interface to verify if they meet the
standards of the feature set. The equipment needed
to verify that each of our features pass the expected
tests is an oscilloscope, an auxiliary source of heat,
and a voltmeter. The oscilloscope and auxiliary
source of heat will be used to complete the testing
of the temperature sensor. The use of a voltmeter
will be used towards components specific to the
user interface. It is believed that the following tests
will meet our expectations and will be ready for the
market review.
H. Market Review
After we created a strategic plan to test our
design, we began to research the design
marketability. Once we began researching the
market for the product it increased our

55
understanding of the factors that go into the design.
The product's goal is to detect when people are not
wearing a face mask properly along with checking
their temperature. The use of the servo motor will
tilt the camera autonomously to detect if the person
is in range to be detected for a face mask. Along
with displaying and outputting messages to the user
if they have passed the necessary requirements. The
effect that COVID has had on society since its
emergence has been deleterious causing many
businesses to shut down permanently. Now that
society is beginning to return to their natural
routines the safest way to stay protected is by
wearing a face mask and practicing social
distancing. The effect of this airborne virus has
given many companies the opportunity to develop
technology to assist society in having a healthier
environment. Now that stores are reopened, and the
mask mandate has been lifted companies have the
option of enforcing clients to wear a mask. The
product design would help enforce the usage of face
masks, eliminating the need of hiring an employee
to enforce wearing a mask. The competition in the
face mask detection market is likely to grow over
the next several years as there are businesses
beginning to release AI assisting machines. China
has a company by the name of UBTECH, which is a
robotics company, that has a robot that simulates an
actual worker. Their robot Aimbot, monitors
hallways to enforce face-masks and social
distancing along with spraying disinfect. While the
company LeewayHertz has unveiled an app that
helps detect if people are wearing a mask using
existing IP cameras. To obtain a better
understanding of how our device would perform in
today's market we performed a SWOT analysis
located in Appendix I. The use of the SWOT
analysis helped the team spot strengths and
weaknesses in our design to help develop our
market availability. With different researchers like
the Variant Market research and Research Dive
Analysis both predicting that the market will reach
over a billion dollars by 2028. The use of our design
is tailored to smaller businesses so that it can bring
a safe environment with modern technology.
Although we all felt comfortable working on this
design since we have two computer engineers and
two electrical engineers, the team lacked the
experience in how the market operates on a large
scale. If we had the knowledge to incorporate our
product correctly, we believe that our design would
be successful in the market like previously stated
companies who have incorporated AI into their
work environments.
I. Testing Results
Designing a project using both software and
hardware components made it critical that we tested
these features for deployment. As building new
designs can come with a variety of issues when
trying to integrate all the components
together. When it came to testing our prototype for
deployment, we focused on our four broad groups:
artificial intelligence mask detection, thermal
infrared camera, rotating servo motors, and the user
interface. These four broad groups were tested by
our group members to confirm if the prototype
would be capable of being deployed by the final
date. These tests are believed to help identify that
the product is ready for deployment. One of the
main features of the design is that the algorithm can
detect the faces and masks of people when
approaching the camera. The algorithm will allow
people to be detected within 3ft of range of the
device. In order to accommodate other parts of the
design we had to limit our original model set from
2400+ images, to 700 images. The model set
contained a variety of pictures that will assist the
algorithm in deciding if people are wearing masks.
The model set contained 4 different types of masks:
blue, black, white, and KN-95 masks. These four
masks produced a total average of 98.92% accuracy
percentage between the masks, which is better than
our predicted 97%. Reducing this model set helped
improve the accuracy of the design along with
slightly improving the frame rate. Although the
frame rate is slow, it still is capable of panning and
tilting as described in the measurable metrics. The
panning and tilting will be done by the servo motors
that will allow people up to 7’0 to be detected by
the device by tilting up to 70 degrees. The camera
may also tilt the opposite direction allowing it to
detect people up to 4’10”. These actions allow us to
verify people of different heights to be measured as
we initially stated in the measurable metrics. The
thermal camera was tested by comparing its results
to an oral thermometer over 10 recordings. When

56
obtaining the average difference in results between
the oral thermometer and the thermal camera it was
calculated to 0.24℉. With our previous goal stated
in the measurable metrics to be +/- 1℉ we believe
that our current temperature sensor meets
satisfactory standards. The last tests we wanted to
conduct was the user interface that involved a GUI
that displayed a bounding box, multiple LED lights,
and a sound card that generated text-to-speech. The
user interface did work as expected and with the
bounding box being able to identify when a person
is in the desired range of 3ft. The bounding box
would be able to adjust between displaying a green
and red bounding box depending on if a person is
wearing a mask or not. It will also be able to display
two LED lights and an audio message to inform you
if you are following the suggested guidelines or not.
As we tested these measurable metrics, we had to
accommodate features and make changes along the
way which helped improve our design to pass the
measurable metrics that we discussed at the
beginning of the project. The testing results showed
to be a critical step in making our project
deployable as we adjusted portions of the design as
needed to improve the overall performance which is
now satisfactory with the specified measurable
metrics.
J. End of Project Documentation
Senior design was a great learning experience for
the whole team B.A.N.E (Benign Autonomous
Neural Environment) group as we were able to
overcome obstacles to continue moving forward by
completing the design to the measurable metrics.
This was possible by forming an equal team of two
electrical engineers and two computer engineers.
Throughout the process of completing the design
we obtained so much more knowledge than any of
us expected. The team was able to learn or refine
our abilities in leadership, communication, time
management, and risk management. These qualities
in a group are often overlooked as there is much
more to an engineer than just the design data. Senior
design started with finding an impactful societal
problem that we can address while creating a design
that could be beneficial to society. During the start
of our project development COVID-19 was at its
peak, with many stores closed and lockdowns being
enforced. While life in the U.S. has seemed to come
back to normal with mask mandates being lifted,
countries like China are still suffering through mask
mandates and COVID-19 outbreaks. The group
researched intensively to design a product that
would be beneficial to society that could help
reduce super spreader events. The team concluded
on a design that can detect a person wearing a mask
while checking if their temperature is in a healthy
range. This design pushed us all to our limits as
most of us had no previous knowledge working
with AI, but we were able to communicate as a
group to complete the tasks we assigned to each
other. We all had some background in
microcontrollers which helped towards applying to
the design which focused heavily on
microcontrollers and artificial intelligence
algorithms. As we all switched leadership roles
throughout the semester, we all got to experience
different leadership styles, we all learned from each
other and were able to use those experiences
towards becoming better leaders. The group was
able to use a timeline to set dates for certain tasks to
be completed by. This was specifically useful as we
needed the core functions developed before moving
forward. We had to manage our time wisely as our
biggest concern for the project was the skew rate of
the servo drivers. There was a significant
improvement when it was decided to compile the
XML model, this compares the nodes in the face
with live feed from the camera simultaneously. We
attempted to add additional voltage towards the
GPIO pins but the driver was rejecting the power
source and causing it to crash. We ultimately
learned that with the current microcontroller we are
no longer able to improve the skew rate any further.
The microcontroller can only handle so many
applications and with the large number of
applications implemented it was restricting us from
further improving the skew rate. Throughout senior
design we faced constant struggles trying to perfect
our design to be presentable. Although the design
may not be perfect it has reached the measurable
metrics that we set for ourselves at the beginning. In
achieving these measurable metrics we’ve learned
how to become better engineers. This class shows
how necessary it is to document the budget, time
management, marketability forecast, risk
management, and other research to develop a
successful project. This report is intended to give

57
insight to the struggles and accomplishments that
the group has overcome to become the best
engineers possible for the foremost obligation the
public welfare.

58
REFERENCES
[1] A. Parks, “Fistbump vs Handshake How COVID19 Does
- and Doesn't Spread,” EBSCO, 06-Mar-2020. [Online].
Available: https://web-a-ebscohost-
com.proxy.lib.csus.edu/ehost/detail/detail?vid=3&sid=
69267cce-a8ed-4b56-b632-708925a246c6%40sdc-v-
sessmgr03&bdata=#AN=142102816&db=a9h.
[Accessed: 20-Sep-2021].
[2] M. Marani, G. G. Katul, W. K. Pan, and A. J. Parolari,
“Intensity and frequency of extreme novel epidemics,”
PNAS, 31-Aug-2021. [Online]. Available:
https://www.pnas.org/content/118/35/e2105482118.
[Accessed: 20-Sep-2021].
[3] H. Ritchie and M. Roser, “Urbanization,” Our World in
Data, 13-Jun-2018. [Online]. Available:
https://ourworldindata.org/urbanization#citation.
[Accessed: 26-Sep-2021].
[4] C.-J. Neiderud, “How urbanization affects the
epidemiology of emerging infectious diseases,”
Infection ecology & epidemiology, 24-Jun-2015.
[Online]. Available:
https://www.ncbi.nlm.nih.gov/pmc/articles/PMC44810
42/. [Accessed: 23-Sep-2021].
[5] J. Howard, A. Huang, Z. Li, Z. Tufekci, V. Zdimal, H.-M.
van der Westhuizen, A. von Delft, A. Price, L.
Fridman, L.-H. Tang, V. Tang, G. L. Watson, C. E.
Bax, R. Shaikh, F. Questier, D. Hernandez, L. F. Chu,
C. M. Ramirez, and A. W. Rimoin, “An evidence
review of face masks against COVID-19,” PNAS, 26-
Jan-2021. [Online]. Available:
https://www.pnas.org/content/118/4/e2014564118.
[Accessed: 23-Sep-2021].
[6] N. H. L. Leung, D. K. W. Chu, E. Y. C. Shiu, K.-H. Chan,
J. J. McDevitt, B. J. P. Hau, H.-L. Yen, Y. Li, D. K. M.
Ip, J. S. M. Peiris, W.-H. Seto, G. M. Leung, D. K.
Milton, and B. J. Cowling, “Respiratory virus shedding
in exhaled breath and efficacy of face masks,” Nature
medicine, 03-Apr-2020. [Online]. Available:
https://pubmed.ncbi.nlm.nih.gov/32371934/.
[Accessed: 26-Sep-2021].
[7] P. K. Kollepara, A. F. Siegenfeld, N. N. Taleb, and Y. Bar-
Yam, “Unmasking the mask studies: Why the
effectiveness of surgical masks in preventing
respiratory infections has been underestimated,”
Journal of Travel Medicine, pp. 5–6, Sep. 2021.
[8] C. Betsch, L. Korn, P. Sprengholz, L. Felgendreff, S.
Eitze, P. Schmid, and R. Böhm, “Social and behavioral
consequences of mask policies during the COVID-19
pandemic,” Proceedings of the National Academy of
Sciences, vol. 117, no. 36, pp. 21851–21853, Aug.
2020.
[9] Wang, Y., Deng, Z. and Shi, D. (2021), How effective is a
mask in preventing COVID-19 infection?. Med Devices
Sens, 4: e10163. https://doi.org/10.1002/mds3.10163
[10] Van Dyke, M., 2021. Trends in County-Level COVID-19
Incidence in Counties With and Without a Mask
Mandate — Kansas, June 1–August 23, 2020.
[11] Y. Li, M. Liang, L. Gao, M. Ayaz Ahmed, J. P. Uy, C.
Cheng, Q. Zhou, and C. Sun, “Face masks to prevent
transmission of covid-19: A systematic review and
meta-analysis,” American Journal of Infection Control,
vol. 49, no. 7, pp. 900–906, Jul. 2021.
[12] S. Lund, K. Ellingrud, B. Hancock, and J. Manyika,
“COVID-19 and Jobs: Monitoring the US impact on
people and places,” McKinsey & Company, 23-Jun-
2021. [Online]. Available:
https://www.mckinsey.com/industries/public-and-
social-sector/our-insights/covid-19-and-jobs-
monitoring-the-us-impact-on-people-and-places.
[Accessed: 26-Sep-2021].
[13] O. Coibion, Y. Gorodnichenko, and M. Weber, “Labor
markets during the COVID-19 crisis: A preliminary
view,” Labor Markets During the COVID-19 Crisis: A
Preliminary Review, Apr. 2020.
[14] O. Coibion, Y. Gorodnichenko, M. Weber, L. Li, Y. Li,
M. Macchiavelli, C. Bredemeier, F. Juessen, R.
Winkler, R. Poblete-Cazenave, J. Bradley, A. Ruggieri,
and A. H. Spencer, “Covid economics,” Centre for
Economic Policy Research, 02-Jul-2021. [Online].
Available: https://cepr.org/content/covid-economics-
vetted-and-real-time-papers-0. [Accessed: 27-Sep-
2021].
[15] Y. Sun, X. Huang, D. Kroening, J. Sharp, M. Hill, and R.
Ashmore, “Testing deep neural networks,” arXiv.org,
15-Apr-2019. [Online]. Available:
https://arxiv.org/abs/1803.04792. [Accessed: 26-Sep-
2021].
[16] Hazlegreaves, Steph. “Covid-19: The Truth about Super-
Spreaders.” Open Access Government, 11 Feb. 2021,
https://www.openaccessgovernment.org/covid-19-
the-truth-about-super-spreaders/103490/.
[17] Chang, Serina et al. “Mobility network models of
COVID-19 explain inequities and inform reopening.”
Nature vol. 589,7840 (2021): 82-87.
doi:10.1038/s41586-020-2923-3
[18] V. van Maanen, “Pandemic Pivots: How businesses
adapted to the impacts of COVID-19.” .

59
[19] “Tracking the COVID-19 economy's effects on food,
housing, and employment hardships,” Center on
Budget and Policy Priorities, 10-Nov-2021. [Online].
Available: https://www.cbpp.org/research/poverty-and-
inequality/tracking-the-covid-19-economys-effects-on-
food-housing-
and#:~:text=The%20majority%20of%20jobs%20lost,o
f%20Labor%20Department%20employment%20data.
[Accessed: 27-Jan-2022].
[20] Adjodah, D., Dinakar, K., Chinazzi, M., Fraiberger, S. P.,
Pentland, A., Bates, S., Staller, K., Vespignani, A., &
Bhatt, D. L. (2021). Association between COVID-19
outcomes and mask mandates, adherence, and attitudes.
https://doi.org/10.1101/2021.01.19.21250132
[21] Melchor, A. (2021). News: The data behind the CDC's
new masking... (the scientist) - behind the headlines -
NLM. National Center for Biotechnology Information.
Retrieved January 29, 2022, from
https://www.ncbi.nlm.nih.gov/search/research-
news/14226/
[22] M. Murti, C. Achonu, B. T. Smith, K. A. Brown, J. H.
Kim, J. Johnson, S. Ravindran, and S. A. Buchan,
“Covid-19 workplace outbreaks by industry sector and
their associated household transmission, Ontario,
Canada, January – June, 2020,” 2020.
[23] D. Romero, “California to bring back indoor mask
mandate,” NBCNews.com, 14-Dec-2021. [Online].
Available: https://www.nbcnews.com/news/us-
news/california-bring-back-indoor-mask-mandate-
rcna8647. [Accessed: 29-Jan-2022].
[24] “The Future of Jobs Report 2020,” World Economic
Forum, 20-Oct-2020. [Online]. Available:
https://www.weforum.org/reports/the-future-of-jobs-
report-2020/in-full/country-and-industry-profiles.
[Accessed: 26-Feb-2022].
[25] “Facial recognition market 2021 covid-19 impact analysis
by industry trends, future demands, growth factors,
emerging technologies, future plans and Business
Growth Strategies,” MarketWatch, 24-Jan-2022.
[Online]. Available:
https://www.marketwatch.com/press-release/facial-
recognition-market-2021-covid-19-impact-analysis-by-
industry-trends-future-demands-growth-factors-
emerging-technologies-future-plans-and-business-
growth-strategies-2022-01-24. [Accessed: 26-Feb-
2022].
[26] E. Guizzo and R. Klett, “How robots became essential
workers in the COVID-19 response,” IEEE Spectrum,
19-Aug-2021. [Online]. Available:
https://spectrum.ieee.org/how-robots-became-essential-
workers-in-the-covid19-response. [Accessed: 26-Feb-
2022].
[27] Research Dive. “Demand: Global Face Mask Detection
Market Expected to Garner a Revenue of $3,040.9
Million by 2028, Growing at a Healthy CAGR of
10.9% from 2021 to 2028 [180-Pages]: Available at
Research Dive.” GlobeNewswire News Room, Research
Dive, 12 Jan. 2022,
https://www.globenewswire.com/en/news-
release/2022/01/12/2365729/0/en/Demand-Global-
Face-Mask-Detection-Market-Expected-to-Garner-a-
Revenue-of-3-040-9-Million-by-2028-Growing-at-a-
Healthy-CAGR-of-10-9-from-2021-to-2028-180-
Pages-Available-at-Research.html.
[28] Alsaydia, O. M., Saadallah, N. R., Malallah, F. L., Al-
Adwany, M. A. S. (2021). Limiting COVID-19
infection by automatic remote face-mask monitoring
and detection using deep-learning with IoT. Eastern-
European Journal of Enterprise Technologies, 5 (2
(113)), 29-36. doi: https://doi.org/10.15587/1729-
4061.2021.238359
[29] Alahmad, Ramsey. “Overview of Diagram for
Prototype”. Apr 2022.
[30] “Nvidia Jetson Nano 2GB J6 GPIO header pinout,”
JetsonHacks, 10-Nov-2020. [Online]. Available:
https://www.jetsonhacks.com/nvidia-jetson-nano-2gb-
j6-gpio-header-pinout/. [Accessed: 02-Apr-2022].
[31] “Logitech C922 Pro Stream 1080p Webcam + Capture
Software,” 1080p Webcam + Capture Software.
[Online]. Available: https://www.logitech.com/en-
us/products/webcams/c922-pro-stream-webcam.960-
001087.html. [Accessed: 02-Apr-2022].
[32] “16 channel 12-bit PWM Servo Motor driver,” Aus
Electronics Direct. [Online]. Available:
https://www.auselectronicsdirect.com.au/16-channel-
12-bit-pwm-servo-motor-driver-module-pc.
[Accessed: 02-Apr-2022].
[33] “Onion Omega2 Maker kit,” Intro to Circuit Diagrams,
13-Apr-2021. [Online]. Available:
https://docs.onion.io/omega2-maker-kit/circuit-
diagram-crash-course.html. [Accessed: 02-Apr-
2022].
[34] “Breadboard - self-adhesive (white),” PRT-12002 -
SparkFun Electronics. [Online]. Available:
https://www.sparkfun.com/products/12002.
[Accessed: 02-Apr-2022].
[35] “SONY SRSZ50.” [Online]. Available:
https://www.newegg.com/sony-srsz50-
blk/p/N82E16836173017. [Accessed: 02-Apr-2022].

60
[36] “Adafruit MLX90640 IR thermal camera breakout - 55
degree,” Evelta Electronics. [Online]. Available:
https://www.evelta.com/adafruit-mlx90640-ir-
thermal-camera-breakout-55-degree/. [Accessed: 02-
Apr-2022].
[37] “Hitec HS-422 servo motor -
robotshophttps://www.robotshop.com/en/hitec-hs-
422-servo-motor.html,” Robot Shop. [Online].
Available: https://www.robotshop.com/ca/en/hitec-
hs-422-servo-motor.html. [Accessed: 03-Apr-2022].
[38] “Adafruit Industries LLC 4407,” DigiKey. [Online].
Available:
https://www.digikey.com/en/products/detail/adafruit-
industries-llc/4407/11497500. [Accessed: 02-Apr-
2022].
[39] Alahmad, Ramsey. “AI Algorithm Flowchart.” Apr 2022.
[40] Alahmad, Ramsey. “Training Loss and Accuracy Graph.”
Apr 2022.
[41] Z. Elias. “Flowchart of MLX90640 Temperature Camera
Algorithm.” Apr. 2022

61
GLOSSARY
Computer Vision – A field of artificial intelligence
that enables computers and systems to derive
meaningful information from digital images, videos,
and other visual inputs – and take actions or make
recommendations based on that information.
Face Mask Mandate – This is a mandate issued by
either the state, or private business that aims to
ensure that anyone who is going out in public, must
wear a mask. In the private business case, anyone
who enters said private business must wear a mask.
Respiratory Epidemic – An epidemic is a sudden
increase of cases for any virus or infection. In the
context of this paper, it is the rapid dispersal of a
virus that is transmitted through respiratory
droplets.
COVID-19 – Infectious disease caused by SARS
CoV-2 virus.
Algorithm – Set of rules in calculations, often by a
computer.
Machine Learning – Usage of algorithms that
improve automatically through experience.
Zoonotic – Germs that spread between animals and
people.
Neural Network – An artificial network composed
of nodes, used mainly for artificial intelligence.
Artificial Intelligence – Intelligence displayed by
machines
Vulnerable Jobs - Workers kept on payroll but not
working during periods of high physical distancing
Unemployment- Not being paid for employment but
available to work but provided benefits by the state
Pandemic – An event in which a disease spreads
across several countries and affecting a large
amount of people
Microcontroller – a microcomputer that controls the
functions of embedded systems
AI – Artificial Intelligence, intelligence
demonstrated by machines, compared to
consciousness in living things.
LED – Light Emitting Diode, a light source that
displays some form of light when currents go
through it.
GPIO – General-purpose input/output on a pin
regarding circuits or boards which can either be
used as a form of output or input.
USB – Universal Serial Bus, establishes connection
and specifications for cables and peripherals.
NAND – Inverter for AND gates, most frequently
seen in flash memory.
SD – Source digital, usually a non-volatile storage
of memory.
MIPI CSI-2 – A widely used camera interface in
mobile and electronic markets.
RAM – Random Access Memory, computer
memory to store data and machine code.
CPU – Central Processing Unit, electronic circuitry
that controls basic operations, logic, and specific
instructions.
UNIX – Multitasking, computer operating system.
GPU – Graphics Processing Unit, electronic
circuitry that manipulates memory to output images
for a frame.
CDC – Center for Disease Control and Prevention,
a public health agency for America.
GUI – Graphical User Interface, user interaction
through electronic devices.
Servo – Servomechanism, producing motion or
forces at a high level of energy than input level.

62
GANTT Chart - Type of bar chart that illustrates a
project schedule
PERT Diagram - Tool used to schedule organize,
and map out tasks within a project.
Github - Provider of internet hosting of online
software development.
Tensorflow – Open-source software library
developed by google for machine learning and
artificial intelligence
Servo – Servomechanism , an automatic device that
uses error-sensing negative feedback to correct the
actin of a mechanism
Jetson Nano- Embedded applications
microcontroller used for AI applications
KN95- Medical masks with extra layers of fabric.

Appendix A-1
APPENDIX A. HARDWARE
Fig. A1. Overview of Diagram for Prototype [29]
Hardware Involved
Fig. A2. Jetson Nano Top Down View [30]
- Jetson Nano 4GB Model

Appendix A-2
• Purchased the highest model with the more RAM so that it can be used for intense AI applications
• Based on the Ubuntu Operating System, so plentiful of Linux information
• Can process multiple neural networks on a sensor stream, and has a better GPU compared to its
competitor Raspberry Pi
Fig. A3. C922 PRO HD STREAM 1080p USB Logitech Camera [31]
- 1080p Logitech USB Camera
• Simple USB camera with decent quality resolution so that it can aid with precision with the AI
network
• Plug and play interface with USB so no need to use external accessories and applications
Fig. A4. SONY SRSZ50 Speaker [35]
- SONY Speaker
• Generic speaker that is used for audio interfacing with the source code
• Alerts user if they are wearing a mask or not through flag conditions from source code
Fig. A5. PCA9685 16 Channel 12-Bit PWM Servo Motor Driver [32]
- Arduino Driver

Appendix A-3
• I2C controlled PWM driver, with 12-bit resolution and 16 channels.
• Used to get signal conditions from the source code that utilizes pan and tilt to be sent towards the
servo motors
Fig. A6. Hitec HS-422 Servo Motor[33]
- Hitec HS-422 Servo Motor
• Used to pan and tilt the camera that is connected to the driver autonomously
• Requires a driver to utilize pulse width modulation
• Simple to use through python commands
Fig. A7. MLX90640 Thermal Camera [38]
- MLX90640 Thermal Camera
• Contains array of 768 infrared sensors
• Used to detect fever temperatures with +/- 1.0°F accuracy
• Uses I2C protocol to interface with microcontrollers and single-board computers
• Interfaced with open source, manufacturer provided, Python libraries

Appendix A-4
Testing Results
TABLE A-I.
Results From Temperature Sensor Accuracy Test.
The table below shows the difference between oral and infrared temperature.
Oral
Thermometer
(°F)
Thermal
Camera (°F)
Diff (°F)
98.0 98.0 0.00
98.2 98.3 0.30
98.1 98.1 0.50
97.8 97.8 0.20
98.0 98.0 0.40
97.9 97.9 0.00
97.8 97.8 0.00
98.1 98.1 0.40
97.9 97.9 0.40
98.3 98.3 0.20
TABLE A-II.
Results From Temperature Sensor Accuracy at Distance Tests.
The table below shows the difference between temperature data at different distances
Set Average
Temp (°F)
Diff from
Ref (°F)
Reference 98.0 N/A
12 Inches 99.7 1.7
24 Inches 98.3 0.3
36 Inches 97.9 0.1
TABLE A-III.
Results From Temperature Sensor Accuracy with Mask Test.
The table below shows the difference between temperature when masked versus unmasked
With Mask (°F) Without
Mask (°F)
Diff (°F)
98.5 98.0 0.5
97.9 98.1 0.2
97.8 97.9 0.1
97.4 97.8 0.4
97.7 98.2 0.5
97.5 97.5 0.0
98.0 97.8 0.2
97.6 97.4 0.2
97.8 98.5 0.7
97.7 97.6 0.1

Appendix B-1
APPENDIX B. SOFTWARE
Fig. B1. AI Algorithm Flowchart [39]
The flowchart above is the logical chart for how the AI decides if someone is wearing a mask or not.

Appendix B-2
Fig. B2. AI Training for Loss & Accuracy [40]
In the graph above, is what represents the training loss and accuracy regarding the AI model. We decided
that after previous tests, using too many images indicated a spike in the validation loss, and a huge dip in
the validation accuracy. This isn’t good for both the hardware and software, as for using the Tensorflow
library, it takes up plentiful of space so it dramatically impacts performance, and may not even promise
results that meet measurable metrics standards. Thus for the latest model, 15 epochs is the cutoff as that it is
the sweet spot between overtraining and undertraining a model. Also, 700 images were used each, for
containing masks and not containing masks. So it should be optimal enough with a slight performance that
is able to meet measurable metric standards.
TABLE B-I.
Average Accuracy Across Variations of Masks.
Test Scenario Average Accuracy
Blue Mask 98.68%
Black Mask 98.31%
White Mask 99.86%
KN-95 98.82%
TOTAL 98.92%
From recent observations in the pandemic, not everyone wore a blue mask. General observations had
variations such as people commonly wearing a blue mask, black mask, white mask, and even KN95s. To

Appendix B-3
test how well the AIs confidence is to different variations of masks, each variation of mask had 10 trials to
test with different angles and were recorded for the confidence rating. From the results, it’s to be concluded
that White Masks have the best confidence rating, and possibly due to how majority of pictures that were
used for masks had an image of a white mask. Likewise, in average, the masks had a higher accuracy that
what our measurable metrics were which is optimal.
TABLE B-II.
How Long in Distance the AI can Detect a Region of Interest.
Tests were also performed with the variation of masks, where the client takes a step back and has their
distance from the camera recorded, until the AI can no longer recognize their region of interest in the
camera display. Our measurable metric was that a client must be detected atleast 3 feet. This is because in
parallel with the thermal camera, it can only measure temperature up to 3 feet. We found that through these
tests, mask, or no mask is well above can be detected farther than 3 feet, which is also a stress test to see
how well the AI can handle.
TABLE B-III.
AI Detecting Only One Client After Seeing Multiple Region of Interests in its View.
Test Scenario Only One Region of
Interest Detected
Both Clients Masked Pass
Both Clients Not
Masked
Pass
Left Client Masked
Only
Pass
Right Client Masked
Only
Pass
In this test, the scenario was that if there are multiple people lined up in front of the camera, we don’t want
the AI to return false positives because of regions of interest in the background. How this test was
performed was a colleague was right next to a client, and from analyzation, whoever is closest to the
camera, even by a small margin of distance, gets detected. Possibly from how the AI is constantly actively
comparing to the database to see what’s the highest confidence available. We found that the AI is able to
only detect one person which is a success for all cases that was tested.
Test Scenario Distance Measured
Blue Mask 10.4 Ft
Black Mask 10.8 Ft
KN95 Mask 6.75 Ft
White Mask 6.41 Ft
No-Mask 8.83 Ft

Appendix B-4
Fig. B3. Temperature Sensor Software Flowchart [41]
The chart above in Fig. B3 summarizes the process of the operation of the thermal camera sensor. The
temperature begins its operation by adjusting the system's i2c-0 bus clock speed and terminates when the
index of temperature data is empty. The program saves a data log at termination of the software.

Appendix C-1
APPENDIX C. MECHANICAL ASPECT
Fig. C1. Servo Stand with Tripod [42]
Fig. C2. Servo Driver Connected to Jetson Nano [43]
The project turned out to become more software oriented than it did hardware. The main mechanical
aspects of the project is just the servo driver, which is connected to both the servo motors and the gpio pin.
How it works is that the servo motors require pulse width modulation, and so the driver is able to control

Appendix C-2
them from the signals received from the driver which is then sent by the jetson nano. In order to improve
functionality and appearance of the project, the AI finds the locations for the regions of interest, finds the
center of their respective X and Y axis, and makes the servo motors pan and tilt at the same time. The idea
for this is that to account for all heights that approach the camera, so that it pan and tilts autonomously to
the comfort of the clients height.

Appendix D-1
APPENDIX D. WORK BREAKDOWN STRUCTURE
TABLE D-I.
Work Breakdown Chart for Features of Projects.
The tables below include how the work was split up for the rest of the semesters, with the start date, and
time. This helped us schedule priorities when it comes to developing the deployable prototype.

Appendix D-2
TABLE D-II.
Work Breakdown Chart for Assignments.
This work breakdown chart helped us divide and conquer the assignments up ahead as it saved time and
confusion.

Appendix E-1
APPENDIX E. TIMELINE CHARTS AND PERT DIAGRAM
TABLE E-I.
GANTT Chart.
The GANTT chart was used so that the team can have a pre-planned schedule so that our team members
know what to do for the work week.

Appendix E-2

Appendix E-3
TABLE E-II.
Detailed Tasks for Project Timeline GANTT Chart.
The table below consists of detailed tasks for the project timeline regarding the GANTT chart. There’s a section for hours
predicted, and hours actually taken to do the task. This is so that we can keep records of who is tasked to do what.

Appendix E-4
TABLE E-III.
Detailed Tasks for Fall 2021 Assignment GANTT Chart.
During the FALL 2021 semester, there were many things going on such as having to work on the project,
whilst organizing the writing assignment. This table consists of detailed tasks assigned to each person so
that the work is further organized and simple.

Appendix E-5
TABLE E-IV.
Detailed Tasks for Spring 2022 Assignment GANTT Chart.
The following table is meant to show the tasks that are split among the team members. With hours
predicted, and actual hours.

Appendix E-6
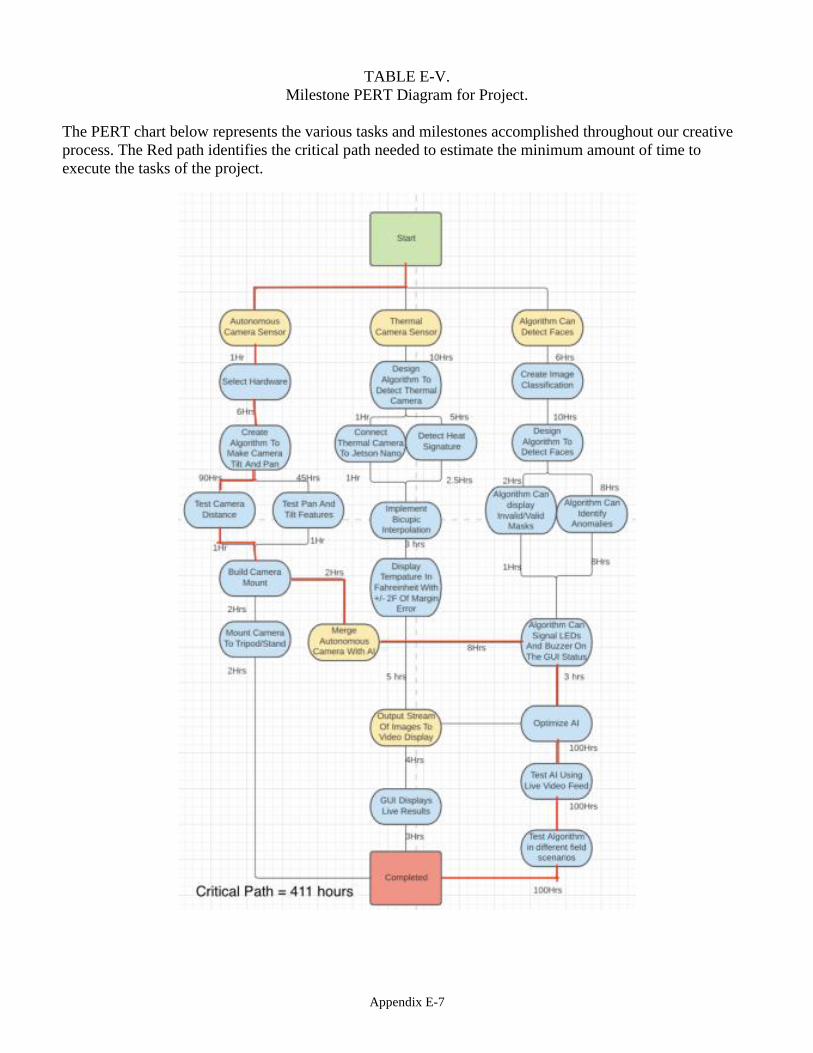
Appendix E-7
TABLE E-V.
Milestone PERT Diagram for Project.
The PERT chart below represents the various tasks and milestones accomplished throughout our creative
process. The Red path identifies the critical path needed to estimate the minimum amount of time to
execute the tasks of the project.

Appendix E-8
TABLE E-VI.
Fall 2021 Assignments PERT Diagram.
The following PERT diagram represents the various tasks assigned to us for the Fall of 2021. The group
identified the key assignments that needed to be completed during the semester.

Appendix E-9
TABLE E-VII.
Spring 2022 Assignments PERT Diagram.
The following PERT diagram represents the various tasks assigned to us for the Spring of 2022. The group
identified the key assignments that needed to be completed during the semester.

Appendix F-1
APPENDIX F. RESUMES
Ramsey Alahmad
EDUCATION
California State University, Sacramento | B.S. Computer Engineering | August 2018 - May 2022
• GPA: 3.70
• Dean's Honor List (Fall 2018 - Spring 2021)
• Association for Computing Machinery
• Tau Beta Pi Chapter President (2021-2021)
• Intro to Microprocessors | Operating System Principles | Database Systems | CMOS and Digital
VLSI
WORK EXPERIENCE
Intel Corporation - NAND Product Development Intern July 2021 – March 2022
Designed a database in MySQL that involves tables used to test runs in system validation of the hardware
alongside separate result tables for possible failures in the NAND product before release.
• Created secondary connection of the database in python that includes more manipulation of data
and options when having data readily available.
Intel Corporation - System on Chip Intern January 2021 - May 2021
Performed various validation tests on projects involving the platform control hub, which supports certain
datapaths and peripherals of the Intel CPU.
• Developed scripts mainly using python within UNIX to help automate progress involving validation
and records within databases.
PROJECTS
Weather Station Sensor August 2020
Circuiting a weather sensor on the Raspberry Pi 4, the sensors detect temperature, humidity, pressure,
acceleration, alongside a gyroscope. It provides output to the user through its LED matrix built in.
• Upon startup, the LEDs display a welcome animation, and scrolls through the weather in real time,
while recording the data onto a spreadsheet for every loop which depicts a graph.
Automatic License Plate Detector May 2020
Implemented an automatic license plate detector using Python and OpenCV Modules in the Raspberry Pi 4
• Converts the image into a default size, grayscales it along with contouring it to avoid unnecessary
details when bilateral filtering to detect edges.
• When contour has been recognized, it crops the license plate, the Tesseract OCR package reads the
license.
SKILLS
• Programming Languages: Java, Python, C, Verilog HDL, Perl, MIPS
• Web Development: HTML5, CSS3, PHP
• Databases: MySQL
• Tools: Git, CAD, Unix, Shell
CERTIFICATIONS
• Goldman Sachs Engineering Virtual Program, Cybersecurity September 2021

Appendix F-2
Justin Roldan SUMMARY
A Senior Engineering student who desires an internship/job opportunity to apply/enhance my technical and
personal leadership skills in the areas of computer hardware design, robotics, cybersecurity, or
business/manufacturing process improvement.
EDUCATION
California State University, Sacramento --- B.S. Computer Engineering August 2018 - May 2022
Napa Valley College, Napa — Associate degree Natural Science and Mathematics May 2017
WORK EXPERIENCE
Remodeling Specialties by Roldan, Napa, CA — Carpenter
Aug 2019 - PRESENT
• Layout areas that need to be prepped; Demo kitchen and baths as needed
• Rewire electrical in wall to place new outlets, switches, recessed and vanity lighting
• Install drywall and sheetrock into existing rooms as needed
• Install cabinets and hardware
University Enterprises Inc, Sacramento, CA — Student Maintenance
Sep 2018 - June 2021
• Assesses facilities to ensure adequate workspace and accommodation
• Patched and painted regularly to eliminate damage and markings
• Assist maintenance on HVAC and other machinery used in the building
Silverado Resort and Spa, Napa, Ca — Front Desk Representative
Sep 2018 - June 2021
• Call guests to confirm itineraries
• Bill and check guests into spa software, along with facility tours
• Regularly stocks departments with supplies
SKILLS
Programming Languages: Java, Pythom, C/C++, Verilog, MIPS
Tools: Unix, Shell, PSPICE

Appendix F-3
Shaan Wadhwa
PROFILE
Energetic, hard-working student skilled in Computer Engineering practices, familiar with C, and Arduino
coding. Interested in Developing ongoing skills in Electrical Engineering.
EDUCATION
• Oak Ridge High School, El Dorado hills, California. GPA: 3.0
• University of Nevada Reno, August 2016 – December 2017, Computer Science and Engineering.
GPA: 3.0. Completed CPE 301 Embedded System Design, and Math 285 Differential Equations
courses.
• Truckee Meadow Community College, January 2018 – December 2018, Electrical Engineering.
GPA: 3.7. Earned a place on the Dean’s List for the Fall 2018 Semester.
• California State University Sacramento, August 2019 - Present, Electrical and Electronic
Engineering. GPA 3.3.
Completed EEE 108 Electronics 1, EEE 130 Electromechanical Conversion, and EEE 185 Modern
Communication Systems courses.
CAREER DEVELOPMENT
• As a course objective at TMCC, I was part of a two-person team that designed and coded, using
Arduino, a dual axial propulsion fan and single centrifugal lift fan hovercraft. Programmed the
hovercraft to follow a line that curved using color sensors.
WORK EXPERIENCE
Custom Fit Inc., Folsom, CA. Summer and Winter breaks from 2015
• Present as a high-end motorized window covering Automator. Install automation hubs, discover
motorized window coverings within the project, assign them to specific rooms, set up scenes and
automations, wired window coverings to large dc power supplies, ensure proper functionality of the
automation system.

Appendix F-4
Zaid Elias
EDUCATION
California State University, Sacramento | B.S. Electrical and Electronic Engineering | 2019 - 2022
• GPA: 3.94
• Dean's Honor List (Spring 2021)
• Digital VLSI Design | Embedded System Design | Signals and Systems | Modern Communication
Systems | Applied Electromechanics
PROJECTS
Ambient Temperature Sensor August 2021
Interfaced with Texas Instrument LM35 temperature sensor in C programming language, using an
STM32L432KC ARM Cortex Microcontroller. Design read temperature, then placed the system into one of
three states.
• Read temperature data using ADC hardware interfacing protocol.
• Circuited LEDs to show state of the design.
• Output data to the terminal using UART serial communications protocol.
• Used PWM protocol to output through a Piezzo buzzer when the system was in critical state.
Microstrip Antenna Fall 2020
Designed, built, and tested a square microstrip antenna using a poly-carbonate substrate and a Copper
conductor to meet desired design parameters.
• Simulated patch antenna in high-frequency structure simulator (HFSS) to find transmission line
input impedance.
• Designed impedance matching circuit using ADS simulator to compare to our physical results.
• Translated hand drawn diagram to final soldered microstrip antenna build.
SKILLS
• Programming Languages: Python, C, Java, Verilog
• Tools: Matlab, Cadence OrCad PSPICE, NI Multisim, ADS, Digital Oscilloscope

Appendix G-1
APPENDIX G. VENDOR CONTACTS
Pi3g.com
Tel: ++49 (0)341 392 858 40
e-Mail: [email protected]
During development of the prototype, the Jetson Nano had a PCIE slot available. Our idea was to use a
TPU (Tensorflow Processing Unit), in hopes of reducing the stress off the system and able to improve
performance. There was no other vendor available besides Pi3g, an electronics vendor from Germany.
Amazon.com
Tel: 888-280-4331
e-Mail: [email protected]
Majority of the parts were ordered off of Amazon, including the Camera, Tripod, Servo Motor & Driver,
and the Jetson Nano. Amazon was a key vendor necessary to be able to supply the group with these parts.

Appendix H-1
APPENDIX H. DEVICE TEST TIMELINE
TABLE H-I.
Device Test Timeline Chart.
This table consists of test scenarios regarding the deployable prototype with their own unique ID,
predictions, who it is assigned to, and the timeline of when the scenario shall take place. Each member talks
about their own scenarios they tested. Assigned to Test ID Test Description Expect Results Actual Results Pass/Fail (to
measurable
metrics)
Test Timeline
Ramsey
Alahmad
1 Test various
types of masks,
such as a blue
surgical mask,
white mask,
black mask,
KN95, etc. This
setting would be
done in a bright
environment
close to the USB
camera
connected to the
Jetson Nano
(atleast 1 ft
away). The
camera would be
place on a tripod.
Pass. The
variations of
masks should
pass due to the
fact that our
model set is
trained with
roughly 2400+
images to detect
who’s wearing
a mask and who
isn’t. With
atleast a 97%
accuracy or
more.
When
conducting the
experiment,
each mask had
a trial of 10
attempts to
record the
accuracy, and
thus calculated
the average. By
finding their
average we
found that each
mask had an
average
accuracy of
98%+. How
this different
from the
expected result
was that the
accuracy would
atleast been
97% as the
benchmark.
The average of
each mask is:
KN95: 98.82%
Black-mask:
98.31%
Blue mask:
98.68%
White Mask:
99.86%
TOTAL AVG:
98.92%
Pass 02/07/22 –
02/14/22
Ramsey
Alahmad
2 Algorithm
detecting objects
(mask or no
mask) atleast 3 ft
away. This test
would be
conducted in a
room with bright
lights so the
region of interest
is clear and
It's assumed
that in bright
light conditions,
the USB
camera would
be able to detect
the regions of
interest with no
problem. It’s
expected that
with a clear
When
analyzing this
scenario, there
were multiple
tests performed
with various
sets of mask.
This is so that
when the model
is deployed in
an industrial
Pass 02/07/22 –
02/14/22

Appendix H-2
visible to see.
This would be
mainly using a
USB camera
connected to the
Jetson nano
where the
software
algorithm is able
to find the
regions of
interest. The
client would
walk as far from
the camera as
possible and
while focusing
on the interface.
Once the
interface stops
showing any
object tracking,
that is when the
client marks how
far away they
are.
enough view of
the client in the
camera’s
direction we
would believe 4
feet away from
the camera
would be fine.
As the subject
is clear enough
for a region of
interest.
setting, the
camera can
feed in regions
of interest to
the algorithm
and be prepared
to come with
confidence
model as it
focused on the
client. The
results were
BLACK
MASK = 10.8
Ft
BLUE MASK
= 10.4 Ft
KN95 MASK =
6.75 Ft
WHITE MASK
= 6.41 Ft
NO MASK =
8.83 Ft
Ramsey
Alahmad
3 This test would
simply have the
jetson nano turn
on for longer
periods of time
in order to see
how long it can
withstand
operating, as
well as having
the CPU in the
nano be
monitored in
order to avoid
overheat and
crash of the
system.
Since the model
is to be
simulated in
places of
businesses
where clients
come and go,
we hope that
the system can
stay active for
atleast 6 hours.
This is to
simulate real
time
benchmarks in
what it would
be like in an
active sitting.
Starting at
11:51 AM, I
ran a timer to
see how long it
could withstand
running the
source code. I
ended it at
around roughly
7 PM. From the
difference
between the
start and end, it
was well over 6
hours, thus
making it a
pass.
Pass 02/07/2022 –
02/14/2022
Ramsey
Alahmad
4 Artificial
intelligence to
only detect one
person at a time
to decide if
they’re wearing a
mask or not. This
is mainly done in
a bright
environment so
that the camera
can have no
distractions
when identifying
It's expected
that the
artificial
intelligence of
the mode will
focus on one
person. This is
because when
training the
model, images
only contained
pictures of an
individual, thus
it would mainly
When
performing the
test, more than
1 person was in
the way of the
camera. How it
was performed
was, one person
would wear a
mask, and the
other no mask.
Another one
wearing no
mask, and the
Pass 02/14/22 –
02/21/22

Appendix H-3
regions of
interest one at a
time. Main
objects that
would be utilized
for this testing is
the artificial
intelligence
model on the
jetson nano and
the USB camera.
The idea is to
simulate a store-
like setting
where people
form a line and
enter if they are
wearing a mask.
focus on one
subject.
other a mask.
The third one
being the
clients wearing
both masks,
and the last one
both clients not
wearing masks.
What was
observed was
that whoever is
closest to the
camera gets the
region of
interest first on
all observances.
Which is a
good sign,
since if this
were to be
deployed in an
industrial
setting, there
would be no
other regions of
interest
distracting the
closest client.
Zaid Elias 5 Test that the
MLX90640
Infared
temperature
sensor detects
human body
temperature
(>97°F) within a
+/-1°F margin of
error in reference
to an oral
thermometer.
The environment
of the test will be
room
temperature, and
the test subject
will stand in
frame of the
camera sensor
and pause the
data collection to
record
temperature.
We expect the
test to pass due
to the wider
industry use
and positive
reputation of
the MLX90640
integrated
circuit.
The
temperature
sensor was able
to keep the data
recording of a
healthy
individual
within a +/- 1 F
margin of error
with a
thermometer
Pass 2/07/22 -
2/14/22
Zaid Elias 6 Test that the
Jetson Nano
supplies delivers
3.3V from the
single-board
computer to the
We expect this
test to pass
because the
Jetson Nano is
advertised as
supplying 3.3V
The supplied
voltage to the
temperature
sensor camera
was found to be
3.28V which
Pass 2/07/22 -
2/14/22

Appendix H-4
MLX90640
infrared
temperature
sensor. Test will
be done using
Analog
Discovery 2
digital
oscilloscope
connected to the
supply pin of the
Jetson Nano
monitoring for
voltage output
across all its
pins. However,
there is a
voltage
regulation
feature of the
Nano that may
affect the
supply voltage
to the pins.
was only 0.02V
away from our
expected result
Zaid Elias 7 Test that the
MLX90640 has
best results when
operating at 32-
34 inches from
target. Test will
be conducted by
taking sample
data from 24, 36,
48 inches and
comparing the
average results.
Each data
collection run
will be 5
minutes.
We expect 24
and 36 inches to
be similar while
48 inches will
provide less
accurate results.
The thermal
collection data
is most accurate
(+/-1 F) at
around 36 and
24 inches while
it was less
accurate (>+/- 1
F) at 12 inches
or less.
Pass 2/07/22 -
2/14/22
Zaid Elias 8 Test those
temperatures at
and above CDC
defined fever
temperature
(100.4°F),
detected by
MLX90640
infrared
temperature
sensor, are stored
in a text file with
timestamp. The
test subject will
place a hot towel
across forehead
until their human
body
temperature is
above 100.4°F.
The subject will
then stand in
frame of the
temperature
sensor camera.
We expect the
test to pass with
all unhealthy
cases logged in
the text file
with a
timestamp.
All the
unhealthy cases
were logged in
a text file with
a time stamp
Pass 2/07/22 -
2/14/22
Zaid Elias 9 Test the stability
of the
MLX90640
We expect this
test to pass with
the temperature
The
temperature
sensor
Pass 2/07/22 -
2/14/22

Appendix H-5
temperature
sensor over
extended periods
of time (12
hours) with no
crashes. The
temperature
sensor will run
with a test
subject in frame
and without over
the course of the
test period.
sensor running
steady during
the extended
period.
maintained its
recording for
12 hours with
no errors but
with a slightly
increased in
accuracy of
+1.12°F
Zaid Elias 10 Test that the FPS
of the
MLX90640
infrared
temperature
sensor stream
does not drop
below 3 for
extended runs of
the sensor.
Average FPS
will be
calculated at the
end of the run.
This test will be
done in
conjunction with
test 9
We expect this
test to pass, and
that the
temperature
sensor will not
go below 3 FPS
on average.
The
temperature
maintains an
average FPS of
4 in extended
runs (>4hrs)
Pass 2/14/22 -
2/21/22
Zaid Elias 11 Test that extreme
temperature
recordings are
disregarded as
non-human. Any
temperature
recording above
109°F and below
97°F will not be
logged in the text
file. The test will
be conducted by
aiming the
MLX90640
towards a hot
light (>109°F)
and then
checking the post
operation text
file.
We expect this
test to pass
because this
sub-feature is
software
dependent, not
hardware and
the developer
can set upper
and lower limits
for the
collection.
No
temperatures
over desired
temperature
was logged in
the post
operation text
file
Pass 2/14/22 -
2/21/22
Zaid Elias 12 Test that the
presence of a
mask on the test
subject does not
cause any
significant
change in the
We expect this
test to pass
because the
mask does not
obstruct all
critical test
areas of the
The mask did
not affect the
collection of
accurate
temperature
data due to the
mask not
Pass 2/14/22 -
2/21/22

Appendix H-6
temperature
recording of the
temperature
sensor. This will
be tested by
giving the test
subject a
standard surgical
mask and putting
them in frame of
the infrared
camera. Sample
data will be
taken for 5
minutes, and the
average
temperature will
be compared to 5
minutes of non-
mask data.
human face
(such as the
forehead or
neck).
covering key
heat points of
the face and
neck.
Justin Roldan 13 Test the
graphical user
interface by
verifying it can
detect faces with
a bounding box
when the video
stream initializes
the camera
sensor to turn
on. Tests should be
done with light
dimmers to test
how dark the
camera can pick
up someone's
face before the
graphical user
interface stops
detecting the
face.
This test is
expected to
pass if there’s
strong lighting,
the camera
should be able
to detect a face
and output a
bounding box
around the
face.
In bright
lighting, the AI
is able to detect
and output a
bounding a box
around the face.
Pass 2/7/22-
2/14/22
Justin Roldan 14 Test the
graphical user
interface color
scheme. If
someone is
wearing a mask
properly the
bounding box
should be
displayed as
green. If there is
no mask or if not
properly used,
This test is
expected to
pass when
presented with
both cases in
good lighting,
otherwise the
camera can't
pick up the face
which will
affect the
outcome of the
When
evaluating the
test, the client
wore a mask,
and then did
not wear a
mask. In bright
settings there
was a brightly
colored box
frame around
the clients face.
A green frame
Pass 2/7/22-
2/14/22
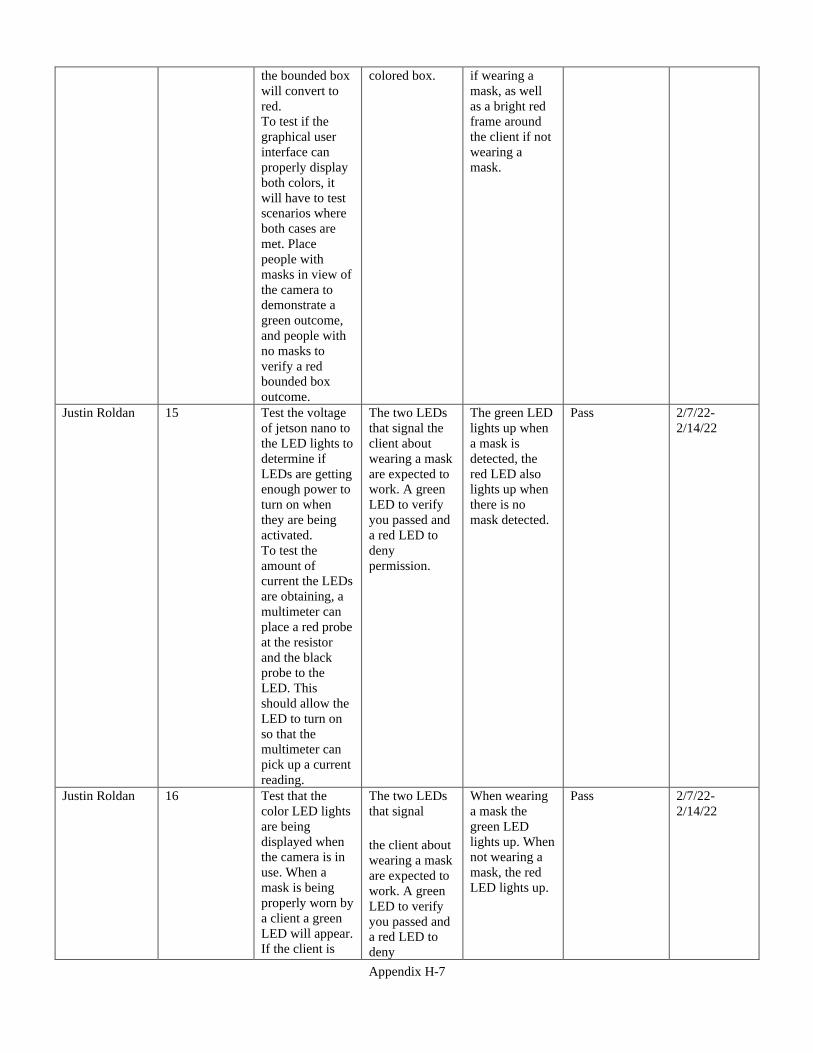
Appendix H-7
the bounded box
will convert to
red. To test if the
graphical user
interface can
properly display
both colors, it
will have to test
scenarios where
both cases are
met. Place
people with
masks in view of
the camera to
demonstrate a
green outcome,
and people with
no masks to
verify a red
bounded box
outcome.
colored box.
if wearing a
mask, as well
as a bright red
frame around
the client if not
wearing a
mask.
Justin Roldan 15 Test the voltage
of jetson nano to
the LED lights to
determine if
LEDs are getting
enough power to
turn on when
they are being
activated. To test the
amount of
current the LEDs
are obtaining, a
multimeter can
place a red probe
at the resistor
and the black
probe to the
LED. This
should allow the
LED to turn on
so that the
multimeter can
pick up a current
reading.
The two LEDs
that signal the
client about
wearing a mask
are expected to
work. A green
LED to verify
you passed and
a red LED to
deny
permission.
The green LED
lights up when
a mask is
detected, the
red LED also
lights up when
there is no
mask detected.
Pass 2/7/22-
2/14/22
Justin Roldan 16 Test that the
color LED lights
are being
displayed when
the camera is in
use. When a
mask is being
properly worn by
a client a green
LED will appear.
If the client is
The two LEDs
that signal
the client about
wearing a mask
are expected to
work. A green
LED to verify
you passed and
a red LED to
deny
When wearing
a mask the
green LED
lights up. When
not wearing a
mask, the red
LED lights up.
Pass 2/7/22-
2/14/22

Appendix H-8
not wearing a
mask our
algorithm will
turn the green
LED off and
signal a red LED
to turn on. For us to test that
both the red and
green LED are
working properly
the camera must
have a person
test both
examples.
permission.
Justin Roldan 17 Test our sound
card so that it
properly
generates sound
from the
speakers using
text to speech.
The audio output
will inform the
user that a mask
is detected or not
detected.
We expect for
the speaker to
generate sound
according to the
outcome of
their facial
covering. We
expect the
output to say
“No mask
detected!” if no
mask is
detected. If the
mask is
detected it is
expected to
output “mask
detected!
As the
algorithm is
always in a
while loop, as
long as the user
is wearing a
mask it will
output “Mask
Detected” in
the camera
stream. If the
user isn’t
wearing a mask
then the
speakers will
output “No
mask detected”.
Thus making it
clear and
evident that the
algorithm
communicates
with the
speakers in
order to use
text to speech.
Pass 2/7/22-
2/14/22
Shaan Wadhwa 18 Test various user
heights, from 4
feet 10 inches to
7 feet tall. This
test will be
conducted by
using a
measuring tape
to properly
position either a
printed-out
image of a face
wearing a mask,
or one of our
The outcome of
this test is
expected to
detect the face
and properly
output if the
face is or is not
wearing a
facemask
How this
evaluation was
performed,
since the group
does not know
anyone that is
4’10 or 7’0,
was mainly
through the use
of a chair. The
individual
would sit down
and test if the
camera and tilt
Pass 2/07/22 -
2/14/22

Appendix H-9
team members,
depending on if
our camera is
able to detects a
face from a 2-
dimensional
printed image.
as low as 4’10.
In which it
detected. What
was found was
that at 3 ft, for a
7’0 individual,
the camera can
tilt as far up at
70 degrees,
being able to
identify a
masked and a
no-masked
individual. At
4’10, the
individual
sitting down,
the camera can
tilt as low as
105 degrees at
roughly 3 ft
while wearing a
mask or no
mask.
Shaan Wadhwa 19 This test will
provide the
Servo Motors
with a larger
number of volts
than we had
previously
supplied. With
an operating
voltage range of
4.8V ~ 6.0V, our
previous supply
was supplying
5V through
GPIO pins.
This larger
voltage supply
should improve
the slew rate of
the servo
motors,
allowing a
smoother
pan/tilt
movement of
the camera as it
tracks a face.
The program
does not
recognize the
driver if it is
not plugged in
within the
power ports via
GPIO. An
external voltage
supply
wouldn’t work.
Fail 2/07/22 -
2/14/22
Shaan Wadhwa,
Ramsey
Alahmad
20 This test will
remove images
from our dataset
which we
reference for our
facemask
detection
algorithm.
Attempting to
maintain
facemask
detection
accuracy while
improving the
slew rate of the
servo motors,
this test should
yield a middle
ground that
improves the
servo motors’
pan/tilt
efficiency.
There is a slight
improvement
when it comes
to lowering the
artificial
intelligence
model in
response
towards a better
pan/tilt. It’s
more
responsive with
a smaller model
compared to a
larger model.
Pass 2/14/22 -
2/21/22
Shaan Wadhwa 21 Test rate at
which the servo
motors are able
to pan/tilt in
The expected
result of this
test is that the
servo motors
The servo
motors are able
to pan and tilt
towards the
Pass 2/14/22 -
2/21/22

Appendix H-10
order to keep the
target user in the
view of our
camera.
pan/tilt the
camera at a rate
in which the
user’s face
never leaves the
view of our
camera, to
maintain proper
and accurate
autonomous
tilting.
center of the
user’s face.

Appendix I-1
APPENDIX I. SWOT ANALYSIS
TABLE I-I.
SWOT Analysis Chart.
Positive Negative
Inte
rnal
Strengths Weaknesses
1 Team members are all familiar and
comfortable with the programming language
used in the project (Python)
1 First team design, marketing experience is
limited, which can lead to a weak impact on
the product development.
2 Project is based around industry standard AI
library (TensorFlow) which is actively
maintained by developers
2 A potential weakness is the dependency on
components like the jetson nano where we
don’t have control of production.
3 Heavier focus on software rather than
hardware allows for maintenance updates and
bug fixes to be more efficient and financially
feasible to complete
3 Limited financial capital, working with no
sponsor so the budget is coming from our
own wallets.
4 Software used is open source offering legal
protection and flexibility for the product.
4 Limited Power supply not allowing for all
hardware components to properly function
like the Servo Motor
5 Balanced team composition of 2 CPE and 2
EEE majors, allowing for equal focus towards
signal/power related features and software
features.
5 Late entry into the market giving the
advantage to business’s who are already
developed further along.
Exte
rnal
Opportunities Threats
1 Increased societal awareness of the benefit of
general mask wearing and fever monitoring
will allow our product to be more easily
marketed
1 Ending of pandemic/endemic, making the
once marketable deployable prototype, as a
dated tool to help businesses.
2 Businesses, specifically small ones, have a
growing interest in automation.
2 Further regulation and questioning of AI
which could lead to redesign changes.
3 Smaller and larger businesses are both in
need of mask and fever detection.
3 Advancements in technology that more
adequately detect objects such as face
masks.
4 Newly developed graphics hardware,
optimized for TensorFlow libraries, will
allow continued improvement of future
versions of our design.
4 Risk of people being upset about our product
and break it.
5 Team resides in geographical region
(California) with high mask and mandate
compliance.
5 Increasing face mask wearing reluctance by
forcing masks being worn in areas where our
product is positioned.