Cross���Evaluation: A new model for information system evaluation
15
JOURNAL OF THE AMERICAN SOCIETY FOR INFORMATION SCIENCE AND TECHNOLOGY, 57(5):614–628, 2006 In this article, we introduce a new information system evaluation method and report on its application to a col- laborative information seeking system, AntWorld. The key innovation of the new method is to use precisely the same group of users who work with the system as judges, a system we call Cross-Evaluation. In the new method, we also propose to assess the system at the level of task completion. The obvious potential limitation of this method is that individuals may be inclined to think more highly of the materials that they themselves have found and are almost certain to think more highly of their own work product than they do of the products built by others. The keys to neutralizing this problem are careful design and a corresponding analytical model based on analysis of variance. We model the several measures of task completion with a linear model of five effects, describing the users who interact with the system, the system used to finish the task, the task itself, the behavior of individuals as judges, and the self- judgment bias. Our analytical method successfully isolates the effect of each variable. This approach pro- vides a successful model to make concrete the “three- realities” paradigm, which calls for “real tasks,” “real users,” and “real systems.” Introduction Scientific progress in the development of information sys- tems requires measurement and evaluation of those systems. Evaluation plays a role not only in assessing the final result of development, but also in guiding development. Historically, and for reasons of efficiency, in the field of information retrieval we have sought to separate evaluation from the details of any specific user’s task. The most prominent exam- ple of this separation is the development of the notion of rel- evance as something that can be assessed by judges distinct from those who need the information. In this sense, the complex notion of relevance is reduced to the relatively objective notion of being “related to the stated topic.” This approach was pioneered by Cyril Cleverdon in the Cranfield Experiments (Cleverdon, 1960). It has evolved into the suc- cessful and influential Text REtrieval Conference (TREC) evaluation framework. There is no question that the existence of TREC, and the applicability of this method, has con- tributed substantially to the growth of information systems. At the same time, there have been efforts to extend this fundamental paradigm. However, in most cases (an anony- mous reviewer has reminded us that this was not a constraint of the early Cranfield work) a document is considered to be objectively either relevant or not relevant for a task. This cannot be maintained for more complex situations, such as question-answering and aspectual recall. It is possible to ring changes on the underlying concept without stepping away from the guiding paradigm. For example, in the short- lived TREC confusion track, Kantor and Voorhees (2000) looked at the cumulated utility, and utility measures have been adopted for the adaptive filtering task (Robertson Soboroff, 2002). Fundamentally, however, these are mathe- matical elaborations of the underlying paradigm: Given the problem, a particular document has an intrinsic score of either 1 or 0. As the tasks become more complex, we would like to move closer to real judgment by real users. An example of a more complex problem is the one addressed in the TREC Interactive Track. This track has struggled for years with the issue of defining a measure that somehow goes beyond elab- orations of binary relevance (Over, 2001). The problem is, when a user uses a system to do a task, how can we separate the user from the system? Conceptually, of course, the answer is clear: We need experimental designs in which the variables representing the user and the system are “crossed.” In other words, we must have several users each use several systems. Historically, in the TREC setting, this was not done because systems “lived” at different institutions and it was not convenient for the same individuals to use multiple sys- tems. With the growth of Web-based systems, the problem is expected to resolve itself. It is therefore time to consider seriously the design and analysis of experiments involving multiple users and multiple systems. Cross-Evaluation: A New Model for Information System Evaluation Ying Sun and Paul B. Kantor 4 Huntington Street, Rutgers University, New Brunswick, NJ 08903. E-mail: {ysun, kantor}@scils.rutgers.edu Received January 13, 2005; revised February 21, 2005; accepted March 11, 2005 © 2006 Wiley Periodicals, Inc. • Published online 1 February 2006 in Wiley InterScience (www.interscience.wiley.com). DOI: 10.1002/asi.20324
Transcript of Cross���Evaluation: A new model for information system evaluation

JOURNAL OF THE AMERICAN SOCIETY FOR INFORMATION SCIENCE AND TECHNOLOGY, 57(5):614–628, 2006
In this article, we introduce a new information systemevaluation method and report on its application to a col-laborative information seeking system, AntWorld. Thekey innovation of the new method is to use precisely thesame group of users who work with the system asjudges, a system we call Cross-Evaluation. In the newmethod, we also propose to assess the system at thelevel of task completion. The obvious potential limitationof this method is that individuals may be inclined tothink more highly of the materials that they themselveshave found and are almost certain to think more highlyof their own work product than they do of the productsbuilt by others. The keys to neutralizing this problem arecareful design and a corresponding analytical modelbased on analysis of variance. We model the severalmeasures of task completion with a linear model of fiveeffects, describing the users who interact with thesystem, the system used to finish the task, the taskitself, the behavior of individuals as judges, and the self-judgment bias. Our analytical method successfullyisolates the effect of each variable. This approach pro-vides a successful model to make concrete the “three-realities” paradigm, which calls for “real tasks,” “realusers,” and “real systems.”
Introduction
Scientific progress in the development of information sys-tems requires measurement and evaluation of those systems.Evaluation plays a role not only in assessing the final result ofdevelopment, but also in guiding development. Historically,and for reasons of efficiency, in the field of informationretrieval we have sought to separate evaluation from thedetails of any specific user’s task. The most prominent exam-ple of this separation is the development of the notion of rel-evance as something that can be assessed by judges distinctfrom those who need the information. In this sense, thecomplex notion of relevance is reduced to the relatively
objective notion of being “related to the stated topic.” Thisapproach was pioneered by Cyril Cleverdon in the CranfieldExperiments (Cleverdon, 1960). It has evolved into the suc-cessful and influential Text REtrieval Conference (TREC)evaluation framework. There is no question that the existenceof TREC, and the applicability of this method, has con-tributed substantially to the growth of information systems.
At the same time, there have been efforts to extend thisfundamental paradigm. However, in most cases (an anony-mous reviewer has reminded us that this was not a constraintof the early Cranfield work) a document is considered to beobjectively either relevant or not relevant for a task. Thiscannot be maintained for more complex situations, such asquestion-answering and aspectual recall. It is possible toring changes on the underlying concept without steppingaway from the guiding paradigm. For example, in the short-lived TREC confusion track, Kantor and Voorhees (2000)looked at the cumulated utility, and utility measures havebeen adopted for the adaptive filtering task (RobertsonSoboroff, 2002). Fundamentally, however, these are mathe-matical elaborations of the underlying paradigm: Given theproblem, a particular document has an intrinsic score ofeither 1 or 0.
As the tasks become more complex, we would like tomove closer to real judgment by real users. An example of amore complex problem is the one addressed in the TRECInteractive Track. This track has struggled for years with theissue of defining a measure that somehow goes beyond elab-orations of binary relevance (Over, 2001). The problem is,when a user uses a system to do a task, how can we separatethe user from the system? Conceptually, of course, theanswer is clear: We need experimental designs in which thevariables representing the user and the system are “crossed.”In other words, we must have several users each use severalsystems. Historically, in the TREC setting, this was not donebecause systems “lived” at different institutions and it wasnot convenient for the same individuals to use multiple sys-tems. With the growth of Web-based systems, the problem isexpected to resolve itself. It is therefore time to considerseriously the design and analysis of experiments involvingmultiple users and multiple systems.
Cross-Evaluation: A New Model for Information System Evaluation
Ying Sun and Paul B. Kantor4 Huntington Street, Rutgers University, New Brunswick, NJ 08903. E-mail: {ysun, kantor}@scils.rutgers.edu
Received January 13, 2005; revised February 21, 2005; acceptedMarch 11, 2005
© 2006 Wiley Periodicals, Inc. • Published online 1 February 2006 in WileyInterScience (www.interscience.wiley.com). DOI: 10.1002/asi.20324

JOURNAL OF THE AMERICAN SOCIETY FOR INFORMATION SCIENCE AND TECHNOLOGY—March 2006 615DOI: 10.1002/asi
At the same time, we finally have an opportunity to moveaway from the artificially imposed dependence on judgeswho are not themselves the users of the systems. The keyinnovation in the proposed method of Cross-Evaluation is touse precisely the same individuals who work with the sys-tem to find answers as the judges of those answers oncefound. There are obvious justifications for this method.These users will have become familiar to some degree withthe problem and its aspects, and they will have gained someknowledge of the corpus or collection through their ownwork with a particular system. They are, if they act promptly,immersed in the problem and able to provide a morethoughtful and effective evaluation than could an unin-volved judge. This is particularly true if the standard of judg-ment that has been chosen is not the quality or relevance,often limited to a binary scale, of the entities found, but israther the quality of an overall work product.
The obvious potential limitation of this method is thatindividuals may be inclined to think more highly of thematerials that they themselves have found and are almostcertain to think more highly of their own work product thanthey do of the products built by others.
We are thus faced with a concept, Cross-Evaluation, thatseems to have significant advantages and at the same time afatal flaw. The key to the method proposed here is to neutral-ize the flaw through carefully designed statistical analysis,leaving only the benefits.
We note there are three levels of granularity at which theresults of using an information system may be judged. Oneis at the levels of the individual item retrieved, which is thebasis for the conventional TREC metrics. The second levelof granularity is task completion. The third level assesses theimpact of the overall, completed task on the motivating goalof the individual or organization. We focus here on the mid-dle level, task completion. To study task completion, weneed three components: (1) a stable of systems, (2) a basketof sufficiently similar tasks, and (3) a collection of suitableusers. Let us think of these as the materials of our study. Wealso need a clear analytical model, which states what is tobe measured and states how meaning is to be extracted fromthe measurements. All of these are detailed in this article.
This article is organized as follows. Related Work is anoverview of some related works and the significance of theproblem. Cross-Evaluation describes the general model ofthe Cross-Evaluation method. The Analytical Method setsforth the analytical model that we use to control for all of thefactors, including self-preference. A Pilot Study is thedescription of a pilot experiment, which we have done tovalidate this approach. It includes the description of thestable of systems and the instruments for gathering data,which we have developed specifically for this project, in aWeb-based form. Results of the Pilot Experiment describesthe analysis processes and results. Conceptually A PilotStudy and Results of the Pilot Experiment may be thought ofas a separate article describing the application of the methodproposed here. Conclusions and Discussion contains thesummary of the findings and our conclusions.
Related Work
Evaluation of Interactive Information Retrieval Systems
The Cranfield paradigm of evaluation has long beencriticized for not taking issues such as the interactive andcognitive aspects of information seeking into consideration.TREC, as the most successful representative of the para-digm, has made an effort to stretch the traditional TREC testcollection, and the track concepts, into the field of interac-tive information retrieval (IR) from the very beginning ofTREC experience (Over, 2001). However, the interactivetrack maintains very little comparability across systems,unlike other TREC tracks.
The TREC interactive track, especially in TREC-5 andTREC-6, has made some good attempts to make comparisonacross systems, while taking the impact of system, topic,searcher, and their interactions into consideration. The ideaof the Matrix Experiment was developed before TREC-5 andlargely tested during TREC-6. In this approach each partici-pating site compares its own experimental system to a singlecontrol or baseline system. A basic Latin square designallowed reasonable estimation of the difference between theexperimental and the control system at each site, while themain effects of topic and searcher are to some degree undercontrol (Lagergren & Over, 1998). Unfortunately, the attemptat cross-site (cross-systems) evaluation was inconclusive,and it was dropped after TREC-7. One guiding principle ofthe Cranfield/TREC paradigm is that any comparisonbetween systems has to be made on the basis of a single setof queries and judgments. For systems without human inter-action, the expert judgments are the only set of judgmentsand every system is tested against them. The comparisonbased on the judgments directly reflects the differencesamong systems. In the interactive track, the expert judg-ments are used as a standard against which each participat-ing site’s output of human-system interaction (in otherwords, the judgments of the site’s user group) is tested.Because each site employs its own group of users, there aremultiple sets of judgments involved in the evaluationprocess: user groups’ judgments and expert judgments. Therule of single set of judgments is violated. Thus it is hard todraw conclusions across systems. The differences amongsystem users from different sites naturally lead to disagree-ment on the relevance judgments. These disagreements notonly block direct cross-site comparison but also raise ques-tions about the meaning of any evaluation based on thecomparison among multiple sets of judgments.
There has been another direction in the information sys-tem evaluation work. It has been primarily seen in research-oriented papers in which the method of evaluation is itselfthe subject of the research. In the pioneer study followingthis path, conducted by Saracevic and Kantor (Saracevicet al., 1988a, 1988b, 1988c), the information seekingprocess was viewed as involving five types of entities: users,questions, intermediaries, search, and retrieved items. Theirsystematic study clearly demonstrated the five entities’complex relations with effectiveness measures including

616 JOURNAL OF THE AMERICAN SOCIETY FOR INFORMATION SCIENCE AND TECHNOLOGY—March 2006DOI: 10.1002/asi
relevance-based precision and recall, and some utility mea-sures. On one hand, that study shows the attractiveness ofthe underlying principle of this approach, an insistence ondoing studies that involve “real users, real problems, andreal systems.” On the other hand, the results reveal that theapproach in itself contains some potential for its owndestruction.
The potential for destruction lies in two of the three real-ities: users and questions. Although “real systems” aresomething that we know how to deal with, particularly in theworld of information retrieval research, in which the sys-tems are usually studied by those who have built them, theother two components, users and problems, are open ended.The study of users can carry us into the study of cognitivescience, the study of personal psychology, the study of edu-cational theory, the study of socially constructed behavior,and so forth.
The study of “real problems” also poses enormous poten-tial hazards. Problems, as can questions, can reflect the entirerange of human knowledge or ignorance. The classificationof problems or questions then becomes no simpler than thelong-standing problem of classifying all of knowledge. Theseontological questions have occupied librarians for genera-tions, and anyone familiar with the available solutions knowsthat they are driven more by the pressures of practical realitythan by any compelling logic. Thus, people who have takenup the issue of classifying problems find themselves lookingat the distressingly large and elusive notions of “task” and“context.” To make matters worse (or better, from the per-spective of the aspiring academic), the notion of contexteasily works its way back to connect to all of complexitiesrelated to the notion of the “user.”
The challenge is to extend the notion of real users andreal problems through the idea of a Cross-Evaluation designto the realm of concrete measurement that will isolate thesystem effect while taking into consideration user andproblem effects.
Measures for Information Retrieval Systems
There are many ways to classify the measures availablefor evaluating an information system. Here we try to orga-nize the measures along the dimension of the measures’objective or subjective nature.
As shown in Figure 1, measures at one end (the left end)of the dimension are the most objective measures, such asthe time spent on a task or a search, the number of queriesentered, the number of documents saved. These measurescan be easily obtained by an automatic analysis of system
logs. The limitation of this group of measures is that theymeasure either the system performance alone or the efficiency(speed, cost, etc.) of the interaction. It is hard to assess theinteractive system’s effectiveness with these measures.
At the other end of the axis we place N-point subjectivemeasures. Such measures are widely used in interactive sys-tem evaluation work. Normally, they are collected by ques-tionnaires that use N-point Likert scales. The questionsasked often isolate the users’ perceptions of various aspects(utility or usability) of their experience with the systems.Such measures are important in helping to understand whatthe users expect in a “good” system and, and thus give sug-gestions for improving the current system (formative evalu-ation). But they are not satisfactory, on their own, in thesituation of comparing two or more systems (summativeevaluation).
In the middle of the axis are located what we call quasi-objective measures. Many popular measures are representa-tives of this type. They share three common characteristics.First, they measure systems by the direct outputs of systemsor interactions. The measures of precision and recall, forexample, are based on the sets of documents retrieved. Otherareas, such as Question Answering (QA) System evaluation,have adopted similar measures. The TREC QA track isthe representative of current QA system evaluation work.The TREC QA track uses a recall like measure based on thecompleteness and correctness of the answers. The “correct-ness” assessment is based on certain predefined criteria(TREC QA Track). The Document Understanding Confer-ence (DUC), run also by the National Institute of Standardsand Technology (NIST), compares each of the machine-generated summaries with an “ideal” model summarywritten by NIST assessors and computes a coverage scorecalled C (DUC, 2002). The ideal model summary is decom-posed into a list of units, and the machine-generated sum-maries are matched against it. In simple words, C is thepercentage of the ideal model units that is included in themachine-generated summary.
The second common feature of all these measures is thatthey rely fundamentally on some subjective processes. Themeasures of precision and recall are based on relevancejudgment, which is widely accepted to be subjective,dynamic, and multidimensional (Barry, 1994; Schamber,1994). The growth of QA research has now expanded farbeyond just factual (or “factoid,” as it is sometimes called)QA (Burger et al., 2001). With research dimensions such asmultiple question types and interactive dialog with the userto refine/guide the QA process, objective criteria for correct-ness are not easily extended to analytical QA.
In DUC, to prevent the evaluation variability introducedby human differences, researchers sought to replace humanexperts with some absolutely objective machine matchingtechnique. But it is clear that the judgments of relevance andcorrectness of texts/passages/summaries inevitably involvethe assessors’ subjective behavior. So the measures based onthem are not objective measures but, as we have noted,quasi-objective.FIG. 1. Objective/subjective dimension of evaluation measures.
N-point measure of:SatisfactionEase of use…
PrecisionRecallCoverage Score…
Quasi-Objective
TimeNumber ofQueriesQuery Length…
SubjectiveObjective

JOURNAL OF THE AMERICAN SOCIETY FOR INFORMATION SCIENCE AND TECHNOLOGY—March 2006 617DOI: 10.1002/asi
These quasi-objective measures are “normalized” in twosenses. The first is a kind of mathematical normalization.The original number based on subjective judgments (num-ber of relevant texts retrieved) is normalized, to produce, forexample, p100, the precision of the first 100 retrieved docu-ments, average precision, and so forth. In the second sense,the judgments themselves are normalized. This normaliza-tion is implemented by using expert judges and/or by defin-ing objective and static criteria for judges to follow. Theassumption is that the experts are more likely to give idealjudgments and/or that there are some objective and staticcriteria for the required quality (relevance, correctness, etc.)of the documents. The normalization carries this group ofmeasures closer to the objective end of the dimension. Tosummarize, we call them quasi-objective because they orig-inate in subjective judgments and are regularized to somedegree by the “objectifying” normalization.
Objective and quasi-objective measures have workedwell in comparing noninteractive information systems.However, as mentioned, there are problems in adapting themdirectly for evaluating highly interactive systems. N-pointsubjective measures satisfy the requirements for interactivesystem evaluation from a purely user-centered perspective.However, most currently asked questions only measure sys-tems indirectly, through users’ perception. But users’ percep-tions of a system are driven by some combination of both theusability aspects and the utility aspects of the system. In par-ticular, a high user satisfaction score does not necessarilymean that the system is more effective. The user may be sat-isfied because the system is simple enough, or pleasantenough, to use. In addition, these measures often do notreally isolate different aspects of the system. That is, factoranalysis shows that the answers to several dozen questionsmay really depend on just two or three underlying factors.Generally, a comparison of systems based on such measuresis not as persuasive as one based on measurement of theresults produced by users of the system.
In this study, we evaluate interactive systems by the finalproducts–analytical reports, which the users produce. Ourmeasure combines the advantages of both quasi-objectiveand subjective measures: The evaluation is based on realproducts, not on abstract perceptions, and the measurementis made by real users in the form of N-point scales withoutany normalization.
We also tried evaluation at the document level granular-ity. However, two arguments make us believe that to mea-sure a system’s effect on complex analytical tasks, thereport-based measure is more appropriate and more accu-rate. First, collecting information is not the final purpose ofusing the systems. Second, users save information for vari-ous purposes. The saved information is not necessarily use-ful to the task, but the fact that it was saved may represent agood work habit of the analyst.
Our proposed evaluation model focuses on realistic ana-lyst tasks and provides a concrete measurement of overallperformance, through the quality of generated analyticalreports.
Cross-Evaluation
As noted, the two key features of the Cross-Evaluationmethod are (1) letting the users be the judges and (2) mea-suring systems at the level of task completion. The methodhas been applied to evaluate a collaborative Web informa-tion seeking system and several QA systems. One commonfeature of these systems is support of complex analyticaltasks. Collecting information and preparing an analyticalreport on an assigned topic is the representative task of thetarget user groups of the systems. Therefore, in the generalmodel we present here, the task for which a system is used isto collect information and complete a draft report. Theeffectiveness of the system is measured by the quality of thereport. We note that the method can be used for systems sup-porting other types of tasks. As long as some measures oftask completion are defined and in the form of numericalscores, the model will work.
From a participant’s point of view, for each particulartopic, the evaluation procedure involves two stages. In stageone, the participant uses the assigned system to collect infor-mation and prepare a draft report on the topic. In stage two,the participant works as an assessor of the report’s quality.We developed a set of five report quality judgment criteria:
• Covers the important ground• Avoids irrelevant materials• Is well organized• Reads clearly and easily• Overall rating this report
Each criterion is scored on an n-point Likert scale, andeach participant judges all of the reports prepared for a giventask.
Each particular task forms an “evaluation unit.” The com-ponents and their relationships for a complete evaluationunit are illustrated in Figure 2.
The Analytical Model
Carefully designed statistical analysis is the second keyfeature of the proposed method.
The measures obtained by Cross-Evaluation can be identi-fied as having been (1) produced by a particular judge for(2) the work of a particular participant (author) on (3) a partic-ular topic and (4) using a particular system. The concept ofCross-Evaluation itself contains a potential fatal flaw: self-judgment bias. We posited that an individual may recognizethe products that he or she contributed and may give themhigher scores during the evaluation stages. To neutralize thispotential flaw, a self-judgment bias effect is included. Webuild an analytical model based on analysis of variance, whichis applied to all of the five measurement scores, with thesevariables as factors. This leads to the general linear model:
Analytical Model (1)
where V � measurement scores; J � judge variable; A �author variable; T � task variable; S � system variable;
V ( j, a, t, s, b) � l0 � ljJ � la
A � ltT � ls
S � lbB � e
618 JOURNAL OF THE AMERICAN SOCIETY FOR INFORMATION SCIENCE AND TECHNOLOGY—March 2006DOI: 10.1002/asi
Participants
CollectedInformation
InformationSystem
A Task
Report ScoringSystem
Evaluation StageWorking Stage
Cross-EvaluationReport PreparationLink Collection
Reports
FIG. 2. Cross-Evaluation model.
B � self-judgment bias variable; � coordinate of the par-ticular value i of variable I, determines the contribution ofthe independent variable I; and e � random error.
The lowercase letters represent the specific values of thecorresponding uppercase variable. Thus j � 1, 2, 3 . . . labelsparticular judges. In the Equation 1 analytical model, we donot include any interaction effects. Typical experimentaldesigns concentrate on getting the best possible estimate ofthe main effects. Quite large experimental designs would berequired to measure the possible interactions. For example,to study all the possible interaction effects in a study includingthree systems, three tasks and three user groups (as reportedin the section A Pilot Study), a 3 � 3 � 3 factorial design,three times the proposed Latin square design, is required.
A Pilot Study—AntWorld Evaluation
The Cross-Evaluation method was developed in the eval-uation component of development of a complex collabora-tive information finding system for the World Wide Web:AntWorld. We report here the study as an illustration of theproposed method.
The Tasks
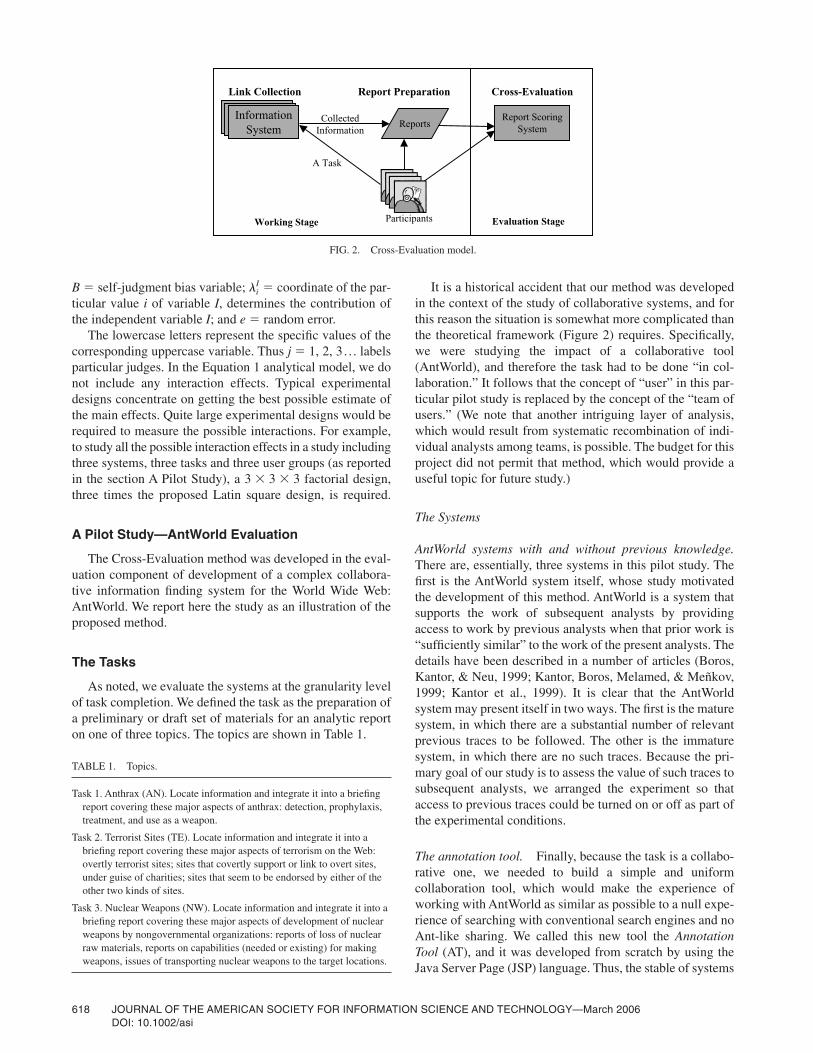
As noted, we evaluate the systems at the granularity levelof task completion. We defined the task as the preparation ofa preliminary or draft set of materials for an analytic reporton one of three topics. The topics are shown in Table 1.
liI It is a historical accident that our method was developed
in the context of the study of collaborative systems, and forthis reason the situation is somewhat more complicated thanthe theoretical framework (Figure 2) requires. Specifically,we were studying the impact of a collaborative tool(AntWorld), and therefore the task had to be done “in col-laboration.” It follows that the concept of “user” in this par-ticular pilot study is replaced by the concept of the “team ofusers.” (We note that another intriguing layer of analysis,which would result from systematic recombination of indi-vidual analysts among teams, is possible. The budget for thisproject did not permit that method, which would provide auseful topic for future study.)
The Systems
AntWorld systems with and without previous knowledge.There are, essentially, three systems in this pilot study. Thefirst is the AntWorld system itself, whose study motivatedthe development of this method. AntWorld is a system thatsupports the work of subsequent analysts by providingaccess to work by previous analysts when that prior work is“sufficiently similar” to the work of the present analysts. Thedetails have been described in a number of articles (Boros,Kantor, & Neu, 1999; Kantor, Boros, Melamed, & Meñkov,1999; Kantor et al., 1999). It is clear that the AntWorldsystem may present itself in two ways. The first is the maturesystem, in which there are a substantial number of relevantprevious traces to be followed. The other is the immaturesystem, in which there are no such traces. Because the pri-mary goal of our study is to assess the value of such traces tosubsequent analysts, we arranged the experiment so thataccess to previous traces could be turned on or off as part ofthe experimental conditions.
The annotation tool. Finally, because the task is a collabo-rative one, we needed to build a simple and uniformcollaboration tool, which would make the experience ofworking with AntWorld as similar as possible to a null expe-rience of searching with conventional search engines and noAnt-like sharing. We called this new tool the AnnotationTool (AT), and it was developed from scratch by using theJava Server Page (JSP) language. Thus, the stable of systems
TABLE 1. Topics.
Task 1. Anthrax (AN). Locate information and integrate it into a briefing report covering these major aspects of anthrax: detection, prophylaxis, treatment, and use as a weapon.
Task 2. Terrorist Sites (TE). Locate information and integrate it into a briefing report covering these major aspects of terrorism on the Web: overtly terrorist sites; sites that covertly support or link to overt sites, under guise of charities; sites that seem to be endorsed by either of the other two kinds of sites.
Task 3. Nuclear Weapons (NW). Locate information and integrate it into a briefing report covering these major aspects of development of nuclear weapons by nongovernmental organizations: reports of loss of nuclear raw materials, reports on capabilities (needed or existing) for making weapons, issues of transporting nuclear weapons to the target locations.

JOURNAL OF THE AMERICAN SOCIETY FOR INFORMATION SCIENCE AND TECHNOLOGY—March 2006 619DOI: 10.1002/asi
consists of the bare AntWorld (AW), the populated AntWorld(AW2), and the Annotation Tool (AT).
The Annotation Tool is in essence simple groupware butspecially designed for our evaluation work as a null system.It provides a method for users to collect useful informationfrom the Web and to share the information with team mem-bers. When a user logs into the system, a Web page kept forthe user’s team and a regular browser window are shown(Figure 3). The team Web page contains the uniformresource locators (URLs) they have selected and simpleannotation information. The tool is multithreaded. Teammembers can work from different places at the same time.
Team members can search and browse with the regularbrowser window. If a user finds a piece of useful informationand wants to share it with his/her teammates, he or she canadd new information (URLs of useful Web pages and briefannotations) on this page. A simple function to organizeinformation is provided by letting the user specify where onthe page the new information should appear.
The team page is kept as a Web page to make it conve-nient for users to look at the information collected by other
team members. By clicking the URLs in the team page, theycan load Web pages into the regular browser window. Thetool also invites the user to make comments on the informa-tion currently displayed.
To add a Web page to this “Annotation Page,” a useris required to make a relevance judgment according to a6-point scale: Essential (5), Valuable (4), Informative (3),Background (2), Irrelevant (1), and No Comment (0).
The Evaluation Process
In this pilot study, in addition to the five variables measur-ing report quality, listed previously, we included a microlevelCross-Evaluation based on the quality of collected informa-tion items. This precedes the macrolevel Cross-Evaluation,which gives a four-stage model as illustrated in Figure 4.
Stage I. Information collection. In the first stage all of theparticipants, using one of the systems (either one of thetwo experimental systems or the null system), gather and
FIG. 3. Interface of the annotation tool.
Null System (AT)
AntWorld System (AW) Reports Report Scoring
System Link Scoring
System
A team(contains 3 or 4participants)
A set (at most 4 teams)
Stage IVCross-Evaluation
Stage IIILink Scoring
Stage IIReport Preparation
Stage ILink Collection
FIG. 4. The four-stage model for AntWorld evaluation.

620 JOURNAL OF THE AMERICAN SOCIETY FOR INFORMATION SCIENCE AND TECHNOLOGY—March 2006DOI: 10.1002/asi
roughly annotate information bearing on a particular topic.This stage extends over a 10- to 14-day span, during whichindividuals are expected to work approximately 10 hourseach. The time is intentionally extended, in order to permitthe experimental system to accumulate links and comments.
Stage II. Report preparation. In the second stage, userscreate reports based on the information collected in the firststage. Each team was asked to select a lead editor, whoworked with an editing tool (which we developed) to selectamong the links that had been gathered and organize theminto a coherent narrative. Other members could read andmake suggestions before the final version of the report wassubmitted.
Stage III. Link scoring. The third stage proceeds onlyafter all participants in the set of teams working on a taskhave produced their draft narratives. The links included inany of the narratives on the specific task were merged into aunion (i.e., duplicates were removed). Each individualparticipant was then asked to evaluate the union. The linksin the union were presented in random order in a partialeffort to control bias toward links that appeared in a judge’sown team’s report. Participants evaluated each link in termsof its contribution to the overall final report by using a six-category scale. The definitions of the six categories are asfollows:
A link is essential if the report cannot be good without it.If there are several ways to get the same important informa-
tion, then each of them is just valuable.Informative is also valuable, but less valuable.
Background is information that fills out the picture but is notkey to the recommendation or decision.
Irrelevant indicates that the link should not be in the report,as it will waste the customer’s time.
If you have no opinion about a particular link, chooseNo Comment.
Stage IV. Report evaluation. In the fourth and final stage,all participants were asked to judge the draft reports as awhole. The judgment is based on the five characteristicslisted. Each characteristic is scored in a range from 0 (worth-less!) to 5 (Marvelous!). Each user was asked to judge all ofthe reports of the task set.
The Evaluation Systems
We built a set of tools to facilitate the four-stage evaluationmodel. This includes a Cross-Evaluation system to collectjudgments and an administration system to facilitate projectcoordination. Because of the highly distributed nature of theexperiment, all the experimental systems are built by usingthe JAVA Web application tools (JSP and Servlet) to makethem accessible through regular Web browsers. In the back-ground, we use the MYSQL database system to store data.
The link scoring tool. The link scoring interface is shownin Figure 5.
On the basis of the login information, the system shows,in random order, all the URLs collected by all of the teams inthe set to which the user belongs. The instructions at the topof the window are a part of the instructions given to the par-ticipants. Because there are quite a few links to score, thesystem saves links that have been scored and, when the same
FIG. 5. The interface of link scoring tool.

JOURNAL OF THE AMERICAN SOCIETY FOR INFORMATION SCIENCE AND TECHNOLOGY—March 2006 621DOI: 10.1002/asi
FIG. 6. The interface of the report evaluation tool.
participant logs in again (subsequently), it displays onlythose links not yet judged.
The report evaluation tool. The report evaluation tool isuseds for evaluating completed reports, as shown inFigure 6. When the user begins report evaluation, the systemautomatically checks the status of document-based evalua-tion. Only after all members in the set finish scoring the linksdoes the report evaluation begin. Before presenting the re-port the system automatically annotates the reports (detailsof the annotation are discussed in the next section).
Across the top of the page is a table that displays all of the(team) reports the participant needs to score and how he/shehas scored each team’s report so far. The team names in thetable are links. Following a link will display the correspond-ing team’s report in the table on the lower right side. Theparticipant actually judges a report on the lower left side ofthe table.
The displayed narrative has its links annotated (by ourprogram) to summarize the results of the scoring exercisejust completed. The annotation for each link in the reportsincludes four statistics:
Avg: the average score assigned by all the judges to the link.NC: the number of judges who had no comment on the link.C: a measure of how well the judges agree. The calculation
is shown in Equation 2. With V the variance of the judg-ments, C was used as the confidence measure. N is thetotal number of judges and a is the average scoreassigned by all the judges to the link.
MS: my score, the score assigned by the user who is judgingthe report.
Confidence Measure (2)
The participant is able to select reports one after anotherand review them and may go back to revise scores assignedto an earlier report.
The administrative system. Managing this experiment isdifficult because of the distributed nature of the experiment.Participants worked remotely from home computers. Inaddition to all the information posted on the project Web siteand instructions provided with the tools, we have a coordi-nator to instruct the participants. An administrative systemwas developed to facilitate the coordinator’s work. It includesthe functions for managing the participant accounts (createnew accounts, assign participants into teams, drop partici-pants who cannot continue the experiment, etc.). The coor-dinator can also use the tool to examine and control theprogress of the experiment. For example, after 10 days ofcollecting information using the assigned system, the coor-dinator sets a system flag so that the participants cannot addany further links to their team page. Similarly, the finalreport evaluation cannot begin until all participants finishscoring the links.
The Participants
The original sponsors of the AntWorld system, andof much work of this type, are primarily interested in
C �1
1 � V
V �aN
i�1(score (i) � a)2
N

622 JOURNAL OF THE AMERICAN SOCIETY FOR INFORMATION SCIENCE AND TECHNOLOGY—March 2006DOI: 10.1002/asi
TABLE 3. Experimental design: Teams by TASK and SYSTEM.
SYSTEM ((n) is the size of the team)
Task AT AW AW2 Total
AN Tiger (3) Horse (3) Rabbit (4) 10TE Monkey (4), ox (4) Dragon (3) Rooster (4) 15NW Rat (4), snake (4) Sheep (4) Dog (3) 15TOTAL 19 10 11 40
developing tools that will be effective for professional ana-lysts and searchers who spend days or weeks monitoring orresearching a particular topic. For users of this type, a 3-houror even a 10-hour learning process is not a serious barrier, ifthe results of that process are substantial improvements inefficiency and effectiveness.
We recruited participants by two paths, one yieldingexperts at search, drawn from the reference library commu-nity, and the other yielding experts in intelligence analysis,through contact with a set of retired government analysts.There were altogether 21 participants.
Pilot Experimental Design
In this pilot study, a single instantiation contains data onas many as four “teams” that together form a “task set” or“group,” addressing the same task. With the same task(in the same task set), different teams are assigned to usedifferent tools.
Complete study of the collaborative system could in prin-ciple involve all of the following variables: the TASK, theSYSTEM, some characteristics of the TEAM as a team, andsome characteristics of the INDIVIDUALS who make upthe team.
In this study we did not attempt to explore characteristicsof the team as a team, although this is a rich area for futureinvestigation. As noted, our budget did not allow the designto regroup participants, a procedure that is necessary if indi-vidual factors are to be isolated. Therefore, we intended tokeep TEAMS together for the length of the study, so that allphenomena of training and learning could be interpreted ascharacteristic of the team itself. The proposed design was aLatin square (Table 2).
However, some of the participants had to leave in themiddle of the experiment, so that, in fact, the teams were notkept together for the length of the study. The total number ofparticipants was 21. Ultimately, only five individuals partic-ipated in all of the three tasks. Seven participated in twotasks and nine users participated in only one task. We tried tokeep the same group of users together in one team and con-stitute new teams as the process evolved. The resulting im-plemented experimental design is shown in Table 3. Thetotal number of “team members” was 40. Each team was as-signed a name from the Chinese animal zodiac.
This pilot design makes it impossible to isolate differ-ences among teams. Therefore, one of the most importantissues in the study of collaborative or interactive systems forinformation finding, the learning effects, is not examined.
We assert, however, that in a full evaluation they should andmust be taken into account.
Pilot Analytical Model
In this pilot study, because of the budget limitation andunexpected loss of participants, there had to be two modifi-cations of the proposed model. First, the author variable wasremoved from the model. Because the teams are not keptconstant through the experiment, we cannot examine thiseffect. Second, we extended the analytical model to examineinteraction effects. We did not ignore the interaction effectsbecause (1) theoretically, we do not know whether in thepopulation the interaction effects are negligible, and (2)practically, our experiment was not a Latin square design,which would assume that they are unimportant. We includedin the model all second-order interactions. Then we simpli-fied the model by removing all interactions that do not havea significant impact on the dependent variables. Equation 3is the model actually used in the pilot AntWorld Evaluation
F1, F2 � {J, S, B, T}F1 � F2
AntWorld Evaluation Model (3)
Results of the Pilot Experiment
Report-Based Evaluation
On the report-based evaluation level, the impact of sys-tems on the completion of tasks, that is, on the quality of thefinal products, was examined. The performance was evalu-ated by considering the scores assigned to the reports as awhole. This is based on a realistic view of the searching taskfor the target user group of the system, which is to “gathervaluable information and integrate it into a report.”
Before reporting the statistical analysis, we look at thefigures for report judgments. As can be seen in Table 3, therewere five reports created with the null system (AT), and eachreport was judged by the users who participated in the corre-sponding task, so there are, in total, 70 judgments. Eachjudgment includes five 0–5 scores, each on one of the fivecharacteristics. In a similar way, there are 30 judgments onsystems AW and AW2, respectively. We broke the scores
�a lF1,F2f1, f2
� eV( j, t, s, b) � l0 � ljJ � lt
T � lsS � lb
B
TABLE 2. Proposed Latin square design.
SYSTEM (n is the size of the team)
Task AT AW AW2
AN Team1 Team 2 Team 3TE Team 2 Team 3 Team 1NW Team 3 Team 1 Team 2

JOURNAL OF THE AMERICAN SOCIETY FOR INFORMATION SCIENCE AND TECHNOLOGY—March 2006 623DOI: 10.1002/asi
TABLE 5. Weights of the leading factor load on five characteristics(extraction method: principal component analysis).
Weights on the first factor
Overall rating .94Is well organized .92Reads clearly and easily .88Covers the important ground .76Avoids irrelevant materials .70
TABLE 6. Analysis of variance for the leading factor of report quality.
Type III sum Mean Source of squares Df square F Sig.
Corrected model 51.37 29 1.77 2.18 .00Intercept .10 1 .10 .13 .72TASK .41 2 .21 .25 .78SYSTEM 2.37 2 1.18 1.46 .24SELF 3.62 1 3.62 4.45 .04TASK * SYSTEM 17.80 4 4.45 5.47 .00JUDGE 24.32 20 1.22 1.49 .10Error 97.63 120 .81Total 149.00 150Corrected total 149.00 149
into two groups: “high” (if the score is 4 or 5) and “other.”The percentage in each group, for each of the five measures,on all reports is grouped by the system variable and summa-rized in Table 4.
The tabulation shows that 55% of the participants consid-ered the overall rating of reports written with AW2 to beequal to or higher than 4, which is barely better than the con-trol system AT (54.2%). AntWorld without previous knowl-edge (AW) only has 37.5% of judgments at this level.Because the SYSTEM effect may be confounded with otherpossible effects, further analysis is necessary to check theaccuracy of this ranking.
Analysis of the leading factor of quality. We next per-formed a factor analysis, to see whether the five measuredvariables are independent. If our instrument, the five-characteristic report quality measurement, has a balanced setof questions that accurately reflect the decision makers’ con-cerns, then factor analysis is a good way to summarize them.
The results show that there is essentially one conceptbeing judged. The first factor explains 71.5% of the variancewith an eigenvalue equal to 3.57. The weights of the firstfactor on the five characteristics, which are correlationsbetween the five characteristics and the first factor, areshown in Table 5. Apparently, the first factor is generallyhighly correlated with all five variables. We refer to the firstcomponent as the leading factor of report quality.
With the leading factor as the dependent variable, weapplied the general analytical model of Equation 3, which is
a univariate general linear model (GLM) analysis. Our searchfor interactions revealed only one significant interactioneffect (between TASK and SYSTEM). The analytical modelis then simplified as shown in Equation 4. (The SPSS syntaxis in the Appendix.)
Simplified Analytical Model (4)
Table 6 shows the impact of each main effect, and of theinteraction effect included in the model. The SYSTEM effectis greater than the TASK effect, but still not statistically sig-nificant. The interaction effect accounts for a substantial partof the variance and is statistically significant. Self-judgmentbias is another significant source of the variance. The modelshows that with the larger effects of task-by-system interac-tion, self-judgment bias and the effect of the judge being cor-rected, the SYSTEM effect can be measured, although in thisparticular experiment it is not statistically significant.
We can also examine the relative magnitudes of the fourmain effects and one interaction effect, using the ranges, ordifferences between the highest and lowest standardizedlambda scores for the particular effects.
As seen in Table 7, we can, with only about 75% confi-dence, draw the conclusion that the SYSTEM variables affectthe leading factor of report quality. This is lower than ourconfidence for the judge (90%), the self-judgment bias(96%), and the interaction effect (100%). However, Table 7shows that the magnitude of the SYSTEM effect is higherthan that of the judge, task, and self-judgment effects, yetlower than that of the system and task interaction effects. Thefact that the smaller differences can be more significant thanlarger ones is caused by the different normal distributions ofthe measured variables. The shape of the self-judgment bias
V ( j, t, s, b) � l0 � ljJ � lt
T � lsS � lb
B � lt, sT, S � e
TABLE 4. Distribution of user assignments to each report characteristicsgrouped by system variable.
System
AT AW AW2 Characteristics Score (n � 70) (n � 40) (n � 40) Total
Covers the important �4 54.3% 45.0% 50.0% 50.7%ground �4 45.7% 55.0% 50.0% 49.3%
Avoids irrelevant �4 41.4% 47.5% 32.5% 40.7%materials �4 58.6% 52.5% 67.5% 59.3%
Is well organized �4 54.3% 27.5% 52.5% 46.7%�4 45.7% 72.5% 47.5% 53.3%
Reads clearly �4 47.1% 30.0% 57.5% 45.3%and easily �4 52.9% 70.0% 42.5% 54.7%
Overall rating �4 54.2% 37.5% 55.0% 50.0%�4 45.8% 62.5% 45.0% 50.0%
TABLE 7. Relative magnitudes of effects analyzed in Table 6.
Effects Range
SYSTEM and task interaction 4.70SYSTEM 4.15Judge 3.82Self-judgment bias 2.11Task 1.96

624 JOURNAL OF THE AMERICAN SOCIETY FOR INFORMATION SCIENCE AND TECHNOLOGY—March 2006DOI: 10.1002/asi
TABLE 8. Estimated marginal means comparison.
95% Confidence interval
Mean difference Sig. Lower bound Upper bound
AW2 vs. AW .35 .095 �.06 .76AW2 vs. AN .13 .506 �.25 .50AW vs. AN �.22 .252 �.60 .16
magnitude distribution is sharper and the mean is nearer tothe zero point than that for the system effect magnitude.
Our ultimate concern is to learn the system factor’s effecton the leading factor of report quality. Because there arethree levels of the system factor (AT, AW, and AW2), it is ofinterest to find the relative relationships among these threelevels. We find that the interaction of the system variable andthe task variable has an effect on this factor. The system vari-able contributes to the leading factor in two ways: throughthe pure system effect and through the interaction effect withthe task variables. We can look at the relative relationshipsamong the three systems’ contributions to the leading factorin three ways.
First, we examine the parameter (l) estimated for eachvalue of the SYSTEM variable. This indicates only the puresystem effect. The Statistical Package for the Social Sciences(SPSS) analysis chooses its default settings arbitrarily andhas set the control system AT to the 0 point ( ). Theestimated l of AW is �1.2; the l of AW2 is 0.17. We foundthat the systems are separated into two groups. To examinethe 95% confidence intervals for the three systems’ parame-ters, ls, we plot the parameters of three systems in Figure 7.It is clear that the estimated mean parameters for AW2 andAT fall outside the 95% confidence interval for AW. Thisfinding indicates that the system effect of AntWorld with rel-evant information in it (AW2) contributes significantly moreto the leading factor of report quality than that of AntWorldwithout such relevant information (AW) does. We see, also,that the Annotation Tool (AT) is significantly better thanAntWorld without relevant information (AW) at the 95%confidence level. Finally, AW2 is not different, at the 95%confidence level, from AT.
Second, we examine the estimated marginal means ofthree levels of the system variable, which reveals relativerelationships among three systems’ overall effect on theleading factor. The result shows that AntWorld with previousknowledge (AW2) and naive AntWorld (AW) are not signif-icantly different at the 95% confidence interval (Table 8).Thus, even though the pure system effect shows a signifi-cant difference between these two levels, the system andtask interaction effect may have opposite effects on theleading factor, which averages out the significant differencebetween the two versions of the AntWorld system, in thisexperiment.
lATS � 0
Third, to verify this interpretation, we analyzed the systemeffect for each task separately. Because we care most aboutfinding the difference between the two experimental systems,we consider only the contrast between two specific levels ofthe system variable: AW and AW2. The results (Table 9)show that AntWorld with previous knowledge has a signifi-cant positive effect for only one scenario: Terrorist Sites.
Multifactor analysis. A multivariate GLM with the sameset of effects was run to examine the SYSTEM variable’simpact on each of the five individual report criteria. Notsurprisingly, we found similar patterns—all five criteriacan separate AW2 from AW at the 95% confidence level(Figure 8).
The report-based evaluation analyses and results showthat we can detect the relative differences among three sys-tems, even though the differences are not statistically signif-icant. Here, we only present the analyses and results for thesystem effect. A similar procedure can be applied to studythe other effects, for example, to answer the question ofwhich tasks are relatively easier.
To sum up, we find that the AntWorld system, when itcontains information from previous users, is significantly“better” than the AntWorld system without such information.It is, however, not significantly better than the AnnotationTool that was built to provide a comparison baseline. Wefind, also, that the significant differences all originate in oneof the three tasks. Thus this analysis does not establish auniform superiority of AW2 over AW.
Link-Based Evaluation
In the link-based evaluation part of the analysis, theimpact of the system variable on the quantity and quality ofsaved links was considered. We measured the performanceof a team (and, in fact, the effect of the system used) by com-puting several numbers: the total number of links that theteam collects and keeps in its final report and the total value
FIG. 7. System effect on leading factor of report quality (bars representthe 95% confidence intervals).
-2.00
-1.50
-1.00
-0.50
0.00
0.50
1.00
AW2 AW AT
TABLE 9. Contrast results between AW2 and AW.
95% Confidence intervalContrast estimate
Scenario (AW2-AW) Sig. Lower bound Upper bound
Anthrax .08 .84 �.72 .88Nuclear weapon �.42 .21 �1.07 .24Terrorist sties 1.37 .00* .72 1.03

JOURNAL OF THE AMERICAN SOCIETY FOR INFORMATION SCIENCE AND TECHNOLOGY—March 2006 625DOI: 10.1002/asi
TABLE 10. Recode link judgments.
Category Recode
Essential 4Valuable 3Informative 2Background 1Irrelevant �3No comment 0
Avoids the irrelevant materials
-2
-1.5
-1
-0.5
0
0.5
1
AW2 AW AT
Covers the important ground
-2
-1.5
-1
-0.5
0
0.5
1
AW2 AW AT
-3
-2.5
-2
-1.5
-1
-0.5
0
0.5
1
1.5
AW2 AW AT
Is well organized Reads clearly and easily
-3
-2.5
-2
-1.5
-1
-0.5
0
0.5
1
1.5
AW2 AW AT
Overall Rating
-3-2.5
-2-1.5
-1-0.5
00.5
11.5
AW2 AW AT
FIG. 8. System effects on five report judgment criteria.
of those links, as computed from the average of all judg-ments made by the members of all teams in the task set. Asmentioned, each link was evaluated by using a six-categoryscale. We recoded the categories into numerical data(Table 10). In recoding, we penalized the irrelevant links.
There are several important questions about the systemsthat we can ask on this level:
1. What is the relationship between the number of links andthe total value of the links saved?
2. What are the impacts of each SYSTEM on the quality ofretrieved information?
3. What conclusion can we draw from the comparison?
To answer question 1, we calculate the total value of linksin each report as
where m � the number of links in team t’s report, n � thenumber of participants in the task set in which team t joined,S(li, j) � judge j’s judgment of the ith link in the report.
V(t) � am
i�1
an
j�1
S(li, j)
n
We can evaluate a team report by computing both thetotal number of links that the team keeps in its final report,and the total value of those links. The results are visualizedin Figure 9.
We can see that one AW2 team (rabbit) has the highesttotal for both total value and total number of links. The AW2team (rooster) has high ratio of total value to total number oflinks. But one AW team (sheep) and two AT teams (tiger andox) also have high ratios.
As with the quality of reports, the values of links may beaffected by multiple factors. As earlier, we want to identifythe system effect while taking into consideration other pos-sible effects. As shown in Table 11, we found that only one

626 JOURNAL OF THE AMERICAN SOCIETY FOR INFORMATION SCIENCE AND TECHNOLOGY—March 2006DOI: 10.1002/asi
TABLE 11. The impacts of each major effect and interaction effect.
Type III MeanSource sum of squares df square F Sig.
Corrected model 3547.09 29 122.31 30.11 .00Intercept 5568.12 1 5568.12 1370.56 .00SELF 347.26 1 347.26 85.48 .00TASK 3.96 2 1.98 .49 .61SYSTEM 9.13 2 4.56 1.12 .33JUDGE 2174.87 20 108.74 26.77 .00TASK * SYSTEM 772.40 4 193.10 47.53 .00
-0.1
0
0.1
0.2
0.30.4
0.5
0.6
0.7
0.8
0.9
AW2 AW AT
FIG. 10. System effect on the individual link scores.
FIG. 9. The total score of links included by each team in their final report,as judged by all members of the same task set, plotted against the totalnumber of links in a report.
Num of Links140120100806040200
SU
M o
f Ave
rage
d lin
k sc
ores
140
120
100
80
60
40
20
0
SYSTEM
AW2
AW
AT
tiger
snake
sheep
rooster
rat
rabbit
ox monkey
horse
dragon
dog
interaction (the same one found earlier) has a significant ef-fect on the link scores (the other interaction effects are notshown).
As shown in Figure 10, we see that both versions of theAntWorld system score above the control system AT. This isdifferent from the relation found when studying the qualityof reports as a whole. And the 95% confidence interval of theAntWorld with relevant knowledge (AW2) does not haveany overlap with the other two systems. Such a result sug-gests that using the AntWorld system when it contains previ-ous information is more effective, link by link, than usingeither the Annotation Tool or the AntWorld system without“prior knowledge.” We may speculate that the AntWorld
alone is a little more effective than the Annotation Tool (aresult that is not significant at the 95% confidence level)because it provides more searching tools (a query can beeasily submitted to several search engines).
Conclusions and Discussion
The pilot study described tells us something about thevalue of the AntWorld system. First, the evaluation was con-ducted under conditions that are as real as possible. Theparticipants were from the target user group of the AntWorldsystem. They worked on their own computers in the envi-ronments with which they are familiar. The experimentalsystems, as well as the collection (the Web), are real.
Second, the statistical method successfully isolated theeffect of each variable. The data gathered were analyzed atthe level of the entire report, which represents the end prod-uct of the collaborative task, and at the level of individuallinks, which are scored for their “relevance to the task.” Theresults indicate that the mechanism of collecting previoussearchers’ knowledge used in the AntWorld system holdspromise to improve professional searchers’ work on compli-cated tasks at both the report-based and the link-based eval-uation levels. The present study is able to make statisticallysignificant distinctions on both levels, but the study is toosmall to be definitive. Because of the lack of continuity inthe teams, the results do not reflect the impact of searchers’difference, which remains one of the most challenging issuesin evaluating collaborative or interactive systems.
We believe that this study has value well beyond theimmediate results. There are four key aspects to this belief.First, this study provides a successful model to make con-crete the “three-realities” paradigm without becomingentangled in the troublesome issues of defining users andtasks. In contrast to previous work adopting the “three-realilities” paradigm, we use the searchers themselves asjudges, while the analytical model controls the potentialhazard of self-judgment bias.
Second, rather than examining the effects of all variablesone at a time, our model looks at all of the effects jointly.Therefore, the isolated effect of each variable (the lambdaparameters of the analysis of variance) is the pure effect ofthe corresponding factor, and the variance of the dependentvariables caused by other effects has been removed. We haveshown that the Cross-Evaluation method with careful statis-tical analysis can resolve distinctions among systems.
Through this analysis the distinctions between systemsare not confounded with the effects of users, topics, and soon. We believe that the proposed model is of potential inter-est for all evaluations of information system that are highlyinteractive or collaborative, or both. The pilot study wereport here shows the types of data and analysis that areneeded to extract useful conclusions.
Third, we present a method for measuring systems at thelevel of task completion, as well as at the level of theindividual search results. This is significant in three ways:(1) It is theoretically desirable to evaluate at the level of the

JOURNAL OF THE AMERICAN SOCIETY FOR INFORMATION SCIENCE AND TECHNOLOGY—March 2006 627DOI: 10.1002/asi
complete work product. As mentioned, it has been widelyaccepted in the studies of information seeking that searchingis not the final goal of users. Searching is in the context ofusers’ tasks at hand. So, searching tools should be evaluatedin terms of helping users to finish tasks. Our participantsaccepted the report-based evaluation as a reasonable method.(2) It is practically economical, especially for studies with thetype of users in our study. The time of expert informationanalysis is expensive. Skipping the time-consuming link-based evaluation would save a great amount of time andmoney. (3) Report-based evaluation provides a new measure-ment direction for systems that do not have mature link-basedmeasures. For example, the traditional relevance-based mea-sures do not fit the requirements of interactive QA systems.Of course, reports are not necessarily the final product of allsearching tasks. However, as long as final products can becross-evaluated, they will fit in the models proposed.
Fourth, the evaluation model described can be easilytransferred, with minor modifications, to other systems forlongtime users with complicated tasks. The design and ana-lytical model reported can be used as a model for testingother complex domain such as QA systems. In fact, whilethis report was being prepared, the method was extended tothe evaluation of QA systems, with a study of the HITIQAsystem (Sun, Kantor, Strzalkowski, Rittman, & Wacholder,2004). It has also been applied in a study of metrics for QAsystems in general (Kantor & Kelly, 2004; Kantor, Kelly, &Morse, 2004).
In summing up, a key objective of the evaluation model isto bypass the difficult user issue for interactive informationsystem evaluation studies of which users are not the focus.However, as pointed out by one anonymous reviewer, thepilot study reported here could not complete the experimen-tal design as initially planned because participants droppedout. Any experiment that involves users over an extendedperiod will face problems of this kind. The method of analy-sis proposed here makes it possible to recover useful infor-mation even in the face of such problems.
Acknowledgments
This research was supported in part by the Defense Ad-vanced Research Projects Agency (DARPA) under contractnumber N66001-97-C-8537 to Rutgers University. Theapplication to HITIQA was supported in part by AdvancedResearch and Development Activity (ARDA) under contractnumber 2002-H790400-000. The first author acknowledgessupport of an ARDA Challenge Internship in the summerof 2004.
We thank Robert Rittman and Shelee Saal for their workcoordinating our participants, and thank Vladimir Meñkovfor his help and insightful comments on system design andimplementation and an anonymous reviewer for some very
helpful comments. And last, but not least, we offer specialthanks to our anonymous participants.
References
Barry, C.L. (1994). User-defined relevance criteria: An exploratory study.Journal of the American Society for Information Science, 45, 149–159.
Boros, E., Kantor, P., & Neu, D.J. (1999). Pheromonic representation ofuser quests by digital structures. In Proceedings of tthe 62nd AnnualMeeting of the American Society for Information Science (Vol. 36,pp. 633–642). Medford, NJ: Information Today.
Burger, J., Cardie, C., Chaudhri, V., Gaizauskas, R., Harabagui, S., Isreal, D.,et al. (2001). Issues, tasks and program structures to roadmap research inquestion & answering (Q&A). Retrieved December 3, 2004, fromhttp://www-nlpir.nist.gov/projects/duc/papers/qa.Roadmap-paper_v2.doc
Cleverdon, C.W. (1960). The ASLIB Cranfield Research Project on theComparative Efficiency of Indexing Systems. ASLIB Proceedings,12(12), 421–431.
DUC (2004). The Document Understanding Conference. Retrieved fromhttp://duc.nist.gov
Kantor, P., Boros, E., Melamed B., & Meñkov, V. (1999) The informationquest: A dynamic model of user’s information needs. Proceedings of the62nd Annual Meeting of the American Society for Information Science,36 (pp. 536–545). Medford, NJ: Information Today.
Kantor, P., Boros, E., Melamed, B., Neu, D.J., Meñkov, V., Shi, Q., et al.(1999) AntWorld. In Proceedings of SIGIR’99, 22nd International Con-ference on Research and Development in Information Retrieval (p. 323).New York: Association for Computer Machinery.
Kantor, P., & Kelly, D. (2004). ARDA Challenge Workshop 2004: Metricsfor question answering systems final report. Unpublished report.
Kantor, P., Kelly, D., & Morse, E. (2004). ARDA Challenge Workshop2004: Metrics for question answering systems. Unpublished manuscript.
Kantor, P., & Voorhees, E. (2000). The TREC-5 confusion track:Comparing retrieval methods for scanned text. Information Retrieval,2(2/3), 165–176.
Lagergren, E., & Over, P. (1998). Comparing interactive information retrievalsystems across sites: The TREC-6 interactive track matrix experiment. InProceedings of the 21st International Conference on Research and Devel-opment in Information Retrieval SIGIR’98 (pp. 164–172).
Over, P. (2001) The TREC interactive track: An annotated bibliography.Information Processing and Management, 37(3), 369–381.
Robertson, S., & Soboroff, I. (2002). The TREC 2002 filtering track report.In the Notebook of the Text REtrieval Conference, 2002. RetrievedDecember 3, 2004, from http://trec.nist.gov//pubs/trec11/papers/OVER.FILTERING.pdf
Saracevic, T., Kantor, P., Chamis, A.Y., & Trivison, D. (1988a). A study ofinformation seeking and retrieving: 1. Background and methodology.Journal of the American Society for Information Science, 39(3), 161–176.
Saracevic, T., & Kantor. P. (1988b). A study of information seeking andretrieving: 2. Users, questions, and effectiveness. Journal of theAmerican Society for Information Science 39(3), 177–196.
Saracevic, T., & Kantor. P. (1988c). A study of information seeking andretrieving: 3. Searchers, searches, overlap. Journal of the AmericanSociety for Information Science 39(3), 197–216.
Schamber, L. (1994). Relevance and information behavior. Annual Reviewof Information Science and Technology, 29, 3–48.
Sun, Y., Kantor, P., Strzalkowski, T., Rittman, R., & Wacholder, N. (2004).Cross evaluation—A pilot application of a new evaluation mechanism. Inthe Proceedings of the 2004 Annual Meeting of American Society forInformation Science and Technology (pp. 383–392). Medford, NJ:Information Today.
TREC QA track. Retrieved December 3, 2004, from http://trec.nist.gov/pre-sentations/TREC10/qa/

628 JOURNAL OF THE AMERICAN SOCIETY FOR INFORMATION SCIENCE AND TECHNOLOGY—March 2006DOI: 10.1002/asi
Appendix
Statistical Package for the Social Sciences syntax for the report-based analysis.
A: Factor AnalysisThe following code extracts the factors underlying the five measured variables.FACTOR/VARIABLES cover noirr organ clear overa /MISSING LISTWISE /ANALYSIS covernoirr organ clear overa/PRINT INITIAL EXTRACTION/CRITERIA MINEIGEN(1) ITERATE(25)/EXTRACTION PC/ROTATION NOROTATE/SAVE REG(ALL)/METHOD � CORRELATION
B: UnivariateThe following code examines specific contrasts among the effects of the system and
the task, on the leading factor from analysis (A).UNIANOVAfac1_1 BY task system self user/METHOD � SSTYPE(3)/INTERCEPT � INCLUDE/PRINT � PARAMETER/LMATRIX ‘System’
system 1 �1 0 task*system 1 �1 0 0 0 0 0 0 0;system 1 �1 0 task*system 0 0 0 1 �1 0 0 0 0;system 1 �1 0 task*system 0 0 0 0 0 0 1 �1 0
/EMMEANS � TABLES(system) COMPARE ADJ(LSD)/CRITERIA � ALPHA(.05)/DESIGN � task system self task*system user .
C: MultivariateThe following SPSS code examines the dependence of all five measured variables on
the four factors jointly, with all main effects and only one interaction effect.GLMcover noirr organ clear overa BY task system self judge/METHOD � SSTYPE(3)/INTERCEPT � INCLUDE/PRINT � PARAMETER/CRITERIA � ALPHA(.05)/DESIGN � task system self judge task*system.