Evaluation of the Information and Communication Technology ...
123
FINAL REPORT Evaluation of the Information and Communication Technology (ICT) Continuum of Care Services (CCS) Intervention in Bihar May 8, 2015 Evan Borkum Anitha Sivasankaran Swetha Sridharan Dana Rotz Sukhmani Sethi Mercy Manoranjini Lakshmi Ramakrishnan Anu Rangarajan Submitted to: Bill and Melinda Gates Foundation Capital Court, 3rd Floor Olof Palme Marg, Munirka New Delhi - 110 067 Project Officers: Yamini Atmavilas Katherine Hay Usha Kiran Tarigopula Contract Number: 4993/22539 (18) Submitted by: Mathematica Policy Research P.O. Box 2393 Princeton, NJ 08543-2393 Telephone: (609) 799-3535 Facsimile: (609) 799-0005 Project Director: Anu Rangarajan Reference Number: 40195
-
Upload
khangminh22 -
Category
Documents
-
view
1 -
download
0
Transcript of Evaluation of the Information and Communication Technology ...

F I N A L R E P O R T
Evaluation of the Information and Communication Technology (ICT) Continuum of Care Services (CCS) Intervention in Bihar
May 8, 2015 Evan Borkum Anitha Sivasankaran Swetha Sridharan Dana Rotz Sukhmani Sethi Mercy Manoranjini Lakshmi Ramakrishnan Anu Rangarajan Submitted to: Bill and Melinda Gates Foundation Capital Court, 3rd Floor Olof Palme Marg, Munirka New Delhi - 110 067 Project Officers: Yamini Atmavilas Katherine Hay Usha Kiran Tarigopula
Contract Number: 4993/22539 (18)
Submitted by: Mathematica Policy Research P.O. Box 2393 Princeton, NJ 08543-2393 Telephone: (609) 799-3535 Facsimile: (609) 799-0005
Project Director: Anu Rangarajan Reference Number: 40195

This page has been left blank for double-sided copying.

MATHEMATICA POLICY RESEARCH
ACKNOWLEDGMENTS
We would like to thank the many individuals and organizations who contributed to this report. At the Bill & Melinda Gates Foundation, we are grateful to Katherine Hay and Yamini Atmavilas, who provided thoughtful and targeted guidance on the types of analysis that would be most useful to explore in this report. At Sambodhi Research and Communications, we are indebted to Aparna Seth, Chandan Singh, Nikhil Raj, and Putul Thakur for their hard work on piloting and refining the survey instruments, finalizing the training materials, and managing a complex data collection effort. Our thanks go as well to Sambodhi’s field team of managers, supervisors, observers, and investigators, who travelled long distances each day in difficult terrain to collect the data needed for this report. We also worked closely with several colleagues at CARE to ensure that the study reflected an up-to-date understanding of the ICT intervention. We are grateful to Shamik Trehan and Indrajit Chaudhuri for their thoughts on the direction of the evaluation. B. Ram Krishnan gave an in-depth overview of the intervention to our investigators and analyzed the monitoring data to provide us with detailed implementation information.
This report would not have been possible without the support of several of our colleagues at Mathematica. Our programmers Bill Leith, Seth Morgan, Carol Razafindrakoto, and Bethany Simard continued their good work on this project, and capably and patiently processed our many requests. Ramya Tallapragada, our excellent project manager, helped prepare comprehensive training materials for the survey data collection. We would also like to thank Stacy Dale, who reviewed our first draft and provided helpful feedback; Walter Brower and Cindy George, who carefully edited the report; Brigitte Tran, who helped create diagrams to explain the intervention; and Sheena Flowers, who provided formatting assistance.
Finally, we are indebted to the many individuals who participated in the study. CARE field staff provided useful and nuanced information on the successes and challenges of implementing the intervention. Frontline workers, despite their busy schedules, were willing participants and provided detailed insights into the training they received and the services they provided. Finally, we are grateful to the beneficiaries who took part in our household survey. We thank them in particular for sharing with us experiences that were personal and sensitive in nature and for being so generous with their time, on which we know there were many demands.
iii

This page has been left blank for double-sided copying.

CONTENTS MATHEMATICA POLICY RESEARCH
CONTENTS
EXECUTIVE SUMMARY .............................................................................................................................. xi
I INTRODUCTION .............................................................................................................................. 1
A. Description of the ICT intervention ............................................................................................ 2
B. Program logic for the ICT-CCS intervention .............................................................................. 8
C. Literature review ...................................................................................................................... 10
D. Key research questions ........................................................................................................... 13
E. Road map for the report .......................................................................................................... 14
II STUDY DESIGN, DATA, AND ANALYTIC APPROACH ............................................................... 15
A. Study design ............................................................................................................................ 15
B. Sample and data ..................................................................................................................... 16
C. Analytic approach to estimating impacts ................................................................................. 18
D. Qualitative process study ........................................................................................................ 19
III FINDINGS ON THE IMPLEMENTATION OF THE ICT INTERVENTION ..................................... 21
A. ICT training and FLW understanding of how to use the ICT-CCS phone ............................... 21
B. Technological and logistical challenges in using the tool ........................................................ 32
IV FINDINGS FROM THE FLW SURVEYS ....................................................................................... 35
A. Baseline equivalence of treatment and control FLWs ............................................................. 35
B. Impact of the intervention on coordination between ASHAs and AWWs ................................ 38
C. Impact of the intervention on job confidence ........................................................................... 40
D. Impact of the intervention on supervision provided to ASHAs and AWWs ............................. 42
E. Summary of findings from FLW surveys ................................................................................. 44
V FINDINGS FROM THE BENEFICIARY SURVEY ......................................................................... 45
A. Baseline equivalence ............................................................................................................... 45
B. Endline sociodemographic characteristics .............................................................................. 47
C. Impacts on FLW-beneficiary interactions ................................................................................ 49
D. Impacts on mothers’ knowledge .............................................................................................. 53
E. Impacts on health behaviors.................................................................................................... 55
F. Variation in impacts by subgroup ............................................................................................ 66
G. Comparison with findings from the overall midline evaluation ................................................ 71
v

CONTENTS MATHEMATICA POLICY RESEARCH
VI CONCLUSION ............................................................................................................................... 75
REFERENCES ............................................................................................................................................ 79
APPENDIX A: TECHNICAL APPENDIX ................................................................................................ A.1
APPENDIX B: COST AND COST-EFFECTIVENESS ANALYSIS ........................................................ B.1
vi

TABLES MATHEMATICA POLICY RESEARCH
TABLES
1 Impacts on FLW performance (percentages unless otherwise indicated) ...................................... xv
2 Impacts on key health behaviors, by domain (percentages unless otherwise indicated) .............. xix
I.1 Evaluations of mHealth interventions in the literature .................................................................... 12
II.1 Endline sample sizes and response rates ..................................................................................... 18
III.1 Data sources for implementation analysis ..................................................................................... 21
III.2 Training provided to ASHAs and AWWs (percentages unless otherwise indicated) ..................... 22
III.3 ASHA and AWW understanding and use of the ICT tool (percentages unless otherwise indicated) ........................................................................................................................................ 24
III.4 Household reports of use of the ICT tool (percentages unless otherwise indicated) .................... 27
III.5 ANM and LS understanding and use of the ICT tool (percentages unless otherwise indicated) ........................................................................................................................................ 29
III.6 Relationship between FLW characteristics and understanding, use, and perceptions of the ICT tool (percentages unless otherwise noted) ....................................................................... 30
III.7 Challenges of using the ICT-CCS phone (percentages unless otherwise indicated) .................... 33
IV.1 Baseline performance of treatment and control FLWs (percentages unless otherwise indicated) ........................................................................................................................................ 37
IV.2 Background characteristics of FLWs (percentages unless otherwise indicated)........................... 39
IV.3 Coordination between ASHAs and AWWs (percentages) ............................................................. 40
IV.4 FLW job confidence (percentages) ................................................................................................ 41
IV.5 ASHA and AWW reports of supervision they received (percentages unless otherwise indicated) ........................................................................................................................................ 43
IV.6 ANM reports of supervision provided to ASHAs and AWWs (percentages unless otherwise indicated) ....................................................................................................................... 44
V.1 Baseline differences in characteristics and outcomes between treatment and control beneficiaries (percentages unless otherwise indicated) ................................................................ 46
V.2 Endline demographic and socioeconomic characteristics of beneficiary respondents (percentages unless otherwise indicated)...................................................................................... 48
V.3 Impacts on FLW interactions with beneficiaries and advice received by beneficiaries (percentages unless otherwise indicated)...................................................................................... 49
V.4 Impacts on FLW interactions: features of interactions (percentages unless otherwise indicated) ........................................................................................................................................ 54
V.5 Impacts on mother’s knowledge (percentages unless otherwise indicated) .................................. 56
V.6 Impacts on antenatal care and delivery preparation (percentages unless otherwise indicated) ........................................................................................................................................ 58
vii

TABLES MATHEMATICA POLICY RESEARCH
V.7 Impacts on delivery, newborn, and postnatal care (percentages unless otherwise indicated) ........................................................................................................................................ 59
V.8 Impacts on child nutrition, for children 6 months or older (percentages unless otherwise indicated) ........................................................................................................................................ 61
V.9 Impacts on child immunizations, for children 6 months or older (percentages unless otherwise indicated) ....................................................................................................................... 63
V.10 Impacts on reproductive health (percentages unless otherwise indicated) ................................... 64
V.11 Impacts by demographic and socioeconomic subgroups .............................................................. 68
V.12 Impacts by FLW subgroups ........................................................................................................... 69
V.13 Levels of and impacts on key outcomes in the ICT-CCS study and Ananya midline evaluation (percentages unless otherwise indicated) .................................................................... 72
A.1 Stratified randomization of subcenters in Saharsa ....................................................................... A.3
B.1 Upfront Costs of ICT-CCS Intervention…… .... ……………………………………………………….B.5
B.2 Operating Costs of ICT-CCS Intervention ..................................................................................... B.6
B.3 Impacts and cost effectiveness for key health behaviors, by domain ........................................... B.9
viii

FIGURES MATHEMATICA POLICY RESEARCH
FIGURES
I.1 Areas addressed by the ICT-CCS intervention across the continuum of care ................................ 3
I.2 ASHA/AWW ICT-CCS mobile phone ............................................................................................... 6
I.3 ANM/LS ICT-CCS mobile phone ..................................................................................................... 8
I.4 Logic model for ICT-CCS intervention ............................................................................................. 9
ix

This page has been left blank for double-sided copying.

EXECUTIVE SUMMARY MATHEMATICA POLICY RESEARCH
EXECUTIVE SUMMARY
The Information and Communication Technology (ICT) Continuum of Care Services (CCS) intervention was conceptualized and implemented by CARE as part of the Ananya program in Bihar.1 The intervention involves the provision of ICT-enabled mobile-phone-based tools for frontline workers (FLWs) that aim to increase the coverage and quality of services that FLWs provide, enhance their communication with beneficiaries, and facilitate supervision (Box 1 summarizes the features of the ICT-CCS tool).
The ICT-CCS phone for accredited social health activists (ASHAs) and anganwadi workers (AWWs), the FLWs who interact closely with the beneficiaries at the community level, combines registration of beneficiaries, scheduling of home visits, and guided protocols along with audiovisual job aids. Client information, including registration and subsequent visits, entered by FLWs is processed by a back-end server that manages the scheduling of home visits for each pregnant woman and mother with young children in the FLW’s coverage area and provides FLWs with reminders about the timing of home visits. The tool includes checklists of information to gather from and provide to beneficiaries during home visits, and also includes videos to communicate health-related information during these visits.
In the absence of this ICT-enabled tool, ASHAs and AWWs are expected to use paper-based home visit registers provided by the core Ananya program to track the timing of visits, and access other job aid tools Ananya provides to facilitate communication with households. The logic underlying the ICT-CCS intervention is that, once FLWs become proficient in using the mobile tool, it will increase contacts between FLWs and households and lead to increased coverage compared with the paper-based tools. The additional features of the tool, such as checklists and videos, are also intended to lead to improvements in communication with households, beyond those created by the core Ananya program’s job aid tools.
An additional ICT-enabled phone provided to auxiliary nurse midwives (ANMs) and lady supervisors (LSs), who supervise ASHAs and AWWs respectively, aims to improve oversight and supervision. It tracks progress on home visits and synthesizes information on key health indicators such that ANMs and LSs can provide targeted feedback to ASHAs and AWWs based on real-time data. The intervention was introduced to ASHAs and AWWs first, in mid-2012. ANMs and LSs were integrated into the rollout in early 2013.
1 The Ananya program was created by the Bill & Melinda Gates Foundation with the long-term goal of reducing the rates of maternal, newborn, and child mortality; fertility; and child under-nutrition in Bihar. The program funds an integrated set of grants to improve health outcomes for young children and their mothers through interventions at the household, community, health facility, and provider levels. The implementation of the Ananya program began in late 2011 with a set of interventions that was initially implemented in eight focus districts—including Saharsa district, the location for this study. The program evolved over time, and in late 2013 the foundation created a technical support unit to support the scale-up of selected Ananya interventions across the state and engage in broader efforts to strengthen Bihar’s public health system through 2017.
xi

EXECUTIVE SUMMARY MATHEMATICA POLICY RESEARCH
We conducted a rigorous evaluation of the impacts of the ICT-CCS intervention through a clustered randomized controlled trial (RCT) in Saharsa district of Bihar. The pilot intervention began in mid-2012. The RCT involved randomly assigning 70 health subcenters to a treatment group of 35 subcenters that received the intervention and a control group of 35 subcenters that did not. The RCT enabled us to measure the value-added of the ICT-CCS tool beyond the core Ananya program interventions, which were implemented simultaneously in both the treatment and the control group.2 Specifically, the evaluation sought to address the following research questions:
• What was the ICT-CCS intervention, and how was it implemented? To what extent did FLWs understand how to use the new ICT-based tools? What were the practical challenges or barriers to using the tools?
• What was the impact of the ICT-CCS intervention on FLW-household interactions? Did ICT-based tools lead to an improvement in the quantity and quality of FLW-household interactions?
2 Some of the other key Ananya interventions included: (1) promoting a complete enumeration and mapping of beneficiaries by FLWs; (2) providing FLWs with a paper-based home visit planner to schedule home visits to each beneficiary at the appropriate times; (3) convening and supporting monthly subcenter meetings at which FLWs were trained on maternal and child health topics; (4) conducting interpersonal communication (IPC) trainings for FLWs on how to persuade households to adopt key health behaviors; (5) providing FLWs with job aid tools, including a Mobile Kunji (a tool that comprises a set of plastic cards to illustrate key health practices as well as audio recordings on health messages by a fictional character called Dr. Anita), a spoon and bowl to demonstrate complementary feeding, a uterus model, Copper-T intrauterine device (IUD), and Mala-D contraceptive pills to facilitate family planning discussions, as well as other objects that can be used to explain family health messages; (6) mass-media interventions to directly disseminate health messages to households; and (7) facility-based interventions to improve the conditions and quality of care at health facilities at which deliveries are conducted.
Box 1. The features of the ICT CCS tool include: 1. Features to record and maintain a comprehensive list of beneficiaries, as well as improve the
regularity and timeliness of home visits a. Registration and tracking of beneficiaries b. Automatic scheduling of home visits for each beneficiary, with reminders provided to FLW to conduct
these visits c. Automatically generated list of children due for immunizations
2. Features to improve the quality of information provided and records maintained a. Interactive checklists to provide health messages and record health information b. Animated videos embedded in the checklists to communicate health messages c. Tools to facilitate computation of expected date of delivery and body mass index
3. Features to facilitate coordination, self-performance assessments, and oversight a. Synchronization of beneficiary records and home visit schedule across FLWs serving the same
catchment area b. Summary of FLW performance generated for self-review c. Additional phones for FLW supervisors to monitor FLW performance based on data generated from
FLW phones
xii

EXECUTIVE SUMMARY MATHEMATICA POLICY RESEARCH
• Did the intervention lead to improvements in maternal and child health outcomes among beneficiaries? Did ICT-based tools lead to improvements in key health outcomes across the family health continuum? If so, were these improvements larger for certain subgroups of the population than for others?
To address these questions, we used a mixed-methods approach, which collected and analyzed quantitative and qualitative data. The quantitative approach used an RCT design to examine whether the intervention led to changes in how FLWs provided services and in beneficiary behaviors and practices, based on data from surveys conducted with about 650 FLWs and 1,550 beneficiaries in mid-2014, approximately two years after the introduction of the intervention. The qualitative analysis examined questions related to the implementation of the program based on field visits and semistructured interviews with implementing partner staff, FLWs, and beneficiaries. Next, we summarize our key findings from the evaluation, starting with a description of how the FLWs used the ICT-CCS tool, followed by a summary of the impacts of the intervention on FLW-household interactions and beneficiary behaviors and practices.
FLW understanding of the ICT-CCS tool increased over time, the result of an intensive training effort by CARE
Qualitative interviews with FLWs and demonstrations that we requested in the FLW endline survey suggest a high level of understanding by FLWs about how to use the home visit scheduling feature of the ICT-CCS phone. Their level of understanding increased markedly in the second year of implementation, as did their understanding of how to use the checklists included in the tool. Achieving this required an intensive effort from CARE, with ongoing training and mentoring activities both inside and outside formal subcenter meetings. Formal trainings consisted of 16 sessions of approximately 3 hours each that were held at the subcenter over a period of 8 weeks, which instructed FLWs in the basic use of the tool and its various modules. Informal mentoring involved CARE staff visiting FLWs who were identified as having difficulty in the formal training sessions and providing them with additional instruction to bring them up to the level of understanding of the other FLWs before the next training session.
In our endline surveys with FLWs, more literate and younger FLWs were significantly more likely to understand the tool as measured by their familiarity with a color scheme used to classify beneficiaries by the stage of pregnancy or age of the child. The level of understanding of the supervisory ICT-CCS phones by FLW supervisors was more limited (about half the supervisors surveyed at endline were unable to log into their phone or open the records of home visits conducted by the FLWs they were supervising).
FLWs use of different features of the ICT-CCS tool varied
More than half the FLWs in treatment areas surveyed at endline reported using features of the phone such as the form for registering beneficiaries (which provides input into the automatically generated home visit schedule) and the automated list of children due for immunizations. However, reported use of some other features of the phone, such as the form for self-monitoring of performance, was lower. Further, although two-thirds of FLWs surveyed at endline reported relying on the home visit scheduler to coordinate with each other, qualitative data suggest that technological issues, a lack of teamwork, and limited FLW capabilities all posed a challenge to coordination.
xiii

EXECUTIVE SUMMARY MATHEMATICA POLICY RESEARCH
In addition, household reports at endline suggested that overall exposure to some of the ICT-CCS tool features in the catchment areas of the treatment subcenters was limited (though we cannot rule out that this could partly reflect recall problems). For example, only 18 percent of beneficiaries in treatment areas reported that an FLW read out a list of questions and reminders from her phone (that is, the checklists) during a home visit. Similarly, only about 20 percent of households in treatment areas reported that they had ever seen an FLW use a video on her phone to explain health information.
FLWs experienced some technical and logistical challenges in using the ICT-CCS tool
Technological issues were caused mainly by poor internet connectivity on the mobile phone, because synchronizing records with the main server requires a strong connection. Around 20 percent of endline FLW survey respondents said they had a poor signal (or no signal at all), which sometimes led to inconsistencies in home visit schedules for FLWs in the same catchment area. Delays in receiving funds for internet charges (which were provided by the intervention) were mentioned as a problem by 17 percent of endline FLW survey respondents, while CARE’s monitoring data suggested that about 14 percent of phones were not in good working order when we conducted our endline.
In addition, although the ICT-CCS tool was designed to relieve the burden on FLWs of having to complete multiple paper-based government registers, FLWs were still required to fill out several of these government registers over the evaluation period (though they no longer had to complete the Ananya paper-based home visit planner). Therefore, some FLWs interviewed for the implementation study felt that the ICT-CCS tool had increased their workload, as they now had to complete both the electronic and the paper-based registers. However, this may not be the case if the intervention is scaled up and eventually replaces paper-based government registers. Nevertheless, FLWs indicated that being able to use the ICT-CCS tool rather than the Ananya paper-based home visit planner was an important benefit of the tool; in particular, the ICT-CCS tool greatly reduced the time and effort required to plan the schedule of home visits by automating this process based on registration information from beneficiaries.
The intervention led to some improvement in coordination of home visits by FLWs and an increase in job confidence; however, it did not result in much improvement in FLW supervision
ASHAs and AWWs in treatment areas were more likely than those in control areas to report that they coordinated home visits with the opposite-cadre FLW serving the same beneficiaries (Table 1), though not all impacts were statistically significant. For example, an ASHA or AWW was more likely to be asked by the opposite-cadre FLW to conduct a home visit when the opposite-cadre was unable to do so (60 percent in treatment areas compared to 46 percent in control areas). This is consistent with the ICT-CCS tool’s emphasis on helping to coordinate home visits for FLWs serving a given catchment area, and is observed despite some of the technical challenges noted earlier in synchronizing home visit records across ASHAs and AWWs.
FLW reports also suggest that the ICT-CCS tool increased their confidence in their ability to perform their jobs. Specifically, ASHAs and AWWs were significantly more likely to report that they thought they had all the necessary skills for their jobs (38 percent in treatment areas, compared to 28 percent in control areas). Further, ANMs were significantly more likely to run
xiv

EXECUTIVE SUMMARY MATHEMATICA POLICY RESEARCH
Table 1. Impacts on FLW performance (percentages unless otherwise indicated)
Endlinecontrol mean
Adjusted endline
treatment mean
Adjusted endline
difference p-Value
Coordination Between ASHAs and AWWs ASHA/AWW asked opposite-cadre FLW to conduct a home visit
when unable to (in past 30 days) 51.8 59.4 7.6 0.167 ASHA/AWW asked by opposite-cadre FLW to conduct a home visit
when they were unable to (in past 30 days) 45.6 59.8 14.2** 0.018 ASHA/AWW met with opposite-cadre FLW to talk about work or
home visits in past 7 days 65.1 71.0 5.9 0.234 ASHA/AWW conducted at least one home visit jointly with opposite-
cadre FLW in the past 7 days 47.2 55.3 8.2 0.135
FLW Job Confidence ASHA/AWW feels they have all skills needed for job 27.7 38.0 10.3** 0.039 ANM ran last subcenter meeting by herself 69.0 89.2 20.1** 0.019 ANM reports needing more skills to lead subcenter meetings 42.9 39.5 -3.4 0.763
Supervision of ASHA/AWW, Reported by ASHA/AWW ASHA/AWW met with supervisor in past three months outside
subcenter meeting 98.6 98.2 -0.4 0.754 Number of times ASHA/AWW met with supervisor in past three
months outside subcenter meeting (average) 3.7 3.8 0.1 0.715 Number of times ASHA/AWW met with supervisor in past six
months outside subcenter meeting (average) 6.9 6.9 0.0 0.892
Supervision of ASHA/AWW, Reported by ANM Times per month ANM meets with ASHAs outside subcenter
meeting (average) 6.2 6.5 0.3 0.855 Times per month ANM meets with AWWs outside subcenter
meeting (average) 4.6 3.4 -1.3 0.197 Number of times accompanied ASHA and observed home visits in
past 30 days (average) 2.4 3.0 0.6 0.334 Number of times accompanied AWW and observed home visits in
past 30 days (average) 1.2 1.4 0.1 0.733 Home visit registers or work phones reviewed at subcenter meeting
By ANM alone 61.9 70.8 8.9 0.406 By ANM and CARE facilitator 28.6 20.1 -8.4 0.344 By CARE facilitator alone 0.0 9.1 9.1* 0.078 By no one 9.5 0.0 -9.5** 0.043
Source: ICT RCT endline ASHA, AWW, and ANM surveys conducted by Sambodhi in collaboration with Mathematica in mid-2014.
Notes: Sample sizes for ASHA/AWW analysis are 256 ASHAs and AWWs in control areas and 316 ASHAs and AWWs in treatment areas. Adjusted treatment mean, difference, and p-values for ASHA/AWW analysis are derived from regression controlling for random assignment strata, FLW cadre (ASHA or AWW), FLW demographic characteristics (whether FLW is a resident of the village she serves, age, religion, SC/ST status, and literacy [as determined by ability to read a passage]), and catchment area characteristics (whether women in the area are predominantly SC/ST or Muslim), and the interaction between each variable for strata, FLW characteristics, and catchment area characteristics with FLW cadre.
Sample sizes for ANM analysis include 42 ANMs in control areas and 37 ANMs in treatment areas. Adjusted treatment mean, difference, and p-value for ANM analysis are derived from regression controlling for random assignment strata.
Item-specific nonresponse might limit the sample size for some comparisons. All standard errors correct for clustering at the subcenter level.
*/**/*** Significantly different from zero at the .10/.05/.01 level, two-tailed test.
xv

EXECUTIVE SUMMARY MATHEMATICA POLICY RESEARCH
subcenter meetings (introduced as part of the broader Ananya program) by themselves without assistance from CARE staff (89 percent in treatment areas, compared to 69 percent in control areas).
However, FLW reports did not suggest any substantial improvements in ANM supervision of ASHAs and AWWs outside of subcenter meetings, which was one of the aims of providing the supervisory mobile tool to the ANM. At endline, almost all ASHAs and AWWs in treatment and control areas reported some interaction with the ANM outside of subcenter meetings. However, the frequency of interactions were very similar in the treatment and control areas, whether we examine ASHA/AWW reports or ANM reports (although small sample sizes limited our ability to estimate impacts on ANM behavior, levels of supervision-related outcomes were generally very similar in the treatment and control groups). There was also no evidence that ANMs increased their direct supervision of home visits by accompanying ASHAs and AWWs on these visits. In addition, review of home visit registers or phones during subcenter meetings by ANMs was similar in the treatment and control groups (reported by about 90 percent of ANMs), though the involvement of CARE in these reviews varied.
The ICT-CCS intervention improved the frequency of FLW-beneficiary interactions, and some measures of the quality of interactions
The percentage of beneficiaries reporting that they received visits from an FLW at critical times during pregnancy and early childhood was significantly higher in the treatment group relative to the control group for several types of visits (Figure 1). At endline, 52 percent of the treatment group reported receiving two or more FLW home visits in the final trimester, compared to 42 percent of the control group. Although there was no significant impact on home visits within the first 24 hours after delivery or returning from a facility, there were significant impacts on home visits within the first week and month after delivery. Specifically, about 73 percent of the treatment group reported a visit by the ASHA or AWW in the first week after delivery, compared to 60 percent of the control group. There was also a significant impact on visits in the first month after delivery, reported by 74 percent of the treatment group and 67 percent of the control group. Further, visits related to complementary feeding for children 5 months or older were reported by 45 percent of beneficiaries in the treatment group, compared to 36 percent of the control group. However, there were no significant differences between the treatment and control groups in home visits related to family planning. This could be because messages about family planning were integrated into other types of visits; the ICT-CCS tool did not provide for specific visits around family planning.
xvi

EXECUTIVE SUMMARY MATHEMATICA POLICY RESEARCH
Figure 1. Impacts on FLW home visits reported by beneficiaries (percentages unless otherwise indicated)
Source: Ananya ICT RCT endline beneficiary survey conducted by Sambodhi in collaboration with Mathematica in mid-2014.
Notes: Treatment means are adjusted using ordinary least squares regressions that control for stratum-fixed effects; indicators of demographic characteristics (SC/ST, Hindu, number of children, woman’s age, woman’s literacy, socioeconomic status (SES) quartile, and indicators for missing values for each characteristic), and subcenter-level baseline means of the outcome (when available). Significant levels are based on p-values that account for clustering of standard errors at the subcenter level. Sample sizes are 1,527 to 1,553 (all women) and 1,045 (children 5 months or older).
*/**/*** Significantly different from zero at the .10/.05/.01 level, two-tailed test.
We also examined impacts on several measures that could reflect the quality of FLW-beneficiary interactions: (1) receipt of targeted advice from FLWs; (2) duration of home visits; (3) use of Ananya job tools in home visits; and (4) discussions with other household members who could affect women’s health behaviors in the Bihar social context, namely the husband and the mother-in-law. These measures are likely to be correlated with interaction quality, though not perfectly so, and could also be imprecise because of recall error. Therefore, they should be viewed as suggestive of improved quality; by examining multiple measures, we aimed to provide a broad analysis of quality.
The evidence of impacts on the quality of FLW-beneficiary interactions based on these measures was mixed (not shown). Beneficiaries in the treatment areas were significantly more likely than those in control areas to receive advice from FLWs on certain topics. Specifically, they were more likely to receive advice on exclusive breastfeeding and on a range of topics related to complementary feeding, including on the timing of initiation of feeding, the appropriate type of food, and the frequency and quantity of feeding. However, treatment-control differences for receipt of advice on other antenatal (such as delivery preparation) and newborn care topics (such as identifying infant danger signs, clean-cord care, and skin-to-skin care) were not significantly different. Beneficiaries in the treatment group were significantly more likely than control group members to report that an FLW ever used the various job aid tools included as part of the overall Ananya program to help promote behavior change during home visits (these impacts varied from 4 to 18 percentage points, and were largest for the Ananya Mobile Kunji tool and the bowl/spoon used to demonstrate complementary feeding). Finally, there was no
42 39
6067
3627
52**43
73*** 74*
45**
29
01020304050607080
At least two homevisits in final
trimester
Home visit within 24hours of delivery
Home visit within 1week of delivery
Home visit within 1month of delivery
Complementaryfeeding home visit(child 5 months or
older)
Family planninghome visit
Control Treatment (regression adjusted)
xvii

EXECUTIVE SUMMARY MATHEMATICA POLICY RESEARCH
significant treatment-control difference in average FLW visit duration, or on whether the FLW spoke to the woman’s husband or mother-in-law in the most recent visit.
The ICT-CCS intervention had significant impacts on some but not all health behaviors across the continuum of care, especially in the antenatal care, nutrition, and reproductive health domains.
The significant impacts of the ICT-CCS intervention on FLW-beneficiary interactions were accompanied by statistically significant impacts on health behaviors in several domains (Table 2). Many of these health behaviors were at relatively low levels in our baseline sample, with behaviors in several domains adopted by less than half of the sample (especially in the antenatal care, newborn care, and reproductive health domains), and those in other domains higher but still far from universal adoption (for example, in the child nutrition and immunization domains). This suggests that there was broad scope for improvements in behaviors across the continuum of care, some of which materialized as a result of the intervention. The impacts of the intervention on health behaviors in various domains were not systematically accompanied by impacts on knowledge of the relevant behaviors (not shown), suggesting that other barriers to practice adoption besides a lack of knowledge may be important in this context. For example, by increasing the frequency of contacts between FLWs and beneficiaries, the tool may have reinforced the importance of certain behaviors that beneficiaries were reluctant to adopt for reasons such as cost or cultural norms.
In the antenatal care domain, there were significant impacts on receipt of at least 3 antenatal care visits (50 percent in the treatment group, compared to 29 percent in the control group) and consumption of at least 90 IFA tablets (17 percent of the treatment group, compared to 11 percent of the control group). There were also significant impacts on some measures of birth preparedness practices to facilitate facility delivery, such as obtaining the phone number of an ambulance, private vehicle, or the FLW. However, we found no significant impacts of the ICT-CCS intervention on most recommended behaviors in the delivery and newborn care domain, including facility delivery, applying nothing to the cord or umbilicus, and delayed bathing. The two behaviors that did show a significant impact in this domain were immediate breastfeeding (76 percent in the treatment group, compared to 62 percent in the control group) and skin-to-skin care (65 percent in the treatment group, compared to 58 percent of the control group).
There were also significant impacts in the child nutrition domain. We found that 64 percent of the treatment group reported that children 6 months or older eat solid or semisolid food, compared to 55 percent of the control group. There was also a significant impact on the timely introduction of complementary feeding, with about 41 percent of the treatment group reporting that the child started eating solid food by age 6 months, compared to 32 percent of the control group. Examining the nature of infant feeding in more detail, there was a statistically significant impact on the appropriate frequency of feeding, but not on the appropriate quantity of feeding or food diversity (not shown).
xviii

EXECUTIVE SUMMARY MATHEMATICA POLICY RESEARCH
Table 2. Impacts on key health behaviors, by domain (percentages unless otherwise indicated)
Endline control mean
Adjusted endline
treatment mean
Adjusted endline
difference p-Value
Antenatal Care At least 3 ANC visits 28.8 49.8 21.1*** 0.000 At least 2 TT injections 89.3 94.0 4.7** 0.035 At least 90 IFA tablets consumed 10.9 17.2 6.3*** 0.003 Obtained telephone number of ambulance, private vehicle, or
FLW for delivery 40.2 49.3 9.1** 0.025
Delivery and Newborn Care Facility delivery 83.9 85.1 1.2 0.586 Nothing applied to cord and umbilicus 32.5 32.4 -0.1 0.976 Bath delayed by at least 2 days 47.6 45.7 -1.9 0.607 Immediate breastfeeding 62.2 75.9 13.7*** 0.000 Skin-to-skin care 57.8 65.2 7.4* 0.073 Exclusive breastfeeding in past 24 hours (children younger than
6 months)a 70.0 64.8 -5.3 0.211
Child Nutrition (child 6 months or older) Child eats solid or semisolid food 54.7 63.6 8.8* 0.055 Child began eating solid food by age 6 months 31.8 41.0 9.1** 0.039
Immunization (child 6 months or older) Received DPT3 76.7 77.7 0.9 0.783 Fully immunized (except measles) 55.3 59.1 3.8 0.292
Reproductive Health Use of permanent methods of contraception 17.8 24.2 6.4** 0.023 Use of temporary methods of contraception (ever)b 22.0 29.0 7.1** 0.040 Use of any modern method of contraception (ever)c 32.4 43.3 10.9*** 0.002 Use of temporary methods of contraception (current)b 10.6 11.5 0.8 0.689 Use of any modern method of contraception (current)c 28.5 35.8 7.3** 0.027
Source: Ananya ICT RCT endline beneficiary survey conducted by Sambodhi in collaboration with Mathematica in mid-2014. Notes: Treatment means and treatment-control differences are adjusted using ordinary least squares regressions that control
for stratum-fixed effects; indicators of demographic characteristics (SC/ST, Hindu, number of children, woman’s age, woman’s literacy, SES quartile, and indicators for missing values for each characteristic); and subcenter-level baseline means of the outcome (when available). Reported p-values account for clustering of standard errors at the subcenter level. Sample sizes are 1,480 to 1,553 (all women), 593 (children less than 6 months), and 927 (children 6 months or older). Table II.1 provides response rates by treatment and control group.
a Based on reports of liquids and solids fed to children younger than 6 months in the previous 24 hours, following the recommended definition of the World Health Organization. b Defined as use of birth control pills, condoms, injectables, or an IUD. c Defined as use of male or female sterilization, birth control pills, condoms, injectables, or an IUD. */**/*** Significantly different from zero at the .10/.05/.01 level, two-tailed test.
In the reproductive health domain, there was a significant impact on the probability of using permanent methods of contraception (24 percent of the treatment group, compared to 18 percent of the control group). There was also a significant impact on having ever used temporary modern methods of contraception (which we define as birth control pills, condoms, injectables, or an IUD), but not on current use of these methods as of the survey date. This suggests that beneficiaries may have been using these temporary methods in an inconsistent manner. Overall, xix

EXECUTIVE SUMMARY MATHEMATICA POLICY RESEARCH
43 percent of women in the treatment group reported having ever used any modern method of contraception (permanent or temporary), compared to 32 percent in the control group. The difference for current use of any modern method was smaller but still significant, with 36 percent of women in the treatment group and 29 percent in the control group using them, a difference driven almost entirely by permanent methods. Finally, in the immunization domain, we found no evidence of statistically significant differences between the treatment and control groups in receipt of routine immunizations.
Our findings are broadly consistent with those from the midline evaluation of the core Ananya program, which was evaluated across 8 districts in Bihar—including Saharsa—after two years of implementation (Borkum et al. 2014b). That evaluation also found significant impacts on the frequency of FLW-household interactions, as well as impacts on similar health-related outcomes (several outcomes related to the antenatal and newborn care, introduction of complementary feeding, and use of modern methods). This suggests that the ICT-CCS intervention may have bolstered the effects of the overall program, but could not effect change to behaviors that were not responsive to the core Ananya program (for example, facility delivery and immunizations, both of which are incentivized by the government and were already at relatively high coverage levels prior to the Ananya program).
There was some evidence of stronger impacts for beneficiaries belonging to scheduled castes or tribes, and for beneficiaries served by FLWs of the same scheduled caste or tribe status
We also examined the variation in impacts for key outcomes by various demographic and socioeconomic subgroups of beneficiaries (scheduled caste/tribe [SC/ST], socioeconomic status, literacy, and parity) as well as subgroups defined by the characteristics of FLWs (age and literacy, which could affect their level of comfort with and use of the ICT-CCS tool). In addition, we examined differences in impacts for SC/ST beneficiaries based on whether they were likely to be served by an SC/ST FLW (which might be expected to facilitate better FLW-beneficiary interactions for these beneficiaries given possible marginalization of SC/ST beneficiaries).
There was some suggestive evidence of a pattern of larger and more strongly significant positive impacts for beneficiaries belonging to scheduled castes or tribes. However, the difference in impacts relative to those for non-scheduled castes or tribes was only significant for two outcomes, FLW visits during pregnancy and use of any modern methods of contraception (not shown). There was some difference in impacts by caste affinity for SC/ST women, with significantly larger impacts for some outcomes if they were more likely to be served by an SC/ST FLW (not shown). The pattern for other outcomes and subgroups was inconsistent, and provided little evidence of systematic differences in impacts along these dimensions (for example, there were few consistent or statistically differences in impacts by other beneficiary characteristics besides caste, or by the age or literacy of FLWs likely to be serving a given beneficiary).
Further strengthening of the use of certain features of the ICT-CCS tool could be valuable if the intervention scales up.
xx

EXECUTIVE SUMMARY MATHEMATICA POLICY RESEARCH
Our evaluation, which gauged impacts two years after the start of the intervention, showed strong impacts on FLW-beneficiary interactions and beneficiaries’ health behaviors. This is despite the fact that some features of the ICT-CCS tools were not utilized to the extent envisaged. For example, use of the tool’s checklists and videos during home visits as recalled and reported by beneficiaries in the treatment areas was limited, use of the supervisory aspects of the tool and impacts on supervision were also limited, and internet connectivity problems posed some challenges to the synchronization of home visit records across FLWs. In addition, FLWs (especially AWWs) did not fully benefit from a reduction in their workload by consolidating all record collection into the ICT-CCS tool, because they still had to fill out mandated paper-based government registers over the evaluation period (though replacing the paper-based Ananya home visit planner was an important benefit).
The fact that significant impacts were observed despite these limitations suggests that there is potential for even greater impacts if all the features of the tool such as the checklists, videos, and supervisory applications are fully taken advantage of (although we cannot be certain of this based on the results of the study alone). Focusing on strengthening the use of these other features of the tool could be an important aspect of the scale-up phase. Also relevant to scale-up, our findings suggest that it will be important to try to resolve some of the technical issues that limit the use of the tool (particularly with regard to synchronization of beneficiary records); having an effective mechanism for FLWs to access to resolve broader technical issues will also be important. In addition, it will be critical to ensure that sufficient training is provided—our qualitative study indicated that intensive training was required to familiarize the FLWs with the tool, including informal one-on-one support for FLWs who required it.
To further inform scale-up of the intervention in Bihar (and possibly elsewhere), we conducted a cost analysis of the ICT-CCS tool based on implementation costs obtained from CARE. This analysis suggests that, provided the existing technology can be used as is with little additional cost, expanding the ICT intervention would cost about USD 112.85 per FLW (USD 5.66 per beneficiary) to set up initially, and about USD 72.24 per FLW per year (USD 3.62 per beneficiary per year) in operating costs. In addition, about USD 69.53 per FLW (USD 3.49 per beneficiary) would have to be spent approximately every three years to replace mobile phones. These cost estimates are based on several assumptions and should be viewed as approximate; nevertheless, they are useful in providing a broad sense of the magnitude of the costs of implementation.
xxi

This page has been left blank for double-sided copying.

I. INTRODUCTION MATHEMATICA POLICY RESEARCH
I. INTRODUCTION
The Bill & Melinda Gates Foundation created the Ananya program to address important family health challenges in Bihar, one of India’s poorest and most populous states. Ananya started as a five-year program (2011–2015) with the long-term goals of reducing the rates of maternal, newborn, and child mortality; fertility; and child under-nutrition in Bihar. The program funds an integrated set of grants to improve health outcomes for young children and their mothers through interventions at the household, community, health facility, and provider levels. The implementation of the Ananya program began in late 2011, with a set of interventions that was initially implemented in eight focus districts in western and central Bihar. The program evolved over time, and in late 2013 the foundation created a technical support unit to support the scale-up of selected Ananya interventions across the state and engage in broader efforts to strengthen Bihar’s public health system through 2017.
The Information and Communication Technology (ICT) Continuum of Care Services (CCS) intervention was implemented by CARE as part of Ananya’s Integrated Family Health Initiative grant. The intervention was implemented starting in mid-2012 in selected areas of Saharsa, one of the Ananya focus districts, as a supplement to the core package of interventions that was implemented throughout the district under the broader Ananya program.
The intervention involves the provision of an ICT-enabled mobile-phone-based tool for frontline workers (FLWs) that combines registration of beneficiaries, scheduling of home visits, and guided protocols along with audiovisual job aids. The intent of the intervention is to increase the coverage and quality of services provided by FLWs, enhance their communication with beneficiaries, and facilitate supervision. Client information entered by FLWs is processed by a back-end server that manages the scheduling of home visits for each pregnant woman and mother with young children in the FLW’s coverage area and provides FLWs with reminders about the timing of home visits. The ICT-CCS tool also includes checklists of information to gather from and provide to beneficiaries during home visits, and includes videos for communicating health-related information during the visits. The ICT-CCS intervention may lead to gains in efficiency as it provides one tool to FLWs for managing cases, planning and conducting home visits, providing services, and collecting health information. In the absence of the ICT-enabled tool, FLWs can use paper-based home visit registers provided by the core Ananya program to track the timing of visits, and other job-aid tools provided by Ananya to facilitate communication with households.
The logic underlying this innovation is that mobile tools will facilitate greater contacts between FLWs and households and lead to increased coverage of key health behaviors. The additional features of the tool, such as checklists and videos, are intended to lead to further improvements in communication with households, beyond those facilitated by the core Ananya program’s job aid tools.
1

I. INTRODUCTION MATHEMATICA POLICY RESEARCH
This report presents the results of a rigorous impact evaluation of the ICT-CCS intervention in Saharsa using a clustered randomized controlled trial (RCT) design that randomly assigned health subcenters in the district to treatment and control groups.3 We estimated the impacts of the intervention by comparing the outcomes of FLWs and households in the treatment and control groups in mid-2014, two years after implementation began. Because the core Ananya program was implemented throughout Saharsa over the evaluation period, the evaluation was designed to measure the value added of the ICT-CCS intervention over the core program. The evaluation also included a qualitative component to better understand the implementation of the intervention and provide context for the estimated quantitative impacts. In the rest of this chapter, we describe the ICT-CCS intervention in detail, illustrate the overall logic underlying the intervention, and set the context for the evaluation by reviewing the relevant literature on similar interventions. We then list the key research questions the evaluation focused on and describe how they were addressed. Finally, we provide a road map for the rest of the report.
A. Description of the ICT intervention
The ICT-CCS intervention was designed to improve several aspects of FLW-household interactions. Specifically, it aimed (1) to increase the regularity and timeliness of home visits made by accredited social health activists (ASHAs) and anganwadi workers (AWWs),4 (2) to improve data-driven monitoring of these visits, (3) to reduce the time FLWs spend on updating multiple paper-based registers,5 and (4) to improve the quality of FLW-household interactions by introducing a checklist of questions combined with interpersonal communication material to guide and enhance these interactions.
The intervention consisted of an ICT-based beneficiary registration and management system to track and support FLWs’ interactions with households from pregnancy through the child’s second birthday to provide information and services across the continuum of family health care
3 The health subcenter, the lowest level of public health facility in Bihar, is intended to provide essential primary health care services, including immunizations, maternal and child health care (such as antenatal checkups and counseling on birth preparedness), family planning services, and drugs for minor ailments. Each subcenter includes several villages (typically five or six) in its catchment area; these villages are served by FLWs, who usually live in the community. 4 ASHAs and AWWs are two types of community-level frontline health workers. AWWs are deployed under the Integrated Child Development Services (ICDS) scheme of the Ministry of Women and Child Development and have traditionally focused on child nutrition. ASHAs are deployed by the National Rural Health Mission of the Ministry of Health and Family Welfare and focus on family health more broadly. One of the goals of the broader Ananya program is to integrate some of the functions of ASHAs and AWWs, who are both located in the community and have immediate access to beneficiaries, so that they can work together in a more coordinated and collaborative manner to provide services at critical junctures across the continuum of care. 5 FLWs are required to maintain registers with records of the services they provide to beneficiaries in their communities. These paper-based registers, most of which are required of AWWs rather than ASHAs, are generally provided by the government and are categorized by a task or service provided. For example, AWWs are expected to record household-level information gathered during the process of enumerating beneficiary households in a survey register, and also update separate registers with information about births and deaths, maternal and child health, immunizations, take-home rations, growth monitoring of children, and so on. These multiple paper-based government registers therefore represent a significant record-keeping burden for AWWs. The core Ananya program that was in place across Saharsa over the evaluation period introduced an additional paper-based register—the home visit planner—to help both ASHAs and AWWs plan their home visits to beneficiaries.
2

I. INTRODUCTION MATHEMATICA POLICY RESEARCH
(Figure I.1). ASHAs and AWWs were provided with ICT-CCS mobile phones in mid-2012, and trained on how to use them to register beneficiaries, facilitate discussions with the households on family health practices, and record information on key practices related to birth preparation, delivery, postnatal care, nutrition, and immunization that beneficiaries had followed. CARE also developed supervisory phones for auxiliary nurse midwives (ANMs), who supervise ASHAs, and lady supervisors (LSs), who supervise AWWs, but these tools were only introduced between February and April 2013.
Two open-source mobile health platforms, CommCare and MoTech, are used to manage this ICT-CCS system. CommCare is the phone-based interface that appears on the phones provided to the ASHAs and AWWs. It is equipped with various forms, checklists, and interpersonal communication tools such as audio, images, and videos to facilitate discussions of appropriate health behaviors with beneficiaries. Beneficiary information entered with CommCare is sent to a central cloud server called CommCare HQ. MoTech is a back-end server that integrates beneficiary data entered in CommCare and manages schedules for each beneficiary, which are then updated on the ASHA and AWW ICT-CCS phones. Below, we describe the features of the ICT-CCS phone, grouped into categories that reflect their intent.
Figure I.1. Areas addressed by the ICT-CCS intervention across the continuum of care
Notes: The horizontal axis shows the number of months relative to the birth of the child. The colored lines denote areas emphasized by the ICT-CCS intervention during each period. Family planning messaging differs based on the stage of pregnancy or the age of the child. Immunization messaging involves the promotion of maternal immunization (tetanus toxoid injections) during pregnancy, and child immunizations after birth.
3

I. INTRODUCTION MATHEMATICA POLICY RESEARCH
1. Features to record and maintain a comprehensive list of beneficiaries, as well as improve the regularity and timeliness of home visits The ICT-CCS tool includes a beneficiary registration form that enables FLWs to register
eligible beneficiaries in their catchment areas and collect relevant background information about them. This information includes key identifiers (such as name and location) and demographic characteristics (such as education and caste), as well as information relevant to the stage at which the beneficiary is registered, which is automatically requested. For example, if the woman is pregnant when she is registered, the phone prompts the FLW to record pregnancy-related information (such as the stage of pregnancy and any complications with the previous pregnancy). This automates much of the FLW’s data collection process, potentially allowing for more accurate and timely recording of information.
A key feature of the ICT-CCS phone is the home visit scheduler, which is intended to ensure that registered beneficiaries receive time-appropriate visits from FLWs. Once a beneficiary is registered by an ASHA or an AWW, the scheduler applies the required periodicity of home visits for that beneficiary based on the stage of pregnancy or child’s age, determines the exact dates on which the woman and her child should be visited, and integrates that schedule into the calendar on the FLW’s phone. Based on this information, the phone sends automated reminders to FLWs regarding which beneficiaries to visit each day and highlights missed visits with an exclamation point against the name of the relevant beneficiary. By having home visits automatically determined, the ICT-CCS tool may decrease slippage in the FLW’s coverage rates. The phone also provides a visual guide to assist FLWs in reviewing their caseload; alongside each name is one of three color-coded boxes, each referring to a certain type of beneficiary (blue for pregnant women, red for women in the critical phase two weeks either side of delivery, and green for women who had delivered more than two weeks ago). This home visit scheduler was intended to function as an alternative to the paper-based home visit planner introduced by the core Ananya program throughout Saharsa (including in the control areas for this study), though the paper-based version was still made available to FLWs in treatment areas if they wished to use it.6
An immunization due list form provides reminders about immunizations. An algorithm compares the schedule for immunizations with information on beneficiaries’ immunization status collected during home visits, and indicates next to each beneficiary’s name the vaccination that is due next and by when. Based on this information, FLWs can inform ANMs which vaccines to bring to the village during the monthly immunization days, and also provide reminders to the relevant beneficiaries about participating in these immunization days.
6 Prior to the introduction of the Ananya home visit planning tools, FLWs use a variety of approaches to identifying which households to visit. For example, some prioritized households based on perceived need (for example, sick newborns), some focused on households that are located closest to them, while others cycled through an ordered list of registered beneficiaries (Sridharan et al, 2014).
4

I. INTRODUCTION MATHEMATICA POLICY RESEARCH
The phone also includes a beneficiary management form to track registered beneficiaries and update the home visit schedule accordingly. FLWs use this form to record information such as the movement of beneficiaries into and out of the village, names and details of beneficiaries that required referrals, and information about abortions and maternal and child deaths that occur within the community. Once a woman’s status is updated on this form, the phone automatically updates her home visit schedule (or removes her from the home visit scheduler if relevant).
2. Features to improve the quality of information provided and records maintained The ICT-CCS tool also seeks to standardize and improve the quality of home visits by
embedding within its forms interactive checklists to guide FLW-beneficiary interactions. These checklists cover a range of relevant reproductive, maternal, newborn, and child health (RMNCH) behaviors that an FLW might discuss during a single home visit. They both gather information about relevant behaviors (for example, whether the mother is using contraception) and prompt the FLW to provide relevant messages (for example, that sterilization services are available at the local government health facility). The behaviors covered depend on the relevant stage of pregnancy or childhood; for example, if a child is three months old, the checklist will prompt the FLW to enquire about exclusive breastfeeding, immunization, and whether the mother has adopted any modern methods of family planning. Addressing multiple domains of RMNCH in a single visit and combining information and messages across domains that are traditionally associated with the role of either the AWW or the ASHA into one platform for both types of FLWs are important features of the intervention.7 The phone also stores information that the FLW might need to share with the beneficiary. For example, if the woman or her child is in need of a qualified medical doctor’s care, the FLW would be able to pull up on her phone details regarding the closest referral unit.
The intervention has embedded an audio feature in all the checklists to address concerns about less literate FLWs being able to use ICT-CCS phones. If an FLW is having difficulty reading out the items on a checklist, she can enable the audio feature that automatically reads out the options as well as the questions that appear on the checklist. To make the process of conducting home visits more interactive, most questions on the checklist are also guided with relevant images. Figure I.2 provides some screenshots from an ICT-CCS phone.
7 During the course of this intervention, CARE also piloted a separate CommCare interface developed solely for AWWs. The AWW CommCare interface was designed to collect information that was specific to the AWWs’ responsibilities and that otherwise had to be updated by the AWWs on paper-based forms. The AWW CommCare modules capture information on take-home rations for mothers and children, growth monitoring for children, daily name-based tracking for pre-school activities, and the registration of children up to age 6.
5

I. INTRODUCTION MATHEMATICA POLICY RESEARCH
Figure I.2. ASHA/AWW ICT-CCS mobile phone
Notes: This screenshot shows the various features available on the ICT-CCS phones given to ASHAs and AWWs. It is a compilation of screen-shots that appear if the ASHA/AWW wants to register a beneficiary in her community (by pressing option code 1 in the left-most screenshot). Assisted with visuals, the checklist (following the sequence of arrows in the figure) prompts the ASHA/AWW to record (1) the name of the woman, (2) the name of her husband, (3) the household registration number, (4) the total number of household members, (5) the age of the woman, and (6) whether the household belongs to a scheduled caste or tribe. These screenshots are illustrative and do not cover the entire list of questions that appear on the checklist.
In addition, videos are synchronized to the ICT-CCS forms to facilitate the effective communication of important family health information. Animated characters in these videos convey key RMNCH messages in the respondents’ local dialect on birth preparedness, cord care, complementary feeding (feeding of solid and semisolid foods), and family planning.
The instruments form is another feature to facilitate the recording of important health information. The form enables FLWs to calculate the estimated delivery date (EDD)8 for pregnant women and the body mass index (BMI) of young children.9 Estimating the EDD and BMI manually can be difficult for FLWs, who are usually not trained to conduct such calculations. A calculator on the ICT-CCS phone does the math for them and reduces the chances of error. In addition to calculating each child’s BMI, the phone also compares it with the population-level reference distribution to categorize the child as underweight, healthy, or overweight. The FLW can use this information to determine what information and services to provide to the household.
8 Calculating a woman’s EDD requires use of an estimate of her last menstrual period (LMP). Typically, EDD is calculated by adding 280 days to the LMP. 9 BMI measures weight-for-height and is used most often to classify whether a person is underweight, overweight, or obese. It is calculated by dividing the weight in kilograms by the square of the height in meters (kg/m2).
1 2 3
6 5 4
6

I. INTRODUCTION MATHEMATICA POLICY RESEARCH
By providing an integrated platform for data collection, the ICT-CCS phone aims to reduce the burden on FLWs of maintaining multiple paper-based registers (a separate one for each RMNCH domain) and improves the quality of record-keeping. At present, because carrying several registers at once can be cumbersome, most FLWs either update their registers after conducting home visits or collect information over the course of several interactions with the beneficiary. This either leads to problems of recall or adds considerably to FLWs’ workload. Although the ICT-CCS tool was designed to address these issues, FLWs were still expected to maintain government-provided paper-based registers over the evaluation period. The potential benefit of the tool in reducing FLWs’ record-keeping burden was therefore not fully captured in the evaluation. However, it may manifest itself if the intervention is scaled up and the government approves the replacement of paper registers with the ICT-CCS tool.
3. Features to facilitate coordination, self-performance assessments, and oversight To foster coordination and collaboration between the ASHA and AWW in a given
catchment area, the ICT-CCS phones include a synchronizing feature that pairs the phones of the ASHA and AWW.10 Each day, ASHAs and AWWs receive the same list of beneficiaries to visit on their phones (if any are due for visits). If one FLW conducts a home visit before the other, the status of this home visit is updated on the phone of the other FLW, thereby preventing duplication of visits and improving efficiency. Unlike the home visit checklists that are pre-loaded on their phones, the synchronization feature requires a (good) internet connection. To enable records to be synchronized, CARE sends an internet recharge, a top-up, to the ICT-CCS phones every month.
All FLWs are also encouraged to review their own work by accessing a performance form. This review of performance is based on the number of timely home visits conducted by the FLWs (as determined by their home visit schedulers) versus the number of outstanding home visits not completed on time. This information is displayed separately for beneficiaries at different stages in the continuum of care, and aims to help FLWs reflect on their work and identify areas for improvement.
The intervention is also structured to facilitate close supervision and oversight by ANMs and LSs. Records of home visits conducted by the ASHAs and AWWs are automatically synthesized and shared in the form of charts and tables on ICT-enabled supervisory phones given to the ANMs and LSs (Figure I.3). Based on these data, supervisors are able to monitor and provide feedback on FLW performance during subcenter meetings. The supervisory phones categorize FLWs’ performance by the timeliness of their home visits as well as changes in key RMNCH indicators in their catchment areas (which are calculated using information recorded in the checklists). These indicators are generally related to tasks performed by the FLWs, such as the provision of information on antenatal care, distribution of IFA tablets, and promotion of facility delivery. As mentioned earlier, the supervisory phones were introduced only in early 2013, and the ANMs and LSs were therefore not exposed to the intervention for the same period of time as the ASHAs and AWWs (though they still had a full year of exposure).
10 A catchment area consisting of a village or a segment of a village is typically served by one ASHA and one AWW.
7

I. INTRODUCTION MATHEMATICA POLICY RESEARCH
To mobilize supervision at the block level, CARE also developed a desktop-based online interface for the Block Health Managers and Children Development Program Officers, block-level officials at NRHM and ICDS respectively. However, because the block-level supervisory software was not fully developed at the time of the survey, this aspect of the program was not captured as part of the evaluation.
Figure I.3. ANM/LS ICT-CCS mobile phone
Notes: This figure shows the various monitoring tools available on the ANM and LS ICT-CCS phones. It is a compilation of screenshots that appear if the ANM/LS chooses to review home visits conducted by the ASHA/AWW (by pressing option code 1 in the left-most screenshot). The checklist (following the sequence of arrows in the figure) prompts the ANM/LS to select (1) the anganwadi center they want to review, and (2) whether they want to review the fraction of home visits conducted according to schedule (a series of pie charts in 3a) or the total number of beneficiaries reached for each task that should be conducted by an ASHA/AWW (the numbered list in 3b).
B. Program logic for the ICT-CCS intervention
In Figure I.4, we illustrate the program logic underlying the ICT-CCS intervention, showing the expected activities and outputs, proximal and intermediate outcomes, and ultimate impacts of the intervention. As described above, the intervention provides a mobile-phone based tool for FLWs with multiple features to facilitate improved interactions with beneficiaries. To support their use of the tool, FLWs were provided with extensive formal and informal training as well as technical support as required. A separate supervisory tool was provided to the supervisors of ASHAs and AWWs to facilitate improved monitoring and support of the performance of these FLWs.
The outcomes most proximal to the intervention involve the FLWs and supervisors understanding the ICT-CCS tools, and integrating the use of these tools into their work. The evaluation focuses on measuring the understanding and use of the tool as reported both by FLWs (for example, understanding of and ability to demonstrate features of the tool) and by beneficiaries (for example, exposure to the videos included in the tool). The use of these tools is expected to improve service provision by FLWs along several dimensions, including improvements in the regularity and timeliness of home visits, improved communication and information provision during these visits, improved coordination among FLWs in the same
1 2
3a 3b
8

9
I. INTR
OD
UC
TION
M
ATH
EMATIC
A POLIC
Y RE
SEA
RC
H
Figure I.4. Logic model for ICT-CCS intervention
ICT-CCS mobile phone tool provided to FLWs (ASHAs/AWWs), which includes:•Registration and management system to track, manage, and plan interactions with beneficiaries across the continuum of care
•Synchronization of home visit schedule for FLWs in the same catchment area
•Checklists to gather information about relevant behaviors and prompt the FLW to provide time-appropriate messages
•Videos to explain key family health messages to beneficiaries
•Feature to enable FLWs to review their performance in terms of completed and outstanding home visits
Extensive training on use of the tool•Formal subcenter-level trainings•One-on-one support for FLWs who required it
Technical trouble-shooting support•Support provided over the phone or in person
ICT-enabled tool provided to FLW supervisors•Supervisory phone for ANMs and LSs enables monitoring of the timeliness of FLW home visits and changes in key health indicators in their areas
Understanding of ICT-CCS tools
• Improved capability of FLWs to use mobile phone technology
•FLWs understand how to use the ICT-CCS tool
•ANM and LS understand how to use the supervisory tool
Use of ICT-CCS tools•FLWs use ICT-CCS tool to plan and conduct home visits
•ANMs and LSs use supervisory tool to monitor and support FLWs
•Technical issues with the tools resolved
FLW service provision•Regular and timely FLW interactions with beneficiaries based on automated schedule
•Comprehensive and accurate information provided to beneficiaries
•More effective communication of information to households
•Greater job confidence• Improved coordination between ASHAs and AWWs
•Improved supervision and data-driven management by ANMs and LSs
Barriers to adoption of key family health behaviors addressed:
• Could involve improved knowledge, better awareness of available services, timely reminders, persuasion to overcome cultural barriers, etc.
Increased adoption of key family health behaviors along the continuum of care:
• Antenatal care (e.g. number of visits, consumption of IFA tablets)
• Delivery (e.g. place of delivery, birth preparedness)
• Newborn care (e.g. cord care, thermal care, immediate breastfeeding)
• Nutrition (e.g. exclusive breastfeeding, complementary feeding)
• Routine child immunizations
• Reproductive health (e.g. use of modern contraceptive methods)
Mortality
•Reduced maternal mortality
•Reduced neonatal and infant mortality
•Reduced under-5 mortality
Health outcomes
•Reduced total and age-specific fertility rates
•Reduced child stunting and wasting
ImpactsIntermediate outcomes
Proximal outcomesActivities/outputs

I. INTRODUCTION MATHEMATICA POLICY RESEARCH
catchment area and improved supervision of FLWs. Again, the evaluation measures these outcomes from the perspective of FLWs (for example, by examining reported coordination and supervision) and beneficiaries (for example, by examining the frequency and nature of FLW interactions as reported by beneficiaries), as relevant.
Intermediate outcomes include successfully addressing barriers to adoption of key health behaviors across the continuum of care, and the actual adoption of these behaviors. We have limited ability to determine the relative importance of addressing various barriers to adoption because these are challenging to measure, though we are able to examine changes in knowledge (one potential barrier) as reported by beneficiaries. We therefore rely primarily on measuring impacts on behavior adoption. Ultimately, these impacts are intended to result in impacts on mortality, fertility, and undernutrition. However, because these ultimate impacts will likely take longer to materialize, the evaluation focused on estimating impacts in the more intermediate behavioral outcomes.
C. Literature review
With the continued increase in the number of users of cell phone and internet technologies in the developing world, the applications of ICT in the health sector (eHealth) are rapidly expanding. Many different types of eHealth services and systems have been implemented in developing countries. For example, telemedicine uses technology to provide patients and doctors with health care from a distance. (Bollineni [2011] describes a project that uses telemedicine in rural India.) Another example is the use of electronic health records: the systematic collection of electronic health information about an individual or population to enable communication between different healthcare providers (for example, the Mosoriot Medical Record System in Kenya and the Community Health Information Tracking System in the Philippines, which is described by the Center for Health Market Innovations, 2014).
The subset of eHealth technologies that we focus on in this report is mHealth: the use of mobile communication devices, such as mobile phones, PDAs, and tablet computers, to provide health services and information. Vital Wave Consulting (2009) and Friederici et al. (2012) provide comprehensive overviews of the present state and future opportunities of mHealth in the developing world. They show that the number of developing countries with at least one mHealth project increased from fewer than 20 in 2003 to 68 in 2011, including 6 countries in South Asia. Examples of these mHealth interventions include Cell-life in South Africa, which uses mobile technology to help health workers monitor patients affected by HIV through home visits, and TeleDoc in India, which uses Java-enabled mobile phones to connect village-based healthcare workers with doctors in urban areas for remote diagnosis and treatment (Center for Health Market Innovations, 2014). These reports highlight that, if proven to be effective, the ubiquitous use of mobile phones in the developing world makes mHealth a cost-effective solution to provide healthcare services to large populations. Systematic reviews of mHealth interventions in developing countries have found some evidence of their success (Kaplan 2006; Mechael 2009; Gurman et al. 2012); below, we discuss specific interventions in greater detail.
Mobile technologies can be used for both prevention and management of disease by providing beneficiaries with information on health care practices. Text messages are the most popular mode of delivery of such information. Deglise et al. (2012) provide a systematic review
10

I. INTRODUCTION MATHEMATICA POLICY RESEARCH
of the use of short message service (SMS) text messages in the prevention, surveillance, management, and treatment compliance of communicable and non-communicable diseases in developing countries and find evidence that they are a promising tool for disease control. Text-message-based interventions that provide reminders to patients have been particularly successful in increasing adherence to medical treatment of diseases such as HIV and TB (Haberer et al. 2010; Lester et al. 2010; Pop-Eleches et al. 2011; Kunawararak et al. 2011). Similarly, Chen et al. (2008) conducted an RCT of the use of text messages with reminders for upcoming health appointments in China, and found that these were a cost-effective solution to improve attendance at health promotion centers.
Text message interventions have been used to improve sexual health knowledge with some success in the developed world (Gold et al. 2011), but the current evidence from developing countries is mixed. For example, a pilot intervention in Uganda implemented an SMS-based quiz related to HIV/AIDS with the incentive of phone credit followed by a final SMS urging respondents to be tested for HIV, and found a 40 percent increase in the number of patients coming for testing (Vital Wave Consulting 2009). In contrast, Jamison et al. (2013) found an increase in an index of promiscuity and no change in knowledge following a text message search technology that provided automated searches of an advice database on questions about sexual health, family planning, and local health services requested by users via SMS, also in Uganda.
On the provider side, mobile technologies can help improve the quality of health services and facilitate improved reach of these services in remote populations. In particular, mHealth technologies have been used to train community health workers (for example, HealthLine in Pakistan), collect data for public health officials to track disease and epidemic outbreaks (for example, Alerta DISAMAR in Peru, Handhelds for Health in India), and deliver information to health care providers for use in diagnosis, referral, and treatment of patients (for example, M-DOK in the Philippines) (Vital Wave Consulting 2009).
However, despite their widespread use, there are very few evaluations studying the impact of these technologies on quality of care and beneficiary health, and even fewer rigorous impact evaluations (the evaluations we discuss below are summarized in Table I.1, in the order in which they appear in the text). DeRenzi et al. (2008) found that the adherence of a small sample of health workers in rural Tanzania to the Integrated Management of Childhood Illness (IMCI) protocols developed by the World Health Organization and UNICEF improved with the use of PDAs (e-IMCI) that guide health workers through each step of the IMCI treatment algorithm. Further, Mitchell et al. (2013) found that e-IMCI increased the rate of correct diagnosis of four important childhood diseases by health workers in rural Tanzanian clinics by 8 percentage points when compared to the paper-only systems they were using previously. Chib (2010) used an RCT in health centers in Indonesia and found that providing midwives with mobile phones to communicate with doctors, colleagues, and patients and to enter data into a central database facilitates smoother communication and allows faster emergency response.
There are also several ongoing projects evaluating the use of mobile phones for various health applications. Researchers are currently conducting a randomized evaluation of Vodafone’s mVacciNation application in improving vaccination coverage of DPT3 in Mozambique (Poverty Action Lab, 2014a). Another randomized evaluation in process will evaluate the impact of the African Health Market for Equity program in Kenya, which includes an ICT component that
11

I. INTRODUCTION MATHEMATICA POLICY RESEARCH
enables clinics to collect data and directly reach patients to improve operational efficiency (Poverty Action Lab, 2014b).
Table I.1. Evaluations of mHealth interventions in the literature
Study Location Features of the
intervention Study Design Findings DeRenzi et al., 2008
Mtwara, Tanzania
PDAs to guide health workers through the Integrated Management of Childhood Illness (e-IMCI) treatment algorithm developed by WHO and UNICEF
Pre-post design: 5 clinical officers were observed before and after introducing e-IMCI (data from multiple patient visits)
• Increased adherence to IMCI protocol (85 percent with e-IMCI relative to 61 percent with paper-IMCI)
• Increase in likelihood of giving recommended advice (77 percent with e-IMCI relative to 57 percent with paper-IMCI)
• No significant difference in average duration of patient visits
Mitchell et al., 2013
Pwani Region, Tanzania
e-IMCI (same as above) Pre-post design: 18 clinical officers were observed before and after introducing e-IMCI (data from multiple visits)
• Increased adherence to IMCI protocol (71 percent with e-IMCI relative to 21 percent with paper-IMCI)
• Increased rate of correct diagnosis (91 percent with e-IMCI relative to 83 percent with paper-IMCI)
• No significant difference in average duration of patient visits
Chib, 2010 Aceh Besar, Indonesia
Provided midwives with mobile phones to communicate with doctors, colleagues and patients, and enter data into a central database
RCT: randomized at referral center level
• Smoother communication among health workers and with patients
• Faster emergency response • More efficient data collection from
patients
Crowley, Fink and Karlan, Ongoing
Numpula Province, Mozambique
Vodafone’s mVacciNation application for DPT3 coverage communicates information about immunization sessions to caregivers and improves vaccine supply chain management within the health system
RCT: randomized at health facility level
Not available yet
Gertler and Montagu, Ongoing
Kenya The ICT component of the broader African Health Market for Equity program enables clinic personnel to collect data and directly reach patients using mobile phones and other technology
RCT: randomized at private clinic level
Not available yet
Anantraman et al., 2002
Ballabhgarh, India
PDA-based system for FLWs to collect data on households, register and monitor pregnancies, and track immunizations for children under age 5
Qualitative study by researchers developing the software, followed by implementation testing with 4 ANMs
• High acceptance of technology by FLWs
• Reduction in total time for data entry
Grisedale and Grünsteidl, 1997
Rajasthan, India
PDA-based data entry and viewing interface to help FLWs organize and schedule home visits
Qualitative study observing ANMs to develop a prototype, followed by two qualitative field studies with 10 ANMs to collect feedback on tool design
• ANMs were not intimidated by or hesitant to use the device
• Input from ANMs was used to refine the tool and improve ease of use
12

I. INTRODUCTION MATHEMATICA POLICY RESEARCH Table I.1 (continued)
Study Location Features of the
intervention Study Design Findings Ramachandran et al., 2010
Orissa, India Short persuasive videos and testimonial videos via mobile phones for use during home visits by ASHAs
Pre-post design: pilot study by researchers developing the content, followed by preliminary quantitative and qualitative findings from 7 ASHAs
• Increase in ASHA knowledge of danger signs
• Increase in ASHA self-efficacy • Helped ASHAs engage village
women in dialogue; improved ASHA motivation and learning; motivated key community influencers to promote the role of ASHAs via testimonial videos
Several studies from India document the implementation of technologies that are similar to
those in the current study (or a subset of them) for community health workers. For example, Anantraman et al. (2002) discuss the implementation of a mobile technology in Ballabhgarh, India, aimed at improving maternal and child health by providing FLWs with software on PDAs (known as Ca:sh) to collect data on each member of the household, register and monitor pregnancies, and track immunizations for children under age 5. Grisedale and Grünsteidl (1997) describe the introduction of a PDA-based system to help FLWs organize and schedule house visits in Rajasthan as part of the India Health Care project. Ramachandran et al. (2010) pilot the use of short persuasive videos (directed to pregnant women) and testimonial videos (to motivate FLWs) deployed on mobile phones for use during home visits by FLWs in Orissa, India.
The current study is unique in that it evaluates an mHealth tool that is substantially more comprehensive than other similar tools that have been implemented to date in India (and elsewhere). In particular, the ICT-CCS tool integrates elements from the other tools implemented for FLWs in India that were described above (including registration and monitoring of beneficiaries, tracking immunizations, visit scheduling, and health information provision through videos), and adds other elements such as checklists and supervisory tools. In addition, this study is also one of the few to conduct a rigorous evaluation of the impacts of a mobile-phone based tool in the health sector of a developing country, and will therefore make an important contribution to the existing evidence base.
D. Key research questions
We conducted a rigorous evaluation of the ICT-CCS intervention in Saharsa after two years of implementation using a clustered RCT design. This report summarizes our findings from this evaluation and seeks to address the following questions:
• What was the ICT-CCS intervention, and how was it implemented? To what extent did FLWs understand how to use the new ICT-based tools? What were the practical challenges or barriers to using them?
• What was the impact of the ICT-CCS intervention on FLW-household interactions? Did ICT-based tools lead to an improvement in the quantity and quality of FLW-household interactions?
• Did the intervention lead to improvements in maternal and child health outcomes among beneficiaries? Did ICT-based tools lead to improvements in key health outcomes across the family health continuum relative to paper-based tools? If so, were these improvements larger for certain subgroups of the population than for others?
13

I. INTRODUCTION MATHEMATICA POLICY RESEARCH
To address these questions, we used a mixed-methods approach, which collected and analyzed quantitative and qualitative data. In particular, we used our RCT design to examine whether the intervention affected service provision by FLWs and beneficiary health behaviors based on data from surveys conducted with FLWs and beneficiaries. We complemented our quantitative analyses with qualitative data obtained through field visits and semistructured interviews with implementing partner staff, FLWs, and beneficiaries to explore questions related to the implementation of the intervention.
E. Road map for the report
The rest of this report is structured as follows. Chapter II describes the study design, data collection, and analytical approach for the evaluation (see Appendix A for further details). Chapter III uses both qualitative and quantitative data to describe the implementation of the intervention in the treatment subcenters. Chapters IV and V summarize impacts on outcomes from surveys conducted with FLWs and beneficiaries, respectively. Chapter VI concludes, and discusses some key lessons and considerations for scale-up.
14

II. STUDY DESIGN, DATA, AND ANALYTIC APPROACH MATHEMATICA POLICY RESEARCH
II. STUDY DESIGN, DATA, AND ANALYTIC APPROACH
We used a rigorous RCT design to evaluate the impacts of the ICT-CCS intervention, and conducted a process study to learn about its implementation. In this chapter, we briefly describe our study design, data collection, and analysis approach for the RCT, as well as our approach to the qualitative data collection.
A. Study design
To provide rigorous, highly credible evidence on the impact of the ICT-CCS intervention, we conducted a clustered RCT. Because the intervention was implemented at the subcenter level (phones were provided to all FLWs in a given subcenter), we randomly assigned a set of subcenters in Saharsa district to treatment and control groups. The treatment group received the ICT-CCS intervention (as well as the core elements of the broader Ananya program), while the control group did not receive the ICT-CCS intervention (but did receive the core elements of the Ananya program). Random assignment ensures that, on average, there are similar groups of FLWs and beneficiaries in the treatment and control subcenters prior to the start of the intervention, and that subcenter characteristics (such as size and distance to other public health facilities) are also similar. Therefore, the only difference between the treatment and control subcenters is that the former are exposed to the intervention. As a result, we are able to attribute any observed treatment-control differences in outcomes over time for FLWs or beneficiaries to the causal effect of the ICT-CCS intervention.
As mentioned earlier, several core (non-ICT) Ananya program interventions were being implemented simultaneously across Saharsa during the evaluation period in both the treatment and control areas. These core interventions included, among others, support for mapping and enumeration of households to ensure that all relevant beneficiaries were identified and linked to FLWs, regular subcenter meetings that trained FLWs on maternal and child health topics, and the provision of training and job aid tools to FLWs to facilitate their communication with households.11 They also included paper-based home visit planners to help FLWs schedule home visits for beneficiaries at appropriate points in the continuum of care. In treatment areas, these core interventions were supplemented by the ICT-CCS tools, which could substitute for the paper-based home visit planners (though the paper-based registers were still available if the FLWs chose to use them).
Therefore, the RCT measures the impact of ICT-CCS tools as well as other core Ananya interventions (including paper-based tools), relative to the core interventions alone. That is, the RCT was designed to measure the value-added of ICT-CCS beyond the core Ananya interventions. It was not designed to measure the impact of ICT-CCS introduced in isolation, which could differ (for example, the impact on FLW home visits could differ in a context without the subcenter meetings).
11 Job aid tools included Mobile Kunji, a set of illustrated cards with messages on key family health practices, which include a phone number that FLWs can dial to play a recorded message from a fictional character (Dr. Anita), who explains to beneficiaries why these practices are important and how to implement them. Other tools included a bowl and spoon to demonstrate complementary feeding and a uterus model, Copper-T intrauterine device (IUD), and Mala-D contraceptive pills to facilitate discussions on family planning.
15

II. STUDY DESIGN, DATA, AND ANALYTIC APPROACH MATHEMATICA POLICY RESEARCH
CARE selected Saharsa as the district in which the ICT-CCS intervention would take place based on the willingness of district-level government officials to support the intervention and the study. Our statistical power calculations suggested that we would require a sample of 70 subcenters and 20 women per subcenter to detect impacts of 6 to 10 percentage points in the behaviors targeted by the intervention. To limit implementation costs and logistical requirements, the intervention and evaluation study focused on four blocks (of a total of 10 blocks in Saharsa).12 To identify these blocks, we excluded blocks that CARE’s ground team had qualitatively determined to be atypical (such as those in which government health officials were not in place), and selected four blocks that were sufficiently large to meet our sample size requirements for the number of subcenters. The four blocks we selected provided the required 70 subcenters for the study. We randomized all the subcenters in the selected blocks into equal-sized treatment and control groups using a stratified random assignment procedure based on the number of anganwadi centers (AWCs) served by the subcenter (a proxy for the size of the population served). The stratification helped to ensure that the treatment and control groups were balanced by the size of the population served, and to reduce variance (and hence improve statistical power) in the analysis (see Appendix A for more details).
B. Sample and data
In both the treatment and the control subcenters, we conducted interviews with FLWs and with mothers who had given birth in the past year. The ASHAs and AWWs are the primary users of the ICT-CCS intervention tools, while the ANMs and LSs play a potentially important supervisory role. We therefore sought to obtain information (1) from ASHAs and AWWs on their use of the technology, their attendance and participation in subcenter meetings, home visits they had conducted, and services they had provided to beneficiaries; and (2) from ANMs and LSs on their supervisory work. We also gathered information from women who had given birth in the past year on their behaviors and practices in health areas, such as antenatal care and delivery preparation, postnatal care, child immunizations, complementary feeding, and family planning, as well as their interactions with the FLWs.
We conducted two rounds of data collection from both FLWs and beneficiaries: a baseline (in May and June 2012, before the ICT-CCS intervention was introduced) and an endline two years later.13 The baseline surveys were intended to enable us to verify the comparability of the treatment and control groups at baseline, and to provide control variables to improve the precision of our impact estimates. The endline, conducted in July and August 2014, was used to determine the impacts of the ICT-CCS intervention after about two years of exposure.14
12 In the administrative structure of Bihar, the block is the level immediately below the district. 13 Sambodhi Research and Communications conducted both the baseline and the endline data collection with the guidance of Mathematica staff. 14 The ICT intervention was introduced into the field in mid-2012, but the various components of the tool were rolled out in stages so that the full set of applications was available only in late 2012 to early 2013. Therefore, the endline measures the impact of the ICT intervention after 12 to 18 months of full implementation, preceded by several months of partial implementation.
16

II. STUDY DESIGN, DATA, AND ANALYTIC APPROACH MATHEMATICA POLICY RESEARCH
Because there was no readily available sample frame to identify women who had given birth in the past year, we conducted a household listing to identify the right set of beneficiaries to survey. Conducting a full listing of all households in the subcenter would have been prohibitively expensive; therefore, we randomly selected two villages (or village segments) per subcenter in which to conduct the listing, defining segments such that we identified about 20 eligible beneficiaries per segment (see Appendix A for details). We surveyed women in the same communities at baseline and endline. However, the household beneficiaries included in the baseline and endline samples were largely different, because a different cohort of women gave birth in the 12 months before each survey. Nevertheless, baseline data enabled us to check that the randomization was successful in creating comparable groups at baseline, and it provided baseline subcenter-level control variables to improve the precision of our impact estimates at endline.
For the FLW surveys, we wanted to interview about four ASHAs and four AWWs per subcenter (our power calculations suggested that this combined sample would enable us to detect impacts of 7 to 12 percentage points in key FLW outcomes). For our baseline FLW surveys, we used a list of subcenter ASHAs and AWWs provided by CARE; we interviewed ASHAs and AWWs who served beneficiaries in the villages (or village segments) selected for the beneficiary surveys, and supplemented this with an additional random sample of ASHAs and AWWs from the subcenter (see Appendix A for details). At endline, we attempted to survey all the ASHAs and AWWs identified at baseline, plus any new ASHAs and AWWs serving households in the sampled communities. Because each subcenter had only one or two ANMs, we attempted to survey all the ANMs in the subcenters included in our sample at baseline and endline, respectively. We also attempted to survey all the LSs who were trained as part of the ICT-CCS intervention in the treatment areas by endline to collect descriptive information about their role with the intervention (however, there were only 20 such LSs at endline).
The response rates to our surveys were generally very high (Table II.1). Focusing on the endline surveys, almost 99 percent of households responded to the listing survey, and about 90 percent of eligible women responded to the beneficiary survey (this combined response rate is about 89 percent). This yielded a total sample of 1,553 completed interviews for the endline beneficiary-level impact analysis. Among FLWs, the endline response rates were 97 percent for AWWs, 92 percent for ASHAs, and 82 percent for ANMs. This yielded a total FLW sample size of 572 for the combined AWW/ASHA sample (which we analyze together in the report) and 79 for the ANM sample (which we analyze separately). For the LS survey, 13 of the 20 eligible LSs (65 percent) were successfully interviewed. The response rates were similar in the treatment and control groups, suggesting that differential nonresponse between the treatment and control groups is unlikely to bias our estimates.
17

II. STUDY DESIGN, DATA, AND ANALYTIC APPROACH MATHEMATICA POLICY RESEARCH
Table II.1. Endline sample sizes and response rates
Survey
Control (35 subcenters)
Treatment (35 subcenters)
Total (70 subcenters)
Response rate
(percent) Sample
size
Response rate
(percent) Sample
size
Response rate
(percent) Sample
size
Households Listing Survey 98.7 8,490 98.3 8,149 98.5 16,639 Beneficiary Survey 92.4 809 88.4 744 90.4 1,553
FLWs
AWW 97.1 134 96.2 153 96.6 287 ASHA 91.7 122 92.1 163 91.7 285 ANM 84.0 42 80.4 37 82.3 79 LS NA NA 65.0 13 65.0 13
Source: Ananya ICT-CCS endline surveys conducted by Sambodhi in collaboration with Mathematica in mid-2014.
C. Analytic approach to estimating impacts
Because random assignment should ensure that the treatment and control groups are similar in all respects other than receipt of the intervention, impacts can be estimated simply by computing the difference in mean outcomes between the two groups at endline. However, we instead estimated impacts in a regression framework, which enabled us to explicitly account for the method of randomization by including stratum-level indicators and hence improve statistical power (see Appendix A for details). By controlling for additional individual and baseline subcenter-level characteristics, we were also able to reduce the variance in the outcome (and hence increase statistical power) and control for differences that could have arisen by chance between the treatment and control groups.15
In our beneficiary-level regressions, we included both individual- and subcenter-level covariates that could be related to the outcome of interest. Our individual-level covariates included the household demographics of a woman, such as (1) whether she belongs to a scheduled caste or tribe, (2) whether she is Hindu, (3) the number of her children, (4) her age, (5) her literacy, and (6) her socioeconomic status (SES) quartile; the subcenter-level covariates included the subcenter-level means of these same outcomes, when available.16 We weighted all beneficiary-level regressions to account for differing sampling probabilities and to ensure treatment-control balance within random assignment strata. The estimated impacts can therefore be interpreted as the impacts for the average beneficiary in the treatment subcenters. We adjusted all standard errors to account for the correlation in outcomes among beneficiaries linked to the same subcenter.
15 As a robustness check, we compared our results with those from simple unadjusted treatment-control comparisons; the results were largely similar. 16 Because we made some changes to the beneficiary survey between baseline and endline to better capture aspects of the intervention, some of the outcomes analyzed at endline were not measured in the baseline survey.
18

II. STUDY DESIGN, DATA, AND ANALYTIC APPROACH MATHEMATICA POLICY RESEARCH
We used a similar regression framework to determine the impact of the interventions on outcomes for ASHAs and AWWs and include both individual FLW and subcenter characteristics. In all our FLW analyses, we pooled the data collected from ASHAs and AWWs.17 FLW-level covariates include controls for the worker’s age, scheduled caste or scheduled tribe status, religion, and literacy (as measured by ability to fluently read a passage). We also include controls for whether the FLW reports serving a catchment area with beneficiaries that are predominantly Muslim or predominantly from scheduled castes or tribes.
We estimated a more parsimonious model for our ANM sample, which did not include an extensive set of covariates. Given the small sample size of this group, we do not have the statistical power to distinguish impacts; hence, the ANM results should be thought of as providing descriptive context for the ASHA, AWW, and beneficiary results. As in the beneficiary analysis, we weighted all regressions so that they represent the average FLW (either the average ASHA/AWW or the average ANM, depending on the analysis), and adjusted for clustering of standard errors at the subcenter level. Because the LS sample is very small and consists only of LSs from the treatment area at endline, we use it to provide purely descriptive information on the role of the LS in the ICT-CCS intervention.
D. Qualitative process study
To learn about program implementation and to inform the RCT findings, we conducted a process study in which we gathered qualitative information on the implementation of the ICT-CCS intervention. We collected these data as part of field visits held at the end of April and early May 2013, about a year after the ICT-CCS intervention had been launched. The process study was therefore conducted about midway between the quantitative baseline and endline, and was primarily designed to examine the process of implementation, which could inform the interpretation of the endline results. As noted below, we also conducted some additional qualitative interviews at the same time as the endline to help understand how implementation evolved over the evaluation period.
As part of the process study visits, we interviewed CARE program staff at headquarters and at the district and block levels to learn about their vision for the ICT-CCS program and how it was implemented. In particular, we asked about inception of the intervention, planning and rollout, implementation successes and challenges, and scalability. We also interviewed FLWs to understand program implementation from their perspective. In particular, we visited two of the four blocks in which the program was implemented and conducted semistructured interviews with 23 randomly-selected FLWs (8 ANMs, 8 AWWs, and 7 AWWs) working at 8 subcenters.18 We asked FLWs about the training they received on the ICT-CCS tool, challenges they faced in
17 We also analyzed several key outcomes for ASHAs and AWWs separately, but found few results that varied across these two cadres. 18 To identify a random sample of FLWs for the process study, we used a multi-stage sampling approach. First, we randomly selected two of the four blocks in which the program was implemented. Second, we randomly selected four subcenters—two treatment and two control subcenters—in each of these blocks. Finally, we randomly selected one village per subcenter and one segment of this village (in the case of large villages). We attempted to interview the ANM in each selected subcenter as well as the ASHA and AWW serving the selected village (or village segment).
19

II. STUDY DESIGN, DATA, AND ANALYTIC APPROACH MATHEMATICA POLICY RESEARCH
learning how to use the tool, ongoing oversight they received from CARE staff, and the extent to which they used the tool to coordinate home visits and share information with households. To obtain a high-level sense of these issues at a later phase of implementation, we conducted a handful of in-depth qualitative interviews during the follow-up survey data collection in summer 2014. We also drew on CARE’s monitoring data to gain insight into the intervention’s implementation.
20
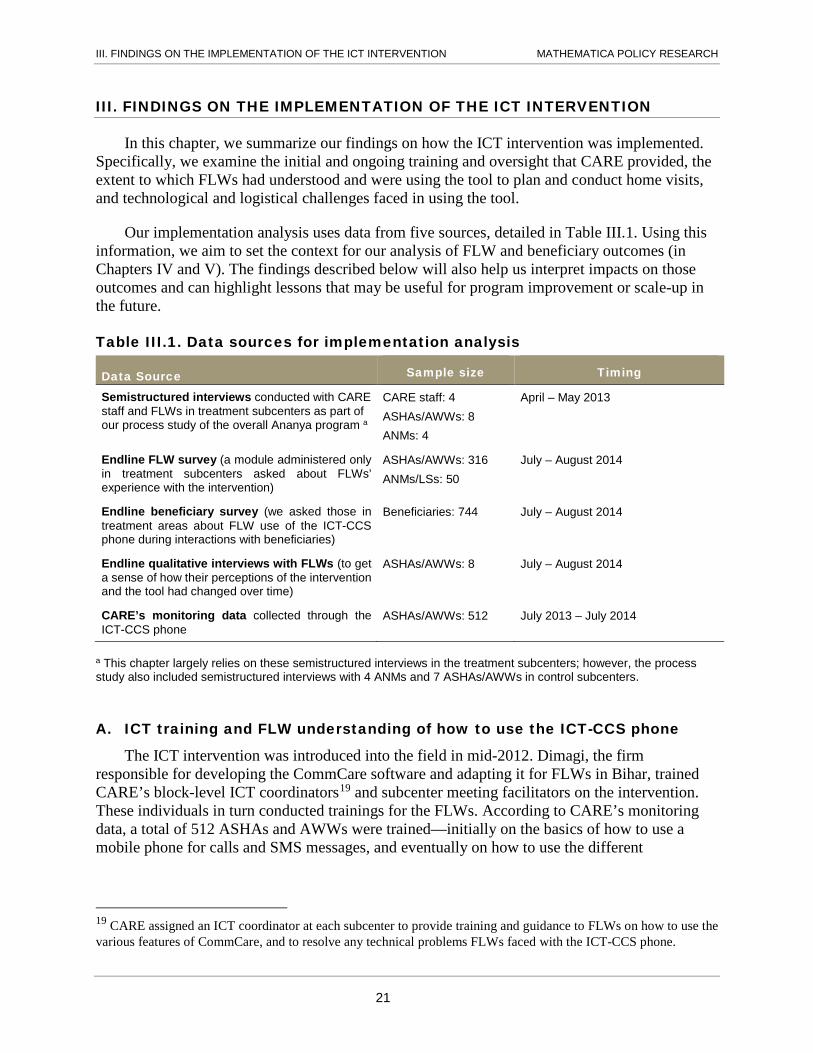
III. FINDINGS ON THE IMPLEMENTATION OF THE ICT INTERVENTION MATHEMATICA POLICY RESEARCH
III. FINDINGS ON THE IMPLEMENTATION OF THE ICT INTERVENTION
In this chapter, we summarize our findings on how the ICT intervention was implemented. Specifically, we examine the initial and ongoing training and oversight that CARE provided, the extent to which FLWs had understood and were using the tool to plan and conduct home visits, and technological and logistical challenges faced in using the tool.
Our implementation analysis uses data from five sources, detailed in Table III.1. Using this information, we aim to set the context for our analysis of FLW and beneficiary outcomes (in Chapters IV and V). The findings described below will also help us interpret impacts on those outcomes and can highlight lessons that may be useful for program improvement or scale-up in the future.
Table III.1. Data sources for implementation analysis
Data Source Sample size Timing
Semistructured interviews conducted with CARE staff and FLWs in treatment subcenters as part of our process study of the overall Ananya program a
CARE staff: 4 ASHAs/AWWs: 8 ANMs: 4
April – May 2013
Endline FLW survey (a module administered only in treatment subcenters asked about FLWs’ experience with the intervention)
ASHAs/AWWs: 316 ANMs/LSs: 50
July – August 2014
Endline beneficiary survey (we asked those in treatment areas about FLW use of the ICT-CCS phone during interactions with beneficiaries)
Beneficiaries: 744 July – August 2014
Endline qualitative interviews with FLWs (to get a sense of how their perceptions of the intervention and the tool had changed over time)
ASHAs/AWWs: 8 July – August 2014
CARE’s monitoring data collected through the ICT-CCS phone
ASHAs/AWWs: 512 July 2013 – July 2014
a This chapter largely relies on these semistructured interviews in the treatment subcenters; however, the process study also included semistructured interviews with 4 ANMs and 7 ASHAs/AWWs in control subcenters.
A. ICT training and FLW understanding of how to use the ICT-CCS phone
The ICT intervention was introduced into the field in mid-2012. Dimagi, the firm responsible for developing the CommCare software and adapting it for FLWs in Bihar, trained CARE’s block-level ICT coordinators19 and subcenter meeting facilitators on the intervention. These individuals in turn conducted trainings for the FLWs. According to CARE’s monitoring data, a total of 512 ASHAs and AWWs were trained—initially on the basics of how to use a mobile phone for calls and SMS messages, and eventually on how to use the different
19 CARE assigned an ICT coordinator at each subcenter to provide training and guidance to FLWs on how to use the various features of CommCare, and to resolve any technical problems FLWs faced with the ICT-CCS phone.
21

III. FINDINGS ON THE IMPLEMENTATION OF THE ICT INTERVENTION MATHEMATICA POLICY RESEARCH
CommCare forms and checklists on the ICT-CCS phone. ANMs and LSs received their supervisory phones (and training) later, in early 2013.
Below we summarize how FLWs perceived this training and what they learned. We also conducted an in-depth assessment of FLW capabilities with regard to CommCare. We describe the extent to which FLWs understood and were able to use the various features of the ICT-CCS phone to plan, coordinate, and conduct home visits and provide services. We also discuss ANM and LS use of the supervisory modules to oversee the work of ASHAs and AWWs in their catchment areas.
CARE provided intensive training and oversight to FLWs and substantially enhanced their very limited capacity to use mobile technology at the outset of the intervention.
FLW reports indicated that the training they received on the ICT intervention considerably advanced their basic understanding of how to use a mobile phone and increased their level of comfort with using a phone to plan and conduct their work. Many FLWs started participating in the intervention with little to no experience with mobile phones beyond making calls. For example, only 10 percent of the ASHA and AWW respondents of the endline quantitative survey had sent an SMS with their mobile phone prior to the program (Table III.2). However, by the time we conducted our process study interviews (in spring 2013, about a year after the intervention was introduced), most had mastered more complex tasks, including how to type in Hindi on the phone, open up applications, and navigate between different screens. Those with poor eyesight were even using the built-in voice commands to use the ICT-CCS phone. This progress has continued over the course of the intervention. Of the endline FLW respondents (whom we surveyed a year after the process study), only 3 percent were unable to log in to the ICT-CCS phone when the internet connection was strong and the phone was in working order (Table III.2).
Table III.2. Training provided to ASHAs and AWWs (percentages unless otherwise indicated)
Endline treatment mean
ICT Training and Experience Received training on use of ICT-CCS phone from staff who came to village 98.8 Most trainings on use of ICT-CCS phone
At home 4.2 At the AWC 18.0 At the subcenter 70.6 Someplace else 7.2
Used phone before given ICT-CCS phone 84.4 Sent SMS before given ICT-CCS phone 10.4 Average number of days it took to learn how to use ICT-CCS phone (FLW self-reports) 42.1 Still learning to use ICT-CCS phone 4.3
Observations of Use of ICT-CCS Phone and Knowledge Logging in
Able to log into ICT-CCS phone 62.5 Could not log in because phone not working or bad service 34.8 Did not know how to log in 2.7
Source: ICT RCT endline ASHA and AWW surveys conducted by Sambodhi in collaboration with Mathematica in mid-2014. Note: Sample size = 316 FLWs (163 ASHAs and 153 AWWs in treatment subcenters)
22

III. FINDINGS ON THE IMPLEMENTATION OF THE ICT INTERVENTION MATHEMATICA POLICY RESEARCH
It took considerable effort to advance FLW capabilities. CARE adopted an intensive “handholding” approach, working with FLWs both in group settings and individually and adapting its training and guidance for a range of skill levels. The training offered at the subcenter level was rigorous: the FLWs we interviewed for the process study reported that they were frequently made to practice using the tool in demonstration mode. These trainings were conducted during subcenter meetings, and consisted of 16 sessions of approximately 3 hours each over a period of 8 weeks (the frequency of subcenter meetings is typically monthly, but was increased for the duration of the training period). As mentioned above, they included instruction on the basic use of the tool (for example, how to type in Hindi) and detailed information of the use of various forms.
CARE staff also worked with FLWs outside the subcenter meetings. In particular, CARE staff identified FLWs who were having difficulty in the formal training sessions and visited them in their homes to provide them with additional instruction and bring them up to the level of understanding of the other FLWs before the next formal training session. Almost 30 percent of our endline ASHA and AWW survey respondents noted that the majority of the trainings (which might have included less formal mentoring activities) were conducted elsewhere (18 percent reported that training was mainly at the AWC in their village, 4 percent that it was mainly during visits to their home by CARE staff, and 7 percent that it was at another location) (Table III.2). CARE also tried to increase accountability by regularly reviewing the data that FLWs entered into the ICT-CCS phones. Our process study found that program staff regularly checked the phones during subcenter meetings to ascertain whether FLWs were registering beneficiaries and entering information into the home visit and due list forms.20 Even with this level of effort, FLWs took considerable time to adapt to the tool. Our endline ASHA and AWW survey respondents reported that it took them on average over a month (42 days) to learn how to enter information into the ICT-CCS phone, although this may have included the 16 formal training sessions (Table III.2).
ASHAs and AWWs were enthusiastic about the home visit scheduler of the ICT-CCS phone and displayed a high level of understanding of how to use it to identify households that needed to be visited.
Our process study found that FLWs greatly appreciated that the ICT-CCS phone automated the process of identifying households to visit, and that they received a list of households to visit each day (instead of painstakingly building out home visit schedules in paper-based planners on the basis of the recommended frequency of visits and expected delivery dates and birth dates). As one respondent noted, “Because we are no longer maintaining a manual home visit planner, we no longer have to worry about scheduling the home visits. We just follow whatever names pop up in our mobile phones for home visits.” Over 60 percent of endline ASHA and AWW survey respondents identified this as an important benefit of the ICT-CCS phone (Table III.3).
20 FLWs also receive support outside the program: just under two-thirds of ASHA and AWW survey respondents reported that they usually call a family member or neighbor when they require technical assistance with the ICT-CCS phone (not shown).
23

III. FINDINGS ON THE IMPLEMENTATION OF THE ICT INTERVENTION MATHEMATICA POLICY RESEARCH
Endline treatment
mean
Observations of Use of ICT-CCS Phone and Knowledge
Opening home visit planner Able to open 62.3 Could not open because phone not working or bad service 34.8 Did not know how to open 2.9
Interpreted number of home visits scheduled correctly Able to interpret 61.4 Could not interpret because phone not working or bad service 34.8 Did not know how to interpret 3.8
Interpreted number of home visits outstanding correctly Able to interpret 58.9 Could not interpret because phone not working or bad service 37.9 Did not know how to interpret 3.2
Knew meaning of color coding on ICT Knew all three color codes 55.9 Knew one or two color codes 35.0 Knew none of the color codes 9.1
Knew that numbers by beneficiary names denoted number of days till next visit 93.4 Reported Use of ICT-CCS Phone Tools
Benefits of using ICT-CCS phonea None 14.1 Maintain fewer registersb 58.9 Home visits come automatically 62.0 Tools to calculate EDD/BMI 8.8 Others 1.2
Films shown most often on ICT-CCS phonec Does not have films on ICT-CCS phone or none shown 0.0 Birth preparedness 68.5 Newborn care/cord care 47.9 Family planning 34.5 Complementary feeding 24.0
Forms used most often other than home visit schedulerc Make a list of beneficiaries 52.4 Beneficiary management 24.3 Immunization due list 52.0 Instrument 9.7 Growth monitoring 8.1 My performance 9.6
Coordinating with Opposite Cadre FLW
Way coordinate with opposite cadre FLW on which households to visit Talk before starting home visits 20.1 Inform each other after home visits 6.2 Use tool on ICT-CCS phone to communicate progress 67.4 Conduct joint home visits 5.9 Do not coordinate in this way 0.0 Other 0.4
Source: ICT RCT endline ASHA and AWW surveys conducted by Sambodhi in collaboration with Mathematica in mid-2014. Note: Sample size = 316 FLWs (163 ASHAs and 153 AWWs in treatment subcenters). a Responses add up to more than 100 percent because respondents could choose multiple options. b Although FLWs in treatment areas were still required to maintain government-mandated paper-based registers, they were no longer required to maintain the paper-based Ananya home visit planner. They may have viewed the Ananya home visit planner as another type of register when answering this question. c Responses add up to more than 100 percent because respondents could choose up to two options.
Our process study interviews indicated that FLWs understood how the ICT-CCS phone identified households for visits. Specifically, they understood that registering women and
24

III. FINDINGS ON THE IMPLEMENTATION OF THE ICT INTERVENTION MATHEMATICA POLICY RESEARCH
children in their phones and recording their expected delivery dates or birthdates provided the information on the basis of which the ICT-CCS phone calculated when those households should be visited. Most had also grasped how to access the list of households to visit on a given day: they correctly noted that households were marked in the master list with either “today” or the number of days till the next visit.
During the endline survey, we asked FLWs in the treatment areas to demonstrate how they used the various forms and modules of the ICT-CCS phone. Our observations with regard to the home visit scheduler were consistent with our process study findings. Most ASHA and AWW survey respondents displayed a high level of comfort with using the scheduler—only 3 percent were unable to open the home visit planner, only 4 percent could not identify the number of scheduled home visits specified in the planner, and only 3 percent could not identify the number of outstanding home visits.22 Over 90 percent knew that the number by each beneficiary’s name denoted the number of days until that person had to be visited next (Table III.3).
Some ASHAs and AWWs were confused about specific aspects of how to use the home visit scheduler, especially the color coding to indicate type of beneficiary.
Some FLWs (particularly the older FLWs) seemed to have difficulties understanding the color coding in the home visit scheduler, which indicates what type of beneficiary the home visit is for (blue for pregnant women, red for women in the critical phase two weeks either side of delivery, and green for women who delivered more than two weeks ago). For example, when asked what the color codes next to each beneficiary’s name signified, one process study interviewee said (incorrectly), “Red means danger and the mother needs to be taken to the hospital. Green means the mother needs to eat green—green vegetables.” Only 56 percent of endline ASHA and AWW survey respondents were familiar with all three color codes (Table III.3).
There was also some confusion among AWWs about how to select households for visits under the ICT intervention. Specifically, AWWs we interviewed as part of the process study reported that ICDS required them to conduct three home visits per day, regardless of what the ICT-CCS phone indicated. Many found it difficult to reconcile these conflicting instructions.
Although two-thirds of FLWs reported relying on the home visit scheduler to coordinate with each other, technological issues, lack of teamwork, and limited FLW capabilities all posed a challenge to coordination.
About 67 percent of ASHA and AWW survey respondents reported using the home visit scheduler on the ICT-CCS phone to coordinate the completion of outstanding visits (Table III.3). However, several important challenges remain in facilitating coordination. There have been several inconsistencies in record synchronization, which sometimes resulted in the ASHA and AWW of the same catchment area not receiving the same list of households to visit (discussed further below). Also, our process study interviews indicated that ASHAs and AWWs were sometimes confused about what coordination meant—that is, whether they should each be
22 However, about 35 percent of ASHA and AWW endline survey respondents were unable to demonstrate these skills, because either internet connectivity was poor or their phone was not in working order (Table III.3).
25

III. FINDINGS ON THE IMPLEMENTATION OF THE ICT INTERVENTION MATHEMATICA POLICY RESEARCH
visiting all the identified households, whether they should conduct joint visits to those households, or whether they should divide responsibilities with each other.
In general, there did not appear to be a sense of teamwork between ASHAs and AWWs, who seemed to be working independently to complete their work. Our process study interviews as well as the qualitative interviews conducted during endline yield several possible explanations for this situation. First, many FLWs thought their work was being reviewed separately (that is, that the ANM would check to see if the ASHA had visited all the identified households, and that the LS would do the same for the AWW), which reduced the incentive for cooperation. In addition, one ANM we interviewed felt that the mobile-phone-based home visit tracking “made the FLWs in [her] area more competitive, instead of instilling collaboration among them.”
Although understanding of how to use the checklists to conduct home visits increased over time, household reports indicate that actual use has not increased.
When we conducted our process study interviews in spring 2013, only a few ASHAs and AWWs appeared to understand how to use the CommCare checklists to conduct home visits, with several exhibiting hesitation when opening up the application and reading out the messages. However, our qualitative interviews at endline indicated that their level of comfort with the checklists in the home visit scheduler had increased over time. In addition, some discussed with us the added utility of the checklists. They mentioned that they no longer had to remember what messages to share with households since the checklist ensured they asked all the relevant questions. While FLWs had an improved understanding of this function, they did not appear to be using it frequently. Only 18 percent of households in treatment areas surveyed at endline reported that an FLW read out questions or reminders from her phone during a home visit (with 23 percent reporting that this happened including interactions outside the home) (Table III.4).
Checklists may lead FLWs to conduct home visits very rapidly and without a view to persuading beneficiaries to adopt key behaviors.
Our observations during the process study—and careful review of the tool itself—indicated that although the checklists facilitated the provision of comprehensive, accurate, and relevant information to beneficiaries, their survey-like format could cause FLWs to rush through important reminders and questions instead of working toward the end goal of facilitating behavior change and persuading beneficiaries to take advantage of available services and adopt key practices. For example, on immediate breastfeeding, the question in the checklist is, “Was the child immediately breastfed? Yes/No,” which served as a time-appropriate reminder for a beneficiary with a newborn, but did not serve to convince her (as the videos or Mobile Kunji might) that it was a vital practice to adopt and would help keep her child healthy.
26

III. FINDINGS ON THE IMPLEMENTATION OF THE ICT INTERVENTION MATHEMATICA POLICY RESEARCH
Table III.4. Household reports of use of the ICT tool (percentages unless otherwise indicated)
Endline treatment
mean Pregnancy Registered on Mobile Phone by FLW 10.3 Use of Questions/Reminders from Phone:
FLW ever read questions/reminders from phone during home visit 18.0 FLW ever read questions/reminders from phone during home visit or outside the home 22.5
Frequency of Use of Videos on Mobile Phone During Home Visits: Never used 80.4 Most of the time 4.0 Sometimes 11.7 Very few times 3.9
Videos Shown During Home Visits or Outside the Home: Birth preparedness 14.5 New born care/cord care 11.8 Family planning 10.2 Complementary feeding 9.2
Recording Immunizations, Among Children Immunized: Immunization details recorded by FLW 84.0 Immunizations recorded on mobile phone by FLW 7.0
Perceptions of Usefulness of ICT Tools, Among Those Exposed to ICT Tools: Videos on mobile phone helped understand issues explained by FLW 53.8 ICT mobile phone helped understand issues explained by FLW 22.1
Source: Ananya ICT RCT endline beneficiary survey conducted by Sambodhi in collaboration with Mathematica in mid-2014. Note: Sample size = 735 to 744 (all women in treatment subcenters), 687 to 786 (women in treatment areas with immunized
children), and 104 to 140 (women in treatment areas reporting that ICT tools were used).
ASHAs and AWWs were enthusiastic about the videos integrated into the tool, but did not use them frequently in interactions with households.
Use of the videos as reported by beneficiaries in treatment areas at endline was low, with around 80 percent of beneficiaries reporting that they had never seen an FLW use a video on her phone to explain health information (Table III.4). This could be related to FLWs’ level of comfort with this feature of the phone; program staff reported during the process study that FLWs sometimes accidentally deleted the videos saved in their phone’s media folder. Although FLWs did not play the videos stored on the phone frequently according to beneficiaries, FLWs’ perceptions of the videos were generally positive. One FLW interview respondent said, “After watching the videos, households get convinced that the message I am giving is correct and that they should follow my advice.” As for beneficiaries, 54 percent of endline survey respondents who had seen videos on the mobile phone felt that they helped them understand the issues the FLW was explaining.
There are four videos embedded in the checklists, covering the following topics: (1) birth preparedness, (2) newborn care or cord care, (3) complementary feeding, and (4) family planning. When asked which two videos they showed households most often, almost 70 percent of endline ASHA and AWW survey respondents mentioned the birth preparedness video, and nearly half mentioned the newborn care/cord care video (Table III.3). Beneficiary reports were aligned with these findings but considerably lower: when asked what videos the FLWs showed them either during or outside home visits, 15 percent of endline household survey respondents 27

III. FINDINGS ON THE IMPLEMENTATION OF THE ICT INTERVENTION MATHEMATICA POLICY RESEARCH
mentioned the birth preparedness video, 12 percent the newborn care/cord care video, 10 percent the family planning video, and 9 percent the complementary feeding video (Table III.4). Several FLW process study respondents reported a preference for videos over the Mobile Kunji as a means of explaining information to beneficiaries. They were more excited about the animated videos (which they called “films”) than the cards, and thought the phone was easier to carry around.
FLWs were using the ICT-CCS phone effectively to collect and use immunization data, and to maintain a list of beneficiaries.
To examine which components of the ICT-CCS tool were used most regularly, we asked FLWs in our endline ASHA and AWW surveys to specify which two forms they used most often other than the home visit scheduler. We found that many FLWs seemed to be relying on the ICT-CCS tool to manage their immunization workload; 52 percent of FLW survey respondents named the immunization due list as one of the two most commonly used forms.23 The other most commonly used forms were the form to make a list of beneficiaries (52 percent of respondents), and the beneficiary management form, which allowed FLWs to update beneficiary records (24 percent of respondents) (Table III.3).
We considered the possibility that the immunization due list and beneficiary listing and management forms were used most often because they were applicable to more cases than other forms. However, with a few exceptions, most other forms have broad relevance. For example, the growth monitoring form provides information collected during the last two weighings of all 0-2 year old children in the community. The “my performance” form provides summaries of home visits conducted on time and outstanding home visits, which an FLW can use regularly for planning purposes. The “instrument” form contains a tool that helps the FLW determine expected delivery dates, a calculation that most FLWs find difficult to complete and is needed as part of the registration of a pregnant woman. Therefore, most of the forms should be used on a regular basis by FLWs if they are using the ICT-CCS tool as intended.
Several ANMs and LSs were not able to use the supervisory phones, though they reported relying on the forms that provide FLW rankings and report any incidence of mortality.
Unlike the ASHAs and AWWs, a significant number of ANMs and LSs were not confident in their use of the supervisory phone, which was introduced several months into the evaluation. Eighteen percent of the endline ANM and LS survey respondents were not able to log in to the phones, and the same percent were unable to open the record of home visits conducted by ASHAs and AWWs in their area. Of the many functions of the supervisory phone, ANM and LS endline survey respondents said they reviewed most frequently the rankings of FLWs they supervised and the reports on beneficiary deaths in their area. As for the information provided by the supervisory phone on home visits conducted by ASHAs and AWWs in their area, ANM and
23 Only 7 percent of household respondents reported that the FLW recorded immunization details on the ICT-CCS phone. However, this might not reflect the actual rate at which immunization records were updated electronically—we heard many reports of FLWs entering information into the ICT-CCS phones after returning home from visiting beneficiaries. Overall, about 77 percent of endline household survey respondents reported that FLWs recorded immunization details on a hard copy diary or register (not shown), which may have eventually been entered into the ICT-CCS phone.
28

III. FINDINGS ON THE IMPLEMENTATION OF THE ICT INTERVENTION MATHEMATICA POLICY RESEARCH
LS endline survey respondents indicated that they used it most often to check whether FLWs were conducting timely home visits and track which types of households were being missed (Table III.5).
Table III.5. ANM and LS understanding and use of the ICT tool (percentages unless otherwise indicated)
Endline Treatment mean
Observations of Use of ICT-CCS Phone and Knowledge
Logging in Able to log into ICT-CCS phone 49.0 Could not log in, phone not working, or bad service 32.7 Could not log in 18.4
Opening home visit record Able to open 49.0 Could not open, phone not working, or bad service 32.7 Could not open 18.4
Able to interpret numbers on outstanding home visits 93.5 Using Tools for Supervision
Review work of ASHA/AWW on ANM/LS phone: More often than weekly 28.6 Weekly 30.6 Less often than weekly 30.6 Never 10.2
Most often use ANM/LS phone to review: Home visit information 16.3 Pregnancy outcomes 8.2 Postpartum complications 12.2 Weak newborn 10.2 Family planning 2.0 Record of death 34.7 FLW rank 32.7 Immunization due list 6.1 Calculators 10.2 My performance 14.3
Use information from ANM/LS phone on ASHA/AWW home visits to: Check if FLWs conduct timely home visits 57.1 Check which types of households are being missing 49.0 Check subcenter/sector performance 36.7 Identify FLWs to monitor or assist 12.2 Identify beneficiaries to focus on for VHND 4.1 Other 0.0 Nothing 14.3
Source: ICT RCT endline ANM and LS surveys conducted by Sambodhi in collaboration with Mathematica in mid-2014. Note: Sample size = 50 FLWs (37 ANMs and 13 LSs in treatment subcenters).
29

III. FINDINGS ON THE IMPLEMENTATION OF THE ICT INTERVENTION MATHEMATICA POLICY RESEARCH
Literacy, age, and cadre were significant predictors of some measures of FLWs’ understanding, use, and perceptions of the ICT-CCS phone.
To determine whether variation in the characteristics of FLWs influenced their understanding, use, and perceptions of the ICT-CCS phone, we ran regressions using FLW characteristics such as age, literacy, cadre, religion, and caste to predict relevant measures of FLW interactions with the ICT-CCS phone. The measures we examined were: (1) the number of days it took for the FLW to become familiar with the phone and whether they were familiar with the three color codes used to denote different stages in the continuum of care (understanding); (2) the forms on the phone that were most commonly used (use); and (3) whether the FLW reported that the phone did not have any benefits (perceptions). All of these measures were self-reported by ASHAs and AWWs in the endline FLW surveys.
We used the coefficients from these regressions to estimate the mean of each measure for FLWs with certain characteristics, controlling for variation in other characteristics (see Appendix A for details). For example, we estimated the probability of being familiar with all three color codes for literate FLWs and compared to the probability for illiterate FLWs. Table III.6 presents these regression-adjusted means and differences across three FLW characteristics for which significant differences were apparent: literacy (those who read a short passage fluently vs. haltingly), cadre (ASHAs vs. AWWs), and age (those age 30 vs. those age 40).24
We found that literacy was a significant predictor of some measures of FLWs’ understanding and use of the ICT-CCS phone. Specifically, FLWs who were able to read a passage that we provided as part of the endline survey were significantly more likely to know the three color codes used in the ICT-CCS, and to have used the beneficiary management form (which is for recording migration, referral, and mortality information on beneficiaries) compared to those who could only read the passage haltingly. Younger FLWs were also more likely to understand the color scheme used by the tool; however, the relationship between age and tool use was somewhat counterintuitive, with younger FLWs being less likely to report having used the beneficiary management form compared to older FLWs.
Differences also existed by FLW cadre. AWWs were significantly more likely than ASHAs to report using the immunization due list most out of all the tools on the phone (58 percent of AWWs versus 41 percent of ASHAs). Finally, a large difference by FLW cadre was in perceptions of the tool, with ASHAs being significantly less likely to report that the ICT-CCS phone had no benefit (perhaps because they do not have the large government-mandated record-keeping burden that AWWs do).
FLWs with positive perceptions of the ICT-CCS phone were more likely to use it for planning and coordinating home visits.
Understanding Use Perceptions
24 We also considered examining FLW experience and FLW proximity to the subcenter. However, FLW experience was highly correlated with FLW age, and there was limited variation in FLW proximity to the subcenter.
30

III. FINDINGS ON THE IMPLEMENTATION OF THE ICT INTERVENTION MATHEMATICA POLICY RESEARCH
Time took to learn
how to use phone (days)
Knew all three color
codes
Form most used:
beneficiary management
Form most used: due
list
Form most used:
instrument
Benefits of work phone:
none
Literacy Regression-adjusted mean for
those who read passage fluently 38.8 63.4 29.1 51.9 11.2 15.4
Regression-adjusted mean for those who read passage haltingly 44.0 34.1 14.1 49.6 9.6 16.1
Difference -5.2 29.3*** 15.0** 2.3 1.6 -0.7 p-value 0.520 0.003 0.044 0.740 0.750 0.932 Cadre Regression-adjusted mean for
ASHAs 42.6 57.2 31.3 41.3 7.6 7.7 Regression-adjusted mean for
AWWs 41.7 55.2 20.3 58.1 10.9 17.7 Difference 0.9 2.0 11.0 -16.8** -3.3 -10.0** p-value 0.868 0.720 0.109 0.022 0.195 0.032 Age Regression-adjusted mean for
FLWs age 30 42.4 62.6 18.5 55.3 10.8 18.3 Regression-adjusted mean for
FLWs age 40 41.8 51.5 28.1 49.8 9.0 11.3 Difference 0.7 11.1* -9.6* 5.5 1.8 7.0* p-value 0.894 0.056 0.073 0.419 0.553 0.058
Source: ICT RCT endline ASHA and AWW surveys conducted by Sambodhi in collaboration with Mathematica in mid-2014.
Notes: Sample size = 316 FLWs (163 ASHAs and 153 AWWs in treatment subcenters). Item-specific non-response limited sample size for some regressions.
Regression-adjusted means are based on ordinary least squares regressions with controls for stratum, cadre, age, reading ability, religion, SC/ST status, whether FLW served a predominantly SC/ST area, and whether FLW served a predominantly Muslim area. Standard errors were clustered at sub-center level.
*/**/*** Significantly different from zero at the .10/.05/.01 level, two-tailed test.
We also conducted regression analyses to understand the relationship between perceptions of the phone and its use.27 We found that those who believed that the ICT-CCS phone had benefits were more likely to use it to coordinate home visits with the opposite cadre FLW (71 percent of those who felt the phone had benefits used it for coordination as opposed to 47 percent of those who felt the phone had no benefits, a statistically significant difference [not shown]). They were also more likely to have understood that they were supposed to be guided by the ICT-CCS phone’s home visit scheduler in determining which households to visit each day. When we asked ASHAs and AWWs how many visits they were required to conduct daily, 17 percent of those who thought the phone had benefits said they were supposed to conduct as many visits as
27 We used ordinary least squares regression of measures of use on measures of perceptions, with controls for random assignment stratum, demographic characteristics of the FLW (age, reading ability, religion, and SC/ST status), demographic characteristics of the area served (whether the area was predominantly SC/ST or predominantly Muslim), FLW cadre, and interactions between FLW cadre and all controls. Standard errors were clustered at the sub-center level.
31

III. FINDINGS ON THE IMPLEMENTATION OF THE ICT INTERVENTION MATHEMATICA POLICY RESEARCH
appeared on the phone, as opposed to 7 percent of those who thought the phone had no benefits (a marginally statistically significant difference; [not shown]).28
B. Technological and logistical challenges in using the tool
In addition to assessing the extent to which FLWs had understood how to use specific features of the ICT-CCS phone and were using these features in practice, we explored whether FLWs were facing any technical and logistical issues in using the phone.
FLWs faced significant challenges in synchronizing their records with the system, which resulted in inefficiencies in home visit planning.
Technological issues with the ICT-CCS phone and CommCare application surfaced mainly as a result of poor internet connectivity on the mobile phone, as synchronizing records with the main server requires a strong connection. About 20 percent of endline ASHA and AWW survey respondents said they had a poor signal (or no signal at all) (Table III.7). When we conducted the process study, FLWs were reporting that weak internet connections prevented records from being synchronized with the main system, which caused (1) the ASHA and AWW in the same catchment area sometimes to receive different lists of households to visit, (2) beneficiary names to vary across ASHA and AWW records, and (3) ASHAs and AWWs to duplicate home visits. The synchronization feature has continued to present challenges over the course of program implementation. In one of the targeted qualitative interviews we conducted during our endline survey data collection, an FLW said, “Sync is not working on the phone. Sometimes I keep getting the same person more than once, even if I have visited a woman today. Then I have to enter the details again.”
FLWs also faced other technical or logistical challenges, of which the most challenging has been the delay in receiving funds to cover CommCare use.
Several FLWs mentioned that the monthly internet “recharge” or “top up” (the rupee amount added to their phone accounts to cover internet charges for the synchronization feature) had been erratic—17 percent of endline survey respondents reported such issues (Table III.7). They cited this problem as one of the key reasons for not using the ICT-CCS phones to conduct home visits. They worried that their personal funds (which they may have added to their account to be able to make phone calls) would be deducted by the telecommunications provider if they accessed CommCare before receiving the “top up.”
Because electricity is not always available in rural areas in Bihar and may be subject to frequent cuts, we asked FLWs whether they had had any difficulties in charging their ICT-CCS phones. However, the majority (86 percent) of survey respondents said their phone was charged and working either all or most of the time. When asked how they charged their phones when they did not have access to electricity at home, about 10 percent said they relied on a generator or car battery, 14 percent said they went to another location that had electricity, and 76 percent said they waited at home until the electricity returned (Table III.7).
28 The majority of FLWs reported that they had a set number of visits to conduct each day (for example, three visits). However, it is possible this was in reaction to the survey question as it was asked—“How many visits are you required to make in a given day?”
32

III. FINDINGS ON THE IMPLEMENTATION OF THE ICT INTERVENTION MATHEMATICA POLICY RESEARCH
Some have faced more mechanical or logistical challenges, with 14 percent of FLW survey respondents reporting that their phone had broken at some point and just under 10 percent reporting having lost their phone (Table III.7). CARE’s monitoring data show that the ICT-CCS phones of 70 FLWs (about 14 percent of all FLWs who received the phones) were in repair or not used in July 2014. According to ASHA and AWW reports, CARE representatives had generally been very responsive to requests to address technical and technological issues. The CARE ICT coordinator in each subcenter was the main contact person for problems with the tool; they would either try to solve the problem over the phone or by meeting with the FLW. Many noted, however, that ANMs had not been able to provide such assistance, an important concern as program implementers consider scaling up the intervention.
Table III.7. Challenges of using the ICT-CCS phone (percentages unless otherwise indicated)
Endline treatment mean
Share of Time Phone Is Charged and Working All of the time 54.4 Most of the time 32.1 Some of the time or less 13.6
Where ICT-CCS Phone Is Charged When No Electricity at Home Use generator or car battery 9.7 Go elsewhere to charge phone 14.0 Stay home and wait for electricity 76.3
ICT-CCS Phone Has Broken 13.6 ICT-CCS Phone Had Been Lost 9.4 Problems Faced While Using ICT-CCS Phone
Topping off/recharging (minutes) 17.0 Charging battery 6.4 No signal or bad signal 19.2 Lost information entered 3.1 Other 3.3
ICT-CCS Phone Currently Working 79.5
Source: ICT RCT endline ASHA and AWW surveys conducted by Sambodhi in collaboration with Mathematica in mid-2014. Note: Sample size = 316 FLWs (163 ASHAs and 153 AWWs in treatment subcenters).
Some FLWs felt that the introduction of the ICT-CCS phone expanded their workload considerably
During our process study interviews, AWWs reported that ICDS expected them to continue maintaining their various paper-based registers in addition to entering information into the ICT-CCS phone, which increased their workload significantly. Our qualitative interviews during the endline survey data collection indicated that these concerns had not abated.29,30 For instance, one
29 This was less of a concern for ASHAs, who have fewer registers to maintain than AWWs. 30 In contrast to this finding, 59 percent of endline ASHA and AWW survey respondents noted that having to maintain fewer registers was a benefit of using the ICT-CCS phone (Table III.3). This might be driven by the fact that treatment FLWs no longer have to maintain CARE’s paper-based home visit planner (as mentioned earlier, they do have to continue maintaining all government-mandated registers).
33

III. FINDINGS ON THE IMPLEMENTATION OF THE ICT INTERVENTION MATHEMATICA POLICY RESEARCH
AWW complained that it did not make sense to record take-home ration information on the ICT-CCS phone since beneficiaries could sign to confirm receipt of take-home rations (a protocol required by the government) only in paper-based registers.31 As mentioned earlier, this situation could change in the future if the intervention is scaled up and the government approves it to replace paper-based registers.
31 This information is recorded in an AWW-specific CommCare form that was introduced later into the evaluation period.
34
IV. FINDINGS FROM THE FLW SURVEYS MATHEMATICA POLICY RESEARCH
IV. FINDINGS FROM THE FLW SURVEYS
The ICT-CCS intervention aims to improve household-level family health outcomes by increasing the regularity and timeliness of FLW interactions with households as well as the comprehensiveness, accuracy, and relevance of the information provided to beneficiaries during the interactions. To capture the impacts of the intervention on the regularity of, and the provision of information during, such interactions, we rely primarily on reports from beneficiaries, who are likely to be a more reliable source of those data; these estimates are presented in Chapter V.32 In this chapter, we focus on three important aspects of FLWs’ work that could be affected by the intervention and for which the FLWs are the best source of information—coordination, job confidence, and supervision.
The intervention has the potential to improve each of these aspects, which could be mechanisms for improved FLW-beneficiary interactions. By synchronizing the home visit schedule for a given catchment area across the ASHA and AWW serving it, the intervention seeks to facilitate greater coordination between ASHAs and AWWs and thus ensure that more visits are timely. In addition, by providing FLWs with a range of features to facilitate interactions with beneficiaries (such as a checklist for home visits), the intervention has the potential to improve the confidence of FLWs in interacting effectively with beneficiaries. Finally, the intervention seeks to improve evidence-based supervision of ASHA and AWW activities through ICT-CCS tools for supervisors.
In Section A of this chapter, we establish baseline equivalence between FLWs in the treatment and control groups. The subsequent sections discuss our findings on the impacts of the intervention on FLW outcomes: Section B on coordination between the ASHA and AWW, Section C on measures of job confidence, and Section D on the supervision provided to ASHAs and AWWs. In all our analyses, we combined ASHA and AWW data. Although these two types of FLWs are deployed by different government agencies, one of the key goals of the broader Ananya program is to facilitate (1) improved collaboration between them, and (2) increased integration of the services they provide such that beneficiaries receive comprehensive coverage across the continuum of care. We therefore examined data collected from ASHAs and AWWs jointly, because the intervention intends them to provide similar services to beneficiaries. Combining the ASHA and AWW samples also increases our statistical power to identify the impacts of the intervention.
A. Baseline equivalence of treatment and control FLWs
Before analyzing the impact of the intervention on FLW outcomes, we estimated baseline levels of key indicators for FLWs in the treatment subcenters at baseline, and compared them to FLWs in the control subcenters. These baseline estimates are important both to describe the pre-intervention context and to assess whether the FLWs in the treatment and control subcenters were similar before the implementation of the ICT intervention. If there are systematic
32 In earlier data collection efforts for the Ananya program, we found that FLWs tended to give socially desirable responses when asked about the frequency and nature of their visits with households.
35
IV. FINDINGS FROM THE FLW SURVEYS MATHEMATICA POLICY RESEARCH
preexisting differences by chance, endline differences between treatment and control areas might not reflect intervention impacts.
Specifically, we examined measures from the baseline FLW data on four types of indicators: training received, the availability of a paper-based home visit planner, mobile phone use, and measures of coordination and supervision (Table IV.1). First, we examined the intensity of the training ASHAs and AWWs received (including participation in regular subcenter meetings), because this could influence the extent to which they understand the importance of coordinating with each other, and the extent to which ANMs understand the value of providing supervision based on real-time information. Second, we examined the availability of a paper-based home visit planner at baseline, which the ICT-CCS tool could replace in treatment areas. This gives a sense of the extent to which FLW were likely to have been systematically planning home visits at baseline; treatment-control differences in this indicator at baseline could bias estimates the intervention’s impact on FLW coordination. Third, we compared baseline data on mobile phone use across treatment and control areas, because it is a key determinant of the ability of ASHAs, AWWs, and ANMs to use the ICT-CCS phone for coordination and supervision. Finally, we examined baseline data on some of the key outcomes that are the focus of this chapter—on the extent to which ASHAs and AWWs were coordinating with each other and ANMs were providing regular supervision—to verify that these measures were not substantially different prior to the intervention.
Overall, our analyses indicate that our samples of FLWs were similar prior to program rollout based on their reported activities and outcomes. Before the intervention, ASHAs and AWWs at treatment and control subcenters participated similarly in subcenter meetings (with more than 80 percent attending three or more in the past three months). Similar percentages across treatment and control groups had a home visit planner: investigators observed that about 30 percent of ASHAs and AWWs had the planner in both treatment and control subcenters. Reported mobile phone use was similar for treatment and control groups; for example, between 8 and 9 percent in both treatment and control areas reported having used their mobile phone to send SMS messages, and there were few statistically significant differences in the reported use of their mobile phone for work. Finally, levels of coordination were similar: slightly more than 80 percent of ASHAs and AWWs in both treatment and control areas reported working closely with the opposite-cadre FLW in their catchment area.33
33 There was one significant difference in treatment and control means: in ASHA and AWW reports of the use of mobile phones to call health facilities during home visits. However, this is not unexpected given the large number of variables tested for baseline equivalence. Specifically, we would expect one or two of the differences to be statistically significant at the 5 percent significance level simply by chance.
36

IV. FINDINGS FROM THE FLW SURVEYS MATHEMATICA POLICY RESEARCH
Table IV.1. Baseline performance of treatment and control FLWs (percentages unless otherwise indicated)
Baseline control mean
Adjusted baseline
treatment mean
Adjusted baseline
difference p-Value
ASHA/AWW Sample
Training Participated in 3 or more subcenter meetings in past 3 months 81.6 87.6 6.0 0.21 Reported that number of home visits made in past month was
discussed at most recent meeting 92.8 91.9 -0.9 0.80 Home Visit Planner Interviewer observed home visit planner 30.6 29.1 -1.5 0.75 Mobile Phone Use Has access to functioning mobile phone 72.0 71.9 -0.1 0.99 Percentage ever sent SMS from phone 8.0 9.1 1.1 0.73 Use of phone (among those with access)
Schedule visits/appointments 43.7 34.2 -9.4 0.17 Arrange transportation for women 21.7 18.1 -3.6 0.45 Call health facility during home visits 36.2 24.4 -11.8** 0.04 Request supplies 20.7 21.2 0.5 0.90 Coordinate with ASHA, ANM, and/or supervisor 60.6 62.2 1.5 0.82 Receive payments 22.6 23.1 0.5 0.92 Any work-related purposes 80.7 81.0 0.3 0.96
Coordination with Opposite-Cadre FLW Work closely with ASHA/AWW (opposite-cadre) 81.0 86.0 5.0 0.36 Times met with ASHA/AWW in past 7 days 2.1 2.3 0.2 0.34
ANM Sample
Subcenter Meetings Participated in 3 or more meetings in past 3 months 90.9 86.8 -4.1 0.56 During most recent meeting, ANM or someone else asked ASHAs
and AWWs to coordinate home visits 81.8 85.4 3.5 0.66 Mobile Phone Use Has access to functioning mobile phone 79.5 82.9 3.4 0.68 Percentage ever sent SMS from phone 11.4 12.2 0.8 0.91 Use of phone (among those with access)
Schedule visits/appointments 56.8 61.0 4.2 0.73 Arrange transportation for women 29.5 26.8 -2.7 0.78 Call health facility during home visits 31.8 24.4 -7.4 0.46 Request supplies 31.8 41.5 9.6 0.35 Coordinate with ASHA, ANM, and/or supervisor 81.8 70.7 -11.1 0.26 Receive payments 29.5 29.3 -0.3 0.98 Any work-related purposes 88.6 87.8 -0.8 0.91
Supervision Times per month meet with each ASHA 5.7 5.2 -0.4 0.55 Times per month meet with each AWW 4.5 5.0 0.5 0.65
Source: Ananya ICT RCT baseline FLW surveys conducted by Sambodhi in collaboration with Mathematica in mid-2012. Notes: N = 254 ASHAs and AWWs in control areas, 319 ASHAs and AWWs in treatment areas, 44 ANMs in control areas,
and 41 ANMs in treatment areas. For those with access to a functioning mobile phone: N=235 ASHAs and AWWs in control areas, 179 ASHAs and AWWs in treatment area; 34 ANMs in control areas, and 35 ANMs in treatment areas. Item-specific nonresponse limits the sample size for some comparisons. We adjusted the treatment mean for differences by stratum and FLW cadre using a regression including stratum by cadre-fixed effects.
*/**/*** Significantly different from zero at the .10/.05/.01 level, two-tailed test.
37

IV. FINDINGS FROM THE FLW SURVEYS MATHEMATICA POLICY RESEARCH
ANM samples were also similar across treatment and control groups before the launch of the ICT intervention. Their levels of participation in subcenter meetings were comparable (87 and 91 percent for treatment and control groups respectively), as were the services provided to beneficiaries (for example, just under 80 percent reported distributing contraception in the past month in both treatment and control areas, not shown). There was little variation in mobile phone access and use across treatment and control ANMs. About 80 percent said they had access to a functioning mobile phone, and between 11 and 12 percent reported having used their mobile phone to send SMS messages. In addition, the intensity of the supervision provided by treatment and control ANMs was similar; for example, both groups reported meeting with each AWW in their catchment area about 5 times a month on average.
As an additional check of comparability between the treatment and control groups, we compared the background characteristics of the FLWs we surveyed at endline, which were unlikely to have changed as a result of the intervention (Table IV.2).34 These characteristics were largely similar in the two groups: differences in age, religion, caste, and education were small and not statistically significant across treatment and control ASHAs and AWWs. FLWs in treatment and control groups also had similar levels of literacy (which may be important given its implications for how well FLWs are able to use the ICT-CCS phone and navigate the CommCare forms and applications). About three-fourths of ASHAs and AWWs in both treatment and control areas were able to fluently read aloud a passage included in the survey.
ANMs also had similar profiles in terms of age, religion, and work experience for treatment and control ANMs; differences were generally small and not statistically significant. Some ANM differences were large—for example, more ANMs in treatment subcenters belonged to the “other backward class” category (an 11-percentage-point difference) and ANMs in treatment subcenters were on average more educated than control ANMs (70 percent in intervention areas reported that they had a diploma, compared to 52 percent in non-intervention areas). However, because of the small sample size of ANMs, most differences were not statistically significant.
B. Impact of the intervention on coordination between ASHAs and AWWs
By synchronizing the list of beneficiaries in a given catchment area and records of home visits across the ICT-CCS phones of the ASHA and AWW, the ICT-CCS intervention seeks to facilitate coordination between the ASHA and AWW and thereby reduce gaps in service coverage. Using the endline FLW survey data, we examined whether ASHAs and AWWs communicated more frequently and worked jointly toward ensuring that all beneficiaries received home visits at the appropriate times. We found that ASHAs and AWWs in treatment areas were more likely than those in control areas to rely on the opposite-cadre FLW in their catchment area to fill in for them when they were unable to complete scheduled or planned home visits (Table IV.3). Whereas 46 percent of control ASHAs and AWWs reported having been asked by the opposite-cadre FLW to conduct a home visit when she was unable to, 60 percent of treatment ASHAs and AWWs reported they had been asked to do so, a statistically significant difference. Other measures, such as the regularity of joint visits or the frequency of meetings with the opposite-cadre FLW to plan home visits or discuss work, also suggested better
34 Unlike our household sample, which consisted of separate cohorts of women at baseline and endline, our baseline and endline FLW samples were largely similar (as described in Chapter II).
38

IV. FINDINGS FROM THE FLW SURVEYS MATHEMATICA POLICY RESEARCH
cooperation in the treatment areas compared to the control areas; however these differences were not statistically significant.
Table IV.2. Background characteristics of FLWs (percentages unless otherwise indicated)
Endline control mean
Adjusted endline
treatment mean
Adjusted endline
difference p-Value
ASHA/AWW SAMPLE
FLW Characteristics Lives in village serves 98.3 98.5 0.3 0.813 Current age (average) 35.1 36.1 1.0 0.204 Hindu 96.5 96.6 0.2 0.912 Caste (Hindus only)
SC/ST 9.3 7.0 -2.3 0.336 Other backward caste 68.8 66.5 -2.3 0.672 General caste 21.9 26.6 4.6 0.363
Highest education standard (average) 11.2 11.2 0.0 0.989 Literacy
Could read short passage fluently 72.8 75.7 3.0 0.478 Could read short passage haltingly 25.4 21.6 -3.9 0.354 Could not read short passage 1.8 2.7 0.9 0.527
ANM SAMPLE
Lives in subcenter village 64.3 71.7 7.4 0.398 Current age (average) 43.0 42.6 -0.4 0.864 Hindu 97.6 99.6 2.0 0.318 Caste (Hindus only)
SC/ST 14.3 14.2 -0.1 0.991 Other backward caste 47.6 58.6 11.0 0.370 General caste 38.1 27.1 -11.0 0.341
Education Diploma 52.4 69.9 17.5 0.131 College-level course 7.1 14.5 7.3 0.358 No college-level course 40.5 15.6 -24.9** 0.015
Contractual ANM (position not permanent) 45.2 28.9 -16.3 0.106 Work experience (average years) 14.4 17.5 3.1 0.230 Time at subcenter (average years) 5.2 7.9 2.7** 0.023 Villages in catchment area (average) 5.6 6.2 0.6 0.480 Days per week spent in villages (average) 2.5 2.6 0.1 0.537
Source: ICT RCT endline FLW surveys conducted by Sambodhi in collaboration with Mathematica in mid-2014. Notes: N = 256 ASHAs and AWWs in control areas, 316 ASHAs in AWWs in treatment areas, 42 ANMs in control areas,
and 37 ANMs in treatment areas. The Hindu subsample includes 246 ASHAs and AWWs in control areas, 304 ASHAs and AWWs in treatment areas, 41 ANMs in control areas; and 37 ANMs in treatment areas. Item-specific nonresponse might limit the sample size for some comparisons.
We adjusted the treatment mean for differences by stratum and FLW cadre using a regression including stratum by cadre-fixed effects.
*/**/*** Significantly different from zero at the .10/.05/.01 level, two-tailed test.
39

IV. FINDINGS FROM THE FLW SURVEYS MATHEMATICA POLICY RESEARCH
Table IV.3. Coordination between ASHAs and AWWs (percentages)
Endline control mean
Adjusted endline
treatment mean
Adjusted endline
difference p-Value
Asked Opposite-Cadre FLW to Conduct a Home Visit When Unable to (in past 30 days) 51.8 59.4 7.6 0.167
Asked by Opposite-Cadre FLW to Conduct a Home Visit When They Were Unable to (in past 30 days) 45.6 59.8 14.2** 0.018
Met with Opposite-Cadre FLW to Talk About Work or Home Visits in Past 7 Days 65.1 71.0 5.9 0.234
Conducted at Least One Home Visit Jointly with Opposite-Cadre FLW in the Past 7 Days 47.2 55.3 8.2 0.135
Source: ICT RCT endline ASHA and AWW surveys conducted by Sambodhi in collaboration with Mathematica in mid-2014.
Notes: N = 256 ASHAs and AWWs in control areas and 316 ASHAs in AWWs in treatment areas. Item-specific nonresponse might limit the sample size for some comparisons. Adjusted treatment mean, difference, and p-value derived from regression controlling for random assignment strata, FLW cadre (ASHA or AWW), FLW demographic characteristics (whether FLW is a resident of the village she serves, age, religion, SC/ST status, and literacy [as determined by ability to read a passage]), and catchment area characteristics (whether women in the area are predominantly SC/ST or Muslim), and the interaction between each variable for strata, FLW characteristics, and catchment area characteristics with FLW cadre. Standard errors correct for clustering at the subcenter level.
*/**/*** Significantly different from zero at the .10/.05/.01 level, two-tailed test.
C. Impact of the intervention on job confidence
FLWs in treatment areas demonstrated greater confidence in their work. When we asked ASHAs and AWWs whether they thought they had the skills needed to do their job, treatment respondents were significantly more likely than control respondents to report having all the neccessary skills (38 percent in treatment areas, compared to 28 percent in control areas) (Table IV.4). Importantly, FLWs appeared to be confident about home visit scheduling, the primary means of expanding service coverage. Significantly fewer ASHAs and AWWs in treatment than in control subcenters expressed the need to learn how to plan visits (19 percent in treatment areas, compared to 32 percent in control areas). ANMs in treatment subcenters were also significantly more likely to have run the last subcenter meeting in their catchment area without assistance (89 percent compared to 69 percent in control subcenters). This could reflect improved job confidence, though the ANMs’ perceived need for additional skills was not significantly different in the treatment and control groups.
40

IV. FINDINGS FROM THE FLW SURVEYS MATHEMATICA POLICY RESEARCH
Table IV.4. FLW job confidence (percentages)
Endline control mean
Adjusted endline
treatment mean
Adjusted endline
difference p-Value
ASHA/AWW SAMPLE FLW Feels they Have All Skills Needed for Job 27.7 38.0 10.3** 0.039 FLW Feels they Need Skills Related to:
How to plan home visits 32.3 19.2 -13.1** 0.012 How to maintain registers 30.2 16.4 -13.8*** 0.001 Maternal and newborn health issues 44.9 37.1 -7.8 0.236 How to communicate better with mothers and families 32.2 33.6 1.4 0.787 How to use the ICT-CCS phone without assistance 0.0 18.0 18.0*** 0.000
ANM SAMPLE Ran Last Subcenter Meeting by Herself 69.0 89.2 20.1** 0.019 ANM Reports Needing More Skills to Lead Subcenter Meetings 42.9 39.5 -3.4 0.763 ANM Reports Needing Skills Related to:
How to review records/registers 27.8 21.2 -6.6 0.750 Teaching or discussing health topics 50.0 69.0 19.0 0.366 How to run a meeting/facilitation skills 50.0 40.1 -9.9 0.627 Public speaking/communication skills 38.9 28.1 -10.7 0.562 Answering questions about FLWs’ ICT-CCS phones 27.8 29.4 1.7 0.941 How to use supervisory phone 0.0 18.2 18.2 0.194 Other 5.6 1.4 -4.1 0.437
Source: ICT RCT endline FLW surveys conducted by Sambodhi in collaboration with Mathematica in mid-2014. Notes: Negative differences indicate a favorable treatment-comparison difference for all outcomes on this table, except
the “ran last subcenter meeting by herself” measure. Sample sizes for ASHA/AWW analysis are 256 ASHAs and AWWs in control areas and 316 ASHAs and AWWs
in treatment areas. Adjusted treatment mean, difference, and p-values for ASHA/AWW analysis are derived from regression controlling for random assignment strata, FLW cadre (ASHA or AWW), FLW demographic characteristics (whether FLW is a resident of the village she serves, age, religion, SC/ST status, and literacy [as determined by ability to read a passage]), and catchment area characteristics (whether women in the area are predominantly SC/ST or Muslim), and the interaction between each variable for strata, FLW characteristics, and catchment area characteristics with FLW cadre.
Sample size for ANM analysis includes 42 ANMs in control areas and 37 ANMs in treatment areas. Adjusted treatment mean, difference, and p-value for ANM analysis are derived from regression controlling for random assignment strata.
Item-specific nonresponse limits the sample size for some outcome measures. All standard errors correct for clustering at the subcenter level.
*/**/*** Significantly different from zero at the .10/.05/.01 level, two-tailed test.
41

IV. FINDINGS FROM THE FLW SURVEYS MATHEMATICA POLICY RESEARCH
D. Impact of the intervention on supervision provided to ASHAs and AWWs
By enabling the collection of real-time data on the conducting of home visits and key health indicators from beneficiaries, the ICT-CCS intervention also intends to facilitate improved management and supervision. ANMs and LSs have the ability to pull up reports on the home visits conducted by ASHAs and AWWs in their catchment area (which can increase accountability on the part of these supervisees), and review any movement in key antenatal care, delivery, newborn care, immunization, nutrition, and family planning indicators (which can facilitate the provision of targeted input on what practices the ASHAs and AWWs should promote during interactions with households). As noted earlier, phones for supervisors were not included as part of the intial intervention, and were only introduced between February and April, 2013 (though there would still have been a full year of exposure to these tools by the time the endline was conducted).
Using our FLW survey data, we first analyzed whether the intervention had improved the regularity of supervisory interactions with ASHAs and AWWs in their catchment areas. We found, in general, that the frequency with which these interactions took place varied little across treatment and control subcenters. Differences between treatment and control areas in whether the ASHA or AWW met with her supervisor in the past three months outside the subcenter meetings and the average number of such meetings in the six months before the interview were close to zero and statistically insignificant (Table IV.5).
We also analyzed the content of information or oversight provided during supervisory interactions. ASHA and AWW reports of advice received by their supervisor were higher in treatment areas for most types of advice, but only one of the treatment-control differences was large enough to be even marginally statistically significant. Specifically, 49 percent of treatment ASHAs and AWWs reported that during most recent visits, their supervisor gave them guidance on how to communicate with households, compared to 40 percent of control ASHAs and AWWs.
ANM reports of the regularity of supervisory meetings are equally consistent across treatment and control subcenters. Again the treatment-control difference is close to zero and statistically insignificant for the following indicators: the average number of times the ANM met with ASHAs outside the subcenter meetings each month, the monthly frequency of non-subcenter meetings with AWWs, and the average number of hours per week the ANM is available to help ASHAs and AWWs outside the subcenter meetings (Table IV.6). ANMs may also provide supervision and oversight by accompanying ASHAs and AWWs on their home visits, either to observe and provide input or to participate in persuading households to adopt appropriate family health behaviors. We found that the intervention had not influenced the regularity of such mentoring activities—there was no significant difference between treatment and control areas in the average number of times ANMs conducted either observations of ASHA and AWW home visits or joint visits with ASHAs and AWWs.
42

IV. FINDINGS FROM THE FLW SURVEYS MATHEMATICA POLICY RESEARCH
Table IV.5. ASHA and AWW reports of supervision they received (percentages unless otherwise indicated)
Endline control mean
Adjusted endline
treatment mean
Adjusted endline
difference p-Value Supervised by:
Lady Supervisor 64.2 65.1 0.9 0.386 ANM 22.2 24.3 2.1 0.392 Lady Health Visitor 0.5 0.2 -0.3 0.545 CDPO 0.0 0.0 0.0 ASHA Facilitator 11.6 8.8 -2.8 0.192 Other 1.4 1.5 0.1 0.901
Met with Supervisor in Past 3 Months Outside Subcenter Meeting 98.6 98.2 -0.4 0.754
Number of Times Met with Supervisor in Past 3 Months Outside Subcenter Meeting (average) 3.7 3.8 0.1 0.715
Number of Times Met with Supervisor in Past 6 Months Outside Subcenter Meeting (average) 6.9 6.9 0.0 0.892
Supervisor Available by Phone or in Person When FLW Needs to Reach Her
Always 77.8 81.4 3.6 0.486 Sometimes 21.3 16.9 -4.3 0.377 Never 0.9 1.7 0.7 0.480
During Recent Visits, Supervisor, Most of the Time: Brought outstanding visits to the FLW’s attention 77.0 73.4 -3.6 0.457 Gave the FLW guidance on what information to give
to households 53.6 57.4 3.8 0.503 Gave the FLW guidance on how to communicate
effectively with households 40.0 49.1 9.1* 0.074 Talked to the households the FLW was finding difficult
to convince 38.3 44.8 6.5 0.228 Helped FLW coordinate with her counterpart 50.9 56.0 5.1 0.365
Source: ICT RCT endline FLW surveys conducted by Sambodhi in collaboration with Mathematica in mid-2014. Notes: N = 256 ASHAs and AWWs in control areas and 316 ASHAs in AWWs in treatment areas. Item-specific
nonresponse might limit the sample size for some comparisons. Adjusted treatment mean, difference, and p-value derived from regression controlling for random assignment strata, FLW cadre (ASHA or AWW), FLW demographic characteristics (whether FLW is a resident of the village she serves, age, religion, SC/ST status, and literacy [as determined by ability to read a passage]), and catchment area characteristics (whether women in the area are predominantly SC/ST or Muslim), and the interaction between each variable for strata, FLW characteristics, and catchment area characteristics with FLW cadre. Standard errors correct for clustering at the subcenter level.
*/**/*** Significantly different from zero at the .10/.05/.01 level, two-tailed test.
We also analyzed data on the extent to which ASHA and AWW home visit records were reviewed by ANMs (as reported by ANMs), which is a potentially important mechanism to increase accountability and promote regular and timely home visits by FLWs. We found, overall, that ANM review of home visit records during subcenter meetings was similar in treatment and control areas (about 90 percent). However, the division of responsibilities with CARE was different: review by the ANM alone was more common in treatment areas (as opposed to joint review with CARE), though the difference was not statistically significant. In addition, most of the records that were not reviewed by ANMs in treatment areas (almost 10 percent of the total) were reviewed by CARE, whereas these records went without review in the control areas. This might be anticipated based on the greater involvement of CARE in treatment areas as a result of the introduction of the ICT-CCS intervention.
43

IV. FINDINGS FROM THE FLW SURVEYS MATHEMATICA POLICY RESEARCH
Table IV.6. ANM reports of supervision provided to ASHAs and AWWs (percentages unless otherwise indicated)
Endline control mean
Adjusted endline
treatment mean
Adjusted endline
difference p-Value
Hold Meetings in Subcenter 97.6 100.0 2.4 0.286 Attended All 3 Subcenter Meetings in Past 3 Months 92.9 93.7 0.8 0.880 Home Visit Registers or Work Phones Reviewed at
Subcenter Meeting By ANM alone 61.9 70.8 8.9 0.406 By ANM and CARE facilitator 28.6 20.1 -8.4 0.344 By CARE facilitator alone 0.0 9.1 9.1* 0.078 By no one 9.5 0.0 -9.5** 0.043
Times per Month Meet with ASHAs Outside Subcenter Meeting (average) 6.2 6.5 0.3 0.855
Times per Month Meet with AWWs Outside Subcenter Meeting (average) 4.6 3.4 -1.3 0.197
Number of Hours per Week the ANM Is Typically Able to Help ASHA/AWW Outside the Subcenter Meetings (average) 5.0 5.6 0.6 0.462
ANM Supports and Monitors: ASHAs the most 59.5 46.3 -13.2 0.219 AWWs the most 4.8 6.8 2.1 0.700 Both ASHAs and AWWs equally 35.7 46.9 11.2 0.274
Number of Times Accompanied ASHA and Observed Home Visits in Past 30 Days (average) 2.4 3.0 0.6 0.334
Number of Times Accompanied AWW and Observed Home Visits in Past 30 Days (average) 1.2 1.4 0.1 0.733
Number of Joint Visits Conducted with ASHA to Address Difficult Cases in the Past Week (average) 1.0 1.2 0.2 0.415
Number of Joint Visits Conducted with AWW to Address Difficult Cases in the Past Week (average) 0.5 0.6 0.0 0.783
Source: ICT RCT endline ANM surveys conducted by Sambodhi in collaboration with Mathematica in mid-2014. Notes: N = 42 ANMs in control areas and 37 ANMs in treatment areas. Item-specific nonresponse might limit the sample
size for some comparisons. Adjusted treatment mean, difference, and p-value derived from regression controlling for random assignment strata. Standard errors correct for clustering at the subcenter level.
*/**/*** Significantly different from zero at the .10/.05/.01 level, two-tailed test.
E. Summary of findings from FLW surveys
Overall, the results from the FLW surveys suggest that the ICT-CCS intervention had substantive effects on how FLWs performed their jobs. Consistent with the ICT-CCS tool’s emphasis on helping to coordinate home visits for FLWs serving a given catchment area, ASHAs and AWWs in treatment areas were more likely than those in control areas to report that they coordinated home visits with the opposite-cadre FLW serving the same beneficiaries. This is despite some of the technical challenges noted in Chapter III in synchronizing home visit records across ASHAs and AWWs. FLW reports also suggest that the ICT-CCS tool increased their confidence in their ability to perform their jobs. However, FLW reports did not suggest any substantial improvements in supervision of ASHAs and AWWs. In the next chapter, we examine the extent to which these impacts on FLWs were accompanied by impacts on home visits (and health behaviors) as reported by beneficiaries.
44

V. FINDINGS FROM THE BENEFICIARY SURVEY MATHEMATICA POLICY RESEARCH
V. FINDINGS FROM THE BENEFICIARY SURVEY
The ICT-CCS intervention sought to facilitate FLWs’ interactions with households by helping FLWs plan their home visits and provide information during them. Once a pregnancy was registered, the ICT-CCS phone issued reminders to conduct visits at appropriate times, and provided checklists and videos with messages to promote key health behaviors across the continuum of care. The theory of change of the ICT-CCS intervention posits that by equipping FLWs with this tool, their interactions with households will be more regular, timely, and informative. In turn, this is expected to improve households’ health-related behaviors, either through improved knowledge or by provision of targeted information to persuade them to adopt behaviors they are already aware of but reluctant to adopt. Therefore, to assess the impact of the ICT-CCS intervention on beneficiaries, we focus on proximal outcomes related to FLW-household interactions and household knowledge, as well as a broad set of health-related outcomes.
In this chapter, we describe the results for these key outcomes from the beneficiary survey. We begin by assessing whether our random assignment design created equivalent treatment and control groups. Next, we examine impacts on FLW interactions with beneficiaries from the beneficiaries’ perspective, as well as impacts on their knowledge that might have mediated changes in behavior. We then assess impacts on a broad set of health behaviors in each of the following domains targeted by the ICT-CCS intervention and the Ananya program more broadly: antenatal care and delivery preparation, delivery and newborn care, child nutrition, child immunizations, and reproductive health. We also examine the extent to which impacts varied across key subgroups of interest. Because we examine impacts on a large set of outcomes, we have to be mindful that some differences can be significant simply by chance (this is known as the multiple comparisons issue; see Schochet 2008). We therefore take care to examine the overall pattern of impacts in each domain before drawing conclusions about the impacts of the intervention. Finally, we compare our findings to those of the overall Ananya midline evaluation (Borkum et al. 2014b), which evaluated the impact of the core Ananya interventions without the ICT-CCS tool.
A. Baseline equivalence
Random assignment should ensure that the treatment and control groups are, on average, statistically equivalent at baseline. However, an unlucky draw can cause the treatment and control groups to differ by chance, which might violate the assumptions underlying the random assignment design. Therefore, to verify the similarity of the two groups at baseline, we compared demographic characteristics and key outcomes for beneficiaries in our baseline survey (Table V.1). These comparisons show that the treatment and control groups were very similar at baseline. Only 2 of the 22 baseline differences we considered (namely receiving at least three antenatal care visits and consuming at least 90 IFA tablets) were statistically significant: no more than would be expected by chance.35 This suggests that the random assignment was successful in
35 Because the two baseline differences that were statistically significant were both in the antenatal care domain, we conducted comparisons for all baseline variables available in that domain (not shown). No other baseline differences in this domain were statistically significant, which suggests that the two significant differences are more likely to be due to sampling variance rather than to a systematic difference between treatment and control subcenters.
45

V. FINDINGS FROM THE BENEFICIARY SURVEY MATHEMATICA POLICY RESEARCH
Table V.1. Baseline differences in characteristics and outcomes between treatment and control beneficiaries (percentages unless otherwise indicated)
Baseline control mean
Adjusted baseline
treatment mean
Adjusted baseline
difference p-Value Sociodemographic Characteristics of Respondent
Hindu 88.8 92.6 3.8 0.230 SC/STa 53.8 53.7 -0.1 0.987 Age (mean, years) 25.6 25.5 -0.1 0.716 Birth parity (mean, number of children) 2.5 2.4 0.0 0.741 Literate 24.7 29.0 4.3 0.141 SES quartile (mean, quartile)b 2.3 2.4 0.1 0.386
Antenatal Care At least 3 ANC visits 23.9 36.7 12.8*** 0.001 Consumed at least 90 IFA tablets 9.7 15.5 5.7* 0.060
Delivery and Postnatal Care Facility delivery 76.8 76.1 -0.7 0.872 Nothing applied to cord and umbilicus 26.3 22.5 -3.8 0.355 Immediate breastfeeding 46.8 44.6 -2.3 0.623 Exclusive breastfeeding for 6 months, children 6 months
or olderc 38.0 33.9 -4.1 0.488 Exclusive breastfeeding in past 24 hours, children
younger than 6 monthsd 64.3 60.1 -4.2 0.375 Child Nutrition, Children 6 Months or Older
Child eats solid or semisolid food 64.3 56.7 -7.6 0.208 Child ate cereal-based meal in previous day 52.6 49.8 -2.8 0.614
Immunizations, Children 6 Months or Older Child received DPT3 62.6 65.0 2.4 0.671 Child fully immunized (except measles) 40.2 41.3 1.1 0.853
Reproductive Health Use of permanent methods 10.7 10.8 0.1 0.958 Use of any modern method (ever)e 23.3 26.5 3.2 0.546 Use of any modern method (current)e 18.4 18.7 0.3 0.945
FLW Interactions At least two ASHA/AWW home visits in final trimesterf 36.4 35.1 -1.3 0.818 Any ASHA/AWW/ANM visit in first month after deliveryf 12.4 13.2 0.7 0.842
Source: Ananya ICT RCT baseline beneficiary survey conducted by Sambodhi in collaboration with Mathematica in mid-2012.
Notes: Treatment means and treatment-control differences are adjusted for differences in random assignment stratum using an ordinary least squares regression with stratum-fixed effects. Reported p-values account for clustering of standard errors at the subcenter level.
Sample sizes are 1,435 to 1,559 (all women), 685 (children younger than 6 months), and 810 to 816 (children 6 months or older).
a Defined only for women who are Hindu. b SES quartile determined using coefficients and cutoffs from a principal components analysis using the Ananya statewide 2012 baseline data (following the methodology of the National Family Health Survey’s wealth index). Quartiles are therefore relative to the 2012 statewide SES distribution for women who gave birth in the previous 12 months. c Based on self-reports of the duration of exclusive breastfeeding for children 6 months or older. d Based on reports of liquids and solids fed to children younger than 6 months old in the previous 24 hours, following the recommended definition of the World Health Organization. e Defined as use of male or female sterilization, birth control pills, condoms, injectables, or an IUD. f In the baseline survey this included home visits by an ASHA, an AWW, or an ANM, while in the endline survey it included only home visits by an ASHA or an AWW. */**/*** Significantly different from zero at the .10/.05/.01 level, two-tailed test.
46

V. FINDINGS FROM THE BENEFICIARY SURVEY MATHEMATICA POLICY RESEARCH
creating equivalent treatment and control groups and increases our confidence that any statistically significant differences between the groups at endline are unlikely to be spurious. Nevertheless, to account for some of the baseline differences that we did observe, we controlled for baseline levels of the outcome aggregated to the subcenter level in the impact analysis.37
B. Endline sociodemographic characteristics
The demographic and socioeconomic characteristics of the surveyed beneficiaries provide important context about the population targeted by the ICT-CCS intervention. In addition, because these characteristics might be correlated with the outcomes of interest, it is important to confirm that they are similar between the treatment and control groups at endline. Otherwise, chance differences in the characteristics of the endline treatment and control samples (which are unlikely to have been affected by the intervention) might be driving the observed impacts.
Most of the sociodemographic characteristics that we examined were similar in the treatment and control groups at endline, including scheduled caste/tribe status, education level, literacy, and SES status. These characteristics suggest that the endline sample of beneficiaries was quite disadvantaged: about half the treatment and control groups belonged to scheduled castes or tribes, more than half had no formal education whatsoever, and only slightly more than a third could read and write. Relative to the overall population of women who had recently given birth in Bihar, the sample was more concentrated in the middle of the SES distribution, with almost 65 percent of women in the second and third statewide SES quartiles, compared with about 50 percent across the state.38 The mean woman in the treatment sample was about 24 years old and had two children; the distributions of age of the women surveyed and birth parity was also similar between the treatment and control groups.
However, some sociodemographic characteristics were statistically different between the treatment and control groups (Table V.2). The treatment group was about 4 percentage points more likely to be Hindu (4 percent more than the control mean of 87 percent) and about 9 percentage points less likely to have a below-poverty-line (BPL) card (12 percent less than the control mean of 75 percent). The average household in the treatment group was also slightly larger than in the control group (7 percent larger than the control mean of 5.1 people). Although statistically significant, these differences were small in magnitude relative to the respective control means, and are unlikely to drive the impacts that we observe. Nevertheless, we control for related individual-level sociodemographic characteristics in the impact analysis to reduce any bias arising from these endline differences and to improve the precision of the estimates.39
37 Although we conducted the beneficiary survey in the same villages at baseline and endline, we surveyed different cohorts of women (those who had given birth in the previous year). Therefore, the individual-level controls in the endline analysis were limited to individual demographic characteristics—we were not able to control for baseline health outcomes at the individual level. 38 These SES quartiles were created following the methodology of the National Family Health Survey and were based on the statewide SES distribution of women who had given birth in the previous year in the 2012 Ananya baseline survey. 39 Specifically, as described in Appendix A, we control for whether a woman belongs to a scheduled caste or tribe, whether she is Hindu, the number of her children, her age, her literacy, and her SES quartile.
47

V. FINDINGS FROM THE BENEFICIARY SURVEY MATHEMATICA POLICY RESEARCH
Table V.2. Endline demographic and socioeconomic characteristics of beneficiary respondents (percentages unless otherwise indicated)
Endline control mean
Adjusted endline
treatment mean
Adjusted endline
difference p-Value
Hindu 87.0 90.6 3.6** 0.043 SC/STa 51.8 48.3 -3.4 0.279 Household Size (mean, number of people) 5.1 5.5 0.4*** 0.001 Age
15–19 years 7.7 9.8 2.2 0.205 20–24 years 41.8 44.2 2.4 0.414 25–29 years 33.2 31.8 -1.3 0.638 30–34 years 14.0 10.1 -3.8* 0.052 35–49 years 3.4 4.0 0.6 0.628 0.304c Mean (years) 24.8 24.4 -0.4 0.145
Birth Parity 1 child 37.7 34.5 -3.2 0.261 2 children 28.6 28.2 -0.4 0.882 3 children 18.1 17.5 -0.6 0.813 4 or more children 15.6 19.8 4.2* 0.072 0.345c
Mean (number of children) 2.2 2.4 0.1 0.135 No Formal Education 60.4 56.1 -4.3 0.146 Literate 34.7 38.5 3.8 0.191 BPL Card 75.2 66.5 -8.7*** 0.001 SES Quartileb
Quartile 1 15.6 15.4 -0.2 0.937 Quartile 2 28.2 29.9 1.7 0.539 Quartile 3 32.9 34.2 1.3 0.648 Quartile 4 23.3 20.5 -2.8 0.250 0.802c
Mean (quartile) 2.6 2.6 0.0 0.475
Source: Ananya ICT RCT endline beneficiary survey conducted by Sambodhi in collaboration with Mathematica in mid-2014.
Notes: Treatment means and treatment-control differences are adjusted for differences by random assignment stratum using a regression with stratum-fixed effects. Reported p-values account for clustering of standard errors at the subcenter level. Sample size is 1,396 to 1,559.
a Defined only for women who are Hindu. b SES quartile determined using coefficients and cutoffs from a principal components analysis using the Ananya statewide 2012 baseline data (following the methodology of the National Family Health Survey’s wealth index). Quartiles are therefore relative to the 2012 statewide SES distribution for women who gave birth in the previous 12 months. c p-Values are for the test of equivalence of distributions between the treatment and control groups and account for clustering of standard errors at the subcenter level. */**/*** Significantly different from zero at the .10/.05/.01 level, two-tailed test.
48

V. FINDINGS FROM THE BENEFICIARY SURVEY MATHEMATICA POLICY RESEARCH
C. Impacts on FLW-beneficiary interactions
The core Ananya program was implemented in both treatment and control areas, and aimed to increase the number and quality of FLW-household interactions. The ICT-CCS intervention implemented in the treatment areas aimed to further improve these interactions by providing a tool that reminded FLWs to conduct home visits on time and provide relevant messages and advice at several points in the continuum of care. These improvements in FLW home visits are the primary mechanism through which the intervention is expected to affect health behaviors. We therefore examined the impact of ICT-CCS on the frequency and nature of these interactions, the most proximal outcomes to the intervention, as reported by the beneficiaries themselves (Table V.3).40
Table V.3. Impacts on FLW interactions with beneficiaries and advice received by beneficiaries (percentages unless otherwise indicated)
Endline control mean
Adjusted endline
treatment mean
Adjusted endline
difference p-Value
During pregnancy Interactions with ASHA/AWW in Last Trimester:
Home visits Any visit 59.5 65.7 6.2* 0.091 2 or more visits 41.8 51.6 9.8** 0.012
Any interactions (including outside the home) Any interaction 63.1 70.2 7.1* 0.056 2 or more interactions 52.5 61.0 8.5** 0.020
Advice Received: Advice on TT injections 81.1 81.4 0.2 0.917 Advice on IFA tablets:
FLW gave advice 69.6 69.6 -0.1 0.980 FLW told woman to consume at least 90 IFA tablets 36.6 34.6 -2.0 0.591 FLW explained benefits 43.9 44.5 0.6 0.890
Advice on delivery preparation Advice on saving money for delivery 54.5 58.0 3.5 0.374 Advice on identifying facility for delivery 45.1 49.0 3.9 0.308 Advice on any maternal danger signsb 44.8 48.2 3.4 0.295
Information on transportation for delivery ASHA or AWW gave phone number of ambulance 22.9 29.1 6.2 0.104 ASHA or AWW gave phone number of private vehicle 17.6 20.2 2.6 0.413 ASHA or AWW gave own phone number 32.5 37.3 4.8 0.215
40 Measuring the frequency of FLW home visits is challenging, because such visits may occur for various reasons—for example, providing advice, weighing the child, taking the child for immunizations, or even social reasons. The levels of reported interactions in the ICT endline survey were in general substantially higher than those in the baseline survey, even in the control areas. For example, the proportion of women in the control group reporting a home visit in the first month after delivery was more than five times higher in the ICT endline (67 percent) compared to the ICT baseline (12 percent). The ICT endline levels were also much higher than those reported in the overall Ananya midline survey, which was conducted across Bihar just a few months prior to the ICT endline (16 percent for Saharsa as a whole, with a 95 percent confidence interval of between 2 and 30 percent). This suggests that home visits might not have been measured in a consistent manner across survey rounds. However, because measurement was similar in treatment and control groups in each round, this should not bias the results of the study.
49

V. FINDINGS FROM THE BENEFICIARY SURVEY MATHEMATICA POLICY RESEARCH Table V.3 (continued)
Endline control mean
Adjusted endline
treatment mean
Adjusted endline
difference p-Value
After delivery Interactions with ASHA/AWW After Delivery
Home visits: Visit in first 24 Hours 38.9 42.8 3.8 0.307 Any visit in the first week 60.4 72.8 12.4*** 0.005 Any visit after first week but before first month 44.9 48.4 3.5 0.349 Any visit in the first month 67.4 73.5 6.1* 0.095 Total number of home visits in the first month (mean) 1.8 2.1 0.3* 0.092
All interactions: Any interaction in the first month 68.3 75.1 6.8* 0.068 Total number of interactions in the first month (mean) 2.1 2.5 0.4* 0.077
Advice by ASHA/AWW in First Month After Delivery Any advice on infant danger signsc 47.3 50.4 3.1 0.461 Advice on keeping cord clean 54.9 55.9 1.0 0.798 Advice on skin-to-skin care 45.2 48.8 3.6 0.286 Advice on exclusive breastfeeding 48.4 55.3 6.9* 0.089
Complementary feeding ASHA/AWW Interactions Related to Complementary Feeding
(children 5 months or older)
Any home visit related to complementary feeding 35.9 44.8 9.0** 0.022 Any interaction related to complementary feeding 40.5 46.6 6.0 0.120
Advice by ASHA/AWW on complementary feeding Advised to start feeding at age 6 months 24.4 33.2 8.9*** 0.005 Advice on types of food 25.6 34.2 8.6** 0.012 Advice on times to feed 24.1 33.9 9.8*** 0.008 Advised on quantity of food using katori 20.8 27.5 6.7* 0.065 Advised to feed from separate bowl 23.6 32.6 9.0** 0.017
Reproductive health Interactions with ASHA/AWW to Discuss Family Planning
Any visit at home by ASHA/AWW about family planningb 26.9 29.3 2.4 0.537 Any interaction with ASHA/AWW about family planning 30.4 30.8 0.5 0.308 Any interaction during pregnancy 21.2 17.7 -3.5 0.329 Any interaction after delivery 14.5 18.2 3.7 0.196
Source: Ananya ICT RCT endline beneficiary survey conducted by Sambodhi in collaboration with Mathematica in mid-2014.
Notes: Treatment means and treatment-control differences are adjusted using ordinary least squares regressions that control for stratum-fixed effects; indicators of demographic characteristics (SC/ST, Hindu, number of children, woman’s age, woman’s literacy, SES quartile, and indicators for missing values for each characteristic); and subcenter-level baseline means of the outcome (when available). Reported p-values account for clustering of standard errors at the subcenter level. Sample sizes are 1,489 to 1,553 (all women) and 1,030 to 1,045 (children 5 months or older).
a In the baseline survey this included home visits by an ASHA, an AWW, or an ANM, while in the endline survey it included all interactions with an ASHA or an AWW. b Includes discussions on excessive vaginal bleeding, severe pain in lower abdomen, high fever, and foul-smelling vaginal discharge. c Includes discussions on loss of interest in breastfeeding, difficult or rapid breathing, pneumonia, being cold to the touch, and being drowsy or difficult to awaken.
*/**/*** Significantly different from zero at the .10/.05/.01 level, two-tailed test.
50

V. FINDINGS FROM THE BENEFICIARY SURVEY MATHEMATICA POLICY RESEARCH
1. Impacts on frequency of FLW-beneficiary interactions There were large and statistically significant impacts across several outcomes related to the
frequency of FLW home visits:
• First, there were significant impacts on the frequency of home visits in the final trimester of pregnancy, which are a focus of the overall Ananya program to encourage birth preparedness and appropriate newborn care. At endline, 52 percent of the treatment group reported receiving two or more home visits by the ASHA or AWW in the final trimester compared to 42 percent of the control group (a significant regression-adjusted difference of 10 percentage points, or 23 percent of the control mean).
• Second, there were impacts on FLW home visits after delivery, which the Ananya program promotes to encourage appropriate newborn care and to identify mothers and infants with potentially serious danger signs. Although there was no significant impact on home visits within the first 24 hours after delivery or returning from a facility, there were significant impacts on visits within the first week and month after delivery. Specifically, 73 percent of the treatment group reported a visit by the ASHA or AWW in the first week after delivery, compared to 60 percent of the control group (a significant regression-adjusted difference of about 12 percentage points, or 20 percent of the control mean). There was also a significant impact on visits in the first month after delivery, reported by 74 percent of the treatment group and 67 percent of the control group (a significant regression-adjusted difference of 6 percentage points, or 9 percent of the control mean). The impact on visits in the first month is driven by impacts on visits in the first week, as there were no significant impacts on visits after the first week but before the first month.
• Third, there were significant impacts on FLW visits related to complementary feeding for children 5 months or older. In the treatment group, 45 percent of beneficiaries reported such a visit, compared to 36 percent of the control group (a significant regression-adjusted difference of 9 percentage points, or 25 percent of the control mean).
• Finally, the one exception to impacts on home visits is impacts on visits related to family planning. These were not significantly different between the treatment and control groups, for family planning visits either during pregnancy or after delivery. This could be because messages about family planning were integrated into other types of visits; the ICT-CCS tool did not schedule specific visits related to family planning.
In the analysis described above, we focused on interactions with beneficiaries at their homes because the reminders provided by the ICT-CCS intervention were for home visits. However, there may have been interactions between FLWs and beneficiaries outside the home that the intervention could plausibly have affected. For example, if a beneficiary was due for a home visit and the FLW encountered her outside the home, the FLW might have used the tool to provide the relevant information at that time. To explore this possibility, we also captured information on interactions outside home visits, and investigated whether our results were affected by including these contacts along with home visits in our measure of interactions (Table V.3). The level of interaction increases once contacts outside home visits are included, though such increases are generally modest (less than 10 percent of the mean for home visits alone). However, the overall differences between treatment and control are similar when we include interactions outside the
51

V. FINDINGS FROM THE BENEFICIARY SURVEY MATHEMATICA POLICY RESEARCH
home, which suggests that these interactions are not a key channel through which the intervention affected health behavior.
2. Impacts on quality of FLW-beneficiary interactions In addition to increasing the frequency of home visits, the ICT-CCS intervention also seeks
to improve their quality. Ideally, measures of the quality of FLW home visits would include a detailed assessment of the content of the interactions between the FLW and the mother. Observations of these interactions, vignettes for FLWs, and interviews of mothers soon after the interaction are other potential options for understanding the quality of FLW home visits. While these approaches would allow a more in-depth assessment and reduce recall error, the bias introduced by direct observation might be a significant limitation. In addition, these approaches would be substantially more resource intensive. They were therefore not feasible for our evaluation.
Instead, we focus on four measures available in our endline survey that could reflect visit quality: (1) receipt of targeted advice from FLWs, especially during home visits; (2) duration of home visits; (3) use of Ananya job aid tools during home visits; and (4) discussions with other household members who may influence women’s health behaviors in the Bihar social context, namely, the husband and the mother-in-law. These measures are likely to be correlated with quality, though not perfectly so. For example, improved FLW skills could eventually reduce the need for job aid tools, while longer home visits reflect quality only to the extent that they may relate to the amount or effectiveness of information provided. In addition, these measures may be imprecise because of recall error. Therefore, they should be viewed as suggestive of improved quality; by examining multiple measures, we hope to provide a broad analysis of quality.
Our first measure of quality was the probability of receiving advice on specific topics from FLWs during home visits and other interactions (the survey did not distinguish between advice given inside and outside the home). There were no statistically significant differences in the probability of receiving advice on key topics related to antenatal care, such as delivery preparation during final trimester interactions (Table V.3). The beneficiaries in the treatment group were also no more likely than those in the control group to have received advice on newborn care practices, such as identifying infant danger signs, clean-cord care, and skin-to-skin care during visits in the first month after delivery. However, there was a significant impact on advice related to exclusive breastfeeding for infants during these visits. In the treatment group, 55 percent of beneficiaries reported receiving advice on exclusive breastfeeding for 6 months; in the control group, 48 percent reported receiving this advice (a significant regression-adjusted difference of 7 percentage points, or 14 percent of the control mean).
This pattern is consistent with the impacts on the frequency of home visits described above. Specifically, advice on many of the newborn care topics that we measured (such as clean-cord care and skin-to-skin care) is most relevant immediately after delivery, and there were no impacts on home visits in the first 24 hours after delivery. In contrast, advice on exclusive breastfeeding is relevant during later visits, and there were impacts on visit frequency in the first week and month after delivery.
In contrast to the limited impacts on advice given during final trimester and post-delivery interactions, impacts on advice on complementary feeding were all large, positive, and 52

V. FINDINGS FROM THE BENEFICIARY SURVEY MATHEMATICA POLICY RESEARCH
statistically significant. Specifically, beneficiaries in the treatment group were significantly more likely to receive advice from the FLW on initiation of complementary feeding at age 6 months (regression-adjusted difference of 9 percentage points, or 36 percent of the control mean), the type of food (regression-adjusted difference of 9 percentage points, or 4 percent), the appropriate frequency of feeding (regression-adjusted difference of 10 percentage points, or 40 percent), the appropriate quantity of food (regression-adjusted difference of 7 percentage points, or 32 percent), and feeding from a separate bowl (regression-adjusted difference of 9 percentage points, or 38 percent).
Impacts on other measures of quality were mixed:
• There were no significant impacts on the duration of home visits, with a mean of about 12 minutes in the treatment group and 13 in the control group, which suggests that quality was not affected by this (rather crude) measure.
• Beneficiaries in the treatment group were significantly more likely than control group members to report that an FLW ever used the various non-ICT-CCS job-aid tools included as part of the overall Ananya program to help promote behavior change during home visits (Table V.4). The impacts on the probability of the FLW ever having used the Ananya job-aid tools (such as the Mobile Kunji cards, the Dr. Anita recorded messages, the katori/spoon to demonstrate quantity of feeding, the uterus model, the Copper-T IUD, and the Mala-D contraceptive pill) varied from 4 to 18 percentage points (or 45 to 81 percent), all of which were statistically significant at least at the 10 percent level. The largest and most strongly significant impacts were for Mobile Kunji (cards or Dr. Anita messages) and the katori/spoon; these impacts persisted when use outside the home was also included. The overall increase in exposure to non-ICT-CCS job-aid tools should be interpreted with caution, because part of the increase is likely driven by the mechanical effect of an increase in the frequency of home visits in the treatment group. In addition, respondents might be more likely to recall the use of these other job-aid tools if they are used together with the ICT-CCS tool, so part of the increase could be driven by reduced recall error in the case of joint use. Nevertheless, there is no evidence of FLWs in ICT-CCS treatment areas having substituted away from using the non-ICT-CCS job-aid tools in home visits.
• There were no impacts on whether the FLW spoke to the woman’s husband, mother-in-law, or other family members, another possible measure of quality given the likely influence of other family members on women’s health decisions (especially the mother-in-law) in the Bihar social context.
D. Impacts on mothers’ knowledge
Improved FLW-household interactions could affect maternal and child health-related behaviors by increasing beneficiaries’ knowledge of desirable health behaviors. An improvement in knowledge is only one possible mechanism through which the intervention could affect behavior; beneficiaries could already have correct knowledge about a certain behavior, but cultural norms and other barriers may deter them from applying their knowledge (see, for example, Bhattacharya 2004, Ensor and Cooper 2004, Hitesh 1996, and Vissandjee et al. 1997). Although we were not able to measure all these possible mechanisms as part of our surveys, we
53

V. FINDINGS FROM THE BENEFICIARY SURVEY MATHEMATICA POLICY RESEARCH
Table V.4. Impacts on FLW interactions: features of interactions (percentages unless otherwise indicated)
Endline control mean
Adjusted endline
treatment mean
Adjusted endline
difference p-Value
Duration of Most Recent FLW Home Visit, Among Women with Home Visits in the Previous Six Months
Fewer than 5 minutes 24.9 26.3 1.4 0.706 6–15 minutes 46.5 51.0 4.5 0.308 16–30 minutes 25.8 20.1 -5.6 0.146 More than 30 minutes 2.8 2.6 -0.2 0.864
0.309a Average, among those with visits (minutes) 13.1 12.4 -0.7 0.454 Talked to husband in most recent visit 15.3 14.2 -1.0 0.741 Talked to mother-in-law in most recent visit 11.2 11.6 0.5 0.822 Talked to other family member in most recent visit 7.9 8.4 0.5 0.802
Job Tools Ever Used by FLW Mobile Kunji cards Ever used during home visit 21.8 39.3 17.6*** 0.000 Ever usedb 27.3 45.7 18.4*** 0.000 Mobile Kunji audio recordings by Dr. Anita Ever used during home visit 17.3 31.3 14.0*** 0.000 Ever usedb 21.7 35.1 13.4*** 0.000 Katori/spoon Ever used during home visit 11.8 20.7 8.8*** 0.005 Ever usedb 16.2 23.5 7.3** 0.046 Uterus model Ever used during home visit 5.7 10.0 4.3* 0.085 Ever usedb 9.5 11.2 1.7 0.576 Sample Copper-T IUD Ever used during home visit 6.8 11.7 4.9* 0.080 Ever usedb 10.1 12.9 2.9 0.366 Sample Mala-D contraceptive pills Ever used during home visitc 6.2 10.6 4.4* 0.070
Source: Ananya ICT RCT endline beneficiary survey conducted by Sambodhi in collaboration with Mathematica in mid-2014.
Notes: Treatment means and treatment-control differences are adjusted using ordinary least squares regressions that control for stratum-fixed effects; indicators of demographic characteristics (SC/ST, Hindu, number of children, woman’s age, woman’s literacy, SES quartile, and indicators for missing values for each characteristic); and subcenter-level baseline means of the outcome (when available). Reported p-values account for clustering of standard errors at the subcenter level. Sample sizes are 972 (visit duration) and 1,553 (all other outcomes).
a p-Value is for the test of equivalence of distributions and account for clustering of standard errors at the subcenter level. b Includes use in most recent home visit, ever used in home visit, and ever used outside home visit. c Includes use in most recent home visit and ever used in home visit (we did not ask about use outside home visits for Mala-D). */**/*** Significantly different from zero at the .10/.05/.01 level, two-tailed test.
54

V. FINDINGS FROM THE BENEFICIARY SURVEY MATHEMATICA POLICY RESEARCH
were able to assess impacts on beneficiaries’ knowledge in several domains (Table V.5). Impacts on knowledge of specific maternal and infant danger signs are mixed: for knowledge of maternal danger signs before, during, and after delivery, 4 out of 14 outcomes have statistically significant differences, and for knowledge of infant danger signs 2 out of 14 outcomes have statistically significant differences. However, these results are likely to be spurious, because the direction of these impacts is not consistent across the various danger signs.
Impacts on knowledge about other health behaviors are generally not significantly different between the treatment and control groups. The one exception is the impact on knowledge about exclusive breastfeeding for 6 months: 74 percent of the treatment group report knowledge about it, compared to 60 percent of the control group (a significant regression-adjusted difference of 14 percentage points, or 23 percent of the control mean). This is consistent with the finding discussed in the previous section on higher reported advice by the FLW on exclusive breastfeeding. Overall though, these findings suggest that changes in knowledge as a result of the intervention are unlikely to be the primary mechanism for changes in health behaviors.
E. Impacts on health behaviors
The ultimate goal of the ICT-CCS intervention is to improve RMNCH behaviors through the more frequent and improved interactions with FLWs documented above. Even though we do not observe impacts on knowledge about health behaviors, we may still find impacts on health behaviors if, for example, desirable behaviors were reinforced by timely interactions with FLWs, or if FLWs were able to more thoroughly and effectively communicate relevant information to beneficiaries. We therefore examined the impact of the ICT-CCS intervention on key health behaviors in the antenatal care, delivery and newborn care, complementary feeding, immunization, and reproductive health domains.
The levels of many key behaviors in these domains were relatively low in the baseline sample (Table V.1). For example, in the antenatal care domain, only 37 percent of baseline respondents in treatment areas reported having received the recommended 3 antenatal care visits, and only 16 percent reported having consumed the recommended 90 IFA tablets during pregnancy. In the delivery and newborn care domain, many key behaviors were adopted by fewer than half of respondents in the baseline sample in treatment areas (for example, 23 percent applied nothing to the cord and 45 percent practiced immediate breastfeeding), while in the reproductive health domain, only 19 percent of baseline respondents in treatment areas reported that they currently used modern methods of contraception. Even in domains in which baseline levels of key behaviors were higher, such as child nutrition (57 percent of mothers of children age 6 months or older reported feeding their child solid foods) and immunization (65 percent of mothers of children age 6 months or older reported that their child received DPT3), adoption of these behaviors was far from universal. This suggests that there was considerable scope for the ICT-CCS intervention to improve health behaviors across the entire continuum of care.
55

V. FINDINGS FROM THE BENEFICIARY SURVEY MATHEMATICA POLICY RESEARCH
Endline control mean
Adjusted endline
treatment mean
Adjusted endline
difference p-Value
Knowledge of Maternal Danger Signs During Pregnancy and Delivery Prolonged labor 35.6 43.1 7.5* 0.058 Excessive bleeding 39.4 36.6 -2.9 0.520 Convulsions 30.9 25.9 -5.0 0.110 Swelling of hands, body, or face 19.5 18.8 -0.8 0.747 Fever 14.6 13.4 -1.2 0.551 Vaginal discharge 3.1 3.8 0.7 0.504 Severe abdominal pain 3.7 6.0 2.3 0.206
Knowledge of Maternal Danger Signs in First 6 Weeks Excessive bleeding 35.6 41.7 6.1* 0.093 Severe abdominal pain 53.7 49.0 -4.8 0.233 Fever 45.0 39.0 -6.1* 0.091 Vaginal discharge 16.1 14.9 -1.2 0.598 Severe headache or blurred vision 11.1 14.6 3.5 0.134 Convulsions 7.4 8.8 1.4 0.428 Fits 1.7 3.8 2.1** 0.040
Knowledge of Infant Danger Signs Diarrhea 38.9 46.7 7.7** 0.023 Fever 66.0 69.4 3.4 0.313 Cough/cold 61.7 62.7 1.0 0.773 Breathing difficulties 18.6 11.9 -6.8*** 0.000 Infant not crying 11.1 9.6 -1.6 0.451 Chest problems 8.5 10.9 2.4 0.197 Blue tongue and lips 8.0 5.5 -2.5 0.158 Baby not taking milk 4.1 2.5 -1.7 0.111 Pneumonia 21.8 22.4 0.7 0.777 Baby not gaining weight 3.8 2.3 -1.5 0.205 Baby small or premature 1.3 1.3 -0.1 0.919 Baby is drowsy 0.4 0.4 0.0 0.978 Baby cold to touch 0.4 0.2 -0.2 0.609 Jaundice 7.7 7.8 0.1 0.937
Nothing Should Be Applied to Cord 19.5 18.0 -1.4 0.579 Bath Should Be Delayed by at Least 2 Days 30.3 24.2 -6.1 0.135 Should Breastfeed Immediately 70.9 70.8 -0.1 0.979 Should Exclusively Breastfeed for 6 Months 59.8 73.9 14.1*** 0.000 Solid Foods Should Be Given Starting at Age 6 Months 55.0 60.2 5.2 0.268 Knows 3 or More Modern Temporary Methods of Contraception 79.2 81.2 2.0 0.420
Source: Ananya ICT RCT endline beneficiary survey conducted by Sambodhi in collaboration with Mathematica in mid-2014.
Notes: Treatment means and treatment-control differences are adjusted using ordinary least squares regressions that control for stratum-fixed effects; indicators of demographic characteristics (SC/ST, Hindu, number of children, woman’s age, woman’s literacy, SES quartile, and indicators for missing values for each characteristic); and subcenter-level baseline means of the outcome (when available). Reported p-values account for clustering of standard errors at the subcenter level. Sample size is 1,520 to 1,553.
*/**/*** Significantly different from zero at the .10/.05/.01 level, two-tailed test.
56

V. FINDINGS FROM THE BENEFICIARY SURVEY MATHEMATICA POLICY RESEARCH
1. Antenatal care There were large and statistically significant impacts on many outcomes in the antenatal care
domain (Table V.6).42 At endline, 50 percent of the treatment group reported receiving at least 3 antenatal care visits, compared to 29 percent in the control group (a significant regression-adjusted difference of 21 percentage points, or 73 percent of the control mean). There was also a small but statistically significant difference in reporting at least 2 TT injections, though this rate is relatively high for both the treatment and the control group (94 and 89 percent, respectively). In addition, there was a large and significant impact on reported consumption of at least 90 IFA tablets, which was reported by 17 percent of the treatment group, compared to 11 percent of the control group (a regression-adjusted difference of 6 percentage points, or 58 percent of the control mean).
There were also significant impacts on some measures of birth preparedness practices to facilitate facility delivery, including obtaining the phone number of an ambulance, a private vehicle, or an FLW (a regression-adjusted difference of 9 percentage points, or 23 percent of the control mean) and identifying a person to accompany the woman to the facility (a regression-adjusted difference of 8 percentage points, or 13 percent of the control mean). However, other measures of delivery preparation, such as saving money for the delivery and identifying a facility, were not significantly different. These activities may require more effort from the beneficiary compared to obtaining phone numbers, which the FLW can provide during a visit. Overall, our finding of significant impacts for many antenatal care outcomes is consistent with the increase in the number of FLW visits in the last trimester discussed earlier.
2. Delivery and newborn care Some of the key areas of focus of the Ananya program related to the adoption of appropriate
newborn care behaviors. However, we found no significant impacts of the ICT-CCS intervention on most recommended behaviors in the delivery and newborn care domain, including facility delivery, applying nothing to the cord or umbilicus, delayed bathing, and treatment seeking
42 As described earlier, there were statistically significant differences between the treatment and control groups at baseline in two of these outcomes—at least 3 ANC visits and consumption of at least 90 IFA tablets. We therefore also estimated impacts for these outcomes using a difference-in-differences approach, which views any baseline differences as true differences between the treatment and control groups, and subtracts the baseline difference from the endline difference presented here. The difference-in-difference impacts for both these outcomes decrease in magnitude (8 percentage points and 2 percentage points, respectively) and are no longer statistically significant. However, the baseline differences we observed are likely to be a result of chance sample variations rather than systematic differences between treatment and control, given that other outcomes in the antenatal care domain were not statistically different at baseline. We therefore consider the impacts from the main analysis to be more likely to reflect the true impact.
57

V. FINDINGS FROM THE BENEFICIARY SURVEY MATHEMATICA POLICY RESEARCH
Table V.6. Impacts on antenatal care and delivery preparation (percentages unless otherwise indicated)
Endline control mean
Adjusted endline
treatment mean
Adjusted endline
difference p-Value
Pregnancy Registered with FLW 93.5 93.7 0.2 0.882 At Least 3 ANC Visits 28.8 49.8 21.1*** 0.000 At Least 2 TT Injections 89.3 94.0 4.7** 0.035 IFA Tablets
At least 90 tablets received 14.8 19.7 4.9** 0.045 At least 90 tablets consumed 10.9 17.2 6.3*** 0.003 Received tablets by month 4 55.4 62.8 7.5** 0.037
Transportation Plans for Delivery: Obtained correct number of government ambulance or
private vehicle 17.9 25.6 7.7** 0.018 Obtained number of FLW 35.3 43.1 7.8** 0.049 Obtained any number (if yes for either of the above) 40.2 49.3 9.1** 0.025
Delivery Preparations: Saved money for delivery 90.2 90.7 0.5 0.797 Identified facility for delivery or emergency 72.6 74.2 1.6 0.604 Identified person to accompany to facility 62.5 70.7 8.2*** 0.001
Discussed Delivery Plans with Husband 94.0 93.6 -0.4 0.802 Discussed Delivery Plans with Mother-in-Law 69.8 72.5 2.7 0.327
Source: Ananya ICT RCT endline beneficiary survey conducted by Sambodhi in collaboration with Mathematica in mid-2014.
Notes: Treatment means and treatment-control differences are adjusted using ordinary least squares regressions that control for stratum-fixed effects; indicators of demographic characteristics (SC/ST, Hindu, number of children, woman’s age, woman’s literacy, SES quartile, and indicators for missing values for each characteristic); and subcenter-level baseline means of the outcome (when available). Reported p-values account for clustering of standard errors at the subcenter level. Sample size is 1,492 to 1,553.
*/**/*** Significantly different from zero at the .10/.05/.01 level, two-tailed test.
behavior and FLW advice related to danger signs (Table V.7).43 The two behaviors that did show a significant impact were immediate breastfeeding and skin-to-skin care. At endline, 76 percent of the treatment group and 62 percent of the control group reported immediate breastfeeding (a significant regression-adjusted difference of 14 percentage points, or a 22 percent of the control mean). Similarly, 65 percent of the treatment group reported skin-to-skin care, compared to 58 percent of the control group (a significant regression-adjusted difference of 7 percentage points, or 12 percent of the control mean). Although we showed above that there were significant impacts on mother’s knowledge on exclusive breastfeeding, this did not translate into significant
43 The impacts on treatment-seeking behavior and FLW advice for danger signs should be viewed with some caution, because they are conditional on experiencing danger signs, and any impact of the intervention on identification of danger signs could lead to compositional differences between the treatment and control groups.
58

V. FINDINGS FROM THE BENEFICIARY SURVEY MATHEMATICA POLICY RESEARCH
Table V.7. Impacts on delivery, newborn, and postnatal care (percentages unless otherwise indicated)
Endline control mean
Adjusted endline
treatment mean
Adjusted endline
difference p-Value
Facility Delivery 83.9 85.1 1.2 0.586 Cord Care
Nothing applied to cord and umbilicus 32.5 32.4 -0.1 0.976 Thermal Care
Bath delayed by at least 2 days 47.6 45.7 -1.9 0.607 Early Initiation of Breastfeeding
Immediate breastfeeding 62.2 75.9 13.7*** 0.000 Child not given prelacteals 81.3 82.0 0.8 0.780
Skin-to-Skin Care 57.8 65.2 7.4* 0.073 Exclusive Breastfeeding
Exclusive breastfeeding for 6 months, children 6 months or oldera 61.1 63.4 2.4 0.557
Exclusive breastfeeding in past 24 hours, children younger than 6 monthsb 70.0 64.8 -5.3 0.211
Danger Signs Experienced any danger sign during pregnancy or deliveryc 38.5 38.9 0.3 0.932 Among those who experienced danger signs:
Sought treatment 49.2 53.2 3.9 0.509 FLW advised to seek treatment 28.8 22.8 -6.0 0.350 FLW advised where to go 22.4 20.5 -1.9 0.735
Experienced any maternal danger sign in first 6 weeksd 27.9 30.0 2.1 0.505 Among those who experienced maternal danger signs:
Sought treatment for any danger sign 58.6 53.4 -5.3 0.420 FLW advised to seek treatment 21.4 22.8 1.4 0.817 FLW advised where to go 20.3 17.5 -2.8 0.621
Experienced any infant danger signe 13.1 20.8 7.7*** 0.000 Among those who experienced infant danger signs:
Sought treatment for any danger sign 65.7 55.3 -10.4 0.133 FLW advised to seek treatment 31.2 22.9 -8.4 0.140 FLW advised where to go 22.4 18.6 -3.8 0.458
Source: Ananya ICT RCT endline beneficiary survey conducted by Sambodhi in collaboration with Mathematica in mid-2014.
Notes: Treatment means and treatment-control differences are adjusted using ordinary least squares regressions that control for stratum-fixed effects; indicators of demographic characteristics (SC/ST, Hindu, number of children, woman’s age, woman’s literacy, SES quartile, and indicators for missing values for each characteristic); and subcenter-level baseline means of the outcome (when available). Reported p-values account for clustering of standard errors at the subcenter level.
Sample sizes are 1,480 to 1,553 (all women); 919 (children 6 months or older); 593 (children younger than 6 months); 586 (experienced danger signs during pregnancy or delivery); 435 to 438 (experienced maternal danger signs in the first 6 weeks); and 271 (experienced infant danger signs).
a Based on self-reports of the duration of exclusive breastfeeding for children 6 months or older. b Based on reports of liquids and solids fed to children younger than 6 months in the previous 24 hours, following the recommended definition of the World Health Organization. c Includes prolonged labor, excessive bleeding, convulsions, swelling of the hands, body, or face, high fever, foul-smelling vaginal discharge, and severe pain in the lower abdomen. d Includes excessive bleeding, convulsions, high fever, foul-smelling vaginal discharge, and severe pain in the lower abdomen. e Includes loss of interest in breastfeeding, difficult or rapid breathing, being cold to the touch, being drowsy or difficult to awaken, and jaundice. */**/*** Significantly different from zero at the .10/.05/.01 level, two-tailed test.
59

V. FINDINGS FROM THE BENEFICIARY SURVEY MATHEMATICA POLICY RESEARCH
impacts on reported exclusive breastfeeding for 6 months,45 which suggests that knowledge might not be the main barrier to exclusive breastfeeding.
3. Complementary feeding
Another important target of the overall Ananya program was appropriate nutrition for infants. Our analysis of child nutrition focused on the introduction, frequency, quantity, and diversity of complementary feeding for children 6 months and older (Table V.8). About 64 percent of the treatment group reported that the child eats solid or semisolid food, compared to 55 percent of the control group (a significant regression-adjusted difference of 9 percentage points, or 16 percent of the control mean). In addition, 58 percent of the treatment group and 51 percent of the control group reported feeding the child a cereal-based meal the previous day, a specific focus of the Ananya program (a significant regression-adjusted difference of about 7 percentage points, or 15 percent of the control mean). There was also a significant impact on the timely introduction of complementary feeding, with about 41 percent of the treatment group reporting that the child started eating solid food by age 6 months, compared to 32 percent of the control group (a significant difference of 9 percentage points, or 29 percent of the control mean).
There was no statistically significant impact on the appropriate quantity of feeding, with very low levels of less than 5 percent in treatment and control groups based on the definition and measurement that we used.46 There was also no significant impact on appropriate frequency of feeding.47 To examine impacts on the types of food fed to the child, we constructed indices of food diversity in the previous 24 hours and frequency of feeding different food types in the previous 7 days based on reported consumption of different types of foods (slightly modified versions of the indices used by Garg and Chadha [2009]). However, there were no significant impacts on either the dietary diversity index or this food frequency index.
45 We defined two measures of exclusive breastfeeding. First, we asked women directly to self-report the duration of exclusive breastfeeding, and whether they gave water during this period (exclusive breastfeeding should exclude water, but we asked this follow-up question to confirm that respondents were reporting exclusive breastfeeding correctly). To allow for full exposure to the ideal exclusive breastfeeding period of six months, our analysis using this measure focused on children older than six months. Second, we asked mothers to report liquids or solids they had fed their child in the previous day. This approach enabled us to compute a measure of exclusive breastfeeding recommended by the World Health Organization (2010), namely the fraction of children under 6 months of age who were given no liquids other than breast milk during the previous day. Although the estimated impacts for the two measures differed in sign, neither was statistically significant. 46 We followed the definition used in CARE’s LQAS monitoring data by defining the appropriate quantity of feeding as at least 100 ml per day for children 6–8 months old and at least 200 ml per day for kids 9–11 months in age. Consistent with the LQAS approach, only cereal-based meals fed to the child from a separate bowl by an adult in the previous day were included, and quantity was measured by having interviewers transfer a representative volume of water (representing the quantity) into a measuring cylinder. 47 Appropriate frequency is defined as 2 or more times per day for children 6–8 months old and 3 or more times per day for children 9–11 months old. This is again consistent with CARE’s LQAS survey, and is also aligned with World Health Organization recommendations.
60

V. FINDINGS FROM THE BENEFICIARY SURVEY MATHEMATICA POLICY RESEARCH
Table V.8. Impacts on child nutrition, for children 6 months or older (percentages unless otherwise indicated)
Endline control mean
Adjusted endline
treatment mean
Adjusted endline
difference p-Value
Child Eats Solid or Semisolid Food 54.7 63.6 8.8* 0.055 Child Began Eating Solid Food by Age 6 Months 31.8 41.0 9.1** 0.039 Child Feeding of Solid/Semisolid Food in Previous Day
Fed any cereal-based meal 50.6 58.1 7.5* 0.098 Appropriate frequency of feeding a 31.9 37.9 6.0 0.111 Appropriate quantity of feedingb 3.3 2.6 -0.7 0.487
Dietary Diversity Index (past 24 hours), Range 0–6c Index = 0 47.2 41.2 -6.0 0.187 Index = 1 13.7 12.1 -1.6 0.552 Index = 2 14.7 18.3 3.6 0.251 Index = 3–6 24.4 28.4 4.0 0.302 0.339e Mean 1.3 1.5 0.2 0.264
Food Frequency Index (past 7 days), Range 0–10d Index = 0 46.8 39.2 -7.6* 0.096 Index = 1–3 20.8 23.6 2.8 0.273 Index = 4–10 32.4 37.1 4.8 0.238 0.191e Mean 2.2 2.6 0.4* 0.086
Source: Ananya ICT RCT endline beneficiary survey conducted by Sambodhi in collaboration with Mathematica in mid-2014. Notes: Treatment means and treatment-control differences are adjusted using ordinary least squares regressions that control for
stratum-fixed effects; indicators of demographic characteristics (SC/ST, Hindu, number of children, woman’s age, woman’s literacy, SES quartile, and indicators for missing values for each characteristic); and subcenter-level baseline means of the outcome (when available). Reported p-values account for clustering of standard errors at the subcenter level. Sample sizes are 713 (quantity of feeding) and 927 (all other outcomes).
a Defined as 2 or more times for children 6–8 months of age and 3 or more times for children 9–11 months of age. b Defined as at least 100 ml for children 6–8 months of age and at least 200 ml for children 9–11 months of age. c Index assigns one point for each of the following types of food eaten in the past 24 hours: rice, khichdi, or bread; daal; fruits and vegetables rich in vitamin A or dark green leafy vegetables; other fruits and vegetables; meat, fish, or eggs; and oil or ghee added to food (slightly modified from Garg and Chadha [2009]). d Index assigns one point for each of the following types of food fed 1 to 3 times in the previous 7 days, and two points for each type of food fed 4 or more times in the previous 7 days: rice, khichdi, or bread; daal; fruits rich in vitamin A or dark green leafy vegetables; other fruits and vegetables; and meat, fish, or eggs (slightly modified from Garg and Chadha [2009]). e p-Values are for the test of equivalence of distributions and account for clustering of standard errors at the subcenter level. */**/*** Significantly different from zero at the .10/.05/.01 level, two-tailed test.
Overall, the findings related to complementary feeding behaviors are largely consistent with the findings on FLW interactions related to complementary feeding discussed earlier, which showed that the treatment group was more likely to receive a visit from the FLW on complementary feeding, and receive advice on topics such as initiation of complementary feeding at age 6 months and the type of food. However, there were no impacts on the quantity, frequency or diversity of feeding, despite impacts on FLW advice on these topics. It is possible that behaviors such as initiating complementary feeding at 6 months and feeding a specific type of food such as a cereal-based meal are simply easier behaviors to remember and follow advice on, compared to feeding an appropriate quantity and variety of foods.
61

V. FINDINGS FROM THE BENEFICIARY SURVEY MATHEMATICA POLICY RESEARCH
4. Immunization Another goal of the overall Ananya program involves increasing child immunizations.
Because immunization rates are typically high for early immunizations but drop for later ones, we focus on DPT3—one of the later ones.48 To examine the impact of the ICT-CCS intervention on immunizations, we used information from immunization cards or, when that information was unavailable or incomplete, from mothers’ recall.49 Although the routine immunizations (except for measles) are supposed to be completed by 14 weeks of age, our analysis focused on a slightly older sample of children (older than 6 months) to allow for some delay in immunizations.
There was no evidence of statistically significant differences between treatment and control group in receipt of almost all the specific routine immunizations.50 The only exception is DPT1, but this difference was negative in sign, small in magnitude (about 2 percent of the control mean), and only marginally significant (Table V.9). There was also no impact on our measures of timely vaccinations, whether the child received DPT by age 4 months or 6 months. This is despite the finding that FLWs in treatment areas reported that the immunization due list was one of the features of the ICT-CCS tool that they used the most. This suggests that other barriers besides accurate identification of children due for immunization, such as ease of access and availability of vaccines, may be important barriers to immunization. (It is also possible that the paper-based due lists were already accurate, so that the ICT-CCS tool did not lead to a substantial improvement in the accuracy of these lists). The data from the household surveys suggest that the child not being in the household is the most commonly reported reason for not receiving DPT3 (about 25 percent of those not receiving DPT3 in both treatment and control) followed by the cost of the vaccine and no immunization sessions held. This indicates that there may be important supply-side constraints to obtaining immunizations. Although the sample sizes for this analysis are small, these constraints suggest that FLWs’ ability to change behavior on immunizations through interactions with the household might be limited.
48 The full set of routine immunizations includes BCG at birth, OPV1 (polio 1) and DPT1 at age 6 weeks, OPV2 (polio 2) and DPT2 at age 10 weeks, OPV3 (polio 3) and DPT3 at age 14 weeks, and measles at age 9 months. 49 At endline, we first asked the mother whether the child received each of the vaccinations. We then asked her if she had the immunization card where vaccinations are written down. If she reported having the card and was able to show it, we collected information from it on whether each vaccination was given and on what date. We combined the information on vaccinations based on the self-reports and the card, considering a vaccination as given if it is reported to be given either on the card or from the mother’s recall. This approach is similar to that used by the NFHS, as well as CARE’s LQAS monitoring data. 50 The data suggest that prevalence of the immunization card was higher in the treatment group at endline (67 percent in treatment versus 59 percent in control). Under our approach to combining card data and self-reports, this would bias the estimated vaccination rates only if mothers tended to forget that specific immunizations were given (negative self-reports would be more likely to be replaced with positive card reports in the treatment group). However, the magnitude of the difference in card prevalence is unlikely to cause a large degree of bias. Moreover, the direction of the bias would result in positive treatment-control differences, which we do not observe.
62

V. FINDINGS FROM THE BENEFICIARY SURVEY MATHEMATICA POLICY RESEARCH
Table V.9. Impacts on child immunizations, for children 6 months or older (percentages unless otherwise indicated)
Endline control mean
Adjusted endline
treatment Mean
Adjusted endline
difference p-Value
Child Ever Immunized 99.6 98.1 -1.5* 0.084 Vaccination Card Available, Among Children Ever Immunized 59.1 66.9 7.9* 0.070 Card and Self-Reports
Received BCG 98.8 97.5 -1.3 0.213 Received Polio 1 94.2 92.6 -1.6 0.519 Received Polio 2 78.1 83.0 4.9 0.145 Received Polio 3 59.4 62.8 3.5 0.376 Received DPT1 98.2 96.0 -2.3* 0.086 Received DPT2 93.8 91.0 -2.8 0.261 Received DPT3 76.7 77.7 0.9 0.783 Fully immunized (except measles) 55.3 59.1 3.8 0.292
Timing of DPT3: Received DPT3 by age 4 months 16.8 13.7 -3.1 0.301 Received DPT3 by age 6 months 50.2 54.3 4.1 0.338
Reason for Not Giving DPT3, Among Those Not Receiving DPT3: Child not present in household 25.7 25.5 -0.2 0.979 Immunization too expensive 9.5 19.6 10.2 0.125 No immunization session held 10.8 9.5 -1.2 0.833
Source: Ananya ICT RCT endline beneficiary survey conducted by Sambodhi in collaboration with Mathematica in mid-2014. Notes: Treatment means and treatment-control differences are adjusted using ordinary least squares regressions that control for
stratum-fixed effects; indicators of demographic characteristics (SC/ST, Hindu, number of children, woman’s age, woman’s literacy, SES quartile, and indicators for missing values for each characteristic); and subcenter-level baseline means of the outcome (when available). Reported p-values account for clustering of standard errors at the subcenter level.
Sample sizes are 693 to 927 (children 6 months or older) and 176 (children 6 months or older who did not receive DPT3).
*/**/*** Significantly different from zero at the .10/.05/.01 level, two-tailed test.
5. Reproductive health The broader set of Ananya interventions are also attempting to improve reproductive health,
with a particular focus on increasing postpartum use of modern contraceptive methods, including permanent methods (female or male sterilization) or temporary methods (which we define as contraceptive pills, condoms, injectables, and IUDs). Therefore, we explored the impacts of the ICT-CCS intervention on contraceptive use (Table V.10).
63

V. FINDINGS FROM THE BENEFICIARY SURVEY MATHEMATICA POLICY RESEARCH
Endline control mean
Adjusted endline
treatment mean
Adjusted endline
difference p-Value
Use of Contraception, Among All Women Use of permanent methods 17.8 24.2 6.4** 0.023 Use of temporary methods (ever)a 22.0 29.0 7.1** 0.040 Use of any modern method (ever)b 32.4 43.3 10.9*** 0.002 Use of temporary methods (current)a 10.6 11.5 0.8 0.689 Use of any modern method (current)b 28.5 35.8 7.3** 0.027
Use of Contraception, Among Women Who Gave Birth More than 6 Months Ago Use of permanent methods 18.9 26.1 7.2** 0.038 Use of temporary methods (ever)a 25.1 31.4 6.3* 0.090 Use of any modern method (ever)b 35.1 48.0 13.0*** 0.001 Use of temporary methods (current)a 11.2 13.9 2.7 0.313 Use of any modern method (current)b 30.1 40.2 10.1** 0.012
Use of Contraception, Among Women Who Gave Birth in Past 6 Months Use of permanent methods 16.9 21.4 4.5 0.273 Use of temporary methods (ever)a 18.0 25.6 7.6* 0.088 Use of any modern method (ever)b 29.4 36.7 7.3 0.132 Use of temporary methods (current)a 10.3 8.8 -1.5 0.579 Use of any modern method (current)b 27.2 29.9 2.7 0.573
Desired Total Number of Children (mean, number) 2.7 2.7 -0.1 0.257 Desired Birth Spacing to Next Child, Among Women Who Want More
Children (mean, months) 30.3 31.0 0.7 0.563 Aware of at Least One Benefit of Birth Spacing 83.6 82.2 -1.4 0.649 Among Women Who Were Not Using Permanent Methods of
Contraception: Discussed family planning with husband in past 3 months 60.4 59.3 -1.0 0.826 Discussed family planning with mother-in-law in past 3 months 35.6 28.9 -6.7 0.113
Source: Ananya ICT RCT endline beneficiary survey conducted by Sambodhi in collaboration with Mathematica in mid-2014. Notes: Treatment means and treatment-control differences are adjusted using ordinary least squares regressions that control for
stratum-fixed effects; indicators of demographic characteristics (SC/ST, Hindu, number of children, woman’s age, woman’s literacy, SES quartile, and indicators for missing values for each characteristic); and subcenter-level baseline means of the outcome (when available). Reported p-values account for clustering of standard errors at the subcenter level.
Sample sizes are 1,534 to 1,553 (all women); 587 to 593 (women who gave birth in past 6 months); 914 to 927 (women who gave birth more than 6 months ago); 889 (women who want more children); and 1,196 to 1,239 (women who were not using permanent methods).
a Defined as use of birth control pills, condoms, injectables, or an IUD. b Defined as use of male or female sterilization, birth control pills, condoms, injectables, or an IUD. */**/*** Significantly different from zero at the .10/.05/.01 level, two-tailed test.
There were large and significant impacts on the use of permanent methods of contraception, but mixed impacts on the use of temporary methods depending on whether we examined ever use or current use. In the treatment group, 24 percent of women reported using permanent methods, compared to 18 percent in the control group (a significant regression-adjusted difference of 6 percentage points, or 36 percent of the control mean). There was also a significant impact on having ever used temporary modern methods, with 29 percent of women in the treatment group reporting having used them, compared to 22 percent in the control group (a significant regression-adjusted difference of 7 percentage points, or 32 percent of the control mean). In contrast, there was no significant impact on the current use of temporary modern
64

V. FINDINGS FROM THE BENEFICIARY SURVEY MATHEMATICA POLICY RESEARCH
methods as of the survey date.52 This suggests that beneficiaries may be using some of these methods, but not in a consistent manner (the impact on ever use of these methods is driven by pills and condoms [not shown], which could be susceptible to inconsistent use).
Overall, 43 percent of women in the treatment group reported having ever used a modern method of contraception, compared to 32 percent in the control group (a significant regression-adjusted difference of 11 percentage points, or 34 percent of the control mean). The difference for current use of these methods was smaller but still statistically significant, with 36 percent of women in the treatment group and 29 percent in the control group using them (a significant regression-adjusted difference of 7 percentage points, or 26 percent of the control mean). As shown above, the impact on ever use of modern methods is driven by both permanent and temporary methods, while the impact on current use of modern methods is driven almost entirely by permanent methods.
To better understand which women are driving these impacts, we examined impacts for women with younger (0–5 months) and older (6–11 months) children. Although Ananya advocated the use of modern methods of contraception for all women, impacts could differ based on the timing of a woman’s last birth. For example, in the first 6 months after birth, the lactational amenorrhea method (LAM) associated with breastfeeding can be relatively reliable for preventing conception if practiced correctly (Kennedy 2002). Women relying on LAM may have been less receptive to messages on modern contraceptive use because they did not view their use as necessary; alternatively, they may have become convinced that relying on this method alone was not sufficient.
There were significant impacts on contraceptive use for women with both older and younger children, but the impacts differ in magnitude and are driven by different types of methods. Among women who have a child who is 6 months or older, reported use of permanent methods was 26 percent for the treatment group and 19 percent for the control group (a regression-adjusted difference of 7 percentage points, or 38 percent of the control mean). In contrast, the impact on permanent methods for women who have a child younger than 6 months was not statistically significant. The impact on use of temporary methods is similar for both age groups, with marginally significant impacts on ever-use of these methods (6 percentage points for mothers of children 6 months and older and 8 percentage points for mothers of children younger than 6 months), and no significant impacts on current use of these methods.
The stronger impact on permanent methods for mothers of older children therefore leads to larger and more significant impacts on the overall use of modern methods for this group. These impacts are 13 percentage points (37 percent of control mean) for ever having used a modern method, and 10 percentage points (34 percent of control mean) for currently using a modern method. In contrast, the overall impact on ever and current use of modern methods for mothers of younger children was not statistically significant. The larger impacts for mothers of older
52 8 women in the overall sample (fewer than 1 percent) reported that they currently used other modern temporary methods besides the pills, condoms, injectables, and IUDs included in our definition. These other methods included diaphragms, implants, and female condoms. However, we excluded these methods from our analysis for comparability with our ever-use measure, which did not ask about these methods. Because only a small percentage of beneficiaries reported using these methods, including them in our measure of current use does not affect our findings.
65

V. FINDINGS FROM THE BENEFICIARY SURVEY MATHEMATICA POLICY RESEARCH
children is consistent with the fact that the mothers of younger children may be relying on LAM and do not feel as strong a need to use contraception.
There were few significant impacts on other, more intermediate reproductive health outcomes that might affect contraceptive use, such as a woman’s desired birth spacing to the next child or discussion on family planning with the woman’s husband or mother-in-law in the previous three months. This suggests that these are not the factors driving the observed impacts on contraceptive use.
6. Summary of impacts on health behaviors and possible mechanisms Overall, we find evidence that improvements in the frequency and quality (by some
measures) of FLW-beneficiary interactions as a result of the ICT-CCS intervention were associated with improved health behaviors across the continuum of care. However, the evidence on how improved interactions are related to improved health behaviors is not-clear cut, and may vary by domain (although we did find few impacts on mothers’ knowledge about health behaviors, suggesting that improved knowledge is generally not a key mechanism for behavior change).
For example, in the antenatal care domain, we found large impacts on the frequency of FLW-household interactions in the last trimester of pregnancy and significant impacts on health behaviors, despite no significant differences in the provision of targeted advice given during these interactions. The mechanism for behavior change is therefore not clear—it could be that simply interacting with an FLW during pregnancy reminds the beneficiary that she is supposed to adopt certain health behaviors. In the delivery and newborn care domain, there were some significant impacts on the frequency of home visits after delivery (especially in the first week), but few impacts on targeted advice provided and behaviors related to newborn care. In this domain, FLW visits do not appear to be effective in changing behavior, possibly because other barriers to changing these behaviors, such as cultural norms, are difficult to overcome through FLW interactions alone. Similarly, in the child immunization domain, we see no impacts on immunization rates despite the high reported use of the immunization due list tool by FLWs, suggesting that other barriers to improving immunization rates such as supply side constraints may be important. Finally, although there were no significant impacts on home visits specifically related to reproductive health, there were large and significant impacts on the use of modern methods of contraception, suggesting that FLWs are successfully communicating this content in other types of visits.
In sum, the mechanisms through which improved FLW-beneficiary interactions translate into behavior change are likely to be complex. It may be difficult to generalize and identify a single mechanism that is applicable to all health behaviors. Rather, further work may be necessary to understand these mechanisms and especially the key barriers to behaviors that were not responsive to the intervention, so that these can be better targeted in the future.
F. Variation in impacts by subgroup
To determine whether the overall impact of the ICT-CCS intervention masked differential impacts for various demographic and socioeconomic subgroups, we estimated separate impacts for these subgroups by including appropriate interaction terms between subgroup characteristics
66
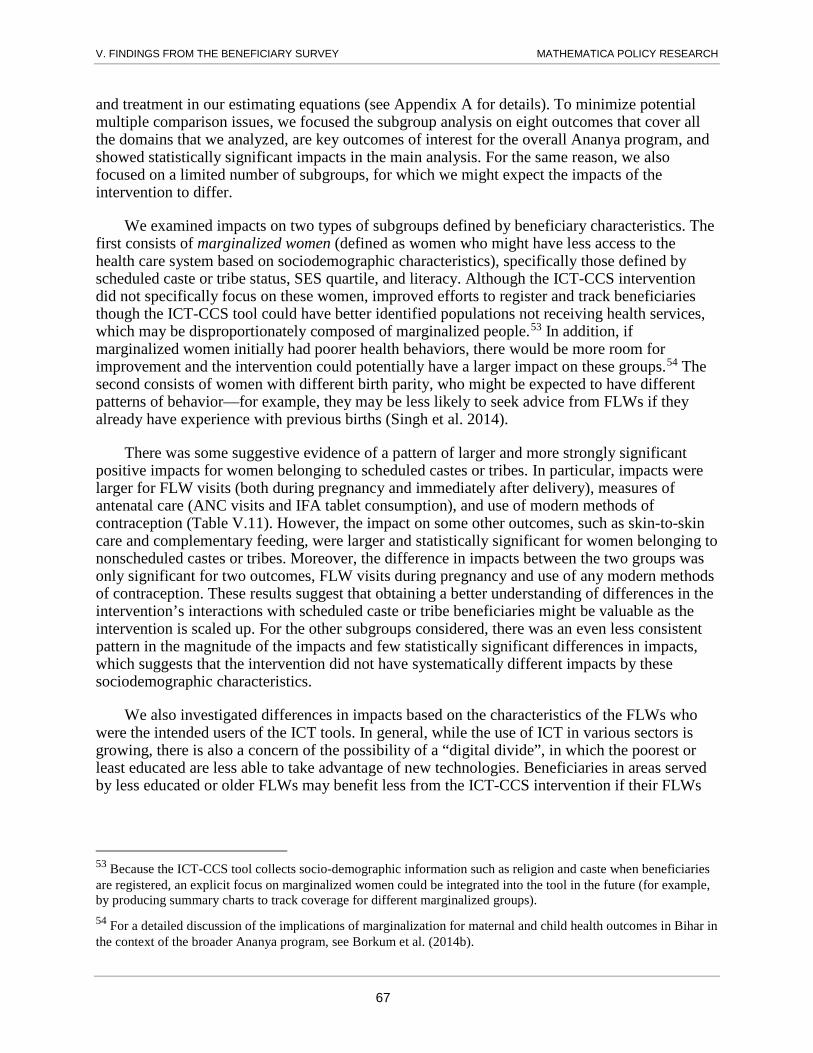
V. FINDINGS FROM THE BENEFICIARY SURVEY MATHEMATICA POLICY RESEARCH
and treatment in our estimating equations (see Appendix A for details). To minimize potential multiple comparison issues, we focused the subgroup analysis on eight outcomes that cover all the domains that we analyzed, are key outcomes of interest for the overall Ananya program, and showed statistically significant impacts in the main analysis. For the same reason, we also focused on a limited number of subgroups, for which we might expect the impacts of the intervention to differ.
We examined impacts on two types of subgroups defined by beneficiary characteristics. The first consists of marginalized women (defined as women who might have less access to the health care system based on sociodemographic characteristics), specifically those defined by scheduled caste or tribe status, SES quartile, and literacy. Although the ICT-CCS intervention did not specifically focus on these women, improved efforts to register and track beneficiaries though the ICT-CCS tool could have better identified populations not receiving health services, which may be disproportionately composed of marginalized people.53 In addition, if marginalized women initially had poorer health behaviors, there would be more room for improvement and the intervention could potentially have a larger impact on these groups.54 The second consists of women with different birth parity, who might be expected to have different patterns of behavior—for example, they may be less likely to seek advice from FLWs if they already have experience with previous births (Singh et al. 2014).
There was some suggestive evidence of a pattern of larger and more strongly significant positive impacts for women belonging to scheduled castes or tribes. In particular, impacts were larger for FLW visits (both during pregnancy and immediately after delivery), measures of antenatal care (ANC visits and IFA tablet consumption), and use of modern methods of contraception (Table V.11). However, the impact on some other outcomes, such as skin-to-skin care and complementary feeding, were larger and statistically significant for women belonging to nonscheduled castes or tribes. Moreover, the difference in impacts between the two groups was only significant for two outcomes, FLW visits during pregnancy and use of any modern methods of contraception. These results suggest that obtaining a better understanding of differences in the intervention’s interactions with scheduled caste or tribe beneficiaries might be valuable as the intervention is scaled up. For the other subgroups considered, there was an even less consistent pattern in the magnitude of the impacts and few statistically significant differences in impacts, which suggests that the intervention did not have systematically different impacts by these sociodemographic characteristics.
We also investigated differences in impacts based on the characteristics of the FLWs who were the intended users of the ICT tools. In general, while the use of ICT in various sectors is growing, there is also a concern of the possibility of a “digital divide”, in which the poorest or least educated are less able to take advantage of new technologies. Beneficiaries in areas served by less educated or older FLWs may benefit less from the ICT-CCS intervention if their FLWs
53 Because the ICT-CCS tool collects socio-demographic information such as religion and caste when beneficiaries are registered, an explicit focus on marginalized women could be integrated into the tool in the future (for example, by producing summary charts to track coverage for different marginalized groups). 54 For a detailed discussion of the implications of marginalization for maternal and child health outcomes in Bihar in the context of the broader Ananya program, see Borkum et al. (2014b).
67

68
V. FIN
DIN
GS
FRO
M TH
E BEN
EFIC
IAR
Y S
UR
VEY M
ATHEM
ATIC
A POLIC
Y R
ESE
AR
CH
Table V.11. Impacts by demographic and socioeconomic subgroups
Adjusted endline treatment-control difference for specified subgroup
Two or more FLW home
visits in final trimester
FLW home visit in first week after
delivery At least 3 ANC visits
At least 90 IFA tablets consumed
Immediate breast-feeding
Skin-to-skin care
Child eats solid or semi-
solid food, child 6
months or older
Currently uses of any modern method of
contraception
Scheduled caste/tribe (SC/ST) SC/ST 19.6*** 18.8*** 26.5*** 8.9*** 14.9*** 3.2 4.4 11.8*** Non-SC/ST 4.6 12.4** 14.9*** 1.4 11.6** 13.1** 10.0 -0.4 Difference 15.1** 6.4 11.6 7.5 3.3 -9.9 -5.6 12.2*
SES quartile Quartile 1 16.5* 17.8* 16.5* 4.9 24.2*** 23.7** -7.6 4.4 Quartile 4 6.4 10.3 24.0*** 6.6 11.5* 13.6** -1.1 4.7 Difference 10.1 7.5 -7.6 -1.8 12.8 10.1 -6.5 -0.3
Literacy Illiterate 10.3** 13.3** 18.3*** 4.5* 13.6*** 6.5 7.9 10.2** Literate 8.9 11.0** 25.7*** 9.4*** 13.9*** 9.1 10.3* 2.4 Difference 1.4 2.3 -7.5 -4.9 -0.2 -2.5 -2.4 7.8
Birth parity 1 2.3 14.7*** 21.4*** 7.7* 4.7 10.7** 10.5 10.7** 3 or more 15.0** 14.7** 16.0*** 8.7*** 12.7** 5.1 11.0 7.7 Difference -12.7* 0.0 5.5 -1.0 -8.0 5.6 -0.5 3.0
Source: Ananya ICT RCT endline beneficiary survey conducted by Sambodhi in collaboration with Mathematica in mid-2014. Notes: Table shows treatment-control differences for specific subgroups. These estimates are conducted using ordinary least squares regressions that include interactions
between treatment status and subgroup indicators and also control for stratum-fixed effects; indicators of demographic characteristics other than those defining the relevant subgroup (SC/ST, Hindu, number of children, woman’s age, woman’s literacy, SES quartile, and indicators for missing values for each characteristic); and subcenter-level baseline means of the outcome (when available).
Sample sizes for outcomes that apply to all women are 705 to 719 (SC/ST) and 668 to 677 (non-SC/ST); 265 to 272 (SES Q1) and 346 to 349 (SES Q4); 560 to 565 (literate) and 987 to 988 (illiterate); and 563 to 570 (parity 1) and 521 to 530 (parity 3 or more). The sample sizes for outcomes that apply to women with children older than 6 months are approximately 60 percent of the overall sample sizes
Statistical significance for a specific subgroup is for the test of the estimated impact against the null of zero and is based on clustering of standard errors at the subcenter level.
*/**/*** Significantly different from zero at the .10/.05/.01 level, two-tailed test.

V
. FIND
ING
S FR
OM
THE BE
NE
FICIA
RY
SU
RV
EY MATH
EMA
TICA PO
LICY
RE
SEA
RC
H
69
Table V.12. Impacts by FLW subgroups
Adjusted endline treatment-control difference for specified subgroup
Two or more FLW home
visits in final trimester
FLW home visit in first week after
delivery At least 3 ANC
visits
At least 90 IFA tablets
consumed Immediate
breast-feeding Skin-to-skin
care
Child eats solid or semi-
solid food, child 6 months
or older
Currently uses of any modern
method of contraception
FLW literacy At least 2
ASHA/AWW in AWC literate 6.6 14.3*** 19.8*** 7.2*** 16.1*** 10.7** 10.3* 13.8***
Less than 2 ASHA/AWW in AWC literate 14.4* 7.8 20.9*** 4.5 8.9 6.8 5.9 -12.7**
Difference -7.9 6.5 -1.1 2.7 7.2 3.9 4.4 26.5*** FLW age
At least 2 ASHA/AWW below median age in AWC 13.0** 9.0** 25.4*** 6.3** 9.5** 8.4* 14.9** 13.1***
Less than 2 ASHA/AWW below median age in AWC 7.3 18.2*** 17.5*** 6.2** 18.6*** 7.4 0.7 2.9
Difference 5.7 -9.3 7.9 0.1 -9.1 1.0 14.2 10.1 FLW caste (analysis restricted to SC/ST women)
At least 1 ASHA/AWW in AWC belongs to a SC/ST 28.2*** 22.8*** 41.2*** 14.5*** 14.9* 12.7 8.5 4.6
No ASHA/AWW in AWC belongs to a SC/ST 13.3** 13.5** 19.3*** 4.7* 16.1*** -7.3 0.8 17.3***
Difference 14.9 9.3 21.9** 9.8* -1.2 20.0* 7.7 -12.6 Source: Ananya ICT RCT endline beneficiary survey conducted by Sambodhi in collaboration with Mathematica in mid-2014. Notes: Table shows treatment-control differences for specific subgroups. These estimates are conducted using ordinary least squares regressions that include interactions
between treatment status and subgroup indicators and also control for stratum-fixed effects; indicators of demographic characteristics (SC/ST, Hindu, number of children, woman’s age, woman’s literacy, SES quartile, and indicators for missing values for each characteristic); and subcenter-level baseline means of the outcome (when available). Estimates in the bottom panel are restricted to the sample of SC/ST beneficiaries.
Sample sizes for outcomes that apply to all women are: 1,016 to 1,033 (at least 2 literate FLWs) and 387 to 389 (less than 2 literate FLWs); 1,140 to 1,161 (at least 2 FLWs below median age) and 388 to 392 (less than 2 FLWs below median age); 186 to 187 (at least 1 SC/ST FLW) and 512 to 524 (no SC/ST FLWs). The sample sizes for outcomes that apply to women with children older than 6 months are approximately 60 percent of the overall sample sizes
Statistical significance is for the test of the estimated impact for a specific subgroup against the null of zero and is based on clustering of standard errors at the subcenter level.
*/**/*** Significantly different from zero at the .10/.05/.01 level, two-tailed test.

V. FINDINGS FROM THE BENEFICIARY SURVEY MATHEMATICA POLICY RESEARCH
are not able to use the technology as effectively. In addition, to further explore our findings of differences in impacts by beneficiary SC/ST status above, we also examined differences in impacts for SC/ST beneficiaries based on whether they were likely to be served by an SC/ST FLW (which could affect the likelihood and nature of their interactions with the SC/ST beneficiaries).
The key subgroups we considered were therefore defined by the literacy (based on the ability to read a passage fluently), age, and caste of the ASHAs and AWWs linked to the AWC serving the beneficiaries. To generate these subgroups, we first categorized AWCs according to (1) whether or not at least two FLWs surveyed in the AWC could read the provided passage fluently, (2) whether or not at least two FLWs surveyed in the AWC were below the median FLW age (35 years),57 and (3) whether a least one FLW in the surveyed AWC belonged to an SC/ST.58 We then matched beneficiaries to AWCs, thus dividing them into the subgroups of interest (for the caste analysis, the beneficiary sample was restricted to SC/ST women).
These analyses has two important limitations. First, we were not able to link beneficiaries to specific FLWs; the AWC level was the finest level available for matching. Second, we had information on only the FLWs included in our sample; while these were representative of FLW in the treatment and control subcenters, because of small sample sizes, they may not be as representative at the AWC level. Therefore, our measures of characteristics of FLWs serving specific women are likely to be somewhat noisy, which could dampen some of the estimated differences in impacts between subgroups.
The analysis by literacy of FLWs suggests that most impacts were statistically similar regardless of whether beneficiaries were more likely to have been served by literate or illiterate FLWs (Table V.12). The magnitudes of the impacts for those more likely to be served by literate FLWs are larger for some outcomes (for example, visits in the first week after delivery and immediate breastfeeding) but smaller for other outcomes (for example, FLW visits in the final trimester). However, the only difference that was statistically significant is for use of any modern methods of contraception, which is larger for those more likely to be served by literate FLWs. The analysis by age of the FLWs was qualitatively similar. Again, the relative magnitude of the impacts varied across outcomes, and none of the differences were significant. Overall, there is no strong evidence of systematic differences in impacts by these FLW characteristics across outcomes—at least based on our somewhat limited measures.
However, there was some evidence of more systematic differences in impacts in the analysis by caste affinity. Impacts were larger for SC/ST women with at least one SC/ST FLW in their AWC for six of the eight outcomes considered. Despite the small sample sizes, these differences in impacts were statistically significant for three outcomes, namely 3 ANC visits, consumption of 90 IFA tablets, and skin-to-skin care. This analysis suggests that caste affinity might have facilitated improvements in outcomes for SC/ST women as a result of the ICT-CCS tool.
57 The results by age were qualitatively similar using different age cutoffs of 40 or 45 years, or examining AWC with at least one FLW below the median age. 58 If only one FLW was surveyed in the AWC, this was defined based on the characteristics of that single FLW.
70

V. FINDINGS FROM THE BENEFICIARY SURVEY MATHEMATICA POLICY RESEARCH
G. Comparison with findings from the overall midline evaluation
The Ananya midline evaluation estimated the impacts of the core Ananya interventions in Bihar between early 2012 and early 2014 using a comparison group design (Borkum et al. 2014b). This design compared the change in outcomes in 8 focus districts in which the interventions were implemented (including Saharsa) to the change in the 30 non-focus districts over the same period. We used the midline evaluation findings to conduct three comparisons with the ICT-CCS evaluation findings: (1) a comparison of mean levels of outcomes, to help validate the ICT-CCS data; (2) a comparison of impacts, to better understand the relative value of the core Ananya interventions and the ICT-CCS intervention; and (3) a comparison of impacts for subgroups of interest, to examine the extent to which the pattern of impacts for core Ananya interventions and the ICT-CCS intervention aligned.
1. Comparison of levels of key outcomes To validate the beneficiary data collected for the ICT-CCS study endline in mid-2014
(which were used to estimate the impacts of the intervention), we compared the levels of key outcomes to those estimated for Saharsa based on data collected for the Ananya midline evaluation in early-2014.59 An important caveat to these comparisons is that the Ananya midline data were not designed to provide precise estimates at the district level, and therefore the estimated confidence intervals for Saharsa are quite wide (as we show below, most of them span a range of between 20 and 50 percentage points). In addition, there was limited overlap between the blocks sampled for the ICT-CCS study and the Ananya midline survey in Saharsa, so the data are not drawn from identical locations. Nevertheless, these comparisons are still instructive as a broad validation exercise.
Overall, estimated levels of most key outcomes in the ICT-CCS endline data are fairly similar to the estimated midline levels for Saharsa, or at least well within the (wide) confidence intervals (Table V.13). Of the 15 outcomes that we considered, 8 have a difference of less than 10 percentage points with the mean estimated from the Saharsa midline data, and only 4 lie outside the midline confidence interval. The outcomes with the largest differences are all related to FLW home visits—in particular, they are measures of home visits after delivery and related to complementary feeding—and are much higher in the ICT-CCS endline data than in the Ananya midline data. This likely reflects the fact that it is challenging to accurately and consistently measure home visits, and the midline survey may have imposed a stricter definition of home visits.60 Because measurement was similar in the treatment and control groups, this should not bias the results of the ICT-CCS study; however, it does suggest that the absolute levels of these outcomes related to FLW interactions (and the changes over time) should be interpreted with caution.
59 Because the treatment areas for the ICT-CCS study only composed a relatively small fraction of the total district, the control areas are likely to be more typical of the state as a whole. We therefore focus on comparing the mean in the ICT-CCS control areas (based on ICT-CCS endline data) to that for Saharsa (based on Ananya midline evaluation data). 60 Although the survey questions were similar, the training for the midline focused more strictly on capturing visits in which advice was provided, and excluding visits to weigh the child, take the child for immunizations, or to provide other services
71

V. FINDINGS FROM THE BENEFICIARY SURVEY MATHEMATICA POLICY RESEARCH
Table V.13. Levels of and impacts on key outcomes in the ICT-CCS study and Ananya midline evaluation (percentages unless otherwise indicated)
Levels of key outcomes Impacts on key
outcomes
ICT-CCS study
midline control mean
Ananya midline Saharsa
mean
Ananya midline
Saharsa 95 percent
confidence interval
ICT-CCS study
impact
Ananya midline
evaluation impact
FLW Interactions At least two home visits in final trimester 42 40 [19; 61] 10** 10*** Any visit in first week after delivery 60 17 [3; 31] 12*** 2 Any visit in first month after delivery 67 16 [2; 30] 6* --c
Any visit related to complementary feeding, children 5 months or older 36 18 [4; 33] 9** --c
Antenatal Care At least 3 ANC visits 29 33 [10; 56] 21*** 5 Consumed at least 90 IFA tablets 11 19 [9; 28] 6** 1
Delivery and Postnatal Care Facility delivery 84 67 [43; 92] 1 0 Nothing applied to cord and umbilicus 32 29 [14; 43] 0 7*** Immediate breastfeeding 62 52 [32; 72] 14*** 3 Delayed bath by at least 2 days 48 50 [38; 61] -2 2 Skin-to-skin care 58 44 [31; 57] 7* 10 Exclusive breastfeeding in past 24 hours,
children younger than 6 monthsa 70 81 [68; 93] -5 3
Child Nutrition, Children 6 Months or Older Child eats solid or semisolid food 55 59 [38; 79] 9* 9*
Immunizations, Children 6 Months or Older Child received DPT3 77 78 [56; 99] 1 2
Reproductive Health Use of any modern method (current)b 29 25 [5; 46] 7** 9***
Source: Ananya ICT RCT endline beneficiary survey conducted in mid-2014 and Ananya midline evaluation survey conducted in early 2014; both surveys were conducted by Sambodhi in collaboration with Mathematica. Midline findings are from Borkum et al (2014b).
a Based on reports of liquids and solids fed to children younger than 6 months old in the previous 24 hours, following the recommended definition of the World Health Organization. b Defined as use of male or female sterilization, birth control pills, condoms, injectables, or an IUD. c Impact estimates not available because these outcomes were not measured at baseline, as required by the midline evaluation design. */**/*** Significantly different from zero at the .10/.05/.01 level, two-tailed test.
72

V. FINDINGS FROM THE BENEFICIARY SURVEY MATHEMATICA POLICY RESEARCH
2. Comparison of impacts on key outcomes We also compared the estimated impacts from the ICT-CCS study to those from the Ananya
midline evaluation. As mentioned above, the Ananya midline evaluation estimated the impact of the core Ananya interventions after two years of implementation relative to non-Ananya districts. The ICT-CCS study estimates the impact of the ICT-CCS intervention over and above that of the core Ananya interventions over a similar period. The overall impact of the core Ananya interventions plus the ICT-CCS intervention relative to a situation without the Ananya program is roughly given by the sum of the two impacts.61 Comparing the midline and ICT-CCS impacts is therefore instructive to understand where the ICT-CCS intervention added value relative to the core Ananya package.
These comparisons suggest that the ICT-CCS intervention reinforced the impacts of Ananya for several outcomes and even improved some outcomes that Ananya did not significantly affect (Table V.13). Focusing on FLW-beneficiary interactions, the most proximal outcomes, both interventions had similar impacts on interactions during pregnancy. Effectively, this implies that the ICT-CCS intervention doubled the impacts of Ananya. However, while Ananya did not affect FLW visits after delivery, the ICT-CCS intervention had large and significant impacts.
In terms of health behaviors, the ICT-CCS intervention again had impacts on several outcomes both for which Ananya was and was not effective on its own, although some outcomes remained unaffected by either intervention. In the antenatal care domain, the ICT-CCS intervention had large impacts on health outcomes, whereas Ananya did not. In the delivery and newborn care domain, some outcomes were not affected by either intervention (facility delivery and delayed bathing), while there was variation in impacts across other outcomes (for example, Ananya had larger impacts for cord care, while ICT-CCS had larger impacts for immediate breastfeeding). Impacts were similar for complementary feeding and current use of modern methods, again suggesting that the ICT-CCS intervention has the potential to double Ananya impacts. However, neither intervention had an impact on immunizations. Overall, the findings suggest that adding the ICT-CCS intervention to the core Ananya package has the potential to substantially improve outcomes across the continuum of care, but that improving some outcomes—such as facility delivery and immunizations—will require an additional effort.
3. Comparison of impacts for key subgroups
Finally, we compared the estimated impacts for subgroups consisting of marginalized women in the ICT-CCS evaluation and the overall Ananya midline evaluation (not shown). Overall, the impacts were consistent for some outcomes and subgroups, but not for others. For example, for SC/ST beneficiaries, both evaluations found significantly larger impacts on FLW visits in the final trimester compared to non-SC/ST beneficiaries (20 versus 5 percentage points in the ICT-CCS evaluation, and 17 versus 3 percentage points in the midline evaluation). However, the ICT evaluation found significantly larger impacts on the use of modern methods
61 Because the midline evaluation and ICT-CCS evaluation results apply to different geographies (8 focus districts including Saharsa versus a subset of blocks in Saharsa district), some caution is necessary in comparing the two sets of estimates.
73

V. FINDINGS FROM THE BENEFICIARY SURVEY MATHEMATICA POLICY RESEARCH
for SC/ST women (12 versus 0 percentage points), whereas the midline evaluation found significantly smaller impacts (2 versus 12 percentage points).
The consistency of the pattern of impact magnitudes between the ICT-CCS and midline evaluations also varies for other subgroups. For example, the impact on use of modern methods of contraception was larger for illiterate beneficiaries in both the ICT-CCS (13 versus 7 percentage points) and midline (11 versus 5 percentage points) evaluations, while the impact on receiving 3 ANC visits was smaller for illiterates in the ICT-CCS evaluation (18 versus 26 percentage points) and larger in the midline evaluation (7 versus 1 percentage points). The impacts for subgroups defined by socio-economic status are similarly variable.
Given that few of the differences in subgroup impacts for the ICT-CCS intervention were statistically significant because of small sample sizes, we cannot rule out that many of these differences reflect sampling variation rather than true differences. This makes it challenging to draw conclusions about the relative subgroup impacts of the ICT-CCS intervention and the core Ananya interventions. Nevertheless, the inconsistencies in the patterns of subgroup impacts suggest that the impact of these interventions for specific subgroups is complex, and that further work may be required to fully understand them.
74

VI. CONCLUSION MATHEMATICA POLICY RESEARCH
VI. CONCLUSION
The ICT intervention facilitated FLWs’ interactions with households by helping them plan and coordinate their home visits. The logic of the ICT intervention posits that by equipping FLWs with an electronic tool to plan, coordinate, and conduct home visits, their interactions with households will be more regular, timely, and informative, thereby improving household knowledge and behaviors.
Our evaluation of the ICT-CCS intervention after two years of implementation showed that it led to substantial increases in the number of FLW-beneficiary interactions relative to the core Ananya package of interventions alone. Specifically, beneficiaries in treatment areas were significantly more likely to receive home visits from FLWs during pregnancy and after delivery, as well as visits related to complementary feeding (though not to family planning). This is consistent with the aim of the intervention to increase the frequency and timeliness of home visits through registration and tracking of beneficiaries, and automated home visit scheduling. Impacts on measures of visit quality—which the intervention could improve through features such as guided checklists for home visits and animated videos for changing behavior—were more mixed. We found impacts on beneficiary receipt of advice from FLWs on some specific topics (particularly related to infant feeding) but not on other topics, strong impacts on use of other Ananya job aid tools by FLWs, and no impacts on FLW visit duration.
These improvements in the frequency and quality of visits were intended to translate into impacts on health behaviors, and we found substantive and significant effects on health behaviors in many—but not all—targeted domains. First, there were significant impacts on several outcomes in the antenatal care and delivery and newborn care domains. These included substantive and statistically significant impacts on antenatal care visits, consumption of IFA tablets, some measures of birth preparedness, and some appropriate newborn care practices (immediate breastfeeding and skin-to-skin care). However, there were no impacts on other behaviors, such as cord care, facility delivery, or exclusive breastfeeding. Second, there were significant impacts in the child nutrition domain, in particular on the age-appropriate introduction of complementary feeding and the frequency of feeding (though not on measures of food diversity). Finally, there were significant impacts on the use of modern methods of contraception, but no impacts on child immunizations.
This study makes an important contribution to the broader literature on the impact of mHealth technologies in developing countries. To our knowledge, this is one of the first rigorous evaluations of such a technology using an RCT, which has enabled us to make causal claims about the impacts of the intervention. The strong and significant impacts that we identified suggest that the use of this type of technology is a promising avenue to improve health outcomes in Bihar, and possibly more broadly. They also suggest that the development of comprehensive mHealth tools like the ICT-CCS intervention, which integrates multiple features and addresses multiple health domains into a single tool (unlike many existing tools, which have a more narrow focus), may be a promising approach.
Our findings are broadly consistent with those from the midline evaluation of the core Ananya program, which was evaluated across 8 districts in Bihar—including Saharsa, the location for this study—after two years of implementation (Borkum et al. 2014b). That
75

VI. CONCLUSION MATHEMATICA POLICY RESEARCH
evaluation also found significant impacts on the frequency of FLW-household interactions, as well as impacts on similar health-related outcomes (several outcomes related to the antenatal and newborn care, introduction of complementary feeding, and use of modern methods). This suggests that the ICT-CCS intervention may have bolstered the effects of the overall program, but could not effect change to behaviors that were not responsive to the core Ananya program (for example, facility delivery and immunizations, both of which are incentivized by the government and were already at relatively high coverage levels prior to the Ananya program).62
Significant impacts on FLW-beneficiary interactions and health behaviors were observed even though some features of the ICT-CCS tools were not utilized to the extent envisaged. For example, use of the tool’s checklists and videos during home visits as reported by beneficiaries in the treatment areas was limited; use of the supervisory aspects of the tool and impacts on supervision were also limited; and internet connectivity problems posed some challenges to the synchronization of home visit records across FLWs. In addition, FLWs (especially AWWs) did not fully benefit from a reduction in their workload by consolidating all record collection into the ICT-CCS tool, because they still had to fill out mandated paper-based government registers over the evaluation period.
The fact that significant impacts were observed despite these limitations suggests that impacts might be even greater if all the features of the tool are taken full advantage of. Indeed, the impacts we observed are likely due in large part to the registration of beneficiaries and automatic scheduling of home visits: the most basic feature of the tool that replaced the use of more complicated Ananya paper-based home visit registers. Focusing on strengthening the use of these other features of the tool could be an important aspect of the scale-up phase. Also relevant to scale-up, our findings suggest that it will be important to resolve some of the technical issues that limit the use of the tool (particularly with regard to synchronization of beneficiary records). In addition, it will be critical to ensure that sufficient training is provided: our qualitative study indicated that intensive support was required to familiarize the FLWs with the tool.
To further inform scale-up of the intervention in Bihar (and possibly elsewhere), we conducted a cost analysis of the ICT-CCS tool based on implementation costs obtained from CARE (see Appendix B for details of the cost analysis and an accompanying cost-effectiveness analysis). The cost analysis suggests that, provided the existing technology can be used as is with little additional cost, expanding the ICT intervention would cost about USD 112.85 per FLW (USD 5.66 per beneficiary) to set up initially, and about USD 72.24 per FLW per year (USD 3.62 per beneficiary per year) in operating costs. In addition, about USD 69.53 per FLW (USD 3.49 per beneficiary) would have to be spent approximately every three years to replace mobile phones. These cost estimates are based on several assumptions and should be viewed as
62 Mathematica also conducted an RCT evaluation of another specific Ananya intervention, the team-based goals and performance-based incentives (TBGI) intervention, which sought to encourage teamwork among FLWs by setting team-based coverage targets and providing non-monetary incentives for achieving them (Borkum et al. 2014a). After one year of implementation, we found that the TBGI intervention led to increased FLW-beneficiary interactions relative to the core Ananya program. However, impacts on health behaviors were more modest, though there was some evidence of impacts on complementary feeding and reproductive health outcomes. A second follow-up is currently under way, and will enable us to estimate impacts on behaviors after two-years of implementation, which will be more comparable to the estimates from the ICT-CCS study.
76

VI. CONCLUSION MATHEMATICA POLICY RESEARCH
approximate; nevertheless, they are useful in providing a broad sense of the magnitude of the costs of implementation.
77

This page has been left blank for double-sided copying.

REFERENCES MATHEMATICA POLICY RESEARCH
REFERENCES
Anantraman, Vishwanath, Tarjei Mikkelsen, Reshma Khilnani, Vikram S. Kumar, Rao Machiraju, Alex Pentland, and Lucila Ohno-Machado. “Handheld Computers for Rural Healthcare, Experiences in a Large Scale Implementation.” Development by Design Conference Proceedings, 2002.
Bhattacharya, Gauri. "Sociocultural and behavioral contexts of condom use in heterosexual married couples in India: challenges to the HIV prevention program." Health Education & Behavior 31.1 (2004): 101-117.
Bollineni, Raja. “Apollo Telemedicine Networking Foundation (ATNF).” ACCESS Health International, 2011, pp. 1–18.
Borkum, Evan, Anu Rangarajan, Dana Rotz, Swetha Sridharan, Sukhmani Sethi, and Mercy Manoranjini. “Evaluation of the Team-Based Goals and Performance-Based Incentives Intervention in Bihar.” Report submitted to the Bill & Melinda Gates Foundation. Princeton, NJ: Mathematica Policy Research, February 2014a.
Borkum, Evan, Dana Rotz, Anu Rangarajan, Swetha Sridharan, Sukhmani Sethi, Mercy Manoranjini, Lalit Dandona, Rakhi Dandona, Priyanka S. Kochar, G. Anil Kumar, and Priyanka Singh. “Midline Findings from the Evaluation of the Ananya Program in Bihar.” Draft report submitted to the Bill & Melinda Gates Foundation. Princeton, NJ: Mathematica Policy Research, December 2014b.
Center for Health Market Innovations, http://healthmarketinnovations.org, accessed November 10, 2014.
Chen, Zhou-wen, Li-zheng Fang, Li-ying Chen, and Hong-lei Dai. “Comparison of an SMS Text Messaging and Phone Reminder to Improve Attendance at a Health Promotion Center: A Randomized Controlled Trial.” Journal of Zhejiang University Science B, vol. 9, no. 1, 2008, pp. 34–38.
Chib, Arul. “The Aceh Besar Midwives with Mobile Phones Project: Design and Evaluation Perspectives Using the Information and Communication Technologies for Healthcare Development Model.” Journal of Computer‐Mediated Communication, vol. 15, no. 3, 2010, pp. 500–525.
Deglise, C., L.S. Suggs, and P. Odermatt. “SMS for Disease Control in Developing Countries: A Systematic Review of Mobile Health Applications.” Journal of Telemedicine and Telecare, vol. 18, no. 5, 2012, pp. 273–281.
DeRenzi, Brian, Neal Lesh, Tapan Parikh, Clayton Sims, Werner Maokla, Mwajuma Chemba, Yuna Hamisi, Marc Mitchell, and Gaetano Borriello. “E-IMCI: Improving Pediatric Health Care in Low-Income Countries.” Proceedings of the SIGCHI Conference on Human Factors in Computing Systems. ACM, 2008.
79

REFERENCES MATHEMATICA POLICY RESEARCH
Ensor, Tim, and Stephanie Cooper. "Overcoming barriers to health service access: influencing the demand side." Health policy and planning 19.2 (2004): 69-79.
Friederici, Nicolas, Carol Hullin, and Masatake Yamamichi. Information and Communications for Development 2012: Maximizing Mobile. Washington, DC.: World Bank, 2012.
Garg, Aashima, and Ravinder Chadha. “Index for Measuring the Quality of Complementary Feeding Practices in Rural India.” Journal of Health, Population, and Nutrition, vol. 27, no. 6, 2009, p. 763–771.
Gold, J., M.S. Lim, J.S. Hocking, L.A. Keogh, T. Spelman, and M.E. Hellard. “Determining the Impact of Text Messaging for Sexual Health Promotion to Young People.” Sexually Transmitted Diseases, vol. 38, no. 4, 2011, pp. 247–252.
Gold, Marthe R., Joanna E. Siegel, Louise B. Russell, and Milton C. Weinstein. Cost-Effectiveness in Health and Medicine. London: Oxford University Press, 1996.
Grisedale, Sally, Mike Graves, and Alexander Grünsteidl. “Designing a Graphical User Interface for Healthcare Workers in Rural India.” Proceedings of the ACM SIGCHI Conference on Human Factors in Computing Systems. ACM, 1997.
Gurman, Tilly A., Sara E. Rubin, and Amira A. Roess. “Effectiveness of mHealth Behavior Change Communication Interventions in Developing Countries: A Systematic Review of the Literature.” Journal of Health Communication, vol. 17, suppl. 1, 2012, pp. 82–104.
Haberer, Jessica E., Josh Kahane, Isaac Kigozi, Nneka Emenyonu, Peter Hunt, Jeffrey Martin, and David R. Bangsberg. “Real-Time Adherence Monitoring for HIV Antiretroviral Therapy.” AIDS and Behavior, vol. 14, no. 6, 2010, pp. 1340–1346.
Hitesh, J. "Perceptions and constraints of pregnancy related referrals in rural Rajasthan." Journal of Family Welfare 42.1 (1996): 24-9.
Jamison, Julian C., Dean Karlan, and Pia Raffler. “Mixed Method Evaluation of a Passive mHealth Sexual Information Texting Service in Uganda.” NBER Working Paper No. 19107, 2013.
Kaplan, Warren A. “Can the Ubiquitous Power of Mobile Phones be used to Improve Health Outcomes in Developing Countries.” Global Health, vol. 2, no. 9, 2006, pp. 1–14.
Kennedy, Kathy I. "Efficacy and effectiveness of LAM." In Integrating Population Outcomes, Biological Mechanisms and Research Methods in the Study of Human Milk and Lactation, pp. 207-216. Springer US, 2002.
Kunawararak, Piyada, Sathirakorn Pongpanich, Sakarin Chantawong, Pattana Pokaew, Patrinee Traisathit, Kriengkrai Srithanaviboonchai, and Tanarak Plipat. “Tuberculosis Treatment with Mobile-Phone Medication Reminders in Northern Thailand.” Southeast Asian Journal of Tropical Medicine and Public Health, vol. 42, no. 6, 2011, pp. 1444.
80

REFERENCES MATHEMATICA POLICY RESEARCH
Lester, Richard T., Paul Ritvo, Edward J. Mills, Antony Kariri, Sarah Karanja, Michael H. Chung, William Jack, James Habyarimana, Mohsen Sadatsafavi, and Mehdi Najafzadeh. “Effects of a Mobile Phone Short Message Service on Antiretroviral Treatment Adherence in Kenya (WelTel Kenya1): A Randomised Trial.” The Lancet, vol. 376, no. 9755, 2010, pp. 1838–1845.
Mechael, Patricia N. “The Case for mHealth in Developing Countries.” Innovations, vol. 4, no. 1, 2009, pp. 103–118.
Mitchell, Marc, Bethany L. Hedt-Gauthier, Daniel Msellemu, Melania Nkaka, and Neal Lesh. “Using Electronic Technology to Improve Clinical Care—Results from a Before-After Cluster Trial to Evaluate Assessment and Classification of Sick Children According to Integrated Management of Childhood Illness (IMCI) Protocol in Tanzania.” BMC Medical Informatics and Decision Making, vol. 13, 2013, p. 95.
Pop-Eleches, C., H. Thirumurthy, J.P. Habyarimana, J.G. Zivin, M.P. Goldstein, D. de Walque, L. MacKeen, J. Haberer, S. Kimaiyo, J. Sidle, D. Ngare, and D.R. Bangsberg. “Mobile Phone Technologies Improve Adherence to Antiretroviral Treatment in a Resource-Limited Setting: A Randomized Controlled Trial of Text Message Reminders.” AIDS (London, England), vol. 25, no. 6, 2011, pp. 825–834.
Poverty Action Lab, http://www.povertyactionlab.org/evaluation/increasing-vaccination-coverage-using-mobile-phone-application-mozambique, accessed November 10, 2014a.
Poverty Action Lab, http://www.povertyactionlab.org/evaluation/evaluating-african-health-market-equity-ahme-initiative-kenya, accessed November 10, 2014b.
Ramachandran, Divya, John Canny, Prabhu D. Das, and Edward Cutrell. “Mobile-Izing Health Workers in Rural India.” Proceedings of the SIGCHI Conference on Human Factors in Computing Systems. ACM, 2010.
Schochet, Peter Z. “Technical Methods Report: Guidelines for Multiple Testing in Impact Evaluations (NCEE 2008-4018).” Washington, DC: National Center for Education Evaluation and Regional Assistance, Institute of Education Sciences, U.S. Department of Education, 2008.
Singh, A., A. Kumar, and P. Pranjali. “Utilization of Maternal Health Care Among Adolescent Mothers in Urban India: Evidence from DLHS-3.” PeerJ, vol. 2, 2014, e592, pp. 1–29.
Sridharan, Swetha, Anu Rangarajan, Mercy Manoranjini, and Sukhmani Sethi. “Findings from the Process Study of the Ananya Program’s IFHI and SDP Grants.” Princeton, NJ: Mathematica Policy Research, 2014
Vissandjée, Bilkis, R. Barlow, and D. W. Fraser. "Utilization of health services among rural women in Gujarat, India." Public Health 111.3 (1997): 135-148.
Vital Wave Consulting. “mHealth for Development: The Opportunity of Mobile Technology for Healthcare in the Developing World.” Washington DC and Berkshire, UK, 2009.
81

REFERENCES MATHEMATICA POLICY RESEARCH
World Health Organization. “Indicators for Assessing Infant and Young Child Feeding Practices. Part II: Measurement.” Geneva: WHO Press, 2010. Available at http://whqlibdoc.who.int/publications/2010/9789241599290_eng.pdf. Accessed December 2014.
82

APPENDIX A
TECHNICAL APPENDIX

This page has been left blank for double-sided copying.

APPENDIX A. TECHNICAL APPENDIX MATHEMATICA POLICY RESEARCH
A. Study design
As described in Chapter I, we conducted a clustered randomized controlled trial (RCT) to evaluate the impacts of the Information and Communication Technology (ICT) intervention. We conducted random assignment at the subcenter level, using all the subcenters in four selected blocks in Saharsa district. Specifically, we randomized the 70 subcenters in these blocks into equal-sized treatment and control groups using a stratified random assignment procedure that involved organizing the subcenters in each block into strata based on the number of anganwadi centers (AWCs) served by the subcenter (a proxy for the size of the population served). Specifically, we divided subcenters in each block into a stratum of “small” subcenters and a stratum of “large” subcenters.63 We then conducted the randomization separately in each stratum by assigning half the subcenters in the stratum to treatment and half to control (or about half in the case of strata with an odd number of subcenters) (Table A.1). The stratification procedure ensured that the treatment and control groups were balanced by the size of population served and reduced variance (hence improving statistical power) in the analysis.64
Table A.1. Stratified randomization of subcenters in Saharsa
Stratum number Block
Number of AWCs served
Total number of
subcenters Treatment subcenters
Control subcenters
1 Kahra <6 12 6 6 2 Kahra ≥6 5 3 2 3 Sattarkatiya <6 5 2 3 4 Sattarkatiya <6 9 5 4 5 Saurbazar ≥6 9 4 5 6 Saurbazar ≥6 12 6 6 7 Sonbarsa <6 6 3 3 8 Sonbarsa ≥6 12 6 6
Total 70 35 35
Note: The table shows the allocation of subcenters in selected blocks in Saharsa to treatment and control groups. All subcenters in the selected blocks were included. Subcenters were organized into strata, which are defined by block and the number of AWCs served (above or below the median of 6). Random assignment was conducted separately within each stratum to obtain an approximately equal allocation to the treatment and control groups.
B. Sampling approach
1. Sampling for beneficiary data collection To obtain a sample frame of eligible beneficiaries in the communities served by the
treatment and control subcenters (the target population), we had to conduct a listing exercise that recorded information on all birth events in the previous 12 months. To keep this listing exercise manageable, we randomly selected two villages served by each subcenter for inclusion in our
63 Because the median subcenter in our sample served six AWCs, we used this as the cutoff to distinguish between small and large subcenters. 64 Given the limited information available on subcenter characteristics (block and size) before randomization, we deemed this crude stratification scheme to be sufficient; it seemed unlikely that a more elaborate stratification scheme using this information (for example, forming smaller size strata within each block) would be advantageous.
A.3

APPENDIX A. TECHNICAL APPENDIX MATHEMATICA POLICY RESEARCH
surveys, using a list of villages linked to each subcenter provided by CARE’s field team. If a large village (population ≥150, as identified by CARE) was selected, we then organized the village into approximately equal-sized segments (75 to 150 households per segment) and randomly selected one segment of the village for surveying.65
We first intended to survey all eligible beneficiaries in the selected villages (or segments); based on existing data about birth rates, we expected our sampling approach to meet our sample size target of about 20 eligible beneficiaries per subcenter. However, after conducting the listing, we discovered that some segments had many more eligible beneficiaries than we expected, which would have increased the time and cost of data collection without much benefit in terms of statistical power. Therefore, if the listing identified 30 or more eligible beneficiaries for a subcenter (across both the selected villages or segments), we randomly selected 25 of them into the sample (by randomly selecting an approximately equal number in each village or segment).
Overall, the beneficiary sampling approach in each subcenter consisted of up to three stages, involving the sequential selection of villages, segments, and beneficiaries. At endline, we returned to the same villages (or segments) but conducted a new listing to identify women who had given birth in the previous 12 months (again, we drew samples when necessary to meet our targeted sample sizes per subcenter).
2. Sampling for frontline worker (FLW) data collection Our overall goal was to draw a representative sample of FLWs—including accredited social
health activists (ASHAs), anganwadi workers (AWWs), and auxiliary nurse midwives (ANMs)—linked to the subcenters in our sample. The targeted sample size based on our statistical power calculations was nine FLWs per subcenter, including four ASHAs, four AWWs, and one ANM. For the baseline ASHA and AWW samples, we used a village-wise list (provided by CARE’s field team) of ASHAs and AWWs in each subcenter. Rather than simply draw a random sample of ASHAs and AWWs from this list, we decided to focus our sample of ASHAs and AWWs on the villages selected for the household survey. This was both to gain logistical simplicity and to have a closer link between household and FLW outcomes.
We therefore attempted to meet our targeted sample size of four ASHAs and four AWWs per subcenter by drawing a random sample of ASHAs and AWWs in the villages selected for the household sample in each subcenter. However, because some villages did not have sufficient ASHAs or AWWs available (for example, because of unfulfilled vacancies), it was sometimes necessary to select additional ASHAs or AWWs from other villages to reach the targeted sample size for the subcenter. To follow the same sampling approach in these cases, we first randomly selected an additional village (or additional villages) in the subcenter, and then randomly selected the appropriate number of ASHAs or AWWs from this village or these villages.
Although this gave us a representative sample of ASHAs and AWWs, we wanted to be sure that we surveyed the ASHAs and AWWs linked to the particular women in our beneficiary sample. Because some villages were large and we selected only one segment for the household survey, the beneficiaries we randomly sampled in the selected segment might not have been
65 When the subcenter served only a single (usually large) village, we selected two segments from this village.
A.4

APPENDIX A. TECHNICAL APPENDIX MATHEMATICA POLICY RESEARCH
served by the ASHA or AWW (there was no way for us to know ex ante which FLWs served which segments). We therefore asked surveyed beneficiaries to give us the names of the ASHAs and AWWs serving them, and added these to the FLW sample if they were not already included.
The final baseline ASHA and AWW samples therefore included (1) FLWs randomly drawn from the same villages selected for the household sample; (2) FLWs randomly drawn from other villages linked to the randomized subcenters; and (3) FLWs added ex post to the sample because they served the women sampled for the beneficiary survey, but had not been selected into the FLW sample. Finally, we used a randomly ordered replacement list (prioritizing ASHAs and AWWs in villages already selected) to ensure that we met our sample size targets, despite the fact that some selected ASHAs or AWWs could not be found or refused to respond. At endline, we attempted to survey all the ASHAs and AWWs identified at baseline, plus any new ASHAs and AWWs serving the sampled beneficiaries. As noted earlier, we attempted to survey all ANMs in the treatment and control subcenters at baseline and endline, respectively (most subcenters had one ANM, but some had two). There was relatively little turnover in the FLW sample—we identified only 9 new ASHAs and 6 new AWWs from a sample of almost 300 of each at endline, and 11 new ANMs out of a total sample of almost 100. At endline, we also surveyed a small number of lady supervisors (LSs) in treatment subcenters. We attempted to interview all the LSs who had been trained by CARE as part of the ICT intervention. In total, we identified 20 such LSs and interviewed 13 of them.
C. Analytic approach
1. Beneficiary surveys: main impact estimates Because randomization should ensure that the treatment and control groups are similar in all
respects other than receipt of the intervention, we could have estimated the impacts presented in Chapter V simply by computing the difference in mean outcomes between the two groups at endline. However, we instead estimated impacts in a regression framework, using the following regression model for beneficiaries in our sample66,67:
(1) ijkjkjkijkkkjkpostijk ZXTY εµδγλαβα ++++++=,
where Yijk,post is the outcome for woman i in subcenter j in stratum k at endline; Tjk is a binary indicator for subcenter j being in the treatment group; λk is a vector of stratum indicators (one for each random assignment stratum); Xijk and Zjk are vectors of individual- and subcenter-level covariates, respectively, that could be related to the outcome of interest (individual-level covariates include household demographics such as whether a woman belongs to a scheduled
66 Using a regression framework enabled us to explicitly account for the method of randomization by including stratum-level indicators. By controlling for additional individual and baseline subcenter-level characteristics, we were also able to reduce the variance in the outcome (and hence increase statistical power) and control for differences that could have arisen by chance between the treatment and control groups. As a robustness check, we compared our results with those from simple unadjusted treatment-control comparisons and found them largely similar. 67 In the case of binary outcomes, Equation (1) is termed a linear probability model. Although probit or logit models are often used for binary outcomes, we prefer the linear probability model because it is easier to interpret and relies on weaker parametric assumptions. In practice, the probit or logit and linear probability models yield similar results for the estimated impacts.
A.5

APPENDIX A. TECHNICAL APPENDIX MATHEMATICA POLICY RESEARCH
caste or tribe, whether she is Hindu, the number of her children, her age, her literacy, and her socioeconomic status quartile, whereas the subcenter-level covariates include the subcenter-level mean of the outcome, when available); µjk is a subcenter-level error term; and εijk is an individual error term. The coefficient of interest is β, which gives the impact of the intervention on the outcome of interest; conceptually, this is only the regression-adjusted difference in mean outcomes between the treatment and control groups. All regressions were weighted to account for differing sampling probabilities and to ensure treatment–control balance within random assignment strata; the estimated impacts can therefore be interpreted as the impacts for the average woman in the treatment subcenters. We adjusted all standard errors to account for the correlation in outcomes among beneficiaries linked to the same subcenter using the cluster adjustment in Stata.
2. Beneficiary surveys: subgroup impacts To estimate impacts and differences in impacts for specific subgroups presented in Chapter
V, we introduced appropriate interaction terms into equation (1). For example, to compare impacts for SC/ST and non-SC/ST beneficiaries, we estimated the following regression model:
(2) ijkjkjkijkkk
ijkijkjkijkjkpostijk
ZXSCSTnonSCSTTSCSTTY
εµδγλα
ββα
+++++
+++= ** 21,
where SCSTijk is a binary indicator that is one for SC/ST beneficiaries and zero for non-SC/ST beneficiaries, nonSCSTijk is a similar binary indicator for non-SC/ST beneficiaries, and all other terms are as defined above. The coefficients on the interaction terms with the binary treatment variable Tjk give the impacts for SC/ST beneficiaries (β1) and non-SC/ST beneficiaries (β2). The difference between these coefficients is the difference in impacts by SC/ST status, which we tested for statistical significance using an F-test with the appropriate degrees of freedom. Impacts for other subgroups defined by beneficiary charactersitics or charactersitics of FLWs serving the beneficiaries were estimated in a similar manner. For the subgroup estimates on caste affinity, subgroups were defined based on the caste of FLWs serving the beneficiaries, and the estimation sample was restricted to SC/ST beneficiaries.
3. FLW surveys: main impact estimates We used a similar regression framework to determine the impact of the interventions on
outcomes for ASHAs and AWWs, which we presented in Chapter IV. In all analyses, we pooled the data collected from workers in these two cadres to estimate the following regression model:68
(3) , 1 2
1 2
*
*ijk post jk ijk k k k k ijk
ijk ijk ijk jk ijk
Y T ASHA ASHAX X ASHA
α β α λ α λ
γ γ µ ε
= + + + +
+ + + +
As in the household analysis, Yijk,post is the outcome for FLW i in subcenter j in stratum k at endline; Tjk is a binary indicator for subcenter j being in the treatment group; ASHAijk is an indicator for the FLW being an ASHA (rather than an AWW); λk is a vector of stratum indicators
68 Our analysis is designed to have power to detect impacts in the pooled sample. However, we also analyzed key outcomes for ASHAs and AWWs separately and found that the estimates were broadly similar.
A.6

APPENDIX A. TECHNICAL APPENDIX MATHEMATICA POLICY RESEARCH
(one for each random assignment stratum); Xijk is a vector of FLW-level covariates that could be related to the outcome of interest; µjk is a subcenter-level error term; and εijk is an individual error term. The indicator for the FLW being an ASHA controls for differences in composition of ASHAs and AWWs in different areas. We allow stratum indicators and FLW characteristics to differentially affect outcomes for ASHAs and AWWs because sampling occurred separately by cadre, and because certain characteristics might be differentially related to ASHAs’ or AWWs’ ability to affect health-related beneficiary outcomes. The FLW characteristics include controls for worker’s age, scheduled caste or scheduled tribe status, religion, reading ability, and indicators for whether the FLW reports serving an area with predominantly Muslim or SC/ST beneficiaries.
All regressions using data from the ASHA and AWW surveys were weighted, correcting for differing sampling probabilities and ensuring treatment-control balance. Weights were normalized so that the estimated effects represent the average FLW. In addition, in all FLW regressions, we adjust for clustering as in the beneficiary-level analysis, using the cluster adjustment in Stata at the subcenter level.
We estimated a more parsimonious model to examine the impacts of ICT on ANMs:
(4) ijkjkkkjkpostijk TY εµλαβα ++++=,
with variables defined as in the other FLW regressions.69 Because our analysis was not designed to have the statistical power to distinguish impacts within the ANM sample (when not pooled with other FLW cadres), these results should be thought of as providing descriptive context for the ASHA, AWW, and household results. Because of this descriptive nature, the model excludes any subcenter or ANM characteristics.
4. FLW surveys: use of ICT-CCS tool by FLW characteristics In Chapter III (Table III.6) we examine how treatment FLW characteristics are related to
various measures of their understanding, use, and perceptions of the ICT-CCS phone. To do this, we estimated an ordinary least squares regression of each measure on FLW characteristics:
(5) ijk ijk k k ijk jk ijkY ASHA Xα α λ γ µ ε= + + + + +
where Yijk is a measure of understanding, use, or perceptions for FLW i in subcenter j and stratum k; ASHAijk is a binary indicator to denote an ASHA (as opposed to an AWW); λk is a vector of stratum indicators; Xijk is a vector of FLW-level characteristics; µjk is a subcenter-level error term; and εijk is an individual error term. The characteristics in Xijk include age, reading ability (literacy), religion, SC/ST status, and indicators for whether the FLW served a predominantly SC/ST or Muslim area.
We used the estimated coefficients from these regressions to produce regression-adjusted means, allowing for more intuitive comparisons of outcomes for FLWs with different
69 Because almost all ANMs in treatment and control subcenters are included in our analysis, we did not weight the ANM data. As in the ASHA/AWW regressions, we adjust for clustering using the cluster adjustment in Stata at the subcenter level. Since the sample size is small, we do not control for ANM characteristics in this regression.
A.7

APPENDIX A. TECHNICAL APPENDIX MATHEMATICA POLICY RESEARCH
characteristics. These means are produced by setting all variables besides the characteristic of interest to the sample mean, and then setting the characteristic of interests to a specific value. For example, the regression-adjusted mean for FLWs who are 30-years-old would use the above regression evaluated at age equal to 30 with all other variables set to the mean for all individuals.
A.8

APPENDIX B
COST AND COST-EFFECTIVENESS ANALYSIS

This page has been left blank for double-sided copying.

APPENDIX B. COST AND COST-EFFECTIVENESS ANALYSIS MATHEMATICA POLICY RESEARCH
To inform scale-up of the ICT-CCS intervention in Bihar and its implementation in other contexts, we conducted a cost and cost-effectiveness analysis of the intervention. The cost analysis was based on implementation costs over the pilot period that were obtained from CARE. It was conducted from the perspective of understanding what it would cost to implement a similar intervention in a similar context, or to scale up the existing intervention. The cost-effectiveness analysis combined estimates of ongoing operating costs of the intervention and the impacts on health behaviors estimated in the body of this report. These cost and cost-effectiveness estimates should be viewed with caution for several reasons, including: (1) the cost information was collected retrospectively and may not be fully complete or accurate; (2) we are unable to measure the costs associated with developing the software, an important component of the total cost; (3) the ICT-CCS pilot was designed as a proof of concept and not necessarily to maximize cost efficiency; and (4) some of the estimated costs may change with the scale of the intervention. Despite these caveats, the estimates presented here will provide a useful broad sense of the costs for policymakers considering adopting or scaling up the intervention.
A. Method for cost analysis
Our cost analysis separates the intervention’s start-up costs required as initial investment, and the costs that need to be made on an ongoing basis to continue the intervention. Specifically, we estimate: (1) upfront costs that have to be paid at the beginning of the program (such as costs of the mobile phones and training), and (2) operating costs that recur over time (such as labor and maintenance costs). We do not include the cost of developing the technology required for the intervention, because this information is not available as this technology was developed in conjunction with other foundation efforts. Further, going forward, the same technology can be used to expand implementation at little additional cost.
We estimate both the costs per FLW as well as the costs per beneficiary; these estimates can be used to estimate the total costs for implementation at a given scale. The cost per FLW is a useful estimate because it allows the government or other implementers to compare the cost of the ICT intervention relative to other interventions that operate through FLWs. The cost per beneficiary is a useful alternative estimate which assesses costs from the perspective of those who are ultimately expected to be affected, and is useful in assessing the cost-effectiveness of the intervention. To calculate the cost per beneficiary, we define a beneficiary as a mother and child pair in the target age range served by the intervention.
The cost analysis involved several steps. First, we identified key components that were part of the intervention and for which we required information about costs. Because the intervention was implemented against the backdrop of the overall Ananya program, we focused on obtaining information about the additional costs of the intervention. For example, subcenter meetings were part of the overall Ananya program and these meetings were implemented in both treatment and control subcenters, so those costs were not counted for the intervention. Second, we collected data on all the costs required to implement the intervention from CARE, and classified these costs into the two categories of costs described earlier, upfront costs and operating costs. For example, the cost of purchasing mobile phones at the start of the intervention was classified as an upfront cost, whereas the cost of the data plan associated with the mobile phone was classified as an operating cost. Third, we used these cost data to compute the upfront costs per FLW (and per
B.3

APPENDIX B. COST AND COST-EFFECTIVENESS ANALYSIS MATHEMATICA POLICY RESEARCH
beneficiary) required as initial investment and the operating costs per FLW (and per beneficiary) for continued operation.
B. Findings from cost analysis
The costs associated with the ICT intervention include the costs of the mobile phones and associated air time, costs of training, costs associated with logistics during the launch of the intervention, labor costs of implementing staff hired specifically for the intervention, phone maintenance costs, and server costs.70 As mentioned above, we computed the up-front and operating costs separately, and converted these into per-FLW and per-beneficiary estimates. For the per-FLW cost estimates, we calculated the number of FLWs in the four blocks of Saharsa between whom to divide the costs as 569. We computed the number of beneficiaries using the population of the blocks in which the intervention was implemented (using census data and assuming half of those enumerated were in treatment) and estimates of birth rates in the district (from external estimates).71 We calculated the number of beneficiaries to be about 11,343 for the per-beneficiary cost estimates.
We classified the costs of purchasing, setting up, and distributing the mobile phones and the costs of training as up-front costs.72 Table B.1 provides details of the upfront costs associated with the ICT intervention. The total upfront cost per FLW is USD 112.85 and the total upfront cost per beneficiary is USD 5.66.
70 FLW turnover does not add to the costs because the phones are recovered when an FLW leaves and given to the new FLW replacing them. Training for new FLWs is conducted by the ICT coordinator as part of their regular duties and does not add significant additional costs. 71 Source for 2001 census data for Saharsa: http://saharsa.bih.nic.in/population1.htm; source for 2001-2011 population growth rate for Saharsa: http://www.census2011.co.in/census/district/66-saharsa.html; source for birth rates for Saharsa: http://www.censusindia.gov.in/vital_statistics/AHSBulletins/files2012/Bihar_Bulletin%202011-12.pdf 72 We assume that mobile phones have a life-cycle of approximately three years; therefore the cost of mobile phones is likely to be incurred approximately once every three years. However, we do not count this as an operating cost since this cost will have to be paid upfront as an initial investment if the program scales up to new locations. If the program continues to operate, mobile phones and memory cards have to be replaced every three years at an additional cost of USD 69.53 per FLW (we assume that the SIM card can be reused). Another approach, if the program were operating at scale, would be to amortize the costs of the mobile phones over a three year window and treat the amortized costs as program operating costs.
B.4

APPENDIX B. COST AND COST-EFFECTIVENESS ANALYSIS MATHEMATICA POLICY RESEARCH
Table B.1. Upfront Costs of ICT-CCS Intervention
Cost Description Total Cost
(USD) a Cost per FLW
(USD) a
Cost per beneficiary (USD)
a
Mobile phone, subscriber identity module (SIM) card, and memory card
Cost of buying the mobile phones for FLWs and the ICT coordinator and setting them up with a SIM card and memory card
40,516 71.21 3.57
Mobile phone distribution and logistics during launch
Logistics associated with starting the program; this includes costs of printing and photocopying, and costs associated with packing and transporting mobile phones.
833 1.46 0.07
Initial training costs
Cost of training the FLWs and supervisors to use the software at the start of the intervention; this includes the labor costs, mobile phone costs and boarding costs for trainers/ facilitators, boarding costs for supervisors during group training, costs of training the ICT coordinators and payment to FLWs for attending each training meeting to help cover the cost of attendance.
22,864 40.18 2.02
TOTAL Sum of all upfront costs 64,214 112.85 5.66 a All costs collected in INR were converted to USD at an exchange rate of INR 60 to 1 USD.
We classified the costs of air time and data, costs of ongoing training, salaries for implementing staff, server costs, and costs associated with maintaining the devices as operating costs. Table B.2 provides details of the ongoing operating costs associated with the ICT intervention for a period of one year. The total operating cost per FLW per year is USD 72.24 (USD 6.02 per month), and the total operating cost per beneficiary per year is USD 3.62.
B.5

APPENDIX B. COST AND COST-EFFECTIVENESS ANALYSIS MATHEMATICA POLICY RESEARCH
Table B.2. Operating Costs of ICT-CCS Intervention
Cost Description
Total Cost per year (USD)a
Cost per FLW per year
(USD) a
Cost per beneficiary per
year (USD) a
Air time and data costs
Cost of using the mobile phones for FLWs and the ICT coordinator
17,160 30.16 1.51
Ongoing training costs
Cost of any ongoing training during the intervention, associated mainly with FLW turnover over time
— b — b — b
Labor costs of implementing staff
Includes the salary and travel expenses of the ICT coordinator
11,400 20.04 1.01
Maintenance costs
Includes the cost of purchasing insurance and warranty for the phones, replacing mobile phone batteries, and replacing mobile phones that were lost or not working for FLWs and ICT coordinatorsc
5,680 9.98 0.50
Server costsd Fees to Dimagi paid per user for hosting CommCare
6,864 12.06 0.61
TOTAL Sum of all operating costs 41,104 72.24 3.62 aAll costs collected in INR were converted to USD at an exchange rate of INR 60 to 1 USD. b The ICT coordinators conduct this training as part of their regular duties, and we ignore the small opportunity cost associated with training new FLWs c Assumes a life cycle of 3 years for a mobile phone. Over these 3 years, maintenance costs include (1) two years of paid warranty (the first year is free); (2) three years of insurance; (3) two battery replacements (assuming the life cycle for the battery is 15 months); and (4) replacement or repair of 5 percent of phones, SIM cards, and memory cards each year due to loss or damage not covered by insurance. d Server costs are calculated at 1 USD per FLW per month and a conversion rate of 1 USD to 60 INR. This is an upper bound for the server costs, because they will decrease with scale. For example, currently the pricing is 1 USD per FLW per month for the first 2000 FLWs after which the price is 0.25 USD per FLW per month. So for an ICT intervention with 10,000 FLWs, the average server cost is 0.40 USD per FLW per month
In addition to the upfront and operating costs discussed above, in order to support this pilot innovation, a lead ICT-CCS program manager and a district manager from CARE spent fifty percent and twenty five percent of their time, respectively, over two years to execute and oversee the intervention for this evaluation. The costs associated with time spent by senior management from CARE was approximately USD 15,000 each year (and amounts to an additional USD 26.36 per FLW and USD 1.32 per beneficiary per year). We did not include these costs in our estimates of operating costs because they were specific to the pilot, and might B.6

APPENDIX B. COST AND COST-EFFECTIVENESS ANALYSIS MATHEMATICA POLICY RESEARCH
not reflect the management costs that would be incurred if the post-pilot phase. If this pilot is scaled up, it is possible that district officials or other management staff may spend time on program oversight. They may either view this program management as part of their current responsibilities in which case there may not be additional management costs, or they may have dedicated managers overseeing the program in which case additional management costs may be incurred.
C. Method for cost-effectiveness analysis
To conduct the cost-effectiveness analysis, we first calculated the cost per beneficiary per year in a steady-state period that reflects the cost of continued service provision. To do this, we amortized the cost of the phones to obtain the steady state value of the cost. Specifically, we estimated the amortized cost per year of buying the mobile phone (the phone itself and the memory card) based on the expected 3-year life-cycle of the mobile phones. We anticipate that the logistics of distributing the mobile phones in steady state are negligible. We also assume that the steady training costs are negligible since the ICT coordinator provides ongoing training to FLWs, including training associated with FLW turnover, as part of their regular duties. We combined the amortized upfront costs with the operating costs to obtain the cost of continued service provision per beneficiary per year in a steady-state.
Next, we combined the cost data with impact estimates from a randomized controlled trial (RCT) of the ICT-CCS intervention. As discussed in the body of this report, the RCT involved randomly assigning subcenters to a treatment group that received the intervention during the study period or to a control group which did not. Random assignment ensured that the treatment and control groups were similar in all respects at baseline and continued to experience similar environments in the intervention period—especially regarding access to and intensity of government health services and other Ananya program activities—except that only the treatment group had access to the ICT-CCS intervention. As a result, the differences in outcomes we observed between the two groups over time can be attributed as the causal effects of the intervention with a known degree of certainty. The RCT was designed to provide rigorous evidence of the value added by the ICT-CCS intervention beyond the core Ananya interventions, and yielded estimated impacts on a range of outcomes across the continuum of care.
Because of the multidimensional nature of the ICT-CCS intervention, we conducted a cost-outcomes analysis that reports the cost of achieving a vector of outcomes.73 A cost-outcomes analysis acknowledges that there are different types of benefits and gives the costs of a change in each of the outcomes considered. It enables decision makers comparing programs to weight programs based on the relative importance they place on an individual outcome, and compare the costs per beneficiary of each program to achieve that outcome.
Finally, we provide the upper bound for the cost effectiveness of the intervention for each outcome. Since the intervention was intended to affect outcomes from several domains simultaneously, and the costs of the intervention are bundled together, we do not have sufficient information to calculate the marginal cost of achieving each additional outcome. Our estimates
73 A similar framework is used in some settings in the public health literature and referred to as a cost-consequence analysis (Gold et al. 1996).
B.7

APPENDIX B. COST AND COST-EFFECTIVENESS ANALYSIS MATHEMATICA POLICY RESEARCH
should therefore be viewed as an upper bound because the same impact for an outcome may have been achieved at a lower cost if the intervention had focused on just that outcome. To calculate the upper bound, we divided the steady state cost per beneficiary per year by the impact for each outcome to obtain the cost of achieving a unit change for that outcome, assuming that it is the only outcome the program affects. We focused on outcomes that had statistically significant impacts; for other outcomes, cost effectiveness was not defined because there was no change attributable to the intervention. Because the outcomes in the RCT are almost all binary (the percentage of beneficiaries adopting a certain health-related behavior), the impact estimates can be interpreted as the change in probability that a particular outcome is observed. Therefore, the cost-outcome estimates we calculated provide the costs per beneficiary for a 1 percentage point change in the probability of adopting each behavioral outcome in the vector of outcomes for which impacts were observed.
D. Findings from cost-effectiveness analysis
As mentioned above, the first step in the cost effectiveness analysis is to determine the annual costs of continuing to provide the ICT intervention in a steady state of operation. We estimate that these steady state costs are approximately USD 95.42 per FLW per year (USD 4.79 per beneficiary per year). This steady state estimate does not consider the upfront costs of training the FLWs and ICT coordinator, buying SIM cards for all the phones, and logistics that were part of the initial investment for the intervention since FLW turnover is fairly low—making the likelihood of incurring these costs in a short horizon low. If we include these upfront costs, and assume that these are spread over a period of ten years (that is, that typical ICT coordinators and FLWs stay in their role for ten years), the steady state costs increases slightly to about USD 99.75 per FLW per year (USD 5.00 per beneficiary per year). Our steady state cost estimates also do not include the management costs provided by CARE since those were specific to the pilot intervention and evaluation. Assuming similar management costs would be required each year in a steady state of operation increases our cost estimates to approximately USD 126.11 per FLW per year (USD 6.33 per beneficiary per year). For the purpose of the cost outcomes analysis, we use the steady state cost of continued operation per beneficiary per year (USD 4.79) that does not include the upfront training, logistics, and management costs.
The domains in which we estimated impacts of the ICT-CCS intervention include antenatal care, delivery and newborn care, child nutrition, immunizations, and reproductive health. Table B.3 summarizes the impacts we observed for key outcomes from each domain and presents the cost-effectiveness estimates for the ICT-CCS intervention using the framework of a cost-outcomes analysis. As mentioned earlier, these impacts are relative to a scenario in which the core Ananya interventions are implemented without the ICT-CCS intervention.
The ICT-CCS intervention had significant impacts on several outcomes in the antenatal care and delivery and newborn care domains. These included substantive and statistically significant impacts on antenatal care visits, consumption of IFA tablets, some measures of birth preparedness, and some appropriate newborn care practices (immediate breastfeeding and skin-to-skin care). However, there were no impacts on other behaviors, such as cord care, facility delivery, or exclusive breastfeeding. There were also significant impacts in the child nutrition domain, in particular on the age-appropriate introduction of complementary feeding. Finally,
B.8

APPENDIX B. COST AND COST-EFFECTIVENESS ANALYSIS MATHEMATICA POLICY RESEARCH
there were significant impacts on the use of modern methods of contraception, but no impacts on child immunizations.
Because the magnitude of the impact of the ICT-CCS intervention varied across outcomes, the cost-effectiveness also varies considerably across outcomes. For example, in steady state, an annual cost of USD 1.02 (upper bound) per beneficiary increases the probability that a beneficiary received at least two TT injections by 1 percentage point relative to the core Ananya interventions. On the other hand, in steady state, achieving a 1 percentage point increase in the probability that a beneficiary received at least three antenatal care visits costs only USD 0.23 (upper bound) per beneficiary.
Table B.3. Impacts and cost effectiveness for key health behaviors, by domain
Difference between
treatment and control mean (percentages)
Upper bound of steady state cost of continued service provision per
beneficiary per year for a one percentage point
impact (USD)
Antenatal Care At least 3 ANC visits 21.1*** 0.23 At least 2 TT injections 4.7** 1.02 At least 90 IFA tablets consumed 6.3*** 0.76 Obtained telephone number of ambulance, private vehicle, or FLW for delivery 9.1** 0.53 Delivery and Newborn Care Facility delivery 1.2 N/A Nothing applied to cord and umbilicus -0.1 N/A Bath delayed by at least 2 days -1.9 N/A Immediate breastfeeding 13.7*** 0.35 Skin-to-skin care 7.4* 0.65 Exclusive breastfeeding for 6 months, children 6 months or oldera 2.4 N/A Exclusive breastfeeding in past 24 hours (children younger than 6 months)b -5.3 N/A Child Nutrition (child 6 months or older) Child eats solid or semisolid food 8.8* 0.54 Child began eating solid food by age 6 months 9.1** 0.53 Child fed any cereal-based meal in the previous day 7.5* 0.64 Immunization (child 6 months or older) Received DPT3 0.9 N/A Fully immunized (except measles) 3.8 N/A Reproductive Health Use of permanent methods of contraception 6.4** 0.75 Use of temporary methods of contraception (current) 0.8 N/A Use of any modern method of contraception (current) 7.3** 0.66
Source: Ananya ICT-CCS Impact Evaluation Report (Borkum et al, 2014). a Based on self-reports of the duration of exclusive breastfeeding for children 6 months or older. b Based on reports of liquids and solids fed to children younger than 6 months in the previous 24 hours, following the recommended definition of the World Health Organization. */**/*** Significantly different from zero at the .10/.05/.01 level, two-tailed test.
B.9

APPENDIX B. COST AND COST-EFFECTIVENESS ANALYSIS MATHEMATICA POLICY RESEARCH
E. Conclusion
Our cost analysis suggests that, provided the existing technology can be used as is with little additional cost, expanding the ICT intervention would cost about USD 112.85 per FLW (USD 5.66 per beneficiary) to set up initially, and about USD 72.24 per FLW per year (USD 3.62 per beneficiary per year) in operating costs. In addition, about USD 69.53 per FLW (USD 3.49 per beneficiary) would have to be spent approximately every three years to replace mobile phones. Including the costs of the management support provided by CARE—which we did not include in our primary cost estimate because they are likely to be specific to the pilot phase—would increase the operating costs per year to USD 98.60 per FLW (USD 4.94 per beneficiary).
It is important to note that there are several assumptions underlying our cost estimates, and they should therefore be treated as approximate. Differences in costs associated with changing the scale of the intervention may be particularly important. For example, we use a rate of USD 1 per FLW per month as an upper bound for the server cost, but if the intervention is expanded the cost per user will be lower and thus decrease the overall operating costs. On the other hand, ongoing training costs associated with FLW turnover may not be negligible if the intervention is expanded, and thus increase the operating costs. Similarly, for a larger scale intervention, there may be administrative costs that we have not considered. Nevertheless, these estimates are useful in providing a broad sense of the magnitude of the costs of implementation.
Our cost-outcomes analysis suggests that the cost effectiveness of the ICT intervention varied across domains as well as within each domain. At the extreme, the ICT intervention had no impact on the immunization domain and hence is not cost effective if immunizations are the main focus, while the intervention had impacts on all the key outcomes in the antenatal care, nutrition and reproductive health domains. There is also substantial variation within domains; for example, within the antenatal care domain, the intervention has a much lower cost for a one percentage point impact in improving the frequency of antenatal care visits versus appropriate TT injections. However, as discussed earlier these numbers should be interpreted as upper bounds since the intervention was intended to collectively affect key outcomes in several domains rather than individual outcomes. Further, the intervention was run as a pilot, rather than with cost effectiveness in mind, so these estimates should be interpreted cautiously.
B.10

www.mathematica-mpr.com
Improving public well-being by conducting high quality, objective research and data collection PRINCETON, NJ ■ ANN ARBOR, MI ■ CAMBRIDGE, MA ■ CHICAGO, IL ■ OAKLAND, CA ■ WASHINGTON, DC
Mathematica® is a registered trademark of Mathematica Policy Research, Inc.