
Critical soil conditions for oxygen stress to plant roots: Substituting the Feddes-function by a...
19
Critical soil conditions for oxygen stress to plant roots: Substituting the Feddes-function by a process-based model Ruud P. Bartholomeus a,b, * , Jan-Philip M. Witte a,b , Peter M. van Bodegom a , Jos C. van Dam c , Rien Aerts a a Vrije Universiteit, Institute of Ecological Science, Department of Systems Ecology, de Boelelaan 1085, 1081 HV Amsterdam, The Netherlands b Kiwa Water Research, P.O. Box 1072, 3430 BB Nieuwegein, The Netherlands c Wageningen UR, Droevendaalsesteeg 4, 6708 PB Wageningen, The Netherlands Received 20 February 2008; received in revised form 17 July 2008; accepted 20 July 2008 KEYWORDS Feddes-function; Gas filled porosity; Oxygen stress; Root water uptake; Transpiration; Water logging Summary Effects of insufficient soil aeration on the functioning of plants form an impor- tant field of research. A well-known and frequently used utility to express oxygen stress experienced by plants is the Feddes-function. This function reduces root water uptake lin- early between two constant pressure heads, representing threshold values for minimum and maximum oxygen deficiency. However, the correctness of this expression has never been evaluated and constant critical values for oxygen stress are likely to be inappropri- ate. On theoretical grounds it is expected that oxygen stress depends on various abiotic and biotic factors. In this paper, we propose a fundamentally different approach to assess oxygen stress: we built a plant physiological and soil physical process-based model to cal- culate the minimum gas filled porosity of the soil (/ gas_min ) at which oxygen stress occurs. First, we calculated the minimum oxygen concentration in the gas phase of the soil needed to sustain the roots through (micro-scale) diffusion with just enough oxygen to respire. Subsequently, / gas_min that corresponds to this minimum oxygen concentration was calculated from diffusion from the atmosphere through the soil (macro-scale). We analyzed the validity of constant critical values to represent oxygen stress in terms of / gas_min , based on model simulations in which we distinguished different soil types and in which we varied temperature, organic matter content, soil depth and plant 0022-1694/$ - see front matter ª 2008 Elsevier B.V. All rights reserved. doi:10.1016/j.jhydrol.2008.07.029 * Corresponding author. Address: Vrije Universiteit, Institute of Ecological Science, Department of Systems Ecology, de Boelelaan 1085, 1081 HV Amsterdam, The Netherlands. Tel.: +31 306069530; fax: +31 306061165. E-mail addresses: [email protected] (R.P. Bartholomeus), [email protected] (R.P. Bartholomeus), flip.witte@ kiwa.nl (J.P.M. Witte), [email protected] (P.M. van Bodegom), [email protected] (J.C. van Dam), rien.aerts@ ecology.falw.vu.nl (R. Aerts). Journal of Hydrology (2008) 360, 147– 165 available at www.sciencedirect.com journal homepage: www.elsevier.com/locate/jhydrol
Transcript of Critical soil conditions for oxygen stress to plant roots: Substituting the Feddes-function by a...

Journal of Hydrology (2008) 360, 147–165
ava i lab le a t www.sc iencedi rec t . com
journal homepage: www.elsevier .com/ locate / jhydrol
Critical soil conditions for oxygen stress to plantroots: Substituting the Feddes-function by aprocess-based model
Ruud P. Bartholomeus a,b,*, Jan-Philip M. Witte a,b, Peter M. van Bodegom a,Jos C. van Dam c, Rien Aerts a
a Vrije Universiteit, Institute of Ecological Science, Department of Systems Ecology, de Boelelaan 1085,1081 HV Amsterdam, The Netherlandsb Kiwa Water Research, P.O. Box 1072, 3430 BB Nieuwegein, The Netherlandsc Wageningen UR, Droevendaalsesteeg 4, 6708 PB Wageningen, The Netherlands
Received 20 February 2008; received in revised form 17 July 2008; accepted 20 July 2008
00do
*
10
kiec
KEYWORDSFeddes-function;Gas filled porosity;Oxygen stress;Root water uptake;Transpiration;Water logging
22-1694/$ - see front mattei:10.1016/j.jhydrol.2008.07
Corresponding author. Add81 HV Amsterdam, The NetE-mail addresses: ruud.ba
wa.nl (J.P.M. Witte), peteology.falw.vu.nl (R. Aerts).
r ª 200.029
ress: Vriherlandsrtholomr.van.bod
Summary Effects of insufficient soil aeration on the functioning of plants form an impor-tant field of research. A well-known and frequently used utility to express oxygen stressexperienced by plants is the Feddes-function. This function reduces root water uptake lin-early between two constant pressure heads, representing threshold values for minimumand maximum oxygen deficiency. However, the correctness of this expression has neverbeen evaluated and constant critical values for oxygen stress are likely to be inappropri-ate. On theoretical grounds it is expected that oxygen stress depends on various abioticand biotic factors. In this paper, we propose a fundamentally different approach to assessoxygen stress: we built a plant physiological and soil physical process-based model to cal-culate the minimum gas filled porosity of the soil (/gas_min) at which oxygen stress occurs.
First, we calculated the minimum oxygen concentration in the gas phase of the soilneeded to sustain the roots through (micro-scale) diffusion with just enough oxygen torespire. Subsequently, /gas_min that corresponds to this minimum oxygen concentrationwas calculated from diffusion from the atmosphere through the soil (macro-scale).
We analyzed the validity of constant critical values to represent oxygen stress interms of /gas_min, based on model simulations in which we distinguished different soiltypes and in which we varied temperature, organic matter content, soil depth and plant
8 Elsevier B.V. All rights reserved.
je Universiteit, Institute of Ecological Science, Department of Systems Ecology, de Boelelaan 1085,. Tel.: +31 306069530; fax: +31 [email protected] (R.P. Bartholomeus), [email protected] (R.P. Bartholomeus), flip.witte@[email protected] (P.M. van Bodegom), [email protected] (J.C. van Dam), rien.aerts@

148 R.P. Bartholomeus et al.
characteristics. Furthermore, in order to compare our model results with the Feddes-function, we linked root oxygen stress to root water uptake (through the sink term vari-able F, which is the ratio of actual and potential uptake).
The simulations showed that /gas_min is especially sensitive to soil temperature, plantcharacteristics (root dry weight and maintenance respiration coefficient) and soil depthbut hardly to soil organic matter content. Moreover, /gas_min varied considerably betweensoil types and was larger in sandy soils than in clayey soils. We demonstrated that F of theFeddes-function indeed decreases approximately linearly, but that actual oxygen stressalready starts at drier conditions than according to the Feddes-function. How much drieris depended on the factors indicated above. Thus, the Feddes-function might cause largeerrors in the prediction of transpiration reduction and growth reduction through oxygenstress.
We made our method easily accessible to others by implementing it in SWAP, a user-friendly soil water model that is coupled to plant growth. Since constant values for /gas_-
min in plant and hydrological modeling appeared to be inappropriate, an integratedapproach, including both physiological and physical processes, should be used instead.Therefore, we advocate using our method in all situations where oxygen stress couldoccur.
ª 2008 Elsevier B.V. All rights reserved.
Figure 1 Sink term variable F as function of pressure head haccording to Feddes et al. (1978). Root water uptake reduceslinearly from III (h3) to IV (h4) due to moisture stress, as well asfrom the critical values II (h2) and I (h1), due to oxygen stress. Inbetween II and III, root water uptake is optimal (F = 1).
Introduction
Plants need soil oxygen to keep their root metabolism run-ning. Consequently, in water saturated soil conditions,where oxygen diffusion is limited, most terrestrial plantssuffer from a lack of oxygen. The effect of insufficient soilaeration on the functioning of plants has been an importantfield of research for a long time, e.g. in: (1) agriculture, asoxygen stress reduces yields (Dasberg and Bakker, 1970), (2)ecology, since water logging affects plant species composi-tion (Bartholomeus et al., 2008; Burdick and Mendelssohn,1987; Niinemets and Valladares, 2006; Runhaar et al.,1997), and (3) hydrological modeling, as water logging re-duces root water uptake (Feddes et al., 1978).
In reference to the latter field of research, currenthydrological models for the unsaturated zone describe soilwater flow by solving the Richards’ equation, which includesa sink term that represents water uptake by plant roots. Dif-ferent procedures for the simulation of root water uptakeexist (e.g. Doussan et al., 1998; Roose and Fowler, 2004;Van den Berg and Driessen, 2002). A well-known and fre-quently used procedure to simulate root water uptake, isthe reduction function of Feddes et al. (1978). Currenthydrological models that include the Feddes-function, suchas SWAP (Kroes et al., 2008) and HYDRUS (Simunek et al.,2005), compute root water uptake by multiplying potentialtranspiration (which is determined by meteorological condi-tions and crop type) with a sink term variable F (Fig. 1).Depending on soil water pressure head h, F corrects for con-ditions that are either too dry, or too wet. Root water up-take decreases linearly between pressure head h2 and theanaerobiosis point h1 due to oxygen stress in wet situations.However, a detailed analysis of this wet side of the functionhas never been performed, in contrast to the dry side of theFeddes-function (the part between h3 and h4) (Metselaarand de Jong van Lier, 2007). None of the procedures forroot water uptake, including the Feddes-function, combineboth plant physiological and soil physical processes to pre-dict the reduction of root water uptake at insufficient soilaeration.
Feddes et al. (1978) already indicated that a fixedanaerobiosis point h2, identical for all environmental condi-tions, may be inappropriate, because pressure heads do notprovide direct information on the aeration status of the soil.Alternative approximations of oxygen stress have been de-fined, like the gas filled porosity of the soil, /gas (Wesselingand van Wijk, 1957). This proxy might provide a better rela-tionship between soil aeration and root oxygen stress, assoil aeration substantially depends on /gas (Hillel, 1980)and plant functioning appears to be well-correlated to thisproxy (Dasberg and Bakker, 1970). Constant critical valuesfor /gas have frequently been applied to represent oxygenstress (Barber et al., 2004; Leao et al., 2006), but constantsare unlikely to be sufficient for any proxy. In fact, oxygenconsumption of, and oxygen transport to plant roots dependon soil temperature, growth stage, soil texture and micro-bial activity (Hillel, 1980). Each of these variables shouldbe considered simultaneously to determine the degree ofoxygen stress accurately, but an accurate procedure doesnot seem to exist up to now. Such a procedure should

Critical soil conditions for oxygen stress to plant roots: Substituting the Feddes-function by a process-based model 149
combine two very different types of equations: (1) Oxygenconsumption of plant roots described by plant physiologicalprocesses, focusing on the energy demand of plants (Cannelland Thornley, 2000), and (2) Oxygen transport to plant rootsdescribed by physical laws, focusing on the diffusion of oxy-gen through different media (e.g. Glınski and Stepniewksi,1985). These plant physiological and soil physical processeshave to be considered simultaneously, as the oxygen trans-port (ad 1) is determined by oxygen consumption (ad 2) andvice versa.
In this paper we introduce such a procedure: we proposea model to compute plant oxygen stress based on the abovementioned processes. Through this model, we quantifiedthe sensitivity of oxygen stress to various model parame-ters. Moreover, we calculated root water uptake reductionunder the influence of oxygen stress. Finally, we arguewhy our model will lead to better predictions of root wateruptake under oxygen stress than the Feddes-function.
Figure 2 Scheme for the calculation of critical values for oxyge
Model description
General setup
The general model setup is visualized by Fig. 2. The mainoutput parameter of our model is the minimum gas filledporosity of the soil /gas_min at which oxygen stress occurs(Fig. 2C). To calculate this parameter, we need to modelthe diffusion-driven transport of oxygen from the gas phaseof the soil to root cells (oxygen diffusion at the micro-scale;Fig. 2A and B) and from the atmosphere to the gas phase ofthe soil (oxygen diffusion at the macro-scale; Fig. 2C and D)(De Willigen and Van Noordwijk, 1987). Diffusion fluxes, de-scribed by Fick’s law, are determined by: (a) oxygen con-suming processes, (b) diffusivity, which depends on themedium through which diffusion takes place, (c) the con-centration gradient, which depends on (d) the distance overwhich diffusion takes place. These aspects are different for
n stress, based on both physiological and physical processes.

Table 1 Parameters that are involved in the diffusion processes for oxygen supply to plant roots
Micro-scale (Fig. 2A and B) Macro-scale (Fig. 2C and D)
Oxygen consuming processes Root respiration (rroot_tot) Root respiration (Rroot_tot)Microbial respiration (rwaterfilm) Microbial respiration (Rmicrobial)
Diffusivity Water-film (Dwaterfilm) root tissue (Droot) Soil (Dsoil)Gradient [O2] gas phase soil (Cmin) � [O2] center of root (0) [O2] atmosphere (Catm) � [O2] gas phase
soil (C)Distance Thickness water-film (D) + root radius (a) Soil surface to certain depth (z)
150 R.P. Bartholomeus et al.
diffusion at the micro-scale and macro-scale (Table 1) andwill be discussed in detail in sections ‘‘Calculation of Cmin
(diffusion at the micro-scale)’’ and ‘‘Calculation of C (diffu-sion at the macro-scale)’’ respectively.
Diffusion at the micro-scale (Fig. 2A and B focuses on theminimum oxygen concentration in the gas phase of the soil(Cmin), needed to meet the oxygen requirements of roots.We schematized roots as cylinders and assumed that theroot zone has a uniform soil texture and temperature. Sub-sequently, Cmin was calculated based on oxygen consump-tion and diffusion pathway through a root cross-section(Fig. 2A). Two temperature dependent oxygen consumingprocesses occur in the root zone: respiration of roots(needed for both maintenance and root growth) and micro-bial respiration in the water-film surrounding the roots. Thewater-film is a thin layer of soil moisture that covers soilparticles and plant roots (Fig. 2B). Oxygen that diffusesfrom the gas phase of the soil to the root passes thiswater-film. Because the diffusivity of oxygen in water is104 times lower than that in free air (Stumm and Morgan,1996), this water layer can be a serious barrier for oxygendiffusion to plant roots (Armstrong and Beckett, 1985; DeWilligen and Van Noordwijk, 1984).
Diffusion at the macro-scale (Fig. 2C and D) focuses onoxygen transport from the atmosphere through the soil tothe gas phase surrounding the roots. Root respiration andmicrobial respiration are sink terms, eliminating oxygenfrom the gas phase of the soil. We assumed that both volu-metric root density and microbial respiration rate decreaseexponentially with depth (Campbell, 1985 fide Cook, 1995).As a result, oxygen concentration C decreases with depth zin the soil profile. The diffusivity of the soil typically con-trols soil aeration and varies with soil type and gas filledporosity /gas (Buckingham, 1904; Moldrup et al., 2000).
In our model, both scales of diffusion were linked by iter-atively adjusting /gas until C (macro-scale) equaled Cmin.This resulted in the minimum gas filled porosity of the soil,/gas_min, needed to meet the oxygen requirements of plantroots at soil depth z. /gas_min is a threshold for oxygen stressand depends on both abiotic and biotic conditions, like soiltexture, soil temperature, growth stage and microbialactivity.
Parameterization
All model parameters are given in Table 2. We used themodel to calculate /gas_min for different soil physical prop-erties derived for sandy, loamy and clayey soils (Table 3,Fig. 3). All plant characteristics used for calculating /gas_min
(see also Appendix A.1) were mean values, taken from liter-ature, for a temperate terrestrial natural grassland. Allparameter values were derived from independent sources,and thus were not optimized to improve model results.Other parameter values than chosen here, e.g. for othervegetations, may be used to calculate /gas_min.
Calculation of Cmin (diffusion at the micro-scale)
Oxygen consuming processes at the micro-scaleThe calculation of root respiration is based on the growth-and-maintenance-respiration paradigm, which involves bothempirical studies and theoretical principles (Amthor, 2000).Despite the partly empirical basis of the equations, they arecommonly used in plant physiological modeling.
Applying this approach, total respiration of a cylindricalroot rroot_tot (kgO2m
�1 rootd�1) was calculated from theroot respiration at a reference temperature rroot_tot_ref(kgO2m
�1 rootd�1) correcting for differences in soil tem-perature Tsoil (K) (Amthor, 2000):
rroot tot ¼ rroot tot ref � Q ðTsoil�TrefÞ=1010 root ð1Þ
where Q10_root is the relative increase in rroot_tot at a tem-perature increase of 10 �C (–) (Atlas and Bartha, 1987).Q10 is a widely accepted empirical measure to describethe sensitivity of plant physiological processes to tempera-ture (Lloyd and Taylor, 1994).
rroot_tot_ref is the sum of reference maintenance respira-tion and reference growth respiration. Oxygen is alwaysused first for maintenance, and only if oxygen availabilityallows, additional oxygen is used for growth respiration.Reference maintenance respiration rroot_m_ref (kgO2m
�1
rootd�1) is described as (Amthor, 2000):
rroot m ref ¼ km � w ð2Þ
where km is the empirical maintenance coefficient of roots(kgO2kg
�1 rootd�1) and w the specific root mass(kgrootm�1root). In our approach, total respiration is takenrelative to maintenance respiration. This ratio is depictedas g (–), and it is assumed that g = gpotential = 5 at optimaloxygen availability (Penning de Vries et al., 1979). /gas
for g = 1 and /gas for g = gpotential correspond to the pointsI (h1) and II (h2) in the Feddes-function (Fig. 1),respectively.
Microbial respiration in the water-film rwaterfilm(kgO2m
�1 rootd�1) was assumed to decrease exponentiallywith depth z (m below soil surface) (Campbell, 1985 fideCook, 1995):

Table 2 Input parameters and calculated parameters (including standard deviations) used in the model
Symbol Unit Description
Input parameters Valuekm – Maintenance coefficient 0.016 ± 0.008
(Kroes et al., 2008)M – Van Genuchten parameter M Table 3MO2
kg mol�1 Molar mass of dioxygen 0.032N – Van Genuchten parameter N Table 3p Pa atmospheric pressure 1e5Q10_root – Relative increase in root respiration
rate at a temperature increase of 10 �C2.0 (Amthor, 2000)
Q10_microbial – Relative increase in microbial respirationrate at a temperature increase of 10 �C
2.8 (Fierer et al., 2006)
R m3 Pa K�1 mol�1 Universal gas constant 8.314427S kg root m�3 root Specific weight of non-airfilled
root tissue1.0e3(De Willigen and Van Noordwijk, 1987)
SRL m root kg�1 root Specific root length 3.8 ± 1.6e5(De Willigen and Van Noordwijk, 1987)
Tair K Air temperature 273–303Tsoil K Soil temperature 273–303Tref K Reference temperature 298var(a) m2 Variance of a 4.175e�10
(De Willigen and Van Noordwijk, 1987)W kg root m�3 soil Dry weight of bulk roots at z = 0 0.785 ± 0.385 (Jackson et al., 1996)Y – Dry matter content of roots 0.07
(De Willigen and Van Noordwijk, 1987)z m Depth 0.0–0.5Zmicrobial m Shape factor for exponential decrease of
microbial respiration with depth0.3(Campbell, 1985 fide Cook and Knight, 2003)
Zroot m Shape factor for exponential decreaseof root respiration with depth
0.127 ± 0.013 (Jackson et al., 1996)
a 1/Pa Van Genuchten parameter a Table 3b kg O2 kg
�1 C d�1 Vegetation dependent respiration rate 2.258 ± 1.085e�4 (Fierer et al., 2006)eorg % Organic matter content of the soil 0.0–15.0g – respiration factor 1–5 (Penning de Vries et al., 1979)hres – Residual water content Table 3hsat – Saturated water content Table 3qsoil kg soil m�3 soil Soil density Table 3sroot – Tortuosity of the root tissue 0.4/root – Air filled root porosity 0.05
(De Willigen and Van Noordwijk, 1987)
Calculated parametersa m Root radiusA m2 Area of a cross-section of water-filmb – Campbell soil water retention parameterC kg O2 m
�3 soil air Oxygen concentration in the gasphase of the soil
Catm kg O2 m�3 air Oxygen concentration in the atmosphere
Cmin kg O2 m�3 root minimum oxygen concentration in
the gas phase of the soilCmin_int kg O2 m
�3 root Minimum oxygen concentration at theinterface of the water-film and the gasphase of the soil
D0 m2 d�1 Diffusivity of oxygen in free airDroot m2 d�1 Diffusivity of the rootDsoil m2 d�1 Mean diffusivity of the soilDwater m2 d�1 Diffusivity of waterDwaterfilm m2 d�1 Diffusivity of water-film
(continued on next page)
Critical soil conditions for oxygen stress to plant roots: Substituting the Feddes-function by a process-based model 151
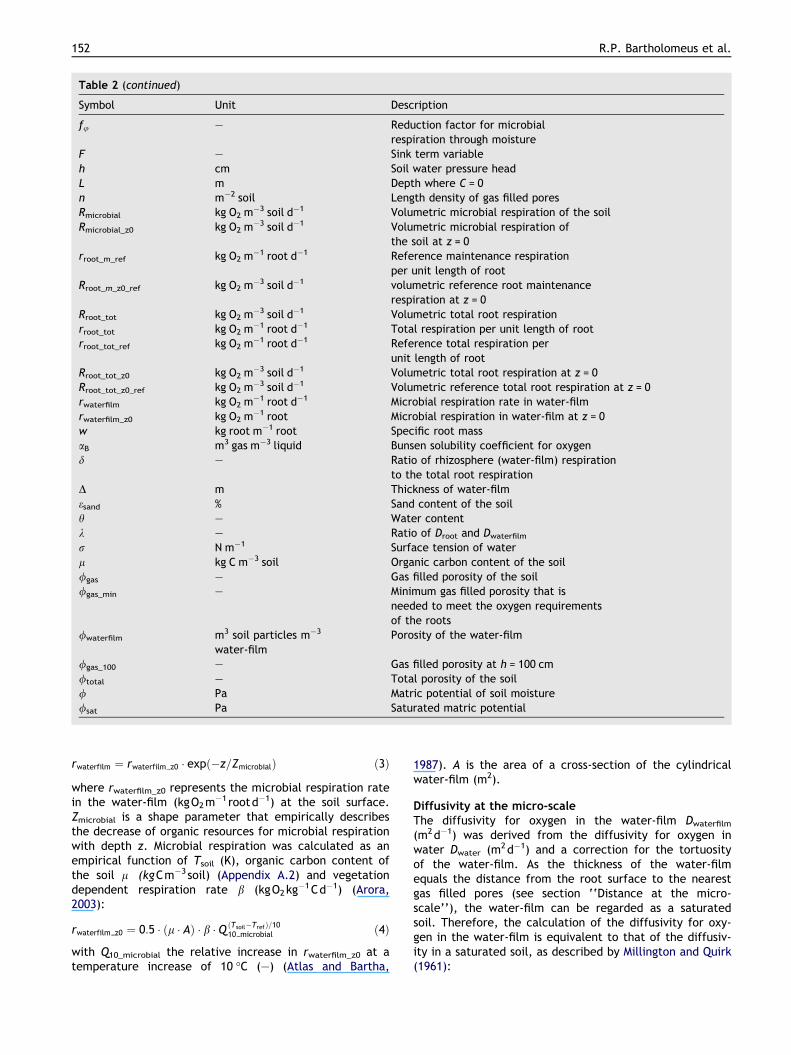
Table 2 (continued)
Symbol Unit Description
fu – Reduction factor for microbialrespiration through moisture
F – Sink term variableh cm Soil water pressure headL m Depth where C = 0n m�2 soil Length density of gas filled poresRmicrobial kg O2 m
�3 soil d�1 Volumetric microbial respiration of the soilRmicrobial_z0 kg O2 m
�3 soil d�1 Volumetric microbial respiration ofthe soil at z = 0
rroot_m_ref kg O2 m�1 root d�1 Reference maintenance respiration
per unit length of rootRroot_m_z0_ref kg O2 m
�3 soil d�1 volumetric reference root maintenancerespiration at z = 0
Rroot_tot kg O2 m�3 soil d�1 Volumetric total root respiration
rroot_tot kg O2 m�1 root d�1 Total respiration per unit length of root
rroot_tot_ref kg O2 m�1 root d�1 Reference total respiration per
unit length of rootRroot_tot_z0 kg O2 m
�3 soil d�1 Volumetric total root respiration at z = 0Rroot_tot_z0_ref kg O2 m
�3 soil d�1 Volumetric reference total root respiration at z = 0rwaterfilm kg O2 m
�1 root d�1 Microbial respiration rate in water-filmrwaterfilm_z0 kg O2 m
�1 root Microbial respiration in water-film at z = 0w kg root m�1 root Specific root massaB m3 gas m�3 liquid Bunsen solubility coefficient for oxygend – Ratio of rhizosphere (water-film) respiration
to the total root respirationD m Thickness of water-filmesand % Sand content of the soilh – Water contentk – Ratio of Droot and Dwaterfilm
r N m�1 Surface tension of waterl kg C m�3 soil Organic carbon content of the soil/gas – Gas filled porosity of the soil/gas_min – Minimum gas filled porosity that is
needed to meet the oxygen requirementsof the roots
/waterfilm m3 soil particles m�3
water-filmPorosity of the water-film
/gas_100 – Gas filled porosity at h = 100 cm/total – Total porosity of the soil/ Pa Matric potential of soil moisture/sat Pa Saturated matric potential
152 R.P. Bartholomeus et al.
rwaterfilm ¼ rwaterfilm z0 � expð�z=ZmicrobialÞ ð3Þ
where rwaterfilm_z0 represents the microbial respiration ratein the water-film (kgO2m
�1 rootd�1) at the soil surface.Zmicrobial is a shape parameter that empirically describesthe decrease of organic resources for microbial respirationwith depth z. Microbial respiration was calculated as anempirical function of Tsoil (K), organic carbon content ofthe soil l (kgCm�3 soil) (Appendix A.2) and vegetationdependent respiration rate b (kgO2kg
�1Cd�1) (Arora,2003):
rwaterfilm z0 ¼ 0:5 � ðl � AÞ � b � Q ðTsoil�TrefÞ=1010 microbial ð4Þ
with Q10_microbial the relative increase in rwaterfilm_z0 at atemperature increase of 10 �C (–) (Atlas and Bartha,
1987). A is the area of a cross-section of the cylindricalwater-film (m2).
Diffusivity at the micro-scaleThe diffusivity for oxygen in the water-film Dwaterfilm
(m2d�1) was derived from the diffusivity for oxygen inwater Dwater (m2d�1) and a correction for the tortuosityof the water-film. As the thickness of the water-filmequals the distance from the root surface to the nearestgas filled pores (see section ‘‘Distance at the micro-scale’’), the water-film can be regarded as a saturatedsoil. Therefore, the calculation of the diffusivity for oxy-gen in the water-film is equivalent to that of the diffusiv-ity in a saturated soil, as described by Millington and Quirk(1961):

Figure 3 Soil water retention curves (Wosten et al., 2001) forthe soil types that were used in the calculation of critical valuesfor oxygen stress. The numbers in the retention curvescorrespond to the soil types and the soil physical characteristicsin Table 3.
Table 3 Soil types and soil physical characteristics (Wosten et al., 2001) that were used in the calculation of critical values foroxygen stress
No. Soil type hres (–) hsat (–) a (1/Pa) N (M = 1 � 1/N) (–)
1 Moderately loamy, very fine sand 0.02 0.42 2.76e�4 1.4912 Course sand 0.01 0.36 4.52e�4 1.9333 Light clay 0.01 0.43 6.4e�4 1.2104 Heavy clay 0.01 0.54 2.39e�4 1.0945 Sandy loam 0.01 0.42 8.4e�4 1.4416 Silty loam 0.01 0.42 5.1e�4 1.305
Critical soil conditions for oxygen stress to plant roots: Substituting the Feddes-function by a process-based model 153
Dwaterfilm ¼ Dwater � /4=3waterfilm ð5Þ
where /waterfilm is called the ‘porosity of the water-film’(m3waterm�3water-film) defined as the ratio between thesoil water content and the volume of the liquid and solidphase (Currie, 1965 fide Simojoki, 2000):
/waterfilm ¼ ð/total � /gasÞ=ð1� /gasÞ ð6Þ
with /total the total porosity of the soil and /gas the gasfilled porosity of the soil.
The diffusivity for oxygen in the plant root Droot was de-rived from Dwater, assuming that the sensitivity of Droot totemperature equals that of Dwater (Langø et al., 1996),and a correction for the tortuosity of root tissues sroot (–):
Droot ¼ sroot � Dwater ð7Þ
By scaling a published reference value of Droot for a terres-trial grassland species at Tsoil = 293 K (Van Noordwijk and DeWilligen, 1984) to Dwater, we obtained sroot = 0.4.
Concentration gradient at the micro-scaleA steady-state equation for the distribution of the concen-tration of oxygen in the water-film and the root (De Willigen
and Van Noordwijk, 1984) was used to calculate Cmin_int
(Appendix A.3). Cmin_int (kgO2m�3 root) represents the oxy-
gen concentration at the interface of the water-film and thegas phase of the soil, that is required to ensure sufficientoxygen supply for rroot_tot to all cells in the root (De Willigenand Van Noordwijk, 1987). The oxygen concentration at theouter edge of the water-film Cmin_int and the gas phase ofthe soil Cmin were considered to be in equilibrium, thus:
Cmin ¼ Cmin int=aB ð8Þ
where aB is the Bunsen solubility coefficient for oxygen(m3gasm�3 liquid) (Langø et al., 1996).
Distance at the micro-scaleThe thickness of the water-film D (m), i.e. the distance fromthe root surface to the nearest gas filled pores, was calcu-lated according to Simojoki (2000) (Appendix A.4). Root ra-dius a (m) was calculated according to De Willigen and VanNoordwijk (1987) (Appendix A.1).
Calculation of C (diffusion at the macro-scale)
Oxygen consuming processes at the macro-scaleThe calculation of the total root respiration of the bulkroots at z = 0 m Rroot_tot_z0 (kgO2m
�3 soild�1) was similarto the procedure for a cylindrical root (Eq. (1)). The onlydifference is that respiration rates are considered per vol-ume soil (kgO2m
�3 soild�1), instead of per meter root(kgO2m
�1 rootd�1). Rroot_tot was assumed to decrease expo-nentially with z, based on the decrease of root dry weightwith depth (Campbell, 1985 fide Cook, 1995):
Rroot tot ¼ Rroot tot z0 � expð�z=ZrootÞ ð9Þ
where Zroot is an empirical shape factor and Rroot_tot_z0 is thetotal root respiration at depth z = 0 m (kgO2m
�3 soild�1):
Rroot tot z0 ¼ Rroot tot z0 ref � Q ðTsoil�TrefÞ=1010 root ð10Þ
and the reference total root respiration at z = 0 Rroot_tot_z0_-ref (kgO2m
�3 soild�1) as defined in section ‘‘Oxygen con-suming processes at the micro-scale’’, but using W(substituting w, Eq. (2)) as the dry weight of bulk roots atz = 0 m (kgrootm�3 soil).
The calculation of the microbial respiration in the bulksoil Rmicrobial (kgO2m
�3 soild�1) was also similar to that ofrwaterfilm (Eq. (3)). The differences are that volumetric res-piration rates, i.e. (kgO2m
�3 soild�1), and unsaturated con-ditions are considered here:
Rmicrobial ¼ Rmicrobial z0 � expð�z=ZmicrobialÞ ð11Þ

154 R.P. Bartholomeus et al.
with the microbial respiration at z = 0 m Rmicrobial_z0
(kgO2m�3 soild�1):
Rmicrobial z0 ¼ fu � l � b � Q ðTsoil�TrefÞ=1010 microbial ð12Þ
with fu a reduction factor for soil moisture (–) (AppendixA.5).
Diffusivity at the macro-scaleThe mean diffusivity of soils Dsoil (m
2d�1) was calculatedfrom soil water characteristics, and thus pore size distribu-tions, according to Moldrup et al. (2000):
Dsoil ¼ D0 � ð2 � /3gas 100 þ 0:04 � /gas 100Þ
� ð/gas=/gas 100Þ2þ3=b ð13Þ
where D0 is the diffusion coefficient for oxygen in free air(m2d�1), /gas_100 is the gas filled porosity at a soil waterpressure head h = �100 cm (–) and b = the Campbell soilwater retention parameter (Campbell, 1974). The b-valuecan be determined as the slope of the soil water retentioncurve in a log–log plot (log[h] vs. log[�h]), which meansthat the soil water retention characteristics have to beknown at least at two h’s. Moldrup et al. (2000) proposeto take: b ¼ ðlog½500� � log½100�Þ=ðhh¼�100cm � hh¼�500cmÞ.Moldrup et al. (2000) showed that the inclusion of soil watercharacteristics in the calculation of Dsoil represents themeasured mean Dsoil much better than previous models thatonly considered the gas filled porosity (/gas) and the totalporosity (/total) of the soil (e.g. Millington and Quirk,1961). Such models highly underestimate Dsoil for low /gas
(Moldrup et al., 2000).
Concentration gradient at the macro-scaleThe concentration gradient at the macro-scale was deter-mined by the oxygen concentration in the atmosphere Catm
(kgO2m�3air) and the oxygen concentration C (kgO2m
�3
soilair) in the soil at a certain depth z. Catm was calculatedaccording the general gas law, assuming 21% of oxygen inthe atmosphere (Appendix A.6). An analytical solution forC(z), considering the exponential decrease of both rootand microbial respiration with depth, is given by Cook(1995). To increase the flexibility of our model, we consid-ered, unlike Cook (1995), root and microbial respiration astwo separate sink terms with specific exponential de-creases, leading to slightly adapted equations (Fig. 2D andAppendix A.7).
Distance at the macro-scaleThe distance over which diffusion takes place equals depth z(m below soil surface) at which the oxygen concentration iscalculated.
The relation between oxygen stress and wateruptake
Our model computes /gas_min as a function of the oxygen de-mand of plant roots for root respiration. However, it is alsopossible to compute root water uptake as function of /gas_-
min. The latter approach was used to evaluate the relationbetween oxygen stress and root water uptake. To do so,we assumed that root water uptake is proportional togrowth respiration. There are several arguments that sup-port this assumption.
Root water uptake occurs by hydrostatic forces (passivetransport) and by the metabolic activity of root cells (activetransport). Stomata represent the highest resistance towater flow (Ehlers and Goss, 2003; Katul et al., 2003). If sto-mata are fully opened, root water uptake is optimal (F = 1)and dominated by hydrostatic forces. At fully open stomata,potential photosynthesis is achieved and oxygen is neededfor both maintenance and growth respiration. Potential rootwater uptake is thus only possible as long as there is no oxy-gen stress. Oxygen stress induces stomatal closure (e.g.Glınski and Stepniewksi, 1985; Kramer, 1951). At completestomatal closure, the actual transpiration and photosynthe-sis approach zero (F = 0). In that case, oxygen is solely usedfor maintenance respiration.
Between the limits F = 1 and F = 0, we assume the reduc-tion of root water uptake to be directly proportional to thereduction in root respiration: Kamaluddin and Zwiazek(2001) demonstrated, by inhibition of the metabolism ofthe roots, that there is a positive correlation between rootrespiration and water uptake. This implies a gradual de-crease of root water uptake with increased oxygen stress.
Model analysis
Sensitivity of /gas_min
/gas was iteratively adjusted between 10�8 (�0) and /total,until the convergence criterion abs(Cmin–C) < 10�4 kg m�3
was met. This /gas corresponds to /gas_ min (Fig. 2A andC). Together with adjusting /gas, the parameters dependingon /gas (D, Rmicrobial_z0 and Dsoil, and thus both Cmin and C),were recalculated.
After numerical verification of our model, we analyzedthe validity of uniform critical values h1 and h2 for oxygenstress (Fig. 1). A sensitivity analysis for /gas_min, and here-with h, was performed for different abiotic conditions, rel-evant for The Netherlands. We distinguished different soiltypes (Table 3, Fig. 3), temperatures (Tsoil = Tair = 273–303 K), organic matter contents (eorg = 0.0–15.0%), depths(z = 0.0–0.5 m) and oxygen requirements (1 6 g 6 5).
Secondly, we performed a Monte Carlo analysis to studythe sensitivity of /gas_min to plant characteristics. Plantcharacteristics were randomly extracted from normal distri-butions, defined by average values and standard deviations(Table 2). /gas_min was calculated for each combination ofabiotic conditions (soil type, Tsoil, eorg and z) and for thou-sands of extractions from the normal distributions of plantcharacteristics. Monte Carlo analysis was performed bothfor g = 1 and g = 5. /gas_min values were normalized to theaverage /gas_min across all simulations. Linear regressionwas used to analyze the sensitivity of normalized /gas_min
to each plant characteristic. Variation in the /gas_minvaluesaround each regression line, caused by variation in allparameters other than the plant characteristic on the x-axis, was visualized by regression quantiles (Koenker, 2007).
Sensitivity of F
We used the model to calculate F (Fig. 1) as function of/gas_min (see section ‘‘The relation between oxygen stressand water uptake’’). g was iteratively adjusted between

Critical soil conditions for oxygen stress to plant roots: Substituting the Feddes-function by a process-based model 155
10�4 (�0) and gpotential, until abs(Cmin–C) < 10�4 kg m�3.g = 1 and g = gpotential correspond to F = 0 and F = 1, respec-tively. Together with adjusting g, the parameters rroot_totand Rroot_tot_z0, and thus both Cmin and C, were recalcu-lated. Since /gas_min is related to h – via soil porosity andthe water retention curve – this enabled us to compare Ffrom our model with F from the reduction function ofFeddes et al. (1978).
Results
Sensitivity of /gas_min and F to environmentalparameters
The minimum gas filled porosity /gas_min, and herewith thesoil water pressure head h corresponding to oxygen stress,was especially sensitive to the abiotic parameters soil tem-perature Tsoil and depth z (Fig. 4). /gas_min was hardly sensi-tive to soil organic matter content eorg. This sensitivitypattern held for all investigated six soil types, although/gas_min differed considerably between soil types.
The Feddes-function uses uniform values h1 and h2 for aspecific crop type or plant species. Values of h1 = � 10 cmand h2 = � 25 cm are commonly used for grasslands (Feddesand Raats, 2004; Kroes et al., 2008; Wesseling, 1991). In allstates tested, oxygen stress started at more negative h(drier) conditions, than these standard values (Fig. 4). Thedifferences between the calculated reduction functionsare considerable among the various soil types (Fig. 5)./gas_min was larger in sandy soils than in soils that containclay particles, as could be expected (Hakansson and Lipiec,2000; Pierce et al., 1983). Clayey soils are well structured,which provides connected gas filled pores through which dif-fusion occurs. Sandy soils with high water contents consistof isolated gas filled pores that cannot contribute to theoxygen diffusion pathway (Horn et al., 1994). Especiallyfor clayey and loamy soils, the critical h-values of Wesseling(1991) corresponded to extremely low /gas-values that areunlikely to be sufficient (<0.01, see Figs. 3 and 5 and Table3) for the oxygen requirements of roots. Unfortunately, inspite of all our efforts we were unable to discover howWesseling (1991) derived the h-values.
Figure 4 Sensitivity of /gas_min and h to (a) Tsoil, (b) z and (c) eorg(F = 1)) for a temperate terrestrial grassland (Table 2) on sandy loamthe reference values 15 �C (288 K), 7.5% and 0.25 m, respectively. Fwhile keeping the other parameters at their reference values. Othe
Analysis of our model showed that transpiration reduc-tion differed strongly between soil types (Fig. 5), but thatwithin a specific soil type, F mainly depends on Tsoil, z and/gas (Figs. 4 and 6). The reduction was highly nonlinear withz and the influence of temperature was considerable (Fig.6), which means that F (Fig. 5) shifts to a different /gas_min
(and h) upon changes in Tsoil and z. Like the original Feddesfunction (Feddes et al., 1978), the shape F as function of h(Fig. 5b) was close to linear.
Sensitivity of /gas_min to plant characteristics
/gas_min appeared to be especially sensitive to plant charac-teristicsW and km and hardly to SRL, b and Zroot (Fig. 7). Thedifferences in sensitivity to W vs. SRL imply that the charac-teristics of a single cylindrical root (w and a, calculatedfrom SRL, Appendix A.1), have less influence on /gas_min
than the characteristics of the bulk roots. This indicatesthat diffusion processes at the micro-scale were less influ-ential than those at the macro-scale. This corresponds toour finding that in the diffusion at the macro-scale, only asmall change in /gas is needed to provide a large changein C. The sensitivity of /gas_min to the maintenance coeffi-cient km can be problematic for some model applications,because km is an empirical parameter that is difficult to ac-quire accurately (Cannell and Thornley, 2000).
Discussion
Progress obtained in the simulation of oxygen stress
In this paper, we introduced a process-based model to sim-ulate the minimum gas filled porosity /gas_min, needed toprovide plant roots with just sufficient oxygen for rootmaintenance and growth respiration. Both the oxygen de-mand of plant roots and soil microbes and the oxygen trans-port from the atmosphere, through the soil and to the rootswere incorporated. Our model is based on important pro-cesses involved in the diffusion processes at the micro-scale(described by e.g. Armstrong and Beckett, 1985; De Willigenand Van Noordwijk, 1984; Glınski and Stepniewksi, 1985;Lemon and Wiegand, 1962) and macro-scale (described by
at different respiration rates (varying from g = 1 (F = 0), to g = 5(soil type = 5, Table 3). Tsoil, eorg and z were normalized aroundor each analysis, only one of the abiotic parameters was varied,r investigated soil types show similar sensitivities.

Figure 5 Sink term variable F as function of both soil type (Table 3) and (a) /gas_min and (b) h. Tsoil = 288 K, eorg = 7.5%, z = 0.25 mand average reference vegetation characteristics (Table 2). The dotted line in (b) represents the function by Feddes et al. (1978).The reduction functions are only valid for the very specific parameter values chosen here. For each of the soil types, the values for/gas_min and thus h change with e.g. Tsoil and z.
Figure 6 Contour plots of F as function of /gas and z for three temperatures (Tsoil = (a) 273 K, (b) 288 K and (c) 303 K) andeorg = 7.5%; Tsoil = Tair. Only the results for a sandy loam (soil type = 5, Table 3) are presented here, but the trend holds for allinvestigated soil types. The range in F-values corresponds to those of the y-axis in Fig. 5a.
156 R.P. Bartholomeus et al.
e.g. Cook, 1995; Glınski and Stepniewksi, 1985; Jones andOr, 1998; Kalita, 1999). So far, only one model considereddiffusion at both scales (Cook and Knight, 2003). We com-bined the most appropriate equations involved in each ofthe diffusion processes, and extended and improved exist-ing calculations where necessary.
Important improvements incorporated in our model are,first of all, to model microbial respiration in dependency ofgas filled porosity /gas of the soil, and thus on water con-tent. Overestimation of oxygen concentrations and /gas_min
by too high microbial respiration rates (Cook and Knight,2003; Kalita, 1999) is thus avoided. Second, we consideredroot and microbial respiration as two separate processes, in-stead of combining them (Cook, 1995; Glınski and Step-niewksi, 1985; Jones and Or, 1998; Kalita, 1999). This hasthe advantage that the model has more flexibility in incor-porating differences in depth profiles between root andmicrobial respiration. Third, the thickness of the water-filmthat covers plant roots and through which oxygen diffusion
takes place, was calculated as function of /gas and not ta-ken as a fixed value (Armstrong and Beckett, 1985; Cookand Knight, 2003; Glınski and Stepniewksi, 1985). Fourth,the microbial respiration within the water-film was consid-ered instead of ignored (Cook and Knight, 2003;Glınski andStepniewksi, 1985; Lemon and Wiegand, 1962; Simojoki,2000). Fifth, our calculation of the soil diffusivity Dsoil onthe basis of the soil water retention curve gives a betterrepresentation of Dsoil at low /gas than the method ofMillington and Quirk (1961) (Cook and Knight, 2003; Glınskiand Stepniewksi, 1985; Jones and Or, 1998). The methodof Millington and Quirk (1961) is solely based on /gas,irrespective of soil type, and on total soil porosity /total.Moldrup et al. (2000) proved that the method of Millingtonand Quirk (1961) underestimates Dsoil at low /gas, which re-sults in an overestimation of /gas_min.
All in all, we improved the descriptions of relevant pro-cesses and parameters and considered them simultaneouslyto calculate representative values for /gas_min accurately.

Figure 7 Sensitivity of /gas_min to plant characteristics of the reference plant species (Table 2). /gas_min is normalized around themean /gas_min of all model runs. Monte Carlo analysis was performed for g = 1 (dotted lines) and g = 5 (solid lines). The slopes of theblack lines indicate the effect on /gas_min of the parameter on the x-axis. The grey lines represent the 10 and 90% regressionquantiles (Koenker, 2007). This bandwidth is caused by all varied parameters (abiotic and plant characteristics) other than theparameter on the x-axis.
Critical soil conditions for oxygen stress to plant roots: Substituting the Feddes-function by a process-based model 157
Thus, we avoided the structural overestimation of /gas_min
as happened in Cook and Knight (2003). Our model enabledus to simulate the variation in /gas_min resulting from differ-ences in both abiotic and biotic conditions.
Constant vs. process-based critical measures foroxygen stress
In the literature, constant critical values for /gas_min havebeen applied to represent root oxygen stress (e.g. Barberet al., 2004; Leao et al., 2006). We demonstrated, however,that /gas_min depends on a number of environmental param-eters, especially soil type, temperature and depth belowsoil surface (Figs. 4–6).
The low sensitivity of /gas_min to soil organic matter con-tent eorg likely has to do with the reduced microbial activityunder the wet conditions at which oxygen stress occurs(through the moisture reduction factor for microbial respi-ration fu, Appendix A.5). This will have led to a relativelylow microbial contribution to total oxygen consumption.The high sensitivity to temperature T is caused by the strongincrease in respiration rate with T (Eqs. (1) and (10)). Thissensitivity apparently dominated the sensitivity of diffusivi-ties to T (Eqs. 5, 7, and 13) as the reverse should have led todecreased /gas_min with increased T. The sensitivity to soildepth z is due to depth dependent macro-scale diffusiondistances.
All in all, the use of constant critical measures for oxy-gen stress should be avoided. /gas_min = 0.10 is generally(e.g. Engelaar and Yoneyama, 2000; Leao et al., 2006;
Lipiec and Hatano, 2003; Zou et al., 2001) used as a crit-ical value for aeration. However, Wesseling and van Wijk(1957) who introduced this threshold, already warnedthat /gas_min = 0.10 ‘‘must be considered as preliminary’’.Despite this remark, this threshold is still applied in manystudies.
Our simulations illustrate that in general, /gas_min = 0.10is too high for the abiotic conditions and plant characteris-tics considered in our research, except for those at highertemperatures and sandy soils. The real overestimation iseven stronger, because Wesseling and van Wijk (1957) ap-plied /gas_min = 0.10 to the bottom end of the root zone,where /gas_min is higher than in the upper part of the rootzone.
Our simulations were done for a temperate terrestrialgrassland, but also characteristics of other crops or vegeta-tion types can be used. /gas_min appeared to be sensitive tosome of the plant characteristics, in particular to the respi-ration maintenance coefficient (km). This illustrates theimportance of an accurate description of plant characteris-tics for the calculation of /gas_min. Consequently, /gas_min
will be different for other crops and vegetation types.Fortunately, in many applications exact knowledge on
actual plant characteristics is less important. Models likeSWAP (Kroes et al., 2008) can be used with plant character-istics of a reference vegetation, instead of the actual vege-tation, to assess a potential stress at a site. Such a measure,reflecting the oxygen status of the soil, can be used to pre-dict the suitability of a site for certain natural vegetationtypes (e.g. Runhaar et al., 1997).

158 R.P. Bartholomeus et al.
Improving oxygen stress thresholds
We used our model to simulate the reduction of water up-take by plant roots and herewith the sink term F that is in-volved in hydrological models like SWAP (Kroes et al.,2008) and HYDRUS (Simunek et al., 2005). Oxygen stresswas coupled to F under the assumptions that: (i) rootwater uptake reaches a maximum (F = 1) upon obtainingthe maximum growth respiration, (ii) root water uptakereaches zero (F = 0) when only maintenance respiration isfeasible, and (iii) in between these thresholds, reducedroot water uptake is directly proportional to reducedgrowth respiration. A maximum value of g = 5 was usedto calculate the maximum growth respiration (Penning deVries et al., 1979). This should be considered as an empir-ical value that seems valid in most cases, but deviationsare likely to occur (Amthor, 2000). Although potentialgrowth respiration and only maintenance respiration mostlikely correspond to F = 1 and F = 0, respectively, furtherresearch on the relationship between reduced respirationand reduced root water uptake in between these thresh-olds is recommended.
Although the linear shape of the Feddes-function seemsvalid (Fig. 5), constant threshold values for the points Iand II (Fig. 1) are inappropriate for an accurate determina-tion of oxygen stress. Reduction of root water uptake al-ready starts at much drier conditions than according tothe Feddes-function and additionally depends strongly onsoil type and temperature. For instance, according to ourmodel, oxygen stress on sandy loam (soil 5) occurs at aca. 40 cm lower groundwater level than according to theFeddes-function (assuming hydrostatic equilibrium) (Fig.5). For sites where the occurrence of oxygen stress couldbe an issue, i.e. at shallow groundwater levels, such a dif-ference is considerable and cannot be ignored.
Assuming a linear relationship in between the two thresh-olds I and II (Fig. 1), our model can be used to generate repro-functions to asses F for a variety of biotic and abiotic condi-tions (Appendix B). The advantage of such functions is thatthey speed-up the simulations considerably.
Applicability of the oxygen stress model
Our oxygen stress model can be applied to improve the sim-ulation of both root water uptake and root growth in modelsthat consider the soil-plant-atmosphere-continuum, likeSWAP (Kroes et al., 2008). In this paper, we used it to sub-stitute the sink term variable F at the wet side of the Fed-des-function. However, other models for root wateruptake can be improved with our approach as well. In sev-eral models (e.g. Doussan et al., 1998; Molz, 1981; Rooseand Fowler, 2004), root water uptake is calculated on thebasis of water absorption driven by hydraulic pressure dif-ferences between the root rhizosphere and the root xylem(passive transport). These types of models probably workwell under conditions with sufficient oxygen supply to plantroots, but not in wetter conditions where water transport toroots is increasingly limited by metabolic processes (activetransport) (see Section ‘‘The relation between oxygen stressand water uptake’’). Our model might be used to improvethe pressure driven root water uptake models, by incorpo-
rating a root sink term F to adjust the water flux from therhizosphere to the root xylem.
The simulation of root growth (e.g. WOFOST and SU-CROS (Van den Berg et al., 2002)), which is based onthe net production of root biomass, can also be improvedwith the aid of our model. The production of root biomassis determined both by photosynthesis and by respiration(Cannell and Thornley, 2000). Our model might contributeto a better description of both processes: Carbon dioxidediffusion from the atmosphere into the plant is only possi-ble when stomata are open. Consequently, photosynthesisis affected by root oxygen stress (Van Bodegom et al.,2008). Therefore, many crop growth models calculatethe actual photosynthesis by linking it to potential photo-synthesis and the relative transpiration rate (ratio of ac-tual and potential transpiration = F) (Van den Berg et al.,2002). An accurate description of the relative transpira-tion and thus root water uptake is desired. Part of thecarbohydrates produced by photosynthesis is used for res-piration. Our model calculates the reduction in respirationrate of the roots due to oxygen stress, as a function of theactual (a)biotic conditions.
Our model is freely available from the internet inSWAP (Kroes et al., 2008). By including our model withinSWAP, it has been integrated in a full hydrological model-ing environment. Processes that are not directly involvedin our model, but that might affect oxygen availability,like swelling and shrinking of soils and macro-pore flow,are accounted for in SWAP. Furthermore, with SWAP, rel-evant processes like heat flow and plant growth can besimulated.
Conclusions
In this paper, we showed that substantial differences in theminimum gas filled porosity of the soil – /gas_min – are espe-cially related to soil type, soil temperature and soil depth.Consequently, constant values for /gas_min should beavoided, since they may result in large prediction errorsof both transpiration and plant growth. The same holds, ofcourse, for the fixed anaerobiosis pressure heads of the fre-quently used Feddes-function. To determine the oxygenstress experienced by roots accurately, we advocate an ap-proach that takes account of relevant abiotic and biotic fac-tors in an integrative manner.
Acknowledgements
This study was carried out in the framework of both ProjectA1 ‘Biodiversity in a changing environment: predicting spa-tio-temporal dynamics of vegetation’ of the Dutch NationalResearch Program Climate Change and Spatial planning(www.klimaatvoorruimte.nl) and the joint research pro-gram of the Dutch Water Utility sector. We thank the editorand three anonymous reviewers for their valuable com-ments on the manuscript.
Appendix A. Calculation of model parameters
This appendix presents and justifies a number of equationsthat are part of our oxygen stress model.

Table B.1 Soil types from the Staring-series (Wosten et al., 2001)
Top soils Description Sub soils Description
B1 Not loamy, very fine to moderately fine sand O1 Not loamy, very fine to moderately fine sandB2 Moderately loamy, very fine to moderately fine sand O2 Moderately loamy, very fine to moderately fine sandB3 Loamy, very fine to moderately fine sand O3 Loamy, very fine to moderately fine sandB4 Highly loamy, very fine to moderately fine sand O4 Highly loamy, very fine to moderately fine sandB5 Coarse sand O5 Coarse sandB6 Boulder clay O6 Boulder clayB7 Light sandy clay O7 Brook loamB8 Moderately sandy clay O8 Light sandy clayB9 Heavy sandy clay O9 Moderately sandy clayB10 Light clay O10 Heavy sandy clayB11 Moderately clay O11 Light clayB12 Heavy clay O12 Moderately clayB13 Sandy loam O13 Heavy clayB14 Silty loam O14 Sandy loamB15 Peaty sand O15 Silty loamB16 Sandy peat and peat O16 Oligotrophic peatB17 Peaty clay O17 Mesotrophic and eutrophic peatB18 Clayey peat O18 Organic sublayer
Both top soils (B) and sub soils (O) are distinguished.
Critical soil conditions for oxygen stress to plant roots: Substituting the Feddes-function by a process-based model 159
A.1. Root radius
The root radius a (m) of a cylindrical root was calculatedfollowing the method of De Willigen and Van Noordwijk(1987):
a ¼ffiffiffiffiffiffiffiffiffiffiffiffiffiffiffiffiffiffiffiffiffiffiffiffiffiffiffiffiffiffiffiffiffiffiffiffiffiffiffiffiffiffiffiffiffiffiffiffiffiffiffiffiffiffiffiffiffiffiffi
w
p � Y � ð1� /rootÞ � S� varðaÞ
r
with w the specific root mass (kgrootm�1 root), Y the drymatter content of roots (–), /root the air filled root porosity(–), S the specific weight of non-airfilled root tissue(kgrootm�3 root) and var (a) the variance of a (m2).
A.2. Organic carbon content
The organic carbon content of the soil l (kgCm3soil) wascalculated from the organic matter content of the soil eorg(%) and the soil density qsoil (kgsoilm
�3 soil). This calcula-tion is based on the assumption that soil organic matterweight consists of 48% of organic carbon.
l ¼ 0:48 � ðeorg=100Þ � qsoil
Figure B.1 Example of a repro-function to describe therelationship between /gas and F. Both the slope a and interceptb are functions soil type (Table B.1), soil temperature Tsoil (K)and soil depth z (m) (Tables B.2 and B.3; Fig. B.2).
A.3. Minimum oxygen concentration at theinterface of the water-film and the soil air
The minimum oxygen concentration at the interface of thewater-film and soil air, Cmin_int (kgO2m
�3 root), was calcu-lated following the method proposed by De Willigen andVan Noordwijk (1984). Their method is an extension of themethod by Lemon and Wiegand (1962), describing the oxy-gen diffusion pathway from the gas phase of the soil tothe root tissue, but additionally involves microbial respira-tion in the root rhizosphere, i.e. in the water-film that sur-rounds the root:
Cmin ¼rroot tot þ rwaterfilm
2 � p � Droot
�(1
2þ ðk� 1Þ � d
2þ k � lnð1þ D=aÞ
� k � d � ð1þ D=aÞ2 � lnð1þ D=aÞðD=aÞ � ð2þ D=aÞ
)
with
k ¼ Droot=Dwaterfilm
d ¼ rwaterfilm=ðrwaterfilm þ rroot totÞ

160 R.P. Bartholomeus et al.
The oxygen consuming processes that are involved in themethod of De Willigen and Van Noordwijk (1984) are bothroot respiration rroot_tot (kgO2m
�1 rootd�1) and respirationin the water-film rwaterfilm (kgO2m
�1rootd�1). Since oxygendiffusion occurs through both the water-film and the roottissue, the diffusivities of oxygen through both media are in-cluded (Droot and Dwaterfilm). The distance over which diffu-sion takes place is determined by the thickness of thewater-film D and the root radius a.
A.4. Water-film thickness
The water-film thickness D (m) was approximated accordingto the procedure proposed by Simojoki (2000), which isbased on soil water retention data. D was approximatedby the difference between the calculated distance between
Figure B.2 Continuous functions, fitted on simulated data (crossefunction F(/gas) (Fig. B.1) for soil type B8 (Table B.1).
the pore centers (Barley, 1970 fide Simojoki, 2000) and theradii of the cylindrical gas filled pores (Simojoki, 2000):
D ¼ 2 �ffiffiffiffiffiffiffiffiffiffiffiffiffiffiffiffi
1
p � nðuÞ
s� 2 � r
u
!
with u the matric potential of the soil moisture (Pa) and rthe surface tension of water (Nm�1), that is given by theEotvos rule: r = 0.07275 Æ (1 � 0.002 Æ (Tsoil � 291)). n is thelength density of air filled pores (i.e. the number of air filledpores per unit area):
nðuÞ ¼Z u
0
�dh=dup � 4 � r2=u2
du
which includes the derivative of the moisture retentioncurve according to Van Genuchten (1980):
s), of both the slope a (top figure) and intercept b of the repro-

Critical soil conditions for oxygen stress to plant roots: Substituting the Feddes-function by a process-based model 161
hðuÞ ¼ hres þhsat � hres
ð1þ ða � uÞNÞM
dhdu¼ ðhsat � hresÞ � a � ða � uÞN�1 � ð1þ ða � uÞNÞM�1 �M � N
ððða � uÞN þ 1ÞMÞ2
with hsat the saturated water content (–), hres the residualwater content (–) and a (Pa�1), M (–) and N (–) the VanGenuchten parameters.
A.5. Reduction of microbial respiration due to soilmoisture availability
The factor fu that represents the reduction of microbialactivity due to soil moisture availability is calculatedaccording to Arora (2003) and Probert et al. (1998) fide Paul(2001). fu varies between 0.0 and 1.0, which represent max-
Table B.2 Fitted parameters for the calculation of sloa ¼ a1T
2soil þ a2z2 þ a3Tsoil þ a4zþ a5Tsoilzþ a6
Soil type (Table B.1) a1 a2 a3
B1 5.07e�03 2.40e + 02 �4.39e + 00B2 1.20e�02 3.26e + 02 �8.91e + 00B3 1.21e�02 3.64e + 02 �9.09e + 00B4 1.67e�02 4.42e + 02 �1.21e + 01B5 4.17e�03 1.93e + 02 �3.72e + 00B6 2.11e�02 5.02e + 02 �1.51e + 01B7 2.86e�02 5.57e + 02 �1.97e + 01B8 1.75e�02 5.55e + 02 �1.32e + 01B9 2.34e�02 6.00e + 02 �1.70e + 01B10 3.12e�02 6.62e + 02 �2.20e + 01B11 2.58e�02 6.42e + 02 �1.83e + 01B12 2.50e�02 6.53e + 02 �1.79e + 01B13 2.53e�02 5.97e + 02 �1.79e + 01B14 2.82e�02 7.10e + 02 �2.04e + 01B15 2.08e�02 4.72e + 02 �1.46e + 01B16 1.99e�02 4.80e + 02 �1.39e + 01B17 2.27e�02 6.31e + 02 �1.62e + 01B18 2.23e�02 6.50e + 02 �1.60e + 01O1 7.21e�04 1.76e + 02 �1.59e + 00O2 3.75e�03 2.25e + 02 �3.61e + 00O3 7.06e�03 2.86e + 02 �5.91e + 00O4 1.29e�02 3.74e + 02 �9.74e + 00O5 2.92e�03 1.86e + 02 �3.06e + 00O6 3.00e�02 5.41e + 02 �2.06e + 01O7 2.76e�02 6.63e + 02 �1.95e + 01O8 1.85e�02 4.88e + 02 �1.34e + 01O9 2.08e�02 5.46e + 02 �1.50e + 01O10 1.85e�02 5.94e + 02 �1.39e + 01O11 2.29e�02 6.33e + 02 �1.67e + 01O12 2.60e�02 5.89e + 02 �1.83e + 01O13 3.36e�02 6.27e + 02 �2.29e + 01O14 3.84e�02 6.74e + 02 �2.71e + 01O15 2.25e�02 6.16e + 02 �1.66e + 01O16 1.88e�02 4.75e + 02 �1.32e + 01O17 2.19e�02 5.40e + 02 �1.53e + 01O18 1.98e�02 5.00e + 02 �1.41e + 01
imum and minimum reduction, respectively. Arora (2003)proposed a reduction function for fu, in which fu is assumedto decrease linearly with the logarithm of matric potential /between thresholds: u1 (25,000 Pa),u2 (762,500 Pa) and u3
(1,500,000 Pa). These thresholds are derived from Probertet al. (1998) fide Paul (2001) and incorporated in the formu-lation of Arora (2003):
fu ¼
0:5 u < usat
1:0� 0:5 � logðu1Þ�logðuÞlogðu1Þ�logðusatÞ
usat 6 u < u1
1:0 u1 6 u < u2
1:0� logðuÞ�logðu2Þlogðu3Þ�logðu2Þ
u2 6 u < u3
0:0 u > u3
8>>>>>><>>>>>>:
with /sat the saturated matric potential (Pa). On the basis offield data, Cosby et al. (1984) proposed the following equa-tion for /sat: usat ¼ 10ð�0:0131�esandþ1:88Þ � 100, with esand thesand content of the soil (%).
pe a in the repro-function F = a Æ /gas + b (0 6 F 6 1):
a4 a5 a6 Residual standarderror for a
�6.31e + 02 1.67e + 00 9.08e + 02 3.081�9.29e + 02 2.49e + 00 1.64e + 03 4.791�9.90e + 02 2.60e + 00 1.70e + 03 4.777�1.26e + 03 3.34e + 00 2.20e + 03 6.448�5.28e + 02 1.44e + 00 7.77e + 02 2.366�1.40e + 03 3.69e + 00 2.71e + 03 7.223�1.67e + 03 4.50e + 00 3.41e + 03 9.240�1.34e + 03 3.31e + 00 2.48e + 03 7.140�1.40e + 03 3.42e + 00 3.09e + 03 7.165�1.53e + 03 3.65e + 00 3.91e + 03 7.722�1.61e + 03 4.00e + 00 3.26e + 03 8.574�1.45e + 03 3.40e + 00 3.21e + 03 8.596�1.72e + 03 4.58e + 00 3.18e + 03 9.092�1.54e + 03 3.56e + 00 3.71e + 03 8.186�1.37e + 03 3.65e + 00 2.57e + 03 7.081�1.34e + 03 3.47e + 00 2.45e + 03 6.845�1.58e + 03 3.91e + 00 2.91e + 03 8.817�1.74e + 03 4.45e + 00 2.89e + 03 10.200�4.33e + 02 1.16e + 00 4.52e + 02 1.939�5.96e + 02 1.59e + 00 7.91e + 02 2.803�7.52e + 02 2.00e + 00 1.19e + 03 3.658�1.03e + 03 2.72e + 00 1.82e + 03 5.126�5.07e + 02 1.39e + 00 6.85e + 02 2.255�1.69e + 03 4.61e + 00 3.55e + 03 9.061�1.67e + 03 4.15e + 00 3.48e + 03 8.568�1.34e + 03 3.50e + 00 2.43e + 03 7.169�1.50e + 03 3.92e + 00 2.72e + 03 7.778�1.45e + 03 3.60e + 00 2.60e + 03 7.867�1.65e + 03 4.21e + 00 3.05e + 03 9.321�1.33e + 03 3.12e + 00 3.26e + 03 6.613�1.40e + 03 3.26e + 00 3.95e + 03 6.937�1.40e + 03 3.21e + 00 4.83e + 03 7.449�1.37e + 03 3.22e + 00 3.05e + 03 7.788�1.29e + 03 3.31e + 00 2.33e + 03 6.737�1.50e + 03 3.87e + 00 2.70e + 03 7.716�1.40e + 03 3.67e + 00 2.52e + 03 7.372

162 R.P. Bartholomeus et al.
A.6. Oxygen concentration in the atmosphere
The oxygen concentration in the atmosphere Catm
(kgO2m�3air) was calculated according to the general gas
law, assuming 21% oxygen in the atmosphere:
Catm ¼ 0:21 �MO2� p
R � Tair
with MO2the molar mass of oxygen (kgmol�1), p the atmo-
spheric pressure (Pa), R the universal gas constant(m3PaK�1mol�1) and Tair the air temperature (K).
A.7. Oxygen concentration in the gas phase of thesoil
The oxygen concentration C (kgO2m�3 soilair) in the gas
phase of the soil at soil depth z (m) (Fig. 2C) was calculatedaccording to Cook (1995). His model is based on one-dimen-
Table B.3 Fitted parameters for the calculation of interb ¼ b1T
2soil þ b2z2 þ b3Tsoil þ b4zþ b5Tsoilzþ b6
Soil type (Table B.1) b1 b2 b3
B1 1.89e�04 �3.91e�01 �8.65e�02B2 5.02e�05 �7.56e�02 �1.01e�02B3 5.36e�06 3.54e�01 1.20e�02B4 �2.67e�05 4.87e�02 3.03e�02B5 2.60e�04 �1.74e + 00 �1.16e�01B6 �1.23e�04 �6.11e�02 8.42e�02B7 �1.02e�04 8.54e�03 7.12e�02B8 �8.09e�05 2.23e�01 5.65e�02B9 �9.68e�05 1.56e�01 6.56e�02B10 �1.37e�04 �4.78e�02 8.94e�02B11 �1.71e�04 �2.25e�01 1.08e�01B12 �1.36e�04 �5.72e�01 8.92e�02B13 �1.19e�04 �8.68e�03 8.28e�02B14 �9.91e�05 �9.32e�01 7.13e�02B15 �7.90e�05 2.75e�02 5.85e�02B16 �7.91e�05 2.32e�01 5.71e�02B17 �2.21e�04 �5.23e�01 1.39e�01B18 �1.16e�04 �3.60e�01 7.85e�02O1 4.17e�04 �1.41e + 00 �2.06e�01O2 2.56e�04 �4.40e�01 �1.22e�01O3 1.93e�04 �2.84e�01 �8.88e�02O4 5.69e�05 �7.44e�02 �1.48e�02O5 5.21e�04 �1.81e + 00 �2.61e�01O6 �1.10e�04 6.88e�02 7.90e�02O7 �1.76e�04 �3.81e�01 1.11e�01O8 �2.38e�05 5.72e�01 2.47e�02O9 �4.68e�05 4.19e�01 3.84e�02O10 �1.10e�04 1.03e�01 7.32e�02O11 �1.48e�04 �3.36e�01 9.58e�02O12 �1.58e�04 1.36e�01 9.92e�02O13 �2.69e�04 �6.12e�01 1.66e�01O14 �6.34e�05 �4.27e�01 5.05e�02O15 3.08e�05 5.25e�02 �6.04e�03O16 �6.20e�05 3.40e�01 4.76e�02O17 �2.90e�05 3.99e�01 2.75e�02O18 �6.76e�05 4.41e�01 5.01e�02
sional oxygen diffusion in the soil. The diffusivity of the soilis given by Dsoil (m
2d�1). Additionally, his model involves asink term that decreases exponentially with soil depth z.
Contrary to Cook (1995), we considered two separatesink terms in which both microbial and root respirationare involved (Fig. 2D). Each term is described both by a ref-erence value at z = 0 (Rmicrobial_z0 in Eq. (12) and Rroot_tot_z0in Eq (10) (kgO2m
�3 soild�1)) and by a shape factor for theexponential decrease (Zmicrobial and Zroot (m) in Eqs. (11) and(9), respectively).
At z = 0, C equals the oxygen concentration in the atmo-sphere Catm (kgO2m
�3air). Two different solutions for theoxygen concentration profile can be distinguished:
First, as for z!1, C ! constant and non-zero value.This occurs when:
Z2microbial �
Rmicrobial z0
Dsoilþ Z2
root �Rroot tot z0
Dsoil< Catm
cept b in the repro-function F = a Æ /gas + b (0 6 F 6 1):
b4 b5 b6 Residual standarderror for b
2.11e + 01 �8.61e�02 7.12e + 00 0.0271.80e + 01 �7.27e�02 �2.81e + 00 0.0211.73e + 01 �7.09e�02 �5.51e + 00 0.0261.76e + 01 �7.02e�02 �7.90e + 00 0.0222.28e + 01 �8.99e�02 9.67e + 00 0.0391.66e + 01 �6.63e�02 �1.51e + 01 0.0231.76e + 01 �7.06e�02 �1.33e + 01 0.0251.62e + 01 �6.61e�02 �1.08e + 01 0.0241.67e + 01 �6.76e�02 �1.21e + 01 0.0251.81e + 01 �7.09e�02 �1.55e + 01 0.0281.68e + 01 �6.46e�02 �1.78e + 01 0.0311.02e + 01 �3.91e�02 �1.54e + 01 0.0401.77e + 01 �6.97e�02 �1.54e + 01 0.0291.35e + 01 �5.10e�02 �1.35e + 01 0.0531.55e + 01 �6.20e�02 �1.16e + 01 0.0161.10e + 01 �4.40e�02 �1.12e + 01 0.0171.44e + 01 �5.42e�02 �2.27e + 01 0.0281.05e + 01 �3.96e�02 �1.41e + 01 0.0292.42e + 01 �9.84e�02 2.20e + 01 0.0432.19e + 01 �8.92e�02 1.16e + 01 0.0291.96e + 01 �8.08e�02 7.68e + 00 0.0321.80e + 01 �7.36e�02 �2.01e + 00 0.0291.96e + 01 �7.85e�02 3.01e + 01 0.0451.77e + 01 �7.11e�02 �1.48e + 01 0.0231.79e + 01 �6.90e�02 �1.85e + 01 0.0311.64e + 01 �6.82e�02 �6.50e + 00 0.0261.74e + 01 �7.16e�02 �8.59e + 00 0.0281.69e + 01 �6.77e�02 �1.32e + 01 0.0271.78e + 01 �6.94e�02 �1.64e + 01 0.0311.56e + 01 �6.18e�02 �1.65e + 01 0.0271.27e + 01 �4.80e�02 �2.65e + 01 0.0421.73e + 01 �6.82e�02 �1.06e + 01 0.0638.44e + 00 �3.54e�02 �2.00e + 00 0.0439.54e + 00 �3.85e�02 �9.98e + 00 0.0208.07e + 00 �3.30e�02 �6.73e + 00 0.0201.50e + 01 �6.10e�02 �1.01e + 01 0.023

Critical soil conditions for oxygen stress to plant roots: Substituting the Feddes-function by a process-based model 163
then
C ¼ Catm � Z2microbial �
Rmicrobial z0
Dsoil
� �� 1� exp � z
Zmicrobial
� �� �
� Z2root �
Rroot tot z0
Dsoil
� �� 1� exp � z
Zroot
� �� �
Second, as for z!1, C! 0. This occurs when:
Z2microbial �
Rmicrobial z0
Dsoilþ Z2
root �Rroot tot z0
DsoilP Catm
then
C ¼ Catm � Z2microbial �
Rmicrobial z0
Dsoil
� �
� 1� z
Zmicrobial� exp � L
Zmicrobial
� �� exp � z
Zmicrobial
� �� �
� Z2root �
Rroot tot z0
Dsoil
� �
� 1� z
Zroot� exp � L
Zroot
� �� exp � z
Zroot
� �� �
where z at which C = 0, given by L (m) (Fig. 2C) can be founditeratively through the Newton–Raphson method:
fi ¼ 0 ¼ CðLÞ
f 0i ¼ �Rmicrobial z0
Dsoil� L � exp � L
Zmicrobial
� �� Rroot tot z0
Dsoil� L
� exp � L
Zroot
� �
Liþ1 ¼ Li �fif 0i
Appendix B. Repro-functions for the reductionof root water uptake of a temperate grasslandunder oxygen stress
We used simulations with our process-based model foroxygen stress to describe root water uptake reduction F asa continuous function of gas-filled porosity /gas, soiltemperature Tsoil and soil depth z. These repro-func-tions are based on the following assumptions andrestrictions:
–The repro-functions are only valid for the plant charac-teristics of temperate terrestrial natural grasslands (Table2) and for soil types that resemble the Staring series ofWosten et al. (2001) (Table B.1).–Between minimum and maximum oxygen deficiency(points I and II in Fig. 1), a linear relationship between Fand /gas is assumed (Fig. B.1).–The air temperature Tair equals Tsoil (K).–The organic matter content eorg = 10% for all soils (ourmodel, see section ‘‘Sensitivity of /gas_min and F to envi-ronmental parameters’’ appeared to be hardly sensitiveto eorg).
–The repro-functions were derived for limited ranges ofabiotic conditions: 265 K 6 Tsoil 6 303 K and 0.05 6 z6 0.5 m.
Assuming linearity, the general shape of the relationshipbetween F and /gas, can be described as F = a Æ /gas + b(0 6 F 6 1; Fig. B.1), where both a and b were approximatedas functions of Tsoil and z (Fig. B.2):
a ¼ a1T2soil þ a2z
2 þ a3Tsoil þ a4zþ a5Tsoilzþ a6
b ¼ b1T2soil þ b2z
2 þ b3Tsoil þ b4zþ b5Tsoilzþ b6
We derived parameter values a1�6 and b1�6 for differentsoil types through curve fitting on simulated data in thefollowing way. First, we simulated F as function of /gas
and we computed the slope a and intercept b by linearregression. This was done for different soil types (TableB.1), 8 values for Tsoil (268 K 6 Tsoil 6 303 K and a stepsize of 5 K) and 10 values for z (0.05 6 z 6 0.5 m and astep size of 0.05 m). Second, for each soil type we de-rived values of a1�6 and b1�6 by non-linear least squarefitting in R (www.r-project.org) on all 80 points a(Tsoil,z) and b(Tsoil, z) respectively. Examples of the thus ob-tained functions for a and b are presented in Fig. B.2.The results for the fitted parameter values for all soils,including the fit statistics, are presented in TablesB.2(a) and B.3(b).
References
Amthor, J.F., 2000. The McCree–de Wit–Penning de Vries–Thorn-ley respiration paradigms: 30 years later. Annals of Botany 86,1–20.
Armstrong, W., Beckett, P.M., 1985. Root aeration in unsaturatedsoil: a multi-shelled mathematical model of oxygen diffusion anddistribution with and without sectoral wet-soil blocking of thediffusion path. New Phytologist 100, 293–311.
Arora, V.K., 2003. Simulation energy and carbon fluxes overwinter wheat using coupled land surface and terrestrialecosystem models. Agricultural and Forest Meteorology 118,21–47.
Atlas, R.M., Bartha, R., 1987. Microbial Ecology: Fundamentals andApplications. The Benjamim/Cummings Publishing Company,Inc., California.
Barber, K.R., Leeds-Harrison, P.B., Lawson, C.S., Gowing, D.J.G.,2004. Soil aeration status in a lowland wet grassland. Hydrolog-ical Processes 18, 329–341.
Barley, K.P., 1970. The configuration of the root system in relationto nutrient uptake. Advances in Agronomy 22, 150–201.
Bartholomeus, R.P., Witte, J.P.M., van Bodegom, P.M., Aerts, R.,2008. The need of data harmonization to derive robust empiricalrelationships between soil conditions and vegetation. Journal ofVegetation Science 19, 799–808.
Buckingham, E., 1904. Contributions to our knowledge of theaeration of soils. Bulletin, 25. USDA Bureau of Soils, Washington,DC.
Burdick, D.M., Mendelssohn, I.A., 1987. Waterlogging responses indune, swale and marsh populations of Spartina patens underfield conditions. Oecologia 3, 321–329.
Campbell, G.S., 1974. A simple method for determining unsaturatedconductivity from moisture retention data. Soil Science 117,311–314.
Campbell, G.S., 1985. Soil physics with BASIC. Transport models forsoil-plant systemsDevelopments in Soil Science, vol. 14. Else-vier, Amsterdam, 150pp.

164 R.P. Bartholomeus et al.
Cannell, M.G.R., Thornley, J.H.M., 2000. Modelling the componentsof plant respiration: some guiding principles. Annals of Botany85, 45–54.
Cook, F.J., 1995. One-dimensional oxygen diffusion into soil withexponential respiration: analytical and numerical solutions.Ecological Modelling 78, 277–283.
Cook, F.J., Knight, J.H., 2003. Oxygen transport to plant roots:modeling for physical understanding of soil aeration. SoilScience Society of America Journal 67, 20–31.
Cosby, B.J., Hornberger, G.M., Clapp, R.B., Ginn, T.R., 1984. Astatistical exploration of the relationships of soil moisturecharacteristics to the physical properties of soils. WaterResources Research 20, 682–690.
Currie, J.A., 1965. Diffusion within soil microstructure. A structuralparameter for soils. Journal of Soil Science 16, 279–289.
Dasberg, S., Bakker, J.W., 1970. Characterizing soil aeration underchanging soil moisture conditions for bean growth. AgronomyJournal 62, 689–692.
De Willigen, P., Van Noordwijk, W., 1984. Mathematical models ondiffusion of oxygen to and within plant roots, with specialemphasis on effects of soil-root contact I. Derivation of themodels. Plant and Soil 77, 215–231.
De Willigen, P., Van Noordwijk, W., 1987. Roots, plant productionand nutrient use efficiency. Agricultural University, Wageningen,282pp.
Doussan, C., Pages, L., Vercambre, G., 1998. Modelling of thehydraulic architecture of root systems: an integrated approachto water absorption – model description. Annals of Botany 81,213–223.
Ehlers, W., Goss, M., 2003. Water Dynamics in Plant Production.CABI Publishing, Wallingford, UK, 273pp.
Engelaar, W.M.H.G., Yoneyama, T., 2000. Combined effects of soilwaterlogging and compaction on rice (Oryza sativa L.) growth,soil aeration, soil N transformations and N discrimination.Biology and Fertility of Soils 32, 484–493.
Feddes, R.A., Raats, P.A.C., 2004. Parameterizing the soil–water–plant root system. In: Feddes, R.A., Rooij, G.H.d., Van Dam, J.C.(Eds.), Unsaturated-zone Modeling: Progress, Challenges, Appli-cations. Wageningen UR Frontis Series, Wageningen, pp. 95–141.
Feddes, R.A., Kowalik, P.J., Zaradny, H., 1978. Simulation of filedwater use and crop yieldSimulation Monographs. Pudoc, Wagen-ingen, 189pp.
Fierer, N., Colman, B.P., Schimel, J.P., Jackson, R.B., 2006.Predicting the temperature dependence of microbial respirationin soil: a continental-scale analysis. Global BiogeochemicalCycles 20, GB3026. doi:10.1029/2005GB002644.
Glınski, J., Stepniewksi, W., 1985. Soil Aeration and its Role forPlants. CRC Press, Boca Raton, 229pp.
Hakansson, I., Lipiec, J., 2000. A review of the usefulness ofrelative bulk density values in studies of soil structure andcompaction. Soil and Tillage Research 53, 71–85.
Hillel, D., 1980. Fundamentals of Soil Physics. Academic Press, Inc.,New York, 413pp.
Horn, R., Taubner, H., Wuttke, M., Baumgartl, T., 1994. Soilphysical properties related to soil structure. Soil and TillageResearch 30, 187–216.
Jackson, R.B. et al, 1996. A global analysis of root distributions forterrestrial biomes. Oecologia 108, 389–411.
Jones, S.B., Or, D., 1998. Design of porous media for optimal gasand liquid fluxes to plant roots. Soil Science Society of AmericaJournal 62, 563–573.
Kalita, P.K., 1999. Transient finite element method solution ofoxygen diffusion in soil. Ecological Modelling 118, 227–236.
Kamaluddin, M., Zwiazek, J.J., 2001. Metabolic inhibition of rootwater flow in red-osier dogwood (Cornus stolonifera) seedlings.Journal of Experimental Botany 52, 739–745.
Katul, G., Leuning, R., Oren, R., 2003. Relationship between planthydraulic and biochemical properties derived from a steady-
state coupled water and carbon transport model. Plant, Cell andEnvironment 26, 339–350.
Koenker, R., 2007. Quantreg: Quantile Regression, R packageversion 4.10.
Kramer, P.J., 1951. Causes of injury to plants resulting fromflooding of the soil. Plant Physiology, 722–736.
Kroes, J.G.,Van Dam, J.C., Groenendijk, P., Hendriks, R.F.A.,Jacobs, C.M.J., 2008. SWAP version 3.2, theory description anduser manual. Alterra Report 1649. Wageningen University andResearch Centre, Wageningen.
Langø, T., Mørland, T., Brubakk, A.O., 1996. Diffusion coefficientsand solubility coefficients for gases in biological fluids andtissues: a review. Undersea and Hyperbaric Medicine 23, 247–272.
Leao, T.P., da Silva, A.P., Macedo, M.C.M., Imhoff, S., Euclides,V.P.B., 2006. Least limiting water range: a potential indicator ofchanges in near-surface soil physical quality after the conversionof Brazilian Savanna into pasture. Soil and Tillage Research 88,279–285.
Lemon, E.R., Wiegand, C.L., 1962. Soil aeration and plant rootrelations II root respiration. Agronomy Journal 54, 171–175.
Lipiec, J., Hatano, R., 2003. Quantification of compaction effectson soil physical properties and crop growth. Geoderma 116,107–136.
Lloyd, J., Taylor, J.A., 1994. On the temperature dependence ofsoil respiration. Functional Ecology 8 (3), 315–323.
Metselaar, K., de Jong van Lier, Q., 2007. The shape of thetranspiration reduction under plant water stress. Vadose ZoneJournal 6, 124–139.
Millington, R.J., Quirk, J.P., 1961. Permeability of porous solids.Transactions of the Faraday Society 57, 1200–1207.
Moldrup, P., Olesen, T., Schjonning, P., Yamaguchi, T., Rolston,D.E., 2000. Predicting the gas diffusion coefficient in undis-turbed soil from soil water characteristics. Soil Science Societyof America Journal 64, 94–100.
Molz, F.J., 1981. Models of water transport in the soil-plant system:a review. Water Resources Research 17 (5), 1245–1260.
Niinemets, U., Valladares, F., 2006. Tolerance to shade, drought,and waterlogging of temperate northern hemisphere trees andshrubs. Ecological Monographs 76, 521–547.
Paul, K., 2001. Temperature and moisture effects on decomposi-tion. In: NEE Workshop Proceedings.
Penning de Vries, F.W.T., Witlage, J.M., Kremer, D., 1979. Rates ofrespiration and of increase in structural dry matter in youngwheat, ryegrass and maize plants in relation to temperature, towater stress and to their sugar content. Annals of Botany(London) 44, 595–609.
Pierce, F.J., Larson, W.E., Dowdy, R.H., Graham, W.A.P., 1983.Productivity of soils: assessing long-term changes due to erosion.Journal of Soil and Water Conservation 38, 39–44.
Probert, M.E., Dimes, J.P., Keating, B.A., Dalal, R.C., Strong, W.M.,1998. APSIM’s water and nitrogen modules and simulation of thedynamics of water and nitrogen in fallow systems. AgriculturalSystems 56, 1–28.
Roose, T., Fowler, A.C., 2004. A model for water uptake by plantroots. Journal of Theoretical Biology 228 (2), 155–171.
Runhaar, J., Witte, J.P.M., Verburg, P.H., 1997. Ground-waterlevel, moisture supply, and vegetation in the Netherlands.Wetlands 17, 528–538.
Simojoki, A., 2000. Responses of soil respiration and barley growthto modified supply of oxygen in the soil. Agricultural and FoodScience in Finland 9, 303–318.
Simunek, J., van Genuchten, M. Th., Sejna, M., 2005. The HYDRUS-1D software package for simulating the one-dimensional move-ment of water, heat, and multiple solutes in variably-saturatedmedia. Version 3.0, HYDRUS Software Series 1. Department ofEnvironmental Sciences, University of California Riverside,Riverside, CA, 270pp.

Critical soil conditions for oxygen stress to plant roots: Substituting the Feddes-function by a process-based model 165
Stumm, W., Morgan, J.J., 1996. Chemical Equilibria and Rates inNatural Waters. John Wiley & Sons, New York, 1022pp.
Van Bodegom, P.M., Sorrell, B.K., Oosthoek, A., Bakker, C., Aerts,R., 2008. Separating the effects of partial submergence and soiloxygen demand on plant physiology and growth upon flooding.Ecology 89, 193–204.
Van den Berg, M., Driessen, P.M., 2002. Water uptake in cropgrowth models for land use systems analysis: I. A review ofapproaches and their pedigrees. Agriculture, Ecosystems andEnvironment 92, 21–36.
Van denBerg,M., Driessen, P.M., Rabbinge, R., 2002.Water uptake incrop growth models for land use systems analysis: II. Comparisonof three simple approaches. Ecological Modelling 148, 233–250.
Van Genuchten, M.T., 1980. A closed-form equation for predictingthe hydraulic conductivity of unsaturated soils. Soil ScienceSociety of America Journal 44, 892–898.
Van Noordwijk, W., De Willigen, P., 1984. Mathematical models ondiffusion of oxygen to and within plant roots, with special
emphasis on effects of soil–root contact, II Applications. Plantand Soil 77, 233–241.
Wesseling, J.G., 1991. Meerjarige simulatie van grondwaterstrom-ing voor verschillende bodemprofielen, grondwatertrappen engewassen met het model SWATRE. 152, DLO-Staring Centrum,Wageningen.
Wesseling, J., van Wijk, W.R., 1957. Soil physical conditions inrelation to drain depth. In: Luthin, J.N. (Ed.), Drainage ofAgricultural Lands. American Society of Agronomy, Madison,Wisconson, pp. 461–504.
Wosten, J.H.M., Veerman, G.J., de Groot, W.J.M., Stolte, J., 2001.Water retention and hydraulic conductivity functions of top- andsubsoils in The Netherlands: the staring series. Alterra Report153, Wageningen, The Netherlands, 86pp (in Dutch).
Zou, C., Penfold, C., Sands, R., Misra, R.K., Hudson, I., 2001.Effects of soil air-filled porosity, soil matric potential and soilstrength on primary root growth of radiata pine seedlings. Plantand Soil 236, 105–115.