Bogotá: ¿más crimen?, ¿más miedo? * Bogotá: Crime or fear of crime
Upload
khangminh22Category
view
0download
0

Crime in India
2015
Compendium
: +91-11-26172324, 26105353, 26177442
Fax : +91-11-26197984
E-Mail : [email protected]
Web Site : http://ncrb.gov.in
National Crime Records Bureau Ministry of Home Affairs
Government of India East Block - 7, R.K. Puram
New Delhi - 110 066

“Please visit our website at http://mha.nic.in”
Rajiv Mehrishi
North Block, New Delhi.
29th July, 2016
MESSAGE
It gives me pleasure to present the annual report “Crime in India” for
the year 2015 published by the National Crime Records Bureau (NCRB). This
report is 63rd in the series; first report having been published in the year 1953.
A lot of changes have been made to widen the scope and coverage of the
report and it continues to be the principal reference for crime statistics in
India, since 1953.
Criminals nowadays are more organized than ever before due to better
communication technology and are continually adopting new techniques and
modus operandi and developing new network that go beyond the national
boundaries. This poses a serious challenge to the law enforcement agencies,
policy makers and other stakeholders of the criminal justice system. An
exhaustive information base on every aspect of criminality in the society is
required to properly analyse the emerging trends and patterns of crime, plan
suitable strategies and appropriate interventions and measures for the future.
The annual report of the NCRB aims to fulfill these data requirements of
various stakeholders.
I thank all the State Governments and UT Administration and heads of
various law enforcement agencies for sending the validated data for
compilation and without them this publication would not have been possible.
(Rajiv Mehrishi)

“Please visit our website at http://ncrb.gov.in”
29th July, 2016
FOREWORD
I am privileged to publish 63rd edition of ‘Crime in India’ for the year 2015,
an annual publication of National Crime Records Bureau since the year 1953.
The trends of crimes keep changing with the growing population and rapid
development of towns and cities. Rise in crimes in any place especially crimes
against women, children and weaker sections of the society is a worrying factor
for everyone. Crime in India publication is a vital tool in the hands of such police
officers, researchers, criminologists and officers of criminal justice system in the
country as it provides ample statistical data to analyze and helps in informed
decision making to curb crime. This report has been one of the prime documents
on crime statistics in our country. Over the last few decades, this report has
become quite popular and its release is eagerly awaited by all. The report makes
us understand and analyse the emerging crime trends both nationally and locally
better.
The report is published in two parts. Part – 1 i.e. Crime in India
(Compendium) pertains to analytical description of crimes, criminals and
properties while Part – 2 i.e. Crime in India (Statistics) contains tabular statistics
on crimes, criminals & property. The report is published with more than 600
pages containing graphs, maps, time series tables etc. The magnitude of the
exercise undertaken for this edition can be gauged from the fact that the data
have been collected in 34 revised proformae from SCRBx/CID of all 36 States/UTs
and 53 Mega Cities (City having population of 10 lakhs or more). The proformae
for collecting data were revised in 2014 only, and lot of efforts had gone in to
राष्ट्रीय अपराध ररकार्ड ब्यूरो (यला ंम ाृय)
भारत सरकार
पूर्वी खण्र्-VII, आर.के.पुरं,् नई दिल्ृी-110066
NATIONAL CRIME RECORDS BUREAU
(MINISTRY OF HOME AFFAIRS)
GOVERNMENT OF INDIA
EAST BLOCK-VII, R.K. PURAM, NEW DELHI – 110 066
Radhakrishna Kini A.
Director General
“Please visit our website at http://ncrb.gov.in”
synchronize the procedure of collecting quality data and analyzing the trend &
patterns of crimes. To make sure that quality of data is not compromised, many
training sessions were given to States’ and UTs’ officials by the Bureau.
Data collection, compilation, analysis, brief comments and publication of
the report is an arduous task and requires untiring efforts. So, I take this
opportunity to record my appreciation of the excellent work done by all the team
members of the Statistical Branch of the Bureau and specially the contributions of
Software Development Team, the software is completely build by in-house team
of the Bureau and has helped a lot in data collection and validating the same. This
software not just helps NCRB but also the States and UTs to compile their data
and publish similar reports for their respective States and UTs.
I convey my gratitude to all the States and UT Police Departments for
supplying the crime data to NCRB within the time schedule. Without their active
support and cooperation it would not have been possible for us to bring out the
report within the timeframe. I urge the Heads of Law Enforcement Agencies to
supply the crime data pertaining to the year 2016 by February 2017 itself.
It is our constant endeavors to make data available in the public domain so
that maximum use of the data could be made. In this regard, Bureau has
uploaded all previous editions of the report including the current publication
‘Crime in India 2015’ on our website http://ncrb.gov.in. Besides, the Bureau is
also in process of digitizing all previous editions of reports in open source format.
I am happy to apprise that more than 1400 datasets including statistical tables of
‘Crime in India’ report during 2014 – 1986 have already been uploaded on Open
Government Data(OGD) Platform India website http://data.gov.in.
We look forward for your suggestion and feedback for improvement in
content and quality of this publication. A feedback form is attached at the end of
the report for your valuable suggestions.
(Radhakrishna Kini A.)
Disclaimer
The information given in this report has been obtained from States/UTs Police. All
precautions have been taken to ensure that the data is statistically consistent. NCRB
has only compiled and collated the data and presented it in the form of this report. As
data is being furnished by States/UTs thus NCRB shall not be responsible for
authenticity of this information. However, any discrepancy observed in this report may
be brought to the notice of the Bureau.
The Bureau is collecting statistical data of police recorded cognizable crimes through a
set of 34 proformae from 36 States/UTs and 53 Mega Cities (i.e. total of 89 data
supplying centres). The data pertain to the calendar year 2015.
In this report, the calculated values of crime rate, percentage etc. is rounded up to one
decimal only; hence an approximate value is used for analysis.
In order to make the statistical analysis more meaningful, we have calculated ‘Crime
Rate’ on the basis of population of that segment only. The population used for
calculation of crime rate for crime against women, Scheduled Castes, Scheduled Tribes,
children, senior citizens are approximate value pertain to population of female,
Scheduled Castes, Scheduled Tribes, children, senior citizens respectively. However, as
the Projected Population as on 1st July is available for total & female population only,
hence, a crude method as percentage ratio of the year 2011 was used for 2014. Hence,
the Bureau does not claim the precise accuracy of estimated population.
The Bureau follows ‘Principal Offence Rule’ for counting of crime. Hence among many
offences registered in a single case, only most heinous crime is considered as counting
unit, thereby representing one case.
The Socio-economic causative factors or reasons of crimes are not being captured by
the Bureau. Only police recorded crime cases are being captured for this publication.
In this edition, data have been collected in the revised proformae wherein, in addition to
inclusion of few new crime heads, some sections of earlier crime heads have also been
changed.
In order to avoid duplication of data collection, the Bureau has discontinued data
collection for the erstwhile Chapter-17 on Police Infrastructure, as Bureau of Police
Research and Development is already collecting and publishing the similar information.
Analysis for all the Chapters, except Chapter-4 & Chapter-12 wherein disposal details
have also been given, has been done on the basis of First Information Report(FIR), as
registered by police.
Like previous edition, this edition contains exclusive chapter on ‘Offences Against the
State’, ‘Environment Related Offences’, ‘Crimes against Senior Citizens’, ‘Crimes
Against Foreigners’, ‘Crimes Committed by Foreign Citizens’ ‘Kidnapping & Abduction ’
‘Child Trafficking ’ along with ‘Human Trafficking ’ have also been included.
Disclaimer
Considering the cost and size of report, the Bureau has printed only limited tables. The
incidents of crimes in cities have been put exclusively under Chapter 2. However, all
the remaining tables have been made available on our website http://ncrb.gov.in under
‘Additional Table for CII’ link.
Like previous edition, in present edition also, ‘Crime against Women’ include crime
head viz. Rape, Assault on Women with Intent to Outrage her Modest, Insult to the
Modesty of Women, Importation of Girls from Foreign Country, Cruelty by Husband or
His Relatives, Kidnapping & Abduction of Women, Abetment of Suicides of Women,
Dowry Deaths the Dowry Prohibition Act, 1961, the Indecent Representation of Women
(Prohibition) Act, 1986, the Commission of Sati Prevention Act 1987, the Protection of
Women from Domestic Violence Act, 2005 and the Immoral Traffic (P) Act.
Under the revised proformae, the classification of crime heads under ‘Crimes against
SCs & STs’ have been categorised as ‘IPC crimes in reported along with cases under
the SC/ST(PoA) Act’, ‘IPC crimes without SC/ST(PoA) Act’, ‘The Protection of Civil
Rights Act’ ‘The Employment of Manual Scavengers and Construction of Dry Latrines
(Prohibition) Act’ and ‘Other SLL Crimes’.
Like previous year, Cyber Crimes include the IT Act (as per amendment of 2008),
related sections of IPC and SLL. Besides, section wise data on cases reported &
persons arrested and their disposal by police and courts under Cyber Crimes has also
been published.
All editions of the publications have been made available on our website. Besides, the
historical, in open format, have also been made available on the website
http://data.gov.in of Open Government Data (OGD) Platform India.
Crime rate for crime against women, crime against children, crime against SCs/STs
and crime senior citizens have been calculated using population of female, children(up
to 18 years), SCs/STs and persons(60 years & above of age).
The complaints against police personnel (Table 16.1) are not necessarily include cases
of human rights violations by police, it may include complaints related to family
problems, general complaints etc.
In some crime heads, figures of persons arrested/charge-sheeted/convicted/etc. may
be less than the corresponding registered cases, as accused might not have been
arrested, died etc.
For some crime heads, cases/persons pending for investigation or trials brought
forward in 2015 may not match with the previous year data (2014), due to
change/modification of sections of that crime heads under the revised proformae.
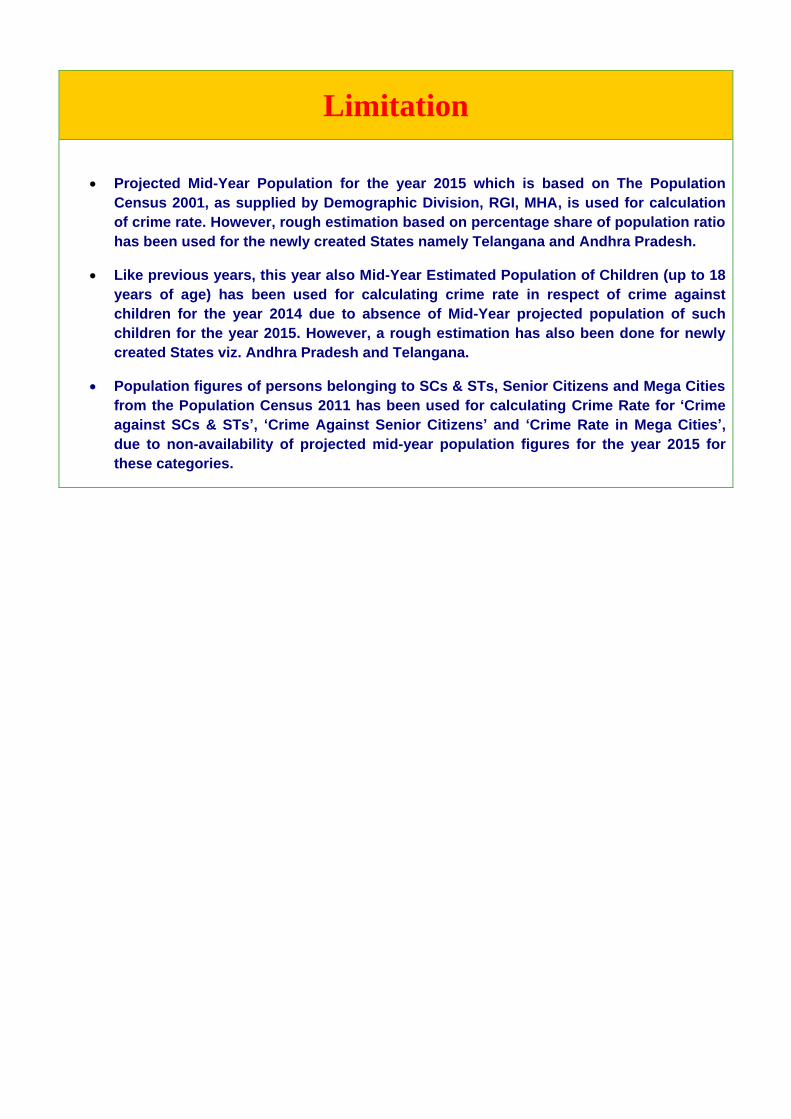
Limitation
Projected Mid-Year Population for the year 2015 which is based on The Population
Census 2001, as supplied by Demographic Division, RGI, MHA, is used for calculation
of crime rate. However, rough estimation based on percentage share of population ratio
has been used for the newly created States namely Telangana and Andhra Pradesh.
Like previous years, this year also Mid-Year Estimated Population of Children (up to 18
years of age) has been used for calculating crime rate in respect of crime against
children for the year 2014 due to absence of Mid-Year projected population of such
children for the year 2015. However, a rough estimation has also been done for newly
created States viz. Andhra Pradesh and Telangana.
Population figures of persons belonging to SCs & STs, Senior Citizens and Mega Cities
from the Population Census 2011 has been used for calculating Crime Rate for ‘Crime
against SCs & STs’, ‘Crime Against Senior Citizens’ and ‘Crime Rate in Mega Cities’,
due to non-availability of projected mid-year population figures for the year 2015 for
these categories.
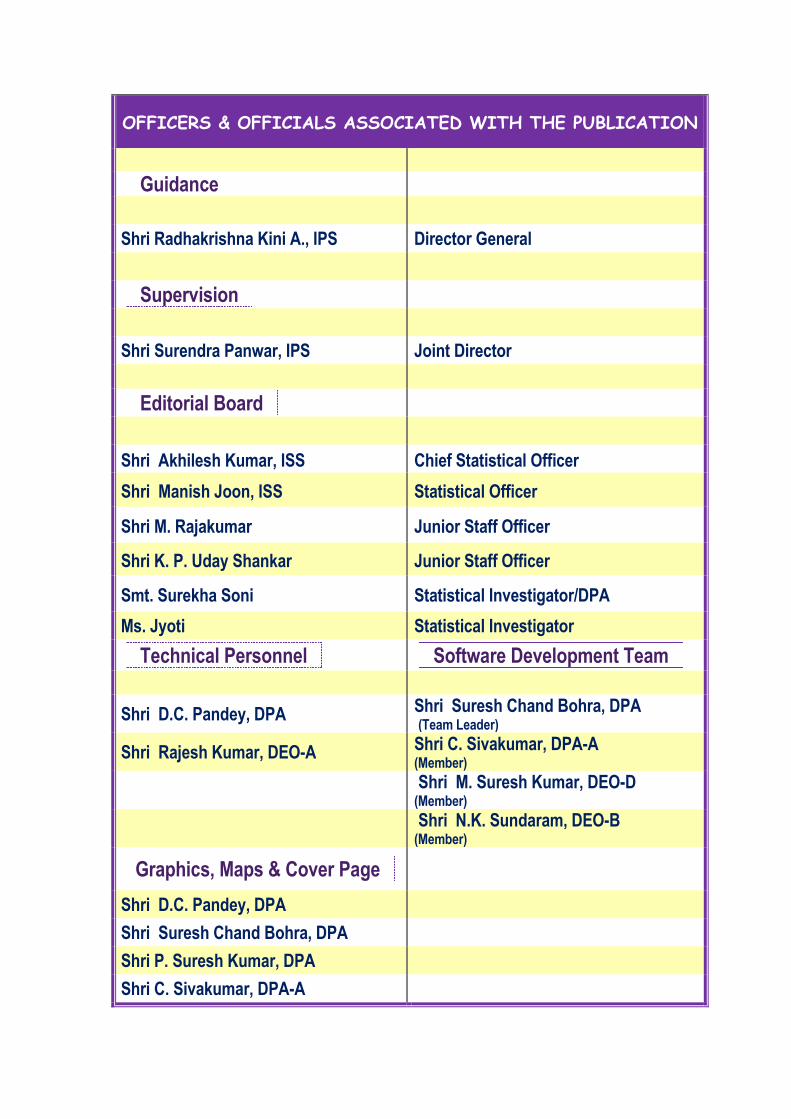
OFFICERS & OFFICIALS ASSOCIATED WITH THE PUBLICATION
...Guidance...
Shri Radhakrishna Kini A., IPS Director General
...Supervision...
Shri Surendra Panwar, IPS Joint Director
...Editorial Board...
Shri Akhilesh Kumar, ISS Chief Statistical Officer
Shri Manish Joon, ISS Statistical Officer
Shri M. Rajakumar Junior Staff Officer
Shri K. P. Uday Shankar Junior Staff Officer
Smt. Surekha Soni Statistical Investigator/DPA
Ms. Jyoti Statistical Investigator
...Technical Personnel... ...Software Development Team...
Shri D.C. Pandey, DPA Shri Suresh Chand Bohra, DPA (Team Leader)
Shri Rajesh Kumar, DEO-A Shri C. Sivakumar, DPA-A (Member)
Shri M. Suresh Kumar, DEO-D (Member)
Shri N.K. Sundaram, DEO-B (Member)
...Graphics, Maps & Cover Page...
Shri D.C. Pandey, DPA
Shri Suresh Chand Bohra, DPA
Shri P. Suresh Kumar, DPA
Shri C. Sivakumar, DPA-A
i
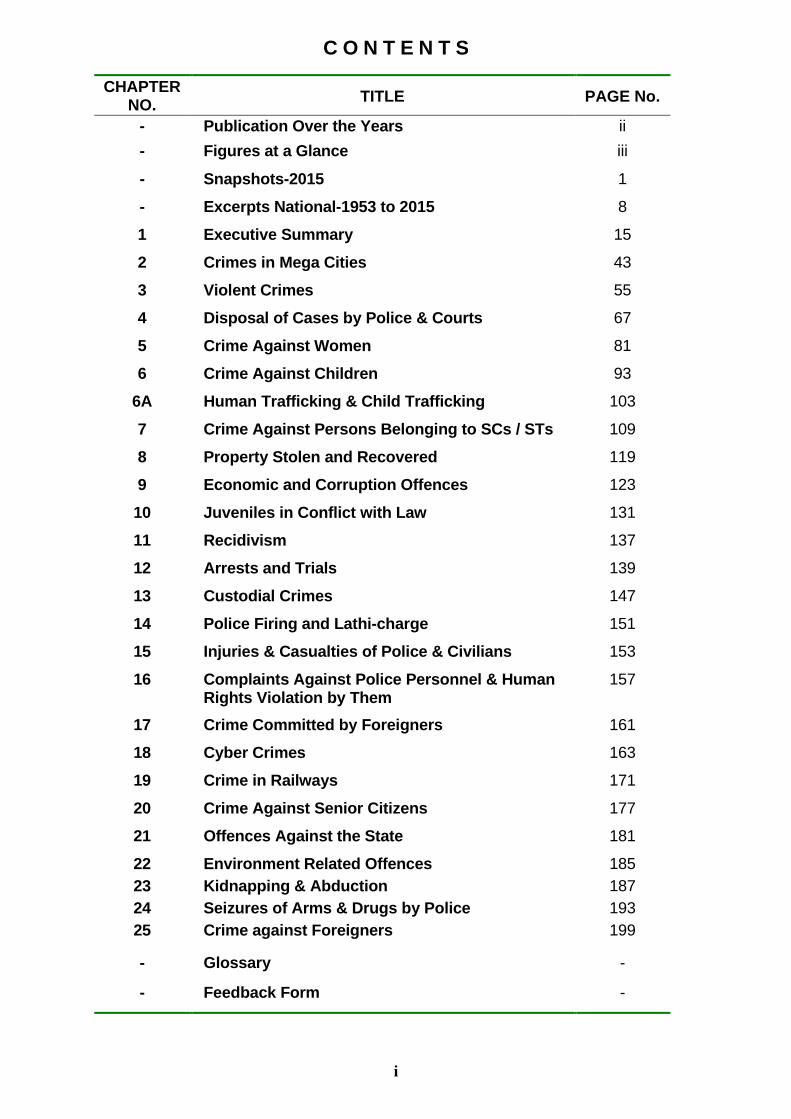
C O N T E N T S
CHAPTER NO.
TITLE PAGE No.
- Publication Over the Years ii
- Figures at a Glance iii
- Snapshots-2015 1
- Excerpts National-1953 to 2015 8
1 Executive Summary 15
2 Crimes in Mega Cities 43
3 Violent Crimes 55
4 Disposal of Cases by Police & Courts 67
5 Crime Against Women 81
6 Crime Against Children 93
6A Human Trafficking & Child Trafficking 103
7 Crime Against Persons Belonging to SCs / STs 109
8 Property Stolen and Recovered 119
9 Economic and Corruption Offences 123
10 Juveniles in Conflict with Law 131
11 Recidivism 137
12 Arrests and Trials 139
13 Custodial Crimes 147
14 Police Firing and Lathi-charge 151
15 Injuries & Casualties of Police & Civilians 153
16 Complaints Against Police Personnel & Human Rights Violation by Them
157
17 Crime Committed by Foreigners 161
18 Cyber Crimes 163
19 Crime in Railways 171
20 Crime Against Senior Citizens 177
21 Offences Against the State 181
22 Environment Related Offences 185
23 Kidnapping & Abduction 187
24 Seizures of Arms & Drugs by Police 193
25 Crime against Foreigners 199
- Glossary -
- Feedback Form -
ii
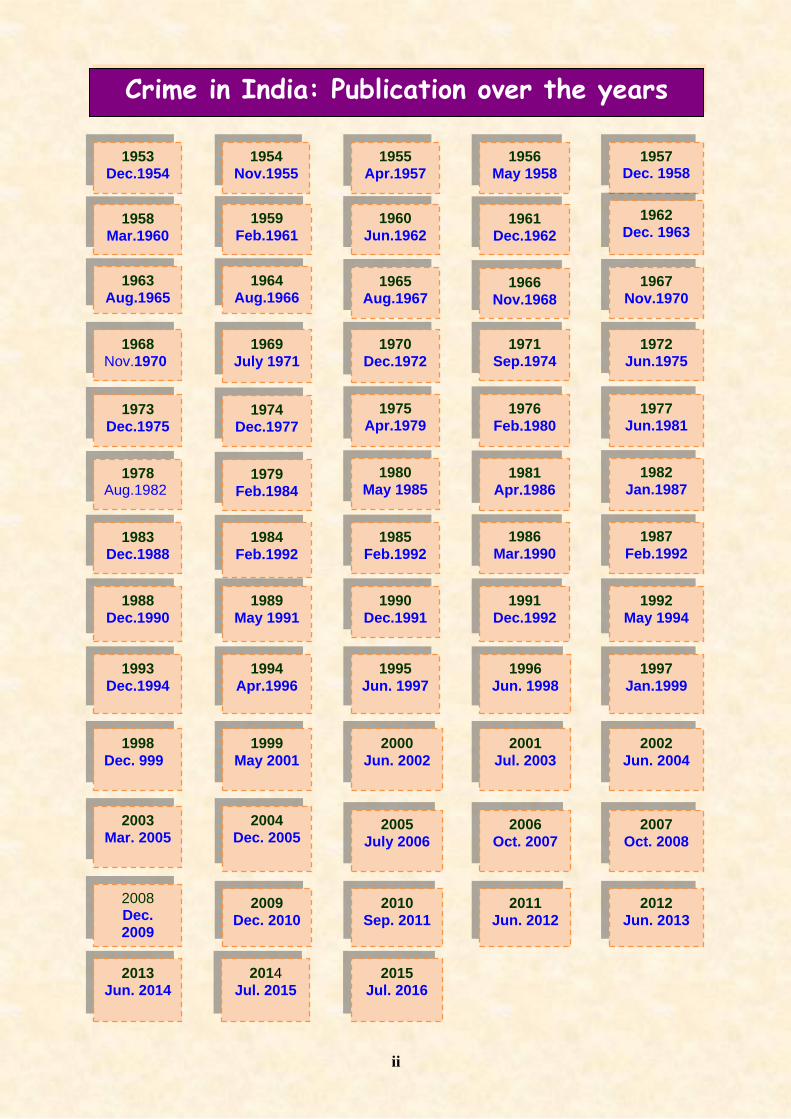
Crime in India: Publication over the years
1953
Dec.1954
1955
Apr.1957
1956
May 1958
1957 Dec. 1958
1954
Nov.1955
1963
Aug.1965 1965
Aug.1967 1966
Nov.1968
1967
Nov.1970
1964
Aug.1966
1960
Jun.1962
1962
Dec. 1963 1959
Feb.1961 1958
Mar.1960 1961
Dec.1962
1973
Dec.1975
1975 Apr.1979
1976
Feb.1980
1977 Jun.1981
1974 Dec.1977
1983 Dec.1988
1985
Feb.1992
1986
Mar.1990
1987
Feb.1992 1984
Feb.1992
1993
Dec.1994
1995
Jun. 1997
1996
Jun. 1998
1997
Jan.1999
1994
Apr.1996
1970
Dec.1972
1972
Jun.1975
1969
July 1971
1968
Nov.1970
1971
Sep.1974
1980
May 1985
1982
Jan.1987 1979
Feb.1984
1978 Aug.1982
1981 Apr.1986
2000
Jun. 2002
2002
Jun. 2004
1998
Dec. 999
2001
Jul. 2003
1990
Dec.1991
1992
May 1994
1989
May 1991
1988
Dec.1990
1991
Dec.1992
2003
Mar. 2005
2004
Dec. 2005 2005
July 2006
2006
Oct. 2007
2007
Oct. 2008
2008 Dec.
2009
2009
Dec. 2010
2010
Sep. 2011
2011
Jun. 2012
1999
May 2001
2012
Jun. 2013
2013 Jun. 2014
2014
Jul. 2015 2015
Jul. 2016
iii
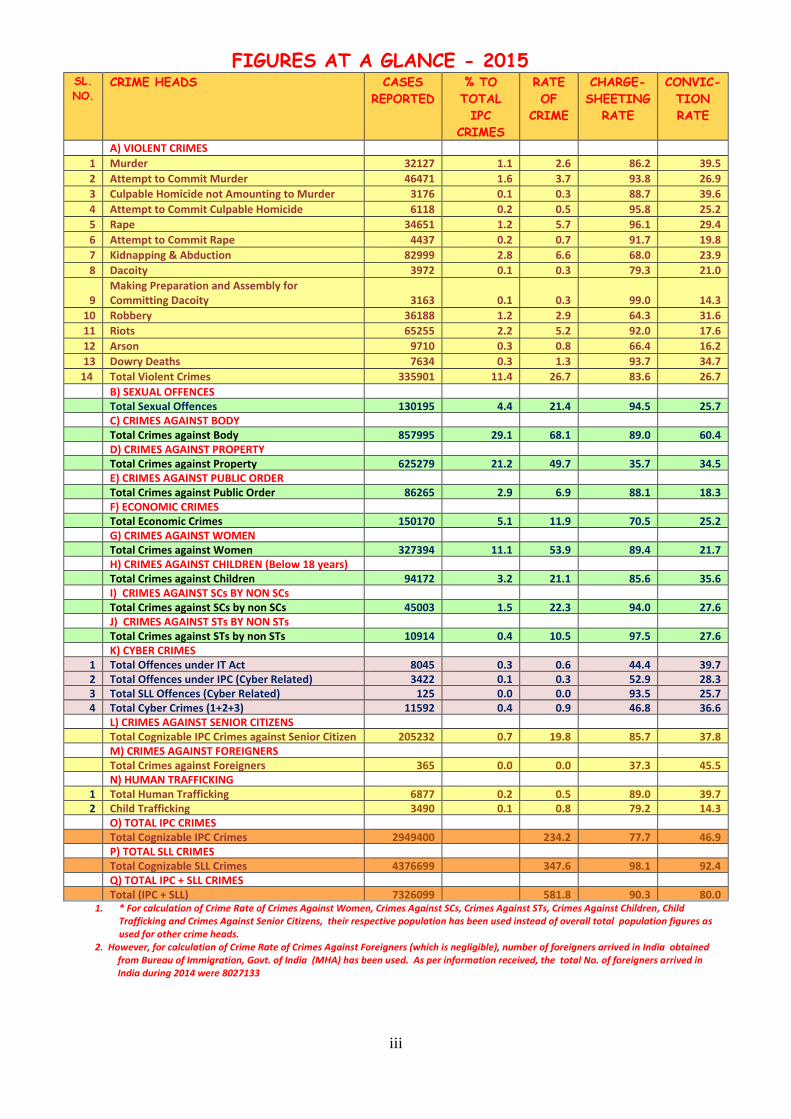
FIGURES AT A GLANCE - 2015 SL.
NO. CRIME HEADS CASES
REPORTED
% TO
TOTAL
IPC
CRIMES
RATE
OF
CRIME
CHARGE-
SHEETING
RATE
CONVIC-
TION
RATE
A) VIOLENT CRIMES
1 Murder 32127 1.1 2.6 86.2 39.5
2 Attempt to Commit Murder 46471 1.6 3.7 93.8 26.9
3 Culpable Homicide not Amounting to Murder 3176 0.1 0.3 88.7 39.6
4 Attempt to Commit Culpable Homicide 6118 0.2 0.5 95.8 25.2
5 Rape 34651 1.2 5.7 96.1 29.4
6 Attempt to Commit Rape 4437 0.2 0.7 91.7 19.8
7 Kidnapping & Abduction 82999 2.8 6.6 68.0 23.9
8 Dacoity 3972 0.1 0.3 79.3 21.0
9 Making Preparation and Assembly for Committing Dacoity 3163 0.1 0.3 99.0 14.3
10 Robbery 36188 1.2 2.9 64.3 31.6
11 Riots 65255 2.2 5.2 92.0 17.6
12 Arson 9710 0.3 0.8 66.4 16.2
13 Dowry Deaths 7634 0.3 1.3 93.7 34.7
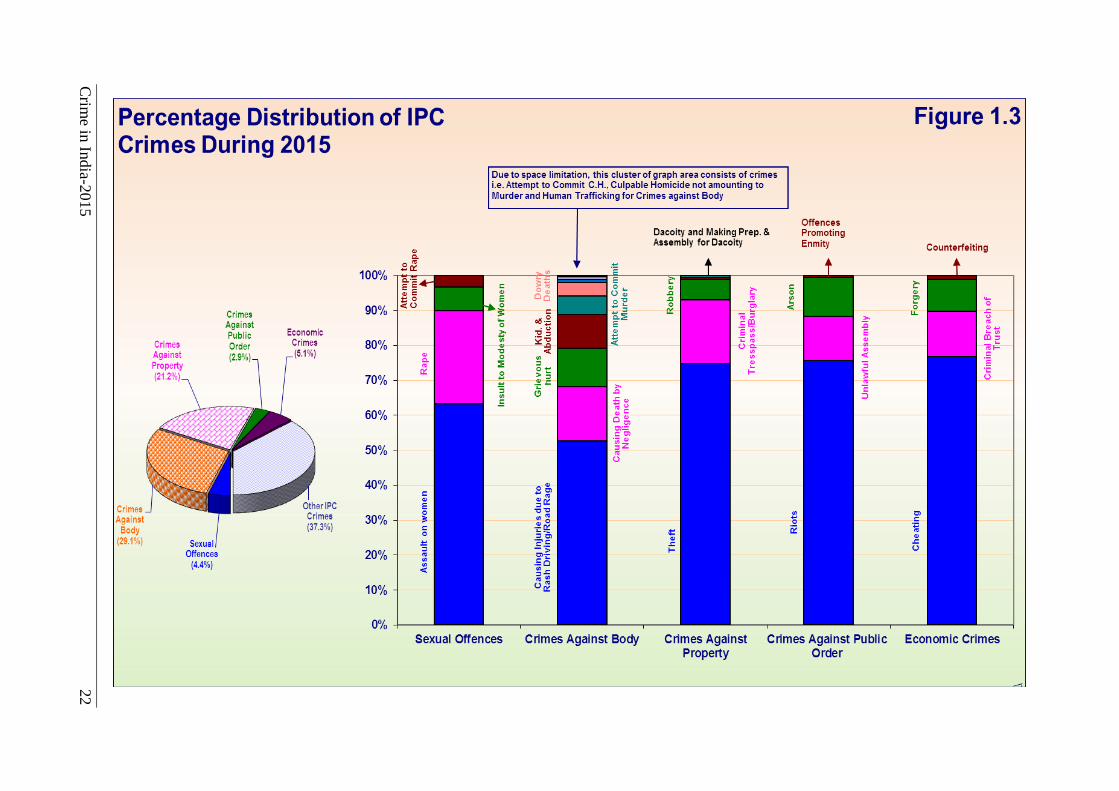
14 Total Violent Crimes 335901 11.4 26.7 83.6 26.7
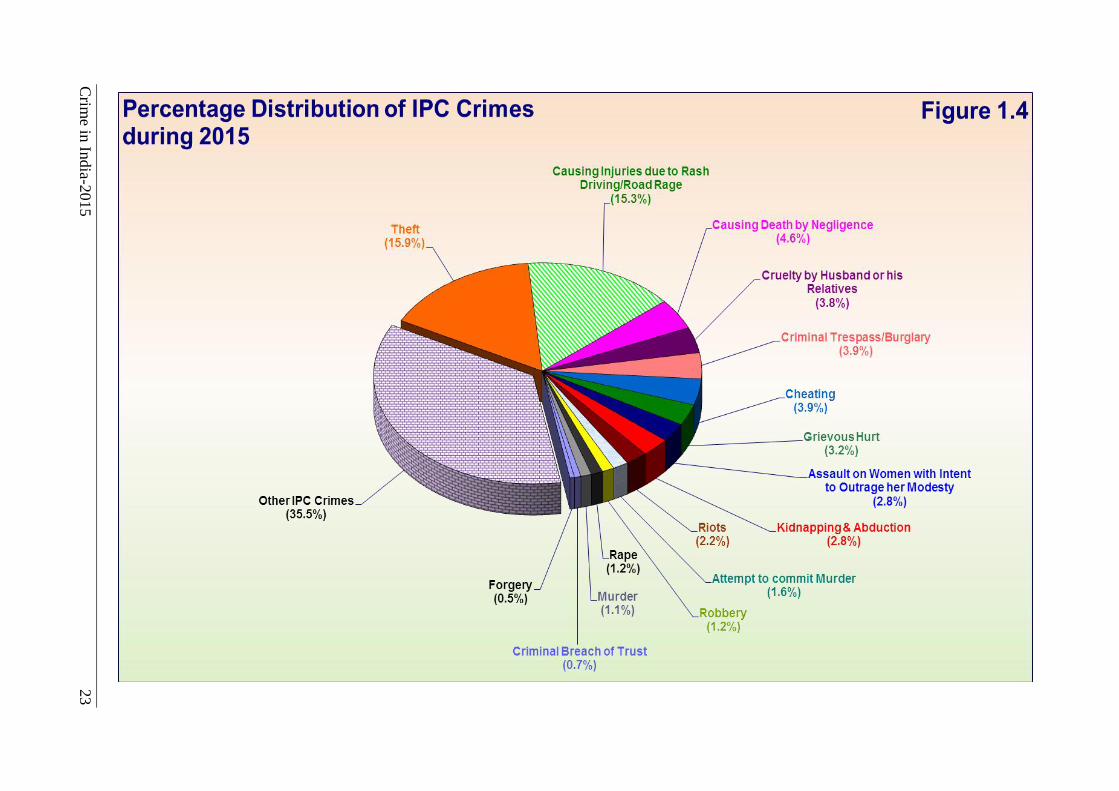
B) SEXUAL OFFENCES Total Sexual Offences 130195 4.4 21.4 94.5 25.7
C) CRIMES AGAINST BODY Total Crimes against Body 857995 29.1 68.1 89.0 60.4
D) CRIMES AGAINST PROPERTY Total Crimes against Property 625279 21.2 49.7 35.7 34.5
E) CRIMES AGAINST PUBLIC ORDER Total Crimes against Public Order 86265 2.9 6.9 88.1 18.3
F) ECONOMIC CRIMES Total Economic Crimes 150170 5.1 11.9 70.5 25.2
G) CRIMES AGAINST WOMEN Total Crimes against Women 327394 11.1 53.9 89.4 21.7
H) CRIMES AGAINST CHILDREN (Below 18 years)
Total Crimes against Children 94172 3.2 21.1 85.6 35.6
I) CRIMES AGAINST SCs BY NON SCs
Total Crimes against SCs by non SCs 45003 1.5 22.3 94.0 27.6
J) CRIMES AGAINST STs BY NON STs
Total Crimes against STs by non STs 10914 0.4 10.5 97.5 27.6
K) CYBER CRIMES 1 Total Offences under IT Act 8045 0.3 0.6 44.4 39.7
2 Total Offences under IPC (Cyber Related) 3422 0.1 0.3 52.9 28.3 3 Total SLL Offences (Cyber Related) 125 0.0 0.0 93.5 25.7 4 Total Cyber Crimes (1+2+3) 11592 0.4 0.9 46.8 36.6
L) CRIMES AGAINST SENIOR CITIZENS
Total Cognizable IPC Crimes against Senior Citizen 205232
0.7 19.8 85.7 37.8
M) CRIMES AGAINST FOREIGNERS
Total Crimes against Foreigners 365 0.0 0.0 37.3 45.5
N) HUMAN TRAFFICKING
1 Total Human Trafficking 6877 0.2 0.5 89.0 39.7 2 Child Trafficking 3490 0.1 0.8 79.2 14.3
O) TOTAL IPC CRIMES
Total Cognizable IPC Crimes 2949400
234.2 77.7 46.9
P) TOTAL SLL CRIMES
Total Cognizable SLL Crimes 4376699
347.6 98.1 92.4
Q) TOTAL IPC + SLL CRIMES
Total (IPC + SLL) 7326099
581.8 90.3 80.0 1. * For calculation of Crime Rate of Crimes Against Women, Crimes Against SCs, Crimes Against STs, Crimes Against Children, Child
Trafficking and Crimes Against Senior Citizens, their respective population has been used instead of overall total population figures as used for other crime heads.
2. However, for calculation of Crime Rate of Crimes Against Foreigners (which is negligible), number of foreigners arrived in India obtained from Bureau of Immigration, Govt. of India (MHA) has been used. As per information received, the total No. of foreigners arrived in India during 2014 were 8027133

Crime in India - 2015 1
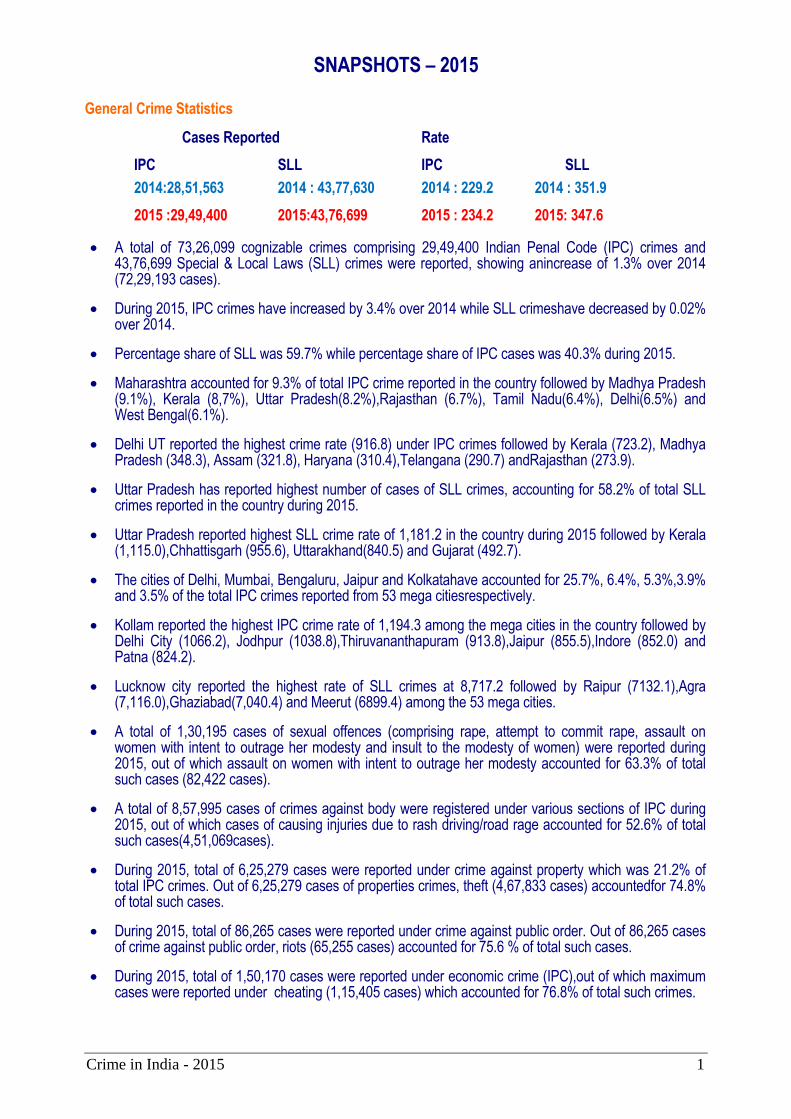
SNAPSHOTS – 2015
General Crime Statistics
Cases Reported Rate
IPC SLL IPC SLL
2014:28,51,563 2014 : 43,77,630 2014 : 229.2 2014 : 351.9
2015 :29,49,400 2015:43,76,699 2015 : 234.2 2015: 347.6 A total of 73,26,099 cognizable crimes comprising 29,49,400 Indian Penal Code (IPC) crimes and
43,76,699 Special & Local Laws (SLL) crimes were reported, showing anincrease of 1.3% over 2014 (72,29,193 cases).
During 2015, IPC crimes have increased by 3.4% over 2014 while SLL crimeshave decreased by 0.02% over 2014.
Percentage share of SLL was 59.7% while percentage share of IPC cases was 40.3% during 2015.
Maharashtra accounted for 9.3% of total IPC crime reported in the country followed by Madhya Pradesh (9.1%), Kerala (8,7%), Uttar Pradesh(8.2%),Rajasthan (6.7%), Tamil Nadu(6.4%), Delhi(6.5%) and West Bengal(6.1%).
Delhi UT reported the highest crime rate (916.8) under IPC crimes followed by Kerala (723.2), Madhya Pradesh (348.3), Assam (321.8), Haryana (310.4),Telangana (290.7) andRajasthan (273.9).
Uttar Pradesh has reported highest number of cases of SLL crimes, accounting for 58.2% of total SLL crimes reported in the country during 2015.
Uttar Pradesh reported highest SLL crime rate of 1,181.2 in the country during 2015 followed by Kerala (1,115.0),Chhattisgarh (955.6), Uttarakhand(840.5) and Gujarat (492.7).
The cities of Delhi, Mumbai, Bengaluru, Jaipur and Kolkatahave accounted for 25.7%, 6.4%, 5.3%,3.9% and 3.5% of the total IPC crimes reported from 53 mega citiesrespectively.
Kollam reported the highest IPC crime rate of 1,194.3 among the mega cities in the country followed by Delhi City (1066.2), Jodhpur (1038.8),Thiruvananthapuram (913.8),Jaipur (855.5),Indore (852.0) and Patna (824.2).
Lucknow city reported the highest rate of SLL crimes at 8,717.2 followed by Raipur (7132.1),Agra (7,116.0),Ghaziabad(7,040.4) and Meerut (6899.4) among the 53 mega cities.
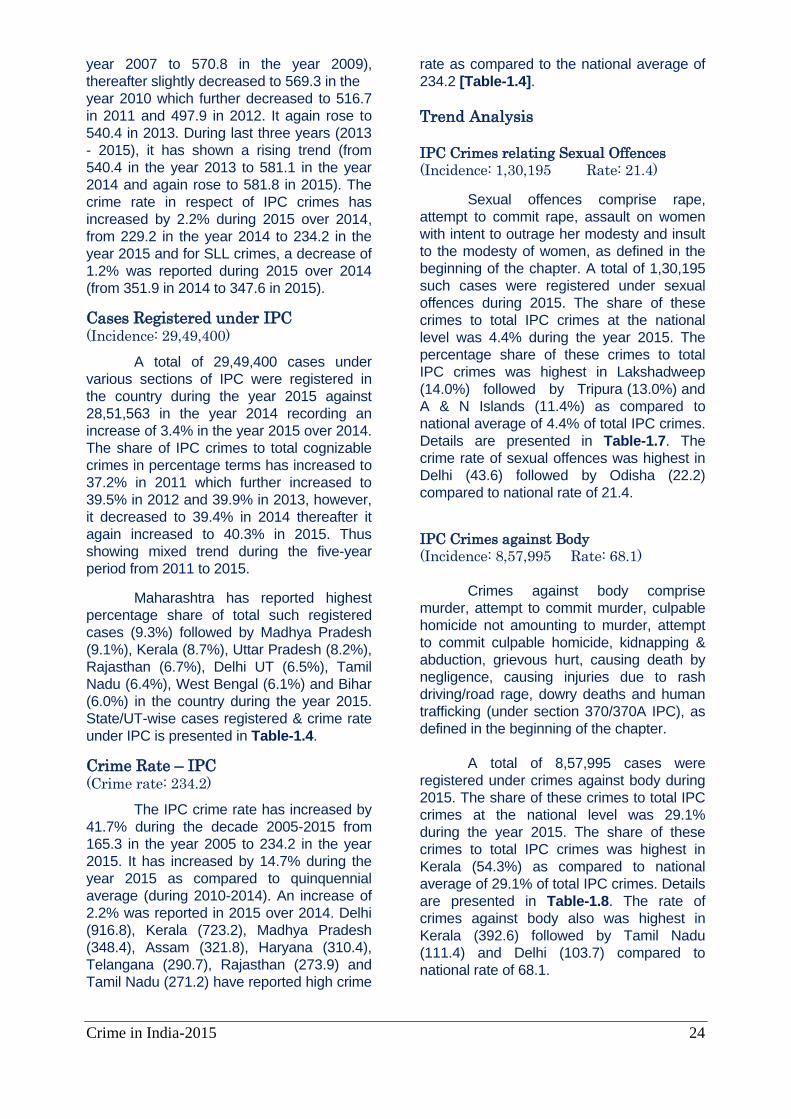
A total of 1,30,195 cases of sexual offences (comprising rape, attempt to commit rape, assault on women with intent to outrage her modesty and insult to the modesty of women) were reported during 2015, out of which assault on women with intent to outrage her modesty accounted for 63.3% of total such cases (82,422 cases).
A total of 8,57,995 cases of crimes against body were registered under various sections of IPC during 2015, out of which cases of causing injuries due to rash driving/road rage accounted for 52.6% of total such cases(4,51,069cases).
During 2015, total of 6,25,279 cases were reported under crime against property which was 21.2% of total IPC crimes. Out of 6,25,279 cases of properties crimes, theft (4,67,833 cases) accountedfor 74.8% of total such cases.
During 2015, total of 86,265 cases were reported under crime against public order. Out of 86,265 cases of crime against public order, riots (65,255 cases) accounted for 75.6 % of total such cases.
During 2015, total of 1,50,170 cases were reported under economic crime (IPC),out of which maximum cases were reported under cheating (1,15,405 cases) which accounted for 76.8% of total such crimes.
Crime in India - 2015 2
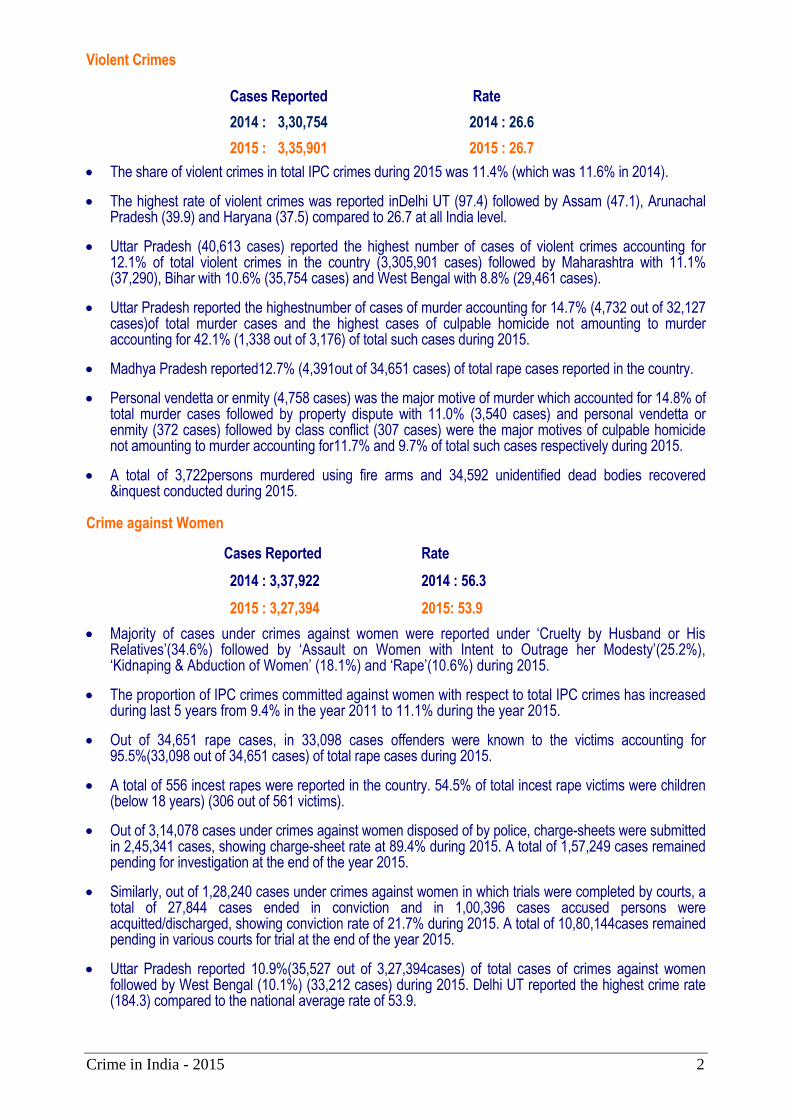
Violent Crimes
Cases Reported Rate
2014 : 3,30,754 2014 : 26.6
2015 : 3,35,901 2015 : 26.7
The share of violent crimes in total IPC crimes during 2015 was 11.4% (which was 11.6% in 2014).
The highest rate of violent crimes was reported inDelhi UT (97.4) followed by Assam (47.1), Arunachal Pradesh (39.9) and Haryana (37.5) compared to 26.7 at all India level.
Uttar Pradesh (40,613 cases) reported the highest number of cases of violent crimes accounting for 12.1% of total violent crimes in the country (3,305,901 cases) followed by Maharashtra with 11.1% (37,290), Bihar with 10.6% (35,754 cases) and West Bengal with 8.8% (29,461 cases).
Uttar Pradesh reported the highestnumber of cases of murder accounting for 14.7% (4,732 out of 32,127 cases)of total murder cases and the highest cases of culpable homicide not amounting to murder accounting for 42.1% (1,338 out of 3,176) of total such cases during 2015.
Madhya Pradesh reported12.7% (4,391out of 34,651 cases) of total rape cases reported in the country.
Personal vendetta or enmity (4,758 cases) was the major motive of murder which accounted for 14.8% of total murder cases followed by property dispute with 11.0% (3,540 cases) and personal vendetta or enmity (372 cases) followed by class conflict (307 cases) were the major motives of culpable homicide not amounting to murder accounting for11.7% and 9.7% of total such cases respectively during 2015.
A total of 3,722persons murdered using fire arms and 34,592 unidentified dead bodies recovered &inquest conducted during 2015.
Crime against Women
Cases Reported Rate
2014 : 3,37,922 2014 : 56.3
2015 : 3,27,394 2015: 53.9
Majority of cases under crimes against women were reported under ‘Cruelty by Husband or His Relatives’(34.6%) followed by ‘Assault on Women with Intent to Outrage her Modesty’(25.2%), ‘Kidnaping & Abduction of Women’ (18.1%) and ‘Rape’(10.6%) during 2015.
The proportion of IPC crimes committed against women with respect to total IPC crimes has increased during last 5 years from 9.4% in the year 2011 to 11.1% during the year 2015.
Out of 34,651 rape cases, in 33,098 cases offenders were known to the victims accounting for 95.5%(33,098 out of 34,651 cases) of total rape cases during 2015.
A total of 556 incest rapes were reported in the country. 54.5% of total incest rape victims were children (below 18 years) (306 out of 561 victims).
Out of 3,14,078 cases under crimes against women disposed of by police, charge-sheets were submitted in 2,45,341 cases, showing charge-sheet rate at 89.4% during 2015. A total of 1,57,249 cases remained pending for investigation at the end of the year 2015.
Similarly, out of 1,28,240 cases under crimes against women in which trials were completed by courts, a total of 27,844 cases ended in conviction and in 1,00,396 cases accused persons were acquitted/discharged, showing conviction rate of 21.7% during 2015. A total of 10,80,144cases remained pending in various courts for trial at the end of the year 2015.
Uttar Pradesh reported 10.9%(35,527 out of 3,27,394cases) of total cases of crimes against women followed by West Bengal (10.1%) (33,212 cases) during 2015. Delhi UT reported the highest crime rate (184.3) compared to the national average rate of 53.9.
Crime in India - 2015 3
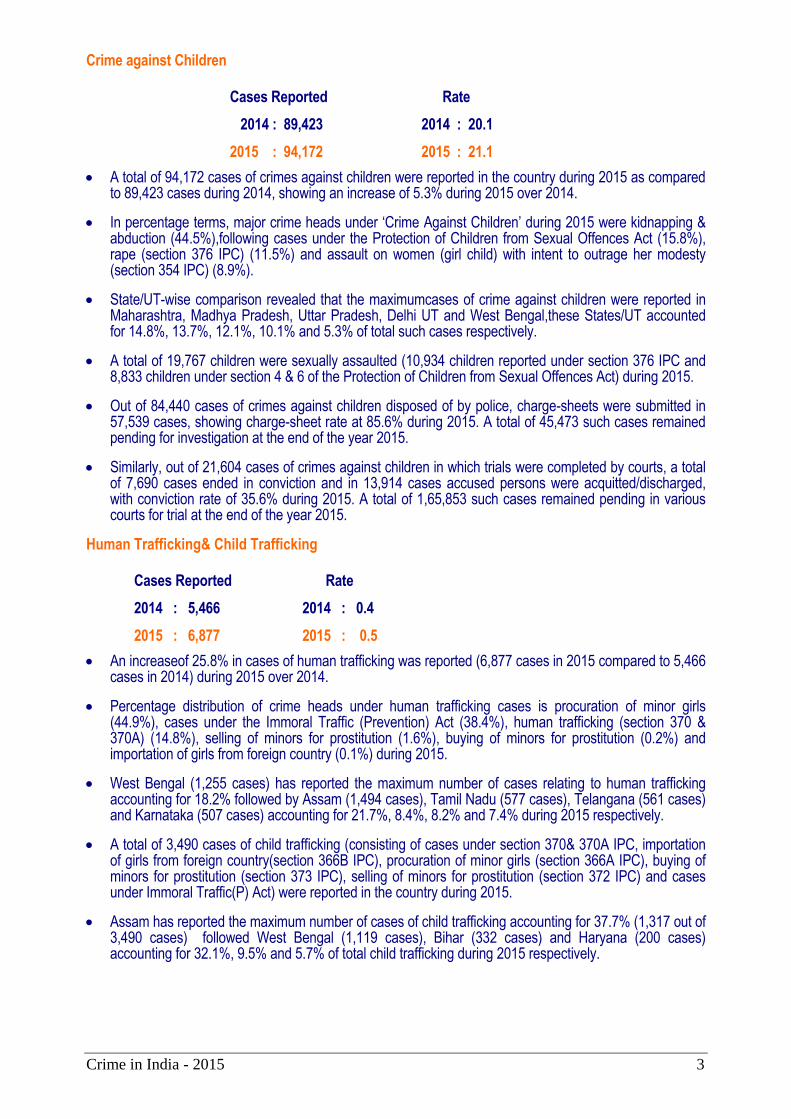
Crime against Children
Cases Reported Rate
2014 : 89,423 2014 : 20.1
2015 : 94,172 2015 : 21.1
A total of 94,172 cases of crimes against children were reported in the country during 2015 as compared to 89,423 cases during 2014, showing an increase of 5.3% during 2015 over 2014.
In percentage terms, major crime heads under ‘Crime Against Children’ during 2015 were kidnapping & abduction (44.5%),following cases under the Protection of Children from Sexual Offences Act (15.8%), rape (section 376 IPC) (11.5%) and assault on women (girl child) with intent to outrage her modesty (section 354 IPC) (8.9%).
State/UT-wise comparison revealed that the maximumcases of crime against children were reported in Maharashtra, Madhya Pradesh, Uttar Pradesh, Delhi UT and West Bengal,these States/UT accounted for 14.8%, 13.7%, 12.1%, 10.1% and 5.3% of total such cases respectively.
A total of 19,767 children were sexually assaulted (10,934 children reported under section 376 IPC and 8,833 children under section 4 & 6 of the Protection of Children from Sexual Offences Act) during 2015.
Out of 84,440 cases of crimes against children disposed of by police, charge-sheets were submitted in 57,539 cases, showing charge-sheet rate at 85.6% during 2015. A total of 45,473 such cases remained pending for investigation at the end of the year 2015.
Similarly, out of 21,604 cases of crimes against children in which trials were completed by courts, a total of 7,690 cases ended in conviction and in 13,914 cases accused persons were acquitted/discharged, with conviction rate of 35.6% during 2015. A total of 1,65,853 such cases remained pending in various courts for trial at the end of the year 2015.
Human Trafficking& Child Trafficking Cases Reported Rate
2014 : 5,466 2014 : 0.4
2015 : 6,877 2015 : 0.5
An increaseof 25.8% in cases of human trafficking was reported (6,877 cases in 2015 compared to 5,466 cases in 2014) during 2015 over 2014.
Percentage distribution of crime heads under human trafficking cases is procuration of minor girls (44.9%), cases under the Immoral Traffic (Prevention) Act (38.4%), human trafficking (section 370 & 370A) (14.8%), selling of minors for prostitution (1.6%), buying of minors for prostitution (0.2%) and importation of girls from foreign country (0.1%) during 2015.
West Bengal (1,255 cases) has reported the maximum number of cases relating to human trafficking accounting for 18.2% followed by Assam (1,494 cases), Tamil Nadu (577 cases), Telangana (561 cases) and Karnataka (507 cases) accounting for 21.7%, 8.4%, 8.2% and 7.4% during 2015 respectively.
A total of 3,490 cases of child trafficking (consisting of cases under section 370& 370A IPC, importation of girls from foreign country(section 366B IPC), procuration of minor girls (section 366A IPC), buying of minors for prostitution (section 373 IPC), selling of minors for prostitution (section 372 IPC) and cases under Immoral Traffic(P) Act) were reported in the country during 2015.
Assam has reported the maximum number of cases of child trafficking accounting for 37.7% (1,317 out of 3,490 cases) followed West Bengal (1,119 cases), Bihar (332 cases) and Haryana (200 cases) accounting for 32.1%, 9.5% and 5.7% of total child trafficking during 2015 respectively.
Crime in India - 2015 4
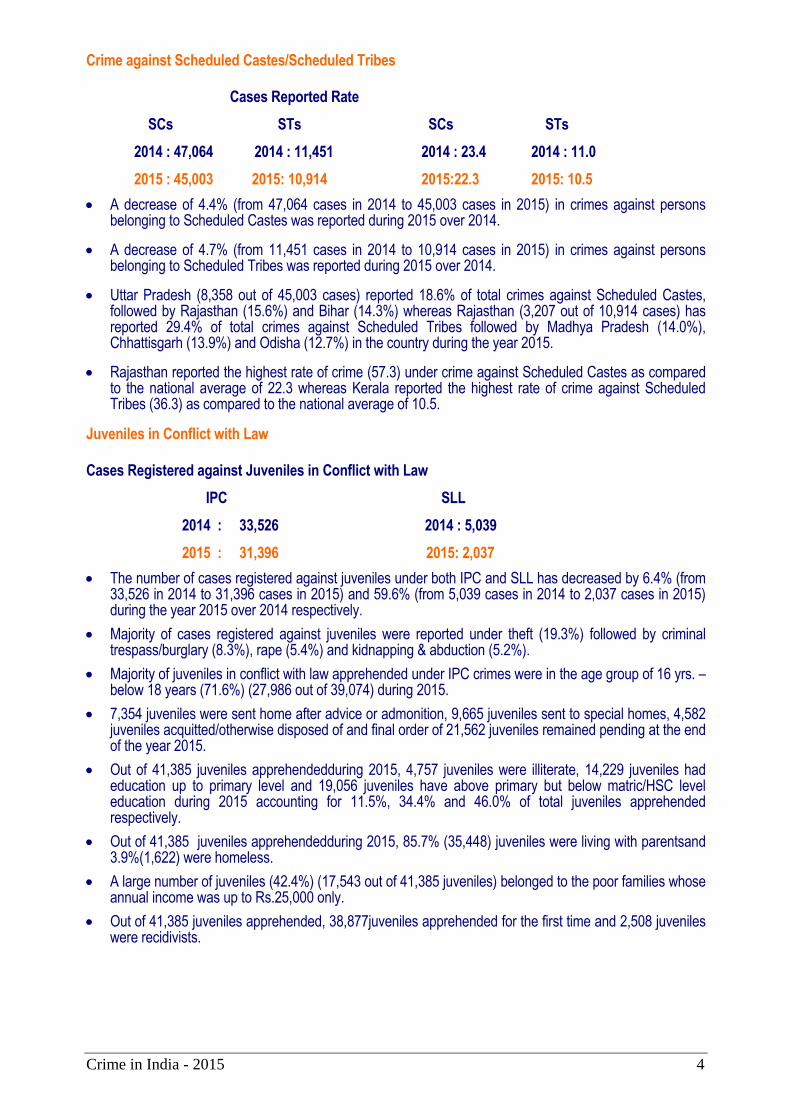
Crime against Scheduled Castes/Scheduled Tribes Cases Reported Rate
SCs STs SCs STs
2014 : 47,064 2014 : 11,451 2014 : 23.4 2014 : 11.0
2015 : 45,003 2015: 10,914 2015:22.3 2015: 10.5
A decrease of 4.4% (from 47,064 cases in 2014 to 45,003 cases in 2015) in crimes against persons belonging to Scheduled Castes was reported during 2015 over 2014.
A decrease of 4.7% (from 11,451 cases in 2014 to 10,914 cases in 2015) in crimes against persons belonging to Scheduled Tribes was reported during 2015 over 2014.
Uttar Pradesh (8,358 out of 45,003 cases) reported 18.6% of total crimes against Scheduled Castes, followed by Rajasthan (15.6%) and Bihar (14.3%) whereas Rajasthan (3,207 out of 10,914 cases) has reported 29.4% of total crimes against Scheduled Tribes followed by Madhya Pradesh (14.0%), Chhattisgarh (13.9%) and Odisha (12.7%) in the country during the year 2015.
Rajasthan reported the highest rate of crime (57.3) under crime against Scheduled Castes as compared to the national average of 22.3 whereas Kerala reported the highest rate of crime against Scheduled Tribes (36.3) as compared to the national average of 10.5.
Juveniles in Conflict with Law
Cases Registered against Juveniles in Conflict with Law
IPC SLL
2014 : 33,526 2014 : 5,039
2015 : 31,396 2015: 2,037
The number of cases registered against juveniles under both IPC and SLL has decreased by 6.4% (from 33,526 in 2014 to 31,396 cases in 2015) and 59.6% (from 5,039 cases in 2014 to 2,037 cases in 2015) during the year 2015 over 2014 respectively.
Majority of cases registered against juveniles were reported under theft (19.3%) followed by criminal trespass/burglary (8.3%), rape (5.4%) and kidnapping & abduction (5.2%).
Majority of juveniles in conflict with law apprehended under IPC crimes were in the age group of 16 yrs. –below 18 years (71.6%) (27,986 out of 39,074) during 2015.
7,354 juveniles were sent home after advice or admonition, 9,665 juveniles sent to special homes, 4,582 juveniles acquitted/otherwise disposed of and final order of 21,562 juveniles remained pending at the end of the year 2015.
Out of 41,385 juveniles apprehendedduring 2015, 4,757 juveniles were illiterate, 14,229 juveniles had education up to primary level and 19,056 juveniles have above primary but below matric/HSC level education during 2015 accounting for 11.5%, 34.4% and 46.0% of total juveniles apprehended respectively.
Out of 41,385 juveniles apprehendedduring 2015, 85.7% (35,448) juveniles were living with parentsand 3.9%(1,622) were homeless.
A large number of juveniles (42.4%) (17,543 out of 41,385 juveniles) belonged to the poor families whose annual income was up to Rs.25,000 only.
Out of 41,385 juveniles apprehended, 38,877juveniles apprehended for the first time and 2,508 juveniles were recidivists.
Crime in India - 2015 5
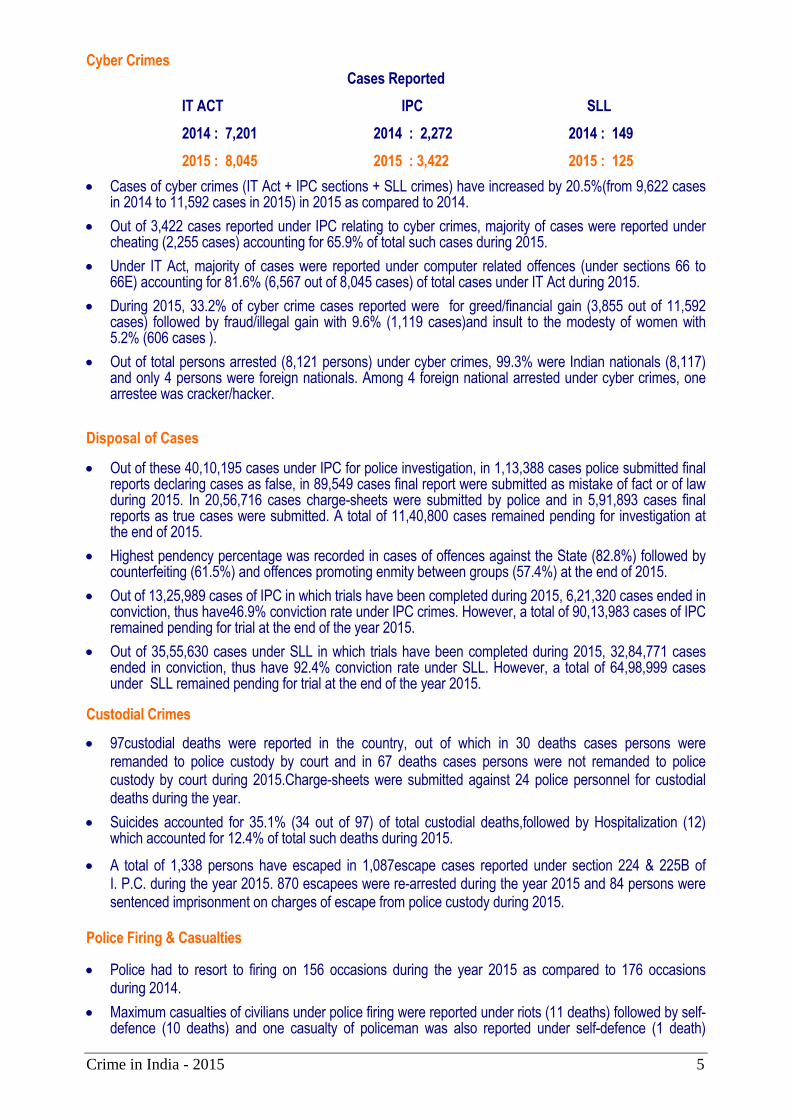
Cyber Crimes Cases Reported
IT ACT IPC SLL
2014 : 7,201 2014 : 2,272 2014 : 149
2015 : 8,045 2015 : 3,422 2015 : 125
Cases of cyber crimes (IT Act + IPC sections + SLL crimes) have increased by 20.5%(from 9,622 cases in 2014 to 11,592 cases in 2015) in 2015 as compared to 2014.
Out of 3,422 cases reported under IPC relating to cyber crimes, majority of cases were reported under cheating (2,255 cases) accounting for 65.9% of total such cases during 2015.
Under IT Act, majority of cases were reported under computer related offences (under sections 66 to 66E) accounting for 81.6% (6,567 out of 8,045 cases) of total cases under IT Act during 2015.
During 2015, 33.2% of cyber crime cases reported were for greed/financial gain (3,855 out of 11,592 cases) followed by fraud/illegal gain with 9.6% (1,119 cases)and insult to the modesty of women with 5.2% (606 cases ).
Out of total persons arrested (8,121 persons) under cyber crimes, 99.3% were Indian nationals (8,117) and only 4 persons were foreign nationals. Among 4 foreign national arrested under cyber crimes, one arrestee was cracker/hacker.
Disposal of Cases
Out of these 40,10,195 cases under IPC for police investigation, in 1,13,388 cases police submitted final reports declaring cases as false, in 89,549 cases final report were submitted as mistake of fact or of law during 2015. In 20,56,716 cases charge-sheets were submitted by police and in 5,91,893 cases final reports as true cases were submitted. A total of 11,40,800 cases remained pending for investigation at the end of 2015.
Highest pendency percentage was recorded in cases of offences against the State (82.8%) followed by counterfeiting (61.5%) and offences promoting enmity between groups (57.4%) at the end of 2015.
Out of 13,25,989 cases of IPC in which trials have been completed during 2015, 6,21,320 cases ended in conviction, thus have46.9% conviction rate under IPC crimes. However, a total of 90,13,983 cases of IPC remained pending for trial at the end of the year 2015.
Out of 35,55,630 cases under SLL in which trials have been completed during 2015, 32,84,771 cases ended in conviction, thus have 92.4% conviction rate under SLL. However, a total of 64,98,999 cases under SLL remained pending for trial at the end of the year 2015.
Custodial Crimes
97custodial deaths were reported in the country, out of which in 30 deaths cases persons were remanded to police custody by court and in 67 deaths cases persons were not remanded to police custody by court during 2015.Charge-sheets were submitted against 24 police personnel for custodial deaths during the year.
Suicides accounted for 35.1% (34 out of 97) of total custodial deaths,followed by Hospitalization (12) which accounted for 12.4% of total such deaths during 2015.
A total of 1,338 persons have escaped in 1,087escape cases reported under section 224 & 225B of I. P.C. during the year 2015. 870 escapees were re-arrested during the year 2015 and 84 persons were sentenced imprisonment on charges of escape from police custody during 2015.
Police Firing & Casualties
Police had to resort to firing on 156 occasions during the year 2015 as compared to 176 occasions during 2014.
Maximum casualties of civilians under police firing were reported under riots (11 deaths) followed by self-defence (10 deaths) and one casualty of policeman was also reported under self-defence (1 death)

Crime in India - 2015 6
during 2015.
A total of 25civiliansand 72police personnel got injured under police firing during ‘riot control’.
Police had to resort to lathi-charge on 327 occasions during 2015. Maximum occasions in which police resorted to lathi-charge were for ‘riots control’ (145 occasions).
Crimes by Foreignersand Crimes committed against Foreigners
A total of 1,278 cases were reported against foreigners under various sections of IPC and SLL crimes and 2,057 foreigners were arrested during 2015.
Out of 1,278 cases registered against foreigners, majority of cases were reported under the Foreigners Act (752 cases) followed by the Narcotic Drugs & Psychotropic Substance Act (111 cases) during 2015.
A total of 365 cases were reported under crime against foreigners in which 271 cases were reported against foreign tourists and 94 cases were in respect of foreigners other than foreign tourists during 2015.
More than half of cases (61.1%) (223 out of 365 cases) reported under crimes against foreigners were reported under thefts followed by assault on women (foreigners) with intent to outrage her modesty (23 cases) during 2015.
Crimes in Railways
A total of 39,239 cases of cognizable crimes were reported by GRP under Indian Penal Code (IPC) showing an increase of 24.1% over 2014 (31,609 cases) and 346 cases under the Indian Railways Act showing an increase of 20.6% over 2014 (287 cases).
Out of total IPC crime by registered by GRP during 2015, thefts (29,686 cases) followed by robberies (1,479 cases) and kidnapping & abduction (270 cases) accounted for 75.7%, 3.8% and 0.7% of total IPC crimes respectively reported by GRP.
A total of 1,017 persons were arrested under the Railways Act, 1898 and the Railway Property (Unlawful Possession) Act, 1966.
Crime against Senior Citizens
Cases Reported RATE
2014 : 18,714 2014 : 18.3
2015 : 20,532 2015 : 20.0
An increase of 9.7% (from 18,714 cases in 2014 to 20,532 cases in 2015) was reported in crimes against senior citizens during 2015 over 2014.
Out of 20,532 cases under crime against senior citizens, maximum cases were reported under cheating (1,867 cases) followed by robbery (1,294 cases) and murder (1,053 cases) during 2015.
A total of 23,615 persons were arrested under the crimes committed against senior citizens during 2015, maximum persons were arrested on murder charge (1,871 persons) followed by cases of grievous hurt (1,508 persons).
Maximum cases of crime against senior citizens were reported in Maharashtra (4,561 cases out of 20,532 cases) followed by Madhya Pradesh (3,456 cases) and Andhra Pradesh (2,495 cases) which accounted for 22.2%, 16.8% and 12.2% total such cases respectively during 2015.
Offences against the State (IPC) A total of 571cases were registered under offences against the State comprising 147 cases under
offences against the State (section 121,121A, 122, 123 and 124A - IPC) and 424cases relating to offences promoting enmity between different groups (section 153A & 153B - IPC).
Uttar Pradesh has reported the highest number of such crimes (60 cases) followed by Telangana (54 Cases), Andhra Pradesh(50 cases) and Karnataka (49 cases) accounting for 10.5%, 9.5%, 8.8% and
Crime in India - 2015 7
8.6% of total such cases respectively during 2015.
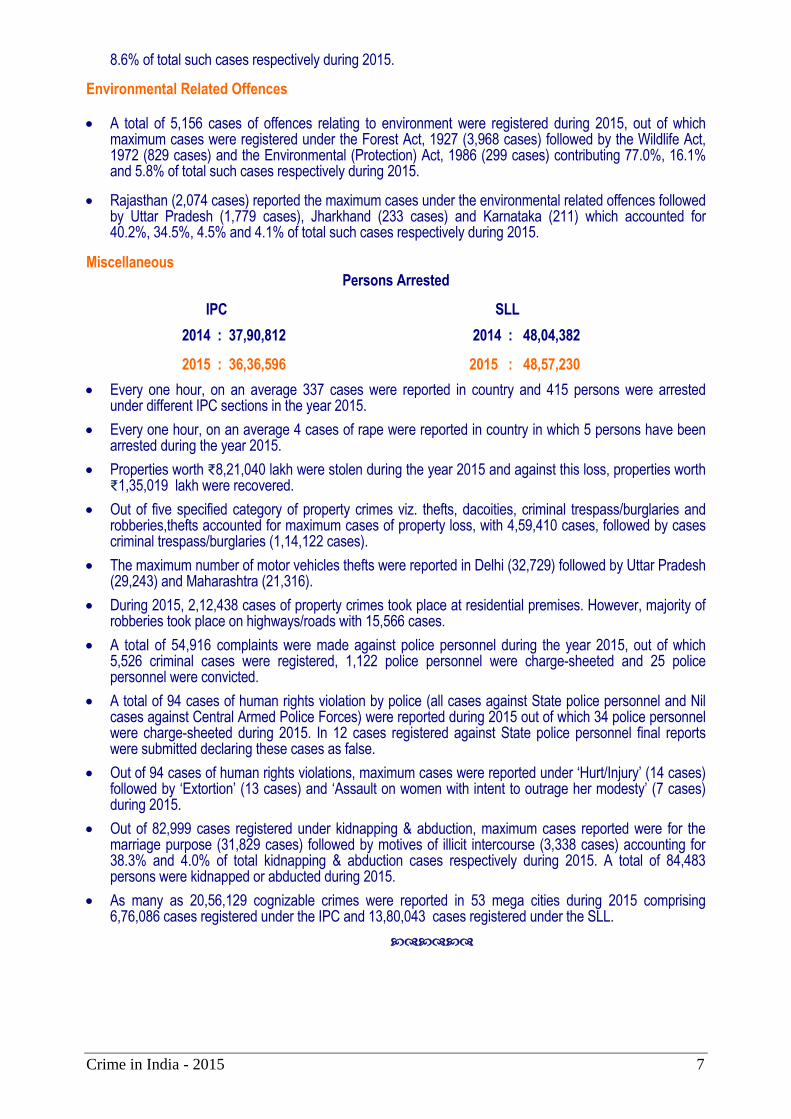
Environmental Related Offences A total of 5,156 cases of offences relating to environment were registered during 2015, out of which
maximum cases were registered under the Forest Act, 1927 (3,968 cases) followed by the Wildlife Act, 1972 (829 cases) and the Environmental (Protection) Act, 1986 (299 cases) contributing 77.0%, 16.1% and 5.8% of total such cases respectively during 2015.
Rajasthan (2,074 cases) reported the maximum cases under the environmental related offences followed by Uttar Pradesh (1,779 cases), Jharkhand (233 cases) and Karnataka (211) which accounted for 40.2%, 34.5%, 4.5% and 4.1% of total such cases respectively during 2015.
Miscellaneous Persons Arrested
IPC SLL
2014 : 37,90,812 2014 : 48,04,382
2015 : 36,36,596 2015 : 48,57,230
Every one hour, on an average 337 cases were reported in country and 415 persons were arrested under different IPC sections in the year 2015.
Every one hour, on an average 4 cases of rape were reported in country in which 5 persons have been arrested during the year 2015.
Properties worth ₹8,21,040 lakh were stolen during the year 2015 and against this loss, properties worth ₹1,35,019 lakh were recovered.
Out of five specified category of property crimes viz. thefts, dacoities, criminal trespass/burglaries and robberies,thefts accounted for maximum cases of property loss, with 4,59,410 cases, followed by cases criminal trespass/burglaries (1,14,122 cases).
The maximum number of motor vehicles thefts were reported in Delhi (32,729) followed by Uttar Pradesh (29,243) and Maharashtra (21,316).
During 2015, 2,12,438 cases of property crimes took place at residential premises. However, majority of robberies took place on highways/roads with 15,566 cases.
A total of 54,916 complaints were made against police personnel during the year 2015, out of which 5,526 criminal cases were registered, 1,122 police personnel were charge-sheeted and 25 police personnel were convicted.
A total of 94 cases of human rights violation by police (all cases against State police personnel and Nil cases against Central Armed Police Forces) were reported during 2015 out of which 34 police personnel were charge-sheeted during 2015. In 12 cases registered against State police personnel final reports were submitted declaring these cases as false.
Out of 94 cases of human rights violations, maximum cases were reported under ‘Hurt/Injury’ (14 cases) followed by ‘Extortion’ (13 cases) and ‘Assault on women with intent to outrage her modesty’ (7 cases) during 2015.
Out of 82,999 cases registered under kidnapping & abduction, maximum cases reported were for the marriage purpose (31,829 cases) followed by motives of illicit intercourse (3,338 cases) accounting for 38.3% and 4.0% of total kidnapping & abduction cases respectively during 2015. A total of 84,483 persons were kidnapped or abducted during 2015.
As many as 20,56,129 cognizable crimes were reported in 53 mega cities during 2015 comprising 6,76,086 cases registered under the IPC and 13,80,043 cases registered under the SLL.
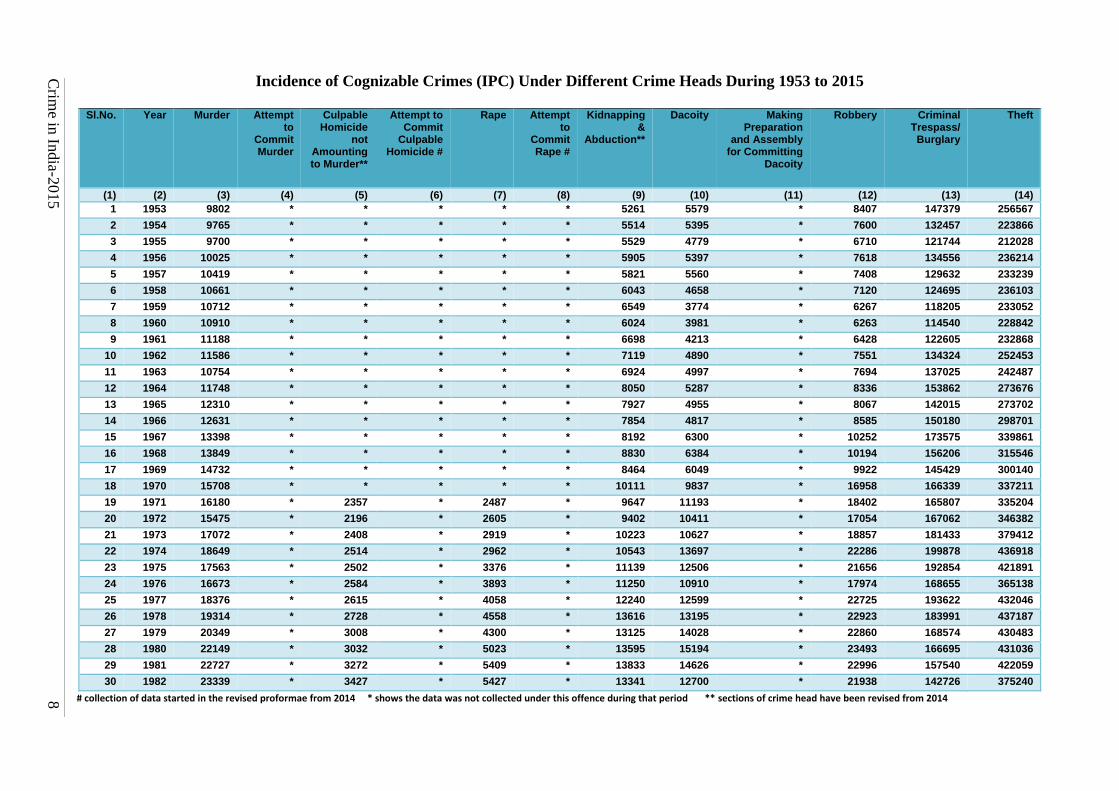
Incidence of Cognizable Crimes (IPC) Under Different Crime Heads During 1953 to 2015
Sl.No. Year Murder Attempt
to Commit Murder
Culpable Homicide
not Amounting to Murder**
Attempt to Commit
Culpable Homicide #
Rape Attempt to
Commit Rape #
Kidnapping &
Abduction**
Dacoity Making Preparation
and Assembly for Committing
Dacoity
Robbery Criminal Trespass/
Burglary
Theft
(1) (2) (3) (4) (5) (6) (7) (8) (9) (10) (11) (12) (13) (14)
1 1953 9802 * * * * * 5261 5579 * 8407 147379 256567
2 1954 9765 * * * * * 5514 5395 * 7600 132457 223866
3 1955 9700 * * * * * 5529 4779 * 6710 121744 212028
4 1956 10025 * * * * * 5905 5397 * 7618 134556 236214
5 1957 10419 * * * * * 5821 5560 * 7408 129632 233239
6 1958 10661 * * * * * 6043 4658 * 7120 124695 236103
7 1959 10712 * * * * * 6549 3774 * 6267 118205 233052
8 1960 10910 * * * * * 6024 3981 * 6263 114540 228842
9 1961 11188 * * * * * 6698 4213 * 6428 122605 232868
10 1962 11586 * * * * * 7119 4890 * 7551 134324 252453
11 1963 10754 * * * * * 6924 4997 * 7694 137025 242487
12 1964 11748 * * * * * 8050 5287 * 8336 153862 273676
13 1965 12310 * * * * * 7927 4955 * 8067 142015 273702
14 1966 12631 * * * * * 7854 4817 * 8585 150180 298701
15 1967 13398 * * * * * 8192 6300 * 10252 173575 339861
16 1968 13849 * * * * * 8830 6384 * 10194 156206 315546
17 1969 14732 * * * * * 8464 6049 * 9922 145429 300140
18 1970 15708 * * * * * 10111 9837 * 16958 166339 337211
19 1971 16180 * 2357 * 2487 * 9647 11193 * 18402 165807 335204
20 1972 15475 * 2196 * 2605 * 9402 10411 * 17054 167062 346382
21 1973 17072 * 2408 * 2919 * 10223 10627 * 18857 181433 379412
22 1974 18649 * 2514 * 2962 * 10543 13697 * 22286 199878 436918
23 1975 17563 * 2502 * 3376 * 11139 12506 * 21656 192854 421891
24 1976 16673 * 2584 * 3893 * 11250 10910 * 17974 168655 365138
25 1977 18376 * 2615 * 4058 * 12240 12599 * 22725 193622 432046
26 1978 19314 * 2728 * 4558 * 13616 13195 * 22923 183991 437187
27 1979 20349 * 3008 * 4300 * 13125 14028 * 22860 168574 430483
28 1980 22149 * 3032 * 5023 * 13595 15194 * 23493 166695 431036
29 1981 22727 * 3272 * 5409 * 13833 14626 * 22996 157540 422059
30 1982 23339 * 3427 * 5427 * 13341 12700 * 21938 142726 375240
# collection of data started in the revised proformae from 2014 * shows the data was not collected under this offence during that period ** sections of crime head have been revised from 2014
Crim
e in In
dia-2
015
8
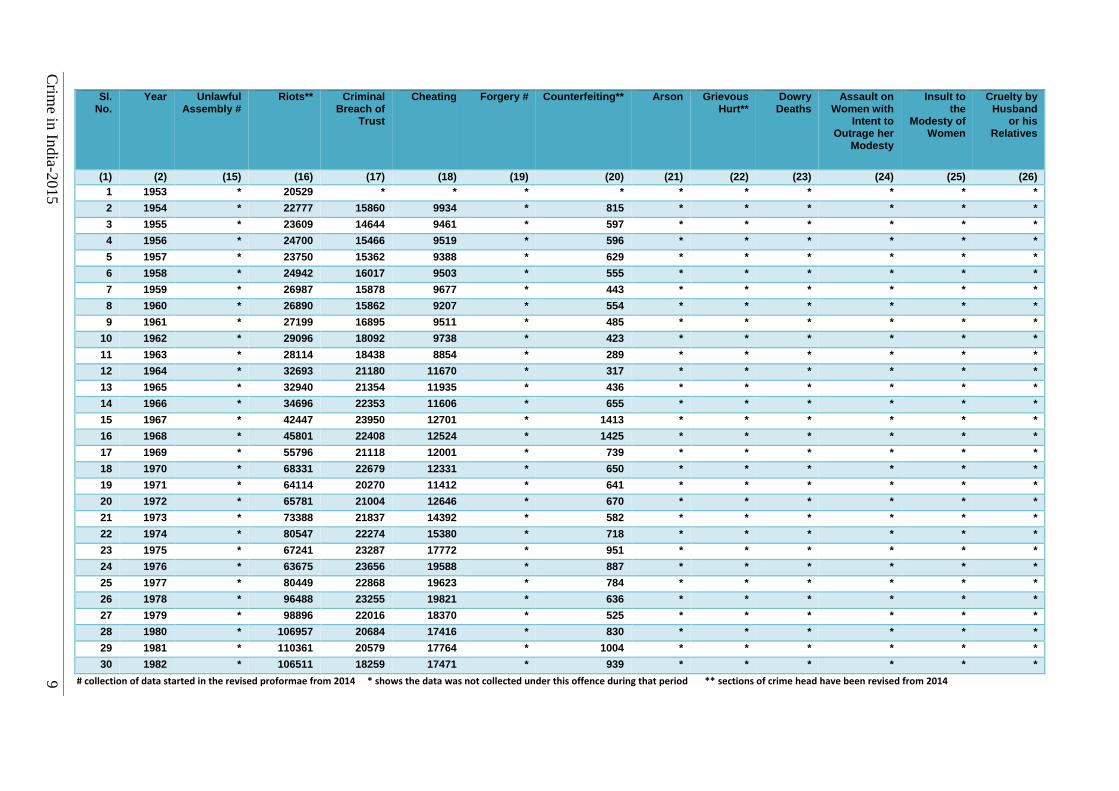
Sl.
No. Year Unlawful
Assembly # Riots** Criminal
Breach of Trust
Cheating Forgery # Counterfeiting** Arson Grievous Hurt**
Dowry Deaths
Assault on Women with
Intent to Outrage her
Modesty
Insult to the
Modesty of Women
Cruelty by Husband
or his Relatives
(1) (2) (15) (16) (17) (18) (19) (20) (21) (22) (23) (24) (25) (26)
1 1953 * 20529 * * * * * * * * * *
2 1954 * 22777 15860 9934 * 815 * * * * * *
3 1955 * 23609 14644 9461 * 597 * * * * * *
4 1956 * 24700 15466 9519 * 596 * * * * * *
5 1957 * 23750 15362 9388 * 629 * * * * * *
6 1958 * 24942 16017 9503 * 555 * * * * * *
7 1959 * 26987 15878 9677 * 443 * * * * * *
8 1960 * 26890 15862 9207 * 554 * * * * * *
9 1961 * 27199 16895 9511 * 485 * * * * * *
10 1962 * 29096 18092 9738 * 423 * * * * * *
11 1963 * 28114 18438 8854 * 289 * * * * * *
12 1964 * 32693 21180 11670 * 317 * * * * * *
13 1965 * 32940 21354 11935 * 436 * * * * * *
14 1966 * 34696 22353 11606 * 655 * * * * * *
15 1967 * 42447 23950 12701 * 1413 * * * * * *
16 1968 * 45801 22408 12524 * 1425 * * * * * *
17 1969 * 55796 21118 12001 * 739 * * * * * *
18 1970 * 68331 22679 12331 * 650 * * * * * *
19 1971 * 64114 20270 11412 * 641 * * * * * *
20 1972 * 65781 21004 12646 * 670 * * * * * *
21 1973 * 73388 21837 14392 * 582 * * * * * *
22 1974 * 80547 22274 15380 * 718 * * * * * *
23 1975 * 67241 23287 17772 * 951 * * * * * *
24 1976 * 63675 23656 19588 * 887 * * * * * *
25 1977 * 80449 22868 19623 * 784 * * * * * *
26 1978 * 96488 23255 19821 * 636 * * * * * *
27 1979 * 98896 22016 18370 * 525 * * * * * *
28 1980 * 106957 20684 17416 * 830 * * * * * *
29 1981 * 110361 20579 17764 * 1004 * * * * * *
30 1982 * 106511 18259 17471 * 939 * * * * * *
# collection of data started in the revised proformae from 2014 * shows the data was not collected under this offence during that period ** sections of crime head have been revised from 2014
Crim
e in In
dia-2
015
9
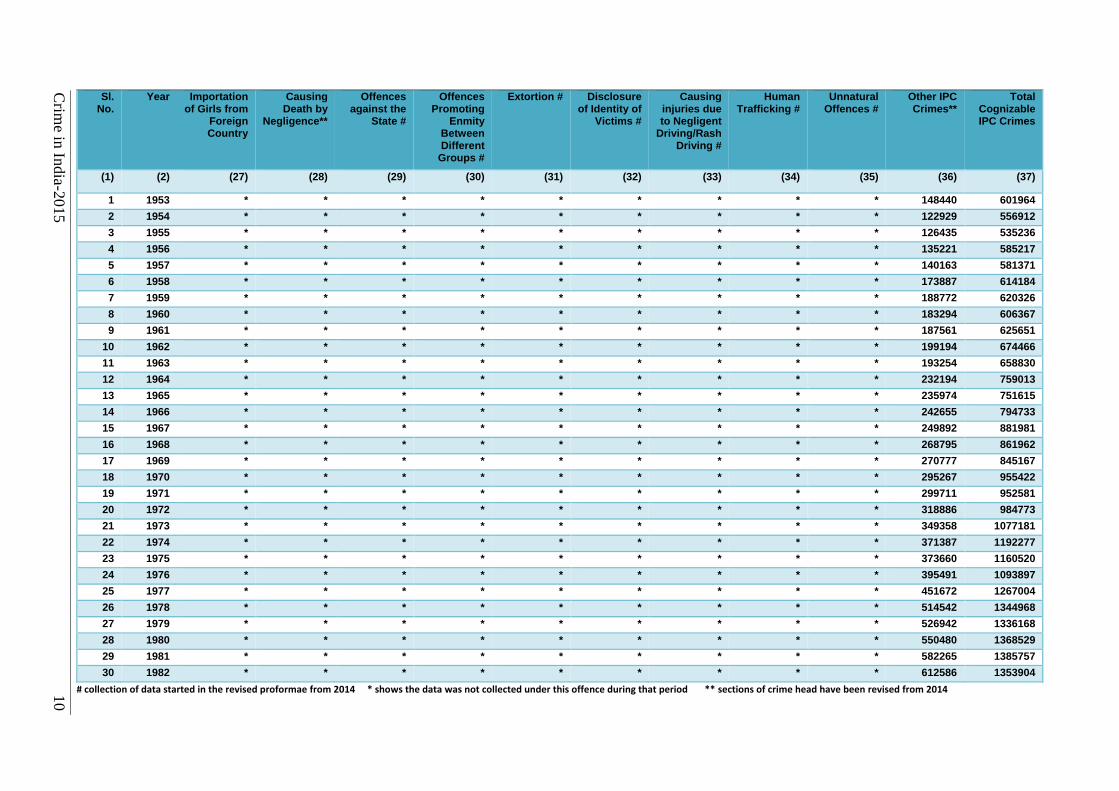
Sl.
No. Year Importation
of Girls from Foreign Country
Causing Death by
Negligence**
Offences against the
State #
Offences Promoting
Enmity Between Different
Groups #
Extortion # Disclosure of Identity of
Victims #
Causing injuries due to Negligent
Driving/Rash Driving #
Human Trafficking #
Unnatural Offences #
Other IPC Crimes**
Total Cognizable IPC Crimes
(1) (2) (27) (28) (29) (30) (31) (32) (33) (34) (35) (36) (37)
1 1953 * * * * * * * * * 148440 601964
2 1954 * * * * * * * * * 122929 556912
3 1955 * * * * * * * * * 126435 535236
4 1956 * * * * * * * * * 135221 585217
5 1957 * * * * * * * * * 140163 581371
6 1958 * * * * * * * * * 173887 614184
7 1959 * * * * * * * * * 188772 620326
8 1960 * * * * * * * * * 183294 606367
9 1961 * * * * * * * * * 187561 625651
10 1962 * * * * * * * * * 199194 674466
11 1963 * * * * * * * * * 193254 658830
12 1964 * * * * * * * * * 232194 759013
13 1965 * * * * * * * * * 235974 751615
14 1966 * * * * * * * * * 242655 794733
15 1967 * * * * * * * * * 249892 881981
16 1968 * * * * * * * * * 268795 861962
17 1969 * * * * * * * * * 270777 845167
18 1970 * * * * * * * * * 295267 955422
19 1971 * * * * * * * * * 299711 952581
20 1972 * * * * * * * * * 318886 984773
21 1973 * * * * * * * * * 349358 1077181
22 1974 * * * * * * * * * 371387 1192277
23 1975 * * * * * * * * * 373660 1160520
24 1976 * * * * * * * * * 395491 1093897
25 1977 * * * * * * * * * 451672 1267004
26 1978 * * * * * * * * * 514542 1344968
27 1979 * * * * * * * * * 526942 1336168
28 1980 * * * * * * * * * 550480 1368529
29 1981 * * * * * * * * * 582265 1385757
30 1982 * * * * * * * * * 612586 1353904
# collection of data started in the revised proformae from 2014 * shows the data was not collected under this offence during that period ** sections of crime head have been revised from 2014
Crim
e in In
dia-2
015
1
0
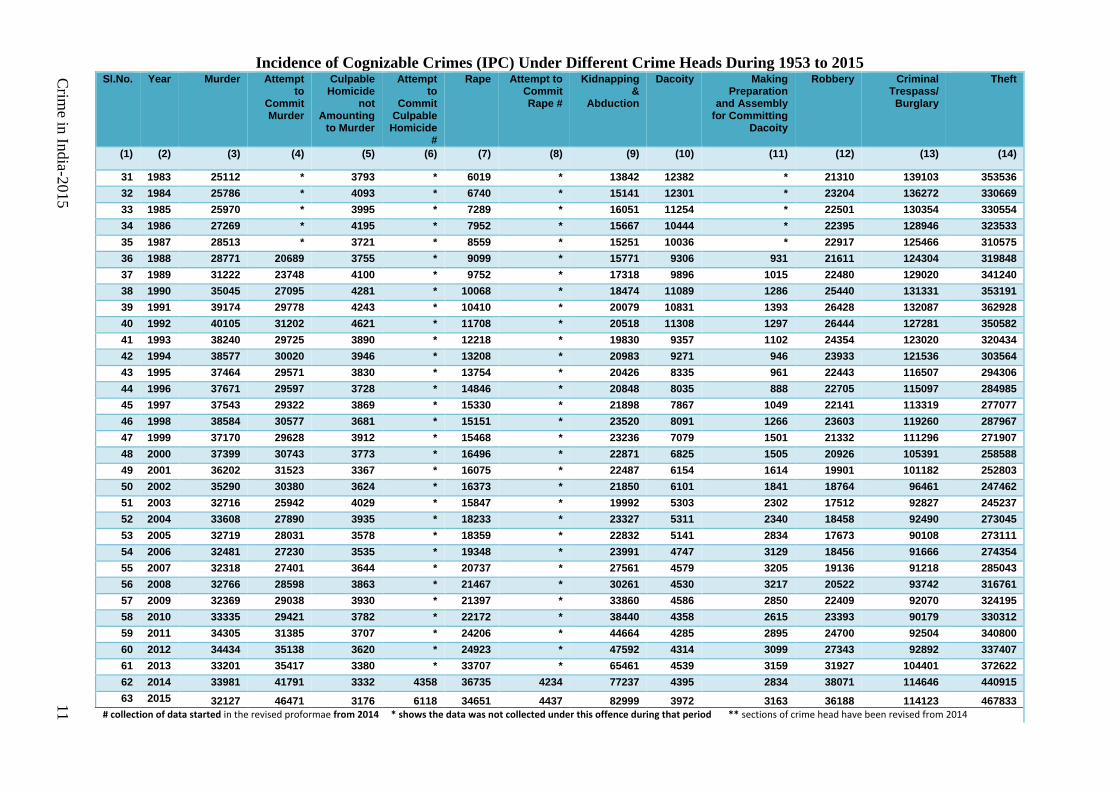
Incidence of Cognizable Crimes (IPC) Under Different Crime Heads During 1953 to 2015 Sl.No. Year Murder Attempt
to Commit Murder
Culpable Homicide
not Amounting
to Murder
Attempt to
Commit Culpable
Homicide #
Rape Attempt to Commit Rape #
Kidnapping &
Abduction
Dacoity Making Preparation
and Assembly for Committing
Dacoity
Robbery Criminal Trespass/
Burglary
Theft
(1) (2) (3) (4) (5) (6) (7) (8) (9) (10) (11) (12) (13) (14)
31 1983 25112 * 3793 * 6019 * 13842 12382 * 21310 139103 353536
32 1984 25786 * 4093 * 6740 * 15141 12301 * 23204 136272 330669
33 1985 25970 * 3995 * 7289 * 16051 11254 * 22501 130354 330554
34 1986 27269 * 4195 * 7952 * 15667 10444 * 22395 128946 323533
35 1987 28513 * 3721 * 8559 * 15251 10036 * 22917 125466 310575
36 1988 28771 20689 3755 * 9099 * 15771 9306 931 21611 124304 319848
37 1989 31222 23748 4100 * 9752 * 17318 9896 1015 22480 129020 341240
38 1990 35045 27095 4281 * 10068 * 18474 11089 1286 25440 131331 353191
39 1991 39174 29778 4243 * 10410 * 20079 10831 1393 26428 132087 362928
40 1992 40105 31202 4621 * 11708 * 20518 11308 1297 26444 127281 350582
41 1993 38240 29725 3890 * 12218 * 19830 9357 1102 24354 123020 320434
42 1994 38577 30020 3946 * 13208 * 20983 9271 946 23933 121536 303564
43 1995 37464 29571 3830 * 13754 * 20426 8335 961 22443 116507 294306
44 1996 37671 29597 3728 * 14846 * 20848 8035 888 22705 115097 284985
45 1997 37543 29322 3869 * 15330 * 21898 7867 1049 22141 113319 277077
46 1998 38584 30577 3681 * 15151 * 23520 8091 1266 23603 119260 287967
47 1999 37170 29628 3912 * 15468 * 23236 7079 1501 21332 111296 271907
48 2000 37399 30743 3773 * 16496 * 22871 6825 1505 20926 105391 258588
49 2001 36202 31523 3367 * 16075 * 22487 6154 1614 19901 101182 252803
50 2002 35290 30380 3624 * 16373 * 21850 6101 1841 18764 96461 247462
51 2003 32716 25942 4029 * 15847 * 19992 5303 2302 17512 92827 245237
52 2004 33608 27890 3935 * 18233 * 23327 5311 2340 18458 92490 273045
53 2005 32719 28031 3578 * 18359 * 22832 5141 2834 17673 90108 273111
54 2006 32481 27230 3535 * 19348 * 23991 4747 3129 18456 91666 274354
55 2007 32318 27401 3644 * 20737 * 27561 4579 3205 19136 91218 285043
56 2008 32766 28598 3863 * 21467 * 30261 4530 3217 20522 93742 316761
57 2009 32369 29038 3930 * 21397 * 33860 4586 2850 22409 92070 324195
58 2010 33335 29421 3782 * 22172 * 38440 4358 2615 23393 90179 330312
59 2011 34305 31385 3707 * 24206 * 44664 4285 2895 24700 92504 340800
60 2012 34434 35138 3620 * 24923 * 47592 4314 3099 27343 92892 337407
61 2013 33201 35417 3380 * 33707 * 65461 4539 3159 31927 104401 372622
62 2014 33981 41791 3332 4358 36735 4234 77237 4395 2834 38071 114646 440915
63 2015 32127 46471 3176 6118 34651 4437 82999 3972 3163 36188 114123 467833
# collection of data started in the revised proformae from 2014 * shows the data was not collected under this offence during that period ** sections of crime head have been revised from 2014
Crim
e in In
dia-2
015
11
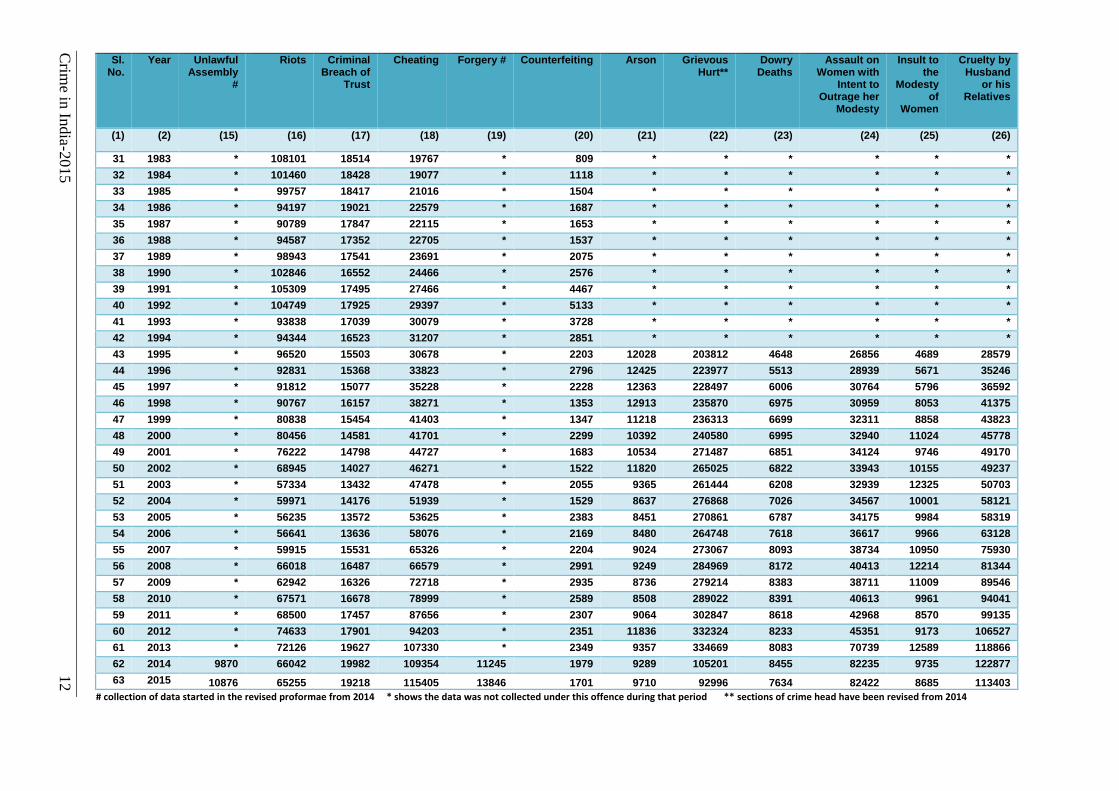
Sl. No.
Year Unlawful Assembly
#
Riots Criminal Breach of
Trust
Cheating Forgery # Counterfeiting Arson Grievous Hurt**
Dowry Deaths
Assault on Women with
Intent to Outrage her
Modesty
Insult to the
Modesty of
Women
Cruelty by Husband
or his Relatives
(1) (2) (15) (16) (17) (18) (19) (20) (21) (22) (23) (24) (25) (26)
31 1983 * 108101 18514 19767 * 809 * * * * * *
32 1984 * 101460 18428 19077 * 1118 * * * * * *
33 1985 * 99757 18417 21016 * 1504 * * * * * *
34 1986 * 94197 19021 22579 * 1687 * * * * * *
35 1987 * 90789 17847 22115 * 1653 * * * * * *
36 1988 * 94587 17352 22705 * 1537 * * * * * *
37 1989 * 98943 17541 23691 * 2075 * * * * * *
38 1990 * 102846 16552 24466 * 2576 * * * * * *
39 1991 * 105309 17495 27466 * 4467 * * * * * *
40 1992 * 104749 17925 29397 * 5133 * * * * * *
41 1993 * 93838 17039 30079 * 3728 * * * * * *
42 1994 * 94344 16523 31207 * 2851 * * * * * *
43 1995 * 96520 15503 30678 * 2203 12028 203812 4648 26856 4689 28579
44 1996 * 92831 15368 33823 * 2796 12425 223977 5513 28939 5671 35246
45 1997 * 91812 15077 35228 * 2228 12363 228497 6006 30764 5796 36592
46 1998 * 90767 16157 38271 * 1353 12913 235870 6975 30959 8053 41375
47 1999 * 80838 15454 41403 * 1347 11218 236313 6699 32311 8858 43823
48 2000 * 80456 14581 41701 * 2299 10392 240580 6995 32940 11024 45778
49 2001 * 76222 14798 44727 * 1683 10534 271487 6851 34124 9746 49170
50 2002 * 68945 14027 46271 * 1522 11820 265025 6822 33943 10155 49237
51 2003 * 57334 13432 47478 * 2055 9365 261444 6208 32939 12325 50703
52 2004 * 59971 14176 51939 * 1529 8637 276868 7026 34567 10001 58121
53 2005 * 56235 13572 53625 * 2383 8451 270861 6787 34175 9984 58319
54 2006 * 56641 13636 58076 * 2169 8480 264748 7618 36617 9966 63128
55 2007 * 59915 15531 65326 * 2204 9024 273067 8093 38734 10950 75930
56 2008 * 66018 16487 66579 * 2991 9249 284969 8172 40413 12214 81344
57 2009 * 62942 16326 72718 * 2935 8736 279214 8383 38711 11009 89546
58 2010 * 67571 16678 78999 * 2589 8508 289022 8391 40613 9961 94041
59 2011 * 68500 17457 87656 * 2307 9064 302847 8618 42968 8570 99135
60 2012 * 74633 17901 94203 * 2351 11836 332324 8233 45351 9173 106527
61 2013 * 72126 19627 107330 * 2349 9357 334669 8083 70739 12589 118866
62 2014 9870 66042 19982 109354 11245 1979 9289 105201 8455 82235 9735 122877
63 2015 10876 65255 19218 115405 13846 1701 9710 92996 7634 82422 8685 113403
# collection of data started in the revised proformae from 2014 * shows the data was not collected under this offence during that period ** sections of crime head have been revised from 2014
Crim
e in In
dia-2
015
12
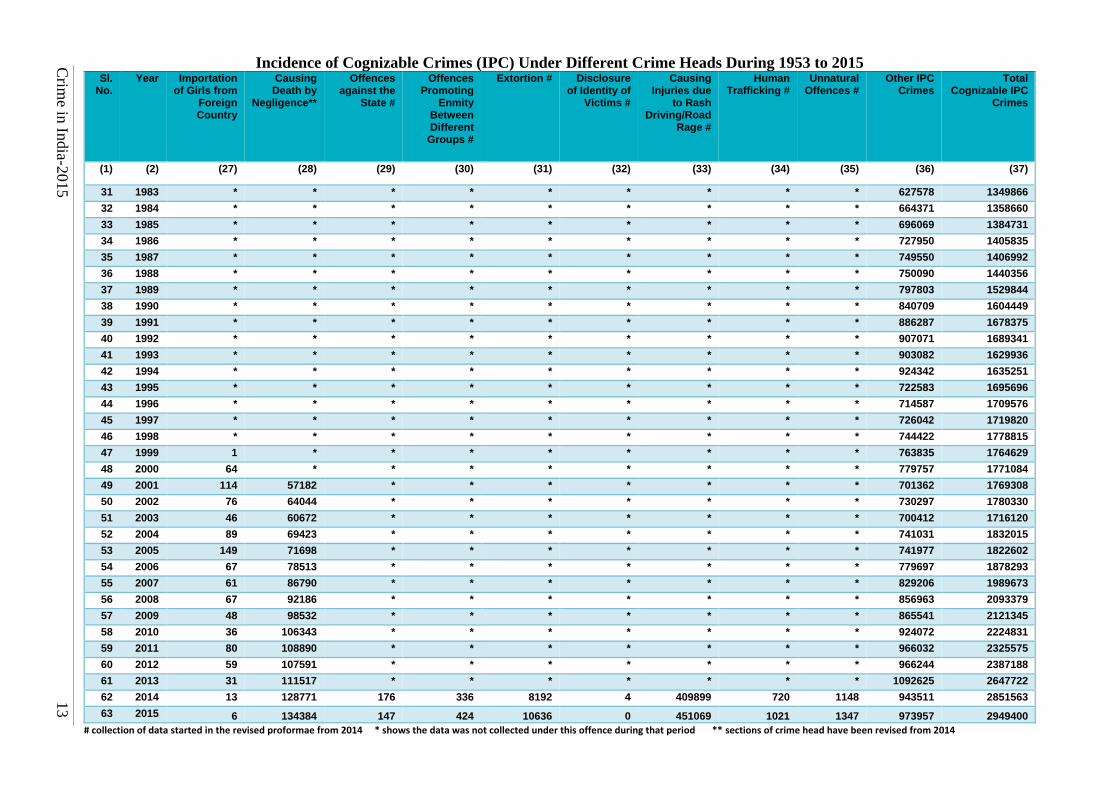
Incidence of Cognizable Crimes (IPC) Under Different Crime Heads During 1953 to 2015
Sl. No.
Year Importation of Girls from
Foreign Country
Causing Death by
Negligence**
Offences against the
State #
Offences Promoting
Enmity Between Different
Groups #
Extortion # Disclosure of Identity of
Victims #
Causing Injuries due
to Rash Driving/Road
Rage #
Human Trafficking #
Unnatural Offences #
Other IPC Crimes
Total Cognizable IPC
Crimes
(1) (2) (27) (28) (29) (30) (31) (32) (33) (34) (35) (36) (37)
31 1983 * * * * * * * * * 627578 1349866
32 1984 * * * * * * * * * 664371 1358660
33 1985 * * * * * * * * * 696069 1384731
34 1986 * * * * * * * * * 727950 1405835
35 1987 * * * * * * * * * 749550 1406992
36 1988 * * * * * * * * * 750090 1440356
37 1989 * * * * * * * * * 797803 1529844
38 1990 * * * * * * * * * 840709 1604449
39 1991 * * * * * * * * * 886287 1678375
40 1992 * * * * * * * * * 907071 1689341
41 1993 * * * * * * * * * 903082 1629936
42 1994 * * * * * * * * * 924342 1635251
43 1995 * * * * * * * * * 722583 1695696
44 1996 * * * * * * * * * 714587 1709576
45 1997 * * * * * * * * * 726042 1719820
46 1998 * * * * * * * * * 744422 1778815
47 1999 1 * * * * * * * * 763835 1764629
48 2000 64 * * * * * * * * 779757 1771084
49 2001 114 57182 * * * * * * * 701362 1769308
50 2002 76 64044 * * * * * * * 730297 1780330
51 2003 46 60672 * * * * * * * 700412 1716120
52 2004 89 69423 * * * * * * * 741031 1832015
53 2005 149 71698 * * * * * * * 741977 1822602
54 2006 67 78513 * * * * * * * 779697 1878293
55 2007 61 86790 * * * * * * * 829206 1989673
56 2008 67 92186 * * * * * * * 856963 2093379
57 2009 48 98532 * * * * * * * 865541 2121345
58 2010 36 106343 * * * * * * * 924072 2224831
59 2011 80 108890 * * * * * * * 966032 2325575
60 2012 59 107591 * * * * * * * 966244 2387188
61 2013 31 111517 * * * * * * * 1092625 2647722
62 2014 13 128771 176 336 8192 4 409899 720 1148 943511 2851563
63 2015 6 134384 147 424 10636 0 451069 1021 1347 973957 2949400
# collection of data started in the revised proformae from 2014 * shows the data was not collected under this offence during that period ** sections of crime head have been revised from 2014
Crim
e in In
dia-2
015
13
Crim
e in In
dia-2
015
14
Crime in India-2015 15
Chapter - 1
Executive Summary
Introduction
NCRB collects, collates, compiles and
publishes the police recorded criminal cases
only on annual basis. There could be
incidents in which the affected individuals
might not have reported the crime to police or
if reported police might not have registered
the case, such incidents are not captured in
the data. NCRB under overall supervision of
Ministry of Affairs and in consultation with
concerned Central Ministries and State
Governments has revised the data collection
proformae in 2014. Statistical data for this
annual report is collected using a set of 24
standardised proformae.
The Criminal Procedure Code (Cr.P.C.)
classifies all the crimes into two categories:
(i) Cognizable - Sec.2(c) Cr.P.C.
(ii) Non-cognizable - Sec.2(l) Cr.P.C.
Cognizable Crimes
A cognizable offence or case is defined as the one which an officer in-charge of a police station may investigate without the order of a magistrate and effect arrest without warrant. The police have a direct responsibility to take immediate action on the receipt of a complaint or of credible information relating to such crimes, visit the scene of the crime, investigate the facts, apprehend the offender and arraign him before a court of law having jurisdiction over the matter. Cognizable crimes are broadly categorised as those falling either under the ‘Indian Penal Code (IPC)’ or under the ‘Special and Local Laws (SLL)’.
Non-Cognizable Crimes
Non-Cognizable crimes are defined as those which cannot be investigated by police without the order of a competent magistrate. Police do not initiate investigation in non-cognizable crimes except with magisterial permission. First Schedule of the Cr.P.C. gives the classification of the offences of the
IPC into cognizable & non-cognizable categories. Broad Classification of Crimes under the Indian Penal Code (IPC)
i) IPC Crimes against Body: Murder,
Attempt to commit murder, Culpable
homicide not amounting to murder,
Attempt to commit Culpable Homicide,
Kidnapping & Abduction, Grievous hurt,
Causing death by negligence, Causing
injuries due to rash driving/road rage and
Human trafficking(under Section
370/370A IPC);
ii) IPC Crimes under Sexual Offences:
Rape, Attempt to commit rape, Assault
on women with intent to outrage her
modesty and Insult to modesty of women;
iii) IPC Crimes relating to Property
Offences: Dacoity, Making preparation
and assembly for committing dacoity,
Robbery, Criminal trespass/ Burglary and
Theft;
iv) IPC Crimes relating to Public Order:
Riots, Arson, Unlawful assembly and
Offences promoting enmity between
different groups;
v) IPC Crimes relating to Economic
Crimes: Criminal breach of trust,
Cheating, Forgery and Counterfeiting;
vi) Human Trafficking: Cases under section
370/370A of IPC, procuration of minors,
Importation of girls from foreign country,
Selling & Buying of minors for
prostitution.
vii) IPC Crimes relating to Offences
against the State: Offences against the
State under section 121, 124A IPC and
Promoting enmity between different
groups
viii) Crime against Children: Foeticide,
Infanticide, Procuration of minors,
Murder, Exposure and abandonment,
Crime in India-2015 16
Offences under the POCSO Act, the
Prohibition of Child Marriage Act etc.
ix) Crime against Women: Rape, Assault
on women with intent to outrage her
modesty, Insult to the modesty of women,
Cruelty by husband or relatives etc.
x) Crime against SCs & STs: Cases under
Protection of Civil Rights Act, the
SC/ST(PoA) Act etc.
xi) Other Crimes
Crimes under the Special and Local Laws (SLL)
1. Arms Act, 1959;
2. Narcotic Drugs & Psychotropic
Substances Act, 1985;
3. Gambling Act, 1867;
4. Excise Act, 1944;
5. Prohibition Act;
6. Explosives & Explosive Substances
Act, 1884 & 1908;
7. Immoral Traffic (Prevention) Act, 1956;
8. Indian Railways Act, 1989;
9. The Foreigners Act, 1946;
10. Protection of Civil Rights Act, 1955;
11. Indian Passport Act, 1967;
12. Essential Commodities Act, 1955;
13. Antiquities & Art Treasures Act, 1972;
14. Dowry Prohibition Act, 1961;
15. Prohibition of Child Marriage Act 2006;
16. Indecent Representation of Women
(Prohibition) Act, 1986;
17. Copyright Act, 1957;
18. Commission of Sati Prevention Act,
1987;
19. SC/ST (Prevention of Atrocities) Act,
1989;
20. Forest Act, 1927;
21. Registration of Foreigners Act, 1939
22. Protection of Women from Domestic
Violence Act, 2005
23. Information Technology Act, 2000
24. Official Secret Act, 1923
25. Electricity Act, 2003
26. Wildlife Protection Act, 1972
27. Bonded Labour System(Abolition) Act,
1976
28. Environment (Protection) Act, 1986
29. Air (Prevention & Control of Pollution)
Act,1981
30. Water (Prevention & Control of
Pollution) Act, 1974
31. National Security Act, 1980
32. Unlawful Activities (Prevention) Act,
1967
33. Young Persons (Harmful Publication)
Act, 1956
34. Railways Property (Unlawful
Possession) Act, 1966
35. Prevention of Damage to Public
Property Act, 1984
36. Transplantation of Human Organ Act,
1994
37. Trade Marks Act, 1999
38. Prevention of Insult to National Honour
Act, 1971
39. State Emblem (Prevention of Improper
Use) Act, 2005
40. Lotteries (Regulation) Act, 1998
41. Citizenship Act, 1955
42. Place of Worship (Special Provision)
Act, 1991
43. Religious Institution (Prevention of
Misuse) Act, 1988
44. Representation of People Act, 1951
45. Emigration Act, 1983
46. Juveniles Justice (Care and Protection
of Children) Act, 2000
47. Infant Substitutes Regulation Act,
2003
48. Anti- Hijacking Act, 1982
49. Atomic Energy Act, 1962
50. Weapon of Mass Destruction
(Prohibition of Unlawful Activities) Act,
2005
51. Suppression of Unlawful Acts against
Safety of Civil Aviation Act, 1982
52. Safety of Maritime Navigation Act,
2002
53. Others.
Details of crime classification and
crime heads are given in ‘Crime in India’
proformae, available on website
http://ncrb.gov.in .
Complaints Received by Police
NCRB is collecting data on nature and
types of crime related complaints received by
police. The nature and number of crime
related complaints vis-à-vis actual number of
cognizable crimes registered by Police are
presented in Table-1.1.
A total of 1,68,25,687 complaints
were received by police in the country during
the year 2015 as compared to 1,30,27,600
complaints received during the year 2014
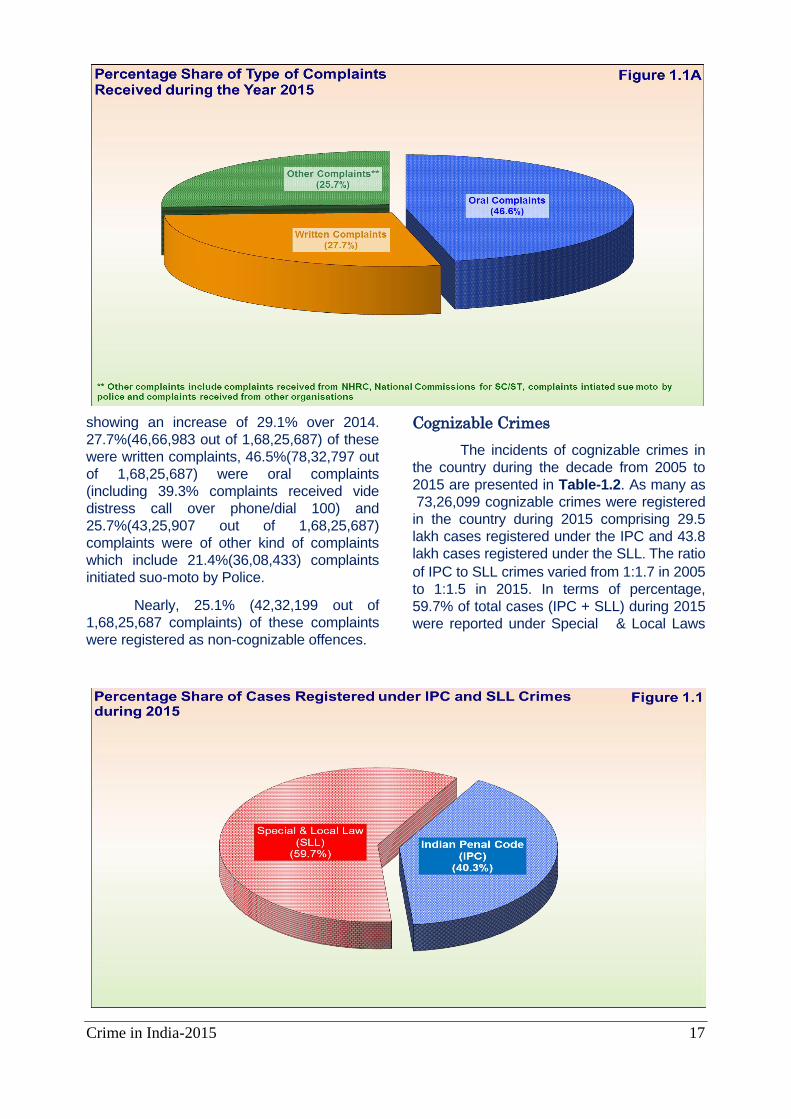
Crime in India-2015 17
showing an increase of 29.1% over 2014.
27.7%(46,66,983 out of 1,68,25,687) of these
were written complaints, 46.5%(78,32,797 out
of 1,68,25,687) were oral complaints
(including 39.3% complaints received vide
distress call over phone/dial 100) and
25.7%(43,25,907 out of 1,68,25,687)
complaints were of other kind of complaints
which include 21.4%(36,08,433) complaints
initiated suo-moto by Police.
Nearly, 25.1% (42,32,199 out of
1,68,25,687 complaints) of these complaints
were registered as non-cognizable offences.
Cognizable Crimes
The incidents of cognizable crimes in
the country during the decade from 2005 to
2015 are presented in Table-1.2. As many as
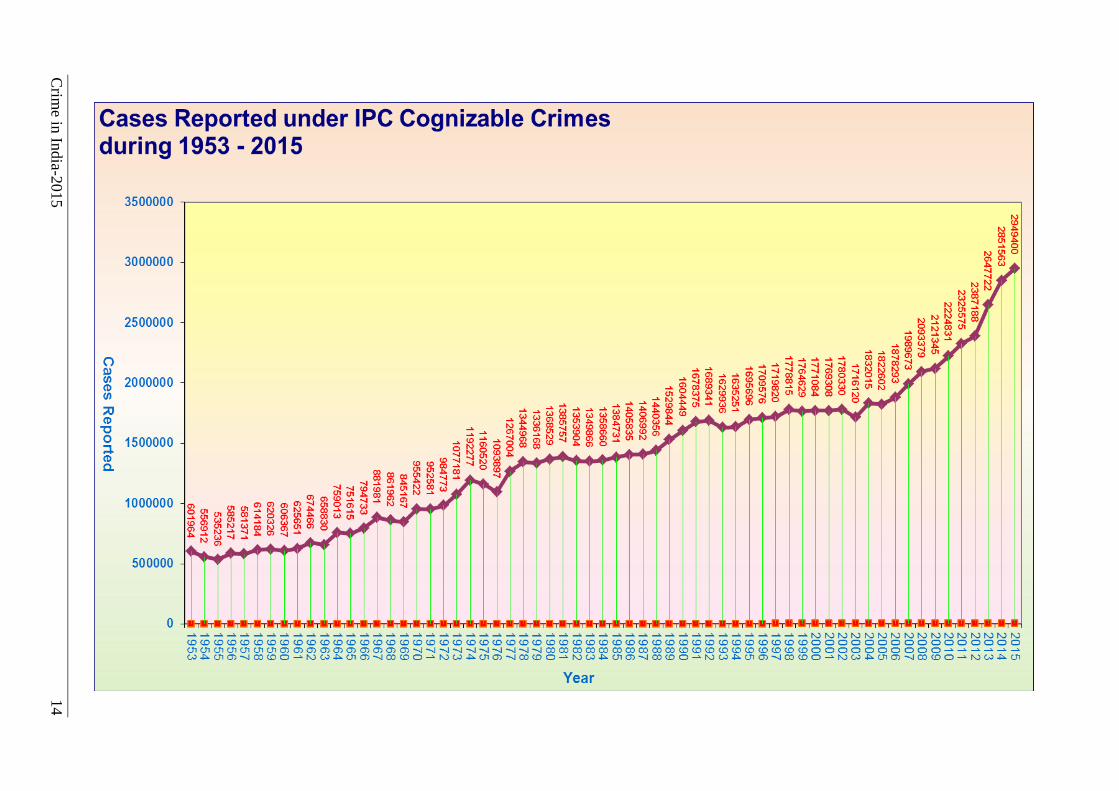
73,26,099 cognizable crimes were registered
in the country during 2015 comprising 29.5
lakh cases registered under the IPC and 43.8
lakh cases registered under the SLL. The ratio
of IPC to SLL crimes varied from 1:1.7 in 2005
to 1:1.5 in 2015. In terms of percentage,
59.7% of total cases (IPC + SLL) during 2015
were reported under Special & Local Laws
Crime in India-2015 18
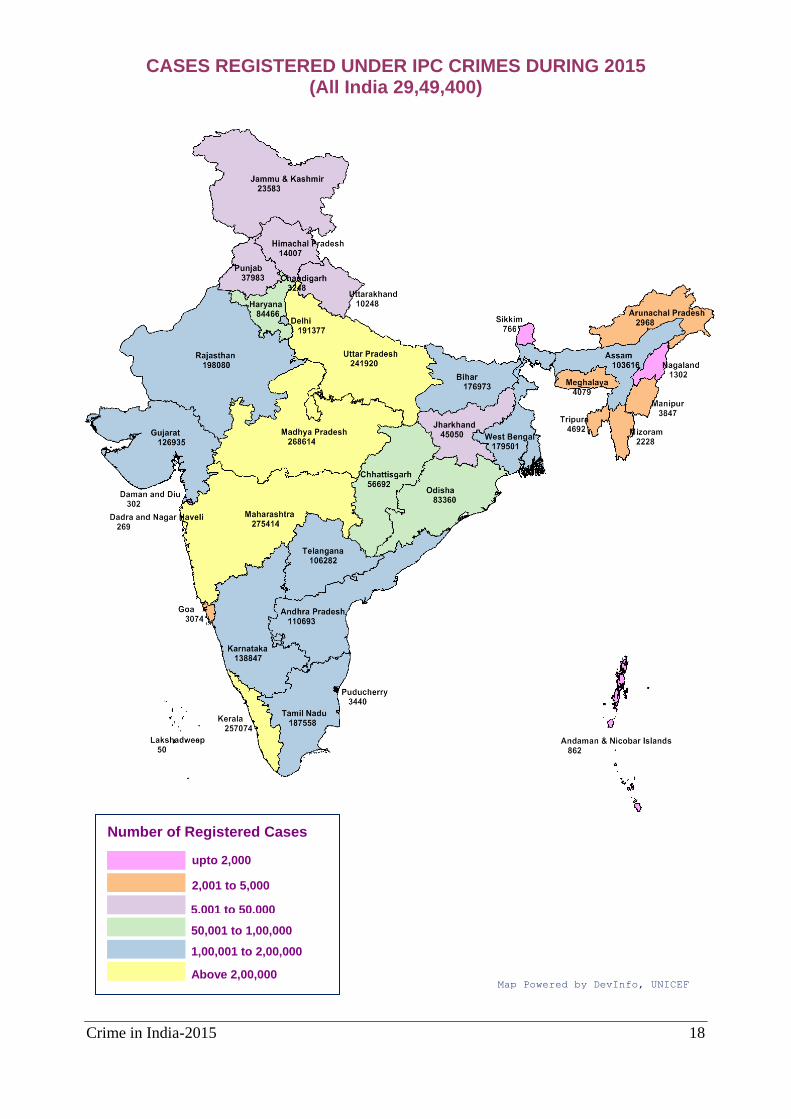
CASES REGISTERED UNDER IPC CRIMES DURING 2015 (All India 29,49,400)
Number of Registered Cases
upto 2,000
5,001 to 50,000
Above 2,00,000 Map Powered by DevInfo, UNICEF
2,001 to 5,000
50,001 to 1,00,000
1,00,001 to 2,00,000
Crime in India-2015 19
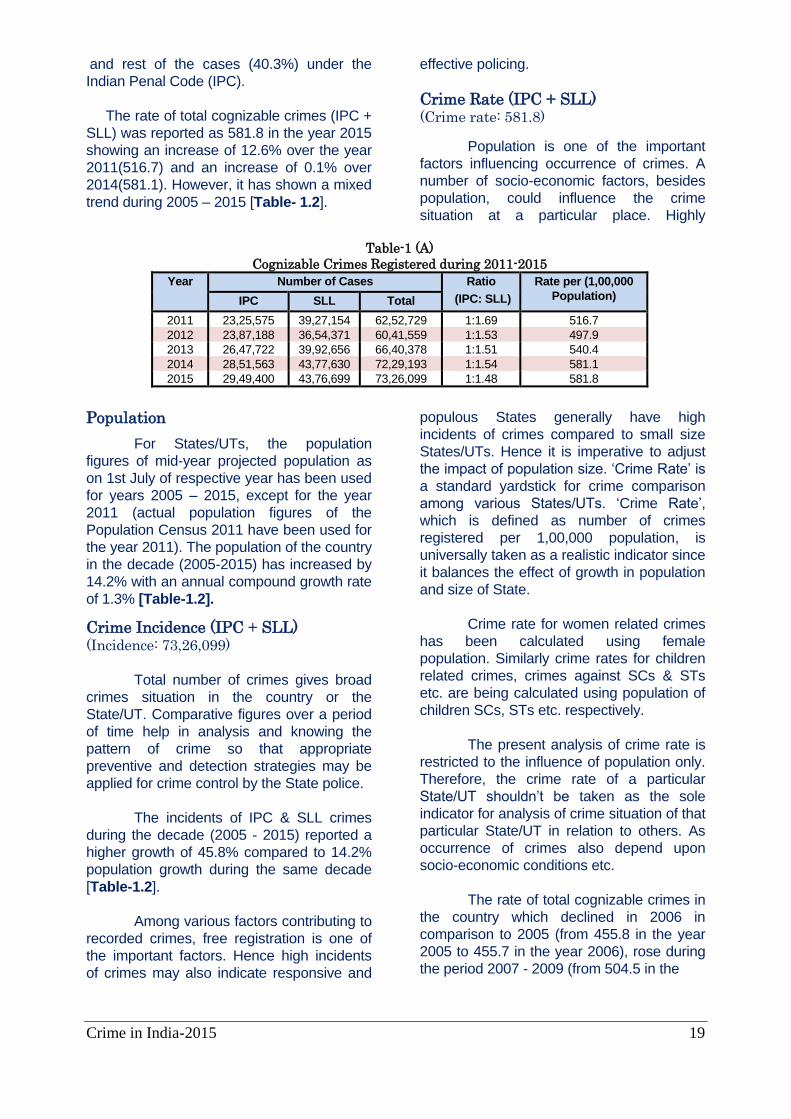
Table-1 (A)
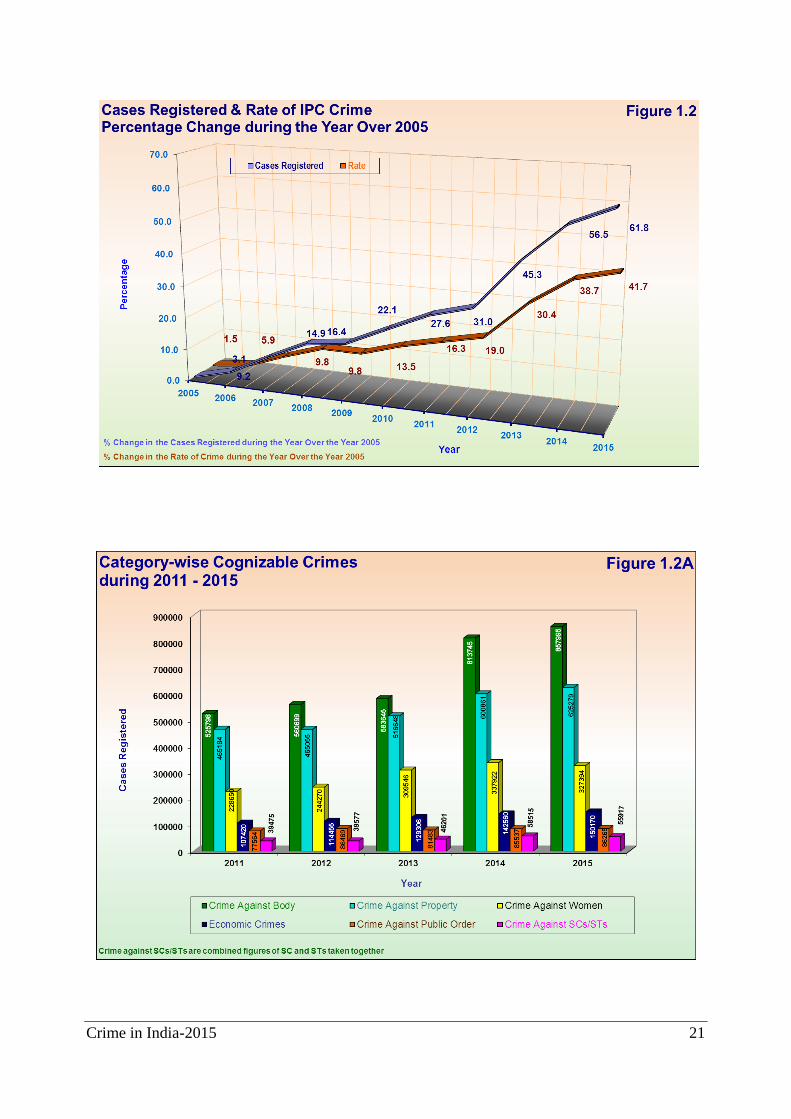
Cognizable Crimes Registered during 2011-2015
Year Number of Cases Ratio
(IPC: SLL)
Rate per (1,00,000
Population) IPC SLL Total
2011 23,25,575 39,27,154 62,52,729 1:1.69 516.7
2012 23,87,188 36,54,371 60,41,559 1:1.53 497.9
2013 26,47,722 39,92,656 66,40,378 1:1.51 540.4
2014 28,51,563 43,77,630 72,29,193 1:1.54 581.1
2015 29,49,400 43,76,699 73,26,099 1:1.48 581.8
and rest of the cases (40.3%) under the
Indian Penal Code (IPC).
The rate of total cognizable crimes (IPC +
SLL) was reported as 581.8 in the year 2015
showing an increase of 12.6% over the year
2011(516.7) and an increase of 0.1% over
2014(581.1). However, it has shown a mixed
trend during 2005 – 2015 [Table- 1.2].
Population
For States/UTs, the population
figures of mid-year projected population as
on 1st July of respective year has been used
for years 2005 – 2015, except for the year
2011 (actual population figures of the
Population Census 2011 have been used for
the year 2011). The population of the country
in the decade (2005-2015) has increased by
14.2% with an annual compound growth rate
of 1.3% [Table-1.2].
Crime Incidence (IPC + SLL) (Incidence: 73,26,099)
Total number of crimes gives broad
crimes situation in the country or the
State/UT. Comparative figures over a period
of time help in analysis and knowing the
pattern of crime so that appropriate
preventive and detection strategies may be
applied for crime control by the State police.
The incidents of IPC & SLL crimes
during the decade (2005 - 2015) reported a
higher growth of 45.8% compared to 14.2%
population growth during the same decade
[Table-1.2].
Among various factors contributing to
recorded crimes, free registration is one of
the important factors. Hence high incidents
of crimes may also indicate responsive and
effective policing.
Crime Rate (IPC + SLL) (Crime rate: 581.8)
Population is one of the important
factors influencing occurrence of crimes. A
number of socio-economic factors, besides
population, could influence the crime
situation at a particular place. Highly
populous States generally have high
incidents of crimes compared to small size
States/UTs. Hence it is imperative to adjust
the impact of population size. ‘Crime Rate’ is
a standard yardstick for crime comparison
among various States/UTs. ‘Crime Rate’,
which is defined as number of crimes
registered per 1,00,000 population, is
universally taken as a realistic indicator since
it balances the effect of growth in population
and size of State.
Crime rate for women related crimes
has been calculated using female
population. Similarly crime rates for children
related crimes, crimes against SCs & STs
etc. are being calculated using population of
children SCs, STs etc. respectively.
The present analysis of crime rate is
restricted to the influence of population only.
Therefore, the crime rate of a particular
State/UT shouldn’t be taken as the sole
indicator for analysis of crime situation of that
particular State/UT in relation to others. As
occurrence of crimes also depend upon
socio-economic conditions etc.
The rate of total cognizable crimes in
the country which declined in 2006 in
comparison to 2005 (from 455.8 in the year
2005 to 455.7 in the year 2006), rose during
the period 2007 - 2009 (from 504.5 in the
Crime in India-2015 20
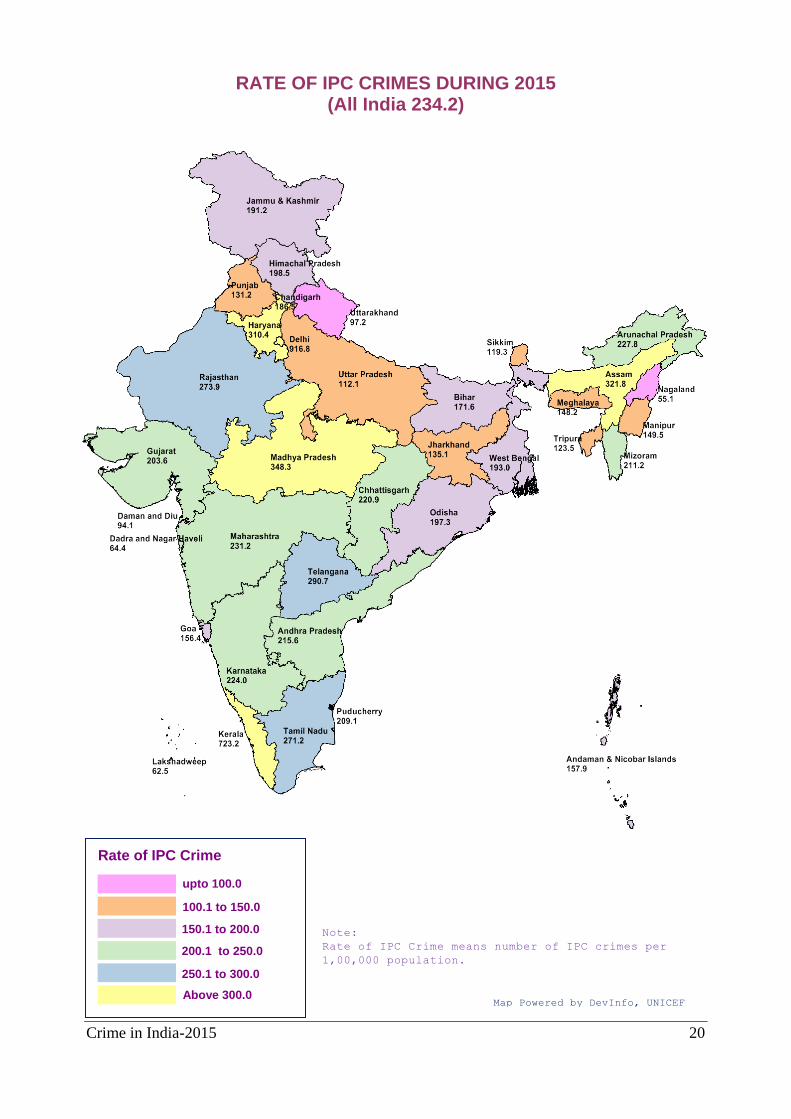
RATE OF IPC CRIMES DURING 2015 (All India 234.2)
Rate of IPC Crime
upto 100.0
150.1 to 200.0
Above 300.0 Map Powered by DevInfo, UNICEF
100.1 to 150.0
200.1 to 250.0
250.1 to 300.0
Note:
Rate of IPC Crime means number of IPC crimes per
1,00,000 population.
Crime in India-2015 21
Crim
e in In
dia-2
015
22
Crim
e in In
dia-2
015
23
Crime in India-2015 24
year 2007 to 570.8 in the year 2009),
thereafter slightly decreased to 569.3 in the
year 2010 which further decreased to 516.7
in 2011 and 497.9 in 2012. It again rose to
540.4 in 2013. During last three years (2013
- 2015), it has shown a rising trend (from
540.4 in the year 2013 to 581.1 in the year
2014 and again rose to 581.8 in 2015). The
crime rate in respect of IPC crimes has
increased by 2.2% during 2015 over 2014,
from 229.2 in the year 2014 to 234.2 in the
year 2015 and for SLL crimes, a decrease of
1.2% was reported during 2015 over 2014
(from 351.9 in 2014 to 347.6 in 2015).
Cases Registered under IPC (Incidence: 29,49,400)
A total of 29,49,400 cases under
various sections of IPC were registered in
the country during the year 2015 against
28,51,563 in the year 2014 recording an
increase of 3.4% in the year 2015 over 2014.
The share of IPC crimes to total cognizable
crimes in percentage terms has increased to
37.2% in 2011 which further increased to
39.5% in 2012 and 39.9% in 2013, however,
it decreased to 39.4% in 2014 thereafter it
again increased to 40.3% in 2015. Thus
showing mixed trend during the five-year
period from 2011 to 2015.
Maharashtra has reported highest
percentage share of total such registered
cases (9.3%) followed by Madhya Pradesh
(9.1%), Kerala (8.7%), Uttar Pradesh (8.2%),
Rajasthan (6.7%), Delhi UT (6.5%), Tamil
Nadu (6.4%), West Bengal (6.1%) and Bihar
(6.0%) in the country during the year 2015.
State/UT-wise cases registered & crime rate
under IPC is presented in Table-1.4.
Crime Rate – IPC (Crime rate: 234.2)
The IPC crime rate has increased by
41.7% during the decade 2005-2015 from
165.3 in the year 2005 to 234.2 in the year
2015. It has increased by 14.7% during the
year 2015 as compared to quinquennial
average (during 2010-2014). An increase of
2.2% was reported in 2015 over 2014. Delhi
(916.8), Kerala (723.2), Madhya Pradesh
(348.4), Assam (321.8), Haryana (310.4),
Telangana (290.7), Rajasthan (273.9) and
Tamil Nadu (271.2) have reported high crime
rate as compared to the national average of
234.2 [Table-1.4].
Trend Analysis IPC Crimes relating Sexual Offences
(Incidence: 1,30,195 Rate: 21.4)
Sexual offences comprise rape,
attempt to commit rape, assault on women
with intent to outrage her modesty and insult
to the modesty of women, as defined in the
beginning of the chapter. A total of 1,30,195
such cases were registered under sexual
offences during 2015. The share of these
crimes to total IPC crimes at the national
level was 4.4% during the year 2015. The
percentage share of these crimes to total
IPC crimes was highest in Lakshadweep
(14.0%) followed by Tripura (13.0%) and
A & N Islands (11.4%) as compared to
national average of 4.4% of total IPC crimes.
Details are presented in Table-1.7. The
crime rate of sexual offences was highest in
Delhi (43.6) followed by Odisha (22.2)
compared to national rate of 21.4.
IPC Crimes against Body
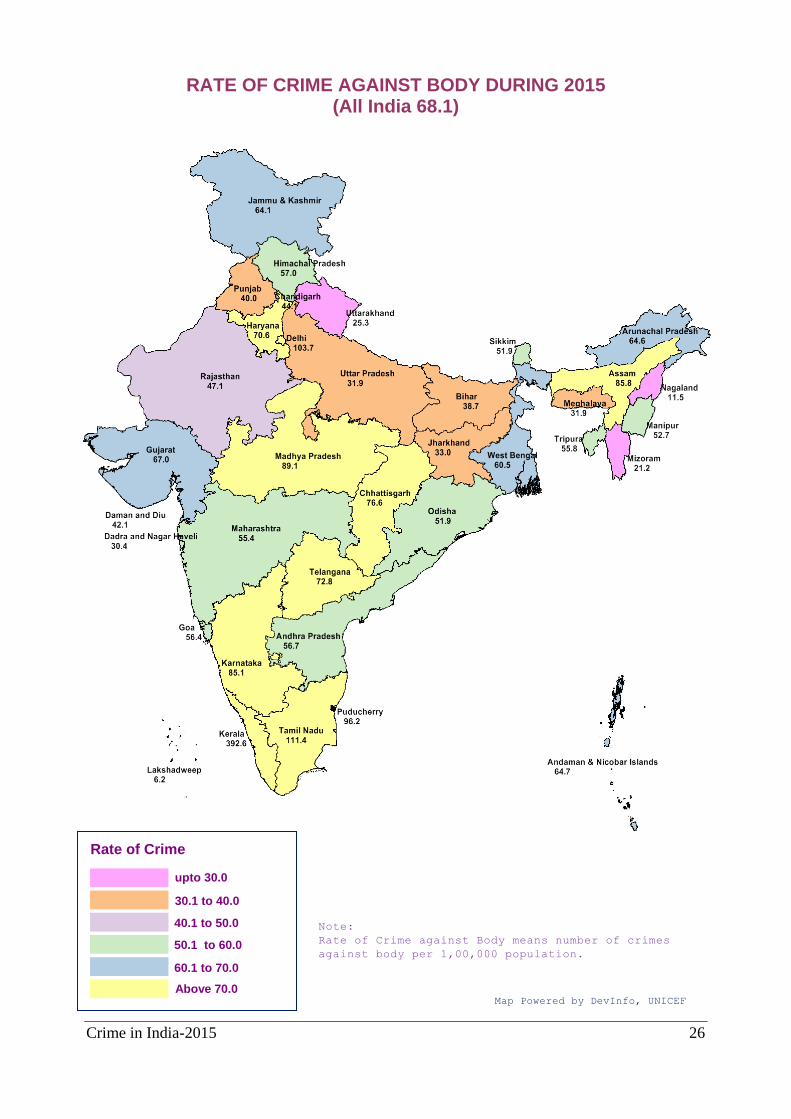
(Incidence: 8,57,995 Rate: 68.1)
Crimes against body comprise
murder, attempt to commit murder, culpable
homicide not amounting to murder, attempt
to commit culpable homicide, kidnapping &
abduction, grievous hurt, causing death by
negligence, causing injuries due to rash
driving/road rage, dowry deaths and human
trafficking (under section 370/370A IPC), as
defined in the beginning of the chapter.
A total of 8,57,995 cases were
registered under crimes against body during
2015. The share of these crimes to total IPC
crimes at the national level was 29.1%
during the year 2015. The share of these
crimes to total IPC crimes was highest in
Kerala (54.3%) as compared to national
average of 29.1% of total IPC crimes. Details
are presented in Table-1.8. The rate of
crimes against body also was highest in
Kerala (392.6) followed by Tamil Nadu
(111.4) and Delhi (103.7) compared to
national rate of 68.1.
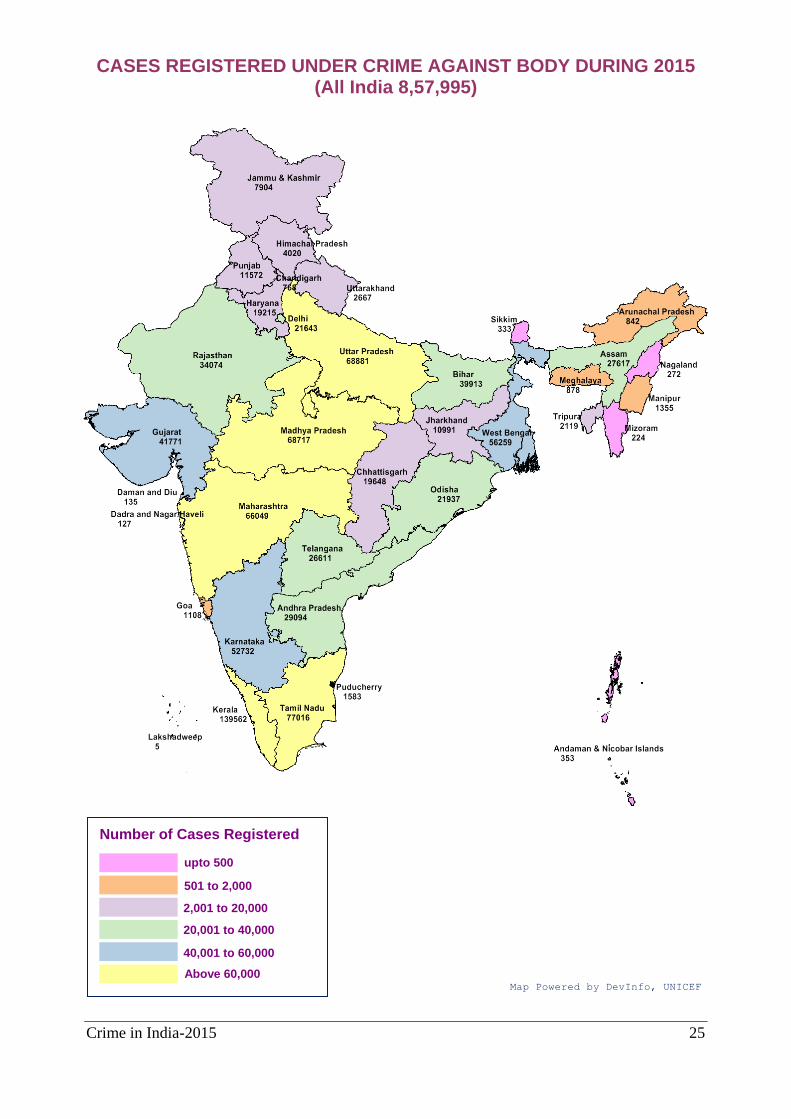
Crime in India-2015 25
CASES REGISTERED UNDER CRIME AGAINST BODY DURING 2015 (All India 8,57,995)
Number of Cases Registered
upto 500
2,001 to 20,000
Above 60,000
501 to 2,000
20,001 to 40,000
40,001 to 60,000
Map Powered by DevInfo, UNICEF
Crime in India-2015 26
RATE OF CRIME AGAINST BODY DURING 2015 (All India 68.1)
Rate of Crime
upto 30.0
40.1 to 50.0
Above 70.0 Map Powered by DevInfo, UNICEF
30.1 to 40.0
50.1 to 60.0
60.1 to 70.0
Note:
Rate of Crime against Body means number of crimes
against body per 1,00,000 population.
Crime in India-2015 27
IPC Crimes relating to Property Offences
(Incidence: 6,25,279 Rate: 49.7)
These crimes comprise dacoity,
making preparation & assembly to commit
dacoity, robbery, criminal trespass/burglary
and theft. A total of 6,25,279 cases were
registered during the year 2015 compared to
6,00,861 such cases registered during the
year 2014, showing an increase of 4.1%.
The share of these crimes to total IPC crimes
at the national level was 21.2% during the
year 2015. The share of these crimes to total
IPC crimes was reported highest in Mizoram
(67.1%) followed by Delhi (65.2%) and
Nagaland (43.5%) compared to national
average of 21.2%. The share of such crimes
in the country shows an increase of 0.5% in
the year 2015 to 2014. Details are presented
in Table-1.9.
IPC Crimes relating to Public Order
(Incidence: 86,265 Rate: 6.9)
Riots, arson, unlawful assembly and
offences promoting enmity between different
groups are the major constituents of crimes
against public order which constitute 2.9% of
total IPC crimes. Number of crimes under
this head has increased by 0.8% (from
85,537 cases in the year 2014 to 86,265
cases in the year 2015) during 2015 over
2014. The rate of such crimes is 6.9 in the
year 2015. The rate of such crime was
reported highest in Kerala at 19.6 followed
by Assam (15.7) and Bihar (13.4) compared
to national average of 6.9. Table-1.10 may
be seen for details.
IPC Economic Crimes
(Incidence: 1,50,170 Rate: 11.9)
These crimes comprise criminal
breach of trust, cheating, forgery and
counterfeiting. The rate of such crimes has
increased from 11.5 in the year 2014 to 11.9
in the year 2015. These crimes have
accounted for 5.1% of the total IPC crimes.
Rajasthan (13.7%) followed by Chandigarh
(11.5%) and Daman & Diu (11.3%) have
reported the highest share of these crimes in
total IPC crimes. Rajasthan has highest
crime rate of 37.4 followed by Delhi UT
(34.2) compared to national average of 11.9.
Table 1.12 may be seen for details.
Trend Analysis - Major IPC crimes
The components of violent crimes
such as murder, attempt to commit murder,
culpable homicide not amounting to murder,
rape, kidnapping & abduction, dacoity, its
preparation & assembly, robbery, riots, arson
and dowry death have been separately
analysed in the Chapter-3 on violent crimes.
The crime head-wise analysis indicating 5
and 10 year trends for remaining crimes are
discussed below.
Criminal Trespass/Burglary (Section 453
to 460 IPC)
(Incidence: 1,14,123 Rate: 9.1)
Cases of criminal trespass/
burglary with 1,14,123 cases in 2015
showed a decrease of 0.5% as compared to
1,14,646 cases in 2014. The trend analysis
of criminal trespass/burglary cases
registered at the national level revealed that
there was an increase in such cases by
26.7% during 2015 as compared to the 2005
level and a rise of 15.4% as compared to the
average of quinquennial years (2010 - 2014)
[Table-1.3].
Maharashtra has reported the
maximum number of such cases among
States/UTs, accounting for 14.5%(16,581 out
of 1,14,123 cases) of such cases at the
national level. On an average, every one
lakh population in the country experienced
nearly 9.1 burglaries/house trespass cases
in the year 2015. The highest rate of 61.6
burglaries per lakh population was reported
from Delhi during the year 2015.
Theft (Sec. 379 to 382 IPC)
(Incidence: 4,67,833 Rate: 37.2)
Theft cases have shown an increase
of 71.3% during the year 2015 in
comparison to the year 2005 and an
increase of 28.4% in the year 2015 as
compared to quinquennial years (2010 to
2014). This increase is 6.1% in the year
2015 compared to the year 2014.
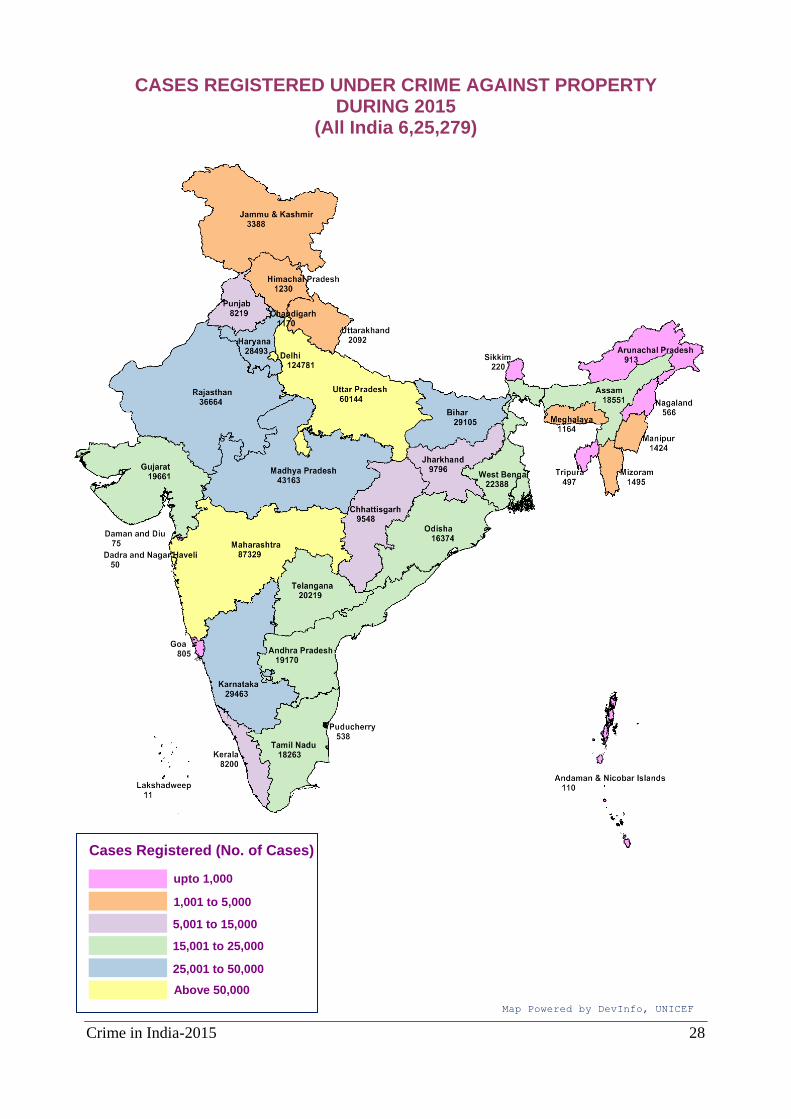
Crime in India-2015 28
CASES REGISTERED UNDER CRIME AGAINST PROPERTY DURING 2015
(All India 6,25,279)
Cases Registered (No. of Cases)
upto 1,000
5,001 to 15,000
Above 50,000
Map Powered by DevInfo, UNICEF
1,001 to 5,000
15,001 to 25,000
25,001 to 50,000
Crime in India-2015 29
Delhi UT has registered highest
number of theft cases i.e. 1,04,432 cases
during the year 2015 which accounted for
22.3% of the total thefts cases registered in
the country. On an average, 37 theft cases
were registered for every 1,00,000
population in the country during 2015. Delhi
has reported highest rate of thefts cases at
500.3 followed by Mizoram (81.0) and
Haryana (75.7) during the year 2015.
‘Auto theft’ has accounted for 42.6%
(1,99,127 cases) of the total theft cases and
there was an increase of 7.3% in the year
2015 in comparison to the year 2014
(1,85,626 cases). Theft other than
automobile has shown an increase of 5.2%
(from 2,55,289 in 2014 to 2,68,706 in 2015)
during 2015 over 2014. The maximum auto
thefts were registered in Delhi UT (32,729
cases) followed by Uttar Pradesh (29,846
cases), Maharashtra (21,468 cases),
Rajasthan (18,141 cases) and Haryana
(14,331 cases), accounting for 16.4%,
15.0%, 10.8%, 9.1% and 7.2% of total such
cases registered at all India level
respectively. Delhi UT has reported much
higher rate at 156.8 as compared to the
national rate of 15.8 of auto thefts per
1,00,000 population.
Criminal Breach of Trust (Sec. 406-409
IPC) (Incidence: 19,218 Rate: 1.5)
A total of 19,218 cases of criminal
breach of trust were registered in the country
during the year 2015 which were 3.8% less
than those of the year 2014 (19,982 cases).
An increase of 41.6% from the 2005 level
and an increase of 4.9% from the average
of quinquennial years (2010 - 2014) were
reported as per 10-year & 5-year trend
analysis.
Uttar Pradesh has registered 3,656
such cases accounting for 19.0% of total
such cases at the national level. Haryana
has reported high rate of 3.8 followed by
Arunachal Pradesh at 3.2 as compared to
1.5 at the national level.
Cheating (Section 420 IPC)
(Incidence:1,15,405 Rate: 9.2)
A total of 1,15,405 cheating cases
were registered in the country during the
year 2015 showing an increase of 115.2%
from the 2005 level and an increase of
5.5% as compared to the previous year
2014 (1,09,354 cases). Rajasthan has
registered the highest number of cases i.e.
21,898 accounting for 19.0% of total such
crimes in the country. Rajasthan has also
reported the highest rate of such crimes
(30.3) in comparison to national rate of 9.2.
Forgery (Sec. 465, 468 & 471 IPC)
(Incidence: 13,846 Rate: 1.1)
A total of 13,846 cases of forgery
were registered during the year 2015
showing an increase of 23.1% over 2014
(11,245 cases). Rajasthan has registered
the highest number of forgery cases
accounting for 33.3%(4,612 out of 13,846
cases) of total such crimes in the country.
Rajasthan has also reported the highest rate
of such crimes (6.4) in comparison to
national rate of 1.1.
Counterfeiting (Sec. 231-235,237-240 &
242-243, 255 and 489-A to 489-E IPC)
(Incidence: 1,701 Rate: 0.1)
A total of 1,701 cases of
counterfeiting were registered during the
year 2015 showing a decline of 14.0% as
compared to previous year (1,979 cases).
Maximum cases of counterfeiting were
registered in West Bengal (415 cases)
followed by Maharashtra (190 cases)
accounting for 24.4% and 11.2% of total
such cases during 2015 respectively.
Grievous Hurt (Sections 325,326,326A &
326 B IPC)
(Incidence: 92,996 Rate: 7.4)
A total of 92,996 cases of grievous
hurt were registered during 2015 showing a
decline of 11.6% over previous year 2014
(1,05,201). West Bengal (18,075 cases)
followed by Bihar (12,502 cases), Assam
(11,407 cases) and Uttar Pradesh (10,397)
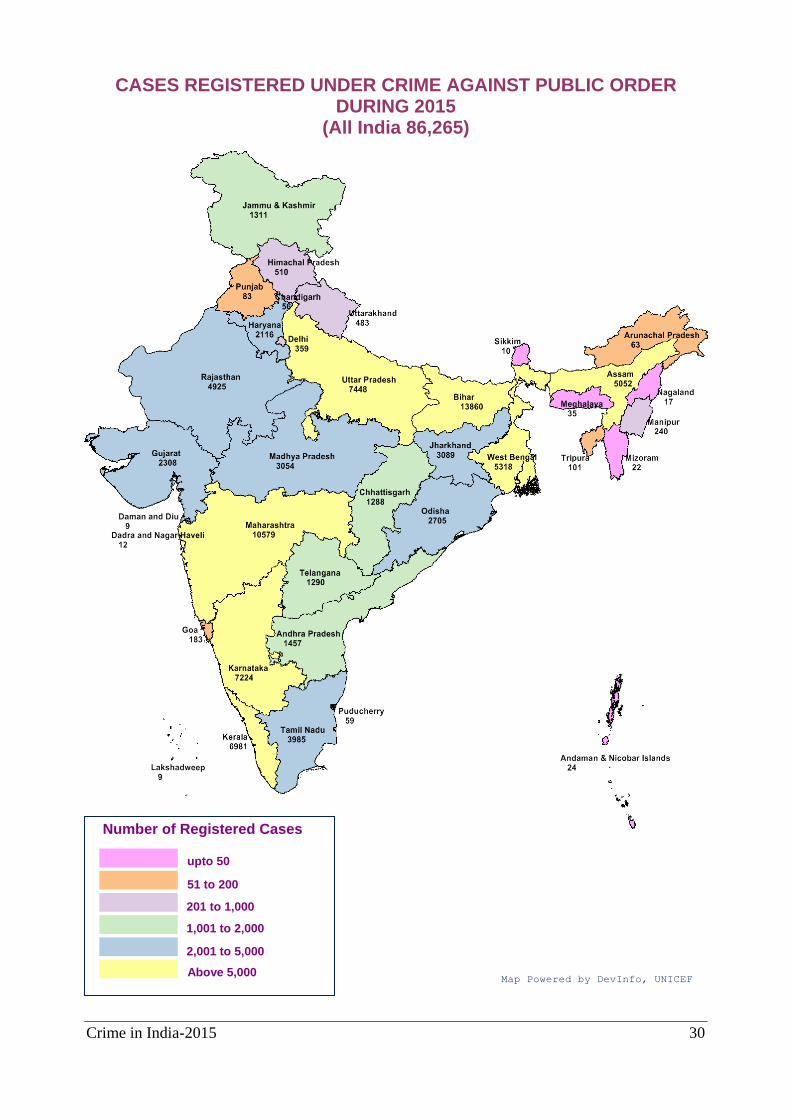
Crime in India-2015 30
CASES REGISTERED UNDER CRIME AGAINST PUBLIC ORDER DURING 2015
(All India 86,265)
Number of Registered Cases
upto 50
201 to 1,000
Above 5,000 Map Powered by DevInfo, UNICEF
51 to 200
1,001 to 2,000
2,001 to 5,000
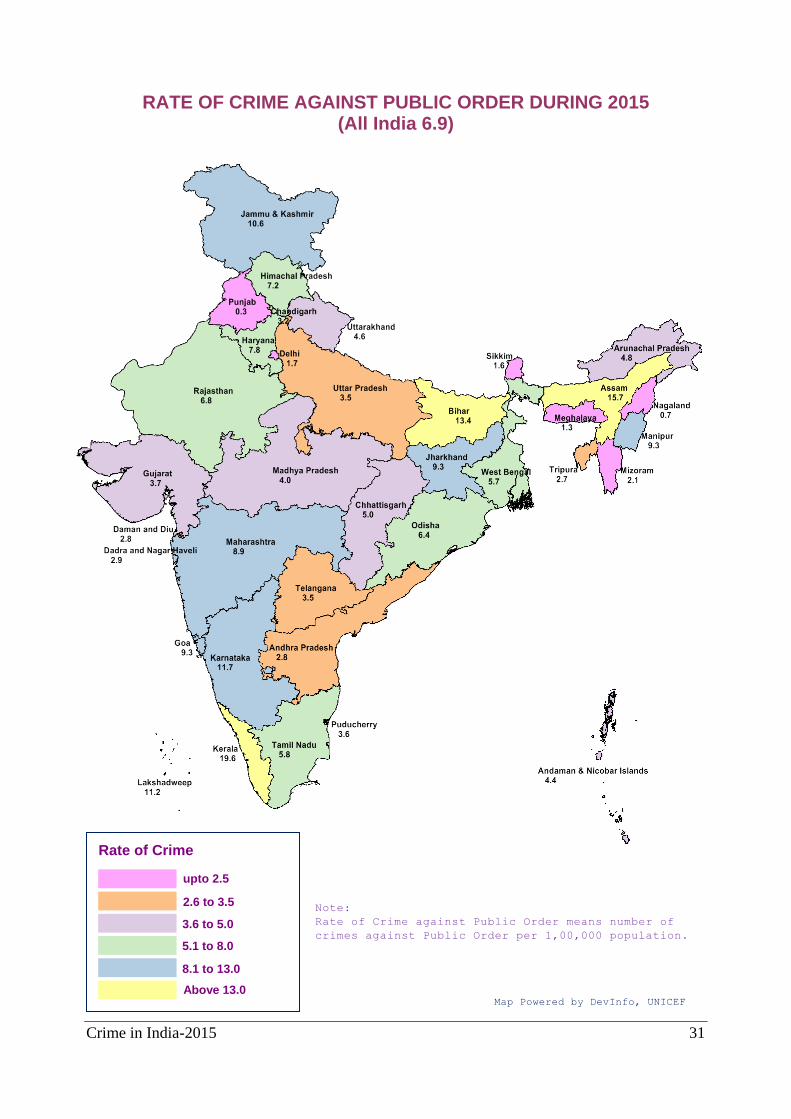
Crime in India-2015 31
RATE OF CRIME AGAINST PUBLIC ORDER DURING 2015 (All India 6.9)
Rate of Crime
upto 2.5
3.6 to 5.0
Above 13.0 Map Powered by DevInfo, UNICEF
2.6 to 3.5
5.1 to 8.0
8.1 to 13.0
Note:
Rate of Crime against Public Order means number of
crimes against Public Order per 1,00,000 population.
Crime in India-2015 32
have accounted for 19.4%, 13.4%, 12.3%
and 11.2% of total such crimes registered at
all India level during 2015 respectively.
Assam has reported the highest rate of such
crimes (35.4) in comparison to national rate
of 7.4.
Assault on Woman with Intent to Outrage
her Modesty (Sec. 354, 354A, 354B, 354C
& 354D IPC)
(Incidence: 82,422 Rate: 13.6)
A total of 82,422 cases of assault on
woman with intent to outrage her modesty
were registered in the country during the
year 2015, showing an increase of 0.2%
over the year 2014 (82,235 cases). An
increase of 141.2% from the 2005 level and
an increase of 46.2% from the average of
last 5 years (2010 - 2014) were reported as
per 10-year & 5-year trend analysis.
Maharashtra with 11,713 cases accounted
for 14.2% of total cases registered in the
country followed by Madhya Pradesh
(9.8%)(8,049 cases) and Uttar Pradesh
(9.6%)(7,885 cases). Delhi has reported the
highest rate (57.8) of such crimes in
comparison to the national average of 13.6.
Insult to the Modesty of Women (Sec. 509
IPC)
(Incidence: 8,685 Rate: 1.4)
A total of 8,685 cases of insult to the
modesty of women were registered in the
country during the year 2015 showing a
decrease of 10.8% as compared to the
previous year (9,735 cases). 5-year trend
analysis also showed a decrease of 13.2%
over the average of quinquennial years
2010-2014.
This decrease may be due to
insertion of section 354A, 354C & 354D in
354 of IPC after the Criminal Amendment
Act 2013.
Andhra Pradesh (2,200 cases)
followed by Delhi UT (1,492 cases),
Telangana (1,288 cases) and Maharashtra
(1,119 cases) have accounted for 25.3%,
17.2%, 14.8% and 12.9% of total such cases
registered in the country during the year
2015 respectively. Delhi has reported
highest crime rate of 16.1 as compared to
1.4 at all India level.
Cruelty by Husband or His Relatives
(Section 498A IPC)
(Incidence: 1,13,403 Rate: 18.7)
A total of 1,13,403 cases were
registered in the country during the year
2015 showing a decrease of 7.7% over 2014
(1,22,877 cases) and an increase of 4.7%
over the average of last 5 years (2010 -
2014). 17.8% of such crimes in the country
were registered in West Bengal (20,163
cases) followed by 12.7% in Rajasthan
(14,383 cases) and 9.9% in Assam (11,225
cases).
Assam has reported the highest crime
rate of 71.5 followed by West Bengal (44.6)
and Rajasthan (41.6) as compared to
national average of 18.7.
Importation of Girls from Foreign Country
(Sec. 366B IPC)
(Incidence: 6 Rate: negligible)
A total of 6 cases of importation of
girls from foreign country were registered in
the country during the year 2015 in
comparison to 13 cases in the year 2014,
showing a decrease of 53.8% during 2015
over 2014.
Causing Deaths by Negligence (Sec. 304A
IPC)
(Incidence: 1,34,384 Rate: 10.7)
A total of 1,34,384 cases of causing
deaths by negligence were registered in the
country during the year 2015 thus showing
an increase of 4.4% over the year 2014
(1,28,771 cases). Uttar Pradesh has
reported the highest number of 15,995 such
cases followed by Tamil Nadu (15,138
cases) and Maharashtra (13,058 cases).
These three States together accounted for
32.9% of total such cases registered in the
country during 2015.
Besides above mentioned crime
heads, NCRB has published detailed data on
various other crime heads also, details may
be seen in tables.
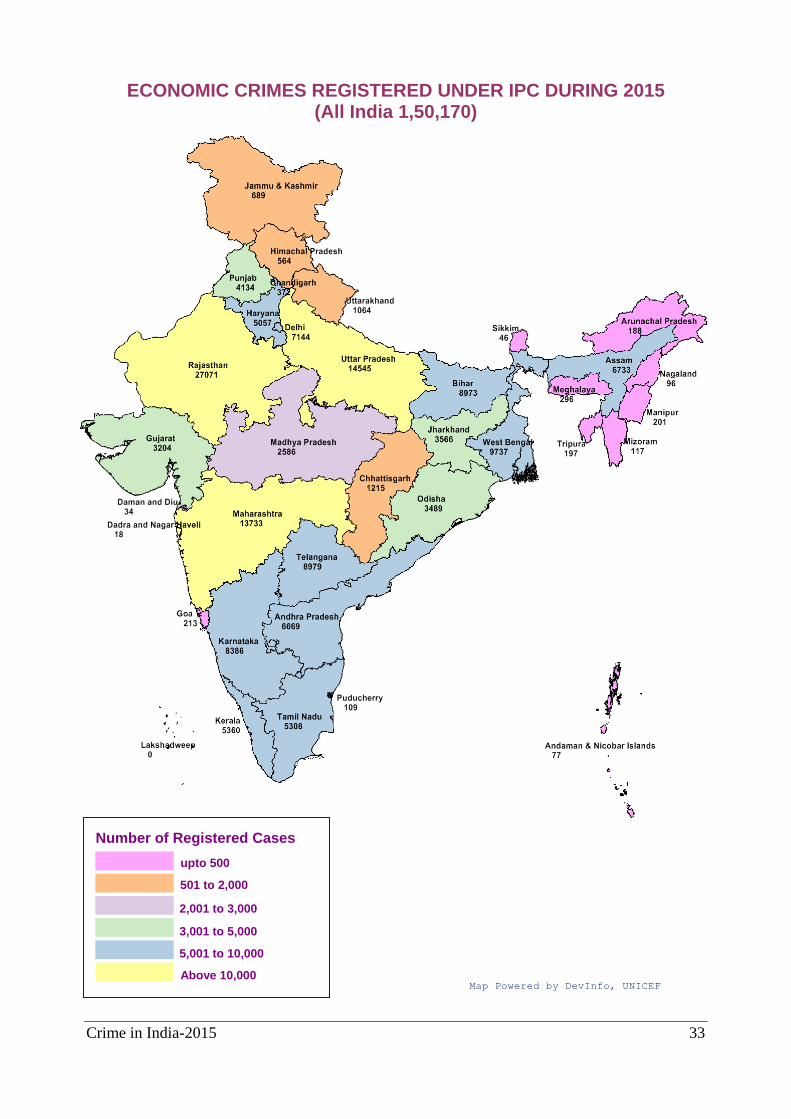
Crime in India-2015 33
ECONOMIC CRIMES REGISTERED UNDER IPC DURING 2015 (All India 1,50,170)
Number of Registered Cases
upto 500
2,001 to 3,000
Above 10,000
501 to 2,000
3,001 to 5,000
5,001 to 10,000
Map Powered by DevInfo, UNICEF
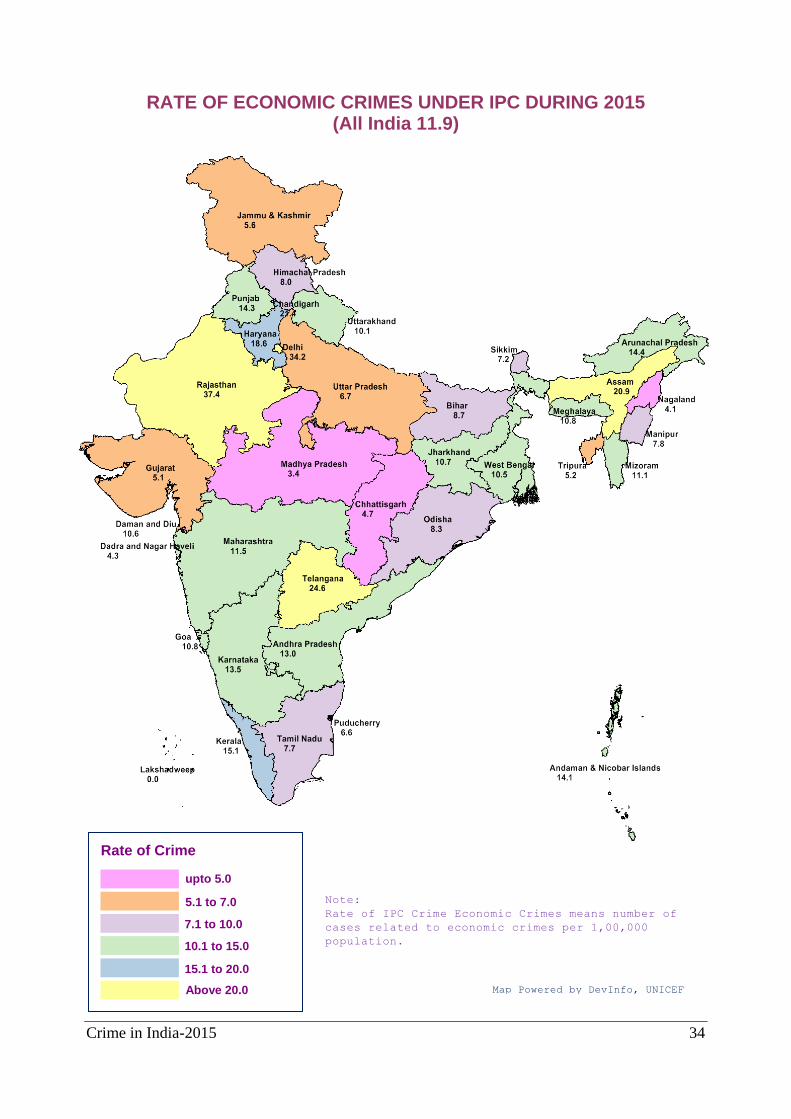
Crime in India-2015 34
RATE OF ECONOMIC CRIMES UNDER IPC DURING 2015 (All India 11.9)
Map Powered by DevInfo, UNICEF
Rate of Crime
upto 5.0
7.1 to 10.0
Above 20.0
5.1 to 7.0
10.1 to 15.0
15.1 to 20.0
Note:
Rate of IPC Crime Economic Crimes means number of
cases related to economic crimes per 1,00,000
population.
Crime in India-2015 35
Crimes under the Special & Local Laws (SLL) (Incidence: 43,76,699 Rate: 347.6)
Cases under these ‘Acts’ generally
represent preventive policing i.e. reporting of
crimes generally indicates better policing
efforts. Mostly the Central Acts on special
subjects which are applicable in the whole
country are considered for the purpose of
crimes registered under SLL. Local Acts and
Central Acts other than classified category
are clubbed together in ‘Other SLL’ crimes.
A total of 43,76,699 cases under SLL
crimes were registered in the country during
the year 2015 showing a decrease of 0.02%
over the year 2014 (43,77,630 cases). 10-
year and 5-year trend shows, 36.6%
increase from the 2005 level and 6.9%
increase over the average of last 5 years
(2010 – 2014). The rate of crime has
decreased from 351.9 in 2014 to 347.6 in the
year 2015. 10-year and 5-year trends for
each crime are presented in Table-1.12.
Trend Analysis
Arms Act, 1959
(Incidence: 53,300 Rate: 4.2)
A total of 53,300 cases under the
Arms Act were registered in the country
during the year 2015 showing a decrease of
3.5% over the previous year (55,255 cases).
10-year and 5-year trend analysis shows,
28.2% decrease from the 2005 level and
12.0% decrease over the average of last 5
years (2010 – 2014). Uttar Pradesh has
reported the highest number of 24,702 cases
registered under the Arms Act which
accounted for 46.3% of total such cases
followed by Madhya Pradesh (18.3%).
Madhya Pradesh has reported the highest
crime rate at 12.7 followed by Uttar Pradesh
(11.4) compared to 4.2 at the national level.
Narcotic Drugs & Psychotropic
Substances Act, 1985
(Incidence: 50,796 Rate: 4.0)
A total of 50,796 cases under this Act
were registered in the year 2015 showing an
increase of 8.3% over previous year (46,923
cases). 10-year and 5-year trend show
72.7% increase from the year 2005 level and
52.8% increase from the average of last 5
years (2010 – 2014). Maharashtra (18,979
cases) and Punjab (10,159 cases) have
registered 37.4% and 20.0% of the total such
cases respectively during 2015. Punjab has
registered highest crime rate of 35.1
compared to the national average of 4.0.
Gambling Act, 1867
(Incidence: 1,30,134 Rate:10.3)
The number of cases registered
under this Act showed an increase of 3.7%
over the previous year (1,25,494 cases). 10-
year and 5-year trend analysis shows, 31.3%
decrease from the 2005 level and 8.3%
decrease over the average of quinquennial
years (2010 – 2014). In percentage terms,
17.4% of the total cases registered in the
country were reported from Madhya Pradesh
(22,618 cases). The crime rate was reported
highest in Goa (63.7) compared to 10.3 at
the national level.
Excise Act, 1944
(Incidence: 2,06,069 Rate:16.4)
The cases under the Excise Act
showed an increase of 36.8% over the year
2005 and decrease of 10.8% over the
previous year. Uttar Pradesh has reported
the maximum cases accounting for
25.0%(51,491 out of 2,06,069 cases) of the
total cases registered under this Act. Among
the States, highest crime rate was reported
from Madhya Pradesh (66.7) followed by
Chhattisgarh (62.0) and Haryana (60.1).
Among the UTs, A & N Islands (383.5) has
reported highest crime rate among UTs
compared to national average of 16.4.
Prohibition Act
(Incidence: 5,00,757 Rate: 39.8)
The cases registered under this Act
have accounted for 11.4% of total SLL
crimes in the country and shows an increase
of 7.2% over the previous year (4,67,111
cases). The cases under this Act have risen
by 53.5% over the year 2005
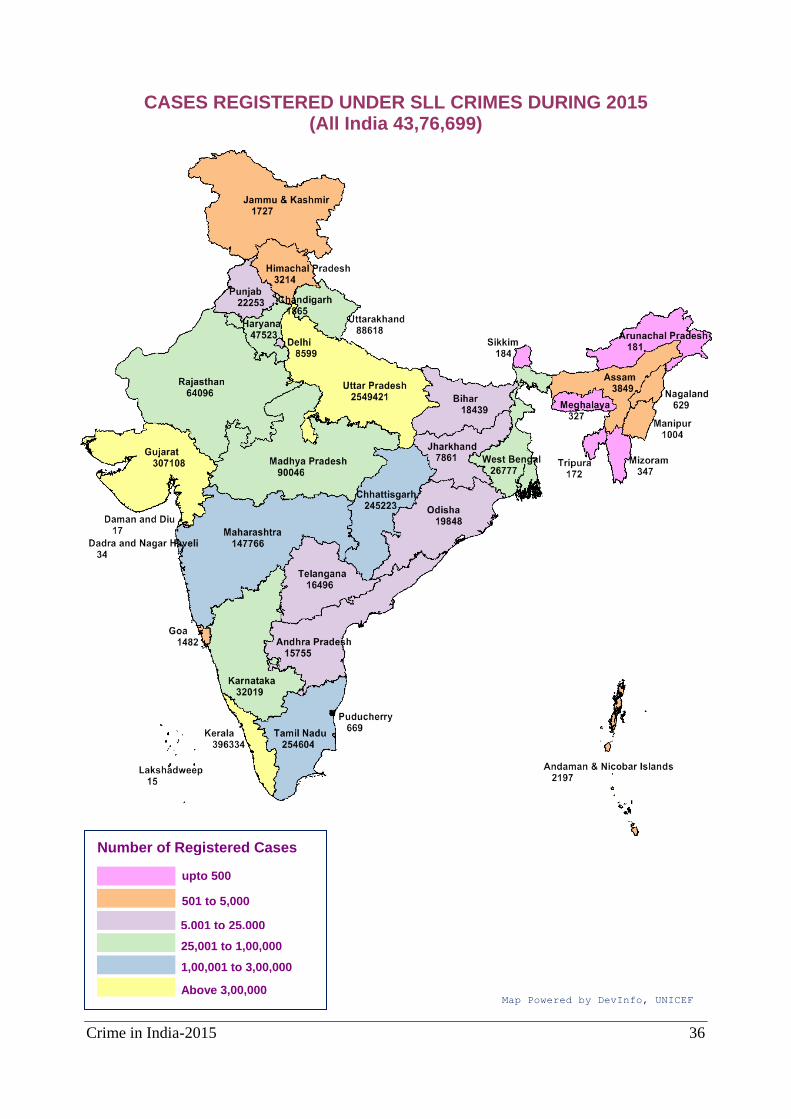
Crime in India-2015 36
CASES REGISTERED UNDER SLL CRIMES DURING 2015 (All India 43,76,699)
Number of Registered Cases
upto 500
5,001 to 25,000
Above 3,00,000 Map Powered by DevInfo, UNICEF
501 to 5,000
25,001 to 1,00,000
1,00,001 to 3,00,000
Crime in India-2015 37
and increased by 19.9% over the average of
quinquennial years (2010 - 2014). The
maximum of cases under this Act were
reported from Gujarat (2,54,212 cases)
followed by Tamil Nadu (1,16,810 cases),
Maharashtra (65,128 cases) and Kerala
(58,197 cases). These four States together
accounted for 98.7% of the total such cases
registered in the country. The crime rate was
highest in Gujarat (407.8) followed by 168.9
in Tamil Nadu and 163.7 in Kerala as against
the national average of 39.8
Explosives & Explosive Substances Act,
1884 & 1908
(Incidence: 4,368 Rate:0.3)
The cases under the Explosives &
Explosive Substances Act showed an
increase of 2.7% from the year 2005 level
and increase of 12.4% over the average of
quinquennial years (2010 - 2014). An
increase of 13.7% in such cases was also
observed in 2015 over 2014 (3,843).
Rajasthan has registered 824 cases under
the Act accounting for 18.9% of the total
such cases followed by Tamil Nadu (12.5%)
(545 cases). The crime rate of 1.1 was
reported in Nagaland and Rajasthan each
against the national average of 0.3.
Immoral Traffic (Prevention) Act, 1956
(Incidence: 2,641 Rate: 0.2)
The cases under the Immoral Traffic
(Prevention) Act have declined by 55.3%
during 2015 over the year 2005 level and
increased by 4.0% during 2015 over average
of last 5 years (2010 - 2014). An increase of
0.9% was observed during 2015 as
compared to 2014. Tamil Nadu reported
19.3% (511 out of 2,641 cases) of total such
cases in the country during 2015. Telangana
reported the highest crime rate at 0.8 against
the national average of 0.2.
Indian Railways Act, 1989
(Incidence: 346 Rate: Negligible)
The cases under the Indian Railways
Act have increased by 54.5% during 2015
over the year 2005 level and increased by
92.0% during 2015 over average of
quinquennial years (2010 - 2014). An
increase of 20.6% was reported during 2015
as compared to 2014. Uttar Pradesh
reported 64.2% (222 out of 346 cases) of
total such cases in the country during 2015.
Registration of Foreigners Act, 1930
(Incidence: 74 Rate: Negligible)
A total of 74 cases under the
Registration of Foreigners Act were
registered in the country during 2015. Tamil
Nadu has reported 23.0% (17 out of 74
cases) of total such cases followed by Kerala
with 16.2% (12 out of 74 cases) of the total
cases registered at the national level.
Protection of Civil Rights Act, 1955
(Incidence: 117 Rate: negligible)
The cases registered under the
Protection of Civil Rights Act have shown a
decline of 74.2% over the 2005 level, an
increase of 19.9% over the average
quinquennial years (2010 - 2014) and an
increase of 1.7% over the year 2014 (115
cases). Bihar reported 63.2% (74 out of 117
cases) of total such cases in the country
during 2015.
Indian Passport Act, 1967
(Incidence: 703 Rate: 0.1)
The cases registered under the
Indian Passport Act have decreased by
37.2% over the year 2005, decreased by
19.4% over the quinquennial average of
2010 - 2014, and an increase of 5.4% over
the previous year (667 cases). The highest
cases under this Act were registered in Tamil
Nadu accounting for 42.2%(297 out of 703
cases) of the total cases in the country while
the highest crime rate of 1.0 was reported in
Tripura against the national average of 0.1.
Essential Commodities Act, 1955
(Incidence: 4,501 Rate: 0.4)
The cases registered under the
Essential Commodities Act have decreased
by 37.6% over the year 2005. It decreased
by 33.6% over the quinquennial
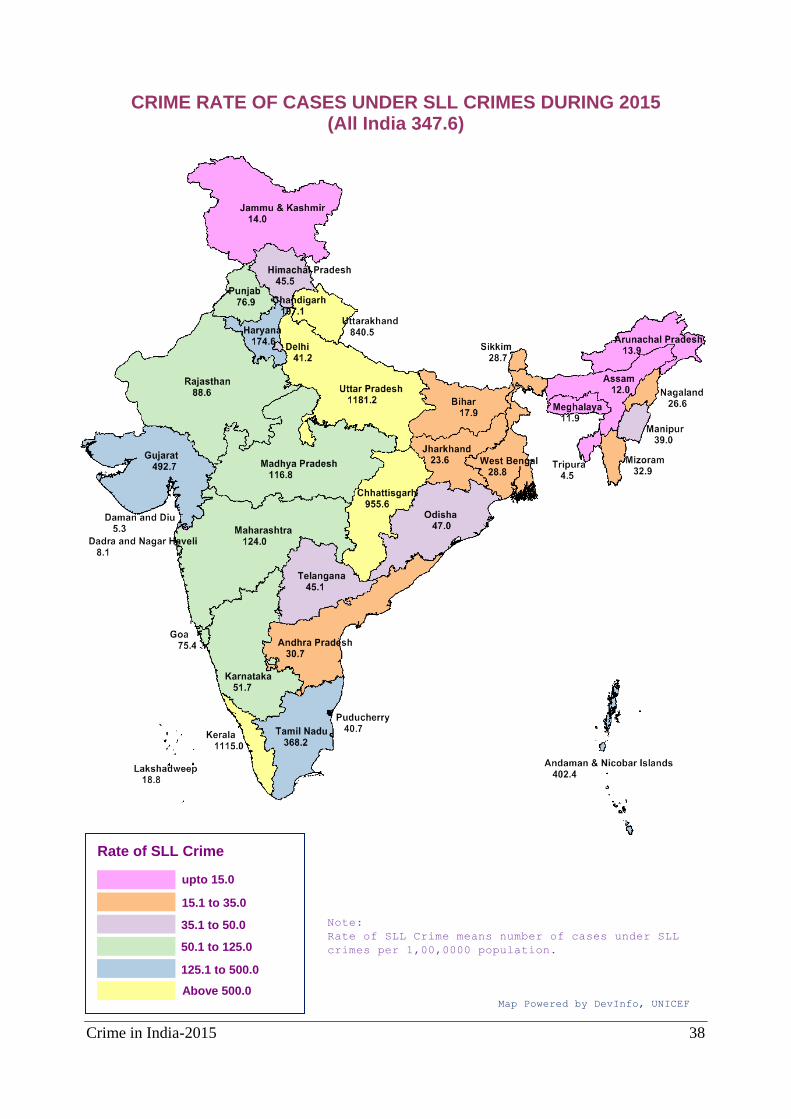
Crime in India-2015 38
CRIME RATE OF CASES UNDER SLL CRIMES DURING 2015 (All India 347.6)
Rate of SLL Crime
upto 15.0
35.1 to 50.0
Above 500.0 Map Powered by DevInfo, UNICEF
15.1 to 35.0
50.1 to 125.0
125.1 to 500.0
Note:
Rate of SLL Crime means number of cases under SLL
crimes per 1,00,0000 population.
Crime in India-2015 39
average during the years 2010 - 2014 and
decreased by 16.9% over previous year
(5,418 cases). The highest number of cases
accounting for 16.0% of the total cases were
reported from Maharashtra (722 cases)
followed by Uttar Pradesh (645 cases)
representing 14.3% of the total such cases.
However, the crime rate was highest in
Jammu & Kashmir (1.1) as compared to the
national average of 0.4.
Antiquities & Art Treasures Act, 1972
(Incidence: 37 Rate: Negligible)
A total of 37 cases under this crime
had registered during the year 2015
showing a decrease of 7.5% over previous
year (40 cases). 27.0%(10 out of 37 cases)
of total such cases were reported in Bihar
during 2015.
Dowry Prohibition Act, 1961
(Incidence: 9,894 Rate:1.6)
The cases registered under the
Dowry Prohibition Act have shown an
increase of 208.8% over 2005, an increase
of 18.9% over the quinquennial average of
2010 - 2014 and a decrease of 1.6% over
the year 2014 (10,050 cases). Uttar Pradesh
reported highest number of such cases
(2,766 cases) followed by Bihar (1,867
cases), Jharkhand (1,552 cases) and
Karnataka (1,541 cases) which together
have accounted for 78.1% of the total such
cases registered in the country. Jharkhand
reported the highest crime rate (9.6) against
the national average of 1.6.
Indecent Representation of Women
(Prohibition) Act, 1986
(Incidence: 40 Rate: Negligible)
The number of cases registered
under the Indecent Representation of
Women (Prohibition) Act has shown a
decline of 98.6% over 2005 and a decline of
89.5% over the average of quinquennial
years (2010 - 2014) and a decline of 14.9%
over the year 2014. Andhra Pradesh (12
cases) followed by Rajasthan (9 cases)
accounted for 30.0% and 22.5% of total such
cases registered in the country during 2015
respectively.
Copyright Act, 1957
(Incidence: 5,241 Rate: 0.4)
The cases registered under the
Copyright Act have shown a declining trend
during 2005-2015. A decrease of 23.4% in
2015 over the 2005 level, a decrease of
19.0% over the 5 year average (2010 - 2014)
and 0.1% increase in 2015 over 2014 (5,236
cases). Tamil Nadu with 2,024 cases has
registered 38.6% of the total such cases
registered in the country.
Scheduled Castes/Scheduled Tribes
(Prevention of Atrocities) Act, 1989
(Incidence: 6,837 Rate: 2.2)
Data under the SC/ST (Prevention of
Atrocities) Act excludes the cases of IPC
crimes registered along with this Act.
A total of 6,837 cases under this Act
were registered in the country during 2015.
Majority of cases under this Act were
reported in Karnataka (1,832 cases) followed
by Uttar Pradesh (1,473 cases) and
Jharkhand (856 cases) during 2015.
Forest Act, 1927
(Incidence: 3,968 Rate: 0.3)
The cases registered under this Act
have shown a decrease of 19.0% over the
previous year (4,901 cases). Two States
namely Rajasthan (1,828 cases) and Uttar
Pradesh (1,311 cases) have accounted for
79.1% of the total such cases registered in
the country during the year 2015. Rajasthan
has reported highest crime rate of 2.5 as
against the national crime rate of 0.3.
Prohibition of Child Marriage Act, 2006
(Incidence: 293 Rate: 0.1)
A total of 293 cases were registered
under this Act during 2015. The State of
Tamil Nadu (77 cases), West Bengal (40
cases) and Karnataka (35 cases) have
accounted for 51.9% of the total cases
registered under this Act in the country
during the year 2015.
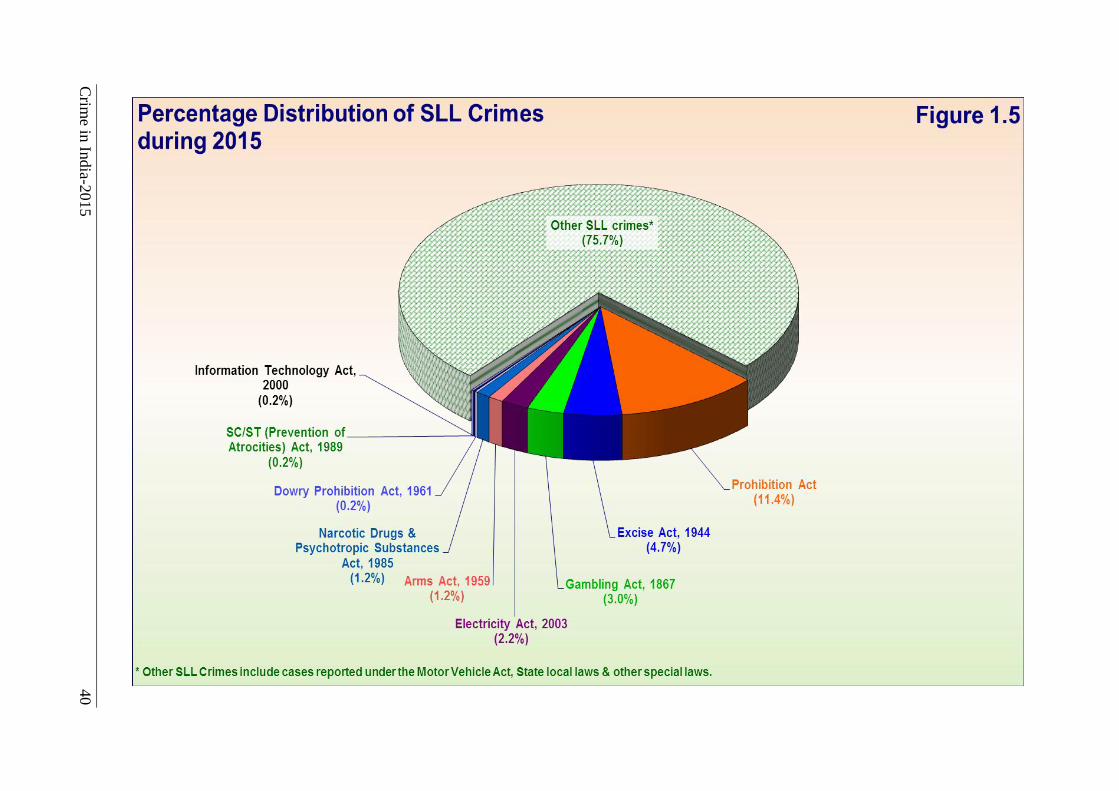
Crim
e in In
dia-2
015
40
Crime in India-2015 41
Protection of Women from Domestic
Violence Act, 2005
(Incidence: 461 Rate: 0.1)
A total of 461 cases were registered
under the Protection of Women from
Domestic Violence Act during 2015.
Maximum cases under this Act were
reported in Bihar (161 cases) followed by
Kerala (132 cases).
Information Technology Act, 2000
(Incidence: 8,045 Rate: 0.6)
A total of 8,045 cases were
registered under this Act during 2015. The
State of Uttar Pradesh (2,161 cases) and
Karnataka (1,414 cases) have accounted for
44.4% of the total such cases registered in
the country during the year 2015.
Official Secret Act, 1923
(Incidence: 9 Rate: Negligible)
A total of 9 cases were registered
under this Act during 2015. These 9 cases
were reported by Haryana, Tamil Nadu &
Delhi UT (2 cases each) and Punjab,
Uttarakhand & West Bengal (1 case each)
during 2015.
Electricity Act
(Incidence: 97,591 Rate: 7.8)
Out of 97,591 cases registered under
the Electricity Act, majority of such cases
were reported in Uttar Pradesh (57,193
cases) and Haryana (18,598 cases). These
two States together accounted for 77.7% of
total such cases reported during the year
2015. Highest crime rate under this Act was
reported in Haryana (68.3) followed by Uttar
Pradesh (26.5) compared to all India
average rate of 7.8.
Bonded Labour System (Abolition) Act,
1976
(Incidence: 92 Rate: Negligible)
Out of total 92 cases registered
under this Act, 15 cases against SCs and 5
cases against STs were registered during
2015. Uttar Pradesh (31 cases) and Tamil
Nadu (15 cases) together accounted for
50.0% of total such cases during 2015.
National Security Act, 1980
(Incidence: 412 Rate: Negligible)
A total of 412 cases were registered
under this Act during 2015. Uttar Pradesh
(253 cases) and Madhya Pradesh (155
cases) together contributed 99.0%(408 out
of 412 cases) of total such cases during
2015.
Unlawful Activities (Prevention) Act, 1967
(Incidence: 897 Rate: 0.1)
A total of 897 cases were registered
under this Act during 2015. Manipur (544
cases) and Assam (103 cases) together
contributed 72.1% (647 out of 897 cases) of
total such cases during 2015.
Prevention of Damage to Public Property
Act, 1984
(Incidence: 4,941 Rate: 0.4)
A total of 4,941 cases were
registered under this Act during 2015. Tamil
Nadu (1,671 cases) and Uttar Pradesh
(1,331 cases) together contributed 60.7%
(3,002 out of 4,941 cases) of total such
cases during 2015.
Prevention of Insult to National Honour
Act, 1971
(Incidence: 61 Rate: Negligible)
A total of 61 cases were registered
under this Act during 2015. Kerala (21
cases) and Maharashtra (11 cases) together
contributed 52.4%(32 out of 61 cases) of
total such cases during 2015.
Lotteries (Regulation) Act, 1998
(Incidence: 3,390 Rate: 0.3)
A total of 3,390 cases were
registered under this Act during 2015. The
maximum cases under the Lotteries
(Regulation) Act were reported in Tamil
Nadu (3,084 cases) contributing 91.0% of
total such cases registered at all India level.
Representation of People Act, 1951
(Incidence: 1,049 Rate: 0.1)
A total of 1,049 cases were
registered under this Act during 2015. The
maximum cases under the Representation of
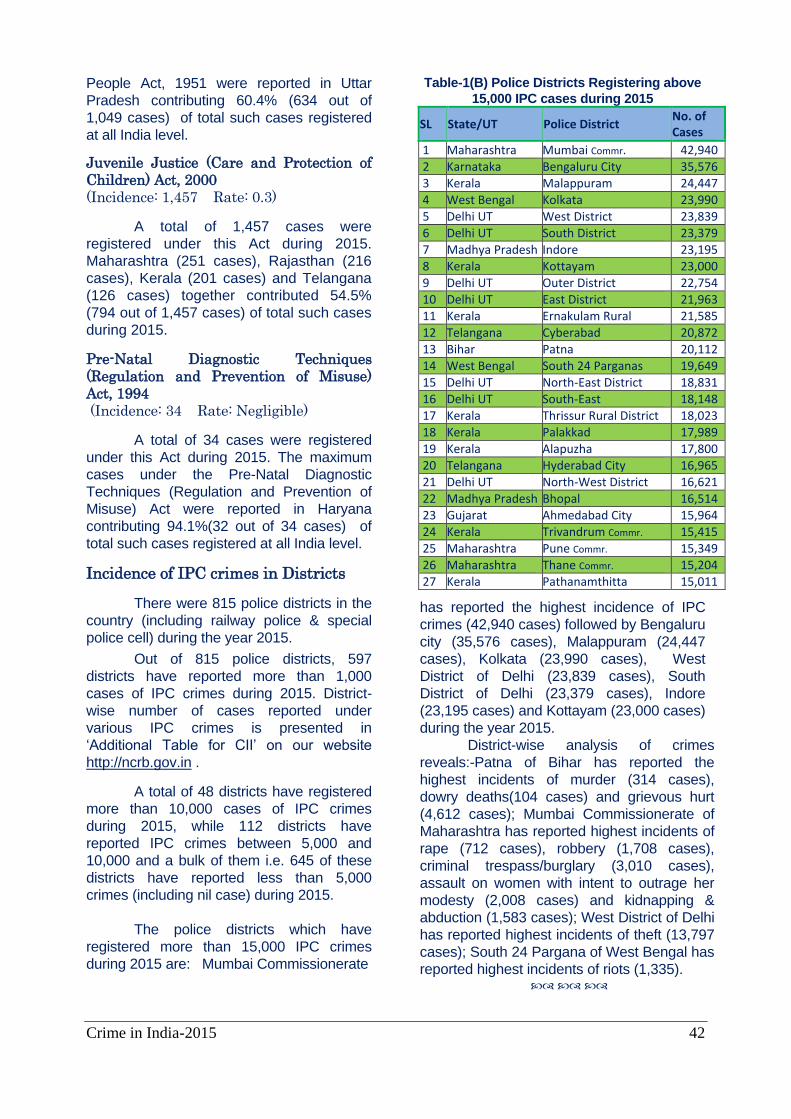
Crime in India-2015 42
People Act, 1951 were reported in Uttar
Pradesh contributing 60.4% (634 out of
1,049 cases) of total such cases registered
at all India level.
Juvenile Justice (Care and Protection of
Children) Act, 2000
(Incidence: 1,457 Rate: 0.3)
A total of 1,457 cases were
registered under this Act during 2015.
Maharashtra (251 cases), Rajasthan (216
cases), Kerala (201 cases) and Telangana
(126 cases) together contributed 54.5%
(794 out of 1,457 cases) of total such cases
during 2015.
Pre-Natal Diagnostic Techniques
(Regulation and Prevention of Misuse)
Act, 1994
(Incidence: 34 Rate: Negligible)
A total of 34 cases were registered
under this Act during 2015. The maximum
cases under the Pre-Natal Diagnostic
Techniques (Regulation and Prevention of
Misuse) Act were reported in Haryana
contributing 94.1%(32 out of 34 cases) of
total such cases registered at all India level.
Incidence of IPC crimes in Districts
There were 815 police districts in the
country (including railway police & special
police cell) during the year 2015.
Out of 815 police districts, 597
districts have reported more than 1,000
cases of IPC crimes during 2015. District-
wise number of cases reported under
various IPC crimes is presented in
‘Additional Table for CII’ on our website
http://ncrb.gov.in .
A total of 48 districts have registered
more than 10,000 cases of IPC crimes
during 2015, while 112 districts have
reported IPC crimes between 5,000 and
10,000 and a bulk of them i.e. 645 of these
districts have reported less than 5,000
crimes (including nil case) during 2015.
The police districts which have
registered more than 15,000 IPC crimes
during 2015 are: Mumbai Commissionerate
Table-1(B) Police Districts Registering above
15,000 IPC cases during 2015
SL State/UT Police District No. of Cases
1 Maharashtra Mumbai Commr. 42,940 2 Karnataka Bengaluru City 35,576 3 Kerala Malappuram 24,447 4 West Bengal Kolkata 23,990 5 Delhi UT West District 23,839 6 Delhi UT South District 23,379 7 Madhya Pradesh Indore 23,195 8 Kerala Kottayam 23,000 9 Delhi UT Outer District 22,754 10 Delhi UT East District 21,963 11 Kerala Ernakulam Rural 21,585 12 Telangana Cyberabad 20,872 13 Bihar Patna 20,112 14 West Bengal South 24 Parganas 19,649 15 Delhi UT North-East District 18,831 16 Delhi UT South-East 18,148 17 Kerala Thrissur Rural District 18,023 18 Kerala Palakkad 17,989 19 Kerala Alapuzha 17,800 20 Telangana Hyderabad City 16,965 21 Delhi UT North-West District 16,621 22 Madhya Pradesh Bhopal 16,514 23 Gujarat Ahmedabad City 15,964 24 Kerala Trivandrum Commr. 15,415 25 Maharashtra Pune Commr. 15,349 26 Maharashtra Thane Commr. 15,204 27 Kerala Pathanamthitta 15,011
has reported the highest incidence of IPC
crimes (42,940 cases) followed by Bengaluru
city (35,576 cases), Malappuram (24,447
cases), Kolkata (23,990 cases), West
District of Delhi (23,839 cases), South
District of Delhi (23,379 cases), Indore
(23,195 cases) and Kottayam (23,000 cases)
during the year 2015.
District-wise analysis of crimes
reveals:-Patna of Bihar has reported the
highest incidents of murder (314 cases),
dowry deaths(104 cases) and grievous hurt
(4,612 cases); Mumbai Commissionerate of
Maharashtra has reported highest incidents of
rape (712 cases), robbery (1,708 cases),
criminal trespass/burglary (3,010 cases),
assault on women with intent to outrage her
modesty (2,008 cases) and kidnapping &
abduction (1,583 cases); West District of Delhi
has reported highest incidents of theft (13,797
cases); South 24 Pargana of West Bengal has
reported highest incidents of riots (1,335).
Crime in India-2015 43
Chapter - 2
Crime in Mega Cities
The term ‘Mega City’ in context of this
chapter refers to city having population of 10
lakh (1 million) or more. List of mega city is
provided by Population Census & Registrar
General of India which is based on last
population census. The numbers of such cities
have increased from 35 in the year 2001 to 53
in the year 2011.NCRB has been collecting
data for these 53 mega cities since 2012.
Crimes are much higher in mega cities
compared to either small cities or rural areas.
High incidents of crimes in mega cities may be
due to various factors like high density of
population, greater information availability/flow,
greater degree of anonymity in big cities, social
milieu of urban slums etc. This chapter deals
with crime analysis reported in 53 mega cities.
The present analysis does not aim at
complete urban crime pattern in the country but
is restricted to only 53 mega cities having urban
population of only 1,607.24 lakh as per The
Population Census 2011.
The population of cities from The Population Census 2011 are used for calculating the Crime Rate for these cities, as mid-year population projection for these cities is not available.
Various Forms of Crime The present analysis on mega cities is
restricted to 34 major specified crimes under
IPC and 56 specified crimes under SLL. The
city-wise details of these crimes for 53 mega
cities are presented in this chapter.
Cognizable Crimes
The incidents of cognizable crimes in
the mega cities during 2015 are presented in
Table-2.1 and 2.3. As many as 20,56,129
cognizable crimes were reported in these 53
mega cities during 2015 comprising 6,76,086
cases registered under the IPC and 13,80,043
cases registered under the SLL. In terms of
percentage, 67.1% of total cases (IPC + SLL)
during 2015 were reported under Special &
Local Laws (SLL) and remaining 32.9% under
Indian Penal Code (IPC).
Crime rate of 1,279.3 was observed in
these mega cities as compared to crime rate of
581.8 at all India level, showing much higher
crime rate compared to all India average.
Trend Analysis - Major IPC Crimes
Murder
(Incidence: 3,401 Rate: 2.1)
The offences of murder with 3,401
cases in 2015 showed a decline of 3.9% in
comparison to 3,538 cases in 2014.
Delhi City has registered the maximum
cases of murder (464 cases) followed by Patna
(232 cases) and Bengaluru (188 cases) during
2015. Crime rate of 2.1 was reported under
murder cases in these 53 mega cities during the
year 2015. The highest rate of 11.3 murders per
lakh population was reported from Patna
compared to all India average rate of 2.1 during
the year 2015.
Attempt to Commit Murder
(Incidence: 4,697 Rate: 2.9)
The offence of attempt to commit
murder with 4,697 cases in 2015 showed a rise
of 2.0% in comparison to 4,603 cases in 2014.
Delhi City has registered the maximum
number of cases of attempt to murder (674
cases) followed by Bengaluru (464 cases) and
Mumbai city (231 cases) during 2015. Crime
rate of 2.9 was reported under attempt to
commit murder cases in these 53 mega cities
during the year 2015. The highest crime rate
(13.7) of attempt to commit murder per lakh
population was reported from Jodhpur
compared to all India average rate of 2.9 during
the year 2015.
Crime in India-2015 44
Culpable Homicide not Amounting to Murder
(Incidence: 352 Rate: 0.2)
A total of 352 cases of culpable
homicides not amounting to murder were
registered in 53 mega cities during 2015. Delhi
City has reported the maximum number of
cases of culpable homicide not amounting to
murder (53 cases) followed by Agra (32 cases),
Bengaluru (23 cases) and Kolkata (19 cases)
during 2015.
Attempt to Commit Culpable Homicide
(Incidence: 1,546 Rate: 0.9)
A total of 1,546 cases of attempt to
commit culpable homicide were registered in 53
mega cities during 2015. Delhi City has reported
the maximum number of cases of attempt to
culpable homicides (897 cases) followed by
Thiruvananthapuram (107 cases) during 2015.
Rape
(Incidence: 6,016 Rate: 3.7)
The offence of rape with 6,016 cases in
2015 showed a rise of 4.4% in comparison to
5,761 cases in 2014.
Incidents of rape were highest in Delhi
City (1,893 cases) followed by Mumbai (712
cases) during 2015. 4.4% more registration in
rape cases were there in Delhi city during 2015
(1,893 cases) over 2014 (1,813 cases). Crime
rate of 3.7 was reported under rape cases in
these 53 mega cities during the year 2015. The
highest rate of 13.4 rape per lakh population
was reported from Jodhpur followed by Delhi
City at 11.6 as compared to 5.7 at average
cities level during the year 2015.
Attempt to Commit Rape
(Incidence: 266 Rate: 0.2)
A total of 266 cases of attempt to
commit rape were reported in 53 mega cities
during 2015. Delhi City has registered the
maximum cases of attempt to commit rape (39
cases) during 2015.
Kidnapping & Abduction
(Incidence: 19,455 Rate: 12.1)
The offence of kidnapping & abduction
with 19,455 cases in 2015 showed a rise of
23.2% in comparison to 15,787 cases in 2014.
Delhi City has reported the maximum
cases of kidnapping & abduction (6,630 cases)
followed by Mumbai (1583 cases), Patna (869
cases) and Bengaluru (777 cases) during 2015.
Crime rate of 12.1 was reported under
kidnapping & abduction cases in these 53 mega
cities during the year 2015. The highest rate
(42.5) of kidnappings & abductions per one lakh
population was reported from Patna compared
to 12.1 in these 53 mega during the year 2015.
Dacoity
(Incidence: 485 Rate: 0.3)
The crime under head dacoity with 485 cases in 2015 showed a decline of 6.2% in
comparison to 517 cases in 2014.
Delhi City has reported the maximum
cases of dacoity (61 cases) followed by Mumbai
(48 cases) and Bengaluru (45 cases) during
2015. The highest crime rate of dacoity (2.3) per
one lakh population was reported from
Aurangabad in comparison to 0.3 in these 53
mega during the year 2015.
Making Preparation and Assembly for
Committing Dacoity
(Incidence: 705 Rate: 0.4)
The offence of making preparation &
assembly to commit dacoity with 705 cases in
2015 showed a rise of 4.6% in comparison to
674 cases in 2014.
Bengaluru has reported the maximum
cases of making preparation and assembly for
committing dacoity (320 cases) accounting for
45.4% of total such cases reported during 2015.
The highest crime rate under this head was
reported from Asansol (4.2) in comparison to
0.3 at average cities level during the year 2015.
Robbery
(Incidence: 14,214 Rate: 8.8)
The offence of robbery with 14,214 cases in 2015 showed a decline of 1.8% in
comparison to 14,475 cases in 2014.
Delhi City has reported the maximum
cases of robbery (6,766 cases) followed by
Mumbai (1,708 cases) and Pune (731 cases)
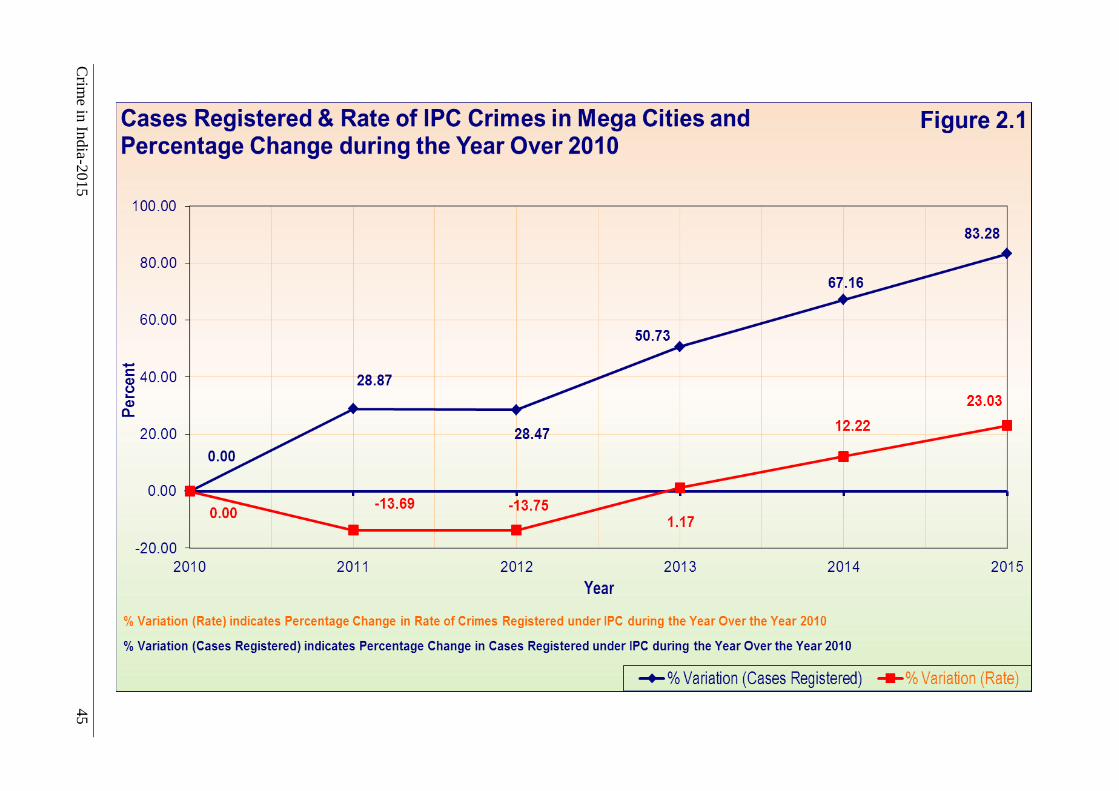
Crim
e in In
dia-2
01
5
45
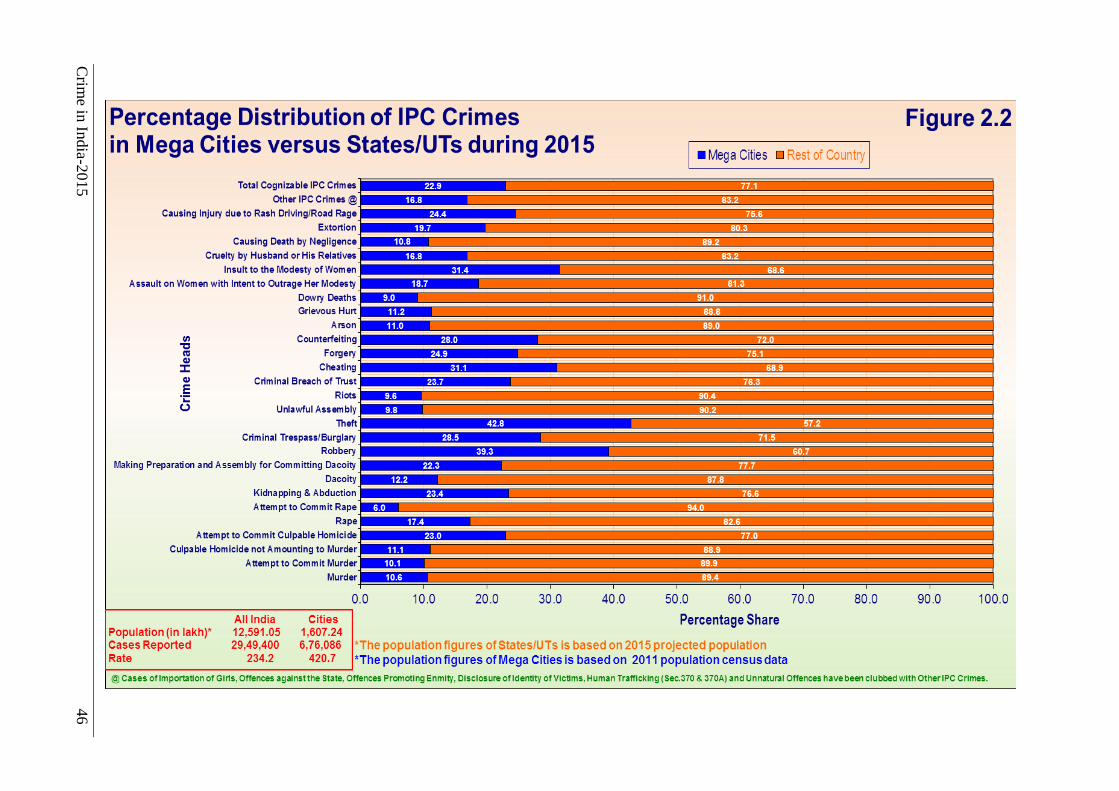
Crim
e in In
dia-2
01
5
46
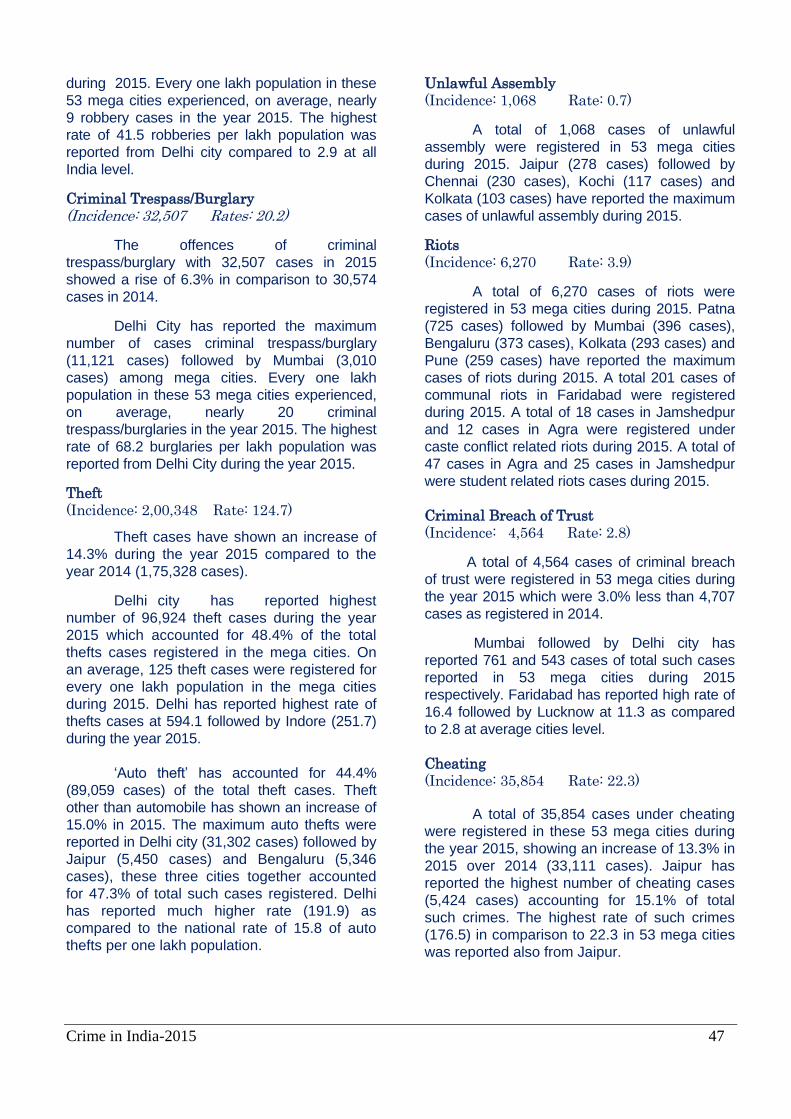
Crime in India-2015 47
during 2015. Every one lakh population in these
53 mega cities experienced, on average, nearly
9 robbery cases in the year 2015. The highest
rate of 41.5 robberies per lakh population was
reported from Delhi city compared to 2.9 at all
India level.
Criminal Trespass/Burglary
(Incidence: 32,507 Rates: 20.2)
The offences of criminal
trespass/burglary with 32,507 cases in 2015
showed a rise of 6.3% in comparison to 30,574
cases in 2014.
Delhi City has reported the maximum
number of cases criminal trespass/burglary
(11,121 cases) followed by Mumbai (3,010
cases) among mega cities. Every one lakh
population in these 53 mega cities experienced,
on average, nearly 20 criminal
trespass/burglaries in the year 2015. The highest
rate of 68.2 burglaries per lakh population was
reported from Delhi City during the year 2015.
Theft
(Incidence: 2,00,348 Rate: 124.7)
Theft cases have shown an increase of
14.3% during the year 2015 compared to the
year 2014 (1,75,328 cases).
Delhi city has reported highest
number of 96,924 theft cases during the year
2015 which accounted for 48.4% of the total
thefts cases registered in the mega cities. On
an average, 125 theft cases were registered for
every one lakh population in the mega cities
during 2015. Delhi has reported highest rate of
thefts cases at 594.1 followed by Indore (251.7)
during the year 2015.
‘Auto theft’ has accounted for 44.4%
(89,059 cases) of the total theft cases. Theft
other than automobile has shown an increase of
15.0% in 2015. The maximum auto thefts were
reported in Delhi city (31,302 cases) followed by
Jaipur (5,450 cases) and Bengaluru (5,346
cases), these three cities together accounted
for 47.3% of total such cases registered. Delhi
has reported much higher rate (191.9) as
compared to the national rate of 15.8 of auto
thefts per one lakh population.
Unlawful Assembly
(Incidence: 1,068 Rate: 0.7)
A total of 1,068 cases of unlawful
assembly were registered in 53 mega cities
during 2015. Jaipur (278 cases) followed by
Chennai (230 cases), Kochi (117 cases) and
Kolkata (103 cases) have reported the maximum
cases of unlawful assembly during 2015.
Riots
(Incidence: 6,270 Rate: 3.9)
A total of 6,270 cases of riots were
registered in 53 mega cities during 2015. Patna
(725 cases) followed by Mumbai (396 cases),
Bengaluru (373 cases), Kolkata (293 cases) and
Pune (259 cases) have reported the maximum
cases of riots during 2015. A total 201 cases of
communal riots in Faridabad were registered
during 2015. A total of 18 cases in Jamshedpur
and 12 cases in Agra were registered under
caste conflict related riots during 2015. A total of
47 cases in Agra and 25 cases in Jamshedpur
were student related riots cases during 2015.
Criminal Breach of Trust (Incidence: 4,564 Rate: 2.8)
A total of 4,564 cases of criminal breach
of trust were registered in 53 mega cities during
the year 2015 which were 3.0% less than 4,707
cases as registered in 2014.
Mumbai followed by Delhi city has
reported 761 and 543 cases of total such cases
reported in 53 mega cities during 2015
respectively. Faridabad has reported high rate of
16.4 followed by Lucknow at 11.3 as compared
to 2.8 at average cities level.
Cheating
(Incidence: 35,854 Rate: 22.3)
A total of 35,854 cases under cheating
were registered in these 53 mega cities during
the year 2015, showing an increase of 13.3% in
2015 over 2014 (33,111 cases). Jaipur has
reported the highest number of cheating cases
(5,424 cases) accounting for 15.1% of total
such crimes. The highest rate of such crimes
(176.5) in comparison to 22.3 in 53 mega cities
was reported also from Jaipur.
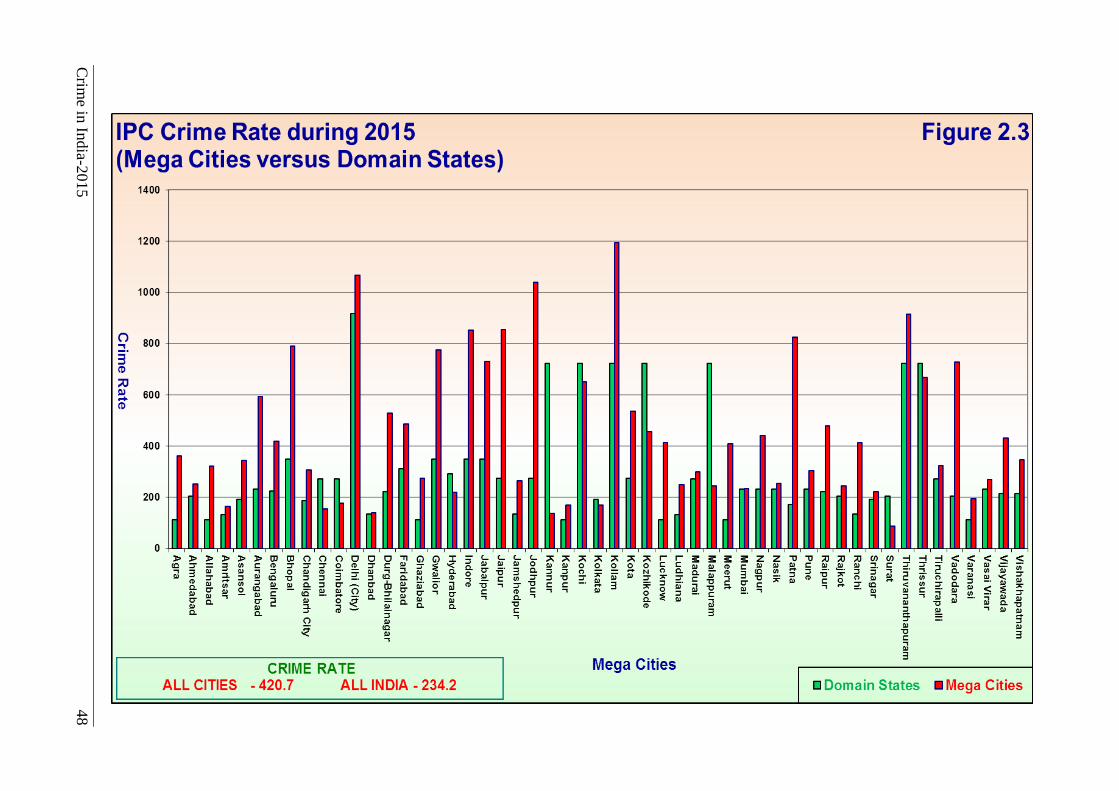
Crim
e in In
dia-2
01
5
48
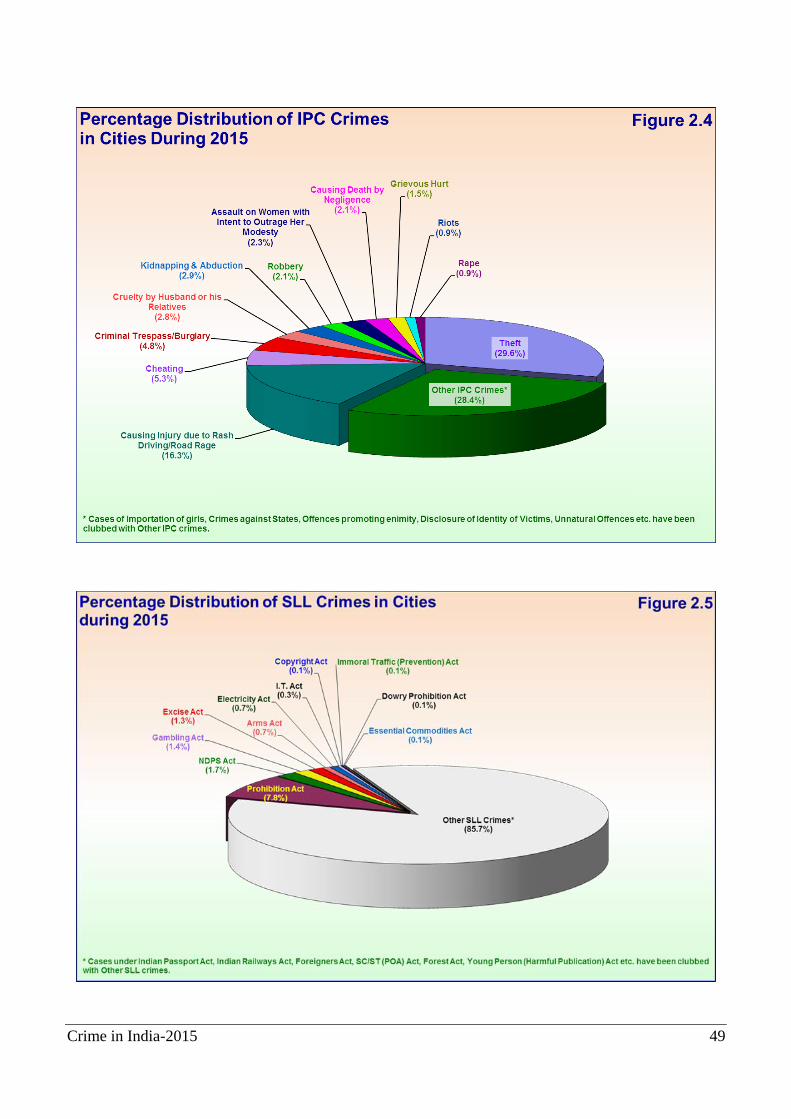
Crime in India-2015 49

Crime in India-2015 50
Forgery
(Incidence: 3,445 Rate: 2.1)
A total of 3,445 cases of forgery were
registered in 53 mega cities during the year
2015 which were 33.4% more than 2,583
cases registered in 2014.
Jodhpur with 1,196 cases has reported
the highest number of forgery cases,
accounting for 34.7% of total such crimes.
Jodhpur has also reported the highest rate of
such crimes (105.1) in comparison to cities
average rate of 2.1.
Counterfeiting
(Incidence: 477 Rate: 0.3)
A total of 477 cases of counterfeiting
were registered during the year 2015, showing
a decline of 6.5% in comparision to previous
year (510 cases). Maximum number of cases of
counterfeiting were reported in Chennai (70
cases) followed by Delhi city (67 cases), these
two cities together accounted for 28.7% of total
such cases registered in these 53 mega cities
during 2015.
Grievous Hurt
(Incidence: 10,424 Rate: 6.5)
Offences of grievous hurt with 10,424
cases registered in 2015 showed a decline of
3.6% in comparison to 10,811 cases registered
in 2014.
Patna (3,112 cases) followed by
Mumbai (1,512 cases) have together accounted
for 44.3% of total such crimes registered during
2015. A total of 41 cases of acid attacks were
also reported, Delhi city has reported highest
cases (19) of acid attacks during 2015. Patna
has reported the highest rate under grievous
hurt (150.2) in comparison to cities average rate
of 6.5.
Dowry Deaths
(Incidence: 689 Rate: 0.4)
A total of 689 cases of dowry deaths
were registered during the year 2015, showing
a decrease of 8.0% over the year 2014 (749
cases). Delhi city with 100 cases has reported
the highest number of incidents of such cases.
Patna has reported the highest rate (3.6) of
such crimes in comparison to the cities average
rate of 0.4.
Assault on Woman with Intent to Outrage
her Modesty
(Incidence: 15,428 Rate:9.6)
A total of 15,428 cases of assault on
woman with intent to outrage her modesty were
registered during 2015, showing an increase of
8.0% over 2014 (14,277 cases). Delhi city with
4,563 cases accounted for 29.6% of total such
cases followed by Mumbai (2,008 cases).
Jodhpur has reported the highest rate (38.7) of
such crimes in comparison to the cities average
rate of 9.6.
Insult to the Modesty of Women
(Incidence: 2,728 Rate: 1.7)
A total of 2,728 cases of insult to the
modesty of women were registered during the
year 2015, showing a decrease of 5.7% in
comparison to the previous year (2,894 cases).
Delhi city (1,262 cases) followed by Mumbai
(412 cases) have accounted for 46.3% and
15.1% of total such cases reported during the
year 2015 respectively. Vijayawada has
reported highest crime rate of 8.2 as compared
to 1.7 at cities average level.
Cruelty by Husband or His Relatives
(Incidence: 19,076 Rate: 11.9) A total of 19,076 cases of cruelty by
husband or his relatives were registered which
is 3.1% less in comparison to the previous year
(19,687 cases). Delhi city (3,190 cases)
followed by Hyderabad (1,606 cases) have
accounted for 16.7% and 8.4% of total such
cases respectively. Jodhpur has reported
highest crime rate of 70.7 as compared to 11.9
at cities average level.
Importation of Girls from Foreign Country
(Incidence: 2 Rate: Negligible)
Only 2 such cases (in Kolkata) were
registered during the year 2015 showing a
decrease of 50.0% in comparison to 4 cases
registered in 2014.
Causing Death by Negligence
(Incidence: 14,454 Rate: 9.0)
A total of 14,454 cases of causing death
by negligence were registered in 53 mega cities
during the year 2015, showing an increase of
3.5% in comparison to the previous year
(13,960 cases). Delhi city (1,438 cases)
registered highest number of such cases
followed by Bengaluru (979 cases),accounting
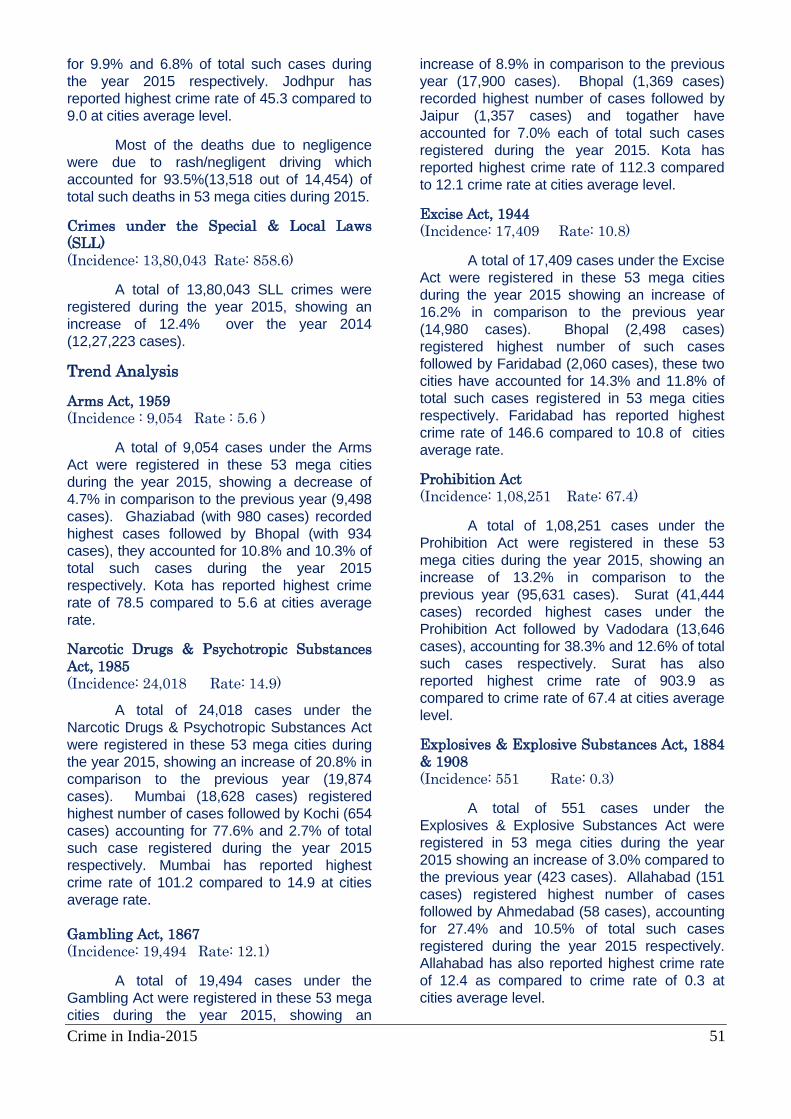
Crime in India-2015 51
for 9.9% and 6.8% of total such cases during
the year 2015 respectively. Jodhpur has
reported highest crime rate of 45.3 compared to
9.0 at cities average level.
Most of the deaths due to negligence
were due to rash/negligent driving which
accounted for 93.5%(13,518 out of 14,454) of
total such deaths in 53 mega cities during 2015.
Crimes under the Special & Local Laws
(SLL)
(Incidence: 13,80,043 Rate: 858.6)
A total of 13,80,043 SLL crimes were
registered during the year 2015, showing an
increase of 12.4% over the year 2014
(12,27,223 cases).
Trend Analysis
Arms Act, 1959
(Incidence : 9,054 Rate : 5.6 )
A total of 9,054 cases under the Arms
Act were registered in these 53 mega cities
during the year 2015, showing a decrease of
4.7% in comparison to the previous year (9,498
cases). Ghaziabad (with 980 cases) recorded
highest cases followed by Bhopal (with 934
cases), they accounted for 10.8% and 10.3% of
total such cases during the year 2015
respectively. Kota has reported highest crime
rate of 78.5 compared to 5.6 at cities average
rate.
Narcotic Drugs & Psychotropic Substances
Act, 1985
(Incidence: 24,018 Rate: 14.9)
A total of 24,018 cases under the
Narcotic Drugs & Psychotropic Substances Act
were registered in these 53 mega cities during
the year 2015, showing an increase of 20.8% in
comparison to the previous year (19,874
cases). Mumbai (18,628 cases) registered
highest number of cases followed by Kochi (654
cases) accounting for 77.6% and 2.7% of total
such case registered during the year 2015
respectively. Mumbai has reported highest
crime rate of 101.2 compared to 14.9 at cities
average rate.
Gambling Act, 1867
(Incidence: 19,494 Rate: 12.1)
A total of 19,494 cases under the
Gambling Act were registered in these 53 mega
cities during the year 2015, showing an
increase of 8.9% in comparison to the previous
year (17,900 cases). Bhopal (1,369 cases)
recorded highest number of cases followed by
Jaipur (1,357 cases) and togather have
accounted for 7.0% each of total such cases
registered during the year 2015. Kota has
reported highest crime rate of 112.3 compared
to 12.1 crime rate at cities average level.
Excise Act, 1944
(Incidence: 17,409 Rate: 10.8)
A total of 17,409 cases under the Excise Act were registered in these 53 mega cities
during the year 2015 showing an increase of
16.2% in comparison to the previous year
(14,980 cases). Bhopal (2,498 cases)
registered highest number of such cases
followed by Faridabad (2,060 cases), these two
cities have accounted for 14.3% and 11.8% of
total such cases registered in 53 mega cities
respectively. Faridabad has reported highest
crime rate of 146.6 compared to 10.8 of cities
average rate.
Prohibition Act
(Incidence: 1,08,251 Rate: 67.4)
A total of 1,08,251 cases under the
Prohibition Act were registered in these 53
mega cities during the year 2015, showing an
increase of 13.2% in comparison to the
previous year (95,631 cases). Surat (41,444
cases) recorded highest cases under the
Prohibition Act followed by Vadodara (13,646
cases), accounting for 38.3% and 12.6% of total
such cases respectively. Surat has also
reported highest crime rate of 903.9 as
compared to crime rate of 67.4 at cities average
level.
Explosives & Explosive Substances Act, 1884
& 1908
(Incidence: 551 Rate: 0.3)
A total of 551 cases under the
Explosives & Explosive Substances Act were
registered in 53 mega cities during the year
2015 showing an increase of 3.0% compared to
the previous year (423 cases). Allahabad (151
cases) registered highest number of cases
followed by Ahmedabad (58 cases), accounting
for 27.4% and 10.5% of total such cases
registered during the year 2015 respectively.
Allahabad has also reported highest crime rate
of 12.4 as compared to crime rate of 0.3 at
cities average level.
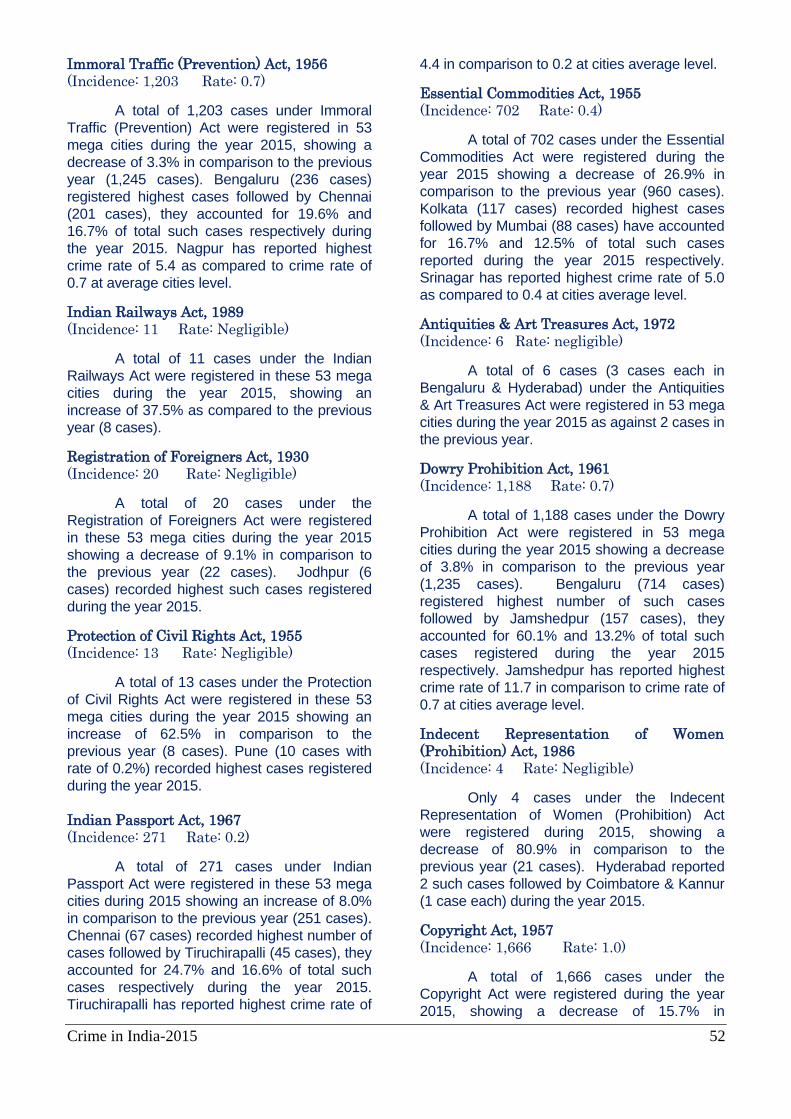
Crime in India-2015 52
Immoral Traffic (Prevention) Act, 1956
(Incidence: 1,203 Rate: 0.7)
A total of 1,203 cases under Immoral
Traffic (Prevention) Act were registered in 53
mega cities during the year 2015, showing a
decrease of 3.3% in comparison to the previous
year (1,245 cases). Bengaluru (236 cases)
registered highest cases followed by Chennai
(201 cases), they accounted for 19.6% and
16.7% of total such cases respectively during
the year 2015. Nagpur has reported highest
crime rate of 5.4 as compared to crime rate of
0.7 at average cities level.
Indian Railways Act, 1989
(Incidence: 11 Rate: Negligible)
A total of 11 cases under the Indian
Railways Act were registered in these 53 mega
cities during the year 2015, showing an
increase of 37.5% as compared to the previous
year (8 cases).
Registration of Foreigners Act, 1930
(Incidence: 20 Rate: Negligible)
A total of 20 cases under the
Registration of Foreigners Act were registered
in these 53 mega cities during the year 2015
showing a decrease of 9.1% in comparison to
the previous year (22 cases). Jodhpur (6
cases) recorded highest such cases registered
during the year 2015.
Protection of Civil Rights Act, 1955
(Incidence: 13 Rate: Negligible)
A total of 13 cases under the Protection
of Civil Rights Act were registered in these 53
mega cities during the year 2015 showing an
increase of 62.5% in comparison to the
previous year (8 cases). Pune (10 cases with
rate of 0.2%) recorded highest cases registered
during the year 2015.
Indian Passport Act, 1967
(Incidence: 271 Rate: 0.2)
A total of 271 cases under Indian
Passport Act were registered in these 53 mega
cities during 2015 showing an increase of 8.0%
in comparison to the previous year (251 cases).
Chennai (67 cases) recorded highest number of
cases followed by Tiruchirapalli (45 cases), they
accounted for 24.7% and 16.6% of total such
cases respectively during the year 2015.
Tiruchirapalli has reported highest crime rate of
4.4 in comparison to 0.2 at cities average level.
Essential Commodities Act, 1955
(Incidence: 702 Rate: 0.4)
A total of 702 cases under the Essential
Commodities Act were registered during the
year 2015 showing a decrease of 26.9% in
comparison to the previous year (960 cases).
Kolkata (117 cases) recorded highest cases
followed by Mumbai (88 cases) have accounted
for 16.7% and 12.5% of total such cases
reported during the year 2015 respectively.
Srinagar has reported highest crime rate of 5.0
as compared to 0.4 at cities average level.
Antiquities & Art Treasures Act, 1972
(Incidence: 6 Rate: negligible)
A total of 6 cases (3 cases each in
Bengaluru & Hyderabad) under the Antiquities
& Art Treasures Act were registered in 53 mega
cities during the year 2015 as against 2 cases in
the previous year.
Dowry Prohibition Act, 1961
(Incidence: 1,188 Rate: 0.7)
A total of 1,188 cases under the Dowry
Prohibition Act were registered in 53 mega
cities during the year 2015 showing a decrease
of 3.8% in comparison to the previous year
(1,235 cases). Bengaluru (714 cases)
registered highest number of such cases
followed by Jamshedpur (157 cases), they
accounted for 60.1% and 13.2% of total such
cases registered during the year 2015
respectively. Jamshedpur has reported highest
crime rate of 11.7 in comparison to crime rate of
0.7 at cities average level.
Indecent Representation of Women
(Prohibition) Act, 1986
(Incidence: 4 Rate: Negligible)
Only 4 cases under the Indecent
Representation of Women (Prohibition) Act
were registered during 2015, showing a
decrease of 80.9% in comparison to the
previous year (21 cases). Hyderabad reported
2 such cases followed by Coimbatore & Kannur
(1 case each) during the year 2015.
Copyright Act, 1957
(Incidence: 1,666 Rate: 1.0)
A total of 1,666 cases under the
Copyright Act were registered during the year
2015, showing a decrease of 15.7% in
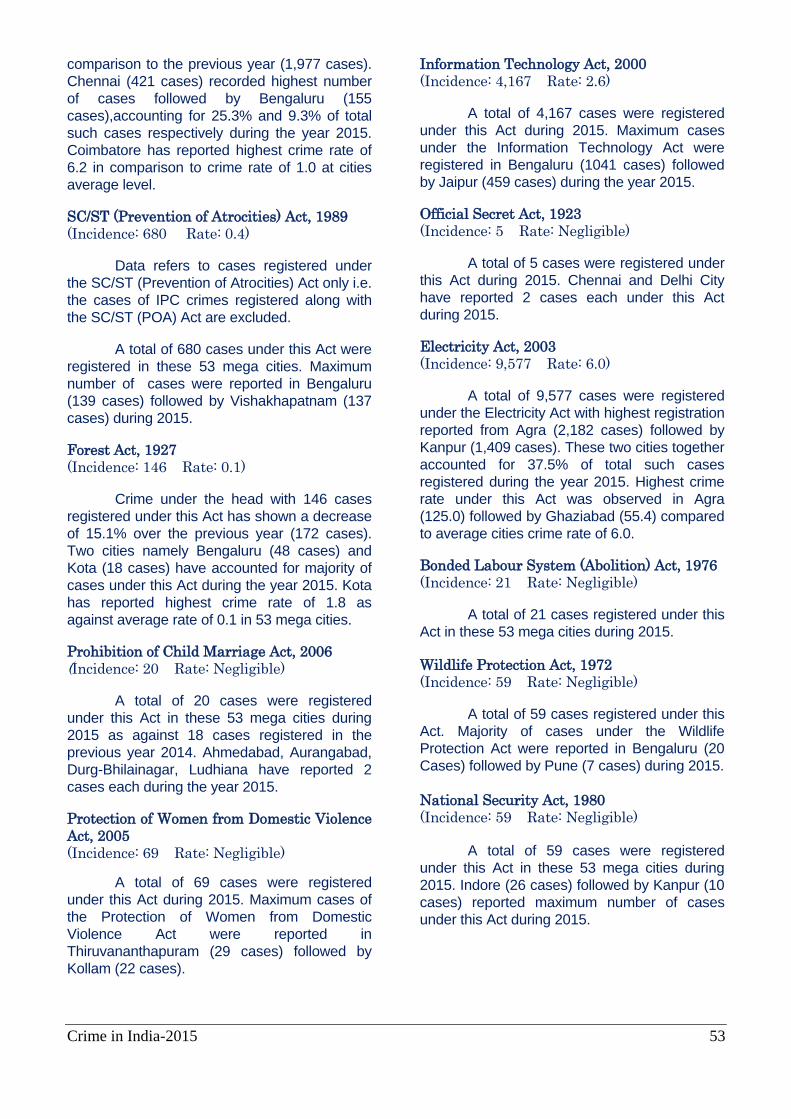
Crime in India-2015 53
comparison to the previous year (1,977 cases).
Chennai (421 cases) recorded highest number
of cases followed by Bengaluru (155
cases),accounting for 25.3% and 9.3% of total
such cases respectively during the year 2015.
Coimbatore has reported highest crime rate of
6.2 in comparison to crime rate of 1.0 at cities
average level.
SC/ST (Prevention of Atrocities) Act, 1989
(Incidence: 680 Rate: 0.4)
Data refers to cases registered under
the SC/ST (Prevention of Atrocities) Act only i.e.
the cases of IPC crimes registered along with
the SC/ST (POA) Act are excluded.
A total of 680 cases under this Act were
registered in these 53 mega cities. Maximum
number of cases were reported in Bengaluru
(139 cases) followed by Vishakhapatnam (137
cases) during 2015.
Forest Act, 1927
(Incidence: 146 Rate: 0.1)
Crime under the head with 146 cases
registered under this Act has shown a decrease
of 15.1% over the previous year (172 cases).
Two cities namely Bengaluru (48 cases) and
Kota (18 cases) have accounted for majority of
cases under this Act during the year 2015. Kota
has reported highest crime rate of 1.8 as
against average rate of 0.1 in 53 mega cities.
Prohibition of Child Marriage Act, 2006
(Incidence: 20 Rate: Negligible)
A total of 20 cases were registered
under this Act in these 53 mega cities during
2015 as against 18 cases registered in the
previous year 2014. Ahmedabad, Aurangabad,
Durg-Bhilainagar, Ludhiana have reported 2
cases each during the year 2015.
Protection of Women from Domestic Violence
Act, 2005
(Incidence: 69 Rate: Negligible)
A total of 69 cases were registered
under this Act during 2015. Maximum cases of
the Protection of Women from Domestic
Violence Act were reported in
Thiruvananthapuram (29 cases) followed by
Kollam (22 cases).
Information Technology Act, 2000
(Incidence: 4,167 Rate: 2.6)
A total of 4,167 cases were registered
under this Act during 2015. Maximum cases
under the Information Technology Act were
registered in Bengaluru (1041 cases) followed
by Jaipur (459 cases) during the year 2015.
Official Secret Act, 1923
(Incidence: 5 Rate: Negligible)
A total of 5 cases were registered under
this Act during 2015. Chennai and Delhi City
have reported 2 cases each under this Act
during 2015.
Electricity Act, 2003
(Incidence: 9,577 Rate: 6.0)
A total of 9,577 cases were registered
under the Electricity Act with highest registration
reported from Agra (2,182 cases) followed by
Kanpur (1,409 cases). These two cities together
accounted for 37.5% of total such cases
registered during the year 2015. Highest crime
rate under this Act was observed in Agra
(125.0) followed by Ghaziabad (55.4) compared
to average cities crime rate of 6.0.
Bonded Labour System (Abolition) Act, 1976
(Incidence: 21 Rate: Negligible)
A total of 21 cases registered under this
Act in these 53 mega cities during 2015.
Wildlife Protection Act, 1972
(Incidence: 59 Rate: Negligible)
A total of 59 cases registered under this
Act. Majority of cases under the Wildlife
Protection Act were reported in Bengaluru (20
Cases) followed by Pune (7 cases) during 2015.
National Security Act, 1980
(Incidence: 59 Rate: Negligible)
A total of 59 cases were registered
under this Act in these 53 mega cities during
2015. Indore (26 cases) followed by Kanpur (10
cases) reported maximum number of cases
under this Act during 2015.

Crime in India-2015 54
Unlawful Activities (Prevention) Act, 1967
(Incidence: 43 Rate: Negligible)
A total of 43 cases were registered
under this Act during 2015. Srinagar (14 cases)
and Kolkata (12 cases) together contributed
60.5% of total such cases (26 out of 43 cases)
during 2015.
Prevention of Damage to Public Property Act,
1984
(Incidence: 567 Rate: 0.4)
A total of 567 cases were registered
under this Act during 2015. Kanpur (68 cases)
and Lucknow (52 cases) together contributed
21.2%(119 out of 416 cases) of total such
cases under this Act during 2015.
Trade Marks Act, 1999
(Incidence: 155 Rate:0.1)
A total of 155 cases were registered
under this Act in these 53 mega cities during
2015. Lucknow (55 cases) reported maximum
number of cases under the Act accounting for
34.2% of total such cases under this Act during
2015.
Lotteries (Regulation) Act, 1998
(Incidence: 851 Rate: 0.5)
A total of 851 cases were registered
under this Act in these 53 mega cities during
2015. The maximum cases under the Lotteries
(Regulation) Act were registered in Coimbatore
(334 cases) followed by Chennai (262 cases).
Tiruchirapalli had highest rate at 15.9 compared
to all cities average of 0.5 during 2015.
Foreigners Act, 1946
(Incidence: 90 Rate: 0.1)
A total of 90 cases were registered
under this Act in these 53 mega cities during
2015. The maximum cases under the
Foreigners Act were reported in Bengaluru (25
cases) followed by Delhi city (20 cases)
contributing 50.0% of total such cases under
this Act reported in 53 mega cities during 2015.
Representation of People Act, 1946
(Incidence: 47 Rate: Negligible)
A total of 47 cases were registered
under this Act during 2015. The majority of
cases under the Representation of People Act,
1951 were reported in Bengaluru (32 cases)
followed by Aurangabad (7 cases) contributing
83.0% of total such cases registered in 53
mega cities during 2015.
Juvenile Justice (Care and Protection of
Children) Act, 2000
(Incidence: 721 Rate: 0.4)
A total of 721 cases were registered
under this Act in these 53 mega cities during
2015. Mumbai (231 cases) followed by Jaipur
(164 cases) together contributed 54.8% (395
out of 721 cases) of total such cases during
2015.
Emigration Act, 1983
(Incidence: 31 Rate: Negligible)
A total of 31 cases were registered
under this Act in these 53 mega cities during
2015. Majority of such cases were reported
from Kochi (16 cases) accounting for 51.6%
(16 out of 31 cases) of total such cases during
2015.
Protection of Children from Sexual Offences
Act 2012
(Incidence: 2,355 Rate: 1.5)
A total of 2,355 cases were registered
under this Act in these 53 mega cities during
2015. Majority of such cases were reported by
Bengaluru (273 cases) followed by
Ahmedabad (191 cases) and Indore (189
cases) accounting for 11.6%, 8.1% and 8.0%
of total such cases registered during 2015
respectively. Durg-Bhilainagar at 12.8, Raipur
at 10.8 and Jabalpur at 10.7 reported highest
rate under this Act compared to average cities
rate of 1.5 during 2015.
Pre-Natal Diagnostic Techniques (Regulation
and Prevention of Misuse) Act, 1994
(Incidence: 1 Rate: Negligible)
Only 1 case in Ahmedabad was
registered under this Act during 2015.
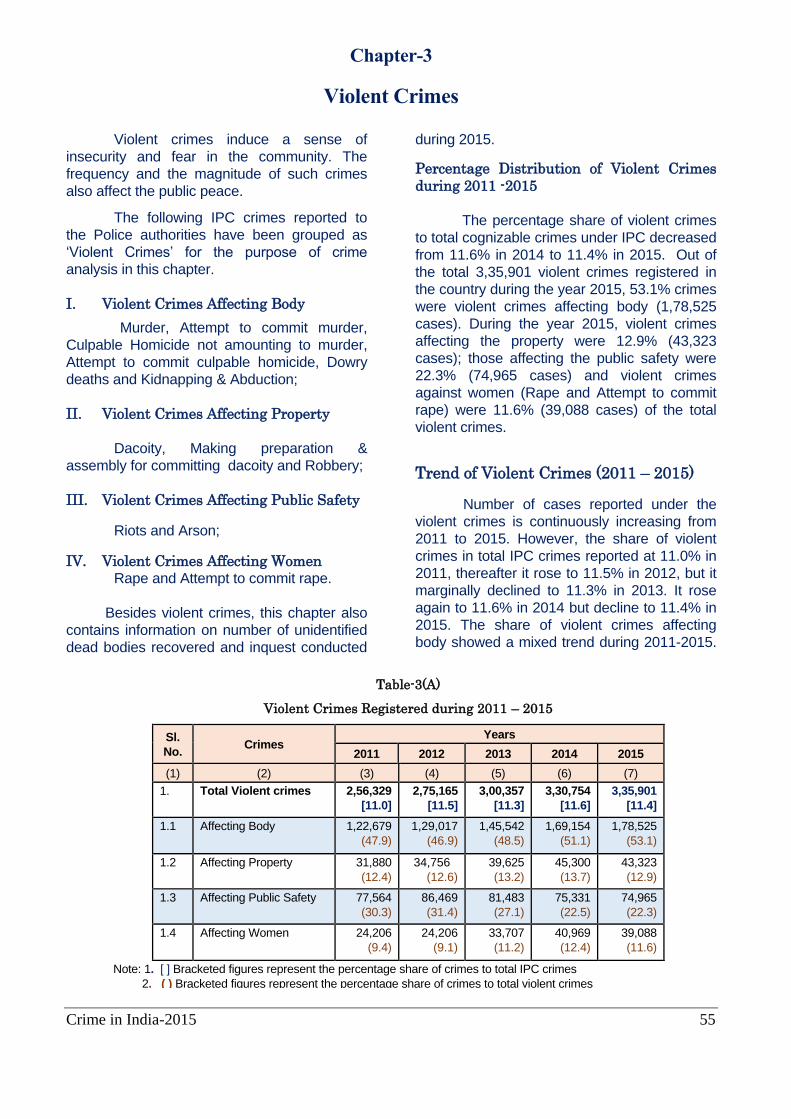
Crime in India-2015 55
Table-3(A)
Violent Crimes Registered during 2011 – 2015
Sl.
No. Crimes
Years
2011 2012 2013 2014 2015
(1) (2) (3) (4) (5) (6) (7)
1. Total Violent crimes 2,56,329
[11.0]
2,75,165
[11.5]
3,00,357
[11.3]
3,30,754
[11.6]
3,35,901
[11.4]
1.1 Affecting Body 1,22,679
(47.9)
1,29,017
(46.9)
1,45,542
(48.5)
1,69,154
(51.1)
1,78,525
(53.1)
1.2 Affecting Property 31,880
(12.4)
34,756
(12.6)
39,625
(13.2)
45,300
(13.7)
43,323
(12.9)
1.3 Affecting Public Safety 77,564
(30.3)
86,469
(31.4)
81,483
(27.1)
75,331
(22.5)
74,965
(22.3)
1.4 Affecting Women 24,206
(9.4)
24,206
(9.1)
33,707
(11.2)
40,969
(12.4)
39,088
(11.6)
Note: 1. [ ] Bracketed figures represent the percentage share of crimes to total IPC crimes
2. ( ) Bracketed figures represent the percentage share of crimes to total violent crimes
Chapter-3
Violent Crimes
Violent crimes induce a sense of
insecurity and fear in the community. The
frequency and the magnitude of such crimes
also affect the public peace.
The following IPC crimes reported to
the Police authorities have been grouped as
‘Violent Crimes’ for the purpose of crime
analysis in this chapter.
I. Violent Crimes Affecting Body
Murder, Attempt to commit murder,
Culpable Homicide not amounting to murder,
Attempt to commit culpable homicide, Dowry
deaths and Kidnapping & Abduction;
II. Violent Crimes Affecting Property
Dacoity, Making preparation &
assembly for committing dacoity and Robbery;
III. Violent Crimes Affecting Public Safety
Riots and Arson;
IV. Violent Crimes Affecting Women
Rape and Attempt to commit rape.
Besides violent crimes, this chapter also
contains information on number of unidentified
dead bodies recovered and inquest conducted
during 2015.
Percentage Distribution of Violent Crimes
during 2011 -2015
The percentage share of violent crimes
to total cognizable crimes under IPC decreased
from 11.6% in 2014 to 11.4% in 2015. Out of
the total 3,35,901 violent crimes registered in
the country during the year 2015, 53.1% crimes
were violent crimes affecting body (1,78,525
cases). During the year 2015, violent crimes
affecting the property were 12.9% (43,323
cases); those affecting the public safety were
22.3% (74,965 cases) and violent crimes
against women (Rape and Attempt to commit
rape) were 11.6% (39,088 cases) of the total
violent crimes.
Trend of Violent Crimes (2011 – 2015)
Number of cases reported under the
violent crimes is continuously increasing from
2011 to 2015. However, the share of violent
crimes in total IPC crimes reported at 11.0% in
2011, thereafter it rose to 11.5% in 2012, but it
marginally declined to 11.3% in 2013. It rose
again to 11.6% in 2014 but decline to 11.4% in
2015. The share of violent crimes affecting
body showed a mixed trend during 2011-2015.
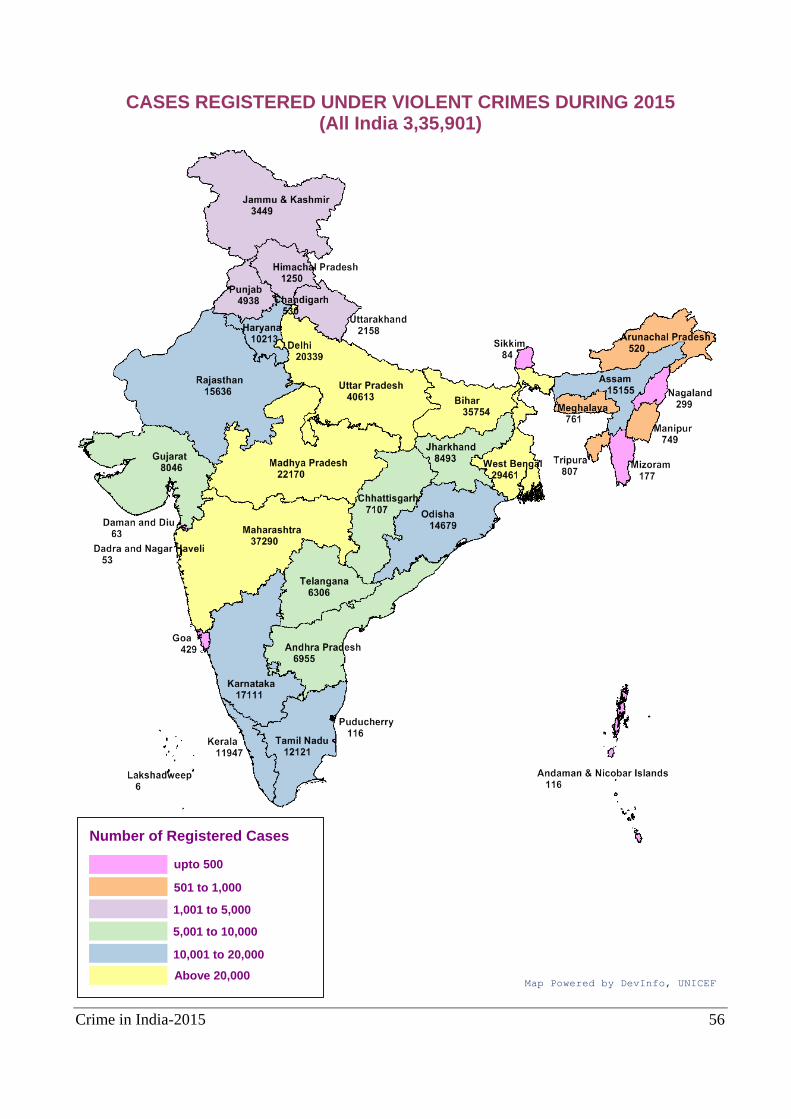
Crime in India-2015 56
CASES REGISTERED UNDER VIOLENT CRIMES DURING 2015 (All India 3,35,901)
Number of Registered Cases
upto 500
1,001 to 5,000
Above 20,000 Map Powered by DevInfo, UNICEF
501 to 1,000
5,001 to 10,000
10,001 to 20,000
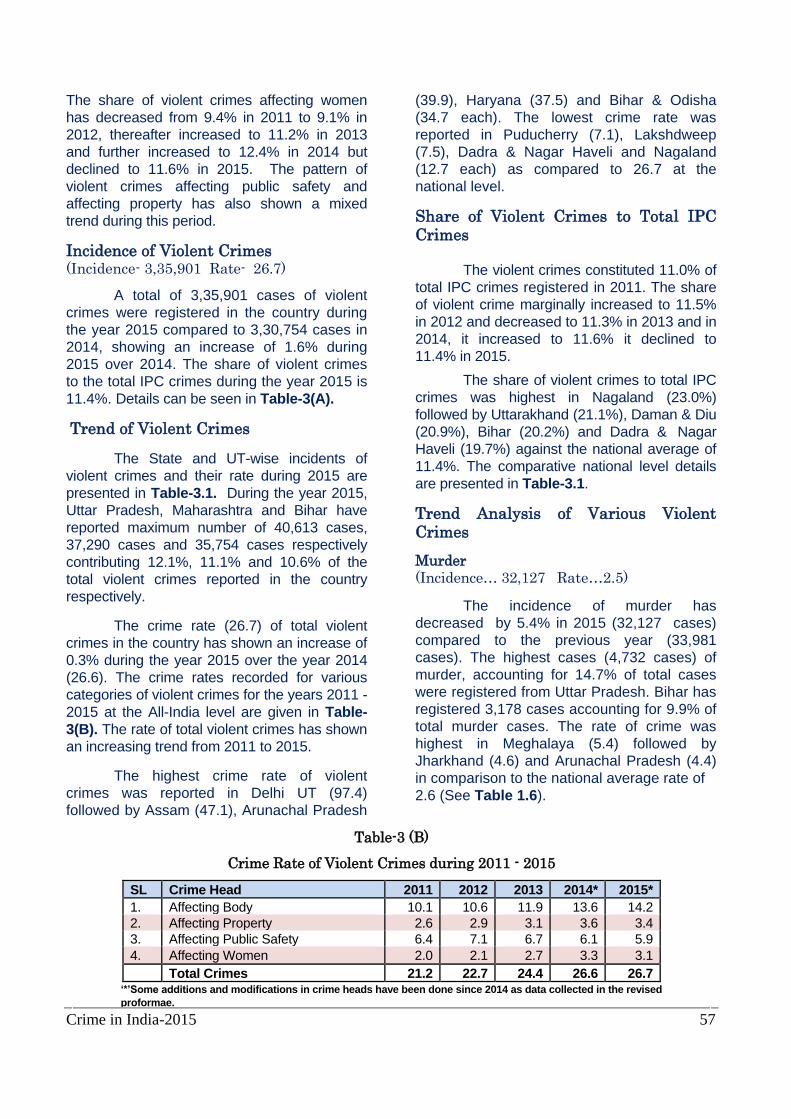
Crime in India-2015 57
The share of violent crimes affecting women
has decreased from 9.4% in 2011 to 9.1% in
2012, thereafter increased to 11.2% in 2013
and further increased to 12.4% in 2014 but
declined to 11.6% in 2015. The pattern of
violent crimes affecting public safety and
affecting property has also shown a mixed
trend during this period.
Incidence of Violent Crimes (Incidence- 3,35,901 Rate- 26.7)
A total of 3,35,901 cases of violent
crimes were registered in the country during
the year 2015 compared to 3,30,754 cases in
2014, showing an increase of 1.6% during
2015 over 2014. The share of violent crimes
to the total IPC crimes during the year 2015 is
11.4%. Details can be seen in Table-3(A).
Trend of Violent Crimes
The State and UT-wise incidents of
violent crimes and their rate during 2015 are
presented in Table-3.1. During the year 2015,
Uttar Pradesh, Maharashtra and Bihar have
reported maximum number of 40,613 cases,
37,290 cases and 35,754 cases respectively
contributing 12.1%, 11.1% and 10.6% of the
total violent crimes reported in the country
respectively.
The crime rate (26.7) of total violent
crimes in the country has shown an increase of
0.3% during the year 2015 over the year 2014
(26.6). The crime rates recorded for various
categories of violent crimes for the years 2011 -
2015 at the All-India level are given in Table-
3(B). The rate of total violent crimes has shown
an increasing trend from 2011 to 2015.
The highest crime rate of violent
crimes was reported in Delhi UT (97.4)
followed by Assam (47.1), Arunachal Pradesh
(39.9), Haryana (37.5) and Bihar & Odisha
(34.7 each). The lowest crime rate was
reported in Puducherry (7.1), Lakshdweep
(7.5), Dadra & Nagar Haveli and Nagaland
(12.7 each) as compared to 26.7 at the
national level.
Share of Violent Crimes to Total IPC Crimes
The violent crimes constituted 11.0% of
total IPC crimes registered in 2011. The share
of violent crime marginally increased to 11.5%
in 2012 and decreased to 11.3% in 2013 and in
2014, it increased to 11.6% it declined to
11.4% in 2015.
The share of violent crimes to total IPC
crimes was highest in Nagaland (23.0%)
followed by Uttarakhand (21.1%), Daman & Diu
(20.9%), Bihar (20.2%) and Dadra & Nagar
Haveli (19.7%) against the national average of
11.4%. The comparative national level details
are presented in Table-3.1.
Trend Analysis of Various Violent Crimes
Murder
(Incidence… 32,127 Rate…2.5)
The incidence of murder has
decreased by 5.4% in 2015 (32,127 cases)
compared to the previous year (33,981
cases). The highest cases (4,732 cases) of
murder, accounting for 14.7% of total cases
were registered from Uttar Pradesh. Bihar has
registered 3,178 cases accounting for 9.9% of
total murder cases. The rate of crime was
highest in Meghalaya (5.4) followed by
Jharkhand (4.6) and Arunachal Pradesh (4.4)
in comparison to the national average rate of
2.6 (See Table 1.6).
Table-3 (B)
Crime Rate of Violent Crimes during 2011 - 2015
SL Crime Head 2011 2012 2013 2014* 2015*
1. Affecting Body 10.1 10.6 11.9 13.6 14.2
2. Affecting Property 2.6 2.9 3.1 3.6 3.4
3. Affecting Public Safety 6.4 7.1 6.7 6.1 5.9
4. Affecting Women 2.0 2.1 2.7 3.3 3.1
Total Crimes 21.2 22.7 24.4 26.6 26.7 ‘*’Some additions and modifications in crime heads have been done since 2014 as data collected in the revised
proformae.
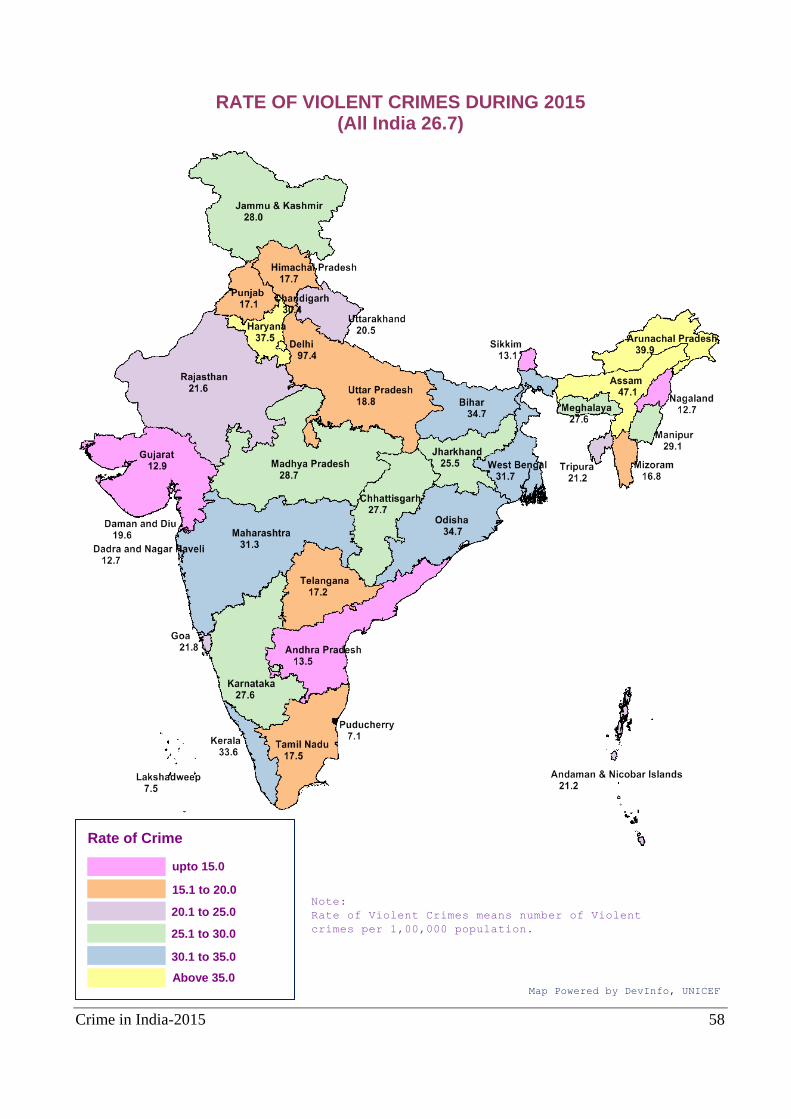
Crime in India-2015 58
RATE OF VIOLENT CRIMES DURING 2015 (All India 26.7)
Rate of Crime
upto 15.0
20.1 to 25.0
Above 35.0 Map Powered by DevInfo, UNICEF
15.1 to 20.0
25.1 to 30.0
30.1 to 35.0
Note:
Rate of Violent Crimes means number of Violent
crimes per 1,00,000 population.
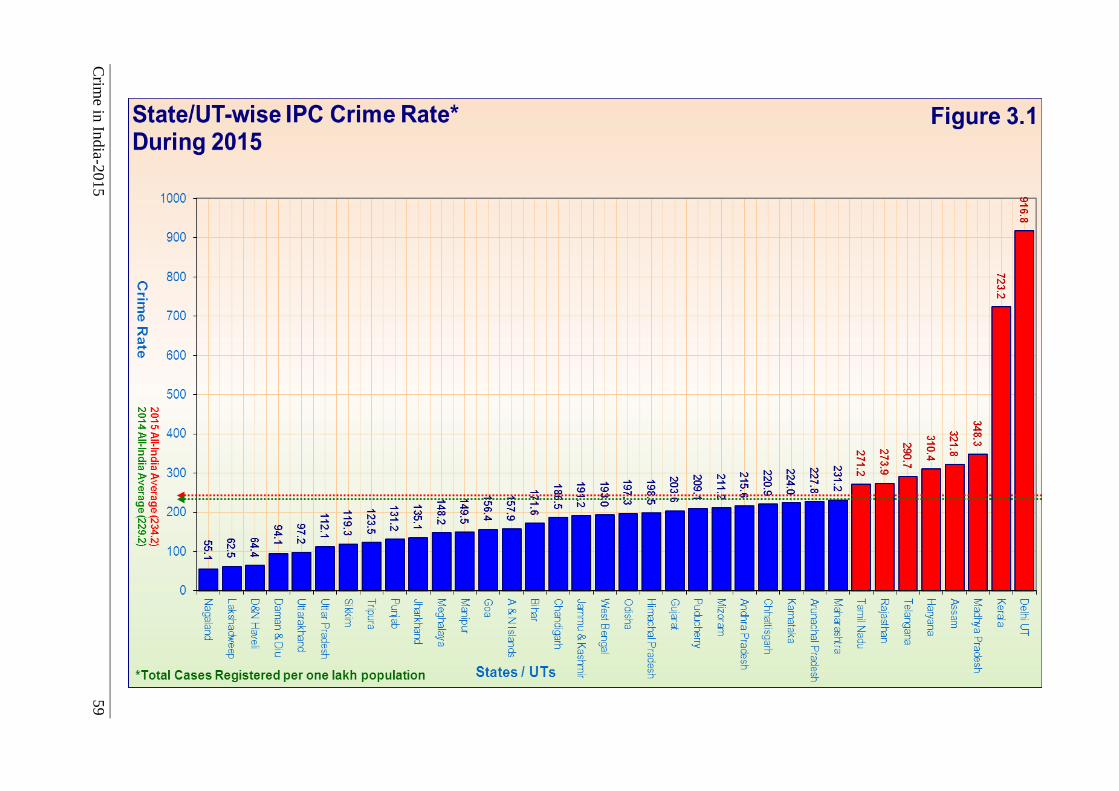
Crim
e in In
dia-2
015
59
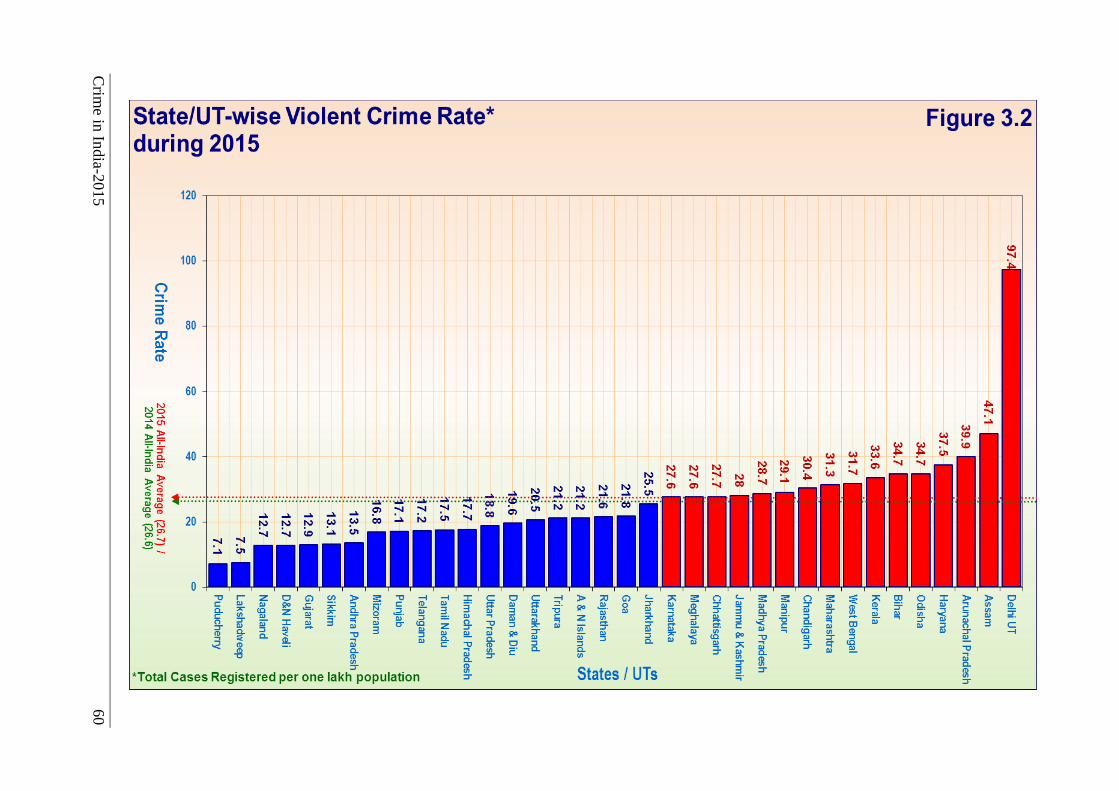
Crim
e in In
dia-2
015
60
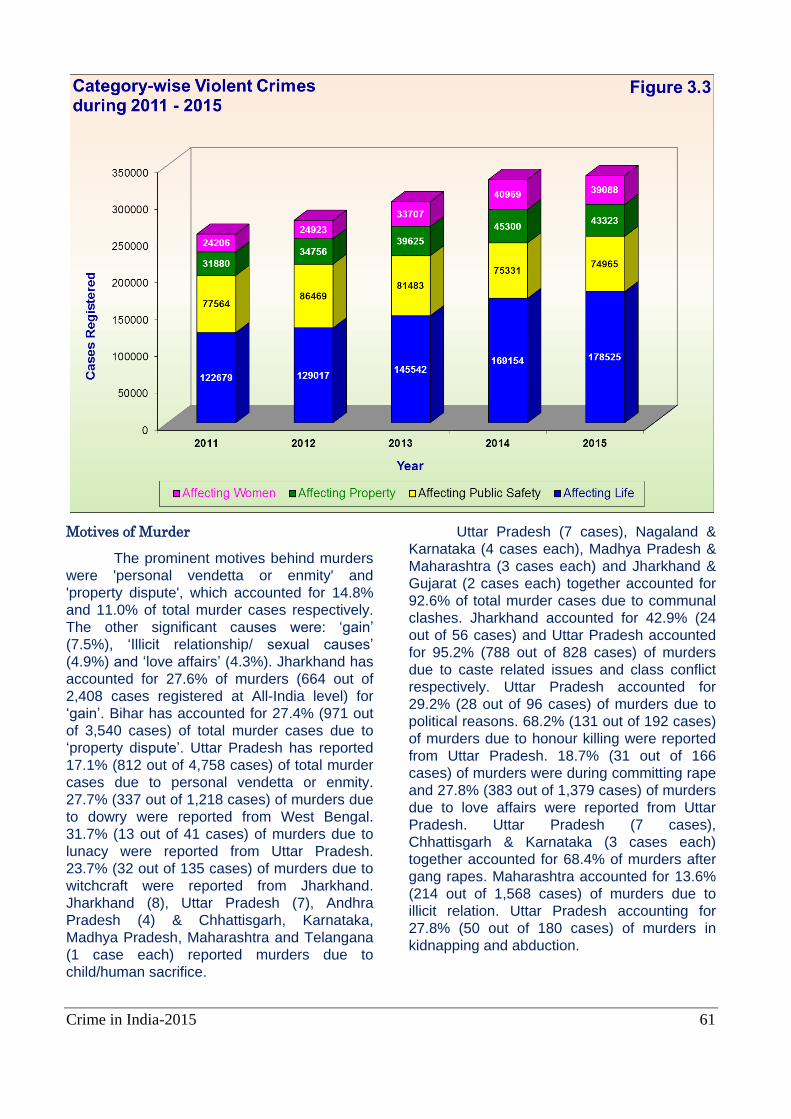
Crime in India-2015 61
Motives of Murder
The prominent motives behind murders
were 'personal vendetta or enmity' and
'property dispute', which accounted for 14.8%
and 11.0% of total murder cases respectively.
The other significant causes were: ‘gain’
(7.5%), ‘Illicit relationship/ sexual causes’
(4.9%) and ‘love affairs’ (4.3%). Jharkhand has
accounted for 27.6% of murders (664 out of
2,408 cases registered at All-India level) for
‘gain’. Bihar has accounted for 27.4% (971 out
of 3,540 cases) of total murder cases due to
‘property dispute’. Uttar Pradesh has reported
17.1% (812 out of 4,758 cases) of total murder
cases due to personal vendetta or enmity.
27.7% (337 out of 1,218 cases) of murders due
to dowry were reported from West Bengal.
31.7% (13 out of 41 cases) of murders due to
lunacy were reported from Uttar Pradesh.
23.7% (32 out of 135 cases) of murders due to
witchcraft were reported from Jharkhand.
Jharkhand (8), Uttar Pradesh (7), Andhra
Pradesh (4) & Chhattisgarh, Karnataka,
Madhya Pradesh, Maharashtra and Telangana
(1 case each) reported murders due to
child/human sacrifice.
Uttar Pradesh (7 cases), Nagaland &
Karnataka (4 cases each), Madhya Pradesh &
Maharashtra (3 cases each) and Jharkhand &
Gujarat (2 cases each) together accounted for
92.6% of total murder cases due to communal
clashes. Jharkhand accounted for 42.9% (24
out of 56 cases) and Uttar Pradesh accounted
for 95.2% (788 out of 828 cases) of murders
due to caste related issues and class conflict
respectively. Uttar Pradesh accounted for
29.2% (28 out of 96 cases) of murders due to
political reasons. 68.2% (131 out of 192 cases)
of murders due to honour killing were reported
from Uttar Pradesh. 18.7% (31 out of 166
cases) of murders were during committing rape
and 27.8% (383 out of 1,379 cases) of murders
due to love affairs were reported from Uttar
Pradesh. Uttar Pradesh (7 cases),
Chhattisgarh & Karnataka (3 cases each)
together accounted for 68.4% of murders after
gang rapes. Maharashtra accounted for 13.6%
(214 out of 1,568 cases) of murders due to
illicit relation. Uttar Pradesh accounting for
27.8% (50 out of 180 cases) of murders in
kidnapping and abduction.
Crime in India-2015 62
Attempt to Commit Murder
(Incidence… 46,471 Rate… 3.7)
During 2015, the cases of attempt to
commit murder (46,471 cases) have increased
by 11.2% over the previous year (41,791). West
Bengal has registered the highest (9,918 cases)
incidents of attempt to commit murder cases
followed by Bihar with 5,981 cases. The crime
rate was the highest in West Bengal (10.7)
against the national average of 3.7 in 2015.
Culpable Homicide not Amounting to Murder
(Incidence......3,176 Rate… 0.3)
The cases of culpable homicide not
amounting to murder have declined by 4.7%
during 2015 (3,176 cases) over previous year
(3,332). Uttar Pradesh has reported the highest
number of culpable homicide not amounting to
murder cases accounting for 42.1%(1,338 out of
3,176 cases) of such cases registered at the
national level during 2015.
Motives of Culpable Homicide (C.H.) not
Amounting to Murder
‘Personal vendetta or enmity’, ‘ Class
conflict’ and ‘Property dispute’ were the major
motives reported under culpable homicide not
amounting to murder accounting for 11.7%,
9.7% and 8.0% of total such cases during 2015
respectively. Uttar Pradesh has accounted for
the highest number of culpable homicide not
amounting to murder cases for 'gain' (35.1%) &
‘property dispute’ (78.8%). Uttar Pradesh
accounted for (247 cases out of 372 cases) of
culpable homicide not amounting to murder
(66.4%) due to ‘personal vendetta or enmity’’.
A total of 1,993 cases of culpable
homicide not amounting to murder, which
accounted for 62.8% of total cases, could not be
classified under the specified category of
motives.
Attempt to Commit Culpable Homicide
(Incidence… 6,118 Rate… 0.5)
The cases of attempt to commit
Culpable Homicide (C.H.) not amounting to
murder accounted for 1.8% (6,118 out of
3,35,901 cases) of total violent crimes during
2015. Kerala has registered the highest number
of 2,059 cases accounting for 33.7% of such
cases registered at national level during 2015.
Rape
(Incidence…34,651 Rate… 5.7) (It excludes cases registered under the Protection of Children from
Sexual Offence Act 2012)
The number of rape cases showed a
significant increase of 88.7% over the year 2005
level, an increase of 22.2% over the
quinquennial average of 2010 - 2014 and a
decline of 5.7% over the previous year (36,735
cases). Madhya Pradesh has recorded the
highest incidents of rape (4,391 cases)
accounting for 12.7% of all the rape cases
registered in the country, followed by
Maharashtra 12.0%. Delhi followed by Andaman
& Nicobar has reported the highest crime rate of
23.7 and 13.5 per one lakh female population
respectively against the national average of 5.7
during the year 2015.
Attempt to Commit Rape
(Incidence…4,437 Rate… 0.7)
The cases of attempt to commit rape
accounted for 1.3% (4,437 out of 3,35,901
cases) of total violent crimes during 2015. West
Bengal has reported the highest number of
1,551 cases accounting for 35.0% of such cases
registered at national level during 2015. Kidnapping & Abduction
(Incidence… 82,999 Rate… 6.6)
A total of 82,999 cases of ‘kidnapping &
abduction' were registered during the year 2015
showing an increase of 263.5% over the 2005
level (22,832 cases), an increase of 51.8% over
the quinquennial average of 2010 - 2014 and an
increase of 7.5% over the previous year (77,237
cases). The highest incidents of kidnapping &
abduction were reported from Uttar Pradesh
(11,999 cases) accounting for 14.5% of the total
cases registered in the country.
Dacoity
(Incidence… 3,972 Rate… 0.3)
The incidents of dacoity showed a
decline of 22.7% over the 2005 level (5,141
cases), decline of 9.3% over the quinquennial
average of 2010 - 2014 and a decrease of 9.6%
over the previous year (4,395 cases).
Maharashtra has reported the highest number of
dacoities (784 cases) accounting for 19.7% of
Crime in India-2015 63
the total such cases registered in the country.
Bihar with 426 cases has accounted for 10.7%
of the total cases in the country. The crime rate
was highest in Meghalaya (1.5) against the
national average of 0.3.
Making Preparation & Assembly for
Committing Dacoity
(Incidence… 3,163 Rate… 0.3)
The incidents of making preparation &
assembly for committing dacoity (3,163 cases)
during the year 2015 registered an increase of
11.6% over 2005 level (2,834 cases), an
increase of 8.3% over the quinquennial average
of 2010 – 2014 and an increase of 11.6% over
the previous year (2,834 cases). West Bengal
has reported the highest number (1,424 cases)
of such incidence accounting for 45.0% of total
such cases at the national level. The crime rate
of 1.5 was reported in West Bengal against the
national average of 0.3.
Robbery
(Incidence… 36,188 Rate… 2.9)
The incidence of robbery (36,188)
showed an increase of 104.8% during 2015
over the 2005 level (17,673 cases), an
increase of 24.4% over the quinquennial
average of 2010 - 2014 and however a decline
of 4.9% over the previous year (38,071 cases).
The highest number of cases was reported
from Maharashtra accounting for 23.7% (8,561
out of 36,188 cases) of total robbery cases.
Delhi UT has also reported the highest crime
rate of 35.5 against the national average of 2.9.
Riots
(Incidence…65,255 Rate… 5.2)
The incidents of rioting (65,255 cases)
have increased by 16.0% during the year 2015
over the year 2005 level, declined by 6.5% over
the quinquennial average of 2010 – 2014 and
decreased by 1.2% over the previous year
(66,042 cases). The highest numbers of such
incidents were reported from Bihar accounting
for 20.4%(13,311 out of 65,255 cases) of total
riots cases followed by Maharashtra accounting
for 12.8% (8,336 cases) of total such cases
registered in the country. The crime rate was
highest in Kerala (16.4) against the national
average of 5.2.
Arson
(Incidence… 9,710 Rate…..0.8)
The cases of arson during the year 2015
have shown an increase of 14.9% over the 2005
level; an increase of 1.0% over the quinquennial
average of 2010 – 2014 and an increase of
4.5% over the year 2014 (9,289 cases).
Maharashtra (1,299 cases) has reported the
highest number of cases accounting for 13.4%
followed by Madhya Pradesh at 8.6% of the total
such cases at the national level. The highest
crime rate was reported in Lakshadweep (6.3)
against the national average of 0.8.
Dowry Death
(Incidence… 7,634 Rate… 1.3)
The incidents of dowry death during the
year 2015 (7,634 cases) have increased by
12.5% over the 2005 level, decreased by 8.6%
over quinquennial average of 2010 - 2014 and
decreased by 9.7% over previous year (8,455
cases). Uttar Pradesh has reported the highest
number of such cases (2,335 cases) followed by
Bihar (1,154 cases). The crime rate for dowry
deaths was highest in Bihar & Uttar Pradesh
with (2.3 each) per one lakh female population
against the national rate of 1.3 during 2015.
Victims of Various Crimes under IPC
So far information on victims of violent
crimes viz. murder, C.H. not amounting to
murder, kidnapping & abduction and rape was
concerned it was being collected and published
in the Crime in India report every year.
However, it felt requirement to enhance the
scope & coverage of information on victims
reported under various IPC crimes and Special
and Local Law. Accordingly collection of
gender-wise information was started on all
important heads of IPC crimes as well as
Special & Local Act especially bodily affected
crimes since 2014 in the revised proformae.
Detailed information on number of victims
under the crime heads of IPC and SLL can be
seen in Table 1.6 and 1.13 respectively. Age-
wise and gender-wise detailed information on
victims of murder, C.H. not amounting to
murder and rape is collected separately. A
detailed analysis on these three heads is as
under:
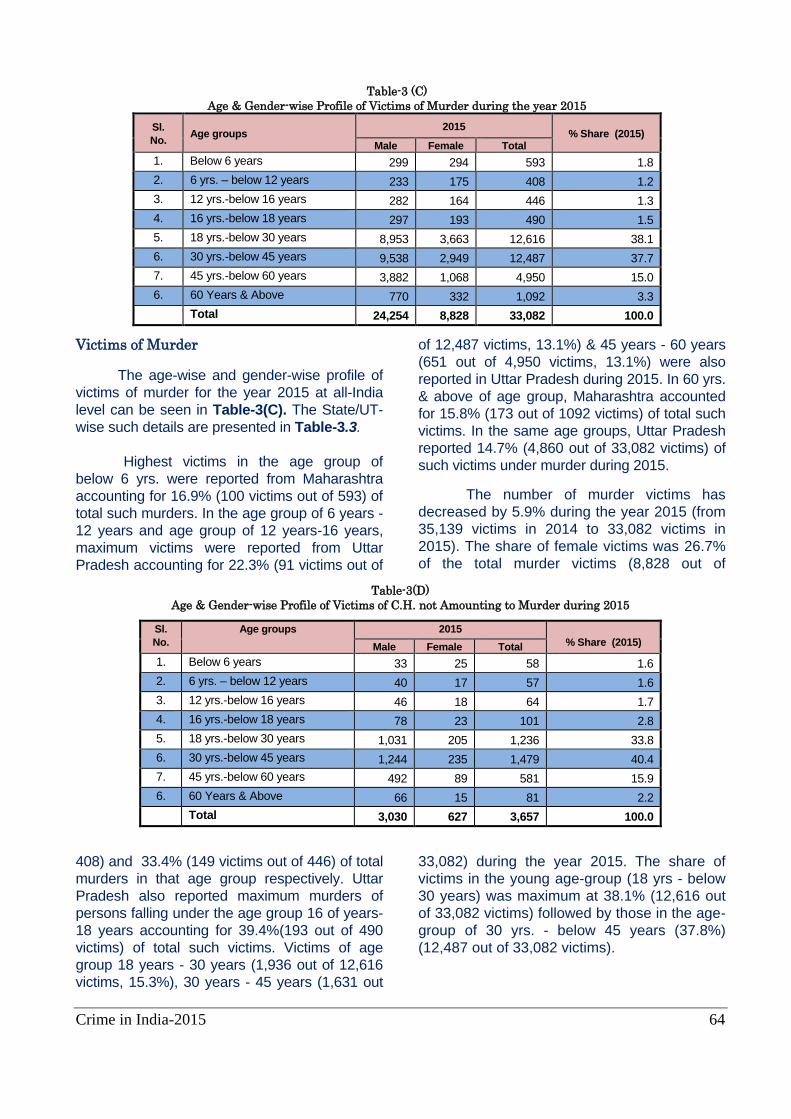
Crime in India-2015 64
Victims of Murder
The age-wise and gender-wise profile of
victims of murder for the year 2015 at all-India
level can be seen in Table-3(C). The State/UT-
wise such details are presented in Table-3.3.
Highest victims in the age group of
below 6 yrs. were reported from Maharashtra
accounting for 16.9% (100 victims out of 593) of
total such murders. In the age group of 6 years -
12 years and age group of 12 years-16 years,
maximum victims were reported from Uttar
Pradesh accounting for 22.3% (91 victims out of
408) and 33.4% (149 victims out of 446) of total
murders in that age group respectively. Uttar
Pradesh also reported maximum murders of
persons falling under the age group 16 of years-
18 years accounting for 39.4%(193 out of 490
victims) of total such victims. Victims of age
group 18 years - 30 years (1,936 out of 12,616
victims, 15.3%), 30 years - 45 years (1,631 out
of 12,487 victims, 13.1%) & 45 years - 60 years
(651 out of 4,950 victims, 13.1%) were also
reported in Uttar Pradesh during 2015. In 60 yrs.
& above of age group, Maharashtra accounted
for 15.8% (173 out of 1092 victims) of total such
victims. In the same age groups, Uttar Pradesh
reported 14.7% (4,860 out of 33,082 victims) of
such victims under murder during 2015.
The number of murder victims has
decreased by 5.9% during the year 2015 (from
35,139 victims in 2014 to 33,082 victims in
2015). The share of female victims was 26.7%
of the total murder victims (8,828 out of
33,082) during the year 2015. The share of
victims in the young age-group (18 yrs - below
30 years) was maximum at 38.1% (12,616 out
of 33,082 victims) followed by those in the age-
group of 30 yrs. - below 45 years (37.8%)
(12,487 out of 33,082 victims).
Table-3 (C)
Age & Gender-wise Profile of Victims of Murder during the year 2015
Sl.
No. Age groups
2015 % Share (2015)
Male Female Total
1. Below 6 years 299 294 593 1.8
2. 6 yrs. – below 12 years 233 175 408 1.2
3. 12 yrs.-below 16 years 282 164 446 1.3
4. 16 yrs.-below 18 years 297 193 490 1.5
5. 18 yrs.-below 30 years 8,953 3,663 12,616 38.1
6. 30 yrs.-below 45 years 9,538 2,949 12,487 37.7
7. 45 yrs.-below 60 years 3,882 1,068 4,950 15.0
6. 60 Years & Above 770 332 1,092 3.3
Total 24,254 8,828 33,082 100.0
Table-3(D)
Age & Gender-wise Profile of Victims of C.H. not Amounting to Murder during 2015
Sl.
No.
Age groups 2015
% Share (2015) Male Female Total
1. Below 6 years 33 25 58 1.6
2. 6 yrs. – below 12 years 40 17 57 1.6
3. 12 yrs.-below 16 years 46 18 64 1.7
4. 16 yrs.-below 18 years 78 23 101 2.8
5. 18 yrs.-below 30 years 1,031 205 1,236 33.8
6. 30 yrs.-below 45 years 1,244 235 1,479 40.4
7. 45 yrs.-below 60 years 492 89 581 15.9
6. 60 Years & Above 66 15 81 2.2
Total 3,030 627 3,657 100.0
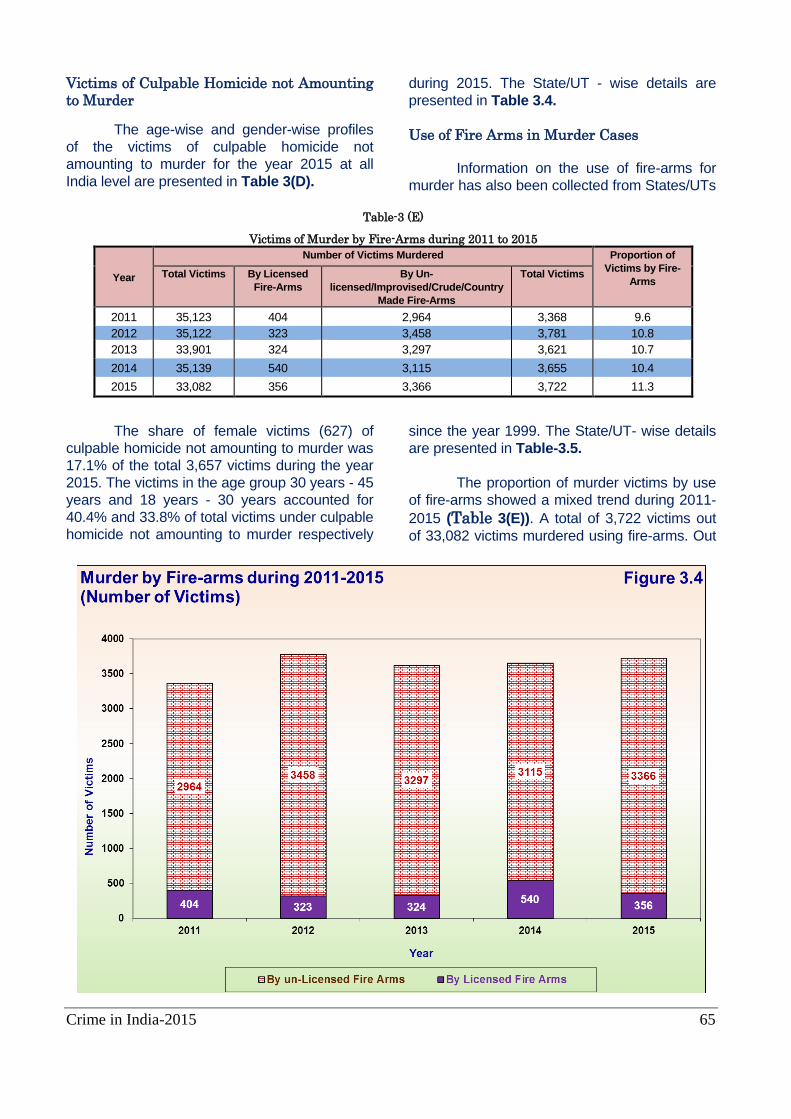
Crime in India-2015 65
Victims of Culpable Homicide not Amounting
to Murder
The age-wise and gender-wise profiles
of the victims of culpable homicide not
amounting to murder for the year 2015 at all
India level are presented in Table 3(D).
The share of female victims (627) of
culpable homicide not amounting to murder was
17.1% of the total 3,657 victims during the year
2015. The victims in the age group 30 years - 45
years and 18 years - 30 years accounted for
40.4% and 33.8% of total victims under culpable
homicide not amounting to murder respectively
during 2015. The State/UT - wise details are
presented in Table 3.4.
Use of Fire Arms in Murder Cases
Information on the use of fire-arms for
murder has also been collected from States/UTs
since the year 1999. The State/UT- wise details
are presented in Table-3.5.
The proportion of murder victims by use
of fire-arms showed a mixed trend during 2011-
2015 (Table 3(E)). A total of 3,722 victims out
of 33,082 victims murdered using fire-arms. Out
Table-3 (E)
Victims of Murder by Fire-Arms during 2011 to 2015
Year
Number of Victims Murdered Proportion of
Victims by Fire-
Arms Total Victims By Licensed
Fire-Arms
By Un-
licensed/Improvised/Crude/Country
Made Fire-Arms
Total Victims
2011 35,123 404 2,964 3,368 9.6
2012 35,122 323 3,458 3,781 10.8
2013 33,901 324 3,297 3,621 10.7
2014 35,139 540 3,115 3,655 10.4
2015 33,082 356 3,366 3,722 11.3
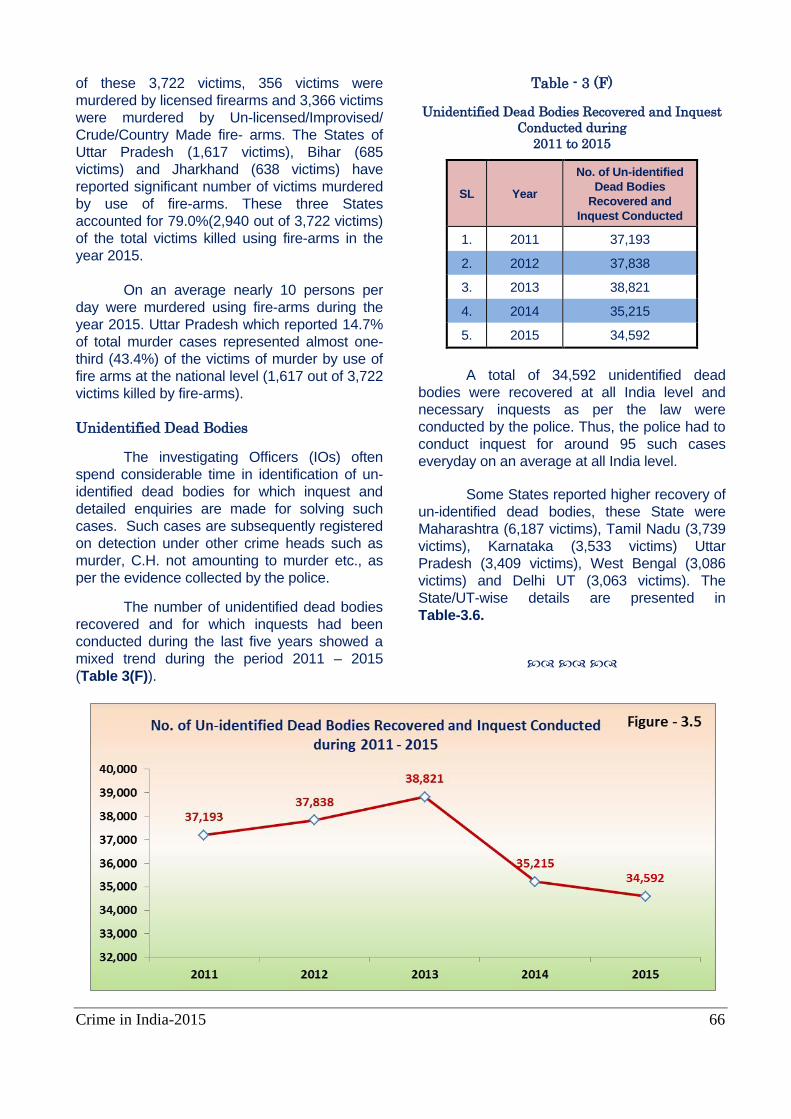
Crime in India-2015 66
of these 3,722 victims, 356 victims were
murdered by licensed firearms and 3,366 victims
were murdered by Un-licensed/Improvised/
Crude/Country Made fire- arms. The States of
Uttar Pradesh (1,617 victims), Bihar (685
victims) and Jharkhand (638 victims) have
reported significant number of victims murdered
by use of fire-arms. These three States
accounted for 79.0%(2,940 out of 3,722 victims)
of the total victims killed using fire-arms in the
year 2015.
On an average nearly 10 persons per
day were murdered using fire-arms during the
year 2015. Uttar Pradesh which reported 14.7%
of total murder cases represented almost one-
third (43.4%) of the victims of murder by use of
fire arms at the national level (1,617 out of 3,722
victims killed by fire-arms).
Unidentified Dead Bodies
The investigating Officers (IOs) often
spend considerable time in identification of un-
identified dead bodies for which inquest and
detailed enquiries are made for solving such
cases. Such cases are subsequently registered
on detection under other crime heads such as
murder, C.H. not amounting to murder etc., as
per the evidence collected by the police.
The number of unidentified dead bodies
recovered and for which inquests had been
conducted during the last five years showed a
mixed trend during the period 2011 – 2015
(Table 3(F)).
Table - 3 (F)
Unidentified Dead Bodies Recovered and Inquest
Conducted during
2011 to 2015
SL Year
No. of Un-identified
Dead Bodies
Recovered and
Inquest Conducted
1. 2011 37,193
2. 2012 37,838
3. 2013 38,821
4. 2014 35,215
5. 2015 34,592
A total of 34,592 unidentified dead
bodies were recovered at all India level and
necessary inquests as per the law were
conducted by the police. Thus, the police had to
conduct inquest for around 95 such cases
everyday on an average at all India level.
Some States reported higher recovery of
un-identified dead bodies, these State were
Maharashtra (6,187 victims), Tamil Nadu (3,739
victims), Karnataka (3,533 victims) Uttar
Pradesh (3,409 victims), West Bengal (3,086
victims) and Delhi UT (3,063 victims). The
State/UT-wise details are presented in
Table-3.6.
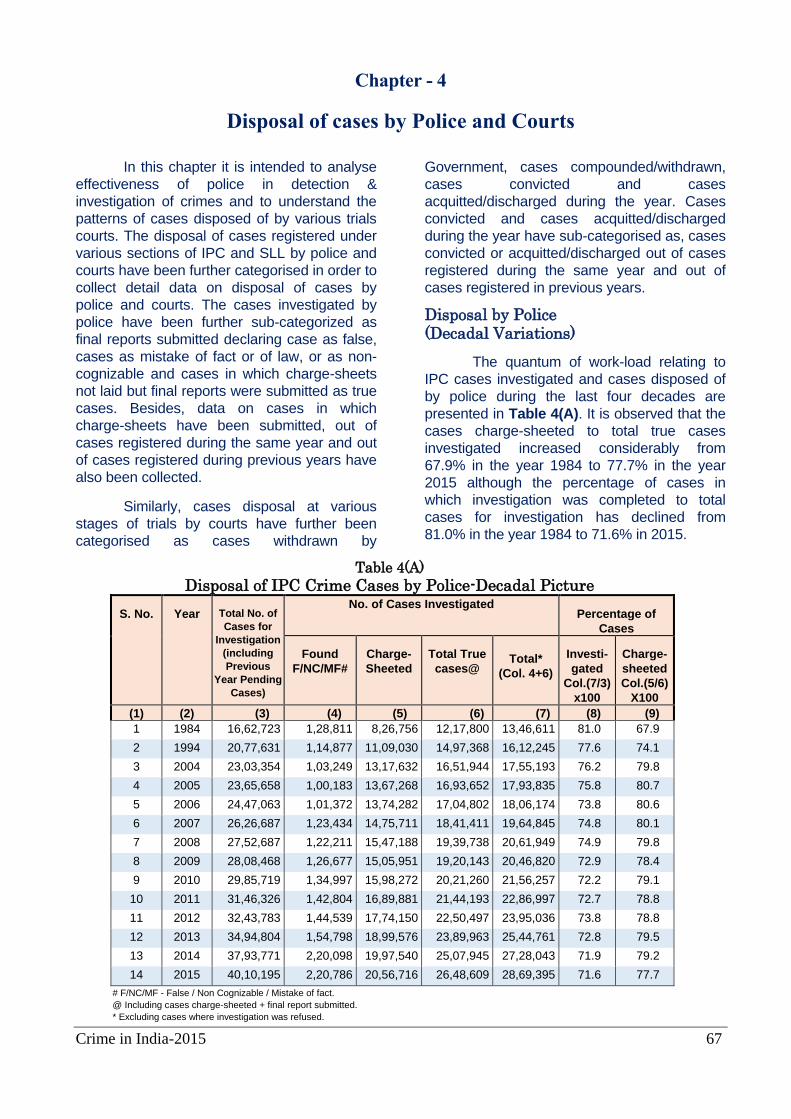
Crime in India-2015 67
Chapter - 4
Disposal of cases by Police and Courts
In this chapter it is intended to analyse
effectiveness of police in detection &
investigation of crimes and to understand the
patterns of cases disposed of by various trials
courts. The disposal of cases registered under
various sections of IPC and SLL by police and
courts have been further categorised in order to
collect detail data on disposal of cases by
police and courts. The cases investigated by
police have been further sub-categorized as
final reports submitted declaring case as false,
cases as mistake of fact or of law, or as non-
cognizable and cases in which charge-sheets
not laid but final reports were submitted as true
cases. Besides, data on cases in which
charge-sheets have been submitted, out of
cases registered during the same year and out
of cases registered during previous years have
also been collected.
Similarly, cases disposal at various
stages of trials by courts have further been
categorised as cases withdrawn by
Government, cases compounded/withdrawn,
cases convicted and cases
acquitted/discharged during the year. Cases
convicted and cases acquitted/discharged
during the year have sub-categorised as, cases
convicted or acquitted/discharged out of cases
registered during the same year and out of
cases registered in previous years.
Disposal by Police (Decadal Variations)
The quantum of work-load relating to
IPC cases investigated and cases disposed of
by police during the last four decades are
presented in Table 4(A). It is observed that the
cases charge-sheeted to total true cases
investigated increased considerably from
67.9% in the year 1984 to 77.7% in the year
2015 although the percentage of cases in
which investigation was completed to total
cases for investigation has declined from
81.0% in the year 1984 to 71.6% in 2015.
Table 4(A)
Disposal of IPC Crime Cases by Police-Decadal Picture
S. No. Year Total No. of
Cases for
Investigation
(including
Previous
Year Pending
Cases)
No. of Cases Investigated Percentage of
Cases
Found
F/NC/MF#
Charge-
Sheeted
Total True
cases@
Total*
(Col. 4+6)
Investi-
gated
Col.(7/3)
x100
Charge-
sheeted
Col.(5/6)
X100
(1) (2) (3) (4) (5) (6) (7) (8) (9)
1 1984 16,62,723 1,28,811 8,26,756 12,17,800 13,46,611 81.0 67.9
2 1994 20,77,631 1,14,877 11,09,030 14,97,368 16,12,245 77.6 74.1
3 2004 23,03,354 1,03,249 13,17,632 16,51,944 17,55,193 76.2 79.8
4 2005 23,65,658 1,00,183 13,67,268 16,93,652 17,93,835 75.8 80.7
5 2006 24,47,063 1,01,372 13,74,282 17,04,802 18,06,174 73.8 80.6
6 2007 26,26,687 1,23,434 14,75,711 18,41,411 19,64,845 74.8 80.1
7 2008 27,52,687 1,22,211 15,47,188 19,39,738 20,61,949 74.9 79.8
8 2009 28,08,468 1,26,677 15,05,951 19,20,143 20,46,820 72.9 78.4
9 2010 29,85,719 1,34,997 15,98,272 20,21,260 21,56,257 72.2 79.1
10 2011 31,46,326 1,42,804 16,89,881 21,44,193 22,86,997 72.7 78.8
11 2012 32,43,783 1,44,539 17,74,150 22,50,497 23,95,036 73.8 78.8
12 2013 34,94,804 1,54,798 18,99,576 23,89,963 25,44,761 72.8 79.5
13 2014 37,93,771 2,20,098 19,97,540 25,07,945 27,28,043 71.9 79.2
14 2015 40,10,195 2,20,786 20,56,716 26,48,609 28,69,395 71.6 77.7
# F/NC/MF - False / Non Cognizable / Mistake of fact.
@ Including cases charge-sheeted + final report submitted.
* Excluding cases where investigation was refused.
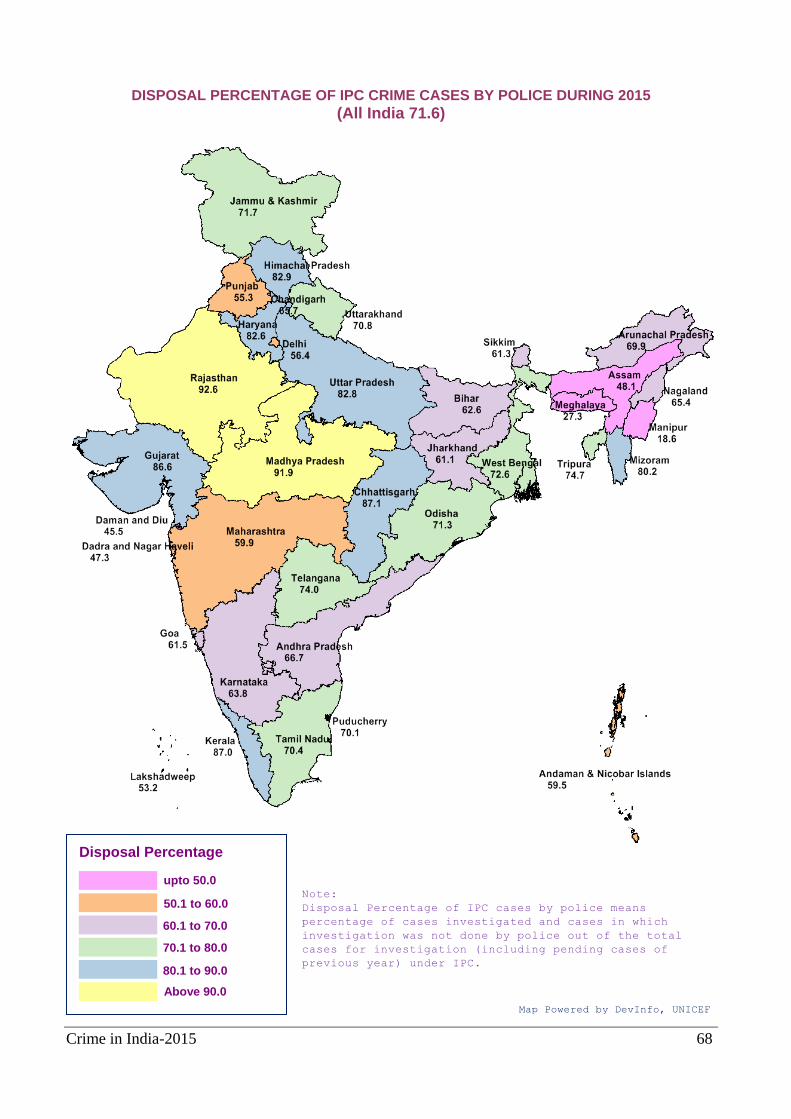
Crime in India-2015 68
DISPOSAL PERCENTAGE OF IPC CRIME CASES BY POLICE DURING 2015
(All India 71.6)
Disposal Percentage
upto 50.0
60.1 to 70.0
Above 90.0
Map Powered by DevInfo, UNICEF
50.1 to 60.0
70.1 to 80.0
80.1 to 90.0
Note:
Disposal Percentage of IPC cases by police means
percentage of cases investigated and cases in which
investigation was not done by police out of the total
cases for investigation (including pending cases of
previous year) under IPC.
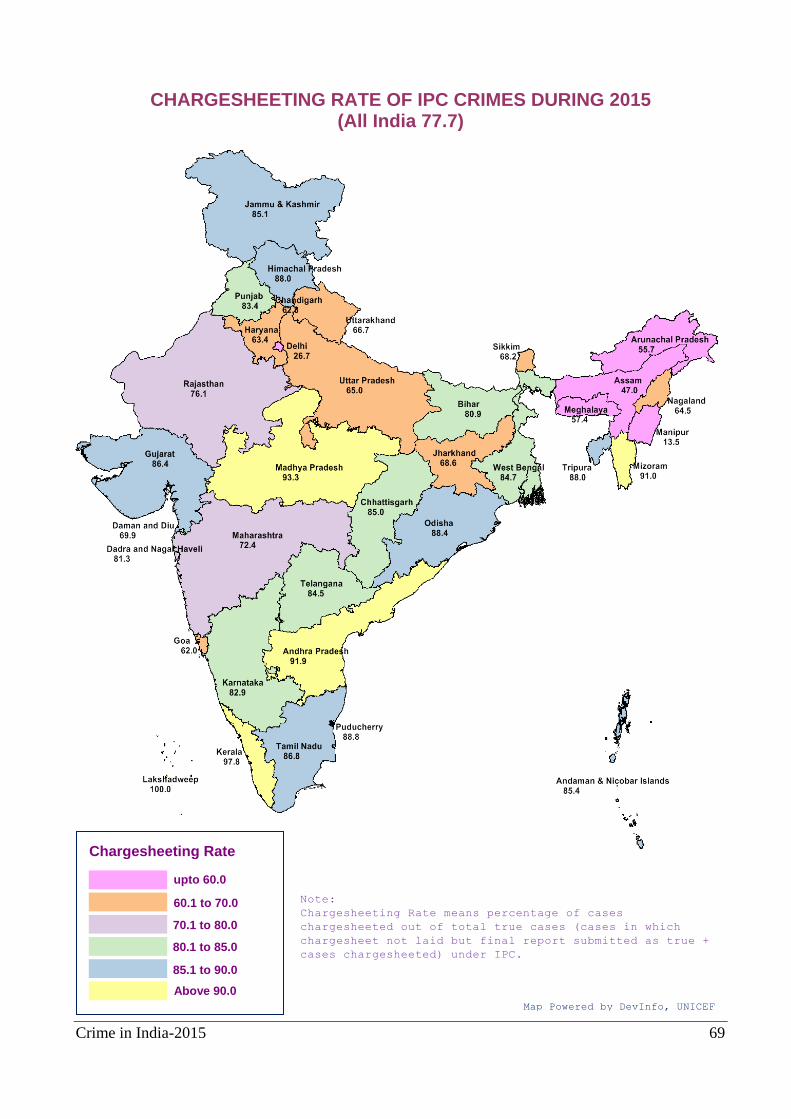
Crime in India-2015 69
CHARGESHEETING RATE OF IPC CRIMES DURING 2015 (All India 77.7)
Chargesheeting Rate
upto 60.0
70.1 to 80.0
Above 90.0
Map Powered by DevInfo, UNICEF
60.1 to 70.0
80.1 to 85.0
85.1 to 90.0
Note:
Chargesheeting Rate means percentage of cases
chargesheeted out of total true cases (cases in which
chargesheet not laid but final report submitted as true +
cases chargesheeted) under IPC.
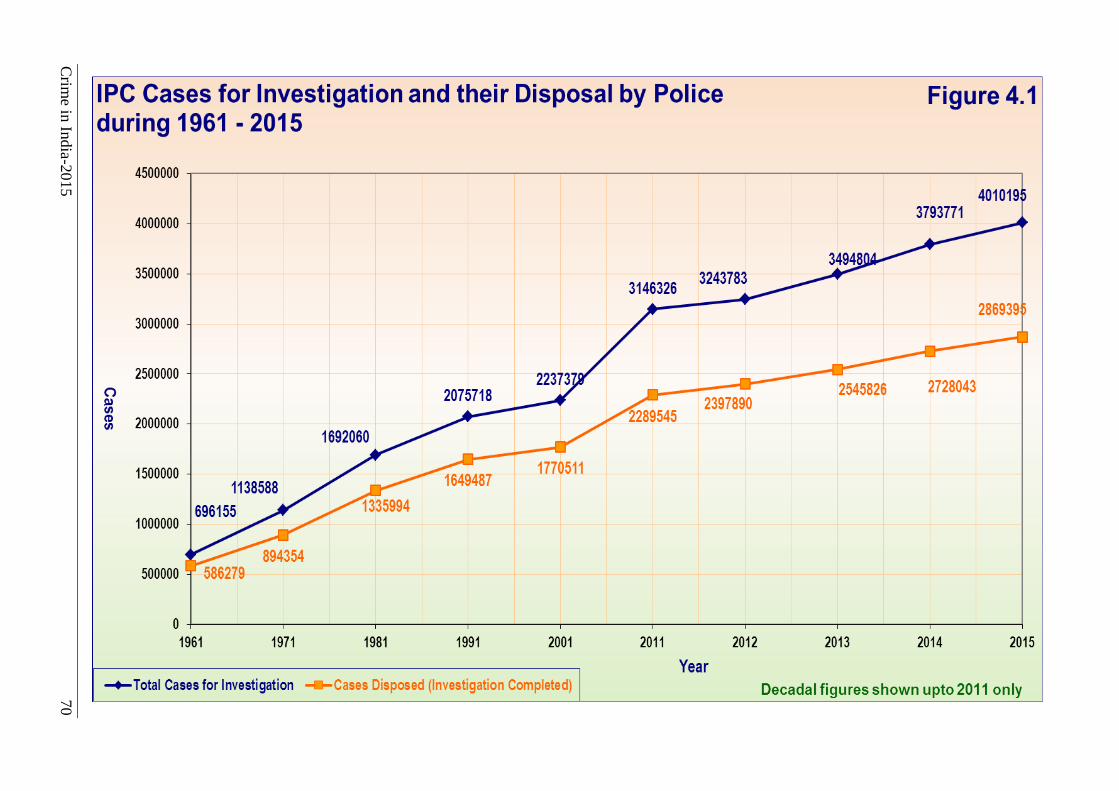
Crim
e in In
dia-2
015
70
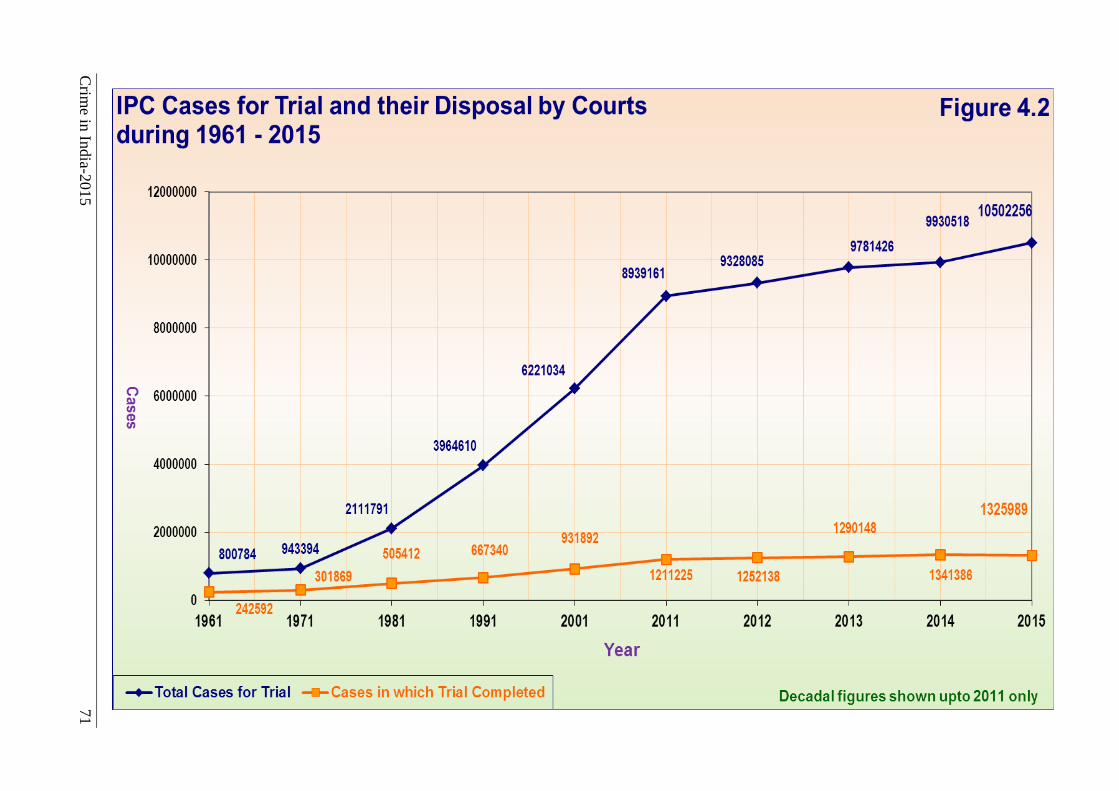
Crim
e in In
dia-2
015
71
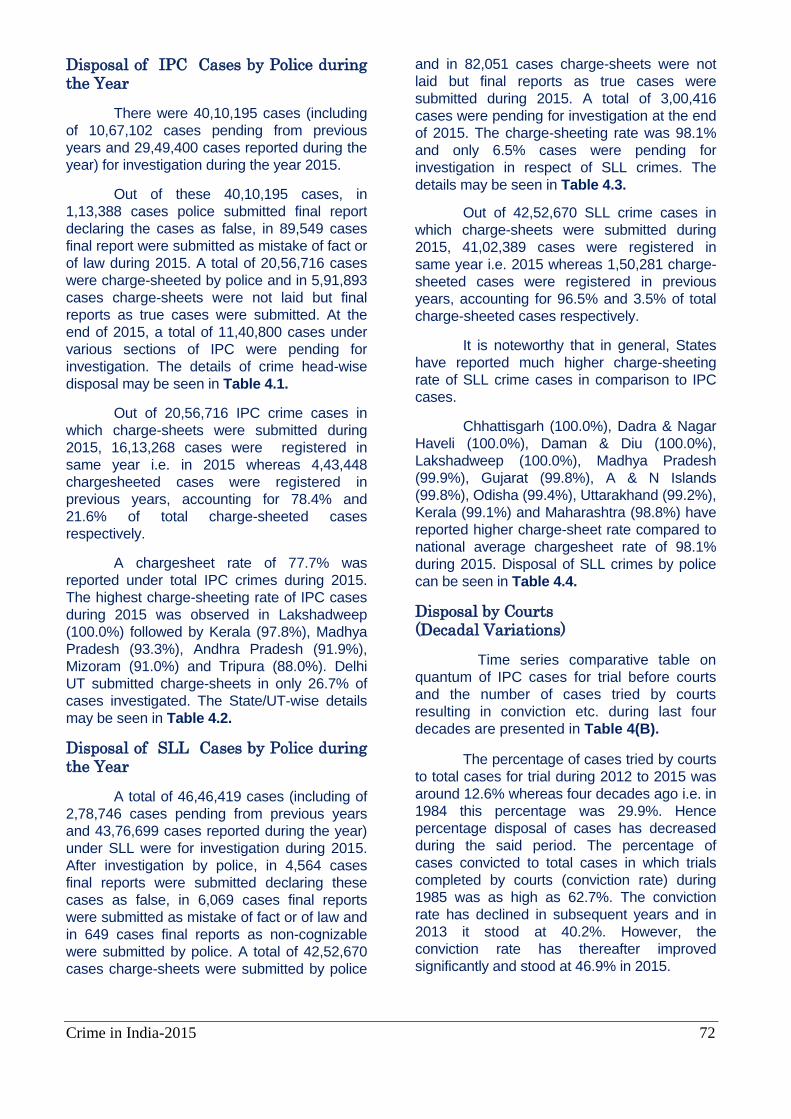
Crime in India-2015 72
Disposal of IPC Cases by Police during the Year
There were 40,10,195 cases (including
of 10,67,102 cases pending from previous
years and 29,49,400 cases reported during the
year) for investigation during the year 2015.
Out of these 40,10,195 cases, in
1,13,388 cases police submitted final report
declaring the cases as false, in 89,549 cases
final report were submitted as mistake of fact or
of law during 2015. A total of 20,56,716 cases
were charge-sheeted by police and in 5,91,893
cases charge-sheets were not laid but final
reports as true cases were submitted. At the
end of 2015, a total of 11,40,800 cases under
various sections of IPC were pending for
investigation. The details of crime head-wise
disposal may be seen in Table 4.1.
Out of 20,56,716 IPC crime cases in
which charge-sheets were submitted during
2015, 16,13,268 cases were registered in
same year i.e. in 2015 whereas 4,43,448
chargesheeted cases were registered in
previous years, accounting for 78.4% and
21.6% of total charge-sheeted cases
respectively.
A chargesheet rate of 77.7% was
reported under total IPC crimes during 2015.
The highest charge-sheeting rate of IPC cases
during 2015 was observed in Lakshadweep
(100.0%) followed by Kerala (97.8%), Madhya
Pradesh (93.3%), Andhra Pradesh (91.9%),
Mizoram (91.0%) and Tripura (88.0%). Delhi
UT submitted charge-sheets in only 26.7% of
cases investigated. The State/UT-wise details
may be seen in Table 4.2.
Disposal of SLL Cases by Police during the Year
A total of 46,46,419 cases (including of
2,78,746 cases pending from previous years
and 43,76,699 cases reported during the year)
under SLL were for investigation during 2015.
After investigation by police, in 4,564 cases
final reports were submitted declaring these
cases as false, in 6,069 cases final reports
were submitted as mistake of fact or of law and
in 649 cases final reports as non-cognizable
were submitted by police. A total of 42,52,670
cases charge-sheets were submitted by police
and in 82,051 cases charge-sheets were not
laid but final reports as true cases were
submitted during 2015. A total of 3,00,416
cases were pending for investigation at the end
of 2015. The charge-sheeting rate was 98.1%
and only 6.5% cases were pending for
investigation in respect of SLL crimes. The
details may be seen in Table 4.3.
Out of 42,52,670 SLL crime cases in
which charge-sheets were submitted during
2015, 41,02,389 cases were registered in
same year i.e. 2015 whereas 1,50,281 charge-
sheeted cases were registered in previous
years, accounting for 96.5% and 3.5% of total
charge-sheeted cases respectively.
It is noteworthy that in general, States
have reported much higher charge-sheeting
rate of SLL crime cases in comparison to IPC
cases.
Chhattisgarh (100.0%), Dadra & Nagar
Haveli (100.0%), Daman & Diu (100.0%),
Lakshadweep (100.0%), Madhya Pradesh
(99.9%), Gujarat (99.8%), A & N Islands
(99.8%), Odisha (99.4%), Uttarakhand (99.2%),
Kerala (99.1%) and Maharashtra (98.8%) have
reported higher charge-sheet rate compared to
national average chargesheet rate of 98.1%
during 2015. Disposal of SLL crimes by police
can be seen in Table 4.4.
Disposal by Courts (Decadal Variations)
Time series comparative table on
quantum of IPC cases for trial before courts
and the number of cases tried by courts
resulting in conviction etc. during last four
decades are presented in Table 4(B).
The percentage of cases tried by courts
to total cases for trial during 2012 to 2015 was
around 12.6% whereas four decades ago i.e. in
1984 this percentage was 29.9%. Hence
percentage disposal of cases has decreased
during the said period. The percentage of
cases convicted to total cases in which trials
completed by courts (conviction rate) during
1985 was as high as 62.7%. The conviction
rate has declined in subsequent years and in
2013 it stood at 40.2%. However, the
conviction rate has thereafter improved
significantly and stood at 46.9% in 2015.
Crime in India-2015 73
DISPOSAL PERCENTAGE OF IPC CRIME CASES BY COURTS DURING 2015 (All India 14.2)
Disposal Percentage
upto 5.0
10.1 to 15.0
Above 30.0
Map Powered by DevInfo, UNICEF
5.1 to 10.0
15.1 to 20.0
20.1 to 30.0
Note:
Disposal Percentage of IPC crime cases by courts is the
number of cases compounded/withdrawn or in which trial
was completed expressed as a percentage of total number
of cases for trial (including cases pending trial from
previous year) under IPC.
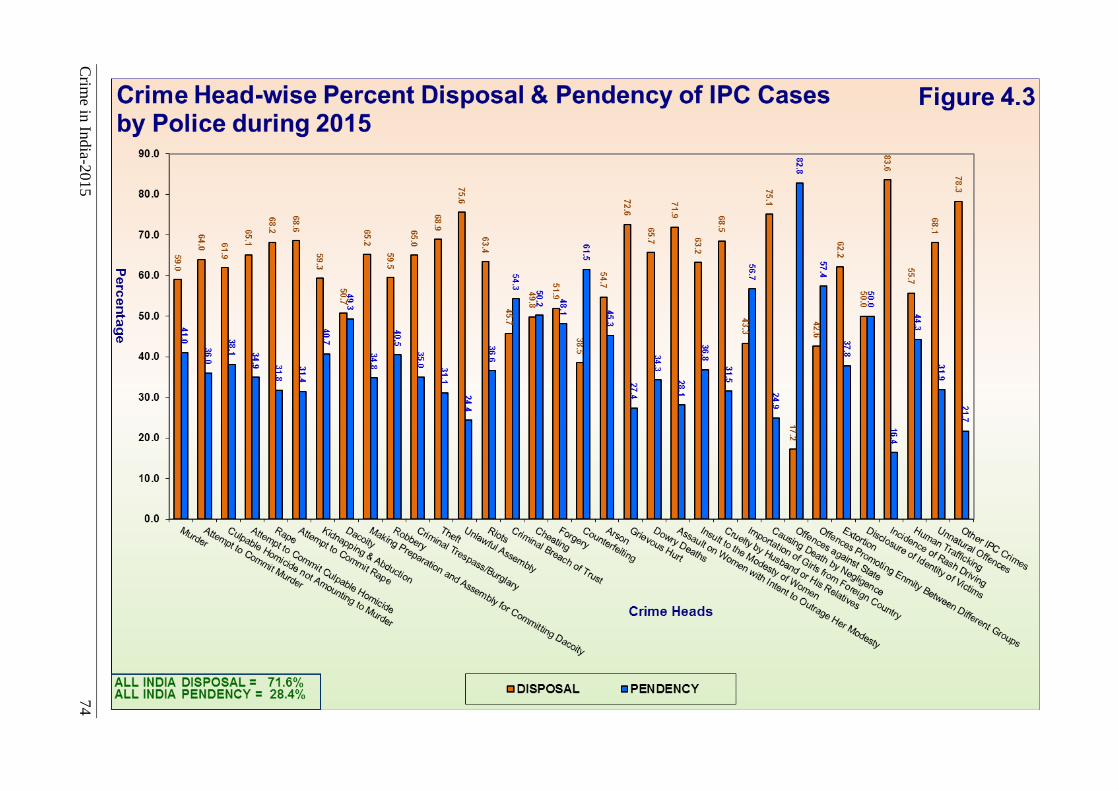
Crim
e in In
dia-2
015
74
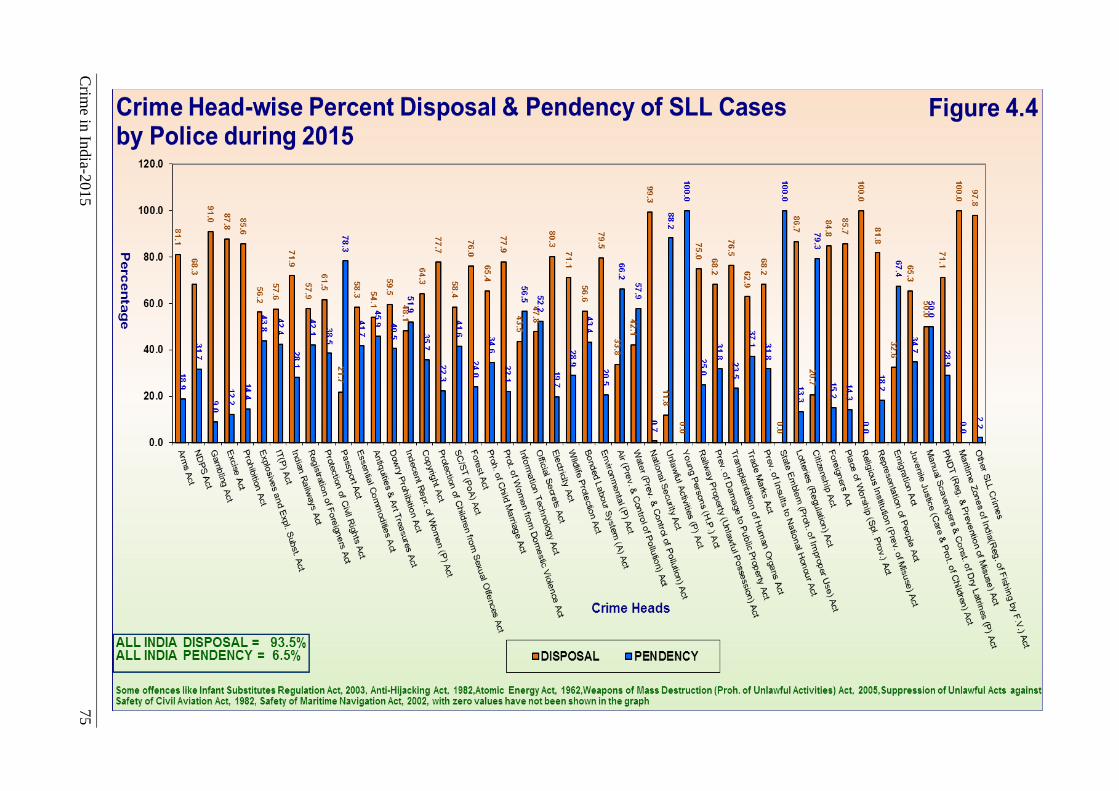
Crim
e in In
dia-2
015
75
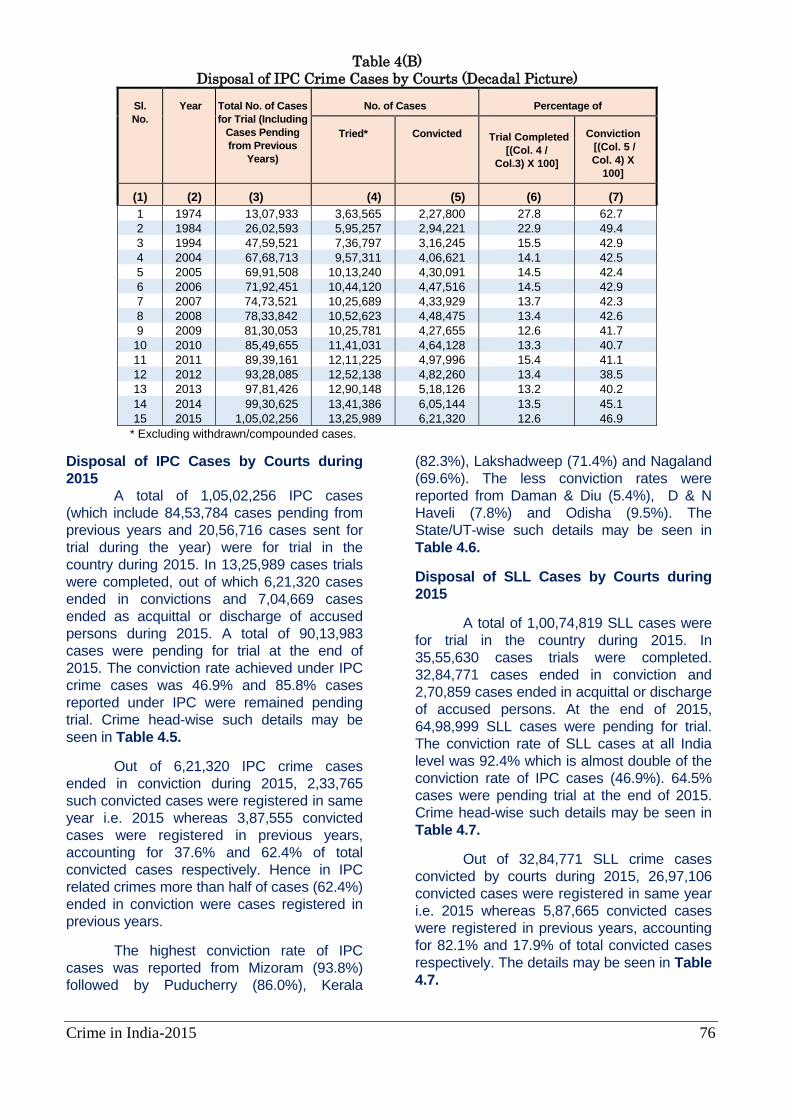
Crime in India-2015 76
Table 4(B)
Disposal of IPC Crime Cases by Courts (Decadal Picture)
Sl.
No.
Year Total No. of Cases
for Trial (Including
Cases Pending
from Previous
Years)
No. of Cases Percentage of
Tried* Convicted
Trial Completed
[(Col. 4 /
Col.3) X 100]
Conviction
[(Col. 5 /
Col. 4) X
100]
(1) (2) (3) (4) (5) (6) (7)
1 1974 13,07,933 3,63,565 2,27,800 27.8 62.7
2 1984 26,02,593 5,95,257 2,94,221 22.9 49.4
3 1994 47,59,521 7,36,797 3,16,245 15.5 42.9
4 2004 67,68,713 9,57,311 4,06,621 14.1 42.5
5 2005 69,91,508 10,13,240 4,30,091 14.5 42.4
6 2006 71,92,451 10,44,120 4,47,516 14.5 42.9
7 2007 74,73,521 10,25,689 4,33,929 13.7 42.3
8 2008 78,33,842 10,52,623 4,48,475 13.4 42.6
9 2009 81,30,053 10,25,781 4,27,655 12.6 41.7
10 2010 85,49,655 11,41,031 4,64,128 13.3 40.7
11 2011 89,39,161 12,11,225 4,97,996 15.4 41.1
12 2012 93,28,085 12,52,138 4,82,260 13.4 38.5
13 2013 97,81,426 12,90,148 5,18,126 13.2 40.2
14
15
2014
2015
99,30,625
1,05,02,256
13,41,386
13,25,989
6,05,144
6,21,320
13.5
12.6
45.1
46.9
* Excluding withdrawn/compounded cases.
Disposal of IPC Cases by Courts during
2015
A total of 1,05,02,256 IPC cases
(which include 84,53,784 cases pending from
previous years and 20,56,716 cases sent for
trial during the year) were for trial in the
country during 2015. In 13,25,989 cases trials
were completed, out of which 6,21,320 cases
ended in convictions and 7,04,669 cases
ended as acquittal or discharge of accused
persons during 2015. A total of 90,13,983
cases were pending for trial at the end of
2015. The conviction rate achieved under IPC
crime cases was 46.9% and 85.8% cases
reported under IPC were remained pending
trial. Crime head-wise such details may be
seen in Table 4.5.
Out of 6,21,320 IPC crime cases
ended in conviction during 2015, 2,33,765
such convicted cases were registered in same
year i.e. 2015 whereas 3,87,555 convicted
cases were registered in previous years,
accounting for 37.6% and 62.4% of total
convicted cases respectively. Hence in IPC
related crimes more than half of cases (62.4%)
ended in conviction were cases registered in
previous years.
The highest conviction rate of IPC
cases was reported from Mizoram (93.8%)
followed by Puducherry (86.0%), Kerala
(82.3%), Lakshadweep (71.4%) and Nagaland
(69.6%). The less conviction rates were
reported from Daman & Diu (5.4%), D & N
Haveli (7.8%) and Odisha (9.5%). The
State/UT-wise such details may be seen in
Table 4.6.
Disposal of SLL Cases by Courts during
2015
A total of 1,00,74,819 SLL cases were
for trial in the country during 2015. In
35,55,630 cases trials were completed.
32,84,771 cases ended in conviction and
2,70,859 cases ended in acquittal or discharge
of accused persons. At the end of 2015,
64,98,999 SLL cases were pending for trial.
The conviction rate of SLL cases at all India
level was 92.4% which is almost double of the
conviction rate of IPC cases (46.9%). 64.5%
cases were pending trial at the end of 2015.
Crime head-wise such details may be seen in
Table 4.7.
Out of 32,84,771 SLL crime cases
convicted by courts during 2015, 26,97,106
convicted cases were registered in same year
i.e. 2015 whereas 5,87,665 convicted cases
were registered in previous years, accounting
for 82.1% and 17.9% of total convicted cases
respectively. The details may be seen in Table
4.7.
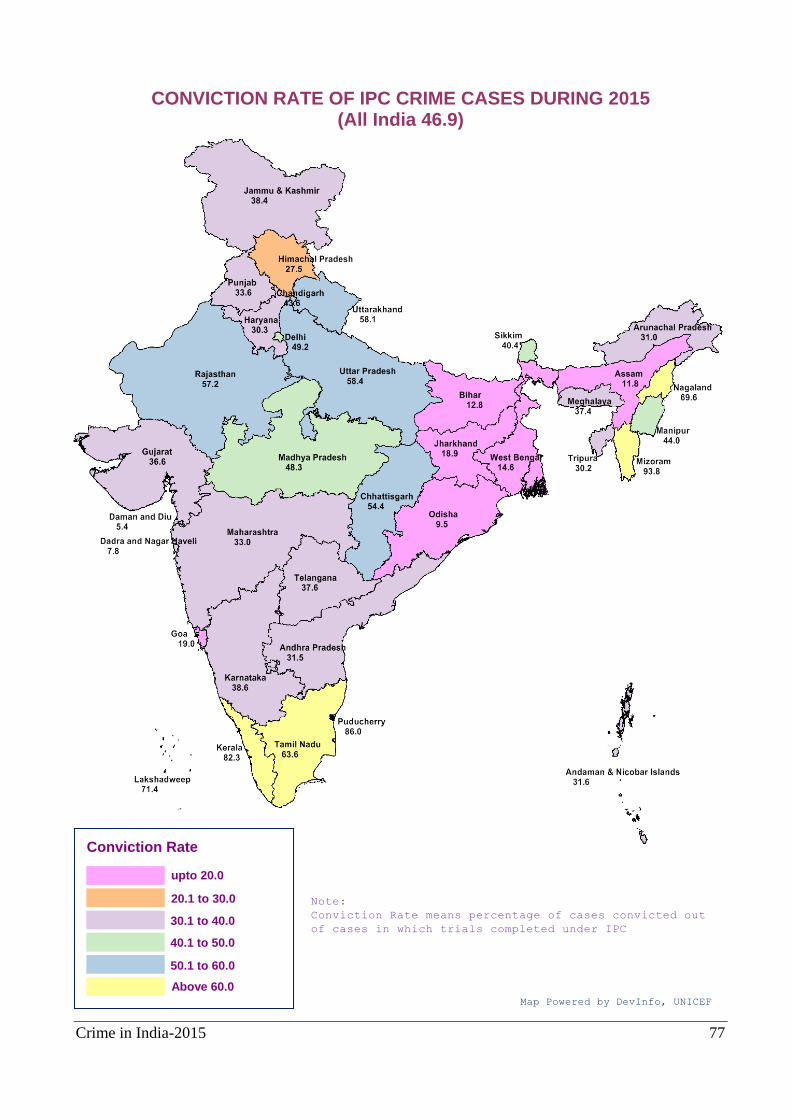
Crime in India-2015 77
CONVICTION RATE OF IPC CRIME CASES DURING 2015 (All India 46.9)
Conviction Rate
upto 20.0
30.1 to 40.0
Above 60.0 Map Powered by DevInfo, UNICEF
20.1 to 30.0
40.1 to 50.0
50.1 to 60.0
Note:
Conviction Rate means percentage of cases convicted out
of cases in which trials completed under IPC
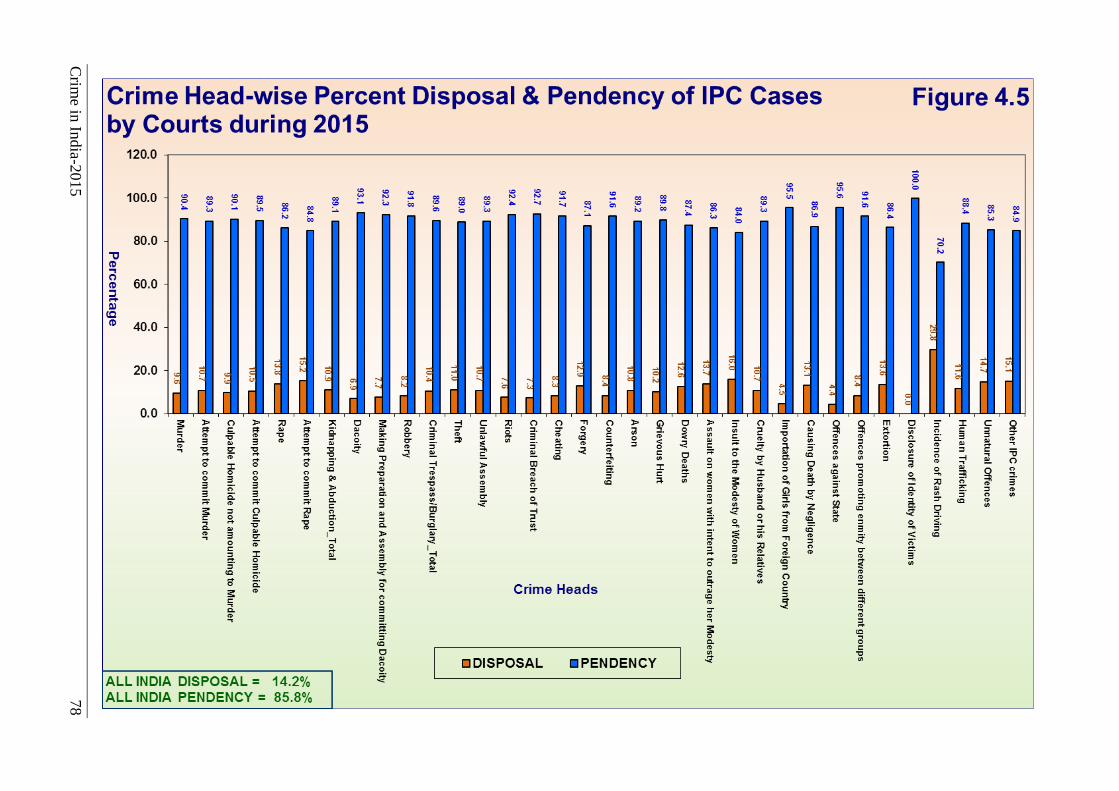
Crim
e in In
dia-2
015
78
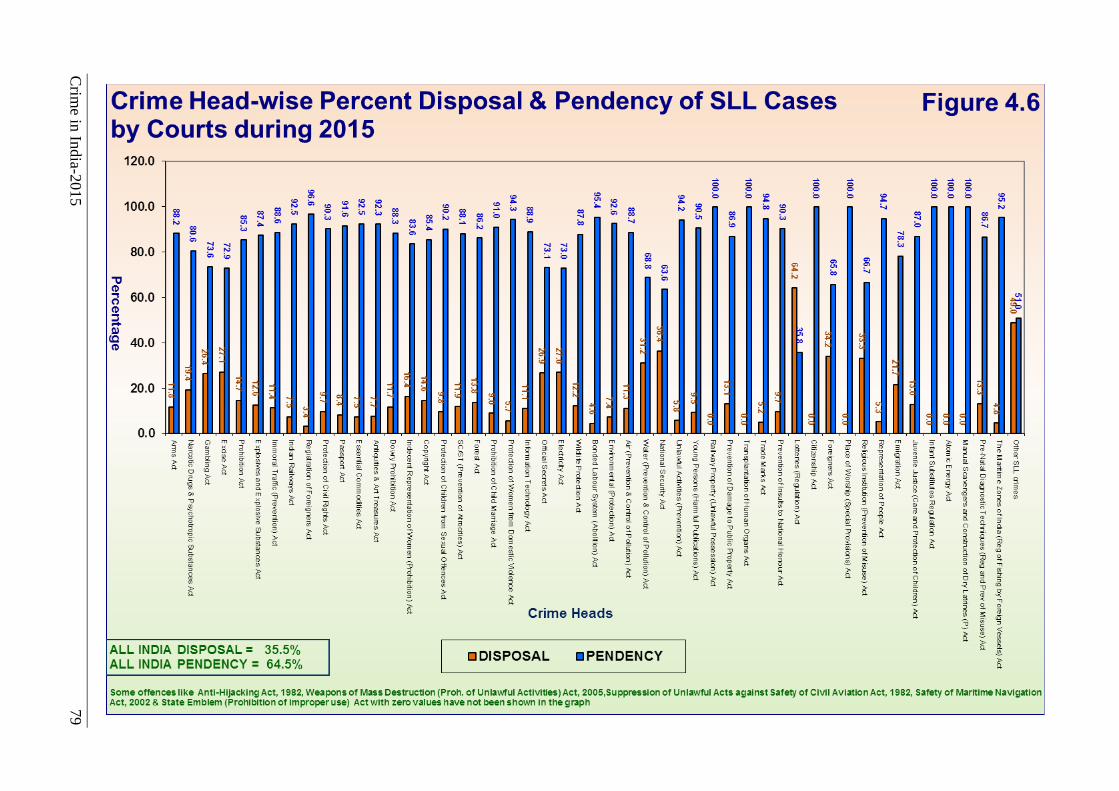
Crim
e in In
dia-2
015
79
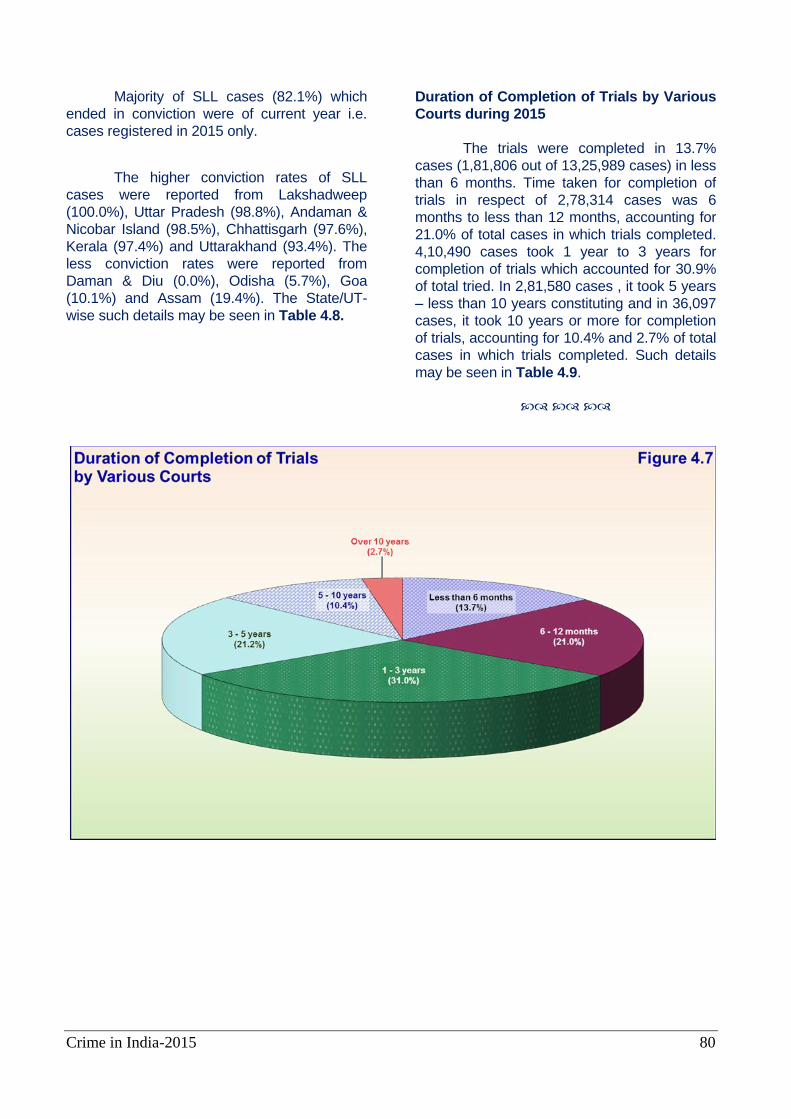
Crime in India-2015 80
Majority of SLL cases (82.1%) which
ended in conviction were of current year i.e.
cases registered in 2015 only.
The higher conviction rates of SLL
cases were reported from Lakshadweep
(100.0%), Uttar Pradesh (98.8%), Andaman &
Nicobar Island (98.5%), Chhattisgarh (97.6%),
Kerala (97.4%) and Uttarakhand (93.4%). The
less conviction rates were reported from
Daman & Diu (0.0%), Odisha (5.7%), Goa
(10.1%) and Assam (19.4%). The State/UT-
wise such details may be seen in Table 4.8.
Duration of Completion of Trials by Various
Courts during 2015
The trials were completed in 13.7%
cases (1,81,806 out of 13,25,989 cases) in less
than 6 months. Time taken for completion of
trials in respect of 2,78,314 cases was 6
months to less than 12 months, accounting for
21.0% of total cases in which trials completed.
4,10,490 cases took 1 year to 3 years for
completion of trials which accounted for 30.9%
of total tried. In 2,81,580 cases , it took 5 years
– less than 10 years constituting and in 36,097
cases, it took 10 years or more for completion
of trials, accounting for 10.4% and 2.7% of total
cases in which trials completed. Such details
may be seen in Table 4.9.
Crime in India-2015 81
Chapter - 5
Crime against Women The principle of gender equality is
enshrined in the Constitution of India. In order
uphold and implement the Constitutional
Mandate, the State has enacted various laws
and taken measures intended to ensure equal
rights, check social discrimination & various
forms of violence and atrocities. Although
women may be victims of any of the general
crimes such as ‘murder’, ‘robbery’, ‘cheating’,
etc. only the crimes which are directed
specifically against women i.e. gender specific
crimes are characterised as ‘Crimes against
Women’. Various new legislations have been
brought and amendments have been made in
existing laws with a view to handle these
crimes effectively. These are broadly classified
under two categories.
(1) Crime Heads under the Indian Penal Code (IPC)
1. Rape (Sec. 376 IPC)$
2. Attempt to commit Rape(Sec 376/511
IPC)*
3. Kidnapping & Abduction of Women
(Section 363, 364, 364A, 365, 366 to 369
IPC)
3.1 K&A under section 363 IPC*
3.2 K&A in Order to Murder*
3.3 K&A for Ransom*
3.4 K&A of Women to Compel Her for
Marriage*
3.5 K&A for Other Purposes*
4. Dowry Deaths (Section 304B IPC)
5. Assault on Woman with Intent to Outrage
Her Modesty (Sec. 354 IPC)
5.1 Sexual Harassment (Sec.354A IPC)*
5.2 Assault on Woman with Intent to
Outrage her Modesty (Sec. 354C IPC)*
5.3 Voyeurism (Sec. 354D IPC)*
5.4 Others *
6. Insult to the Modesty of women (Sec.
509 IPC)
6.1 at Office Premises*
6.2 at Places Related to Work*
6.3 in Public Transport*
6.4 in Other Places*
7. Cruelty by husband or his relatives
(Sec. 498A IPC)
8. Importation of Girl from Foreign Country
(up to 21 years of age) (Sec. 366 B IPC)
9. Abetment of Suicide of Women (Sec. 306
IPC)* ‘$’- Excludes child rapes registered under the
section 4 & 6 of Protection of Children from Sexual
Offence Act 2012 which published separately in
Chapter-6.
(2) Crime Heads under the Special & Local Laws (SLL)
Special Acts enacted for protection and
safety of women have been clubbed under SLL
These gender specific laws in which criminal
cases recorded by police throughout the
country are –
(i) The Dowry Prohibition Act, 1961
(ii) The Indecent Representation of Women
(Prohibition) Act, 1986
(iii) The Commission of Sati Prevention Act,
1987
(iv) The Protection of women from domestic
Violence Act, 2005*
(v) The Immoral Traffic (Prevention) Act, 1956#
‘#’ women related crimes only.
‘*’ - Started collecting since in 2014 in the revised
proformae.
Apart from above crime heads which
are considered as crime against women, some
general crimes in which women are victims
have also been collected under the revised
proformae. Data of the same is published on
our website in ‘Additional Tables for CII’.
‘Crime rate’ for crimes committed
against women has been calculated using only
female population which is based on mid-year
projected female population for the year 2015,
as supplied by Registrar General of
India/Population Commissioner, MHA. Mid-year
projected population figures in respect of newly
created States of Andhra Pradesh and
Telangana has been arrived using district
population ratio of the Population Census 2011.
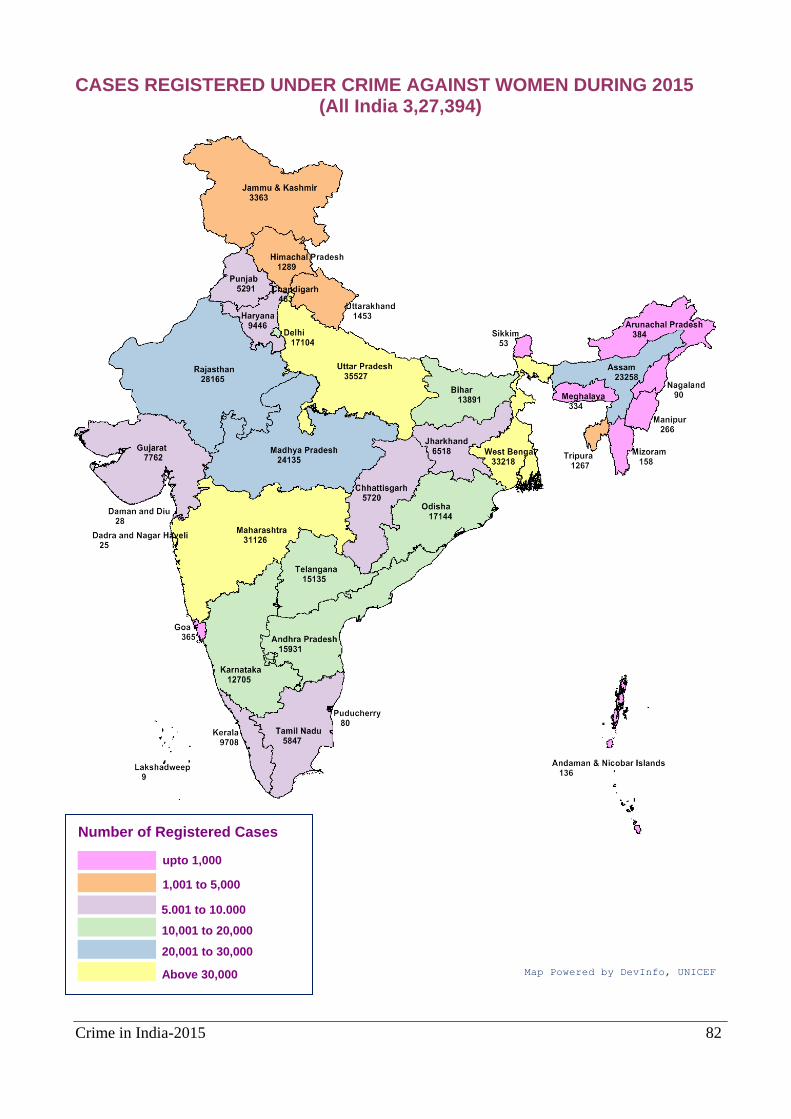
Crime in India-2015 82
CASES REGISTERED UNDER CRIME AGAINST WOMEN DURING 2015 (All India 3,27,394)
Number of Registered Cases
upto 1,000
5,001 to 10,000
Above 30,000 Map Powered by DevInfo, UNICEF
1,001 to 5,000
10,001 to 20,000
20,001 to 30,000
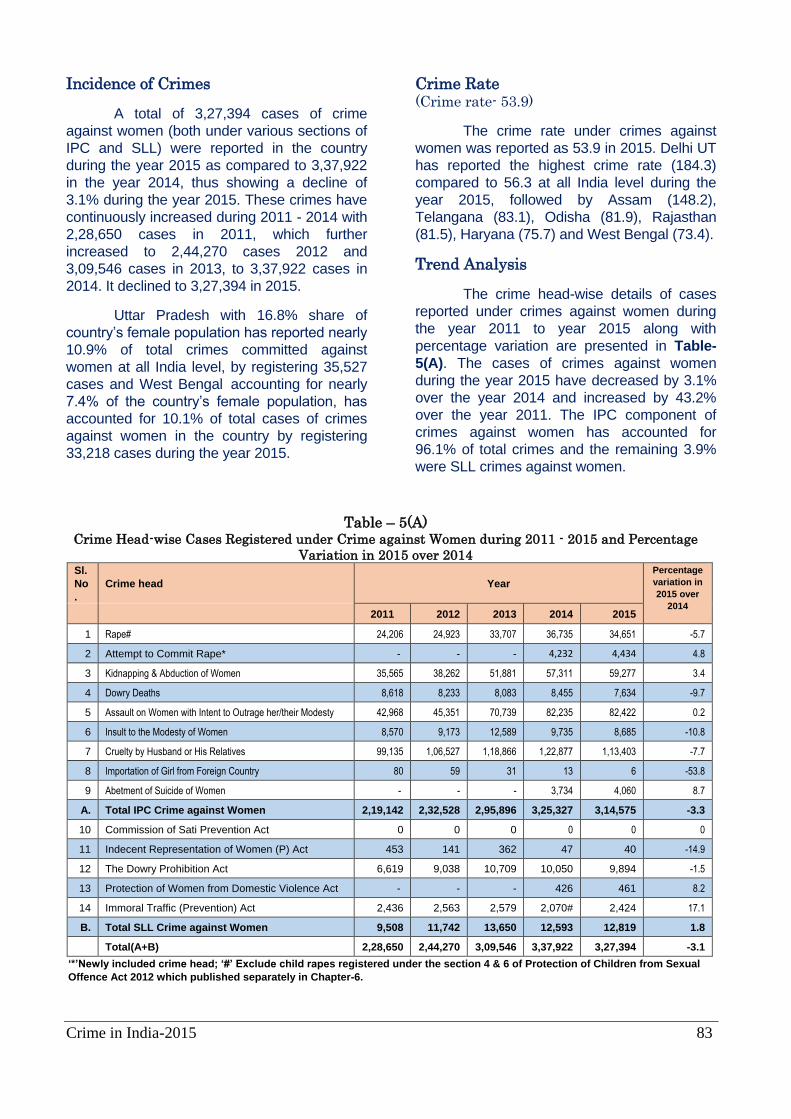
Crime in India-2015 83
Incidence of Crimes
A total of 3,27,394 cases of crime
against women (both under various sections of
IPC and SLL) were reported in the country
during the year 2015 as compared to 3,37,922
in the year 2014, thus showing a decline of
3.1% during the year 2015. These crimes have
continuously increased during 2011 - 2014 with
2,28,650 cases in 2011, which further
increased to 2,44,270 cases 2012 and
3,09,546 cases in 2013, to 3,37,922 cases in
2014. It declined to 3,27,394 in 2015.
Uttar Pradesh with 16.8% share of
country’s female population has reported nearly
10.9% of total crimes committed against
women at all India level, by registering 35,527
cases and West Bengal accounting for nearly
7.4% of the country’s female population, has
accounted for 10.1% of total cases of crimes
against women in the country by registering
33,218 cases during the year 2015.
Crime Rate (Crime rate- 53.9)
The crime rate under crimes against
women was reported as 53.9 in 2015. Delhi UT
has reported the highest crime rate (184.3)
compared to 56.3 at all India level during the
year 2015, followed by Assam (148.2),
Telangana (83.1), Odisha (81.9), Rajasthan
(81.5), Haryana (75.7) and West Bengal (73.4).
Trend Analysis
The crime head-wise details of cases
reported under crimes against women during
the year 2011 to year 2015 along with
percentage variation are presented in Table-
5(A). The cases of crimes against women
during the year 2015 have decreased by 3.1%
over the year 2014 and increased by 43.2%
over the year 2011. The IPC component of
crimes against women has accounted for
96.1% of total crimes and the remaining 3.9%
were SLL crimes against women.
Table – 5(A) Crime Head-wise Cases Registered under Crime against Women during 2011 - 2015 and Percentage
Variation in 2015 over 2014 Sl.
No
.
Crime head Year
Percentage
variation in
2015 over
2014
2011 2012 2013 2014 2015
1 Rape# 24,206 24,923 33,707 36,735 34,651 -5.7
2 Attempt to Commit Rape* - - - 4,232 4,434 4.8
3 Kidnapping & Abduction of Women 35,565 38,262 51,881 57,311 59,277 3.4
4 Dowry Deaths 8,618 8,233 8,083 8,455 7,634 -9.7
5 Assault on Women with Intent to Outrage her/their Modesty 42,968 45,351 70,739 82,235 82,422 0.2
6 Insult to the Modesty of Women 8,570 9,173 12,589 9,735 8,685 -10.8
7 Cruelty by Husband or His Relatives 99,135 1,06,527 1,18,866 1,22,877 1,13,403 -7.7
8 Importation of Girl from Foreign Country 80 59 31 13 6 -53.8
9 Abetment of Suicide of Women - - - 3,734 4,060 8.7
A. Total IPC Crime against Women 2,19,142 2,32,528 2,95,896 3,25,327 3,14,575 -3.3
10 Commission of Sati Prevention Act 0 0 0 0 0 0
11 Indecent Representation of Women (P) Act 453 141 362 47 40 -14.9
12 The Dowry Prohibition Act 6,619 9,038 10,709 10,050 9,894 -1.5
13 Protection of Women from Domestic Violence Act - - - 426 461 8.2
14 Immoral Traffic (Prevention) Act 2,436 2,563 2,579 2,070# 2,424 17.1
B. Total SLL Crime against Women 9,508 11,742 13,650 12,593 12,819 1.8
Total(A+B) 2,28,650 2,44,270 3,09,546 3,37,922 3,27,394 -3.1
‘*’Newly included crime head; ‘#’ Exclude child rapes registered under the section 4 & 6 of Protection of Children from Sexual
Offence Act 2012 which published separately in Chapter-6.
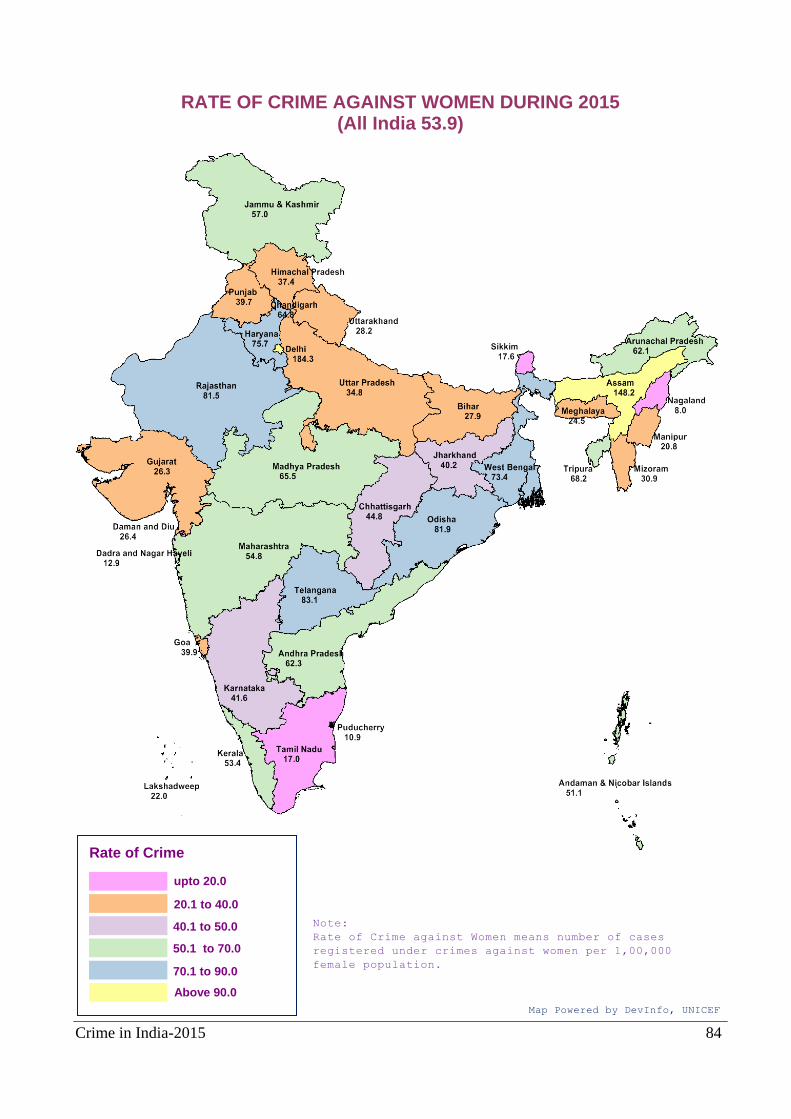
Crime in India-2015 84
RATE OF CRIME AGAINST WOMEN DURING 2015 (All India 53.9)
Rate of Crime
upto 20.0
40.1 to 50.0
Above 90.0
Map Powered by DevInfo, UNICEF
20.1 to 40.0
50.1 to 70.0
70.1 to 90.0
Note:
Rate of Crime against Women means number of cases
registered under crimes against women per 1,00,000
female population.
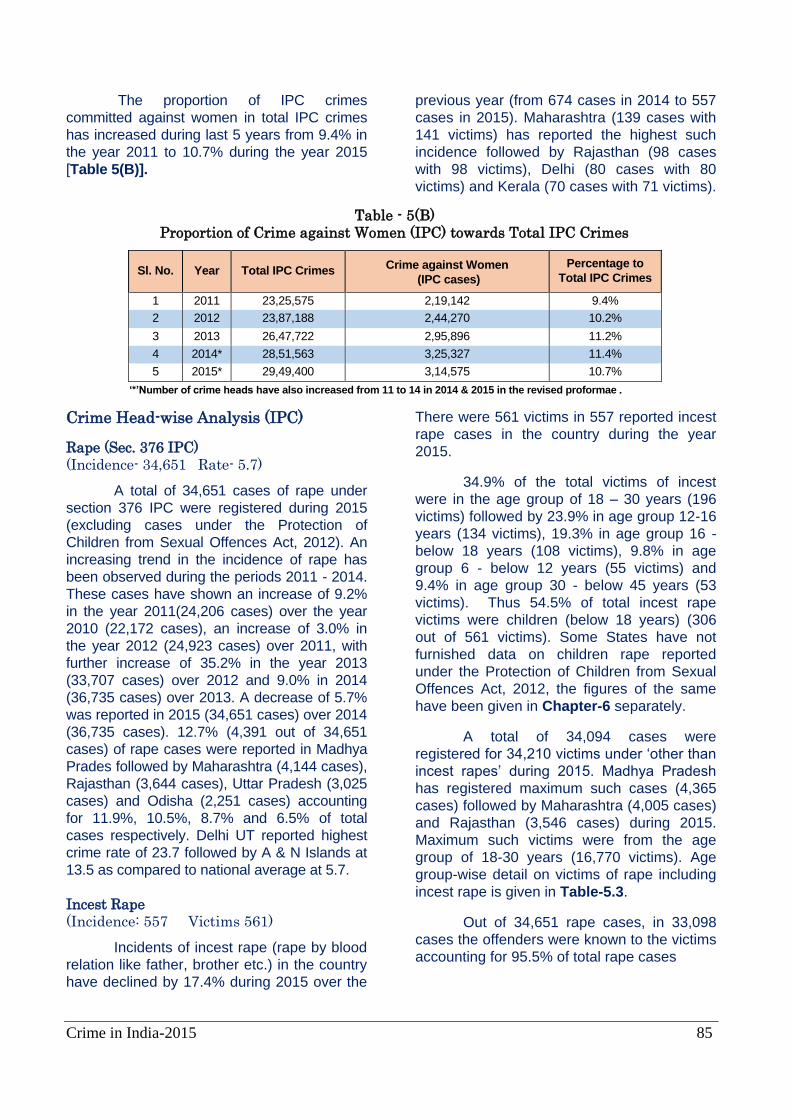
Crime in India-2015 85
The proportion of IPC crimes
committed against women in total IPC crimes
has increased during last 5 years from 9.4% in
the year 2011 to 10.7% during the year 2015
[Table 5(B)].
Crime Head-wise Analysis (IPC)
Rape (Sec. 376 IPC)
(Incidence- 34,651 Rate- 5.7)
A total of 34,651 cases of rape under
section 376 IPC were registered during 2015
(excluding cases under the Protection of
Children from Sexual Offences Act, 2012). An
increasing trend in the incidence of rape has
been observed during the periods 2011 - 2014.
These cases have shown an increase of 9.2%
in the year 2011(24,206 cases) over the year
2010 (22,172 cases), an increase of 3.0% in
the year 2012 (24,923 cases) over 2011, with
further increase of 35.2% in the year 2013
(33,707 cases) over 2012 and 9.0% in 2014
(36,735 cases) over 2013. A decrease of 5.7%
was reported in 2015 (34,651 cases) over 2014
(36,735 cases). 12.7% (4,391 out of 34,651
cases) of rape cases were reported in Madhya
Prades followed by Maharashtra (4,144 cases),
Rajasthan (3,644 cases), Uttar Pradesh (3,025
cases) and Odisha (2,251 cases) accounting
for 11.9%, 10.5%, 8.7% and 6.5% of total
cases respectively. Delhi UT reported highest
crime rate of 23.7 followed by A & N Islands at
13.5 as compared to national average at 5.7.
Incest Rape
(Incidence: 557 Victims 561)
Incidents of incest rape (rape by blood
relation like father, brother etc.) in the country
have declined by 17.4% during 2015 over the
previous year (from 674 cases in 2014 to 557
cases in 2015). Maharashtra (139 cases with
141 victims) has reported the highest such
incidence followed by Rajasthan (98 cases
with 98 victims), Delhi (80 cases with 80
victims) and Kerala (70 cases with 71 victims).
There were 561 victims in 557 reported incest
rape cases in the country during the year
2015.
34.9% of the total victims of incest
were in the age group of 18 – 30 years (196
victims) followed by 23.9% in age group 12-16
years (134 victims), 19.3% in age group 16 -
below 18 years (108 victims), 9.8% in age
group 6 - below 12 years (55 victims) and
9.4% in age group 30 - below 45 years (53
victims). Thus 54.5% of total incest rape
victims were children (below 18 years) (306
out of 561 victims). Some States have not
furnished data on children rape reported
under the Protection of Children from Sexual
Offences Act, 2012, the figures of the same
have been given in Chapter-6 separately.
A total of 34,094 cases were
registered for 34,210 victims under ‘other than
incest rapes’ during 2015. Madhya Pradesh
has registered maximum such cases (4,365
cases) followed by Maharashtra (4,005 cases)
and Rajasthan (3,546 cases) during 2015.
Maximum such victims were from the age
group of 18-30 years (16,770 victims). Age
group-wise detail on victims of rape including
incest rape is given in Table-5.3.
Out of 34,651 rape cases, in 33,098
cases the offenders were known to the victims
accounting for 95.5% of total rape cases
Table - 5(B)
Proportion of Crime against Women (IPC) towards Total IPC Crimes
Sl. No. Year Total IPC Crimes Crime against Women
(IPC cases)
Percentage to
Total IPC Crimes
1 2011 23,25,575 2,19,142 9.4%
2 2012 23,87,188 2,44,270 10.2%
3 2013 26,47,722 2,95,896 11.2%
4 2014* 28,51,563 3,25,327 11.4%
5 2015* 29,49,400 3,14,575 10.7%
‘*’Number of crime heads have also increased from 11 to 14 in 2014 & 2015 in the revised proformae.
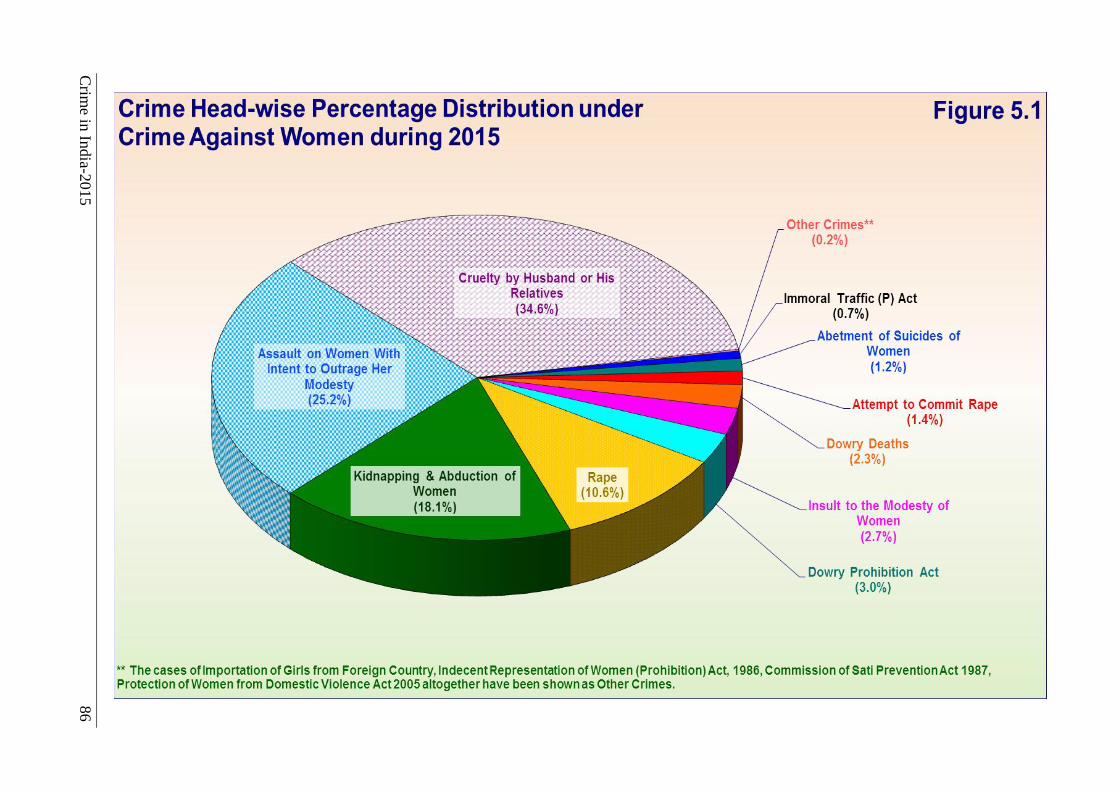
Crim
e in In
dia-2
015
86
Crime in India-2015 87
during 2015. 33 out of 36 States/UTs have
reported more than 90% of such rape cases
during 2015. Apart from 557 incest rape cases
(i.e. rapes by blood relatives), in 891 cases
victims were raped by close family members
and in 1,788 cases victims were raped by
other relatives. A total of 9,508 cases were
reported in which victims were raped by her
neighbours, maximum such cases were
reported in Assam (1,098 cases), Uttar
Pradesh (1,083 cases), Madhya Pradesh (883
cases) and Rajasthan (865 cases) and these
four States together accounted for 41.3% of
total such rape cases. In 557 cases,
employers/ co-workers have raped their
female employees or colleagues [Table-5.4].
During 2015, majority of rapes were
committed by unknown persons in Odisha
(327) followed by West Bengal (316).
Custodial Rape
(Incidence: 95 Rate- Negligible)
Custodial rape refers to cases of rape
under custody of police, of hospital, judicial
custody etc., earlier data on rape under police
custody only was collected. It has been further
sub categorized as custodial gang rape and
other than custodial rape & gang rape.
Out of 34,651 total rape cases
registered in the country, 95 cases were
registered as custodial rapes during the year
2015. Highest number of custodial rape cases
were reported in Uttar Pradesh (91 cases
consisting of 4 cases of gang rape and 87
cases of other custodial rapes) followed by
Uttarakhand (2 cases of custodial rape other
than gang rape), one case each in Andhra
Pradesh and West Bengal of custodial rape
other than gang rape were also registered in
2015 [Table 5.2].
Rape Other Than Custodial Rape
(Incidence: 34,556 Rate- 5.7)
Out of 34,651 total rape cases in the
country, 34,556 cases were registered as
other than custodial rape cases during the
year 2015. Rape other than custodial rape has
been further sub-categorized as gang rape
and other rape. Out of 34,556 rape cases
(other than custodial rape cases) in the
country, 2,113 cases were registered as gang
rape cases and 32,443 cases were registered
under other rape cases.
Maximum rape cases (other than
custodial rape cases) were reported in
Madhya Pradesh (4,391 cases, consisting of
270 gang rape cases and 4,121 other than
gang rape cases), followed by Maharashtra
with 4,144 such cases (consisting of 141 gang
rape cases and 4,003 other than gang rape
cases) and Rajasthan 3,644 (consisting of 411
gang rape cases and 3,233 other than gang
rape cases).
Maximum number of gang rape cases
were reported in Uttar Pradesh with 462 cases
(consisting of 4 custodial gang rape cases
and 458 other than custodial gang rape
cases) followed by Rajasthan with 411 cases
(all 411 cases other than custodial gang rape
cases) [Table 5.2].
Attempt to Commit Rape
(Incidence: 4,437 Rate- 0.7)
A total of 4,437 cases were registered
under attempt to commit rape during 2015.
Maximum number of such cases were
reported from West Bengal (1,551 cases)
followed by Assam (499 cases), Uttar Pradesh
(422 cases) and Rajasthan (407 cases)
[Table 5.2].
Kidnapping & Abduction of Women
(Incidence: 59,277 Rate- 9.8)
A total of 59,277 cases were registered
under kidnapping & abduction of women
during 2015. These cases have shown an
increase of 3.4% during 2015 over the
previous year 2014 (from 57,311 cases). Uttar
Pradesh with 10,135 cases of kidnapping &
abduction has accounted for 17.1% of the
total such cases. Delhi UT has reported the
highest crime rate at 46.3 compared to the
national average of 9.8.
Out of 59,277 cases of kidnapping &
abduction, maximum number of cases of
kidnapping & abduction of women were
registered for marriage purposes (31,778
cases)
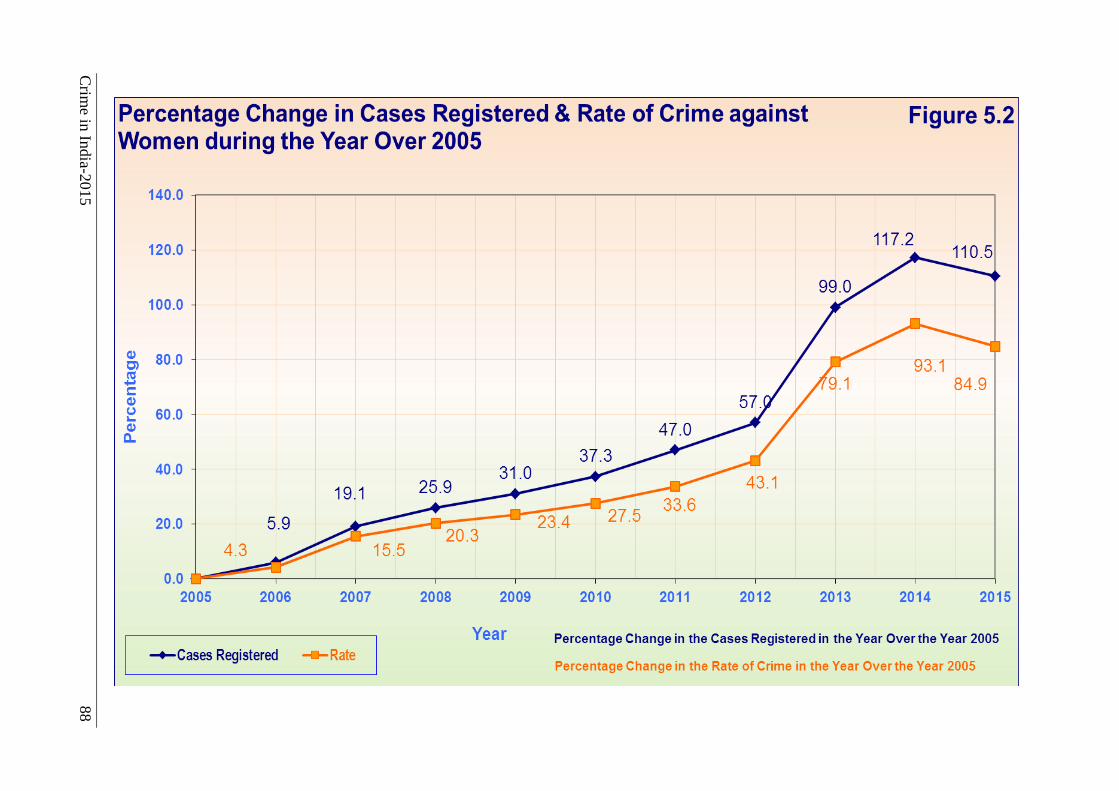
Crim
e in In
dia-2
015
88
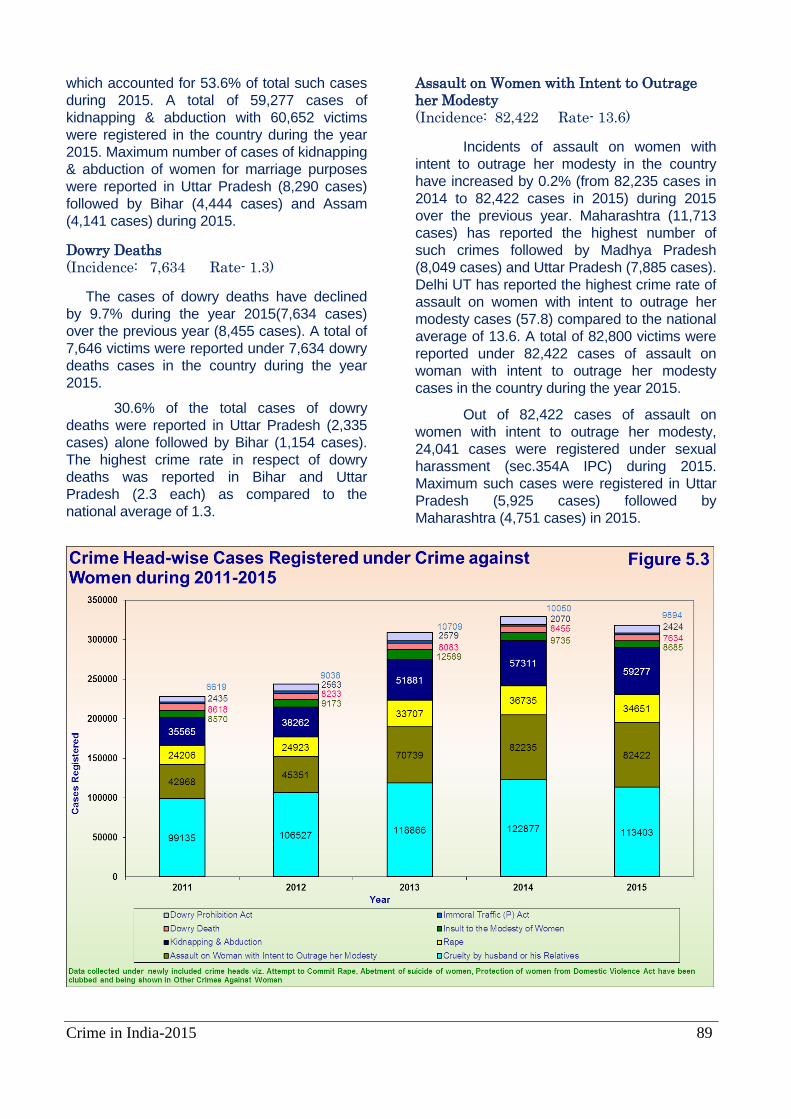
Crime in India-2015 89
which accounted for 53.6% of total such cases
during 2015. A total of 59,277 cases of
kidnapping & abduction with 60,652 victims
were registered in the country during the year
2015. Maximum number of cases of kidnapping
& abduction of women for marriage purposes
were reported in Uttar Pradesh (8,290 cases)
followed by Bihar (4,444 cases) and Assam
(4,141 cases) during 2015.
Dowry Deaths
(Incidence: 7,634 Rate- 1.3)
The cases of dowry deaths have declined
by 9.7% during the year 2015(7,634 cases)
over the previous year (8,455 cases). A total of
7,646 victims were reported under 7,634 dowry
deaths cases in the country during the year
2015.
30.6% of the total cases of dowry
deaths were reported in Uttar Pradesh (2,335
cases) alone followed by Bihar (1,154 cases).
The highest crime rate in respect of dowry
deaths was reported in Bihar and Uttar
Pradesh (2.3 each) as compared to the
national average of 1.3.
Assault on Women with Intent to Outrage
her Modesty
(Incidence: 82,422 Rate- 13.6)
Incidents of assault on women with
intent to outrage her modesty in the country
have increased by 0.2% (from 82,235 cases in
2014 to 82,422 cases in 2015) during 2015
over the previous year. Maharashtra (11,713
cases) has reported the highest number of
such crimes followed by Madhya Pradesh
(8,049 cases) and Uttar Pradesh (7,885 cases).
Delhi UT has reported the highest crime rate of
assault on women with intent to outrage her
modesty cases (57.8) compared to the national
average of 13.6. A total of 82,800 victims were
reported under 82,422 cases of assault on
woman with intent to outrage her modesty
cases in the country during the year 2015.
Out of 82,422 cases of assault on
women with intent to outrage her modesty,
24,041 cases were registered under sexual
harassment (sec.354A IPC) during 2015.
Maximum such cases were registered in Uttar
Pradesh (5,925 cases) followed by
Maharashtra (4,751 cases) in 2015.
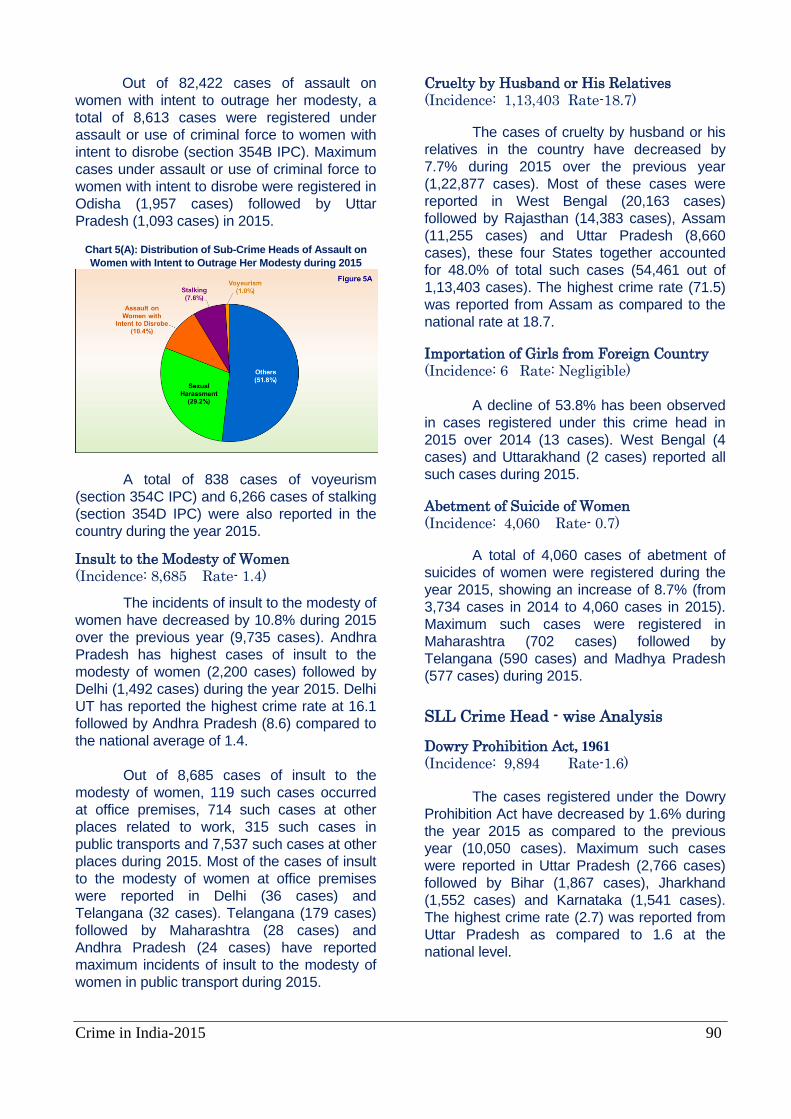
Crime in India-2015 90
Out of 82,422 cases of assault on
women with intent to outrage her modesty, a
total of 8,613 cases were registered under
assault or use of criminal force to women with
intent to disrobe (section 354B IPC). Maximum
cases under assault or use of criminal force to
women with intent to disrobe were registered in
Odisha (1,957 cases) followed by Uttar
Pradesh (1,093 cases) in 2015.
Chart 5(A): Distribution of Sub-Crime Heads of Assault on
Women with Intent to Outrage Her Modesty during 2015
A total of 838 cases of voyeurism
(section 354C IPC) and 6,266 cases of stalking
(section 354D IPC) were also reported in the
country during the year 2015.
Insult to the Modesty of Women
(Incidence: 8,685 Rate- 1.4)
The incidents of insult to the modesty of
women have decreased by 10.8% during 2015
over the previous year (9,735 cases). Andhra
Pradesh has highest cases of insult to the
modesty of women (2,200 cases) followed by
Delhi (1,492 cases) during the year 2015. Delhi
UT has reported the highest crime rate at 16.1
followed by Andhra Pradesh (8.6) compared to
the national average of 1.4.
Out of 8,685 cases of insult to the
modesty of women, 119 such cases occurred
at office premises, 714 such cases at other
places related to work, 315 such cases in
public transports and 7,537 such cases at other
places during 2015. Most of the cases of insult
to the modesty of women at office premises
were reported in Delhi (36 cases) and
Telangana (32 cases). Telangana (179 cases)
followed by Maharashtra (28 cases) and
Andhra Pradesh (24 cases) have reported
maximum incidents of insult to the modesty of
women in public transport during 2015.
Cruelty by Husband or His Relatives
(Incidence: 1,13,403 Rate-18.7)
The cases of cruelty by husband or his
relatives in the country have decreased by
7.7% during 2015 over the previous year
(1,22,877 cases). Most of these cases were
reported in West Bengal (20,163 cases)
followed by Rajasthan (14,383 cases), Assam
(11,255 cases) and Uttar Pradesh (8,660
cases), these four States together accounted
for 48.0% of total such cases (54,461 out of
1,13,403 cases). The highest crime rate (71.5)
was reported from Assam as compared to the
national rate at 18.7.
Importation of Girls from Foreign Country
(Incidence: 6 Rate: Negligible)
A decline of 53.8% has been observed
in cases registered under this crime head in
2015 over 2014 (13 cases). West Bengal (4
cases) and Uttarakhand (2 cases) reported all
such cases during 2015.
Abetment of Suicide of Women
(Incidence: 4,060 Rate- 0.7)
A total of 4,060 cases of abetment of
suicides of women were registered during the
year 2015, showing an increase of 8.7% (from
3,734 cases in 2014 to 4,060 cases in 2015).
Maximum such cases were registered in
Maharashtra (702 cases) followed by
Telangana (590 cases) and Madhya Pradesh
(577 cases) during 2015.
SLL Crime Head - wise Analysis
Dowry Prohibition Act, 1961
(Incidence: 9,894 Rate-1.6)
The cases registered under the Dowry
Prohibition Act have decreased by 1.6% during
the year 2015 as compared to the previous
year (10,050 cases). Maximum such cases
were reported in Uttar Pradesh (2,766 cases)
followed by Bihar (1,867 cases), Jharkhand
(1,552 cases) and Karnataka (1,541 cases).
The highest crime rate (2.7) was reported from
Uttar Pradesh as compared to 1.6 at the
national level.
Crime in India-2015 91
Indecent Representation of Women
(Prohibition) Act, 1986
(Incidence: 40 Rate: Negligible)
A decline of 14.9% was registered in
this crime head during the year 2015 as
compared to the previous year (47 cases).
Andhra Pradesh reported maximum such
cases accounting for 30.0% (12 cases out of
40 cases) of total such cases during 2015.
Commission of Sati Prevention Act, 1987
Like previous years, this year also no
case under the Commission of Sati Prevention
Act was registered across the country during
the year 2015.
Protection of Women from Domestic Violence
Act, 2005
(Incidence: 461 Rate- 0.1)
A total of 461 cases were registered
under this Act during 2015, showing an
increase of 8.2% (from 426 cases in 2014 to
461 cases in 2015) during 2015 over 2014.
Bihar (161 cases) followed by Kerala (132
cases), Madhya Pradesh (91 cases). Himachal
Pradesh (15 cases), Rajasthan (14 cases) and
Haryana (11 cases) have reported the
maximum such cases during 2015, these six
States together accounted for 92.0% of total
such cases reported in the country during
2015.
Immoral Traffic (Prevention) Act, 1956
(Incidence-2,424 Rate- 0.4)
The cases refer to crimes perpetrated
on women only registered under the Immoral
Traffic (P) Act.
The highest number of cases under the
Immoral Traffic (P) Act were reported in Tamil
Nadu (491 cases out of 2,424 cases)
accounting for 20.3% of total such cases
followed by Karnataka (420 cases),
Maharashtra (381 cases), Telangana (252) and
Andhra Pradesh (204). Karnataka, Tamil Nadu
and Telangana have reported the highest crime
rate of 1.4 each as compared to the national
average of 0.4.
Out of 2,424 cases registered under the
Immoral Traffic (Prevention) Act, 1,193 cases
under section 5 (procuring, inducing or taking
persons for prostitution), 79 cases under
section 6 (detaining of persons in premises
where prostitution carries on), 176 cases under
section 7 (prostitution in vicinity of public
places), 288 cases under section 8 (seducing
or soliciting for the purposes of prostitution) and
688 cases under other sections of the Immoral
Traffic (P) Act were reported during 2015.
Maharashtra (133 cases), Kerala (63 cases)
and Karnataka (48 cases) have reported
maximum cases of seducing or soliciting for the
purposes of prostitution, these three States
together accounted for 84.7% of total such
cases reported in the country (244 out of 288
cases) during 2015.
Disposal of Crimes Reported under Crime
against Women by Police
There were 4,71,327 cases (including
3,27,394 cases registered during 2015 and
1,44,914 cases pending investigation from
previous years) for investigation during the year
2015. Out of these cases, police completed
investigation in 3,14,078 cases during 2015. A
total of 8,765 cases of kidnapping & abduction
of women, 7,458 cases of cruelty by husband
or his relatives, 4,583 cases of assault on
women with intent to outrage her modesty and
2,624 cases of rape were such cases in which
final report were submitted by police declaring
the cases as false. In 29,228 cases charge-
sheets were not laid but final reports were
submitted showing as true cases by police
during 2015.
Out of 3,14,078 cases disposed of by
police, charge-sheets were submitted in
2,45,341 cases showing charge-sheeting rate
of 89.4%. Chargesheets (100%) were
submitted in all cases of custodial gang rape,
however low chargesheet rate was observed in
cases of kidnapping & abduction of women
(70.4%). A total of 1,57,249 cases under
crimes against women remained pending for
investigation at the end of the year 2015,
showing pendency rate of 33.3% at the end of
the year 2015 [Table 5.5].
Disposal of Crimes Reported under Crime
against Women by Courts
There were 12,27,187 cases (including
9,82,582 cases pending trials from previous
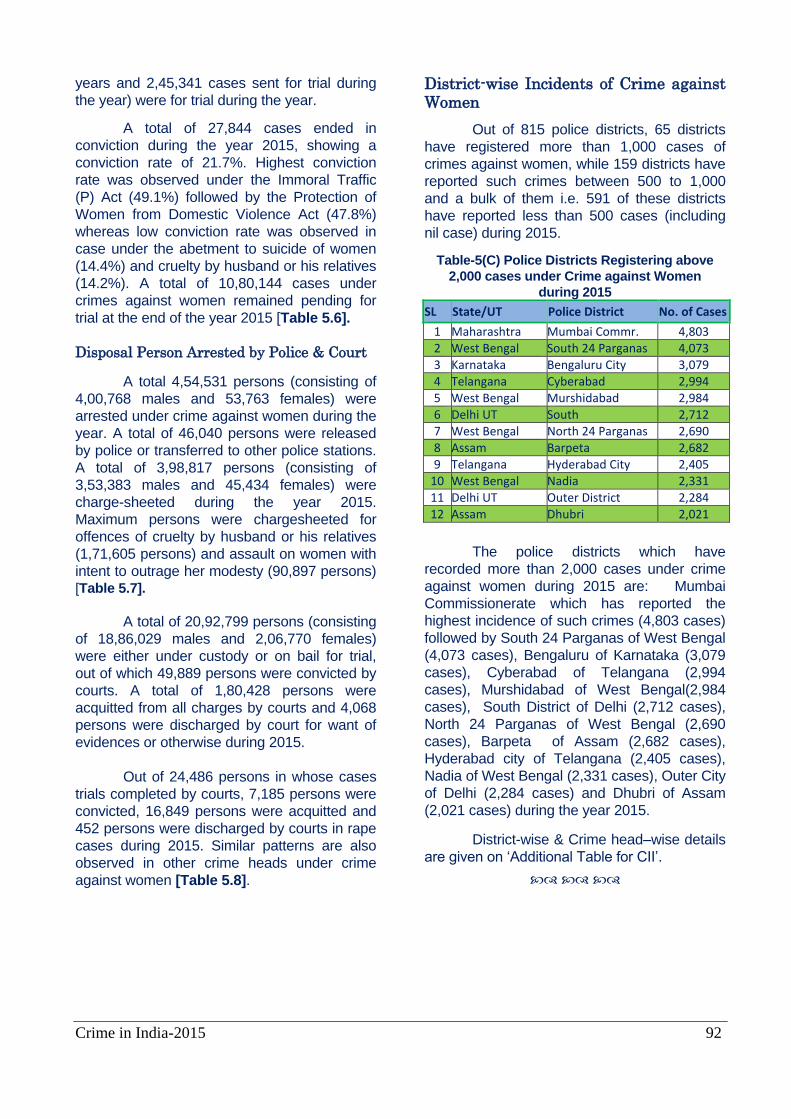
Crime in India-2015 92
years and 2,45,341 cases sent for trial during
the year) were for trial during the year.
A total of 27,844 cases ended in
conviction during the year 2015, showing a
conviction rate of 21.7%. Highest conviction
rate was observed under the Immoral Traffic
(P) Act (49.1%) followed by the Protection of
Women from Domestic Violence Act (47.8%)
whereas low conviction rate was observed in
case under the abetment to suicide of women
(14.4%) and cruelty by husband or his relatives
(14.2%). A total of 10,80,144 cases under
crimes against women remained pending for
trial at the end of the year 2015 [Table 5.6].
Disposal Person Arrested by Police & Court
A total 4,54,531 persons (consisting of
4,00,768 males and 53,763 females) were
arrested under crime against women during the
year. A total of 46,040 persons were released
by police or transferred to other police stations.
A total of 3,98,817 persons (consisting of
3,53,383 males and 45,434 females) were
charge-sheeted during the year 2015.
Maximum persons were chargesheeted for
offences of cruelty by husband or his relatives
(1,71,605 persons) and assault on women with
intent to outrage her modesty (90,897 persons) [Table 5.7].
A total of 20,92,799 persons (consisting
of 18,86,029 males and 2,06,770 females)
were either under custody or on bail for trial,
out of which 49,889 persons were convicted by
courts. A total of 1,80,428 persons were
acquitted from all charges by courts and 4,068
persons were discharged by court for want of
evidences or otherwise during 2015.
Out of 24,486 persons in whose cases
trials completed by courts, 7,185 persons were
convicted, 16,849 persons were acquitted and
452 persons were discharged by courts in rape
cases during 2015. Similar patterns are also
observed in other crime heads under crime
against women [Table 5.8].
District-wise Incidents of Crime against Women
Out of 815 police districts, 65 districts
have registered more than 1,000 cases of
crimes against women, while 159 districts have
reported such crimes between 500 to 1,000
and a bulk of them i.e. 591 of these districts
have reported less than 500 cases (including
nil case) during 2015.
Table-5(C) Police Districts Registering above
2,000 cases under Crime against Women
during 2015
SL State/UT Police District No. of Cases
1 Maharashtra Mumbai Commr. 4,803 2 West Bengal South 24 Parganas 4,073 3 Karnataka Bengaluru City 3,079 4 Telangana Cyberabad 2,994 5 West Bengal Murshidabad 2,984 6 Delhi UT South 2,712 7 West Bengal North 24 Parganas 2,690 8 Assam Barpeta 2,682 9 Telangana Hyderabad City 2,405
10 West Bengal Nadia 2,331 11 Delhi UT Outer District 2,284 12 Assam Dhubri 2,021
The police districts which have
recorded more than 2,000 cases under crime
against women during 2015 are: Mumbai
Commissionerate which has reported the
highest incidence of such crimes (4,803 cases)
followed by South 24 Parganas of West Bengal
(4,073 cases), Bengaluru of Karnataka (3,079
cases), Cyberabad of Telangana (2,994
cases), Murshidabad of West Bengal(2,984
cases), South District of Delhi (2,712 cases),
North 24 Parganas of West Bengal (2,690
cases), Barpeta of Assam (2,682 cases),
Hyderabad city of Telangana (2,405 cases),
Nadia of West Bengal (2,331 cases), Outer City
of Delhi (2,284 cases) and Dhubri of Assam
(2,021 cases) during the year 2015. District-wise & Crime head–wise details
are given on ‘Additional Table for CII’.
Crime in India-2015 93
Chapter - 6
Crime against Children
Crimes against children include physical and emotional abuse, neglect and exploitation, such as through child pornography or sex trafficking of minors. Indian penal code and the various protective and preventive special and local laws specifically mention the offences wherein children are victims. The age of child varies as per the definition given in the concerned Acts but age of child has been defined to be below 18 years as per The Juvenile Justice (Care and Protection of Children) Act, 2000 Amended. Therefore an offence committed on a victim under the age of 18 years is considered as crime against children for the purpose of analysis in this chapter. It is also to be borne in mind that the offences that are analysed in this chapter do not form an exclusive block of offences that are reported in the country. They are included in the IPC/SLL cases already discussed in other relevant chapters. The offences dealt in this chapter have been culled out from various reported crimes in the country wherein the victims of the offences were children. The list of offences under the two broadly categorised offences under the IPC and the Special and Local Acts is as follows: 1) Crime against Children under Indian Penal Code.
(i) Murder (Section 302 IPC)
(ii) Attempt to commit murder (Section 307
IPC)*
(iii) Infanticide (Section 315 IPC)
(iv) Rape (Section 376 IPC)
(v) Unnatural Offence (Section 377 IPC)*
(vi) Assault on Women (Girl Child) with Intent
to Outrage her Modesty (section 354 IPC)*
6.1 Sexual Harassment (Section 354A
IPC)*
6.2 Assault or Use of Criminal Force to
Women (Girl Child) with Intent to
Disrobes (Section 354B IPC*)
6.3 Voyeurism (Section 354C IPC)*
6.4 Stalking (Section 354D IPC)*
(vii) Insult to the Modesty of Women (Girl
Child) (Section 509 IPC*)
(viii) Kidnapping & Abduction (Section 363,
364,364A, 365, 366, 367, 368 & 369 IPC).
(ix) Foeticide (Section 315 and 316 IPC).
(x) Abetment of Suicide of Child (Section 305
IPC)
(xi) Exposure and Abandonment (section 317
IPC)
(xii) Procuration of Minor Girls (section 366-A
IPC)
(xiii) Importation of Girls from Foreign Country
(Section 366-B IPC) (under 18 years of
age)
(xiv) Buying of Minors for Prostitution (Section
373 IPC)
(xv) Selling of Minors for Prostitution (Section
372 IPC)
2) Crime against Children under
Special and Local Laws(SLL)
i) Prohibition of Child Marriage Act, 2006
ii) Transplantation of Human Organs Act
1994*(for persons below 18 years of age)
iii) Child labour (Prohibition & Regulation)
Act, 1986*
iv) Immoral Traffic (Prevention) Act, 1956*
v) Juvenile Justice (Care & Protection of
Children) Act, 2000*
vi) Protection of Children from Sexual
Offences Act, 2012*
‘*’ Data has been collected since 2014 in the revised proformae.
Note:- In order to avoid the duplicity of data, cases registered under section 376 of IPC exclude the cases registered under sections 4 & 6 of the Protection of Children from Sexual Offence (POCSO) Act 2012. Similarly cases reported under different sections of IPC like 354, 509 etc. exclude related section of the POCSO Act.
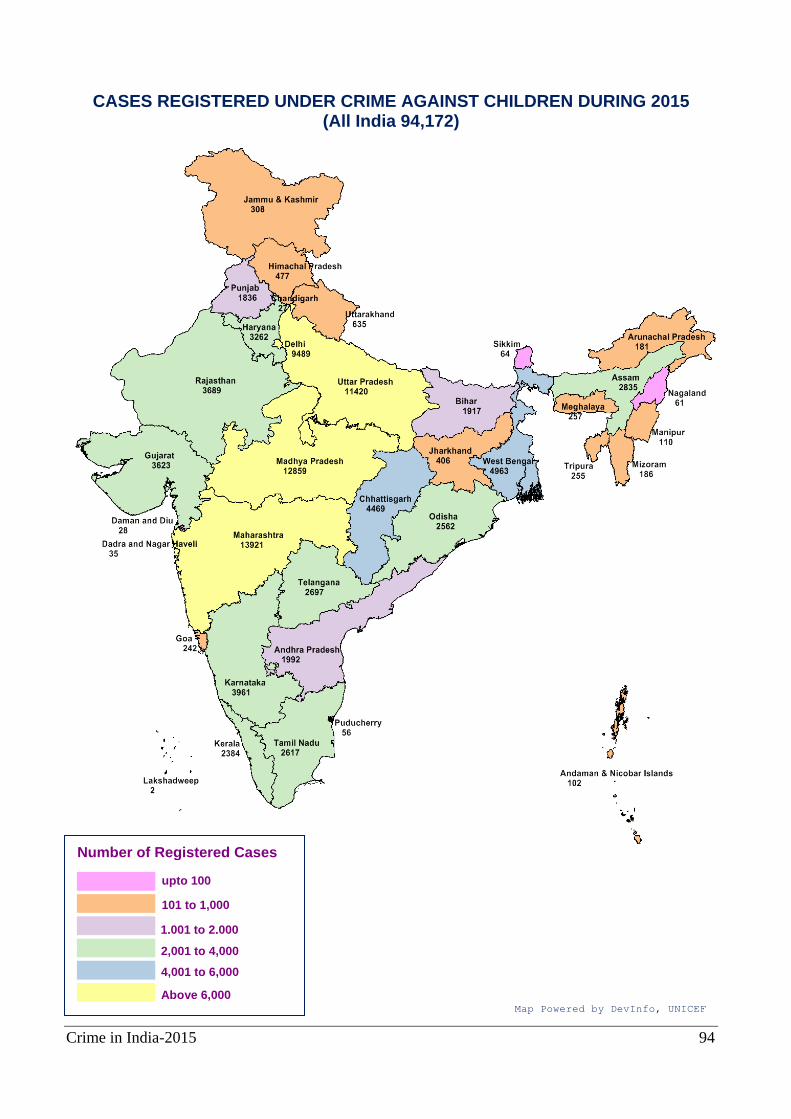
Crime in India-2015 94
CASES REGISTERED UNDER CRIME AGAINST CHILDREN DURING 2015 (All India 94,172)
Number of Registered Cases
upto 100
1,001 to 2,000
Above 6,000 Map Powered by DevInfo, UNICEF
101 to 1,000
2,001 to 4,000
4,001 to 6,000
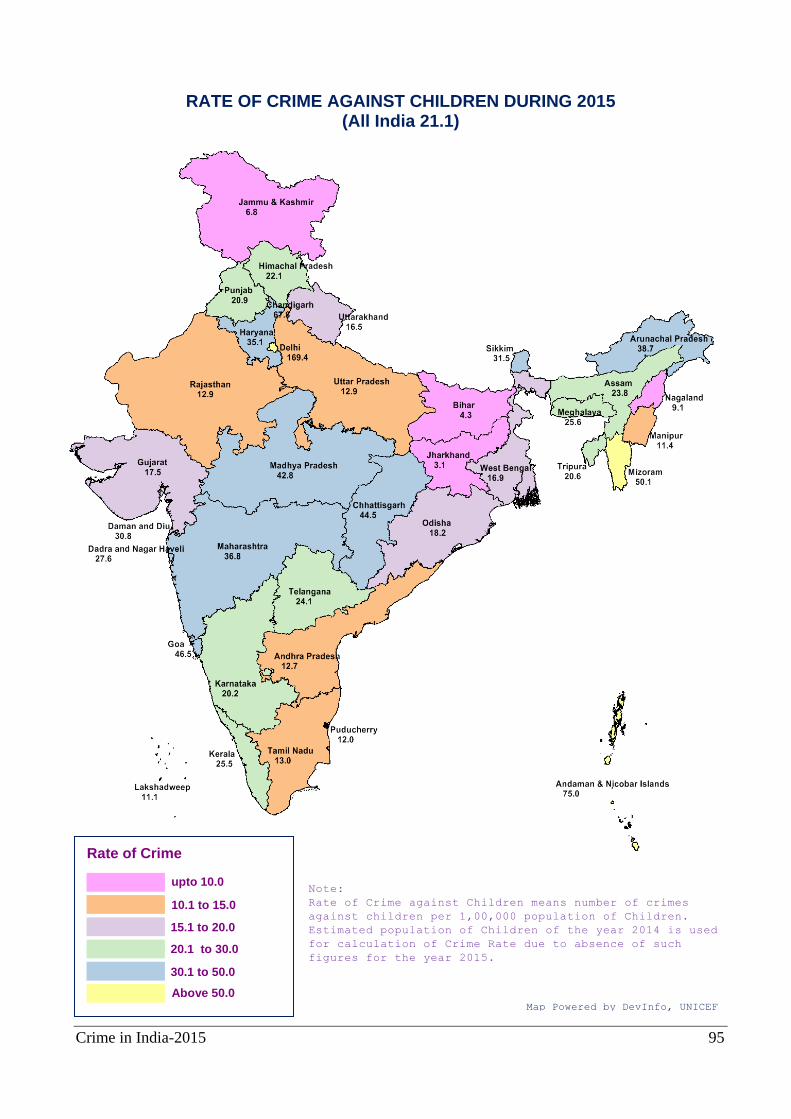
Crime in India-2015 95
RATE OF CRIME AGAINST CHILDREN DURING 2015 (All India 21.1)
Rate of Crime
upto 10.0
15.1 to 20.0
Above 50.0 Map Powered by DevInfo, UNICEF
10.1 to 15.0
20.1 to 30.0
30.1 to 50.0
Note:
Rate of Crime against Children means number of crimes
against children per 1,00,000 population of Children.
Estimated population of Children of the year 2014 is used
for calculation of Crime Rate due to absence of such
figures for the year 2015.
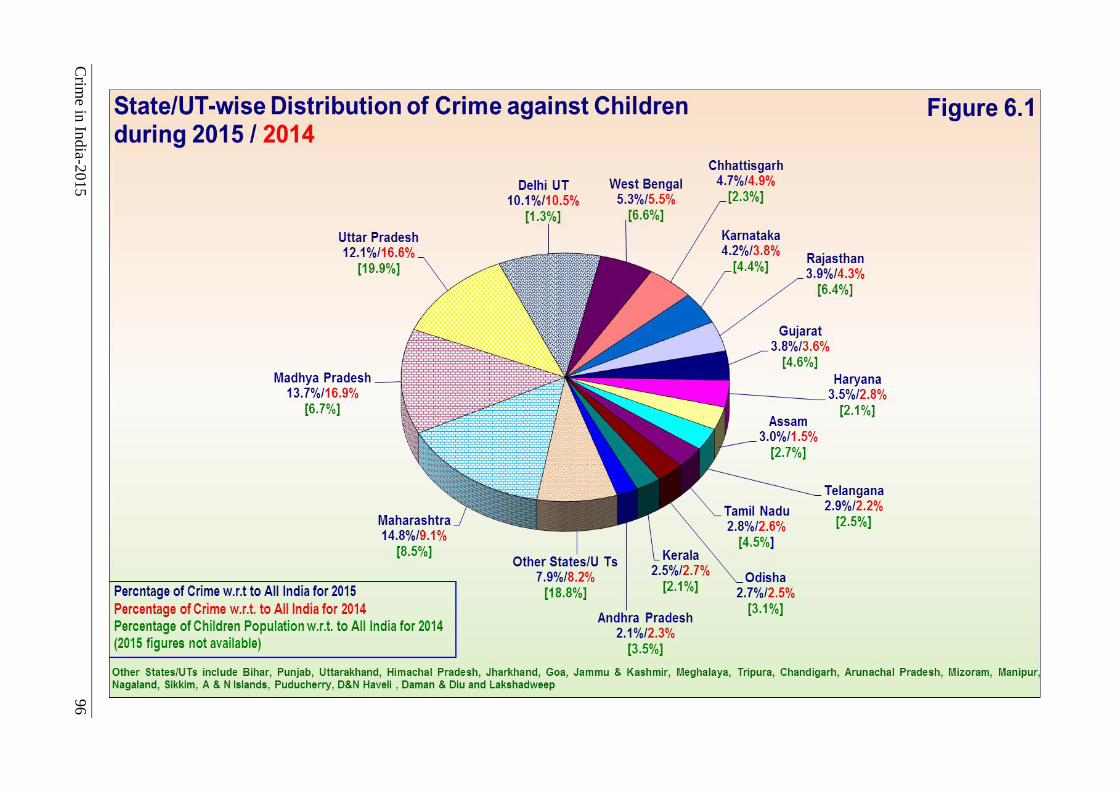
Crim
e in In
dia-2
015
96

Crime in India-2015 97
Incidence of Crime against Children (Incidence: 94,172)
A total of 94,172 cases of crimes against children were registered in the country during 2015 as compared to 89,423 cases during 2014, showing an increase of 5.3%. Maharashtra accounted for 14.8% of total crimes committed against children registered in the country. The next in order was Madhya Pradesh (13.7%), Uttar Pradesh (12.1%) and Delhi (10.1%).
Crime Rate (Rate: 21.1)
The crime rate i.e. number of cases reported under crimes against children per 1,00,000 population of children (below 18 years of age) was observed as 21.1 at all India level during 2015. The crime rate was highest in Delhi (169.4) followed by A&N Islands (75.0), Chandigarh (67.8), Mizoram (50.1) and Goa (46.5) in comparison to the national average of 21.1.
Crime Head-wise Analysis
The State/UT-wise and crime head-
wise incidents of crimes are presented in Table-6.2.
Murder (excluding Infanticide) (Incidence: 1,758 Rate: 0.4)
A total of 1,758 cases of ‘murder’ of children (excluding infanticides) were registered in the country against 1,817 cases in 2014 showing a decrease of 3.2% during 2015 over 2014. Uttar Pradesh has reported the highest number of such cases (474 cases) accounting for 27.0% of the total cases registered in the country. Sikkim, Lakshadweep and Puducherry did not report any case of intentional homicide of children during the year 2015. Total numbers of victims were 1,937 in 1,758 cases. D & N Haveli (1.6) followed by Arunachal Pradesh (1.3) have reported high crime rate compared to crime rate of 0.4 at all India level during 2015. Infanticide (Sec. 315 IPC) (Incidence: 91 Rate: Negligible)
A total of 91 cases of ‘Infanticide’ were registered in the country during the 2015. The incidents declined by 24.8% in the year 2015 over 2014 (from 121 cases in 2014 to 91
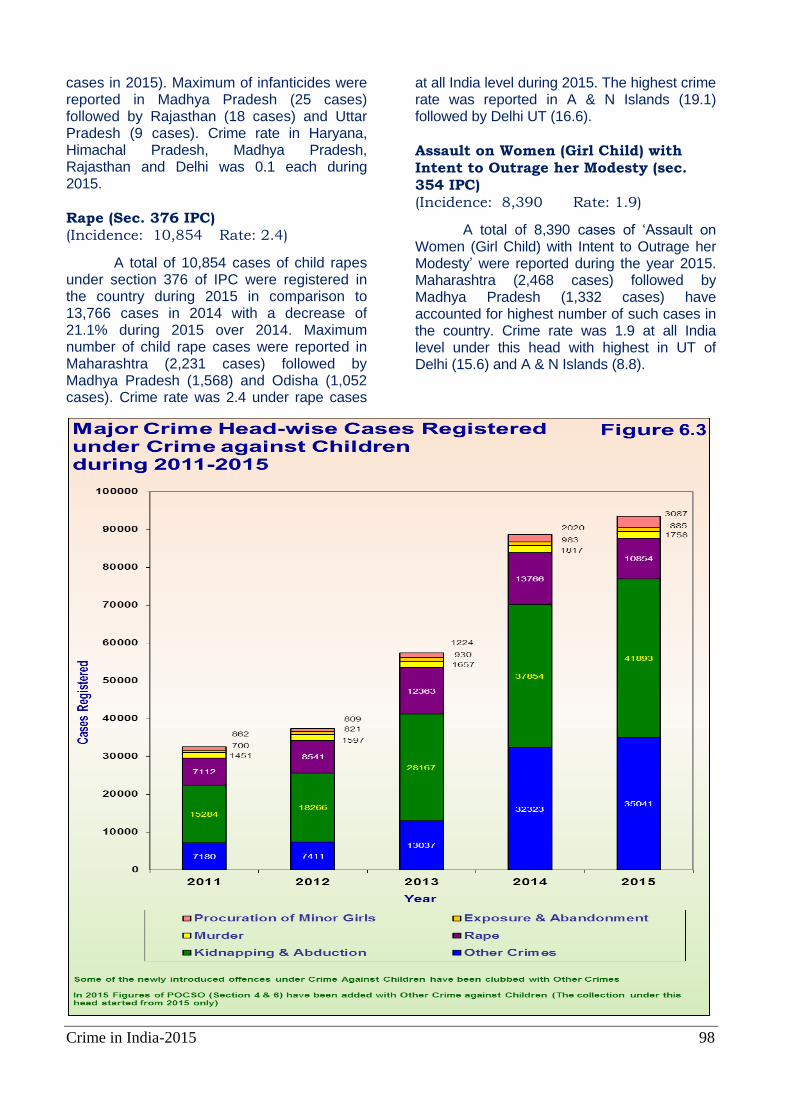
Crime in India-2015 98
cases in 2015). Maximum of infanticides were reported in Madhya Pradesh (25 cases) followed by Rajasthan (18 cases) and Uttar Pradesh (9 cases). Crime rate in Haryana, Himachal Pradesh, Madhya Pradesh, Rajasthan and Delhi was 0.1 each during 2015. Rape (Sec. 376 IPC) (Incidence: 10,854 Rate: 2.4) A total of 10,854 cases of child rapes under section 376 of IPC were registered in the country during 2015 in comparison to 13,766 cases in 2014 with a decrease of 21.1% during 2015 over 2014. Maximum number of child rape cases were reported in Maharashtra (2,231 cases) followed by Madhya Pradesh (1,568) and Odisha (1,052 cases). Crime rate was 2.4 under rape cases
at all India level during 2015. The highest crime rate was reported in A & N Islands (19.1) followed by Delhi UT (16.6). Assault on Women (Girl Child) with Intent to Outrage her Modesty (sec.
354 IPC) (Incidence: 8,390 Rate: 1.9)
A total of 8,390 cases of ‘Assault on Women (Girl Child) with Intent to Outrage her Modesty’ were reported during the year 2015. Maharashtra (2,468 cases) followed by Madhya Pradesh (1,332 cases) have accounted for highest number of such cases in the country. Crime rate was 1.9 at all India level under this head with highest in UT of Delhi (15.6) and A & N Islands (8.8).
Crime in India-2015 99
Sexual Harassment (Sec. 354A IPC) (Incidence: 3,350 Rate: 0.8)
A total of 3,350 cases of ‘Sexual Harassment’ of children were registered during the year 2015. Maharashtra (1,043 cases), Uttar Pradesh (729 cases) and Madhya Pradesh (471 cases) have reported high number of such cases in the country. Crime rate was 0.8 at all India level under this head with highest in Mizoram (5.7) and Delhi (4.8).
Assault or Use of Criminal Force to Women (Girl Child) with Intent to Disrobe (Section 354B IPC) (Incidence: 540 Rate: 0.1)
A total of 540 cases under ‘Assault or uses of criminal force to women (girl child) with
intent to disrobe’ were registered during the year 2015. Uttar Pradesh (104 cases), UT of Delhi (82 cases) and Maharashtra (77 cases) have reported high number of such cases in the country. Crime rate was 0.1 at all India level under this head wherein the highest such crime rate was in Delhi (1.5) and followed by Tripura (1.0). Voyeurism (Section 354C IPC) (Incidence: 51 Rate: Negligible)
A total of 51 cases of ‘Voyeurism’ were registered during the year 2015. Maharashtra (12 cases), Delhi UT & Telangana (6 cases each) have reported high number of cases in the country. Total numbers of victims were 56 in 51 cases.
Table-6 (A)
Incidents of Crimes against Children and % change in 2015 over 2014
Sl. No.
Crime Head
Year % Variation in 2015 over
2014 2013 2014 2015
(1) (2) (3) (4) (5) (6)
1. Murder 1657 1817 1758 -3.2
2. Attempt to Commit Murder* - 840 276 -67.1
3. Infanticide 82 121 91 -24.8
4. Rape 12363 13766 10854 -21.2
5. Assault on Women(Girls Children) with Intent to Outrage their Modesty*
- 11335 8390 -26.0
6. Insult to the Modesty of Women (Girls Children)* - 444 348 -0.3
7. Kidnapping & Abduction 28167 37854 41893 10.7
8. Foeticide 221 107 97 -9.3
9. Abetment of Suicide 215 56 51 -8.9
10. Exposure & Abandonment 930 983 885 -10.0
11. Procuration of minor girls 1224 2020 3087 52.8
12. Importation of girls from foreign country (below 18 years)*
- 2 2 0.0
13. Buying of girls for prostitution 6 14# 11# -21.4
14. Selling of girls for prostitution 100 82# 111# 35.4
15. Prohibition of Child Marriage Act 222 280 293 4.6
16. Transplantation of Human Organs Act* - 1 0 -100.0
17. Child Labour (Prohibition and Regulation) Act* 147 251 70.7
18. Immoral Trafficking (P) Act* - 86 58 -32.6
19. Juveniles Justice(C&P of Children) Act * - 1,315 1457 10.8
20. Protection of Children from Sexual Offences Act* - 8904 14913 67.5
21. Un-natural Offences* - 765 814 6.4
22. Human Trafficking (section 370 & 370A IPC)* - - 221~ -
23. Other Crimes 13037 8484 8311 -2.0
24. Total 58224 89423 94172 5.3
‘*’Collecting since 2014 in the revised proformae; ‘#’ data collected under minor in place of girls only; ‘~’ included for
the first time in 2015
Crime in India-2015 100
Stalking (Section 354D IPC) (Incidence-1,020 Rate-0.2)
A total of 1,020 cases of ‘Stalking’ of children were registered during the year 2015. Maharashtra (422 cases), Delhi UT (169 cases) and Telangana (135 cases) have reported high number of such cases in the country. Crime rate was 0.2 at all India level under this head with highest in Delhi UT (3.0) and followed by A&N Island (1.5). Insult to the Modesty of Women (Girl Child)(Sec. 509 IPC)
(Incidence-348 Rate-0.1)
A total of 348 cases of ‘Insult to the modesty of women’ (girl child) were registered during the year 2015. Maharashtra (91 cases) and Telangana (59 cases) have reported high number of such cases in the country. Crime rate was 0.1 at all India level under this head with highest in Delhi (0.9) followed by Andhra Pradesh (0.3).
Kidnapping & Abduction of Children (Incidence-41,893 Rate-9.4)
A total of 41,893 cases of ‘kidnapping & abduction’ of children were registered during the year 2015 as compared to 37,854 cases in the previous year showing an increase of 10.7%. Maharashtra (6,960 cases) followed by Delhi (6,881 cases) have reported high number of such cases in the country. Crime rate was 9.4 at all India level under this head with highest in UT of Delhi (122.9) and followed by Chandigarh (41.0).
A total of 23,462 cases of ‘kidnapping & abduction’ of children were registered under Section 363 IPC, with 24,304 victims. Maximum numbers of such victims were from UT of Delhi (7,257 victims).
A total of 12,516 cases of ‘kidnapping & abduction of women(girls children) to compel her for marriage’ were registered with crime rate of 2.8 at all India level. Maximum such victims were reported from Uttar Pradesh (4,462 victims).
A total of 192 cases of ‘kidnapping & abduction in order to Murder’ were registered under Section 364 IPC, with 192 victims. Maximum such victims were from Uttar Pradesh (129 victims). A total of 142 cases of kidnapping or abduction for ransom etc. were
registered under section 364A IPC, with 147 victims. Maximum such victims were from Uttar Pradesh (29 victims).
Foeticide (Sec. 315 & 316 IPC) (Incidence-97 Rate-Negligible)
A total of 97 cases of ‘foeticide’ were registered in the country during 2015 as compared to 107 cases in the year 2014 indicating a decline of 9.3%. Madhya Pradesh, Haryana, Rajasthan and Uttar Pradesh have reported 17 cases, 14 cases, 13 cases and 12 cases respectively. Crime rate was negligible at all India level under this head with Haryana (0.2), Delhi, Punjab, Madhya Pradesh & Chhattisgarh with 0.1 crime rate each. Abetment to Suicide of Child (Sec. 305 IPC)
(Incidence- 51 Rate-Negligible)
A total of 51 cases of ‘abetment to suicide’ of children were registered during the year 2015 as compared to 56 cases in the year 2014 showing a decline of 8.9% during 2015. Crime rate was negligible at all India level under this head with Tripura and Chhattisgarh (0.1 each).
Exposure & Abandonment (Sec. 317 IPC) (Incidence-885 Rate- 0.2)
A total of 885 such cases were registered during 2015 as compared to 983 cases during 2014 showing an increase of 10.0% during the year 2015. Maharashtra has reported the highest number of such cases (219 cases), followed by Madhya Pradesh (145 cases). Crime rate was 0.2 at all India level under this head with highest in D&N Haveli (1.6) and followed by Chandigarh and A&N Islands (1.5 each).
Procuration of Minor Girls, Sec.
366A IPC (Incidence-3,087 Rate 0.7)
3,087 such cases were registered in the year 2015 as compared to 2,020 cases in the year 2014, showing an increase of 52.8% during 2015 over 2014. Assam has reported 1,303 such cases followed by West Bengal (1,003 cases) and Bihar (305 cases). Crime rate was 0.7 at all India level under this head with highest in Assam (11.0) followed by West Bengal (3.4).

Crime in India-2015 101
Importation of Girls from Foreign
Country (Section 366B IPC) (Incidence-2 Rate-Negligible)
Two cases of ‘Importation of girls from foreign country’ (under 18 years of age) were registered during the year 2015 in the country. These 2 cases were reported from Uttarakhand and West Bengal with 1 case each.
Buying/Selling of Minors for
prostitution, Sec. 373/372 IPC
(Incidence…11/111 Rate-Negligible)
11 cases of ‘buying of minor for prostitution(under section 373 of IPC)’ and 111 cases of ‘selling of minors for prostitution (under section 372 of IPC)’ were registered in the country during the year 2015 against 14 and 122 such cases registered in the year 2014 respectively. Only Maharashtra, Haryana, Telangana and Uttar Pradesh reported cases of ‘buying of minors for prostitution'.
Five States/UT namely Chhattisgarh, Haryana, Madhya Pradesh, Maharashtra, Uttar Pradesh and West Bengal registered cases of ‘selling of minors for prostitution' during 2015.
Prohibition of Child Marriage Act, 2006 (Incidence-293 Rate-0.1)
A total of 293 cases under the Prohibition of Child Marriage Act, 2006 were registered during the year 2015. Tamil Nadu (77 cases) followed by West Bengal (40 cases) have reported high number of such cases in the country. Crime rate was 0.1 at all India level under this head with highest in A&N Islands (0.7) followed by Tamil Nadu (0.4).
Transplantation of Human Organs
Act, 1994 (for persons below 18 years of age) (Incidence- Nil Rate-Negligible)
No case of ‘the Transplantation of Human Organs Act’ 1994 (for persons below 18 years of age) was registered in the country during the year 2015.
Child Labour (Prohibition & Regulation) Act, 1986
(Incidence- 251 Rate-0.1)
A total of 251 cases under the ‘Child Labour’ (Prohibition & Regulation) Act, 1986
were registered during the year 2015.
Maharashtra (96 cases) followed by Delhi (57 cases), Karnataka (34 cases) have registered high number of such cases in the country.
Out of 251 cases under the Child Labour (Prohibition & Regulation) Act, 1986, 53 cases were related to crimes committed against migrants, 198 cases related to offences committed against locals.
Immoral Traffic (Prevention) Act, 1986
(Incidence- 58 Rate-Negligible)
A total of 58 cases under the ‘Immoral Traffic (Prevention) Act’, 1956 were
registered during the year 2015. Maharashtra (18 cases) and Karnataka (10 cases) have registered high number of such cases in the country.
Juvenile Justice (Care & Protection of Children) Act, 2000 (Amended) (Incidence- 1,457 Rate- 0.3)
A total of 1,457 cases under the ‘Juvenile Justice (Care & Protection of Children) Act’, were registered during the year 2015. Maharashtra (251 cases) and Rajasthan (216 cases) have registered high number of such cases in the country. Crime rate was 0.3 at all India level under this head with highest in Chandigarh (3.8 each) followed by Sikkim (3.0).
Unnatural Offences, Sec. 377 IPC (Incidence- 814 Rate-0.2 )
814 cases of ‘unnatural offences’ under crime against children were registered during 2015. Uttar Pradesh (179 cases), Kerala (142 cases) and Maharashtra (116 cases) have registered high number of such cases in the country. Crime rate was 0.2 at all India level under this head with highest in UT of Chandigarh (2.8), followed by Delhi (2.0).
Protection of Children from Sexual Offences Act, 2012 (Incidence- 14,913 Rate-3.3)
A total of 14,913 cases under the ‘Protection of Children from Sexual Offences Act’, 2012 were registered during the year 2015. Uttar Pradesh (3,078 cases), Madhya Pradesh (1,687 cases) and Tamil Nadu (1,544 cases) have accounted for majority of such cases in the country. Crime rate was 3.3 at all
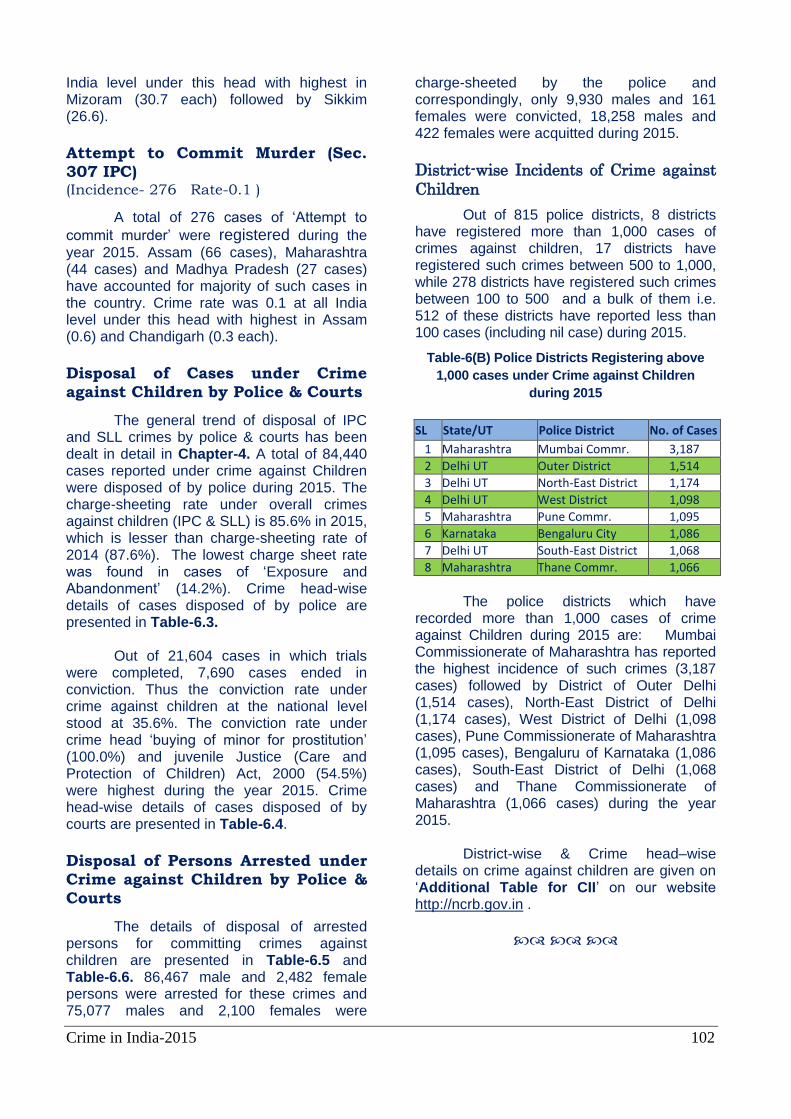
Crime in India-2015 102
India level under this head with highest in Mizoram (30.7 each) followed by Sikkim (26.6).
Attempt to Commit Murder (Sec. 307 IPC) (Incidence- 276 Rate-0.1 )
A total of 276 cases of ‘Attempt to
commit murder’ were registered during the
year 2015. Assam (66 cases), Maharashtra (44 cases) and Madhya Pradesh (27 cases) have accounted for majority of such cases in the country. Crime rate was 0.1 at all India level under this head with highest in Assam (0.6) and Chandigarh (0.3 each).
Disposal of Cases under Crime against Children by Police & Courts
The general trend of disposal of IPC and SLL crimes by police & courts has been dealt in detail in Chapter-4. A total of 84,440 cases reported under crime against Children were disposed of by police during 2015. The charge-sheeting rate under overall crimes against children (IPC & SLL) is 85.6% in 2015, which is lesser than charge-sheeting rate of 2014 (87.6%). The lowest charge sheet rate was found in cases of ‘Exposure and Abandonment’ (14.2%). Crime head-wise details of cases disposed of by police are presented in Table-6.3.
Out of 21,604 cases in which trials were completed, 7,690 cases ended in conviction. Thus the conviction rate under crime against children at the national level stood at 35.6%. The conviction rate under crime head ‘buying of minor for prostitution’ (100.0%) and juvenile Justice (Care and Protection of Children) Act, 2000 (54.5%) were highest during the year 2015. Crime head-wise details of cases disposed of by courts are presented in Table-6.4.
Disposal of Persons Arrested under Crime against Children by Police &
Courts
The details of disposal of arrested persons for committing crimes against children are presented in Table-6.5 and Table-6.6. 86,467 male and 2,482 female persons were arrested for these crimes and 75,077 males and 2,100 females were
charge-sheeted by the police and correspondingly, only 9,930 males and 161 females were convicted, 18,258 males and 422 females were acquitted during 2015.
District-wise Incidents of Crime against
Children
Out of 815 police districts, 8 districts have registered more than 1,000 cases of crimes against children, 17 districts have registered such crimes between 500 to 1,000, while 278 districts have registered such crimes between 100 to 500 and a bulk of them i.e. 512 of these districts have reported less than 100 cases (including nil case) during 2015.
Table-6(B) Police Districts Registering above
1,000 cases under Crime against Children
during 2015
SL State/UT Police District No. of Cases
1 Maharashtra Mumbai Commr. 3,187
2 Delhi UT Outer District 1,514
3 Delhi UT North-East District 1,174
4 Delhi UT West District 1,098
5 Maharashtra Pune Commr. 1,095
6 Karnataka Bengaluru City 1,086
7 Delhi UT South-East District 1,068
8 Maharashtra Thane Commr. 1,066
The police districts which have recorded more than 1,000 cases of crime against Children during 2015 are: Mumbai Commissionerate of Maharashtra has reported the highest incidence of such crimes (3,187 cases) followed by District of Outer Delhi (1,514 cases), North-East District of Delhi (1,174 cases), West District of Delhi (1,098 cases), Pune Commissionerate of Maharashtra (1,095 cases), Bengaluru of Karnataka (1,086 cases), South-East District of Delhi (1,068 cases) and Thane Commissionerate of Maharashtra (1,066 cases) during the year 2015. District-wise & Crime head–wise details on crime against children are given on ‘Additional Table for CII’ on our website http://ncrb.gov.in .
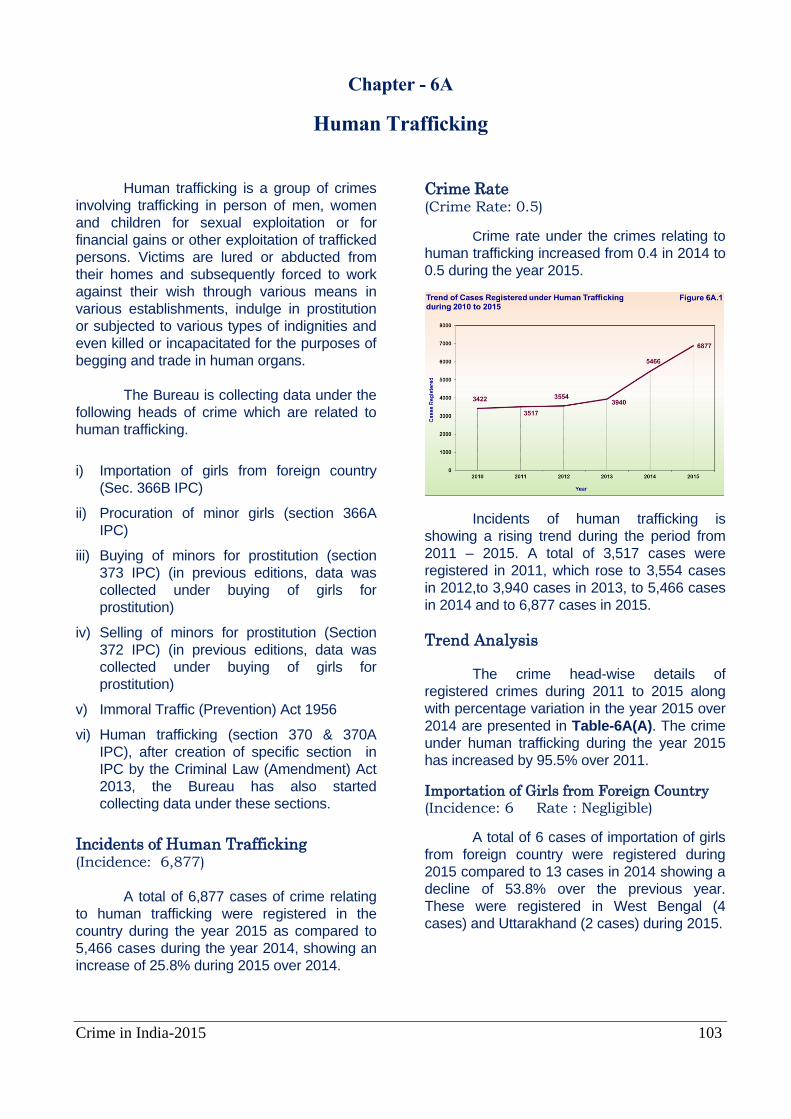
Crime in India-2015 103
Chapter - 6A
Human Trafficking
Human trafficking is a group of crimes
involving trafficking in person of men, women
and children for sexual exploitation or for
financial gains or other exploitation of trafficked
persons. Victims are lured or abducted from
their homes and subsequently forced to work
against their wish through various means in
various establishments, indulge in prostitution
or subjected to various types of indignities and
even killed or incapacitated for the purposes of
begging and trade in human organs.
The Bureau is collecting data under the
following heads of crime which are related to
human trafficking.
i) Importation of girls from foreign country
(Sec. 366B IPC)
ii) Procuration of minor girls (section 366A
IPC)
iii) Buying of minors for prostitution (section
373 IPC) (in previous editions, data was
collected under buying of girls for
prostitution)
iv) Selling of minors for prostitution (Section
372 IPC) (in previous editions, data was
collected under buying of girls for
prostitution)
v) Immoral Traffic (Prevention) Act 1956
vi) Human trafficking (section 370 & 370A
IPC), after creation of specific section in
IPC by the Criminal Law (Amendment) Act
2013, the Bureau has also started
collecting data under these sections.
Incidents of Human Trafficking
(Incidence: 6,877)
A total of 6,877 cases of crime relating
to human trafficking were registered in the
country during the year 2015 as compared to
5,466 cases during the year 2014, showing an
increase of 25.8% during 2015 over 2014.
Crime Rate (Crime Rate: 0.5)
Crime rate under the crimes relating to
human trafficking increased from 0.4 in 2014 to
0.5 during the year 2015.
Incidents of human trafficking is
showing a rising trend during the period from
2011 – 2015. A total of 3,517 cases were
registered in 2011, which rose to 3,554 cases
in 2012,to 3,940 cases in 2013, to 5,466 cases
in 2014 and to 6,877 cases in 2015.
Trend Analysis
The crime head-wise details of
registered crimes during 2011 to 2015 along
with percentage variation in the year 2015 over
2014 are presented in Table-6A(A). The crime
under human trafficking during the year 2015
has increased by 95.5% over 2011.
Importation of Girls from Foreign Country
(Incidence: 6 Rate : Negligible)
A total of 6 cases of importation of girls
from foreign country were registered during
2015 compared to 13 cases in 2014 showing a
decline of 53.8% over the previous year.
These were registered in West Bengal (4
cases) and Uttarakhand (2 cases) during 2015.
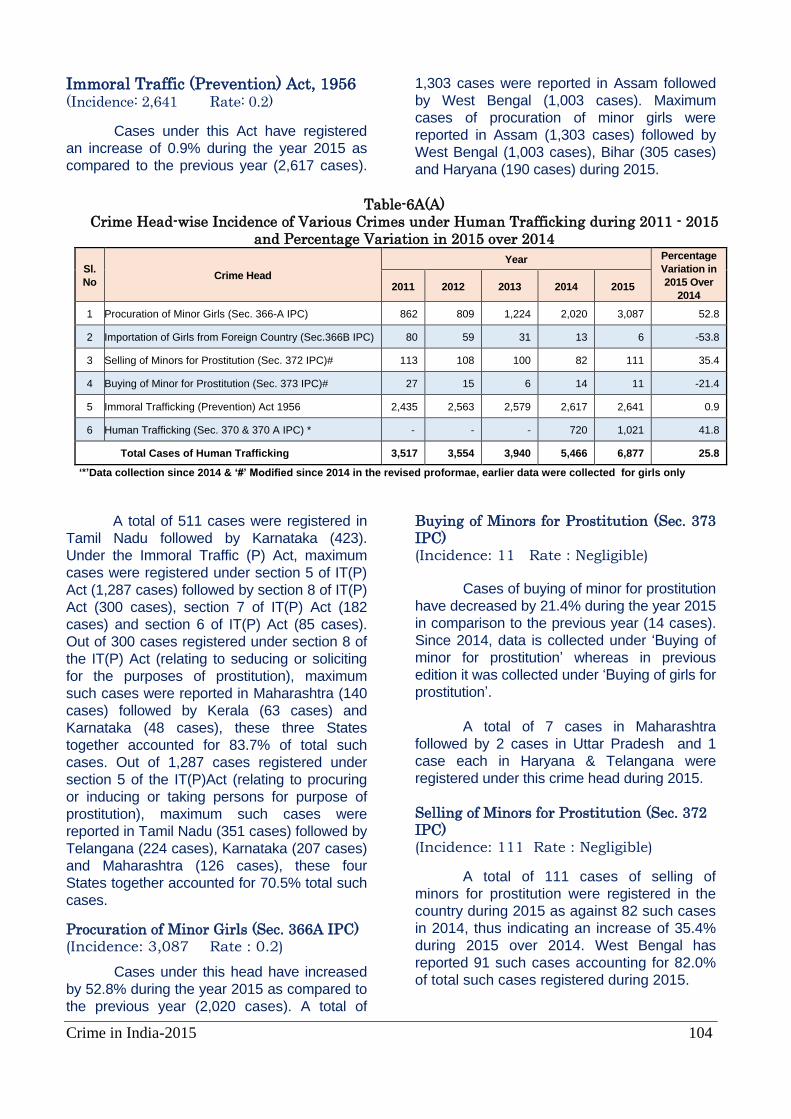
Crime in India-2015 104
Immoral Traffic (Prevention) Act, 1956
(Incidence: 2,641 Rate: 0.2)
Cases under this Act have registered
an increase of 0.9% during the year 2015 as
compared to the previous year (2,617 cases).
A total of 511 cases were registered in
Tamil Nadu followed by Karnataka (423).
Under the Immoral Traffic (P) Act, maximum
cases were registered under section 5 of IT(P)
Act (1,287 cases) followed by section 8 of IT(P)
Act (300 cases), section 7 of IT(P) Act (182
cases) and section 6 of IT(P) Act (85 cases).
Out of 300 cases registered under section 8 of
the IT(P) Act (relating to seducing or soliciting
for the purposes of prostitution), maximum
such cases were reported in Maharashtra (140
cases) followed by Kerala (63 cases) and
Karnataka (48 cases), these three States
together accounted for 83.7% of total such
cases. Out of 1,287 cases registered under
section 5 of the IT(P)Act (relating to procuring
or inducing or taking persons for purpose of
prostitution), maximum such cases were
reported in Tamil Nadu (351 cases) followed by
Telangana (224 cases), Karnataka (207 cases)
and Maharashtra (126 cases), these four
States together accounted for 70.5% total such
cases.
Procuration of Minor Girls (Sec. 366A IPC)
(Incidence: 3,087 Rate : 0.2)
Cases under this head have increased
by 52.8% during the year 2015 as compared to
the previous year (2,020 cases). A total of
1,303 cases were reported in Assam followed
by West Bengal (1,003 cases). Maximum
cases of procuration of minor girls were
reported in Assam (1,303 cases) followed by
West Bengal (1,003 cases), Bihar (305 cases)
and Haryana (190 cases) during 2015.
Buying of Minors for Prostitution (Sec. 373
IPC)
(Incidence: 11 Rate : Negligible)
Cases of buying of minor for prostitution
have decreased by 21.4% during the year 2015
in comparison to the previous year (14 cases).
Since 2014, data is collected under ‘Buying of
minor for prostitution’ whereas in previous
edition it was collected under ‘Buying of girls for
prostitution’.
A total of 7 cases in Maharashtra
followed by 2 cases in Uttar Pradesh and 1
case each in Haryana & Telangana were
registered under this crime head during 2015.
Selling of Minors for Prostitution (Sec. 372
IPC)
(Incidence: 111 Rate : Negligible)
A total of 111 cases of selling of
minors for prostitution were registered in the
country during 2015 as against 82 such cases
in 2014, thus indicating an increase of 35.4%
during 2015 over 2014. West Bengal has
reported 91 such cases accounting for 82.0%
of total such cases registered during 2015.
Table-6A(A)
Crime Head-wise Incidence of Various Crimes under Human Trafficking during 2011 - 2015
and Percentage Variation in 2015 over 2014
Sl.
No Crime Head
Year Percentage
Variation in
2015 Over
2014 2011 2012 2013 2014 2015
1 Procuration of Minor Girls (Sec. 366-A IPC) 862 809 1,224 2,020 3,087 52.8
2 Importation of Girls from Foreign Country (Sec.366B IPC) 80 59 31 13 6 -53.8
3 Selling of Minors for Prostitution (Sec. 372 IPC)# 113 108 100 82 111 35.4
4 Buying of Minor for Prostitution (Sec. 373 IPC)# 27 15 6 14 11 -21.4
5 Immoral Trafficking (Prevention) Act 1956 2,435 2,563 2,579 2,617 2,641 0.9
6 Human Trafficking (Sec. 370 & 370 A IPC) * - - - 720 1,021 41.8
Total Cases of Human Trafficking 3,517 3,554 3,940 5,466 6,877 25.8
‘*’Data collection since 2014 & ‘#’ Modified since 2014 in the revised proformae, earlier data were collected for girls only
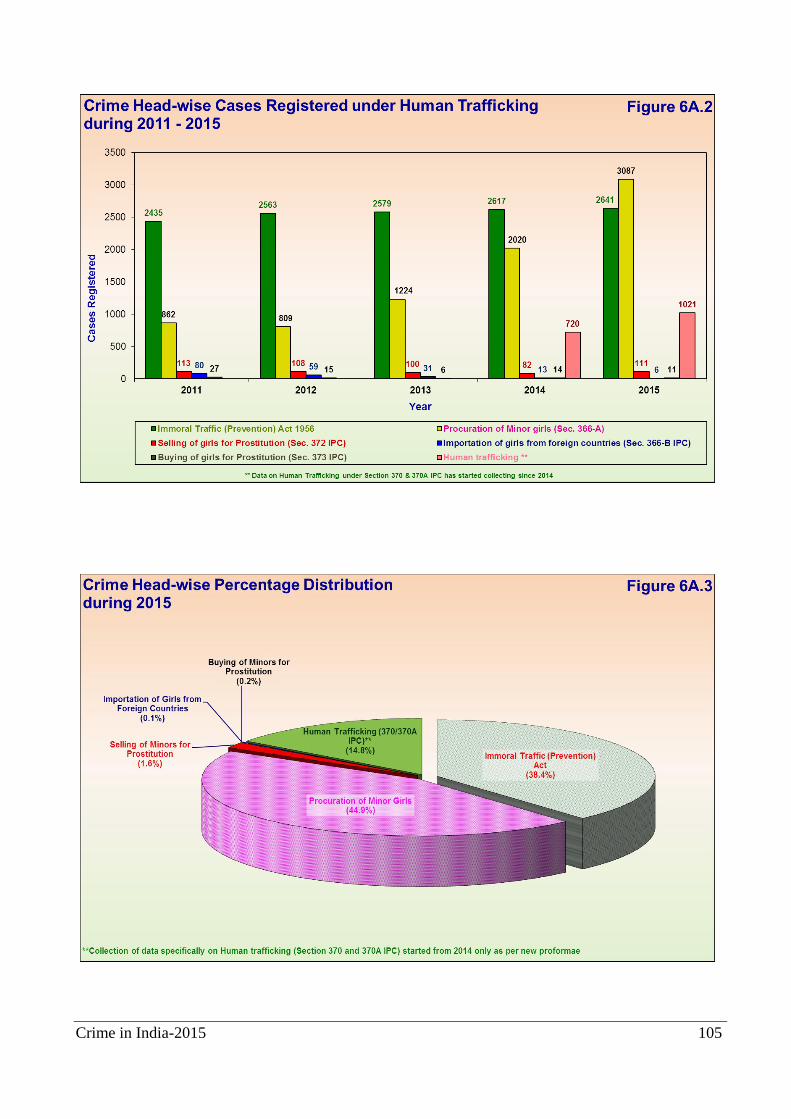
Crime in India-2015 105
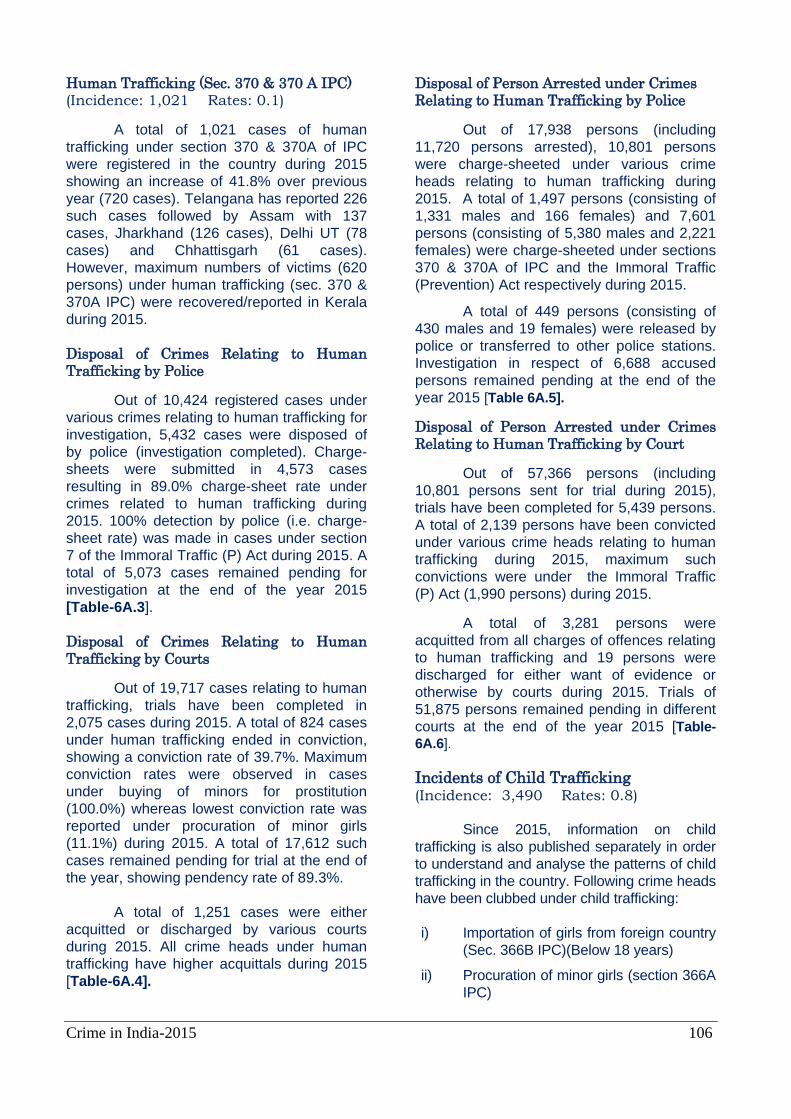
Crime in India-2015 106
Human Trafficking (Sec. 370 & 370 A IPC)
(Incidence: 1,021 Rates: 0.1)
A total of 1,021 cases of human
trafficking under section 370 & 370A of IPC
were registered in the country during 2015
showing an increase of 41.8% over previous
year (720 cases). Telangana has reported 226
such cases followed by Assam with 137
cases, Jharkhand (126 cases), Delhi UT (78
cases) and Chhattisgarh (61 cases).
However, maximum numbers of victims (620
persons) under human trafficking (sec. 370 &
370A IPC) were recovered/reported in Kerala
during 2015.
Disposal of Crimes Relating to Human
Trafficking by Police
Out of 10,424 registered cases under
various crimes relating to human trafficking for
investigation, 5,432 cases were disposed of
by police (investigation completed). Charge-
sheets were submitted in 4,573 cases
resulting in 89.0% charge-sheet rate under
crimes related to human trafficking during
2015. 100% detection by police (i.e. charge-
sheet rate) was made in cases under section
7 of the Immoral Traffic (P) Act during 2015. A
total of 5,073 cases remained pending for
investigation at the end of the year 2015
[Table-6A.3].
Disposal of Crimes Relating to Human
Trafficking by Courts
Out of 19,717 cases relating to human
trafficking, trials have been completed in
2,075 cases during 2015. A total of 824 cases
under human trafficking ended in conviction,
showing a conviction rate of 39.7%. Maximum
conviction rates were observed in cases
under buying of minors for prostitution
(100.0%) whereas lowest conviction rate was
reported under procuration of minor girls
(11.1%) during 2015. A total of 17,612 such
cases remained pending for trial at the end of
the year, showing pendency rate of 89.3%.
A total of 1,251 cases were either
acquitted or discharged by various courts
during 2015. All crime heads under human
trafficking have higher acquittals during 2015
[Table-6A.4].
Disposal of Person Arrested under Crimes
Relating to Human Trafficking by Police
Out of 17,938 persons (including
11,720 persons arrested), 10,801 persons
were charge-sheeted under various crime
heads relating to human trafficking during
2015. A total of 1,497 persons (consisting of
1,331 males and 166 females) and 7,601
persons (consisting of 5,380 males and 2,221
females) were charge-sheeted under sections
370 & 370A of IPC and the Immoral Traffic
(Prevention) Act respectively during 2015.
A total of 449 persons (consisting of
430 males and 19 females) were released by
police or transferred to other police stations.
Investigation in respect of 6,688 accused
persons remained pending at the end of the
year 2015 [Table 6A.5].
Disposal of Person Arrested under Crimes
Relating to Human Trafficking by Court
Out of 57,366 persons (including
10,801 persons sent for trial during 2015),
trials have been completed for 5,439 persons.
A total of 2,139 persons have been convicted
under various crime heads relating to human
trafficking during 2015, maximum such
convictions were under the Immoral Traffic
(P) Act (1,990 persons) during 2015.
A total of 3,281 persons were
acquitted from all charges of offences relating
to human trafficking and 19 persons were
discharged for either want of evidence or
otherwise by courts during 2015. Trials of
51,875 persons remained pending in different
courts at the end of the year 2015 [Table-
6A.6].
Incidents of Child Trafficking
(Incidence: 3,490 Rates: 0.8)
Since 2015, information on child
trafficking is also published separately in order
to understand and analyse the patterns of child
trafficking in the country. Following crime heads
have been clubbed under child trafficking:
i) Importation of girls from foreign country
(Sec. 366B IPC)(Below 18 years)
ii) Procuration of minor girls (section 366A
IPC)
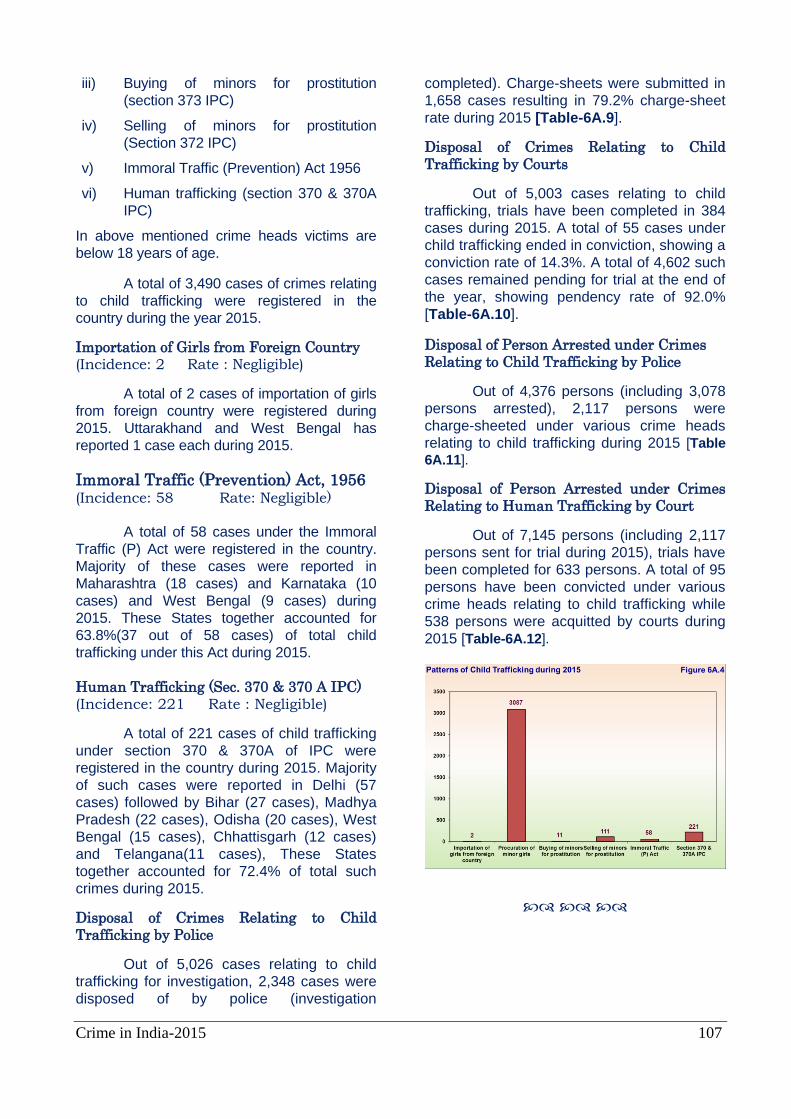
Crime in India-2015 107
iii) Buying of minors for prostitution
(section 373 IPC)
iv) Selling of minors for prostitution
(Section 372 IPC)
v) Immoral Traffic (Prevention) Act 1956
vi) Human trafficking (section 370 & 370A
IPC)
In above mentioned crime heads victims are
below 18 years of age.
A total of 3,490 cases of crimes relating
to child trafficking were registered in the
country during the year 2015.
Importation of Girls from Foreign Country
(Incidence: 2 Rate : Negligible)
A total of 2 cases of importation of girls
from foreign country were registered during
2015. Uttarakhand and West Bengal has
reported 1 case each during 2015.
Immoral Traffic (Prevention) Act, 1956
(Incidence: 58 Rate: Negligible)
A total of 58 cases under the Immoral
Traffic (P) Act were registered in the country.
Majority of these cases were reported in
Maharashtra (18 cases) and Karnataka (10
cases) and West Bengal (9 cases) during
2015. These States together accounted for
63.8%(37 out of 58 cases) of total child
trafficking under this Act during 2015.
Human Trafficking (Sec. 370 & 370 A IPC)
(Incidence: 221 Rate : Negligible)
A total of 221 cases of child trafficking
under section 370 & 370A of IPC were
registered in the country during 2015. Majority
of such cases were reported in Delhi (57
cases) followed by Bihar (27 cases), Madhya
Pradesh (22 cases), Odisha (20 cases), West
Bengal (15 cases), Chhattisgarh (12 cases)
and Telangana(11 cases), These States
together accounted for 72.4% of total such
crimes during 2015.
Disposal of Crimes Relating to Child
Trafficking by Police
Out of 5,026 cases relating to child
trafficking for investigation, 2,348 cases were
disposed of by police (investigation
completed). Charge-sheets were submitted in
1,658 cases resulting in 79.2% charge-sheet
rate during 2015 [Table-6A.9].
Disposal of Crimes Relating to Child
Trafficking by Courts
Out of 5,003 cases relating to child
trafficking, trials have been completed in 384
cases during 2015. A total of 55 cases under
child trafficking ended in conviction, showing a
conviction rate of 14.3%. A total of 4,602 such
cases remained pending for trial at the end of
the year, showing pendency rate of 92.0%
[Table-6A.10].
Disposal of Person Arrested under Crimes
Relating to Child Trafficking by Police
Out of 4,376 persons (including 3,078
persons arrested), 2,117 persons were
charge-sheeted under various crime heads
relating to child trafficking during 2015 [Table
6A.11].
Disposal of Person Arrested under Crimes
Relating to Human Trafficking by Court
Out of 7,145 persons (including 2,117
persons sent for trial during 2015), trials have
been completed for 633 persons. A total of 95
persons have been convicted under various
crime heads relating to child trafficking while
538 persons were acquitted by courts during
2015 [Table-6A.12].
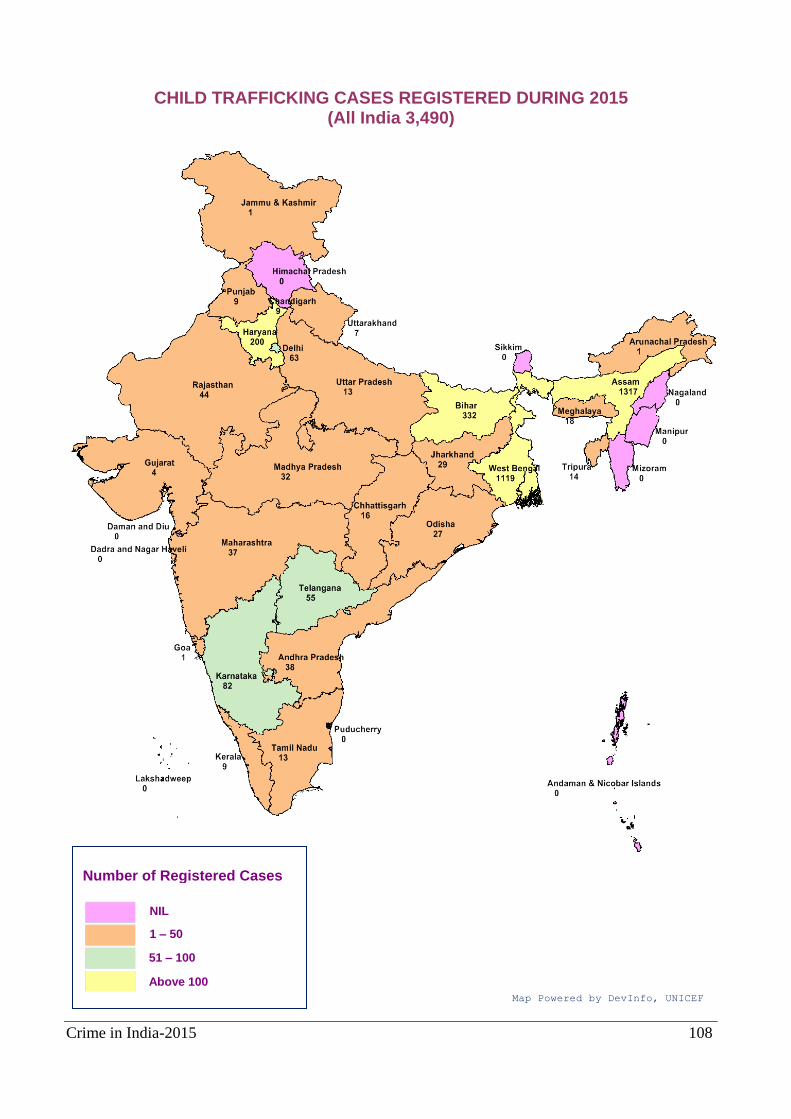
Crime in India-2015 108
CHILD TRAFFICKING CASES REGISTERED DURING 2015 (All India 3,490)
Number of Registered Cases
NIL
51 – 100
Map Powered by DevInfo, UNICEF
1 – 50
Above 100
Crime in India-2015 109
Chapter - 7
Crime against Scheduled Castes & Scheduled Tribes
India is committed to the welfare and
development of its people in general and of
vulnerable sections of society in particular.
Equality of status and opportunity to all citizens
of the country is guaranteed by the Constitution
of India, which also provides that no individual
shall be discriminated against on the grounds of
religion, caste or sex, etc. Fundamental rights
and other specific provisions, namely, Articles
38, 39 and 46 in the Constitution of India stand
testimony to the commitment of the State
towards its people. The strategy of the State is
to secure distributive justice and allocation of
resources to support programmes for social,
economic and educational advancement of the
weaker sections in general and persons
belonging to Scheduled Castes and Scheduled
Tribes in particular.
Constitutional Rights
The Indian Constitution vide Article 15
lays down that no citizen shall be subjected to
any disability or restriction on the grounds of
religion, race, caste, sex or place of birth. It
also guarantees that every citizen shall have
equality of status and opportunity.
The problems of social inequality and
class divide in a country like India with
heterogeneous groups and sub-groups needs
to be recognised and resolved by all available
democratic measures including special
legislations to deal with particular acts
constituting offences against such weaker
sections of the society. `Scheduled Castes' and
`Scheduled Tribes' are two such identified
social groups. Article 46 of the constitution of
India expressly provides that the State shall
promote the educational and economic
upliftment of the weaker sections of the society,
in particular of SCs & STs with special care and
shall protect them from injustice and all forms of
exploitation.
Legal Rights
Special social enactments have come
into force from time to time for SCs and STs in
order to uphold the constitutional mandate and
safeguard the interests of these sections of the
society.
The major legal enactments at the
national level are:
(i) The Protection of Civil Rights Act, 1955
(ii) The Scheduled Caste/Scheduled Tribe
(Prevention of Atrocities) Act, 1989
The Protection of Civil Rights Act, 1955
was enacted in furtherance of Article 17 of the
Constitution to abolish untouchability and its
practice in any form.
The Scheduled Castes/ Scheduled
Tribes (Prevention of Atrocities) Act, 1989 was
brought into force from 30th January 1990 in
order to check and deter crimes against
persons belonging to SCs/STs by persons
belonging to other communities. These
enactments have extended the positive
discrimination in favour of SCs and STs to the
field of criminal law in as much as they
prescribe penalties that are more stringent than
the corresponding offences under Indian Penal
Code (IPC) and other laws. Special Courts have
been established in major states for speedy trial
of cases registered exclusively under these
Acts.
Classification of Crimes
Considering the data requirements of
various stakeholders, the classifications of
crimes have been revised recently for collection
of comprehensive data on crime committed
against SCs and STs.
The new classification of crimes against
persons belonging to SCs & STs broadly
categorized under three major crime heads,
namely:-
(i) the Protection of Civil Rights Act, 1955
for measuring incidents of
discriminations against persons
belonging to SCs & STs by Non-
SCs/STs.
Crime in India-2015 110
(ii) Atrocities committed against persons
belonging to SCs and STs by Non-SCs
and STs i.e. where SC/ST (Prevention
of Atrocities) Act has been applied along
with various sections of IPC. Incidents of
various sections of IPC viz. murder,
grievous hurt, rape etc. along with the
SC/ST (PoA) Act.
(iii) Crime committed against SCs and STs
where SC/ST (PoA) Act has not been
applied and only IPC sections have
been involved.
Besides these three major heads, data on
following crime heads have also been
collected:-
(iv) The Employment of Manual Scavengers
and Construction of Dry Latrines
(Prohibition) Act, 1923
(v) Other SLL crimes
In the revised proformae of Crime in
India, comprehensive information on crimes
committed against SC/ST women under various
crime heads namely assault on SC/ST women
with intent to outrage her modesty (section 354
IPC) along with further breakup of sub-section
354A IPC (sexual harassment), section 354B
IPC (assault or use of criminal force to women
with intent to disrobe), section 354C IPC
(voyeurism) & section 354D IPC (stalking);
insult to modesty of SC/ST women (under
section 509IPC) took place in office premises or
at public transport or other places related to
works; etc. have been collected.
The ‘Crime Rate’ for crimes committed
against SCs and STs has been calculated using
the population of SC and ST respectively only,
based on The Population Census 2011. Since
mid-year projection in respect of SCs & STs
population is not available.
Crime against Persons belonging to Scheduled Caste
Incidence of Crime – National (Incidence: 45,003 Rate: 22.3)
A total of 45,003 cases of total crimes
committed against SCs(which include atrocities
as well as non-atrocities cases) were registered
in the country as compared to 47,064 cases
registered in 2014, showing a decrease of 4.4%
in 2015 over 2014. It may be mentioned that
during 2015, out of 45,003 cases of crime
against SCs 38,564 cases under various
section of IPC along with the SC/ST(POA) Act
(atrocities cases i.e. where SC/ST(POA) Act
applied), 6,009 cases under various section of
IPC wherein the SC/ST (POA) Act was not
applied, 324 cases under other SLL crimes.
The highest incidents of crime against SCs
were reported from Uttar Pradesh (8,358 cases)
followed by Rajasthan (6,998 cases), Bihar
(6,438 cases) and Andhra Pradesh (4,415
cases), they accounted for 18.6%, 15.5%,
14.3% and 9.8% of total such crimes registered
during 2015 respectively. During 2015, crimes
rate of 22.3 was reported under crimes
committed on persons belonging to SCs.
Protection of Civil Rights Act
(Incidence: 106 Rate: 0.1)
A total of 106 cases under this Act were
registered during 2015. Maximum cases under
this Act were reported in Bihar (74 cases)
followed by Karnataka (11 cases), Maharashtra
(9 cases), Himachal Pradesh (3 cases) and
Odisha & Delhi UT (2 cases each) during 2015.
Incidence of Atrocities against SCs (Incidence: 38,564 Rate: 19.2)
A total of 38,564 cases of atrocities
against SCs (in which SC/ST(POA) Act applied)
were registered in the country during 2015. The
highest incidents of atrocities against SCs were
reported from Uttar Pradesh (8,357 cases)
followed by Bihar (6,293 cases), Rajasthan
(5,911 cases) and Madhya Pradesh (3,546
cases). Majority of victims under atrocities
against SCs were also reported from Uttar
Pradesh (8,459 persons) followed by Bihar
(6,552 persons), Rajasthan (5,979 persons) and
Madhya Pradesh (3,693 persons).
The highest rate of atrocities against
SCs was reported from Goa (51.1) followed by
Rajasthan (48.4), Bihar (38.0) and Daman &
Diu (32.7) compared to 19.2 at all India level
during 2015.
Crime in India-2015 111
Incidence of IPC Crimes against SCs(in
which the SC/ST(PoA) Act not applied i.e.
Non-atrocities Cases) (Incidence: 6,009 Rate: 3.0)
A total of 6,009 cases of IPC without the
SC/ST(POA) Act (in which SC/ST(POA) Act not
applied i.e. non-atrocities) were also registered
in the country during 2015. The highest number
of such cases were reported from Andhra
Pradesh (2,050 cases) followed by Rajasthan
(1,040 cases), Chhattisgarh (790 cases),
Madhya Pradesh (638 cases) and Odisha (482
cases). The highest number of victims in such
cases were also reported from Andhra Pradesh
(2,062 persons) followed by Rajasthan (1,048
persons), Chhattisgarh (790 persons), Madhya
Pradesh (671 persons) and Odisha (530
persons). Among the above States, the highest
rate of crime was reported from Andhra
Pradesh (24.3) followed by Chhattisgarh (24.1),
Rajasthan (8.5), Odisha (6.7) and Madhya
Pradesh (5.6). Table 7.2 contains State/UT-
wise details on IPC cases where the SC/ST
(POA) Act has been applied, as well as cases
where this Act was not applied & number of
victims in above two categories of cases and
crime rate during 2015.
Disposal of Crimes Committed against SCs
by Police
Out of 59,834 cases of crime against
SCs for investigation (including 45,003 cases
registered during 2015), 42,459 cases were
disposed of by police during 2015. Of these
cases, the charge-sheets were submitted in
31,852 cases and in 2,028 cases charge-sheets
were not laid but final reports were submitted as
true, thus showing charge-sheet rate of 94.0%.
A charge-sheet rate of 97.5% and 93.5% were
reported under the Protection Civil Rights Act
and atrocities against SCs respectively. A total
of 17,375 cases were remained pending for
investigation at the end of 2015. The details
may be seen in Table 7.3.
Disposal of Crimes Committed against
Scheduled Castes by Courts
A total of 1,40,340 cases of crimes
committed against persons belonging to
Scheduled Castes were for trial in the country
during 2015. Trials were completed in 17,012
during 2015 out of which 4,702 cases ended in
conviction and in 12,310 cases accused
persons were acquitted or discharged. At the
end of 2015, a total of 1,22,083 cases remained
pending for trial. The conviction rate of 27.6%
and pendency rate of 86.9% under crime
against SCs were reported during 2015. The
details may be seen in Table 7.4.
Disposal of Persons Arrested for
Committing Crime against Scheduled
Castes by Police
Out of 97,786 persons (consisting of
21,932 persons either in the custody or on bail
at the beginning of the year and 75,854 persons
arrested during 2015), charge-sheets were
submitted against 66,880 persons (consisting of
65,244 males and 1,636 females) during the
year 2015. Investigation by police was pending
in respect of 24,280 persons at the end of 2015.
The details may be seen in Table 7.5.
Disposal of Persons Arrested for
Committing Crime against Scheduled
Castes by Courts.
A total of 3,03,605 persons were under
trial for committing crimes against SCs in the
country during 2015.
A total of 9,656 persons (consisting of
9,557 males and 99 females) were convicted
and 25,385 persons (consisting of 24,716 males
and 669 females) were acquitted. 500 persons
were also discharged by courts for want of
evidence or otherwise during 2015. The trials in
respect of 2,65,905 persons were remained
pending at the end of 2015. The details may be
seen in Table 7.6.
District-wise Incidents of Total Crimes
against SCs
A total of 16 districts have registered
more than 300 cases of crimes against SCs
during 2015, while 34 districts have reported
IPC crimes between 200 and 300 and a bulk of
them i.e. 765 of these districts have reported
less than 200 such cases (including nil case)
during 2015.
The police districts which have
registered more than 300 cases of crimes
against SCs during 2015 are:
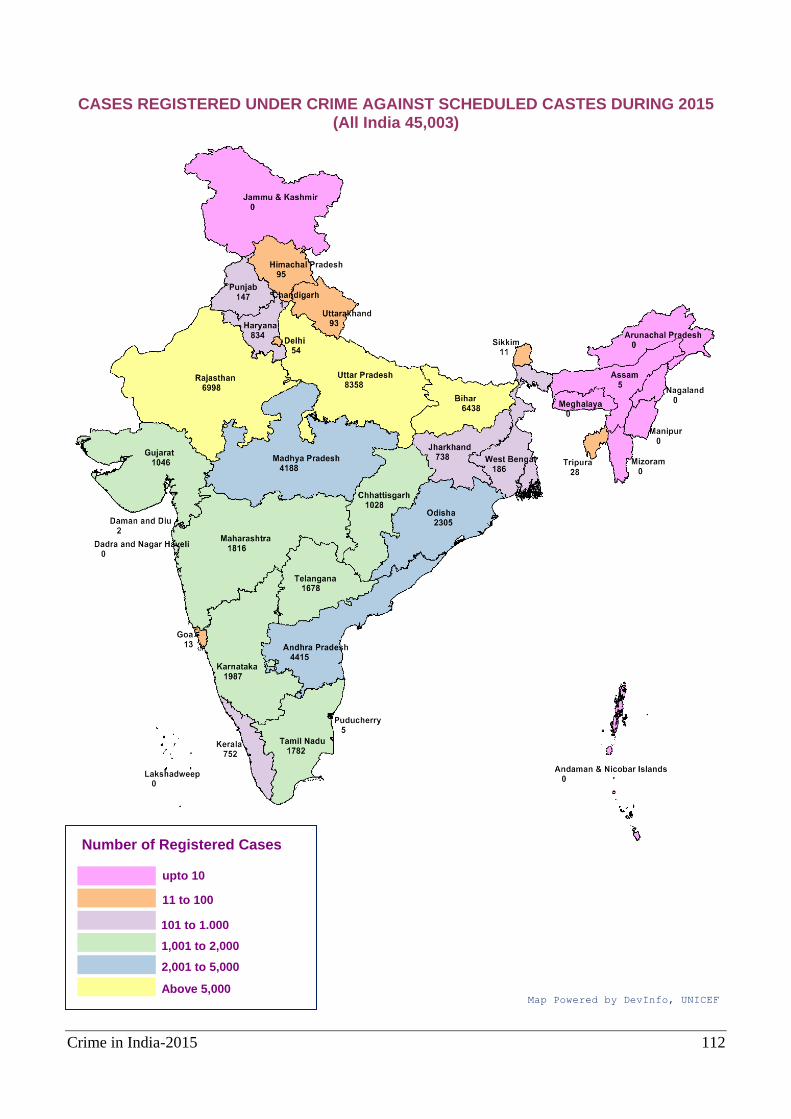
Crime in India-2015 112
CASES REGISTERED UNDER CRIME AGAINST SCHEDULED CASTES DURING 2015 (All India 45,003)
Number of Registered Cases
upto 10
101 to 1,000
Above 5,000 Map Powered by DevInfo, UNICEF
11 to 100
1,001 to 2,000
2,001 to 5,000
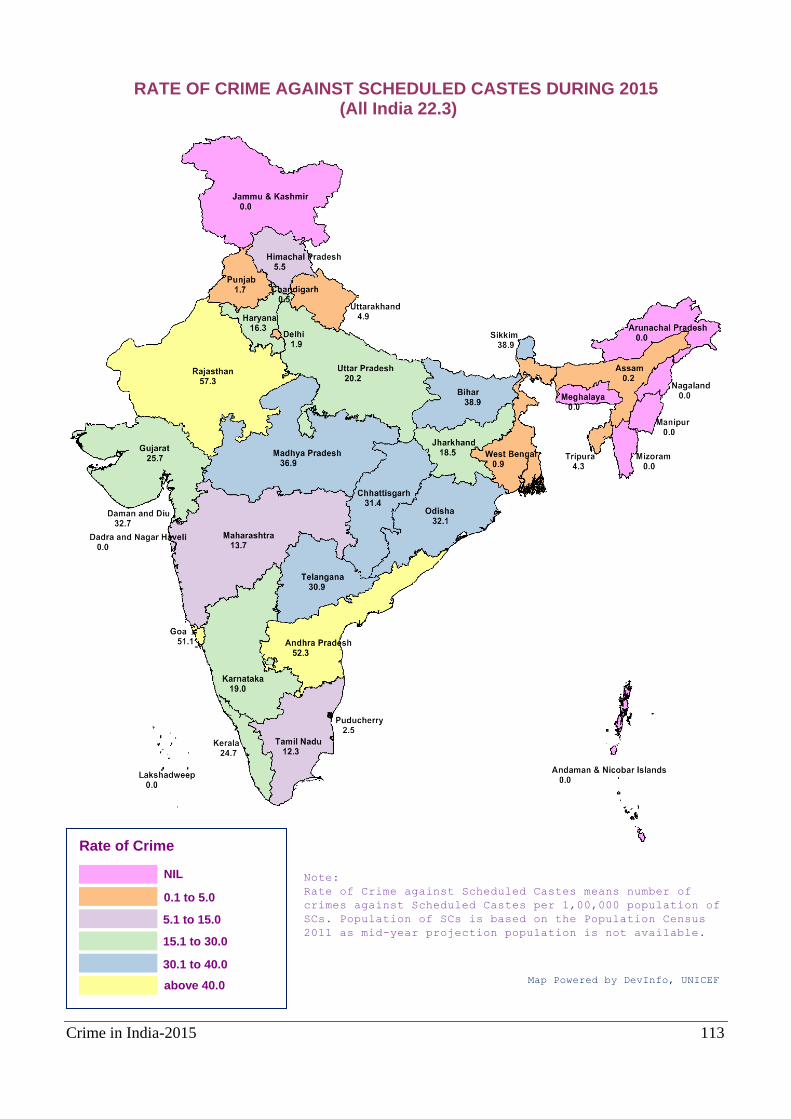
Crime in India-2015 113
RATE OF CRIME AGAINST SCHEDULED CASTES DURING 2015 (All India 22.3)
Rate of Crime
NIL
5.1 to 15.0
above 40.0 Map Powered by DevInfo, UNICEF
0.1 to 5.0
15.1 to 30.0
30.1 to 40.0
Note:
Rate of Crime against Scheduled Castes means number of
crimes against Scheduled Castes per 1,00,000 population of
SCs. Population of SCs is based on the Population Census
2011 as mid-year projection population is not available.
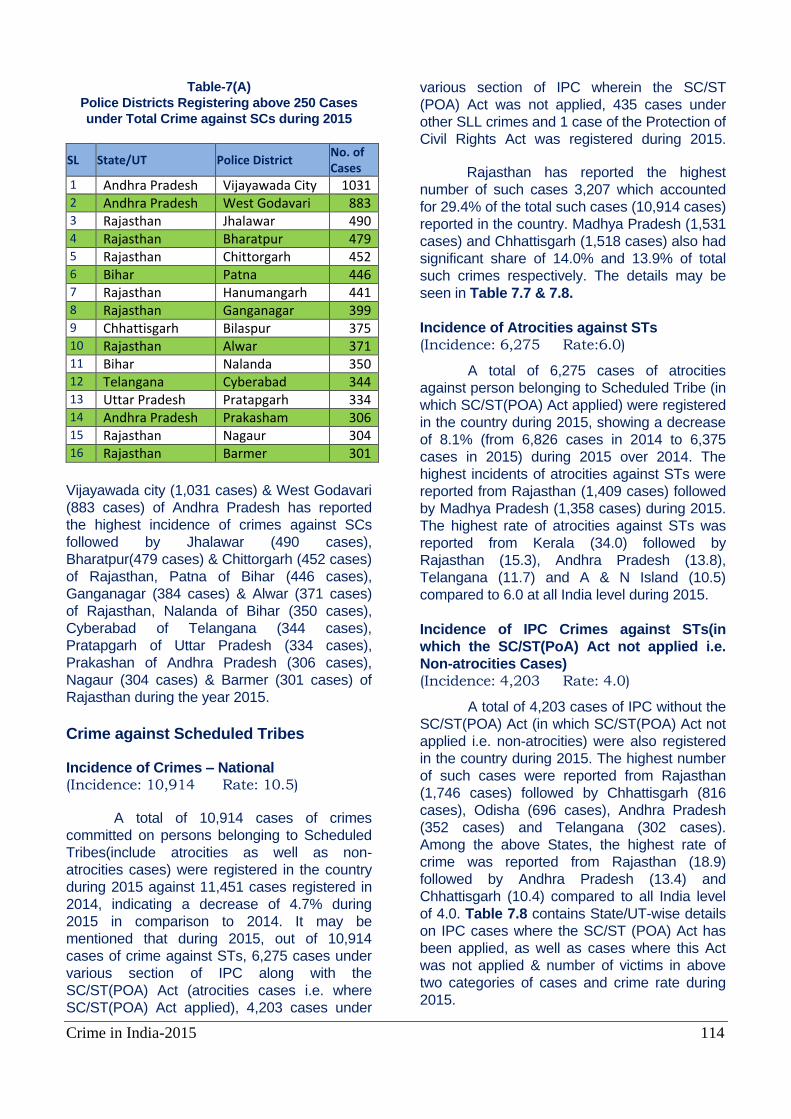
Crime in India-2015 114
Table-7(A)
Police Districts Registering above 250 Cases
under Total Crime against SCs during 2015
SL State/UT Police District No. of Cases
1 Andhra Pradesh Vijayawada City 1031 2 Andhra Pradesh West Godavari 883 3 Rajasthan Jhalawar 490 4 Rajasthan Bharatpur 479 5 Rajasthan Chittorgarh 452 6 Bihar Patna 446 7 Rajasthan Hanumangarh 441 8 Rajasthan Ganganagar 399 9 Chhattisgarh Bilaspur 375 10 Rajasthan Alwar 371 11 Bihar Nalanda 350 12 Telangana Cyberabad 344 13 Uttar Pradesh Pratapgarh 334 14 Andhra Pradesh Prakasham 306 15 Rajasthan Nagaur 304 16 Rajasthan Barmer 301
Vijayawada city (1,031 cases) & West Godavari
(883 cases) of Andhra Pradesh has reported
the highest incidence of crimes against SCs
followed by Jhalawar (490 cases),
Bharatpur(479 cases) & Chittorgarh (452 cases)
of Rajasthan, Patna of Bihar (446 cases),
Ganganagar (384 cases) & Alwar (371 cases)
of Rajasthan, Nalanda of Bihar (350 cases),
Cyberabad of Telangana (344 cases),
Pratapgarh of Uttar Pradesh (334 cases),
Prakashan of Andhra Pradesh (306 cases),
Nagaur (304 cases) & Barmer (301 cases) of
Rajasthan during the year 2015. Crime against Scheduled Tribes
Incidence of Crimes – National (Incidence: 10,914 Rate: 10.5)
A total of 10,914 cases of crimes
committed on persons belonging to Scheduled
Tribes(include atrocities as well as non-
atrocities cases) were registered in the country
during 2015 against 11,451 cases registered in
2014, indicating a decrease of 4.7% during
2015 in comparison to 2014. It may be
mentioned that during 2015, out of 10,914
cases of crime against STs, 6,275 cases under
various section of IPC along with the
SC/ST(POA) Act (atrocities cases i.e. where
SC/ST(POA) Act applied), 4,203 cases under
various section of IPC wherein the SC/ST
(POA) Act was not applied, 435 cases under
other SLL crimes and 1 case of the Protection of
Civil Rights Act was registered during 2015.
Rajasthan has reported the highest
number of such cases 3,207 which accounted
for 29.4% of the total such cases (10,914 cases)
reported in the country. Madhya Pradesh (1,531
cases) and Chhattisgarh (1,518 cases) also had
significant share of 14.0% and 13.9% of total
such crimes respectively. The details may be
seen in Table 7.7 & 7.8.
Incidence of Atrocities against STs (Incidence: 6,275 Rate:6.0)
A total of 6,275 cases of atrocities
against person belonging to Scheduled Tribe (in
which SC/ST(POA) Act applied) were registered
in the country during 2015, showing a decrease
of 8.1% (from 6,826 cases in 2014 to 6,375
cases in 2015) during 2015 over 2014. The
highest incidents of atrocities against STs were
reported from Rajasthan (1,409 cases) followed
by Madhya Pradesh (1,358 cases) during 2015.
The highest rate of atrocities against STs was
reported from Kerala (34.0) followed by
Rajasthan (15.3), Andhra Pradesh (13.8),
Telangana (11.7) and A & N Island (10.5)
compared to 6.0 at all India level during 2015.
Incidence of IPC Crimes against STs(in
which the SC/ST(PoA) Act not applied i.e.
Non-atrocities Cases) (Incidence: 4,203 Rate: 4.0)
A total of 4,203 cases of IPC without the
SC/ST(POA) Act (in which SC/ST(POA) Act not
applied i.e. non-atrocities) were also registered
in the country during 2015. The highest number
of such cases were reported from Rajasthan
(1,746 cases) followed by Chhattisgarh (816
cases), Odisha (696 cases), Andhra Pradesh
(352 cases) and Telangana (302 cases).
Among the above States, the highest rate of
crime was reported from Rajasthan (18.9)
followed by Andhra Pradesh (13.4) and
Chhattisgarh (10.4) compared to all India level
of 4.0. Table 7.8 contains State/UT-wise details
on IPC cases where the SC/ST (POA) Act has
been applied, as well as cases where this Act
was not applied & number of victims in above
two categories of cases and crime rate during
2015.
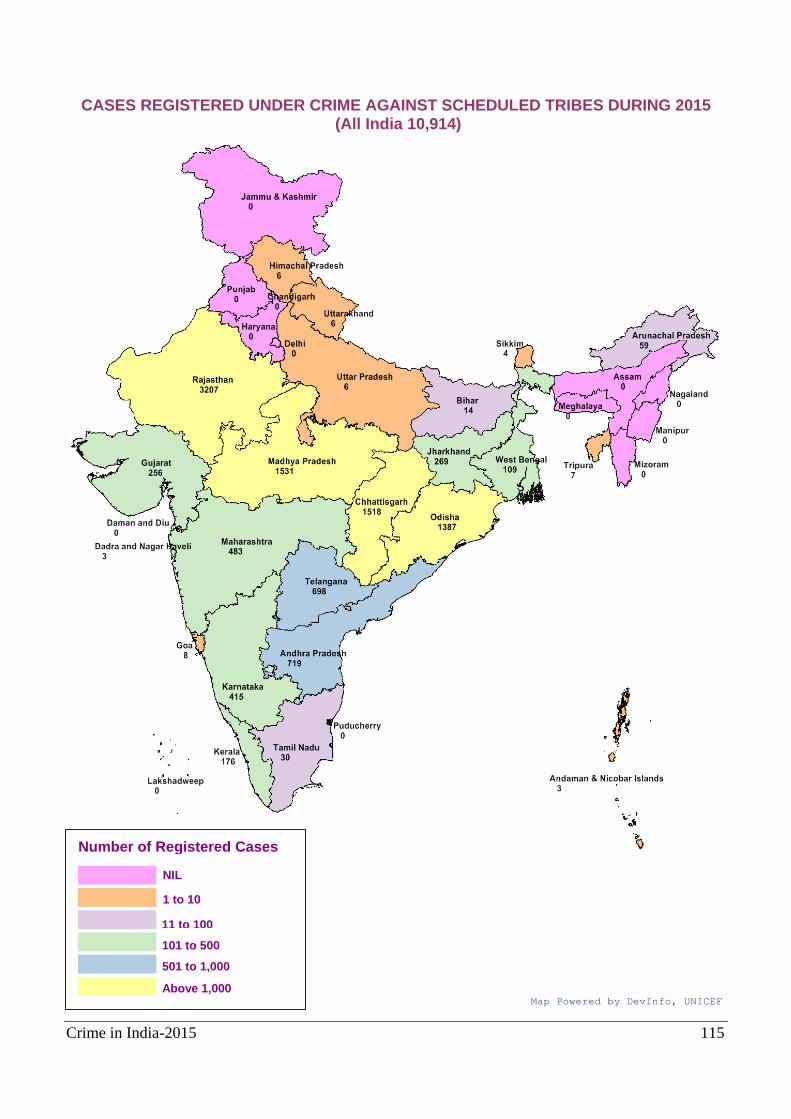
Crime in India-2015 115
CASES REGISTERED UNDER CRIME AGAINST SCHEDULED TRIBES DURING 2015 (All India 10,914)
Number of Registered Cases
NIL
11 to 100
Above 1,000 Map Powered by DevInfo, UNICEF
1 to 10
101 to 500
501 to 1,000
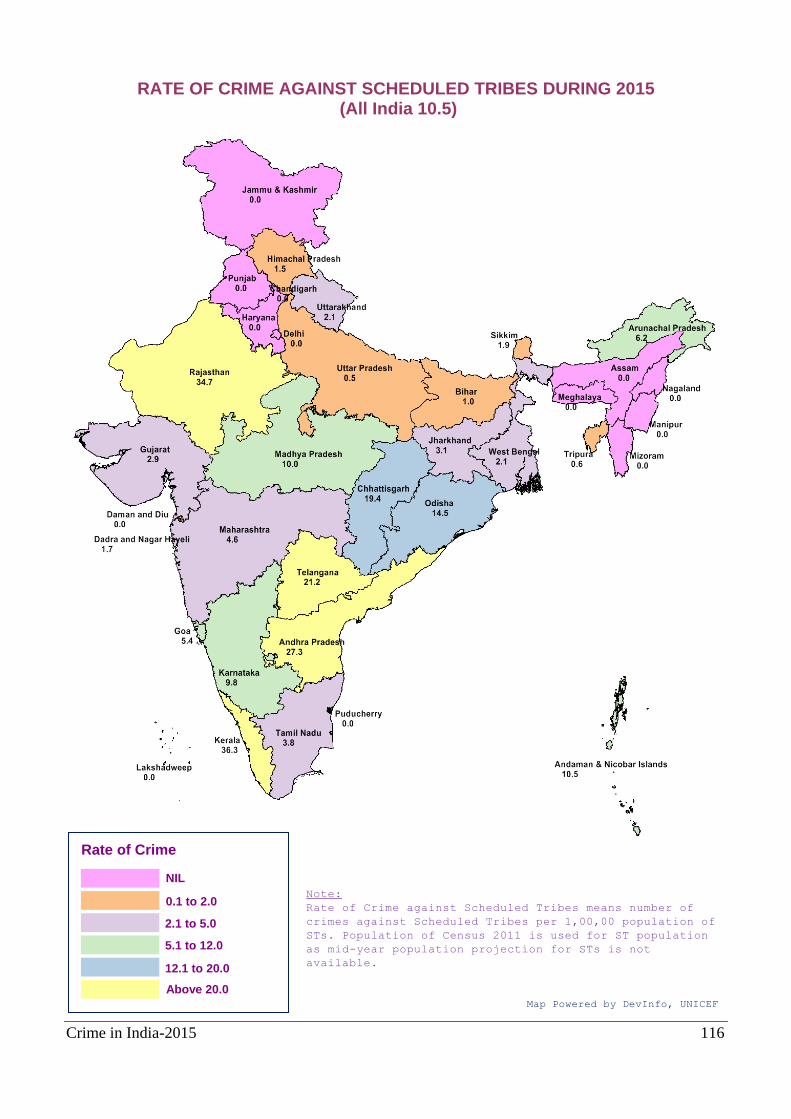
Crime in India-2015 116
RATE OF CRIME AGAINST SCHEDULED TRIBES DURING 2015 (All India 10.5)
Rate of Crime
NIL
2.1 to 5.0
Above 20.0 Map Powered by DevInfo, UNICEF
0.1 to 2.0
5.1 to 12.0
12.1 to 20.0
Note:
Rate of Crime against Scheduled Tribes means number of
crimes against Scheduled Tribes per 1,00,00 population of
STs. Population of Census 2011 is used for ST population
as mid-year population projection for STs is not
available.
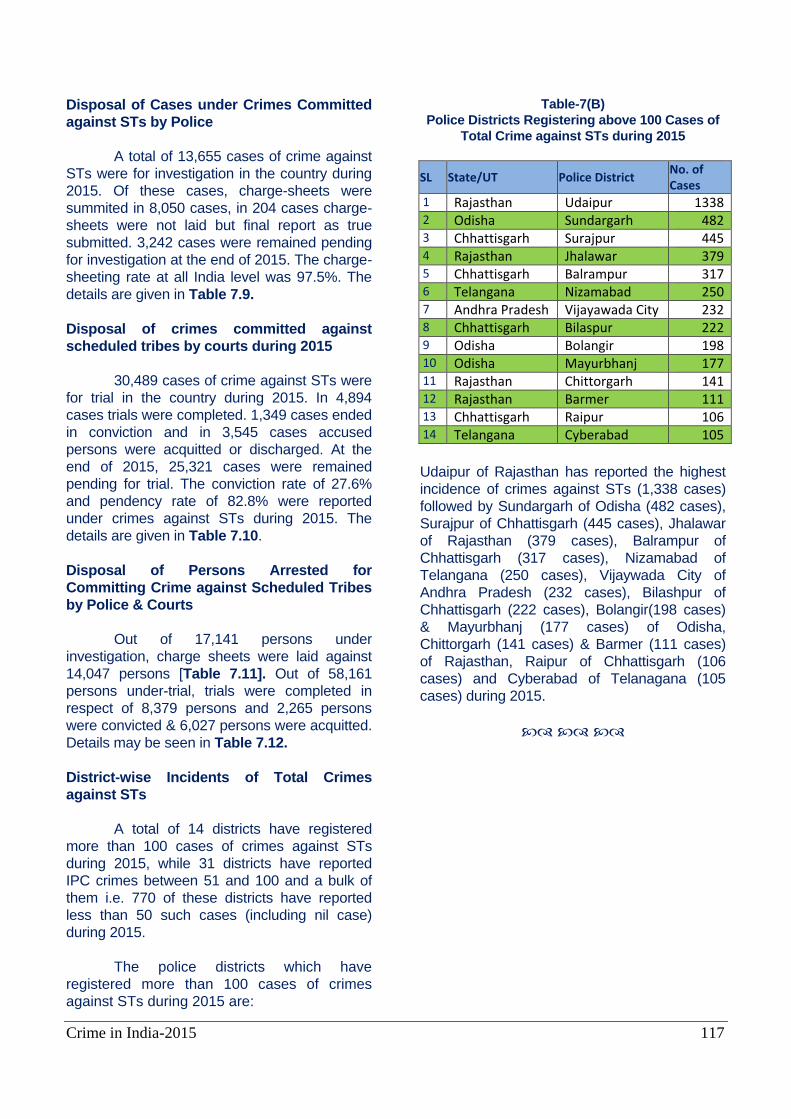
Crime in India-2015 117
Disposal of Cases under Crimes Committed
against STs by Police
A total of 13,655 cases of crime against
STs were for investigation in the country during
2015. Of these cases, charge-sheets were
summited in 8,050 cases, in 204 cases charge-
sheets were not laid but final report as true
submitted. 3,242 cases were remained pending
for investigation at the end of 2015. The charge-
sheeting rate at all India level was 97.5%. The
details are given in Table 7.9.
Disposal of crimes committed against
scheduled tribes by courts during 2015
30,489 cases of crime against STs were
for trial in the country during 2015. In 4,894
cases trials were completed. 1,349 cases ended
in conviction and in 3,545 cases accused
persons were acquitted or discharged. At the
end of 2015, 25,321 cases were remained
pending for trial. The conviction rate of 27.6%
and pendency rate of 82.8% were reported
under crimes against STs during 2015. The
details are given in Table 7.10.
Disposal of Persons Arrested for
Committing Crime against Scheduled Tribes
by Police & Courts
Out of 17,141 persons under
investigation, charge sheets were laid against
14,047 persons [Table 7.11]. Out of 58,161
persons under-trial, trials were completed in
respect of 8,379 persons and 2,265 persons
were convicted & 6,027 persons were acquitted.
Details may be seen in Table 7.12.
District-wise Incidents of Total Crimes
against STs
A total of 14 districts have registered
more than 100 cases of crimes against STs
during 2015, while 31 districts have reported
IPC crimes between 51 and 100 and a bulk of
them i.e. 770 of these districts have reported
less than 50 such cases (including nil case)
during 2015.
The police districts which have
registered more than 100 cases of crimes
against STs during 2015 are:
Table-7(B)
Police Districts Registering above 100 Cases of
Total Crime against STs during 2015
SL State/UT Police District No. of Cases
1 Rajasthan Udaipur 1338 2 Odisha Sundargarh 482 3 Chhattisgarh Surajpur 445 4 Rajasthan Jhalawar 379 5 Chhattisgarh Balrampur 317 6 Telangana Nizamabad 250 7 Andhra Pradesh Vijayawada City 232 8 Chhattisgarh Bilaspur 222 9 Odisha Bolangir 198 10 Odisha Mayurbhanj 177 11 Rajasthan Chittorgarh 141 12 Rajasthan Barmer 111 13 Chhattisgarh Raipur 106 14 Telangana Cyberabad 105
Udaipur of Rajasthan has reported the highest
incidence of crimes against STs (1,338 cases)
followed by Sundargarh of Odisha (482 cases),
Surajpur of Chhattisgarh (445 cases), Jhalawar
of Rajasthan (379 cases), Balrampur of
Chhattisgarh (317 cases), Nizamabad of
Telangana (250 cases), Vijaywada City of
Andhra Pradesh (232 cases), Bilashpur of
Chhattisgarh (222 cases), Bolangir(198 cases)
& Mayurbhanj (177 cases) of Odisha,
Chittorgarh (141 cases) & Barmer (111 cases)
of Rajasthan, Raipur of Chhattisgarh (106
cases) and Cyberabad of Telanagana (105
cases) during 2015.

Crim
e in In
dia-2
015
118
Crime in India-2015 119
Chapter - 8
Property Stolen and Recovered
Value of Property Stolen & Recovered - National level The details of property stolen and recovered, percentage of recovery (year-wise) and percentage changes over the decade (2005 - 2015) have been presented in Table-8.1. An increasing trend was observed in the value of lost properties from 2006 to 2012. It, however, decreased by 37.3% from the year 2012 (₹21,07,194 lakh) to the year 2013 (₹13,21,931 lakh), which further decreased by 43.2% in 2014 (₹7,51,482 lakh) over 2013 (₹13,21,931 lakh) and it increased by 9.2% in 2015 (₹8,21,040 lakh) over 2014 (₹7,51,482 lakh). During decadal period, an increase of 240.8% in properties loss was observed (from ₹2,40,900 lakh in 2005 to ₹8,21,040 lakh in 2015) on the other hand, during the period, percentage recovery of stolen properties has decreased by 21.9% in 2015 over 2014. Properties worth ₹8,21,040 lakh were stolen during the year 2015 and properties worth ₹1,35,019 lakh were recovered. The percentage of recovery of stolen properties during the year 2015 was 16.4% which is lower than the previous year recovery percentage (21.0%). The net value of properties lost/stolen increased by 9.3% over 2014 (from ₹7,51,482 lakh in 2014 to ₹8,21,040 lakh in 2015). The value of properties recovered has shown a decline of 14.3% (from ₹1,57,552 lakh in 2014 to ₹1,35,019 lakh in 2015) during the year 2015.
Value of Property Stolen & Recovered – States/ UTs The State & UT-wise details regarding value of properties stolen and recovered as also the percentage of recovery are presented in Table-8.2. In terms of numerical value, Maharashtra has reported the highest loss of properties at ₹4,53,389.5 lakh followed by Delhi UT (₹71,987.0 lakh) and Uttar Pradesh (₹29,637.7 lakh), these States accounted for 55.2%, 8.8% and 3.6% of total properties stolen during the year respectively. The highest
recovery of properties was reported in Maharashtra (₹23,200.8 Lakh) followed by Rajasthan (₹13,625.3 Lakh) and Delhi UT (₹12,599.8 lakh). 28 States/ UTs have reported a little less percentage recovery of stolen properties whereas 8 States/UTs reported more than the national level recovery percentage of 16.4%. Andaman & Nicobar Islands reported highest recovery of percentage (77.0%) followed by Tamil Nadu (65.4%), Telangana (57.8%), Punjab (56.2%) and Rajasthan (53.8%). Lowest recovery percentage was recorded in Lakshadweep (0.0 %).
Category of Offences - Incidence and Value The crime head-wise details on the incidence and value of properties stolen and recovered as also the percentage of recovery during 2015 have been shown in Table-8.3.
Out of five specified category of property crimes, maximum number of cases of properties loss i.e. 4,59,410 out of 6,45,015 cases were reported under thefts followed by criminal trespass /burglary (1,14,122 cases). Un-specified category ‘other kind of property crimes’ accounted for highest loss of properties worth ₹4,08,657.3 lakh, followed by theft (₹2,44,528.4 lakh) and criminal trespass / burglary (₹98,553.2 lakh). However, the highest recovery percentage 52.5% in terms of value recovered was for dacoity cases (₹11,407.8 lakh out of ₹21,743.4 lakh).
A total of 11,307 cases of chain
snatching were registered in the country out of which recoveries were made in 4,837 cases, showing 42.8% recovery of items robbed under chain snatching during 2015. In 11,307 cases of chain snatching, properties worth ₹5,787.2 lakh were robbed during 2015. However, properties worth ₹2,119.4 lakh were only recovered during 2015.
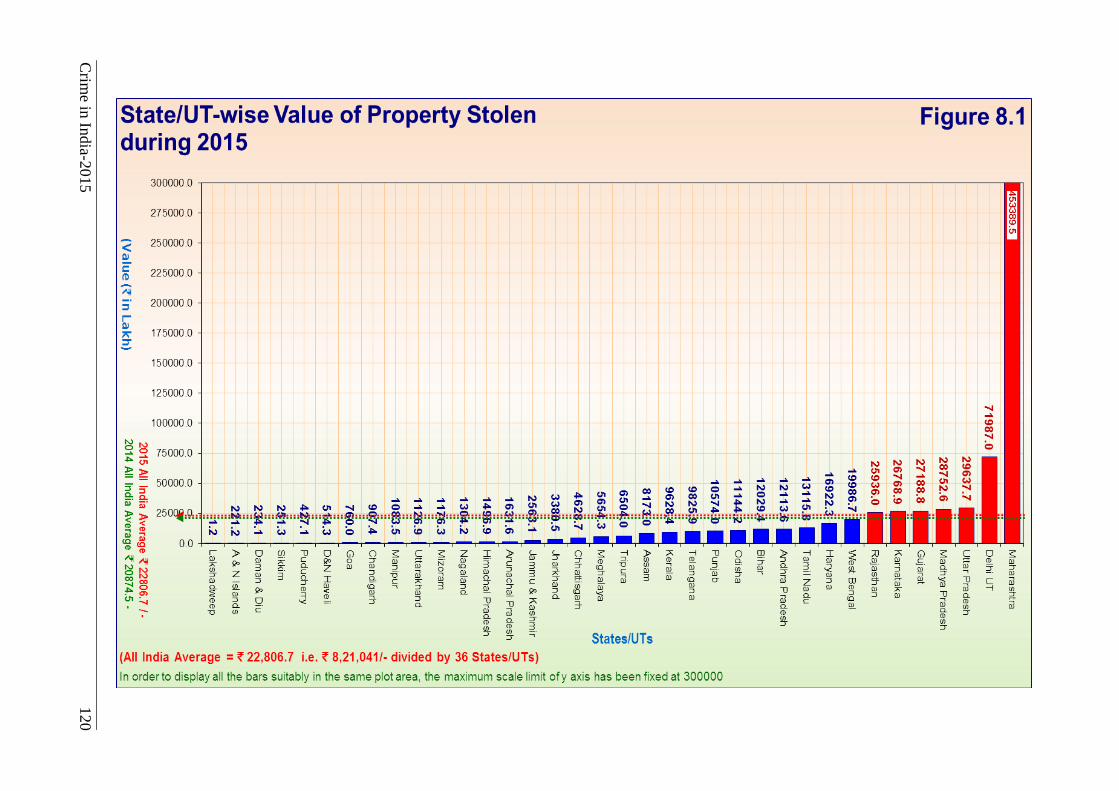
Crim
e in In
dia-2
015
120
Crime in India-2015 121
Nature of Property Stolen and Recovered - Incidence and Value The nature of property stolen and recovered has been classified into different categories viz. ‘communication and electricity wire’, ‘cattle’, ‘cycle’, ‘motor vehicles’, ‘fire arms’, ‘explosives/explosive substances’, ‘electric components’ and ‘cultural property’. Properties other than the above 8 specified categories are clubbed as ‘other kinds of properties’. The details of incidence and value of properties stolen & recovered along with percentage of recovery have been shown in Table-8.4.
The highest loss and recovery of properties worth ₹1,25,296.9 lakh and ₹37,480.4 lakh respectively was registered for motor vehicles among the specified types of properties. A total of 1,59,646 motor cycles/scooters stolen cases were reported during 2015, out of which recoveries were made in 33,666 cases showing 21.1% recoveries of motor cycles/scooters. A total of 18,415 LMV/car stolen cases were registered, out of which recoveries were made in 2,692 cases during 2015. It is worth mentioning that fire arms and explosives / explosive substances worth ₹241.1 lakh and ₹83.4 lakh respectively were stolen respectively during the year 2015. A total of 46,873 and 11,745 cases of theft of mobile phones and laptops were registered during 2015. During 2015, maximum recoveries of properties, in term of cases, were reported under cattle theft (47.0%) whereas lowest recoveries were made under motor vehicles (20.8%). The highest recovery of stolen properties, in term of value, was made under cattle theft at 46.2% of stolen properties whereas lowest recovery of explosives/explosive substances (17.3%) was reported during the year 2015.
Premises/ Place of Occurrence-wise Incidence and Value of Property Lost during the Year
The information relating to the number of cases and value of properties stolen under ‘dacoity’, ‘robbery’, ‘criminal trespassing /burglary’ and ‘theft’ at various premises or various places of occurrence of these crimes have been shown in Table-8.5. Maximum number of cases of properties stolen were registered in residential premises (2,12,438 out of 6,22,116 cases) followed by highways/road (89,102 cases) which accounted for 34.1% and 14.3% of total such cases registered in the country during 2015 respectively. However, a total of 2,22,927 cases out of 6,22,116 cases were also registered under un-specified category ‘other places of occurrence’ during 2015.
Majority of robberies (15,566 out of 36,188 cases) took place on highways/road. Maximum cases of ‘Criminal trespassing /Burglary’ and ‘Theft’ took place in residential premises.
In residential premises, most of properties, in term of value, were stolen under thefts (₹67,506.8 lakh) followed by criminal trespasses/burglaries (₹60,315.9 lakh), dacoities (₹4,607.5 lakh) and robberies (₹3,980.9 lakh).
A total of 77 cases of dacoities in railways, 24 cases of dacoities in banks, 17 cases of dacoities in religious places, 11 cases of dacoities in river and sea and 2 cases of dacoities in ATM were registered during 2015.
In commercial establishments, 37,665
cases of thefts, 17,373 cases of criminal trespasses/burglaries, 2,229 cases of robberies and 284 cases of dacoities were registered during 2015.
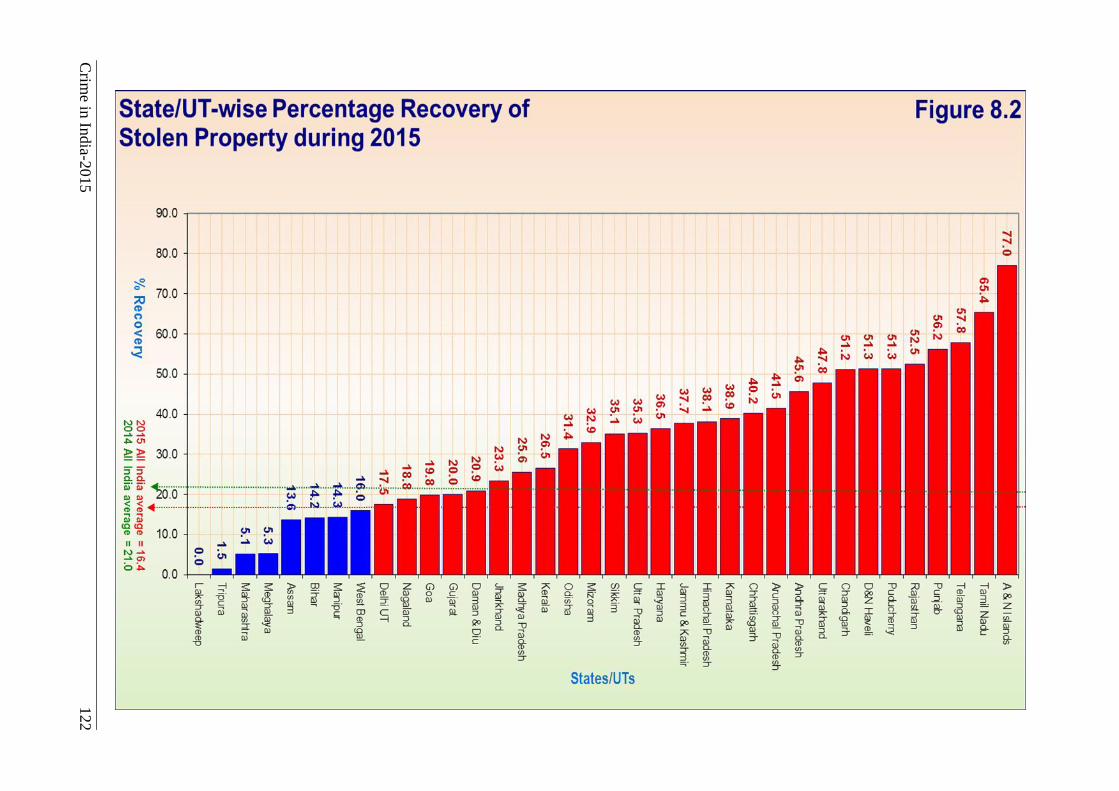
Crim
e in In
dia-2
015
122
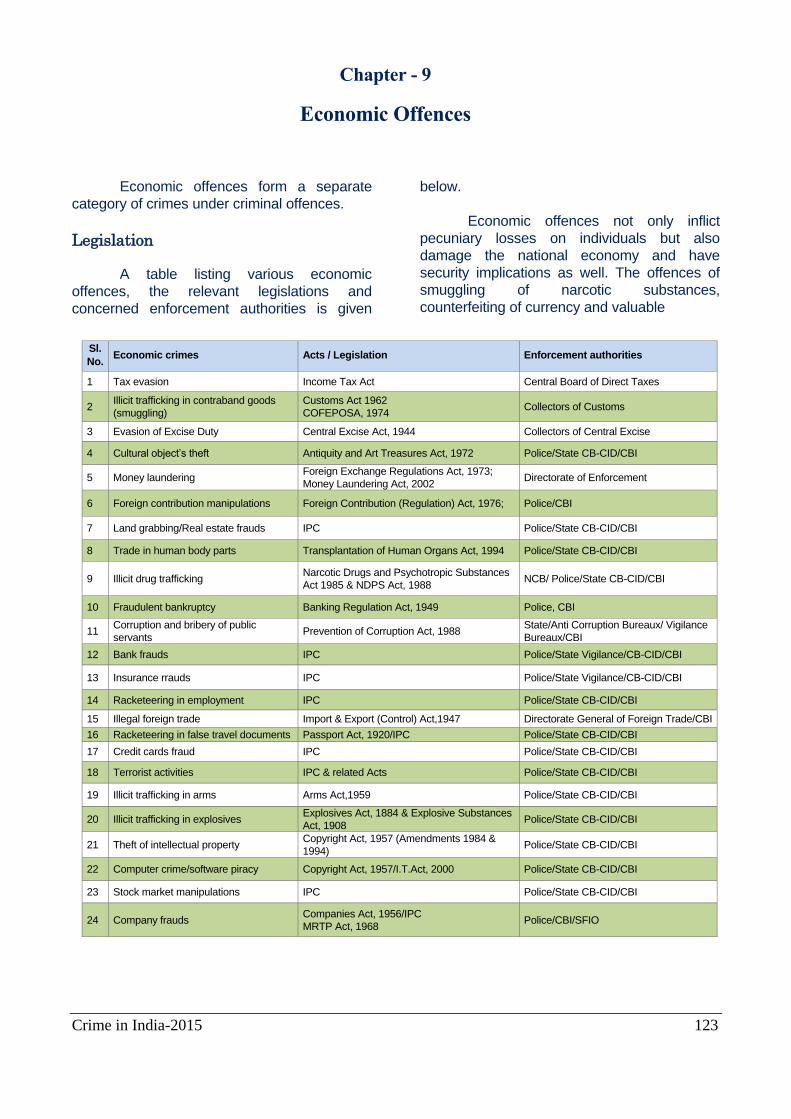
Crime in India-2015 123
Chapter - 9
Economic Offences
Economic offences form a separate
category of crimes under criminal offences.
Legislation
A table listing various economic
offences, the relevant legislations and
concerned enforcement authorities is given
below.
Economic offences not only inflict
pecuniary losses on individuals but also
damage the national economy and have
security implications as well. The offences of
smuggling of narcotic substances,
counterfeiting of currency and valuable
Sl.
No. Economic crimes Acts / Legislation Enforcement authorities
1 Tax evasion Income Tax Act Central Board of Direct Taxes
2 Illicit trafficking in contraband goods
(smuggling)
Customs Act 1962
COFEPOSA, 1974 Collectors of Customs
3 Evasion of Excise Duty Central Excise Act, 1944 Collectors of Central Excise
4 Cultural object’s theft Antiquity and Art Treasures Act, 1972 Police/State CB-CID/CBI
5 Money laundering Foreign Exchange Regulations Act, 1973;
Money Laundering Act, 2002 Directorate of Enforcement
6 Foreign contribution manipulations Foreign Contribution (Regulation) Act, 1976; Police/CBI
7 Land grabbing/Real estate frauds IPC Police/State CB-CID/CBI
8 Trade in human body parts Transplantation of Human Organs Act, 1994 Police/State CB-CID/CBI
9 Illicit drug trafficking Narcotic Drugs and Psychotropic Substances
Act 1985 & NDPS Act, 1988 NCB/ Police/State CB-CID/CBI
10 Fraudulent bankruptcy Banking Regulation Act, 1949 Police, CBI
11 Corruption and bribery of public
servants Prevention of Corruption Act, 1988
State/Anti Corruption Bureaux/ Vigilance
Bureaux/CBI
12 Bank frauds IPC Police/State Vigilance/CB-CID/CBI
13 Insurance rrauds IPC Police/State Vigilance/CB-CID/CBI
14 Racketeering in employment IPC Police/State CB-CID/CBI
15 Illegal foreign trade Import & Export (Control) Act,1947 Directorate General of Foreign Trade/CBI
16 Racketeering in false travel documents Passport Act, 1920/IPC Police/State CB-CID/CBI
17 Credit cards fraud IPC Police/State CB-CID/CBI
18 Terrorist activities IPC & related Acts Police/State CB-CID/CBI
19 Illicit trafficking in arms Arms Act,1959 Police/State CB-CID/CBI
20 Illicit trafficking in explosives Explosives Act, 1884 & Explosive Substances
Act, 1908 Police/State CB-CID/CBI
21 Theft of intellectual property Copyright Act, 1957 (Amendments 1984 &
1994) Police/State CB-CID/CBI
22 Computer crime/software piracy Copyright Act, 1957/I.T.Act, 2000 Police/State CB-CID/CBI
23 Stock market manipulations IPC Police/State CB-CID/CBI
24 Company frauds Companies Act, 1956/IPC
MRTP Act, 1968 Police/CBI/SFIO
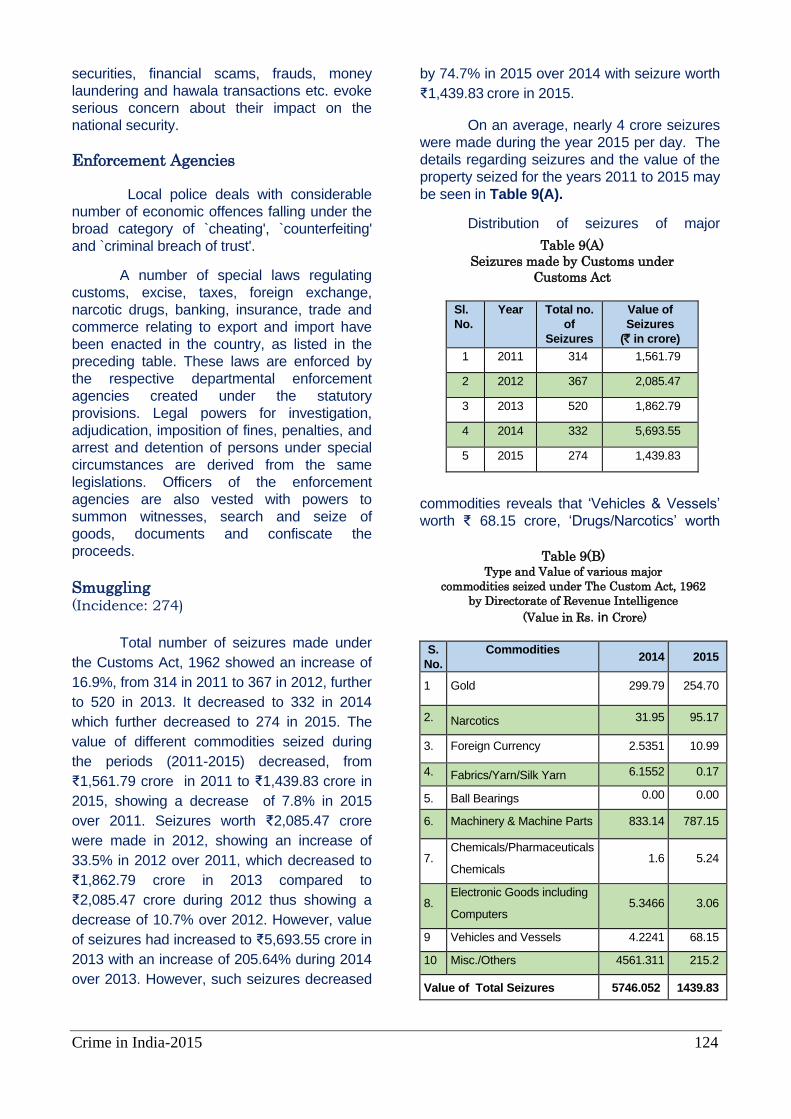
Crime in India-2015 124
securities, financial scams, frauds, money
laundering and hawala transactions etc. evoke
serious concern about their impact on the
national security.
Enforcement Agencies
Local police deals with considerable
number of economic offences falling under the
broad category of `cheating', `counterfeiting'
and `criminal breach of trust'.
A number of special laws regulating
customs, excise, taxes, foreign exchange,
narcotic drugs, banking, insurance, trade and
commerce relating to export and import have
been enacted in the country, as listed in the
preceding table. These laws are enforced by
the respective departmental enforcement
agencies created under the statutory
provisions. Legal powers for investigation,
adjudication, imposition of fines, penalties, and
arrest and detention of persons under special
circumstances are derived from the same
legislations. Officers of the enforcement
agencies are also vested with powers to
summon witnesses, search and seize of
goods, documents and confiscate the
proceeds.
Smuggling (Incidence: 274)
Total number of seizures made under
the Customs Act, 1962 showed an increase of
16.9%, from 314 in 2011 to 367 in 2012, further
to 520 in 2013. It decreased to 332 in 2014
which further decreased to 274 in 2015. The
value of different commodities seized during
the periods (2011-2015) decreased, from
₹1,561.79 crore in 2011 to ₹1,439.83 crore in
2015, showing a decrease of 7.8% in 2015
over 2011. Seizures worth ₹2,085.47 crore
were made in 2012, showing an increase of
33.5% in 2012 over 2011, which decreased to
₹1,862.79 crore in 2013 compared to
₹2,085.47 crore during 2012 thus showing a
decrease of 10.7% over 2012. However, value
of seizures had increased to ₹5,693.55 crore in
2013 with an increase of 205.64% during 2014
over 2013. However, such seizures decreased
by 74.7% in 2015 over 2014 with seizure worth
₹1,439.83 crore in 2015.
On an average, nearly 4 crore seizures
were made during the year 2015 per day. The
details regarding seizures and the value of the
property seized for the years 2011 to 2015 may
be seen in Table 9(A).
Distribution of seizures of major
commodities reveals that ‘Vehicles & Vessels’
worth ₹ 68.15 crore, ‘Drugs/Narcotics’ worth
Table 9(A)
Seizures made by Customs under
Customs Act
Sl.
No.
Year Total no.
of
Seizures
Value of
Seizures
(` in crore)
1 2011 314 1,561.79
2 2012 367 2,085.47
3 2013 520 1,862.79
4 2014 332 5,693.55
5 2015 274 1,439.83
Table 9(B) Type and Value of various major
commodities seized under The Custom Act, 1962
by Directorate of Revenue Intelligence
(Value in Rs. in Crore)
S.
No.
Commodities 2014 2015
1 Gold 299.79 254.70
2. Narcotics 31.95 95.17
3. Foreign Currency 2.5351 10.99
4. Fabrics/Yarn/Silk Yarn 6.1552 0.17
5. Ball Bearings 0.00 0.00
6. Machinery & Machine Parts 833.14 787.15
7. Chemicals/Pharmaceuticals
Chemicals 1.6 5.24
8. Electronic Goods including
Computers 5.3466 3.06
9 Vehicles and Vessels 4.2241 68.15
10 Misc./Others 4561.311 215.2
Value of Total Seizures 5746.052 1439.83
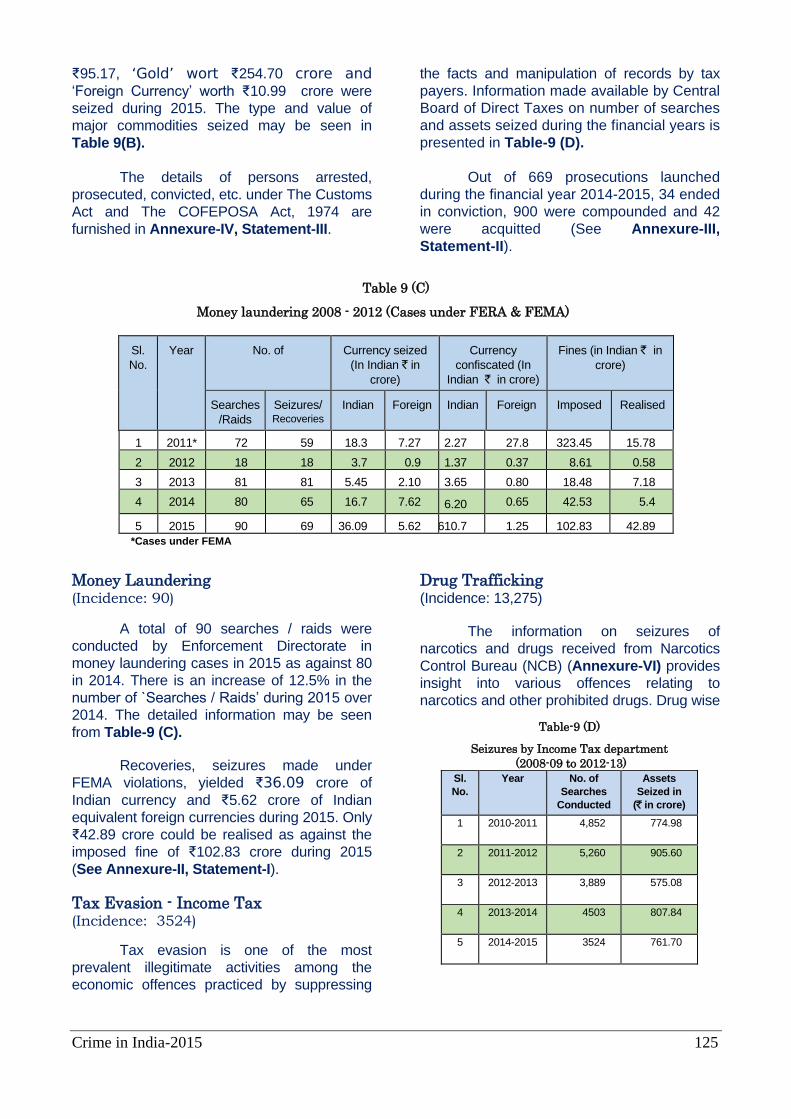
Crime in India-2015 125
Table 9 (C)
Money laundering 2008 - 2012 (Cases under FERA & FEMA)
Sl.
No.
Year No. of Currency seized
(In Indian ` in
crore)
Currency
confiscated (In
Indian ` in crore)
Fines (in Indian ` in
crore)
Searches
/Raids
Seizures/ Recoveries
Indian Foreign Indian Foreign Imposed Realised
1 2011* 72 59 18.3 7.27 2.27 27.8 323.45 15.78
2 2012 18 18 3.7 0.9 1.37 0.37 8.61 0.58
3 2013 81 81 5.45 2.10 3.65 0.80 18.48 7.18
4 2014 80 65 16.7 7.62 6.20 0.65 42.53 5.4
5 2015 90 69 36.09 5.62 6 610.7 1.25 102.83 42.89
*Cases under FEMA
₹95.17, ‘Gold’ wort ₹254.70 crore and ‘Foreign Currency’ worth ₹10.99 crore were seized during 2015. The type and value of
major commodities seized may be seen in
Table 9(B).
The details of persons arrested,
prosecuted, convicted, etc. under The Customs
Act and The COFEPOSA Act, 1974 are
furnished in Annexure-IV, Statement-III.
Money Laundering (Incidence: 90)
A total of 90 searches / raids were
conducted by Enforcement Directorate in
money laundering cases in 2015 as against 80
in 2014. There is an increase of 12.5% in the
number of `Searches / Raids’ during 2015 over
2014. The detailed information may be seen
from Table-9 (C).
Recoveries, seizures made under
FEMA violations, yielded ₹36.09 crore of
Indian currency and ₹5.62 crore of Indian
equivalent foreign currencies during 2015. Only
₹42.89 crore could be realised as against the
imposed fine of ₹102.83 crore during 2015
(See Annexure-II, Statement-I).
Tax Evasion - Income Tax (Incidence: 3524)
Tax evasion is one of the most
prevalent illegitimate activities among the
economic offences practiced by suppressing
the facts and manipulation of records by tax
payers. Information made available by Central
Board of Direct Taxes on number of searches
and assets seized during the financial years is
presented in Table-9 (D).
Out of 669 prosecutions launched
during the financial year 2014-2015, 34 ended
in conviction, 900 were compounded and 42
were acquitted (See Annexure-III,
Statement-II).
Drug Trafficking (Incidence: 13,275)
The information on seizures of
narcotics and drugs received from Narcotics
Control Bureau (NCB) (Annexure-VI) provides
insight into various offences relating to
narcotics and other prohibited drugs. Drug wise
Table-9 (D)
Seizures by Income Tax department
(2008-09 to 2012-13)
Sl.
No.
Year No. of
Searches
Conducted
Assets
Seized in
(` in crore)
1 2010-2011 4,852 774.98
2 2011-2012 5,260 905.60
3 2012-2013 3,889 575.08
4 2013-2014 4503 807.84
5 2014-2015 3524 761.70
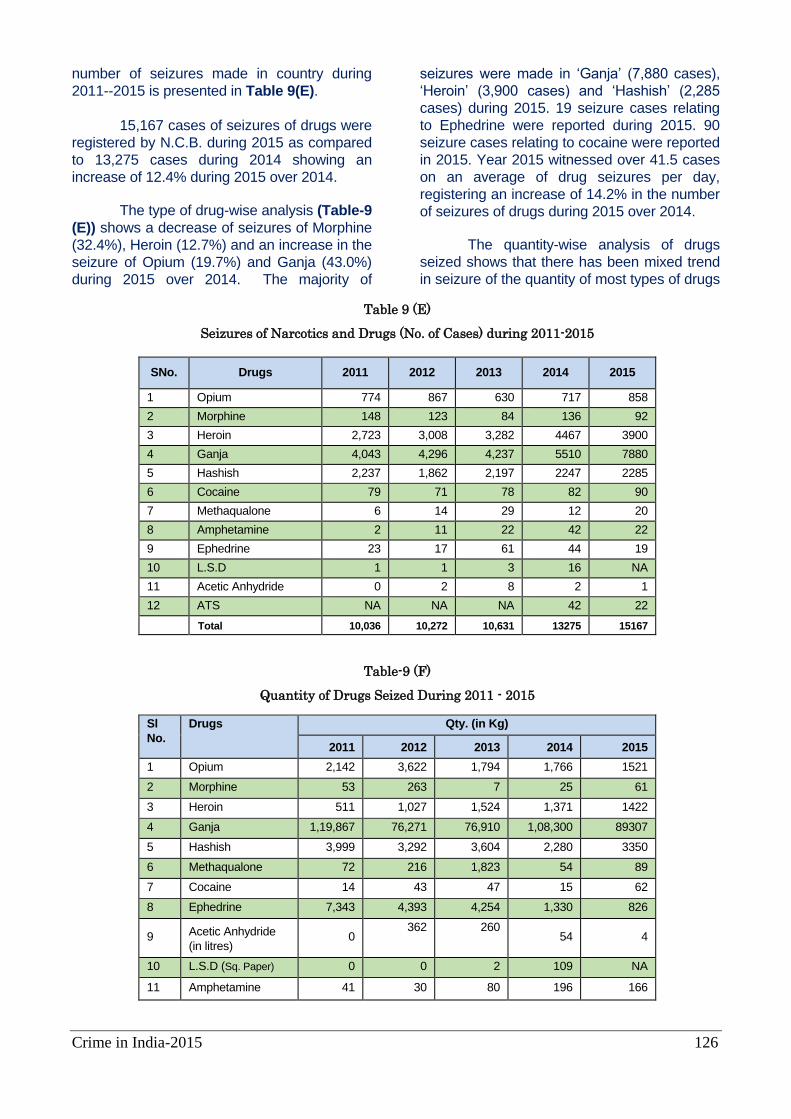
Crime in India-2015 126
Table 9 (E)
Seizures of Narcotics and Drugs (No. of Cases) during 2011-2015
SNo. Drugs 2011 2012 2013 2014 2015
1 Opium 774 867 630 717 858
2 Morphine 148 123 84 136 92
3 Heroin 2,723 3,008 3,282 4467 3900
4 Ganja 4,043 4,296 4,237 5510 7880
5 Hashish 2,237 1,862 2,197 2247 2285
6 Cocaine 79 71 78 82 90
7 Methaqualone 6 14 29 12 20
8 Amphetamine 2 11 22 42 22
9 Ephedrine 23 17 61 44 19
10 L.S.D 1 1 3 16 NA
11 Acetic Anhydride 0 2 8 2 1
12 ATS NA NA NA 42 22
Total 10,036 10,272 10,631 13275 15167
Table-9 (F)
Quantity of Drugs Seized During 2011 - 2015
Sl
No.
Drugs Qty. (in Kg)
2011 2012 2013 2014 2015
1 Opium 2,142 3,622 1,794 1,766 1521
2 Morphine 53 263 7 25 61
3 Heroin 511 1,027 1,524 1,371 1422
4 Ganja 1,19,867 76,271 76,910 1,08,300 89307
5 Hashish 3,999 3,292 3,604 2,280 3350
6 Methaqualone 72 216 1,823 54 89
7 Cocaine 14 43 47 15 62
8 Ephedrine 7,343 4,393 4,254 1,330 826
9 Acetic Anhydride
(in litres) 0
362
260
54 4
10 L.S.D (Sq. Paper) 0 0 2 109 NA
11 Amphetamine 41 30 80 196 166
number of seizures made in country during
2011--2015 is presented in Table 9(E).
15,167 cases of seizures of drugs were
registered by N.C.B. during 2015 as compared
to 13,275 cases during 2014 showing an
increase of 12.4% during 2015 over 2014.
The type of drug-wise analysis (Table-9
(E)) shows a decrease of seizures of Morphine
(32.4%), Heroin (12.7%) and an increase in the
seizure of Opium (19.7%) and Ganja (43.0%)
during 2015 over 2014. The majority of
seizures were made in ‘Ganja’ (7,880 cases),
‘Heroin’ (3,900 cases) and ‘Hashish’ (2,285
cases) during 2015. 19 seizure cases relating
to Ephedrine were reported during 2015. 90
seizure cases relating to cocaine were reported
in 2015. Year 2015 witnessed over 41.5 cases
on an average of drug seizures per day,
registering an increase of 14.2% in the number
of seizures of drugs during 2015 over 2014.
The quantity-wise analysis of drugs
seized shows that there has been mixed trend
in seizure of the quantity of most types of drugs

Crime in India-2015 127
Table 9 (G)
Value of property of drug traffickers forfeited and frozen
(Amount in ` Lakh)
Sl.
No.
Value of
property
2011 2012 2013 2014 2015
Cases Value Cases Value Cases Value Cases Value Cases Value
1 Forfeited 0 0 0 0 0 0 1 37.9 0 0
2 Frozen 4 26.5 0 0 4 57.3 0 0 5 2.5
Table-9 (H)
Cultural Property Stolen & Recovered
Sl.
No.
Year No. of cases in which
Property was
Value of Property
(in ` Lakh)
Stolen Recovered Stolen Recovered
1 2011 799 192 2,893.5 290.7
2 2012 777 277 2,089.4 1,466.8
3 2013 1,128 243 2,685.2 2,296.2
4 2014 764 221 2294.9 1983.3
5 2015 1747 693 1611.1 623.8
during 2015 as compared to 2014. Ephedrine
showed decrease in quantity seized from 1,330
Kg in 2014 to 826 Kg in 2015. Similar trend
was also noticed in the seizure of Opium (from
1,766 Kg in 2013 to 1,521 Kg in 2015), Ganja
(from 1,08,300 Kg in 2014 to 89,307 Kg in
2015) and Acetic Anhydride (54 Litres in 2014
to 4 litres in 2015) (Table 9 (F)).
An increase in the quantity of drugs
seized was reported in Methaqualone (from 54
Kg in 2014 to 86 Kg), Morphine (from 25 Kg in
2014 to 61 Kg in 2015), Heroin (from 1,371 in
2014 to 1,422 in 2015), Hashish (from 2,280 in
2014 to 3,350 in 2015), Cocaine (from 15 Kg in
2014 to 62 Kg in 2015).
A total of 32,069 persons including 203
foreigners were arrested for offences relating to
drug trafficking in 2015. 45,050 persons were
prosecuted, 31,195 persons were convicted
and 3,110 persons were acquitted in cases of
Drug –Trafficking (See Annexure-VI).
Property of Forfeited and Frozen
The information on property of drug
traffickers forfeited and frozen has been
collected from Narcotics Control Bureau (NCB)
(Annexure-VI). Details on cases registered in
which properties of traffickers forfeited and
frozen by law enforcement agencies during
2011 – 2015 are presented in Table – 9(G).
Trafficking in Cultural Property (Incidence: 1747)
The information on registered cases of
cultural property theft during 2011 -2015 is
presented in Table 9(H). There has been an
increase of 128.6 % in cases of thefts (from
764 cases in 2014 to 17,47 cases in 2015) of
cultural property. Cultural properties worth
₹16.1 crore were stolen in 17,47 cases while
properties worth ₹6.24 crore were recovered
during 2015. State/UT-wise details may be
seen in Chapter-8, Table No. 8.4.
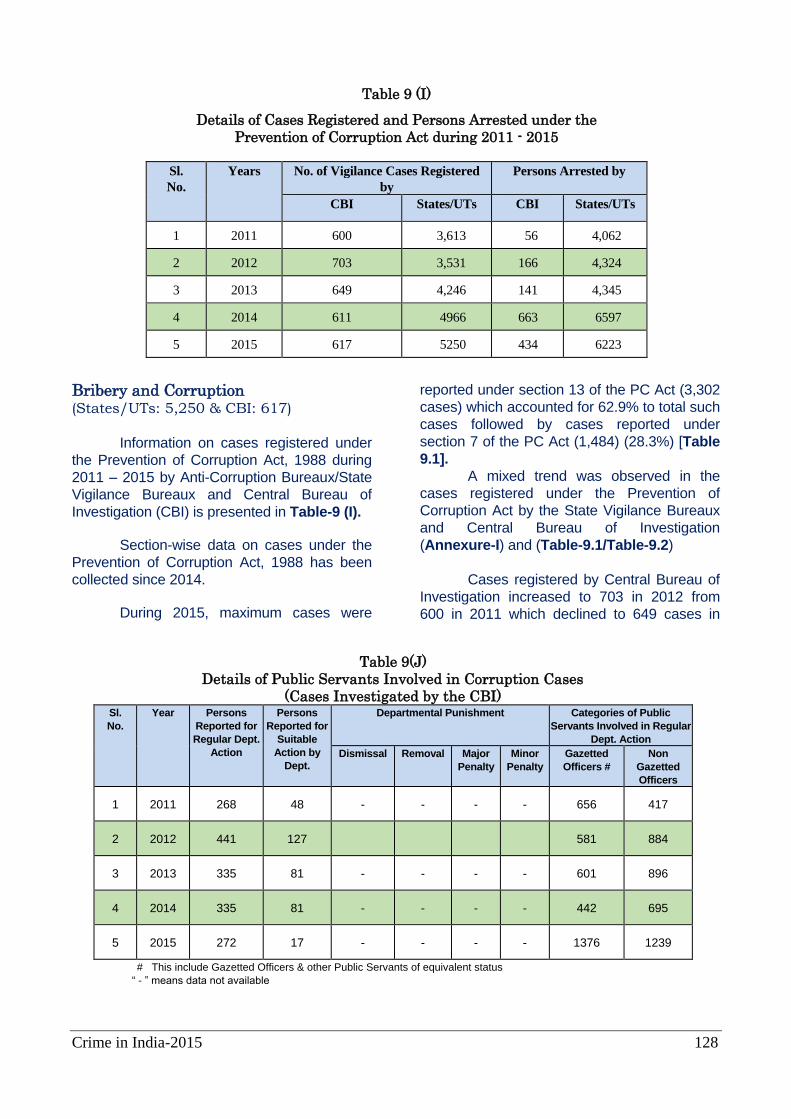
Crime in India-2015 128
Table 9 (I)
Details of Cases Registered and Persons Arrested under the
Prevention of Corruption Act during 2011 - 2015
Sl.
No.
Years No. of Vigilance Cases Registered
by
Persons Arrested by
CBI States/UTs CBI States/UTs
1 2011 600 3,613 56 4,062
2 2012 703 3,531 166 4,324
3 2013 649 4,246 141 4,345
4 2014 611 4966 663 6597
5 2015 617 5250 434 6223
Table 9(J)
Details of Public Servants Involved in Corruption Cases
(Cases Investigated by the CBI) Sl.
No.
Year Persons
Reported for
Regular Dept.
Action
Persons
Reported for
Suitable
Action by
Dept.
Departmental Punishment Categories of Public
Servants Involved in Regular
Dept. Action
Dismissal Removal Major
Penalty
Minor
Penalty
Gazetted
Officers #
Non
Gazetted
Officers
1 2011 268 48 - - - - 656 417
2 2012 441 127 581 884
3 2013 335 81 - - - - 601 896
4 2014 335 81 - - - - 442 695
5 2015 272 17 - - - - 1376 1239
# This include Gazetted Officers & other Public Servants of equivalent status
“ - ” means data not available
Bribery and Corruption (States/UTs: 5,250 & CBI: 617)
Information on cases registered under
the Prevention of Corruption Act, 1988 during
2011 – 2015 by Anti-Corruption Bureaux/State
Vigilance Bureaux and Central Bureau of
Investigation (CBI) is presented in Table-9 (I).
Section-wise data on cases under the
Prevention of Corruption Act, 1988 has been
collected since 2014.
During 2015, maximum cases were
reported under section 13 of the PC Act (3,302
cases) which accounted for 62.9% to total such
cases followed by cases reported under
section 7 of the PC Act (1,484) (28.3%) [Table
9.1].
A mixed trend was observed in the
cases registered under the Prevention of
Corruption Act by the State Vigilance Bureaux
and Central Bureau of Investigation
(Annexure-I) and (Table-9.1/Table-9.2)
Cases registered by Central Bureau of
Investigation increased to 703 in 2012 from
600 in 2011 which declined to 649 cases in
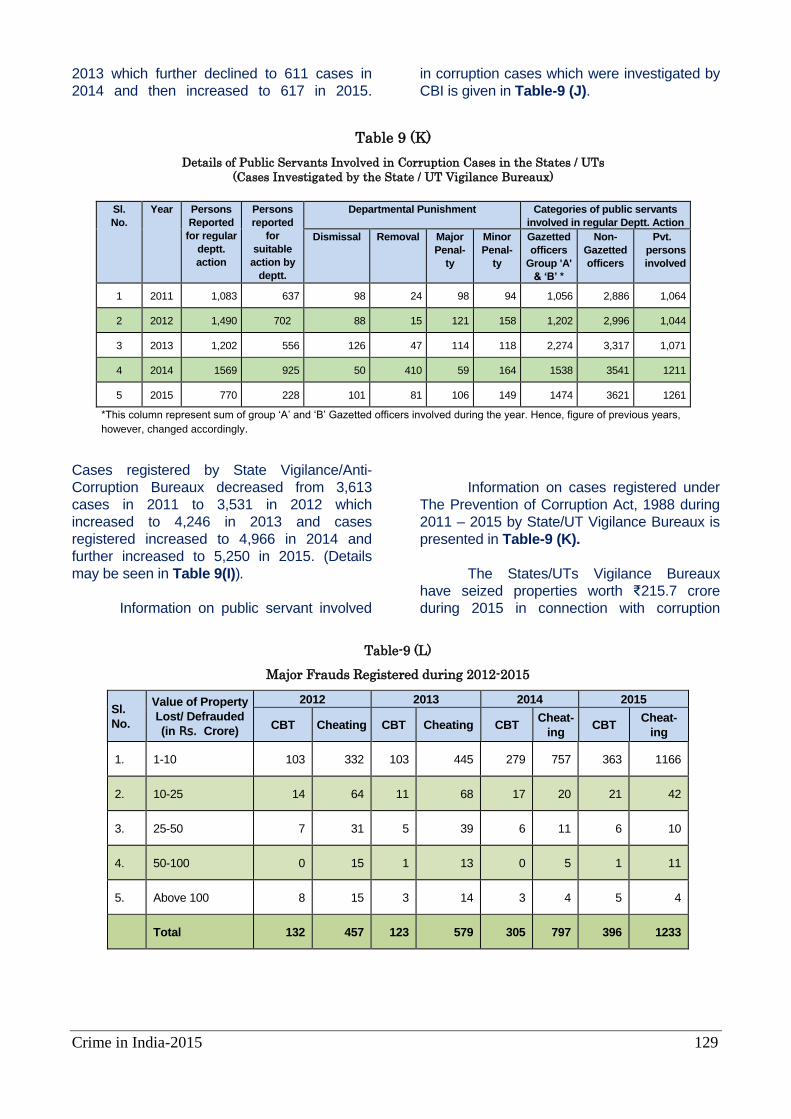
Crime in India-2015 129
Table 9 (K)
Details of Public Servants Involved in Corruption Cases in the States / UTs
(Cases Investigated by the State / UT Vigilance Bureaux)
Sl.
No.
Year Persons
Reported
for regular
deptt.
action
Persons
reported
for
suitable
action by
deptt.
Departmental Punishment Categories of public servants
involved in regular Deptt. Action
Dismissal Removal Major
Penal-
ty
Minor
Penal-
ty
Gazetted
officers
Group 'A'
& ‘B’ *
Non-
Gazetted
officers
Pvt.
persons
involved
1 2011 1,083 637 98 24 98 94 1,056 2,886 1,064
2 2012 1,490 702 88 15 121 158 1,202 2,996 1,044
3 2013 1,202 556 126 47 114 118 2,274 3,317 1,071
4 2014 1569 925 50 410 59 164 1538 3541 1211
5 2015 770 228 101 81 106 149 1474 3621 1261
*This column represent sum of group ‘A’ and ‘B’ Gazetted officers involved during the year. Hence, figure of previous years,
however, changed accordingly.
Table-9 (L)
Major Frauds Registered during 2012-2015
Sl.
No.
Value of Property
Lost/ Defrauded
(in Rs. Crore)
2012 2013 2014 2015
CBT Cheating CBT Cheating CBT Cheat-
ing CBT
Cheat-
ing
1. 1-10 103 332 103 445 279 757 363 1166
2. 10-25 14 64 11 68 17 20 21 42
3. 25-50 7 31 5 39 6 11 6 10
4. 50-100 0 15 1 13 0 5 1 11
5. Above 100 8 15 3 14 3 4 5 4
Total 132 457 123 579 305 797 396 1233
2013 which further declined to 611 cases in
2014 and then increased to 617 in 2015.
Cases registered by State Vigilance/Anti-
Corruption Bureaux decreased from 3,613
cases in 2011 to 3,531 in 2012 which
increased to 4,246 in 2013 and cases
registered increased to 4,966 in 2014 and
further increased to 5,250 in 2015. (Details
may be seen in Table 9(I)).
Information on public servant involved
in corruption cases which were investigated by
CBI is given in Table-9 (J).
Information on cases registered under
The Prevention of Corruption Act, 1988 during
2011 – 2015 by State/UT Vigilance Bureaux is
presented in Table-9 (K).
The States/UTs Vigilance Bureaux
have seized properties worth ₹215.7 crore
during 2015 in connection with corruption
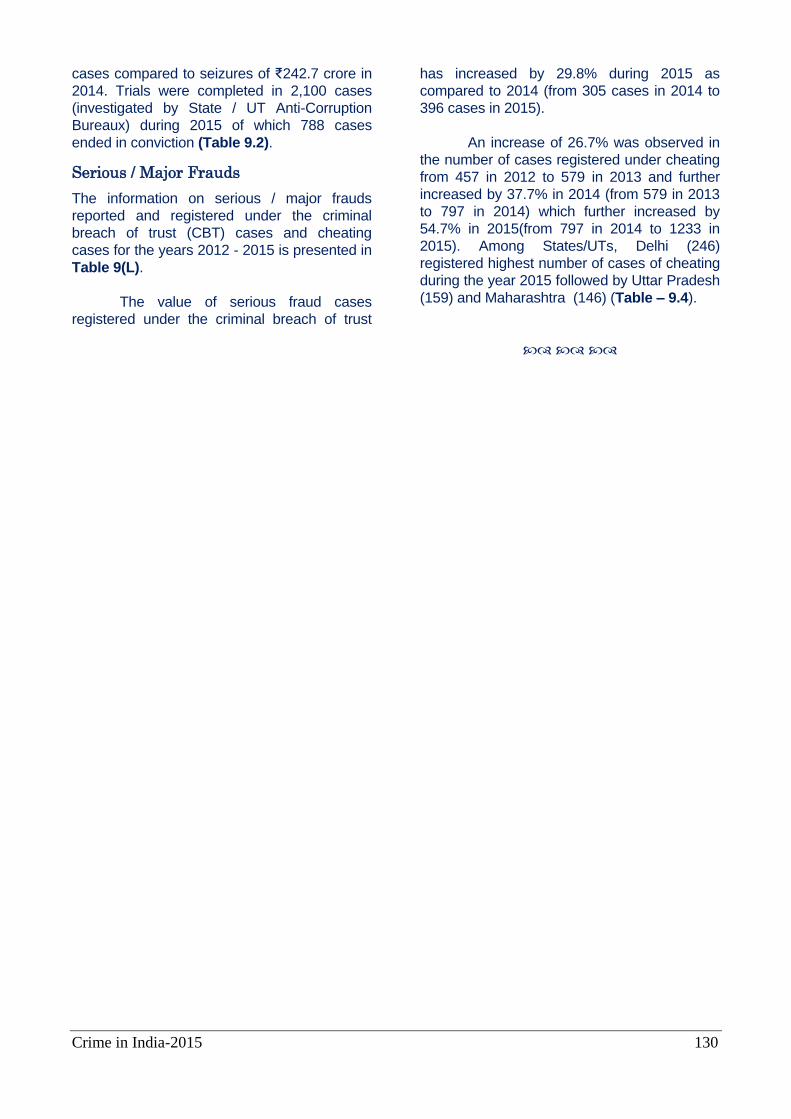
Crime in India-2015 130
cases compared to seizures of ₹242.7 crore in
2014. Trials were completed in 2,100 cases
(investigated by State / UT Anti-Corruption
Bureaux) during 2015 of which 788 cases
ended in conviction (Table 9.2).
Serious / Major Frauds
The information on serious / major frauds
reported and registered under the criminal
breach of trust (CBT) cases and cheating
cases for the years 2012 - 2015 is presented in
Table 9(L).
The value of serious fraud cases
registered under the criminal breach of trust
has increased by 29.8% during 2015 as
compared to 2014 (from 305 cases in 2014 to
396 cases in 2015).
An increase of 26.7% was observed in
the number of cases registered under cheating
from 457 in 2012 to 579 in 2013 and further
increased by 37.7% in 2014 (from 579 in 2013
to 797 in 2014) which further increased by
54.7% in 2015(from 797 in 2014 to 1233 in
2015). Among States/UTs, Delhi (246)
registered highest number of cases of cheating
during the year 2015 followed by Uttar Pradesh
(159) and Maharashtra (146) (Table – 9.4).
Crime in India-2015 131
Chapter – 10
Juveniles in conflict with law
Introduction
‘Juveniles in Conflict with Law’ refers to any persons below age of 18 years who comes into contact with the justice system as a result of being suspected or accused of committing crimes. Data on juveniles in conflict with law is based on police recorded First Information Report (FIR) only irrespective of final order. Data are being captured through a prescribed proformae, some information, relating to demographic details of juveniles, might be collected from juveniles home/special home.
The figures for juvenile apprehended till
2000 were collected as per the definition of juveniles in The Juvenile Justice (Care & Protection of Children) Act, 1986. As per this Act, juveniles or child means a person who has not completed eighteen year of age.
Share of Juvenile Crimes
The share of IPC crimes registered against juveniles to total IPC crimes registered in the country during 2005 was at 1.0% which marginally increased to 1.1% in 2006 and remained static in 2007. This share increased marginally to 1.2% in 2008 thereafter decreased to 1.1% in 2009.This share further decreased to 1.0% in 2010 and thereafter marginally increased to 1.1% in 2011. Further, the share increased marginally to 1.2% in 2012 and remained static at 1.2% in 2013 and 2014. Furthermore, the share has marginally decreased to 1.1% in 2015. The details may be seen in Table 10.1.
IPC Crimes (Incidence: 31,396)
The number of cases registered under various sections of IPC crimes against juveniles(in conflict with law) in 2015 have decreased by 6.3% during 2015 over 2014 as 33,526 cases under IPC crimes were registered against juveniles during 2014 which decreased to 31,396 such cases in 2015. The details may be seen in Table 10.1.
The highest share of cases registered against juveniles were reported under the crime head ‘theft’ (19.2%), ‘criminal trespass/burglary’ (8.3%), ‘rape’ (5.4%) and kidnapping & abduction’ (5.2%) and ‘Causing injuries under rash driving/road rage' (4.9%). These five crime heads have together accounted for 43.0% of total IPC cases (31,396 cases) of juveniles in conflict with law. The details may be seen in Table 10.2.
SLL Crimes (Incidence: 2,037)
Cases of juveniles in conflict with law registered under various SLL crimes have decreased by 59.6% in 2015 as compared to 2014 as 5,039cases of juveniles in conflict with law under SLL registered in 2014 which decreased to2,037 cases in 2015.
The highest share of cases registered against juveniles was reported for the crime under ‘Protection of Children from Sexual Offences Act’ which accounted for 22.6% of total SLL cases (2,037 cases) registered against juveniles. The details may be seen in Table 10.3.
State-wise Distribution of Cases
Registered against Juveniles under
Various Sections of IPC
Madhya Pradesh (6,320 cases), Maharashtra (5,482 cases),Delhi (2,332 cases), Rajasthan (2,126 cases), Chhattisgarh (1,788 cases), Bihar (1,562 cases) and Tamil Nadu (1,483 cases) have reported maximum number of cases registered against juvenile under various sections of IPC. These seven States taken together have accounted for 67.2% (21,093 out of 31,396 cases) of total cases under IPC relating to juveniles in conflict with law in the country. A total of 128 cases and 87 cases registered against juveniles under murder in Maharashtra and Madhya Pradesh respectively during 2015. Majority of rape cases registered against juveniles in the country was reported from Madhya Pradesh (282 cases) followed by Maharashtra (247 cases), Rajasthan (166 cases) and Chhattisgarh (134 cases) which was 16.7%, 14.6%, 9.8% and 7.9% of total rape
Crime in India-2015 132
cases registered against juveniles respectively in the country. Among UTs, a total of 119 rape cases registered against juveniles were reported in Delhi during the year 2015.
Maximum number of cases of kidnapping & abduction registered against juveniles in the country was reported from Madhya Pradesh (299 cases) followed by Bihar (298 cases), Chhattisgarh (230 cases) and Uttar Pradesh (145 cases). These four States together have accounted for 59.6% (972 out of 1,630 cases) of total such cases in the country.
Maharashtra (1,279 cases), Delhi (669 cases), Madhya Pradesh (458 cases), Tamil Nadu (432 cases), Rajasthan (412 cases) and Andhra Pradesh (399 cases) have reported high number of cases of theft registered against juveniles. These six States taken together have accounted for 60.4% (3,649 out of 6,046 cases) of total such cases registered in the country.
Maximum number of cases registered against juveniles under assault on women with intent to outrage her modesty (sec. 354 IPC) were reported from Madhya Pradesh (364 cases), Maharashtra (347 cases), Delhi (142 cases), Chhattisgarh (105 cases) and Rajasthan (76 cases) which together accounted for 71.8% of total cases (1,439) registered in the country. Details are given in Table 10.2.
State/UT-wise Distribution of Cases
Registered against Juveniles under
Various Sections of SLL
Majority of cases registered against juveniles under Special and Local Laws(SLL) were reported in Tamil Nadu, which accounted for 16.2% (331 out of 2,037 cases) of total such cases under SLL, followed by 12.9% in Madhya Pradesh (263 cases), 10.8% each in Kerala and Gujarat (221 cases each) and 10.3% Maharashtra (211 cases). These five States taken together have accounted for 61.2% of total such cases of juveniles in conflict with law under SLL crimes registered in the country.
Out of 460 cases registered in the country under ‘The Protection of Children from Sexual Offences Act’ against juveniles, 84 cases were reported from Gujarat (18.3%) followed by Madhya Pradesh with 65 cases
(14.1%). Madhya Pradesh reported 79 cases of juveniles in conflict with law under the Gambling Act followed by Chhattisgarh with 41 cases. 46 cases out of 187 cases registered against juveniles under 'The Arms Act' were reported from Bihar and Madhya Pradesh whereas 53 out of 152 cases reported under the 'Excise Act 1944' were reported from Madhya Pradesh alone. 14 cases out of 33 cases registered against juveniles under 'The SC/ST(Prevention of Atrocities) Act' were reported in Tamil Nadu. Gujarat reported 54 cases out of 130 such cases under 'Prohibition Act'. Under the Narcotic Drugs & Psychotropic Substances Act, Kerala registered 39 out of total 123 cases reported in the country. Details are given in Table 10.3.
Juveniles Apprehended
The details on gender-wise juveniles apprehended under IPC and SLL crimes are presented in Table 10.4. A total of 41,385 juveniles were apprehended during 2015 out of which 40,468 were boys and 917 were girls. The percentage of girls to total juveniles was 2.2% i.e. 1.1 percentage point less than such share in 2014 (3.3%). Details of juveniles apprehended under IPC and SLL crimes by age-group are presented in Table 10.4. Out of total juveniles apprehended in 2015, 602 juveniles were in the age-group of below 12 years, 11,052 juveniles in the age-group of 12-16 years and 29,731 juveniles apprehended were under the age-group of 16-18 years and the percentage shares of juveniles apprehended under these age-groups were 1.4%, 26.7% and 71.8% of total juveniles apprehended during 2015 respectively. A decrease of 1.5% (from 11,220 in 2014 to 11,052 in 2015) in the age group 12-16 and decrease of 17.7% (from 36,138 in 2014 to 29,731 in 2015) in the age group of 16-18 years were reported during 2015 over 2014. The overall decrease in juveniles apprehended at the national level was 14.2% during 2015 in comparison to 2014.
Out of total 41,385 juveniles apprehended during 2015, 39,074 juveniles (94.4%) were apprehended under IPC crimes while 2,311 juveniles (5.6%) were apprehended for cases under SLL crimes. Majority of juveniles were apprehended for theft (7,936) followed by criminal trespass & burglary (3,632), rape (1,841) and robbery (1,838). These heads taken together accounted for 39.0% (15,247 out of 39,074) of total juveniles apprehended under
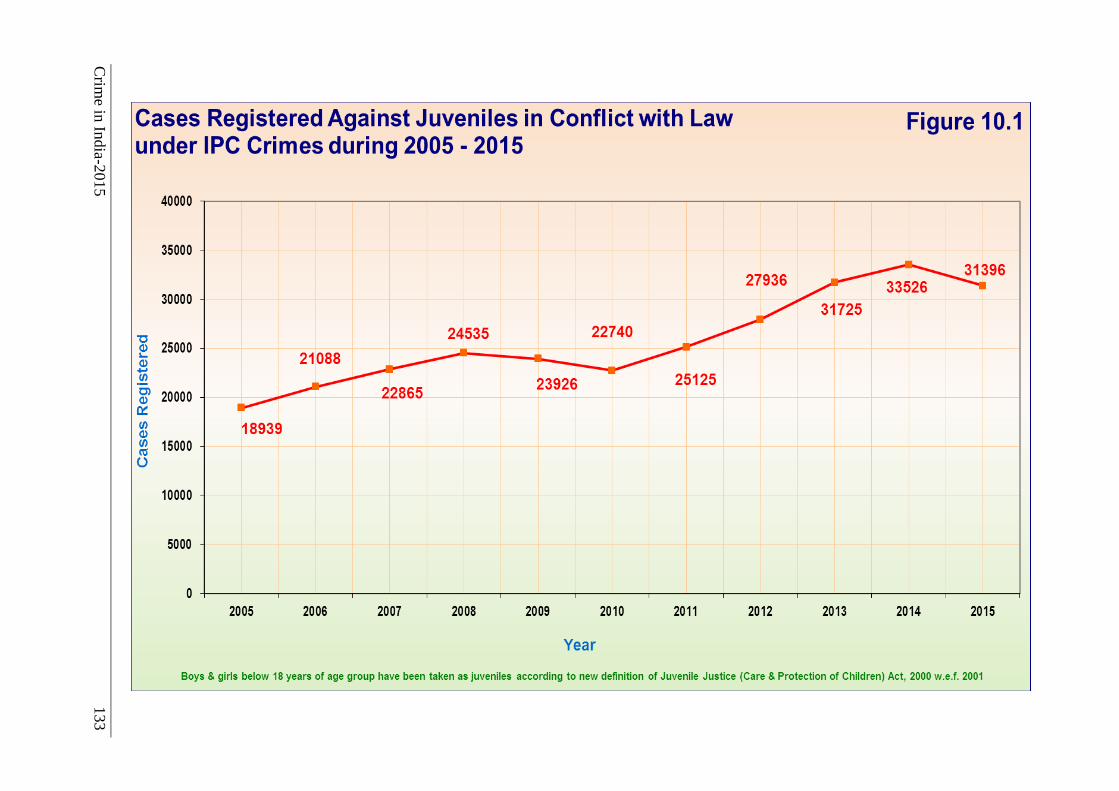
Crim
e in In
dia-2
015
133
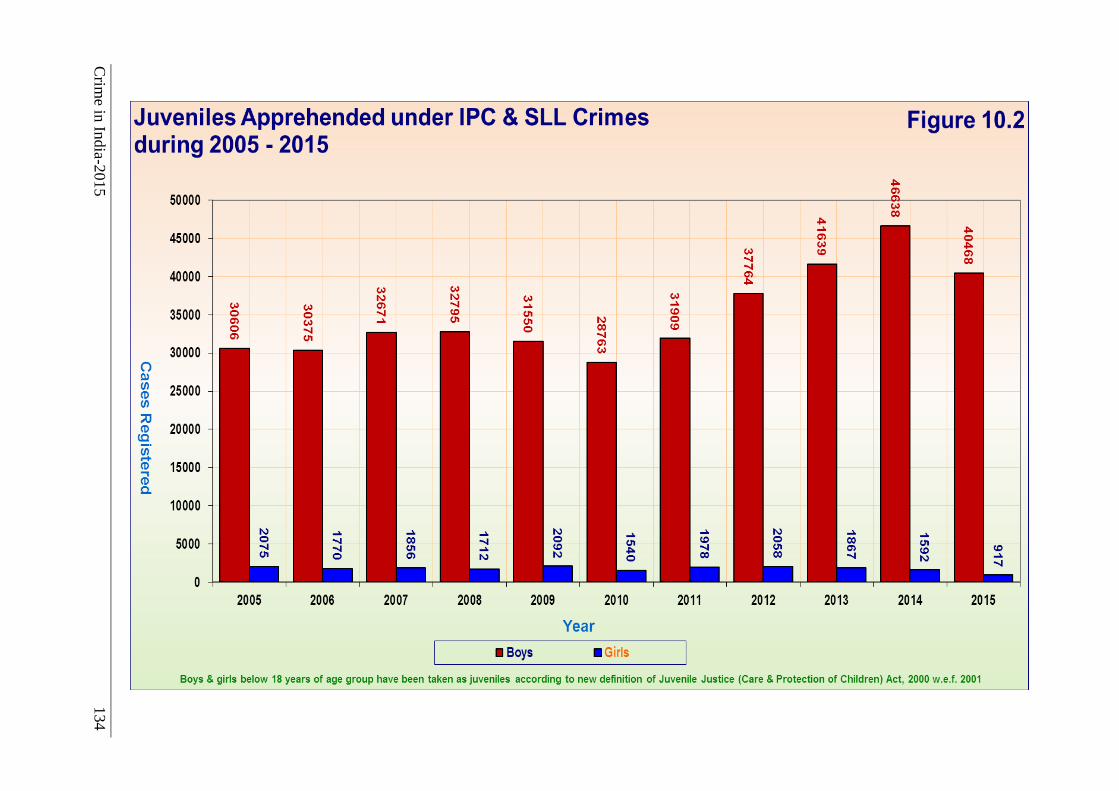
Crim
e in In
dia-2
015
134
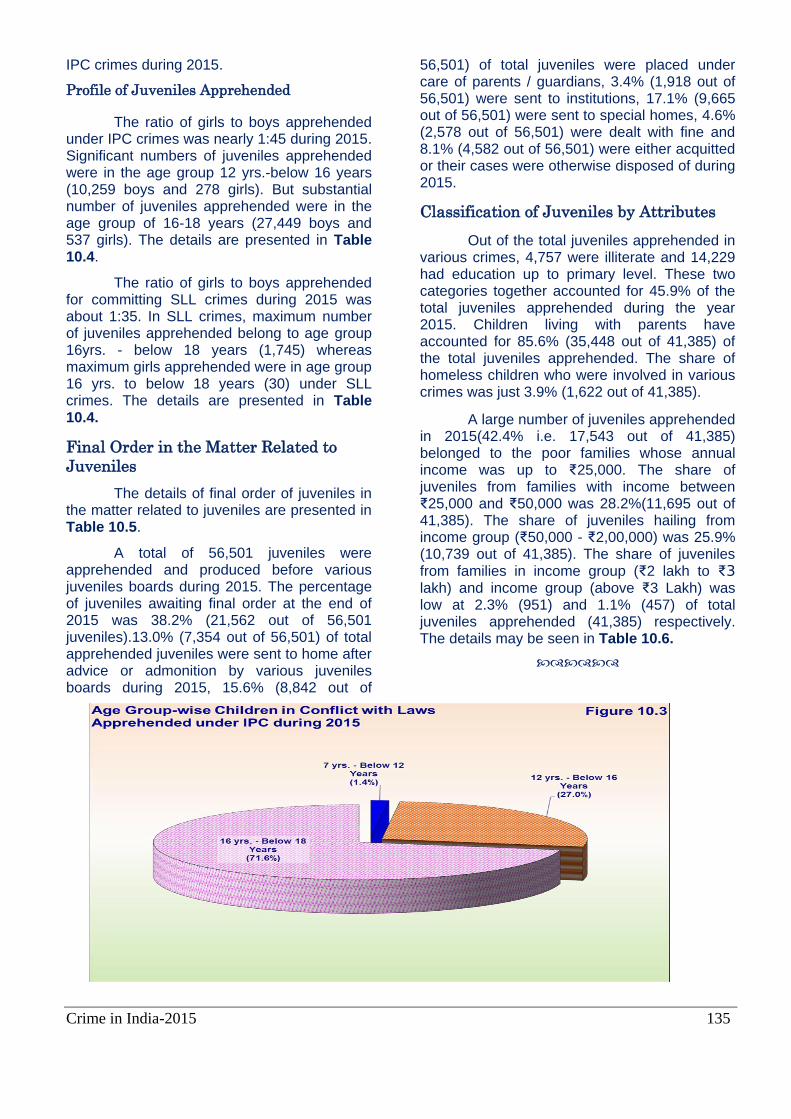
Crime in India-2015 135
IPC crimes during 2015.
Profile of Juveniles Apprehended
The ratio of girls to boys apprehended under IPC crimes was nearly 1:45 during 2015. Significant numbers of juveniles apprehended were in the age group 12 yrs.-below 16 years (10,259 boys and 278 girls). But substantial number of juveniles apprehended were in the age group of 16-18 years (27,449 boys and 537 girls). The details are presented in Table 10.4.
The ratio of girls to boys apprehended for committing SLL crimes during 2015 was about 1:35. In SLL crimes, maximum number of juveniles apprehended belong to age group 16yrs. - below 18 years (1,745) whereas maximum girls apprehended were in age group 16 yrs. to below 18 years (30) under SLL crimes. The details are presented in Table 10.4.
Final Order in the Matter Related to
Juveniles
The details of final order of juveniles in the matter related to juveniles are presented in Table 10.5.
A total of 56,501 juveniles were apprehended and produced before various juveniles boards during 2015. The percentage of juveniles awaiting final order at the end of 2015 was 38.2% (21,562 out of 56,501 juveniles).13.0% (7,354 out of 56,501) of total apprehended juveniles were sent to home after advice or admonition by various juveniles boards during 2015, 15.6% (8,842 out of
56,501) of total juveniles were placed under care of parents / guardians, 3.4% (1,918 out of 56,501) were sent to institutions, 17.1% (9,665 out of 56,501) were sent to special homes, 4.6% (2,578 out of 56,501) were dealt with fine and 8.1% (4,582 out of 56,501) were either acquitted or their cases were otherwise disposed of during 2015.
Classification of Juveniles by Attributes
Out of the total juveniles apprehended in various crimes, 4,757 were illiterate and 14,229 had education up to primary level. These two categories together accounted for 45.9% of the total juveniles apprehended during the year 2015. Children living with parents have accounted for 85.6% (35,448 out of 41,385) of the total juveniles apprehended. The share of homeless children who were involved in various crimes was just 3.9% (1,622 out of 41,385).
A large number of juveniles apprehended in 2015(42.4% i.e. 17,543 out of 41,385) belonged to the poor families whose annual income was up to ₹25,000. The share of juveniles from families with income between ₹25,000 and ₹50,000 was 28.2%(11,695 out of 41,385). The share of juveniles hailing from income group (₹50,000 - ₹2,00,000) was 25.9% (10,739 out of 41,385). The share of juveniles from families in income group (₹2 lakh to ₹3 lakh) and income group (above ₹3 Lakh) was low at 2.3% (951) and 1.1% (457) of total juveniles apprehended (41,385) respectively. The details may be seen in Table 10.6.
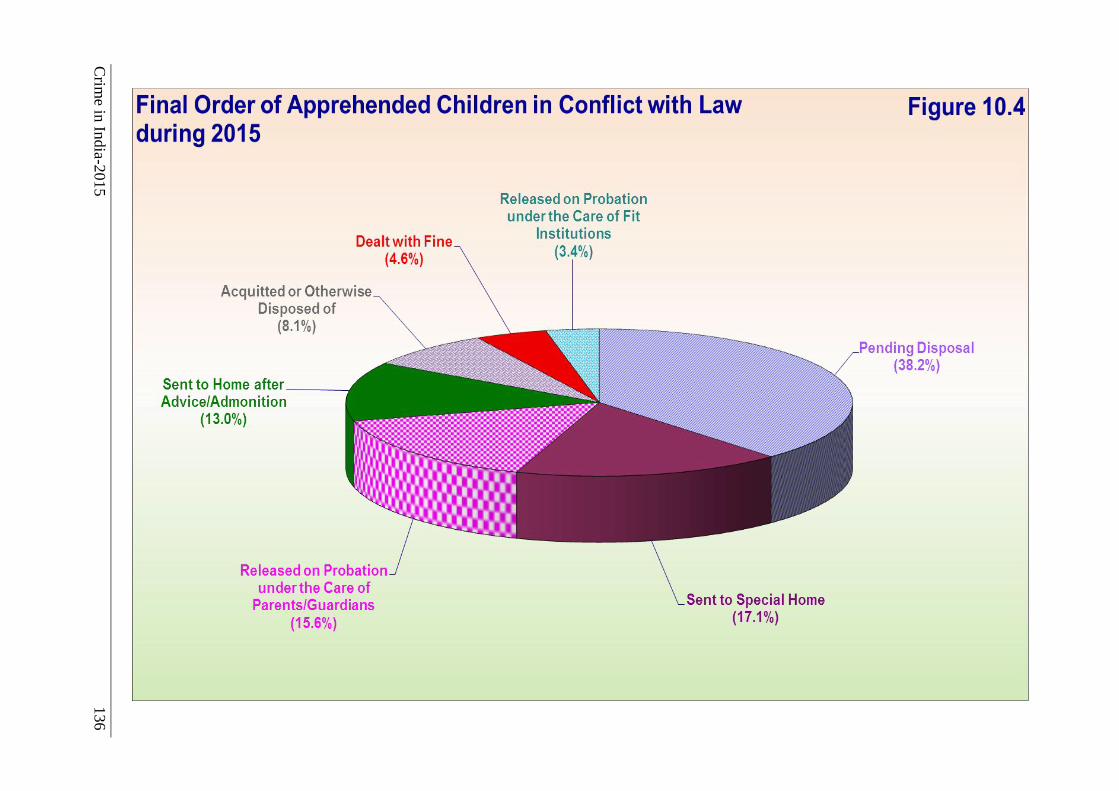
Crim
e in In
dia-2
015
136
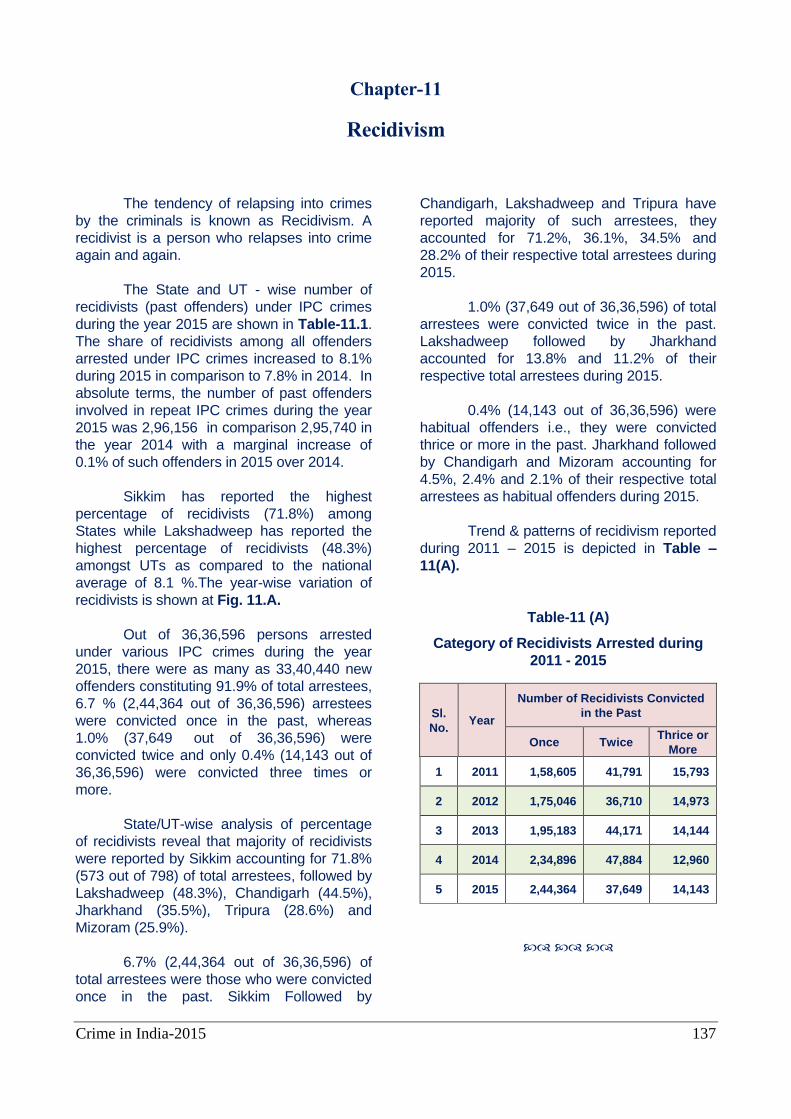
Crime in India-2015 137
Chapter-11
Recidivism
The tendency of relapsing into crimes
by the criminals is known as Recidivism. A
recidivist is a person who relapses into crime
again and again.
The State and UT - wise number of
recidivists (past offenders) under IPC crimes
during the year 2015 are shown in Table-11.1.
The share of recidivists among all offenders
arrested under IPC crimes increased to 8.1%
during 2015 in comparison to 7.8% in 2014. In
absolute terms, the number of past offenders
involved in repeat IPC crimes during the year
2015 was 2,96,156 in comparison 2,95,740 in
the year 2014 with a marginal increase of
0.1% of such offenders in 2015 over 2014.
Sikkim has reported the highest
percentage of recidivists (71.8%) among
States while Lakshadweep has reported the
highest percentage of recidivists (48.3%)
amongst UTs as compared to the national
average of 8.1 %.The year-wise variation of
recidivists is shown at Fig. 11.A.
Out of 36,36,596 persons arrested
under various IPC crimes during the year
2015, there were as many as 33,40,440 new
offenders constituting 91.9% of total arrestees,
6.7 % (2,44,364 out of 36,36,596) arrestees
were convicted once in the past, whereas
1.0% (37,649 out of 36,36,596) were
convicted twice and only 0.4% (14,143 out of
36,36,596) were convicted three times or
more.
State/UT-wise analysis of percentage
of recidivists reveal that majority of recidivists
were reported by Sikkim accounting for 71.8%
(573 out of 798) of total arrestees, followed by
Lakshadweep (48.3%), Chandigarh (44.5%),
Jharkhand (35.5%), Tripura (28.6%) and
Mizoram (25.9%).
6.7% (2,44,364 out of 36,36,596) of
total arrestees were those who were convicted
once in the past. Sikkim Followed by
Chandigarh, Lakshadweep and Tripura have
reported majority of such arrestees, they
accounted for 71.2%, 36.1%, 34.5% and
28.2% of their respective total arrestees during
2015.
1.0% (37,649 out of 36,36,596) of total
arrestees were convicted twice in the past.
Lakshadweep followed by Jharkhand
accounted for 13.8% and 11.2% of their
respective total arrestees during 2015.
0.4% (14,143 out of 36,36,596) were
habitual offenders i.e., they were convicted
thrice or more in the past. Jharkhand followed
by Chandigarh and Mizoram accounting for
4.5%, 2.4% and 2.1% of their respective total
arrestees as habitual offenders during 2015.
Trend & patterns of recidivism reported
during 2011 – 2015 is depicted in Table –
11(A).
Table-11 (A)
Category of Recidivists Arrested during
2011 - 2015
Sl.
No. Year
Number of Recidivists Convicted
in the Past
Once Twice Thrice or
More
1 2011 1,58,605 41,791 15,793
2 2012 1,75,046 36,710 14,973
3 2013 1,95,183 44,171 14,144
4 2014 2,34,896 47,884 12,960
5 2015 2,44,364 37,649 14,143
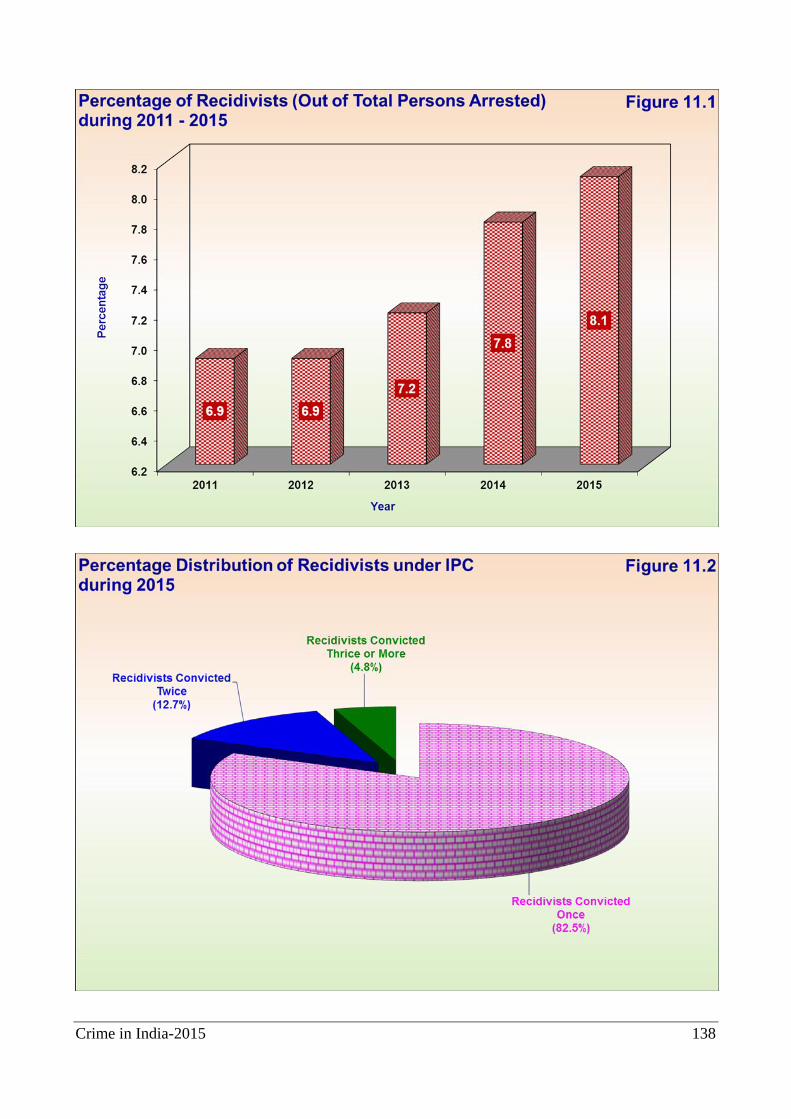
Crime in India-2015 138
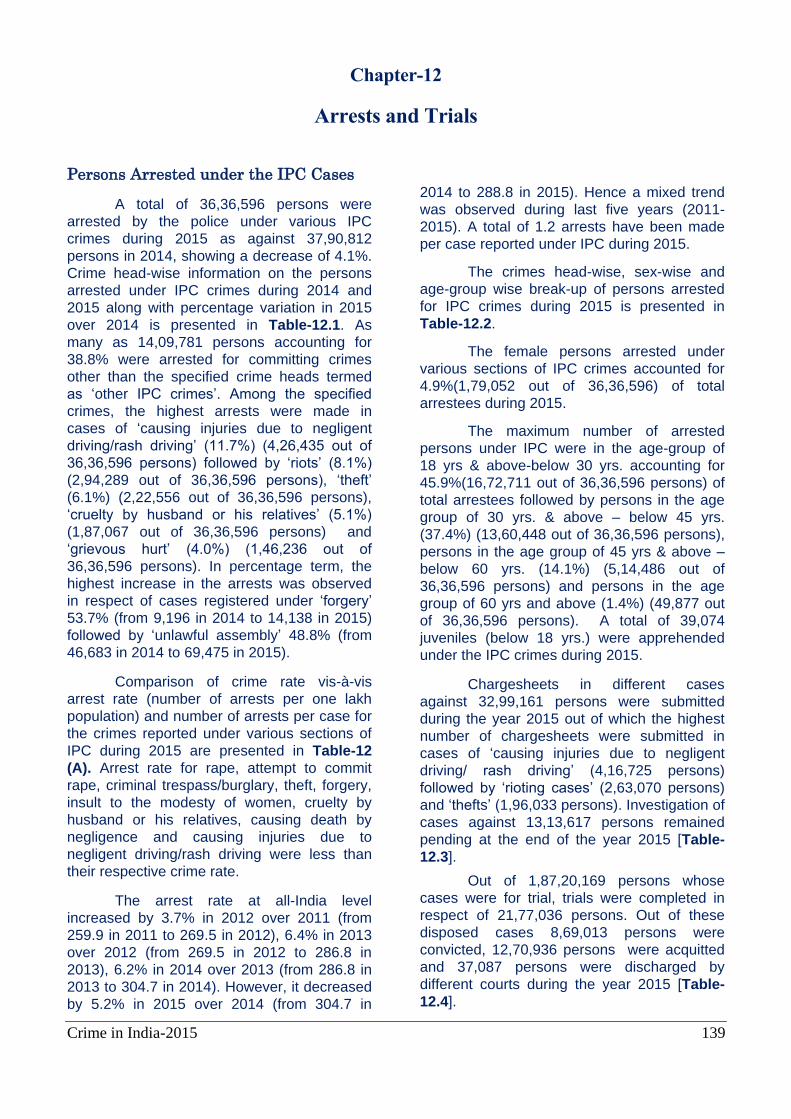
Crime in India-2015 139
Chapter-12
Arrests and Trials
Persons Arrested under the IPC Cases
A total of 36,36,596 persons were
arrested by the police under various IPC
crimes during 2015 as against 37,90,812
persons in 2014, showing a decrease of 4.1%.
Crime head-wise information on the persons
arrested under IPC crimes during 2014 and
2015 along with percentage variation in 2015
over 2014 is presented in Table-12.1. As
many as 14,09,781 persons accounting for
38.8% were arrested for committing crimes
other than the specified crime heads termed
as ‘other IPC crimes’. Among the specified
crimes, the highest arrests were made in
cases of ‘causing injuries due to negligent
driving/rash driving’ (11.7%) (4,26,435 out of
36,36,596 persons) followed by ‘riots’ (8.1%)
(2,94,289 out of 36,36,596 persons), ‘theft’
(6.1%) (2,22,556 out of 36,36,596 persons),
‘cruelty by husband or his relatives’ (5.1%)
(1,87,067 out of 36,36,596 persons) and
‘grievous hurt’ (4.0%) (1,46,236 out of
36,36,596 persons). In percentage term, the
highest increase in the arrests was observed
in respect of cases registered under ‘forgery’
53.7% (from 9,196 in 2014 to 14,138 in 2015)
followed by ‘unlawful assembly’ 48.8% (from
46,683 in 2014 to 69,475 in 2015).
Comparison of crime rate vis-à-vis
arrest rate (number of arrests per one lakh
population) and number of arrests per case for
the crimes reported under various sections of
IPC during 2015 are presented in Table-12
(A). Arrest rate for rape, attempt to commit
rape, criminal trespass/burglary, theft, forgery,
insult to the modesty of women, cruelty by
husband or his relatives, causing death by
negligence and causing injuries due to
negligent driving/rash driving were less than
their respective crime rate.
The arrest rate at all-India level
increased by 3.7% in 2012 over 2011 (from
259.9 in 2011 to 269.5 in 2012), 6.4% in 2013
over 2012 (from 269.5 in 2012 to 286.8 in
2013), 6.2% in 2014 over 2013 (from 286.8 in
2013 to 304.7 in 2014). However, it decreased
by 5.2% in 2015 over 2014 (from 304.7 in
2014 to 288.8 in 2015). Hence a mixed trend
was observed during last five years (2011-
2015). A total of 1.2 arrests have been made
per case reported under IPC during 2015.
The crimes head-wise, sex-wise and
age-group wise break-up of persons arrested
for IPC crimes during 2015 is presented in
Table-12.2.
The female persons arrested under
various sections of IPC crimes accounted for
4.9%(1,79,052 out of 36,36,596) of total
arrestees during 2015.
The maximum number of arrested
persons under IPC were in the age-group of
18 yrs & above-below 30 yrs. accounting for
45.9%(16,72,711 out of 36,36,596 persons) of
total arrestees followed by persons in the age
group of 30 yrs. & above – below 45 yrs.
(37.4%) (13,60,448 out of 36,36,596 persons),
persons in the age group of 45 yrs & above –
below 60 yrs. (14.1%) (5,14,486 out of
36,36,596 persons) and persons in the age
group of 60 yrs and above (1.4%) (49,877 out
of 36,36,596 persons). A total of 39,074
juveniles (below 18 yrs.) were apprehended
under the IPC crimes during 2015. Chargesheets in different cases
against 32,99,161 persons were submitted
during the year 2015 out of which the highest
number of chargesheets were submitted in
cases of ‘causing injuries due to negligent
driving/ rash driving’ (4,16,725 persons)
followed by ‘rioting cases’ (2,63,070 persons)
and ‘thefts’ (1,96,033 persons). Investigation of
cases against 13,13,617 persons remained
pending at the end of the year 2015 [Table-
12.3].
Out of 1,87,20,169 persons whose
cases were for trial, trials were completed in
respect of 21,77,036 persons. Out of these
disposed cases 8,69,013 persons were
convicted, 12,70,936 persons were acquitted
and 37,087 persons were discharged by
different courts during the year 2015 [Table-
12.4].
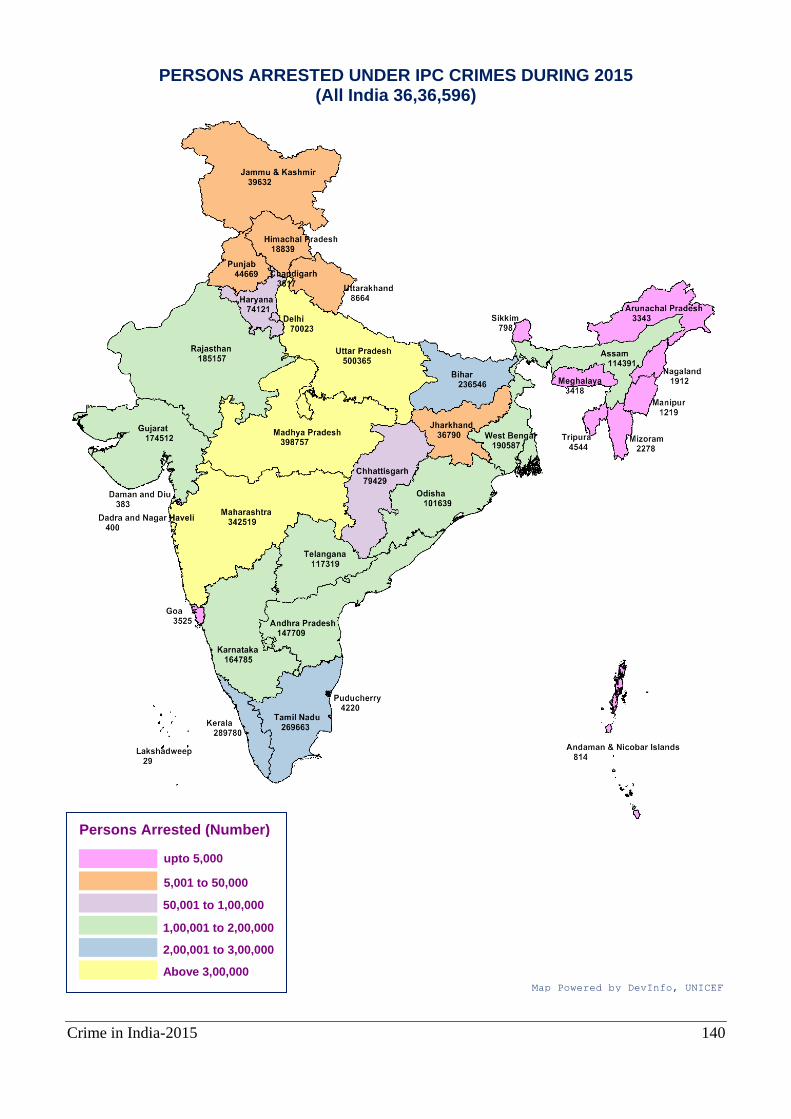
Crime in India-2015 140
PERSONS ARRESTED UNDER IPC CRIMES DURING 2015 (All India 36,36,596)
Persons Arrested (Number)
upto 5,000
50,001 to 1,00,000
Above 3,00,000
Map Powered by DevInfo, UNICEF
5,001 to 50,000
1,00,001 to 2,00,000
2,00,001 to 3,00,000
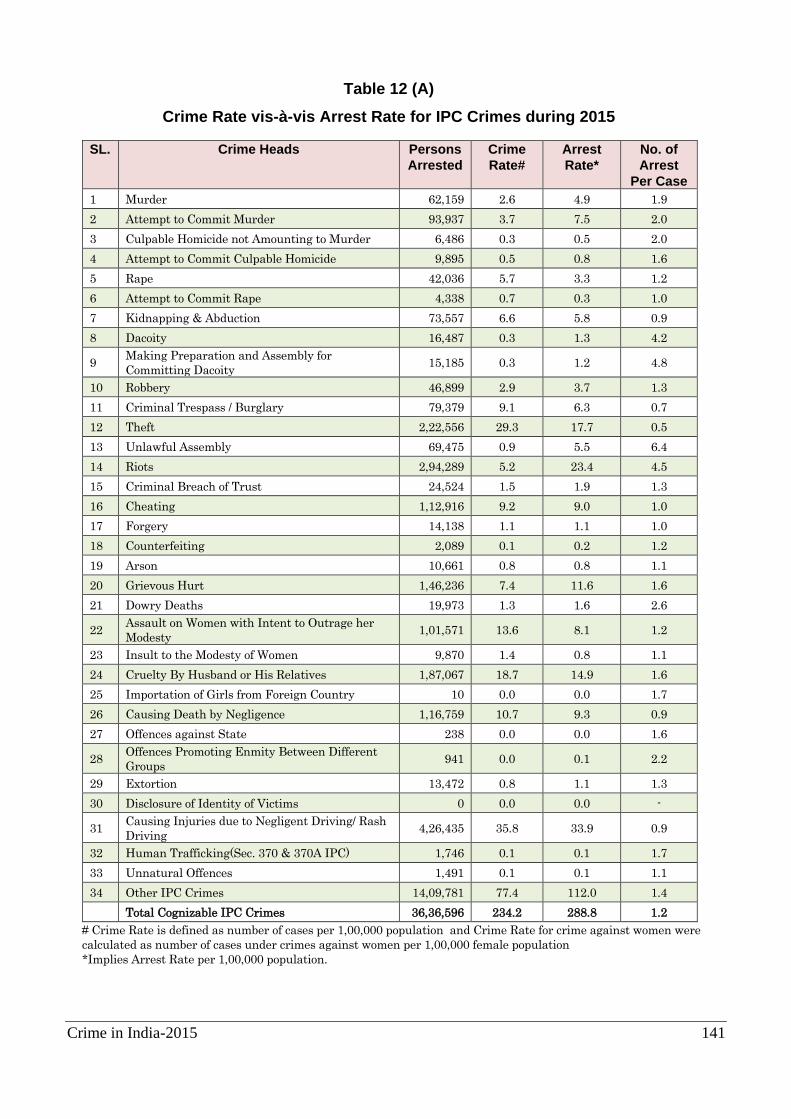
Crime in India-2015 141
Table 12 (A)
Crime Rate vis-à-vis Arrest Rate for IPC Crimes during 2015
SL. Crime Heads Persons
Arrested
Crime
Rate#
Arrest
Rate*
No. of
Arrest
Per Case
1 Murder 62,159 2.6 4.9 1.9
2 Attempt to Commit Murder 93,937 3.7 7.5 2.0
3 Culpable Homicide not Amounting to Murder 6,486 0.3 0.5 2.0
4 Attempt to Commit Culpable Homicide 9,895 0.5 0.8 1.6
5 Rape 42,036 5.7 3.3 1.2
6 Attempt to Commit Rape 4,338 0.7 0.3 1.0
7 Kidnapping & Abduction 73,557 6.6 5.8 0.9
8 Dacoity 16,487 0.3 1.3 4.2
9 Making Preparation and Assembly for
Committing Dacoity 15,185 0.3 1.2 4.8
10 Robbery 46,899 2.9 3.7 1.3
11 Criminal Trespass / Burglary 79,379 9.1 6.3 0.7
12 Theft 2,22,556 29.3 17.7 0.5
13 Unlawful Assembly 69,475 0.9 5.5 6.4
14 Riots 2,94,289 5.2 23.4 4.5
15 Criminal Breach of Trust 24,524 1.5 1.9 1.3
16 Cheating 1,12,916 9.2 9.0 1.0
17 Forgery 14,138 1.1 1.1 1.0
18 Counterfeiting 2,089 0.1 0.2 1.2
19 Arson 10,661 0.8 0.8 1.1
20 Grievous Hurt 1,46,236 7.4 11.6 1.6
21 Dowry Deaths 19,973 1.3 1.6 2.6
22 Assault on Women with Intent to Outrage her
Modesty 1,01,571 13.6 8.1 1.2
23 Insult to the Modesty of Women 9,870 1.4 0.8 1.1
24 Cruelty By Husband or His Relatives 1,87,067 18.7 14.9 1.6
25 Importation of Girls from Foreign Country 10 0.0 0.0 1.7
26 Causing Death by Negligence 1,16,759 10.7 9.3 0.9
27 Offences against State 238 0.0 0.0 1.6
28 Offences Promoting Enmity Between Different
Groups 941 0.0 0.1 2.2
29 Extortion 13,472 0.8 1.1 1.3
30 Disclosure of Identity of Victims 0 0.0 0.0 -
31 Causing Injuries due to Negligent Driving/ Rash
Driving 4,26,435 35.8 33.9 0.9
32 Human Trafficking(Sec. 370 & 370A IPC) 1,746 0.1 0.1 1.7
33 Unnatural Offences 1,491 0.1 0.1 1.1
34 Other IPC Crimes 14,09,781 77.4 112.0 1.4
Total Cognizable IPC Crimes 36,36,596 234.2 288.8 1.2
# Crime Rate is defined as number of cases per 1,00,000 population and Crime Rate for crime against women were
calculated as number of cases under crimes against women per 1,00,000 female population
*Implies Arrest Rate per 1,00,000 population.
Crime in India-2015 142
ARREST RATE UNDER IPC CRIMES DURING 2015 (All India 288.8)
Arrest Rate
upto 150.0
200.1 to 250.0
Above 350.0 Map Powered by DevInfo, UNICEF
150.1 to 200.0
250.1 to 300.0
300.1 to 350.0
Note:
Arrest Rate means number of persons arrested under IPC
crimes per 1,00,000 population.
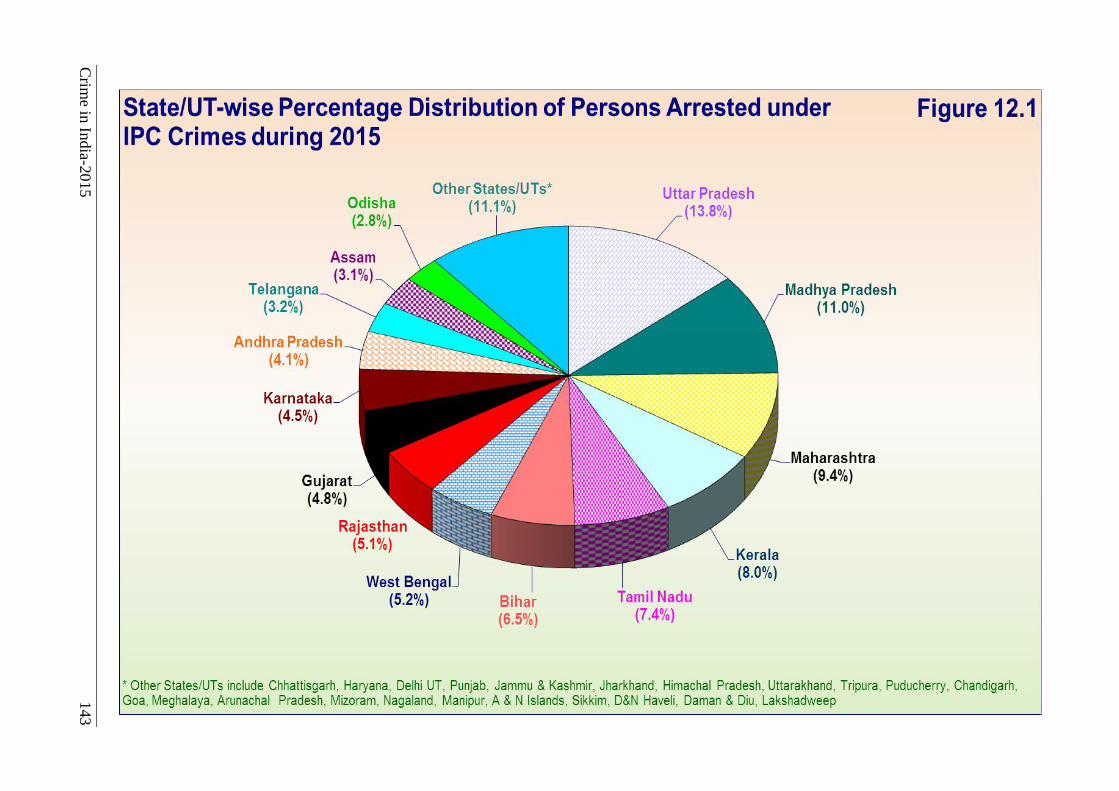
Crim
e in In
dia-2
015
143
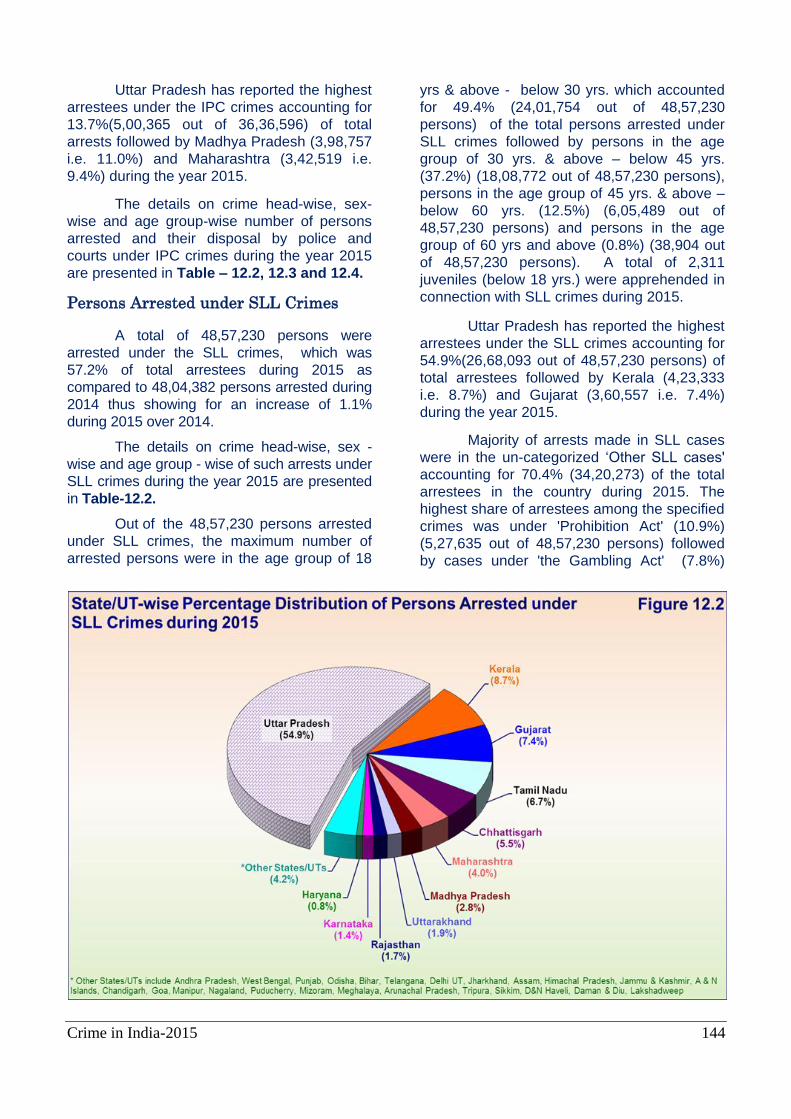
Crime in India-2015 144
Uttar Pradesh has reported the highest
arrestees under the IPC crimes accounting for
13.7%(5,00,365 out of 36,36,596) of total
arrests followed by Madhya Pradesh (3,98,757
i.e. 11.0%) and Maharashtra (3,42,519 i.e.
9.4%) during the year 2015.
The details on crime head-wise, sex-
wise and age group-wise number of persons
arrested and their disposal by police and
courts under IPC crimes during the year 2015
are presented in Table – 12.2, 12.3 and 12.4.
Persons Arrested under SLL Crimes
A total of 48,57,230 persons were
arrested under the SLL crimes, which was
57.2% of total arrestees during 2015 as
compared to 48,04,382 persons arrested during
2014 thus showing for an increase of 1.1%
during 2015 over 2014.
The details on crime head-wise, sex -
wise and age group - wise of such arrests under
SLL crimes during the year 2015 are presented
in Table-12.2.
Out of the 48,57,230 persons arrested
under SLL crimes, the maximum number of
arrested persons were in the age group of 18
yrs & above - below 30 yrs. which accounted
for 49.4% (24,01,754 out of 48,57,230
persons) of the total persons arrested under
SLL crimes followed by persons in the age
group of 30 yrs. & above – below 45 yrs.
(37.2%) (18,08,772 out of 48,57,230 persons),
persons in the age group of 45 yrs. & above –
below 60 yrs. (12.5%) (6,05,489 out of
48,57,230 persons) and persons in the age
group of 60 yrs and above (0.8%) (38,904 out
of 48,57,230 persons). A total of 2,311
juveniles (below 18 yrs.) were apprehended in
connection with SLL crimes during 2015.
Uttar Pradesh has reported the highest
arrestees under the SLL crimes accounting for
54.9%(26,68,093 out of 48,57,230 persons) of
total arrestees followed by Kerala (4,23,333
i.e. 8.7%) and Gujarat (3,60,557 i.e. 7.4%)
during the year 2015.
Majority of arrests made in SLL cases
were in the un-categorized ‘Other SLL cases'
accounting for 70.4% (34,20,273) of the total
arrestees in the country during 2015. The
highest share of arrestees among the specified
crimes was under 'Prohibition Act' (10.9%)
(5,27,635 out of 48,57,230 persons) followed
by cases under 'the Gambling Act' (7.8%)
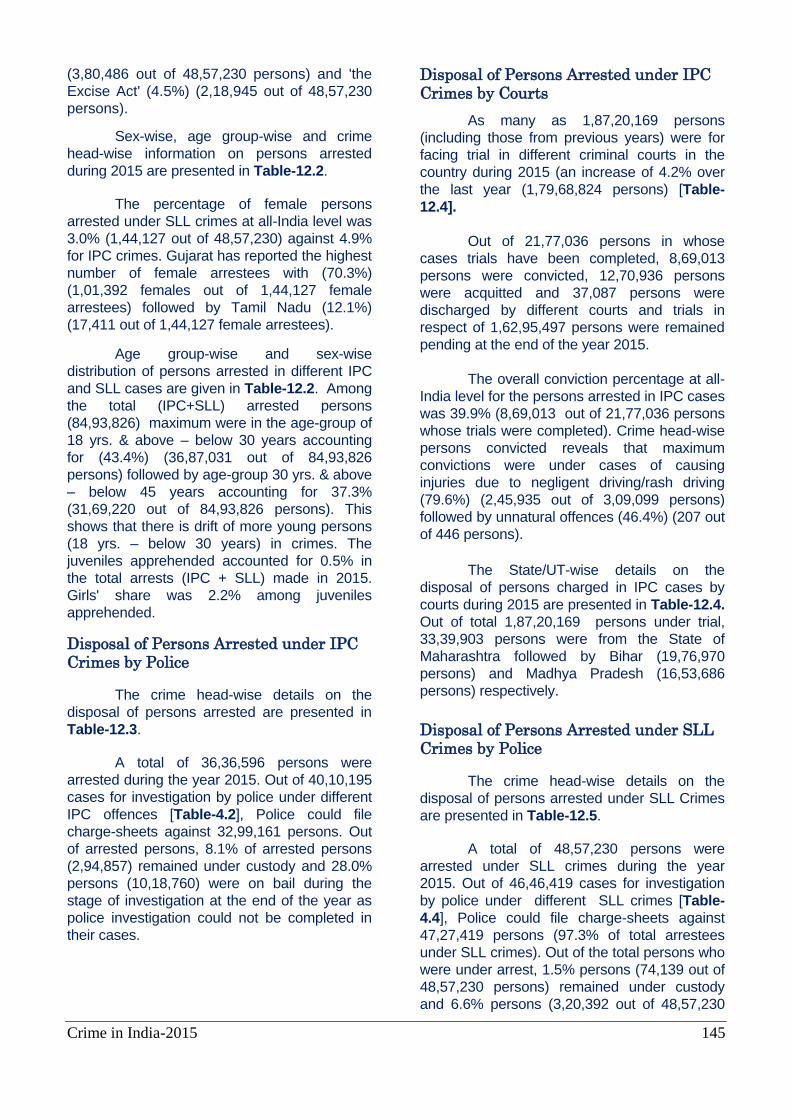
Crime in India-2015 145
(3,80,486 out of 48,57,230 persons) and 'the
Excise Act' (4.5%) (2,18,945 out of 48,57,230
persons).
Sex-wise, age group-wise and crime
head-wise information on persons arrested
during 2015 are presented in Table-12.2.
The percentage of female persons
arrested under SLL crimes at all-India level was
3.0% (1,44,127 out of 48,57,230) against 4.9%
for IPC crimes. Gujarat has reported the highest
number of female arrestees with (70.3%)
(1,01,392 females out of 1,44,127 female
arrestees) followed by Tamil Nadu (12.1%)
(17,411 out of 1,44,127 female arrestees).
Age group-wise and sex-wise
distribution of persons arrested in different IPC
and SLL cases are given in Table-12.2. Among
the total (IPC+SLL) arrested persons
(84,93,826) maximum were in the age-group of
18 yrs. & above – below 30 years accounting
for (43.4%) (36,87,031 out of 84,93,826
persons) followed by age-group 30 yrs. & above
– below 45 years accounting for 37.3%
(31,69,220 out of 84,93,826 persons). This
shows that there is drift of more young persons
(18 yrs. – below 30 years) in crimes. The
juveniles apprehended accounted for 0.5% in
the total arrests (IPC + SLL) made in 2015.
Girls' share was 2.2% among juveniles
apprehended.
Disposal of Persons Arrested under IPC Crimes by Police
The crime head-wise details on the
disposal of persons arrested are presented in
Table-12.3.
A total of 36,36,596 persons were
arrested during the year 2015. Out of 40,10,195
cases for investigation by police under different
IPC offences [Table-4.2], Police could file
charge-sheets against 32,99,161 persons. Out
of arrested persons, 8.1% of arrested persons
(2,94,857) remained under custody and 28.0%
persons (10,18,760) were on bail during the
stage of investigation at the end of the year as
police investigation could not be completed in
their cases.
Disposal of Persons Arrested under IPC Crimes by Courts
As many as 1,87,20,169 persons
(including those from previous years) were for
facing trial in different criminal courts in the
country during 2015 (an increase of 4.2% over
the last year (1,79,68,824 persons) [Table-
12.4].
Out of 21,77,036 persons in whose
cases trials have been completed, 8,69,013
persons were convicted, 12,70,936 persons
were acquitted and 37,087 persons were
discharged by different courts and trials in
respect of 1,62,95,497 persons were remained
pending at the end of the year 2015.
The overall conviction percentage at all-
India level for the persons arrested in IPC cases
was 39.9% (8,69,013 out of 21,77,036 persons
whose trials were completed). Crime head-wise
persons convicted reveals that maximum
convictions were under cases of causing
injuries due to negligent driving/rash driving
(79.6%) (2,45,935 out of 3,09,099 persons)
followed by unnatural offences (46.4%) (207 out
of 446 persons).
The State/UT-wise details on the
disposal of persons charged in IPC cases by
courts during 2015 are presented in Table-12.4.
Out of total 1,87,20,169 persons under trial,
33,39,903 persons were from the State of
Maharashtra followed by Bihar (19,76,970
persons) and Madhya Pradesh (16,53,686
persons) respectively.
Disposal of Persons Arrested under SLL Crimes by Police
The crime head-wise details on the
disposal of persons arrested under SLL Crimes
are presented in Table-12.5.
A total of 48,57,230 persons were
arrested under SLL crimes during the year
2015. Out of 46,46,419 cases for investigation
by police under different SLL crimes [Table-
4.4], Police could file charge-sheets against
47,27,419 persons (97.3% of total arrestees
under SLL crimes). Out of the total persons who
were under arrest, 1.5% persons (74,139 out of
48,57,230 persons) remained under custody
and 6.6% persons (3,20,392 out of 48,57,230
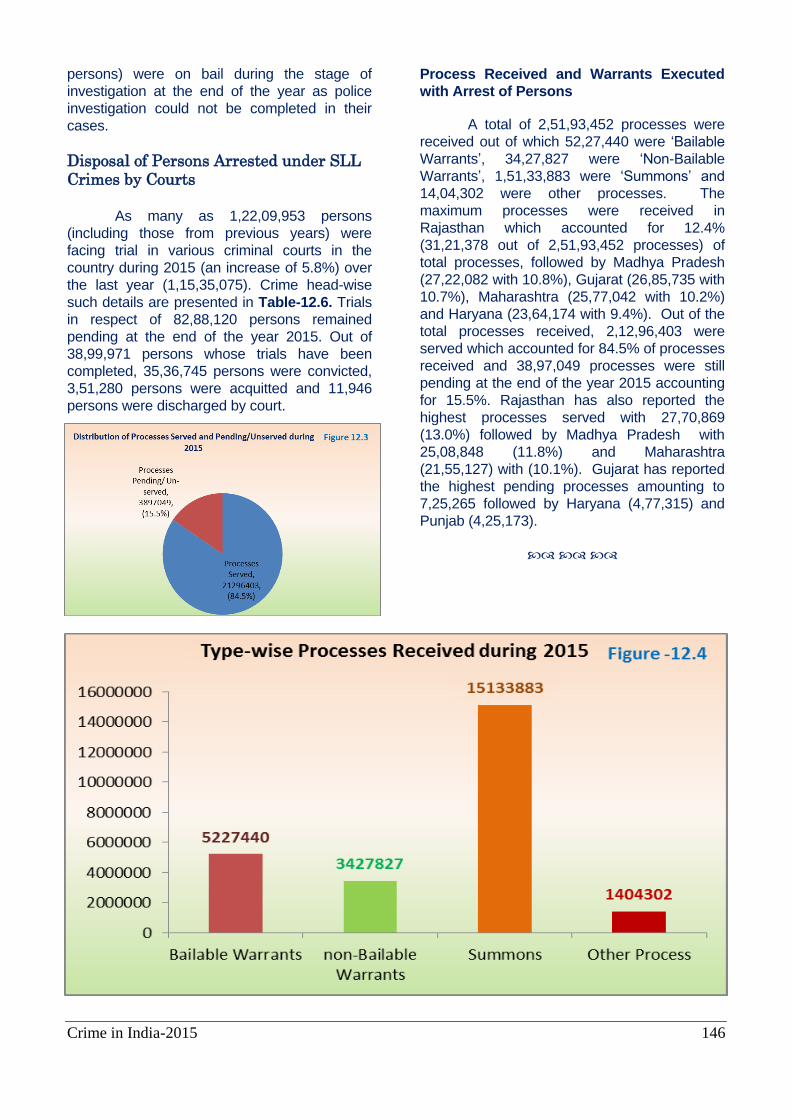
Crime in India-2015 146
persons) were on bail during the stage of
investigation at the end of the year as police
investigation could not be completed in their
cases.
Disposal of Persons Arrested under SLL Crimes by Courts As many as 1,22,09,953 persons
(including those from previous years) were
facing trial in various criminal courts in the
country during 2015 (an increase of 5.8%) over
the last year (1,15,35,075). Crime head-wise
such details are presented in Table-12.6. Trials
in respect of 82,88,120 persons remained
pending at the end of the year 2015. Out of
38,99,971 persons whose trials have been
completed, 35,36,745 persons were convicted,
3,51,280 persons were acquitted and 11,946
persons were discharged by court.
Process Received and Warrants Executed
with Arrest of Persons
A total of 2,51,93,452 processes were
received out of which 52,27,440 were ‘Bailable
Warrants’, 34,27,827 were ‘Non-Bailable
Warrants’, 1,51,33,883 were ‘Summons’ and
14,04,302 were other processes. The
maximum processes were received in
Rajasthan which accounted for 12.4%
(31,21,378 out of 2,51,93,452 processes) of
total processes, followed by Madhya Pradesh
(27,22,082 with 10.8%), Gujarat (26,85,735 with
10.7%), Maharashtra (25,77,042 with 10.2%)
and Haryana (23,64,174 with 9.4%). Out of the
total processes received, 2,12,96,403 were
served which accounted for 84.5% of processes
received and 38,97,049 processes were still
pending at the end of the year 2015 accounting
for 15.5%. Rajasthan has also reported the
highest processes served with 27,70,869
(13.0%) followed by Madhya Pradesh with
25,08,848 (11.8%) and Maharashtra
(21,55,127) with (10.1%). Gujarat has reported
the highest pending processes amounting to
7,25,265 followed by Haryana (4,77,315) and
Punjab (4,25,173).
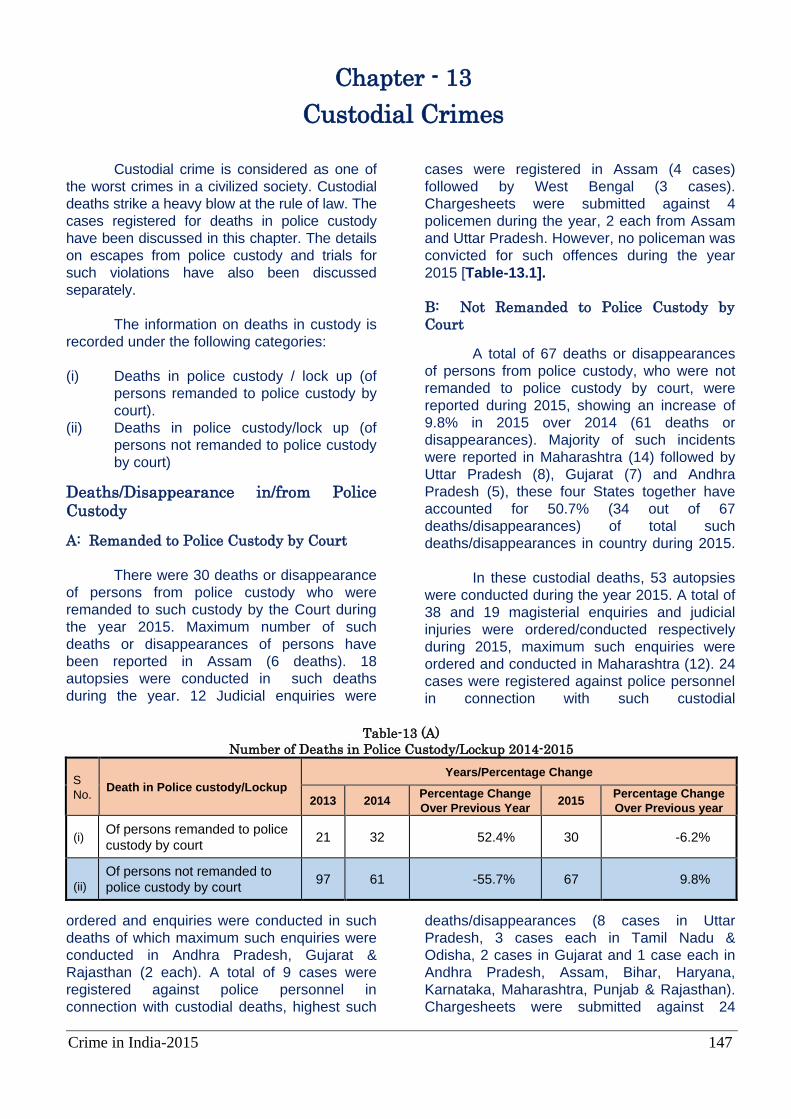
Crime in India-2015 147
Chapter - 13
Custodial Crimes
Custodial crime is considered as one of
the worst crimes in a civilized society. Custodial
deaths strike a heavy blow at the rule of law. The
cases registered for deaths in police custody
have been discussed in this chapter. The details
on escapes from police custody and trials for
such violations have also been discussed
separately.
The information on deaths in custody is
recorded under the following categories:
(i) Deaths in police custody / lock up (of
persons remanded to police custody by
court).
(ii) Deaths in police custody/lock up (of
persons not remanded to police custody
by court)
Deaths/Disappearance in/from Police Custody
A: Remanded to Police Custody by Court
There were 30 deaths or disappearance
of persons from police custody who were
remanded to such custody by the Court during
the year 2015. Maximum number of such
deaths or disappearances of persons have
been reported in Assam (6 deaths). 18
autopsies were conducted in such deaths
during the year. 12 Judicial enquiries were
ordered and enquiries were conducted in such
deaths of which maximum such enquiries were
conducted in Andhra Pradesh, Gujarat &
Rajasthan (2 each). A total of 9 cases were
registered against police personnel in
connection with custodial deaths, highest such
cases were registered in Assam (4 cases)
followed by West Bengal (3 cases).
Chargesheets were submitted against 4
policemen during the year, 2 each from Assam
and Uttar Pradesh. However, no policeman was
convicted for such offences during the year
2015 [Table-13.1].
B: Not Remanded to Police Custody by
Court
A total of 67 deaths or disappearances
of persons from police custody, who were not
remanded to police custody by court, were
reported during 2015, showing an increase of
9.8% in 2015 over 2014 (61 deaths or
disappearances). Majority of such incidents
were reported in Maharashtra (14) followed by
Uttar Pradesh (8), Gujarat (7) and Andhra
Pradesh (5), these four States together have
accounted for 50.7% (34 out of 67
deaths/disappearances) of total such
deaths/disappearances in country during 2015.
In these custodial deaths, 53 autopsies
were conducted during the year 2015. A total of
38 and 19 magisterial enquiries and judicial
injuries were ordered/conducted respectively
during 2015, maximum such enquiries were
ordered and conducted in Maharashtra (12). 24
cases were registered against police personnel
in connection with such custodial
deaths/disappearances (8 cases in Uttar
Pradesh, 3 cases each in Tamil Nadu &
Odisha, 2 cases in Gujarat and 1 case each in
Andhra Pradesh, Assam, Bihar, Haryana,
Karnataka, Maharashtra, Punjab & Rajasthan).
Chargesheets were submitted against 24
Table-13 (A)
Number of Deaths in Police Custody/Lockup 2014-2015
S
No. Death in Police custody/Lockup
Years/Percentage Change
2013 2014 Percentage Change
Over Previous Year 2015
Percentage Change
Over Previous year
(i) Of persons remanded to police
custody by court 21 32 52.4% 30 -6.2%
(ii)
Of persons not remanded to
police custody by court 97 61 -55.7% 67 9.8%
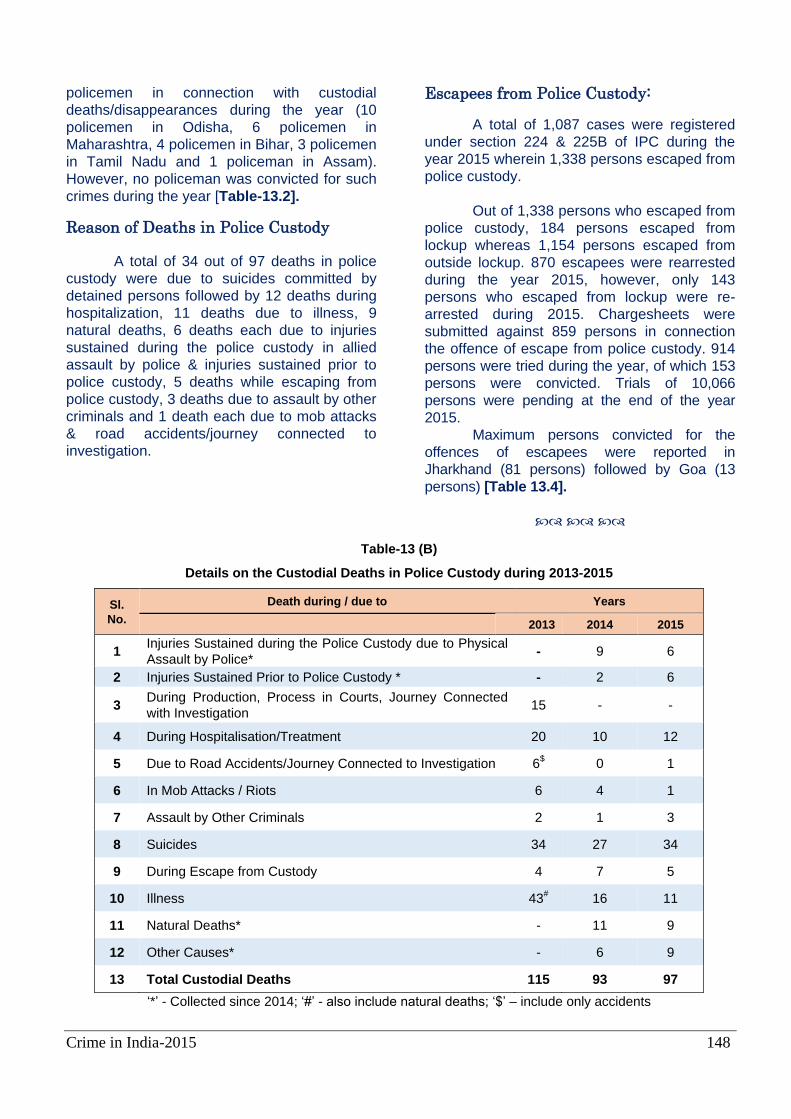
Crime in India-2015 148
policemen in connection with custodial
deaths/disappearances during the year (10
policemen in Odisha, 6 policemen in
Maharashtra, 4 policemen in Bihar, 3 policemen
in Tamil Nadu and 1 policeman in Assam).
However, no policeman was convicted for such
crimes during the year [Table-13.2].
Reason of Deaths in Police Custody
A total of 34 out of 97 deaths in police
custody were due to suicides committed by
detained persons followed by 12 deaths during
hospitalization, 11 deaths due to illness, 9
natural deaths, 6 deaths each due to injuries
sustained during the police custody in allied
assault by police & injuries sustained prior to
police custody, 5 deaths while escaping from
police custody, 3 deaths due to assault by other
criminals and 1 death each due to mob attacks
& road accidents/journey connected to
investigation.
Escapees from Police Custody:
A total of 1,087 cases were registered
under section 224 & 225B of IPC during the
year 2015 wherein 1,338 persons escaped from
police custody.
Out of 1,338 persons who escaped from
police custody, 184 persons escaped from
lockup whereas 1,154 persons escaped from
outside lockup. 870 escapees were rearrested
during the year 2015, however, only 143
persons who escaped from lockup were re-
arrested during 2015. Chargesheets were
submitted against 859 persons in connection
the offence of escape from police custody. 914
persons were tried during the year, of which 153
persons were convicted. Trials of 10,066
persons were pending at the end of the year
2015.
Maximum persons convicted for the
offences of escapees were reported in
Jharkhand (81 persons) followed by Goa (13
persons) [Table 13.4].
Table-13 (B)
Details on the Custodial Deaths in Police Custody during 2013-2015
Sl.
No.
Death during / due to Years
2013 2014 2015
1 Injuries Sustained during the Police Custody due to Physical
Assault by Police* - 9 6
2 Injuries Sustained Prior to Police Custody * - 2 6
3 During Production, Process in Courts, Journey Connected
with Investigation 15 - -
4 During Hospitalisation/Treatment 20 10 12
5 Due to Road Accidents/Journey Connected to Investigation 6$ 0 1
6 In Mob Attacks / Riots 6 4 1
7 Assault by Other Criminals 2 1 3
8 Suicides 34 27 34
9 During Escape from Custody 4 7 5
10 Illness 43# 16 11
11 Natural Deaths* - 11 9
12 Other Causes* - 6 9
13 Total Custodial Deaths 115 93 97
‘*’ - Collected since 2014; ‘#’ - also include natural deaths; ‘$’ – include only accidents
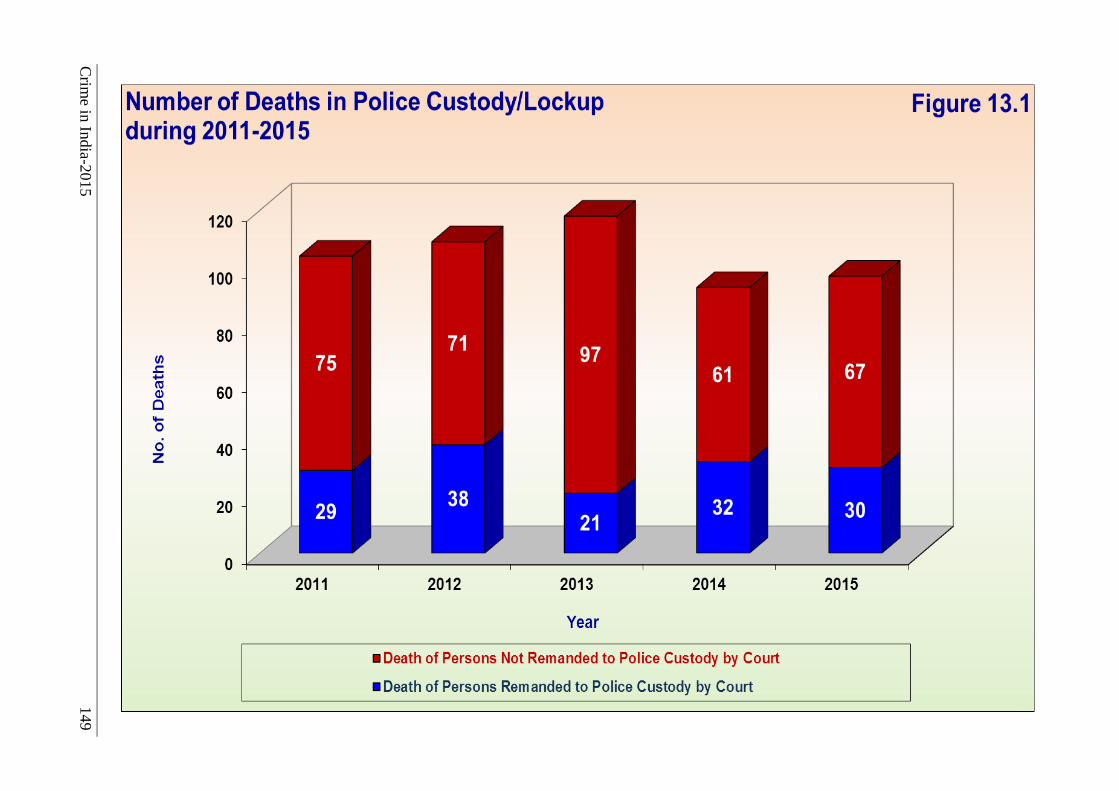
Crim
e in In
dia-2
015
149
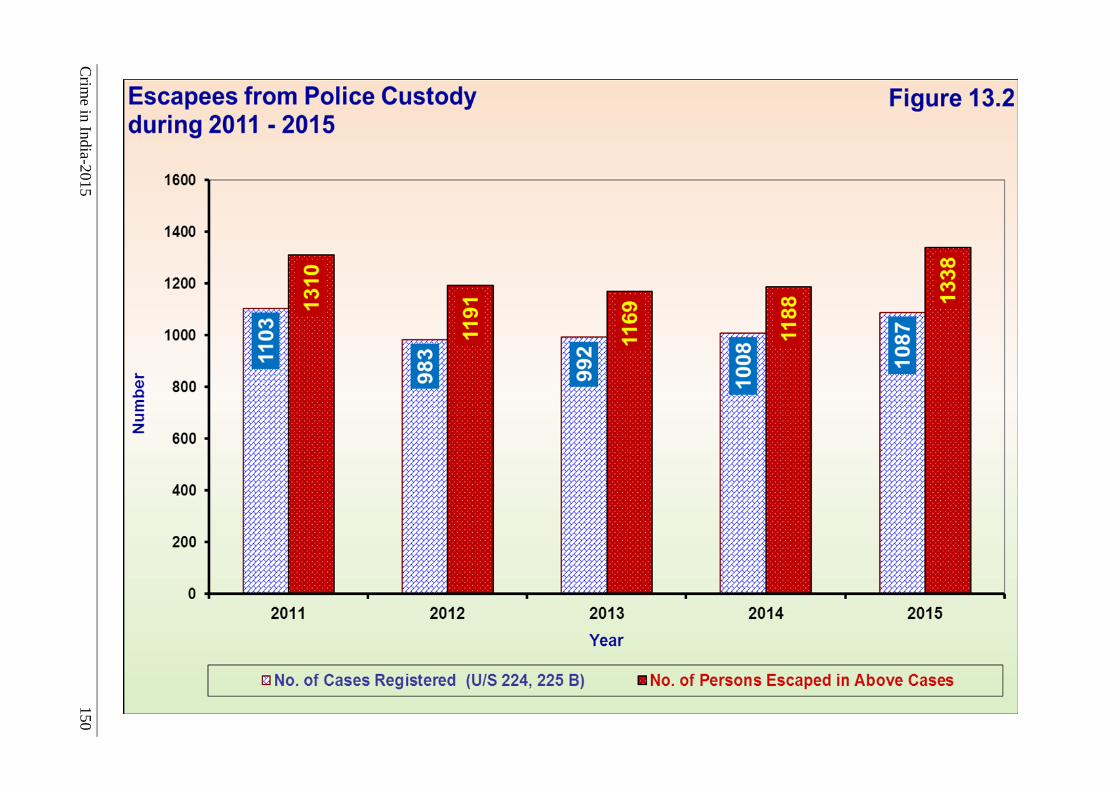
Crim
e in In
dia-2
015
150
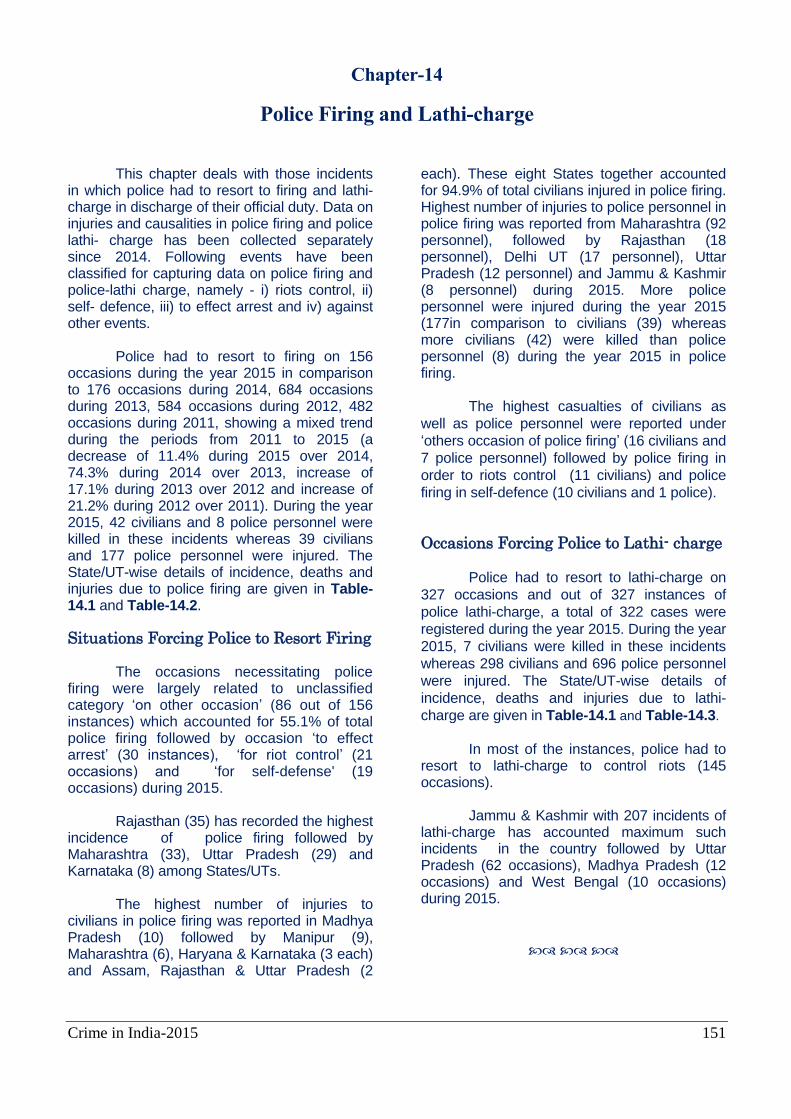
Crime in India-2015 151
Chapter-14
Police Firing and Lathi-charge
This chapter deals with those incidents in which police had to resort to firing and lathi- charge in discharge of their official duty. Data on injuries and causalities in police firing and police lathi- charge has been collected separately since 2014. Following events have been classified for capturing data on police firing and police-lathi charge, namely - i) riots control, ii) self- defence, iii) to effect arrest and iv) against other events. Police had to resort to firing on 156 occasions during the year 2015 in comparison to 176 occasions during 2014, 684 occasions during 2013, 584 occasions during 2012, 482 occasions during 2011, showing a mixed trend during the periods from 2011 to 2015 (a decrease of 11.4% during 2015 over 2014, 74.3% during 2014 over 2013, increase of 17.1% during 2013 over 2012 and increase of 21.2% during 2012 over 2011). During the year 2015, 42 civilians and 8 police personnel were killed in these incidents whereas 39 civilians and 177 police personnel were injured. The State/UT-wise details of incidence, deaths and injuries due to police firing are given in Table-14.1 and Table-14.2. Situations Forcing Police to Resort Firing The occasions necessitating police firing were largely related to unclassified category ‘on other occasion’ (86 out of 156 instances) which accounted for 55.1% of total police firing followed by occasion ‘to effect arrest’ (30 instances), ‘for riot control’ (21 occasions) and ‘for self-defense' (19 occasions) during 2015. Rajasthan (35) has recorded the highest incidence of police firing followed by Maharashtra (33), Uttar Pradesh (29) and Karnataka (8) among States/UTs. The highest number of injuries to civilians in police firing was reported in Madhya Pradesh (10) followed by Manipur (9), Maharashtra (6), Haryana & Karnataka (3 each) and Assam, Rajasthan & Uttar Pradesh (2
each). These eight States together accounted for 94.9% of total civilians injured in police firing. Highest number of injuries to police personnel in police firing was reported from Maharashtra (92 personnel), followed by Rajasthan (18 personnel), Delhi UT (17 personnel), Uttar Pradesh (12 personnel) and Jammu & Kashmir (8 personnel) during 2015. More police personnel were injured during the year 2015 (177in comparison to civilians (39) whereas more civilians (42) were killed than police personnel (8) during the year 2015 in police firing.
The highest casualties of civilians as
well as police personnel were reported under
‘others occasion of police firing’ (16 civilians and
7 police personnel) followed by police firing in
order to riots control (11 civilians) and police
firing in self-defence (10 civilians and 1 police).
Occasions Forcing Police to Lathi- charge
Police had to resort to lathi-charge on
327 occasions and out of 327 instances of
police lathi-charge, a total of 322 cases were
registered during the year 2015. During the year
2015, 7 civilians were killed in these incidents
whereas 298 civilians and 696 police personnel
were injured. The State/UT-wise details of
incidence, deaths and injuries due to lathi-
charge are given in Table-14.1 and Table-14.3.
In most of the instances, police had to resort to lathi-charge to control riots (145 occasions). Jammu & Kashmir with 207 incidents of lathi-charge has accounted maximum such incidents in the country followed by Uttar Pradesh (62 occasions), Madhya Pradesh (12 occasions) and West Bengal (10 occasions) during 2015.
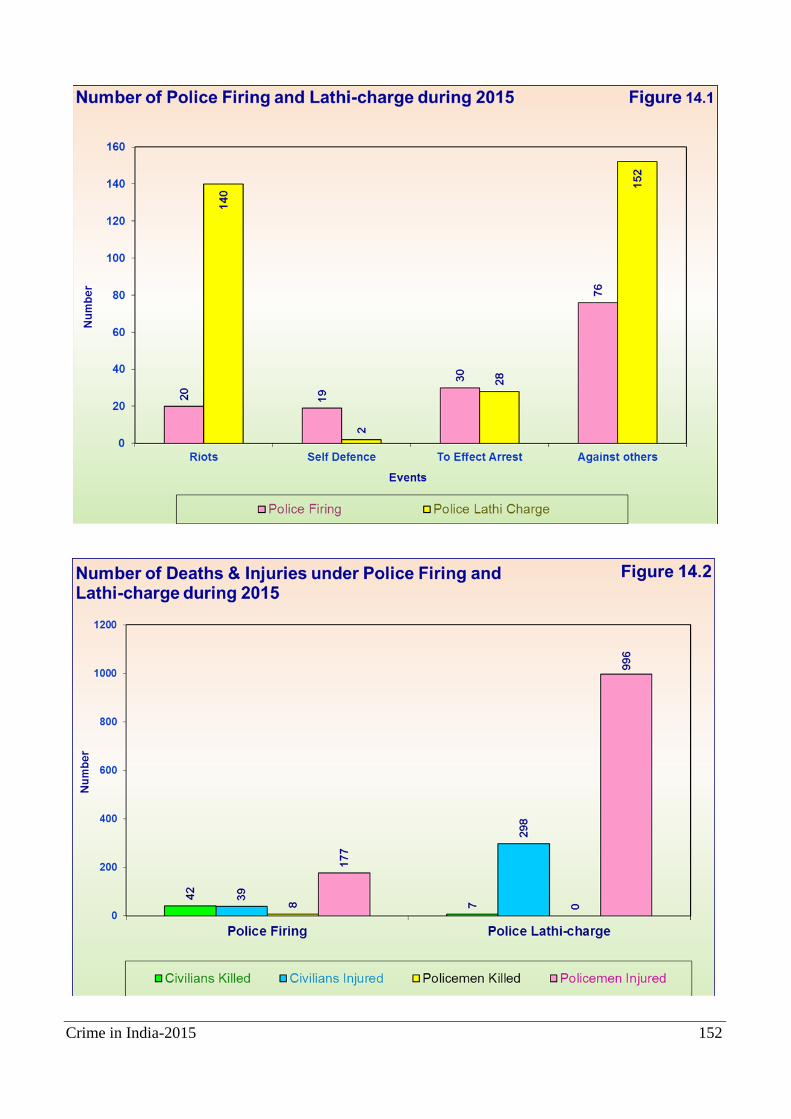
Crime in India-2015 152
Crime in India-2015 153
Chapter-15
Police and Civilians Casualties
A large number of policemen lose their lives or limbs while performing duty every year - fighting insurgents, militants and criminals or while controlling the mob in a law and order situation. Many times, civilians also have lost their lives or got injured in various incidents of riots, commission of crimes like robbery or dacoity, by terrorists/militants etc.
The State/UT - wise information relating to police personnel killed or injured on duty during 2015 is presented in Table-15.1 and 15.2 and the age group - wise natural deaths of police personnel and suicides committed by these personnel is given in Table-15.3. Since 2014, NCRB has also started collecting data on civilians killed or injured in various incidents like bomb explosion, by terrorists/extremists etc., which is presented in Table-15.4.
A total number of 3,260 police personnel died (2,356 due to natural deaths, 737 killed on duty and 167 suicidal deaths) during the year 2015 in comparison to 3,313 deaths in the year 2014, showing a decline of 1.6% over the previous year.
Police Personnel Killed on Duty
The casualties include civil as well as the armed police personnel of various States / UTs who sacrificed their lives while performing their duty. The police casualties (737) while on duty increased by 0.8% during 2015 as compared to previous year (731). Out of 737 police personnel killed on duty, 59.6%(439 out of 737) of total causalities of police personnel were reported in 6 States only namely Uttar Pradesh (152), Maharashtra (64), Gujarat (62), Haryana (57), Chhattisgarh (55) and Tamil Nadu (49). Majority of the police casualties (83.6%) (616 out of 737) were due to ‘accidents’ followed by deaths in attacks by other criminals and by deaths in 'anti-terrorist/ extremists operations' which accounted for 5.3% (39 out of 737) and 5.2% (38 out of 737) of such deaths respectively. 4.9% (36 out of 737) of police
personnel were killed in anti- Left Wing Extremists (LWE) Operations.
A total 616 police personnel were killed while on duty ‘in accidents’. Highest such casualties were reported from Uttar Pradesh (146 deaths) followed by Maharashtra & Gujarat (59 deaths each), Haryana (53 deaths) and Tamil Nadu (49 deaths) under this head during the year 2015. A total 39 police personnel were killed by ‘criminals’. Maximum such casualties were reported from Uttar Pradesh (6 out of 39). 38 causalities were reported in Anti Terrorist/Extremist operations from 7 States, the highest number of such casualties was in Chhattisgarh (9) and Jammu & Kashmir and Jharkhand (8 each). Anti-LWE Operations which accounted for 36 casualties were in 2 States only - 35 causalities from Chhattisgarh and 1 causality from Jharkhand.
Rank - wise analysis of police causalities reveals that out of 737 police personnel killed on duty, 5 were ‘Other Gazetted Officers”, 53 were upper subordinates (Inspectors - 3 and Sub-Inspectors - 50) and 679 were lower subordinates (Assistant Sub- Inspectors - 73, Head Constables -184 and Constables - 422). The details are given in Table-15.2.
Police Personnel Injured on Duty
3,486 police personnel of various ranks (3,222 from States and 264 from the Union Territories) sustained injuries while performing their duties during the year. State / UT-wise details of police personnel injured by type of duty/operation are given in Table-15.1.
Out of the total 3,486 police personnel injured on duty, 61.6% of total causalities of police personnel (2,148 out of 3,486) was reported in only 6 States namely Kerala (575), Jammu & Kashmir (456), Maharashtra (370), Tamil Nadu (276), Rajasthan (253) and Uttar Pradesh (218).
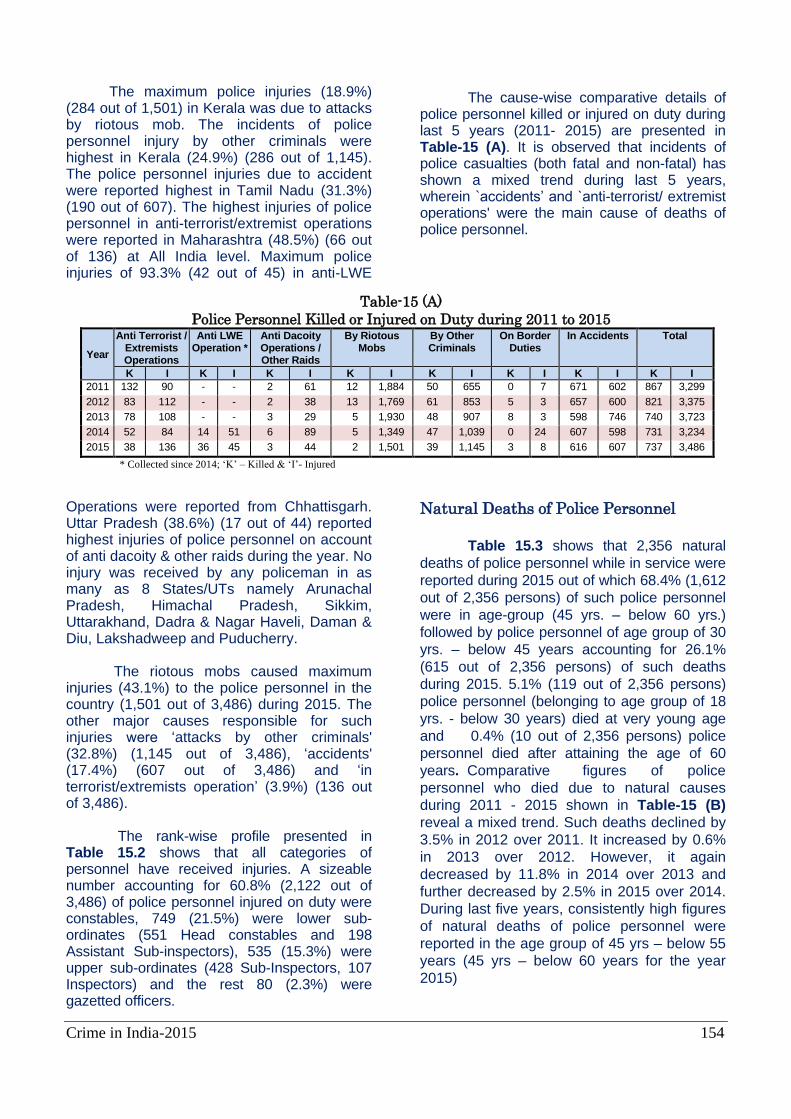
Crime in India-2015 154
Table-15 (A)
Police Personnel Killed or Injured on Duty during 2011 to 2015
Year
Anti Terrorist / Extremists Operations
Anti LWE Operation *
Anti Dacoity Operations / Other Raids
By Riotous Mobs
By Other Criminals
On Border Duties
In Accidents Total
K I K I K I K I K I K I K I K I
2011 132 90 - - 2 61 12 1,884 50 655 0 7 671 602 867 3,299
2012 83 112 - - 2 38 13 1,769 61 853 5 3 657 600 821 3,375
2013 78 108 - - 3 29 5 1,930 48 907 8 3 598 746 740 3,723
2014 52 84 14 51 6 89 5 1,349 47 1,039 0 24 607 598 731 3,234
2015 38 136 36 45 3 44 2 1,501 39 1,145 3 8 616 607 737 3,486
* Collected since 2014; ‘K’ – Killed & ‘I’- Injured
The maximum police injuries (18.9%) (284 out of 1,501) in Kerala was due to attacks by riotous mob. The incidents of police personnel injury by other criminals were highest in Kerala (24.9%) (286 out of 1,145). The police personnel injuries due to accident were reported highest in Tamil Nadu (31.3%) (190 out of 607). The highest injuries of police personnel in anti-terrorist/extremist operations were reported in Maharashtra (48.5%) (66 out of 136) at All India level. Maximum police injuries of 93.3% (42 out of 45) in anti-LWE
Operations were reported from Chhattisgarh. Uttar Pradesh (38.6%) (17 out of 44) reported highest injuries of police personnel on account of anti dacoity & other raids during the year. No injury was received by any policeman in as many as 8 States/UTs namely Arunachal Pradesh, Himachal Pradesh, Sikkim, Uttarakhand, Dadra & Nagar Haveli, Daman & Diu, Lakshadweep and Puducherry. The riotous mobs caused maximum injuries (43.1%) to the police personnel in the country (1,501 out of 3,486) during 2015. The other major causes responsible for such injuries were ‘attacks by other criminals' (32.8%) (1,145 out of 3,486), ‘accidents' (17.4%) (607 out of 3,486) and ‘in terrorist/extremists operation’ (3.9%) (136 out of 3,486). The rank-wise profile presented in Table 15.2 shows that all categories of personnel have received injuries. A sizeable number accounting for 60.8% (2,122 out of 3,486) of police personnel injured on duty were constables, 749 (21.5%) were lower sub-ordinates (551 Head constables and 198 Assistant Sub-inspectors), 535 (15.3%) were upper sub-ordinates (428 Sub-Inspectors, 107 Inspectors) and the rest 80 (2.3%) were gazetted officers.
The cause-wise comparative details of police personnel killed or injured on duty during last 5 years (2011- 2015) are presented in Table-15 (A). It is observed that incidents of police casualties (both fatal and non-fatal) has shown a mixed trend during last 5 years, wherein `accidents’ and `anti-terrorist/ extremist operations' were the main cause of deaths of police personnel.
Natural Deaths of Police Personnel
Table 15.3 shows that 2,356 natural
deaths of police personnel while in service were
reported during 2015 out of which 68.4% (1,612
out of 2,356 persons) of such police personnel
were in age-group (45 yrs. – below 60 yrs.)
followed by police personnel of age group of 30
yrs. – below 45 years accounting for 26.1%
(615 out of 2,356 persons) of such deaths
during 2015. 5.1% (119 out of 2,356 persons)
police personnel (belonging to age group of 18
yrs. - below 30 years) died at very young age
and 0.4% (10 out of 2,356 persons) police
personnel died after attaining the age of 60
years. Comparative figures of police
personnel who died due to natural causes
during 2011 - 2015 shown in Table-15 (B)
reveal a mixed trend. Such deaths declined by
3.5% in 2012 over 2011. It increased by 0.6%
in 2013 over 2012. However, it again
decreased by 11.8% in 2014 over 2013 and
further decreased by 2.5% in 2015 over 2014.
During last five years, consistently high figures
of natural deaths of police personnel were
reported in the age group of 45 yrs – below 55
years (45 yrs – below 60 years for the year
2015)
Crime in India-2015 155
Suicides Committed By Police Personnel
A total of 167 police personnel
committed suicide in the country during the year
2015. Tamil Nadu has reported the highest
number of such suicides accounting for
19.7%(33 out of 167 suicides) followed by
Maharashtra (25 suicides), Karnataka (15
suicides) and Chhattisgarh & Madhya Pradesh
(11 suicides each). Nearly 38.9% (65 out of 167
suicides) suicides at all-India level was reported
in the age group 30 yrs. & - below 45 years.
30.5% (51 out of 167 suicides), 29.9% (50
suicides) and 0.5% (1 suicide) of total suicides at
All India level were reported in age group of 18
yrs. -30 years, 45 yrs. - 60 years and 60 years &
above during 2015 respectively [Table-15.3].
Casualties of Civilians
A total of 48 civilians lost their lives in
different incidents like bomb explosion, riots,
border cross firing, etc. during 2015. Most of
causalities of civilians were reported in Jammu &
Kashmir (19 out of 48 persons) accounting for
39.5% of total such casualties followed by 10.4%
casualties in Chhattisgarh (5 persons), 8.3%
casualties in Manipur (4 persons) and 6.3%
casualties in Punjab & West Bengal (3 persons
each).
A total of 19 out of 48 civilians were killed
by terrorists/militants accounting for 39.5% of
total civilian casualties during 2015. Most of such
casualties were reported in Jammu & Kashmir
(18 civilians) followed by Manipur (1 civilian).
A total of 11 civilians were killed by
Naxalites/Left Wing Extremists (LWE) during
2015. The incidents of killing of civilians by
Naxalites or Left Wing Extremists(LWE) were
reported in four States namely Chhattisgarh (5
casualties), Punjab (3 casualties), Jharkhand (2
casualties) and Telangana (1 casualty) during
2015.
A total of 4 civilians (3 in Manipur and 1
in Jammu & Kashmir) lost their lives in bomb
explosion during 2015.
2 civilians each in Gujarat & Uttar
Pradesh and 1 civilian each in Maharashtra &
Rajasthan lost their lives in riots during 2015.
No casualty was reported during border
cross firing during 2015.
Injuries of Civilians
A total of 458 civilians got injured in
various incidents like bomb explosion, riots,
border cross firing etc. during 2015, wherein
maximum such injuries were reported in riots
(292 out of 458 injuries) accounting for 63.8% of
total civilians injured.
Out of 292 civilians injured in rioting, 125
civilian got injured in rioting in Uttar Pradesh
alone followed by 60 civilians injured in
Maharashtra, 32 civilians injured in Chandigarh
UT, 30 civilians injured in Delhi UT and 21
civilians injured in Karnataka during 2015.
All civilians injured by extremists/left wing
extremists were reported in Chhattisgarh (23
persons) during 2015.
Out of 67 civilians injured by
Table – 15(B)
Police Personnel Died due to Natural Causes during 2011 to 2015 Year 18 yrs – below
25 yrs 25 yrs – below
35 yrs 35 yrs – below
45 yrs 45 yrs – below
55 yrs 55 yrs & above
Total
2011 38 231 764 1,257 532 2,822
2012 64 210 695 1,215 540 2,724
2013 50 237 659 1,183 610 2,739
Year* 18 yrs – below 30 yrs
30 yrs – below 45 yrs
45 yrs – below 60 yrs
60 yrs & above
Total
2014* 130 641 1,617 29 2,417
2015 119 615 1,612 10 2,356
Note ‘*’ Age groups have been re-grouped as per the revised proformae of Crime in India
Crime in India-2015 156
terrorists/militants, 49 civilians were injured in
Jammu & Kashmir, 10 civilians injured in Punjab
and 8 civilians were injured in North-Eastern
States (4 in Manipur and 2 each in Meghalaya &
Mizoram) during 2015.
Out of 39 civilians injured in bomb
explosion, 36 civilians got injured in Manipur and 3 civilians got injured in West Bengal during
2015.
A total of 26 civilians in Maharashtra, 5
civilians in West Bengal, 3 civilians in Madhya
Pradesh and 2 civilians in Karnataka were
injured during commission of crimes like robbery
or dacoity during 2015.
Crime in India-2015 157
Chapter - 16
Complaints against Police Personnel and
Human Rights Violations by Them
Complaints Received and Cases
Registered against Police Personnel
Total numbers of complaints, both non-
cognizable and cognizable, reported to the
police authorities against police personnel from
States/UTs are presented in Table-16.1.
Information on the number of complaints /
allegations received against police personnel;
number of inquiries instituted such as
departmental, magisterial and judicial; number
of complaints/cases found
false/unsubstantiated; number of cases
registered during the year; and number of
cases either reported for regular departmental
action or sent for trial/charge-sheeted is
presented in Table-16 (A).
A total of 54,916 complaints were
registered in the country against police
personnel during the year 2015. Inquiries were
instituted in as many as 16,721 cases. Out of
these, departmental inquiries were initiated in
16,308 cases, magisterial inquiries in 94 cases
and judicial inquiries in 319 cases. Thus,
inquiries were instituted in 30.4% of total such
complaints. The total number of cases that
either not substantiated or not found true were
20,405 which amounted to 37.2% of the total
complaints registered. An increase of 14.9%
was noticed in registered complaints against
police personnel in comparison to the previous
year (from 47,774 in the year 2014 to 54,916 in
2015). Maximum complaints against police
personnel were received in Delhi which
accounted for 23.5% (12,913 out of 54,916
complaints) followed by Madhya Pradesh
accounting for 18.4% (10,089 complaints),
Maharashtra (14.6%) (8,004 complaints) and
Uttar Pradesh (8.5%) (4,659 complaints). In
some States, FIRs were registered in all
complaints/allegations received, these states
are Goa, Meghalaya, Nagaland, Sikkim,
Tripura, A&N Islands, Daman & Diu,
Lakshadweep and Puducherry.
Involvement of Police Personnel and Action Taken against Them
A total of 1,512 police personnel were
arrested during the year 2015. Out of the
arrested police personnel, 1,122 police
personnel were charge-sheeted/sent up for trial
during the period. Cases were either withdrawn
or disposed of otherwise in respect of 115
police personnel. Trials were completed in
respect of 92 police personnel out of which 67
were acquitted and 25 were convicted. The
Table-16 (A)
Complaints, Inquiries and Cases Registered against Police Personnel during 2011-2015
Year
No. of
Complaints
Received /
Alleged
during the
year
No. of Inquiry Instituted Complaints /
Cases Declared
False /
Unsubstantiated
No. of Cases
Registered
during the
year
No. of Cases
Sent for
Trials /
Charge-
sheeted
Depart-
mental Magisterial Judicial
2011 61,765 21,144 282 246 28,789 11,171 913
2012 57,363 19,490 352 252 30,875 2,289 839
2013 51,120 14,928 247 655 26,640 1,989 799
2014 47,774 11,711 67 351 20,126 2,601 1,268
2015 54,916 16,308 94 319 20,405 5,526 4,367
Crime in India-2015 158
relevant details for the last five years are
presented in Table-16 (B).
Departmental Action against Police Personnel
The magnitude of Departmental action
taken by the States/UTs against the erring
police personnel indicates effectiveness of
supervisory control of the concerned
authorities. Disciplinary actions were initiated
against 35,240 police personnel. Enquires
were conducted against 18,876 police
personnel during the year. The cases were
either withdrawn or otherwise disposed of in
respect of 5,523 policemen. After completion
of enquiries 447 police personnel were either
dismissed or removed from the service. The
highest dismissals/removals were reported
from Delhi (69) accounting for 15.4% followed
by Punjab (63), Uttar Pradesh (49) and
Chhattisgarh (35). Minor punishments were
given to 14,249 police personnel and major
punishments were awarded to 3,754 police
personnel during this period. In 4,514
departmental enquiries, charges were not
proved and departmental enquiries in respect
of 8,864 police personnel were pending at the
end of the year 2015. The relevant details for
the last five years are presented in Table-16
(C).
Human Rights Violation by Police An attempt has been made since 1999
to gather information on details of cases where
human rights were violated by police in form of
excesses such as ‘disappearance of persons’,
‘illegal detentions’, ‘fake encounters’, ‘extortion’,
‘torture’, etc. The details are presented in
Table-16.2.
A total of 94 cases of human rights
violation by police (State Police) were
registered during 2015, out of which 12 were
found to be false. 34 policemen were charge-
sheeted and no police personnel was convicted
Table-16 (B)
Number of Police Personnel Under-Trial, Convicted & Acquitted during 2011-2015
Sl.
No.
Year No. of Police
Personnel
Sent for Trial
No. of Police Personnel
Whose Cases
Withdrawn or
Otherwise Disposed Of
No. of Police
Personnel in Whose
Cases Trial was
Completed
No. of Police Personnel
Convicted Acquitted
1. 2011 1,229 475 439 47 392
2 2012 1,147 633 158 42 116
3 2013 1,250 412 154 53 101
4. 2014 1,166 146 126 44 82
5 2015 1,122 115 92 25 67
Table-16 (C)
Departmental Action and Punishment Awarded to Police Personnel During 2011-2015
Sl.
No. Year
Number of Personnel
Major
Punishment
Awarded
Minor
Punishment
Awarded Against Whom
Disciplinary
Action Initiated
Whose cases
Withdrawn or
Otherwise
Disposed Of
Dismissed/
Removed from
Service
1. 2011 26,736 8,500 873 4,482 15,004
2. 2012 23,720 7,477 608 4,199 11,900
3. 2013 24,217 7,021 544 3,980 13.724
4. 2014 29,726 5,890 416 4,637 12,549
5. 2015 35,240 5,523 447 3,754 14,249
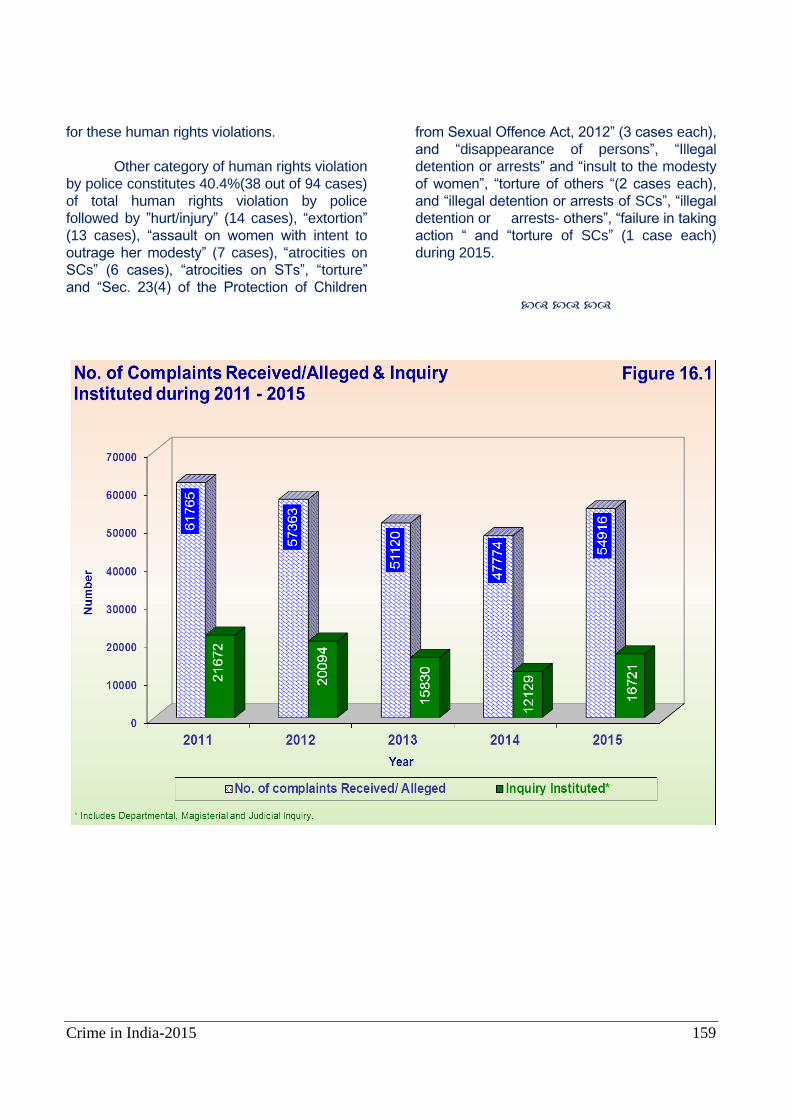
Crime in India-2015 159
for these human rights violations.
Other category of human rights violation
by police constitutes 40.4%(38 out of 94 cases)
of total human rights violation by police
followed by ”hurt/injury” (14 cases), “extortion”
(13 cases), “assault on women with intent to
outrage her modesty” (7 cases), “atrocities on
SCs” (6 cases), “atrocities on STs”, “torture”
and “Sec. 23(4) of the Protection of Children
from Sexual Offence Act, 2012” (3 cases each),
and “disappearance of persons”, “Illegal
detention or arrests” and “insult to the modesty
of women”, “torture of others “(2 cases each),
and “illegal detention or arrests of SCs”, “illegal
detention or arrests- others”, “failure in taking
action “ and “torture of SCs” (1 case each)
during 2015.
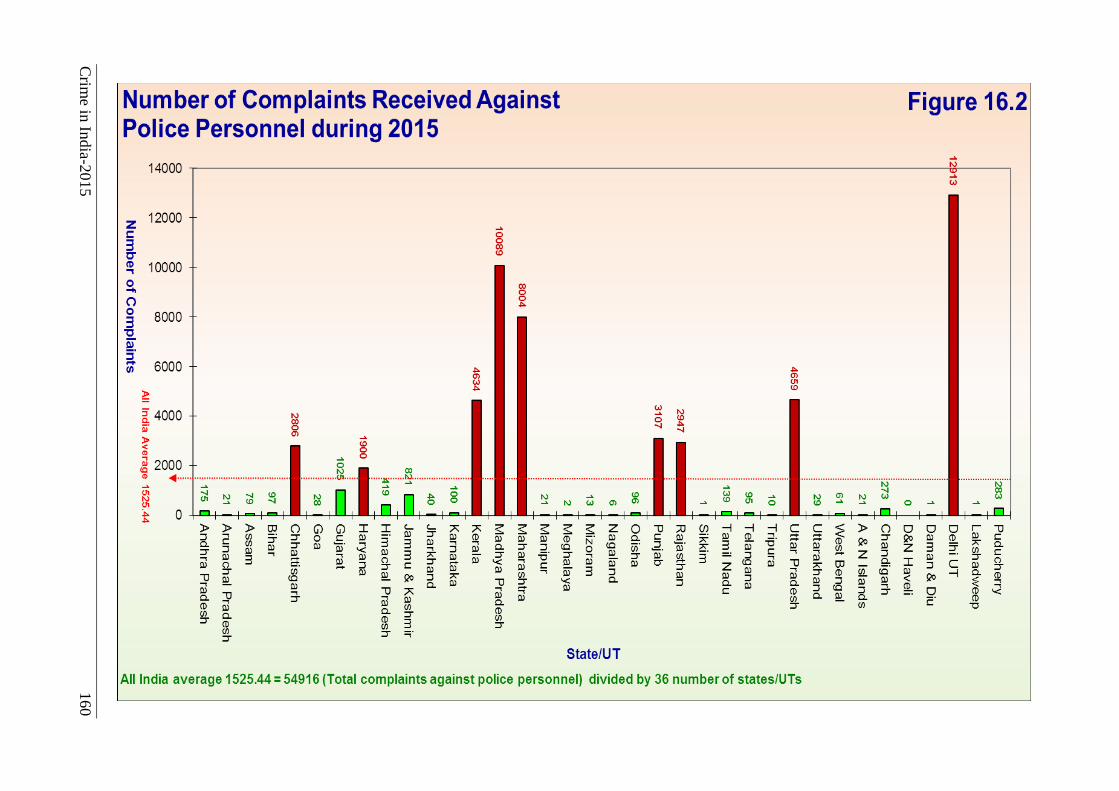
Crim
e in In
dia-2
015
160
Crime in India-2015 161
Chapter - 17
Crime Committed by Foreigners
Introduction
This chapter intent to understand and analyse the pattern of crimes committed by foreigners. Detailed information on foreigners arrested and their disposal by police and courts under various crimes have been dealt in this chapter.
Cognizable Crimes Committed by
Foreigners
A total of 1,278 cases were registered in which 2,057 foreigners have been arrested for committing various cognizable crimes during 2015. Most of the foreigners were arrested in connection with cases registered under the Foreigners Act which accounted for 66.5%(1,367 out of 2,057 persons) of total foreigners arrested, it was followed by arrests under the Passport Act (143 persons), cases under the Narcotic Drugs & Psychotropic Substances Act (128 persons), forgery (73 persons), the Registration of Foreigners Act (59 persons), cheating (49 persons), rape (14 persons) and murder (6 persons).
State/UT-wise foreigners arrested revealed that maximum number of foreigners have been arrested in West Bengal which accounted for 57.6%(1,185 out of 2,057 foreigners) of total such arrestees. A total of 176 foreigners in Maharashtra, 168 foreigners in Delhi, 102 foreigners in Karnataka and 69 each foreigners in Tamil Nadu and Goa have been arrested in connection with various crimes during 2015.
3 foreigners in Delhi and 1 foreigner each in Gujarat, Karnataka and Jammu & Kashmir have been arrested for offences of murder during 2015. 6 foreigners each in Haryana & Delhi and 1 in each Goa & Karnataka have been arrested for the offences of rape during 2015.
Karnataka and Maharashtra have reported highest number of foreigners arrested under cheating (20 foreigners in Karnataka & 15 foreigners in Maharashtra) followed by Delhi (7 foreigners), Punjab (3 foreigners) and Goa, Haryana, Rajasthan & Uttarakhand (1 foreigner each) and forgery (54 foreigners in
Delhi, 8 foreigners in Maharashtra, 4 foreigners in each Jharkhand & Karnataka and 1 in each Gujarat, Kerala & West Bengal). A total of 34 foreigners were arrested in Mizoram under the NDPS Act which accounted for 26.6% of total such arrestees followed by Goa (28 foreigners), Maharashtra (23 foreigners), Delhi (11 foreigners), Karnataka (9 foreigners) and Haryana (8 foreigners) during 2015.
Under the Registration of Foreigner Act, most of the arrests of foreigners have been made in Tamil Nadu (14 out of 59 foreigners) followed by Jammu & Kashmir (12 foreigners), Assam (11 foreigners) and Arunachal Pradesh (8 foreigners).
Disposal Cases under Crimes Committed
by Foreigners
Out of 1,718 cases (440 cases pending from previous years + 1,278 cases reported during the year), police submitted charge-sheets in 1,075 cases during 2015, showing 97.9% as charge-sheet rate. However, 36.1% of such cases remained pending for investigation (620 out of 1,718 cases) at the end of the year. 100% detection i.e. charge-sheets were submitted in cases of murder, rape, unnatural offence, forgery, under the NDPS Act, the Registration of Foreigners Act, the Explosive & Explosive Substances Act and the IT Act during 2015.
Out for 4,600 cases for trials before courts, convictions have been made in 424 cases, showing 79.5% conviction rate during 2015. However, 88.4% cases remained pending before courts at the end of the year 2015. The crime heads in which more than 90.0% conviction rate was achieved were murder (100%), forgery (100%), the Arms Act (100%) and the Unlawful Activities (Prevention) Act (100%).
In 1,075 cases (involving 1,936 foreigners) charge-sheets were submitted by police during 2015. In 424 convicted cases, 872 foreigners have been convicted during the year 2015. 194 foreigners have been acquitted by the courts. Trials remained pending in respect of 7,686 foreigners at the end of the year 2015.
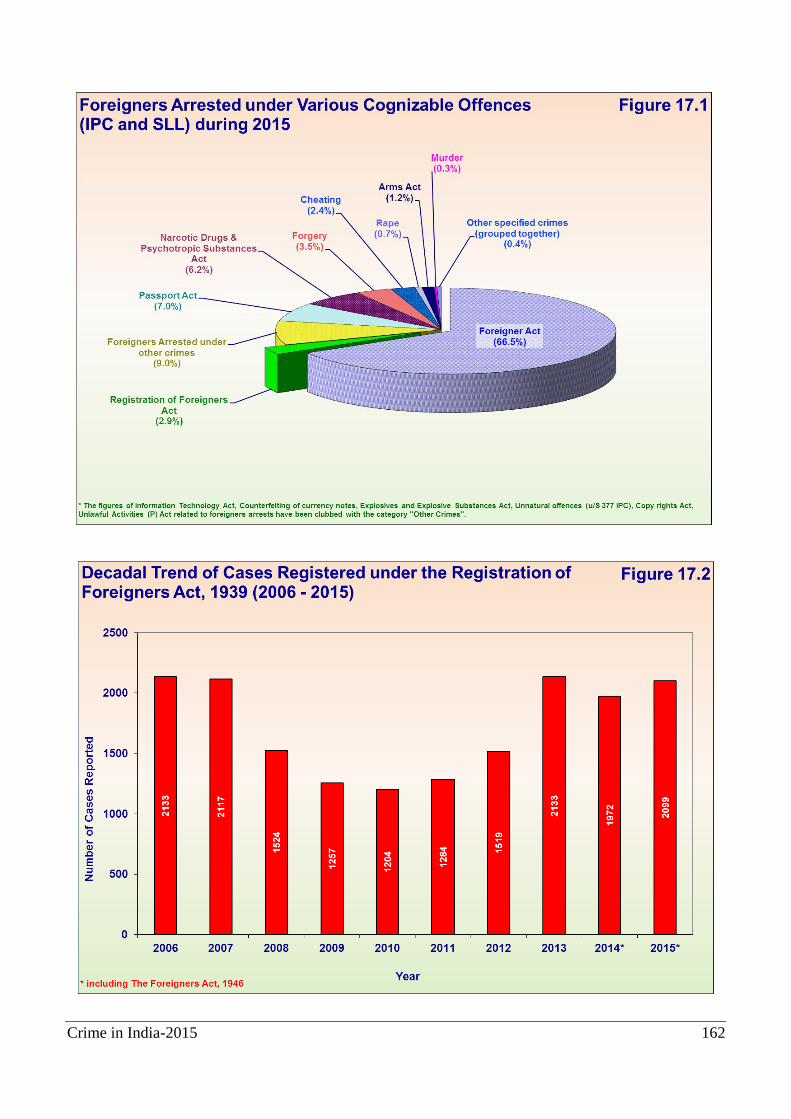
Crime in India-2015 162
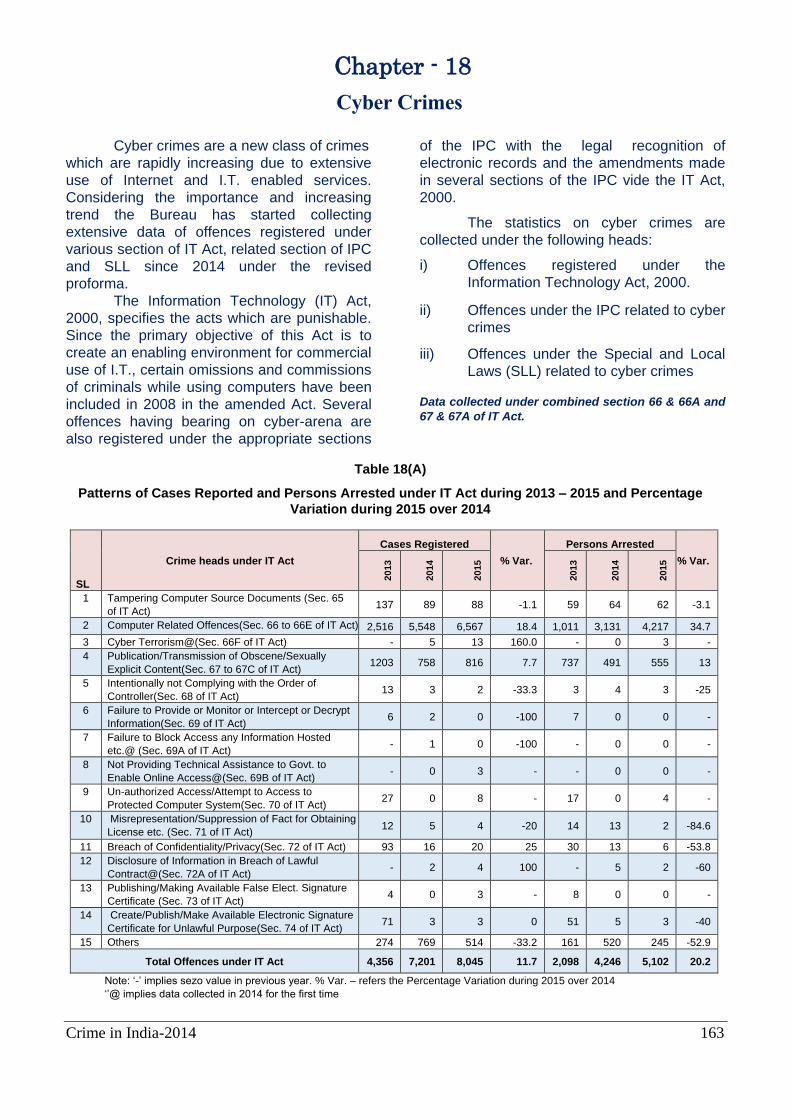
Crime in India-2014 163
Chapter - 18
Cyber Crimes
Cyber crimes are a new class of crimes
which are rapidly increasing due to extensive
use of Internet and I.T. enabled services.
Considering the importance and increasing
trend the Bureau has started collecting
extensive data of offences registered under
various section of IT Act, related section of IPC
and SLL since 2014 under the revised
proforma.
The Information Technology (IT) Act,
2000, specifies the acts which are punishable.
Since the primary objective of this Act is to
create an enabling environment for commercial
use of I.T., certain omissions and commissions
of criminals while using computers have been
included in 2008 in the amended Act. Several
offences having bearing on cyber-arena are
also registered under the appropriate sections
of the IPC with the legal recognition of
electronic records and the amendments made
in several sections of the IPC vide the IT Act,
2000.
The statistics on cyber crimes are
collected under the following heads:
i) Offences registered under the
Information Technology Act, 2000.
ii) Offences under the IPC related to cyber
crimes
iii) Offences under the Special and Local
Laws (SLL) related to cyber crimes
Data collected under combined section 66 & 66A and
67 & 67A of IT Act.
Table 18(A)
Patterns of Cases Reported and Persons Arrested under IT Act during 2013 – 2015 and Percentage
Variation during 2015 over 2014
SL
Crime heads under IT Act
Cases Registered
% Var.
Persons Arrested
% Var.
2013
2014
2015
2013
2014
2015
1 Tampering Computer Source Documents (Sec. 65
of IT Act) 137 89 88 -1.1 59 64 62 -3.1
2 Computer Related Offences(Sec. 66 to 66E of IT Act) 2,516 5,548 6,567 18.4 1,011 3,131 4,217 34.7
3 Cyber Terrorism@(Sec. 66F of IT Act) - 5 13 160.0 - 0 3 -
4 Publication/Transmission of Obscene/Sexually
Explicit Content(Sec. 67 to 67C of IT Act) 1203 758 816 7.7 737 491 555 13
5 Intentionally not Complying with the Order of
Controller(Sec. 68 of IT Act) 13 3 2 -33.3 3 4 3 -25
6 Failure to Provide or Monitor or Intercept or Decrypt
Information(Sec. 69 of IT Act) 6 2 0 -100 7 0 0 -
7 Failure to Block Access any Information Hosted
etc.@ (Sec. 69A of IT Act) - 1 0 -100 - 0 0 -
8 Not Providing Technical Assistance to Govt. to
Enable Online Access@(Sec. 69B of IT Act) - 0 3 - - 0 0 -
9 Un-authorized Access/Attempt to Access to
Protected Computer System(Sec. 70 of IT Act) 27 0 8 - 17 0 4 -
10 Misrepresentation/Suppression of Fact for Obtaining
License etc. (Sec. 71 of IT Act) 12 5 4 -20 14 13 2 -84.6
11 Breach of Confidentiality/Privacy(Sec. 72 of IT Act) 93 16 20 25 30 13 6 -53.8
12 Disclosure of Information in Breach of Lawful
Contract@(Sec. 72A of IT Act) - 2 4 100 - 5 2 -60
13 Publishing/Making Available False Elect. Signature
Certificate (Sec. 73 of IT Act) 4 0 3 - 8 0 0 -
14 Create/Publish/Make Available Electronic Signature
Certificate for Unlawful Purpose(Sec. 74 of IT Act) 71 3 3 0 51 5 3 -40
15 Others 274 769 514 -33.2 161 520 245 -52.9
Total Offences under IT Act 4,356 7,201 8,045 11.7 2,098 4,246 5,102 20.2
Note: ‘-’ implies sezo value in previous year. % Var. – refers the Percentage Variation during 2015 over 2014
‘’@ implies data collected in 2014 for the first time

Crime in India-2015 164
Cyber Crimes
(Cases Reported: 11,592
Persons Arrested: 8,121)
A total of 11,592 cases were registered
under the cyber crimes (which includes cases
under Information Technology Act, offences
under related sections of IPC and offences under
Special and Local Laws (SLL)) in comparison to
9,622 cases registered during the previous year
(2014) which shows an increase of 20.5% over
the previous year. Uttar Pradesh has reported
the highest number of such crimes accounting for
19.0% (2,208 cases out of 11,592 cases) of total
cyber crimes followed by Maharashtra (2,195
cases out of 11,592 cases) accounting for 18.9%
and Karnataka (1,447 cases out of 11,592 cases
i.e. 12.5%).
In these cases a total of 8,121 persons
were arrested during 2015 in comparison to
5,752 persons arrested during the previous year
(2014) registering 41.2% increase over the
previous year. Uttar Pradesh (1,699) has
reported the maximum number of persons
arrested under such crimes.
The details of cases registered and
persons arrested under cyber crimes during 2015
can be seen under Table – 18.1.
Cyber Crimes – Cases of Various Categories under the IT Act, 2000 Information on the cases registered
under the IT Act relating to cyber crimes at all-
India level is presented in Table – 18(A).
A total of 8,045 cases were registered
under the IT Act during the year 2015 in
comparison to 7,201 cases during the previous
year (2014), showing an increase of 11.7% in
2015 over 2014. 81.6% (6,567 cases) of the total
8,045 cases under IT Act were related to
computer related offences (under section 66 &
66A, 66B, 66C, 66D and 66E of IT Act) followed
by 10.1% (816 out of 8,045 cases) under
publication/transmission of obscene/sexually
explicit content (under section 67 & 67A, 67B and
67C of IT Act). A total of 14,121 cases under IT
Act including 6,268 cases pending from previous
year were investigated during the year 2015 and
at the end of the year 8,088 cases remained
pending for investigation. A total of 2,396 cases
were charge-sheeted during 2015. A total of
4,191 cases were pending for trial at the end of
the year 2015, in which maximum number of
cases were computer related offences (under
section 66 & 66A, 66B to 66D of IT Act) (3,110
cases) during 2015. In 486 cases trials were
completed, 193 cases ended in conviction. The
details of disposal of cases of cyber crimes under
the IT Act are shown under Table - 18.2 and
18.3.
62.8%(5,102 out of 8,121) of the persons
arrested under cyber crimes was under the IT
Act. Out of 5,102 persons arrested under the IT
act., maximum were arrested under computer
related offences (under section 66&66A, 66B to
66E of IT Act) (4,217 out of 5,102 persons)
accounting for 82.6% followed by
publication/transmission of obscene/sexually
explicit content (under section 67 & 67A, 67B and
67C of IT Act) accounting for 10.9% (555 out of
5,102 persons) during the year 2015.
The age-wise profile of persons arrested
in Cyber Crime cases under IT Act, 2000 showed
that 62.5% of the offenders were in the age
group 18 yrs. – below 30 years (3,188 out of
5,102 persons) and 30.8%(1,573 out of 5,102
persons) of the offenders were in the age group
30 yrs. – below 45 years. 98 juvenile offenders
(below 18 years) were apprehended under IT Act
during 2015. A total of 3,502 persons were
charge-sheeted, 250 persons were convicted and
358 persons were acquitted under such cases of
cyber crimes under IT Act during 2015. Further
details on the age group, persons arrested and
their disposal under the IT Act by police and
courts may be seen in Table -18.4, 18.5 and
18.6.
Incidences of Cyber Crimes Registered under IPC
Information on the cases registered
under various sections of IPC which were
considered as cyber crimes at all-India level is
presented in Table – 18(B).
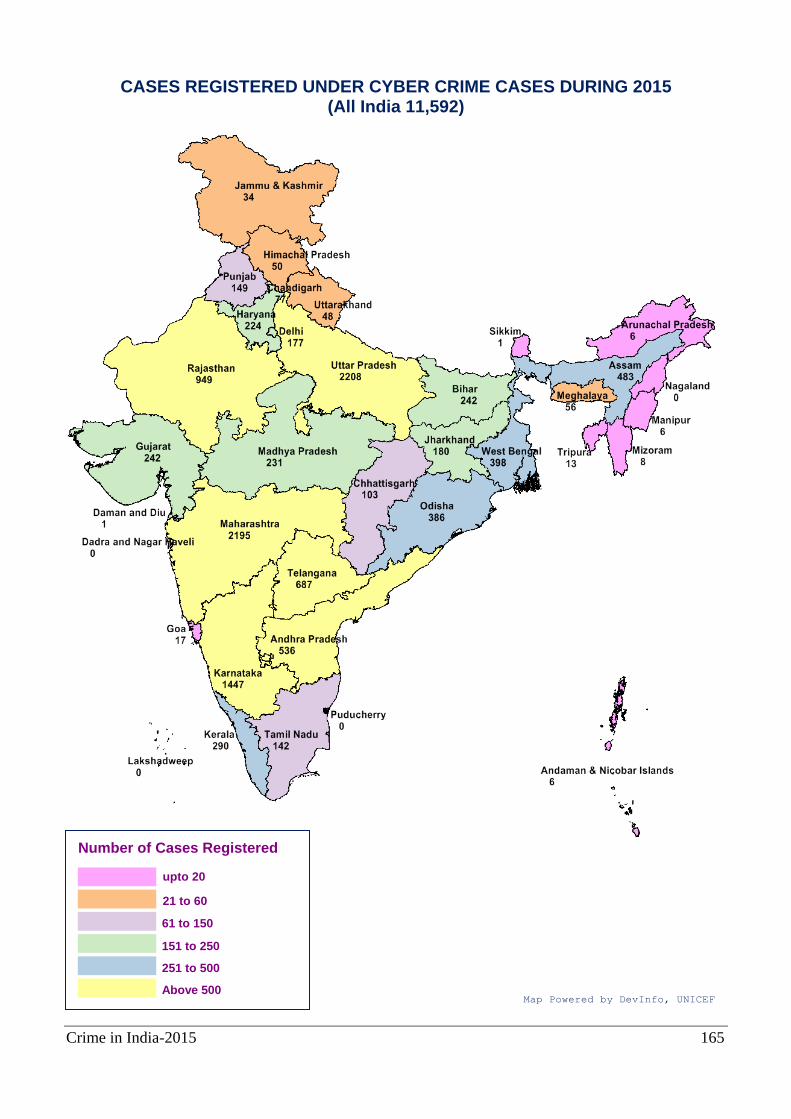
Crime in India-2015 165
CASES REGISTERED UNDER CYBER CRIME CASES DURING 2015 (All India 11,592)
Number of Cases Registered
upto 20
61 to 150
Above 500 Map Powered by DevInfo, UNICEF
21 to 60
151 to 250
251 to 500
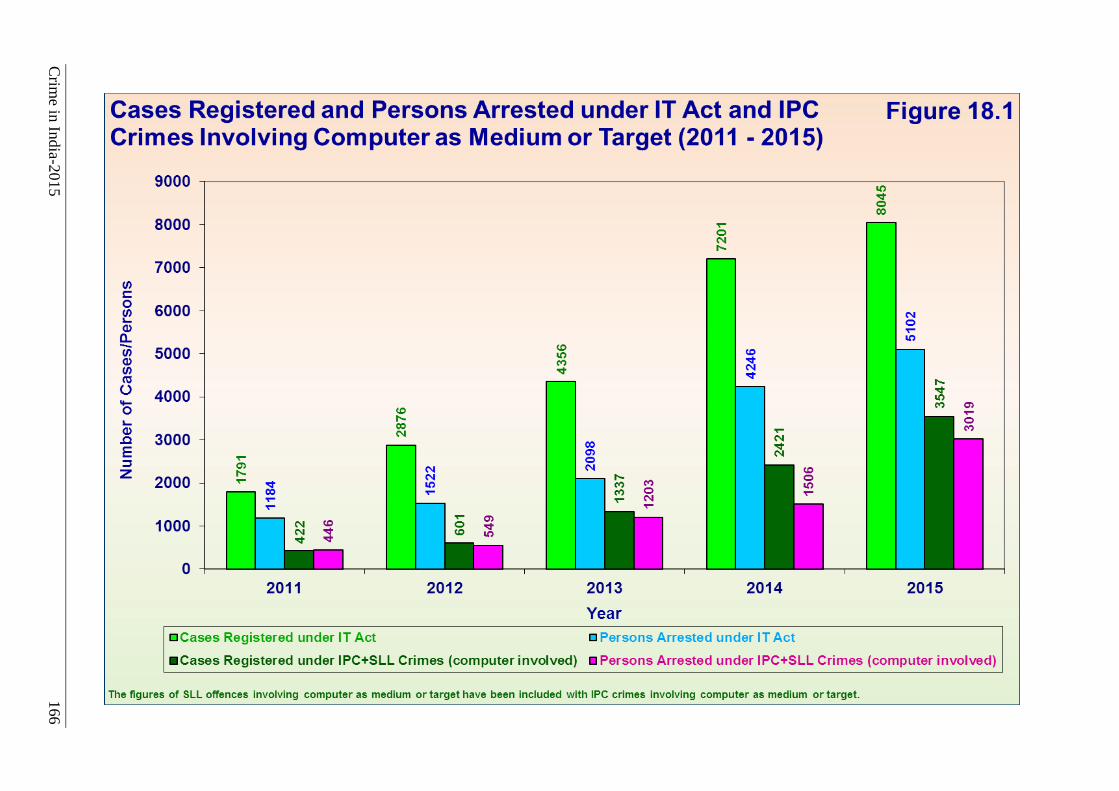
Crim
e in In
dia-2
015
166
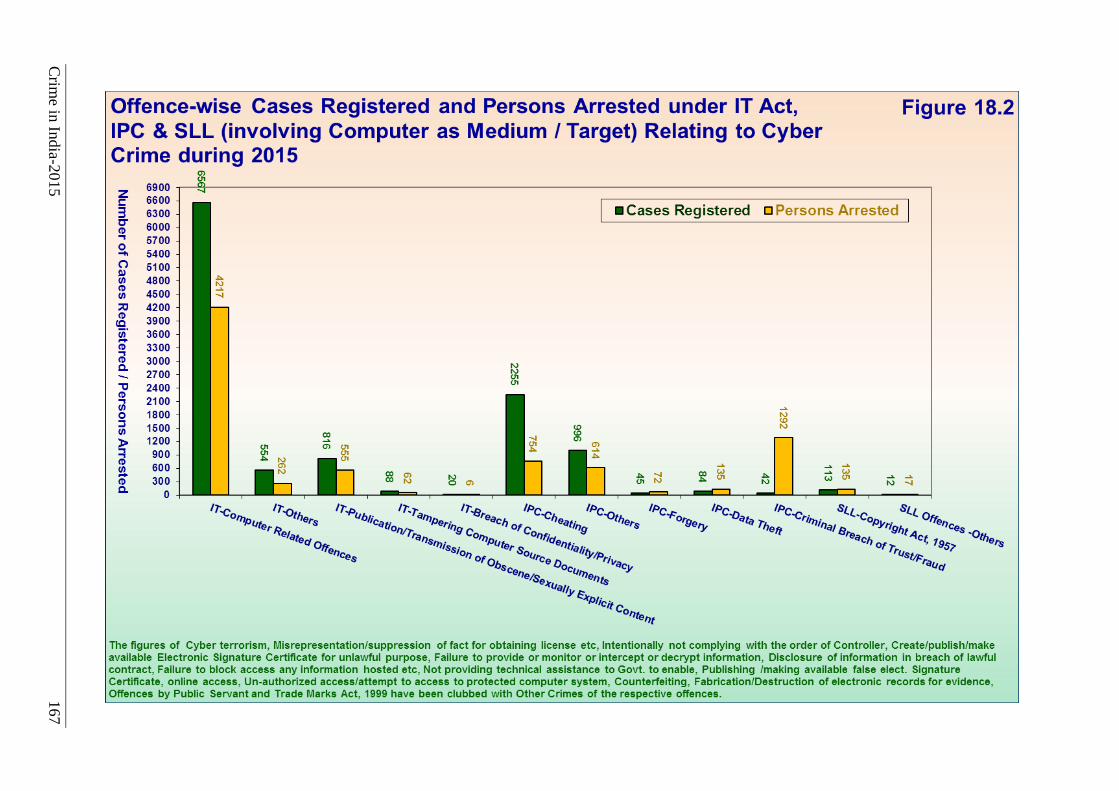
Crim
e in In
dia-2
015
167
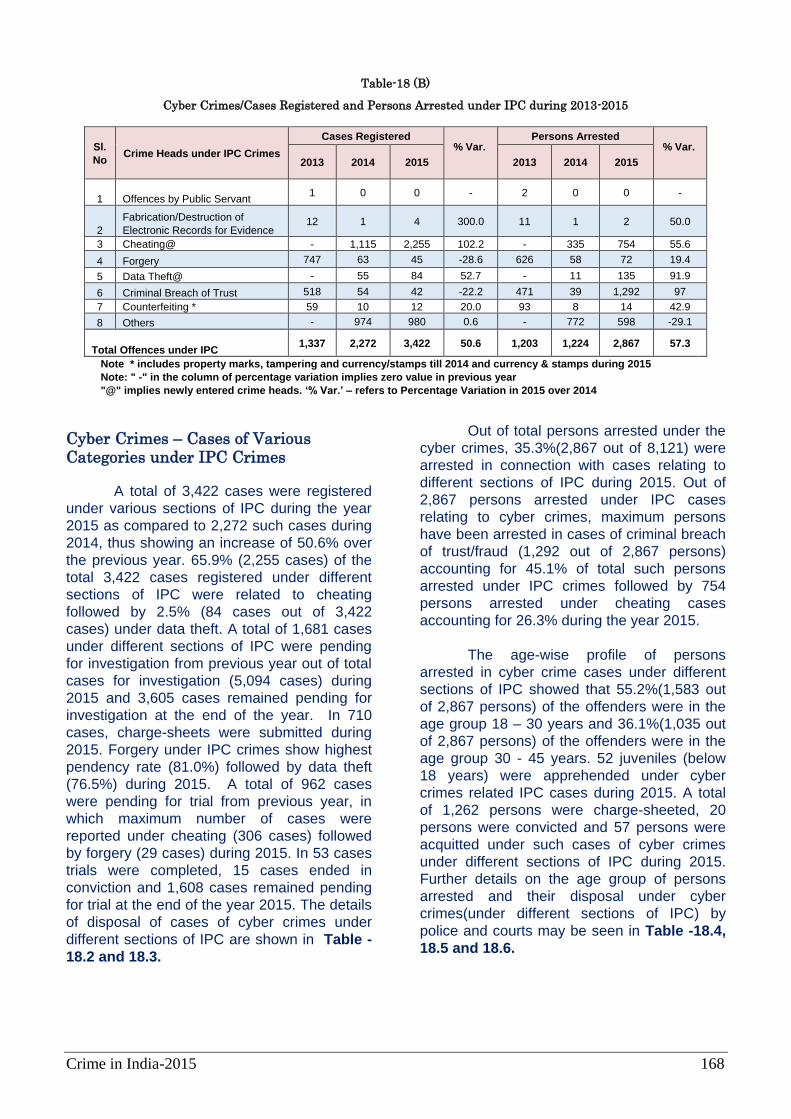
Crime in India-2015 168
Cyber Crimes – Cases of Various Categories under IPC Crimes
A total of 3,422 cases were registered
under various sections of IPC during the year
2015 as compared to 2,272 such cases during
2014, thus showing an increase of 50.6% over
the previous year. 65.9% (2,255 cases) of the
total 3,422 cases registered under different
sections of IPC were related to cheating
followed by 2.5% (84 cases out of 3,422
cases) under data theft. A total of 1,681 cases
under different sections of IPC were pending
for investigation from previous year out of total
cases for investigation (5,094 cases) during
2015 and 3,605 cases remained pending for
investigation at the end of the year. In 710
cases, charge-sheets were submitted during
2015. Forgery under IPC crimes show highest
pendency rate (81.0%) followed by data theft
(76.5%) during 2015. A total of 962 cases
were pending for trial from previous year, in
which maximum number of cases were
reported under cheating (306 cases) followed
by forgery (29 cases) during 2015. In 53 cases
trials were completed, 15 cases ended in
conviction and 1,608 cases remained pending
for trial at the end of the year 2015. The details
of disposal of cases of cyber crimes under
different sections of IPC are shown in Table -
18.2 and 18.3.
Out of total persons arrested under the
cyber crimes, 35.3%(2,867 out of 8,121) were
arrested in connection with cases relating to
different sections of IPC during 2015. Out of
2,867 persons arrested under IPC cases
relating to cyber crimes, maximum persons
have been arrested in cases of criminal breach
of trust/fraud (1,292 out of 2,867 persons)
accounting for 45.1% of total such persons
arrested under IPC crimes followed by 754
persons arrested under cheating cases
accounting for 26.3% during the year 2015.
The age-wise profile of persons
arrested in cyber crime cases under different
sections of IPC showed that 55.2%(1,583 out
of 2,867 persons) of the offenders were in the
age group 18 – 30 years and 36.1%(1,035 out
of 2,867 persons) of the offenders were in the
age group 30 - 45 years. 52 juveniles (below
18 years) were apprehended under cyber
crimes related IPC cases during 2015. A total
of 1,262 persons were charge-sheeted, 20
persons were convicted and 57 persons were
acquitted under such cases of cyber crimes
under different sections of IPC during 2015.
Further details on the age group of persons
arrested and their disposal under cyber
crimes(under different sections of IPC) by
police and courts may be seen in Table -18.4,
18.5 and 18.6.
Table-18 (B)
Cyber Crimes/Cases Registered and Persons Arrested under IPC during 2013-2015
Sl.
No Crime Heads under IPC Crimes
Cases Registered % Var.
Persons Arrested % Var.
2013 2014 2015 2013 2014 2015
1 Offences by Public Servant 1 0 0 - 2 0 0 -
2
Fabrication/Destruction of
Electronic Records for Evidence 12 1 4 300.0 11 1 2 50.0
3 Cheating@ - 1,115 2,255 102.2 - 335 754 55.6
4 Forgery 747 63 45 -28.6 626 58 72 19.4
5 Data Theft@ - 55 84 52.7 - 11 135 91.9
6 Criminal Breach of Trust 518 54 42 -22.2 471 39 1,292 97
7 Counterfeiting * 59 10 12 20.0 93 8 14 42.9
8 Others - 974 980 0.6 - 772 598 -29.1
Total Offences under IPC 1,337 2,272 3,422 50.6 1,203 1,224 2,867 57.3
Note * includes property marks, tampering and currency/stamps till 2014 and currency & stamps during 2015
Note: " -" in the column of percentage variation implies zero value in previous year
"@" implies newly entered crime heads. ‘% Var.’ – refers to Percentage Variation in 2015 over 2014
Crime in India-2015 169
Cyber Crimes – Cases of Various Categories under Special and Local Laws (SLL) A total of 125 cases were registered
under various sections of SLL during the year
2015. 90.4% (113 out of 125 cases) of the total
cases registered under different sections of
SLL were related to the Copyright Act, 1957.
Out of 208 cases for investigation,
investigations were completed for 112 cases
under different sections of SLL during 2015. In
100 cases, charge-sheets were submitted by
police during the year 2015 and 96 cases
remained pending for investigation at the end
of the year. Cases under the Copyright Act has
highest pendency rate (51.8%) during 2015. A
total of 637 pending cases brought forward for
trials during 2015, in which maximum cases
were reported under the Copyright Act (622
cases). Out of 101 cases in which trials were
completed, 26 cases ended in conviction and
75 cases ended in acquittal/discharge during
2015. A total of 636 cases remained pending
for trial at the end of the year. The details of
disposal of cases of cyber crimes under
different sections of IPC are given in Table -
18.2 and 18.3.
1.9% of the persons arrested (152 out
of 8,121) are in cases relating to different Acts
& sections of SLL. Out of such arrested
persons, the maximum number of persons
arrested numbering 135 out of 152 persons
were in cases under the Copyright Act
accounting for 88.8% followed by other SLL
offences (17 out of 152 persons) during the
year 2015.
The age-wise profile of persons
arrested in cyber crime cases under different
sections of SLL showed that 62.5%(95 out of
152 persons) of the offenders were in the age
group of 30 - 45 years and 23.3%(43 out of
152 persons) of the offenders were in the age
group of 18 – 30 years. 2 juveniles (below 18
years) were apprehended under SLL crimes
during 2015. A total of 164 persons were
charge-sheeted during the year 2015. A total
of 32 persons were convicted and 104 persons
were acquitted in cases of cyber crimes under
different sections of SLL during 2015. Further
details on the age group of persons arrested
and their disposal under cyber crimes (under
different sections of SLL) by police and courts
may be seen in Table -18.4, 18.5 and 18.6.
Motives of Cyber Crimes
Most of the cyber crimes were
registered for greed/financial gain accounting
for 33.3% (3,855 out of 11,592 cases) followed
by fraud/illegal gain (9.6%) (1,119 cases),
insult to the modesty of women (5.2%) (606
cases), sexual exploitation (5.1%) (588 cases)
and causing disrepute (3.3%) (387 cases).
State/UT - wise and motives - wise
details of cyber crimes during 2015 are
presented in Table 18.7.
Profile of Accused in Cyber Crimes
Data on profiles of persons arrested
under cyber crimes have been collected as
foreign nationals and Indian citizens.
4 foreign nationals and 8,117 Indian
nationals were arrested under cyber crimes.
Among foreign nationals, one person was
cracker/hacker and has been arrested in
Chhattisgarh. Similarly among Indian nationals,
most of the persons arrested under cyber
crime were 'Business Competitor’ with
19.6%(1,594 out of 8,121 persons) of total
such persons followed by neighbours / friends
& relatives' with 14.7%(1,195 out of 8,121
persons) of total such persons, professional
computer geeks/hackers/crackers with 13.5%
(1,095 persons), student with 10% (814
persons), sexual freak with 5.1% (415 persons)
and employees/disgruntled employees 3.1%
(249 persons).
State/UT - wise details on profiles of
persons arrested or accused of cyber crimes
during 2015 are presented in Table 18.8.
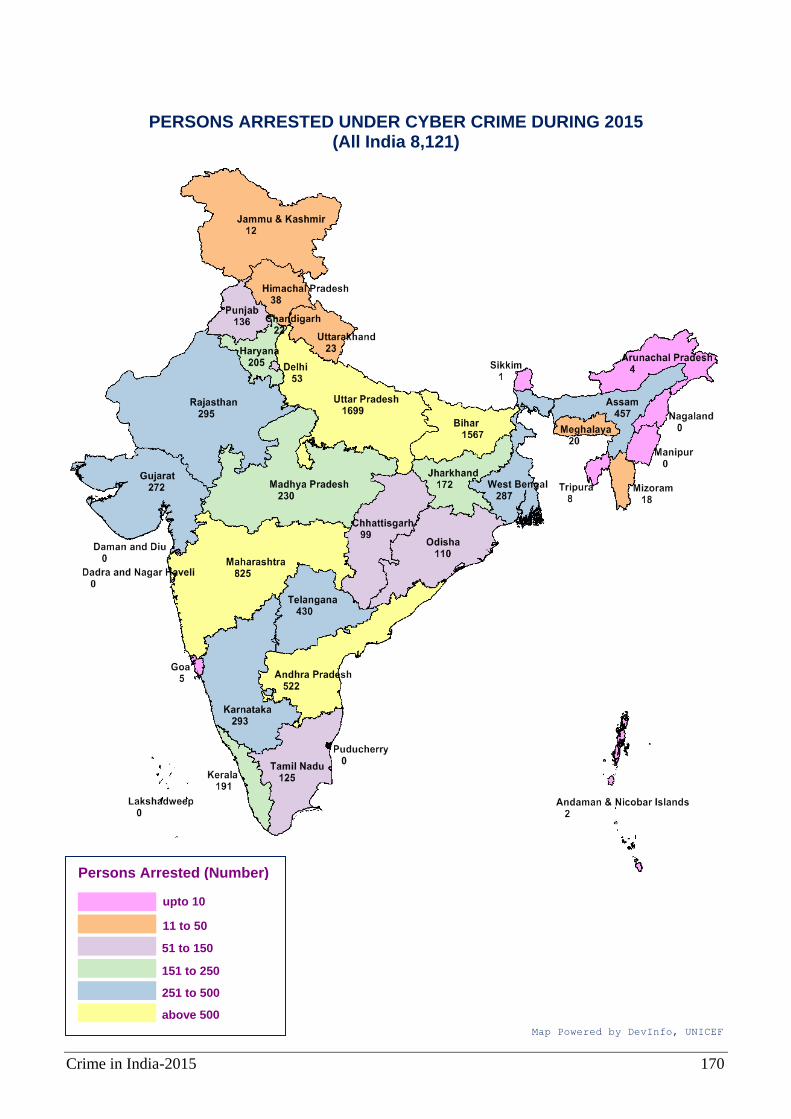
Crime in India-2015 170
PERSONS ARRESTED UNDER CYBER CRIME DURING 2015 (All India 8,121)
Persons Arrested (Number)
upto 10
51 to 150
above 500
Map Powered by DevInfo, UNICEF
11 to 50
151 to 250
251 to 500
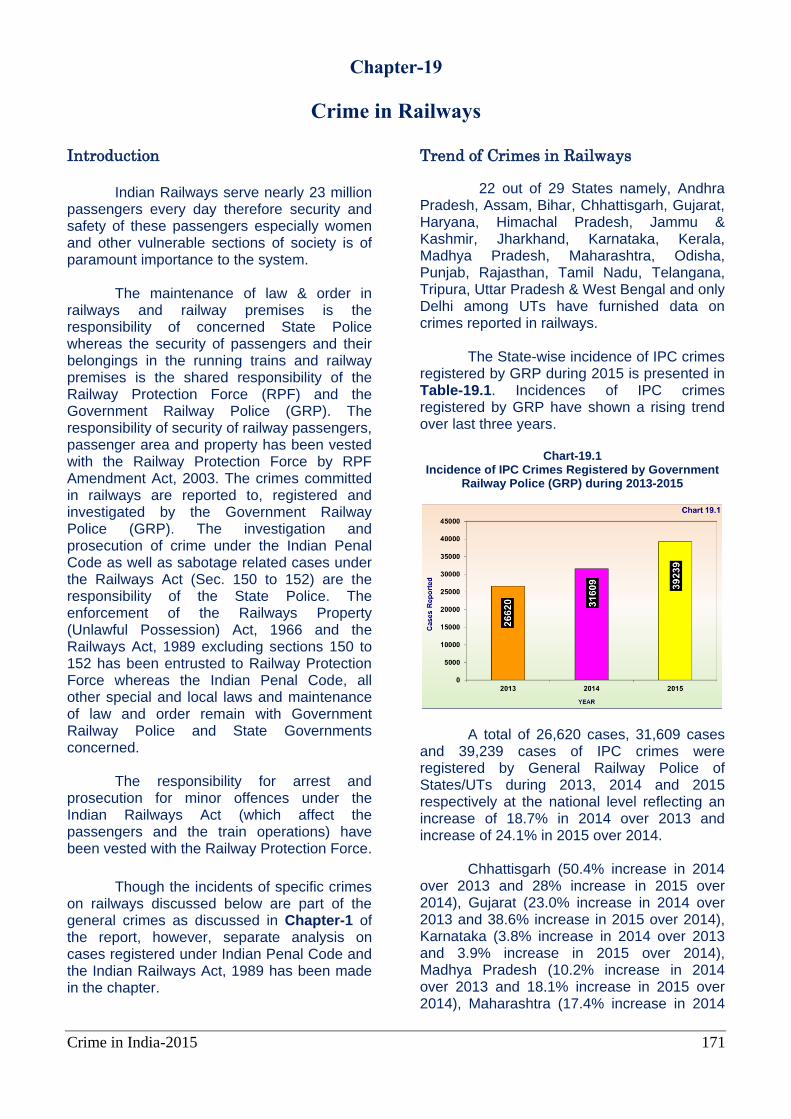
Crime in India-2015 171
Chapter-19
Crime in Railways
Introduction
Indian Railways serve nearly 23 million
passengers every day therefore security and safety of these passengers especially women and other vulnerable sections of society is of paramount importance to the system.
The maintenance of law & order in
railways and railway premises is the responsibility of concerned State Police whereas the security of passengers and their belongings in the running trains and railway premises is the shared responsibility of the Railway Protection Force (RPF) and the Government Railway Police (GRP). The responsibility of security of railway passengers, passenger area and property has been vested with the Railway Protection Force by RPF Amendment Act, 2003. The crimes committed in railways are reported to, registered and investigated by the Government Railway Police (GRP). The investigation and prosecution of crime under the Indian Penal Code as well as sabotage related cases under the Railways Act (Sec. 150 to 152) are the responsibility of the State Police. The enforcement of the Railways Property (Unlawful Possession) Act, 1966 and the Railways Act, 1989 excluding sections 150 to 152 has been entrusted to Railway Protection Force whereas the Indian Penal Code, all other special and local laws and maintenance of law and order remain with Government Railway Police and State Governments concerned. The responsibility for arrest and prosecution for minor offences under the Indian Railways Act (which affect the passengers and the train operations) have been vested with the Railway Protection Force.
Though the incidents of specific crimes on railways discussed below are part of the general crimes as discussed in Chapter-1 of the report, however, separate analysis on cases registered under Indian Penal Code and the Indian Railways Act, 1989 has been made in the chapter.
Trend of Crimes in Railways
22 out of 29 States namely, Andhra Pradesh, Assam, Bihar, Chhattisgarh, Gujarat, Haryana, Himachal Pradesh, Jammu & Kashmir, Jharkhand, Karnataka, Kerala, Madhya Pradesh, Maharashtra, Odisha, Punjab, Rajasthan, Tamil Nadu, Telangana, Tripura, Uttar Pradesh & West Bengal and only Delhi among UTs have furnished data on crimes reported in railways. The State-wise incidence of IPC crimes registered by GRP during 2015 is presented in Table-19.1. Incidences of IPC crimes registered by GRP have shown a rising trend over last three years.
Chart-19.1 Incidence of IPC Crimes Registered by Government
Railway Police (GRP) during 2013-2015
A total of 26,620 cases, 31,609 cases
and 39,239 cases of IPC crimes were registered by General Railway Police of States/UTs during 2013, 2014 and 2015 respectively at the national level reflecting an increase of 18.7% in 2014 over 2013 and increase of 24.1% in 2015 over 2014.
Chhattisgarh (50.4% increase in 2014
over 2013 and 28% increase in 2015 over 2014), Gujarat (23.0% increase in 2014 over 2013 and 38.6% increase in 2015 over 2014), Karnataka (3.8% increase in 2014 over 2013 and 3.9% increase in 2015 over 2014), Madhya Pradesh (10.2% increase in 2014 over 2013 and 18.1% increase in 2015 over 2014), Maharashtra (17.4% increase in 2014
Crime in India-2015 172
over 2013 and 30.3% increase in 2015 over 2014),Tamil Nadu (5.5% increase in 2014 over 2013 and 26.8% increase in 2015 over 2014) and Uttar Pradesh (23.7% increase in 2014 over 2013 and 39.0% increase in 2015 over 2014) have shown an increasing trend during the last 3 years. The State/UT-wise comparative incidence of IPC crimes as registered by Government Railway Police (GRP) during the years 2013 to 2015 are presented in Tables-19(A).
Among IPC crimes, maximum cases
were registered under ‘theft’ accounting for 75.6% (29,686 out of 39,239 cases) of total IPC cases followed by ‘robbery’ 3.8%(1,479 cases out of 39,239 cases) and ‘kidnapping & abduction’ 0.7% (270 out of 39,239 cases cases). A total of 247 cases of murder, 211 cases of making preparation & assembly for committing dacoity and 158 cases of grievous hurt were registered by GRP during 2015. 18.5% of IPC crimes as registered by GRP were reported in Maharashtra (7,277 cases out of 39,239 cases) followed by 18.3% in Uttar Pradesh (7,168 cases), 11.4% in Madhya Pradesh (4,461 cases), 8.6% in Delhi UT (3,356 cases), 5.6% in Bihar (2,182 cases) and 4.4% in Andhra Pradesh (1,720 cases) during 2015.
Cases Registered under Indian Railways
Act, 1989 The State/UT-wise number of cases
registered under the Indian Railways Act, 1989 during 2013 to 2015 and their percentage variation are presented in Table-19.2.
Number of cases under the Indian
Railways Act reported a rising trend during 2013 - 2015 with 166 cases in 2013 which rose to 287 cases in 2014 and further increased to 346 cases in 2015, showing increase of 72.9% during 2014 over 2013 and 20.6% during 2015 over 2014. State/UT-wise trend of such cases shows that maximum increase in cases registered under the Indian Railways Act during the year 2015 over 2014 was reported
in Haryana at 300% (from 3 cases in 2014 to 12 cases in 2015) followed by 250% increase in Punjab (from 4 cases in 2014 to 14 cases in 2015) and 144% increase in Kerala (from 9 cases in 2014 to 22 cases in 2015).
Persons Arrested under the Indian
Railways Act, 1989 A total of 1,013 persons were arrested under the Indian Railways Act during 2015. 72.4%(734 out of 1,013 persons) of total such arrests were reported in Tamil Nadu alone followed by 215 persons arrested in Uttar Pradesh and 19 persons arrested in Chhattisgarh [Table-19.3].
Disposal of Cases under the Indian
Railways Act by Police
Details on cases registered under IPC crimes and SLL crimes and their disposal by police and courts during 2015 are presented in Chapter-4.
Out of 474 cases registered under the Indian Railways Act, police could complete investigation in 339 cases accounting for 71.5% of total such cases. Out of 339 such cases investigated by police, charge-sheets were submitted in 253 cases showing charge-sheet rate of 74.6% during 2015. Detail on cases disposed of by police under various SLL crimes including the Indian Railways Act during 2015 are presented in Table-4.3.
Disposal of Cases under the Indian
Railways Act by Courts As many as 289 cases out of 4,306 cases under the Indian Railways Act were tried in different courts in the country showing 6.7% disposal of such cases by courts during the year 2015. The conviction rate for such cases stood at 64% (185 cases convicted out of 289 cases in which trials completed). 92.5%(3,982 out of 4,306 cases) of total cases registered under the Indian Railways Act remained pending for trial at the end of the year 2015.
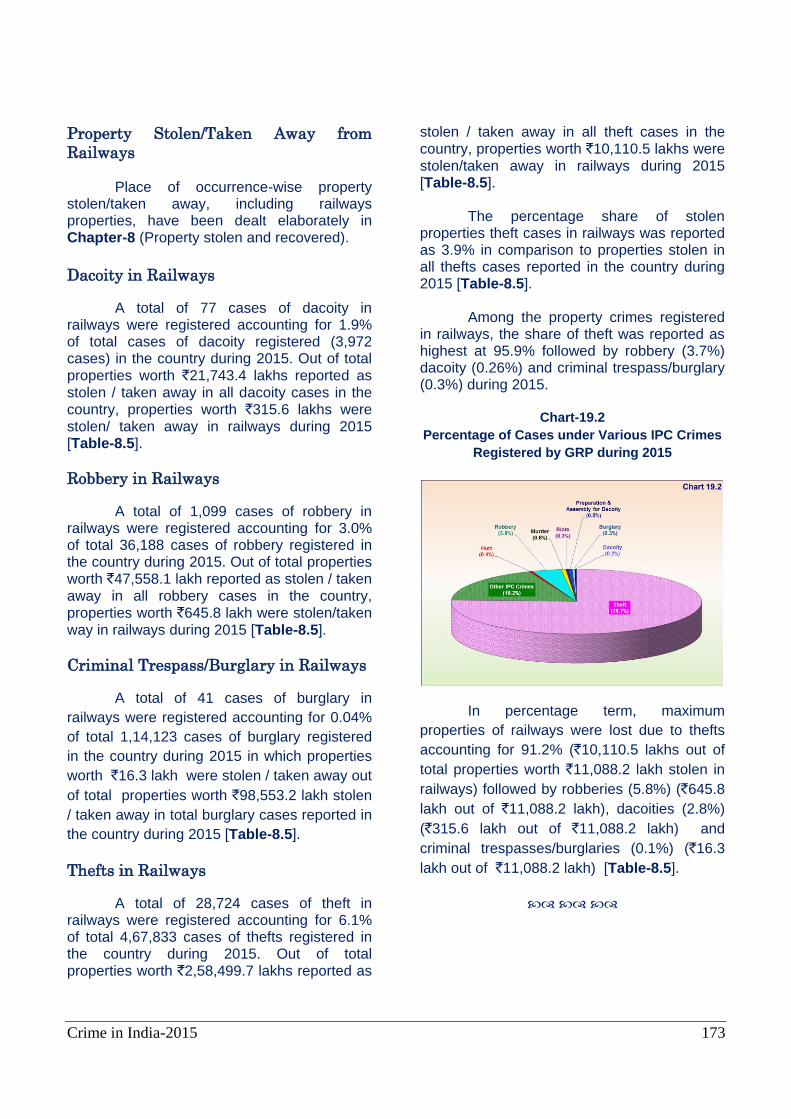
Crime in India-2015 173
Property Stolen/Taken Away from
Railways Place of occurrence-wise property stolen/taken away, including railways properties, have been dealt elaborately in Chapter-8 (Property stolen and recovered).
Dacoity in Railways
A total of 77 cases of dacoity in railways were registered accounting for 1.9% of total cases of dacoity registered (3,972 cases) in the country during 2015. Out of total properties worth `21,743.4 lakhs reported as stolen / taken away in all dacoity cases in the country, properties worth `315.6 lakhs were stolen/ taken away in railways during 2015 [Table-8.5].
Robbery in Railways
A total of 1,099 cases of robbery in railways were registered accounting for 3.0% of total 36,188 cases of robbery registered in the country during 2015. Out of total properties worth `47,558.1 lakh reported as stolen / taken away in all robbery cases in the country, properties worth `645.8 lakh were stolen/taken way in railways during 2015 [Table-8.5].
Criminal Trespass/Burglary in Railways
A total of 41 cases of burglary in
railways were registered accounting for 0.04%
of total 1,14,123 cases of burglary registered
in the country during 2015 in which properties
worth `16.3 lakh were stolen / taken away out
of total properties worth `98,553.2 lakh stolen
/ taken away in total burglary cases reported in
the country during 2015 [Table-8.5].
Thefts in Railways
A total of 28,724 cases of theft in railways were registered accounting for 6.1% of total 4,67,833 cases of thefts registered in the country during 2015. Out of total properties worth `2,58,499.7 lakhs reported as
stolen / taken away in all theft cases in the country, properties worth `10,110.5 lakhs were stolen/taken away in railways during 2015 [Table-8.5].
The percentage share of stolen properties theft cases in railways was reported as 3.9% in comparison to properties stolen in all thefts cases reported in the country during 2015 [Table-8.5].
Among the property crimes registered in railways, the share of theft was reported as highest at 95.9% followed by robbery (3.7%) dacoity (0.26%) and criminal trespass/burglary (0.3%) during 2015.
Chart-19.2
Percentage of Cases under Various IPC Crimes
Registered by GRP during 2015
In percentage term, maximum
properties of railways were lost due to thefts
accounting for 91.2% (`10,110.5 lakhs out of
total properties worth `11,088.2 lakh stolen in
railways) followed by robberies (5.8%) (`645.8
lakh out of `11,088.2 lakh), dacoities (2.8%)
(`315.6 lakh out of `11,088.2 lakh) and
criminal trespasses/burglaries (0.1%) (`16.3
lakh out of `11,088.2 lakh) [Table-8.5].
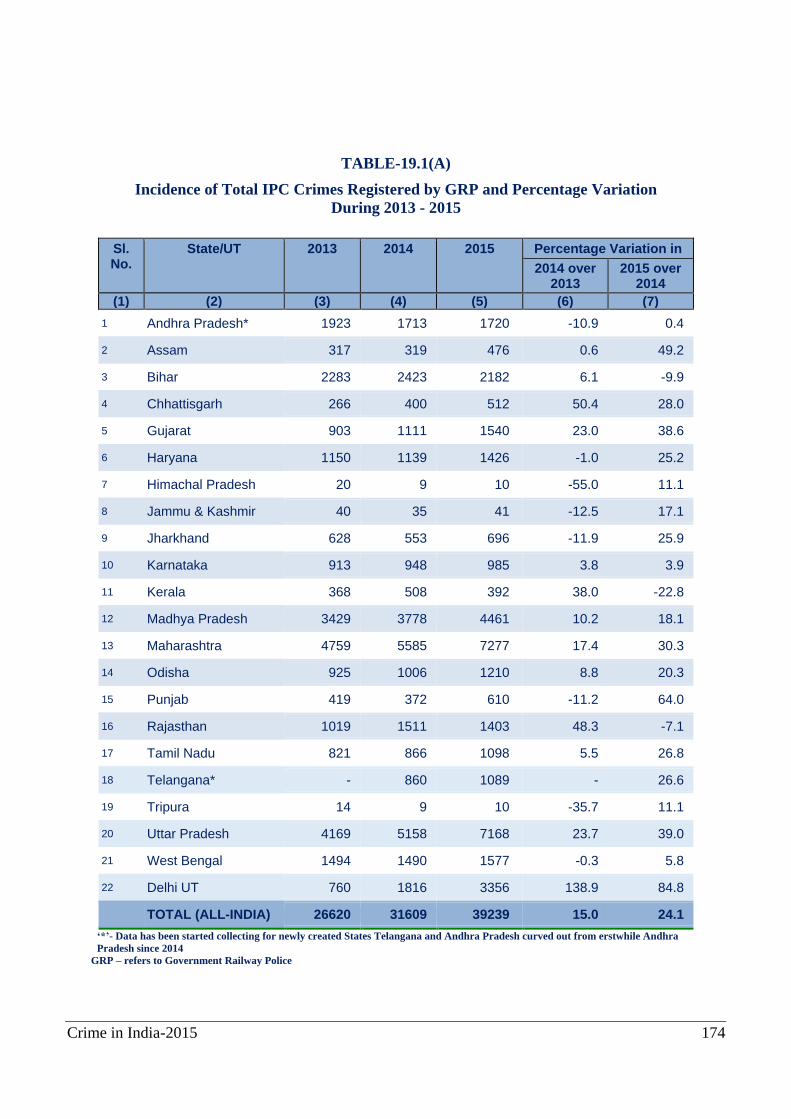
Crime in India-2015 174
TABLE-19.1(A)
Incidence of Total IPC Crimes Registered by GRP and Percentage Variation
During 2013 - 2015
Sl. No.
State/UT 2013 2014 2015 Percentage Variation in
2014 over 2013
2015 over 2014
(1) (2) (3) (4) (5) (6) (7)
1 Andhra Pradesh* 1923 1713 1720 -10.9 0.4
2 Assam 317 319 476 0.6 49.2
3 Bihar 2283 2423 2182 6.1 -9.9
4 Chhattisgarh 266 400 512 50.4 28.0
5 Gujarat 903 1111 1540 23.0 38.6
6 Haryana 1150 1139 1426 -1.0 25.2
7 Himachal Pradesh 20 9 10 -55.0 11.1
8 Jammu & Kashmir 40 35 41 -12.5 17.1
9 Jharkhand 628 553 696 -11.9 25.9
10 Karnataka 913 948 985 3.8 3.9
11 Kerala 368 508 392 38.0 -22.8
12 Madhya Pradesh 3429 3778 4461 10.2 18.1
13 Maharashtra 4759 5585 7277 17.4 30.3
14 Odisha 925 1006 1210 8.8 20.3
15 Punjab 419 372 610 -11.2 64.0
16 Rajasthan 1019 1511 1403 48.3 -7.1
17 Tamil Nadu 821 866 1098 5.5 26.8
18 Telangana* - 860 1089 - 26.6
19 Tripura 14 9 10 -35.7 11.1
20 Uttar Pradesh 4169 5158 7168 23.7 39.0
21 West Bengal 1494 1490 1577 -0.3 5.8
22 Delhi UT 760 1816 3356 138.9 84.8
TOTAL (ALL-INDIA) 26620 31609 39239 15.0 24.1
‘*’- Data has been started collecting for newly created States Telangana and Andhra Pradesh curved out from erstwhile Andhra
Pradesh since 2014
GRP – refers to Government Railway Police
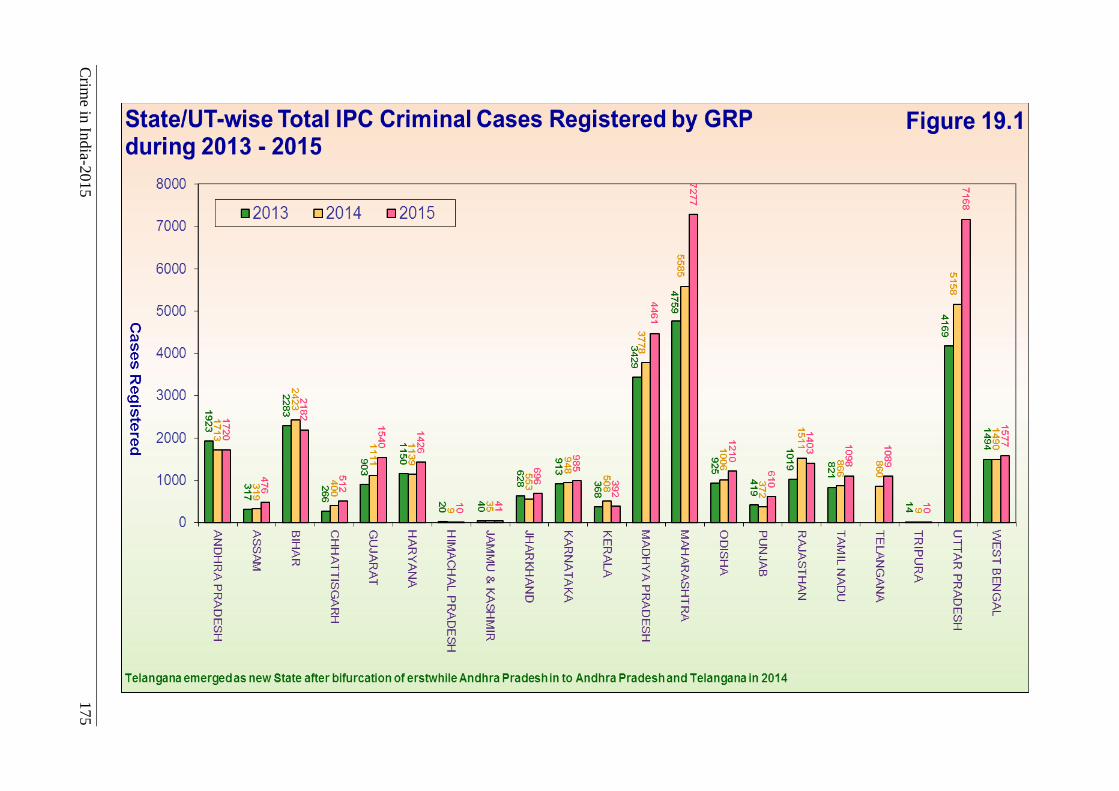
Crim
e in In
dia-2
015
175
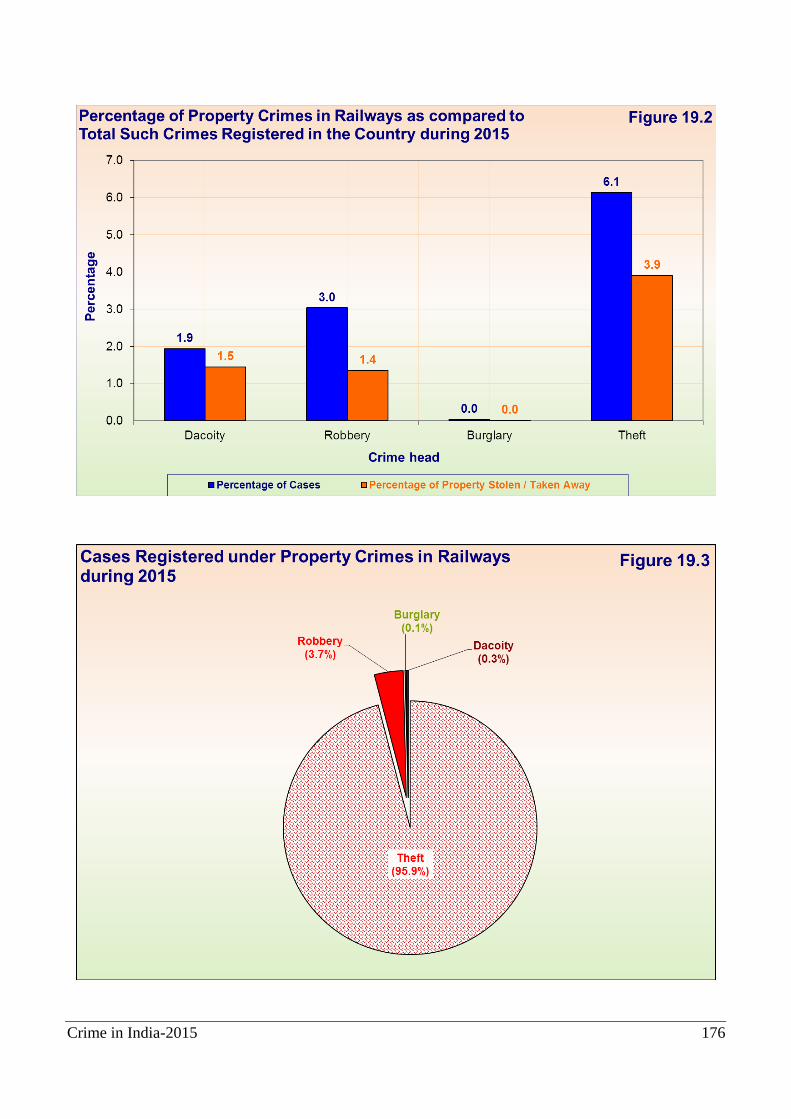
Crime in India-2015 176

Crime in India-2015 177
Chapter - 20
Crime against Senior Citizens
Introduction
Senior citizens are most vulnerable to be victim of any crime, since they are soft targets. The Maintenance and Welfare of Parents and Senior Citizens Act, 2007 define senior citizens as the Indian citizens who have attained the age of 60 years or above. As per the Population Census 2011, population of elderly persons or senior citizens was nearly 1,024.6 lakhs. Since 2014, the Bureau is collecting and publishing data on crimes against senior citizens in order to analyze the trend and patterns on reporting of crimes directed towards this vulnerable group. Data on crimes committed on senior citizens registered under different sections of IPC have been collected and presented in this chapter.
Crime against Senior Citizens (Incidence: 20,532 Rate 20.0)
A total of 20,532 cases of IPC crimes against senior citizens were registered during 2015, showing an increase of 9.7% during the year over previous year 2014 (18,714 cases). Out of 20,532 IPC crimes under crime against senior citizens, maximum cases were registered under cheating (1,867 cases) followed by robbery (1,294 cases), murder (1,053 cases) and grievous hurt (949 cases), contributing 9.1%, 6.3%, 5.1% and 4.6% of total such crimes during 2015 respectively.
State/UT-wise trends reveal that maximum cases of crime against senior citizens were registered in Maharashtra followed by Madhya Pradesh, Andhra Pradesh and Tamil Nadu accounting for 22.2% (4,561 cases), 16.8% (3,456 cases), 12.1% (2,495 cases) and 9.5% (1,947 cases) of total such cases (20,532 cases) respectively during 2015.
A total of 23,615 persons (consisting of 22,252 male and 1,363 female) were arrested under crimes against senior citizens during 2015. Majority of persons arrested for crimes against senior citizens were reported from Madhya Pradesh (5,739) followed by Maharashtra (5,062), Tamil Nadu (2,492), Andhra Pradesh (2,283), Chhattisgarh (1,397)
and Uttar Pradesh (966) during 2015. Crime rate of 20.0 was reported at all
India level during 2015. Delhi has reported the maximum rate of such crime with 108.8 crime rate followed by Madhya Pradesh (60.5), Chhattisgarh (53.7), Andhra Pradesh (51.6), A & N Islands (47.2), Telangana (44.1) and Maharashtra (41.1).
Trend of Major Crimes against Senior
Citizens
Murder (Incidence: 1,053 Rate 1.0)
A total of 1,053 cases of murder of senior citizens were registered during 2015. Most of such cases were registered in Maharashtra (167 cases), Tamil Nadu (162 cases), Uttar Pradesh (151 cases) and Madhya Pradesh (106 cases), these States together accounted for 55.6% (586 cases out of 1,053 cases) of total such cases during 2015.
Out of 1,871 persons arrested for murder of elderly people in the country, maximum number of arrested persons were reported in Uttar Pradesh (449) followed by Maharashtra (258), Tamil Nadu (246) and Madhya Pradesh (214).
Attempt to Commit Murder (Incidence: 456 Rate 0.4)
A total of 456 cases of attempt to commit murder of senior citizens were registered during 2015. Most of such cases were reported in Bihar (94 cases), Tamil Nadu (71 cases) and Maharashtra (62 cases), these States together accounted for 49.8% (227 cases out of 456 cases) of total cases of attempt to commit murder during 2015.
Out of 736 persons arrested for attempt
to commit murder of elderly people, maximum arrested persons were reported from Maharashtra (146 persons) followed by Bihar (110 persons) and Tamil Nadu (100 persons) during 2015.
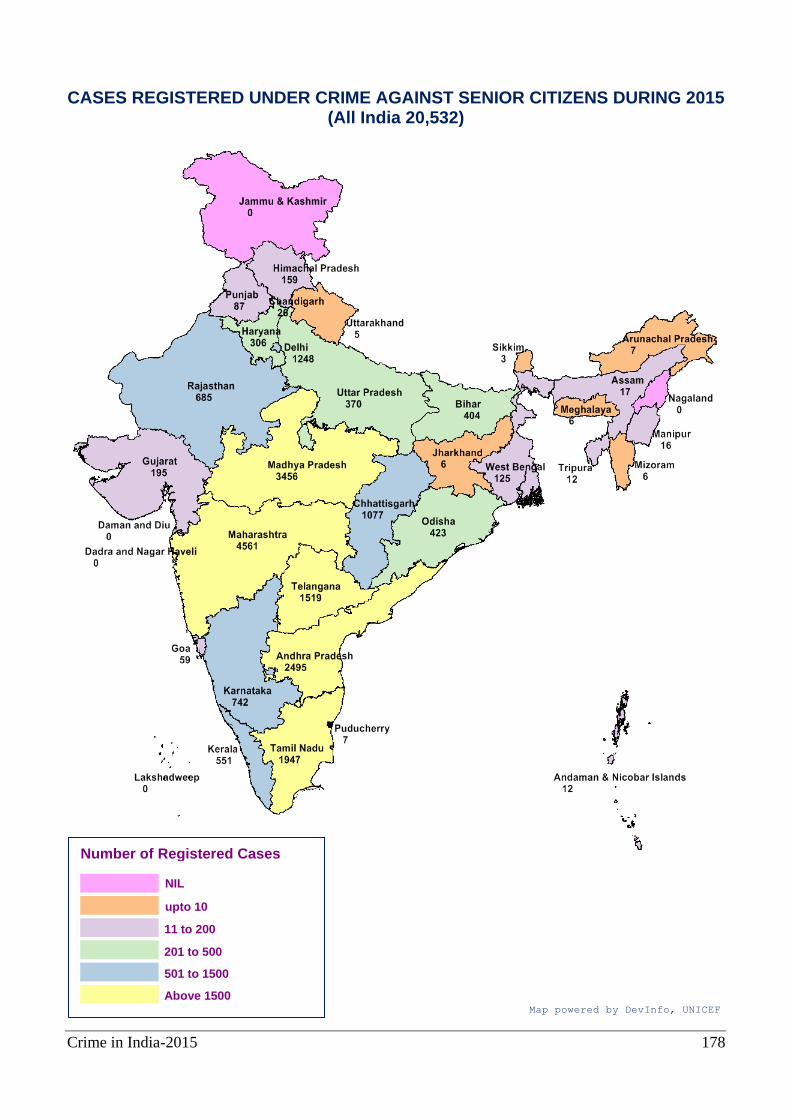
Crime in India-2015 178
CASES REGISTERED UNDER CRIME AGAINST SENIOR CITIZENS DURING 2015 (All India 20,532)
Number of Registered Cases
NIL
11 to 200
Above 1500 Map powered by DevInfo, UNICEF
upto 10
201 to 500
501 to 1500
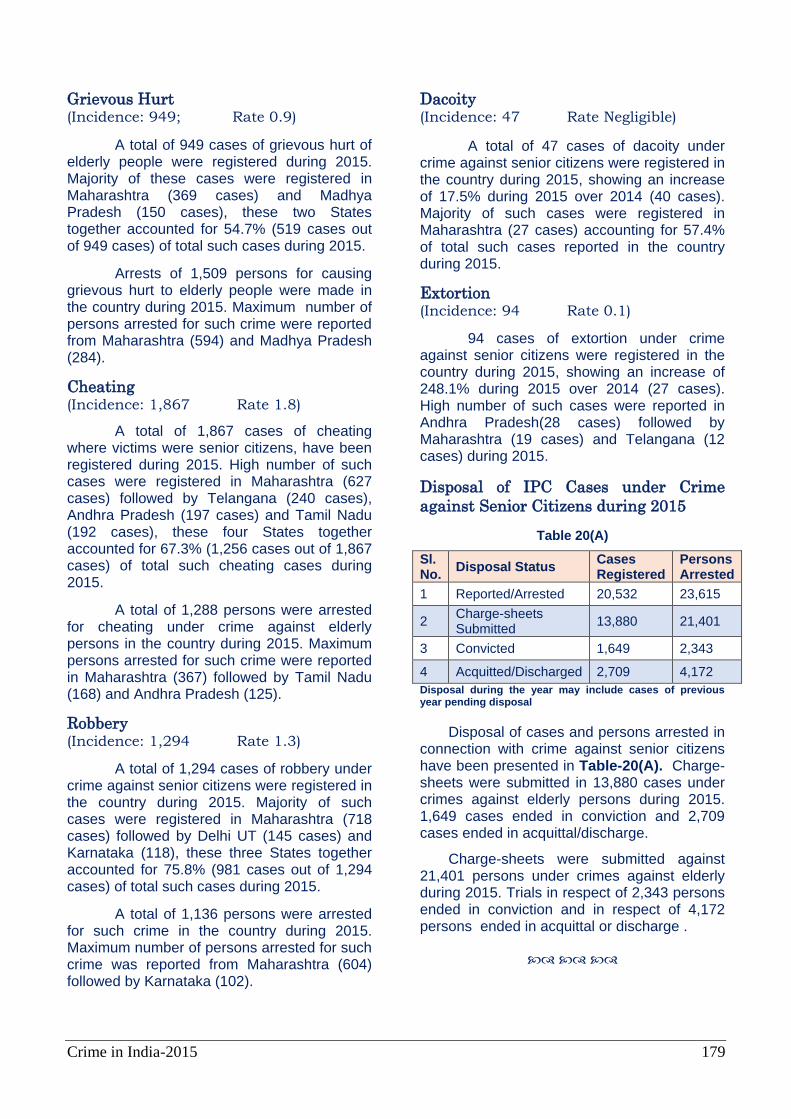
Crime in India-2015 179
Grievous Hurt (Incidence: 949; Rate 0.9)
A total of 949 cases of grievous hurt of elderly people were registered during 2015. Majority of these cases were registered in Maharashtra (369 cases) and Madhya Pradesh (150 cases), these two States together accounted for 54.7% (519 cases out of 949 cases) of total such cases during 2015.
Arrests of 1,509 persons for causing grievous hurt to elderly people were made in the country during 2015. Maximum number of persons arrested for such crime were reported from Maharashtra (594) and Madhya Pradesh (284).
Cheating (Incidence: 1,867 Rate 1.8)
A total of 1,867 cases of cheating where victims were senior citizens, have been registered during 2015. High number of such cases were registered in Maharashtra (627 cases) followed by Telangana (240 cases), Andhra Pradesh (197 cases) and Tamil Nadu (192 cases), these four States together accounted for 67.3% (1,256 cases out of 1,867 cases) of total such cheating cases during 2015.
A total of 1,288 persons were arrested for cheating under crime against elderly persons in the country during 2015. Maximum persons arrested for such crime were reported in Maharashtra (367) followed by Tamil Nadu (168) and Andhra Pradesh (125).
Robbery (Incidence: 1,294 Rate 1.3)
A total of 1,294 cases of robbery under crime against senior citizens were registered in the country during 2015. Majority of such cases were registered in Maharashtra (718 cases) followed by Delhi UT (145 cases) and Karnataka (118), these three States together accounted for 75.8% (981 cases out of 1,294 cases) of total such cases during 2015.
A total of 1,136 persons were arrested for such crime in the country during 2015. Maximum number of persons arrested for such crime was reported from Maharashtra (604) followed by Karnataka (102).
Dacoity (Incidence: 47 Rate Negligible)
A total of 47 cases of dacoity under crime against senior citizens were registered in the country during 2015, showing an increase of 17.5% during 2015 over 2014 (40 cases). Majority of such cases were registered in Maharashtra (27 cases) accounting for 57.4% of total such cases reported in the country during 2015.
Extortion (Incidence: 94 Rate 0.1)
94 cases of extortion under crime against senior citizens were registered in the country during 2015, showing an increase of 248.1% during 2015 over 2014 (27 cases). High number of such cases were reported in Andhra Pradesh(28 cases) followed by Maharashtra (19 cases) and Telangana (12 cases) during 2015.
Disposal of IPC Cases under Crime
against Senior Citizens during 2015
Table 20(A)
Sl. No.
Disposal Status Cases Registered
Persons Arrested
1 Reported/Arrested 20,532 23,615
2 Charge-sheets Submitted
13,880 21,401
3 Convicted 1,649 2,343
4 Acquitted/Discharged 2,709 4,172
Disposal during the year may include cases of previous year pending disposal
Disposal of cases and persons arrested in connection with crime against senior citizens have been presented in Table-20(A). Charge-sheets were submitted in 13,880 cases under crimes against elderly persons during 2015. 1,649 cases ended in conviction and 2,709 cases ended in acquittal/discharge.
Charge-sheets were submitted against 21,401 persons under crimes against elderly during 2015. Trials in respect of 2,343 persons ended in conviction and in respect of 4,172 persons ended in acquittal or discharge .
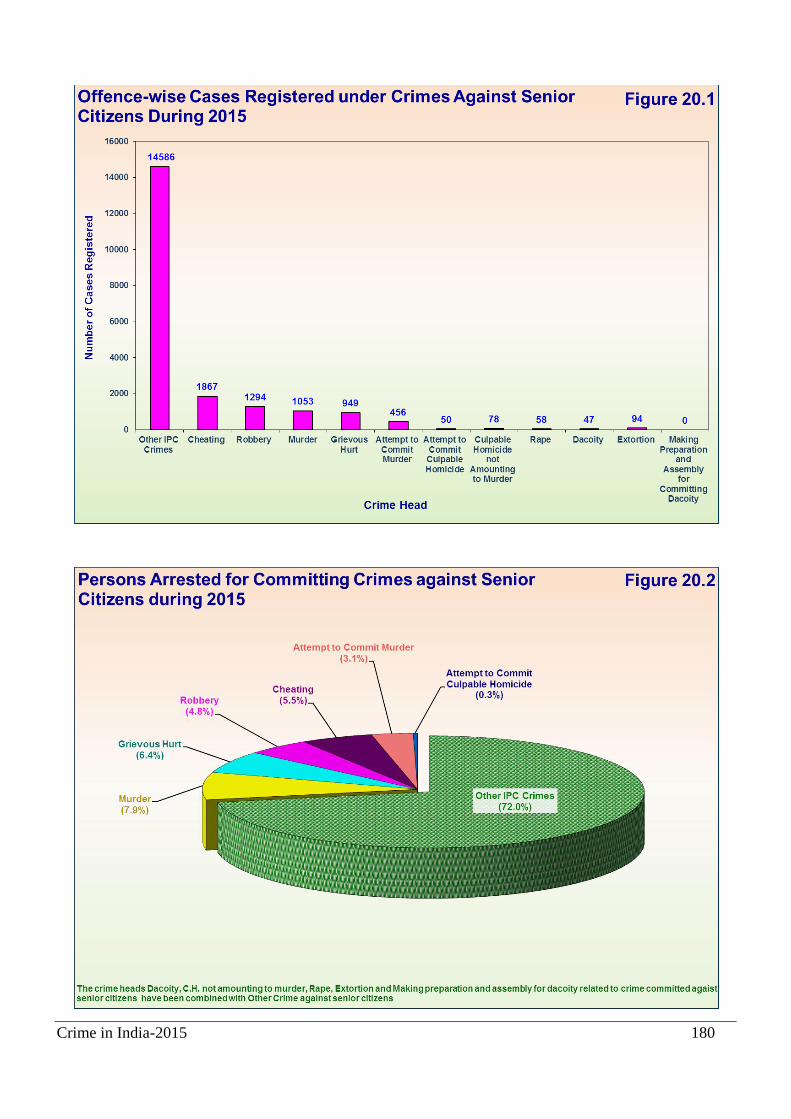
Crime in India-2015 180
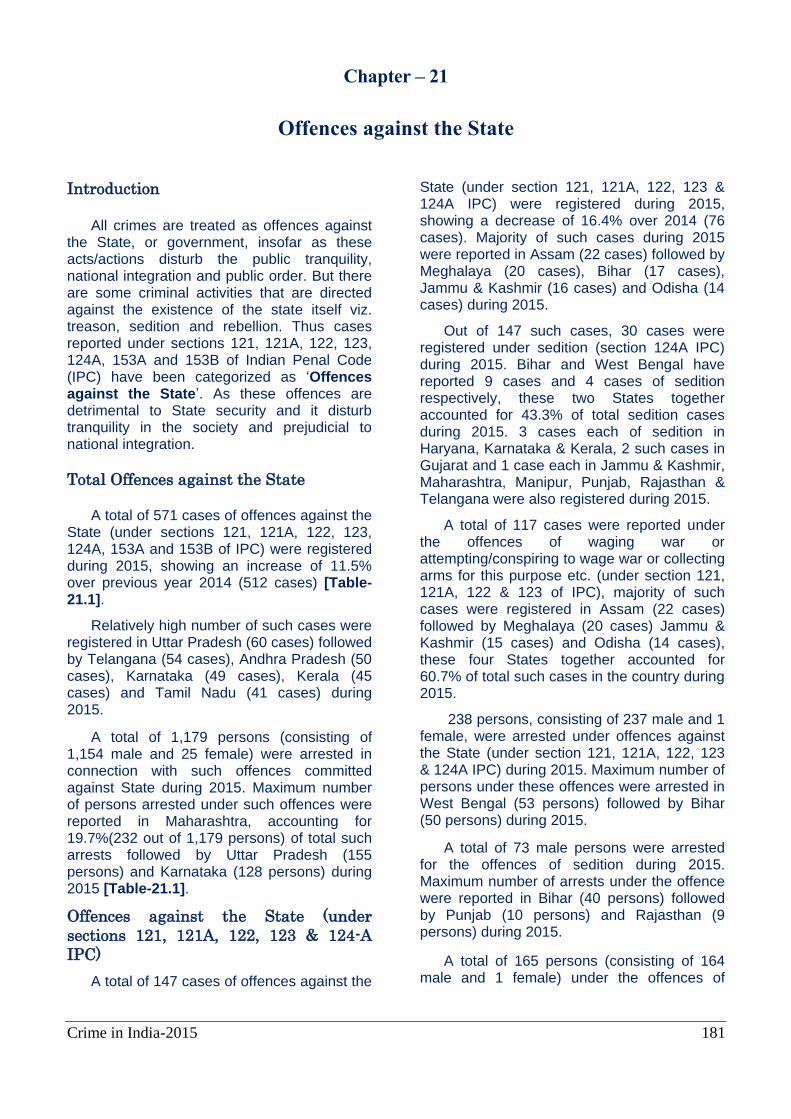
Crime in India-2015 181
Chapter – 21
Offences against the State
Introduction
All crimes are treated as offences against
the State, or government, insofar as these acts/actions disturb the public tranquility, national integration and public order. But there are some criminal activities that are directed against the existence of the state itself viz. treason, sedition and rebellion. Thus cases reported under sections 121, 121A, 122, 123, 124A, 153A and 153B of Indian Penal Code (IPC) have been categorized as ‘Offences against the State’. As these offences are detrimental to State security and it disturb tranquility in the society and prejudicial to national integration.
Total Offences against the State
A total of 571 cases of offences against the State (under sections 121, 121A, 122, 123, 124A, 153A and 153B of IPC) were registered during 2015, showing an increase of 11.5% over previous year 2014 (512 cases) [Table-21.1].
Relatively high number of such cases were registered in Uttar Pradesh (60 cases) followed by Telangana (54 cases), Andhra Pradesh (50 cases), Karnataka (49 cases), Kerala (45 cases) and Tamil Nadu (41 cases) during 2015.
A total of 1,179 persons (consisting of 1,154 male and 25 female) were arrested in connection with such offences committed against State during 2015. Maximum number of persons arrested under such offences were reported in Maharashtra, accounting for 19.7%(232 out of 1,179 persons) of total such arrests followed by Uttar Pradesh (155 persons) and Karnataka (128 persons) during 2015 [Table-21.1].
Offences against the State (under
sections 121, 121A, 122, 123 & 124-A
IPC)
A total of 147 cases of offences against the
State (under section 121, 121A, 122, 123 & 124A IPC) were registered during 2015, showing a decrease of 16.4% over 2014 (76 cases). Majority of such cases during 2015 were reported in Assam (22 cases) followed by Meghalaya (20 cases), Bihar (17 cases), Jammu & Kashmir (16 cases) and Odisha (14 cases) during 2015.
Out of 147 such cases, 30 cases were registered under sedition (section 124A IPC) during 2015. Bihar and West Bengal have reported 9 cases and 4 cases of sedition respectively, these two States together accounted for 43.3% of total sedition cases during 2015. 3 cases each of sedition in Haryana, Karnataka & Kerala, 2 such cases in Gujarat and 1 case each in Jammu & Kashmir, Maharashtra, Manipur, Punjab, Rajasthan & Telangana were also registered during 2015.
A total of 117 cases were reported under the offences of waging war or attempting/conspiring to wage war or collecting arms for this purpose etc. (under section 121, 121A, 122 & 123 of IPC), majority of such cases were registered in Assam (22 cases) followed by Meghalaya (20 cases) Jammu & Kashmir (15 cases) and Odisha (14 cases), these four States together accounted for 60.7% of total such cases in the country during 2015.
238 persons, consisting of 237 male and 1 female, were arrested under offences against the State (under section 121, 121A, 122, 123 & 124A IPC) during 2015. Maximum number of persons under these offences were arrested in West Bengal (53 persons) followed by Bihar (50 persons) during 2015.
A total of 73 male persons were arrested for the offences of sedition during 2015. Maximum number of arrests under the offence were reported in Bihar (40 persons) followed by Punjab (10 persons) and Rajasthan (9 persons) during 2015.
A total of 165 persons (consisting of 164
male and 1 female) under the offences of
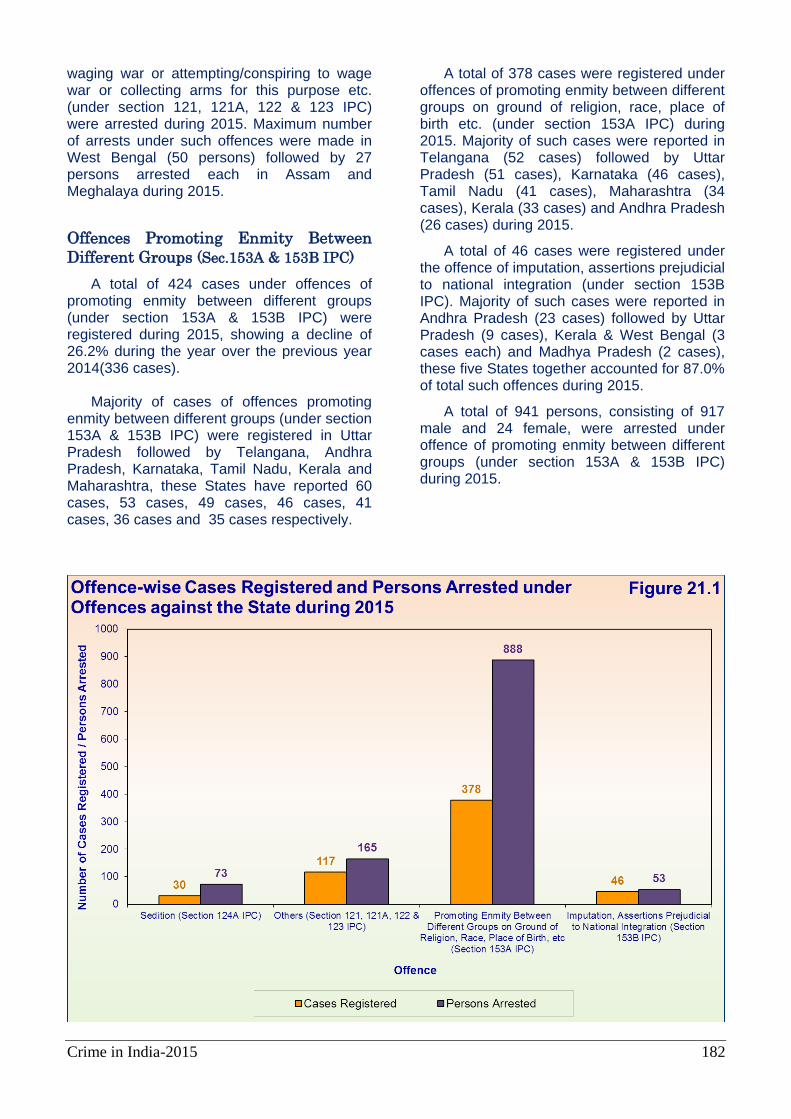
Crime in India-2015 182
waging war or attempting/conspiring to wage war or collecting arms for this purpose etc. (under section 121, 121A, 122 & 123 IPC) were arrested during 2015. Maximum number of arrests under such offences were made in West Bengal (50 persons) followed by 27 persons arrested each in Assam and Meghalaya during 2015.
Offences Promoting Enmity Between
Different Groups (Sec.153A & 153B IPC)
A total of 424 cases under offences of promoting enmity between different groups (under section 153A & 153B IPC) were registered during 2015, showing a decline of 26.2% during the year over the previous year 2014(336 cases).
Majority of cases of offences promoting
enmity between different groups (under section 153A & 153B IPC) were registered in Uttar Pradesh followed by Telangana, Andhra Pradesh, Karnataka, Tamil Nadu, Kerala and Maharashtra, these States have reported 60 cases, 53 cases, 49 cases, 46 cases, 41 cases, 36 cases and 35 cases respectively.
A total of 378 cases were registered under offences of promoting enmity between different groups on ground of religion, race, place of birth etc. (under section 153A IPC) during 2015. Majority of such cases were reported in Telangana (52 cases) followed by Uttar Pradesh (51 cases), Karnataka (46 cases), Tamil Nadu (41 cases), Maharashtra (34 cases), Kerala (33 cases) and Andhra Pradesh (26 cases) during 2015.
A total of 46 cases were registered under the offence of imputation, assertions prejudicial to national integration (under section 153B IPC). Majority of such cases were reported in Andhra Pradesh (23 cases) followed by Uttar Pradesh (9 cases), Kerala & West Bengal (3 cases each) and Madhya Pradesh (2 cases), these five States together accounted for 87.0% of total such offences during 2015.
A total of 941 persons, consisting of 917 male and 24 female, were arrested under offence of promoting enmity between different groups (under section 153A & 153B IPC) during 2015.

Crime in India-2015 183
CASES REGISTERED UNDER OFFENCES AGAINST STATE (IPC) DURING 2015
(All India 571)
Number of Registered Cases
NIL
6 to 15
Above 35 Map Powered by DevInfo, UNICEF
upto 5
16 to 20
21 to 35
Crime in India-2015 184
Maximum number of persons under these offences were arrested in Maharashtra (232 out of 941 persons) followed by Uttar Pradesh (155 persons), Karnataka (124 persons), Andhra Pradesh (80 persons), Kerala (66 persons), Rajasthan (56 persons) and Tamil Nadu (53 persons) during 2015.
Under offences of promoting enmity
between different groups on ground of religion, race, place of birth etc. (under section 153A IPC), 888 persons were arrested during 2015. Maximum number of persons under these offences were arrested in Maharashtra (229 out of 888 persons) followed by Uttar Pradesh (143 persons), Karnataka (124 persons), Andhra Pradesh (68 persons), Kerala (61
persons) and Rajasthan (56 persons) during 2015.
Under the offence of imputation, assertions
prejudicial to national integration (under section 153B IPC), 53 persons were arrested during the year 2015. A total of 15 persons in Madhya Pradesh, 12 persons each in Andhra Pradesh & Uttar Pradesh, 5 persons in Kerala, 3 persons in West Bengal and 2 persons in Haryana were arrested under offence of imputation, assertions prejudicial to national integration (under section 153B IPC) during 2015.
176
336
512
147
424
571
0
100
200
300
400
500
600
Offences Against State Offences Promoting EnmityBetween Different Group
Total Offences Against the State
Trend of Cases Reported under Total Offences Against the State
during 2014 - 2015
2014 2015
Figure 21.2
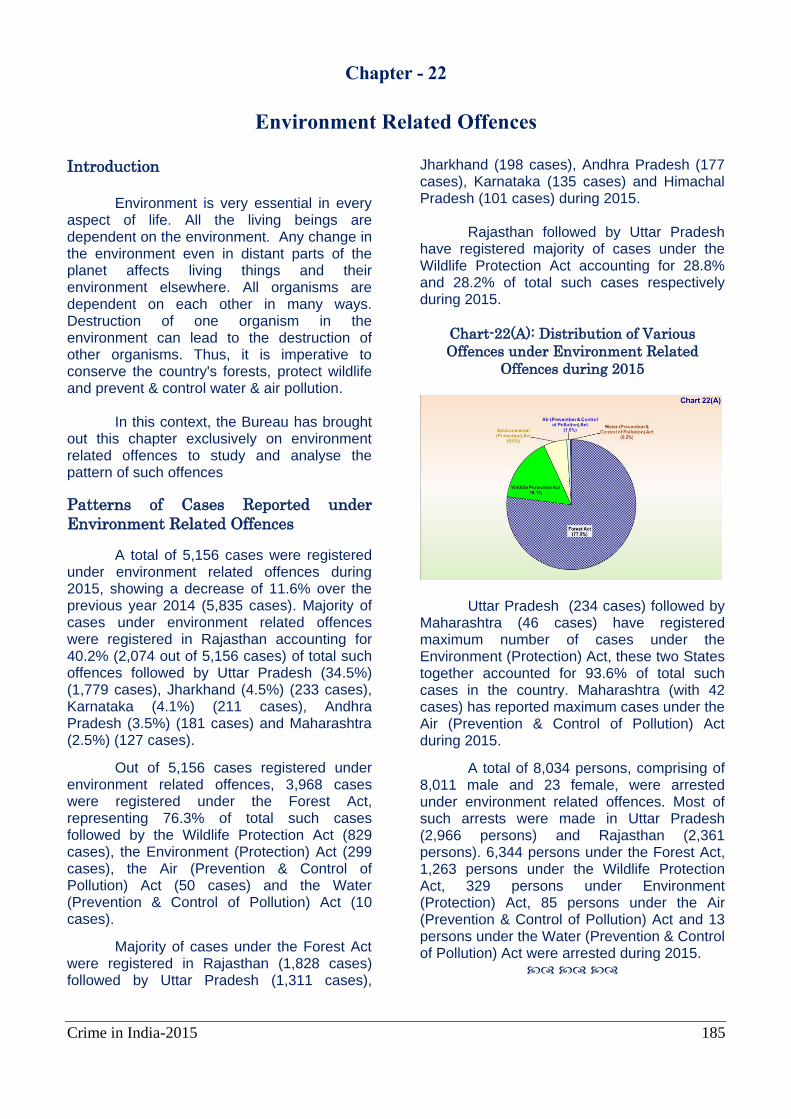
Crime in India-2015 185
Chapter - 22
Environment Related Offences
Introduction
Environment is very essential in every
aspect of life. All the living beings are dependent on the environment. Any change in the environment even in distant parts of the planet affects living things and their environment elsewhere. All organisms are dependent on each other in many ways. Destruction of one organism in the environment can lead to the destruction of other organisms. Thus, it is imperative to conserve the country's forests, protect wildlife and prevent & control water & air pollution.
In this context, the Bureau has brought out this chapter exclusively on environment related offences to study and analyse the pattern of such offences
Patterns of Cases Reported under
Environment Related Offences
A total of 5,156 cases were registered under environment related offences during 2015, showing a decrease of 11.6% over the previous year 2014 (5,835 cases). Majority of cases under environment related offences were registered in Rajasthan accounting for 40.2% (2,074 out of 5,156 cases) of total such offences followed by Uttar Pradesh (34.5%) (1,779 cases), Jharkhand (4.5%) (233 cases), Karnataka (4.1%) (211 cases), Andhra Pradesh (3.5%) (181 cases) and Maharashtra (2.5%) (127 cases).
Out of 5,156 cases registered under environment related offences, 3,968 cases were registered under the Forest Act, representing 76.3% of total such cases followed by the Wildlife Protection Act (829 cases), the Environment (Protection) Act (299 cases), the Air (Prevention & Control of Pollution) Act (50 cases) and the Water (Prevention & Control of Pollution) Act (10 cases).
Majority of cases under the Forest Act were registered in Rajasthan (1,828 cases) followed by Uttar Pradesh (1,311 cases),
Jharkhand (198 cases), Andhra Pradesh (177 cases), Karnataka (135 cases) and Himachal Pradesh (101 cases) during 2015.
Rajasthan followed by Uttar Pradesh have registered majority of cases under the Wildlife Protection Act accounting for 28.8% and 28.2% of total such cases respectively during 2015.
Chart-22(A): Distribution of Various
Offences under Environment Related
Offences during 2015
Uttar Pradesh (234 cases) followed by Maharashtra (46 cases) have registered maximum number of cases under the Environment (Protection) Act, these two States together accounted for 93.6% of total such cases in the country. Maharashtra (with 42 cases) has reported maximum cases under the Air (Prevention & Control of Pollution) Act during 2015.
A total of 8,034 persons, comprising of 8,011 male and 23 female, were arrested under environment related offences. Most of such arrests were made in Uttar Pradesh (2,966 persons) and Rajasthan (2,361 persons). 6,344 persons under the Forest Act, 1,263 persons under the Wildlife Protection Act, 329 persons under Environment (Protection) Act, 85 persons under the Air (Prevention & Control of Pollution) Act and 13 persons under the Water (Prevention & Control of Pollution) Act were arrested during 2015.
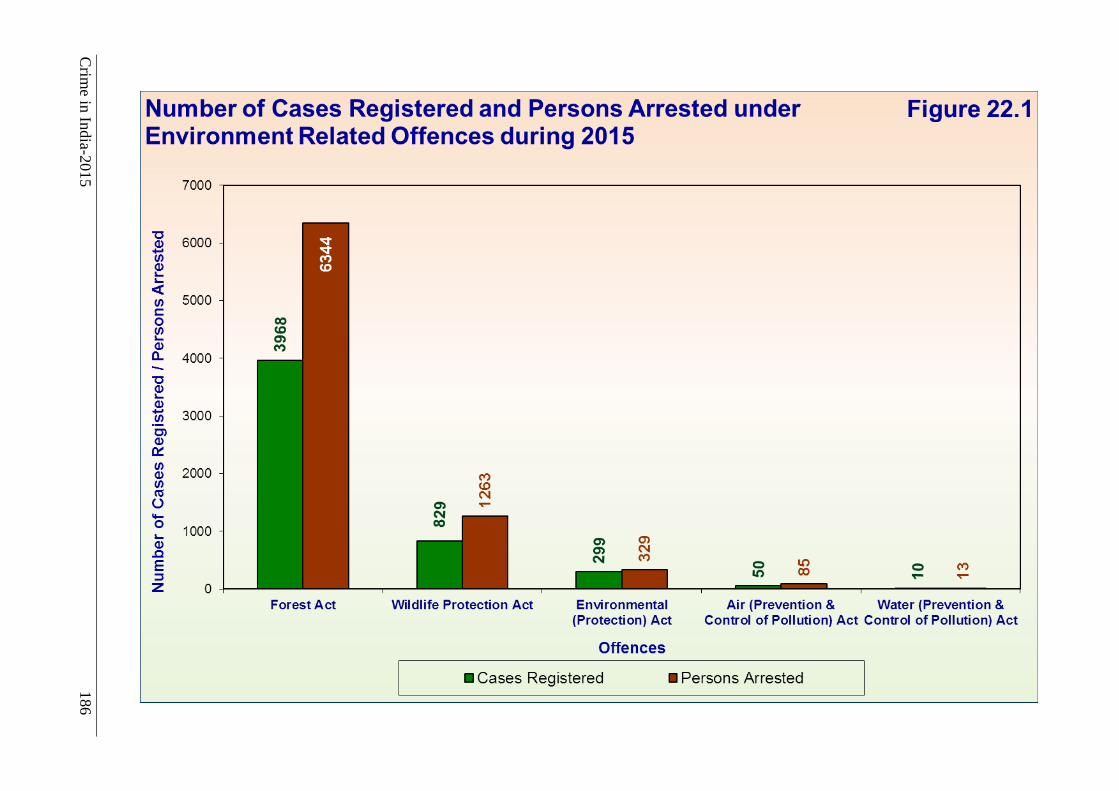
Crim
e in In
dia-2
015
186
Crime in India-2015 187
Chapter – 23
Kidnapping & Abduction of Persons
Trend of Kidnapping & Abduction (2011 – 2015)
The incidents of kidnapping and
abduction are found to be continuously
increasing during last five years (from 2011 to
2015). In recent years, the share of cases
reported under kidnapping and abduction
w.r.t. total IPC crimes has continuously
increased. The share of cases of kidnapping
& abduction was 1.9% of total IPC crimes in
2011, which increased to 2.0% in 2012, which
further increased to 2.5% in 2013, 2.7% in
2014 and 2.8% in 2015.
Kidnapping & Abduction (Incidence: 82,999 Rate: 6.6)
A total of 82,999 cases of kidnapping
& abduction were registered during the year
2015, showing an increase of 263.5% over
2005 level (22,832 cases), an increase of
51.8% over the quinquennial average of
2010-2014 and an increase of 7.5% over the
previous year (77,237 cases). Maximum
number of cases of kidnappings & abductions
were registered in Uttar Pradesh (11,999
cases) accounting for 14.5% of total such
cases followed by 9.9% in Maharashtra
(8,255 cases), 9.3% in Delhi UT (7,730 cases)
and 8.6% in Bihar (7,128 cases). The rate of
crime was highest in Delhi UT (37.0) followed
by Assam (18.1), Arunachal Pradesh (13.4)
and Chandigarh (13.2). The details can be
seen in Table-23.1.
Victims of Kidnapping and Abduction
Persons are kidnapped/abducted by
criminals for various reasons and intentions i.e.
for adoption, begging, camel racing, illicit
intercourse, marriage, prostitution, ransom,
revenge, sale, selling body parts, slavery,
unlawful activity, murder and for other
purposes.
State/UT-wise, sex-wise and age
group-wise victims of kidnapping & abduction
are presented in Table-23.2. The purpose
wise, age group-wise and sex wise break-up
of victims of kidnapping & abduction at all –
India level is presented at Table-23.3.
Maximum number of victims of
kidnapping & abduction were under the age-
group of 18 years & above – below 30 years
which accounted for 36.6%(30,923 out of
84,483 victims) of the total victims of
kidnapping & abduction during the year 2015.
Uttar Pradesh has reported the highest
number of kidnapping & abduction of persons
accounting for 14.2% (12,034 out of 84,483
victims) of total kidnapped/abducted persons.
Maharashtra (8,576 persons), Delhi UT (8,257
persons), Bihar (7,131 persons) and Madhya
Pradesh (6,856 persons) have also reported
10.1%, 9.8%, 8.4% and 8.1% of total
kidnapped & abducted persons respectively.
Madhya Pradesh has reported the
maximum kidnapping or abduction of children
(below 6 years) accounting for 24.6% (533 out
of 2,163) of total such kidnappings &
abductions. Delhi UT has reported highest
number of kidnapped or abducted children
belonging to age group 6 years – below 12
years accounting for 26.8%(1,224 out of
7,726 children) of total such kidnapped or
abducted children. Delhi UT has also reported
highest kidnapping/abduction of children
belonging to age group 12 years-below 16
years accounting for 19.1%(3,260 out of
17,047 children) of total such kidnapped or
abducted children. Uttar Pradesh has highest
kidnapping or abduction of 3,405 children
belonging to age group 16 years – below 18
years accounting for 17.7% of total such
kidnapped or abducted children. Uttar
Pradesh has also reported maximum number
of victims under the age group of 18 year &
above – below 30 years accounting for 16.0%
(4,963 out of 30,923 persons) of total such
kidnaping & abduction of person. Assam has
reported the maximum victims under the age
group of 30 years - below 45 years
accounting for 22.0% (2,016 out of 9,139
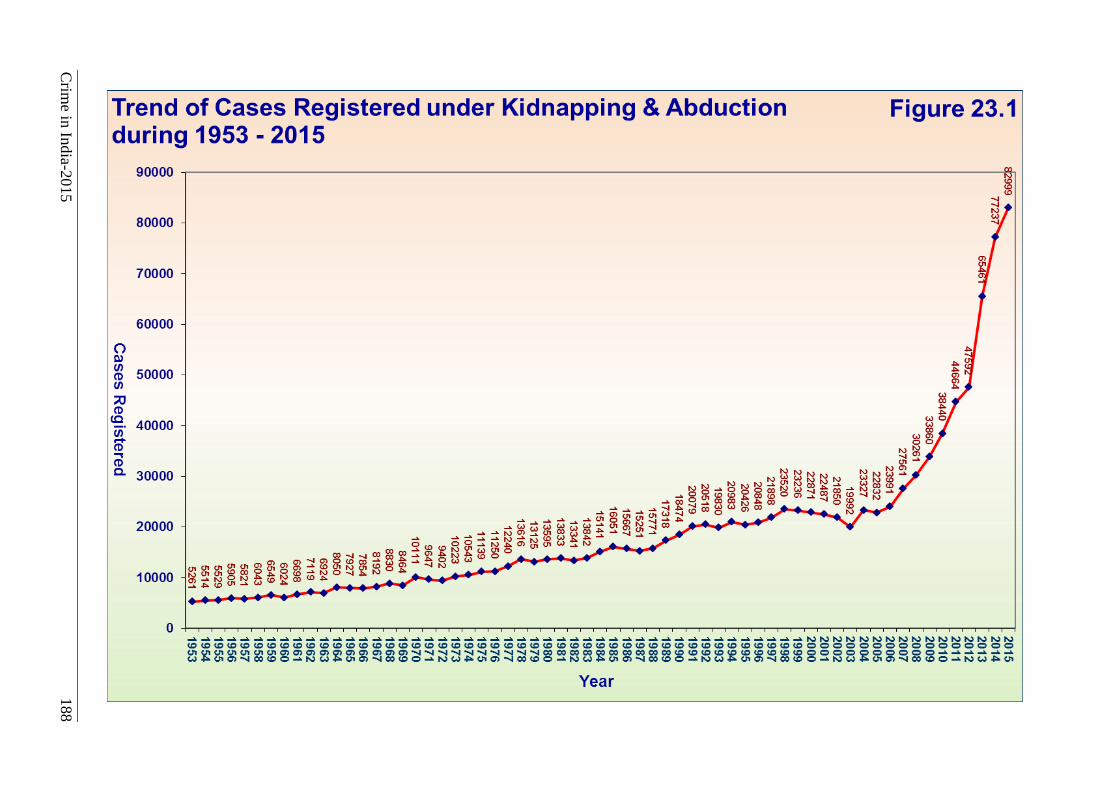
Crim
e in In
dia-2
015
188
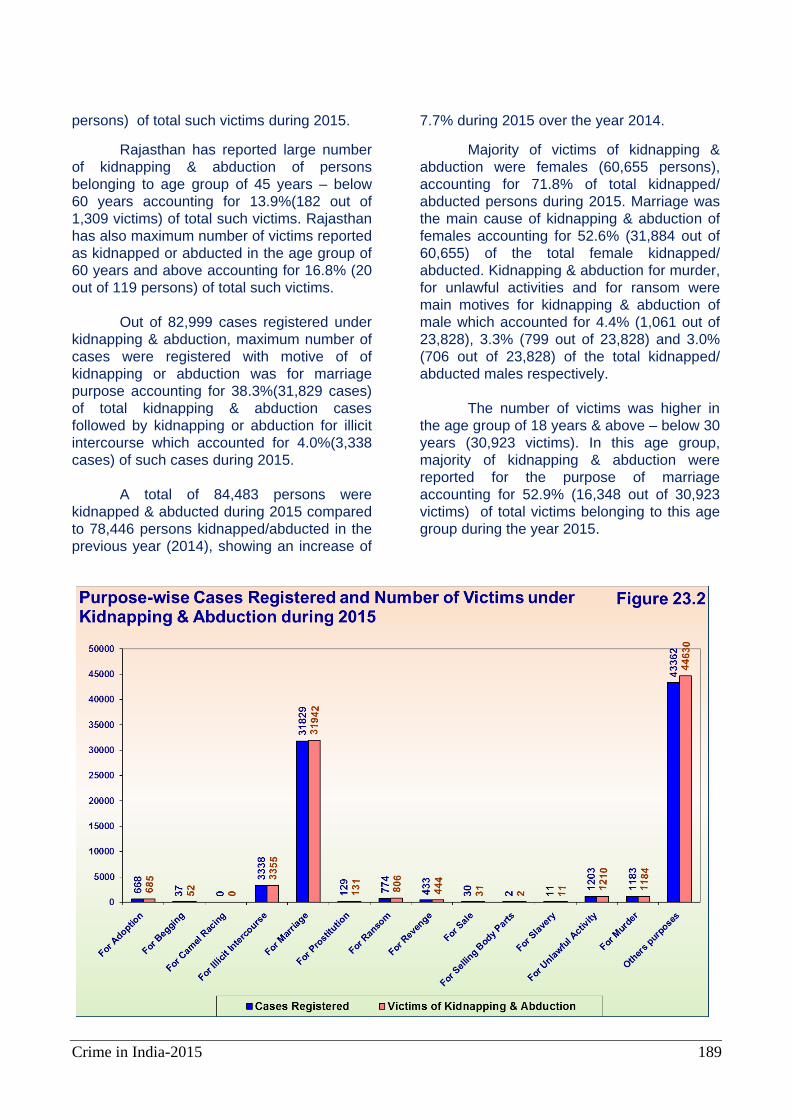
Crime in India-2015 189
persons) of total such victims during 2015.
Rajasthan has reported large number
of kidnapping & abduction of persons
belonging to age group of 45 years – below
60 years accounting for 13.9%(182 out of
1,309 victims) of total such victims. Rajasthan
has also maximum number of victims reported
as kidnapped or abducted in the age group of
60 years and above accounting for 16.8% (20
out of 119 persons) of total such victims.
Out of 82,999 cases registered under
kidnapping & abduction, maximum number of
cases were registered with motive of of
kidnapping or abduction was for marriage
purpose accounting for 38.3%(31,829 cases)
of total kidnapping & abduction cases
followed by kidnapping or abduction for illicit
intercourse which accounted for 4.0%(3,338
cases) of such cases during 2015.
A total of 84,483 persons were
kidnapped & abducted during 2015 compared
to 78,446 persons kidnapped/abducted in the
previous year (2014), showing an increase of
7.7% during 2015 over the year 2014.
Majority of victims of kidnapping &
abduction were females (60,655 persons),
accounting for 71.8% of total kidnapped/
abducted persons during 2015. Marriage was
the main cause of kidnapping & abduction of
females accounting for 52.6% (31,884 out of
60,655) of the total female kidnapped/
abducted. Kidnapping & abduction for murder,
for unlawful activities and for ransom were
main motives for kidnapping & abduction of
male which accounted for 4.4% (1,061 out of
23,828), 3.3% (799 out of 23,828) and 3.0%
(706 out of 23,828) of the total kidnapped/
abducted males respectively.
The number of victims was higher in
the age group of 18 years & above – below 30
years (30,923 victims). In this age group,
majority of kidnapping & abduction were
reported for the purpose of marriage
accounting for 52.9% (16,348 out of 30,923
victims) of total victims belonging to this age
group during the year 2015.
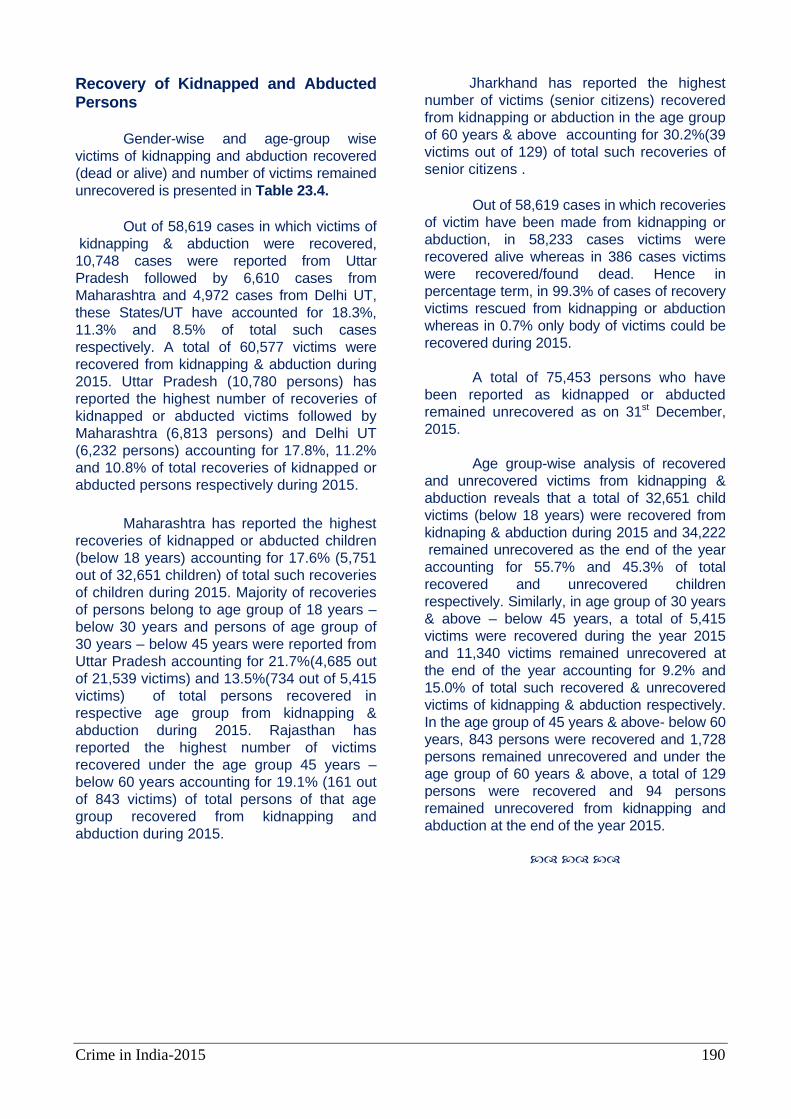
Crime in India-2015 190
Recovery of Kidnapped and Abducted Persons Gender-wise and age-group wise
victims of kidnapping and abduction recovered
(dead or alive) and number of victims remained
unrecovered is presented in Table 23.4.
Out of 58,619 cases in which victims of
kidnapping & abduction were recovered,
10,748 cases were reported from Uttar
Pradesh followed by 6,610 cases from
Maharashtra and 4,972 cases from Delhi UT,
these States/UT have accounted for 18.3%,
11.3% and 8.5% of total such cases
respectively. A total of 60,577 victims were
recovered from kidnapping & abduction during
2015. Uttar Pradesh (10,780 persons) has
reported the highest number of recoveries of
kidnapped or abducted victims followed by
Maharashtra (6,813 persons) and Delhi UT
(6,232 persons) accounting for 17.8%, 11.2%
and 10.8% of total recoveries of kidnapped or
abducted persons respectively during 2015.
Maharashtra has reported the highest
recoveries of kidnapped or abducted children
(below 18 years) accounting for 17.6% (5,751
out of 32,651 children) of total such recoveries
of children during 2015. Majority of recoveries
of persons belong to age group of 18 years –
below 30 years and persons of age group of
30 years – below 45 years were reported from
Uttar Pradesh accounting for 21.7%(4,685 out
of 21,539 victims) and 13.5%(734 out of 5,415
victims) of total persons recovered in
respective age group from kidnapping &
abduction during 2015. Rajasthan has
reported the highest number of victims
recovered under the age group 45 years –
below 60 years accounting for 19.1% (161 out
of 843 victims) of total persons of that age
group recovered from kidnapping and
abduction during 2015.
Jharkhand has reported the highest
number of victims (senior citizens) recovered
from kidnapping or abduction in the age group
of 60 years & above accounting for 30.2%(39
victims out of 129) of total such recoveries of
senior citizens .
Out of 58,619 cases in which recoveries
of victim have been made from kidnapping or
abduction, in 58,233 cases victims were
recovered alive whereas in 386 cases victims
were recovered/found dead. Hence in
percentage term, in 99.3% of cases of recovery
victims rescued from kidnapping or abduction
whereas in 0.7% only body of victims could be
recovered during 2015.
A total of 75,453 persons who have
been reported as kidnapped or abducted
remained unrecovered as on 31st December,
2015.
Age group-wise analysis of recovered
and unrecovered victims from kidnapping &
abduction reveals that a total of 32,651 child
victims (below 18 years) were recovered from
kidnaping & abduction during 2015 and 34,222
remained unrecovered as the end of the year
accounting for 55.7% and 45.3% of total
recovered and unrecovered children
respectively. Similarly, in age group of 30 years
& above – below 45 years, a total of 5,415
victims were recovered during the year 2015
and 11,340 victims remained unrecovered at
the end of the year accounting for 9.2% and
15.0% of total such recovered & unrecovered
victims of kidnapping & abduction respectively.
In the age group of 45 years & above- below 60
years, 843 persons were recovered and 1,728
persons remained unrecovered and under the
age group of 60 years & above, a total of 129
persons were recovered and 94 persons
remained unrecovered from kidnapping and
abduction at the end of the year 2015.
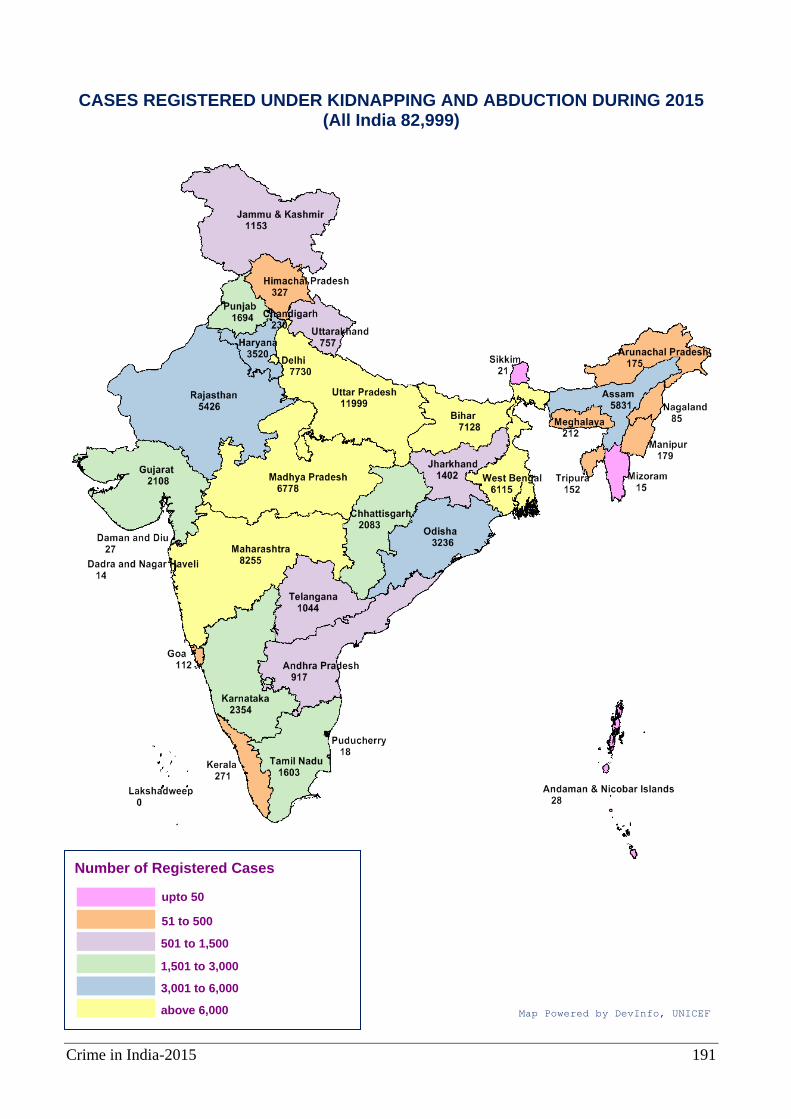
Crime in India-2015 191
CASES REGISTERED UNDER KIDNAPPING AND ABDUCTION DURING 2015 (All India 82,999)
Number of Registered Cases
upto 50
501 to 1,500
above 6,000 Map Powered by DevInfo, UNICEF
51 to 500
1,501 to 3,000
3,001 to 6,000
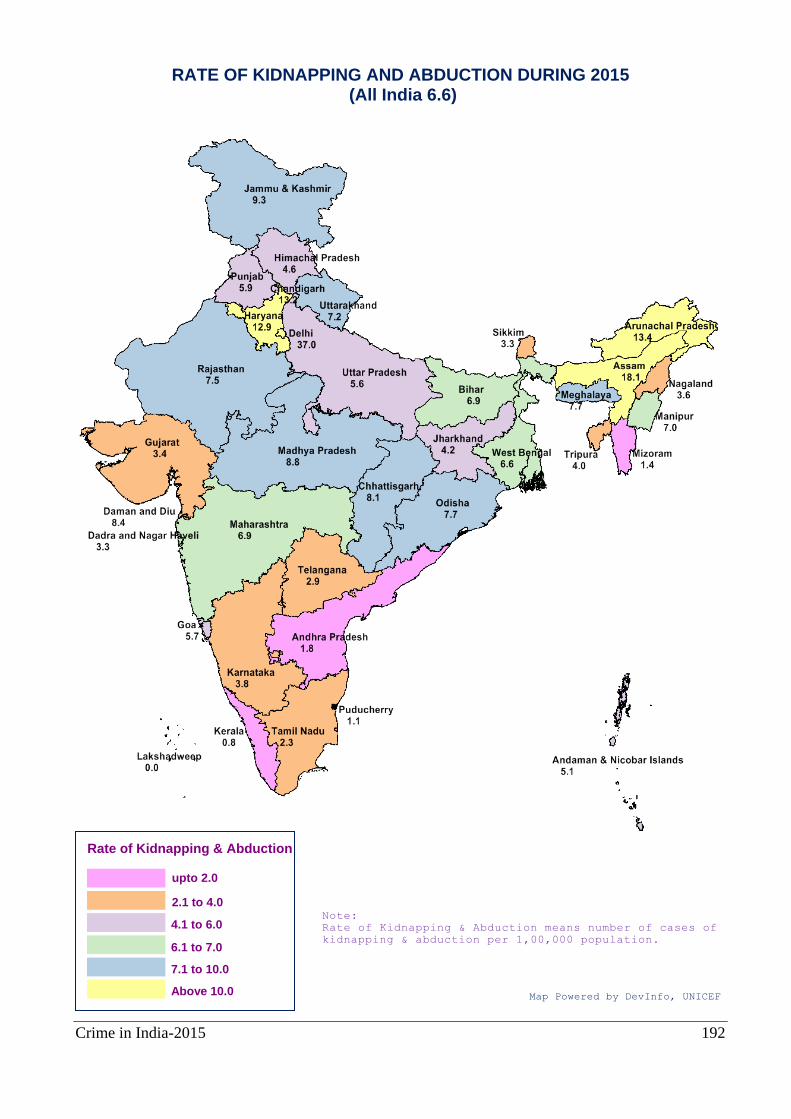
Crime in India-2015 192
RATE OF KIDNAPPING AND ABDUCTION DURING 2015 (All India 6.6)
Rate of Kidnapping & Abduction
upto 2.0
4.1 to 6.0
Above 10.0 Map Powered by DevInfo, UNICEF
2.1 to 4.0
6.1 to 7.0
7.1 to 10.0
Note:
Rate of Kidnapping & Abduction means number of cases of
kidnapping & abduction per 1,00,000 population.
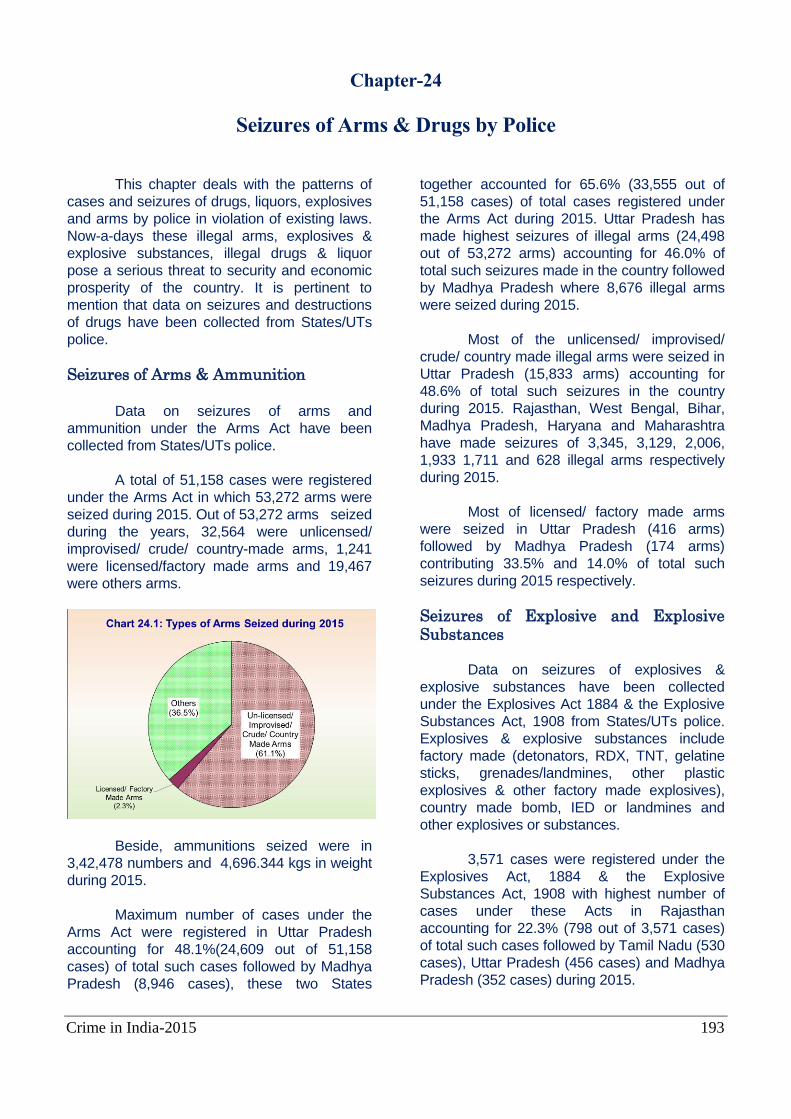
Crime in India-2015 193
Chapter-24
Seizures of Arms & Drugs by Police
This chapter deals with the patterns of
cases and seizures of drugs, liquors, explosives
and arms by police in violation of existing laws.
Now-a-days these illegal arms, explosives &
explosive substances, illegal drugs & liquor
pose a serious threat to security and economic
prosperity of the country. It is pertinent to
mention that data on seizures and destructions
of drugs have been collected from States/UTs
police.
Seizures of Arms & Ammunition
Data on seizures of arms and
ammunition under the Arms Act have been
collected from States/UTs police.
A total of 51,158 cases were registered
under the Arms Act in which 53,272 arms were
seized during 2015. Out of 53,272 arms seized
during the years, 32,564 were unlicensed/
improvised/ crude/ country-made arms, 1,241
were licensed/factory made arms and 19,467
were others arms.
Beside, ammunitions seized were in
3,42,478 numbers and 4,696.344 kgs in weight
during 2015.
Maximum number of cases under the
Arms Act were registered in Uttar Pradesh
accounting for 48.1%(24,609 out of 51,158
cases) of total such cases followed by Madhya
Pradesh (8,946 cases), these two States
together accounted for 65.6% (33,555 out of
51,158 cases) of total cases registered under
the Arms Act during 2015. Uttar Pradesh has
made highest seizures of illegal arms (24,498
out of 53,272 arms) accounting for 46.0% of
total such seizures made in the country followed
by Madhya Pradesh where 8,676 illegal arms
were seized during 2015.
Most of the unlicensed/ improvised/
crude/ country made illegal arms were seized in
Uttar Pradesh (15,833 arms) accounting for
48.6% of total such seizures in the country
during 2015. Rajasthan, West Bengal, Bihar,
Madhya Pradesh, Haryana and Maharashtra
have made seizures of 3,345, 3,129, 2,006,
1,933 1,711 and 628 illegal arms respectively
during 2015.
Most of licensed/ factory made arms
were seized in Uttar Pradesh (416 arms)
followed by Madhya Pradesh (174 arms)
contributing 33.5% and 14.0% of total such
seizures during 2015 respectively.
Seizures of Explosive and Explosive Substances
Data on seizures of explosives &
explosive substances have been collected
under the Explosives Act 1884 & the Explosive
Substances Act, 1908 from States/UTs police.
Explosives & explosive substances include
factory made (detonators, RDX, TNT, gelatine
sticks, grenades/landmines, other plastic
explosives & other factory made explosives),
country made bomb, IED or landmines and
other explosives or substances.
3,571 cases were registered under the
Explosives Act, 1884 & the Explosive
Substances Act, 1908 with highest number of
cases under these Acts in Rajasthan
accounting for 22.3% (798 out of 3,571 cases)
of total such cases followed by Tamil Nadu (530
cases), Uttar Pradesh (456 cases) and Madhya
Pradesh (352 cases) during 2015.
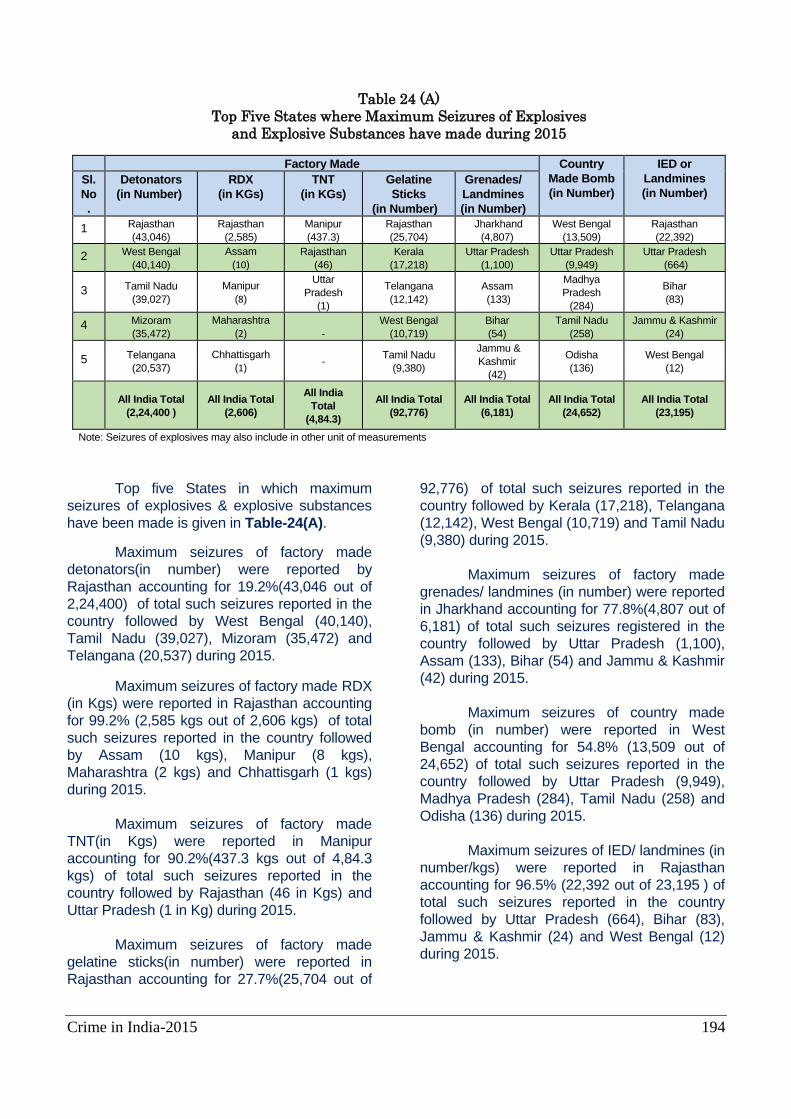
Crime in India-2015 194
Table 24 (A)
Top Five States where Maximum Seizures of Explosives
and Explosive Substances have made during 2015
Factory Made Country
Made Bomb
(in Number)
IED or
Landmines
(in Number) Sl.
No
.
Detonators
(in Number)
RDX
(in KGs)
TNT
(in KGs)
Gelatine
Sticks
(in Number)
Grenades/
Landmines
(in Number)
1 Rajasthan
(43,046)
Rajasthan
(2,585)
Manipur
(437.3)
Rajasthan
(25,704)
Jharkhand
(4,807)
West Bengal
(13,509)
Rajasthan
(22,392)
2 West Bengal
(40,140)
Assam
(10)
Rajasthan
(46)
Kerala
(17,218)
Uttar Pradesh
(1,100)
Uttar Pradesh
(9,949)
Uttar Pradesh
(664)
3 Tamil Nadu
(39,027)
Manipur
(8)
Uttar
Pradesh
(1)
Telangana
(12,142)
Assam
(133)
Madhya
Pradesh
(284)
Bihar
(83)
4 Mizoram
(35,472)
Maharashtra
(2)
-
West Bengal
(10,719)
Bihar
(54)
Tamil Nadu
(258)
Jammu & Kashmir
(24)
5 Telangana
(20,537)
Chhattisgarh
(1) -
Tamil Nadu
(9,380)
Jammu &
Kashmir
(42)
Odisha
(136)
West Bengal
(12)
All India Total
(2,24,400 )
All India Total
(2,606)
All India
Total
(4,84.3)
All India Total
(92,776) All India Total
(6,181) All India Total
(24,652)
All India Total
(23,195)
Note: Seizures of explosives may also include in other unit of measurements
Top five States in which maximum
seizures of explosives & explosive substances
have been made is given in Table-24(A).
Maximum seizures of factory made
detonators(in number) were reported by
Rajasthan accounting for 19.2%(43,046 out of
2,24,400) of total such seizures reported in the
country followed by West Bengal (40,140),
Tamil Nadu (39,027), Mizoram (35,472) and
Telangana (20,537) during 2015.
Maximum seizures of factory made RDX
(in Kgs) were reported in Rajasthan accounting
for 99.2% (2,585 kgs out of 2,606 kgs) of total
such seizures reported in the country followed
by Assam (10 kgs), Manipur (8 kgs),
Maharashtra (2 kgs) and Chhattisgarh (1 kgs)
during 2015.
Maximum seizures of factory made
TNT(in Kgs) were reported in Manipur
accounting for 90.2%(437.3 kgs out of 4,84.3
kgs) of total such seizures reported in the
country followed by Rajasthan (46 in Kgs) and
Uttar Pradesh (1 in Kg) during 2015.
Maximum seizures of factory made
gelatine sticks(in number) were reported in
Rajasthan accounting for 27.7%(25,704 out of
92,776) of total such seizures reported in the
country followed by Kerala (17,218), Telangana
(12,142), West Bengal (10,719) and Tamil Nadu
(9,380) during 2015.
Maximum seizures of factory made
grenades/ landmines (in number) were reported
in Jharkhand accounting for 77.8%(4,807 out of
6,181) of total such seizures registered in the
country followed by Uttar Pradesh (1,100),
Assam (133), Bihar (54) and Jammu & Kashmir
(42) during 2015.
Maximum seizures of country made
bomb (in number) were reported in West
Bengal accounting for 54.8% (13,509 out of
24,652) of total such seizures reported in the
country followed by Uttar Pradesh (9,949),
Madhya Pradesh (284), Tamil Nadu (258) and
Odisha (136) during 2015.
Maximum seizures of IED/ landmines (in
number/kgs) were reported in Rajasthan
accounting for 96.5% (22,392 out of 23,195 ) of
total such seizures reported in the country
followed by Uttar Pradesh (664), Bihar (83),
Jammu & Kashmir (24) and West Bengal (12)
during 2015.
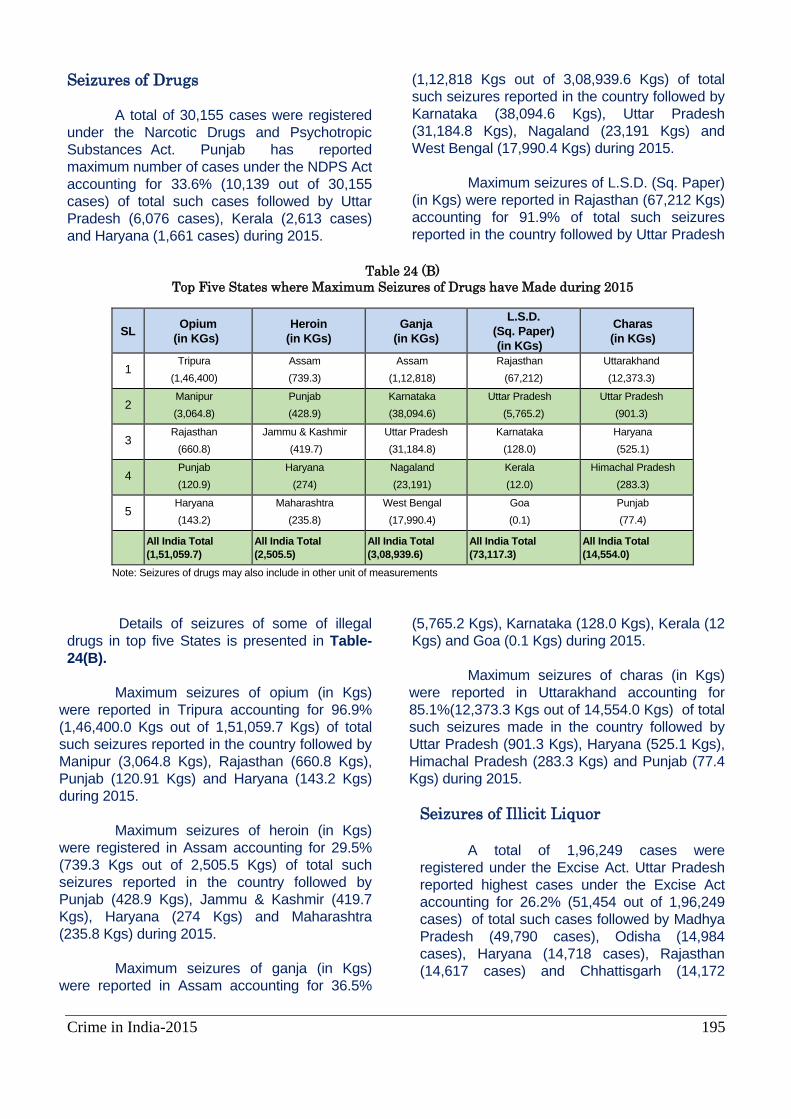
Crime in India-2015 195
Table 24 (B)
Top Five States where Maximum Seizures of Drugs have Made during 2015
SL Opium
(in KGs)
Heroin
(in KGs)
Ganja
(in KGs)
L.S.D.
(Sq. Paper)
(in KGs)
Charas
(in KGs)
1 Tripura
(1,46,400)
Assam
(739.3)
Assam
(1,12,818)
Rajasthan
(67,212)
Uttarakhand
(12,373.3)
2 Manipur
(3,064.8)
Punjab
(428.9)
Karnataka
(38,094.6)
Uttar Pradesh
(5,765.2)
Uttar Pradesh
(901.3)
3 Rajasthan
(660.8)
Jammu & Kashmir
(419.7)
Uttar Pradesh
(31,184.8)
Karnataka
(128.0)
Haryana
(525.1)
4 Punjab
(120.9)
Haryana
(274)
Nagaland
(23,191)
Kerala
(12.0)
Himachal Pradesh
(283.3)
5 Haryana
(143.2)
Maharashtra
(235.8)
West Bengal
(17,990.4)
Goa
(0.1)
Punjab
(77.4)
All India Total
(1,51,059.7)
All India Total
(2,505.5)
All India Total
(3,08,939.6)
All India Total
(73,117.3) All India Total
(14,554.0)
Note: Seizures of drugs may also include in other unit of measurements
Seizures of Drugs
A total of 30,155 cases were registered
under the Narcotic Drugs and Psychotropic
Substances Act. Punjab has reported
maximum number of cases under the NDPS Act
accounting for 33.6% (10,139 out of 30,155
cases) of total such cases followed by Uttar
Pradesh (6,076 cases), Kerala (2,613 cases)
and Haryana (1,661 cases) during 2015.
Details of seizures of some of illegal
drugs in top five States is presented in Table-
24(B).
Maximum seizures of opium (in Kgs)
were reported in Tripura accounting for 96.9%
(1,46,400.0 Kgs out of 1,51,059.7 Kgs) of total
such seizures reported in the country followed by
Manipur (3,064.8 Kgs), Rajasthan (660.8 Kgs),
Punjab (120.91 Kgs) and Haryana (143.2 Kgs)
during 2015.
Maximum seizures of heroin (in Kgs)
were registered in Assam accounting for 29.5%
(739.3 Kgs out of 2,505.5 Kgs) of total such
seizures reported in the country followed by
Punjab (428.9 Kgs), Jammu & Kashmir (419.7
Kgs), Haryana (274 Kgs) and Maharashtra
(235.8 Kgs) during 2015.
Maximum seizures of ganja (in Kgs)
were reported in Assam accounting for 36.5%
(1,12,818 Kgs out of 3,08,939.6 Kgs) of total
such seizures reported in the country followed by
Karnataka (38,094.6 Kgs), Uttar Pradesh
(31,184.8 Kgs), Nagaland (23,191 Kgs) and
West Bengal (17,990.4 Kgs) during 2015.
Maximum seizures of L.S.D. (Sq. Paper)
(in Kgs) were reported in Rajasthan (67,212 Kgs)
accounting for 91.9% of total such seizures
reported in the country followed by Uttar Pradesh
(5,765.2 Kgs), Karnataka (128.0 Kgs), Kerala (12
Kgs) and Goa (0.1 Kgs) during 2015.
Maximum seizures of charas (in Kgs)
were reported in Uttarakhand accounting for
85.1%(12,373.3 Kgs out of 14,554.0 Kgs) of total
such seizures made in the country followed by
Uttar Pradesh (901.3 Kgs), Haryana (525.1 Kgs),
Himachal Pradesh (283.3 Kgs) and Punjab (77.4
Kgs) during 2015.
Seizures of Illicit Liquor A total of 1,96,249 cases were
registered under the Excise Act. Uttar Pradesh
reported highest cases under the Excise Act
accounting for 26.2% (51,454 out of 1,96,249
cases) of total such cases followed by Madhya
Pradesh (49,790 cases), Odisha (14,984
cases), Haryana (14,718 cases), Rajasthan
(14,617 cases) and Chhattisgarh (14,172
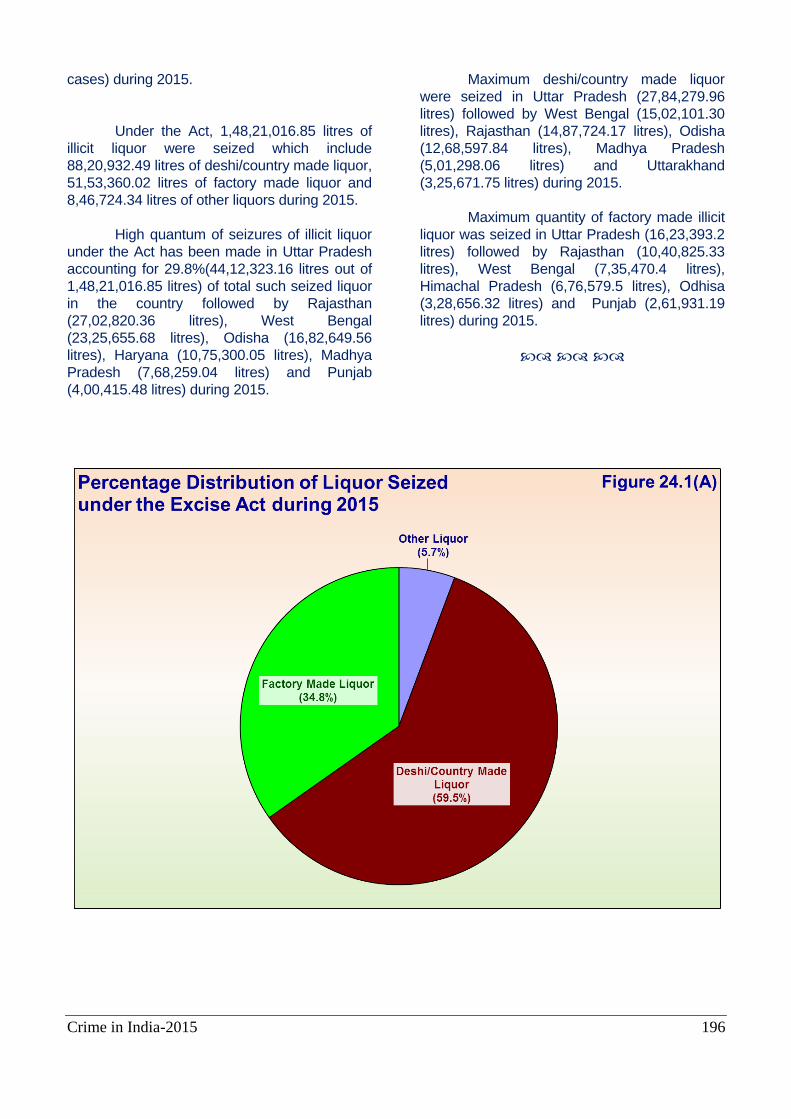
Crime in India-2015 196
cases) during 2015.
Under the Act, 1,48,21,016.85 litres of
illicit liquor were seized which include
88,20,932.49 litres of deshi/country made liquor,
51,53,360.02 litres of factory made liquor and
8,46,724.34 litres of other liquors during 2015.
High quantum of seizures of illicit liquor
under the Act has been made in Uttar Pradesh
accounting for 29.8%(44,12,323.16 litres out of
1,48,21,016.85 litres) of total such seized liquor
in the country followed by Rajasthan
(27,02,820.36 litres), West Bengal
(23,25,655.68 litres), Odisha (16,82,649.56
litres), Haryana (10,75,300.05 litres), Madhya
Pradesh (7,68,259.04 litres) and Punjab
(4,00,415.48 litres) during 2015.
Maximum deshi/country made liquor
were seized in Uttar Pradesh (27,84,279.96
litres) followed by West Bengal (15,02,101.30
litres), Rajasthan (14,87,724.17 litres), Odisha
(12,68,597.84 litres), Madhya Pradesh
(5,01,298.06 litres) and Uttarakhand
(3,25,671.75 litres) during 2015.
Maximum quantity of factory made illicit
liquor was seized in Uttar Pradesh (16,23,393.2
litres) followed by Rajasthan (10,40,825.33
litres), West Bengal (7,35,470.4 litres),
Himachal Pradesh (6,76,579.5 litres), Odhisa
(3,28,656.32 litres) and Punjab (2,61,931.19
litres) during 2015.
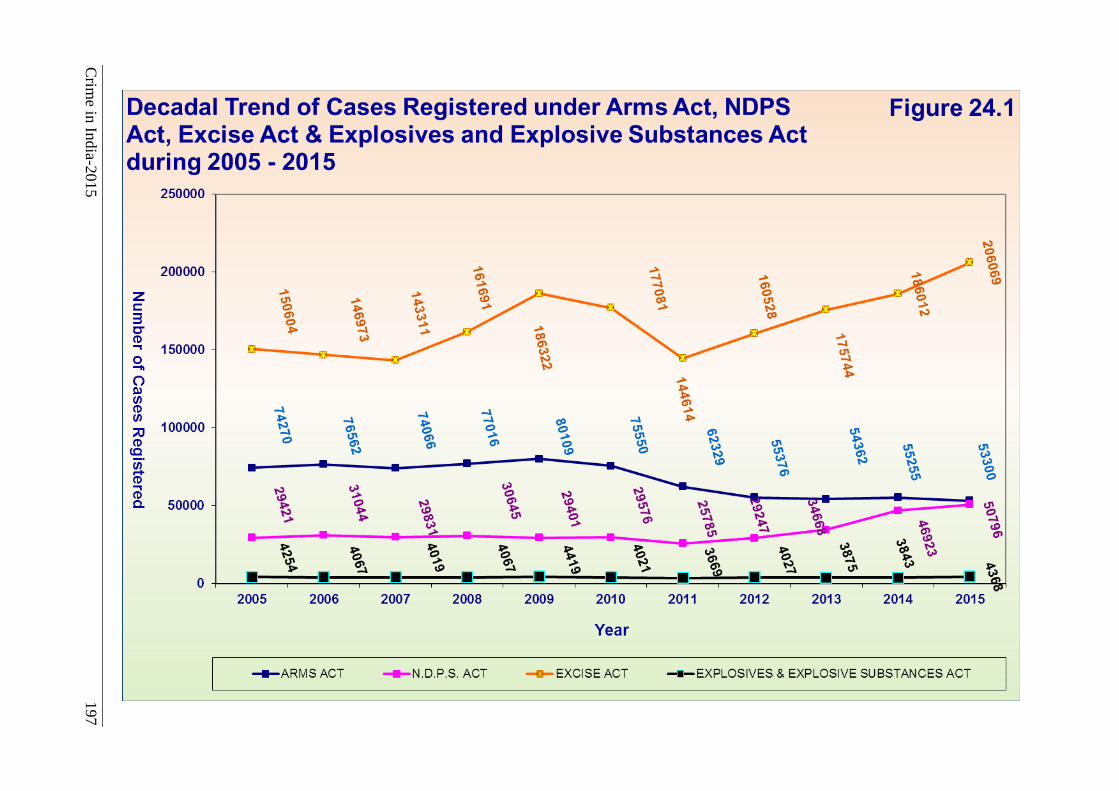
Crim
e in In
dia-2
01
5
197
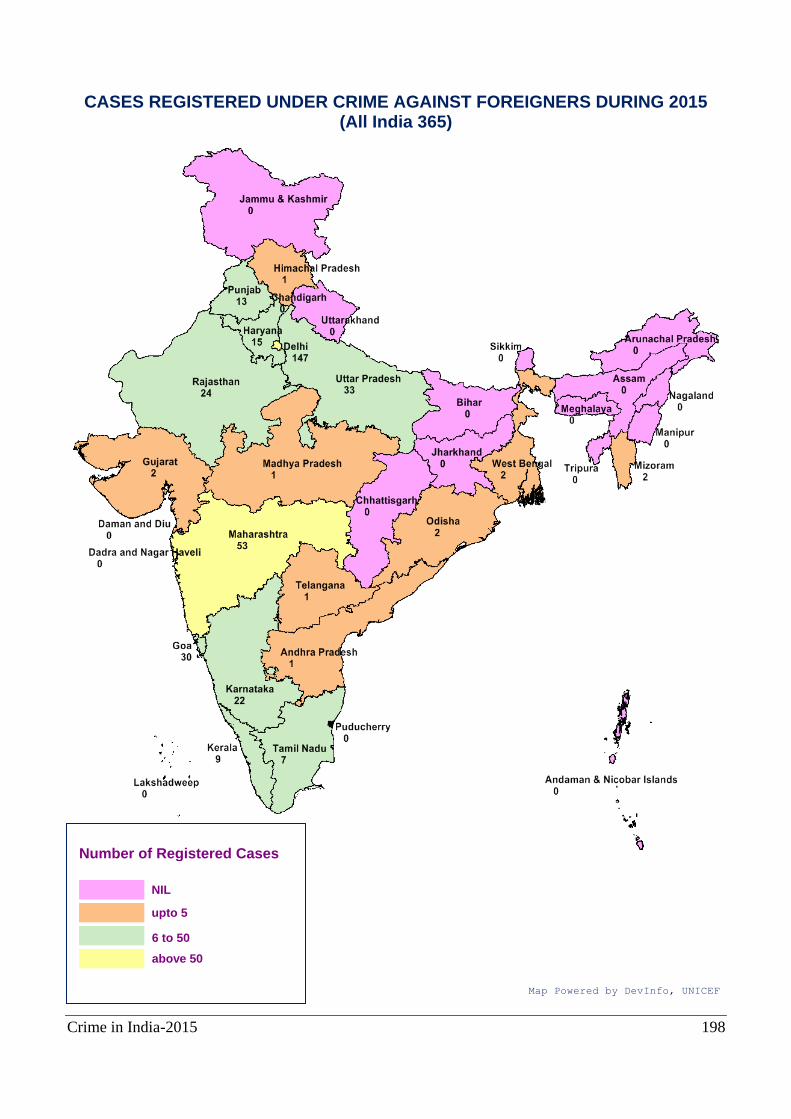
Crime in India-2015 198
CASES REGISTERED UNDER CRIME AGAINST FOREIGNERS DURING 2015 (All India 365)
Number of Registered Cases
NIL
6 to 50
Map Powered by DevInfo, UNICEF
upto 5
above 50
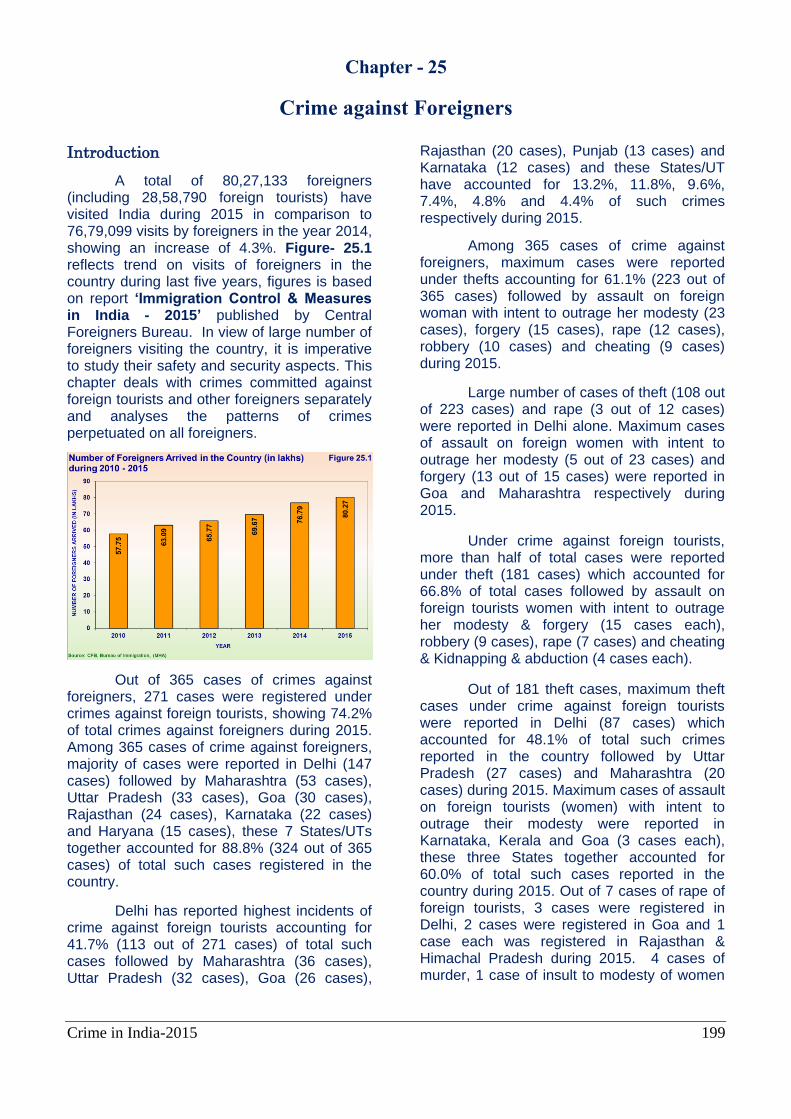
Crime in India-2015 199
Chapter - 25
Crime against Foreigners
Introduction
A total of 80,27,133 foreigners (including 28,58,790 foreign tourists) have visited India during 2015 in comparison to 76,79,099 visits by foreigners in the year 2014, showing an increase of 4.3%. Figure- 25.1 reflects trend on visits of foreigners in the country during last five years, figures is based on report ‘Immigration Control & Measures in India - 2015’ published by Central Foreigners Bureau. In view of large number of foreigners visiting the country, it is imperative to study their safety and security aspects. This chapter deals with crimes committed against foreign tourists and other foreigners separately and analyses the patterns of crimes perpetuated on all foreigners.
Out of 365 cases of crimes against foreigners, 271 cases were registered under crimes against foreign tourists, showing 74.2% of total crimes against foreigners during 2015. Among 365 cases of crime against foreigners, majority of cases were reported in Delhi (147 cases) followed by Maharashtra (53 cases), Uttar Pradesh (33 cases), Goa (30 cases), Rajasthan (24 cases), Karnataka (22 cases) and Haryana (15 cases), these 7 States/UTs together accounted for 88.8% (324 out of 365 cases) of total such cases registered in the country.
Delhi has reported highest incidents of crime against foreign tourists accounting for 41.7% (113 out of 271 cases) of total such cases followed by Maharashtra (36 cases), Uttar Pradesh (32 cases), Goa (26 cases),
Rajasthan (20 cases), Punjab (13 cases) and Karnataka (12 cases) and these States/UT have accounted for 13.2%, 11.8%, 9.6%, 7.4%, 4.8% and 4.4% of such crimes respectively during 2015.
Among 365 cases of crime against foreigners, maximum cases were reported under thefts accounting for 61.1% (223 out of 365 cases) followed by assault on foreign woman with intent to outrage her modesty (23 cases), forgery (15 cases), rape (12 cases), robbery (10 cases) and cheating (9 cases) during 2015.
Large number of cases of theft (108 out of 223 cases) and rape (3 out of 12 cases) were reported in Delhi alone. Maximum cases of assault on foreign women with intent to outrage her modesty (5 out of 23 cases) and forgery (13 out of 15 cases) were reported in Goa and Maharashtra respectively during 2015.
Under crime against foreign tourists, more than half of total cases were reported under theft (181 cases) which accounted for 66.8% of total cases followed by assault on foreign tourists women with intent to outrage her modesty & forgery (15 cases each), robbery (9 cases), rape (7 cases) and cheating & Kidnapping & abduction (4 cases each).
Out of 181 theft cases, maximum theft cases under crime against foreign tourists were reported in Delhi (87 cases) which accounted for 48.1% of total such crimes reported in the country followed by Uttar Pradesh (27 cases) and Maharashtra (20 cases) during 2015. Maximum cases of assault on foreign tourists (women) with intent to outrage their modesty were reported in Karnataka, Kerala and Goa (3 cases each), these three States together accounted for 60.0% of total such cases reported in the country during 2015. Out of 7 cases of rape of foreign tourists, 3 cases were registered in Delhi, 2 cases were registered in Goa and 1 case each was registered in Rajasthan & Himachal Pradesh during 2015. 4 cases of murder, 1 case of insult to modesty of women
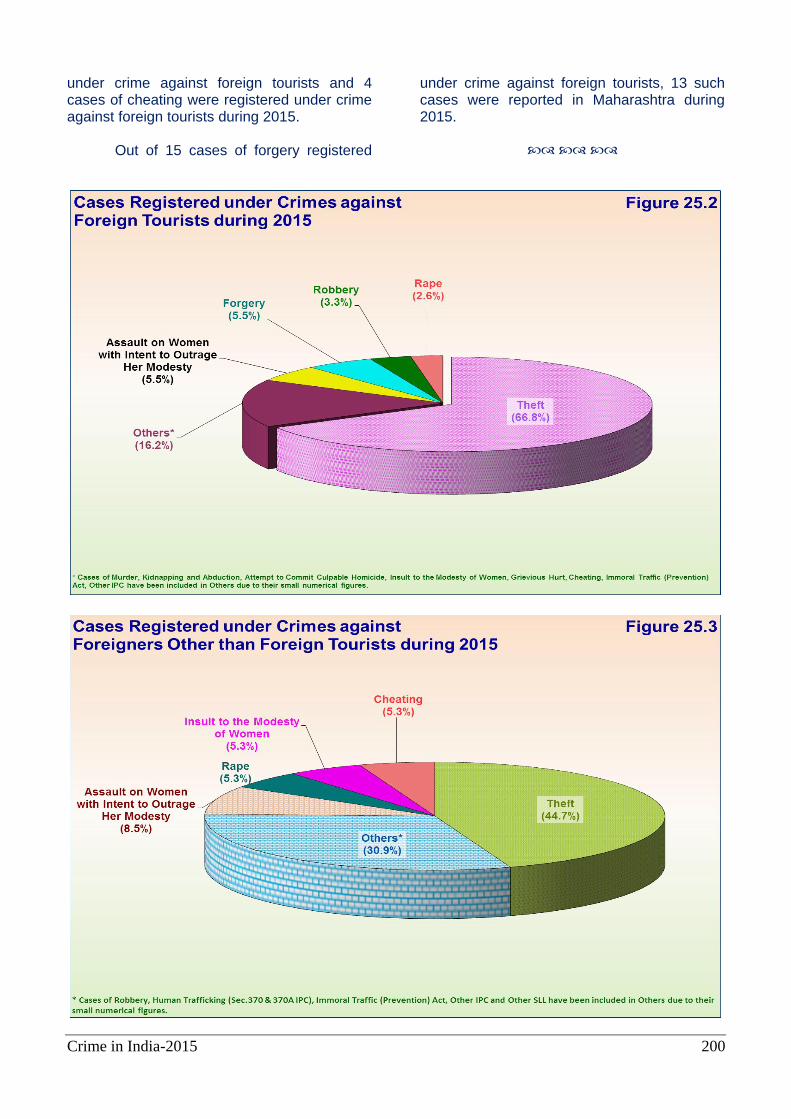
Crime in India-2015 200
under crime against foreign tourists and 4 cases of cheating were registered under crime against foreign tourists during 2015.
Out of 15 cases of forgery registered
under crime against foreign tourists, 13 such cases were reported in Maharashtra during 2015.
Page 1 of 2
Glossary
Crime Head with sections under which data have been collected
SL Crime Head Sections under which data collected
1 Murder Under Section 302 IPC
2 Attempt to Commit Murder Under Section 307 IPC
3 Culpable Homicide not Amounting to Murder Under Section 304 IPC
4 Attempt to Commit Culpable Homicide Under Section 308 IPC
5 Rape Under Section 376 IPC
6 Attempt to Commit Rape Under Section 376/511 IPC
7 Kidnapping & Abduction Under Section 363,364,364A,365,366-369 IPC
8 Kidnapping & Abduction in Order to Murder Under Section 364 IPC
9 Kidnapping For Ransom Under Section 364A IPC
10 Kidnapping & Abduction of Women to Compel her for Marriage
Under Section 366 IPC
11 Dacoity Under Section 395,396-398 IPC
12 Dacoity with Murder Under Section 396 IPC
13 Making Preparation and Assembly for Committing Dacoity
Under Section 399 & 402 IPC
14 Robbery Under Section 392 to 394, 397 & 398 IPC
15 Criminal Trespass/Burglary Under Section 453 to 460 IPC
16 Theft Under Section 379 to 382 IPC
17 Unlawful Assembly Under Section 143,144 & 145 IPC
18 Riots Under Section 147-151 & 153A IPC
19 Criminal Breach of Trust Under Section 406 to 409 IPC
20 Cheating Under Section 420 IPC
21 Forgery Under Section 465, 468 & 471 IPC
22 Counterfeiting (Section 231-235,237-240, 242-243, 255 and 489-A to 489-E IPC)
23 Offences Related to Counterfeit Coin Under Section 231-235,237, 238-240 & 242-243 IPC
24 Counterfeiting Government Stamp Under Section 255 IPC
25 Counterfeit Currency & Bank Notes Under Section 489-A to 489-E IPC
26 Counterfeiting Currency Notes or Bank Notes Under Section 489A IPC
27 Using Forged or Counterfeit Currency/Bank Notes
Under Section 489B IPC
28 Possession of Forged or Counterfeiting Currency / Bank Notes
Under Section 489C IPC
29 Make/Possess Materials for Forging or Counterfeiting Currency/Bank Notes
Under Section 489D IPC
30 Make/Use Documents Resembling Currency Notes/Bank Notes
Under Section 489 E IPC
31 Arson Under Section 435-436 & 438 IPC
32 Grievous Hurt Under Section 325,326,326A & 326 B IPC
33 Acid Attack Under Section 326A IPC
34 Attempt to Acid Attack Under Section 326B IPC
35 Dowry Deaths Under Section 304-B IPC
36 Assault on Women with Intent to Outrage her Modesty
Under Section 354 IPC,354A,354B,354C,354D
37 Sexual Harassment Under Section 354A IPC
38 Assault on Women with Intent to Disrobe Under Section 354B IPC
39 Voyeurism Under Section 354C IPC
40 Stalking Under Section 354D IPC
41 Insult to the Modesty of Women Under Section 509 IPC
42 Cruelty by Husband or His Relatives Under Section 498-A IPC
43 Importation of Girls from Foreign Country Under Section 366-B IPC
44 Causing Death by Negligence Under Section 304-A IPC
45 Offences Against the State Under Section 121, 121A, 122, 123, 124-A IPC
46 Sedition Under Section 124A IPC
47 Offences Promoting Enmity Between Different Groups
Under Section 153A & 153B IPC)
48 Promoting Enmity on Ground of Religion Race and Place Of Birth
Under Section 153A IPC)
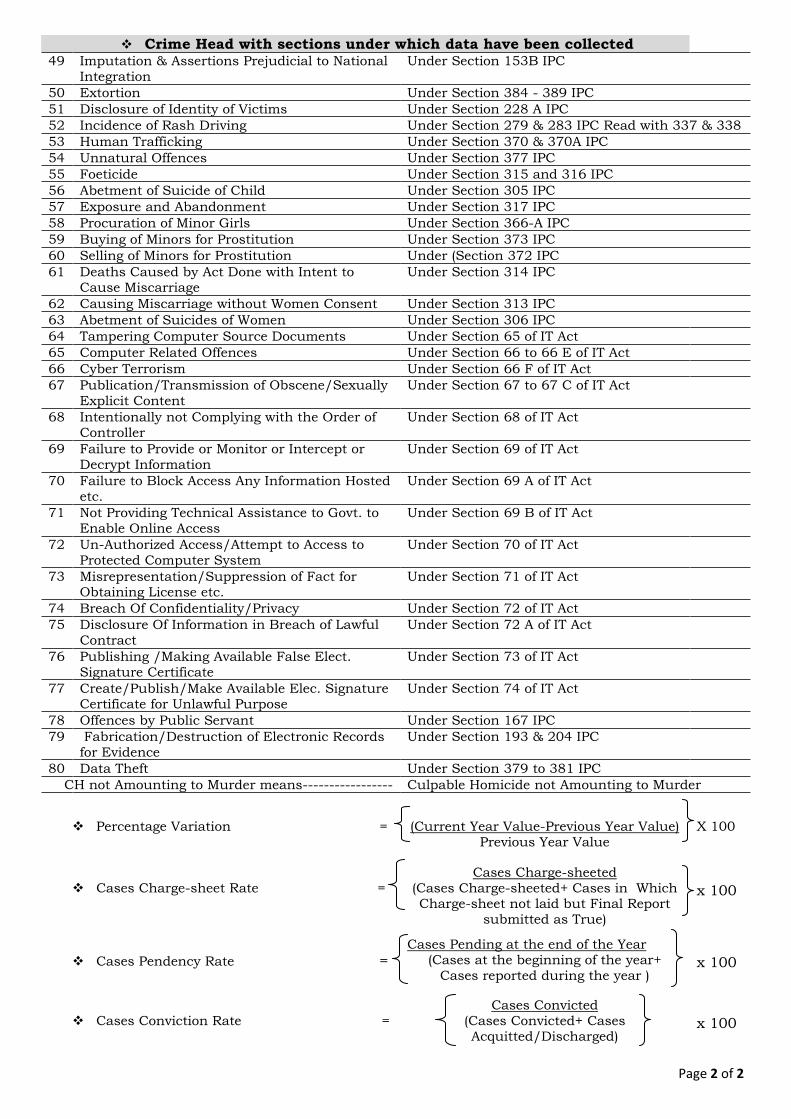
Page 2 of 2
Crime Head with sections under which data have been collected
49 Imputation & Assertions Prejudicial to National Integration
Under Section 153B IPC
50 Extortion Under Section 384 - 389 IPC
51 Disclosure of Identity of Victims Under Section 228 A IPC
52 Incidence of Rash Driving Under Section 279 & 283 IPC Read with 337 & 338
53 Human Trafficking Under Section 370 & 370A IPC
54 Unnatural Offences Under Section 377 IPC
55 Foeticide Under Section 315 and 316 IPC
56 Abetment of Suicide of Child Under Section 305 IPC
57 Exposure and Abandonment Under Section 317 IPC
58 Procuration of Minor Girls Under Section 366-A IPC
59 Buying of Minors for Prostitution Under Section 373 IPC
60 Selling of Minors for Prostitution Under (Section 372 IPC
61 Deaths Caused by Act Done with Intent to Cause Miscarriage
Under Section 314 IPC
62 Causing Miscarriage without Women Consent Under Section 313 IPC
63 Abetment of Suicides of Women Under Section 306 IPC
64 Tampering Computer Source Documents Under Section 65 of IT Act
65 Computer Related Offences Under Section 66 to 66 E of IT Act
66 Cyber Terrorism Under Section 66 F of IT Act
67 Publication/Transmission of Obscene/Sexually Explicit Content
Under Section 67 to 67 C of IT Act
68 Intentionally not Complying with the Order of Controller
Under Section 68 of IT Act
69 Failure to Provide or Monitor or Intercept or Decrypt Information
Under Section 69 of IT Act
70 Failure to Block Access Any Information Hosted etc.
Under Section 69 A of IT Act
71 Not Providing Technical Assistance to Govt. to Enable Online Access
Under Section 69 B of IT Act
72 Un-Authorized Access/Attempt to Access to Protected Computer System
Under Section 70 of IT Act
73 Misrepresentation/Suppression of Fact for Obtaining License etc.
Under Section 71 of IT Act
74 Breach Of Confidentiality/Privacy Under Section 72 of IT Act
75 Disclosure Of Information in Breach of Lawful Contract
Under Section 72 A of IT Act
76 Publishing /Making Available False Elect. Signature Certificate
Under Section 73 of IT Act
77 Create/Publish/Make Available Elec. Signature Certificate for Unlawful Purpose
Under Section 74 of IT Act
78 Offences by Public Servant Under Section 167 IPC
79 Fabrication/Destruction of Electronic Records for Evidence
Under Section 193 & 204 IPC
80 Data Theft Under Section 379 to 381 IPC
CH not Amounting to Murder means----------------- Culpable Homicide not Amounting to Murder
Percentage Variation = (Current Year Value-Previous Year Value) Previous Year Value
X 100
Cases Charge-sheet Rate =
Cases Charge-sheeted (Cases Charge-sheeted+ Cases in Which Charge-sheet not laid but Final Report
submitted as True)
x 100
Cases Pendency Rate =
Cases Pending at the end of the Year (Cases at the beginning of the year+
Cases reported during the year )
x 100
Cases Conviction Rate =
Cases Convicted (Cases Convicted+ Cases Acquitted/Discharged)
x 100
FEEDBACK FORM (Crime in India – 2015)
Sender(s) Name & Full Address (Optional)
For improvement in the Report we solicit your views. PLEASE TICK () IN THE APPROPRIATE BOX
Quantity of Information Very Large Large Limited Scanty
Quality of Data Very High High Good Poor
Usefulness of Data Very relevant Relevant Little use No use
Quality of Publication Impressive Good Ordinary Poor
Obtainability of Book Timely Late Very Late
Suggestion(s), if any, for further improvement(s) in :
(i) Quality of Data (usefulness of statistics to police in controlling law and order):
(ii) Additional information needed to be added/incorporated:
(iii) Quality of Publication:
Any other comment(s) / suggestion(s):
Date : Place : Signature in Full
(Optional) Reply to : The Director General, National Crime Records Bureau, East Block – 7, R.K. Puram, New Delhi – 110066, India, e-mail : [email protected] Fax : +91-11- 26197984


Copyright © 2022 FDOKUMEN