Credentials Matter: COVID-19 Case Study - ExcelinEd
49
September 2020 CREDENTIALS MATTER COVID-19 CASE STUDY Examining the effect of the COVID-19 pandemic on Career and Technical Education and associated industry credentials
-
Upload
khangminh22 -
Category
Documents
-
view
6 -
download
0
Transcript of Credentials Matter: COVID-19 Case Study - ExcelinEd

September 2020
CREDENTIALS MATTERCOVID-19 CASE STUDY Examining the effect of the COVID-19 pandemic on Career and Technical Education and associated industry credentials

ABOUT THE PROJECT Credentials Matter is a partnership between ExcelinEd
and Burning Glass Technologies. This ongoing,
comprehensive research project seeks to understand
the industry credential landscape in the United States
and provide actionable data analysis and resources for
states and the public to improve outcomes for students.
CREDENTIALS MATTER: COVID-19 CASE STUDY | 2
ExcelinEd | Burning Glass Technologies

This project was made possible by a grant from Carnegie
Corporation of New York. The statements made and views
expressed are solely the responsibility of the authors.
This report was written by Rucha Vankudre and Layla O’Kane,
with support from Joel Simon.
Launched by former Florida Governor Jeb Bush in 2008, the
Foundation for Excellence in Education (ExcelinEd) supports state
leaders in transforming education to unlock lifelong opportunity
and success for each and every child. From policy development to
implementation, ExcelinEd brings deep expertise and experience
to customize education solutions for each state’s unique needs.
Focused on educational quality, innovation and opportunity,
ExcelinEd’s agenda is increasing student learning, advancing
equity and readying graduates for college and career. Learn more
at ExcelinEd.org.
Burning Glass Technologies delivers job market analytics that
empower employers, workers and educators to make data-
driven decisions. The company’s artificial intelligence technology
analyzes hundreds of millions of job postings and real-life career
transitions to provide insight into workforce demand patterns.
This real-time strategic intelligence offers crucial insights, such
as which jobs are most in demand, the specific skills employers
need and the career directions that offer the highest potential
for workers. For more information, visit burning-glass.com.
A U T H O R S
CREDENTIALS MATTER: COVID-19 CASE STUDY | 3
ExcelinEd | Burning Glass Technologies About the Project Partners

FOREWORD The first six months of the novel coronavirus (COVID-19) pandemic has affected nearly every aspect of American life. The public health implications alone are staggering. As of September 2020, millions of Americans have tested positive for the virus and nearly 200,000 Americans have died.
The onset of COVID-19 provoked a national effort to “slow the spread” of the virus, a response unprecedented in modern memory. From March through May across the nation, our economy went almost dormant. State and local “stay-at-home” orders required “non-essential” businesses, schools and other institutions to either shift to remote operations or close their doors indefinitely – resulting in record job-loss and unemployment claims. Meanwhile, “essential” workers continued to provide critical services in the face of great personal and family health risks. We mourn with the families and communities who have lost loved ones, jobs, businesses, home and food security and a sense of normalcy.
Recovering and post-pandemic labor markets may look very different from pre-pandemic labor conditions. While we do not yet know the extent of these changes, we can anticipate that remote work, automation and business closures will be significant influencing factors based on what we have seen thus far.
Patricia LevesqueExcelinEd CEO
Matt SigelmanBurning Glass Technologies CEO
It’s imperative that we learn from the pandemic and its ripple effects to both support recovery efforts and prepare for life in a “new normal.” With regards to recovery, education systems will need to ensure that learners can actively participate in the nation’s recovery while also considering additional factors that may shape occupational opportunities in the future.
This report provides insights into labor market trends across career clusters, occupations and credentials during the first few months of the pandemic. It highlights how different occupational factors like critical worker designation, physical proximity to others, and automation risk impact physical safety and economic security across occupations – and how these factors may reshape the landscape of opportunity for workers and learners. It is intended to provide educators and policy makers with a framework for evaluating their career and technical education and workforce training investments to ensure that they align with the new contours of opportunity. Unpacking the effects of the almost complete economic shutdown during the pandemic can help inform future policies, educational offerings, and individual career decisions as our pandemic response and recovery continues.
The pandemic has and will continue to change how we balance notions of risk and opportunity. As students and displaced workers evaluate future career opportunities, they will surely weigh them in light of health and economic security. We hope this report provides some new insight into how educators and policymakers can help learners – new and older – achieve the balance they need to succeed in the future.
CREDENTIALS MATTER: COVID-19 CASE STUDY | 4
ExcelinEd | Burning Glass Technologies Foreword

TABLE OF CONTENTS
Introduction 6
Methodology 8
Overview of COVID-19 11 Labor Market Effects
Findings by Key Occupational Factors 13
Findings by Career Cluster 18
Implications 42
Recommendations 48
CREDENTIALS MATTER: COVID-19 CASE STUDY | 5
ExcelinEd | Burning Glass Technologies

INTRODUCTIONCOVID-19 has disrupted students, educators and policymakers
across the nation. Between March and May of 2020, over 20 million
Americans lost their jobs and the unemployment rate shot up to
14.7%, the highest it has been since the Great Depression.1 More
recently, the nation’s gross domestic product — the broadest measure
of economic activity — shrank at an annual rate of 32.9%. Indeed, the
economic decline in April, May and June was more than four times as
steep as the worst quarter during the Great Recession.2
1 https://www.washingtonpost.com/business/2020/05/08/april-2020-jobs-report/2 https://www.npr.org/sections/coronavirus-live-updates/2020/07/30/896714437/3-months-of-hell-u-s-economys-worst-quarter-ever
CREDENTIALS MATTER: COVID-19 CASE STUDY | 6
ExcelinEd | Burning Glass Technologies

As the economy navigates reopening and education systems adjust not only to how they will deliver
instruction safely but to make sure that what they are teaching remains relevant, states must
understand the labor market changes that have occurred already so they can begin to anticipate
future labor market trends. This Credentials Matter case study can help.
Credentials Matter: COVID-19 Case Study examines short-term changes in credential demand
based on the economic ramifications of COVID-19 and analyzes factors that may continue to affect
credential demand in potential future waves of the pandemic as well as throughout economic
recovery.
Credentials Matter: COVID-19 Case Study also builds a future-looking analysis. It examines
how credential demand continues to shift, identifies how credentials can support students in
the recovery and considers how credentials can prepare students to support recovery efforts.
Throughout, the report focuses on credentials that have been reported to have been earned by K-12
students to remain consistent with previous Credentials Matter research and to provide actionable
insights for the secondary school systems.
THIS REPORT SEEKS TO ANSWER THE FOLLOWING
RESEARCH QUESTIONS:
u How has COVID-19 shifted short-term employment
demand nationally across occupations?
> What are the trends by occupation and career
cluster?
> What factors have influenced these shifts?
u How has COVID-19 affected employer demand in the
short-term for industry-recognized credentials earned
by K-12 students?
CREDENTIALS MATTER: COVID-19 CASE STUDY | 7
ExcelinEd | Burning Glass Technologies Introduction

METHODOLOGYThis report analyzes the COVID-19 time period during
the weeks between March 2, 2020 and May 31, 2020.
CREDENTIALS MATTER: COVID-19 CASE STUDY | 8
ExcelinEd | Burning Glass Technologies

We calculated the percent change in weekly postings between
the week of March 2 and the weeks of May 11, May 18 and May
25. To provide a more robust estimate of the change over this
time period, we then took the average of these three percent
changes. This metric was used throughout the analysis to
calculate changes at the occupation level, defined by six-digit
O*NET-Standard Occupational Classification (SOC) codes. We used
the national average decline in weekly job postings of 41% across
this same time period as a benchmark to compare differences in
COVID-19 impact across occupations. All employment numbers
are based on OES 2018 data, and annual median salary numbers
are from OES May 2019 data.3
We calculated the percent change in demand within a career
cluster4 by linking career pathways and clusters to SOC
occupations using the Perkins IV crosswalks.5 We summed the
weekly number of job postings across all occupations linked to
a cluster and then calculated the percent change in the same
manner as described above.
DEMAND WITHIN CAREER CLUSTERS
DEMAND FOR OCCUPATIONS
Demand for an industry certification looks specifically at the
job postings that request that certification, while demand
for a license is the same as demand for the whole occupation
(regardless of whether the posting explicitly mentions the
license). This is consistent with previous definitions of demand as
described in more detail in our first Credentials Matter report.
DEMAND FOR CREDENTIALS
When looking at state level analyses, we only considered states
that had at least 100 postings in a career cluster during the week
of March 2.
DEMAND BY STATE
3 https://www.bls.gov/oes/tables.htm4 State CTE programs are typically organized under 16 career clusters that are made up of multiple pathways and occupations.
AdvanceCTE - Career Clusters, 20195 The Perkins IV crosswalks were developed by the U.S. Office of Vocational and Adult Education in 2007 and updated by the National
Research Center for Career and Technical Education and the National Association of State Directors of Career-Technical Education Consortium in 2012.
CREDENTIALS MATTER: COVID-19 CASE STUDY | 9
ExcelinEd | Burning Glass Technologies Methodology

6 https://www.lmiontheweb.org/more-than-half-of-u-s-workers-in-critical-occupations-in-the-fight-against-covid-19/7 In light of the pandemic, many occupations have fundamentally changed their working practices (e.g., psychologists moving to
telehealth appointments), so responses on this survey may change in the future based on how various occupations adapted during and after the COVID-19 crisis.
8 For more information, see https://www.onetonline.org/find/descriptor/result/4.C.2.a.39 https://www.oxfordmartin.ox.ac.uk/downloads/academic/The_Future_of_Employment.pdf
In addition to the demand analyses described above, we use the following three key occupational
factors in our analysis: Automation Risk score, Physical Proximity score and Critical Worker designation. These occupational factors help illuminate how jobs may be affected differently
through the economic recovery period.
AUTOMATION RISK SCOREThis score is a measure from 0 to 100 derived from Frey and Osbourne’s 2013
paper The Future of Employment.9 It is calculated by breaking occupations down
into individual tasks and evaluating the ability of automated systems to perform
the tasks within that occupation. To calculate the Automation Risk score for each
career cluster, we took a weighted average of the individual occupation scores
based on the distribution of employment by occupation in the cluster in 2018.
PHYSICAL PROXIMITY SCOREThis score is constructed for each occupation from data gathered by O*NET in
response to this survey question7: “To what extent does this job require the
worker to perform job tasks in close physical proximity to other people?”8 Physical
Proximity scores exist at the eight-digit SOC level and range from 0 to 100. We
took a simple average of the scores to roll up to the six-digit SOC level. We then
calculated a weighted average of all the occupations within a cluster based on the
share of employment in that cluster in 2018.
CRITICAL WORKER DESIGNATION This classification system is based on the Department of Homeland Security’s
guidance for identifying the critical infrastructure workforce during COVID-19.
It was created by the LMI Institute and Council for Community and Economic
Research at the six-digit SOC level.6 To calculate the percent Critical Worker
metric at the cluster level, we used 2018 employment
by occupation.
CREDENTIALS MATTER: COVID-19 CASE STUDY | 10
ExcelinEd | Burning Glass Technologies Methodology

OVERVIEW OF COVID-19 LABOR MARKET EFFECTSBetween the first week of March and the end of May 2020,
there was a 41% decline in overall weekly job postings in the
United States. Over a similar time period in 2019, the economy
experienced a 29% increase in weekly job postings.
CREDENTIALS MATTER: COVID-19 CASE STUDY | 11
ExcelinEd | Burning Glass Technologies

However, the pandemic-related decline in demand was not uniform; some career clusters and
occupations provided relatively more stable employment prospects than others. For example, job
postings for occupations in Architecture & Construction as well as Transportation, Distribution &
Logistics both fell less than 30%, while Arts, A/V Technology & Communications job postings fell
nearly 50%.
DECLINE IN U.S. JOB POSTS BY CAREER CLUSTER(AVG. CHANGE IN WEEKLY POSTINGS MARCH TO MAY 2020)
INDEXED U.S. JOB POSTINGS: 2019 VS 2020
-50%
40
0
-40%
60
20
-30%
80
-20%
100
-10%
120
0%
140
20202019
AGRICULTURE, FOOD &
NATURAL RESOURCES
ARCHITECTURE & CONSTRUCTION
ARTS, A/V TECHNOLOGY &
COMMUNICATIONS
BUSINESS MANAGEMENT &
ADMINISTRATION
EDUCATION & TRAINING
FINANCE
GOVERNMENT & PUBLIC
ADMINISTRATIONHEALTH SCIENCE
HOSPITALITY & TOURISMHUMAN SERVICES
INFORMATION TECHNOLOGYLAW, PUBLIC SAFETY,
CORRECTIONS & SECURITYMANUFACTURING
MARKETING
SCIENCE, TECHNOLOGY,
ENGINEERING & MATHEMATICS
TRANSPORTATION, DISTRIBUTION
& LOGISTICS
-33%-28%
-49% -48%
-33%
-44% -42%-39%
-44%
-34%-39%
-46%
-36%
-45%
-26%
-42%
January 14 February 14 March 14 April 14 May 14
CREDENTIALS MATTER: COVID-19 CASE STUDY | 12
ExcelinEd | Burning Glass Technologies Overview of COVID-19 Labor Market Effects

FINDINGS BY KEY OCCUPATIONAL FACTORS Affecting Growth and Recovery During and After COVID-19
CREDENTIALS MATTER: COVID-19 CASE STUDY | 13
ExcelinEd | Burning Glass Technologies

10 Although this list attempts to capture the federal suggestions, states may have defined critical occupations differently, so it is potentially not an exhaustive list of all occupations deemed critical by each state.
CRITICAL WORKER DESIGNATIONAt the start of the pandemic, many states issued stay-at-home orders with exemptions only for
Critical Workers.10 Workers in these occupations were generally able to continue working while
workers in other occupations were furloughed or laid off at higher rates. Many of these Critical
occupations experienced smaller declines in employment during the early months of the pandemic.
Additionally, it is likely that these occupations would be less affected than others in terms of
demand if there are future waves of the virus.
The chart below displays the share of Critical Workers in each career cluster. The career clusters
with the highest percentage of Critical Workers —all at over 85% — are Education & Training, Health
Science, Information Technology, Manufacturing and Transportation, Distribution & Logistics.
Conversely, Arts, A/V Technology & Communications, Human Services and Marketing all had less
than 50% of their workforces designated as Critical Workers.
PERCENT OF WORKFORCE CONSIDERED CRITICAL BY CAREER CLUSTER
0%
10%
20%
30%
40%
50%
60%
70%
80%
90%
100%
AGRI
CULT
URE,
FOO
D &
NATU
RAL R
ESOU
RCES
ARCH
ITEC
TURE
& C
ONST
RUCT
ION
ARTS
, A/V
TEC
HNOL
OGY
&
COMMUN
ICAT
IONS
BUSIN
ESS M
ANAG
EMEN
T &
ADMIN
ISTRA
TION
EDUC
ATIO
N &
TRAI
NING
FINA
NCE
GOVE
RNMEN
T & P
UBLIC
ADMIN
ISTRA
TION
HEAL
TH SC
IENC
E
HOSP
ITALIT
Y & T
OURI
SMHU
MAN SE
RVIC
ES
INFO
RMAT
ION
TECH
NOLO
GY
LAW, P
UBLIC
SAFE
TY,
CORR
ECTI
ONS &
SECU
RITY
MANUF
ACTU
RING
MARKE
TING
SCIE
NCE,
TEC
HNOL
OGY,
ENGI
NEER
ING
& MAT
HEMAT
ICS
TRAN
SPOR
TATI
ON,
DIST
RIBU
TION
& L
OGIST
ICS
77%
63%
36%
57%
87%
60%68%
91%
67%
45%
62%
100%
90%
72%
96%
37%
CREDENTIALS MATTER: COVID-19 CASE STUDY | 14
ExcelinEd | Burning Glass Technologies Key Occupational Factors

Below, we highlight two career clusters, Transportation, Distribution & Logistics and Arts, A/V
Technology & Communications, to show the different relative sizes of the three largest Critical
occupations within each cluster. Transportation, Distribution & Logistics has one of the highest
percentages of Critical Workers, at 96%, with the top three occupations comprising 48% of the
total workforce within that cluster. In contrast, the three largest Critical occupations in Arts, A/V
Technology & Communications make up only 24% of the total workforce within that cluster, leading
to the lowest cluster percentage of Critical Workers at 36%.
SHARE OF EMPLOYMENT FOR THREE LARGEST CRITICAL OCCUPATIONS
Laborers and Freight, Stock, and Material Movers, Hand
Telecommunications Equipment Installers and Repairers, Except Line Installers
25%
12%
Heavy and Tractor- Trailer Drivers
Producers and Directors
15%
6%
Light Truck or Delivery Services Drivers
Telecommunications Line Installers and Repairers
8%
6%
TRANSPORTATION, DISTRIBUTION & LOGISTICS
ARTS, A/V TECHNOLOGY & COMMUNICATIONS
48%CRITICAL WORKERS
96%
CRITICAL WORKERS
36% 24%
CREDENTIALS MATTER: COVID-19 CASE STUDY | 15
ExcelinEd | Burning Glass Technologies Key Occupational Factors

100
PHYSICAL PROXIMITY SCORE BY CAREER CLUSTER
PHYSICAL PROXIMITY SCORE BY
OCCUPATION
0
10
20
30
40
50
60
70
80
90
PHYSICAL PROXIMITY SCORE The Physical Proximity score for an occupation is a measure of how close workers must be to other people to successfully complete their job. As a result, workers in jobs with a higher Physical Proximity score are generally at higher risk of transmission of COVID-19. This increased risk now associated with occupations with high Physical Proximity scores may change the value proposition for those who are considering entering or maintaining employment in these fields.
The impact of Physical Proximity on occupational demand is influenced by the Critical Worker designation. For Critical Workers in high-proximity jobs this may mean higher likelihood of risk of illness, although employment itself may be less affected. Non-Critical Workers in high-proximity jobs generally returned to work at a later date and at a much slower pace than jobs with lower Physical Proximity scores, typically to limit spread and to ensure sufficient safety measures were in place.
The chart below displays the Physical Proximity scores for all 16 career clusters. Health Science and Human Services have the highest Physical Proximity scores while Agriculture, Food & Natural Resources and Science, Technology, Engineering & Mathematics have the lowest Physical Proximity scores.
The graphic below provides examples of occupations in clusters at each end of the Physical Proximity spectrum: Health Science (the highest overall cluster score) and Science, Technology, Engineering & Mathematics (the second lowest overall cluster score). The occupations selected reflect the two highest and two lowest Physical Proximity scores, demonstrating the range of the scores across occupations within each cluster.
HEALTH SCIENCE
SCIENCE, TECHNOLOGY, ENGINEERING & MATHEMATICS
100
61
100
59
42
31
38
30
Dental Hygienists
Microbiologists
Physical Therapists
Anthropologists and Archeologists
Medical Transcriptionists
Economists
Epidemiologists
Petroleum Engineers
AGRI
CULT
URE,
FOO
D &
NATU
RAL R
ESOU
RCES
ARCH
ITEC
TURE
& C
ONST
RUCT
ION
ARTS
, A/V
TEC
HNOL
OGY
&
COMMUN
ICAT
IONS
BUSIN
ESS M
ANAG
EMEN
T &
ADMIN
ISTRA
TION
EDUC
ATIO
N &
TRAI
NING
FINA
NCE
GOVE
RNMEN
T & P
UBLIC
ADMIN
ISTRA
TION
HEAL
TH SC
IENC
E
HOSP
ITALIT
Y & T
OURI
SMHU
MAN SE
RVIC
ES
INFO
RMAT
ION
TECH
NOLO
GY
LAW, P
UBLIC
SAFE
TY,
CORR
ECTI
ONS &
SECU
RITY
MANUF
ACTU
RING
MARKE
TING
SCIE
NCE,
TEC
HNOL
OGY,
ENGI
NEER
ING
& MAT
HEMAT
ICS
TRAN
SPOR
TATI
ON,
DIST
RIBU
TION
& L
OGIST
ICS
47
68
55 54
71
50
60
85
7177
65
52
61
48
6164
CREDENTIALS MATTER: COVID-19 CASE STUDY | 16
ExcelinEd | Burning Glass Technologies Key Occupational Factors

AUTOMATION RISK SCORE BY CAREER CLUSTER
0
10
20
30
40
50
60
70
80
90
AUTOMATION RISK SCORE Automation Risk is a measure of the likelihood that human capital within a job will be replaced
by computer-controlled equipment. In general, lower-skill occupations are often at higher risk of
automation. As a result of COVID-19, it is possible that the desire to limit human interaction and
temper the spread of the virus will lead firms to automate more quickly than they would have
otherwise. This may lead to lower employment and less growth in occupations with high Automation
Risk scores, and may change the value proposition for those who are considering entering or
maintaining employment in these fields.
The chart above shows the Automation Risk scores by career cluster, with Hospitality & Tourism
having the highest average score of 81 and Education & Training having one of the lowest scores of
14. The graphic below displays the occupations that have at least 1% of cluster employment and the
highest and lowest Automation Risk scores within these clusters.
AUTOMATION RISK
SCORES BY OCCUPATION
HOSPITALITY AND TOURISM
EDUCATION AND TRAINING
97
65
96
56
8
1
1
1
Hosts and Hostesses, Restaurant, Lounge and Coffee Shop
Librarians
Cooks, Restaurant
Teacher Assistants
Food Service Managers
Elementary School Teachers
Recreation Workers
Instructional Coordinators
100
AGRI
CULT
URE,
FOO
D &
NATU
RAL R
ESOU
RCES
ARCH
ITEC
TURE
& C
ONST
RUCT
ION
ARTS
, A/V
TEC
HNOL
OGY
&
COMMUN
ICAT
IONS
BUSIN
ESS M
ANAG
EMEN
T &
ADMIN
ISTRA
TION
EDUC
ATIO
N &
TRAI
NING
FINA
NCE
GOVE
RNMEN
T & P
UBLIC
ADMIN
ISTRA
TION
HEAL
TH SC
IENC
E
HOSP
ITALIT
Y & T
OURI
SMHU
MAN SE
RVIC
ES
INFO
RMAT
ION
TECH
NOLO
GY
LAW, P
UBLIC
SAFE
TY,
CORR
ECTI
ONS &
SECU
RITY
MANUF
ACTU
RING
MARKE
TING
SCIE
NCE,
TEC
HNOL
OGY,
ENGI
NEER
ING
& MAT
HEMAT
ICS
TRAN
SPOR
TATI
ON,
DIST
RIBU
TION
& L
OGIST
ICS
6662
32
60
14
72
41
25
81
36
44
22
70
10
7474
CREDENTIALS MATTER: COVID-19 CASE STUDY | 17
ExcelinEd | Burning Glass Technologies Key Occupational Factors

FINDINGS BY CAREER CLUSTERThis section examines the impact of COVID-19 by career cluster and
includes a closer look at demand for occupations and credentials within
each cluster. We focus on eight career clusters. Each cluster includes a
factsheet and an analysis.
These clusters were selected
based on
1 the size of the overall employment market
2 effects on demand based on the occupational factors outlined above
3 the highest number of credentials earned by students in K-12
CREDENTIALS MATTER: COVID-19 CASE STUDY | 18
ExcelinEd | Burning Glass Technologies

ABOUT THE CAREER CLUSTER FACTSHEET Each factsheet contains details about the cluster in general and the impact of COVID-19,
specifically, including:
PERCENT OF OVERALL POSTINGS The percent of overall job
postings in the week of
March 2, 2020 that were
represented by occupations
in the cluster.
CHANGE IN POSTINGS The percent change
in postings during the
COVID-19 time period
between the week of March
2 and the weeks of May 11,
May 18 and May 25.
MINIMUM EDUCATION REQUIREMENT DISTRIBUTION The distribution of minimum
education requirements in job
postings in these categories:
High School, Associate’s Degree,
Bachelor’s Degree, Bachelor’s
Degree +.
TOP PERFORMING STATES The three states with the most positive/least negative
percent changes in demand during the COVID-19 period.
LOWEST PERFORMING STATES The three states with the most negative percent changes
in demand during the COVID-19 period.
TOP 5 CREDENTIALS EARNED IN CAREER CLUSTER The five credentials in the
career cluster with the highest
attainment by K-12 students.
OVERVIEW
COVID-19 CLUSTER IMPACT
CREDENTIALS MATTER: COVID-19 CASE STUDY | 19
ExcelinEd | Burning Glass Technologies Findings by Career Cluster

For each occupation in these groupings, we present data on employment, median salary and scores
on key occupational factors. We only consider occupations that had at least 500 job postings in the
week of March 2, 2020.
ABOUT THE CAREER CLUSTER ANALYSISIn these sections, we discuss some of the major findings from the factsheets and occupational
impact tables as well as additional trends within the cluster, calling out cluster occupations with
interesting results and specific credentials or licensed occupations as relevant.
AUTOMATION RISK SCORE
A weighted average of occupational Automation Risk scores within a
cluster.
PHYSICAL PROXIMITY
SCORE A weighted average
of occupational Physical Proximity
scores within a cluster.
PERCENT CRITICAL WORKERS
The share of workers within the cluster
who were classified as Critical Workers according to the Department of
Homeland Security guidance.
CLUSTER AVERAGE
KEY OCCUPATIONAL FACTORS
COVID-19 OCCUPATIONAL IMPACT
The three occupations with the most positive/least negative percent changes in demand during the COVID-19 period.
The three occupations with the most negative percent changes in demand during the COVID-19 period.
The three largest occupations as determined by the share of employment within a cluster in that occupation in 2018.
MOST STABLE
LEAST STABLE
LARGEST
CREDENTIALS MATTER: COVID-19 CASE STUDY | 20
ExcelinEd | Burning Glass Technologies Findings by Career Cluster

X%
X%
X%
$X
$X
$XLARGEST
-15% 11% $36,860
-29% 10% $30,440
-2% 8% $48,330
Construction Laborers
Landscaping & Groundskeeping Workers
Carpenters
X%
X%
X%
$X
$X
$X
MOST STABLE
+5% 5% $55,160
-2% 8% $48,330
-15% 11% $36,860
Plumbers, Pipefitters & Steamfitters
Carpenters
Construction Laborers
X%
X%
X%
$X
$X
$X
OVERVIEW
COVID-19 CLUSTER IMPACT
COVID-19 OCCUPATIONAL IMPACT
MINIMUM EDUCATION
REQUIREMENT DISTRIBUTION
TOP PERFORMING
STATES
LOWEST PERFORMING
STATES
PERCENT OF OVERALL POSTINGS
CHANGE IN POSTINGS -4%
ALABAMA OKLAHOMA
-45%IOWA
-40%MINNESOTA
-39%MISSOURI
-7% -11%INDIANA
53%High School
4%Associate’s
42%Bachelor’s
1%Bachelor’s Plus
ARCHITECTURE & CONSTRUCTION
3%
-28%
OCCUPATION
PERCENT CHANGE IN JOB
POSTINGS
PERCENTAGE OF CLUSTER
EMPLOYMENTMEDIAN SALARY
LEAST STABLE
NCCER – Masonry
NCCER – Core Curriculum
NCCER – Carpentry
Autodesk Certified User
NCCER – Electrical
TOP 5 CREDENTIALS EARNED IN CAREER CLUSTER
-54% 1% $80,750
-50% 3% $87,060
-42% 3% $95,260
Architects, Except Landscape & Naval
Civil Engineers
Construction Managers
CREDENTIALS MATTER: COVID-19 CASE STUDY | 21
ExcelinEd | Burning Glass Technologies Findings by Career Cluster

LARGESTOCCUPATION
MOST STABLEOCCUPATION
LEAST STABLEOCCUPATION
CLUSTER AVERAGE
Construction Managers
Construction Laborers
Landscaping & Groundskeeping Workers
Carpenters
Plumbers, Pipefitters & Steamfitters
Carpenters
Construction Laborers
Architects, Except Landscape & Naval
Civil Engineers
PHYSICAL PROXIMITY
SCORE (out of 100)
AUTOMATION RISK SCORE
(out of 100)
CRITICAL WORKER
DESIGNATION
62 68 63%
KEY OCCUPATIONAL FACTORS
ARCHITECTURE & CONSTRUCTION
ANALYSIS
The Architecture & Construction career cluster outperformed the overall labor market during the
COVID-19 time period, with the second smallest decline in job postings of any career cluster. Plumbers
did particularly well and experienced a 5% growth in postings along with the occupations of Carpenters,
Construction Laborers and Electricians, which all declined less than 22%. In contrast, occupations such
as Civil Engineers, Construction Managers and Interior Designers experienced decreases in postings
between 42% and 59%. Jobs that were identified as least stable seem to be those with higher salaries.
Also notable is the fact that 53% of jobs in this field require only a high school degree. Despite this lower
barrier to entry, the three largest occupations in this cluster all have average salaries above the living
wage of $30,000.11
ANALYSIS
11 We assume a 40-hour work week and 50 weeks/year to calculate living annual wage based on median hourly wage of $15, see page 25 of A National Landscape of High School Student Credential Attainment Compared to Workforce Demand at https://www.credentialsmatter.org/resources.html for more information.
COVID-19 OCCUPATIONAL IMPACT
X
X
X
88
95
72
73
76
80
X
X
X
35
72
88
67
80
73
X
X
X
2
2
7
53
47
50
CREDENTIALS MATTER: COVID-19 CASE STUDY | 22
ExcelinEd | Burning Glass Technologies Findings by Career Cluster

ANALYSIS
ARCHITECTURE & CONSTRUCTION
The above graph displays the total job postings for licensed occupations aggregated at the
career cluster level along with a labor market trend line as a benchmark, all indexed to
1 at the beginning of the COVID-19 time period. It shows that at the end of the analysis
period, the licensed occupations in Architecture & Construction, Electricians and Plumbers,
outperformed the labor market and licensed occupations in almost all other clusters. These
licensed occupations also experienced very little volatility, steadily outperforming the
market over the COVID-19 time period. This contrasts with the licensed occupations in the
Human Services cluster, which had the highest indexed number of postings at the end of May
but experienced repeated large drops monthly.
INDEXED U.S. JOB POSTINGS FOR LICENSED OCCUPATIONS BY CAREER CLUSTER
0.4
0.0
0.6
0.2
0.8
1.0
1.2
1.4
Labor Market
Transportation, Distribution & Logistics
Law, Public Safety, Corrections & Security
Human Services
Health Science
Architecture & Construction
March 2 March 23 April 13 May 4 May 25
CREDENTIALS MATTER: COVID-19 CASE STUDY | 23
ExcelinEd | Burning Glass Technologies Findings by Career Cluster

LARGEST0%
-2%
-46%
12%
16%
15%
$61,600
$59,670
$27,920
Secondary School Teachers, Except Special Education and CTE
Elementary School Teachers, Except Special Education
Teacher Assistants
MOST STABLE
+13%
+5%
0%
0.4%
7%
12%
$61,190
$59,660
$61,600
Special Education Teachers, All Other
Middle School Teachers, Except Special Education & CTESecondary School Teachers, Except Special Education & CTE
ETS ParaPro Assessment
NOCTI Job Ready Assessment – Early Childhood Education and Care (Basic)
AAFCS Pre-PAC – Early Childhood Education
Child Development Associate Credential
AAFCS Pre-PAC – Education Fundamentals
TOP 5 CREDENTIALS EARNED IN CAREER CLUSTER
OVERVIEW
COVID-19 CLUSTER IMPACT
COVID-19 OCCUPATIONAL IMPACT
MINIMUM EDUCATION
REQUIREMENT DISTRIBUTION
TOP PERFORMING
STATES
LOWEST PERFORMING
STATES
PERCENT OF OVERALL POSTINGS
CHANGE IN POSTINGS +50%
NORTH CAROLINA
ARKANSAS
-57%UTAH
-54%NEW YORK
-57%HAWAII
+45% +4%INDIANA
24%High School
8%Associate’s
47%Bachelor’s
21%Bachelor’s Plus
EDUCATION & TRAINING
4%
-33%
OCCUPATION
PERCENT CHANGE IN JOB
POSTINGS
PERCENTAGE OF CLUSTER
EMPLOYMENTMEDIAN SALARY
LEAST STABLE
-81%
-53%
-51%
1%
3%
2%
$51,830
$57,040
$95,410
Interpreters & Translators
Educational, Guidance, School & Vocational Counselors
Education Administrators, Postsecondary
CREDENTIALS MATTER: COVID-19 CASE STUDY | 24
ExcelinEd | Burning Glass Technologies Findings by Career Cluster

LARGESTOCCUPATION
MOST STABLEOCCUPATION
COVID-19 OCCUPATIONAL IMPACT
LEAST STABLEOCCUPATION
CLUSTER AVERAGE
Education Administrators, Postsecondary
Elementary School Teachers, Except Special Education
Teacher Assistants
Secondary School Teachers, Except Special Education and CTE
Special Education Teachers, All Other
Middle School Teachers, Except Special Education & CTE
Secondary School Teachers, Except Special Education & CTE
Interpreters & Translators
Educational, Guidance, School & Vocational Counselors
PHYSICAL PROXIMITY
SCORE (out of 100)
AUTOMATION RISK SCORE
(out of 100)
CRITICAL WORKER
DESIGNATIONKEY OCCUPATIONAL FACTORS
EDUCATION & TRAINING
ANALYSIS
Education & Training is another well-performing cluster, with an overall average decline of 33%.12 This career cluster also has a very high percentage of critical workers (87%) and a very low Automation Risk score (14). Although this cluster currently has a high Physical Proximity score, this may change as additional distance and remote learning opportunities develop. Interestingly, postings either grew or stayed relatively constant at each of the Elementary, Middle and Secondary school levels: Middle School Teacher postings grew by 5%, Secondary School Teacher postings remained constant, Elementary School Teachers fell only 2%, and Education Administrators in Elementary and Secondary schools only fell 8%. In stark contrast, postings for positions at preschools fell in large numbers, with Preschool Teacher and Preschool Education Administrator postings both falling 50% and Special Education Preschool Teacher postings falling 42%.
The occupations in this field tend to command higher wages; however, many of these positions also require higher levels of education. A full 68% of positions in this cluster require a minimum of a bachelor’s degree.
ANALYSIS
12 This may be due in part to seasonality, because the end of the school year often brings an increase in postings as districts plan for the upcoming fall.
1
0.4
56
70
79
88
1
17
1
90
70
70
38
1
1
66
64
38
14 71 87%
CREDENTIALS MATTER: COVID-19 CASE STUDY | 25
ExcelinEd | Burning Glass Technologies Findings by Career Cluster

MOST STABLE
+4%
-6%
-10%
0.50%
1%
6%
$95,460
$205,590
$25,280
Veterinarians13
Family & General Practitioners
Home Health Aides
LARGEST-10%
-39%
-30%
6%
23%
11%
$25,280
$73,300
$29,660
Home Health Aides
Registered Nurses
Nursing Assistants
OVERVIEW
COVID-19 CLUSTER IMPACT
COVID-19 OCCUPATIONAL IMPACT
MINIMUM EDUCATION
REQUIREMENT DISTRIBUTION
TOP PERFORMING
STATES
LOWEST PERFORMING
STATES
PERCENT OF OVERALL POSTINGS
CHANGE IN POSTINGS -9%
MONTANANORTH DAKOTA
-61%UTAH
-65%LOUISIANA
-52%DELAWARE
-1% -15%ALABAMA
31%High School
26%Associate’s
29%Bachelor’s
14%Bachelor’s Plus
HEALTH SCIENCE
15%
-39%
OCCUPATION
PERCENT CHANGE IN JOB
POSTINGS
PERCENTAGE OF CLUSTER
EMPLOYMENTMEDIAN SALARY
LEAST STABLE
-62%
-61%
-60%
2%
0.50%
1%
$89,440
$74,320
$155,600
Physical Therapists
Diagnostic Medical Sonographers
Dentists, General
Certified Phlebotomy Technician
Certified Nursing Assistant
EMT/Paramedic License
Certified Clinical Medical Assistant
Certified EEG/EKG/ECG Technician
TOP 5 CREDENTIALS EARNED IN CAREER CLUSTER
CREDENTIALS MATTER: COVID-19 CASE STUDY | 26
ExcelinEd | Burning Glass Technologies Findings by Career Cluster

LARGESTOCCUPATION
MOST STABLEOCCUPATION
COVID-19 OCCUPATIONAL IMPACT
LEAST STABLEOCCUPATION
CLUSTER AVERAGE
Dentists, General
Registered Nurses
Nursing Assistants
Home Health Aides
Veterinarians13
Family & General Practitioners
Home Health Aides
Physical Therapists
Diagnostic Medical Sonographers
PHYSICAL PROXIMITY
SCORE (out of 100)
AUTOMATION RISK SCORE
(out of 100)
CRITICAL WORKER
DESIGNATIONKEY OCCUPATIONAL FACTORS
HEALTH SCIENCE
ANALYSIS
Along with a very low Automation Risk score, 91% of the Health Science workforce is designated as a
Critical Worker, indicating stronger prospects for employment and resilience during future crises. Health
Science occupations experienced wide variations in percent decline in job postings during the COVID-19
time period. The average decline for the career cluster was 39%. Family & General Practitioners and
COVID-19 related treatment providers, such as Respiratory Therapists showed stronger demand with
declines between 6 and 33%, while supplementary health service providers, such as Physical Therapists
(-62%), Pharmacists (-60%) and Occupational Therapists (-55%) had larger declines.
For the popular credential of Certified Nursing Assistant, there was a smaller than average decline of
30% in postings. However, the low median salary of $29,660 makes it a weaker career choice in terms of
income. The credentials of Licensed Practical Nurse and Licensed Vocational Nurse have a higher median
salary of $40,810, and also had a smaller than average decline at 36%.
ANALYSIS
39
4
1
0.4
43
39
84
91
88
91
91
84
2
35
0.4
100
95
99
25 85 91%
13 CTE programs may differ in how they categorize occupations into career clusters. Some programs place Veterinarians in the Agriculture, Food & Natural Resources career cluster while others place them in the Health Science career cluster.
CREDENTIALS MATTER: COVID-19 CASE STUDY | 27
ExcelinEd | Burning Glass Technologies Findings by Career Cluster

LARGEST-22%
-41%
-52%
12%
20%
14%
$27,430
$22,740
$22,890
Janitors & Cleaners, Except Maids & Housekeeping Cleaners
Combined Food Preparation & Serving Workers, Including Fast Food
Waiters & Waitresses
MOST STABLE
-22%
-33%
-35%
12%
4%
2%
$27,430
$24,800
$23,370
Janitors & Cleaners, Except Maids & Housekeeping Cleaners
Food Preparation Workers
Amusement & Recreation Attendants
-15%NORTH
CAROLINA
OVERVIEW
COVID-19 CLUSTER IMPACT
COVID-19 OCCUPATIONAL IMPACT
MINIMUM EDUCATION
REQUIREMENT DISTRIBUTION
TOP PERFORMING
STATES
LOWEST PERFORMING
STATES
PERCENT OF OVERALL POSTINGS
CHANGE IN POSTINGS
ARKANSAS
-77%DC
-60%ILLINOIS
-21% -27%INDIANA
87%High School
4%Associate’s
8%Bachelor’s
1%Bachelor’s Plus
HOSPITALITY & TOURISM
9%
-44%
OCCUPATION
PERCENT CHANGE IN JOB
POSTINGS
PERCENTAGE OF CLUSTER
EMPLOYMENTMEDIAN SALARY
LEAST STABLE
-63%
-59%
-59%
0.1%
2%
1%
$54,430
$26,350
$51,530
Lodging Managers
Recreation Workers
Chefs & Head Cooks
AAFCS Pre-PAC – Culinary Arts
ServSafe Certification (Manager/Food Handler/Allergens/Alcohol)
Certified Guest Service Professional
ProStart National Certificate of Achievement
NOCTI Job Ready Assessment Culinary Arts Level 2 Cook
TOP 5 CREDENTIALS EARNED IN CAREER CLUSTER
-72%HAWAII
CREDENTIALS MATTER: COVID-19 CASE STUDY | 28
ExcelinEd | Burning Glass Technologies Findings by Career Cluster

LARGESTOCCUPATION
MOST STABLEOCCUPATION
COVID-19 OCCUPATIONAL IMPACT
LEAST STABLEOCCUPATION
CLUSTER AVERAGE
Chefs & Head Cooks
Combined Food Preparation & Serving Workers, Including Fast Food
Waiters & Waitresses
Janitors & Cleaners, Except Maids & Housekeeping Cleaners
Janitors & Cleaners, Except Maids & Housekeeping Cleaners
Food Preparation Workers
Amusement & Recreation Attendants
Lodging Managers
Recreation Workers
PHYSICAL PROXIMITY
SCORE (out of 100)
AUTOMATION RISK SCORE
(out of 100)
CRITICAL WORKER
DESIGNATIONKEY OCCUPATIONAL FACTORS
HOSPITALITY & TOURISM
ANALYSIS
Hospitality & Tourism was particularly hard hit with an overall decline in job postings of 44%. While
demand for most Hospitality & Tourism occupations has fallen drastically, restaurant and hotel
personnel have seen the largest declines with decreases of 63% for Lodging Managers and 59% for Chefs
& Head Cooks. The increased emphasis on sanitation and cleaning methods is reflected by the lower
decreases for Janitors & Cleaners (-22%) and Maids & Housekeeping Cleaners (-36%). Although restaurant
and hotel jobs are starting to return in the initial recovery, it is likely they would be the first to
disappear again if there are future waves of COVID-19. These occupations are also at high risk of future
automation.
Along with the large declines in employment, occupations in Hospitality & Tourism tend to have very
low median salaries. In fact, the three largest occupations, which make up nearly 50% of employment in
the cluster all have salaries far below the living wage of $30,000. Additionally, 87% of postings require
only a high school diploma.
ANALYSIS
66
87
72
48
69
84
66
92
94
48
74
78
0.4
0.6
10
49
72
81
81 71 67%
CREDENTIALS MATTER: COVID-19 CASE STUDY | 29
ExcelinEd | Burning Glass Technologies Findings by Career Cluster

2020 INDEXED JOB POSTINGS: SERVSAFE
ANALYSIS
HOSPITALITY & TOURISM
40
0
60
20
80
100
120
140
Indexed Total ServSafe Demand Indexed Total Market Demand
The ServSafe family of credentials is requested by employers across several hospitality occupations, including Food Service Managers (25%), Cooks, Restaurant (13%), Chefs and Head Cooks (9%), First-Line Supervisors of Food Preparation and Serving Workers (8%) and Combined Food Preparation and Serving Workers, Including Fast Food (6%). The graph below shows the total number of job postings for the labor market and the postings requesting ServSafe (both indexed to 100 on 1/14/2020). Since restaurant occupations were some of the hardest hit, there was a larger decline in postings requesting ServSafe compared to the decline in overall postings.
January 14 February 14 March 14 April 14 May 14
CREDENTIALS MATTER: COVID-19 CASE STUDY | 30
ExcelinEd | Burning Glass Technologies Findings by Career Cluster

-50%DC
-48%UTAH
OVERVIEW
COVID-19 CLUSTER IMPACT
COVID-19 OCCUPATIONAL IMPACT
MINIMUM EDUCATION
REQUIREMENT DISTRIBUTION
TOP PERFORMING
STATES
LOWEST PERFORMING
STATES
PERCENT OF OVERALL POSTINGS
CHANGE IN POSTINGS -19%
TENNESSEE OKLAHOMA
-46%VIRGINIA
-21%
38%High School
5%Associate’s
30%Bachelor’s
27%Bachelor’s Plus
HUMAN SERVICES
3%
-34%
OCCUPATION
PERCENT CHANGE IN JOB
POSTINGS
PERCENTAGE OF CLUSTER
EMPLOYMENTMEDIAN SALARY
LEAST STABLE
MOST STABLE
LARGEST-41%
-63%
+17%
-12%
-60%
-12%
-46%
-51%
-22%
6%
0.2%
6%
35%
5%
35%
9%
1%
1%
$35,060
$25,110
$26,090
$25,280
$40,390
$25,280
$24,230
$55,220
$49,610
Social & Human Services Assistants
Locker Room, Coatroom & Dressing Room Attendants
Hairdressers, Hairstylists & Cosmetologists
Personal Care Aides
Fitness Trainers & Aerobics Instructors
Personal Care Aides
Childcare Workers
Health Educators
Marriage & Family Therapists
Career Essentials – Cosmetology
Hair Stylist/Cosmetologist/Barber License
TSFA Knowledge Based Certification
AAFCS Pre-PAC Broad Field Family and Consumer Sciences
TSFA Level I High School Floral Design Certification
TOP 5 CREDENTIALS EARNED IN CAREER CLUSTER
-21%NORTH
CAROLINA
CREDENTIALS MATTER: COVID-19 CASE STUDY | 31
ExcelinEd | Burning Glass Technologies Findings by Career Cluster

LARGESTOCCUPATION
MOST STABLEOCCUPATION
COVID-19 OCCUPATIONAL IMPACT
LEAST STABLEOCCUPATION
CLUSTER AVERAGE
Health Educators
Personal Care Aides
Childcare Workers
Social & Human Services Assistants
Hairdressers, Hairstylists & Cosmetologists
Personal Care Aides
Marriage & Family Therapists
Locker Room, Coatroom & Dressing Room Attendants
Fitness Trainers & Aerobics Instructors
PHYSICAL PROXIMITY
SCORE (out of 100)
AUTOMATION RISK SCORE
(out of 100)
CRITICAL WORKER
DESIGNATIONKEY OCCUPATIONAL FACTORS
HUMAN SERVICES
ANALYSIS
The Human Services career cluster had a 34% decline in job postings during the COVID-19 time period.
Healthcare related occupations in the cluster, like Personal Care Aides and Mental Health Counselors
had smaller declines between 12% and 26% while Childcare Workers, Social Workers and Fitness Trainers
had declines between 45% and 60%. This could be because of a lack of public funding for things like
childcare, decreased demand for childcare services as normally working parents have stayed home,
temporary closure of fitness centers, and because healthcare related occupations in the Human Services
cluster are considered more necessary.
ANALYSIS
13
43
11
74
9
74
8
5
1
79
64
92
86
83
86
75
64
58
36 77 45%
CREDENTIALS MATTER: COVID-19 CASE STUDY | 32
ExcelinEd | Burning Glass Technologies Findings by Career Cluster

ANALYSIS
Licensed occupations in personal care experienced a great deal of volatility. For example,
Hairdressers, Hairstylists and Cosmetologists experienced a 67% weekly drop in job postings
at the end of March and a 200% weekly increase in the middle of May, coinciding with phased
reopening of many states. This volatility combined with a low median salary of $26,090, far
below the living wage, and increased risk due to the physical closeness required to perform
these jobs makes the occupation a weaker employment choice. The same is true of other
licensed occupations in Human Services like Barbers (median salary of $30,150) and Manicurists
& Pedicurists ($25,770).
HUMAN SERVICES
LICENSED OCCUPATIONS IN HUMAN SERVICES
PERCENT CHANGE IN JOB
POSTINGS
+17%
-36%
-16%
-27%
Hairdressers, Hairstylists & Cosmetologists
Skincare Specialists
Manicurists & Pedicurists
Barbers
CREDENTIALS MATTER: COVID-19 CASE STUDY | 33
ExcelinEd | Burning Glass Technologies Findings by Career Cluster

MOST STABLE
-38%
-38%
-39%
3%
6%
4%
$99,730
$86,550
$112,690
Information Security Analysts
Computer Programmers
Computer Network Architects
LARGEST-52%
-44%
-48%
14%
22%
15%
$90,920
$107,510
$52,270
Computer Systems Analysts
Software Developers, Applications
Computer User Support Specialists
OVERVIEW
COVID-19 CLUSTER IMPACT
COVID-19 OCCUPATIONAL IMPACT
MINIMUM EDUCATION
REQUIREMENT DISTRIBUTION
TOP PERFORMING
STATES
LOWEST PERFORMING
STATES
PERCENT OF OVERALL POSTINGS
CHANGE IN POSTINGS
MISSISSIPPI
-70%NEW
HAMPSHIRE
-65%MICHIGAN
-18% -31%MARYLAND
10%High School
5%Associate’s
81%Bachelor’s
4%Bachelor’s Plus
INFORMATION TECHNOLOGY
9%
-46%
OCCUPATION
PERCENT CHANGE IN JOB
POSTINGS
PERCENTAGE OF CLUSTER
EMPLOYMENTMEDIAN SALARY
LEAST STABLE
-52%
-48%
-48%
14%
15%
9%
$90,920
$52,270
$88,550
Computer Systems Analysts
Computer User Support Specialists
Computer Occupations, All Other
ICT Multimedia Essential
Certified Internet Web Certification
Microsoft Technology Associate
ICT Cybersecurity Essentials
ICT Word Processing Essentials
TOP 5 CREDENTIALS EARNED IN CAREER CLUSTER
-15%HAWAII
-65%DELAWARE
CREDENTIALS MATTER: COVID-19 CASE STUDY | 34
ExcelinEd | Burning Glass Technologies Findings by Career Cluster

LARGESTOCCUPATION
MOST STABLEOCCUPATION
COVID-19 OCCUPATIONAL IMPACT
LEAST STABLEOCCUPATION
CLUSTER AVERAGE
Computer Occupations, All Other
Software Developers, Applications
Computer User Support Specialists
Computer Systems Analysts
Information Security Analysts
Computer Programmers
Computer Network Architects
Computer Systems Analysts
Computer User Support Specialists
PHYSICAL PROXIMITY
SCORE (out of 100)
AUTOMATION RISK SCORE
(out of 100)
CRITICAL WORKER
DESIGNATIONKEY OCCUPATIONAL FACTORS
INFORMATION TECHNOLOGY
ANALYSIS
Information Technology faced a larger than average decline of 46%. There was less variation in the
declines for individual occupations across this cluster compared to some of the previously examined
career clusters. That is, the difference between the declines for the most stable occupation of
Information Security Analyst and least stable occupation of Computer Systems Analyst was only 14
percentage points. Although all the occupations in this cluster experienced large declines during the
COVID-19 time period, the cluster has a low Physical Proximity score, reflecting the fact that many
jobs can be performed remotely and a low risk of automation. Additionally, 100% of its workforce was
classified as a Critical Worker. Eighty-five percent of job postings required at least a bachelor’s degree
and this high entry requirement is reflected in very high median salaries for the associated occupations.
ANALYSIS
1
4
65
54
50
64
21
48
21
52
39
46
1
65
22
54
64
46
22 52 100%
CREDENTIALS MATTER: COVID-19 CASE STUDY | 35
ExcelinEd | Burning Glass Technologies Findings by Career Cluster

ANALYSIS
INFORMATION TECHNOLOGY
WHAT ARE POSSIBLE IMPACTS OF COVID-19 ON DEMAND FOR IT CREDENTIALS?
Two of the most demanded Information Technology credentials are CompTIA A+ and Cisco Certified Network Associate (CCNA).
Comparing CompTIA A+ and CCNA illustrates how differences in occupations can affect overall demand for credentials. Job postings for Computer User Support Specialists comprise forty-eight percent of employer requests for CompTIA A+ credentials, significantly higher than any other occupation. Since this occupation had larger declines in postings compared to the market, CompTIA A+ was also less demanded overall. Additionally, the high Automation Risk score and Physical Proximity score of the occupation suggest this trend might continue through recovery.
Conversely, demand for the CCNA credential outperformed the market during COVID-19. The three occupations with the largest demand for CCNA are Computer Network Architects; Computer Occupations, All Other; and Network and Computer Systems Administrators. The fact that CCNA credential is requested by occupations with lower Automation Risk scores and lower Physical Proximity scores suggests that it might continue to be more demanded by employers throughout recovery.
2020 INDEXED JOB POSTINGS: CCNA
40
0
60
20
80
100
120140
Indexed Total CCNA Demand Indexed Total Market Demand
2020 INDEXED JOB POSTINGS: COMPTIA A+
40
0
60
20
80
100
120140
Indexed Total CompTIA A+ Demand Indexed Total Market Demand
January 14 February 14 March 14 April 14 May 14
January 14 February 14 March 14 April 14 May 14
CREDENTIALS MATTER: COVID-19 CASE STUDY | 36
ExcelinEd | Burning Glass Technologies Findings by Career Cluster
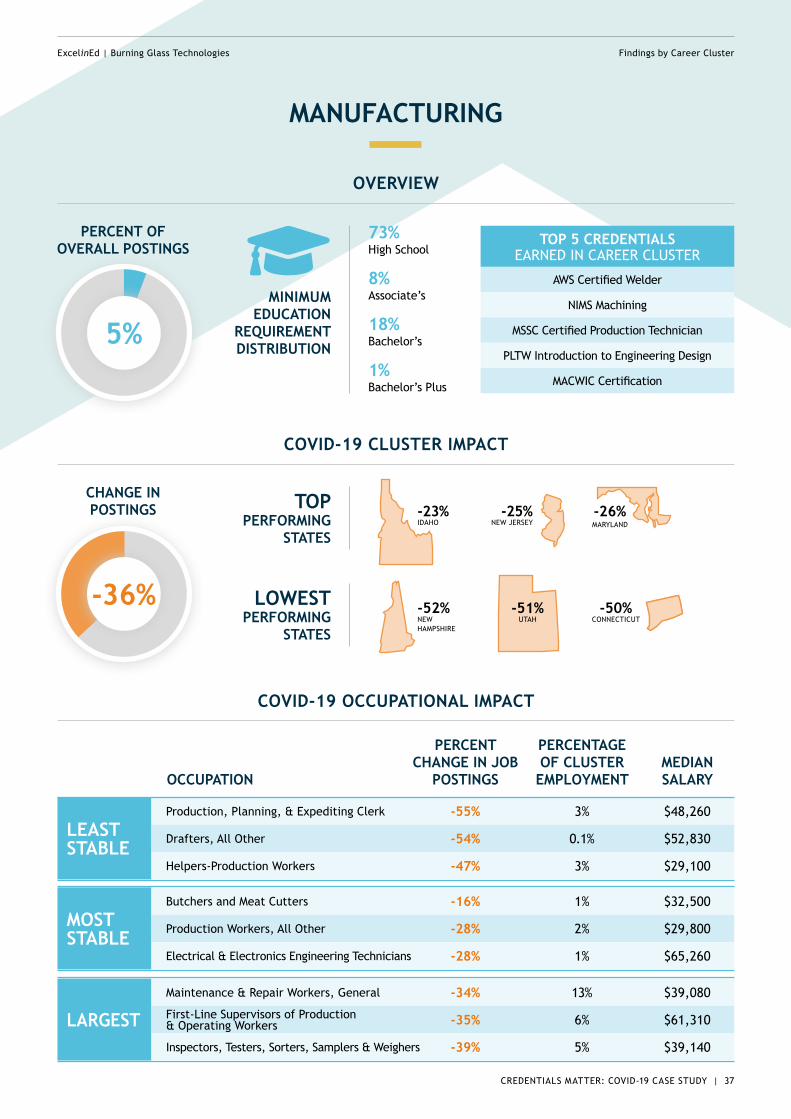
MOST STABLE
-16%
-28%
-28%
1%
2%
1%
$32,500
$29,800
$65,260
Butchers and Meat Cutters
Production Workers, All Other
Electrical & Electronics Engineering Technicians
LARGEST-39%
-34%
-35%
5%
13%
6%
$39,140
$39,080
$61,310
Inspectors, Testers, Sorters, Samplers & Weighers
Maintenance & Repair Workers, General
First-Line Supervisors of Production & Operating Workers
OVERVIEW
COVID-19 CLUSTER IMPACT
COVID-19 OCCUPATIONAL IMPACT
MINIMUM EDUCATION
REQUIREMENT DISTRIBUTION
TOP PERFORMING
STATES
LOWEST PERFORMING
STATES
PERCENT OF OVERALL POSTINGS
CHANGE IN POSTINGS -23%
IDAHO NEW JERSEY
-50%CONNECTICUT
-25%
73%High School
8%Associate’s
18%Bachelor’s
1%Bachelor’s Plus
MANUFACTURING
5%
-36%
OCCUPATION
PERCENT CHANGE IN JOB
POSTINGS
PERCENTAGE OF CLUSTER
EMPLOYMENTMEDIAN SALARY
LEAST STABLE
-55%
-54%
-47%
3%
0.1%
3%
$48,260
$52,830
$29,100
Production, Planning, & Expediting Clerk
Drafters, All Other
Helpers-Production Workers
MACWIC Certification
AWS Certified Welder
NIMS Machining
MSSC Certified Production Technician
PLTW Introduction to Engineering Design
TOP 5 CREDENTIALS EARNED IN CAREER CLUSTER
-51%UTAH
-26%MARYLAND
-52%NEW HAMPSHIRE
CREDENTIALS MATTER: COVID-19 CASE STUDY | 37
ExcelinEd | Burning Glass Technologies Findings by Career Cluster

LARGESTOCCUPATION
MOST STABLEOCCUPATION
COVID-19 OCCUPATIONAL IMPACT
LEAST STABLEOCCUPATION
CLUSTER AVERAGE
Helpers-Production Workers
Maintenance & Repair Workers, General
First-Line Supervisors of Production & Operating WorkersInspectors, Testers, Sorters, Samplers & Weighers
Butchers and Meat Cutters
Production Workers, All Other
Electrical & Electronics Engineering Technicians
Production, Planning, & Expediting Clerk
Drafters, All Other
PHYSICAL PROXIMITY
SCORE (out of 100)
AUTOMATION RISK SCORE
(out of 100)
CRITICAL WORKER
DESIGNATIONKEY OCCUPATIONAL FACTORS
MANUFACTURING
ANALYSIS
The Manufacturing career cluster had an average decline of 36%. Although the career cluster has 90%
of its workers designated as Critical Workers, it also has a high Automation Risk score of 70 and 81% of
postings require less than a Bachelor’s degree. In spite of the low educational requirements, the three
largest occupations within the cluster all had median salaries above the living wage and declines smaller
than the national average: Maintenance & Repair Workers, General had a decline of 34%; First-Line
Supervisors of Production & Operating Workers had a decline of 35%; and Inspectors, Testers, Sorters,
Samples & Weighers had a decline of 39%.
ANALYSIS
98
64
2
65
69
65
93
92
84
77
58
57
88
67
66
52
49
54
70 61 90%
CREDENTIALS MATTER: COVID-19 CASE STUDY | 38
ExcelinEd | Burning Glass Technologies Findings by Career Cluster

ANALYSIS
MANUFACTURING
The most demanded Manufacturing credential is AWS Welding. Welders, Cutters, Solderers and Brazers occupation postings make up the majority of AWS Welding demand (28%) and 14.8% of all job postings in this occupation specifically request the credential. This number fell slightly to 13.2% in 2020. This occupation has a median salary of $42,490 and has a very high Automation Risk score of 94. As the graph below shows, postings requesting AWS Welding slightly outperformed the labor market over the COVID-19 time period.
2020 INDEXED JOB POSTINGS: AWS WELDING
40
0
60
20
80
100
120
140
Indexed Total AWS Demand Indexed Total Market Demand
January 14 February 14 March 14 April 14 May 14
CREDENTIALS MATTER: COVID-19 CASE STUDY | 39
ExcelinEd | Burning Glass Technologies Findings by Career Cluster

MOST STABLE
+27%
-19%
-32%
25%
5%
1%
$29,150
$36,200
$94,560
Laborers & Freight, Stock, & Material Movers, Hand
Industrial Truck & Tractor Operators
Transportation, Storage, & Distribution Managers
LARGEST-44%
+27%
-41%
8%
25%
15%
$34,730
$29,150
$45,260
Light Truck or Delivery Services Drivers
Laborers & Freight, Stock, & Material Movers, Hand
Heavy & Tractor-Trailer Truck Drivers
OVERVIEW
COVID-19 CLUSTER IMPACT
COVID-19 OCCUPATIONAL IMPACT
MINIMUM EDUCATION
REQUIREMENT DISTRIBUTION
TOP PERFORMING
STATES
LOWEST PERFORMING
STATES
PERCENT OF OVERALL POSTINGS
CHANGE IN POSTINGS
-55%KENTUCKY
+27%MASSACHUSETTS
86%High School
3%Associate’s
10%Bachelor’s
1%Bachelor’s Plus
TRANSPORTATION, DISTRIBUTION & LOGISTICS
6%
-26%
OCCUPATION
PERCENT CHANGE IN JOB
POSTINGS
PERCENTAGE OF CLUSTER
EMPLOYMENTMEDIAN SALARY
LEAST STABLE
-71%
-63%
-50%
2%
1%
4%
$31.340
$25,140
$38,740
Taxi Drivers & Chauffeurs
Parking Lot Attendants
Billing & Posting Clerks
FAA Small UAS Remote Pilot Airman
Automotive Service Excellence Certification
S/P2 - Automotive Service
S/P2 - Collision Repair and Refinish
Valvoline - Motor Oil Certification
TOP 5 CREDENTIALS EARNED IN CAREER CLUSTER
NEW JERSEY+33%+44%
NEW HAMPSHIRE
-62%HAWAII
-57%LOUISIANA
CREDENTIALS MATTER: COVID-19 CASE STUDY | 40
ExcelinEd | Burning Glass Technologies Findings by Career Cluster

LARGESTOCCUPATION
MOST STABLEOCCUPATION
COVID-19 OCCUPATIONAL IMPACT
LEAST STABLEOCCUPATION
CLUSTER AVERAGE
Billing & Posting Clerks
Laborers & Freight, Stock, & Material Movers, Hand
Heavy & Tractor-Trailer Truck Drivers
Light Truck or Delivery Services Drivers
Laborers & Freight, Stock, & Material Movers, Hand
Industrial Truck & Tractor Operators
Transportation, Storage, & Distribution Managers
Taxi Drivers & Chauffeurs
Parking Lot Attendants
PHYSICAL PROXIMITY
SCORE (out of 100)
AUTOMATION RISK SCORE
(out of 100)
CRITICAL WORKER
DESIGNATIONKEY OCCUPATIONAL FACTORS
TRANSPORTATION, DISTRIBUTION & LOGISTICS
ANALYSIS
The Transportation, Distribution & Logistics career cluster had the smallest average decline of
any career cluster, falling only 26%. Many of the larger occupations making up this career cluster
experienced growth during the COVID-19 time period. For example, Laborers & Freight, Stock & Material
Movers, Hand, which makes up 25% of total employment in this cluster experienced an average increase
of 27% in postings. This occupation has a lower than living-wage median salary of $29,510. The same
is true of Packers & Packagers, Hand which had a demand growth of 84% but a median salary of only
$25,910. In contrast, Cargo & Freight Agents had a growth of 89% and has a higher median salary,
$43,740, making this a better choice within the cluster when looking at potential salary earnings.
However, this cluster also has a high Automation Risk score of 74 and 86% of postings require only a high
school diploma as an educational requirement.
ANALYSIS
69
85
79
67
70
42
85
93
59
70
34
47
89
87
96
79
73
59
74 61 96%
CREDENTIALS MATTER: COVID-19 CASE STUDY | 41
ExcelinEd | Burning Glass Technologies Findings by Career Cluster

As states re-open, we will learn more how the COVID-19 virus effects
have impacted economies and labor markets in the medium- and long-
term. Not all businesses and industries will look the same after the
pandemic. Some will likely experience permanent changes in working
conditions, such as the number of employees working at a time and the
way the job is performed to maintain social distance.
As the economy shifts, the importance of high-quality, industry-
responsive education-to-workforce pathways will increase. Second and
third waves of the pandemic could occur, and if that happens, continued
disruption is likely.
IMPLICATIONS
CREDENTIALS MATTER: COVID-19 CASE STUDY | 42
ExcelinEd | Burning Glass Technologies

To both prepare for this disruption and work towards economic recovery, states will need to understand the factors likely to affect future workforce needs, workplace practices and consumer behavior.
We recommend states consider the following factors and questions to understand how their career pathway and credential offerings for students may be affected by the economic impacts of the COVID-19 pandemic.
CRITICAL WORKER DESIGNATIONBeing deemed a Critical Worker has insulated some workers from COVID-related job loss. While
perhaps insulated from job loss, many of these critical workers are not insulated from risk of
exposure to the Coronavirus or infection. Some critical occupations have not only remained stable,
but have increased in demand. Key questions in determining COVID-related influence on demand for
workers and credentials include:
u How many career pathways and credentials does my state offer that lead to critical occupations?
u How should students balance the trade-offs between near-term economic stability and increased risk of infection due to Critical Worker designation and associated tasks that require closer proximity to others?
u Are the career pathways and credentials that lead to critical jobs associated with occupations that pay a living wage of at least $30,000 and offer career advancement opportunities?
OCCUPATION FUTURE OUTLOOK
Although Nursing Assistants experienced more stable demand during COVID-19 among occupations in the Health Science career cluster, they also carry health risk for individuals and very low median salary. Despite this stable demand, students interested in nursing pathways may seek occupations with increased credentials, such as LPN, to offset the low median salary and increased exposure to viruses.
As one of the few non-critical occupations within the Health Science career cluster, Diagnostic Medical Sonographers had one of the largest declines in postings at 62%. However, this occupation carries a high median salary. As patients regain comfort visiting healthcare settings, demand may return to pre-crisis levels, as the number of people overall needing sonography services is unlikely to decline, even if those services are currently being delayed or avoided.
Certified Nursing Assistant
$29,660MEDIAN ANNUAL SALARY
Critical DESIGNATION
Diagnostic Medical Sonographer
$74,320MEDIAN ANNUAL SALARY
Non-critical DESIGNATION
CREDENTIALS MATTER: COVID-19 CASE STUDY | 43
ExcelinEd | Burning Glass Technologies Implications

PHYSICAL PROXIMITYProximity to others has been used throughout the pandemic as a measure of safety, resulting in
restrictions to some businesses being open. As the need for physical proximity has becomes a
greater and more universal concern in career planning, new considerations for choosing careers and
credentials should include:
u Which career pathways and credentials does my state offer that lead to jobs requiring a high proximity to others?
u What are the health and economic stability risks for students preparing to enter high-proximity jobs?
u How are students and decision-makers informed about which career pathways and lead to higher-proximity jobs—especially in states with less-stringent proximity or personal protective restrictions?
OCCUPATION FUTURE OUTLOOK
Skincare Specialists often require close contact with clients in order to perform their jobs. Since much of the work focuses on the client’s face, this adds an additional layer of risk because masks are not always practical in certain situations. Many beauty salons were ordered to close when coronavirus numbers increased, and states have varied in their reopening policies with many limiting the number of salon clients and others limiting services offered (e.g. not allowing facials). As a result, students going into this field will be taking on health risks in addition to the economic instability currently present in the field. As a discretionary/luxury activity, consumer demand for these services may also remain depressed as long as the recession endures.
Workers in this field can typically perform their jobs from a distance and can also use telephone and video interfaces to serve their clients. Additionally, the toll of COVID-19 on the nation’s mental health suggests that demand for this field may rise. Students interested in this occupation may face less health and economic risk than others who pursue healthcare and social assistance specialties that cannot be delivered remotely as easily.
Skincare Specialists
$34,090 MEDIAN ANNUAL SALARY
HIGH PHYSICAL PROXIMITY
Mental Health and SubstanceAbuse Social Workers
$46,650 MEDIAN ANNUAL SALARY
LOW PHYSICAL PROXIMITY
CREDENTIALS MATTER: COVID-19 CASE STUDY | 44
ExcelinEd | Burning Glass Technologies Implications

REMOTE WORKThe pandemic has increased employees’ and companies’ abilities and willingness allow
employees to work remotely and has also increased worker demand for remote work. As
these trends accelerate, employers should actively signal in job postings the potential for
remote work so states can track which occupations are more likely to be remote and prepare
students for opportunities beyond their labor market area. In the meantime, states can
address the question of remote work based on current norms in the occupation.
u What is the likelihood of a career pathway and credential leading to an occupation that 1) can be done effectively in a remote fashion, and 2) whose employers allow employees to work remotely even after the pandemic has passed?
u How can my state prepare students for jobs where remote work is an option to remain open to opportunities that will still exist in the event of a second or third wave of COVID-19 or future health crises?
u Can remote work practices (like use of Zoom, time-management, effective online communication and collaboration) be incorporated into career pathways that prepare students for occupations that allow remote work, and will those skills become important components of industry-recognized credentials?
CREDENTIALS MATTER: COVID-19 CASE STUDY | 45
ExcelinEd | Burning Glass Technologies Implications

AUTOMATION RISKThe pandemic will accelerate current trends towards automation as some businesses and
employers choose not to re-hire workers in favor of automating processes. Nearly all occupations
are experiencing some form of automation, and education leaders should consider:
u Which career pathways and credentials does my state offer that lead to jobs at high risk of automation, and which may face more rapid shift to automation technologies coming out of this recession?
u Which career clusters have higher overall risks of automation, and how can career pathways and credentials be used to advise students toward jobs that are more likely to survive automation?
OCCUPATION FUTURE OUTLOOK
COVID-19 may lead to greater use of touchscreen or mobile ordering technology in the restaurant industry, both to cut costs and to keep consumers and employees safe. Food Preparation and Serving Workers are at high risk of being replaced as these existing technologies gain greater use beyond fast food and fast casual restaurants and into more takeout and traditional sit-down restaurants.
As restaurants implement new policies to stay in compliance with COVID-19 guidelines, manager positions will become more important than ever. Oversight of social distancing and sanitation practices along with knowledge of typical food safety regulations will play an increased role in restaurant success due to the occupation’s low Automation Risk and high Physical Proximity scores.
Combined Food Preparation and Serving Workers, Including Fast Food
$22,740MEDIAN ANNUAL SALARY
HIGHAUTOMATION RISK
Food Service Managers
$55,320MEDIAN ANNUAL SALARY
LOWAUTOMATION RISK
CREDENTIALS MATTER: COVID-19 CASE STUDY | 46
ExcelinEd | Burning Glass Technologies Implications

LICENSING AND EXPIRY HURDLESWhile licensed occupations are often thought of as reliable “good” jobs, many do not pay a living
wage and some require frequent re-licensing or expire. With more remote work opportunities and
the potential to move to lower cost of living areas, re-licensing or expiring credentials may become
more burdensome hurdles. Other credentials, especially technical and software focused credentials,
may require frequent updating to stay current with the skills employers demand in the job market.
Key questions for those considering occupations that require licensure include:
u Which career pathways and credentials does my state offer to students that will ultimately require state-based licenses?
u Do licensing requirements limit inter-state mobility?
u Which career pathways and credentials does my state offer that lead to licensure that will need to be renewed, and what are the time, cost and process burdens associated with re-licensing?
OCCUPATION FUTURE OUTLOOK
All states require individuals in this occupation to have a license to practice, with training hours and exam requirements varying by state. Additionally, licenses need to be renewed every one to two years. Combined with the low median wage for this occupation and the especially volatile demand throughout the COVID-19 time period, the licensing and expiry burdens make this occupation a much more limiting career choice than many others within the cluster.
Electrician license requirements vary by state and by level, with some states requiring licenses for apprenticeships while others require it only at the journeyman, master electrician or electrical contractor level. Some states have reciprocal licenses which allow work across state lines. In spite of these high hurdles, Electricians had relatively strong demand throughout the COVID-19 time period and also allow for social distancing during work. Should COVID-19 practices endure and call for additional investments in remote work and learning infrastructure, then demand for electricians will likely grow. These factors along with the high median salary make this a stronger career choice among licensed occupations.
Hairdressers, Hairstylists & Cosmetologists
$26,090 MEDIAN ANNUAL SALARY
HIGH LICENSING AND EXPIRY HURDLES
Electricians
$56,180 MEDIAN ANNUAL SALARY
HIGH LICENSING AND EXPIRY HURDLES
CREDENTIALS MATTER: COVID-19 CASE STUDY | 47
ExcelinEd | Burning Glass Technologies Implications
RECOMMENDATIONSIn light of the previous data and analysis, we pose three suggestions.
INCREASE THE USE OF LABOR MARKET DATA BY STAKEHOLDERS. Policymakers can identify labor market patterns in their states and provide
occupational and credential demand data to districts and schools. They can also
focus funding on career pathways and credentials that lead to high-wage, in-
demand, relatively stable occupations as well as target budget reductions on
programs that lead to low-wage, low-demand or highly volatile occupations.
Education institutions can include occupation stability and volatility criteria in
program approval processes, local offerings/promotion decisions and incentive
methodologies.
REASSESS CAREER PATHWAYS CONSIDERING THE KEY OCCUPATIONAL FACTORS DRIVING RECOVERY AFTER THE COVID-19 CRISIS. This includes properly assessing and communicating the potential risks and benefits
associated with occupations and aligned credentials that prepare students for
the “front-lines” of pandemic-related activity, including health risks and job loss
risks. Additionally, it requires considering Automation Risk which may become
exacerbated soon and encouraging programs that lead to occupations that aren’t
at risk of being automated. This assessment could also include identifying programs
that may experience an increase in remote work and adding standards that support
learning the skills required to be successful remotely.
EMPOWER STUDENTS AND PARENTS TO USE JOB DEMAND, WAGE AND RISK INFORMATION.Equip families to access and understand factors related to occupational stability so
they can evaluate their ability and willingness to accept various risks and benefits
as they plan their careers.
1
2
3
CREDENTIALS MATTER: COVID-19 CASE STUDY | 48
ExcelinEd | Burning Glass Technologies

BIBLIOGRAPHY Advance CTE. Perkins IV Crosswalks. Retrieved from https://careertech.org/crosswalks
Cook, William. (2020, March 29). LMI Institute. Many U.S. Workers in Critical Occupations in the
Fight Against COVID-19. Retrieved from https://www.lmiontheweb.org/more-than-half-of-u-s-
workers-in-critical-occupations-in-the-fight-against-covid-19/
Frey, Carl & Osborne, Michael. (2013). The Future of Employment: How Susceptible
Are Jobs to Computerisation? Oxford Martin. 114. 10.1016/j.techfore.2016.08.019.
Long, Heather and Andrew Van Dam (2020, May 8). U.S. unemployment rate jumps to
14.7 percent, the worse since the Great Depression. The Washington Post.
Retrieved from https://www.washingtonpost.com/business/2020/05/08/april-2020-jobs-report/
O*NET. (2020, June 23). O*NET Online. Work Context – Physical Proximity.
Retrieved from https://www.onetonline.org/find/descriptor/result/4.C.2.a.3
United States Department of Labor. (2020, June 8). U.S. Bureau of Labor Statistics.
Occupational Employment Statistics. Retrieved from https://www.bls.gov/oes/tables.htm
Walsh, Matthew et al. (2019, May). A National Landscape of High School Student Credential
Attainment Compared to Workforce Demand. Retrieved from https://www.credentialsmatter.org/
resources.html
CREDENTIALS MATTER: COVID-19 CASE STUDY | 49
ExcelinEd | Burning Glass Technologies Bibliography