American Art History and Digital Scholarship: New Avenues for Exploration
Upload
khangminh22Category
view
1download
0
The West Valley Workforce and Labor Market Study Sponsored by WESTMARC and Maricopa Workforce Connections
Fall 08
Creating New Avenues for Success
Prepared by ERISS Corporation and Advanced Workforce Systems

2 www.usworks.com/westmarc
Table of Contents
ACKNOWLEDGEMENTS ................................................................................................. 4
WEST VALLEY LABOR MARKET STUDY INTRODUCTION .......................................... 7
SECTION 1 HEADLINES AND EXECUTIVE SUMMARY ................................................ 9
THE EXECUTIVE SUMMARY – HEADLINES EXPLAINED .......................................... 10
SECTION 2 THE WEST VALLEY OF PHOENIX ............................................................ 19
CONCLUSION: THE WEST VALLEY – THE BEST IS YET TO COME ........................ 32
SECTION 3 INDIVIDUAL COMMUNITY REPORTS ...................................................... 33
AVONDALE ..................................................................................................................... 34
BUCKEYE ....................................................................................................................... 40
EL MIRAGE ..................................................................................................................... 46
GILA BEND .................................................................................................................... 50
GLENDALE ..................................................................................................................... 55
GOODYEAR ................................................................................................................... 61
LITCHFIELD PARK ......................................................................................................... 67
PEORIA........................................................................................................................... 71
WEST PHOENIX ............................................................................................................. 78
SUN CITY ....................................................................................................................... 85
SUN CITY WEST ............................................................................................................ 89
SURPRISE ...................................................................................................................... 94
TOLLESON ..................................................................................................................... 99

3Copyright ERISS 2008 www.usworks.com/westmarc
WICKENBURG ............................................................................................................. 104
YOUNGTOWN .............................................................................................................. 109
APPENDIX 1 EMPLOYER SURVEY METHODOLOGY ............................................... 113
APPENDIX 2 EMPLOYMENT, OCCUPATION AND LABOR FORCE ESTIMATION METHODOLOGY .......................................................................................................... 118
APPENDIX 3 DATA TABLES AND SPECIALIZED REPORTS .................................... 121
4 www.usworks.com/westmarc
Acknowledgements
ERISS Corporation would like to acknowledge and thank the WESTMARC staff, Maricopa Workforce Connections, all of the Sponsors and the 1,004 businesses who participated in the survey.
The Department of Labor has stated that in order for information to be relevant and meaningful to a community, it must be current, comprehensive, local and have universal access to the information. By collecting the data in a timely manner and disseminating it via interactive web applications, current, critical information is now available to all stakeholders in a format they can use. Comprehensive local labor market information is the foundation for a demand-driven, information-based workforce and economic development system.
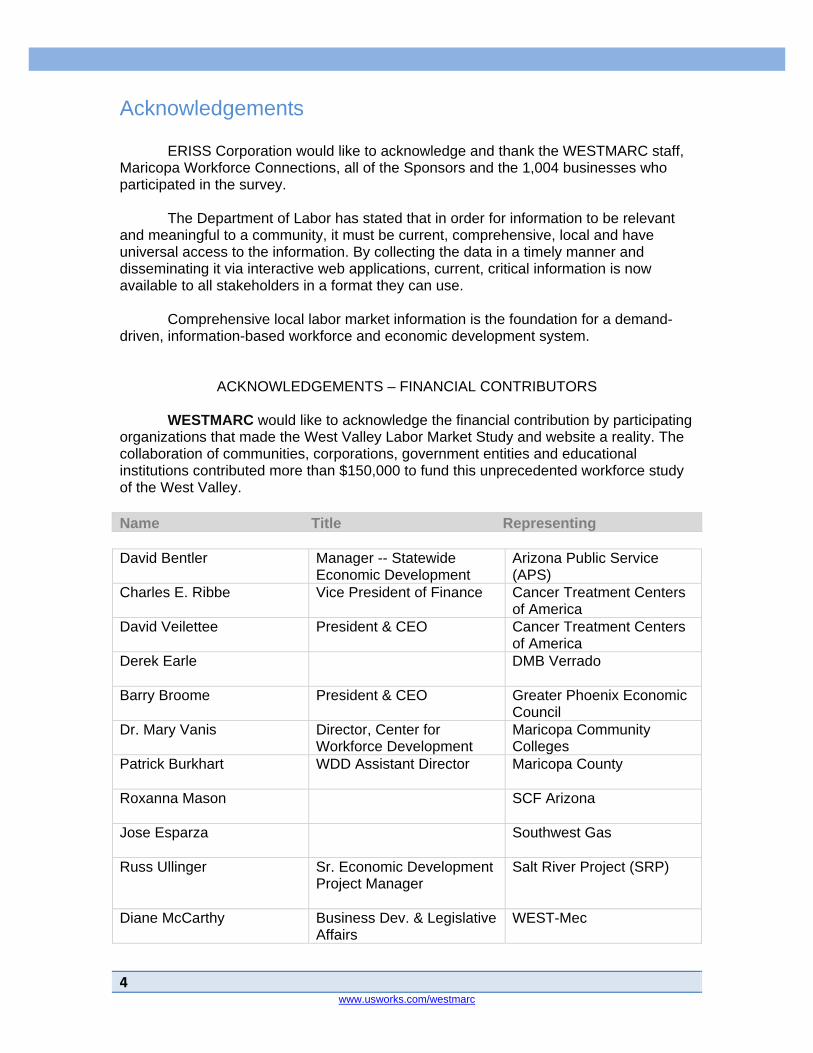
ACKNOWLEDGEMENTS – FINANCIAL CONTRIBUTORS WESTMARC would like to acknowledge the financial contribution by participating organizations that made the West Valley Labor Market Study and website a reality. The collaboration of communities, corporations, government entities and educational institutions contributed more than $150,000 to fund this unprecedented workforce study of the West Valley. Name Title Representing David Bentler Manager -- Statewide
Economic Development Arizona Public Service (APS)
Charles E. Ribbe Vice President of Finance Cancer Treatment Centers of America
David Veilettee President & CEO Cancer Treatment Centers of America
Derek Earle DMB Verrado
Barry Broome President & CEO Greater Phoenix Economic Council
Dr. Mary Vanis Director, Center for Workforce Development
Maricopa Community Colleges
Patrick Burkhart WDD Assistant Director Maricopa County
Roxanna Mason SCF Arizona
Jose Esparza Southwest Gas
Russ Ullinger Sr. Economic Development Project Manager
Salt River Project (SRP)
Diane McCarthy Business Dev. & Legislative Affairs
WEST-Mec

5Copyright ERISS 2008 www.usworks.com/westmarc
Claudia Whitehead Economic Development Director
City of Avondale
Scott Chesney Economic Development Director
City of El Mirage
Brian Friedman Economic Development Director
City of Glendale
Harry Paxton Economic Development Director
City of Goodyear
Steve Prokopek Economic Development Director
City of Peoria
John Hagen Economic Development Director
City of Surprise
Lori Gary Economic Development Director
Town of Buckeye
ACKNOWLEDGEMENTS – COMMITTEE MEMBERS WESTMARC would also like to acknowledge the time and effort put forth by the members of the Labor Market Study Taskforce Committee. This group of individuals represented a broad array of West Valley stakeholders and their input, expertise, and insights in the planning and decision making process is greatly appreciated. Name Title Representing Jack Lunsford President & CEO WESTMARC
Megan Griego, Chair Economic Development
Coordinator City of Surprise
Harry Paxton, Co-Chair Economic Development Director
City of Goodyear
Landis Elliott Development Director The Bade Companies
Jeff Fairman Business Development Director
Sundt Construction, Inc.
Hal DeKeyser Hal DeKeyser & Associates
Kevin Berry Center Coordinator Maricopa Workforce Connections
Curtis Shaw Business Services Specialist
Maricopa Workforce Connections
John Hagen Economic Development Director
City of Surprise
Lori Gary Economic Development Director
Town of Buckeye
Darah Mann Director of Marketing & Communications
WESTMARC
Dina Mathias Economic Development City of Avondale

6 www.usworks.com/westmarc
Specialist Jeanine Jerkovic Economic Development
Manager City of Surprise
John Catapano Coordinator, Research & Communications
Maricopa Community Colleges
Dr. Mary Vanis Director, Center for Workforce Development
Maricopa Community Colleges
Scott Chesney Economic Development Director
City of El Mirage
Joanne Barker Management Assistant City of Glendale
Jason Bayer Business Development Coordinator
Town of Buckeye
Steve Bleyer Management Analyst City of Peoria
Kristen Stephenson Business Research Manager
Greater Phoenix Economic Council
Diane McCarthy Business Dev. & Legislative Affairs
West-MEC
Bill Honsaker Managing Director Jones Lang LaSalle Americas, Inc.
Rich Umbarger Project Design Consultants
Kim Zoph Business Advocate City of Goodyear
Patricia Krogh Director of Client & Business Development
Converse Consultants
Gabriel Aguilera Associate Quarles and Brady, LLP
Amity Bravo Director of Operations WESTMARC
Amber Botamer Director of Member Services & Public Affairs
WESTMARC
Tracey Simmons DMB Verrado
Brad Smidt Vice President-Business Development
Greater Phoenix Economic Council
Cheryl Covert Management Assistant Town of Buckeye
7Copyright ERISS 2008 www.usworks.com/westmarc
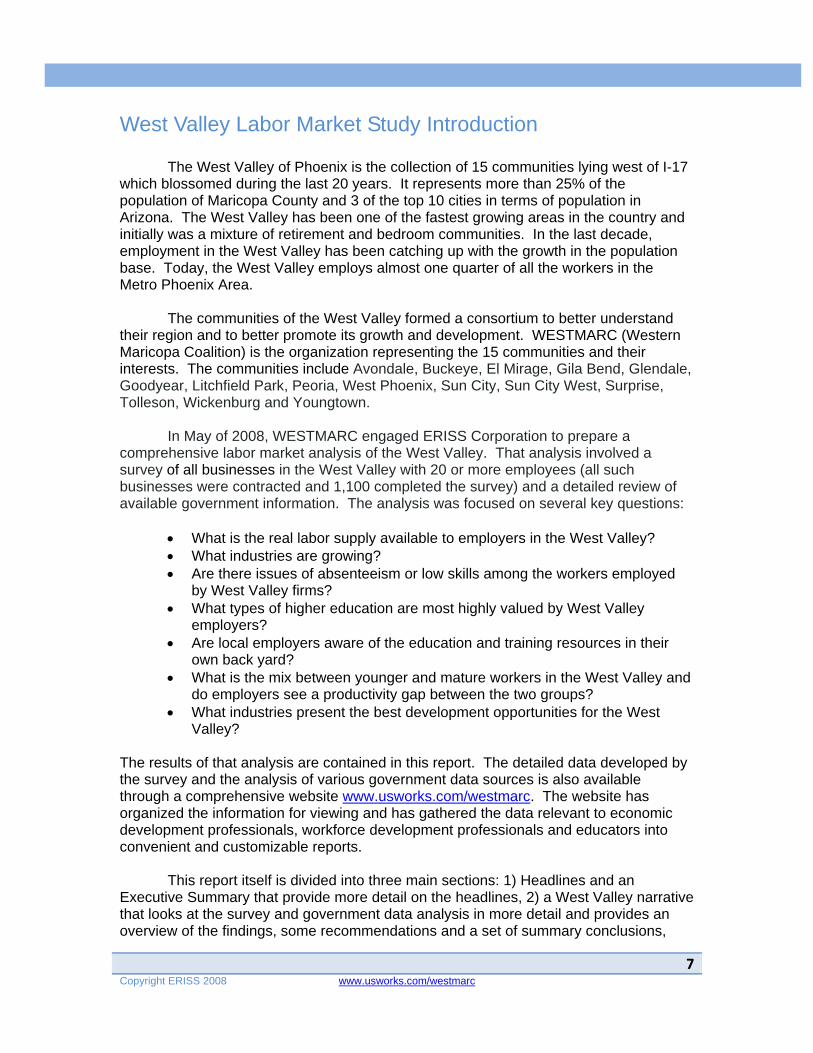
West Valley Labor Market Study Introduction
The West Valley of Phoenix is the collection of 15 communities lying west of I-17 which blossomed during the last 20 years. It represents more than 25% of the population of Maricopa County and 3 of the top 10 cities in terms of population in Arizona. The West Valley has been one of the fastest growing areas in the country and initially was a mixture of retirement and bedroom communities. In the last decade, employment in the West Valley has been catching up with the growth in the population base. Today, the West Valley employs almost one quarter of all the workers in the Metro Phoenix Area.
The communities of the West Valley formed a consortium to better understand
their region and to better promote its growth and development. WESTMARC (Western Maricopa Coalition) is the organization representing the 15 communities and their interests. The communities include Avondale, Buckeye, El Mirage, Gila Bend, Glendale, Goodyear, Litchfield Park, Peoria, West Phoenix, Sun City, Sun City West, Surprise, Tolleson, Wickenburg and Youngtown.
In May of 2008, WESTMARC engaged ERISS Corporation to prepare a
comprehensive labor market analysis of the West Valley. That analysis involved a survey of all businesses in the West Valley with 20 or more employees (all such businesses were contracted and 1,100 completed the survey) and a detailed review of available government information. The analysis was focused on several key questions:
• What is the real labor supply available to employers in the West Valley? • What industries are growing? • Are there issues of absenteeism or low skills among the workers employed
by West Valley firms? • What types of higher education are most highly valued by West Valley
employers? • Are local employers aware of the education and training resources in their
own back yard? • What is the mix between younger and mature workers in the West Valley and
do employers see a productivity gap between the two groups? • What industries present the best development opportunities for the West
Valley? The results of that analysis are contained in this report. The detailed data developed by the survey and the analysis of various government data sources is also available through a comprehensive website www.usworks.com/westmarc. The website has organized the information for viewing and has gathered the data relevant to economic development professionals, workforce development professionals and educators into convenient and customizable reports. This report itself is divided into three main sections: 1) Headlines and an Executive Summary that provide more detail on the headlines, 2) a West Valley narrative that looks at the survey and government data analysis in more detail and provides an overview of the findings, some recommendations and a set of summary conclusions,
8 www.usworks.com/westmarc
and 3) a narrative report on each West Valley community that looks at their key industries, the nature of their workforce including residents and those commuting in, the occupational distribution of their workforce and the characteristics of the workers who are commuting out. There are three appendices in the report: 1) a description of the survey and survey methodology, 2) a description of the key government data sources and the techniques used in analyzing them, and 3) www.usworks.com/westmarc the study’s website which contains the most comprehensive data available anywhere on the WESTMARC area; literally thousands of tables and graphs drawn from the survey and the government data analysis. Appendix 3 provides for a description of the special report section of the website.
9Copyright ERISS 2008 www.usworks.com/westmarc
Section 1
Headlines and Executive Summary The Headlines
• Comprehensive Business Survey Finds West Valley is Still Growing
• High Quality, New Workers Generally Easy to Find
• Demand for New Workers Driven by Mix of Expansion and Turnover
• West Valley Businesses Recruiting Successfully from the Entire Metro Phoenix Area
• Overall Labor Supply Remains High Despite Relatively Low Unemployment
• Over 450,000 Workers Available to Fill Jobs for the Right Offer
• Employee Absenteeism a Non Issue for Most West Valley Employers
• Growth/Expansion Opportunities Seen in Transportation, Wholesale Trade, Traditional and Non-Store Retailing, and Education
• Most West Valley Businesses Find Their Workforces to be Highly Productive

10 www.usworks.com/westmarc
The Executive Summary - Headlines Explained
Comprehensive Business Survey Finds West Valley is Still Growing
In a survey of 1,100 businesses in the West Valley completed in mid-October 2008 and conducted by ERISS Corporation, WESTMARC found that despite negative signs in the overall economy, all but one industry reported expected growth in employment over the next 12 months. Growth was expected to be highest in four industry sectors – Health Services, Construction, Transportation/Utilities, and Retail. Moderate growth of 1 to 3% is expected in other sectors.
Source: ERISS Corporation Survey of West Valley Businesses, Fall 2008
While it is good news, because the survey only contacted employers with 20 or more employees, the results may not be completely representative of the results from smaller firms which might have greater difficulty in expanding with the tight credit market and may not be able to aggressively pursue the same types of opportunities that larger firms can. It is also important to note that the survey was conducted from late August 2008 through the end of October 2008. Some of the results came before the meltdown of the credit markets and some were collected after that major mid-September shift. There was not a noticeable shift in the results from before or after the mid September market drops. However, the economic mood has darkened considerably since then and these same growth projections may no longer apply.

11Copyright ERISS 2008 www.usworks.com/westmarc
High Quality, New Workers Generally Easy to Find
The comprehensive business survey found that West Valley employers are not finding it difficult to fill vacancies for either experienced or non-experienced workers. Overall, the time to fill non-experienced vacancies averaged 25 days and experienced vacancies took an average of 40 days. There was significant variation by industry as you can see from the following charts:
Industry Key:
# Industry 1 Business Services 2 Construction 3 Education 4 Finance 5 Government 6 Health Services 7 Lodging 8 Manufacturing 9 Retail
10 Services 11 Transportation/Utilities 12 Wholesale
Source: ERISS Corporation Survey of West Valley Businesses, Fall 2008 For both experienced and non-experienced vacancies, the longest time to fill was within government. The length of time was driven by a combination of factors including the nature of the government hiring process and the highly targeted skill requirements. The shortest time to fill for both experienced and non-experienced vacancies came in

12 www.usworks.com/westmarc
lodging and retail, reflecting in part the relatively low skill base required for the majority of jobs in those sectors. For non-experienced vacancies, the Construction, Manufacturing and Transportation/Utilities also had below average times in hiring. For experienced vacancies, only Health Services had below average lead times for new hires.
Demand for New West Valley Workers Driven by Mix of Expansion and Turnover
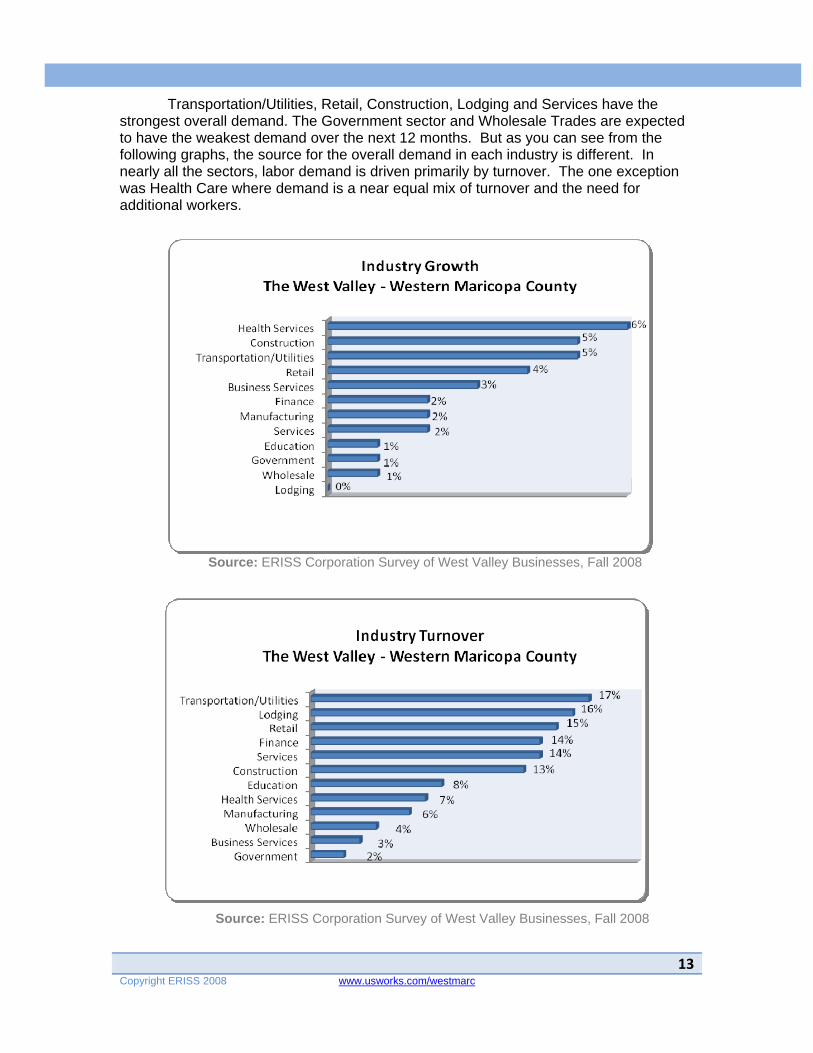
In the US economy particularly, hiring demand is generated from two sources – growth and turnover. Generally, turnover represents the largest fraction of labor demand -- workers in one industry move to another and move between firms in the same industry. While turnover is sometimes frustrating for the employer losing a worker, it is also critical to the efficient function of any local economy because it is how new demand is fulfilled by experienced workers and how new skill requirements are addressed. The comprehensive labor study conducted for WESTMARC helps local employers better understand the flow of workers among and between different firms and industries. The labor demand found in the survey arises from the need for an expanded workforce and the need to replace workers that leave for other jobs. The following chart describes the overall demand for workers by each major industry sector; the percentages are of the total number of workers currently employed in the particular industry sector:
Source: ERISS Corporation Survey of West Valley Businesses, Fall 2008
13Copyright ERISS 2008 www.usworks.com/westmarc
Transportation/Utilities, Retail, Construction, Lodging and Services have the strongest overall demand. The Government sector and Wholesale Trades are expected to have the weakest demand over the next 12 months. But as you can see from the following graphs, the source for the overall demand in each industry is different. In nearly all the sectors, labor demand is driven primarily by turnover. The one exception was Health Care where demand is a near equal mix of turnover and the need for additional workers.
Source: ERISS Corporation Survey of West Valley Businesses, Fall 2008
Source: ERISS Corporation Survey of West Valley Businesses, Fall 2008

14 www.usworks.com/westmarc
West Valley Businesses Recruiting from the Entire Metro Phoenix Area
The most common mistake that businesses often make is to assume their recruitment market is fairly small and very close to their businesses. The current workforce in all West Valley communities is composed mainly of workers who commute in from outside their home city and often from outside of the West Valley. An analysis of the actual commuting patterns into the West Valley tells the story. Two facts stand out:
• A minority of workers live and work in the same community – often a very small minority. (The range is just over 30% for Wickenburg to 3% for Tolleson.)
• West Valley companies draw from the entire Metro Phoenix area and even attract workers from Tucson and Yuma.
The following “commuter map” produced using the “On the Map” program from the US Census Bureau shows the geographic reach of the West Valley employers. The West Valley is designated on the map with the yellow and red trapezoid. The circles represent clusters of commuters who go to work in the West Valley. A little less than half of the workers in the West Valley come from West Valley communities (but even those workers are generally driving out of their hometowns to work).
Source: US Census Bureau, Local Employment Dynamics, On the Map Large numbers of the “in-commuters” to West Valley firms come from the city of Phoenix east of I-17 and from the large East Valley cities of Chandler, Mesa, Scottsdale and Tempe. There is even a relatively significant group of workers traveling up I-10 from Tucson. This analysis was done using Census data from 2006 (the latest available).
15Copyright ERISS 2008 www.usworks.com/westmarc
For West Valley businesses and those considering locating in the West Valley, the real recruitment market is at least the entire Metro Phoenix area. That means the labor pool is vastly larger than it might appear if only a single city or group of cities is considered. While increases in gas prices may impact this pattern in the long run, morning and evening rush hours in the Metro Phoenix area even today seem to indicate that long commutes are still here. Concern about those prices and the impact of the long commute on the quality of life may present opportunities to the West Valley. First, there may be an expansion opportunity in the creation of “tele-commuting centers” which allow businesses in one part of the metro area to provide remote office space which is electronically linked to another location. Second, the West Valley communities could create a “Live and Work in the West Valley” targeted job/talent bank that would promote employment in the West Valley.
Overall Labor Supply Remains High Despite Relatively Low Unemployment
Rate with Over 450,000 Workers Available to Fill Jobs for the Right Offer
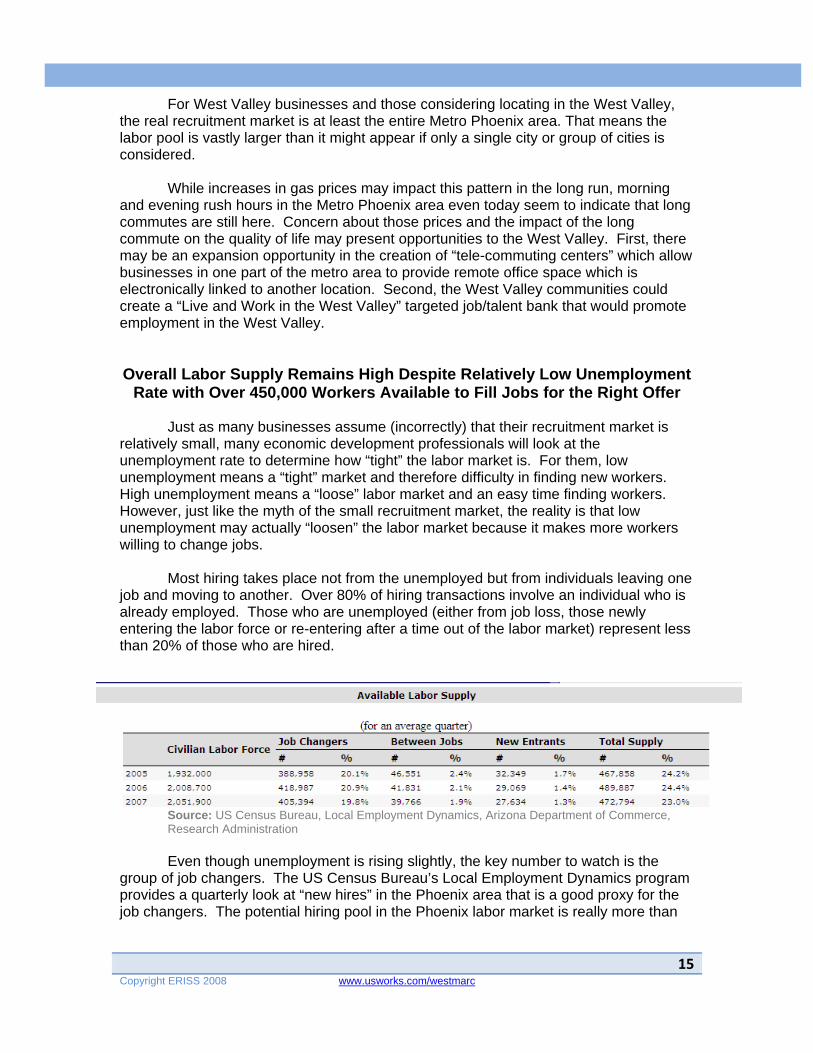
Just as many businesses assume (incorrectly) that their recruitment market is relatively small, many economic development professionals will look at the unemployment rate to determine how “tight” the labor market is. For them, low unemployment means a “tight” market and therefore difficulty in finding new workers. High unemployment means a “loose” labor market and an easy time finding workers. However, just like the myth of the small recruitment market, the reality is that low unemployment may actually “loosen” the labor market because it makes more workers willing to change jobs. Most hiring takes place not from the unemployed but from individuals leaving one job and moving to another. Over 80% of hiring transactions involve an individual who is already employed. Those who are unemployed (either from job loss, those newly entering the labor force or re-entering after a time out of the labor market) represent less than 20% of those who are hired.
Source: US Census Bureau, Local Employment Dynamics, Arizona Department of Commerce, Research Administration
Even though unemployment is rising slightly, the key number to watch is the group of job changers. The US Census Bureau’s Local Employment Dynamics program provides a quarterly look at “new hires” in the Phoenix area that is a good proxy for the job changers. The potential hiring pool in the Phoenix labor market is really more than

16 www.usworks.com/westmarc
450,000 individuals not the 70,000 individuals represented by those listed as “unemployed.” Coupled with the wide recruitment market for the West Valley demonstrated by the commute pattern analysis, an employer seeking to expand or locate in the West Valley will find a recruitment pool of more than 450,000 people who are either currently unemployed or a willing job changer. Even with a rise in the unemployment rate, the number of available workers will not decline. The website “appendix” will allow you to generate reports showing the number of workers in a particular occupation (the prime recruiting pool) who are working in a particular community, in the West Valley or in the entire Metro Phoenix area. Those reports will show the number of individuals in the target occupation who are working in the target and in all industries. For most businesses, the real labor supply for an occupation is the total number working in all industries in the entire Metro Phoenix area.
Employee Absenteeism a Non Issue for Most West Valley Employers Most Absences are for Legitimate Illnesses
Based on the results on the survey of West Valley employers, 63% of the firms report that absenteeism is “not a significant problem” at their firms. Only 4% of the firms report absenteeism as a significant problem. The remaining 33% report that any absenteeism problem is isolated to a small group of employees. When absences occur, the majority of employers (61%) report that the cause is a legitimate illness with child care. Transportation is the most often stated reason for the balance.
Source: ERISS Corporation Survey of West Valley Businesses, 2008
17Copyright ERISS 2008 www.usworks.com/westmarc
Growth/Expansion Opportunities Seen in Transportation, Wholesale Trade, Traditional and Non-Store Retailing, Health Care and Education
The Transportation and the Health Care sectors were already seen to be growing in the results of the survey. As noted earlier, that growth is driven by some “organic” advantages owned by the West Valley. In the case of Transportation, that advantage is the nexus of several Interstates combined with both rail and air transportation hubs. In the case of Health Care, it is a combination of the underlying demand for health care services from the aging population in the retirement communities and the relatively large fraction of the health care system for the entire Phoenix area already located in the West Valley. The Transportation advantage has the potential of spawning two additional growth industries for the West Valley – Wholesale Trade and Non-Store Retailing. Wholesale operations depend on transportation and are attracted to areas where they are able to move their products in and out easily. The West Valley becomes a logical place to locate a wholesale operation that would serve the entire Southwest US. Non-store retailing is an industry grouping that includes both vending machine operators and Internet giants like Amazon. The West Valley’s opportunity for growth is clearly in the direction of attracting fulfillment centers for Internet retailers (or the Internet operations of large brick and mortar retailers). The same reason that wholesalers would find the West Valley attractive would apply to the fulfillment operations. The growth in traditional retail will occur because of the need to create local retail outlets to serve the population that has moved to the West Valley over the past decade. The West Valley has a plethora of top-notch brick and mortar educational facilities that can meet employers’ need for an educated workforce. From top notch graduate schools to technical and customized training, the West Valley has the educational assets needed to create and maintain a 21st century workforce. The Health Care sector has the advantage of Midwestern University, the largest medical school in Arizona. As West Valley companies compete in the global economy, Thunderbird School of Global Management, which is consistently ranked as a leader in global business education, is there to help. Arizona State University at the West Campus and several Maricopa Community Colleges add to this outstanding mix of higher education assets.
The West Valley has a solid base of higher education institutions that graduate new talent each year and where local employers can turn to help retool their own workforces. That base produces the constantly renewing talent pool that is attractive to all industries. The proximity of two of the leaders in online education (University of Phoenix headquartered in southeastern Phoenix and Rio Salado College Online headquartered in nearby Tempe) produces a growth opportunity. Online and distance education is the fastest growing segment of the higher education market. It requires subject matter experts, video production and editing capacity, computer graphics and content management. While the online education industry can draw its content from anywhere, the proximity of the two giants of the industry (a short ride on I-10 away from the West Valley) makes it much easier for West Valley entrepreneurs to establish the personal connections that are still vital to business even in the digital age.
18 www.usworks.com/westmarc
Most West Valley Businesses Find Their Workforces to be Highly
Productive
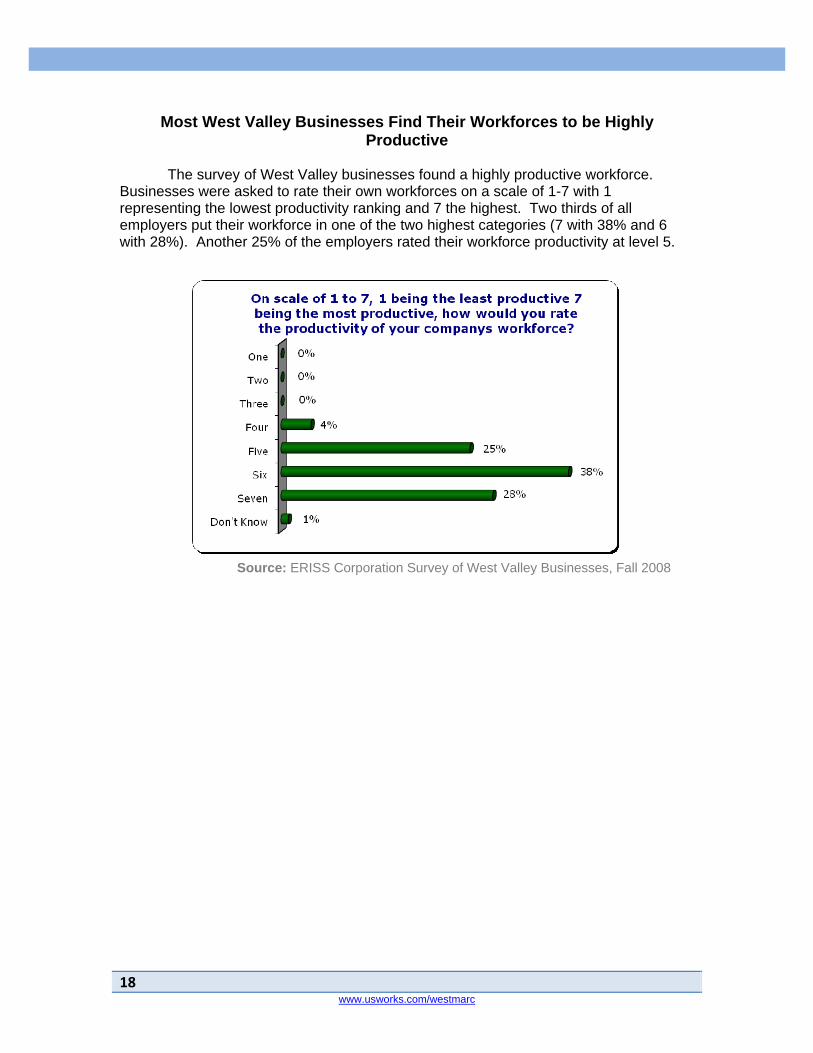
The survey of West Valley businesses found a highly productive workforce. Businesses were asked to rate their own workforces on a scale of 1-7 with 1 representing the lowest productivity ranking and 7 the highest. Two thirds of all employers put their workforce in one of the two highest categories (7 with 38% and 6 with 28%). Another 25% of the employers rated their workforce productivity at level 5.
Source: ERISS Corporation Survey of West Valley Businesses, Fall 2008
19Copyright ERISS 2008 www.usworks.com/westmarc
Section 2 The West Valley of Phoenix
The Avenues of Success
Overview The key message of this report is that the West Valley is Phoenix. The West Valley draws on the talent pool, the amenities and the critical infrastructure of the entire metropolitan area. An equally important message is that the West Valley presents some unique avenues of success for businesses and residents. This section of the report will look at the workforce, industry base and unique assets of the West Valley as a whole. We will also point out some unique avenues of opportunity presented by recent and long term trends. Specifically, we will:
• Paint a picture of the West Valley’s unique assets and place them in the context of the entire Phoenix region;
• Demonstrate the extent and depth of the West Valley talent pool; • Look at the expected growth patterns that emerged from the just completed
survey of businesses in the West Valley; and • Look at the potential for growth and new avenues of opportunity that emerge
from a closer look at the West Valley’s unique assets. The picture that will emerge is of a vibrant region that is well-positioned to take advantage of the future trends in regional, US and global economies. The West Valley – The Many Avenues of the Future The Greater Phoenix West Valley could be referred to as “The Avenues” because of the numbered avenues in its easily traveled grid system. But “avenues” are not just a name but reflect the reality and the possibility of the region. The West Valley is many things:
• A large and easily accessible marketplace that offers businesses and residents many avenues of opportunity;
• A transportation hub with rail, truck and air that provide avenues for commerce throughout the entire Southwest US;
• A business destination that draws talent from all over the metro area; • A center for educational excellence that creates multiple avenues for talent
growth and development; • An area of hidden gems poised to sparkle in the emerging 21st century economy.
The West Valley and Phoenix are also full of surprises. Despite Phoenix’s reputation as a retirement haven, the average age of the population is actually several years below the national average. While the labor force is enriched by all this young blood, the community is sustained by the volunteer engagement of the senior

20 www.usworks.com/westmarc
population. The population is well educated (27%+ with bachelor’s degrees) but more importantly the West Valley is home to one of the best career and technical systems in the nation (West-MEC and the Maricopa Community College system). This education and training structure gives the West Valley unique ability to respond to changing demands for skills and the ability to fill the growing number of jobs for well-educated workers with less than a bachelor’s degree.
West Valley Industry and Occupational Distributions 2008
Firms Employment NAICS Sector NAICS Sector Description # % # %
11 Agriculture 63 0.3% 823 0.2%21 Mining 15 0.1% 149 0.0%22 Utilities 33 0.1% 563 0.1%23 Construction 2,098 9.1% 35,191 8.3%
31-33 Manufacturing 1,008 4.4% 38,204 9.0%42 Wholesale 1,338 5.8% 30,850 7.3%
44-45 Retail 4,226 18.3% 67,399 16.0%48-49 Transportation and Warehousing 709 3.1% 17,065 4.0%
51 Information 325 1.4% 4,243 1.0%52 Finance and Insurance 1,243 5.4% 14,029 3.3%53 Real Estate and Leasing 990 4.3% 12,749 3.0%54 Professional, Technical 1,393 6.0% 13,974 3.3%55 Management of Companies 15 0.1% 830 0.2%56 Administrative Support and Waste Management 1,013 4.4% 14,553 3.4%61 Education 676 2.9% 39,670 9.4%62 Social Assistance and Health 2,338 10.1% 44,006 10.4%71 Arts, Entertainment and Recreation 383 1.7% 7,361 1.7%72 Accommodations and Food Service 1,748 7.6% 36,947 8.7%81 Other Services 3,097 13.4% 22,572 5.3%92 Public Administration 416 1.8% 21,283 5.0%
Source: InfoUSA and Advanced Workforce Systems The West Valley is a great place to work but also a wonderful place to play. Glendale, the most populated community in the West Valley, is home to the Arizona Cardinals and the Phoenix Coyotes. Phoenix International Raceway in Avondale draws hundreds of thousands of NASCAR fans to the area. Baseball fans might consider the West Valley “Fantasy Avenue” because it is now home to more spring training camps than any other area of the country. Golf courses and resorts abound. The Valley is a short drive from some of the most spectacular natural beauty in the world – the red mountains of Sedona and the Grand Canyon. The West Valley is home to many household names in business with over 400,000 workers employed in a variety of industries. The chart below illustrates the breadth and depth of the West Valley’s employment base. The Valley employs people in nearly every occupation in America from lawyer to landscaper and from nuclear technician to instructional designer. The chart below shows the distribution of workers in broad occupational categories (job families) in both the West Valley and the Metro

21Copyright ERISS 2008 www.usworks.com/westmarc
Phoenix area. A few facts emerge from this look at the data that were not obvious when we looked at the West Valley in isolation. First, the relative concentration of health care occupations (6.6% of the total for the West Valley versus 6% for the Metro Phoenix area as a whole) speaks to the importance of the health care industry to the West Valley and of West Valley facilities and expertise to the entire region. Second, the concentration of education occupations in the West Valley (6.3% versus 4.4% for the Metro Phoenix area) shows the potential of that industry as a foundation for future growth. And finally, the relative concentration of both transportation and production occupations in the West Valley speaks to another potential foundation for future expansion.
Occupational Distribution 2008
Job Families West Valley Phoenix MSA # % # % Management Occupations 18,401 4.4% 84,953 4.7%Business Operations and Finance Occupations 14,142 3.4% 80,884 4.5%Computer and Mathematics Occupations 6,437 1.5% 43,289 2.4%Architecture and Engineering Occupations 5,159 1.2% 34,741 1.9%Physical, Social and Life Sciences Occupations 2,706 0.6% 13,297 0.7%Community and Social Services Occupations 4,937 1.2% 17,058 0.9%Legal and Related Occupations 2,028 0.5% 12,608 0.7%Education and Library Occupations 26,130 6.3% 80,665 4.4%Artistic and Creative Occupations 4,166 1.0% 20,477 1.1%Health Care Professional and Technical Occupations 17,847 4.3% 71,222 3.9%Health Care Support Occupations 9,470 2.3% 38,300 2.1%Protective Services Occupations 6,941 1.7% 37,898 2.1%Food Service Occupations 38,182 9.2% 144,839 8.0%Building and Grounds Maintenance Occupations 11,377 2.7% 72,107 4.0%Personal Service Occupations 11,031 2.6% 42,995 2.4%Sales and Related Occupations 53,884 12.9% 211,550 11.7%Administrative and Clerical Occupations 67,873 16.3% 343,412 18.9%Agricultural, Fishing and Forestry Occupations 1,239 0.3% 8,325 0.5%Construction and Mining Occupations 27,508 6.6% 131,250 7.2%Installation and Repair Occupations 21,010 5.0% 79,699 4.4%Production Occupations 28,863 6.9% 112,155 6.2%Transportation and Material Moving Occupations 37,373 9.0% 132,465 7.3%
Source: InfoUSA, US Census Bureau Local Employment Dynamics and Advanced Workforce Systems
While the West Valley has some unique advantages, it is important to see it in the context of the entire Metro Phoenix area. Sky Harbor Airport, which is just east of the West Valley, is a critical piece of the integrated transportation system. West Valley businesses draw on the financial, business and other services located in the rest of the metro area. West Valley transportation companies ship goods produced in the entire area and deliver materials to all those facilities. While the business-to-business interactions are important, for a firm thinking of locating in the West Valley, the linkage of

22 www.usworks.com/westmarc
labor markets may be even more critical. We will explore that connection in the next section. The West Valley’s Real Labor Market The initial understanding of the labor market by most individuals and businesses is usually fairly narrow. If you wished to locate a new company in city X, your first questions might be “what is the unemployment rate?” and “how many of the types of worker needed actually live in city X?” A business with only those questions is likely to make the wrong location decision because it framed the labor market too narrowly. The unemployment rate is often used as a proxy for the relative tightness of the labor market. It is usually a bad proxy. Most hiring is done not from the ranks of the unemployed but from the ranks of the employed. How tight or loose a local labor market is will be determined much more by how willing workers are to move from job to job than the number of people who are out of work. In fact, counter intuitively high unemployment may actually shrink the available labor pool by “freezing” workers into their current jobs and making them less available to be hired by others. Job Changers and “Post it Note” Employees Labor markets in the US are defined by the velocity and the volume of movement of workers between employers and occupations. It is what made it possible for the Internet and other leading edge innovations to be developed and exploited first in the US because workers were available and willing to move to a new opportunity.
Source: US Census Bureau, Local Employment Dynamics, Arizona Department of Commerce, Research Administration
This chart provides that expanded look at the overall labor supply in the Metro Phoenix area in 2005-2007. The “job changers” are estimated from a new report available from the US Census Local Employment Dynamics program. That program looks at how workers move from job to job and industry to industry. It reports on the number of “new hires” each quarter with a “new hire” being a worker that had not been employed by a particular business anytime in the last year. (That definition is designed to exclude seasonal hiring and workers returning from a temporary layoff.) The size of the new hire population is huge, some 20% of the entire labor force in the Metro Phoenix area is a new hire each quarter. While 75% of the labor force seems glued to their jobs, about 20% of the labor force might be seen as “post it note” employees. They are lightly attached to their current employer and more than willing to move for a new opportunity. The number of “post it note” employees dwarfs the 3-4% of the labor force that was listed as “unemployed” during that same quarter.
23Copyright ERISS 2008 www.usworks.com/westmarc
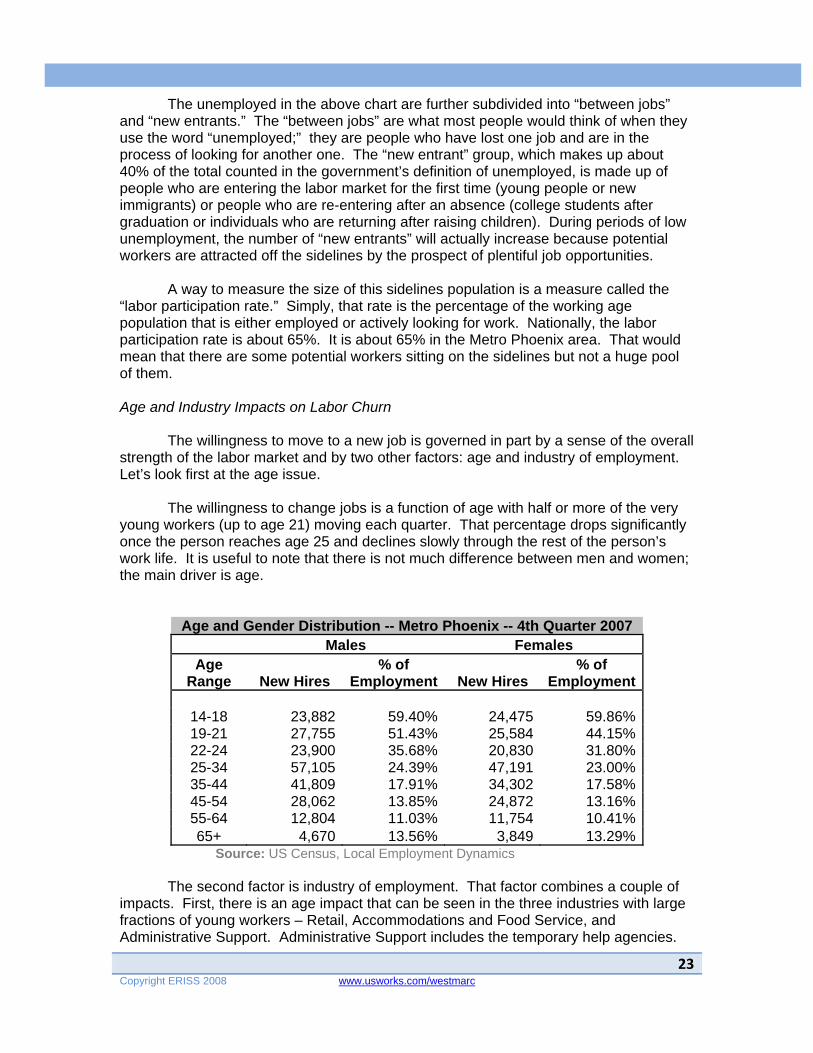
The unemployed in the above chart are further subdivided into “between jobs” and “new entrants.” The “between jobs” are what most people would think of when they use the word “unemployed;” they are people who have lost one job and are in the process of looking for another one. The “new entrant” group, which makes up about 40% of the total counted in the government’s definition of unemployed, is made up of people who are entering the labor market for the first time (young people or new immigrants) or people who are re-entering after an absence (college students after graduation or individuals who are returning after raising children). During periods of low unemployment, the number of “new entrants” will actually increase because potential workers are attracted off the sidelines by the prospect of plentiful job opportunities. A way to measure the size of this sidelines population is a measure called the “labor participation rate.” Simply, that rate is the percentage of the working age population that is either employed or actively looking for work. Nationally, the labor participation rate is about 65%. It is about 65% in the Metro Phoenix area. That would mean that there are some potential workers sitting on the sidelines but not a huge pool of them. Age and Industry Impacts on Labor Churn The willingness to move to a new job is governed in part by a sense of the overall strength of the labor market and by two other factors: age and industry of employment. Let’s look first at the age issue. The willingness to change jobs is a function of age with half or more of the very young workers (up to age 21) moving each quarter. That percentage drops significantly once the person reaches age 25 and declines slowly through the rest of the person’s work life. It is useful to note that there is not much difference between men and women; the main driver is age.
Age and Gender Distribution -- Metro Phoenix -- 4th Quarter 2007 Males Females
Age Range New Hires
% of Employment New Hires
% of Employment
14-18 23,882 59.40% 24,475 59.86% 19-21 27,755 51.43% 25,584 44.15% 22-24 23,900 35.68% 20,830 31.80% 25-34 57,105 24.39% 47,191 23.00% 35-44 41,809 17.91% 34,302 17.58% 45-54 28,062 13.85% 24,872 13.16% 55-64 12,804 11.03% 11,754 10.41% 65+ 4,670 13.56% 3,849 13.29%
Source: US Census, Local Employment Dynamics The second factor is industry of employment. That factor combines a couple of impacts. First, there is an age impact that can be seen in the three industries with large fractions of young workers – Retail, Accommodations and Food Service, and Administrative Support. Administrative Support includes the temporary help agencies.
24 www.usworks.com/westmarc
Metro Phoenix Area -- 2007 Employment and New Hires by NAICS Sector
NAICS Sector NAICS Sector Description Employment
New Hires
New Hire Rate
Average Monthly Earnings
11 Agriculture 9,011 3,076 34.1% 2,366
21 Mining 3,409 587 17.2% 7,052
22 Utilities 14,886 658 4.4% 6,285
23 Construction 167,774 42,252 25.2% 4,149
31-33 Manufacturing 144,863 15,861 10.9% 5,231
42 Wholesale 92,564 12,535 13.5% 5,405
44-45 Retail 235,464 60,719 25.8% 2,815
48-49 Transportation and Warehousing
61,314 10,013 16.3% 3,932
51 Information 32,604 5,691 17.5% 4,597
52 Finance and Insurance 119,200 17,150 14.4% 5,246
53 Real Estate and Leasing 41,611 7,872 18.9% 3,924
54 Professional, Technical and Scientific Services
104,597 20,181 19.3% 5,514
55 Management of Companies 23,952 2,992 12.5% 5,278
56 Administrative Support and Waste Management
183,711 81,898 44.6% 2,900
61 Education 123,891 13,172 10.6% 3,030
62 Social Assistance and Health 174,077 29,130 16.7% 3,934
71 Arts, Entertainment and Recreation
35,226 7,727 21.9% 3,275
72 Accommodations and Food Service
153,240 54,407 35.5% 1,724
81 Other Services 53,327 12,593 23.6% 2,652
92 Public Administration 80,300 4,392 5.5% 3,938
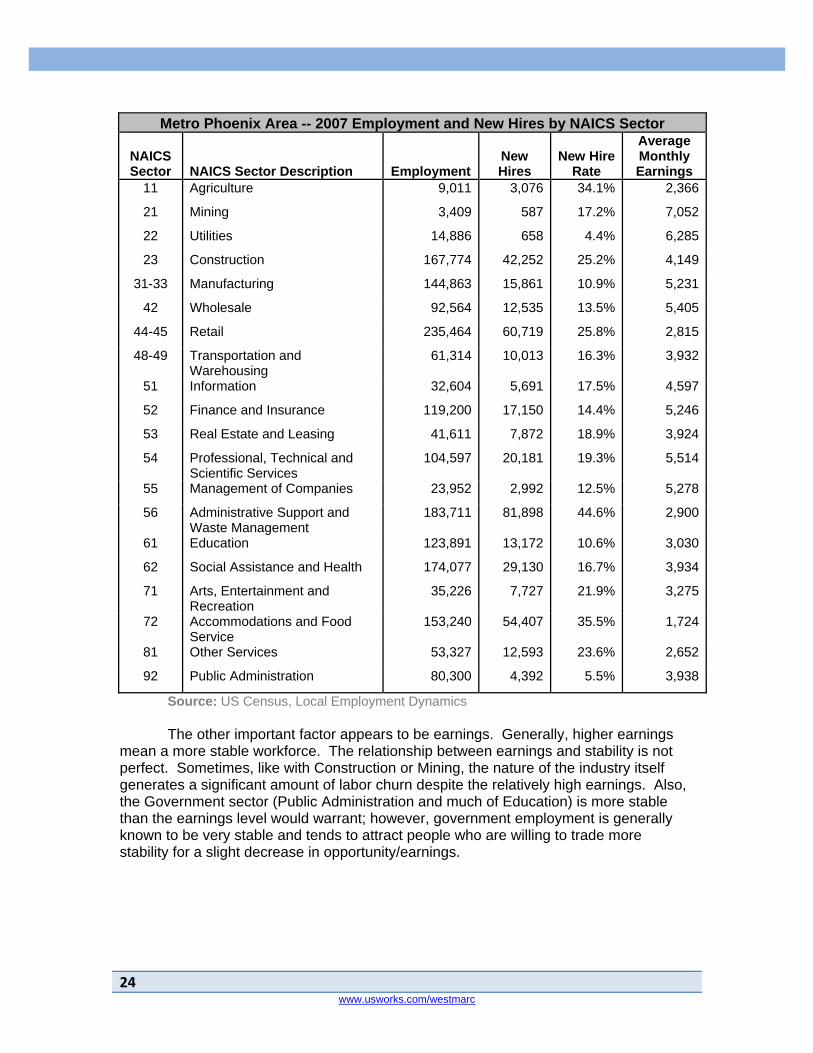
Source: US Census, Local Employment Dynamics The other important factor appears to be earnings. Generally, higher earnings mean a more stable workforce. The relationship between earnings and stability is not perfect. Sometimes, like with Construction or Mining, the nature of the industry itself generates a significant amount of labor churn despite the relatively high earnings. Also, the Government sector (Public Administration and much of Education) is more stable than the earnings level would warrant; however, government employment is generally known to be very stable and tends to attract people who are willing to trade more stability for a slight decrease in opportunity/earnings.

25Copyright ERISS 2008 www.usworks.com/westmarc
Source: US Census, Local Employment Dynamics, On the Map
Commuting Patterns and the Size of the Labor Pool Our view of the size of the available labor supply should have already been expanded by the discussion of job changers. However, the largest expansion comes from looking at the current commuting patterns. This map shows where the employees who work in the West Valley (the area inside the red and yellow trapezoid) live. Many come from within the West Valley but most come from east of I-17. In our analysis, the number of employees who live and work in the same city represents a small fraction of the total employment in that city. (A more detailed city by city analysis is contained in the next section.) For example, Glendale employers draw only 20% of their workers from within the boundaries of Glendale. For Goodyear, it is under 13%. For Tolleson, just 3% of the employees at Tolleson businesses live and work in the city. For the West Valley as a whole 9% of the workers come from outside of Maricopa County with commuters from Tucson representing a large percentage of the out-of-county workers.

26 www.usworks.com/westmarc
When looking for workers, it is appropriate for West Valley businesses to consider the entire Metro Phoenix area as the appropriate recruiting pool. The web-based appendices (www.usworks.com/westmarc) to this report allow an employer or a person advising a firm on a site selection decision to see the potential labor supply of the entire region and even to create a report that looks at the top 20 occupations that are typically hired in a particular industry – within a particular community, the West Valley as a whole and in the entire Metro Phoenix area. Those reports are also structured to remind the user that occupations can cross industries. Not all nurses work in the health care industry. Not all teachers work in the education industry. When recruiting or when considering whether the area will have enough workers to support a new business, these reports can be invaluable. The West Valley in the Short Term – Still Growing
In a survey of 1,100 businesses in the West Valley completed in mid-October 2008 and conducted by ERISS Corporation, WESTMARC found that despite negative signs in the overall economy, all but one industry reported expected growth in employment over the next 12 months. Growth was expected to be highest in four industry sectors – Health Services, Construction, Transportation/Utilities, and Retail. Moderate growth of 1% to 3% was expected in other sectors.
Source: ERISS Survey of West Valley Businesses, Fall 2008 As noted earlier, many of the businesses were surveyed prior to the financial meltdown and all of the businesses were surveyed by the end of October before the depth of the current economic trouble became clear. The expected growth is likely to be less in 2009 than the businesses themselves reported in Fall 2008 survey; however, the results point to pattern of growth that is likely to re-emerge once the overall economy recovers.

27Copyright ERISS 2008 www.usworks.com/westmarc
Growth in the Health Care sector reflects, in part, the existing concentration of health care facilities in the West Valley relative to the rest of the Metro Phoenix area. Health Care continues to grow in the West Valley driven by the core demand of the local residents and a growing number of world class specialty treatment centers that have a potential to draw clients from outside of the Phoenix area. The Health Care sector will require nearly 6% more employees over the next year according to the results of the recently completed ERISS survey of West Valley employers. Growth in Transportation/Utilities is driven primarily by the large and growing transportation hubs that are located in the West Valley and serve much of the southwestern US from the nexus of I-17 and I-10. Even though wholesale trade and distribution are only growing modestly in the West Valley, they add to the demand for transportation. Demand for new workers in the Transportation sector is expected to increase by 5% over the next 12 months based on the survey of West Valley employers. Growth in Construction is running against national trends. In the survey, 28 of the 89 firms responding estimated increased need for workers in the next 12 months. Only three of the firms estimated a declining need for workers. The bulk of the firms estimated that their workforce would remain the same size. The survey was of firms with 20 or more employees. The growing firms were in all three segments of the construction industry – construction of buildings, heavy and civil construction, and specialty trade contractors. While residential construction had slowed considerably prior to the mid-September financial crisis, non-residential construction continued to show growth even into October in national business reports. Increased demand for workers in the Retail sector reflects the continued build out of that sector in the West Valley. That increase can be expected to continue even in the economic slowdown because of the rapid residential growth in the West Valley through 2007 and the normal lag in developing the supporting array of retail outlets to support the higher population. Plans on the drawing board or in the middle of the approval and permitting process throughout the West Valley should maintain the demand for new retail workers well into 2009. Some High Growth Occupations in the West Valley Some of the fastest growing occupations in the West Valley, according to the just completed survey of businesses are:
Occupation Growth Occupation Growth Customer Service Reps 18% Retail Salespersons 8% Transportation Supervisors 11% Vehicle Salespersons 8% Material Moving Foremen 10% Network Administrators 8% Vehicle Cleaners 10% Restaurant Servicepersons 7% Database Administrators 9% Word processors and Typists 7% Bill and Account Collectors 9% Grounds keeping Supervisors 7%
Source: ERISS Survey of West Valley Businesses, Fall 2008

28 www.usworks.com/westmarc
The West Valley in the Long Term - New Avenues of Opportunity Growth/Expansion Opportunities Seen in Transportation, Wholesale Trade, Traditional and Non-Store Retailing, Sports and Entertainment, Health Care
and Education The Transportation and the Health Care sectors were already seen to be growing in the results of the survey. As noted earlier, that growth is driven by some “organic” advantages owned by the West Valley. In the case of Transportation, that advantage is the nexus of several Interstates combined with both rail and air transportation hubs. In the case of Health Care, it is a combination of the underlying demand for health care services from the aging population in the retirement communities and the relatively large fraction of the health care system for the entire Phoenix area already located in the West Valley. For Sports and Entertainment, the key drivers are the location of two professional sports venues, multiple Major League Baseball spring training facilities and Phoenix International Raceway. Transportation and Related Industries The Transportation sector is one of the foundation industries in the West Valley. The truck transportation aspects of industries are clustered within easy access of the I-17, I-10 and I-8 corridors. The marshalling yards, container storage facilities, the intermodal transfer yards are all in place. The logistical advantages of the West Valley location have drawn some of the big names in transportation to the West Valley – Swift, Yellow Freight, Knight, Union Pacific and BNSF. The proximity to Phoenix Sky Harbor International Airport and the location of a number of smaller regional airports in Buckeye, Deer Valley, Glendale, Goodyear, and Wickenburg give the West Valley full access to the nation and the world. Lufthansa’s pilot training facility in Goodyear adds another element to this complete transportation picture. Growing the basic transportation and warehousing segment makes logical sense for the West Valley. But this natural transportation advantage has the potential of spawning two additional growth industries for the West Valley – Wholesale Trade and Non-Store Retailing. Wholesale operations depend on transportation and are attracted to areas where they are able to move their products in and out easily. The West Valley becomes a logical place to locate a wholesale operation that would serve the entire Southwest US. Non-store retailing is a strange industry grouping that includes vending machine operators and Internet giants like Amazon. The West Valley’s opportunity for growth is clearly in the direction of attracting fulfillment centers for Internet retailers (or the Internet operations of large brick and mortar retailers). Wholesale operations would also find the West Valley attractive because of the density of transportation assets and the relatively central location of West Valley in terms of reaching most of the southwestern US (including southern California in a day or less). Almost one third of Whole Trade employment in the Metro Phoenix area is already located in the West Valley; but there is a clear opportunity for additional development and attraction. The effort to attract the back-end operations of Internet retailers and wholesalers could have a synergistic impact since both would find the increased presence of the other a valuable reason for locating in the West Valley.

29Copyright ERISS 2008 www.usworks.com/westmarc
The West Valley – A Great Place to Play The West Valley has a booming Sports and Entertainment sector that drives direct employment but more importantly spinoff employment in retail, restaurants and lodging. Glendale is home to two of the major venues – the Arizona Cardinals’ home at the University of Phoenix Stadium and the Phoenix Coyotes’ home at Jobing.com Arena. These facilities also play hosts to major entertainers and other family fun events.
Spring in the West Valley brings the sounds of major league baseball spring training to the numerous complexes in Glendale, Goodyear, Peoria and Surprise. In 2009, the West Valley will play host to 8 teams (Dodgers, Padres, Brewers, Mariners, White Sox, Royals, Rangers, and Indians) with the Cincinnati Reds joining in 2010 to become the second team using the brand new Goodyear Ballpark. Spring training draws thousands of fans from all over the country who come to be part of fantasy and excitement that is major league baseball. And, in between games, they have a chance to experience the shopping, world class golf and fine dining that characterizes the Valley of the Sun. But the crack of the bat is not the only sound that draws sports fans by the thousands to the West Valley. The engine roar of NASCAR racing can bring several hundred thousand people to Phoenix International Raceway in Avondale on the two race weekends a year (one in the fall and one in the spring). There are numerous smaller races that use the track during the rest of the year. As with spring training, race fans are drawn by their particular sport but are known to stay around to enjoy the many other attractions of the West Valley. The Potential Boom in Health Care Health Care continues to grow in the West Valley driven by the core demand of the local residents and a growing number of world class specialty treatment centers that have a potential to draw clients from outside of the Phoenix area. Two of these centers are worthy of special note – the CORE Institute and Cancer Treatment Centers of America. CORE, the Center for Orthopedic Research and Education, is a center of excellence in the growing field of orthopedic surgery including hip and knee replacements and state-of-the-art treatments for bones and joints. Because we are living longer and sometimes living harder, we are wearing out our bodies long before we are ready to stop living. CORE and other specialty treatment centers are the wave of the future.
Goodyear Ballpark

30 www.usworks.com/westmarc
The Cancer Treatment Centers of America chose the West Valley as the location for their latest center which focuses on a holistic approach to cancer treatment and care. Again, such centers are the wave of the future where care and family support are integrated.
The Health Care sector will require nearly 13% more employees (to cover growth and turnover) over the next year according to the results of the recently completed ERISS survey of West Valley employers. That growth can be just the beginning. Health Care providers are already more concentrated in the West Valley than in the rest of the Phoenix area. The West Valley needs to take advantage of that density to attract more. Traditional Retail – Catching up with the Population Boom The pattern for suburban development in the US has been housing first, then local retail (grocery and service stores) and then the full spread of retail from auto dealers to regional shopping centers. With the rapid population growth of the West Valley, particularly in areas west of the 101, the area is still catching up to the retail demands of the new population. (The West Valley has 3 regional malls compared to 8 in the East Valley.) Major new retail complexes for the West Valley are more likely to take the form of the “cityscape” centers like Estrella Falls rather than traditional regional malls like Desert Sky. There will likely be redevelopment of older retail facilities in the eastern portions of the West Valley often in the “cityscape” style. Higher Education Provides a Constantly Renewing Talent Pool and Online Education Provides a Growth Opportunity The West Valley offers many avenues of opportunities for higher education which produces a constant stream of new talent and allows the existing workforce to upgrade and renew their skills. The numerous higher education choices in the West Valley include:
• Arizona State University at the West Campus • Thunderbird School of Global Management • Midwestern University • Western International University • Grand Canyon University • Ottawa University • Maricopa Community Colleges • University of Phoenix • Universal Technical Institute
31Copyright ERISS 2008 www.usworks.com/westmarc
They provide the residents and employers of the West Valley with a spectrum of education and training including international business, osteopathic medicine, and numerous technical disciplines. Two new private institutions of post-secondary education have chosen to build campuses in Goodyear: Franklin Pierce University and University of the Incarnate Word. Rio Salado College is constructing a “Communiversity” in Surprise, which will offer associates, bachelors, and masters degrees on-site and online starting Fall 2009 using its own faculty and those of up to ten additional partners. These new additions to the higher education universe in the West Valley just add to the options. Maricopa Community Colleges, with several campuses in the West Valley, will work with employers to create specialized and custom training. The Maricopa Community College system has a reputation for excellence around the country and is a major asset for Metro Phoenix and the West Valley. Metro Phoenix is an education rich environment with several other higher educational institutions outside of the West Valley, such as DeVry University, three other campuses of Arizona State University, and numerous technical and industrial training schools. On the higher education front, the online education segment provides both an immediate and a long term growth opportunity. The immediate opportunity is created because traditionally periods of recession are when Americans go back to school to retool. However, there is very little excess capacity in the brick and mortar education institutions. The only place where this rush of demand can be fulfilled is online. Both the University of Phoenix and Maricopa Community Colleges are well-positioned to take advantage of this likely rush of demand. Even though both organizations are headquartered just outside of the West Valley, they both have several satellite campuses west of I-17. Longer term, the trend toward courses that can start at any time rather than on a fixed schedule and education/training that is targeted to gaining the required skill or information is best executed online. Much of the future growth in the higher education and training markets will be online. Again, the West Valley can take advantage of this trend because of the proximity of the corporate headquarters for the parent of the online education giant University of Phoenix. With the potential for the online education industry to grow, the communities in the West Valley can assist businesses in the related fields of instructional design, computer graphics, simulation and animation, testing and certification to locate and expand in the West Valley
32 www.usworks.com/westmarc
Conclusion --
The West Valley – the Best is Yet to Come The West Valley embodies the best of the West and the best of America. The future is bright because the communities of the West Valley are focused on making the area friendly to business, those that are already in the Valley and those who will come to put down new roots in these Avenues of Success and Opportunities. There are several lessons that the communities of the West Valley should take from this report:
• They have inherent strengths and competitive advantages in health care, transportation, wholesale and distribution, and education (particularly higher education and online learning). These areas are critical because they represent industries that bring dollars into the region (rather than simply circulating dollars within the region). Growth in these dollar importing industries will come easiest if it is focused on the areas where the West Valley has a natural competitive advantage.
• There are opportunities for retail, food service and other population supporting services as the local business infrastructure in the West Valley moves to catch up with the rapid population growth.
• The recruiting market area for businesses in the West Valley (even Wickenburg in the far northwest and Gila Bend in the far southwest) is the entire Metro Phoenix area. The commuter analysis that was done for the West Valley as a whole and for individual communities clearly shows that the real labor market is the Metro Phoenix area. It is important when selling the “local” talent pool to remember that it is Metro Phoenix wide.
• The labor supply is not defined by the unemployment rate but by the willingness of current workers to change jobs. About 25% of the Phoenix area labor market is willing to move to new jobs at any given time and some 19% do in fact move to new jobs each quarter.
• Labor supply for an occupation is really defined by all incumbents in that occupation working in any industry and in any part of the Metro Phoenix area.
• Based on the survey of businesses conducted in the fall of 2008, the West Valley is still growing with nearly all industry segments showing an increase in demand for workers over the next year.

33Copyright ERISS 2008 www.usworks.com/westmarc
Section 3
Individual Community Reports
This section of the report looks at the labor market in each of the West Valley communities. The primary focus is on those industries that are located within each community and the workers that are employed there. There will also be a look at those who are commuting into work and at those who are leaving to work in other communities, particularly those in the East Valley. These snapshots of the communities are based on an analysis of the industry base as reported in the InfoUSA employer database. The data is from the spring of 2008 and therefore does not reflect new businesses that have opened in the community or recent expansions of existing businesses. The charts and graphs shown reflect the best estimate of the industry and occupational mix in each of the communities; however, they are only estimates. These reports will provide summary data across all industries and occupations. Specifically, each report will:
• Provide a short overview of the community • Describe the community’s industry mix and place that in the context of the West
Valley and the overall Metro Phoenix area • Describe the community’s occupational mix and place that in the context of the
West Valley and the overall Metro Phoenix area. • Describe where the community draws it workers from • Describe the characteristics of the commuters who travel from the community
into the East Valley. There are web-based appendices that allow the user to get much greater detail on specific industry sectors, individual industries and individual occupations. Reports can be generated for each of the individual communities in the West Valley and for the grouping of communities that make up the Northwest Valley and the Southwest Valley. All this information and the report generating tools can be found at www.usworks.com/westmarc.
34 www.usworks.com/westmarc
Avondale
Overview In the late 19th century, Avondale was a pit stop on the main thoroughfare for folks racing to the ‘Golden Coast’. Today, this vibrant city is a premier destination for International NASCAR racing, festivals, shopping, dining, recreation, education, family living, employment and business location. Yesterday Avondale's founding father, William "Billy" G. Moore, arrived in Arizona in the late 1860s, settling near the Agua Fria River around 1880. Billy Moore called his settlement "Coldwater, Arizona" - apparently both for the river and for the water that flowed from a local spring. He served a brief stint as Justice of the Peace for the Agua Fria area. He bought land, established a stage stop, erected a saloon and a general store, and was even Postmaster of Coldwater from 1901 until 1905. In the early 1900s, the Coldwater post office moved to a site near the nearby Avondale Ranch. The post office soon became known as Avondale, and the name Coldwater was discontinued. In December 1946, the City of Avondale was incorporated. Today
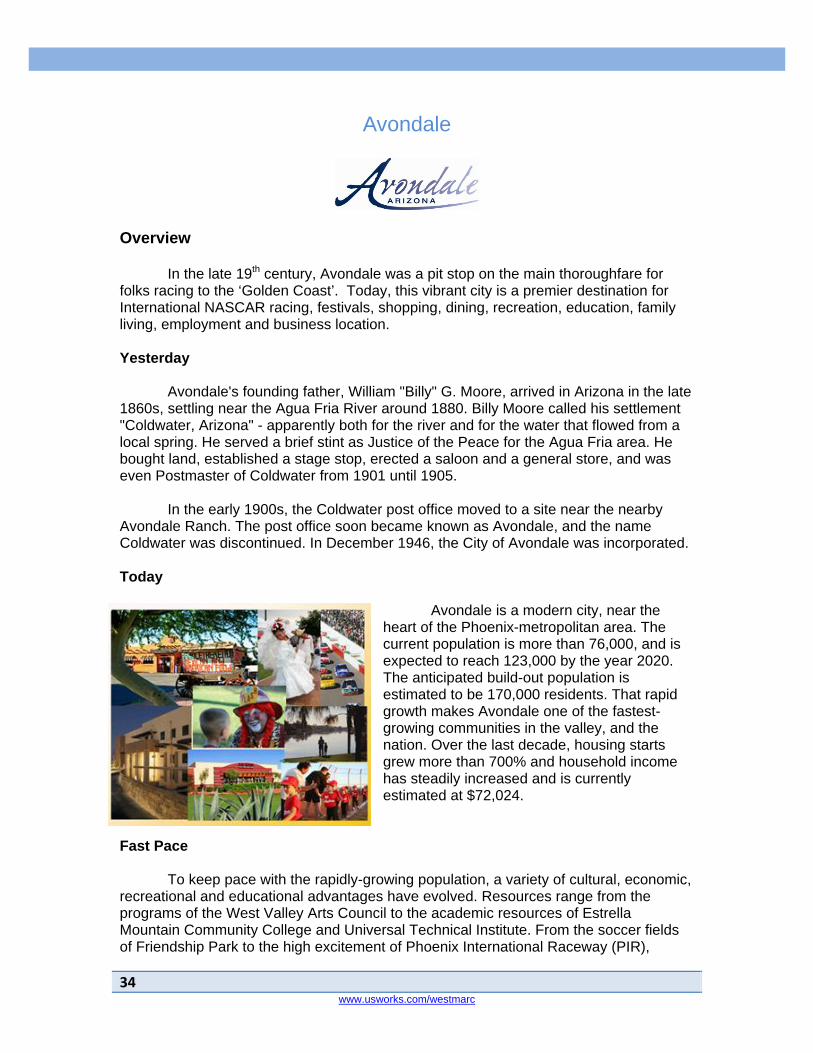
Avondale is a modern city, near the heart of the Phoenix-metropolitan area. The current population is more than 76,000, and is expected to reach 123,000 by the year 2020. The anticipated build-out population is estimated to be 170,000 residents. That rapid growth makes Avondale one of the fastest-growing communities in the valley, and the nation. Over the last decade, housing starts grew more than 700% and household income has steadily increased and is currently estimated at $72,024.
Fast Pace To keep pace with the rapidly-growing population, a variety of cultural, economic, recreational and educational advantages have evolved. Resources range from the programs of the West Valley Arts Council to the academic resources of Estrella Mountain Community College and Universal Technical Institute. From the soccer fields of Friendship Park to the high excitement of Phoenix International Raceway (PIR),
35Copyright ERISS 2008 www.usworks.com/westmarc
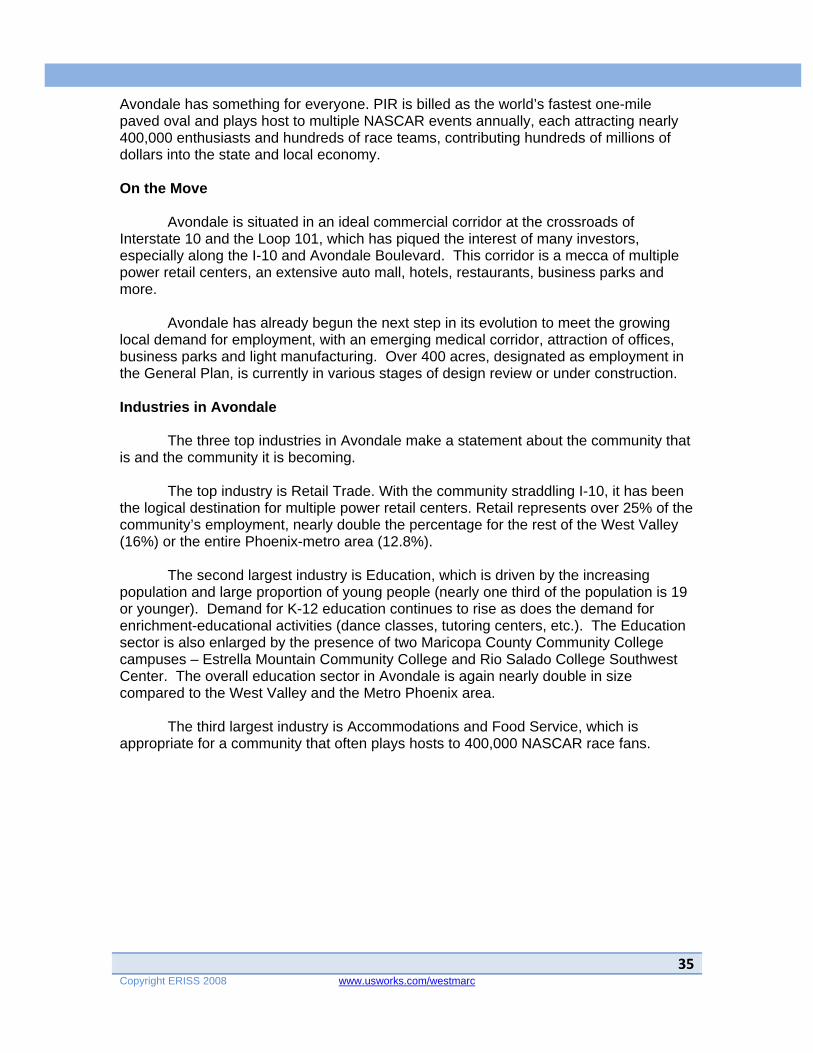
Avondale has something for everyone. PIR is billed as the world’s fastest one-mile paved oval and plays host to multiple NASCAR events annually, each attracting nearly 400,000 enthusiasts and hundreds of race teams, contributing hundreds of millions of dollars into the state and local economy. On the Move Avondale is situated in an ideal commercial corridor at the crossroads of Interstate 10 and the Loop 101, which has piqued the interest of many investors, especially along the I-10 and Avondale Boulevard. This corridor is a mecca of multiple power retail centers, an extensive auto mall, hotels, restaurants, business parks and more. Avondale has already begun the next step in its evolution to meet the growing local demand for employment, with an emerging medical corridor, attraction of offices, business parks and light manufacturing. Over 400 acres, designated as employment in the General Plan, is currently in various stages of design review or under construction. Industries in Avondale The three top industries in Avondale make a statement about the community that is and the community it is becoming. The top industry is Retail Trade. With the community straddling I-10, it has been the logical destination for multiple power retail centers. Retail represents over 25% of the community’s employment, nearly double the percentage for the rest of the West Valley (16%) or the entire Phoenix-metro area (12.8%). The second largest industry is Education, which is driven by the increasing population and large proportion of young people (nearly one third of the population is 19 or younger). Demand for K-12 education continues to rise as does the demand for enrichment-educational activities (dance classes, tutoring centers, etc.). The Education sector is also enlarged by the presence of two Maricopa County Community College campuses – Estrella Mountain Community College and Rio Salado College Southwest Center. The overall education sector in Avondale is again nearly double in size compared to the West Valley and the Metro Phoenix area. The third largest industry is Accommodations and Food Service, which is appropriate for a community that often plays hosts to 400,000 NASCAR race fans.
36 www.usworks.com/westmarc
The following chart provides a complete picture of the industry mix and the related employment for Avondale.
Source: InfoUSA and Advanced Workforce Systems
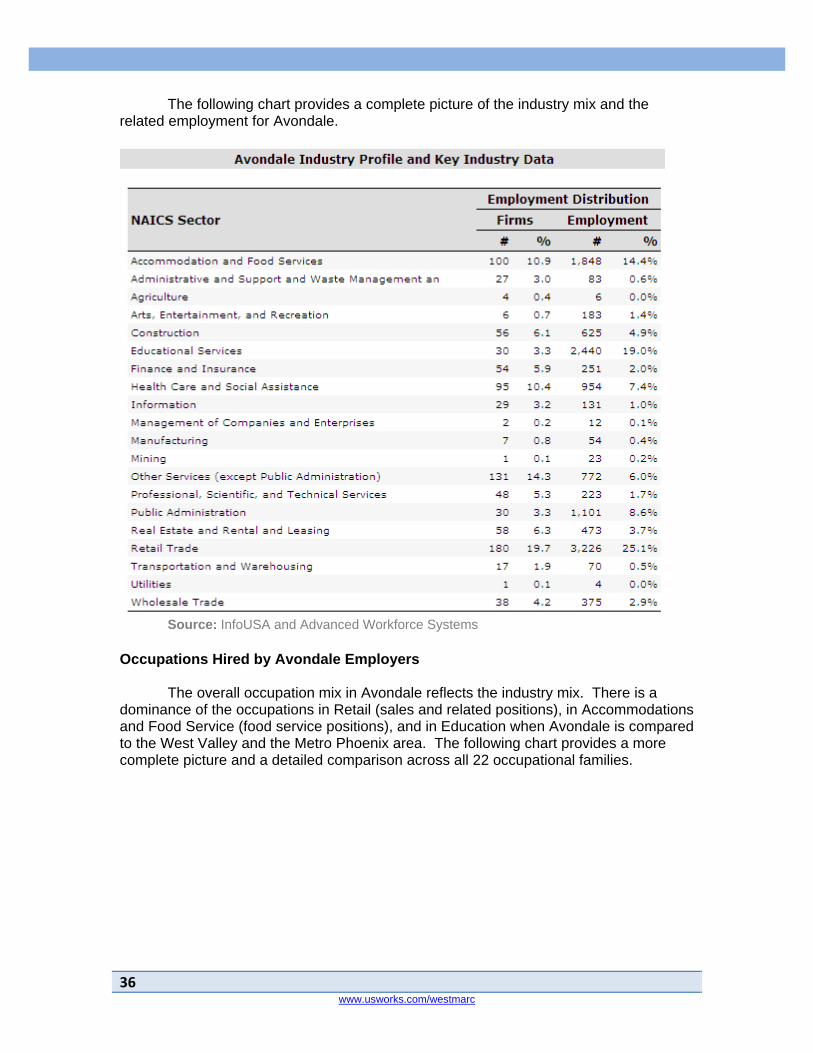
Occupations Hired by Avondale Employers The overall occupation mix in Avondale reflects the industry mix. There is a dominance of the occupations in Retail (sales and related positions), in Accommodations and Food Service (food service positions), and in Education when Avondale is compared to the West Valley and the Metro Phoenix area. The following chart provides a more complete picture and a detailed comparison across all 22 occupational families.
37Copyright ERISS 2008 www.usworks.com/westmarc
Source: InfoUSA and Advanced Workforce Systems
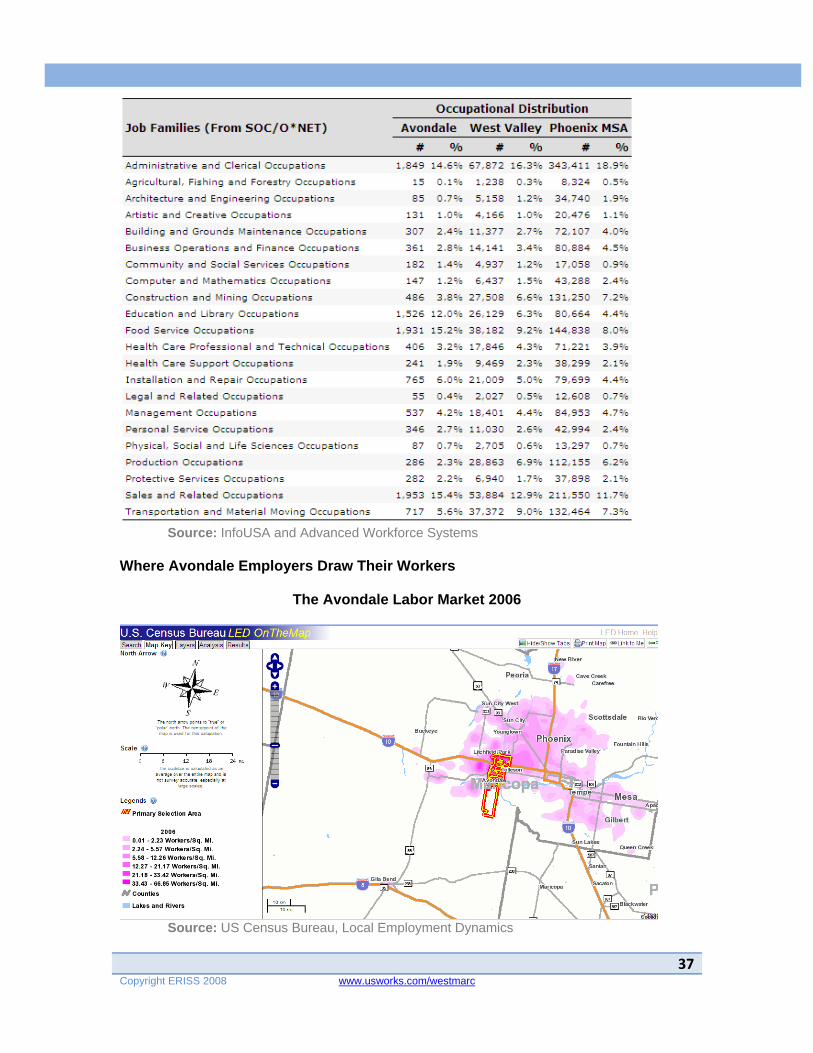
Where Avondale Employers Draw Their Workers
The Avondale Labor Market 2006
Source: US Census Bureau, Local Employment Dynamics
38 www.usworks.com/westmarc
Avondale (the yellow and red box on the map) draws its workers from the entire Phoenix-metro area. The above map and the origin report (below) were created using the new “On the Map” tool created by the US Census Bureau. The origin report shows that 80% + of Avondale’s workers commute from outside the community. The City of Phoenix provides the largest contingent of workers with neighboring Goodyear while other West Valley communities provide the remaining balance.
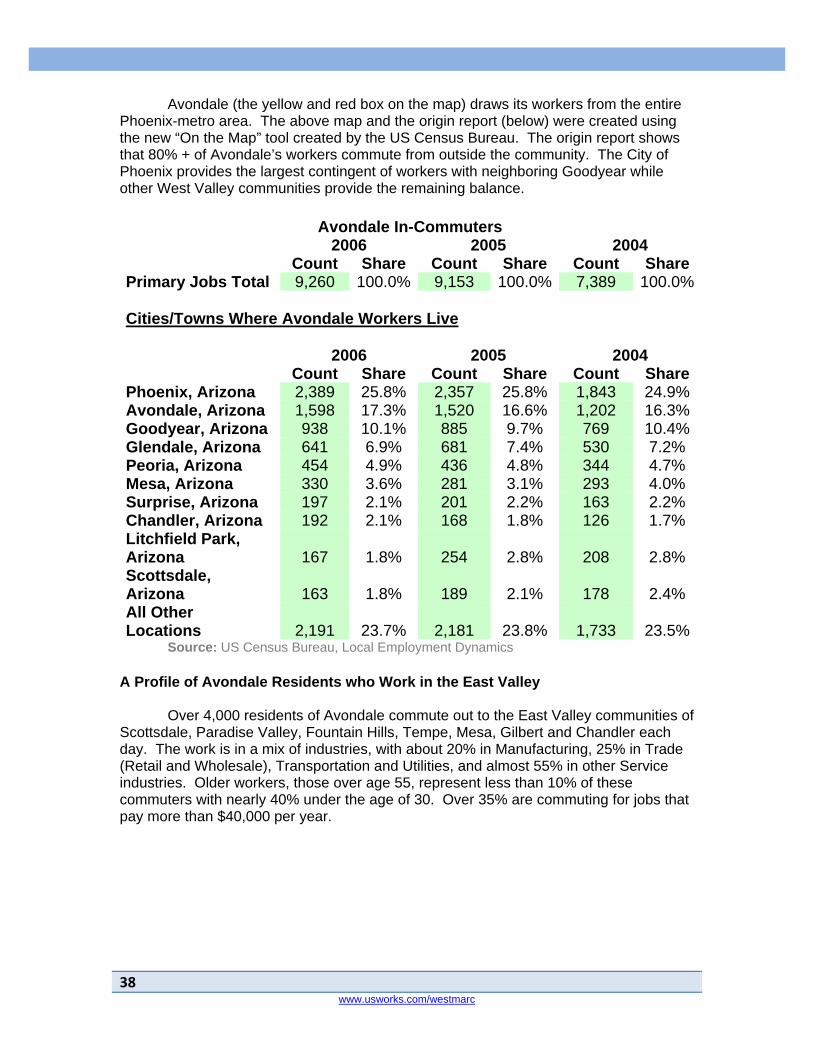
Avondale In-Commuters 2006 2005 2004 Count Share Count Share Count Share Primary Jobs Total 9,260 100.0% 9,153 100.0% 7,389 100.0% Cities/Towns Where Avondale Workers Live 2006 2005 2004 Count Share Count Share Count Share Phoenix, Arizona 2,389 25.8% 2,357 25.8% 1,843 24.9% Avondale, Arizona 1,598 17.3% 1,520 16.6% 1,202 16.3% Goodyear, Arizona 938 10.1% 885 9.7% 769 10.4% Glendale, Arizona 641 6.9% 681 7.4% 530 7.2% Peoria, Arizona 454 4.9% 436 4.8% 344 4.7% Mesa, Arizona 330 3.6% 281 3.1% 293 4.0% Surprise, Arizona 197 2.1% 201 2.2% 163 2.2% Chandler, Arizona 192 2.1% 168 1.8% 126 1.7% Litchfield Park, Arizona 167 1.8% 254 2.8% 208 2.8% Scottsdale, Arizona 163 1.8% 189 2.1% 178 2.4% All Other Locations 2,191 23.7% 2,181 23.8% 1,733 23.5%
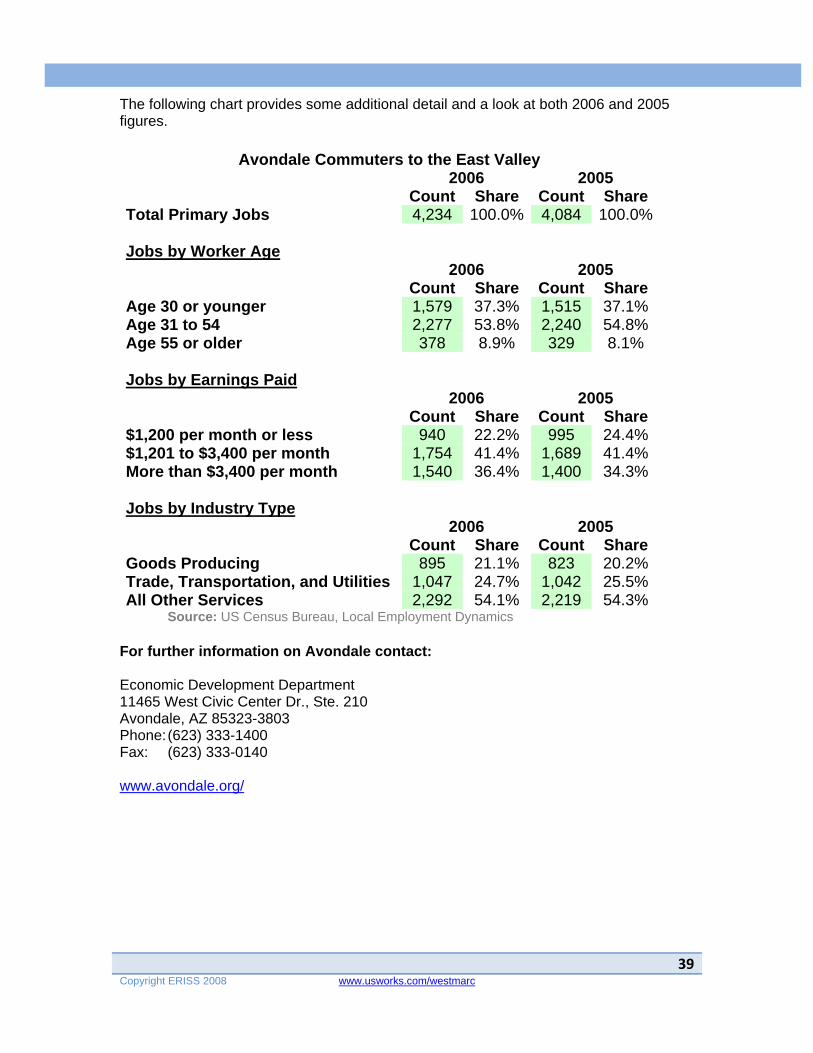
Source: US Census Bureau, Local Employment Dynamics A Profile of Avondale Residents who Work in the East Valley Over 4,000 residents of Avondale commute out to the East Valley communities of Scottsdale, Paradise Valley, Fountain Hills, Tempe, Mesa, Gilbert and Chandler each day. The work is in a mix of industries, with about 20% in Manufacturing, 25% in Trade (Retail and Wholesale), Transportation and Utilities, and almost 55% in other Service industries. Older workers, those over age 55, represent less than 10% of these commuters with nearly 40% under the age of 30. Over 35% are commuting for jobs that pay more than $40,000 per year.
39Copyright ERISS 2008 www.usworks.com/westmarc
The following chart provides some additional detail and a look at both 2006 and 2005 figures.
Avondale Commuters to the East Valley 2006 2005 Count Share Count Share Total Primary Jobs 4,234 100.0% 4,084 100.0% Jobs by Worker Age 2006 2005 Count Share Count Share Age 30 or younger 1,579 37.3% 1,515 37.1% Age 31 to 54 2,277 53.8% 2,240 54.8% Age 55 or older 378 8.9% 329 8.1% Jobs by Earnings Paid 2006 2005 Count Share Count Share $1,200 per month or less 940 22.2% 995 24.4% $1,201 to $3,400 per month 1,754 41.4% 1,689 41.4% More than $3,400 per month 1,540 36.4% 1,400 34.3% Jobs by Industry Type 2006 2005 Count Share Count Share Goods Producing 895 21.1% 823 20.2% Trade, Transportation, and Utilities 1,047 24.7% 1,042 25.5% All Other Services 2,292 54.1% 2,219 54.3%
Source: US Census Bureau, Local Employment Dynamics For further information on Avondale contact: Economic Development Department 11465 West Civic Center Dr., Ste. 210 Avondale, AZ 85323-3803 Phone: (623) 333-1400 Fax: (623) 333-0140 www.avondale.org/

40 www.usworks.com/westmarc
Buckeye
Overview A Little History In 1877, the founder of the settlement that was to become the Town of Buckeye led a party of six men, three women and ten children from Creston, Iowa bound for Arizona. The leader of this party was Thomas Newt Clanton whose purpose for coming west was to foster good health. It was a good move for him – he lived in Arizona for 49 years before his death at the age of 82. Development in the Buckeye Valley received its first great boost with the construction of the Buckeye Canal. In 1884, Malin M. Jackson named the canal in honor of his native state of Ohio, the Buckeye State. Clanton built ten miles of the canal, which was completed in 1886. In 1887, Clanton and his family moved to Buckeye, becoming the first permanent Anglo residents. Clanton and Jackson envisioned a need for a town site near the center of the Buckeye Valley, so in 1888 the two, along with William “Bucky” O’Neil, who later became known as a famous Rough Rider, laid out the town site on a portion of the Clanton Homestead.
The first post office in the area was established the same year. Also in 1888, Bucky O’Neil and associates organized the Buckeye Irrigation Company and had it certified by the Territorial Secretary. Jackson named the town Sidney, after his home in Ohio. However, because of the significance of the canal, over time the town became known as Buckeye and the name was legally changed in 1910.
Advances in transportation put Buckeye on the map. In 1910, the Arizona Eastern Railroad came to Buckeye; the first car in 1911; a steam rail line connected it to Phoenix by 1912; and a state highway by 1915. The coming of the railroad was so significant that the business district was moved to accommodate the location of the railroad station. As a result, Buckeye was booming. By 1912, major buildings were constructed, along with expansion of the business community.

41Copyright ERISS 2008 www.usworks.com/westmarc
Buckeye was incorporated in 1926 and included 440 acres. The first mayor was Hugh M. Watson. Watson started the Buckeye Valley Bank. His son, Hugh Watson, Jr. served as mayor from 1956 to 1958. In 1935, the Buckeye Chamber of Commerce started the Helzapoppin Days, which became a local tradition. The festivities included street dances, parade, carnival, and a rodeo. Proceeds were given to local churches that distributed the funds to the needy and for scholarships. Celebrities such as cowboy singing star Gene Autry attended the events. Similar local holidays, such as the annual Pioneer Days, are still celebrated in Buckeye today. Buckeye Today This western most community of the Valley of the Sun is home to over 40,000 people. For the past 20 years, growth in the greater Phoenix area has been robust in three of the four quadrants of the region. With those areas rapidly nearing build out, the last frontier rests in the Southwest Valley and the Town of Buckeye. Planning Town planners project that it will take at least 30 years for the nearly 600-mile planning area that stretches from almost Wickenburg to Gila Bend, the Hassayampa River to Perryville Road, to be built out. Biggest of the small As Arizona’s biggest “small town,” Buckeye still enjoys the great feeling of a small community. Buckeye celebrates Countryfest in the fall, Pioneer Days in the spring, and a great family Fourth of July. Population Information Currently there are over 240,000 homes planned in Buckeye. Given the size and number of the master-planned developments within the town limits, the population will explode to over 100,000 by the year 2010. Residential, world-class retail, entertainment, health care, education, and employment uses are planned. Location Information Buckeye is fortunate to be intersected by five highways, home to a general aviation airport, and served by the railroad. Virtually every major mode of transportation makes Buckeye accessible from multiple points. In addition to this, the Town of Buckeye sits on the state’s largest untapped groundwater aquifer, the Hassayampa River Basin. And the majestic view of the White Tank Mountains from every vantage point creates a unique and unparalleled landscape. More about Buckeye Being located just 35 miles west of Phoenix makes it convenient for work, sightseeing, and an exciting nightlife, yet far enough away to retain a comfortable small

42 www.usworks.com/westmarc
town feeling. Therefore, residents can take advantage of the amenities found in a metropolitan city and throughout its western suburbs, and then return to the quiet comforts of home. This once sleepy agricultural town is at the dawn of a new era, and those residents who are proud to call Buckeye home have found a great place to live, work and discover the best that Arizona has to offer. Industries in Buckeye The industry mix in Buckeye reflects a community that is rapidly building its infrastructure to take care of its growing population. The retail sector is smaller than it will be in a few years as increased population begins to attract more stores who want to be close to their expanding customer base. Its manufacturing base at 10% of total employment represents a larger fraction than in the West Valley as a whole (9%) or in the Metro Phoenix area (8%). It also has a higher concentration of transportation related employment than the rest of the region.
Source: InfoUSA and Advanced Workforce Systems

43Copyright ERISS 2008 www.usworks.com/westmarc
Occupations Hired by Buckeye Employers The occupational mix reflects the industry clusters that are more concentrated in Buckeye. Production, Transportation and Food Service occupations are more frequent in Buckeye than in the rest of the West Valley or the Metro Phoenix area.
Source: InfoUSA and Advanced Workforce Systems
44 www.usworks.com/westmarc
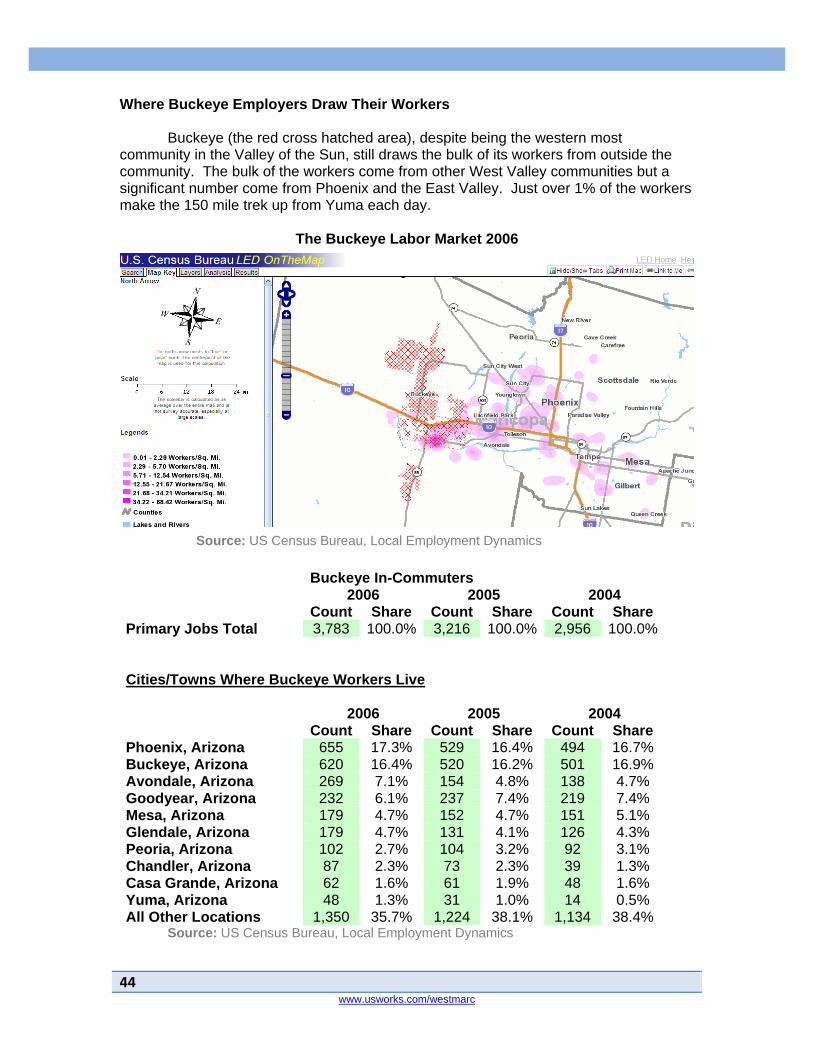
Where Buckeye Employers Draw Their Workers Buckeye (the red cross hatched area), despite being the western most community in the Valley of the Sun, still draws the bulk of its workers from outside the community. The bulk of the workers come from other West Valley communities but a significant number come from Phoenix and the East Valley. Just over 1% of the workers make the 150 mile trek up from Yuma each day.
The Buckeye Labor Market 2006
Source: US Census Bureau, Local Employment Dynamics
Buckeye In-Commuters 2006 2005 2004 Count Share Count Share Count Share Primary Jobs Total 3,783 100.0% 3,216 100.0% 2,956 100.0% Cities/Towns Where Buckeye Workers Live 2006 2005 2004 Count Share Count Share Count Share Phoenix, Arizona 655 17.3% 529 16.4% 494 16.7% Buckeye, Arizona 620 16.4% 520 16.2% 501 16.9% Avondale, Arizona 269 7.1% 154 4.8% 138 4.7% Goodyear, Arizona 232 6.1% 237 7.4% 219 7.4% Mesa, Arizona 179 4.7% 152 4.7% 151 5.1% Glendale, Arizona 179 4.7% 131 4.1% 126 4.3% Peoria, Arizona 102 2.7% 104 3.2% 92 3.1% Chandler, Arizona 87 2.3% 73 2.3% 39 1.3% Casa Grande, Arizona 62 1.6% 61 1.9% 48 1.6% Yuma, Arizona 48 1.3% 31 1.0% 14 0.5% All Other Locations 1,350 35.7% 1,224 38.1% 1,134 38.4%
Source: US Census Bureau, Local Employment Dynamics
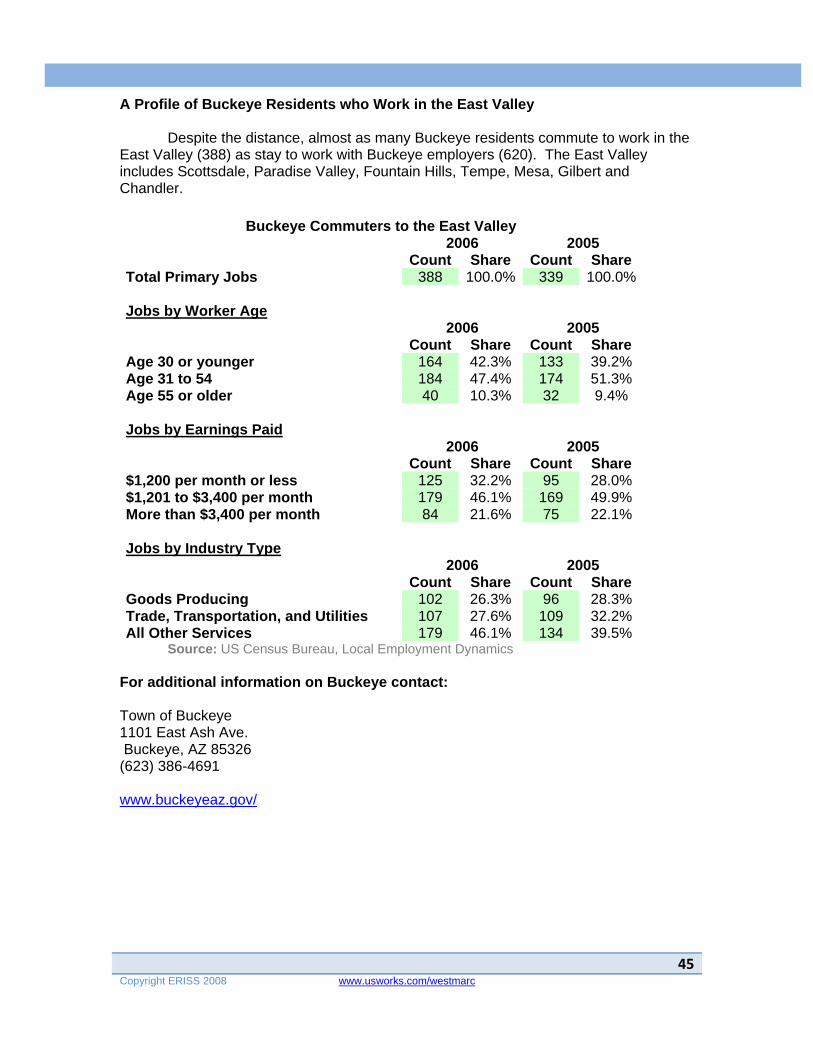
45Copyright ERISS 2008 www.usworks.com/westmarc
A Profile of Buckeye Residents who Work in the East Valley Despite the distance, almost as many Buckeye residents commute to work in the East Valley (388) as stay to work with Buckeye employers (620). The East Valley includes Scottsdale, Paradise Valley, Fountain Hills, Tempe, Mesa, Gilbert and Chandler.
Buckeye Commuters to the East Valley 2006 2005 Count Share Count Share Total Primary Jobs 388 100.0% 339 100.0% Jobs by Worker Age 2006 2005 Count Share Count Share Age 30 or younger 164 42.3% 133 39.2% Age 31 to 54 184 47.4% 174 51.3% Age 55 or older 40 10.3% 32 9.4% Jobs by Earnings Paid 2006 2005 Count Share Count Share $1,200 per month or less 125 32.2% 95 28.0% $1,201 to $3,400 per month 179 46.1% 169 49.9% More than $3,400 per month 84 21.6% 75 22.1% Jobs by Industry Type 2006 2005 Count Share Count Share Goods Producing 102 26.3% 96 28.3% Trade, Transportation, and Utilities 107 27.6% 109 32.2% All Other Services 179 46.1% 134 39.5%
Source: US Census Bureau, Local Employment Dynamics For additional information on Buckeye contact: Town of Buckeye 1101 East Ash Ave. Buckeye, AZ 85326 (623) 386-4691 www.buckeyeaz.gov/

46 www.usworks.com/westmarc
El Mirage
Overview El Mirage is the gateway to the Northwest Valley. Located in the heart of the rapidly growing West Valley, the community has grown from a small-town dependent on agriculture to a diverse urban economy with a population of over 40,000. The goal is to create a community that provides the residents the opportunity to purchase any good or service they desire without having to leave the city limits. Industries in the City of El Mirage
Source: InfoUSA and Advanced Workforce Systems

47Copyright ERISS 2008 www.usworks.com/westmarc
El Mirage has an industry mix with significant employment in construction and manufacturing in addition to the core base of retail employment and educational services. Employment in the other services category is also substantially higher than its proportion in the rest of the West Valley and the Metro Phoenix area. Employment in Health Care and in Professional Technical and Scientific Services also tends to be weaker than in the West Valley as a whole. Occupations Hired by El Mirage Employers The occupational mix within the El Mirage local workforce reflects the industry mix found in the community. There is a strong mix of Construction, Production, Educational and Service (installation and repair) occupations in the workforce.
Source: InfoUSA and Advanced Workforce Systems

48 www.usworks.com/westmarc
Where El Mirage Employers Draw Their Workers
The El Mirage Labor Market 2006
Source: US Census Bureau, Local Employment Dynamics El Mirage employers draw heavily from other West Valley communities including Surprise, Glendale and Peoria. Less than 6% of the El Mirage workforce is drawn from residents. However, as the above map shows, El Mirage (the small red box) can draw from every corner of the Metro Phoenix area because of its positioning on the freeway grid of the region.
El Mirage In-Commuters 2006 2005 2004 Count Share Count Share Count Share Primary Jobs Total 3,062 100.0% 2,716 100.0% 2,406 100.0% Cities/Towns Where El Mirage Workers Live 2006 2005 2004 Count Share Count Share Count Share Phoenix, Arizona 744 24.3% 670 24.7% 523 21.7% Surprise, Arizona 436 14.2% 395 14.5% 367 15.3% Glendale, Arizona 294 9.6% 291 10.7% 245 10.2% Peoria, Arizona 282 9.2% 259 9.5% 218 9.1% El Mirage, Arizona 175 5.7% 155 5.7% 186 7.7% Avondale, Arizona 154 5.0% 131 4.8% 128 5.3% Goodyear, Arizona 92 3.0% 84 3.1% 103 4.3% Sun City, Arizona 77 2.5% 45 1.7% 39 1.6% Mesa, Arizona 67 2.2% 59 2.2% 49 2.0% Sun City West, Arizona 49 1.6% 48 1.8% 36 1.5% All Other Locations 692 22.6% 579 21.3% 512 21.3%
Source: US Census Bureau, Local Employment Dynamics
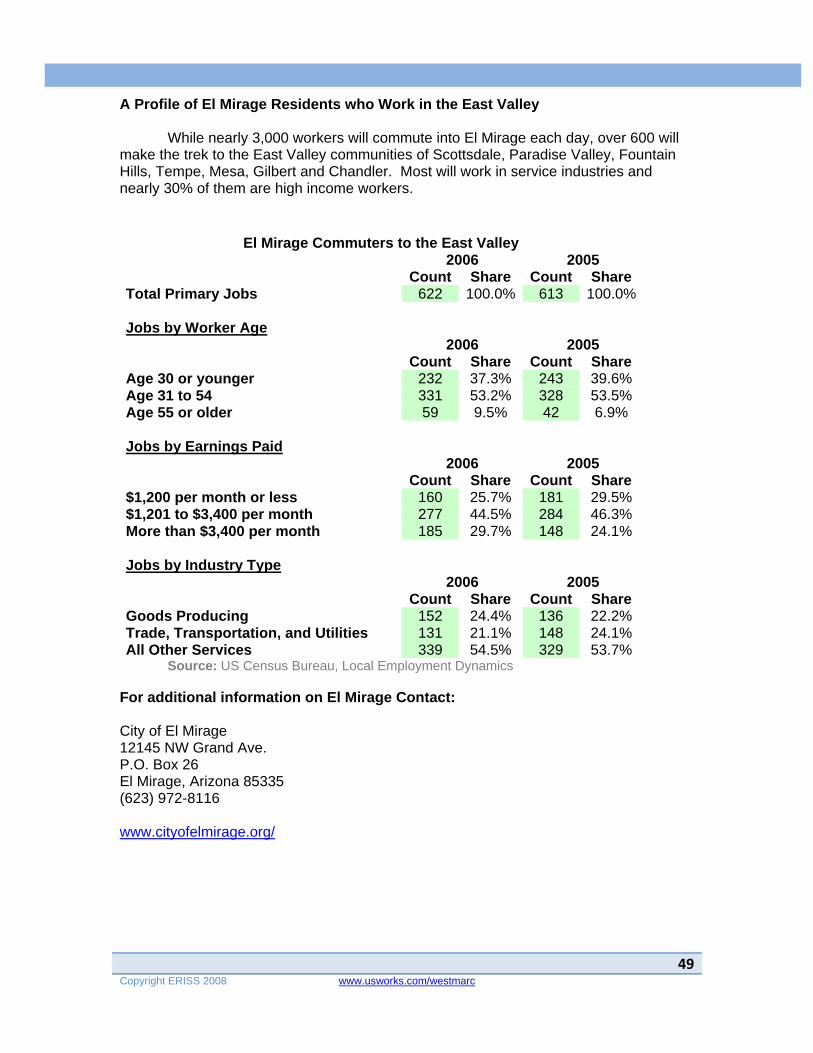
49Copyright ERISS 2008 www.usworks.com/westmarc
A Profile of El Mirage Residents who Work in the East Valley While nearly 3,000 workers will commute into El Mirage each day, over 600 will make the trek to the East Valley communities of Scottsdale, Paradise Valley, Fountain Hills, Tempe, Mesa, Gilbert and Chandler. Most will work in service industries and nearly 30% of them are high income workers.
El Mirage Commuters to the East Valley 2006 2005 Count Share Count Share Total Primary Jobs 622 100.0% 613 100.0% Jobs by Worker Age 2006 2005 Count Share Count Share Age 30 or younger 232 37.3% 243 39.6% Age 31 to 54 331 53.2% 328 53.5% Age 55 or older 59 9.5% 42 6.9% Jobs by Earnings Paid 2006 2005 Count Share Count Share $1,200 per month or less 160 25.7% 181 29.5% $1,201 to $3,400 per month 277 44.5% 284 46.3% More than $3,400 per month 185 29.7% 148 24.1% Jobs by Industry Type 2006 2005 Count Share Count Share Goods Producing 152 24.4% 136 22.2% Trade, Transportation, and Utilities 131 21.1% 148 24.1% All Other Services 339 54.5% 329 53.7%
Source: US Census Bureau, Local Employment Dynamics For additional information on El Mirage Contact: City of El Mirage 12145 NW Grand Ave. P.O. Box 26 El Mirage, Arizona 85335 (623) 972-8116 www.cityofelmirage.org/
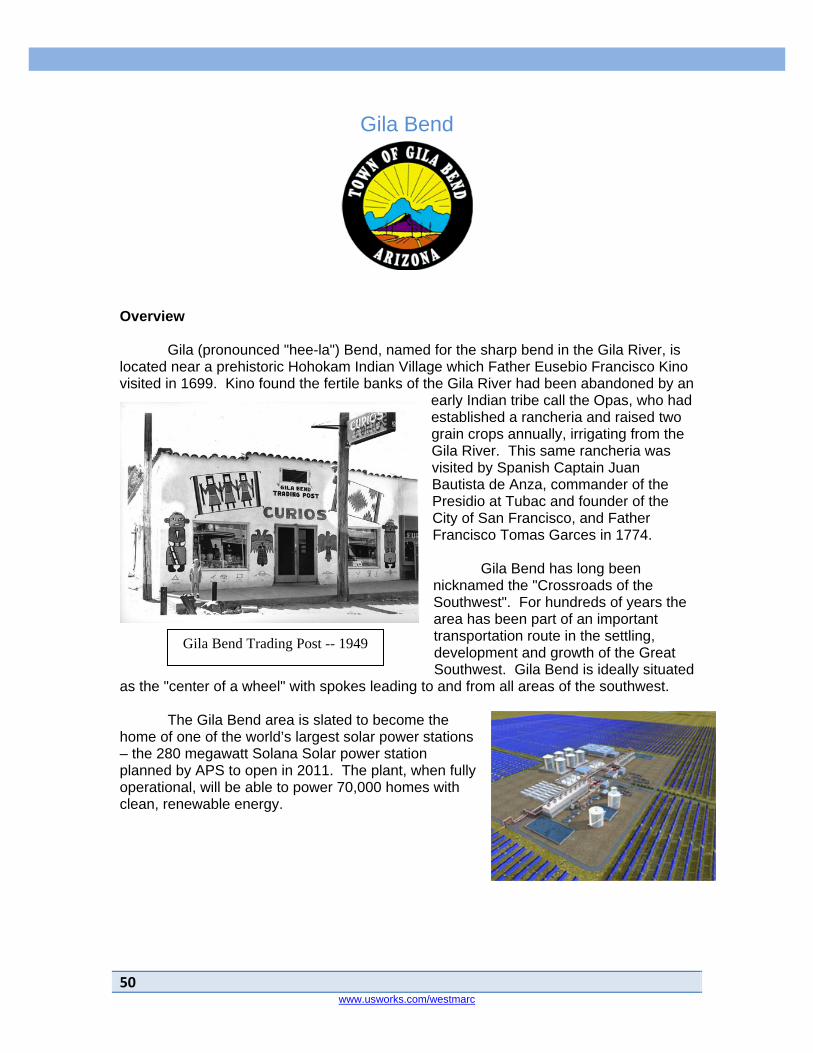
50 www.usworks.com/westmarc
Gila Bend Trading Post -- 1949
Gila Bend
Overview Gila (pronounced "hee-la") Bend, named for the sharp bend in the Gila River, is located near a prehistoric Hohokam Indian Village which Father Eusebio Francisco Kino visited in 1699. Kino found the fertile banks of the Gila River had been abandoned by an
early Indian tribe call the Opas, who had established a rancheria and raised two grain crops annually, irrigating from the Gila River. This same rancheria was visited by Spanish Captain Juan Bautista de Anza, commander of the Presidio at Tubac and founder of the City of San Francisco, and Father Francisco Tomas Garces in 1774. Gila Bend has long been nicknamed the "Crossroads of the Southwest". For hundreds of years the area has been part of an important transportation route in the settling, development and growth of the Great Southwest. Gila Bend is ideally situated
as the "center of a wheel" with spokes leading to and from all areas of the southwest. The Gila Bend area is slated to become the home of one of the world’s largest solar power stations – the 280 megawatt Solana Solar power station planned by APS to open in 2011. The plant, when fully operational, will be able to power 70,000 homes with clean, renewable energy.

51Copyright ERISS 2008 www.usworks.com/westmarc
Industries in Gila Bend At present, Food Service, Retail and Education are the dominant industries in the Gila Bend area. The coming power plant is likely to create a significant presence for the Utility sector and will likely generate significantly more activity in the Construction industry and eventually in firms that will service the thousands of mirrors and other machinery.
Source: InfoUSA and Advanced Workforce System

52 www.usworks.com/westmarc
Occupations Hired by Gila Bend Employers The primary occupational clusters track the main industries in the Gila Bend area. Food Service, Retail and Education occupations dominate the job market in the area.
Source: InfoUSA and Advanced Workforce Systems
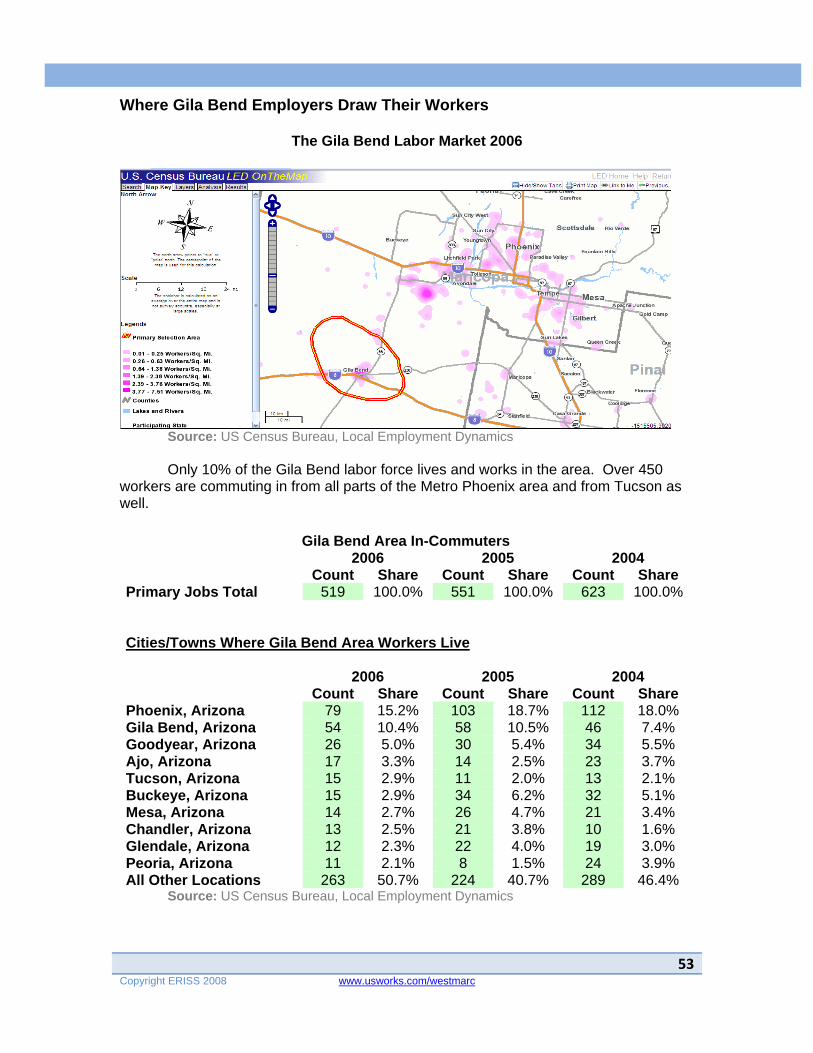
53Copyright ERISS 2008 www.usworks.com/westmarc
Where Gila Bend Employers Draw Their Workers
The Gila Bend Labor Market 2006
Source: US Census Bureau, Local Employment Dynamics Only 10% of the Gila Bend labor force lives and works in the area. Over 450 workers are commuting in from all parts of the Metro Phoenix area and from Tucson as well.
Gila Bend Area In-Commuters 2006 2005 2004 Count Share Count Share Count Share Primary Jobs Total 519 100.0% 551 100.0% 623 100.0% Cities/Towns Where Gila Bend Area Workers Live 2006 2005 2004 Count Share Count Share Count Share Phoenix, Arizona 79 15.2% 103 18.7% 112 18.0% Gila Bend, Arizona 54 10.4% 58 10.5% 46 7.4% Goodyear, Arizona 26 5.0% 30 5.4% 34 5.5% Ajo, Arizona 17 3.3% 14 2.5% 23 3.7% Tucson, Arizona 15 2.9% 11 2.0% 13 2.1% Buckeye, Arizona 15 2.9% 34 6.2% 32 5.1% Mesa, Arizona 14 2.7% 26 4.7% 21 3.4% Chandler, Arizona 13 2.5% 21 3.8% 10 1.6% Glendale, Arizona 12 2.3% 22 4.0% 19 3.0% Peoria, Arizona 11 2.1% 8 1.5% 24 3.9% All Other Locations 263 50.7% 224 40.7% 289 46.4%
Source: US Census Bureau, Local Employment Dynamics

54 www.usworks.com/westmarc
A Profile of Gila Bend Area Residents who Work in the East Valley Almost twice as many workers leave the Gila Bend area to commute to jobs in the East Valley as stay to work in Gila Bend. East Valley consists of Scottsdale, Paradise Valley, Fountain Hills, Tempe, Mesa, Gilbert and Chandler. Nearly 60% of those are middle aged workers. A significant number of those workers are going to manufacturing jobs.
Gila Bend Commuters to the East Valley 2006 2005 Count Share Count Share Total Primary Jobs 104 100.0% 94 100.0% Jobs by Worker Age 2006 2005 Count Share Count Share Age 30 or younger 37 35.6% 38 40.4% Age 31 to 54 62 59.6% 46 48.9% Age 55 or older 5 4.8% 10 10.6% Jobs by Earnings Paid 2006 2005 Count Share Count Share $1,200 per month or less 29 27.9% 32 34.0% $1,201 to $3,400 per month 48 46.2% 42 44.7% More than $3,400 per month 27 26.0% 20 21.3% Jobs by Industry Type 2006 2005 Count Share Count Share Goods Producing 42 40.4% 30 31.9% Trade, Transportation, and Utilities 19 18.3% 23 24.5% All Other Services 43 41.3% 41 43.6%
Source: US Census Bureau, Local Employment Dynamics
For additional information on Gila Bend Contact: Town of Gila Bend 644 W. Pima Street Gila Bend, AZ 85337 (928) 683-2255 www.gilabendaz.org/

55Copyright ERISS 2008 www.usworks.com/westmarc
Glendale
Overview The City of Glendale is one of the most dynamic and rapidly growing communities in the United States. Strategically located in the northwest region of the Phoenix Metropolitan Area, Glendale boasts over 250,000 citizens, making it the fourth largest city in Arizona. Served extensively by ground, air, and rail transportation, Glendale offers a well-developed arterial street system complemented by Interstate 10, Interstate 17 and State Route 101 ringing the city. Glendale Municipal Airport is a tower-controlled facility strategically located near Loop 101. Its 7,150-foot-by-100-foot airstrip easily accommodates corporate jet travel. The Burlington-Northern Santa Fe Railroad runs through the city along U.S. Highway 60, and Phoenix Sky Harbor International Airport is only a 20-minute drive away. Glendale is also a playground for the outdoor and athletic enthusiast. Thunderbird Mountain Park hugs the northern edge of the community and welcomes hikers and bikers of all abilities. Views from the top include beautiful Arrowhead Ranch, a community of homes, parks and lakes as well as one of the wealthiest zip codes in the state. Cowboys, farmers, ranchers and Native Americans wove the fabric that is the Glendale of today and visitors are afforded a number of ways to catch a glimpse of these pioneers at the many cultural and heritage attractions within the city. Preserving one of the Valley's oldest and most magnificent ranches, Sahuaro Ranch Park Historical Area consists of 13 original buildings and a huge rose garden. Palm trees wave above the red brick facade of the Main House, and peacocks now roam the grounds where chickens and livestock used to graze. Known as the "Showplace of the Valley," Sahuaro Ranch Park Historical Area offers exhibits and guided tours, keeping alive the history of early settlement in the Valley.
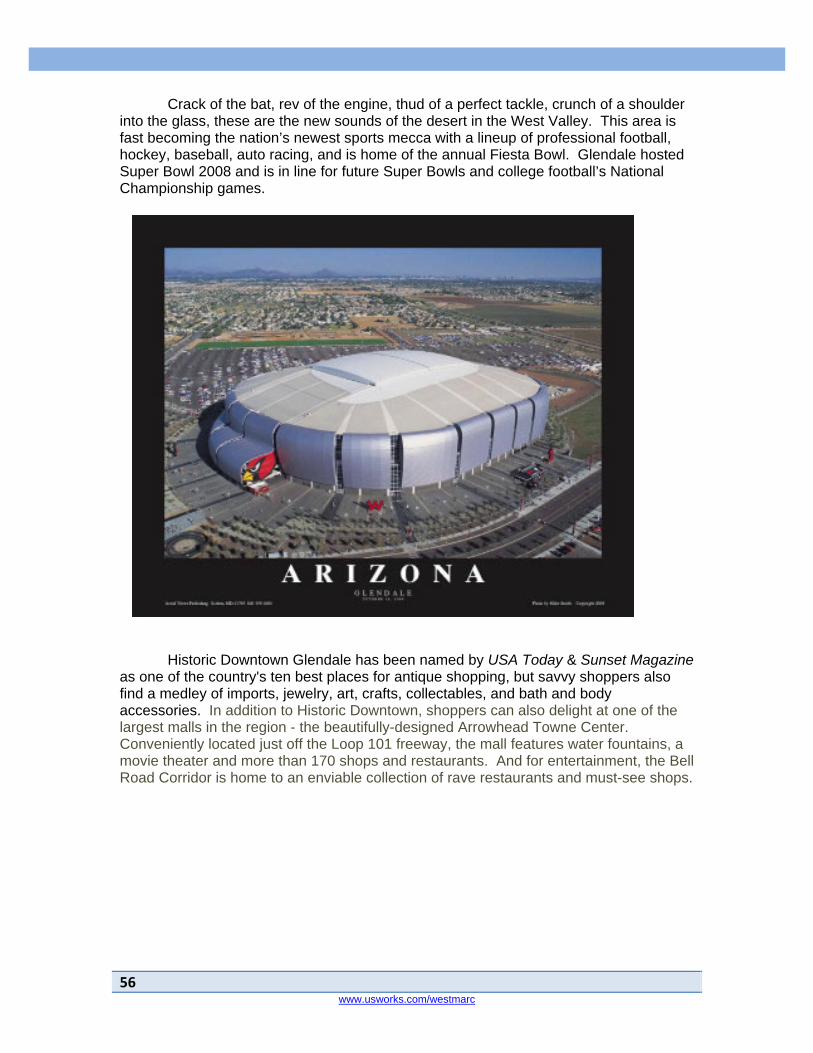
56 www.usworks.com/westmarc
Crack of the bat, rev of the engine, thud of a perfect tackle, crunch of a shoulder into the glass, these are the new sounds of the desert in the West Valley. This area is fast becoming the nation’s newest sports mecca with a lineup of professional football, hockey, baseball, auto racing, and is home of the annual Fiesta Bowl. Glendale hosted Super Bowl 2008 and is in line for future Super Bowls and college football’s National Championship games.
Historic Downtown Glendale has been named by USA Today & Sunset Magazine as one of the country's ten best places for antique shopping, but savvy shoppers also find a medley of imports, jewelry, art, crafts, collectables, and bath and body accessories. In addition to Historic Downtown, shoppers can also delight at one of the largest malls in the region - the beautifully-designed Arrowhead Towne Center. Conveniently located just off the Loop 101 freeway, the mall features water fountains, a movie theater and more than 170 shops and restaurants. And for entertainment, the Bell Road Corridor is home to an enviable collection of rave restaurants and must-see shops.

57Copyright ERISS 2008 www.usworks.com/westmarc
Industries in Glendale Glendale’s industry mix is balanced with over 6,000 firms representing the full spectrum of businesses in the Metro Phoenix area. Its Health Care sector is large with over 12% of the total employment in the city, higher than the percentage in the Metro Phoenix area as a whole (9.1%) but on par with the rest of the West Valley (13%). Glendale is truly a shopping destination with over 17% of its employment in Retail Trade, higher than both the West Valley average (14%) and the Metro Phoenix average (12.8%). There is a robust Accommodations and Food Service sector and a large Education sector.
Source: InfoUSA and Advanced Workforce Systems

58 www.usworks.com/westmarc
Occupations Hired by Glendale Employers The occupational mix in Glendale reflects its diverse industry base with a strong base of Business Operations, Computer, Health Care and Sales and Food Service occupations. In many ways, Glendale is a microcosm of the Metro Phoenix area.
Source: InfoUSA and Advanced Workforce Systems
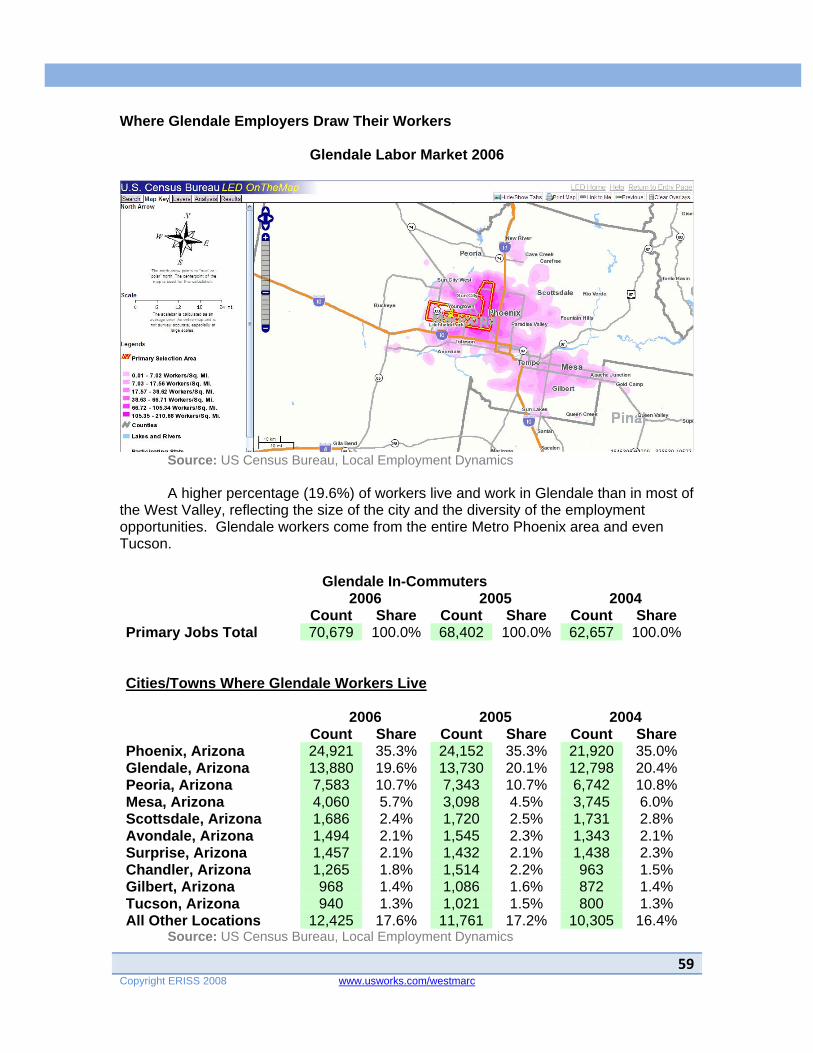
59Copyright ERISS 2008 www.usworks.com/westmarc
Where Glendale Employers Draw Their Workers
Glendale Labor Market 2006
Source: US Census Bureau, Local Employment Dynamics
A higher percentage (19.6%) of workers live and work in Glendale than in most of the West Valley, reflecting the size of the city and the diversity of the employment opportunities. Glendale workers come from the entire Metro Phoenix area and even Tucson.
Glendale In-Commuters 2006 2005 2004 Count Share Count Share Count Share Primary Jobs Total 70,679 100.0% 68,402 100.0% 62,657 100.0% Cities/Towns Where Glendale Workers Live 2006 2005 2004 Count Share Count Share Count Share Phoenix, Arizona 24,921 35.3% 24,152 35.3% 21,920 35.0% Glendale, Arizona 13,880 19.6% 13,730 20.1% 12,798 20.4% Peoria, Arizona 7,583 10.7% 7,343 10.7% 6,742 10.8% Mesa, Arizona 4,060 5.7% 3,098 4.5% 3,745 6.0% Scottsdale, Arizona 1,686 2.4% 1,720 2.5% 1,731 2.8% Avondale, Arizona 1,494 2.1% 1,545 2.3% 1,343 2.1% Surprise, Arizona 1,457 2.1% 1,432 2.1% 1,438 2.3% Chandler, Arizona 1,265 1.8% 1,514 2.2% 963 1.5% Gilbert, Arizona 968 1.4% 1,086 1.6% 872 1.4% Tucson, Arizona 940 1.3% 1,021 1.5% 800 1.3% All Other Locations 12,425 17.6% 11,761 17.2% 10,305 16.4%
Source: US Census Bureau, Local Employment Dynamics

60 www.usworks.com/westmarc
A Profile of Glendale Residents who Work in the East Valley As is true in most of the West Valley, more Glendale residents commute to jobs in the East Valley (Scottsdale, Paradise Valley, Fountain Hills, Tempe, Mesa, Gilbert and Chandler) than stay to work in Glendale itself. Most of these out-commuters to the East Valley are younger workers who find jobs in the Service sector.
Glendale Commuters to the East Valley 2006 2005 Count Share Count Share Total Primary Jobs 19,063 100.0% 18,285 100.0% Jobs by Worker Age 2006 2005 Count Share Count Share Age 30 or younger 7,038 36.9% 6,742 36.9% Age 31 to 54 9,790 51.4% 9,581 52.4% Age 55 or older 2,235 11.7% 1,962 10.7% Jobs by Earnings Paid 2006 2005 Count Share Count Share $1,200 per month or less 4,499 23.6% 4,715 25.8% $1,201 to $3,400 per month 8,062 42.3% 7,764 42.5% More than $3,400 per month 6,502 34.1% 5,806 31.8% Jobs by Industry Type 2006 2005 Count Share Count Share Goods Producing 3,925 20.6% 3,661 20.0% Trade, Transportation, and Utilities 4,552 23.9% 4,338 23.7% All Other Services 10,586 55.5% 10,286 56.3%
Source: US Census Bureau, Local Employment Dynamics For additional information on Glendale contact: City of Glendale Economic Development 5850 West Glendale Ave. Glendale, AZ 85301 Phone: (623) 930-2983 Fax: (623) 931-5730 www.glendaleaz.com/EconomicDevelopment
61Copyright ERISS 2008 www.usworks.com/westmarc
Goodyear
Overview From Cotton to Aerospace The Goodyear of today exists because of the cotton of yesteryear. It was part of the 16,000 acres purchased in 1917 for the Goodyear Tire and Rubber Company by junior executive Paul Litchfield. Cotton used to make rubber tires for airplanes in World War I was in short supply because foreign sources were in war torn countries or disease ridden.
When Goodyear found that Arizona’s climate and soil was similar to foreign sources, the company sent Litchfield to purchase land. The small community that formed as a result of the Goodyear Farms cotton industry was first called “Egypt” for the Egyptian cotton grown there and then it was called “Goodyear.” The community thrived as long as the cotton industry was strong. But after World War I, cotton prices plummeted
and Goodyear’s economy suffered. However, World War II brought a recovery in the early 1940’s when the Litchfield Naval Air Facility and the Goodyear Aircraft Corporation located there, employing as many as 7,500 people at one time. Dirigibles or “blimps” were built at the Goodyear Aircraft Corporation. After the war, the Naval Air Facility served as a storage base for thousands of World War II aircraft that were moth balled and salvaged. Then, in 1968, the Navy sold the airfield to the City of Phoenix which named it the Phoenix-Litchfield Airport. In 1986, it was renamed the Phoenix-Goodyear Airport. The town of Goodyear was incorporated in November 1946. At that time, the town had 151 homes, 250 apartments, a grocery store, drug store, barber shop, beauty shop and service station. Then, in 1949, a long history of aerospace and defense programs began in Goodyear when the Goodyear Aerospace Corporation replaced the Goodyear Aircraft facility. That plant was later sold to Loral Defense Systems and eventually evolved by merger and acquisition into the current Lockheed Martin Corp.
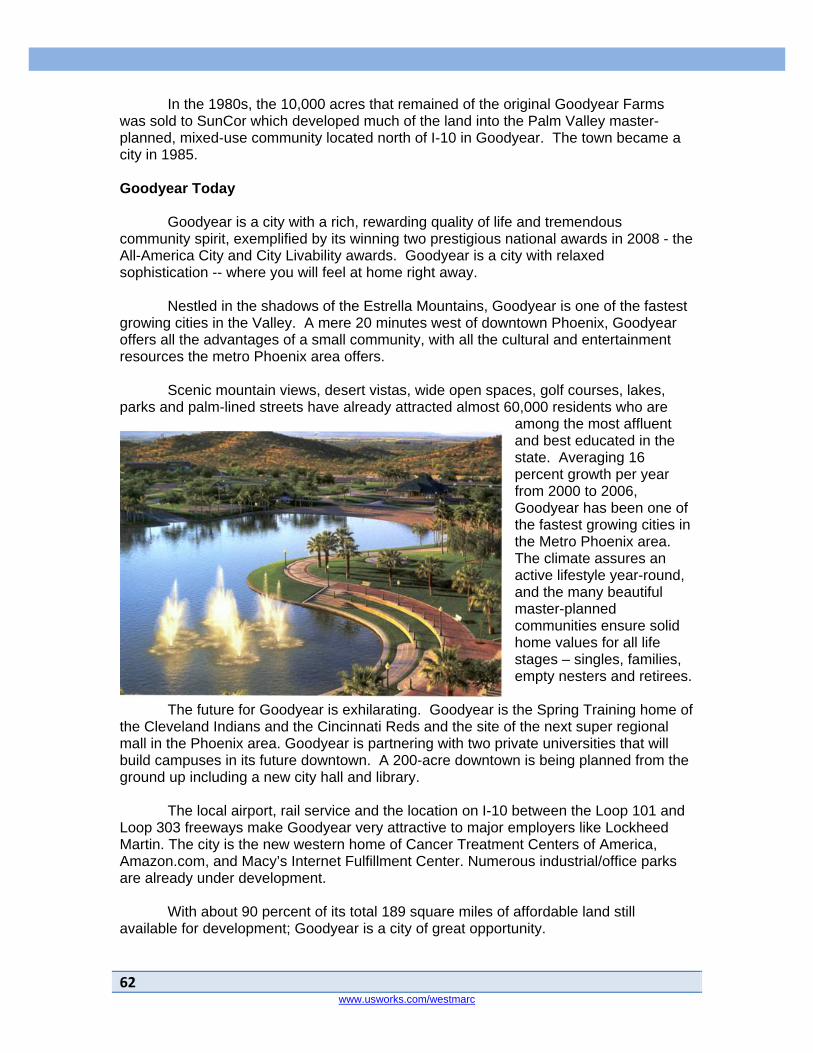
62 www.usworks.com/westmarc
In the 1980s, the 10,000 acres that remained of the original Goodyear Farms was sold to SunCor which developed much of the land into the Palm Valley master-planned, mixed-use community located north of I-10 in Goodyear. The town became a city in 1985. Goodyear Today Goodyear is a city with a rich, rewarding quality of life and tremendous community spirit, exemplified by its winning two prestigious national awards in 2008 - the All-America City and City Livability awards. Goodyear is a city with relaxed sophistication -- where you will feel at home right away. Nestled in the shadows of the Estrella Mountains, Goodyear is one of the fastest growing cities in the Valley. A mere 20 minutes west of downtown Phoenix, Goodyear offers all the advantages of a small community, with all the cultural and entertainment resources the metro Phoenix area offers. Scenic mountain views, desert vistas, wide open spaces, golf courses, lakes, parks and palm-lined streets have already attracted almost 60,000 residents who are
among the most affluent and best educated in the state. Averaging 16 percent growth per year from 2000 to 2006, Goodyear has been one of the fastest growing cities in the Metro Phoenix area. The climate assures an active lifestyle year-round, and the many beautiful master-planned communities ensure solid home values for all life stages – singles, families, empty nesters and retirees.
The future for Goodyear is exhilarating. Goodyear is the Spring Training home of the Cleveland Indians and the Cincinnati Reds and the site of the next super regional mall in the Phoenix area. Goodyear is partnering with two private universities that will build campuses in its future downtown. A 200-acre downtown is being planned from the ground up including a new city hall and library. The local airport, rail service and the location on I-10 between the Loop 101 and Loop 303 freeways make Goodyear very attractive to major employers like Lockheed Martin. The city is the new western home of Cancer Treatment Centers of America, Amazon.com, and Macy’s Internet Fulfillment Center. Numerous industrial/office parks are already under development. With about 90 percent of its total 189 square miles of affordable land still available for development; Goodyear is a city of great opportunity.
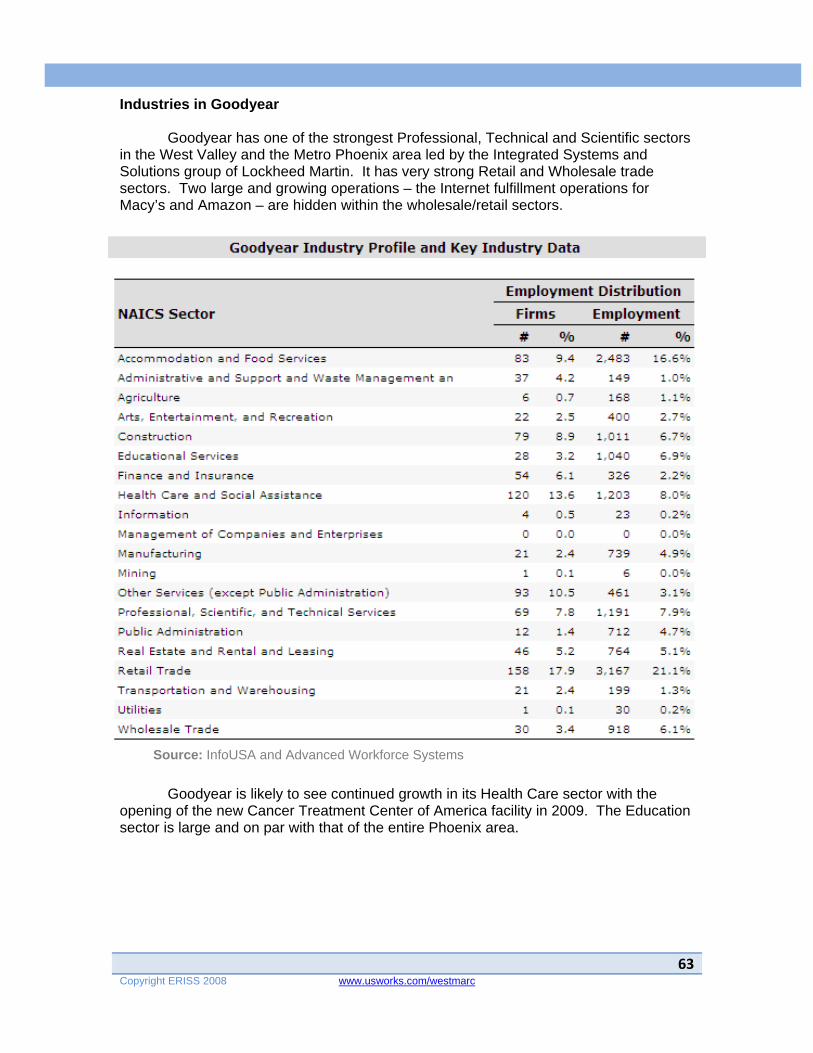
63Copyright ERISS 2008 www.usworks.com/westmarc
Industries in Goodyear Goodyear has one of the strongest Professional, Technical and Scientific sectors in the West Valley and the Metro Phoenix area led by the Integrated Systems and Solutions group of Lockheed Martin. It has very strong Retail and Wholesale trade sectors. Two large and growing operations – the Internet fulfillment operations for Macy’s and Amazon – are hidden within the wholesale/retail sectors.
Goodyear is likely to see continued growth in its Health Care sector with the opening of the new Cancer Treatment Center of America facility in 2009. The Education sector is large and on par with that of the entire Phoenix area.
Source: InfoUSA and Advanced Workforce Systems
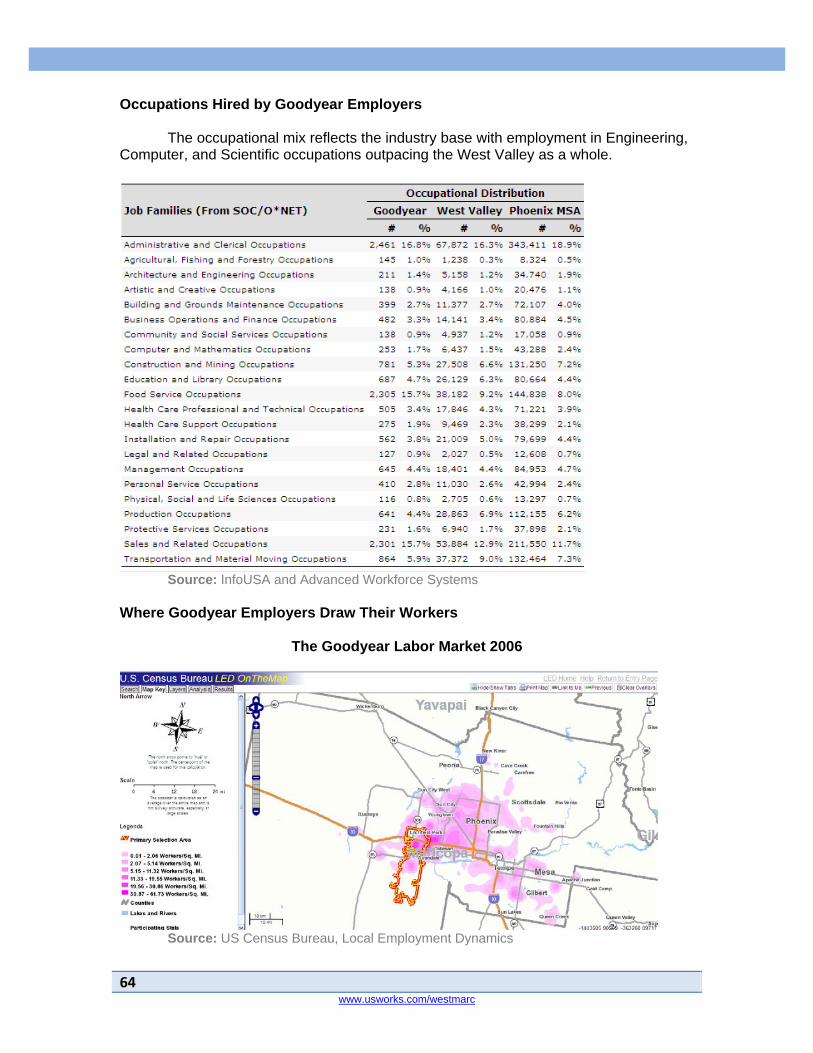
64 www.usworks.com/westmarc
Occupations Hired by Goodyear Employers The occupational mix reflects the industry base with employment in Engineering, Computer, and Scientific occupations outpacing the West Valley as a whole.
Source: InfoUSA and Advanced Workforce Systems
Where Goodyear Employers Draw Their Workers
The Goodyear Labor Market 2006
Source: US Census Bureau, Local Employment Dynamics
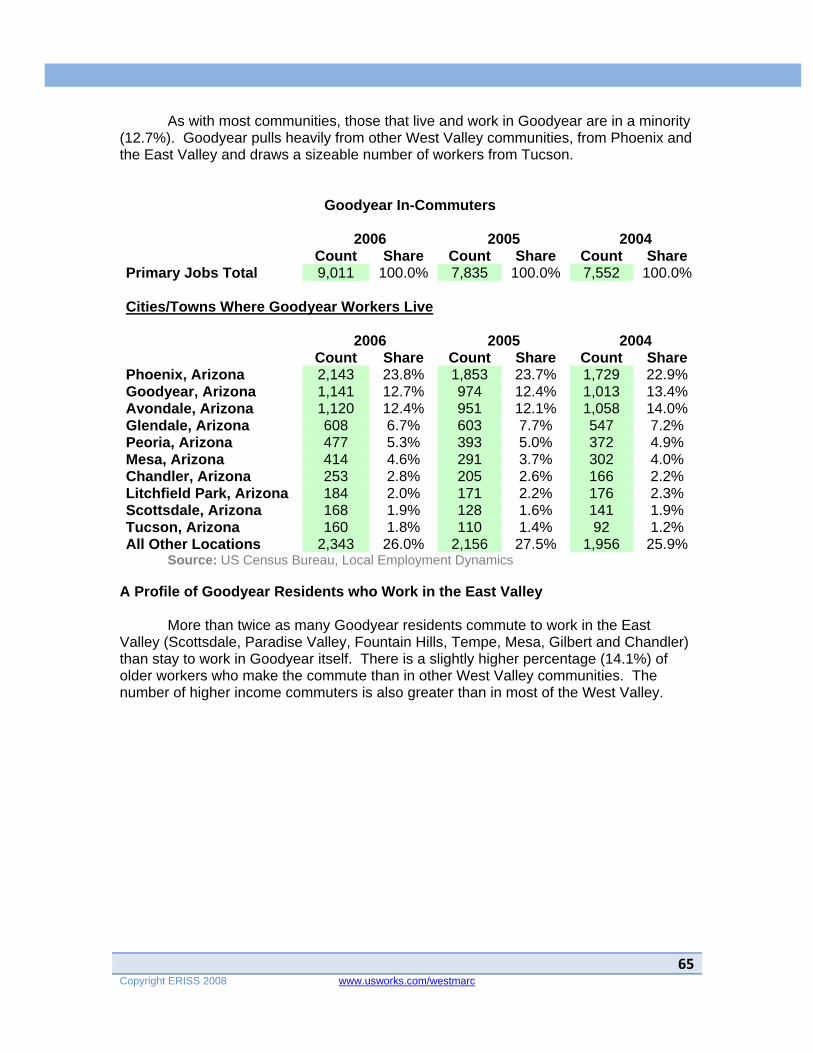
65Copyright ERISS 2008 www.usworks.com/westmarc
As with most communities, those that live and work in Goodyear are in a minority (12.7%). Goodyear pulls heavily from other West Valley communities, from Phoenix and the East Valley and draws a sizeable number of workers from Tucson.
Goodyear In-Commuters
2006 2005 2004 Count Share Count Share Count Share Primary Jobs Total 9,011 100.0% 7,835 100.0% 7,552 100.0% Cities/Towns Where Goodyear Workers Live 2006 2005 2004 Count Share Count Share Count Share Phoenix, Arizona 2,143 23.8% 1,853 23.7% 1,729 22.9% Goodyear, Arizona 1,141 12.7% 974 12.4% 1,013 13.4% Avondale, Arizona 1,120 12.4% 951 12.1% 1,058 14.0% Glendale, Arizona 608 6.7% 603 7.7% 547 7.2% Peoria, Arizona 477 5.3% 393 5.0% 372 4.9% Mesa, Arizona 414 4.6% 291 3.7% 302 4.0% Chandler, Arizona 253 2.8% 205 2.6% 166 2.2% Litchfield Park, Arizona 184 2.0% 171 2.2% 176 2.3% Scottsdale, Arizona 168 1.9% 128 1.6% 141 1.9% Tucson, Arizona 160 1.8% 110 1.4% 92 1.2% All Other Locations 2,343 26.0% 2,156 27.5% 1,956 25.9%
Source: US Census Bureau, Local Employment Dynamics A Profile of Goodyear Residents who Work in the East Valley More than twice as many Goodyear residents commute to work in the East Valley (Scottsdale, Paradise Valley, Fountain Hills, Tempe, Mesa, Gilbert and Chandler) than stay to work in Goodyear itself. There is a slightly higher percentage (14.1%) of older workers who make the commute than in other West Valley communities. The number of higher income commuters is also greater than in most of the West Valley.

66 www.usworks.com/westmarc
Goodyear Commuters to the East Valley
2006 2005 Count Share Count Share Total Primary Jobs 2,551 100.0% 2,544 100.0% Jobs by Worker Age 2006 2005 Count Share Count Share Age 30 or younger 739 29.0% 735 28.9% Age 31 to 54 1,452 56.9% 1,471 57.8% Age 55 or older 360 14.1% 338 13.3% Jobs by Earnings Paid 2006 2005 Count Share Count Share $1,200 per month or less 542 21.2% 479 18.8% $1,201 to $3,400 per month 978 38.3% 971 38.2% More than $3,400 per month 1,031 40.4% 1,094 43.0% Jobs by Industry Type 2006 2005 Count Share Count Share Goods Producing 511 20.0% 513 20.2% Trade, Transportation, and Utilities 602 23.6% 622 24.4% All Other Services 1,438 56.4% 1,409 55.4%
Source: US Census Bureau, Local Employment Dynamics For additional information on Goodyear contact: Economic Development Department City of Goodyear 190 N. Litchfield Rd. Goodyear, AZ 85338 (623) 932-3025 www.goodyearaz.gov/ecdev
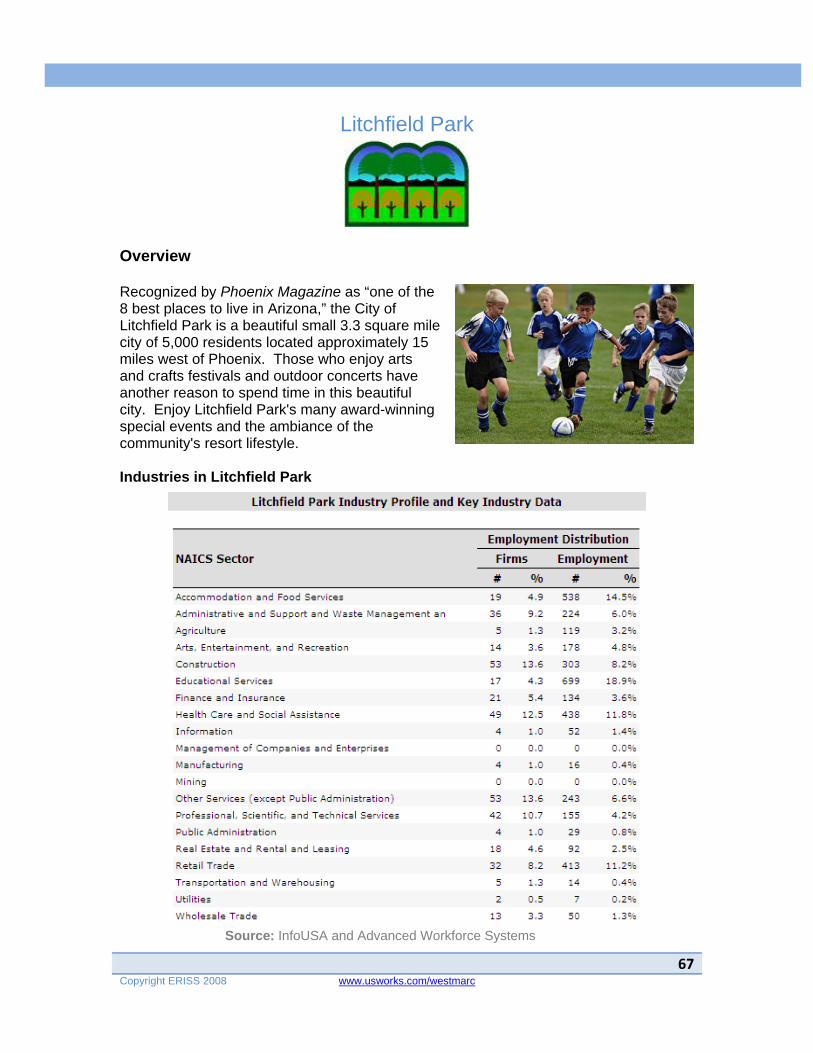
67Copyright ERISS 2008 www.usworks.com/westmarc
Litchfield Park
Overview Recognized by Phoenix Magazine as “one of the 8 best places to live in Arizona,” the City of Litchfield Park is a beautiful small 3.3 square mile city of 5,000 residents located approximately 15 miles west of Phoenix. Those who enjoy arts and crafts festivals and outdoor concerts have another reason to spend time in this beautiful city. Enjoy Litchfield Park's many award-winning special events and the ambiance of the community's resort lifestyle. Industries in Litchfield Park
Source: InfoUSA and Advanced Workforce Systems
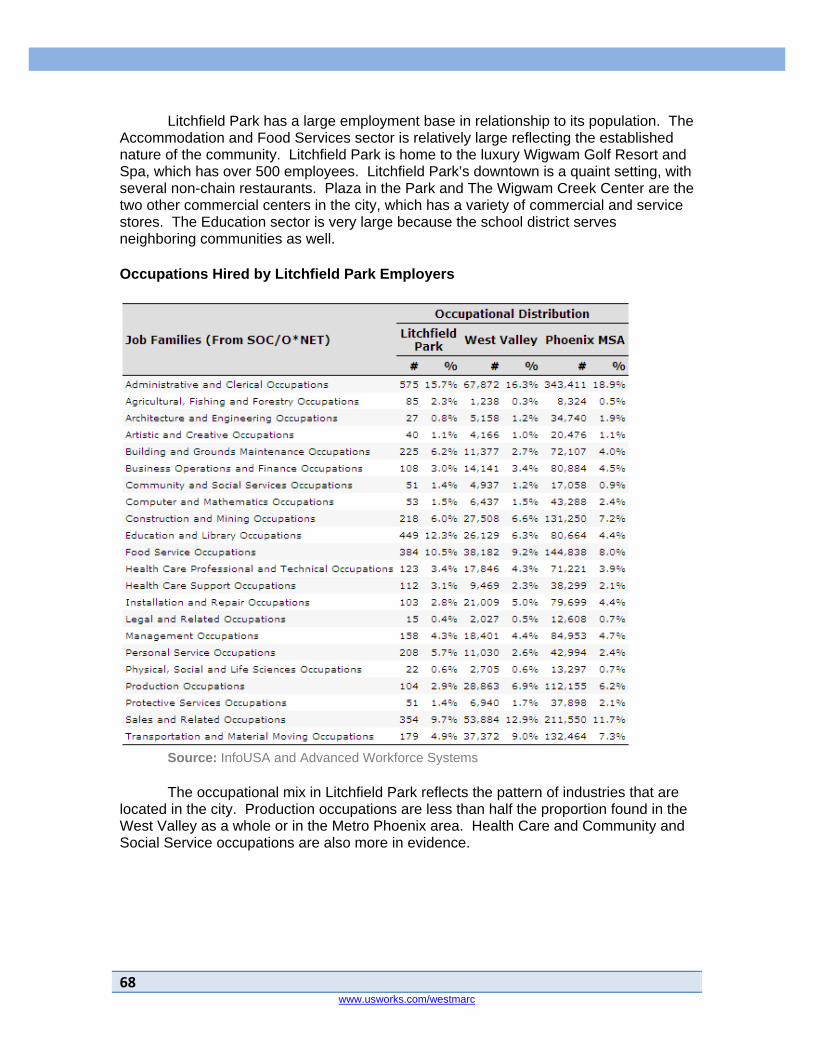
68 www.usworks.com/westmarc
Litchfield Park has a large employment base in relationship to its population. The Accommodation and Food Services sector is relatively large reflecting the established nature of the community. Litchfield Park is home to the luxury Wigwam Golf Resort and Spa, which has over 500 employees. Litchfield Park’s downtown is a quaint setting, with several non-chain restaurants. Plaza in the Park and The Wigwam Creek Center are the two other commercial centers in the city, which has a variety of commercial and service stores. The Education sector is very large because the school district serves neighboring communities as well. Occupations Hired by Litchfield Park Employers
Source: InfoUSA and Advanced Workforce Systems
The occupational mix in Litchfield Park reflects the pattern of industries that are located in the city. Production occupations are less than half the proportion found in the West Valley as a whole or in the Metro Phoenix area. Health Care and Community and Social Service occupations are also more in evidence.

69Copyright ERISS 2008 www.usworks.com/westmarc
Where Litchfield Park Employers Draw Their Workers
The Litchfield Park Labor Market 2006
Source: US Census Bureau, Local Employment Dynamics
Litchfield Park draws its workers from all over the Metro Phoenix area. Just over 10% of Litchfield Park employment occurs with individuals who both live and work in the city.
Litchfield Park In-Commuters
2006 2005 2004 Count Share Count Share Count Share Primary Jobs Total 1,321 100.0% 1,376 100.0% 1,280 100.0% Cities/Towns Where Litchfield Park Workers Live 2006 2005 2004 Count Share Count Share Count Share Phoenix, Arizona 325 24.6% 294 21.4% 252 19.7% Litchfield Park, Arizona 142 10.7% 122 8.9% 103 8.0% Avondale, Arizona 130 9.8% 173 12.6% 192 15.0% Goodyear, Arizona 120 9.1% 126 9.2% 148 11.6% Glendale, Arizona 79 6.0% 80 5.8% 68 5.3% Scottsdale, Arizona 59 4.5% 69 5.0% 63 4.9% Mesa, Arizona 51 3.9% 38 2.8% 22 1.7% Peoria, Arizona 48 3.6% 74 5.4% 48 3.8% Chandler, Arizona 34 2.6% 34 2.5% 20 1.6% Surprise, Arizona 31 2.3% 34 2.5% 39 3.0% All Other Locations 302 22.9% 332 24.1% 325 25.4%
Source: US Census Bureau, Local Employment Dynamics
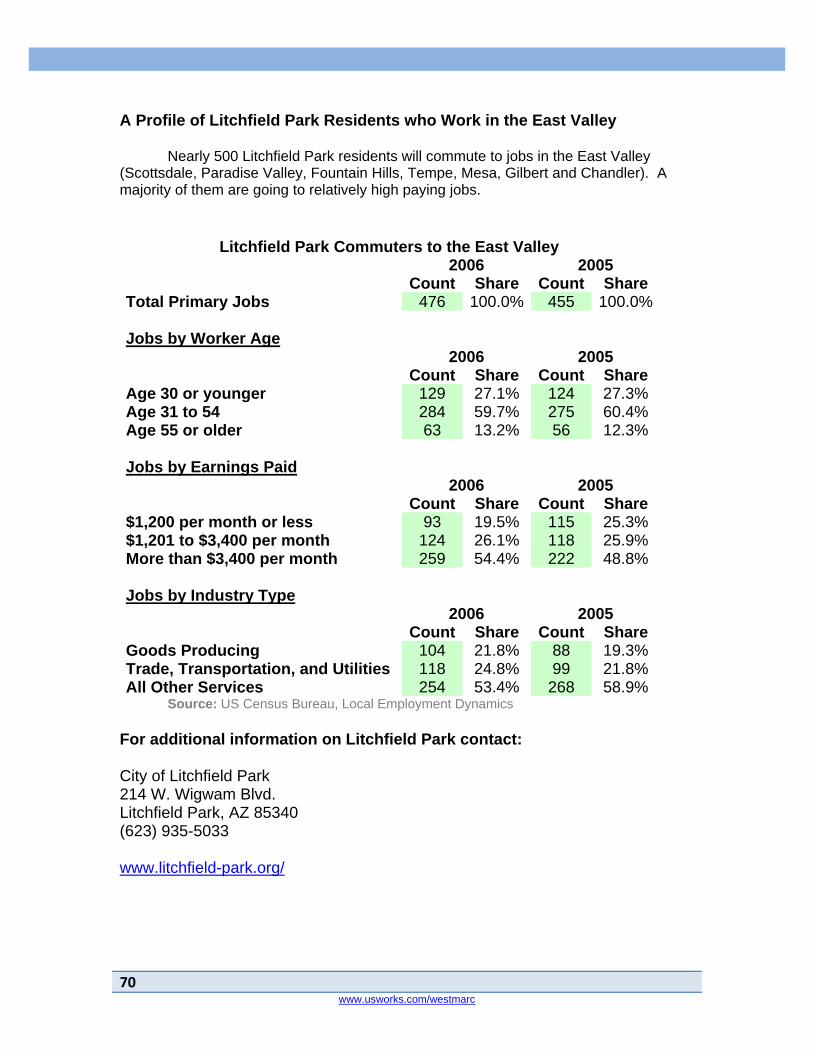
70 www.usworks.com/westmarc
A Profile of Litchfield Park Residents who Work in the East Valley Nearly 500 Litchfield Park residents will commute to jobs in the East Valley (Scottsdale, Paradise Valley, Fountain Hills, Tempe, Mesa, Gilbert and Chandler). A majority of them are going to relatively high paying jobs.
Litchfield Park Commuters to the East Valley 2006 2005 Count Share Count Share Total Primary Jobs 476 100.0% 455 100.0% Jobs by Worker Age 2006 2005 Count Share Count Share Age 30 or younger 129 27.1% 124 27.3% Age 31 to 54 284 59.7% 275 60.4% Age 55 or older 63 13.2% 56 12.3% Jobs by Earnings Paid 2006 2005 Count Share Count Share $1,200 per month or less 93 19.5% 115 25.3% $1,201 to $3,400 per month 124 26.1% 118 25.9% More than $3,400 per month 259 54.4% 222 48.8% Jobs by Industry Type 2006 2005 Count Share Count Share Goods Producing 104 21.8% 88 19.3% Trade, Transportation, and Utilities 118 24.8% 99 21.8% All Other Services 254 53.4% 268 58.9%
Source: US Census Bureau, Local Employment Dynamics For additional information on Litchfield Park contact: City of Litchfield Park 214 W. Wigwam Blvd. Litchfield Park, AZ 85340 (623) 935-5033 www.litchfield-park.org/
71Copyright ERISS 2008 www.usworks.com/westmarc
Peoria
Overview
Although established as a farming community in the 1880s, today Peoria is one of the fastest growing cities in Arizona. This rapid population growth in Peoria and the surrounding metropolitan area has resulted in an abundant labor force that boasts an educated labor pool that is younger than the national average. Although more than half of Peoria’s residents have more than one year of college education, the area is home to a wide range of workers, including traditional blue-collar workers, skilled and unskilled workers and professionals in a wide variety of fields.
Population over time
Peoria Household characteristics
Number of Households 51,748Median Household Income 2007 $66,359Educational Attainment 34.1%Median Age Distribution 35.2Median Price (single family home)*
Resale Home $ 229,450 New Home $290,000
*Source – Q2 2008 ASU Realty Studies
Peoria Growth indicators
1995 2000 2005 2010 Taxable Sales* $1 Billion $1.8 Billion $3.1 Billion $4.5 BillionCIP Infrastructure Investment $11 Billion $24.1 Billion $47.4 Billion $81.5 Billion
*Sales tax in Peoria is 8.1% (5.6% state; 0.7% county; 1.8% City of Peoria)
City 1995 2000 2005 2010 Peoria 74,565 108,364 138,143 172,793West Valley 380,849 474,057 698,202 922,346Metro Phoenix 2,438,214 2,895,450 3,452,642 4,009,834

72 www.usworks.com/westmarc
Peoria is a Great Place to Live Peoria is a vibrant and diverse community offering a variety of living styles from downtown to suburban to master-planned. As the recreational and entertainment hub of the Northwest Valley, the City has built amenities that foster community and offer something for everyone. And to top it off, the City is pursuing a growth strategy that is sustainable and balanced. For all of these reasons, Peoria was ranked 55th of the top 100 places to live by Money magazine in 2008.
Transportation Infrastructure Peoria is conveniently located in the Northwest Valley, minutes away from Downtown Phoenix and Sky Harbor International Airport. Major freeways for the City include Interstates 17 and 10, the Loop 101, and state highways 60 and 74. The development of the Loop 303 in northern Peoria, a 6-lane freeway linking the West Valley to I-10 and I-17, will provide even greater accessibility to neighboring communities and long-haul transportation while also opening up thousands of acres of vacant land for development.
Sports and Entertainment Peoria has a reputation for bringing art and culture to the West Valley. The Arizona Broadway Theatre and the Center for the Performing Arts bring critically acclaimed theatre year-round to the community. Home to the San Diego Padres and the Seattle Mariners since 1994, Peoria Sports Complex draws nearly 230,000 fans for Major League Baseball Spring Training every year. The Complex, which has become the model for multi-team facilities that are being built today, is comprised of a main stadium and six and a half practice fields for each team. The unique setup is ideal for adult, college, high school and youth baseball tournaments and championships and is also available for community events, concerts, art exhibits, car shows, and charitable functions. The Challenger Space Center of Arizona is a working memorial to the astronauts that lost their lives in the ill-fated space shuttle Challenger flight on January 28, 1986. As a premier learning hub, the Center has a unique affiliation with the Smithsonian Institute, offering access to national quality museum exhibits right here in Peoria. Situated on the southern border are the homes of the Phoenix Coyotes and the Arizona Cardinals. Jobing.com Arena hosts numerous music and non-hockey events and University of Phoenix Stadium hosts the Fiesta Bowl and is also on the rotation for future Super Bowls as well as college football's National Championship games. Also, a short drive away is the Phoenix International Raceway, home to a variety of NASCAR events throughout the year.

73Copyright ERISS 2008 www.usworks.com/westmarc
Education The Northwest Valley offers a plethora of opportunities for higher education. ASU at the West Campus, the Thunderbird School of Global Management, Midwestern University, and Western International University provide the spectrum of education and training from international business to osteopathic medicine. Furthermore, Peoria Unified School District, the third largest school district in Arizona serving 38,000 students, consistently beats state and county test scores. PUSD received Gold Medal recognition and was rated in the top 17 percent of the 1,500 top-ranking school districts nationwide by Expansion Magazine.
Health Care The City of Peoria is committed to health, wellness, and community development. Home to the largest health care community in the state, Plaza del Rio, and the Peoria Regional Medical Center, the City has big plans for the development of its health care cluster. Plaza del Rio Peoria is home to the single largest health care community in Arizona, Plaza del Rio. Covering 185 acres, the campus is unique in attracting and combining medical facilities with seven different types of senior living products – running the gamut from independent rental and life-care units to various specialized health care facilities. This campus system allows seniors who are committed to health goals or facing medical challenges to live their lives in a setting that complements their needs and desires. At the same time physicians and other medical groups have easy access to both an extensive variety of medical services and a built-in market of patients. Peoria Regional Medical Center Peoria Regional Medical Center's initial 70,000-square-foot, acute-care facility will have more than 30 private emergency rooms and 30 inpatient beds when it is completed in the fall of 2009. The primary focus of the facility will be quick delivery of efficient and accurate medical services, following a "Door to Doc in 31 Minutes" model of emergency care. The hospital also will offer a full range of diagnostic imaging and laboratory services, complete surgical services and an on-site pharmacy.
Recreation Peoria is home to Lake Pleasant Regional Park, a desert reservoir of more than 10,000 acres of water and 13,600 acres of land. In addition to being a full-service facility offering rental watercrafts, boat slips, fishing supplies, and sunset dinner cruises, the lake is the perfect place for water sports, desert camping, hiking and wildlife watching. Rio Vista Community Park is a 52-acre park in the heart of Peoria that boasts an urban fishing lake, top notch skate park, volleyball and softball fields, batting cages, armadas, and a state-of-the-art recreation facility.

74 www.usworks.com/westmarc
Included in the City's overall Master Plan is the integration of a trails system that will link north and south Peoria. Whether leisurely strolling in a riverbed, exploring an ancient civilization or climbing a challenging mountain trail, Peoria has you connected to the outdoors.
Dining The Arrowhead Entertainment District’s “Restaurant Row” boasts one of the highest concentrations of restaurants in the region. Restaurants serving a wide variety of cuisine, sports bars, live music and dancing, are abundant and within walking distance from Peoria Sports Complex.
Shopping Diverse shopping centers are scattered throughout Peoria. The new Park West offers an upscale shopping experience in a “lifestyle and entertainment” environment. Over 2 million square feet of retail space is also under development in northern Peoria in Cibola Vista Commercial Centre and along Lake Pleasant Parkway. Industries in Peoria
Source: InfoUSA and Advanced Workforce
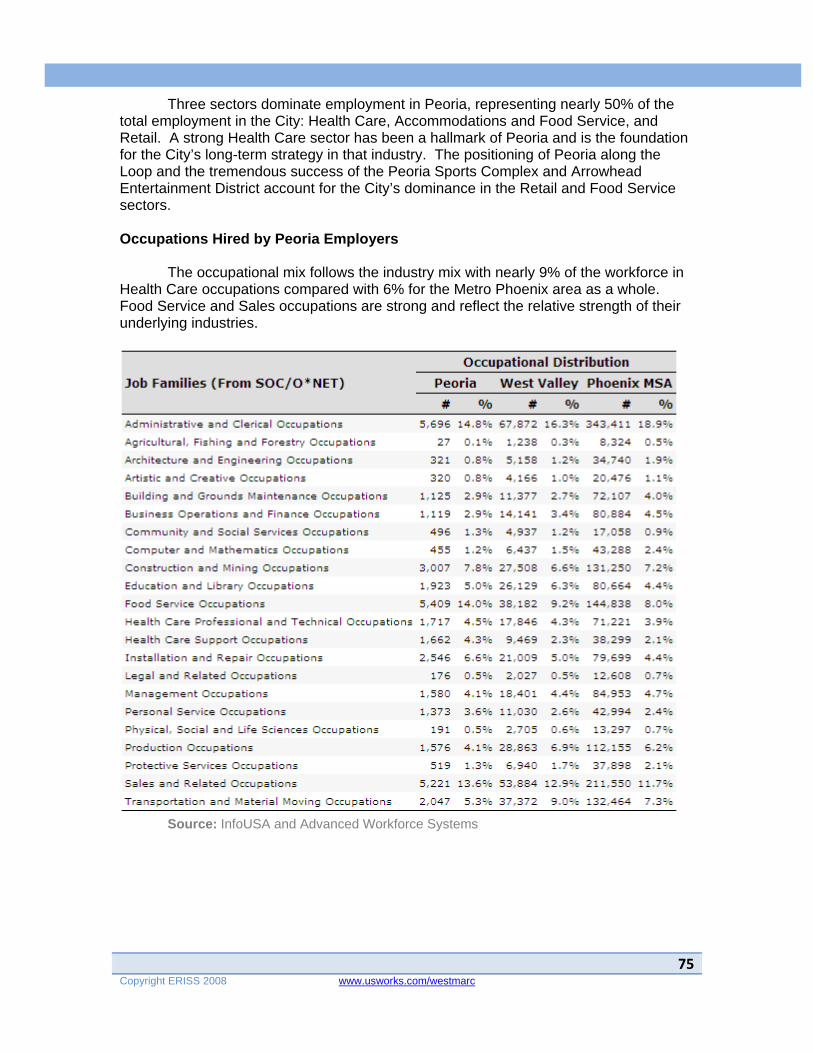
75Copyright ERISS 2008 www.usworks.com/westmarc
Three sectors dominate employment in Peoria, representing nearly 50% of the total employment in the City: Health Care, Accommodations and Food Service, and Retail. A strong Health Care sector has been a hallmark of Peoria and is the foundation for the City’s long-term strategy in that industry. The positioning of Peoria along the Loop and the tremendous success of the Peoria Sports Complex and Arrowhead Entertainment District account for the City’s dominance in the Retail and Food Service sectors. Occupations Hired by Peoria Employers The occupational mix follows the industry mix with nearly 9% of the workforce in Health Care occupations compared with 6% for the Metro Phoenix area as a whole. Food Service and Sales occupations are strong and reflect the relative strength of their underlying industries.
Source: InfoUSA and Advanced Workforce Systems
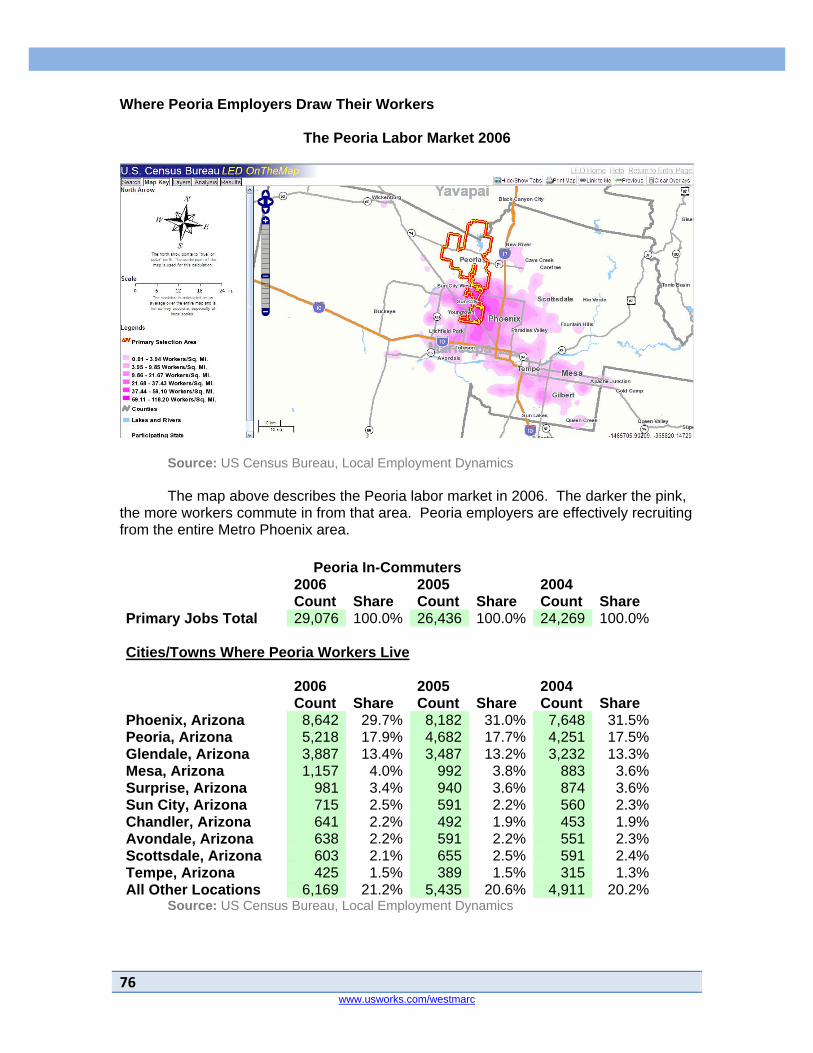
76 www.usworks.com/westmarc
Where Peoria Employers Draw Their Workers
The Peoria Labor Market 2006
Source: US Census Bureau, Local Employment Dynamics The map above describes the Peoria labor market in 2006. The darker the pink, the more workers commute in from that area. Peoria employers are effectively recruiting from the entire Metro Phoenix area.
Peoria In-Commuters 2006 2005 2004 Count Share Count Share Count Share Primary Jobs Total 29,076 100.0% 26,436 100.0% 24,269 100.0% Cities/Towns Where Peoria Workers Live 2006 2005 2004 Count Share Count Share Count Share Phoenix, Arizona 8,642 29.7% 8,182 31.0% 7,648 31.5% Peoria, Arizona 5,218 17.9% 4,682 17.7% 4,251 17.5% Glendale, Arizona 3,887 13.4% 3,487 13.2% 3,232 13.3% Mesa, Arizona 1,157 4.0% 992 3.8% 883 3.6% Surprise, Arizona 981 3.4% 940 3.6% 874 3.6% Sun City, Arizona 715 2.5% 591 2.2% 560 2.3% Chandler, Arizona 641 2.2% 492 1.9% 453 1.9% Avondale, Arizona 638 2.2% 591 2.2% 551 2.3% Scottsdale, Arizona 603 2.1% 655 2.5% 591 2.4% Tempe, Arizona 425 1.5% 389 1.5% 315 1.3% All Other Locations 6,169 21.2% 5,435 20.6% 4,911 20.2%
Source: US Census Bureau, Local Employment Dynamics
77Copyright ERISS 2008 www.usworks.com/westmarc
The metropolitan Phoenix area is very fluid: strong transportation and freeway accessibility make for simple and relatively short commutes. As a result, only 18% of Peoria residents work in Peoria. The bulk of the workers in Peoria commute in from surrounding cities. And while the remaining residents commute to other communities in the West Valley, nearly 40% travel to the East Valley everyday to work. A profile of the Peoria residents that commute to the East Valley is given below.
Peoria Commuters to the East Valley 2006 2005 Count Share Count Share Total Primary Jobs 10,624 100.0% 9,954 100.0% Jobs by Worker Age 2006 2005 Count Share Count Share Age 30 or younger 3,576 33.7% 3,123 31.4% Age 31 to 54 5,774 54.3% 5,583 56.1% Age 55 or older 1,274 12.0% 1,248 12.5% Jobs by Earnings Paid 2006 2005 Count Share Count Share $1,200 per month or less 2,404 22.6% 2,312 23.2% $1,201 to $3,400 per month 4,062 38.2% 3,863 38.8% More than $3,400 per month 4,158 39.1% 3,779 38.0% Jobs by Industry Type 2006 2005 Count Share Count Share Goods Producing 2,019 19.0% 1,766 17.7% Trade, Transportation, and Utilities 2,632 24.8% 2,553 25.6% All Other Services 5,973 56.2% 5,635 56.6%
Source: US Census Bureau, Local Employment Dynamics For additional information on Peoria contact: City of Peoria Economic Development Department 8401 W. Monroe St. Room 190 Peoria, AZ 85345 Phone: (623) 773-7735 Fax: (623) 773-7519 www.peoriaaz.com/

78 www.usworks.com/westmarc
West Phoenix
Overview
The West Valley and West Phoenix
The Phoenix area is known as the Valley of the Sun and is commonly divided by locals into East and West Valleys. The City of Phoenix is in the center of the valley and the portion of the City west of the I-17 expressway is generally included in the West Valley. While much of this narrative speaks to the City as a whole, the charts and tables at the end of this section apply only to the portions of the City to the west of I-17. The labor market maps will further divide West Phoenix north and south using Camelback Road as the dividing line.
Phoenix – Past and Present
The early economy of Phoenix was primarily agricultural, dependent mainly on cotton and citrus farming. In the last two decades, the economy has diversified as swiftly as the population has grown. As the state capital of Arizona, many residents in the area are employed by the government. Arizona State University has also enhanced the area's population through education and its growing research capabilities. Due to the warm climate in winter, Phoenix benefits greatly from seasonal tourism and recreation, and has a particularly vibrant golf industry.
Phoenix is currently home to major Fortune 1000 companies such as: Waste Management, Inc., Republic Services, Inc., Avnet, Apollo Group (which operates the University of Phoenix), mining company Freeport-McMoRan (recently merged with Phoenix based Phelps Dodge), retailer PetSmart, energy supplier Pinnacle West and retailer CSK Auto. Honeywell's Aerospace division is headquartered in Phoenix, and the valley hosts many of their avionics and mechanical facilities. American Express hosts their financial transactions, customer information, and their entire website in Phoenix. Phoenix is also home to the headquarters of U-HAUL International, a rental company and moving supply store. Best Western, an international hotel chain, is also headquartered in the city.
In recent years many Internet companies have found a home in Phoenix. Internet companies like eBay, GoDaddy.com, and IPowerWeb all have major offices located in Phoenix.

79Copyright ERISS 2008 www.usworks.com/westmarc
Culture and Lifestyle
Phoenix and the surrounding area are home to a broad range of cultural activities including the performing arts, museums, and events.
Performing Arts
Several music venues take place around Arizona, but primarily in and around downtown Phoenix and in Scottsdale. One such venue is the Phoenix Symphony Hall, where performances from groups such as Arizona Opera and Ballet Arizona often occur. Another venue is the Orpheum Theatre (Phoenix) which is home to the Phoenix Metropolitan Opera. Concerts also regularly make stops in the area. Venues for concerts include the US Airways Center in downtown Phoenix and the Dodge Theater (also in downtown Phoenix). Since 2002, Phoenix has also seen a rapid growth in local arts through The Artlink Program. Several smaller theatres including Trunk Space, Space 55 and Modified Arts support regular independent musical and theatre performances.
Museums
Several museums are scattered around the valley. One of the most well-known museums in the area is the Heard Museum just north of downtown. It has over 130,000 square feet of gallery, classroom and performance space. Some of the signature exhibits include a full Navajo hogan, the Barry Goldwater Collection of 437 historic Hopi kachina dolls, and an exhibit on the 19th century boarding school experiences of Native Americans. The Heard Museum attracts about 250,000 visitors a year.
Other notable museums include the Arizona Science Center, Hall of Flame Fire Museum, Phoenix Museum of History, the Phoenix Zoo, and the Pueblo Grande Museum and Archaeological Park.
Fine Arts
The downtown Phoenix art scene has also developed significantly in the past decade. The Artlink organization and the multitude of galleries downtown have successfully launched a First Friday’s art walk.

80 www.usworks.com/westmarc
Industries in West Phoenix (west of I-17)
Source: InfoUSA and Advanced Workforce Systems
The portion of Phoenix west of I-17 has a very heavy concentration of Manufacturing, Wholesale Distribution and Transportation employment and a relatively weaker Health Care and Food Service sector. The Retail sector, despite having nearly 20% of the firms and 13% of the employment, was on par with Retail sectors in the rest of the Metro Phoenix area. Nearly half of all employment in the West Valley is located in that portion of Phoenix west of I-17.
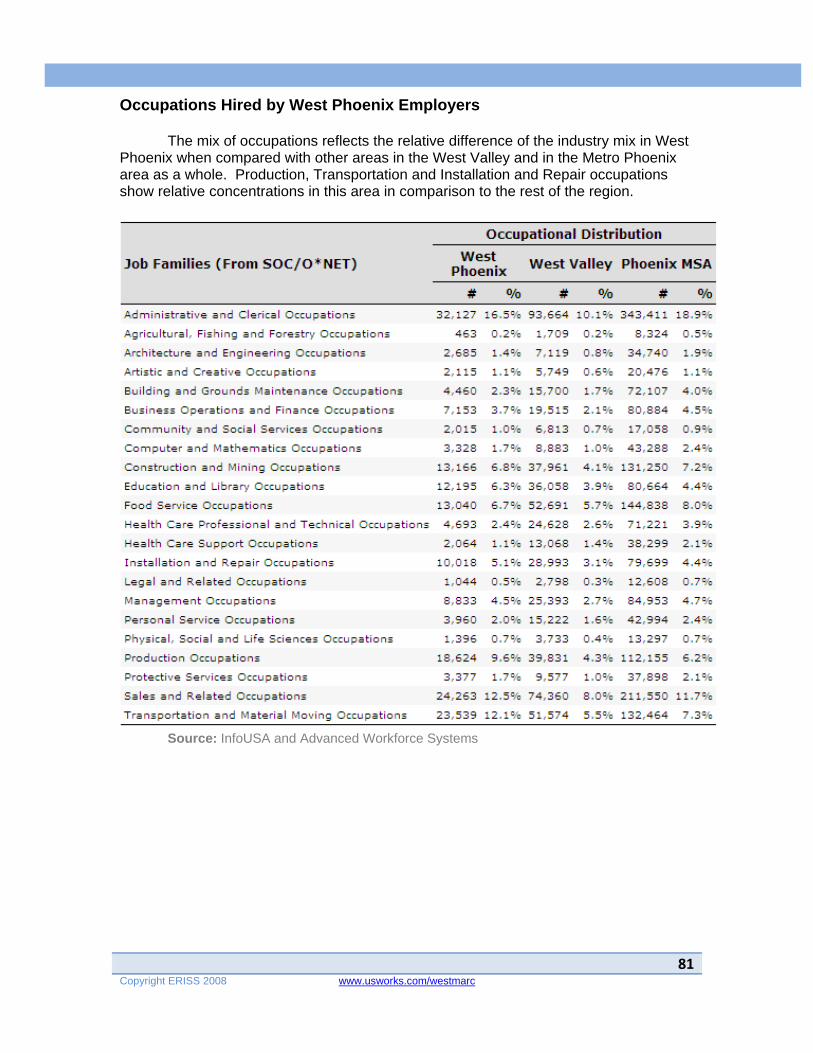
81Copyright ERISS 2008 www.usworks.com/westmarc
Occupations Hired by West Phoenix Employers The mix of occupations reflects the relative difference of the industry mix in West Phoenix when compared with other areas in the West Valley and in the Metro Phoenix area as a whole. Production, Transportation and Installation and Repair occupations show relative concentrations in this area in comparison to the rest of the region.
Source: InfoUSA and Advanced Workforce Systems

82 www.usworks.com/westmarc
Where West Phoenix Employers Draw Their Workers
The Northwest Phoenix Labor Market 2006
Source: US Census Bureau, Local Employment Dynamics
Note: The red/yellow areas are the city of Phoenix west of I-17 and north of Camelback Road. The pink thermals indicate the density of the areas of commuter origin for those employed in Northwest Phoenix. The Census LED database includes wage record data from quarterly reports filed by most employers as part of their unemployment insurance tax returns. Each of the wage records are tied to a specific employer and work location. The wage record is further enhanced with place of residence data for every worker. The commuting maps and related data displays come from an analysis of those individual data elements.

83Copyright ERISS 2008 www.usworks.com/westmarc
The Southwest Phoenix Labor Market 2006
Source: US Census Bureau, Local Employment Dynamics
Note: The red/yellow areas are the city of Phoenix west of I-17 and south of Camelback Road. The pink thermals indicate the density of the areas of commuter origin for those employed in Southwest Phoenix.
Phoenix West of I-17 In-Commuters 2006 2005 2004 Count Share Count Share Count Share Total Primary Jobs 244,797 100.0% 234,012 100.0% 216,161 100.0% Cities/Towns Where West Phoenix Workers Live 2006 2005 2004 Count Share Count Share Count Share Phoenix, Arizona 107,341 43.8% 103,435 44.2% 97,764 45.2% Glendale, Arizona 20,131 8.2% 19,765 8.4% 18,573 8.6% Mesa, Arizona 17,632 7.2% 16,164 6.9% 15,320 7.1% Chandler, Arizona 11,548 4.7% 10,799 4.6% 9,840 4.6% Peoria, Arizona 10,959 4.5% 10,712 4.6% 9,561 4.4% Tempe, Arizona 8,361 3.4% 8,128 3.5% 7,447 3.4% Scottsdale, Arizona 7,515 3.1% 7,584 3.2% 6,542 3.0% Gilbert, Arizona 6,557 2.7% 6,742 2.9% 5,816 2.7% Avondale, Arizona 5,696 2.3% 5,221 2.2% 4,593 2.1% Tucson, Arizona 4,639 1.9% 4,262 1.8% 3,977 1.8% All Other Locations 44,418 18.1% 41,200 17.6% 36,728 17.0%
Source: US Census Bureau, Local Employment Dynamics
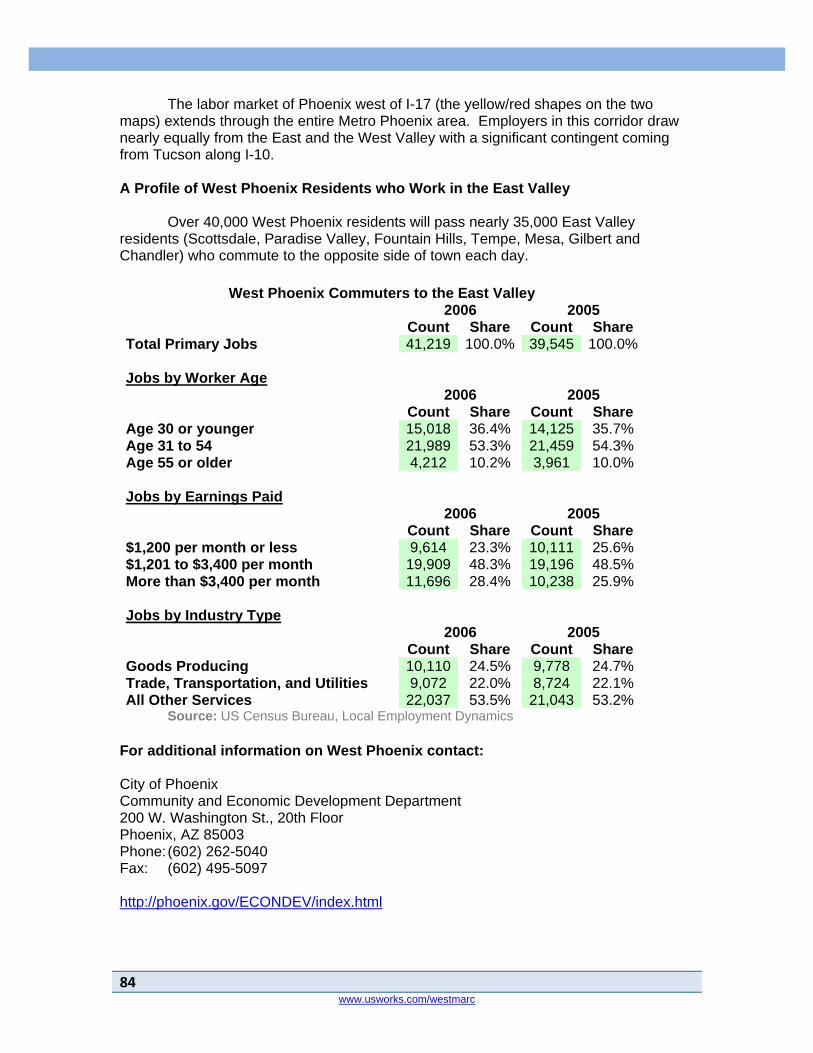
84 www.usworks.com/westmarc
The labor market of Phoenix west of I-17 (the yellow/red shapes on the two maps) extends through the entire Metro Phoenix area. Employers in this corridor draw nearly equally from the East and the West Valley with a significant contingent coming from Tucson along I-10. A Profile of West Phoenix Residents who Work in the East Valley Over 40,000 West Phoenix residents will pass nearly 35,000 East Valley residents (Scottsdale, Paradise Valley, Fountain Hills, Tempe, Mesa, Gilbert and Chandler) who commute to the opposite side of town each day.
West Phoenix Commuters to the East Valley 2006 2005 Count Share Count Share Total Primary Jobs 41,219 100.0% 39,545 100.0% Jobs by Worker Age 2006 2005 Count Share Count Share Age 30 or younger 15,018 36.4% 14,125 35.7% Age 31 to 54 21,989 53.3% 21,459 54.3% Age 55 or older 4,212 10.2% 3,961 10.0% Jobs by Earnings Paid 2006 2005 Count Share Count Share $1,200 per month or less 9,614 23.3% 10,111 25.6% $1,201 to $3,400 per month 19,909 48.3% 19,196 48.5% More than $3,400 per month 11,696 28.4% 10,238 25.9% Jobs by Industry Type 2006 2005 Count Share Count Share Goods Producing 10,110 24.5% 9,778 24.7% Trade, Transportation, and Utilities 9,072 22.0% 8,724 22.1% All Other Services 22,037 53.5% 21,043 53.2%
Source: US Census Bureau, Local Employment Dynamics For additional information on West Phoenix contact: City of Phoenix Community and Economic Development Department 200 W. Washington St., 20th Floor Phoenix, AZ 85003 Phone: (602) 262-5040 Fax: (602) 495-5097 http://phoenix.gov/ECONDEV/index.html

85Copyright ERISS 2008 www.usworks.com/westmarc
Sun City
Overview Sun City (founded 1960) is one of the largest retirement communities in the nation and is world-famous for its active, resort retirement lifestyle that has set the standard for other retirement communities to follow. The town is unincorporated and depends on Maricopa County for services such as law enforcement, street repairs and zoning protection. Sun City boasts eleven golf courses (including the Hillcrest public course, the site of Senior PGA and LPGA tour events, and the Desert Trails course, designed by golf legend Billy Casper and course architect Greg Nash) and seven recreation centers which provide swimming, tennis, bowling and a myriad of other activities. Volunteerism is strong in Sun City. The Sun City Prides is a nonprofit corporation which assists Maricopa County in keeping Sun City clean. The group has more than 300 members who help maintain the beauty of the 217 miles of streets and medians in the community. Industries in Sun City
Source: InfoUSA and Advanced Workforce

86 www.usworks.com/westmarc
The employment picture in Sun City is heavily impacted by the presence of the Sun Health/Banner Health facilities in the community. They are such large employers that they generate a Health Care sector with more than 50% of the total employment. The Arts, Entertainment and Recreation sector contains over 5% of the total employment (West Valley and Phoenix MSA percentages are 1.7 and 1.9 respectively). That reflects the original concept of this Del Webb community with its focus on retirement and leisure activity. The multiple golf courses and other recreational facilities would be found in this sector. Occupations Hired by Sun City Employers The occupational mix of Sun City reflects the heavily health care mix of the community’s industry base. The two Health Care occupational categories (professional and technical and health care support) represent nearly one third of all employment; more than 5 times the amount found in the rest of the West Valley or in the Metro Phoenix area.
Source: InfoUSA and Advanced Workforce Systems

87Copyright ERISS 2008 www.usworks.com/westmarc
Where Sun City Employers Draw Their Workers
The Sun City Labor Market 2006
Source: US Census Bureau, Local Employment Dynamics
Sun City (represented by the red/yellow area) draws workers from all over the Metro Phoenix area but most heavily from other West Valley communities.
Sun City In-Commuters 2006 2005 2004 Count Share Count Share Count Share Total Primary Jobs 10,518 100.0% 10,044 100.0% 10,221 100.0% Cities/Towns Where Sun City Workers Live 2006 2005 2004 Count Share Count Share Count Share Phoenix, Arizona 2,255 21.4% 2,095 20.9% 2,243 21.9% Peoria, Arizona 1,967 18.7% 1,840 18.3% 1,906 18.6% Glendale, Arizona 1,371 13.0% 1,395 13.9% 1,411 13.8% Surprise, Arizona 1,135 10.8% 1,057 10.5% 1,067 10.4% Sun City, Arizona 1,013 9.6% 1,012 10.1% 1,028 10.1% El Mirage, Arizona 347 3.3% 282 2.8% 291 2.8% Avondale, Arizona 269 2.6% 262 2.6% 240 2.3% Sun City West, Arizona 247 2.3% 231 2.3% 244 2.4% Goodyear, Arizona 196 1.9% 181 1.8% 179 1.8% Youngtown, Arizona 172 1.6% 164 1.6% 143 1.4% All Other Locations 1,546 14.7% 1,525 15.2% 1,469 14.4%
Source: US Census Bureau, Local Employment Dynamics

88 www.usworks.com/westmarc
A Profile of Sun City Residents who Work in the East Valley Even though Sun City was founded as a retirement community, it might be more accurate to see it as an active older adult community. Over 500 workers over the age of 55 still make the commute each day from Sun City to the East Valley (Scottsdale, Paradise Valley, Fountain Hills, Tempe, Mesa, Gilbert and Chandler). This is the largest fraction of older workers in the East Valley commute stream of any West Valley community.
Sun City Commuters to the East Valley 2006 2005 Count Share Count Share Total Primary Jobs 1,391 100.0% 1,301 100.0% Jobs by Worker Age 2006 2005 Count Share Count Share Age 30 or younger 312 22.4% 286 22.0% Age 31 to 54 553 39.8% 508 39.0% Age 55 or older 526 37.8% 507 39.0% Jobs by Earnings Paid 2006 2005 Count Share Count Share $1,200 per month or less 354 25.4% 363 27.9% $1,201 to $3,400 per month 577 41.5% 566 43.5% More than $3,400 per month 460 33.1% 372 28.6% Jobs by Industry Type 2006 2005 Count Share Count Share Goods Producing 233 16.8% 225 17.3% Trade, Transportation, and Utilities 356 25.6% 369 28.4% All Other Services 802 57.7% 707 54.3%
Source: US Census Bureau, Local Employment Dynamics For additional information on Sun City contact: Sun City Visitors Center 16824 N 99th Ave. Sun City, AZ 85351 Phone: (623) 977-5000 www.suncityaz.org/
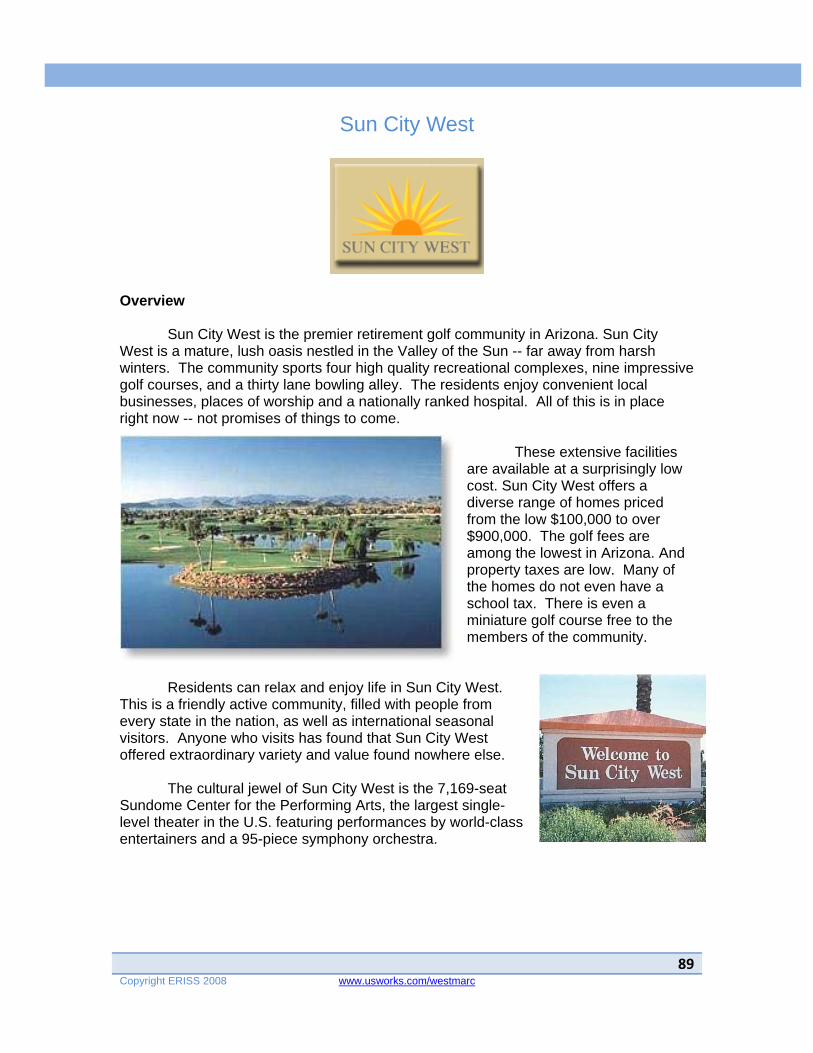
89Copyright ERISS 2008 www.usworks.com/westmarc
Sun City West
Overview Sun City West is the premier retirement golf community in Arizona. Sun City West is a mature, lush oasis nestled in the Valley of the Sun -- far away from harsh winters. The community sports four high quality recreational complexes, nine impressive golf courses, and a thirty lane bowling alley. The residents enjoy convenient local businesses, places of worship and a nationally ranked hospital. All of this is in place right now -- not promises of things to come.
These extensive facilities are available at a surprisingly low cost. Sun City West offers a diverse range of homes priced from the low $100,000 to over $900,000. The golf fees are among the lowest in Arizona. And property taxes are low. Many of the homes do not even have a school tax. There is even a miniature golf course free to the members of the community.
Residents can relax and enjoy life in Sun City West. This is a friendly active community, filled with people from every state in the nation, as well as international seasonal visitors. Anyone who visits has found that Sun City West offered extraordinary variety and value found nowhere else. The cultural jewel of Sun City West is the 7,169-seat Sundome Center for the Performing Arts, the largest single-level theater in the U.S. featuring performances by world-class entertainers and a 95-piece symphony orchestra.

90 www.usworks.com/westmarc
Industries in Sun City West Like its development cousin, Sun City West has a dominant Health Care sector followed by a very large other services sector. Much of the Retail and Food Services sector that serves Sun City West is located outside of its boundaries.
Source: InfoUSA and Advanced Workforce Systems
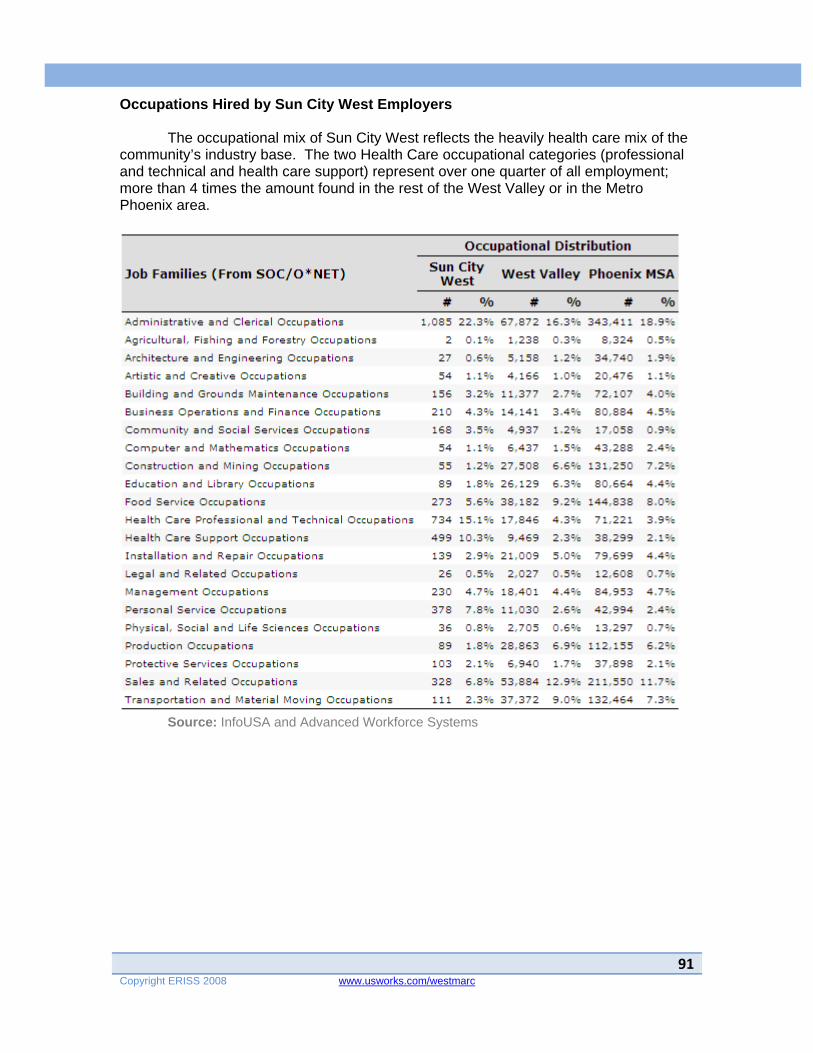
91Copyright ERISS 2008 www.usworks.com/westmarc
Occupations Hired by Sun City West Employers The occupational mix of Sun City West reflects the heavily health care mix of the community’s industry base. The two Health Care occupational categories (professional and technical and health care support) represent over one quarter of all employment; more than 4 times the amount found in the rest of the West Valley or in the Metro Phoenix area.
Source: InfoUSA and Advanced Workforce Systems
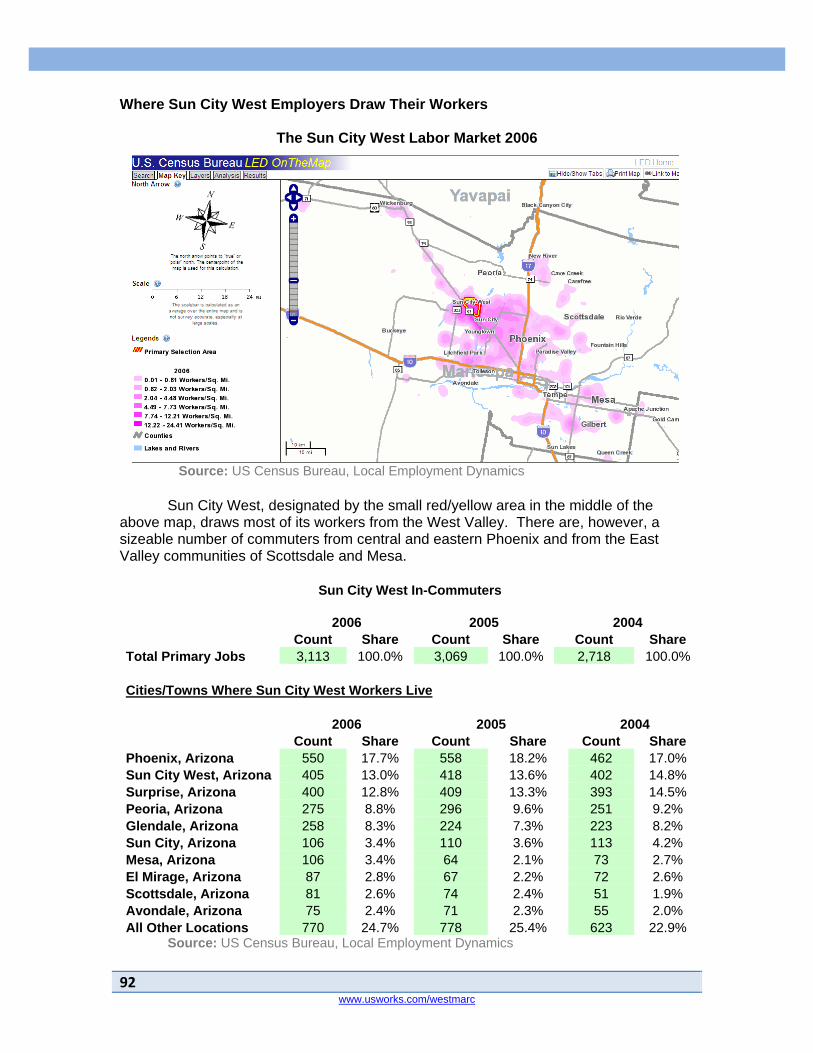
92 www.usworks.com/westmarc
Where Sun City West Employers Draw Their Workers
The Sun City West Labor Market 2006
Source: US Census Bureau, Local Employment Dynamics Sun City West, designated by the small red/yellow area in the middle of the above map, draws most of its workers from the West Valley. There are, however, a sizeable number of commuters from central and eastern Phoenix and from the East Valley communities of Scottsdale and Mesa.
Sun City West In-Commuters
2006 2005 2004 Count Share Count Share Count Share Total Primary Jobs 3,113 100.0% 3,069 100.0% 2,718 100.0% Cities/Towns Where Sun City West Workers Live 2006 2005 2004 Count Share Count Share Count Share Phoenix, Arizona 550 17.7% 558 18.2% 462 17.0% Sun City West, Arizona 405 13.0% 418 13.6% 402 14.8% Surprise, Arizona 400 12.8% 409 13.3% 393 14.5% Peoria, Arizona 275 8.8% 296 9.6% 251 9.2% Glendale, Arizona 258 8.3% 224 7.3% 223 8.2% Sun City, Arizona 106 3.4% 110 3.6% 113 4.2% Mesa, Arizona 106 3.4% 64 2.1% 73 2.7% El Mirage, Arizona 87 2.8% 67 2.2% 72 2.6% Scottsdale, Arizona 81 2.6% 74 2.4% 51 1.9% Avondale, Arizona 75 2.4% 71 2.3% 55 2.0% All Other Locations 770 24.7% 778 25.4% 623 22.9%
Source: US Census Bureau, Local Employment Dynamics

93Copyright ERISS 2008 www.usworks.com/westmarc
A Profile of Sun City West Residents who Work in the East Valley As is true for most of the communities in the West Valley, there are more residents of Sun City West making the trek to the East Valley (Scottsdale, Paradise Valley, Fountain Hills, Tempe, Mesa, Gilbert and Chandler) each day than who stay and work in Sun City West. These out-commuters are a bit older than the average for the West Valley and like most of their compatriots are employed in the service industries.
Sun City West Commuters to the East Valley
2006 2005 Count Share Count Share Total Primary Jobs 684 100.0% 676 100.0% Jobs by Worker Age 2006 2005 Count Share Count Share Age 30 or younger 130 19.0% 88 13.0% Age 31 to 54 293 42.8% 298 44.1% Age 55 or older 261 38.2% 290 42.9% Jobs by Earnings Paid 2006 2005 Count Share Count Share $1,200 per month or less 202 29.5% 179 26.5% $1,201 to $3,400 per month 282 41.2% 301 44.5% More than $3,400 per month 200 29.2% 196 29.0% Jobs by Industry Type 2006 2005 Count Share Count Share Goods Producing 100 14.6% 130 19.2% Trade, Transportation, and Utilities 205 30.0% 178 26.3% All Other Services 379 55.4% 368 54.4%
Source: US Census Bureau, Local Employment Dynamics For additional information on Sun City West contact: Sun City West Visitors Center 13815 Camino del Sol Sun City West, AZ 85375 (623) 214-8629 http://suncitywest.org/
94 www.usworks.com/westmarc
Surprise
Overview
From a Single Development to Over 100,000 Residents
The city was founded in 1938 by real estate developer and State Legislator Homer C. Ludden, who named it after his hometown of Surprise, Nebraska. Although there were only a few houses and a gas station on the one-mile-square parcel of land when Ludden subdivided it to build inexpensive houses for agricultural workers, Surprise has experienced tremendous growth in the years since it incorporated as a city in 1960.
Today Surprise is one of the 10 most populous cities in Arizona.
Tens of thousands of retirees moved to the city in the 1990s and early 2000s to live in Sun City Grand, an age-restricted resort-like community, with homes built by the property development firm Del Webb. Thirty-two of the state's top 50 homebuilders cater to new homebuyers, who are attracted by the city's modestly-priced homes, its relative proximity to Phoenix, and by the property taxes, which are among the lowest in the state. With the more recent influx of young families and their children moving into the community,
the median age in Surprise is only 36. City officials estimate the population is over 109,000 as of November 2008.. Extraordinary -- given that 25 years ago the city was home to less than 4,000 people.
The city is the spring training home of the Kansas City Royals and the Texas Rangers baseball teams. These Major League Baseball teams use Surprise Stadium for their activities. The city also hosts a variety of non-sporting events in downtown Surprise, which draw over 2 million people to the City’s core on an annual basis.
Surprise is one of the fastest growing communities in the United States and on a path to become a city of more than a half-million population. Opportunities for commercial, office, and industrial development are virtually unlimited with 10 new business parks and 12 retail centers either open, permitted or planned.

95Copyright ERISS 2008 www.usworks.com/westmarc
Industries in Surprise Surprise has a robust Retail and Food Service sector reflecting its own rapid growth and the support it provides to its neighbors in the Sun Cities. Unlike the active adult communities that are its immediate neighbors, Surprise’s Education sector is on par with the rest of the West Valley.
Source: InfoUSA and Advanced Workforce Systems

96 www.usworks.com/westmarc
Occupations Hired by Surprise Employers The occupational mix in Surprise tracks the industry mix with significant employment in Sales, Education and Food Service occupations.
Source: InfoUSA and Advanced Workforce Systems
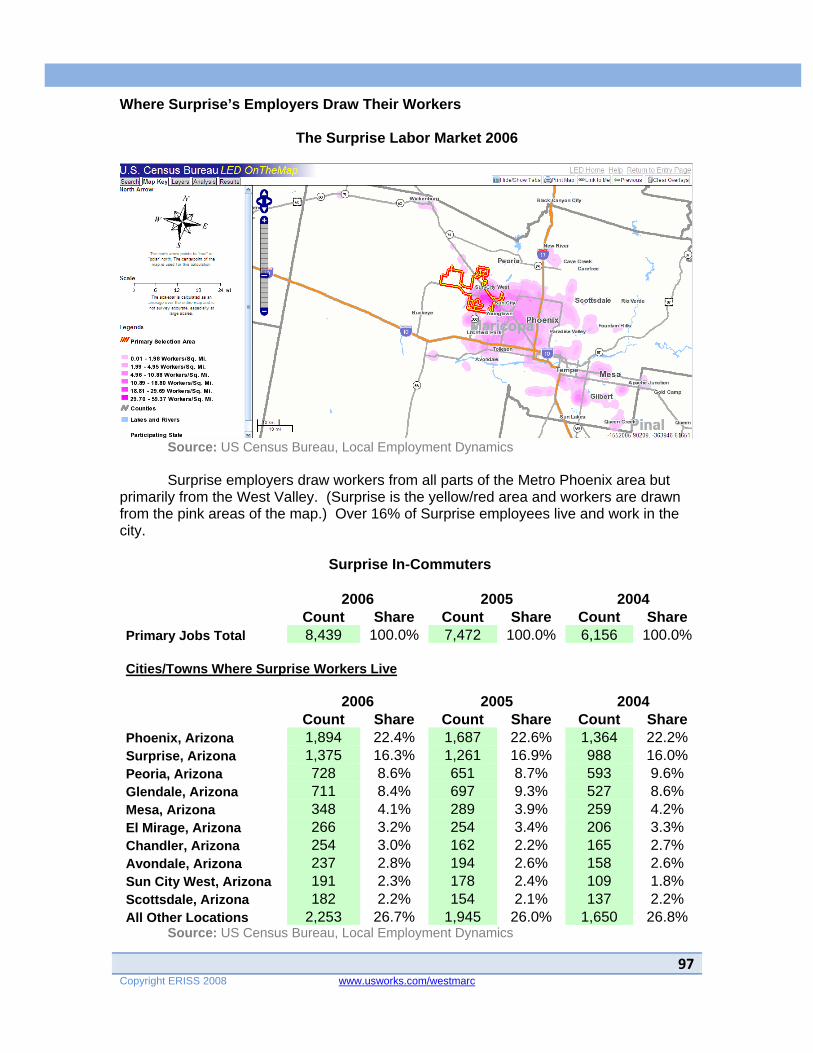
97Copyright ERISS 2008 www.usworks.com/westmarc
Where Surprise’s Employers Draw Their Workers
The Surprise Labor Market 2006
Source: US Census Bureau, Local Employment Dynamics
Surprise employers draw workers from all parts of the Metro Phoenix area but primarily from the West Valley. (Surprise is the yellow/red area and workers are drawn from the pink areas of the map.) Over 16% of Surprise employees live and work in the city.
Surprise In-Commuters
2006 2005 2004 Count Share Count Share Count Share Primary Jobs Total 8,439 100.0% 7,472 100.0% 6,156 100.0% Cities/Towns Where Surprise Workers Live 2006 2005 2004 Count Share Count Share Count Share Phoenix, Arizona 1,894 22.4% 1,687 22.6% 1,364 22.2% Surprise, Arizona 1,375 16.3% 1,261 16.9% 988 16.0% Peoria, Arizona 728 8.6% 651 8.7% 593 9.6% Glendale, Arizona 711 8.4% 697 9.3% 527 8.6% Mesa, Arizona 348 4.1% 289 3.9% 259 4.2% El Mirage, Arizona 266 3.2% 254 3.4% 206 3.3% Chandler, Arizona 254 3.0% 162 2.2% 165 2.7% Avondale, Arizona 237 2.8% 194 2.6% 158 2.6% Sun City West, Arizona 191 2.3% 178 2.4% 109 1.8% Scottsdale, Arizona 182 2.2% 154 2.1% 137 2.2% All Other Locations 2,253 26.7% 1,945 26.0% 1,650 26.8%
Source: US Census Bureau, Local Employment Dynamics
98 www.usworks.com/westmarc
A Profile of Surprise Residents who Work in the East Valley As is true across much of the West Valley, nearly twice the number of Surprise residents commutes to work in the East Valley (Scottsdale, Paradise Valley, Fountain Hills, Tempe, Mesa, Gilbert and Chandler) each day than stay to work in Surprise.
Surprise Commuters to the East Valley 2006 2005 Count Share Count Share Total Primary Jobs 2,724 100.0% 2,571 100.0% Jobs by Worker Age 2006 2005 Count Share Count Share Age 30 or younger 778 28.6% 746 29.0% Age 31 to 54 1,495 54.9% 1,375 53.5% Age 55 or older 451 16.6% 450 17.5% Jobs by Earnings Paid 2006 2005 Count Share Count Share $1,200 per month or less 605 22.2% 675 26.3% $1,201 to $3,400 per month 1,151 42.3% 1,086 42.2% More than $3,400 per month 968 35.5% 810 31.5% Jobs by Industry Type 2006 2005 Count Share Count Share Goods Producing 524 19.2% 457 17.8% Trade, Transportation, and Utilities 728 26.7% 695 27.0% All Other Services 1,472 54.0% 1,419 55.2%
Source: US Census Bureau, Local Employment Dynamics For additional information on Surprise contact: City of Surprise Economic Development Department 12425 W. Bell Rd. Surprise, AZ 85374 (623) 222-3300 www.surpriseaz.com/
99Copyright ERISS 2008 www.usworks.com/westmarc
Tolleson
Overview Tolleson is a self-contained community 10 miles west of downtown Phoenix. W.G. Tolleson of South Carolina founded the town in 1912. Tolleson measures about six square miles and was incorporated in 1929. Once dependent on agriculture, Tolleson today has a strong commercial and industrial base. The City of Tolleson has become a strong distribution hub for companies wishing to deliver products to southwestern markets. This is primarily due to its excellent location just south of the I-10 and the interchange with the new Loop 101. The city of Tolleson hosts several large employers, including Sunland Beef, Kroger’s, Albertson’s, Salt River Project, and Sysco Food Systems. In addition to distribution and food, fiber and natural products, the community has a strong manufacturing structure. Tolleson has a prime location along a major transportation corridor. Tolleson is served by the Papago Freeway, which is a segment of Interstate 10. The Union Pacific rail line runs through Tolleson, providing a number of industrial sites with rail access. Air transit is accomplished through the nearby Phoenix-Goodyear Municipal Airport and Phoenix's Sky Harbor International Airport, located approximately 20 - 25 minutes away. Tolleson has three city parks, a community center, five lighted ball parks, and numerous lighted basketball, tennis and racquetball courts. The West Valley Fine Arts Council also provides a variety of scheduled cultural events in Tolleson and the surrounding area. The nearby 19,000-acre Estrella Mountain Regional Park and 26,000-acre White Tank Regional Park offer numerous opportunities for outdoor recreation. Also just southwest of Tolleson is the Phoenix International Raceway (PIR), offering auto races including the Copperworld Classic, Phoenix 200 Indy, and NASCAR Winston Cup Phoenix 500.
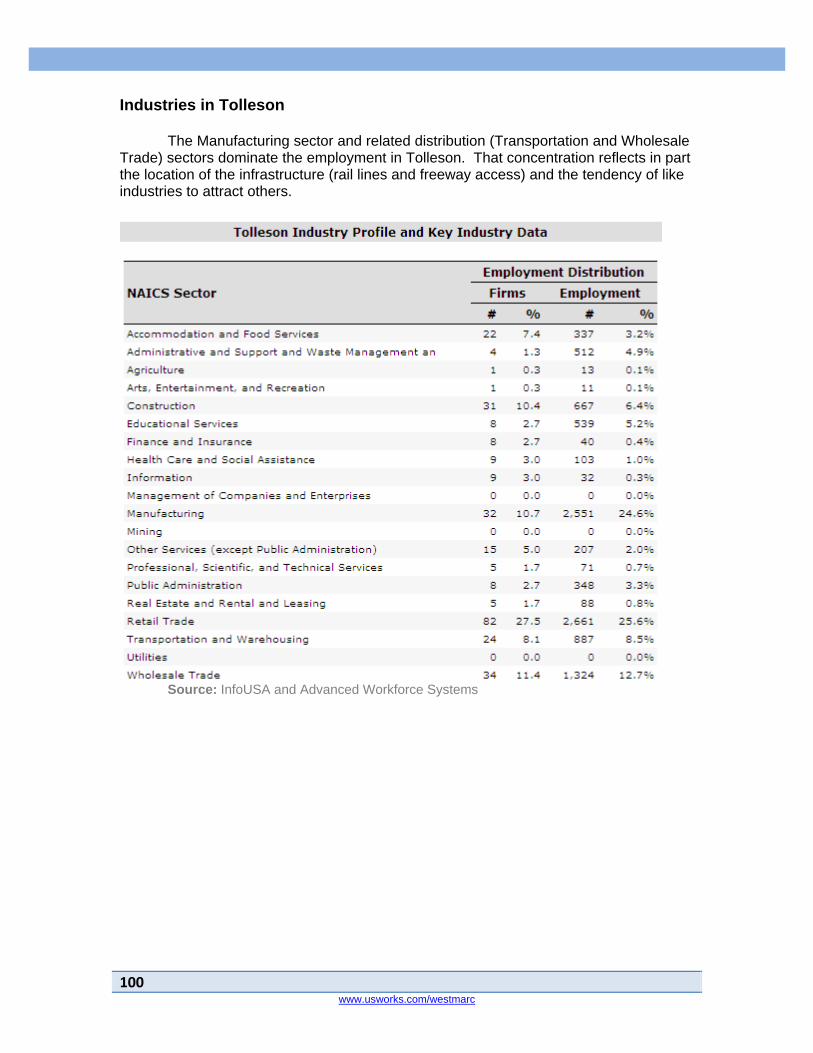
100 www.usworks.com/westmarc
Industries in Tolleson The Manufacturing sector and related distribution (Transportation and Wholesale Trade) sectors dominate the employment in Tolleson. That concentration reflects in part the location of the infrastructure (rail lines and freeway access) and the tendency of like industries to attract others.
Source: InfoUSA and Advanced Workforce Systems

101Copyright ERISS 2008 www.usworks.com/westmarc
Occupations Filled by Tolleson Employers The occupation mix is dominated by the Production and Material Moving occupations needed to service the Manufacturing and Transportation/Wholesale sectors of the local economy.
Source: InfoUSA and Advanced Workforce Systems

102 www.usworks.com/westmarc
Where Tolleson Employers Draw Their Workers
The Tolleson Labor Market 2006
Source: US Census Bureau, Local Employment Dynamics
With its prime location on the I-10 corridor, Tolleson employers are able to draw workers from the entire Metro Phoenix area. Just 3% of the employees in Tolleson firms live and work in Tolleson, the smallest percentage in the West Valley.
Tolleson In-Commuters 2006 2005 2004 Count Share Count Share Count Share Primary Jobs Total 11,522 100.0% 12,048 100.0% 11,238 100.0% Cities/Towns Where Tolleson Workers Live 2006 2005 2004 Count Share Count Share Count Share Phoenix, Arizona 4,923 42.7% 5,427 45.0% 5,335 47.5% Glendale, Arizona 1,038 9.0% 1,121 9.3% 1,088 9.7% Avondale, Arizona 875 7.6% 938 7.8% 839 7.5% Peoria, Arizona 596 5.2% 581 4.8% 491 4.4% Mesa, Arizona 529 4.6% 440 3.7% 405 3.6% Goodyear, Arizona 380 3.3% 451 3.7% 376 3.3% Tolleson, Arizona 348 3.0% 381 3.2% 324 2.9% Chandler, Arizona 284 2.5% 267 2.2% 236 2.1% Gilbert, Arizona 157 1.4% 154 1.3% 132 1.2% Tempe, Arizona 156 1.4% 176 1.5% 144 1.3% All Other Locations 2,236 19.4% 2,112 17.5% 1,868 16.6%
Source: US Census Bureau, Local Employment Dynamics

103Copyright ERISS 2008 www.usworks.com/westmarc
A Profile of Tolleson Residents who Work in the East Valley Despite the relatively easy commute, a very small number of Tolleson residents make the daily commute to jobs in the East Valley (Scottsdale, Paradise Valley, Fountain Hills, Tempe, Mesa, Gilbert and Chandler). In fact, the East Valley towns send nearly 3 times the number of workers to Tolleson than make the reverse commute.
Tolleson Commuters to the East Valley 2006 2005 Count Share Count Share Total Primary Jobs 304 100.0% 334 100.0% Jobs by Worker Age 2006 2005 Count Share Count Share Age 30 or younger 119 39.1% 137 41.0% Age 31 to 54 161 53.0% 166 49.7% Age 55 or older 24 7.9% 31 9.3% Jobs by Earnings Paid 2006 2005 Count Share Count Share $1,200 per month or less 70 23.0% 97 29.0% $1,201 to $3,400 per month 162 53.3% 171 51.2% More than $3,400 per month 72 23.7% 66 19.8% Jobs by Industry Type 2006 2005 Count Share Count Share Goods Producing 87 28.6% 104 31.1% Trade, Transportation, and Utilities 76 25.0% 71 21.3% All Other Services 141 46.4% 159 47.6%
Source: US Census Bureau, Local Employment Dynamics For additional information on Tolleson contact: Tolleson City Hall 9555 W. Van Buren St. Tolleson, AZ 85353 (623) 936-7111 www.tollesonaz.org/
104 www.usworks.com/westmarc
Wickenburg
Overview History Henry Wickenburg came to the area in search of gold. He was rewarded with the discovery of Vulture Mine, where over $30 million in gold was found. There are still relics around the area that stand as a tribute to these early adventurers as well as a walking tour around Vulture Mine. Ranchers and farmers discovered the fertile flood plain of the Hassayampa River and settled in the area. The Hassayampa River Preserve lets you escape to a literal oasis in the desert with lush, streamside habitat that includes many endangered birds and animals. Together with Henry Wickenburg, the miners, farmers and ranchers helped found the young community of Wickenburg in 1863. The Town of Wickenburg was incorporated in 1909.
It was a rough start for the town with Indian wars, mine closures, desperados, drought and a disastrous flood in 1890 when the Walnut Creek Dam burst. Despite these trials and tribulations the town continued to grow. In 1895 the railroad arrived in town. The historic depot still stands today as the Wickenburg Chamber of Commerce building. For a more indepth history or event information, please visit the Chamber of Commerce’s website at
www.wickenburgchamber.com. The Chamber has a self-guided walking tour of the downtown including the jail tree that once served at the town jail and 23 structures that are on the National Historical Register. For the past 57 years, the Gold Rush Days each February celebrate the town’s rich western heritage, with one of the largest parades in Arizona, gold panning and a rodeo. The Desert Caballeros Western Museum, filled with western art and frontier history, has been identified as "one of the finest small museums in the state, maybe in the nation". (Copley News Service).
Today Wickenburg is known for its clean air, wide-open spaces, guest ranches, tourism and medical services sector. It is the Dude Ranch Capital of Arizona with four ranches that still offer a unique Western experience ranging from a cozy adobe hacienda to a modern ranch resort complete with championship

105Copyright ERISS 2008 www.usworks.com/westmarc
golf course. Wickenburg is growing as a leader in the Health Care sector with Remuda Ranch, for eating disorders;, the Meadows, for treatment of addictions;, and Gatehouse Academy, for drug rehabilitation of young adults. The Del E. Webb Center for the Performing Arts is a state-of-the-art 600-seat theatre dedicated to enhancing the cultural richness of Wickenburg and all surrounding communities by presenting a variety of the finest performers. Throughout its history, the Center has presented a variety of performances ranging from internationally acclaimed pianist Olga Kern to cowboy poet Baxter Black to the hilarious musical production of Seven Brides for Seven Brothers. Industries in Wickenburg
Source: InfoUSA and Advanced Workforce Systems
The current industry mix reflects both the historic Wickenburg and the emerging one. Accommodations and Food Service and Retail sectors are critical and include some of the “real West” elements that still define the Wickenburg experience. The size of the Health Care and Wholesale sectors speak to the emerging economy in the area.

106 www.usworks.com/westmarc
Occupations Hired by Wickenburg Employers The occupational mix tracks with the industry mix with a strong group of Health Care workers, related Community and Social Service occupations, and Sales occupations.
Source: InfoUSA and Advanced Workforce Systems

107Copyright ERISS 2008 www.usworks.com/westmarc
Where Wickenburg Employers Draw Their Workers
The Wickenburg Labor Market 2006
Source: US Census Bureau, Local Employment Dynamics
The largest share of Wickenburg workers live in Wickenburg which is unusual for the West Valley but speaks to their position in the far northwest of the Valley. The rest are drawn from the West Valley with a small contingent from the East Valley.
Wickenburg In-Commuters 2006 2005 2004 Count Share Count Share Count Share Primary Jobs Total 3,175 100.0% 3,674 100.0% 3,205 100.0% Cities/Towns Where Wickenburg Area Workers Live 2006 2005 2004 Count Share Count Share Count Share Wickenburg, Arizona 967 30.5% 1,095 29.8% 1,020 31.8% Phoenix, Arizona 380 12.0% 484 13.2% 385 12.0% Sun City West, Arizona 229 7.2% 232 6.3% 202 6.3% Surprise, Arizona 186 5.9% 193 5.3% 173 5.4% Mesa, Arizona 144 4.5% 61 1.7% 44 1.4% Glendale, Arizona 144 4.5% 181 4.9% 125 3.9% Peoria, Arizona 90 2.8% 102 2.8% 116 3.6% Sun City, Arizona 46 1.4% 51 1.4% 34 1.1% Scottsdale, Arizona 36 1.1% 43 1.2% 24 0.7% Kingman, Arizona 36 1.1% 27 0.7% 23 0.7% All Other Locations 917 28.9% 1,205 32.8% 1,059 33.0%
Source: US Census Bureau, Local Employment Dynamics
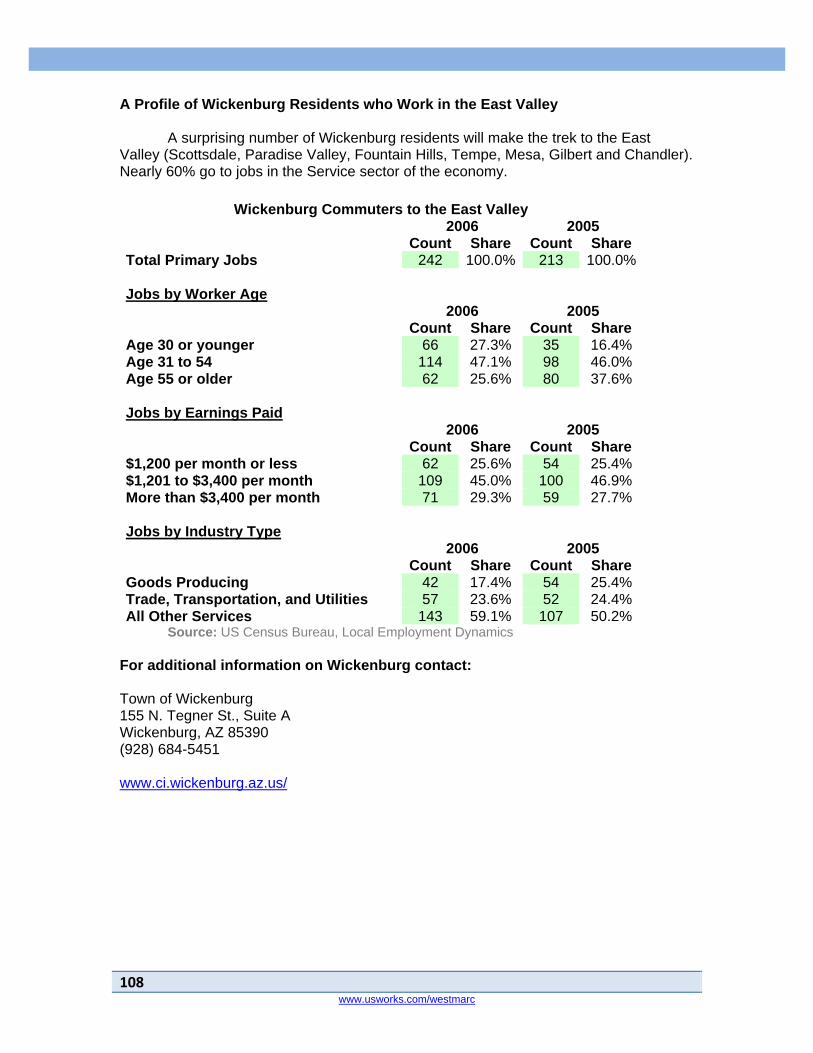
108 www.usworks.com/westmarc
A Profile of Wickenburg Residents who Work in the East Valley A surprising number of Wickenburg residents will make the trek to the East Valley (Scottsdale, Paradise Valley, Fountain Hills, Tempe, Mesa, Gilbert and Chandler). Nearly 60% go to jobs in the Service sector of the economy.
Wickenburg Commuters to the East Valley 2006 2005 Count Share Count Share Total Primary Jobs 242 100.0% 213 100.0% Jobs by Worker Age 2006 2005 Count Share Count Share Age 30 or younger 66 27.3% 35 16.4% Age 31 to 54 114 47.1% 98 46.0% Age 55 or older 62 25.6% 80 37.6% Jobs by Earnings Paid 2006 2005 Count Share Count Share $1,200 per month or less 62 25.6% 54 25.4% $1,201 to $3,400 per month 109 45.0% 100 46.9% More than $3,400 per month 71 29.3% 59 27.7% Jobs by Industry Type 2006 2005 Count Share Count Share Goods Producing 42 17.4% 54 25.4% Trade, Transportation, and Utilities 57 23.6% 52 24.4% All Other Services 143 59.1% 107 50.2%
Source: US Census Bureau, Local Employment Dynamics For additional information on Wickenburg contact: Town of Wickenburg 155 N. Tegner St., Suite A Wickenburg, AZ 85390 (928) 684-5451 www.ci.wickenburg.az.us/
109Copyright ERISS 2008 www.usworks.com/westmarc
Youngtown
Overview In 1954, real estate broker Ben Schleifer and banker Clarence Suggs formed Youngtown Land and Investment Co, and purchased 320 acres of cotton farmland. Together they built the first master-planned adult community exclusively for retirees - Youngtown, AZ. In 1960, Youngtown was incorporated and became the first city occupied exclusively by senior citizens. Another first for Youngtown was the formation of AARP Chapter 1 in 1960. In 1998, the age restriction was lifted, allowing all ages to reside in Youngtown. Since that time, Youngtown has grown but still enjoys the tranquil, small town feel while providing residents with five parks, a library, clubhouse, and a lake. Industries in Youngtown
Source: InfoUSA and Advanced Workforce Systems

110 www.usworks.com/westmarc
Youngtown employers are generally in businesses that provide direct services to Youngtown residents. Between the Health and Social Assistance sector and the Other Services (general personal services) sector, over 55% of the total employment is represented. Occupations Hired by Youngtown Employers The occupational mix in Youngtown reflects dominance of the two key industries (Health Care and other Services). There is strong representation in the two health categories and in the personal service occupations.
Source: InfoUSA and Advanced Workforce Systems
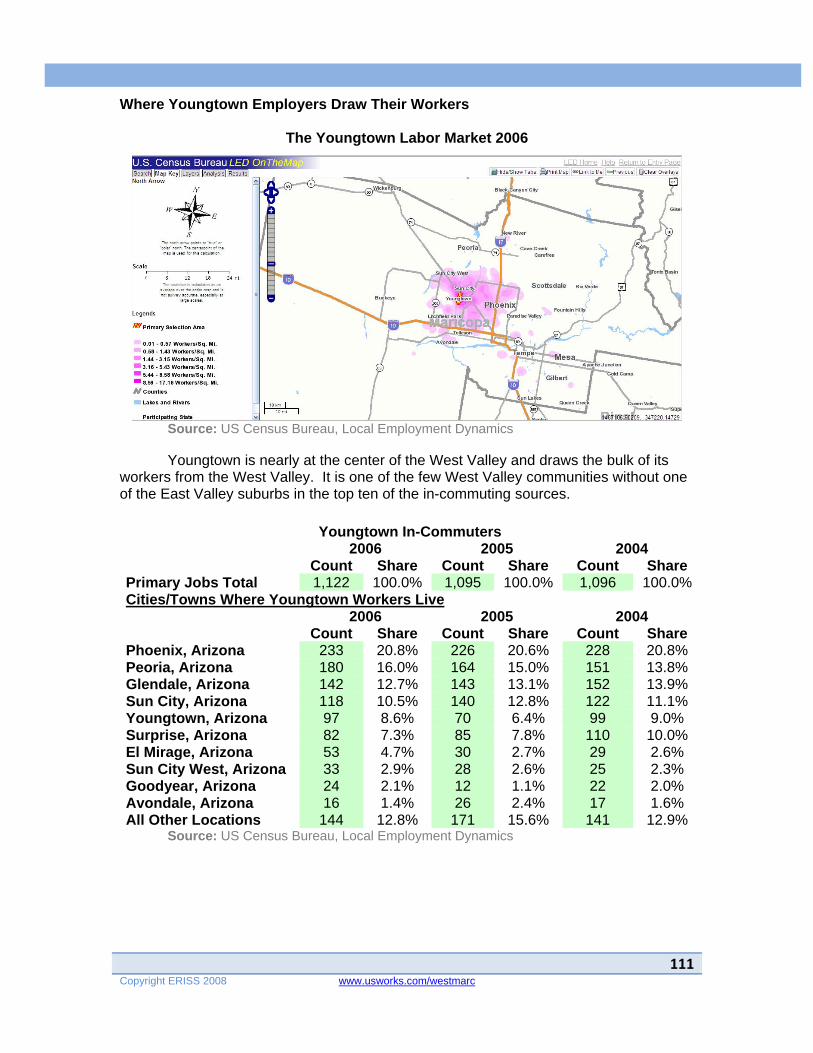
111Copyright ERISS 2008 www.usworks.com/westmarc
Where Youngtown Employers Draw Their Workers
The Youngtown Labor Market 2006
Source: US Census Bureau, Local Employment Dynamics Youngtown is nearly at the center of the West Valley and draws the bulk of its workers from the West Valley. It is one of the few West Valley communities without one of the East Valley suburbs in the top ten of the in-commuting sources.
Youngtown In-Commuters 2006 2005 2004 Count Share Count Share Count Share Primary Jobs Total 1,122 100.0% 1,095 100.0% 1,096 100.0% Cities/Towns Where Youngtown Workers Live 2006 2005 2004 Count Share Count Share Count Share Phoenix, Arizona 233 20.8% 226 20.6% 228 20.8% Peoria, Arizona 180 16.0% 164 15.0% 151 13.8% Glendale, Arizona 142 12.7% 143 13.1% 152 13.9% Sun City, Arizona 118 10.5% 140 12.8% 122 11.1% Youngtown, Arizona 97 8.6% 70 6.4% 99 9.0% Surprise, Arizona 82 7.3% 85 7.8% 110 10.0% El Mirage, Arizona 53 4.7% 30 2.7% 29 2.6% Sun City West, Arizona 33 2.9% 28 2.6% 25 2.3% Goodyear, Arizona 24 2.1% 12 1.1% 22 2.0% Avondale, Arizona 16 1.4% 26 2.4% 17 1.6% All Other Locations 144 12.8% 171 15.6% 141 12.9%
Source: US Census Bureau, Local Employment Dynamics
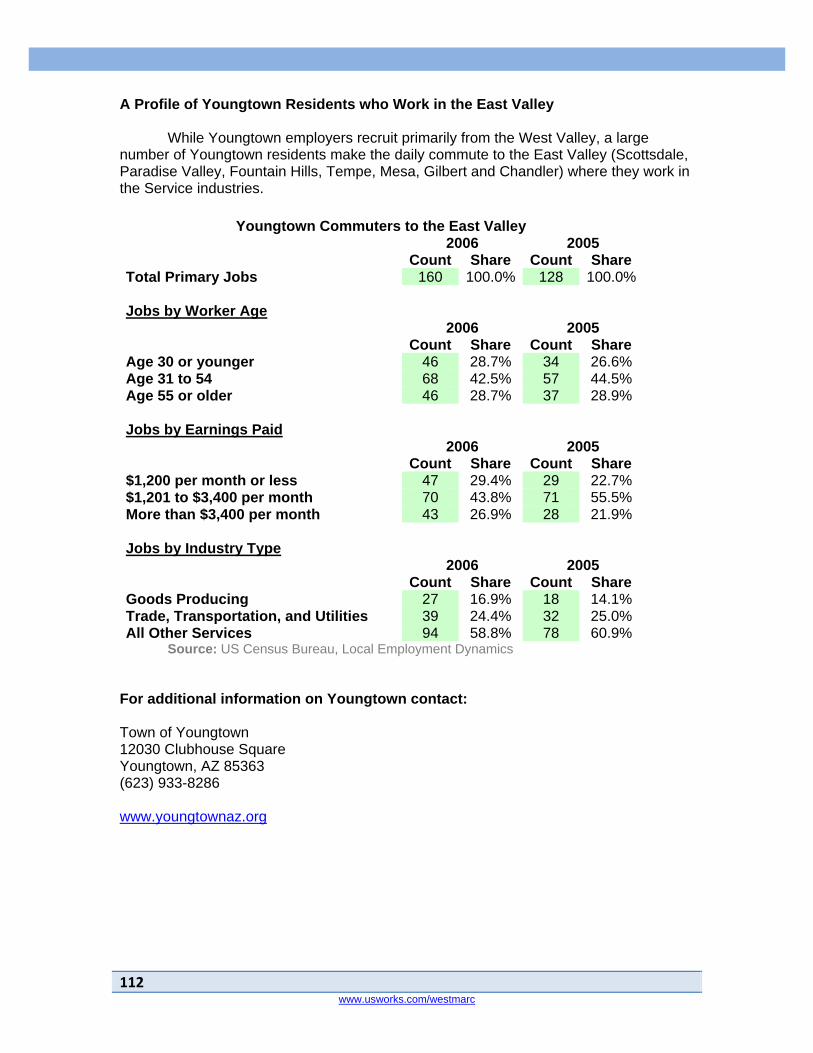
112 www.usworks.com/westmarc
A Profile of Youngtown Residents who Work in the East Valley While Youngtown employers recruit primarily from the West Valley, a large number of Youngtown residents make the daily commute to the East Valley (Scottsdale, Paradise Valley, Fountain Hills, Tempe, Mesa, Gilbert and Chandler) where they work in the Service industries.
Youngtown Commuters to the East Valley 2006 2005 Count Share Count Share Total Primary Jobs 160 100.0% 128 100.0% Jobs by Worker Age 2006 2005 Count Share Count Share Age 30 or younger 46 28.7% 34 26.6% Age 31 to 54 68 42.5% 57 44.5% Age 55 or older 46 28.7% 37 28.9% Jobs by Earnings Paid 2006 2005 Count Share Count Share $1,200 per month or less 47 29.4% 29 22.7% $1,201 to $3,400 per month 70 43.8% 71 55.5% More than $3,400 per month 43 26.9% 28 21.9% Jobs by Industry Type 2006 2005 Count Share Count Share Goods Producing 27 16.9% 18 14.1% Trade, Transportation, and Utilities 39 24.4% 32 25.0% All Other Services 94 58.8% 78 60.9%
Source: US Census Bureau, Local Employment Dynamics For additional information on Youngtown contact: Town of Youngtown 12030 Clubhouse Square Youngtown, AZ 85363 (623) 933-8286 www.youngtownaz.org
113Copyright ERISS 2008 www.usworks.com/westmarc
Appendix 1 -- Employer Survey Methodology Background The WESTMARC Survey was conducted during the period August 2008 to October 2008. The survey collected both occupation and employer-specific data concerning wages, growth, turnover, demand, supply difficulty, and a number of other workforce-related areas. In addition to occupation-specific questions, a series of supplemental questions were asked. The Employer Database ERISS uses a commercially available database of local employers within specific size categories. The database is then subjected to a quality assurance review, including an examination of employer records for correct Standard Industrial Classification (SIC), size and other relevant data points. This database is integrated into our current survey programming processes and the employers are targeted based on their SIC-code and Department of Labor Occupational Employment Statistics (OES) employment projections. Sampling ERISS conducts large-scale, representative sample surveys using a technique known as "stratified proportional quota sampling." This technique enables researchers to accurately represent the major characteristics of a population by sampling a proportional amount of each. Pre-determined population characteristics (such as company size, industry, and region) serve as stratification criteria. The result of this sampling design is an optimized allocation of the sample among the various strata. Additionally, this technique allows researchers a great deal of flexibility in terms of representation of pre-chosen strata within the population. For example, a particular region may have relatively few large companies, but these companies account for a large proportion of regional employment. Purposive over sampling of larger companies ensures the employees and occupations at these companies are represented in the survey to the degree they impact the region, not just their proportionate representation in the overall population. Finally, ERISS combines this sampling method with a "census" survey approach to ensure as many employers are contacted as possible. To this end, ERISS attempts to contact every employer in the universe of employers (in this case all employers with 20 or more employees) and achieves response rates averaging 30%. This means that for an area with 20,000 employers, we would obtain responses from approximately 6,000 employers. This is conservatively four to ten times as many responses as would be obtained using a traditional stratified random sampling technique. The higher number of responses ensures sufficient data is gathered to provide detailed local information, even when stratified by sub-regions, industry classifications employer size and even customized industry sub-clusters. The result of such a large

114 www.usworks.com/westmarc
sample and the use of stratified proportional quota sampling results in representative data on a number of dimensions. Random samples can also be stratified on a multiple dimensions, but because fewer employers are surveyed in a random sample, these stratifications are based on fewer responses and may have a higher level of error. Methodological Tradeoffs There are inherent advantages and disadvantages to any research methodology. There is no single method best suited to all types of research. Labor market research is typified by a series of tradeoffs that are best characterized in terms of cost/benefit. Research goals, intended use of the data and available resources largely dictate the optimum method of choice. The method that returns the most value is often not the most theoretically desirable, but rather the most valid for the purpose and budget of the survey. Obtaining a true random sample along all desired stratification levels usually requires the expenditure of resources greatly out of proportion to the expected returns. For the applied purposes of most workforce professionals, surveying the greatest number of employers possible in a representative, valid, and cost effective manner is of greater importance than achieving a true random sample that allows for the use of statistical techniques that are often of little applied value to the purposes of the survey on a local workforce development level. Therefore, for research involving job markets, sample representativeness is often a more important consideration than true randomization (which is better suited to research more experimental in nature and design, and where timeliness of the data is not an issue). Additionally, due to selection bias, non-response, inaccurate or non-representative database source, attrition and other factors, studies originally designed as random sample surveys often do not qualify as random after the survey is complete. Due to a dependence on randomization to ensure the generalization of survey results (rather than targeting individual strata or other techniques to ensure representativeness), the final result of some "random sample" surveys are samples that are neither random nor representative. Assuming a true random sample is achieved, what are the advantages and disadvantages of true random sampling over other techniques such as proportional quota sampling? The primary advantage is that statistical theory can be used to make generalizations from the sample of employers to the population. However, sampling theory dictates that the more units sampled from a population, the closer the sample comes to approximating the characteristics of the population (assuming sampling is equivalent across various demographic dimensions, such as company size). When a large proportion of the employer population is surveyed, the ability to make accurate statements about those employers is largely equivalent to making statements about the population as a whole. Additionally, measures to ensure and gauge external validity can be utilized. For example, a comparison of ERISS data for a key factor such as salary, with pre-existing salary information about the target population can add confidence to the survey data. In sum, as compared to a random sample survey, the primary advantage of the ERISS approach is a representative and valid sample containing a higher number of responses, representing more occupations, with a lower cost, and most importantly,
115Copyright ERISS 2008 www.usworks.com/westmarc
more timely results. Surveys are usually completed within 12-16 weeks, ensuring the most recent job market information available. Admittedly, some sacrifices are made in terms of generalization of the survey results as compared with surveys using probabilistic sampling techniques. The information provided by the Bureau of Labor Statistics utilizing random sample survey techniques cannot be replaced by any other method in terms of value for strategic decisions and planning. However, the information required for more tactical decisions must be more current and represent a large number of local employers. Ideally, the timely, representative data provided by ERISS in conjunction with random sample survey data (such as provided by the BLS) supplies the necessary information workforce and economic development professions require for both tactical and strategic labor market solutions. Tracking of Stratification Parameters As previously described, the sample is stratified in terms of industry, company size, and region. This is accomplished by means of real-time data tracking. The emerging sample is inspected daily, and resources are adjusted and reallocated to ensure representativeness in terms of each stratification parameter. For example, if an employer database indicates that the Business Services industry accounts for roughly 8% of all employers in a region, steps are taken to ensure this industry represents approximately 8% of all industries in the final survey data. Similarly, company size (regardless of industry assignment), and regional representation are tracked and adjusted. The survey is not considered complete until all stratification parameters fall within the predetermined ranges, and the overall required response rate has been achieved. The Staffing Pattern ERISS employs sophisticated staffing patterns to determine which occupations to survey for each individual employer. These staffing patterns are based upon interviews with more than 2,000,000 employers, crossing four-digit SIC codes to enhanced, six-digit OES codes (ERISS uses customized eight-digit O*NET codes to account for new and emerging occupations not represented in the standard O*NET coding system). Considering the volatility of occupational titles and the evolution and development of new industries and categories of businesses, staffing patterns tend to lose their ability to reflect occupational trends over time. Therefore, the ERISS staffing patterns are modified and updated to accurately reflect occupations in the current labor market. This is accomplished by continuous adjustments and improvements as we incorporate information from each completed survey to reflect new occupations or existing occupations appearing in new industrial classifications. Occupational Targeting ERISS deploys both preset and dynamic targeting criteria for occupational selection. Preset targeting criteria include: Sponsor requests - occupations that are selected as "special interest" occupations by its customers. Occupational "rarity" - for example, when surveying fire stations, the occupation "fire chief" would be given top
116 www.usworks.com/westmarc
priority since they are found nowhere else. Number of potential employers - the more potential employers, the higher the priority. The ERISS dynamic targeting process is designed to adjust the parameters of the survey in real-time, as the survey is being conducted. The targeting program works by following the pre-set parameters to ensure the proper amounts and types of industries, occupations and company sizes are surveyed. These parameters operate at multiple levels simultaneously and the number of surveys required for each occupation varies according to the fulfillment of certain preset requirements as well as the characteristics of the developing survey data To determine the proper number of surveys required for each occupation, dynamically adjusting thresholds, referred to as "floors" and "ceilings," are used. The "ceiling" is defined as the point at which the collection of more data for a particular occupation will no longer significantly impact the results. The "floor" refers to the minimum number of occupational surveys required for occupational data to be considered valid and publishable. In response to live survey data, the program adjusts these thresholds for each occupation. For example, if the existing data for a particular occupation is displaying a high amount of salary variability, the program adjusts the floor so that a higher number of these occupations are targeted for surveying, thereby increasing the confidence in the data for that occupation. Occupations with very little salary variability require fewer data points to achieve the same level of confidence. As more occupational surveys are collected, and the dynamic minimum threshold is reached, the probability that the occupation will be selected for surveying declines until, after the maximum threshold is reached, the probability becomes zero, and the occupation is no longer surveyed. Additionally, before the survey, targeting parameters can be manually adjusted to ensure that certain "VIP" businesses or other high-priority targets, whether industries, regions, occupations or even specific firms or companies, are sampled in sufficient numbers. One special feature of ERISS’ methodology and CATI system is the ability to know when enough occupations have been surveyed using more than simple "counts." For instance, some occupations typically have a great deal of salary variability (i.e. large range between the highest and lowest salaries). These types of occupations require more data in order to make confident statements concerning the average and median salaries. Using existing data from the Bureau of Labor Statistics and other sources, these occupations are identified prior to the start of the survey and assigned higher completion thresholds ensuring adequate numbers are surveyed according to the salary characteristics. Data Validation Data is validated at three points during the survey process; during the live survey (real-time validation), spot checks of completed surveys (usually within 24 hours of the survey) and after the survey calls are complete (post-survey validation).
Real-time validation is conducted along several dimensions, the first being during keyboard entry. The ERISS CATI (Computer Aided Telephone Interview) system performs extensive logic and range checking both in terms of salary points, hiring and turnover numbers, etc. During the survey, ERISS surveyors are also subject to both visual (observations of screens) and audio ("silent" listening) monitoring. Experienced

117Copyright ERISS 2008 www.usworks.com/westmarc
ERISS team-leaders, trained in management and leadership listen-in on randomly selected survey calls. This monitoring not only ensures that data is collected in a standardized and reliable manner, but also that surveyors are polite and professional when interviewing employers. Additionally, ERISS survey team-leaders visually monitor the surveyors’ computer screens to track survey progress and method. Also during the live-survey, survey statistics are monitored in real-time to track trends in the developing database. For each individual surveyor as well as at the aggregate level, these statistics document such factors as number of calls, average length of call, successful surveys, phone appointments, and various other factors crucial to tracking the live survey. This information is also used to target surveyors for observation. In addition to the live-survey monitoring, daily tabulations of the survey data are conducted. At the end of each day of survey operations, a review and analysis of survey statistics and other statistical information collected to date is conducted. These "daily" statistics are used to analyze and interpret trends in key areas such as representation by size and industry. This information is used to devise strategy and targeting adjustments for the following day’s survey. Also, daily validation calls are made to participants to spot-check data. These calls are made by experienced ERISS surveyors to randomly selected employers. This not only provides a valuable validity check on the collected data, but it also provides a check on the accuracy of individual surveyors. Post-Survey Validation Once the calls are complete, the raw data is processed by a series of post-processing software programs developed specifically for the purpose. These programs flag (and eliminate if desired) data outliers, determine and flag data variability, create data aggregations and provide summary tables as well as data validation tabulations. Data points that are considered suspect or out-of-bounds according to a number of parameters are rechecked by calling the relevant employer and asking validation questions. If the data in question is still suspect, the decision can be made to remove it from the data set. Once all data runs are complete, the raw data is then processed using SPSS software (Statistical Package for the Social Sciences) macros to calculate a variety of statistical measures that are then compared to the aggregate results above. Tests include response distribution against the target population along geographical areas, industry clusters and employer size. Based upon these data runs, ERISS created a summary of findings relating to data validity by industry, by area and by employer size by area. Lastly, the resulting data sets are evaluated against initial targeting parameters as agreed upon with the survey sponsor. In consultation with the sponsor, a determination is made as to whether the survey is complete, or whether to continue the survey to gather additional information.
118 www.usworks.com/westmarc
Appendix 2 -- Employment, Occupation and Labor Force Estimation Methodology
Background The WESTMARC study required the creation of series estimations of employment data for the communities of the West Valley and for the entire Metro Phoenix area. These estimates included:
• Employment for individual communities • Occupational employment in various communities and industries • In and out commute patterns for individual communities • Overall labor supply for the Metro Phoenix area
Where information is sourced directly from a government database or statistical program, the source is noted. In a number of cases, the base source is government data but additional analysis was required. Where that took place, the sourcing will note Advanced Workforce Systems as the author of the analysis. Employment Estimation For the Phoenix metro area, employment estimates were drawn from the US Census, Longitudinal Employer-Household Dynamics program. The information is reported through the Local Employment Dynamics (LED) program on their website http://lehd.did.census.gov/led/. This Census program uses administrative records to create a nearly complete picture of the civilian workforce and a number of its characteristics. Employment information is drawn from the Quarterly Census of Employment and Wages (QCEW). The QCEW will include data on every US worker subject to the unemployment compensation system (generally those working for a wage or salary). It represents over 90% of the employment in the US. It does not include self-employment or employment with the federal government. This employment data is then matched with records from other federal agencies to add age, gender and place of residence to the file. The Census LED definition of “employment” requires that a worker have some wage reported in two consecutive quarters. For example, a person will be considered employed in the first quarter of 2008 if s/he had wages reported in both the 1st quarter of 2008 and the 4th quarter of 2007. This definition of employment is slightly more restrictive than the definition used by the Bureau of Labor Statistics which requires only current employment and does not look at employment in a prior period or a subsequent one. The Census LED definition of a “new hire” requires that a person be employed (working for two consecutive quarters) with a firm and that they had not worked for that firm (had any wages reported) for 4 quarters prior to employment there. This definition is designed to exclude individuals who return annually to the same seasonal employer or who rejoin an old employer after a layoff. When employment data is reported for the entire Phoenix Metropolitan Statistical Area (MSA), Census LED data has been used.
119Copyright ERISS 2008 www.usworks.com/westmarc
Employment estimation for individual communities in the West Valley was done using the InfoUSA (www.infousa.com/) database of employers. (That same database has been purchased by the US Department of Labor for inclusion on its Career One Stop service and is the foundation database used by ERISS in conducting its surveys.) The InfoUSA database includes employment data for each firm as well as primary and secondary SIC (standard industrial classification) codes for each firm. ERISS reviewed that database in accordance with its standard quality assurance procedures (see Appendix 1). The reviewed database was then subject to a further review by Advanced Workforce Systems to verify actual employment totals for large employers and to code the employers into the North American Industrial Classification System (NAICS). NAICS is the classification systems user by the US Canada and Mexico to categorize businesses when they are developing statistical reports and other economic data. It was first used extensively in the US beginning in the late 1990s. Overall employment estimates and industry level estimates were made by adding the individual employment counts for each employer in a particular jurisdiction. Industry level counts were done at the 2 digit (NAICS Sector) and 3 digit (NAICS industry) level. Estimates for Agriculture and Public Administration were only done at the 2 digit sector level. Occupational Estimation Occupational estimates for the Phoenix MSA, the West Valley and the individual communities were created using the industry/occupation matrix created by the Bureau of Labor Statistics from their Occupational Employment Statistics (OES) program. The national matrix was used at the 3 digit NAICS level for all industries except Agriculture and Public Administration where the 2 digit matrix was used. The occupational estimates provide a reasonable representation of the actual occupation mix in the local economy. The estimates are most accurate when the entire Metro Phoenix area is being viewed and when occupations have been aggregated into one of the 22 job families. They are least accurate when looking at a single detailed occupation (e.g. registered nurse), in a single 3 digit industry (e.g. ambulatory health care facilities), in a single community (e.g. Surprise). Available Labor Supply Estimation The available labor supply in the Phoenix metro area was calculated by combining information from two primary sources. For the purposes of this estimation, the available labor supply is assumed to be composed of 3 elements: job changers, those between jobs and new entrants to the labor force. In some models of the labor supply, a fourth element would be added – those on the sidelines but with some possibility of moving into the labor force. Job Changers were calculated from the 4 quarter averages of “new hires” reported as part of the Census LED program. The “new hires” were used as the best proxy for job changers because by definition they excluded those who were returning from a temporary layoff or returning the same seasonal employer. Differences between

120 www.usworks.com/westmarc
the “separations” and the “new hires” reported in the Census LED program were monitored. Separations were always higher than new hires because they covered any reason for leaving a job – voluntary resignations, movement to a new job, layoffs, retirements and dismissals. Fairly consistently, the difference between the separation and new hire numbers was equivalent to the number of new claims for unemployment benefits. While some “new hires” clearly come from the ranks of the unemployed, we believe that on balance most of the “new hires” are in fact individuals moving from job to job. The two other categories – between jobs and new entrants – represent two portions of the labor force that are defined as “unemployed.” (A person is considered “unemployed” if s/he has not worked during the middle week of a month but has been actively seeking employment. A person without a job and who is not actively seeking a job is considered “not in the labor force.”) Census and the Bureau of Labor Statistics will conduct annual supplemental surveys of the workforce to determine the reasons for unemployment. Consistently in that survey, the unemployed are made up of two groups – those who have recently lost a job and those who are entering the labor force either for the first time or after a period of absence. About 60% are in the former category of between jobs and 40% are entering the labor force from the sidelines. One additional factor is important to note: Job changers and the two “unemployed” categories are calculated from two different bases. The job changers are based on reports from employers and cover individuals who work in a particular area, no matter where they live. The two “unemployed” categories are based on a survey of households and therefore describe individuals who are living in a particular area but who may have been or may be employed outside that area. Again, as with the discussion of the occupational estimates, the size of the geography matters. At the Metro Phoenix area level, it would be fair to say that the results of the household survey and the establishment data would be speaking about the same population. Since the calculation is designed to estimate the available labor supply in the Metro Phoenix area, it is reasonable to combine and consider as available to work in Phoenix individuals who are already working in Phoenix and “unemployed” individuals who are living in Phoenix. Commuting Patterns The commuting patterns described in this report come from the origin and destination files contained with the Census LED On the Map program. A detailed description of how the data is calculated and displayed can be found at http://lehd.did.census.gov/led/datatools/onthemap3.html .

121Copyright ERISS 2008 www.usworks.com/westmarc
Appendix 3 -- Data Tables and Specialized Reports
Background The website www.usworks.com/westmarc developed by ERISS contains a large number of interactive data tables that can be customized into reports. Report Elements The report elements are grouped into three report packages designed for slightly difference audiences.
• The “Prospects” report package is designed primarily for economic development professionals and is intended to answer common data questions from them.
• The “Area Profile” report package is designed primarily for individuals who are developing plans or preparing background information for decision makers.
• The “Occupational Profile” report package is designed primarily to assist workforce development professionals who need more detailed information about individual occupations or groups of occupations.
Package Report Element Description Prospects, Area
Industry Summary The user will select a community for the report. This summary is available for 2 digit sectors and 3 digit industries. It includes a description of the industry, a count of the firms and total employment in the industry within the selected community, the West Valley and the Phoenix MSA, and employment trends for the Metro Phoenix area in that industry. It will also display the age and gender distribution of the workers in that industry in the Phoenix MSA.
Prospects, Area
Industry Occupational Summary
The user will select a community for this report. This summary is available for 2 digit sectors and 3 digit industries. The report will display the top 20 occupations in that industry and provide counts for each occupation within the selected industry and within all industries. The data will display for the selected community, the West Valley and for the Metro Phoenix area. The report is designed to give the user a sense of how many workers might be available to fill particular jobs.
Prospects, Area
West Valley Profile This is a narrative profile of the entire West Valley.
Prospects, Commuter Profile This is a profile of the workers who are

122 www.usworks.com/westmarc
Package Report Element Description Area employed in each of the West Valley
communities and the West Valley as a whole. The report consists of a map that displays (using thermals) where workers in a particular community commute from. It will also provide a table showing the top 10 jurisdictions that send workers to a particular community. The report is generated by the Census LED On the Map program,
Prospects, Area
Community Industry Profile
The user will select a community for the report. The report will then display the industry mix for the selected community in terms of number of firms and employment in each of the industries. The report displays industries at the NAICS 2 digit sector level. Similar reports on the industry mix of the West Valley and the Phoenix MSA are available for comparison. The report also includes a segment on the minority and women-owned businesses and on key industries in the MSA.
Prospects, Area
Community Occupational Profile
The user will select a community for the report. The report will then display the employment distribution in the community (with the West Valley and Phoenix MSA displayed for comparison purposes) into the 22 jobs families.
Prospects Metro Area Demographics
This report displays some common demographic information about Maricopa County including the age/gender of the population, levels of educational attainment, household income, commuting methods and current school enrollment figures.
Prospects Metro Area Labor Force Demographics
This report will describe several common factors about the labor force in the Phoenix MSA including the available labor supply, current unemployment rate, age/gender distribution of those working and those being hired, the occupational distribution, and the age/race/gender distribution for 10 broad occupational categories.
Occupation ERISS Survey Charts The occupation can be selected individually or by selecting the top 5, 10 or 20 occupations in a particular industry. This element of the report will display data developed by ERISS from the recent survey of West Valley employers and from other sources including wages, salary trends for new hires, time required to fill vacancies, and the level of education and experience commonly

123Copyright ERISS 2008 www.usworks.com/westmarc
Package Report Element Description requested of job candidates.
Occupation Occupational Demographics
The occupation can be selected individually or by selecting the top 5, 10 or 20 occupations in a particular industry. This element will include a short description of the occupation and show its projected growth over the next 10 years, wages for the occupation in Maricopa County, Arizona and the US, and industries that commonly hire that occupation.
Occupation Occupational Requirements
The occupation can be selected individually or by selecting the top 5, 10 or 20 occupations in a particular industry. This will display a series of detailed skills, tasks and duties typical for this occupation.
To contact ERISS Corporation please call: Barbara Nyegaard, CEO at 888-491-9222 x202 Or email [email protected]
Copyright © 2022 FDOKUMEN