CPY Document - CORE
191
Woods..Hole Oceanographic Institution DOCUM'ENT LIBRARY Woods Hole Uceanographic Institution . WHOI-95-tO ee;.1 . ':¡'".''' . '. t'"". ¡'" .,\ (I ". :: Cl I' c: o , ,_' :! ~. .~ . 193 Technical Report July t995 Toward an Effective Protocol on,Land-Based tJarine Pollution in the Wider Caribbean Region by . Porter Hoagland Mary E.. S.chumacher Arthur G.Gaines,Jr. Marine Poliçy Center Woods Hole Oceanographic Institution Woods Hole, Massachusetts 02543-:1138 . Phone 508-548:'1400 ..Telei(951679 . !,.¡:
-
Upload
khangminh22 -
Category
Documents
-
view
2 -
download
0
Transcript of CPY Document - CORE

Woods..Hole Oceanographic Institution
DOCUM'ENTLIBRARY
Woods Hole Uceanographic
Institution
. WHOI-95-tOee;.1
. ':¡'".''' . '. t'"".¡'" .,\(I ". ::Cl I' c:o , ,_' :!~. .~. 193
Technical Report
July t995
Toward an Effective Protocol on,Land-Based tJarine Pollution
in the Wider Caribbean Region
by
. Porter HoaglandMary E.. S.chumacherArthur G.Gaines,Jr.
Marine Poliçy CenterWoods Hole Oceanographic Institution
Woods Hole, Massachusetts 02543-:1138. Phone 508-548:'1400 ..Telei(951679 .
!,.¡:

WHOI-95-10
Toward an Effective Protocol on Land-Based Marine Pollutionin the Wider Caribbean Region
by
Porter HoaglandMar E. SchumacherArthur G. Gaines,Jr.
DOCU~~1ENT
LIBRARYWoods Hole Oceanographic
Institution
Marine Policy CenterWoods Hole Oceanographic Institution
Woods Hole, Massachusetts 02543-1138
July 1995
Technical Report
Funding provided by the United States Environmental Protection Agency, Office of InternationalActivities under Co-operative Agreement No. CX82IS40-01-0.
Reproduction in whole or in part is permitted for any purpose of theUnited States Government. This report should be cited as:
Woods Hole Oceanog. Inst. Tech. Rept., WHOI-9S-1O.
Approved for publication; distribution unlimited.o/'i:i:Õ :r:i- i:~ 0:: 0ID-:i ,.-0/'oo
Approved for Distribution:
~dr~ ((. ~Andrew R. Solow, Director
Marine Policy Center
On the cover: Actual and Hypothetical Maritime Jurisdictions in the Wider Caribbean Region. Adapted from Fenwick (1992).Q 1995 by the Woods Hole Oceanographic Institution.
Hypothetial boundaris (thin lines) are those identified by the u.s. Department of State in its World Data Bank 2. In most cases, thehypothetial boundaris are approximate equidistant boundari, and they do not reflct any acceptance by the u.s. government. Some
claims may be based upon unilateral assertins; these claims may be subject to chatle by natinal legislatin or decree or through
internatinal boundry negotitins. Boundris as represented are approximations for general reference only.


Toward an Effective Protocol on Land-Based Marine Pollution
in the
Wider Caribbean Region
July 1995
by
Porter HoaglandMary E. Schumacher
Arur G. Gaines
Marine Policy CenterWoods Hole Oceanographic Institution
Woods Hole, Massachusett 02543
-1-

share a common boundary, such as rivers and their deltas or estuaries. However, the systematiccollection and analysis of data on the extent and distribution of localized pollutants has oruyrecently gotten under way. Because inventories are limited to point-source pollutant loads, theresults so far are not useful for assessing the extent and distribution of pollutants generated bysome of the most significant non-point source activities in the region, including agriculture,forestr, and coastal development projects. In the absence of systematically collected data on
non-point pollutant loads for most of the WCR countries and territories, a more complete pictureof an individual state or subregion's relative contribution and exposure to LBMP must beinerred from other indicators. We examine a combination of indicators to help assess theinclination and abilty of states to undertke independent or joint action to control LBMPproblems.
We analyze several issues and arguments that often are assumed to be relevant to theCaribbean and therefore have been used as a basis for pursuing a regionwide approach to LBMPcontrol in the WCR. These issues and arguments include: common-pool pollution effects; scaleeconomies; common pollution problems; and the need for uniform standards (water quality orpollution control standards). Each of these issues must be evaluated carefully with respect to thewide variety of environmental, political, and economic characteristics found in the WCR states.We believe that all of these issues are indeed relevant and valid at some scale in the Caribbean.However, the extent to which they are applicable regionwide is not at all clear.
We believe that strong arguments can be made in favor of a regional protocol containingintitutional arrangements that help to resolve pollution problems at the domestic and subregionallevels, especially transboundary pollution between adjacent or neighboring states. This kind ofan effort can build upon existing bilateral arrangements, if deemed successful, such as thosebetween Venezuela and Trinidad & Tobago, Mexico and Belize, or the United States andMexico. We advocate an approach that start out at a small scale so that valuable, andpotentially tranferable, experience can be gained at little risk of larger program ineffectiveness.If scientific research demonstrates the need to internlize pollutant effects that are morewidespread, then larger subregions might be delineated, building upon the experience gained atthe bilateral leveL. The best approach appears to be an incremental one, building uponsuccessful arrangements among those states that have appropriate incentives for solving realtransboundar pollution problems.
We also address the arguent for an LBMP protocol in the WCR tht gives priority toresolving localized but widely occurring pollution problems-an approach that is clearly morecompatible with the environmental realities of the region. We are concerned that the logic ofconcluding an international protocol to address primarily domestic problems depends uponcertin unproven assumptions about clearinghouse efficiencies and other scale economies, andabout the likelihood that an international program wil be more effective than effort by
-lV-

individual states in attracting funding and other forms of assistace from multilateral andbilateral donor agencies. We believe that these assumptions are valid to a point that stops shortof justifying a uniform, regionwide approach to LBMP problems and solutions. We recommendthat a protocol focusing on common, nontransboundary LBMP explicitly recognie that somecommon LBMP problems in the WCR are more common than others, by carefully delineatingsubregional groupings and approaches on the basis of shared marine environmental problems.We furter recommend that in such a case the "umbrella" function of a regional protocol shouldconcentrate on the need to ensure uniform access to all clearinghouse products and on the
resolution of issues concernng the internal allocation of financial and techncal assistace toindividual states and subregions.
We explore thee avenues to identifying promising opportnities for mutually beneficialcollaborations, or "gain from trade," in pollution control. First, economic commonalities
thoughout the region are identified, with the states grouped and ranked according to their levelof participation in relevant economic sectors. This information is useful in identifying statesengaged in a particular polluting activity on a relatively small scale, who could benefit frompollution control approaches and technologies that have already been adopted by another stateengaged in the same activity at a much larger scale. At the same time, states operating in thesame industries at roughly the same scale of activity may encounter the same LBMP problemsand thus might well be interested in cooperating on the development of common solutions. Alsoconsidered are the states' existing relations as trade parters, which could serve as an additionalbasis or support for collaborations and exchanges in LBMP control.
Second, we consider the relative identities of WCR states as polluters and polluteeswithn geographic subregional groupings, according to an approach developed by Broadus et al.
(1993). Specifically, relevant population and economic data are used to estimate the extent towhich each state is a source of LBMP; the extent to which it has a stae in controlling theproblem; and its relative economic capacity to undertke corrective action. This analysis yieldsseveral ilustrative examples of key match-ups among source, staeholder, and faciltator stateswith and across subregions, in which faciltator states (typically importnt trading parers oraid providers) inuence source states to control their LBMP emissions for the benefit of keystaeholder states. Although this anlysis is distinctly geared toward intances of tranboundarypollution, we believe that it wil be useful even if the negotiating parties concentrte their efforton collective responses to common, nontransboundary problems. In either case, an
understading of each state's relative stading with respect to source, stae, and capacity shouldenhance the abilty of negotiating parties to identify those specific collaborations and exchangesthat are most likely to be successfully implemented.
Thid, we develop a qualitative rating system that takes into account not only the siz butalso the direction of a state's economic incentive with respect to controlling LBMP, and not only
-v-

its economic capacity but also its institutional capacity to underte corrective action. Like theeconomic groupings, this approach compares all the WCR states within a single, regionwidecontext. This rating system helps to predict which states are the most likely to engage insustained and successful action to control LBMP, and, for the other states, the general types ofassistance or special inducements that each is most likely to require in order to participatesuccessfully.
The Cartagena Convention establishes a broad goal with respect to the control of LBMPin the Convention area. As currently articulated, this goal is subject to variable interpretations.In order to improve the potential for protocol effectiveness, this goal must be clarified, its termsshould be made more explicit, and objectives should be specified to enable states, collectivelyor independently, to reach this goal. In particular, the term appropriate measures, found in theConvention's mandate that its Contracting Parties "shall take all appropriate measures to prevent,reduce, or control" LBMP, should be defined explicitly.
One important role for the prospective protocol wil be the clarification of rights to aclean marine environment. Broad language iI the Cartagena Convention, the United NationsConvention on the Law of the Sea (UNCLOS III), and principles of customary international lawlend support to the notion tht states affected by pollution originating in another jurisdiction havethe right to a clean environment. The emerging "polluter pays" principle is consonant with thesesources of law, but appears to apply primarily at the subnational leveL. However, these sourcesof law are not unambiguous with respect to the assignment of rights. We develop a stylizedmodel to demonstrate the importnce of clearly defined rights and to help elucidate the potentialfor benefits from agreements, or "gains from trade," in pollution control (Appendix C).
Gains from trade can be facilitated with mechanisms for transfer payments. Thesemechanisms exist already and have been employed to assist in the resolution of Caribbean LBMPproblems to a limited extent. The United States, some European states, Sweden, Canada, andVenezuela already provide foreign aid of various types to many states in the region. Thesetranfer payments can be "tied" specifically to pollution control arrangements in the context ofthe subregional or bilateral agreements that we have suggested. It is not necessary that transfersbe financial; transfers can involve scientific or technological research, expertise, or equipment,or other goods and services.
Another importnt role for the protocol is the reduction of transactions costs among statesinvolved in pollution control negotiations. Transactions costs can involve costs of informationdisparities and uncertinty, negotiation, and enforcement. The protocol can also serve thetraditional roles of providing a forum to help focus pollution-related scientific research andmonitoring and to identify an array of feasible pollution control instruments that might beemployed by states in pollution control at the domestic and subregional levels.
-Vl-

At this juncture, it is not yet possible to evaluate the effectiveness of a protocol on LBMPcontrol for the Caribbean. We can, however, say something about the general features andelements that might be incorporated into a protocol to improve its potential for effectiveness.Notably, the WCR resembles the Mediterranean as a regional sea, suggesting that many lessons,on what to adopt as well as what to avoid, can be drawn from the Mediterranean experience.Experience with the control of LBMP in other regional seas can provide useful lessons as well,
particularly in the areas of program finncing, political commitment, statements of goals, targetsand deadlines, and compliance.
-Vll-

-Vll-
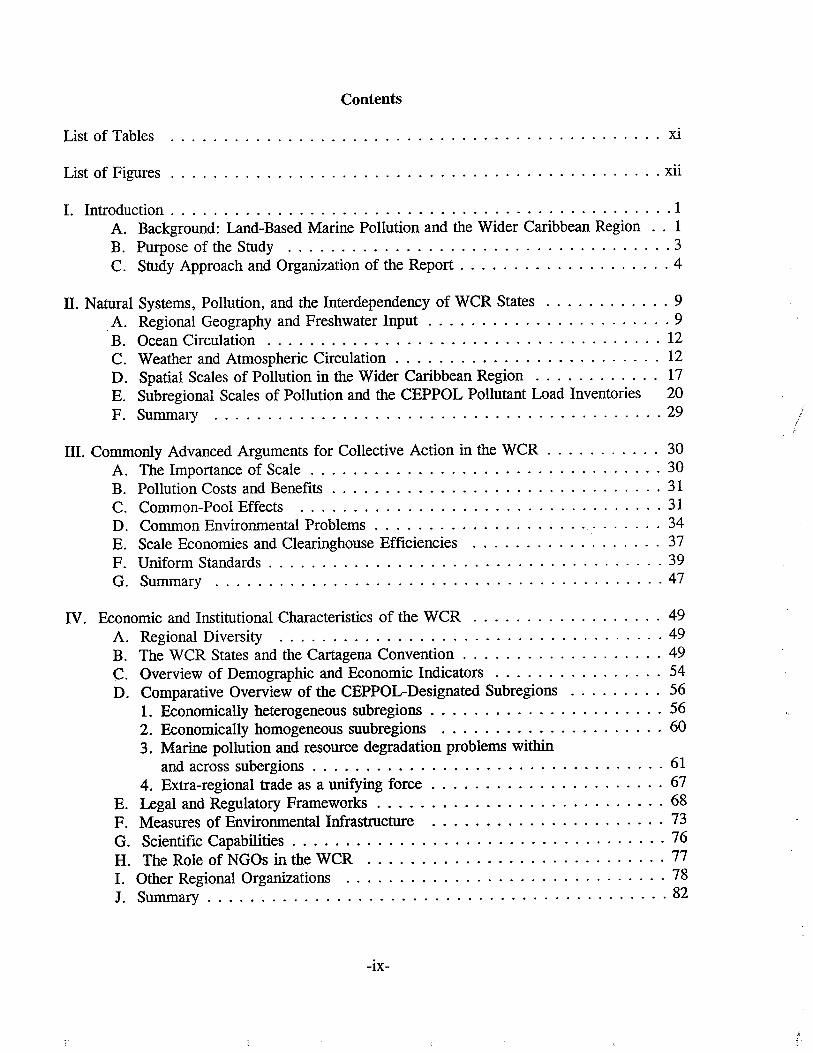
Contents
List of Tables .............................................. Xl
List of Figures . . . . . . . . . . . . . . . . . . . . . . . . . . . . . . . . . . . . . . . . . . . . . . xu
1. Introduction. . . . . . . . . . . . . . . . . . . . . . . . . . . . . . . . . . . . . . . . . . . . . . . 1A. Background: Land-Based Marine Pollution and the Wider Caribbean Region . . 1B. Purpose of the Study ....................................3C. Study Approach and Organization of the Report . . . . . . . . . . . . . . . . . . . . 4
ll. Natural Systems, Pollution, and the Interdependency of WCR States . . . . . . . . . . . . 9A. Regional Geography and Freshwater Input . . . . . . . . . . . . . . . . . . . . . . . 9B. Ocean Circulation . . . . . . . . . . . . . . . . . . . . . . . . . . . . . . . . . . . . . 12C. Weather and Atmospheric Circulation. . . . . . . . . . . . . . . . . . . . . . . . . 12D. Spatial Scales of Pollution in the Wider Caribbean Region . . . . . . . . . . . . 17E. Subregional Scales of Pollution and the CEPPOL Pollutant Load Inventories 20F. Summary .......................................... 29
III. Commonly Advanced Arguments for Collective Action in the WCR . . . . . . . . . . . 30A. The Importnce of Scale . . . . . . . . . . . . . . . . . . . . . . . . . . . . . . . . . 30B. Pollution Costs and Benefits . . . . . . . . . . . . . . . . . . . . . . . . . . . . . . . 31C. Common-Pool Effects .................................. 31D. Common Environmental Problems. . . . . . . . . . . . . . . . . . . '_' . . . . . . 34E. Scale Economies and Clearinghouse Efficiencies .................. 37
F. Uniform Standards . . . . . . . . . . . . . . . . . . . . . . . . . . . . . . . . . . . . . 39G. Summary .......................................... 47
IV. Economic and Institutional Characteristics of the WCR ........ . . . . . . . . . . 49
A. Regional Diversity .................................... 49B. The WCR States and the Cartgena Convention. . . . . . . . . . . . . . . . . . . 49C. Overview of Demographic and Economic Indicators .... . . . . . . . . . . . . 54D. Comparative Overview of the CEPPOL-Designated Subregions ......... 56
1. Economically heterogeneous subregions . . . . . . . . . . . . . . . . . . . . . . 562. Economically homogeneous suubregions ..................... 603. Marie pollution and resource degradation problems with
and across subergions . . . . . . . . . . . . . . . . . . . . . . . . . . . . . . . . . 61
4. Extra-regional trade as a unifying force . . . . . . . . . . . . . . . . . . . . . . 67
E. Legal and Regulatory Frameworks . . . . . . . . . . . . . . . . . . . . . . . . . . . 68F. Measures of Environmental Infastrctue ...................... 73G. Scientific Capabilties . . . . . . . . . . . . . . . . . . . . . . . . . . . . . . . . . . . 76H. The Role of NGOs in the WCR ............................ 771. Other Regional Organations .............................. 78J. Summary . . . . . . . . . . . . . . . . . . . . . . . . . . . . . . . . . ~ . . . . . . . . . 82
-lX-

Contents (contd.)
V. Analysis of the Incentives and Prospects for Collective Action .............. 84
A. Analytic Approaches ................................... 84B. Economic Commonalities ................................ 84C. Sources and Stakes .................................... 92D. An Alternative Assessment of Capacities and Incentives to Control LBMP . 102E. Concluding Remarks .................................. 109
VI. Lessons Learned . . . . . . . . . . . . . . . . . . . . . . . . . . . . . . . . . . . . . . . . . 112A. Regional Background Characteristics ........................ 112
1 . Delineation of Subregions . . . . . . . . . . . . . . . . . . . . . . . . . .. 112
2. Coherence Among Member States. . . . . . . . . . . . . . . . . . . . .. 1153. High-Level Political Commitment and Oversight . . . . . . . . . . . .. 117
4. Knowledge of Baseline Conditions . . . . . . . . . . . . . . . . . . . . .. 118B. Elements of Effective Program Design ....................... 119
1. Clear Goals and Objectives .......................... 1192. Obligation to Adopt Measures: Targets and Deadlines ......... 120
3. Efficiently Designed Program Measures .................. 121
4. Compliance Mechanisms. . . . . . . . . . . . . . . . . . . . . . . . . . .. 1225. Mechanisms for Trade .. . . . . . . . . . . . . . . . . . . . . . . . . . .. 1236. Adequate Financing Features . . . . . . . . . . . . . . . . . . . . . . . .. 1247. Effective Decisionmaking Processes . . . . . . . . . . . . . . . . . . . .. 125
8. Adaptability Over Time ..................... ~.' . . . .. 126
C. Dynamic Measures of Effectiveness .. . . . . . . . . . . . . . . . . . . . . . .. 1271. Level of Compliance . . . . . . . . . . . . . . . . . . . . . . . . . . . . . . 1272. Achievement of the Program Goal. . . . . . . . . . . . . . . . . . . . ., 1283. Increased Domestic Abatement Effort ................... 129
D. Summary ......................................... 130
AppendicesA.B.C.D.
E.
F.
Data Tables . . . . . . . . . . . . . . . . . . . . . . . . . . . . . . . . . . . . 13 1Estimation of Drainage Basin and Coastal Populations . . . . . . . . . . .. 147
Opportnities for Gain from Trade: A Stylized Model . . . . . . . . . .. 155Consultant Report: E. H. Gladfelter and J. C. Ogden. The status ofrelevant scientifc capabilties and knowledge of land-based marinepollution problems in the Caribbean. (unattched)Consultant Report: L. A. Kimball. Land-based sources marine
pollution: institutions and exchanges. (unattched)Consultant Report. E. F. Mandell. Land-based sources of marine
pollution, legal instruments, and institutional capabilties in theSpanish-speaking countries of the Wider Caribbean Region. (unattched)
References ............................................... 166
-x-

List of Tables
1 Lessons Learned from a Comparative Assessment of LBMP in the Baltic,
North Sea, and Mediterranean . . . . . . . . . . . . . . . . . . . . . . . . . . . . . . . . .52 Principal Rivers Draining Into the Wider Caribbean. . . . . . . . . . . . . . . . . . . 103 CEPPOL Results: Waste Loads from Domestic Sources in the
Wider Caribbean Region by Subregion (t/y) . . . . . . . . . . . . . . . . . . . . . . . . 234 CEPPOL Results: Waste Loads from Industrial Sources in the
Wider Caribbean Region by Subregion (t/y) . . . . . . . . . . . . . . . . . . . . . . . . 245 Regional Enviromnental Programs & Projects in the Caribbean . . . . . . . . . . . . 386 Pollution Control Instrments: A Qualitative Comparison . . . . . . . . . . . . . . . 447 Distributional Implications of Instrument Choice . . . . . . . . . . . . . . . . . . . . . 468 Political Units in the Wider Caribbean Region ... . . . . . . . . . . . . . . . . . . . 509 Participation in Law of the Sea, London Dumping, and Cartgena Conventions . . 52
10 Major Net Importers and Net Exporters of Fish and Fish Products in the WCR . . 5511 Observed Resource and Pollution Problems . . . . . . . . . . . . . . . . . . . . . . . . 6212 Authority for Enviromnental Policy and Enforcement in the WCR States . . . . . . 7113 Measures of Enviromnental Infrastructure . . . . . . . . . . . . . . . . . . . . . . . . . 7414 Regional Enviromnental Institutions . . . . . . . . . . . . . . . . . . . . . . . . . . . . . 8115 Leading Oil and Natural Gas Producers, Oil Refiners, and Producers of
Industrial Chemicals ... . . . . . . . . . . . . . . . . . . . . . . . . . . . . . . . . . . . 8616 Leading Agricultural, Sugarcane, and Banana Producers . . . . . . . . . . . . . . . . 8717 Coastal Development and Leading Fish Producers and Tourist Destinations .... 8918 Debt Service Ratios and Leading Recipients of Foreign Aid . . . . . . ... . . . . . . 9019 Major Export and Primary Importing States . . . . . . . . . . . . . . . . . . . . . . . 9120 Opportnities for Exchange and Cooperation . . . . . . . . . . . . . . . . . . . . . . . 9321 Sources, Stakes, and Capacities within Subregions. . . . . . . . . . . . . . . . . . . . 9522 Key States and Trading Relationships in the Wider Caribbean Region . . . . . .. 10123 Qualitative Ratings of Capacity and Incentive to Undertke LBMP Control. . .. 10324 Overall Prospect of Sustained and Effective Action to Control LBMP . . . . . .. 10725 Checklist: Factors for Regional Program Success ................... 113
26 Commonality of Specific LBMP Problems as Basis for Subregional Groupings . 116A.l Economic and Population Data for WCR States .................... 132A.2 Lad Areas, Coastlines, and EEZs ............................ 133A.3 Selected Indicators of Land-Based Marine Pollution Inputs. . . . . . . . . . . . .. 134
A.4 Selected Fisheries Data, 1990 ............................... 136A.5 Selected Economic Data on Countries and Territories of the WCR,
Grouped by CEPPOL-Designated Subregions. . . . . . . . . . . . . . . . . . . . .. 137A.6 Scientific Associations and Member Institutions in the WCR ............ 143
A.7 Participation in Global and Regional Organiztions .................. 144
B.l Estimated Drainage Basin and Coastal Populations of the WCR States . . . . . .. 150
-X1-

I.,.:.'.
I,l:
List of FiguresI~-.
1 Actual and Hypothetical Maritime Jurisdictions in the
Wider Caribbean Region .................................... 22 Surface Currents of the Wider Caribbean Region (March) . . . . . . . . . . . . . . . 133 Surface Currents of the Wider Caribbean Region (June) ................ 14
4 Surface Currents of the Wider Caribbean Region (September) . . . . . . . . . . . . . 155 Surface Currents of the Wider Caribbean Region (December) . . . . . . . . . . . . . 166 CEPPOL-Designated Subregions .............................. 217 Relative Contributions of Combined Pollutats from
Domestic and Industrial Sources by Five WCR Subregions .............. 26
8 Relative Contributions of Individual Pollutants from
Domestic and Industrial Sources by Five WCR Subregions .............. 27
9 Relative Contributions of Pollutats from Combined Domestic and Industrial
Point Sources by 25 WCR States, Grouped by CEPPOL-Designated Subregions . 2810 Relationship Between Pollution Emissions and Damages ................ 40
11 Regional Diversity as Measured by GDP Per Capita .................. 51
12 WCR Fish Exports and Per Capita Fish Consumption. . . . . . . . . . . . . . . . . . 5813 Major Regional Areas, Actions, and Actors in Environmental Management
and Sustainable Development . . . . . . . . . . . . . . . . . . . . . . . . . . . . . . . . . 79
14 CEP Contributions (Deficits), 1981-92 . . . . . . . . . . . . . . . . . . . . . . . . . . . 8315 Comparison of Sources, Stakes, and Capacities withn CEP Subregions. . . . . . . 9616 Relative Capacities and Incentives to Control LBMP Throughout the WCR ... 105B.l Drainage Area of the Wider Caribbean. . . . . . . . . . . . . . . . . . . '_' . . . .. 149C.L A Model of Transboundary Pollution Control . . . . . . . . . . . . . . . . ". . . . .. 158
-xii -

i. Introduction
A. Background: Land-Based Marine Pollution and the Wider Caribbean Re~ion
Lad-based marine pollution (LBMP) is the world's most serious marine pollutionproblem, estimated by the United Nations Joint Group of Expert on the Scientific Aspects ofMarine Pollution (GESAMP) to contribute more than 75 percent of the pollutants enterig thesea (GESAMP 1990). Negotiations are under way to develop a regional protocol for action tocontrol LBMP in the Wider Caribbean Region (WCR), which is derined by the 1983 Conventionfor the Protection and Development of the Marine Environment of the Wider Caribbean Region,or Cartgena Convention, to include the Gulf of Mexico, the Caribbean Sea proper, and thosepart of the western Atlantic within 200 nautical miles of the Bahamas and Florida, down to thenortern border of Brazil.
A map of the Wider Caribbean Region is found in Figure 1, which also depicts the actual
(heavy lines) and hypothetical (th lines) maritime boundaries of the WCR states. i Except fortwo "doughnut holes" in the Gulf of Mexico, there are no high seas in the region. Severalimportt international boundaries have been agreed upon, but the majority are stil undecided.
In Section V, we employ ths base map as an heuristic tool for displaying certin informationabout the characteristics of the states of the region.
The Caribbean basin is home to a large and diverse marine ecosystem, including roughly14 percent of the world's coral reefs; the barrier reef system off Belize is the world's secondlargest, measuring approximately 220 kI in length. Throughout the region, the reefs receiveprotection from extensive and productive sea grass beds, which also provide grazing for seaturtles, manatees, fish, and invertebrates. Also characteristic of the region are coastal
mangroves that support a grazing food chain and provide nursery grounds for fish and shellfish,while trapping sediments and exporting nutrients (Elder and Pernett 1991).
The diversity of the region includes not only its natural marine systems but also atremendously broad range of cultures, languages, political systems, and economies. Forexample, the WCR is home to the world's largest and most diverse economy (the United States);to countries tht are among the world's smallest (St. Kitt & Nevis, Grenada, St. Vincent & theGrenadines) and poorest (Haiti, Guyana, Nicaragua); and to one of the world's few remaing
i We have adated and updated this map from Fenwick (1992). Hypothetica boundares are those identified
by the U.S. Deparent of State in its World Data Ban 2. In most caes, the hypothetica boundares are
approximate equidistat boundares, and they do not reflect any accptance by the U.S. governent. Some claimsmay be based upon unilateral assertions; these claims may be subject to change by national legislation or decree orthough international boundar negotiations. Boundares as represented are approximations for general referenceonly.
1
'TöQ'i:1-o..~o~i:e:ll::0-~'-'0o~=ro~õ'e:
-' 0g 0o
~o
o I'oo(.ooZ
~~.~š'o..i:~.v.0-§.õ'::v.
((oo
coao
_.::~=ro~ö:o..("Il..0:CJoIl:::Ao(Jõ'::r-Il0-Il'0~o0-~o3;V::~õ'~\0\0IV'-
2

communist states (Cuba).
Despite this diversity, however, and the existence of several distinct subregional
identities, there is a relatively high degree of regional interdependence. To a large extent thiscohesion is attributable to perceptions by, and pattern of trade with, the United States and othermajor parters outside the region (United Kigdom, France, Germany, the Netherlands,
Canda). For many years these trading pattern emphasized bananas, sugarcane, and otheragricultul products. Although these remain importnt regional export, in recent decades they
have been joined by a variety of manufactured goods. Most significant, however, is the extentto which tourism has come to dominate a large number of WCR economies, with cruise tourismbecoming an especially powerfl unifying force thoughout much of the region.
As in all regions of the globe, local situations and priorities are reflected in the mi ofland-based marine pollution problems observed within the region. In addition to agrochemical
runoff and discharges of industrial effluents, characteristic conditions include poor sewagetreatment facilities; increasing urbaniztion, especially in coastal areas; upland erosion; anddeforestation (UNEP 1989a, 1994a). Even the region's tourist industr, which relies uponperceptions of a pristine environment, itself contributes substantially to degradation of the coastalenvironment in a variety of ways, including inadequate sewage treatment at tourist facilities,coastal erosion from beach dredging to accommodate accelerated hotel constrction, tag of
corals, and daage to corals by anchors, spearfishing, and ship waste.
Growing recognition in the 1970s of these and other environmental problems led to theadoption, in 1981, ofthe Action Plan for the Caribbean Environment Programe (CEP). Initialfunding for the CEP came in the form of "seed money" from the United Nations EnvironmentPrograme (UNEP), but gradually the governents of the WCR have taken over responsibiltyfor fuding and management of the program. Among the signs of the regional governents'"clear commitment" to the CEP, UNEP cites regular contributions to the Caribbean Trust Fund,which support the CEP, and ratification of the Cartgena Convention, which entered into forcein 1986, along with a Protocol concerng Co-operation in Combating Oil Spils in the WiderCaribbean Region (UNEP 1991a). Negotiation of a second protocol, on Specially ProtectedAreas and Wildlife, followed in Januar 1990. This report is intended to advance the basis forprogress in discussions among the WCR states toward negotiation of a thd protocol to the
Cartgena Convention, concernng land-based sources of marine pollution in the region.
¡~
,
B. Purpose of the Study
In May 1993, the US Environmental Protection Agency's Office of InternationalActivities awarded study grant assistance to the Marine Policy Center (MPC) of
the Woods Hole
Ocenographic Institution to compile inormation and produce analyses to enhance the
3

effectiveness of an international protocol for the control of LBMP in the Wider CaribbeanRegion. The analyses have been guided by four principal study objectives:
(1) a review and summary of LBMP problems to detennine common problems and priorityproblem areas;
(2) a survey of broadly defined environmental inrastrcture to help identify nationalcommitments and national capacities to prevent, reduce, or control LBMP;
(3) a survey and analysis of subregional differences in commitment or interest in regional
control of LBMP, to help direct and motivate recommendations for protocol mechanisms;and
(4) a comparison of program approaches from other regions, especially the Baltic, NortSea, and Mediterranean, providing lessons from which an effective program for theCaribbean might be designed.
Special attention to program experiences in the Baltic, Nort Sea, and Mediterraneanregions reflects the fact that these were the first regional environmental programs on LBMP tobe evaluated on a comparative basis, in a study also undertken by the Marine Policy Center(Broadus et al. 1993). That study identified precisely what effort have been made in these theeregions, what has worked best, what has not worked, and why. These lessons are displayed inTable 1 and are referred to thougho~t ths report, directly and indirectly, as we develop ouranalyses and recommendations concërnng an effective LBMP protocol for the Caribbean. Weemploy the tenn effective in the sense used by Broadus et al. (1993), where it refers to thedegree to which the program's actual effect achieves the program's goals. 2
C. Study Approach and Organition of the Report
Of all the lessons listed in Table 1, perhaps the most fundamental concerns the existenceof differences among states in outlook and capabilty, and the importnce of program design toaccommodate these differences and thereby serve the real national interests of participatig states
2 This definition is consistent with that developed by Bernauer (1995). Bernauer defines effectiveness as the
extent to which, holding other factors constant, an intitution contributes to "goal attinent." Goal attanment canbe meaured as the difference between, for examle, the quaity of the mane environment prior to the
implementation of a protocol and its quality when protocol effectiveness is evaluated.
4
Table 1
Lesons Lerned from a Comparative Assessment of LBMPin the Baltic, Nort Sea and Mediterranean
Clarity
Capacity toevolve
Politicalcoii tment
speciticityorobjectives
Scientificinvolvement
self-interesttest
Mechanisms~or trade
Reportingandcompliance
Transparency
Limitexpectations
Costly misunderstandings, false start and wasted effort can be avoidedby seeking maimum clarity in defining proram qoals, the relationsamonq parties, measures and rec01endations, and the role of thesecretariat. Particular effort should be made to excise hidden agendas(eq., if income transfer or lobbying of governents is to be a programobjective, this should be set out clearly and incorporated explicitlyinto program desiqn).
The ability to adjust the program to changed circutances and improvedknowledge is vital to its effectiveness over time. The method ofkeepinq the framework convention quite spare and leaving programelaboration to subsequent protocols, directives, recommendations, orflexible action plans is useful in this reqard.
Program effectiveness will depend inevitably on the political commitmentof the parties. Examples of movement toward enhanced effectiveness wereobserved in all three regions as a result of collective politicalintervention by parties at a ministerial level. The devJ.ce of anoverarchinq, hiqh-level political fnru above tb& reqionel program, asin the Nort Sea COnference.., appears tC' have been useful in thisreqard. Such a foru also provides a hiqhly-visible focal ('int forpublic pressure, and i t contrib~tes to program transpar.ency, whichenhances the relevance and effectiven6ss of public pressure.
Demonstratinq effectiveness and clarity in its measures is importntboth in sustaninq proram support and in operational programimplementation. For this it is necessary to specify objectives whoseaccomplishment can be measured and demonstrated. Targets and timetablesare useful. especially if they are sensitive to differences in thestakes and economic capabilities among the parties. Black lists andqrey lists are useful in spcifying the scope of concern, but experiencehas pointed to the need to narrow program focus in practice to prioritytarqets (sometimes called "red lists").
A mechanism for expert scientific input and advice is essential, toclarify the nature and magnitude of problems and to monitor changingconditions, but it is important to assure that scientific researchinterests do not altogether run away with program resources. Thepersuasive establishment of baseline conditions, both in term ofambient measures and emissions, must be a priority, as demonstrated bythe hindrances created by shortcominqs in doinq so in all the casesexamined. It should be recognized that the baseline profiles can beuseful even if somewhat crude, and that assembling credible baselineswill be expensive and time consuming.
States can be expected to serve their own self-interests, but programeffectiveness will be improved to the extent that program design takesaccount of this and explicitly seeks to accommodate the genuine (ratherthan presumed) self-interest of its parties. Program structures thatencourage or accommodate agreements and actions by sub-groups ofparties, that allow for flexible financial or technical assistance, orthat provide explicitly for variable schedules or an "opt out" option onsome measures, may also be helpful in this regard.
Because the seir-interests of states will dirrer, and because one of theprincipal rationales for collective action is to facilitate sharing andexchange, program effectiveness will be enhanced by provision ofmechanisms for explicit "trade" (quid pro quos, specialization) amongparticipants. Similarly, efficiency is served by implementationmeasures that take into account differences among states and thatfacilitate trading to accomplish mutual objectives (such as tradablequota schemes). Implicit trades or explicit quid pro quos lly beachieved through program funding schemes.
Assessing the degree of state compliance with program recommendationshas been obviated in all three cases by the poor performance of statereporting. Special emphasis in program design should be placed onspecifying expectations for compliance, means for monitoring compliance,and particularly, procedures that encourage accurate and timely statereporting. In this reqard, keeping the reporting burden simple and at aminimum is "important. It may also be useful to assure that the resultsof reporting are useful to all parties and to suggest a reporting systemthat meshes routinely and automatically into the states' own practices.Some provision for non-intrusive, third party inspection may also beuseful, though this is only implicit in the cases examined through theirlack of success with more conventional, passive means of collectingstate reports.
Most of the lessons proposed above speak to the value of transparency inprogram desiqn and execution, but it warrants explicit inclusion.Program effectiveness is enhanced (both in term of party state supportover time and of verifiability by other interests) by the maximumtransparency compatible with the protection of proprietary interests andthe sovereiqn rights of independent states.
Regional programs in the real world can at best be catalytic. Measuresto control land-based Ilrine pollution will necessarily occur almo~texclusively through domestic actions. The programs may succeed as amedium for exchange and consensus among memers and as a promoter ofexternl funding support, which can be used to reinforce internationallyagreed program objectives and reward compliance. The effectiveness ofthe reqional trust fund device is not clear from the cases examined andmust be carefully questioned. Aqain, clarity of purpose andtransparency cannot be over emphasized.
Source: Broadus et a1. 19935

(the "self-interest test").3 Without a doubt, WCR States are seriously concerned aboutenvironmental quality regionwide, but they are even more concerned about and motivated to acton activities that impinge upon or otherwise threaten the use of ocean resources within their ownjurisdictions .
Land-based marine pollution problems typically, and in the first instance, are treated asprimarily a domestic issue. Although a state may suffer from marine pollution generated by
other states or may benefit from actions taken by another state to improve its own marineenvironment, the existence of such externl effects does not signal automatic agreement oncollective actions. Rather, such actions must be perceived as beneficial by individual states iftheir participation is to be secured.
The data, analyses, and recommendations presented in this report reflect the followingbasic assumptions about the essential factors that shape a state's perceptions of the likely benefitsof participating in collective actions to control LBMP and its prospect of actually realizingbenefits:
A state's effective commtment to regional control of land-based marine pollution may be takenapproximately to be a fuction of the potential impacts it most feas from marine pollution, theproportion of its-population or economy most exposed to such impacts, its degree of trans boundarexposure to inputs from other source states, its own relative contribution as a source, its ownendowment of institutional and economic capabilties to tackle the problem, and the additionalresources or benefits that might be made available to it through exchange with regional nèighbors.
(MPC 1993).
These key factors wil tend to differ across the region, particularly in a region as diverseas the Wider Caribbean.
Our starting point for analyzing importnt differences among individual states orsubregions of the WCR is a review and summary characterition, in Section II, of the region'snatural systems and most significant LBMP problems, including their principal sources anddistribution. Special attention is devoted to inventories of selected domestic and industrial point-source pollutat loads for 25 of the WCR states, as collected and analyzed by the Program forMarine Pollution Assessment and Control (CEPPOL).
The evidence to date indicates that most land-based marine pollutats are not tranported
far from their sources of discharge, and that tranboundar pollution, where it occurs, appears
3 We adopt the perspective in this report that states are naturally "self-interested." The key to an effective land-
based mae pollution protocol is to haress the natural self-interest of these states to prevent, reduce, or controlmaine pollution.
6
to be confined to border regions.4 The potential remains for a generalized "pollution" of theWider Caribbean to develop or to be detected as more data are systematically collected, whichwould strengthen the case for a regionwide approach. Neverteless, an LBMP protocol for theregion can be effective if it focuses on tranboundary pollution problems at the subregional level
or on the numerous incidences of problems of a limited areal extent, whose resolution couldbenefit from shared experience or attention. The appropriateness of a focus on common, but notnecessarily transboundary, LBMP problems is reportedly acknowledged and planed for by thenegotiating parties (Wood-Thomas, pers. comm., 1995).
Much of the published literature and written records of WCR discussions have focusedon the establishment and implementation of a regionwide approach to the prevention, reduction,or control of LBMP. In Section III, we critique several of the more commonly advancedarguents and proposals and caution againt those that are not substantiated by environmentalrealities or do not reflect a balanced perspective on the costs and benefits of uniform approachesfor individual states. We argue that one of the most importnt challenges facing the ContractingParies is to correctly characterize the scale of LBMP problems and faciltate identification andimplementation of appropriate solutions at the subregional leveL.
Sections IV and V are concerned with the identification of commonalities andcomplementarities-environmental, economic, and institutional-that can serve as the basis forsubregional collaborations and exchanges. In Section IV, we present a broad range ofeconomic, environmental, and natural resource data for 37 political units, or states, in the WCR,as well as information on their environmental laws, inrastructure, regulation, and enforcement;the extent of their participation in relevant regional and global organations; and the extent ofmarine scientific capabilties and NGO involvement and activity. Comparisons are made withinthe subregional framework established by the CEPPOL program to faciltate its analysis of point-source pollutant loads and distributions thoughout the WCR.
In Section V, we pursue three alternative approaches to identifying promisingopportnities for mutually beneficial collaborations, or "gain from trade." First, commonexport products and economic activities are identifed as a potential basis for collaboration onscientific reseach and pollution control approaches among states at similar scales of activity,or for technology transfer from states operatig at larger scales to those operating at smallerscales. Next, we consider the relative identities of WCR states as polluters and pollutees withnthe CEPPOL subregional groupings, according to the approach developed by Broadus et al.(1993). Specifically, we estimate the extent to which each state is a source of LBMP, ha astae in controlling the problem, and has the economic capacity to tae corrective action. Our
4 We employ a broad defintion of tranbounda pollution to include direct impacts from discharges, impacts
on straddling fish stocks (including potential destruction of nursery areas), damge to export goods, impacts ontoursm, diminished passive use values. See Broadus and Varov (1994) for a description of potential daagesfrom transboundar pollution occurrences.
7

analysis yields several ilustrative examples of key match-ups among source, stakeholder, andfaciltator states (i.e., major trading partners or aid providers) with and across subregions.Finally, we develop a rating system that taes into account not only the size but also thedirection of a state's economic incentive with respect to controllng LBMP, and not only itseconomic capacity but also its intitutional capacity to underte corrective action. Although therating system is rather crude, the results are useful for predicting which states are the most likelyto engage in sustained and successful action to control LBMP and, for the other states, thegeneral categories of assistance or special inducements that each is likely to need in order toparticipate successfully.
In Section VI, we apply to the Wider Caribbean Region the lessons learned about
program effectiveness (Table 1) in the earlier, comparative study of programs in the Baltic,Nort Sea, and Mediterranean regions. We present a checklist of importt factors in theemain categories-relevant regional background characteristics, program design elements, andindicators of program effectiveness-and compare these factors with expectations about aprotocol for the WCR, based upon regional realities and the state of the policy debate over theestablishment of an LBMP protocol.
Following the main text of the report are thee appendices that provide additional dataor furter explanation of certin portions of the text. Appendix A contains a number of datatables that support the discussions in Sections iv and V, and Appendix B explains our approachto estimating the proportions of each state's population that live within the drainage area and thecoastal zone of the Wider Caribbean Region. (The information in Appendix B is relevantpriarily to the discussion of "Sources and Stakes" in Section V, but also to the review of
LBMP inputs in Section IV). Appendix C supplements the discussion of "EconomicCommonalities" in Section V with a stylized model that examines the effects of propert right
distributions, burden of proof, and lack of clarity in property rights on the range and extent ofpossible "gain from trade" to be realizd from agreements intended to reduce or control LBMPemissions.
Finlly, we note the availabilty of thee additional appendices not included with ths
report. These are papers prepared by consultats to the Marine Policy Center project to serveas the basis for discussions at a regional workshop of expert held at the University of the WestIndies in Barbados in December 1994, and also as expert source materials for the preparationof ths report. Gladfelter and Ogden (1994) provides a summary of the relevant scientificcapabilties and current knowledge of LBMP problems in the Wider Carbbean. Kiball (1994)presents an overview of the key functions, intitutions, and processes involved in the design andimplementation of an interntional protocol on LBMP. Mandell (1994) surveys the importntLBMP problems, legal instrents, and intitutional capabilties of the Spansh-speakingcountries of the WCR. Copies of each of these papers are available on a limited basis from theMarine Policy Center.
8

II. Natural Systems, Pollution, and the Interdependency of WCR States
A. Regional Geography and Freshwater Input
The Caribbean Sea is defined by the margin of Central and South America and the
Greater and Lesser Antiles Islands. The Caribbean Sea contains four deep basins separated by
prominent undersea ridges. Together with a fift basin, the Gulf of Mexico, ths larger waterbody comprises the American mediterranean, one of four mediterraneans on eart (the othersare the Arctic, the Asiatic, and the European mediterranean). A stil larger entity surroundingthe Caribbean is the Wider Caribbean Region (WCR), which adds to the Americanmediterranean the Bahamas and par of the sea off the Guianas. The WCR is defined in theCartgena Convention as comprising "the marine environment of the Gulf of Mexico, theCaribbean Sea, and the areas of the Atlantic Ocean adjacent thereto, south of 30° nort latitude
and within 200 nautical miles" of the Atlantic coasts of states from the Bahamas and Floridadown to the nortern border of BraziL. 1
The Wider Caribbean Region encompasses an area of 4.31 millon ki2 and has a meandepth of 2174m. The drainage basin, from which freshwater is delivered to the coast, has anarea of about 5.6 milion ki2, of which the largest portions are in the United States (62%),Venezuela (17%), Colombia (4%), and Mexico (4%). While not formally incorporated into thedefintion of the WCR, the lands draing into the marine area are clearly of. importce tomanagement of this area, and particularly so in a discussion of land-based pollution. Of thepricipal rivers entering this area (Table 2), which collectively deliver about 66,500 m3/sec offreshwater, 45% comes from the Orinoco (Venezuela), 28% from the Mississippi (U.S.), and11 % from the Magdalena (Colombia). Fifteen rivers comprise the remaining 16% of riverineinput. An additional, undefined freshwater input enters from the lagoons, mangrove swamps,and bayous that make up a large portion of the coastline, especially along the nortern YucatanPeninsula, eastern Florida, and the nort coasts of Colombia and Venezuela.
Also signficant is the freshwater input originating from the Amazon River, which \stechncaly outside of the Wider Caribbean Region defined by UNEP. The Amazon dischargeapproximates 170,000 m3/sec of freshwater on average, of which a porton enters the Carbbeanalong the coast near Trindad and Tobago. Froelich, Atwood, and Giese (1978) estimate thatabout half of the freshwater entering the Carbbean Sea, evident as salinty depressions extendingto about 100 m depth, is from this source. This water also contain signficant quantities ofdissolved silca, an importt nutrient for certin phytoplankon.
lA stil larger area, incorporating pars of the Sargasso Sea and Bermuda and the Gulf of Panam, is referred
to as the Intra-Americas Sea by IOCARIBE, the Carbbean and Adjacent Regions Task Force of theIntergovernental Oceanographic Commssion (IOC) of UNESCO.
9

Table 2
Principal Rivers Drainng Into the Wider Caribbean
River Draiage Water Sediment Specific Mea tubidityArea (km?) Discharge discharge tranport (mgll)
(m3sec-l) (106 tons/year) (tl2/yea)
USA
Mississippi 3,268,000 18,400 222 76 380
Apalachicola 44,000 620 0.16 6.8 15
Mobile 97,000 1,500 4.5 42 95
Brazs 114,000 160 15.9 0.14 3200
Colorado 107,000 79 1.9* 17.9
USA-Mexico
Rio Grande 467,00 23 very low*
Colombia
Magdaena 235,000 7,500 234 1000 1000
Venezuela
Orioco 950,000 30,000 85.0 91 90
*Low values due to dam.Sources: Borgese and Ginburg, 1982; UNEP, 1994a.
10

In addition to freshwater, rivers naturally deliver suspended sediments to the sea. In thecase of the Wider Caribbean Region, large amounts of sediment are delivered by the Mississippi
(222 milion tons/yr), the Magdalena (235 milion tons/yr), and the Orinoco (85 millon tons/yr;UNEP 1989a). The Amazon discharges a large quantity of sediment, of which some portionfinds its way into the WCR. For perspective, the dredging required for maintenance of all U.S.navigational waterways and harbors entails about 270 millon tons/yr (see Herbich 1992), someof which is disposed of at contained sites on land (see Mangone 1990:189). At the river'smouth, both freshwater and its suspended and dissolved loads become entrained in and dissipatedby the prevailng coastal and ocean circulation pattern. In the case of the Mississippi, theOrinoco, and the Amazon, sufficient water volumes are involved tht the fate of the river plumeca be detected remotely using satellte imagery (Müller-Karger 1993). River discharge directlyor indirectly affects sudace salinty, concentration and composition of phytoplankon, plantpigments, and suspended sediment concentration. Available satellte imagery shows the Amazonplume moving nortward along the Guiana coast from Februar though May (when the Nort
Equatorial Counter Current is weak), directly entering the Caribbean though passages betweenTridâd and Tobago and the mainland, and engulfing these islands and the island of Barbadosas well. Durig this time surface salinty at Barbados may drop from 34 0/00 to 31 0/00 (Hunte1994). From June to January, discolored water originating at the mouth of the Amazon veersoffshore near French Guiana and curves eastward into the open ocean, in a plume that can bedefied on satellte imagery in terms of its pigment concentration. According to Müller-Karger
(1993), ths period corresponds with the clearest water conditions at Barbados.
The Orinoco River also has a strong impact in the eastern Caribbean Sea, varyingseaonally with discharge. During the dry season from February though April, the Orinocooutfow enters the Caribbean between Trindad and Venezuela moving westward across thesouthern Caribbean. Eddies in the tropical Atlantic at this time can move Orioco wateroffshore to the east of the Antiles, engulfing Barbados in pigment-rich water during January-March. During the period of maximum discharge for the Orinoco, the Islands of Trindad,Tobago, Grenada, and St. Vincent are regularly affected. Imagery taen in October 1979 showsa plume of Orinoco water extending nortward nearly to Puerto Rico, along and west of thesubmerged Aves Ridge.
From other satellte imagery, Müller-Karger (1993) concludes that the Mississippi plumeordiny moves westward along the Texas shoreline. An October 1982 image of the Western
Carbbe shows dispersal of the Magdalena River plume, normally following the coast to thewest, extending nortwest intead, nearly to the Island of Jamaica. Clearly, much more is tobe learned from additiona and increasingly sophisticated satellte imagery.
The above demonstrates that the pathway exists for waterborne materials to travel greatdistances in the WCR, with measurable impacts on phytoplanon chlorophyll concentration,salinity, turbidity, and concentrations of certin chemicals. The extent to which human affect
11

the quantity or composition of river water suggests the extent of transboundary containationof marine waters in the WCR.
B. Ocean Circulation
The major ocean surface currents of the Caribbean area have been known in broad brushfor many years (e.g., Figures 2-5). These currents in general enter the Wider Caribbean Regionfrom the open ocean to the east and along the norteast coast of Brazil and the Guianas. Waterfrom both the South Atlantic and Nort Atlantic enter in ths way, ultimately feeding into theGulf Stream in the Straits of Florida in about equal quantities (Richardson, pers. comm., 1994).These surface currents establish a seemingly clear relationship among "upstream" nations to theeast and south and "downstream" nations to the west and nort. However, as ilustrated below,
ths gross understanding of surface circulation in the Caribbean is clearly incomplete, andimportnt refinements wil come from ongoing and future oceanographic research in this area,such as studies under way by IOCARBE (Maul, pers. comm., 1995).
For example, importnt departres from the general east-to-west surface circulationpattrn exist as a result of gyres along the coasts of Panama, Colombia, and Venezuela,
producing west-to-east inshore components of drift. Simlarly, eastward-moving back eddiesexist along the south coast of the Greater Antiles Islands. These natural pattern of circulationresult in trnsboundary exchange from Belize to Guatemala and Honduras, and from Nicaraguato Costa Rica, Panaa, and Colombia.
Deep water in the Caribbean is believed to enter periodically though the deeper passagesof the Lesser Antiles. Circulation in the deep water is probably far more quiescent than for
surface waters. Thus, the deep water occupying the four basins of the Caribbean Sea, whichlies entirely within the exclusive economic zones (EEZs) of adjacent coastal states, is subject tothe impacts of human activities in ways that are not well understood.
C. Weather and Atmospheric Circulation
Like the surface ocean circulation, prevailing easterly tradewinds result in an upstrea-downstrea relationship among nations in the Wider Carbbean Region. Lad-basedatmospheric pollutats, such as industrial stack effuent and other point source gases and
pariculates, as well as non-point source pollutats such as chlorinted hydrocarbon pesticides,are relevant to a discussion of tranbounda atmospheric containtion.
Between 1886 and 1986, 492 hurrcanes (storm of tropical origin with a cyclonic windcirculation of 75 mph or more) have theatened or actually reached the Wider Caribbean Region
(see Gray 1992). Damage caused by hurcanes results from direct impacts of wind (and theassociated cargo of wind-blown debris), torrential rainall, and ocean waves and storm
12

_~ _ tV 7f\ .; T ,.
. ._.
. .t .
.,. l"
íf I
D: \
. j .
1 \ i
.',..... ~~ftrr..2~~~:~~Jlr~r.:~1 i irl \ \t; íì(\ .~ ' ~y
,: ~_ ~ :. '~I -'I,!. ,) " " ¡; ~ \\ '. --
~. ~~.~~fi:' I,r ¡ (\ 't '.'.1;CS(L\\ ~"'~"f"" \ \ l-'
I. ~
:- t.
. 1 ~
~ ¡
ì ii',
'.. V
.. ,
'.1 "
OA
\1' I
I "'
~\ \
LJ
" . _
'" "
'; \\
t\' ~
., 'i
,¡ \
i . J
- "-
,-1
i .,.-
-. .-
---
-; r / Lsi i) ~: ," "oJ \ ..... ~- \~. \! '" r" " , I \ \
, j L \ i · ; ~ ' --' _... 'Î
~~
-K"t
-1:-
~~
~j.l
l)~,~
.~,k
- ~
:~, V
'-'~
~'7
"'(,r
L \ .
_~,_
. ! .,
\~ _
.. , ;
\"'..
~"
.-~,
_.,,-
,.- ,.
---
I'i
, " .
~ ~
,. ,'"
- -
,.=
:~-.
... "
'0:-
- .-
--,.-
..."
.....
..-..:
--
--
i~'.
~ lL
.. ~
~ ";
. -, ~
~~9.
~"-
"...-
-- ..
.~. _
..~...
.....
......
... n
' ~..;
~- ~
\) \;
D L
fr \
..-0:
s¿:
~ir=~~ ~.."...~~ c~I:~ 1'.. "~~ I. 0,
, ' ---__4----.., --' ' '. 'Voõ*..; "",' . ..... "If
.' . .....~.;~', ~,~~ 'A"~. - ¡:i ~"'~~~~~ ", .. fo_ ~
,', .,
¡. t
. l\ 1
.,tA
l'íJ
- \ .
-, "
CO
' ,I Y
'.. X
" -
~ ;-
~ ,
. -..
~ "
'. ' \
-1fß
¡~))
1 ~:
t'~i:~
:P\ i
~~''\
. ~. =
~ :.
l.J'i:
~ l'
(! .
"-'..
'1--
-1--
-_1_
+--
'fil/-
",.:
,, Ji
WI '
J ~
- "
" :K
'" '.
~ .~
:- ~
. c: ,
~.~/.:.~.;~1ii.~i~~/:~.~~ ".;; ""l"'.,I~r..;~'-,~~._-.\ - 'i ~,.,'ø: -P ~4e,"' :~:\\¡:~~'..i., l!.: ,~.~ \ -IQ', .
.liÆ' .",;¡-i "~". 'f.~ '\.l " ';... \ ~ "'F.f-- t \ \
'tl.:.
rf.~
~...
. . '~
I"1.
~ ,!
.' ..
... _
l"~W
Aa
~JZ
iV~
--~
~ ~
~ \~
+-\
_!"_
- ''i
~ t
." ..
..,'Ç
.:.,/.
, R-'~
~=
~A
r.ûJ
LV N
1....
.' I"
... ~
\ 1\
\\_ ii ,~ :.:~;.t., ~;¡~-'¡., ;d~..~ _~ ~~. 1\)..0 -= .' ~I ji~ 'j; , J D.
w i-
""~
'( ..
.:l:~
. ..-
.W "
,:,' ~
u _,
or. V
~::r
.4~
"J~:;::'H'. ." .... . .. ,- ~ '. -. . "'
. . .'
:"(~
....£
f ~ ..
A -
"~
b ~
'."~
~I..
.JI~
~ft(
;P*Y
$11~
~L
~ ~
~ L
.=o.
't ~
.~..
'\ 0.
-- \
~~
. "J
~ ..
.. ,\¡
ir ~
.. 1v
,, ~
' .~
'-)'j
I Q
,, ~
~ ~,
~'",
-~' :
. ~_.
~ij
f'L I
-r
~'. .
: ., .
. ~.,4
11,
l.-
T. ,. ~ ~ 'F 00 rV~" ",~., ' ~"ol 1'X.:1, ~\~
~~
. ~
~1.
~~
Ú¡¡
~ )
1~~
~~
~l~
~~
~ _
\--
'- .,,'~,.~,' _~D-'.f_ 111 .1' .' ..., - ~ \
~1
_ ~
l :J
~'1
: .:'~
' . ,i
.) .w
~: ~
.'~
~1~
." '~
:f~~
~~
'~I"
'L':'
~~
"~H
,':I.:
ii\~
Ji~
:~l;'
;~,'1
~ilt
~,~
,;?:~
.!ç...
. .:;~
~l-~
~ ~
r ,. M,J .." r .... '".'~ i i . . .;v. '6 '.. '" - .." " . 'I"" (;Il' .. ¡", "-/. -,~
V ~
~--
\' ,:
'.~
¡¡
"'l';"
~'~
;~(~
¡~'~
' ~l ¡
.~~
.', ,
:,, :'
P,,:
i:~..~
. ';"
!~.~
.; ,
__ ,0 , . ,'.~ ~ . ,-., .."., " . ~i "eo' L- . --
I -- / ;' ...~ ,"~.' . ..,~ . ,y ,. ",,~ ~ --
1 V
to' .
'~'I,
i"f ..
' .1/
Y' .
..t...
"."
,.ìl~
:~..,
"..,
. .'.-
.....
'.' t.
...,
/' c:
' '..
~~.
.. ~
,,' .
''',.
~. .
.\ . .
:. "
'..., ,~ ~¡;" ,'" ,!:,";O: ' . ~ _... .' . - 0
" ~ "-." ~':i¡ ~ i I . .. -.' "" " . . .' . .
L I ~
60
1 ~
.~ i.
fr'~
.t~
:I~I'~
~'1
i "":
'~~
'~~
'~iJ
tI';I'
~~
~'4
¡ :~
:,,,"
: ..."
,;~~
~':,
~~
.L n
t¡. ~
\t~:
r~..
lm...
:..~
~..
.I~
~~. .
)ìt,
~ ,f
.' ,
. . '1
. \ "
':\, ,~ '1)' '., _1..JI'¡:i1 iJiN,., 'l,~ll\ 'i :.,. ~i '. ,,'fá"" ~\
, _ "
..". .
. ....
.. '.
..~i"
. ""'"
"£~
.,.~
.,"' "
.' ,.
.l.~
..~
\:~ .1
I i "
". I'!r. t ~lÆ~~I.:i~t~\1j)(i ):~"'~Iff..FÙ~ X~\'~:.'I..1M;~,~'~' _..~~~ ~.tJ'~. L.... . ;'"~ ~-o. . ~ \
, __ "" .-:.I_L::~i~f!_.::.I.. -- ....\ \ .f':i.I'.:~Jli . .., ..". .... .... 0
~~~
~,.
."
1f.
I.~
,ia..
..~'3
.Figure 2. Surface currents of the Wider Caribbean Region (March).
I
Source: IUCN, n.d.

..oJC)i-:lo
en
r-oJi::li-'-i:o.,00oJ~i:CloJ.....,i-ClU
lioIILli:oJi-i-:lC)
oJC)Cllii-:l
en
C'

.'1i:
.""$-Q)
~Q)W0.Q)en'-
'.. .t
i:o-r00Q)ø:i:elQ).0.0-r$-elU
Q)..w~o

i:
zu~HQlCJl-;io(/
..oCOLIi:Qll-l-;iCJ
QlCJII..l-;i
Cf
irQll-;iCl-r"'

surge-each of which has caused social havoc though devastating loss of crops, housing, civilinrastructure, and human life. The "hurricane season" for ths area is June though November,with peak hurricane incidence in August, September, and October. The economic impacts ofthese storms, and the associated human suffering, have been very severe. The shared naturalhazard represented by hurricanes suggests there are regional benefits to be derived fromcooperation in hurricane prediction and monitoring, damage relief, and natural hazard standardsfor industrial siting and construction (especially where use or storage of hazardous materials areinvolved).
D. Spatial Scales of Pollution in the Wider Caribbean Region
In our discussion of regional approaches and opportties to addressing land-based
marine pollution problems, two separate categories of issues are germane:
a) pollution problems of large areal extent, with regional transboundary
implications, whose resolution calls for action over a spatial area larger than oneor two nations; and
b) pollution problems of limted areal extent, but numerous localized occurrencesthoughout the region, whose resolution could benefit from shared experience orattention.
In the WCR, by far the most serious damages caused by effluents from land-basedsources ocur locally, with the territorial sea or exclusive economic zone of the source state.2Most land-based marine pollutats are not transported far from their sources of discharge, andtranboundary pollution events, where they occur, appear to be confined to border regions.
Overviews of land-based regional pollution in the Caribbean are given by several recentUNEP papers (see UNEP 1994a and references therein; WWF/ESI 1994 and references therein).The defintion of pollution problems in some existing report is blurred, with a resultingconfion of specific sites, sources, or pathways of pollution. For example, the identificationof cholera and inectious hepatitis as importnt land-based mare pollution problems in theWCR seems to ignore the distinction between contate dring water supplies and
contated coastal waters, as well as the geographical boundaes of the WCR. References
to inadeqtely treated sewage in some cases are based upon an a priori assuption tht
seconda wastewater treatment is the sole acceptable option for domestic wastewater disposalin the WCR. Natual processes that lin national jurisdictions are sometimes interpreted as
2 For example, in 1992, Jonathan Canon, the director of the U.S. Gulf of Mexico Program, was quoted as
saying: "(t)he general judgment, I believe, is that the gulf is not in a crisis state, although there are locaiz crisisarea" (BNA 1992).
17

tataount to a demonstration of transboundary pollution. And naturally occurring phenomena
such as red tides, ciguatera poisoning, natural diseases in corals and other marine anials,seagrass die-offs, and certin mass mortlities in the sea (cf., Brongersma-Sanders 1957), aretaen as evidence of human impacts. Effectively setting priorities and addressing abatement ofexisting pollution problems and their prevention in the future requires clear and techncally sounddefinition of the pollution problems or their potential to develop.
Gladfelter and Ogden (1994; see Appendix D) divide pollutants into two categories; a)enrchment of naturally occurring substances, and b) introduction of new containants. Theseauthors appropriately include other human-derived stresses, such as over-fishing and mangroveclearing, as sources of pollution. According to the US National Oceanic and AtmosphericAdminstration (NOAA), the following sources should ultimately be included in a pollutantdischarge inventory:
a). Point sources (industr and wastewater treatment facilties)
b) Urban non-point runoff (stormwater runoff and combined overfow discharges)
c) Non-urban non-point sources (agriculture and forest runoff)
d) Upstream sources (pollutants carried to the sea from inand sources)
e) Irrgation return flows (agricultural pollutants carried in irigation runoff).
To ths list should be added pollutants carried in direct groundwater discharge to the sea.
According to UNEP (1994a), the major land-based pollutants entering the Caribbean are:sewage, hydrocarbons, sediments, nutrients, pesticides, litter and marine debris, and toxicwastes.
Perhaps the most widespread coastal pollution problem globally is nutrientoverenrchment. It is also among the most common marie pollution problems in the Caribbean,where nutrients are added as sewage discharge and runoff of dissolved fertilizr. (Fertilizr use
is estimated to have increased 33% between 1979 and 1989.) Neverteless, nutrientoverenrichment, though widely occurring in the WCR, is believed to be a problem of localizedscale at the present time, as is the case in most regions of the globe.
Altered sediment delivery to coastal waters can have negative impacts, if increased, onmangrove, seagrass, and coral habitats; and if decreased, on deltaic wetlands. Clearing of forestlands, ming operations, and ocean disposal of dredged materials are sources of sediments thatare known to be increasing at the present time. (See Cortés and Risk 1985 for a discussion ofthe effects of deforestation on reefs.) Reefs near the Centrl America coast and areas of the
18

eastern Caribbean are believed to be suffering from sediment stress related to agriculturalpractices and tourism development, but it does not appear that the problem involves
transboundary or regional spatial scales. CEPPOL pilot studies intiated in 1992 at four regionallaboratories in the region may shed additional light on the impact of various pollutants, includingsewage, oil, and particularly sediments, on reefs and other coastal ecosystems (Mandell, pers.comm., 1995).
Disposal of sewage in coastal waters is a topic of great concern internationally, but alsoa topic of significant misunderstading. The two major elements of concern regarding sewageare public health and nutrient overenrichment (in extreme intaces, excessive organc loadingca be an issue as well). Combining industrial and domestic waste streams can compound the
problem by adding chemical toxicity to the above problems, which can frustrate effectivewastewater treatment and recycling and add an additional environmental impact. Where tourismand aesthetics are particularly importnt, sewage disposal can become a charged issue.Moreover, an emphasis in some quarters on deploying standardiz or best availabletehnologies has helped promote the idea that low-cost solutions to handling domestic wastes,such as on-site disposal in leaching beds, are ineffective, and that expensive high-technologywastewater treatment plants are always preferable. These perceptions are neither techncally
correct nor in the public interest. A more balanced and inovative view of wastewater treatmentis evident in UNEP (1991b). Salas (1994) points out, appropriately, that standard secndarywastewater treatment facilties do not eliminate nutrients from the effuent stream, often addtoxic disinectants for pathogen control (with undesirable secondary environmenta impacts), andleave disposal of solids (sludge) as an unresolved separate problem. Modem wastewatertreatment facilties are costly to build, operate, and maintain in monetary terms and in terms ofenergy and freshwater consumption.
We are not aware of any regional-scale impacts of sewage disposaL. Neverteless, acontinuing dialogue on suitable wastewater handling practices and technologies in the WCR isa neeed and appropriate element of regional collaboration. A key question is the determationof appropriate water quality standards. For example, certin bacterial standards, such as thefecal coliform water quality indicator, can give a high result tht is often falsely attibute to
human fecl containation where it does not exist, rather than to any of a number of other likelysources, such as warm-blooded anals and naturally occurring sediment bacteria.
According to Gladfelter and Ogden (1994), thermal pollution from power plantsrepresents a localizd but widely occuring problem in the WCR.3
3Reseach undertaken for the present study, as reported in Section IV of this report, indicates that thermal
pollution is a concern for Barbados, Colombia, the Dominica Republic, the Netherlands Antiles, Puerto Rico, St.Lucia, and the US Virgin Islands.
19

Oil hydrocarbons represent a pollutant category that one might expect to have regional-scale implications. For example, a 1979 collsion of the tank vessels ATLANTIC EMPRESand AEGEAN CAPTAIN near Trindad and Tobago spiled an estimated 300,000 tons of oil intothe ocean (Famighetti 1995), or approximately eight times the volume of the well-known 1989EXXON VALDEZ spil in Prince William Sound, Alaska; and oil released in the 1979 Ixtocwellhead blow-out accident in the Gulf of Mexico was about 16 times the Valdez spil. Neitherof these spils has received significant attention in the discussion of pollution or habitatdegradation in the WCR, however, including UNEP's (1994a) review of hydrocarbon pollutionin the WCR. Of course, the UNEP report focuses on land-based sources of pollution;nonetheless, it does include discussion of natural seeps entering the Caribbean (citing Harey1987) at a depth of 150 to 250 m (amounting to an estimated 1 millon tons, or 27 times thePrince Willam Sound spil).
The distribution of tar and dissolved/dispersed hydrocarbons was the subject of a majorsix-yea study by CARPOL (Atwood et al. 1987). The study revealed interesting trends in thespatial and time distribution of hydrocarbon residues. Neverteless, Gladfelter and Ogden(1994) conclude, "While pollution of this sort is unsightly and deadly to some large marineanals, it is not among the highest priority problems affecting the coastal ecosystems: the coral
reefs, the mangroves, and the seagrass beds." UNEP (1994a) concludes: ". . . inormationrequired to ascertin the ecological and health risks caused by long-term chronic oil discharges
into the coastal marine environment of the WCR, is stil very limited. . . ."
E. Subregional Scales of Pollution and the CEPPOL Pollutant Load Inventories
UNEP's 1994 Regional Overview of Land-Based Sources of Pollution in the WiderCaribbean Region (UNEP 1994a) sumarizes the results to date of national inventories of land-based mare pollution in the WCR as reported by the Program for Marine Pollution Assessmentand Control (CEPPOL), which is administered jointly by UNEP and the IntergovernentalOceanographic Commission (IOC). For purposes of assessing the geographical distribution ofthe pollution load and analyzing the results, the CEPPOL program divided the WCR into sixgeographic subregions (see Figure 6). With ths arangement, thee political units aredesignate as falling into more than one geographical subregion: Mexico spans Subregions I andII (Gulf of Mexico and Western Caribbean); Cuba spans Subregions I and il (Gulf of Mexicoand Norteastern-Central Carbbean); and the Netherlands Antiles span Subregions IV and V,with the islands of St. Maaren, St. Eustasius, and Saba assigned to the Eastern Carbbeansubregion (IV and the islands of Bonaire and Curacao to the Southern Caribbean (V). 4
4A1though not listed in Figure 6, Aruba, a member of the Netherlands Antiles Federation until 1986, is included
by CEPPOL as a separate politica unit within Subregion V.
20

ATlANTIC
OCAN
I'ICOCAN
\ (?.~ 0 __ D .. .'I~ \ ~ .'z \ ~~ .Sub-Region II \S~b-..R . IV~. \ .. . u egion~ ~\ ~~ -? - - Sub-Regioo"V. - \.: .\ '....\
m. Nonhea and Cetr Cabbe
Cuba, Mexco and the Unite State
Belize, Costa Rica, Guatemala,Hondur, Mexco, Nicagua andPanBa, Caym Isds, CubaDomica Republic, Hati, JamcaPuer Rico and. Turks and CacosIslands
i. Gulf of Mexco
D. Weste Cabbe
IV. Eater Cabbe Angu Antigua and Bauda,Baos, Bntish Virn Islds.Dominica, Grenada. Guadaloupc,Maque, Monse 51. Maa.St. Luci, St. Kius and Nev, 51.Vincet and the Greines and USVirin Islds
V. South Cabbe Colombia, Netherlal\ds Antilles,Trida and Tobo and Venez
VI. Equatona AtlticFrech Guy, Guya and Sunne
Nor Wes
Figure 6. CEPPOL-designated subregions (Source: UNP 1994)21

As of 1994, the CEPPOL program had compiled data on biological oxygen demand
(BOD), total suspended solids (TSS), total nitrogen (TN), total phosphorus (TP), and oil andgrease inputs from domestic and industrial point sources in 24 WCR countries, and from pointand non-point sources combined in the U. S. Gulf Coast region. Additional information, suchas the presence or absence of phenols and various heavy metals, was also recorded though notquantified. The results, as summarized in the 1994 UNEP Regional Overview, are displayed inTables 3 and 4.
In considering the results, some importt limitations of the data should be taen intoaccount, especially: the non-comparabilty of data for the U.S. Gulf Coast; the absence ofcertin countries and of an entire subregion from the inventory; and the lack of inormation asto the basis for normalizing the data. S
Attempts by this study to ascertin the point-source share of U.S. Gulf Coast pollutantloads have been unsuccessful, but it is useful to bear in mind that non-point sources have beenestimated to contribute between 70 percent and 90 percent of the nutrent loads (i.e., nitrogenand phosphorus) entering the Gulf of Mexico from U.S. land-based sources (Broadus and
Vartov 1994), with industrial-scale agriculture being by far the largest of the non-point sourcecontributors. For certin other countries in the WCR, the proportion of all land-based nutrients
from non-point sources can be expected to be substantially greater than in the United States,because of such factors as the generally lower availability of domestic septic and municipalsewage treatment facilties and, in some countries, the more intensive use of fertilizers. Similarfactors hold true for non-nutrient pollutants from non-point sources, particularly pesticides, theuse of which has been dramatically curtiled in the United States in recent years but remainsintensive in Venezuela, Mexico, and the Central American countries (Henao et al. 1993; UNEP1994a).
The subregion completely missing from the inventory is Subregion VI (the EquatorialAtlantic Nort West), which includes French Guiana, Guyana, and Suriname. To the extent thattransboundary pollution effects do exist, it is unfortnate indeed not to have any data onpollution sources within the subregion that is the furtest upstream of the six subregions in theWCR. Also missing from the inventory are data for Guatemala and Nicaragua (Subregion II);the Bahamas, the Cayman Islands, and Haiti (Subregion III); and Anguila, Martinque,Guadeloupe, and Montserrat (Subregion IV).6 As demonstrated in Section IV of ths report,
SIn assessing the value of the Regional Overview (UNEP 1994a), Gladfelter and Ogden (1994) note that the
information in the report is of limited value for assessing "pollutat load per year per (a) cubic meter of seawater,(b) acre of benthic communty impacted, (c) unit of coastline, (d) unit of human population, etc."
6According to Enrque Mandell (pers. comm., 1995), who paricipated in the analysis of the CEPPOL data,
fiancial assistace and guidelines for preparation of pollutat inventories were provided by CEPPOL to several ofthe missing states (i.e., Guyana, Suriame, Guadeloupe, Marinique, and the Cayman Islands).
22

Table 3
CEPPOL Results: Wase Loads from Domesic Sourcesin the Wider Caribben Region by Subregion (t/y)
Contr ISu b-Region BOD TS 1N TP Oil andGrea
Sub-Region ICuba(N Cot) 53,734 50,811 4,198 5,915 5,985Mexico(Gulf Coa) 24,529 20,964 4,184 1,810 8,379USA(Gulf Coat) 37,393 44,552 25,688 11,416 27,00
Sub-Tota 115,656 116,327 34,070 19,141 41,370
Sub-Rël!ion IIBeli 1,905 2,100 650 320 240Cost Rica 530 1,079 210 25 20Honduras 9,626 8,235 625 823 450Mexico(Ca. Coat) 3,756 3,232 607 261 1,256Pana 969 1,781 327 38 35
Sub-Tota 16,785 16,427 2,419 1,467 2,001
Sub-Rel!ion mCuba (Ca. Coast) 9,413 3,481 572 296 112Dom. Republic 40,573 60,00 3,027 4,182 5,125Jamaica 4,227 6,658 1,097 133 350Puert Rico 16,819 20,00 530 890 500Turk. & Cacos Is. 47 75 13 2 2
".
Sub-Tota 71,079 90.214 5,239 "5,503 6,089
Sub-Rel!ion TV
Antigu & Barbuda 29 45 7 1 1
Baados 3,838 3,300 290 378 290Bnt. Virgin Is. Dominca 85 145 26 3 2
Grenada 51 81 13 2 2St. Lucia 86 136 22 3 2
St. Kitts & Nevis 25 40 29 2 1
St. Vin. & Gren. 250 390 66 9 5
US Virgin Islands 26 40 7 1 1
40 44 250 132 200
Sub-Tota4,790 4,617 710 531 504
Sub-Re2ion VArba 61 52 20 4 1
Colombia 26,300 42,120 7,l1S 986 620
Netherlands Ant. 85 5 40 1 1
Tnnida & Tobago 1,00 1,567 1,585 59 28
Venezuela 232,725 185,00 77,575 32,425 18,325
Sub-Tot 26,171 228,744 86,338 33,475 18,975
GRA TOTAL 506,48 456,329 118,79 60,117 68,939
Source: UN 1994a 23

._, '~'.::~11l,:I~~~..,:i~;,:',: :.-
Table 4
CE
PPOL
Results: W
aste Loads from
Industrial Sources in the Wider C
aribbean Region
CC
lunl rylSuIi R
ecCI
BO
DT
SST
NT
rO
il &
ii~
NI
'"C
aC
rZ
a"'Is
Gre....
Sub-R
t2oQ I
C"h.
103,43879,731
3.1611,414
4,474X
XX
XX
XM
u. (G"ir C
n.1)1,073.66
Z7 .496,000
67341
615,6JOX
XX
XU
SA (G
"ir Coasl)
68,658146.151
13,JOO
16.15110,077
XX
XX
XX
XSub-T
ota1.145,761
17.1111,118417,1J4
17,717640,181
XX
XX
XX
X
Sub-R
mon II
;
nciie870
1,150190
8070
Cosla Rica
6,3595,571
1,057188
1,138X
IIcmduru
11 ,345
141,51039,115
4,IS06,310
Mexleo (Cari.)
r.....284
65554
I83
XX
Sub-Tota
126,858149,881
40,5164,519
8,611
Sub-R
eRlon 11
Caba (C
ar. Coas)
19,W27,350
3.8904,156
104X
XD
o... Republ
57,82611,516
19,1008,500
4,350X
XX
XX
J_oIa5,753
3,09817
6610
X
Puerto RIo
214,00850,00
10,0018
113,00X
XX
XX
Tarl ai Colos
Sub-Tota
357,441993,964
0,16511,690
118.074
Sub-Rt1lon IV
Anlilt'" &
Ø.rbud.
55110
II
IX
XX
Xn.rbados
91,0001",00
37,000IS
,0041,000
XX
XX
X
Dnlish V
ir. Is.5
131
\1
X
Do..iala
1,6501,511
100\00
180G
nn.d.151
17855
30\0
X
Si. Lul.
\90895
J834
10X
X
51. KillS &
Neri
10\73
5J
\X
XS
i. Via. &
Ibe Gredies
33\414
J1
1
U.S. V
ir. Isluds13
451
\1\
X' X
Sub-Tota
94,707170,170
J7 ,3061S,17\
41,117
Sub-Rmoo V
Anihi
1701110
40ii
liSC
olombl.
14,69313,738
4,JOO
1,100\,693
XX
NeeberlUldl Anlines
1,977876
1901
\.050X
X
Tniúd.d & Tobico
199,001,060,000
11\,000\7
\46,000X
X
Venuuel.
286,430\,600,154
95,47730,15\
13,750X
XX
XX
Sub- Tolü
603,3702,68,948
211,\0731,537
\62,608
TO
TA
L3,428,131
31,920,953349,438
11,634980,101
. . D.ia Indle.i. illl \l poUut~el dlaratd Inlo ibe ..ari e...inieal
Source: UN
EP 1994a
-.N

individual country omissions have varing degrees of influence on the picture that emerges fromthe CEPPOL data on point-source pollutant loads. For example, the lack of data for Guatemalaand Nicaragua probably has little effect on the point-source results for Subregion II (or overall),because the population centers and major economic activities of both countries are orientedtoward the Pacific coast and largely outside the Caribbean drainage basin (see Appendix B), andbecause both countries provide quite low access to sewage treatment services in rural areas.Within Subregion III, inclusion of the Bahamas, Cayman Islands, and Haiti all would likely havehad some effect on the observed distribution of domestic pollutants, though least so in the caseof Haiti, where sewage treatment services are available to a very low percentage of thepopulation. In addition, Haiti would likely have had observed industrial pollutants, althoughprobably at a lower level than Jamaica's. For Subregion IV, the omission of Guadeloupe islikely to have affected the industrial pollutant results, since both Guadeloupe and Barbadosprocess sugar, rum, and other sugar byproducts in amounts that can be inferred from GDP datato be roughly twice as large for Barbados as for Guadeloupe. In the case of Anguila,Martinque, and Montserrat, it appears unlikely, from what little data are available, that theirinclusion would have substantially altered the picture. The same can be said about all theeSubregion VI states with respect to industrial pollutants, but it is possible that domestic pollutatresults for Subregion VI might have approached those for Subregion II.
Figure 7 depicts the relative contributions of domestic and industrial pollutants by the fivesubregions for which CEPPOL data were reported. It is readily apparent that substantially morethan half the tota pollutant load included in the inventory is generated in Subregions I and V.Figure 8, which displays the subregional contributions of individual pollutants, indicates thatSubregion I contributes less nutrient loading (TN and TP) from domestic sources than SubregionV, and no more from industrial sources than any of the other subregions, notwithstanding thefact that the Subregion I data include both point and non-point source pollutants for the U.S.Gulf Coast.
The relative contributions of individual states are depicted in Figure 9. Among the morestriking results are the indications that Puerto Rico and Barbados each contributes more pollutantloading from industrial point sources than the United States, and that Mexico contributes morethan ten times the industrial pollutant loading of any other state in the CEPPOL inventory
(accountig for 82 percent of the entire WCR industrial pollutant load). As for domestic pointsources, it is noteworty that Cuba and the Dominican Republic is each responsible for a greaterpollutat load than Mexico, and that Venezuela contributes far more in domestic pollutats than
Colombia.
To a large extent, some of the more anomalous results of the CEPPOL inventory areexplained by its limitation to point sources of pollution. As noted in UNEP's 1994 RegionalOverview, for example, ths limtation has the effect of reporting the greatest domestic pollutionloads for those states that provide sewage treatment services to the greatest number of people,
25

700
60
50
.. 40i:~..:ioÉ. 30
20
100
o
35
30
25
20..c~~
15
10
5
0
Figure 7.
Combined Domestic Wase Loads(tons/year)
II II tV. Suogion (*00 dat provided
V *VI
Combined Industrial Waste Loads(tons/year)
II IVSu (*11 da pr
IIv *V
Relative Contrbutions of Combined Pollutats from Domestic and IndustrSources by five WCR Subreons (Source: UNP 1994a)
26
Domestic Source Loads(tons/year
300
250
- 200CJ"0Cci
150CJ::0.ct: 100
50
0II II IV V .Vi
Suegio (*l' da prvi
Industrial Source Loads(tons/year)
30
25
20-((i:
.Q 15::-
10
5
0 II II IV V .VISubregions (*no dat provided
IDBOD~TP
_TSS ~TN1::::1 Oil & grease
Fige 8. Relative Contrbutions of Individua Pollutats from Domestic and IndustralSources by five WCR Subregions (Source: UN 1994a)
27

Wast. from
Com
bin Dom
.stic Souc..
Qonsl..,)
llii,g
o100
20JO
(Tanl
4060
60
1li~"~
Waste from Coin Ind Soc.s
QonSi-i
0.51.6
q.l
Relative Contrbutions of
Pollutats from
Com
bined Dom
estic and Industral Point
Sources by 25 WCR States, Groupe by CEPPOL-Designated Subregions
(Source: U
NE
P i 994a)
Figure 9.
SL V
incenl & u&
~jd~~is~ Ifc¡a
si.I?~r. ~r.~
:k1~~rcfl:.G
Uii:~~ß:
Dom
iniaB
ritJl~ Virgin II.
Antigua (. ~
~:
.Ang~.
2:i
00N
.30, "t
..

while failing to capture the extent to which a population's domestic waste goes completelyuruanaged or inadequately treated. It also does not address (except for the United States, forwhich non-point source loads were included) pollution from such significant WCR non-pointsources as agriculture, forestry, marinas, construction, urban runoff, and automotive emissions.
F. Summary
All nation-states of the Wider Caribbean Region use the marine enviroruent as a sinkfor the discharge of pollutants from land-based sources. By far the most serious damages causedby effuents from land-based sources occur locally, within the territorial sea or exclusiveeconomic zone of the source state. Most land-based marine pollutants are not transported farfrom their sources of discharge, and transboundary pollution events, where they occur, appearto be confined to border regions.
As the WCR is an open system that exchanges massive amounts of water on a continuousbasis, it is understandable that there is no clear evidence that discharges from WCR statescontribute to a generalized "pollution" of the Caribbean Sea and its associated gulfs. Dischargesfrom the major river systems move considerable distances within and across subregions, andsediment loads and litter are transported long distances across the region. Our state of
knowledge regarding the transport of other pollutants is too limited, however, to suggest whatmovements occur beyond the local and subregional scales.
The systematic collection and analysis of data on the extent and distribution of localizedpollutants has only recently gotten under way. As of 1994, the CEPPOL program had preparedinventories and begun an analysis of the distribution of selected land-based marine pollutantsgenerated by domestic and industrial point sources in 24 WCR states, and by domestic andindustrial point and non-point sources combined in the United States Gulf Coast region. Becauseall but one of these CEPPOL inventories are limited to point-source pollutant loads, the resultsso far cannot be used to assess the extent and distribution of pollutants generated by some of themost significant non-point source activities in the region, including agriculture, forestry, andcoastal development projects.
In the absence of systematically collected data on non-point pollutant loads for most ofthe WCR countries and territories, a more complete picture of an individual state or subregion'srelative contribution and exposure to LBMP must be inferred from other indicators. Thecombination of indicators considered in Section IV is useful as well for assessing the inclinationand abilty of states to undertake independent or joint action to control LBMP problems.
29

III. Arguments for Collective Action in the WCR
A. The Importance of Scale
The published literature and written records of WCR discussions focuses on theestablishment and implementation of a regionwide approach to the prevention, reduction, orcontrol of LBMP. In this section, we examine several issues and arguments that are beingdebated as bases for pursuing a "regionwide" approach to LBMP control in the WCR. Theseissues and arguments include: common-pool pollution effects; common problems; scaleeconomies; and the need for uniform standards (water quality or pollution control standards).
Some of our discussion is critical of several broad arguments that have been made infavor of an LBMP protocol for the Caribbean. The intent of this criticism is constructive;whether or not an international agreement has the potential to be effective depends upon acareful assessment of the arguments made in favor of collective action. Our analysis cannot beused in place of the international negotiations that must occur to work out the details of aprotocol. But we hope to give the negotiators an understanding of the different sides of theissues involved.
All of these issues are indeed relevant and valid at some scaLe in the Caribbean.
However, the extent to which they are applicable regionwide is not at all clear. To a significantextent, protocol effectiveness wil depend upon whether or not the Contracting Parties cancorrectly characterize the scale of LBM pollution problems and tailor appropriate solutions. iThese activities are among the most importnt ones to be addressed by a protocol andimplemented though its institutions.
The occurrence of trans boundary movements of pollution (or of natural resources affectedby pollution) is among the most powerfl rationales for an international protocol on pollutionreduction. Increasingly, the existence of common, but nontransboundary, pollution problemswithin the jurisdiction of many states is being advocated as a justification for an internationalprotocol. An understanding of common socio-economic characteristics, as we describe inSections IV and V, can be useful in identifying potential benefits from agreements andrelationships to control pollution. We discuss the potential for these kinds of "gains from trade"in the Caribbean in Section V.
i Implicit in this statement is the point that region wide approaches to LBM pollution problems may be ineffectiveif the problems themselves are not regionwide.
30

B. Pollution Costs and Benefits
As we consider the arguments commonly advanced for collective action with respect toLBMP in the WCR, we should maintain a balanced perspective on the types of benefits and costsinvolved in pollution control.
Land-based waste discharges should be described as "pollution" only to the extent thatother human activities or valued characteristics of the marine environment are affected adverselyby the effluents.2 Discharges can affect such uses of the WCR coastal and marine environmentsas coastal tourism and recreation, nursery grounds for fish and wildlife, commercial and
recreational fisheries, and biological diversity. Scientists have begun to document the potential,and in some cases actual, impacts of land-based effuents in the WCR (Gladfelter and Ogden1994; UNEP 1994a and references therein). The social costs of these impacts have not beendocumented to date,3 but they are likely to vary considerably by state and geographic location.
WCR states face a great variety of economic development problems, including issuesassociated with effluents from human activities. The introduction of nutrients, pesticides,sewage, and industrial effuents into local marine environments is a direct consequence ofexpanding populations and the siting of industrial facilities in coastal zones or major watersheds.It is very important to recognize that Caribbean coastal and marine environments provide
substantial economic benefits as sins for agricultural runoff, sewage, and industrial effuents.Any measures taen to reduce or control discharges from land-based sources are likely to becostly, but solutions to some of the most significant problems can be achieved with minialfinancial investments, e.g., properly sited outfalls. Evaluation of these benefits and costs, and
considerations of their distribution among the citizens of a state or across states, are relevant tothe problems of LBMP control.
C. Common-Pool Effects
Consider a situation in which a set of states share a common-pool resource, such as aregional marine environment. Marine pollutants originating in one or more of the states of the
2 This definition is the anthropocentric one currently accpted and embodied in international environmental law(Hunter, Sommer, and Vaughan 1994). Note that the definition of "pollution" found in Article 1(4) of UNCLOSII appears more broad, in that it also encompasses "har to living resources and mare life." Kimball (1995)explains that the definition of pollution is being broadened in three ways: the precautionar principle has begun tobe adopted as a nonbinding norm; har to "living resources" now often includes har to "marine ecosystems"; andcoastal zones and related waters are begining to be considered a par of the marine environment.
3 Estimates of the benefits of natural marine environments in the Caribbean, such as coral reefs or marshes, are
only just emerging. See Pendleton (1994); Spurgeon (1992); van't Hof (1985); or Lynne, Conroy, and Prochaska(1981).
31

region flow across national boundaries. 4 Adverse impacts of pollution may occur in all states.
Because each of these states could benefit, at no cost, from expensive pollution controlundertken by any other state in the region, incentives for unilateral pollution control arediminished. If this kind of "free-riding" can be curtailed through regional collective action, thenit may be possible for pollution emissions to be reduced to a greater extent. Most regionalLBMP protocols are in the nature of contracts through which the states of a region attempt toobligate themselves to reduce the tendency to free-ride in the reduction and control of pollution.In fact, mechanisms designed to control or reduce free-riding behavior can be the most importantelements of such protocols.
In some regional seas, such as the Baltic, the rationale for an international protocol onland-based sources of marine pollution appears clear (Broadus et al. 1993). There are manysources of potential pollutants and many states affected by transboundary pollutant flows.Furthermore, substantial uncertinty exists about the precise source of any particular pollutant,making it costly to assign liability for pollution impacts. This statement is especially true forhistorical contributions to stocks of persistent pollutants. Multilateral pollution reduction isneeded to reduce impacts felt by all states in the region.
In the WCR, sources and effects are localized, and therefore the need for an internationalagreement on multilateral pollution reduction is not as clear as in the case of the Baltic. A
fundamental question for the WCR is why, within the context of a regional protocol, should astate assume a serious obligationS to other states to clean up discharges of pollution thatoriginate and remain within its own borders. 6 This is precisely the issue faced by theMediterranean states in their attempts to regulate LBMP in that region.
Unless voluntarily relinquished, each WCR state has the right to determine its own pathof economic development, subject to customary international law (HLR 1991). Any particularstate's choice of development path could involve discharges into its local coastal or marineenvironments. Each state has the right to perform its own evaluation of benefits and costsassociated with the release of effluents. Absent transboundary effects and subject to relevant
4 Analogously, natural resource stocks might cross national boundaries. If these stocks are hared by pollution
in one nation's waters, then adverse economic effects may be felt by another nation.
S Clearly there is a legal obligation on the par of state-paries to the Caragena Convention to prevent, reduce
and control pollution from land-based sources. Whether states take this obligation seriously depends upon theirdefinition of "appropriate measures" and, if defined, whether such measures are implemented. Protocol"effectiveness" depends critically upon the extent to which states take their obligations seriously.
6 Charey (1994) explains that UNCLOS II "effectively addresses" the issues related to reconciliation between
a nation's obligation to protect and preserve the marine environment and its sovereign right to exploit its naturalresources. Yet it would appear that the language of Article 193 and other language in the Convention relating to
the use of "best practicable means" to prevent, reduce or control pollution is broad enough to accommodate relaxedinterpretations in specific contexts.
32

international law, it is unclear that other states or the international community in concert havethe right to impose environmental standards on any particular state and thereby affect its choiceof development path.
According to principles of international law and custom, each state also has the right tovoluntarily relinquish its right to economic self-determination. Each WCR state has the rightto enter into trades, agreements, or other types of relations with other states in the region,including agreements to adopt policies for pollution control, such as the Cartagena Conventionor UNCLOS III. Two-thirds of the WCR states are Contracting Parties to the CartagenaConvention, which calls for the development of a protocol on land-based sources of marinepollution. Article 7 of the Convention provides a good example of the voluntary relinquishment;to an unspecified extent, of each state's right to economic self-determination. As agreed, partiesto the Cartgena Convention "shall take all appropriate measures to prevent, reduce and controlpollution" from land-based sources (emphasis added). The use of the term "shall" denotes anobligation on the part of each state-party. A difficult debate has now been initiated on whatmeasures might be considered "appropriate" (Wood-Thomas, pers. comm., 1995).7
Evolving international law of the marine environment, such as that embodied inUNCLOS III, has enlarged its focus to include pollution impacts both across state boundariesand within a state's exclusive economic zone and territory, including estuaries (see Charney1994). Historically, however, perceptions of the need for international control of marinepollution at the domestic level have arisen mainly from concerns about the potential forinterntional impacts of insuffcient domestic controls. Meng (1987) concludes, therefore, thatit "seems inevitable that the notion of trans frontier pollution wil remain one of the bases for thedevelopment of international law on marine pollution control, simply because to respect andprotect state sovereignty has always been a fundamental object of international law." Wesuggest that the existence of transboundary pollutant flows is one of the strongest reasons for aninternational LBMP protocoL8
The adverse effects of transboundary marine pollution often are uncertin or not
imediate. States may wish to avert the risks of any negative impacts of transboundary marine
7 The extent to which a LBMP protocol wil be considered effective, ex post, wil depend upon the clarity of
the definition of "appropriate measures" in this context.
8 To suggest that an international protocol must be negotiated and implemented to control pollution only at the
domestic level would appear, at best, to invite ineffectiveness. Can one reasonably expect that states unaffected byanother state's domestic pollution wil bear the burden of enforcement against the polluting state? Charey (pers.comm. 1985) argues that "third" states can protect a "commons," such as the marine environment, even if no stateis directly injured. However, a significant obstacle is the cost of bringing the action.
33

pollution on their own marine and coastal environments and resources. 9 In the presence of such
risks, it can be sensible for states to be conservative with respect to marine pollution problems.Risk-aversion with regard to the expected impacts of transboundary pollution provides a rationalefor collective action similar to that in the presence of actual impacts. However, in the absence
. of demonstrated impacts, the implementation of pollution reduction measures is likely to be moreproblematic.
In the WCR, adjacent or neighboring states can perceive more clearly the benefits andcosts of marine pollution and pollution controls than can states that are separated by greatdistances. LBMP problems can be observed more easily, benefits from pollution control aremore likely to be realized, and monitoring and enforcement costs may be much smaller in asubregional, especially bilateral, context. A central role of an LBMP protocol in the Caribbeanshould be to encourage states to agree to pollution reduction at bilateral or subregional levels,delineated on the basis of transboundary effects, where they are known to occur, or commonenvironmental problems. We discuss this role in greater detail in Section V.
Several international heritage sites and trans boundary fishery resources exist in theCaribbean (Elder and Pernetta 1991). States may have a legal obligation to reduce or toeliminate activities that have an adverse effect on internationally protected sites or species. Withrespect to the arguments discussed above, these resources and protected areas are analyticallyidentical to the problem of a common-pool resource. For stationary resources, such as marineprotected areas, the same arguments we have made already concenung the advantages ofsubregional approaches can be reiterated. For fugitive resources, such as some species of
marine fisheries, similar arguments can likewise be made, although the geographic distributionof cause and effect may differ from the distribution of marine pollution.
D. Common Environmental Problems ,~-'~'
In the WCR, transboundary pollution problems tend to occur across shared watercourses,in shared estuaries, or across nearshore marine boundaries. Other serious LBMP problemsexist, but these tend to be localized, affecting uses or harming resources of the state from whichthe pollution originates (Section II). Thus one of the strongest reasons for negotiating aninternational agreement to control LBMP, namely the occurrence of international pollutioneffects, appears not as strong in the Caribbean as in other regional seas, such as the Baltic orthe Nort Sea.
Because of localized intrastate pollution in the WCR, many observers have recommended
9 Aversion to risks does not necessarily imply avoidance of risks at all costs. In other words, we do not
recommend adoption of the extreme version of the "precautionar principle" (see Broadus 1992).
34
that an LBMP protocol should focus on approaches to the resolution of local, not transboundary,pollution problems. An importnt issue to raise in this context is whether or not an internationalagreement is needed to resolve local pollution problems. An alternative course of action wouldbe for each state to make its own decisions and take its own actions with respect to LBMPproblems that are clearly not international in effect. These independent decisions and actionsmight involve seeking or trading for financial or techncal assistance from other states, withinthe region or elsewhere.
What are the kinds of barriers that exist to prevent Caribbean states from acting on theirown to resolve localized LBMP problems? Several barriers have been identified, includinginsufficient financial or physical resources to control LBMP, inadequate institutions, such aslaws and policies, and even ignorance or lack of recognition of LBMP as an environmentalproblem.
In cases in which pollution control resources are insuffcient, analysts have suggested thatan international protocol may provide a partial solution. For example, Kimball (pers. comm.,1995) has pointed out that". . . a well-functioning agreement may attract international assistancefrom multilateral and bilateral donor agencies. Thus, the agreement leverages internationalassistance for domestic problems, creating incentives for the polluter state to join." We expectthat states may be able to attract international assistance, even in the absence of an internationalagreement. However, the conclusion of such an agreement may enhance the significance ofLBMP as an international problem relative to other social problems. If this is true, it is possiblethat financial resources that might have been directed to resolve other problems are more likelyto be directed toward LBMP.
Others have suggested that the conclusion of an LBMP protocol resolves a "fairness"problem in which international assistance is directed only toward an elite subset of states, orperhaps to specific groups of states in defined "subregions," on the basis of their perceived
capabilities. For example, Wood-Thomas (pers. comm., 1995) states that "(i)f we workexclusively at the subregional level, several sub-regional groups may not be able to takemeanigful action because they do not possess adequate human or financial resources. Externalresources (World Bank, US~, etc.) may not be able to support all of the subregions addressingsimilar problems, and they wil therefore most likely lend support to those sub-regions which
are best organized and institutionally capable." The extent to which this statement is truedepends upon how international assistance is allocated. Recently, the lion's share ofinternational assistance funds from the United States to the WCR has been flowing to Haiti andNicaragua, which arguably are not well-organied or institutionally capable. But otherorganiations, such as the World Bank, may employ different criteria. Even if an LBMPprotocol does level the playing field in terms of attracting international assistance, issues persistabout allocating this assistance internally among the Contracting Parties. Presumably, theseissues can be addressed through fairness rules incorporated into the protocol.
35

It is also possible that the Contracting Parties to a protocol can provide for contributionsfrom each party to a central fund. We discuss below in Section IV.I the status of contributions
(and unfulfiled pledges) to the CEP fund. Tietenberg (pers. comm., 1995) has suggested thatannual fees might be levied on WCR states (or individual pollution sources) to fund monitoringand enforcement activities, as is currently the practice with respect to some forms of airpollution in the United States. The size of the fee might be tied to the level of pollution so thatthere is an incentive for states to lower discharges. However, unless the fees are small, theremay be difficulties in getting states to agree initially to participate in such a program. And ifthe fees are small, they are unlikely to provide much of a source reduction incentive. Inaddition, a system for accurate and consistent measurement of point source and nonpoint sourcepollution must be established, unless fees are based on a fixed level of allowable discharges.
An even more difficult problem concerns the lack of institutional infrastructure in manyof the states of the region. We address the status of these institutions in Section IV. E below.The most serious cases are those states in which political power is held by those who benefitfrom using the marine environment for waste disposal and in which those who suffer fromLBMP have little or no political power. It may be difficult, if not impossible, to encourage suchstates to agree to a protocol, unless their participation is tied specifically to other issues.Lining LBMP to other issues wil require an examination of the relevant political conditionsfor those states that are reluctant to participate, and negotiation on a case-by-case basis.
Some analysts have argued that international collective action, such as that called for ina regional LBMP protocol, can stimulate the development of institutions and domestic programsto implement the provisions of the agreement. If domestic programs are developed, one mustbe concerned with the extent to which these programs can be determined to be effective at localand national levels.
Education about LBMP problems in the WCR wil always be impgrtant. Our
examination of the region suggests that there is a fairly good awareness in each of the statesabout the presence of localized marine pollution from land-based sources. More work needs tobe accomplished with regard to determining the extent of the problem in each state, includingthe nature of pollutant flows and the size of actual damages and risks. Some good work alongthese lines is already being accomplished though the CEP and other research programs.Institutions established under the auspices of an LBMP protocol might usefully draw upon orexpand existing programs, such as CEPPOL and others, to enhance the awareness andunderstanding of marine pollution in the region.
Most WCR states have made some measurable progress toward developing andimplementing the capacity to deal with localized LBMP problems. We discuss this progress ingreater detail in Section V below.
36

E. Scale Economies and Clearinghouse Efficiencies
Officials of international organizations, such as UNEP, have argued that a regionalprotocol can facilitate technology transfer, expedite information exchange, and focus theallocation of financial capital and other resources more effectively to solve LBMP problems(UNEP 1994c, 1992; Nollkaemper 1992). These and other coordinative-type activities are thekind commonly associated with a "clearinghouse."
Clearinghouse efficiencies are a type of "scale economy:" as the amount of a particularservice, such as information exchange, is increased, the cost per unit declines. In general,economies of scale are likely to be realized when an activity involves relatively high "fixed"costs, io when specialization in the performance of tasks is possible, or where risks can bepooled, such as through the establishment of emergency-response measures. It is important tonote that scale economies may exist over a range of certin levels of activity but disappear,resulting in "diseconomies" of scale, at higher levels. The relevant issue with respect to
clearinghouse effciencies is: what is the optimal size of the clearinghouse?
Economies of scale may exist in scientific research and monitoring of land-based sourcesof marine pollution, too. Table 13, in the next section, lists the research, coordination, andadvocacy organizations that focus on marine science in the Caribbean today. It is likely that atleast some, if not all, of the relevant economies of scale in scientific research and monitoringhave been realized alread though the activities of these organiations.
Officials at some international institutions, such as UNEP and the Caribbean Division ofthe World Bank, have begun developing synoptic views of the primary Caribbean regionalenvironmental institutions and their mandates. Table 5 lists these institutions and theircorresponding mandates. These institutions act in clearinghouse capacities, but, according toWorld Bank officials, the institutionaLframeworkis stil too fragmented, suggesting that evenmore centralization is warranted:
The fundamental problem is that these efforts have often led to the formulation of proposals andimplementation of activities that, while responding to a priority issue, do so from a paricularinstitutional or even funding source perspective. There is, in general, a need for coordination ona regional basis in order to increase the effectiveness of the regional efforts. (Elvis and Colbert1994)
10 As fixed costs are spread out over greater levels of the activity, their per unit contribution to total costs
declines. Fixed costs are by definition "recoverable" so that, for example, expenditures that are made on suppliesor infrastructure can be recouped if the activity termnates. If these expenditures canot be recouped, then the costsare "sunk." Sunk costs do not contribute to economies of scale.
37

Table 5Regional Environmental Progra & Projects in the Carbbean
DoDD. Pr K DlIlii/PIjK"
UNITD NATWNS AGENaRl
Unid N&OIU Envinmnt Prgram (UNE eCbbe Envirnment Prgram
Uni N&na OovcJ Pr¡ram oLad Use Planig, Hwr SeuJementand Tellestr PrLenCiacity 21 FWld
Uiid N&toiu Centr for Hwi Setements (UNCHS) -Lad Use Planning and Human SeuJemen13 Development _ OECS
Uii iiiu Foo and Agcullure Organizon (FAO) .rropicaJ Forstr Action Plans (CARJCOM)
Uiid lWolu Bcmic Commi..ion for Lat Am oEnvirnmenlA Management Issues in iourmand me Cabe (EC) oRegional Sewage Dispoal aid Coasla Coiuaton Stu~
P&4 Amc&4 Health (k¡¡&4ÏZon (pAHG) -Envirnffnta HeaJth in SustAnable Tourm Development
MULTITEIL DEVELPMENT INSTITUTINS:
Wod &i -Naoiu Envirnmenta Action PlA (N1i)oOEC Waste Management PrjectoWider Ciibbc Initiatve foe Shipgenccatd Waste (WClSW)
Inter-Amc&4 Develpment Bank (IB) oManagement of Coastaarne R.soCC3 - Widcc-Ciibbe
Cabu DeveJnt Ba (COB) -Natonal Eivirniiita Action Plas (N.) (with WB)
oOEC Waste maagement Prject (with WB)-PClticide Pollution in ile Windward ùlAdi (through CEHO
Eupe Coniit (B oCRlORUM Regional Environment Prgram wider Lomt IV
Eurpe Invutnt Ba (EID) oOEC Waste Management (with WB)
CÀ¡lIíi of Am Sla (OAS) .Natural Resoce Management - inc1Cl paki I;d prtete Arel
iy.lcm plan.oEnvirnmeii and Tourm Awarenes
BILTEL DEVELPMET AGENCII -,.-..,~:~
Brb DcvcJp~ Divilioa (BDD) -Renewable Natural ReIOurCes PrgrlJ - Trpical Fortr Acn
Pla (with FAO)oNatoiu Environmnta Actin Plani (wiil WB)
C&ldia lnlUatul Dcvolpmot A¡ency (ClA) oCbbean Basin Management Triiing (CARICOM)oNatural Re.ouCCl Management Dat Bue Prject - OECIBAdaaBV!
oEnvirnmenta Traning prgramme
Gcmw AacDC C~ ionir-a Coon (GTZ) -Pulic Health Educaton - CARICOM cotn.oWor&ton Syiiicm Development - CEll
Japca Poliy aid Hum Ru Devclopme Fw oNaoiu Envirnmenta Actn Plani (N.) ilrou¡h WB - GEC
(pHR)
Uni Sta Aacii Cor lnlclÛii Development oEnvirnmnt aid Coasta R.souce Mana¡emel1t (ENCORE) - GEC
(USAl) oEalCrn CiibbCA Policy Prject - GEC
SOUR.: WOI ~ (1~)
38

Although there would appear to be the potential for economies of scale, questions persistabout how these might be realized through a protocol arrangement and whether a protocol isbetter than some alternative. To date, clearinghouse roles have been developed and implementedby international organizations with international resources, such as UNEP and the World Bank,with apparently little effect on the commitment, practices, or environmental problems ofindividual states. The example of UNEP's CEP, which was established in 1982, serves to makethe point. Brewster (1994) has identified the following four existing constraints to the successfulimplementation of CEP: (1) insufficient political commitment; (2) inadequate financial support;
(3) organizational weaknesses; and (4) inadequate awareness, expertise, and experience at thedomestic leveL. These constraints are of the same nature as those that may well limit theeffectiveness of a regionwide LBMP protocol.
Clearly, there is a role for a clearinghouse on LBMP in the WCR. To a large extent,this role is being performed already by UNEP and the World Bank, as well as by other smallerregional institutions, such as OECS. The fundamental issue is whether additional economies canbe achieved by an "umbrella" institution established through the protocol. Although thisquestion cannot be answered until such an institution is established, it is sensible, at least, toquestion the potential for additional scale economies. We suggest that the best approach is anincremental one.
II A clearinghouse established under the LBMP protocol should take advantage
of existing institutions and expand step-by-step, testing for the existence of scale economies. 12
F. Uniform Standards
The extent to which marine pollution should be controlled depends upon ourunderstanding of both causes and effects, and the extent to which it can be controlled dependsuponour ability to infuence causes so as to reduce adverse effects. Figure 10, adapted fromFisher and Peterson (1973), describes the relationship between emissions (causes) and the
determination of damages (effects). A wide range of pollution control instruments are available,ranging from command-and-control regulations, or standards (Helfand 1991), to market-basedapproaches (OECD 1994; Tietenberg 1985), or to combinations of the two. The best instrumentor combination of instruments may depend upon specific environmental, political, or economicfactors. In the WCR, much of the discussion about pollution control instruments has focusedon the development of "standards" of two types: ambient water quality standards and technology-based controls.
11 Wood-Thomas (pers. coin. 1995) reports that". . . we are pushing a reorientation of CEPPOL to serve
defined management needs and we wil likely pursue a functional linkage of work undertaken through both CEPPOLand IPID," a regional Integrated Planing and Institutional Development Project.
12 The protocol institution may decide to contract, instead of expand, existing institutions in order to achieve
the most effcient level of clearinghouse service.
39

'0 '0 ro 1-. Gli- Ol rt:: OlOl Ii 0 P....
h: o rt. i: I-ro I-.~ Ul 01-. 0 rt ::OQ
i: i:roliUln I- 8 1-- ti(1 Ol 1-- Ol 0 ::I- Ii rt I- Hi Ha rt (f
rt ro p, Ii (f1- P, 1-. Ol H8 Ul :; 0
'1 :: roOlO Zro ro rt :: Ul (frt I- Ol Ol roro Ol :: Ii :;Ii rt P, I. OlUl 1- ro I.o 0 Ul ro:: ::
Ul 0:: IiI- 1-Ul '0..w tr V~ ro
rt rtro::P,'1:F 1- rt 1-- 1-- Ol
ro 80rtUlliro ro . Ii Ul rt:: ~ o 0 Ul
Ol I. I-'0 ::Olro-c'O0 P,rt::roro 0I- P, Ii g~I- 'ooloi: i- 008 t1 tJrt Ol '0 8 X 1- HH1- o 0l'Oi.1- i- ti0 rolii:1.1- HZ:: rt :: ro 1- o i-
1-. P,:: 0 Zro o Ul :: (f8 i: ~ 01-- I- Ii 0Ul Ol HiUl Ii1-0
I
::Ul
VOl:: 1- 1- 0 Hi i-P, :: :: 0 I-.::HiOIiUlOP, ro 1-- Ol :: i:Ol o P,I-~ Ul8 rt ro OlOl I-.:: Ii p, :: ti .,:,::;
.; ,¡;~~,I. OOroOlP, I-ro ::roro8Ul I-Ul Ul Hi Ol ti
~ o Ul I. 0 0Hi~ ro Hi i-:i ro (f
P, rt ro 0 rt P,Ol o Ol Ii o ro
'0 . Ii Olrt P,roP,
Hi VIi0 roOHiC:8 rt Hi 1- Ol
0 Ul I-I- . 1- :: i: t11-- I- ro 00Ul I- Ol o t-:: :: 0 ~ ~ro :: P, HiIi ro (f ::
OlOP,Ol I- 0 ro:: rt Ul OlP, :: rt P,
~
40

In the Caribbean, concentrations of LBM pollutants, of any type, vary by location; theyare "non-uniformly mixed" (Tietenberg 1988). Pollutant levels at each location also may varyover time as a result of environmental events, such as storms; seasonal oceanographic
phenomena, such as freshets; or cumulative effects, such as the build-up of pollutant stocks.Pollutant concentrations, of any type, may be attributed to single or multiple sources, such asindustrial plant emissions, sewer outflows, or runoff from farms. In general, each pollutionsource contributes a different amount to the ambient concentration at each location, because ofrelative proximity, precipitation or mixing, or other reasons. Finally, the distributions of naturalresources and human uses of the marine environment also are nonuniform (Elder and Pernetta1991) .
The nonuniform distributions of both ambient pollution concentrations and resources oruses implies that damages from marine pollution are likely to vary by location. Damages canalso vary because of differences in the tastes and income levels of the users of resources atparticular locations. The differential relative contribution of sources to ambient concentrationsat any location implies that costs of pollution control vary by location as well. Costs ofpollution control for sources can vary also because of differences in technologies, market
conditions, and other factors.
If the causes and effects of marine pollution were uniformly distributed, then uniformregional standards or controls might be appropriate policy instruments. But the existence ofnonuniformities in the Caribbean argues strongly for approaches that are capable of dealingeffectively with the problem of pollution control at each location.13 In other words, regionwideuniform water quality standards and technology-based controls are not necessarily appropriatepolicy instruments, given the environmental and economic characteristics of the Caribbean.
As a precursor to the selection of a pollution control instrument, we require inormationabout the damages associated with pollution at each location in the Caribbean (see the "dollarcosts" box in Figure 10). Ideally, this information would include data on the damages associatedwith different levels of pollution at each location. Moreover, we need information about thecosts of control for sources contributing to pollution at each location. An economically efficientemissions quota or charge could then be set for each location. Preference for either a quota ora charge depends upon the relative levels of knowledge about damages or control costs (Baumoland Oates 1988).14
For many pollutants, a surrogate measure of damages, based upon a scientific
13 One might argue that "on average" standards would be appropriate pollution control instruments. Such an
argument ignores difficulties of political acceptance of standards (Sand 1991) and the natural tendency to weakenthe standards approach through waivers or exceptions (UNEP 1994c).
14 In general, it can be quite expensive to gather information about either damages or control costs.
41

understanding of the potential effect of pollutants on human health, often is employed instead
(see the "effects" box in Figure 10). A water quality standard can be set to ensure that pollutionis kept at some level that has a low probability of health effects (Figure 10). Quotas can be setat levels to ensure that the water quality standard is not exceeded. 15 Water quality standards
are less expensive to administer than the efficient quotas or charges described above, becausethere is no need to measure damages explicitly. 16 But because water quality standards consider
neither damages nor control costs, their uniform application may require excessively costlypollution control in areas where there are very low levels of marine resource use.
Several analysts have suggested that regional water quality standards should be appliedin the Caribbean. In Policy Principles, WWF and ESI (1994: 2) argue for "regionalenvironmental standards and environmental quality commitments." Their argument is basedprimarily on the potential benefits of a level regulatory environment across Caribbean states. 17Kasten (1994: 17) has argued for establishing a technology-based control program in the shortrun and supplementing this program with water quality standards in the long run.
The use of the term "regional" in these studies probably implies water quality standardsthat are "uniform" across the region, but there is no need for this interpretation. For example,in Appropriate Approaches, UNEP (1994c: 27) argues for domestic water quality standardsbased upon regional standards that can be modified though the use of "exceptions" and
"waivers." Exceptions and waivers would be based upon "particular ecological, geographical,and physical characteristics and the level of existing pollution." In this way standards might bemade appropriately nonuniform across WCR states. IS
In order to design technology-based controls that meet established water quality
standards, the relationship between pollutant discharges and effects should be known. Often thisrelationship is not well understood, and pollution controls have been recommended or adoptedin many part of the world without regard to their likely effectiveness in meeting,~water qualitystandards or sometimes even prior to the establishment of water quality standards.
Arguments for the adoption of pollution controls without water quality standards arise,in part, from the supposition that control of LBM pollutants must begin before the lengthyprocesses of establishing water quality standards and understanding cause-and-effect relationships
15 Setting the appropriate quota wil require some knowledge of the relationship between emissions and effects,
i.e., of the assimilative capacity of the environment.
16 Water quality standards can also be applied without regard to the costs of control, although it is often the case
that policy debates wil tend to focus on these costs.
17 This argument is based on the idea of "pollution havens." See below.
is Note, however, that if exceptions become widespread, then water quality "standards" may lose their meaning.
42

are completed. In effect, such an approach is an application of the "precautionary principle,"defined, as follows, in the Rio Declaration of the 1992 U.N. Conference on Environment andDevelopment (UNCED):
(w)here there are threats of serious or irreversible damage, lack of full scientific certainty shallnot be used as a reason for postponing cost-effective measures to prevent environmental
degradation. (emphasis added)'9
Economic theory, in combination with a substantial body of empirical analysis, indicatesthat technology-based standards may be one of the most costly ways in which to control pollution
(Cropper and Oates 1992; Tietenberg 1985). For example, Lyon and Farrow (1995) haveexamined the benefits and costs of clean water programs in the United States. Their findingssuggest that incremental costs of water pollution control, which are based on estimates ofconstructing publicly owned treatment works, exceed incremental benefits.
Notwithstanding their relative costliness, there are several reasons why technology-basedstandards might be promoted as a policy measure. Table 6 presents a comparison of theeconomic incentives and effects of different types of pollution control instruments. First, froman economic standpoint, the presence of theshold effects in the face of uncertainty aboutdamages or control costs is one of the strongest reasons in favor of establishing technology-basedstandards. Such effects may exist in the WCR with respect to harmful, persistent pollutants,such as organohalogens.
Many of the WCR states are Contracting Parties to the London Dumping Convention (seeTable 9 in Section IV), which has organied pollutants into prohibited (black list) and regulated
(grey list) substances. Black list substances tend to be those with theshold effects. One optionfor the Contracting Parties to the Cartgena Convention is to consider treating LBM pollutantsin the same manner ~s London Dumpin Convention pollutants so that, for example, land-baseddischarges of black'list pollutats would be banned and land-based discharges of grey-listpollutants would be regulated by individual states. However, W ood- Thomas (pers. comm.,1995) explain that the negotiations concernng the WCR protocol are leading in a differentdirection:
L¥jL'"
l
We are specifically avoiding a black-list, grey-list approach in the WCR because of lessons leared
in the Baltic, Nort Sea, and Mediterranean. This structure has failed to focus the respectiveparies on those contamnants that are the priority problems within a region. Changes in the Balticand North Sea have reflected a recognition of this problem as they have developed "red-lists."We hope to utilze the negotiation of specific anexes to take this concept to a more pragmatic
19 Adoption of technology-based controls without water quality standards can be considered an application of
an extreme version of the precautionar principle (cf., Broadus 1992), one whose adoption might be questioned onecnomic grounds uness clear threshold effects are suspected. Threshold effects are damages that are severe orirreversible, imposing high levels of social costs if pollution is controlled at too Iowa leveL.
43

Table 6
Pollution C
ontrol Instruents: A Q
ualitative Com
parion
Quali ty/F
eatureT
echnology-based Standard
Pigouvian T
axtr
Tradeable P
ermts
;-:,-
("Optim
al" Em
issions Charge)
(Marketable right to pollute)
Econom
ically "Effcient"
Costly to determ
ne effcient levelsY
es, if knowledge of abatem
entY
es; knowledge of source-
of controlcosts and benefits
contributions to receptorsneeded in non
uniformy-m
ixed
case
Achieves D
esired Em
issionsY
es; only if relationship between
Unlikely, but possible through
Yes
Reduction
TB
S and emissions is know
niterative process
Achieves D
esired Am
bientY
esY
es, after iterations complete;
Yes
Pollutant Levd
possible further reductions asfirm
s innovate
Source of Revenue
No
Yes
Yes, if auctioned initially
Encourages R
&D
inL
ittle incentive, unless standard isY
es (emissions reduced further)
Yes (no further em
issionsPollution C
ontrol"perform
ance-based"reductions)
Monitoring and
Needed and costly
Needed and costly
Needed and costly
Enforcem
ent
Transactions costs
No, but adm
inistrative costs areN
o, but administrative costs are
Yes, if large num
ber of sourceshigh
high(unless brokers em
erge)
~
/ Assum
ng some level of scientific understanding exists of the relationship betw
een pollutant loading from em
issions and ambient
levels of pollutant, considerig the assimlative capacity of the m
arine environment.

level-focusing effort on the principal source categories that are responsible for the more obviousand gross sources of pollution. Various anexes would then be developed over time as the
scientific understanding evolves concerning what pollutants and sources are most important in theRegion. As such we use the protocol structure to help rationalize and focus the attention of theparties on those problems that are most significant in the region. The problems vary and are notshared by all, but with adequate flexibility and definition of the anexes, these should provide auseful vehicle to facilitate limited, but pragmatic actions that expand over time (recognizing thescarcity of resources and that scientific understanding will improve and offer new priorities foraction).
Second, from a political standpoint, some industries may favor standards because theyconstitute barriers to entry, and employees of controlled industries may favor standards becauseof wage-enhancing effects. Table 7, adapted from Dewees (1983), outlines some of thesereasons .
Third, from a strategic standpoint, as happened in the case of the negotiations over anLBMP protocol in the Mediterranean, developed states might argue in favor of technology-basedstandards for at least three reasons: (1) technology-based standards may already be in place; (2)adoption of similar standards removes the incentive, however small, for a developed state'sindustries to relocate; and (3) establishment of technology-based standards in other states
presents market opportnities for existing producers of pollution control technologies.
Technology-based standards are just one of several possible kinds of standards. 20
Moreover, as shown in Table 6, standards are not the only available pollution controlinstrument. Given nonuniformities in the distribution of LBMP causes and effects, it is notobvious, ex ante, that technology-based standards wil be the most appropriate pollution controlintrument in every case. Following the intent of the precautionary principle to encourage theadoption of cost-effective pollution control methods, flexibilty in selecting and implementingmethods of control seems more appropriate. Furter, such flexibilty is likely to increase thepotential for gains from trade in pollution control: and, thereby, to enhance the potential for
protocol effectiveness.
Some analysts have argued for uniform standards to "level the environmental playingfield." This argument, which is one version of the "pollution haven" hypothesis (Cumberland1981), states that the implementation of uniform standards removes incentives for industries torelocate to jurisdictions in which standards are low or nonexistent. The pollution havenhypothesis is currently the focus of a number of research effort in the environmental policy field
(Jaffe et aL. 1995; Cropper and Oates 1992). Early results from this research are not in fullagreement, but basic theory suggests that a policy of "environmental federalism," or the settingof standards at a level which internalizes pollution impacts, is economically efficient (Oates and
20 Helfand (1991) evaluates the economic effects of at least five different kinds of standards.
45

Table 7
Distributional Im
plications of Instruent Choice
~..~
Shareholders of
Workers in
Existing Firm
sE
xisting Firms
Application of controls:
To existing
To new
firms only
To existing
To new
firms only
firms only
firms only
No controls
Inferior to freely
Inferior to
Superior to any typedistributed
standardsof control
marketable perm
its
Uniform
effuent standardsSuperior to either
Superior to noInferior to no
Superior to charges,charges or auctioned
controls or freelycontrols
marketable perm
itsm
arketable permts
distributedm
arketable permits
Tradeable P
ermts
Superior to noInferior to
Inferior to noInferior to standards
(marketable right to
controls; if freelystandards, if freely
controlspollute a specified quantity
distributed, thendistributed
of effuent)superior to standards,charges, or auctionedm
arketable permits
Effuent charges
Inferior to standardsInferior to no
Inferior to standardscontrols
Source: D
ewees (I983)
\0~

Schwab 1988). This result derives its force from the fundamental nonuniformities in cause andeffect, described above.21 This theoretical result reinforces an argument for the setting ofstandards at domestic or subregional levels in the Caribbean, although it should be recognizedthat some states or subregions wil need outside assistance in setting standards.
Other considerations suggest that pollution haven arguments are sometimes exaggerated.For example, unlike marine pollution from ships, land-based capital is not completely mobileand cannot be moved costlessly to avoid stringent environmental regulations. Some types ofland-based sources, including utilities such as power plants, must be sited in almost every
jurisdiction. 22 For those states that focus on tourism as a major industry, the pollution haven
hypothesis would appear to be easily rejected. Also, factors affecting other inputs to anindustrial firm's production processes, such as labor costs, may greatly outweigh the estimatedcosts of environmental regulation in a firm's location decision. For example, Jaffe et al. (1995)find that the costs of industrial compliance with federal pollution control regulations in theUnited States are a small fraction, averaging only two percent, of the total cost of production.
It is likely that great difficulties wil be encountered in attempts to reach agreement onor to implement regionwide uniform water quality standards or technology-based controls,thereby heightening the potential for protocol ineffectiveness. The adoption of regional standardsmay result in an international consensus on the lowest standards acceptable to all parties (cf.,Sand 1991), instead of ones that reflect the size of damages or that adequately protect humanhealth. The nonuniform distribution of causes and effects of LBMP in the WCR strengthens anargument for decisions to be made on water quality standards and pollution control instrumentsat the subregional, bilateral, or domestic levels. Discussion at regional fora on the benefits ofwaivers, exemptions, and timetable extensions indicate that the Contracting Parties are awareof the problems of adopting and applying uniform standards. Thus, a critically importnt rolefor an LBMP protocol is to help states identify the most appropriate pollution controlmechanisms for their individual or shared environmental circumstances.
G. Summary
Many of the arguments made for concluding an international LBMP protocol in the WCRare valid at some scale. Transboundary pollution occurs along the borders of some states but
21 In their study of the benefits and costs of the U.S. clean water program, Lyon and Farrow (1995) recommend
that more attention be given to geographically targeted controls instead of uniform national regulations.
22 If environmental regulations var by jurisdiction, then the kinds of technologies employed by utilities may
var as welL. But utilties wil not be attracted to regions because of nonstringent environmental regulations. In
fact, some types of "point" sources, such as sewage treatment facilties, will be attracted to regions because ofstringent environmental regulations.
47

is not a regionwide phenomenon. Nevertheless, it may be one of the strongest reasons forconcluding an international agreement. Clearinghouse efficiencies, a type of scale economy,may exist for some categories of pollution problems that are common among the WCR states.Clearinghouse programs exist already in the region, and the issue for protocol negotiators is howto take advantage of these programs through judicious consolidation or expansion in some
directions to test for additional scale effects. The nonuniform distribution of causes and effectsof marine pollution in the WCR argues for approaches that deal with problems at each location.We argue for flexibility in the adoption of pollution control instruments, such as tradeablepermits or emission charges where appropriate. Regionwide requirements for technologycontrols wil be unnecessarily costly and inappropriate unless threshold effects are likely.
Increasingly, observers are arguing for an LBMP protocol in the WCR that gives priorityto resolving localized but widely occurring pollution problems. Such an approach is clearlymore compatible with the environmental realities of the region than one that seeks only (orprimarily) to address transboundary pollution problems. However, the logic of concluding aninternational protocol to address primarily domestic pollution problems depends upon certainunproven assumptions about clearinghouse efficiencies and other scale economies, and about thelikelihood that an international program wil be more effective than efforts by individual statesin attracting funding and other forms of assistance from multilateral and bilateral donor agencies.We believe that these assumptions are valid to a point that stops well short of justifying auniform, regionwide approach to LBMP problems and solutions. Rather, recognizing that somecommon LBMP problems in the WCR are more common than others (see Section IV), werecommend a protocol that carefully delineates subregional groupings and approaches on thebasis of common marine environmental problems. We further recommend (in Section VI) thatthe "umbrella" function of a regional LBMP protocol should concentrate on the need to ensureuniform access to all clearinghouse products and on the internal allocation of financial andtechncal assistance to individual states and subregions.
:.ir.o.
In the next two sections, we describe commonalities and differences across WCR statesand begin to identify opportnities for mutual benefits in pollution reduction and control, which,
if properly elucidated, can be used to encourage subregional pollution control efforts.
48

IV. Economic and Institutional Characteristics of the WCR
A. Regional Diversity
The limited evidence of trans boundary pollution effects noted in the preceding section isan importnt respect in which the Wider Caribbean Region (WCR) more closely resembles theMediterranean Sea than either the Baltic or the North Sea. Another striking similarity betweenthe Wider Caribbean and the Mediterranean is the large number of countries bordering theregional sea and the tremendous diversity of cultures, economies, and national priorities thateach region embraces.
Four official languages-English, Spanish, French, and Dutch-and dozens of dialectsare spoken thoughout the Wider Caribbean Region, which encompasses 37 distinct politicalunits: 25 sovereign nations (13 island nations and 12 continental), 5 territories of the UnitedKingdom, 3 overseas departments of France, 2 self-governing units of the Dutch realm(including one island shared by the Netherlands and France), 2 territories of the United States, iand the US-associated commonwealth of Puerto Rico (Table 8). The region's 25 sovereignnations alone range in size from 40,000 persons inhabiting 269 km2 (St. Kitts & Nevis) toroughly 250 milion dispersed over more than 9 milion km2 (United States), with economies
ranging from the world's largest and most diversified (United States) to one of its most abjectlypoor and undeveloped (Haiti) (Figure 11; see also Tables A.l and A.2 in Appendix A).
B. The WCR States and the Cartgena Convention
The large number of countries bordering the Gulf of Mexico/Caribbean Sea is reflectedin a long list of Contracting Parties to the Convention for the Protection and Development of theMarine Environment of the Wider Caribbean Region, or Cartgena Convention. Participationby the countries and territories of the WCR in the Cartgena Convention and its two existingprotocols (on cooperation in combating oil spils and on the establishment of specially protectedareas and wildlife) is displayed in Table 9, along with their participation in the Law of the SeaConvention (UNCLOS III) from which the Cartagena Convention takes its definition ofpollution, and in the London Dumping Convention, which govern the dumping of wastes fromships into the marine environment. Not listed in Table 9 are the three European states withisland territories in the region-France, the Netherlands, and the United Kingdom-that areParties to the Cartgena Convention. All told, 16 of the 25 sovereign states in the region are ...Contracting Parties to the Cartgena Convention, and 10 of the 12 foreign dependencies are
lThroughout the text, we omit the uninhabited US territory of Navassa Island from counts and discussions of
the WCR states. We mention it here only to explain its appearance on the maps in Sections I and V, whereindividual states are identified in terms of their maritime boundaries; in these maps, Navassa appears as a white area(as do two areas of high seas in the Gulf of Mexico) to the southeast of Cuba.
49

Table 8
Political Units of the Wider Caribbean Region
Terri tories/dependenciesSovereign States
Island ContinentalFrance Netherlands United United States
(overseas (self- Kingdomdepartments) governing (terri tories)
units ofDutch realm)
Antigua & Belize French Aruba Anguilla Navassa Is.Barbuda Guiana (uninhabited
terr. )
Bahamas Colombia Guadeloupe Netherlands British Puerto Rico
Antilles Virgin (commonweath)Islands
Barbados Costa Rica Martinique Cayman U.S. VirginIslands Islands
(terrtory)Cuba Guatemala Montserrat
Dominica Guyana Turks &CaicosIslands
Dominican HondurasRepublic
Grenada Mexico
Haiti Nicaragua
Jamaica Panama
S1. Kitts & SurinameNevis
S1. Lucia UnitedStates .... .. ... ..-.
S1. Vincent Venezuela&
Grenadines
Trinidad &Tobago
50

~o"~
e: 80~"-c:.."-i:c:Ui-~ 60c.ac.~oQ.
.E 40~Q.~Q.c.Q.~"-..-9 20::E::u
100
oo 20 40 60 80
Cumulative Percentage of States in Region100
Figure 1 i" Regional diversity as measured by GDP per capita. Greater diversity is shownas a larger deparre from the 45° dashed line, which depicts a perfectly uniformdistrbution of GDP per capita. Among the four regions depicted, the WiderCaribbean and the Mediterranean are the most diverse.
51

Table 9
Participation In Law of the Sea, London DumpIng, and Cartagena Conventions
State Law of the London CartagenaSea Dumping & Protocls
Anauila' .Antiqua & Barbuda . . . .'Aruba" 0 . .. .Bahamas .Barbados . ..Belize .Bntish Viraln Is: . . .'Cavman Is.c . . .'ColombIa 0 0 . ..Costa Rica . . ..Cuba . . .. .Dominica . ..Dominican Reoublic 0 .French Guiana' 0 . .. .Grenada . ..Guadelouoe' 0 . . .'Guatemala 0 . .. .Guvana .Haiti 0 .Honduras . . 00Jamaica . . .. .Martinique' 0 . . .'Mexico . . ...Montserrat .Neth. Antiles" 0 . . ..Nicaraaua 0 00Panama 0 . . .'Puerto Rico' . ..'SI. Kits & Nevis .SI. Lucia . . . .'SI. Vincent & Grenadines - . . .'Sunname 0 .Tnnidad & TobaQo . ..'Turk & Calcoc . . .'United States . . .'US Virain Islands' . . .'Venezuela 0 .. .
. Convention signed and ratified. 0 Convention signed but not ratifed.
. Oil spil protocl signed and ratifed: 0 Oil spil protoc signed but no ratifed:
. SPAW protocl signed (only Colombi has ratifed)
'Not a Contracting Party to the Cartagena Convention, blt participates in the Canbbean~nviroment Programme.By Netherlands.
"By UK.'By France (Cartagena Convention signed "wth reseive.'j'By US.Sources: Branes 1991: IMO 1991: Curtis 1993: Broadus and Vartanov 1994: Mandell 1994:
UNEP 1992a: World Bank 1994: WR11994.
52

bound by its provisions as welL. i (Signatories that have not ratified the convention includeHonduras, Nicaragua, and the European Economic Community).
The Cartagena Convention was negotiated under the auspices of UNEP, and morespecifically of UNEP's Regional Seas Programme, whose charter is to promote "a regionalapproach to the control of marine pollution and management of marine and coastal resources"(Introduction to Cartagena Convention, UNEP 1983). The Wider Caribbean Region became thefourth designated Regional Seas Programme area in 1981 (the Mediterranean was the first, in1978), when an intergovernental meeting at Montego Bay, Jamaica, adopted an Action Plan
for the region. As is customary for the UNEP Regional Seas Programme, the Action Plan setforth required program components in the areas of environmental assessment, environmentalmanagement, environmental legislation, institutional arrangements, and financial arrangements.
The Cartgena Convention, adopted in March 1983 at Cartagena de Indias, Colombia,satisfies the Action Plan's requirement for environmental legislation. It takes the customaryUNEP form of an umbrella convention, elaborated by specific techncal protocols, that servesas a legal framework for cooperative regional and national actions. As expressed in theIntroduction to the Cartagena Convention, "The legal commitment of Governents clearlyexpresses their political wil to manage individually and jointly their common environmentalproblems." Article 7 identifies land-based marine pollution (LBMP) as among the environmentalproblems to be managed.
Joint management of LBMP is likely to be particularly challenging in the case of theWCR, given the large number and broad diversity of the countries involved. As noted in thecomparative study of the Baltic, North Sea, and Mediterranean programs, "one may expectcooperation effort-and particularly the establishment of shared objectives and commonapproaches-to be the most complicated in regions with relatively heterogeneous member
countries" (Broadus et al. 1993). The study goes on to suggest, in the case of the Mediterraneanprogram, that "improvement in managing land-based pollution may be possible by separating andrecombinng the Mediterranean countries into new subregions, based on environmental
considerations. "
In the remainder of this section, we consider the prospects for addressing LBMP on asubregional basis, using as our point of departre the six WCR subregions designated by theCEPPOL program. The CEPPOL point-source pollutant inventories and other reports ofobserved pollutants and associated environmental degradation are reviewed in the context of
various economic and institutional factors that shed light on these observations and on theprospects for controlling land-based marine pollution through collective actions and mechanisms.
i The United Kingdom has ratified the Caragena Convention on behalf of the British Virgin Islands, the Cayman
Islands, and the Turks and Caicos Islands, but not Anguilla or Montserrat.
53

C. Overview of Demographic and Economic Indicators
Selected indicators of LBMP inputs are presented for the 37 countries and islandterritories of the WCR in Table A.3 (Appendix A). The indicators fall into four general areasof information: on human settlements, agriculture, mining and manufacturing, and deforestation.Information on human settlements includes the estimated concentration of each country'spopulation within the drainage basin and coastal areas of the Wider Caribbean Region (seeAppendix B) and the extent to which the population has access to sewage treatment services.This information sheds light, for example, on the CEPPOL finding that a very high proportionof the Subregion V domestic pollutant load is attributable to Venezuela, even though Venezuela'spopulation, at 19 milion, is only three-fifths the size of Colombia's: Venezuela's coastal
population is approximately 4.5 times greater than Colombia's (Mandelli, pers. comm., 1995;see also Table B.l in Appendix B). Other information reported in Table A.3 includes the extentof pesticide and fertilzer use and the distribution of oil refineries, mines, and factories ofvarious types thoughout the region.
Subsumed under the statistics on agriculture are those for fisheries, which, unlikeagriculture (or mining and manufacturing), derives more benefit from an unpolluted marineenvironment than from the freedom to contribute to LBMP. 3 For this reason-and becauseeconomic data on the region's fisheries are scant and are believed seriously to underestimate thevalue of fishing to many WCR cultures and economies (Mahon 1993)-selected data by weighton fish catch, imports, exports, and domestic consumption are presented separately in Table A.4
(Appendix A). Table 10 provides some limited economic data on those WCR countries that rankamong the top 50 in the world for the value of their annual fish imports and/or export, asreported in U.N. trade statistics (UN, n.d.). Nineteen of the WCR countries and territoriesqualify for inclusion, but only nine of these-the Bahamas, Colombia, Costa Rica, Cuba, FrenchGuiana, Honduras, Mexico, Panama, and Venezuela-are net fish exporters in terms of valueof catch.
Tourism, an economic mainstay for many countries of the region, is an activity that canbe both vulnerable to and a contributor of LBMP. Tourism receipts as a percentage of GDP arereported in Table A.5 (Appendix A), which also includes a narrative summary highlighting themost prominent economic activities and targeted growth areas for the WCR countries. Thecountries are grouped in the table according to the six CEPPOL-designated subregions, makingit comparatively easy to identify those geographical areas where economic activities andpriorities are the most homogeneous (Subregions II and IV), the most vulnerable to LBMP(Subregion IV), or the most likely to create LBMP effects for downstream countries (SubregionV).
3 This statement is paricularly true for the smaller island states, where near-shore arisinal fishing accounts for
most of the employment in fisheries.
54
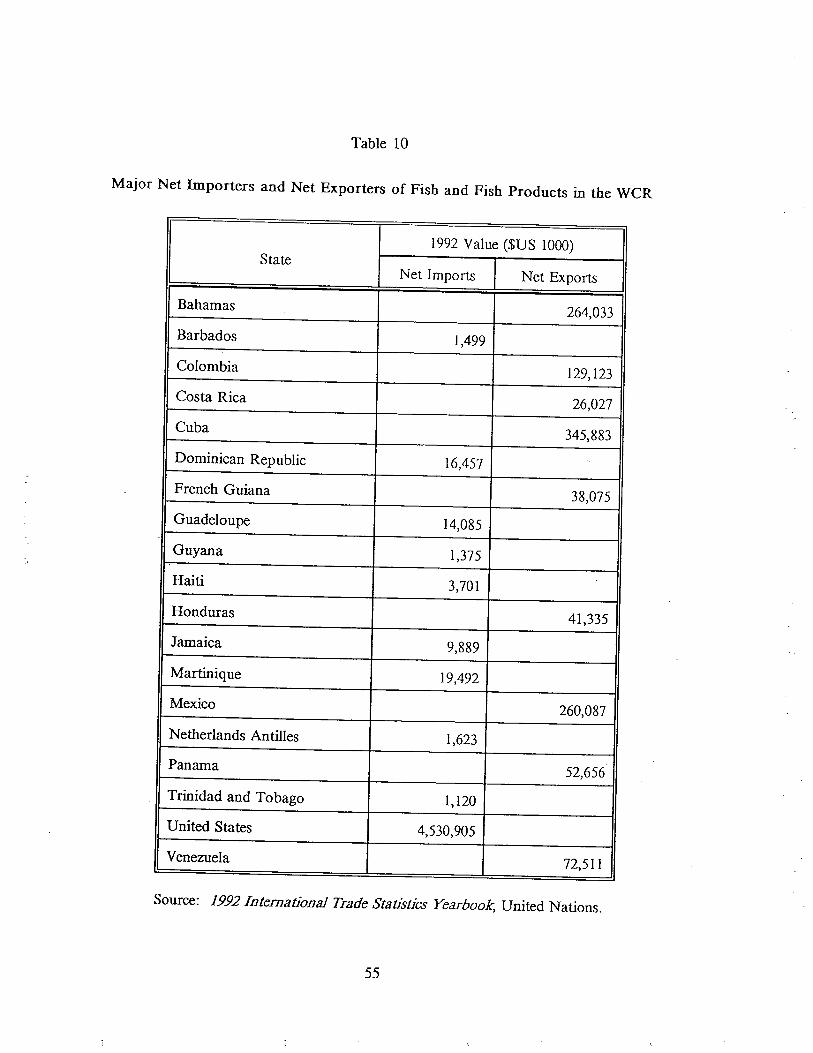
Table 10
Major Net Importers and Net Exporters of Fish and Fish Products in the WCR
1992 Value ($US 1000)
StateNet Imports Net Export
Bahamas264,033
Barbados 1,499
Colombia 129,123
Costa Rica 26,027
Cuba 345,883
Dominican Republic 16,457
French Guiana38,075
Guadeloupe 14,085
Guyana 1,375
Haiti 3,701
Honduras 41,335
Jamaica 9,889
Martnique 19,492
Mexico 260,087
Netherlands Antiles 1,623
Panama52,656
Triidad and Tobago 1,120
United States 4,530,905
Venezuela 72,511
Source: 1992 International Trade StatistIcs Yearbook; United Nations.
55

D. Comparative Overview of the CEPPOL-nesignated Subregions
Within four of the six WCR subregions, the amount of divergence in standard of livingand the size and composition of economies is nearly as striking at the subregional level as it isthroughout the WCR as a whole. The exceptions to the general pattern of diversity areSubregion II, which is typified by agricultural economies with low per capita GDP and fairlylow population densities, and Subregion iv, which is typified by tourism-dominated economieswith somewhat higher than average Gnp and very high population densities.
Fisheries statistics, although very incomplete and often unaccommodating for purposesof direct comparison, provide sketches of the subregions that have similar implications for theemphasis likely to be placed on the quality of the marine environment. For example, theaverage per capita consumption of fish thoughout the WCR is approximately 20 kg, and itranges from a low of 5.9 kg in Subregion II (with all 7 states well below the WCR average) toa high of 33.7 kg in Subregion iv (with 5 states consuming more than twice the WCR average,and another 3 well above average). These patterns, like the larger economic picture, point tostrikingly different incentives at work in the two subregions with respect to controllngdegradation of marine and coastal resources. Within the other subregions, by contrast, the levelsof fish consumption, like the other economic indicators, are much less consistent.
A number of marine pollution and resource degradation problems plague all of thesubregions, though in varying degrees. The most widespread problems are direct damage toreefs and mangroves from commercial and recreational activities (e.g., dredging, clearing,dumping, fishig, diving, and boating) and pollution of coastal waters by sewage effuent.Among the problems that reach serious proportions in some subregions while occasioning littledistress in others are coastal erosion; deforestation; and pollution from fertilizers and pesticides,bauxite mining, and oil refineries.
1. Economically heterogeneous subregions
Subregion III, the most strikingly heterogeneous subregion (in economic terms), includesthe Greater Antilles, the Bahamas, and the Cayman and Turks and Caicos Islands. Thissubregion is horne to both the highest and the lowest per capita Gnps throughout the WCR (theCayman Islands and Haiti, respectively), as well as to the economies that rank highestthroughout the WCR in terms of the predominance of agriculture (Haiti, at 34 percent of GDP),versus manufacturing (Cuba and Puerto Rico, both at 39 percent), versus tourism (CaymanIslands at 70 percent, about even with Antigua & Barbuda and the US Virgin Islands inSubregion IV; and the Bahamas, where tourism has recently declined from about 75 to about 50percent of GDP). Moreover, among all the economies in the WCR that are heavily orientedtoward tourism, those in Subregion III are the most firmly bolstered by a robust financial
56

services sector.
Jamaica, at the geographic center of Subregion III, has the most balanced mix ofagriculture, manufacturing, tourism, and mining of any country in the WCR (agriculture 5percent, mining 10 percent, manufacturing 20 percent, tourism 21 percent), and in this sensecould perhaps be characterized as the most typical of Caribbean countries, notwithstanding a percapita GDP less than one-third the WCR average.
The Subregion III countries exhibit similar range as well in the extent to which fisheriesprovide a significant export/import and dietary staple. The value of net fish exports by the
Bahamas is the second-highest throughout the entire WCR (after Cuba; Table 10). As can beseen in Figure 12, the Cayman Islands has one of the smallest catches (by weight) and exportsthe largest share of its catch of any WCR country, relying heavily on imports (Table A.4) tosatisfy a roughly average per capita domestic consumption rate among its tiny population of26,000. Haiti, by contrast, exports less than 10 percent of its catch, which ranks in the middlerange (by weight) among all the WCR countries; nonetheless, more than two-thirds of the fishconsumed by Haiti's population of 6.5 millon must be imported, even though its per capitaconsumption rate is the fifth lowest in the entire WCR (Table A.4).
Subregions I and V also exhibit considerable divergence in terms of economic size andemphasis, although in neither case is the mix of leading economic sectors for individual countriesas pronounced as in Subregion III.4
Subregion i. The divergence among Subregion I countries is most striking with respectto per capita GDP (Table A. 1, Appendix A). This is the subregion with the highest average percapita GDP by far (1.75 times the WCR average), yet US per capita GDP is 6 times hìgher thanMexico's and 14 times higher than Cuba's. Similarly, population density is well below theWCR average of 159/km2 in all thee countries, but it nonetheless ranges considerably withinthe subregion, from 27/km2 in the United StatesS to 96/km2 in Cuba. All thee economies areindustrialized and diversified, but Cuba's is the most distinctly geared to .natural resourceexploitation: 20 percent of Cuba's GDP is concentrated in agriculture and mining, as opposedto 11 percent of Mexico's and just 4 percent for the United States-notwithstanding the fact thatthe United States holds more than 1600 outer continental shelf leases in the Gulf of Mexico and,together with Mexico, accounts for thee-quarters of the roughly 100 oil refineries in operationthoughout the WCR (Table A.3).
4This is hardly surprising, given the smaller numbers of countries involved-just 3 in Subregion I and 5 in
Subregion V as opposed to 8 in Subregion II-and the higher proportions of large economies, which tend to bemore diversified and more balanced than smaller ones.
SPopulation density is roughly the same throughout the five Gulf coastal states as for the United States as a
whole.
57

MontserratArba
Cayman IS.
DominicaUSVI
St Lucia _Neth. Antilles _
Brish VI
BelizeSt Kis
Grenada __Antigua & Baruda
MartniqueSuriname
NicaraguaGuatemalaBarbados _Fr. Guiana
St Vincent & GrenadinesBahamas
Hai _ ~Trin & Tob
GuadeloupeJamaica _ _
HondurasDominican Rep
Costa Rica ,.Guyana
Colombia ,-
PanamaCuba
VenezuelaUS GulfMexico
oI
10I
20 :i ~o ~ t! -10 Jo ~ 100
1- Exports as % catch ~ Ann kg per capita
Sources: FAD, 1993a; United Nations, n.d.
Figure 12. WCR fish exports and per capita fish consumption(Note: States appear in order, bottom to top, from largest to smallest catch byweight.)
58

The picture is similar with respect to fish export: Cuba has the fourth-largest catch byweight in the WCR (after Mexico, the US Gulf Coast states, and Venezuela), and the value ofits net fish exports is the highest of any reported for the entire region (Table 10). OnlySubregion VI has less economic reliance on tourism, which constitutes less than 2 percent ofGDP for each of the three Subregion I countries and about 2.6 percent of GDP for the five USGulf coastal states.
Subregion V. As importnt as petroleiim is in the Gulf of Mexico, it is in Subregion Vthat its economic dominance is greatest. Each state in the subregion has at least one refinery,and oil accounts for roughly 30 percent of GDP for Trinidad & Tobago and about 23 percentfor Venezuela. Tourism is targeted for development in Venezuela and especially in Trinidad &Tobago, but in neither country, nor in Colombia, does it yet contribute appreciably to GDP.
The least industrialized state in Subregion V is the Netherlands Antilles, which has thelargest commercial drydock in the Western Hemisphere, on Curacao; tourism is the majoremployer and accounts for more than one-third of GDP, followed in importnce bybanking/finance and fishing. Although tourism figures even more prominently in Aruba (whereit is nearly 50 percent of GDP), Aruba's oil and manufacturing sectors are considerably morerobust than in the Netherlands Antiles.
Colombia's maintays are agriculture and manufacturing (each accounting for 21 percentof GDP), but in no other country of Subregion V does agriculture account for more than 5percent of GDP.
Fish is an importnt dietary staple only in the Dutch dependencies, which must importthee-quarters or more of their needs to meet domestic demand. The largest fish exporter in thesubregion is Colombia (Table 10), which has the sixth largest catch by weight in the WCR,export 40 percent of its catch, and import. one-thrd of its needs to meet the lowest per capitadomestic consumption rate outside of Central America. Venezuela, with a catch thee times thesize of Colombia's, exports very little of its catch (about 10 percent) and import less than 1percent of its needs. Trinidad & Tobago imports just under half of its needs and exports lessthan one-fifth of its catch.
Subregion VI. Fisheries may well be more importnt to Guyana and French Guiana inSubregion VI than to any other countries in the WCR. Both have small and quite narroweconomies and very high per capita rates of fish consumption. Guyana, with a population of800,000, has the distinction of being the only WCR state that is self-sufficient in fish.6 FrenchGuiana is one of the major exporters of fish and shrimp in the region, with shrimp accounting
6According to many sources, including FAO (1993a). UN trade data for 1992, however, list $1,375,000 worth
of fresh and frozen shellfish imports by Guyana.
59

for half of export earnings (and sugar accounting for most of the rest).
Overall, agriculture is the predominant sector in both economies, in terms of share ofGDP. In French Guiana, however, the major employers are forestry and construction, althoughFrance is both the largest source of income (in the form of subsidies) and the most important
source of high-wage and high-skil employment (at the Euro-French space center at Kourou).Guyana, nicknamed the "breadbasket" of the Caribbean, is also known as the world's largestproducer of bauxite and has recently become a producer of gold as welL.
Agriculture and bauxite mining are less prominent, though not insubstantial, in theeconomy of Suriname, where the largest share of GDP (22 percent) is concentrated in financialand real estate services and the largest segment of the workforce (37 percent) is employed inpublic administration and defense. Suriname's is decidedly the most precarious ewnomy withinthe subregion, however, having hovered near the brink of fiscal crisis ever since economic aidfrom the Netherlands and the United Nations was suspended in 1982 in the wake of a post-independence military coup (U. S. State Department 1994).
Probably the most homogenous aspects of the Subregion VI countries are theirremarkably low population density, which averages just 2.6 persons per km2, and the near-totalconcentration of their populations along the coastline. Per capita GDP is also below the WCRaverage for all thee countries, but it ranges from a very low $435 in Guyana to more than tentimes that amount in Suriname.
2. Economically homogeneous subregions
Subregion II. Average per capita GDP is lowest of all in Subregion II, one of two quiteeconomically homogeneous subregions within the WCR. As noted earlier, agriculturaleconomies with low per capita GDP and low population densities are characteristic of SubregionII. So, too, is a greater economic orientation toward the Pacific than the Caribbean coast for
all the Subregion II countries that have two coastlines (i.e., all but Belize). Manufacturing,though generally accounting for a lesser share of GDP than agriculture, is even more ubiquitousthroughout the subregion as an importnt economic sector.
The only two countries that depart appreciably from this description are Mexico (whereagriculture is just 9 percent of GDP) and Panama (where agriculture and manufacturingcombined are just 20 percent of GDP). Mexico, as noted earlier, is quite highly diversified, andits economy completely dwarfs all others in the subregion (although Mexico's per capita GDPis no more than 50 percent higher than any other in the subregion). Panama alone in SubregionII has an economy dominated by services (26 percent of GDP in transportation/communications,with 32 percent of the workforce employed in governent services).
60

Only in Belize does tourism represent a substantial proportion of GDP (23 percent) anda priority area for investment and growth.
After Mexico, Panama leads the subregion in fish catch (by weight). Costa Rica,Honduras, Guatemala, and Belize all export substantially greater proportions of their catch thanPanama, but within the subregion only Mexico's net fish exports surpass Panama's in value.The average rate of domestic fish consumption in Subregion II is the lowest in the WCR, andonly in Mexico and Panama does it surpass 10 kg per capita per year.
Subregion iv. In striking contrast to this picture is Subregion IV, the only othereconomically homogeneous subregion, which is typified by tourism-dominated economies,somewhat higher than average per capita GDPs, and very high population densities. SubregionIV contains seven of the bottom eight WCR countries in terms of proportion of GDP accountedfor by agriculture, mining, and manufacturing combined.
The homogeneity is particularly noteworty for the fact that Subregion IV is the one with
the greatest number of political units (14) and the broadest array of foreign dependencies (twoFrench overseas departents, the smaller islands of the Netherlands Antiles, three Britishterritories, and the U.S. Virgin Islands). Clearly the commonalities are the small size of theislands and their considerable limitations with respect to natural resources. Only Dominica,Grenada, St. Lucia, and St. Vincent and the Grenadines can support agriculture to anysignificant extent (i.e., approaching 20 percent of GDP).
Tourism is tremendously importnt to most of the Subregion IV economies. This is trueeven of heavily (French) subsidized Guadeloupe and Martinque and those few other states thatmay be equally well known for other things besides tourism-such as Barbados for its sugar,rum, and banking services, or the US Virgin Islands for its Hess Oil refinery, the largest in theWestern Hemisphere.
Fisheries employment and fish consumption also contrast distinctly with the SubregionII pattern. Domestic consumption of fish is very high in nearly all the Subregion IV states, andcomparatively little of the fish catch is exported by any state except St. Vincent and theGrenadines.
3. Marine pollution and resource degradation problems within and across subregions
Table 11 displays the observed pollution and resource degradation problems associated
with the economic activities and population concentrations within the WCR states andsubregions. Nearly every state in the region has suffered direct damage to coral reefs andmangroves from a combination of pollutants and economic and recreational activities (as wellas from natural hazards such as hurricanes and coral bleaching). The next most common
61
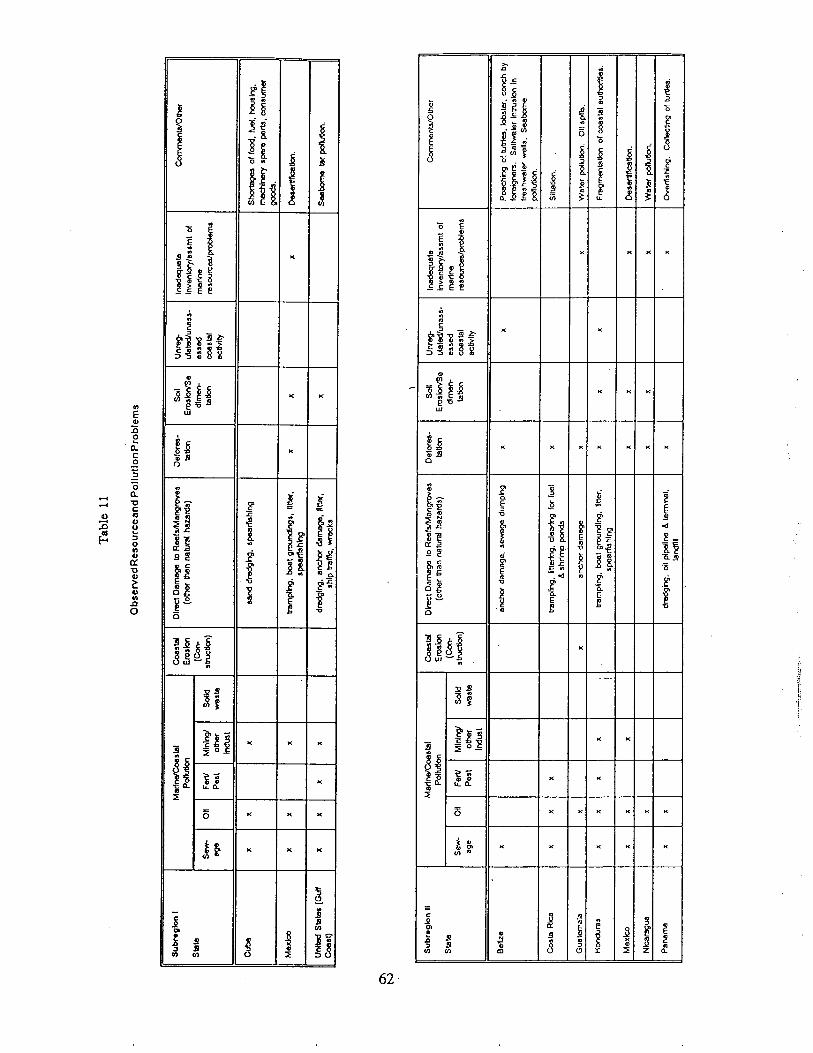
Tab
le i
i
Obs
erve
d R
esou
rcea
nd P
ollu
tion
Pro
blem
s
Sub
regi
o I
Man
".C
osta
lC
os ta
DI~
! D
ama
10 R
eers
lang
roes
Der
or.
Sol
Unr
eIn
aequ
ate
Cot
sOIt
Polu
tE
rosi
o(o
lh lh
n na
turs
haa
rd)
la li
Ero
slo
utal
euns
s-Invenio/.ssmt 01
Stal
e(C
odi
me,
.es
sed
man
neSe
.01
1F
e1
Min
ing
Sefi
dsl
Nll)
ta !
!co
.tal
reso
urcp
rsag
Pest
olh
WIs
ieac
lilty
Indu
s i
Cu
xx
xsand drein, sperfhlng
Sho
of l
co, f
u, h
osin
g,m
i .pe
re p
ert,
cosu
mgo
.M
exic
xx
xtr
mpl
in, b
ot g
rong
s, li
ne,
xx
xee
ll.sp
erfh
lng
Uni
Sta
le (
Gu
xx
xx
dren
g, a
nc d
ama,
line
,x
Sebo
ta p
o.eo
ll).h
lp tr
1l, w
rks
0' N
Sub
reg
Ion
IIM
anne
'Cos
tal
Cos
taD
iret D
amag
10
Ree
lsla
ngro
esD
elor
.So
lU
nre
lnau
a!e
Com
ents
/Oth
erPo
llut
Ero
sio
(oth
r th
an n
atur
al h
azar
ds)
ta ti
Ero
sloe
ulat
edun
ass-
Inventor/a.sm! 01
Stal
e(C
odl
me
esse
dm
anne
Sew
-O
ilFe
rM
inin
gSo
idi t
rll)
ta li
cost
alre
sour
cpre
ms
age
Pest
olh
WIs
Ieac
lilty
Indu
s I
Bel
ize
x.n
cho
dam
age,
sew
dum
pin
xx
Poah
in o
r. tu
lr, I
osle
r, c
o by
fom
. Sai
iwie
Intr
sio
Infr
eshW
ller
_n..
Seb
opo
ut.
Cos
ta R
icx
xx
lnmplin, litteri, cleari for fuel
xSi
ltati.
& s
hrim
p po
Gua
tela
xx
anch
o da
mag
xx
Wal
er p
ol.ti
. Oil
spill
.
Hor
ra.
xx
xx
trm
plng
, bol
gro
ndin
g, li
tter,
xx
xF
ram
etat
i of c
o.la
l aut
hlls
.!
. pe
arfh
lng
Mex
icx
xx
xX
xO
esel
i.N
lcri
uax
xx
xW. te poli.
P.ne
ma
xx
dregin. oil pipeine & termi""I.
xx
Overl.hing. Coting of turt.
land
ll
"",..
_~:~
:-..;
,:,i.a
j:'~"
'-_'

Tab
le 1
1 (c
ont'd
.)
0\ \.
Sub
regi
on II
Mar
ineC
osta
lC
osla
Dire
ct D
amag
e to
Ree
lslM
angr
oes
Def
ores
-So
liU
nre
Inad
uate
Com
meW
Olh
erPo
luto
n. E
rosi
o(oth thn natura hazards)
ta li
Ero
sloS
eul
aled
unas
s-In
vent
or/a
ssm
t of
Stal
e(C
o.di
men
-es
sed
mar
ine
Se.
011
Fer
Min
ing
Sost
rll)
ta li
cos
tal
reso
urce
sprs
age
Pesl
oth
was
teac
tMty
Indu
sl
Bah
aX
Exp
lslv
espo
sons
use
d lo
r nS
hlng
,X
anc damage, spearflShlng
Cay
man
Is.
Xx
anc damage, Ii
tier,
spe
arls
hlng
Sea
bo ta
r po
lut.
Lak
ofnali resourcs, lotal relianc on
Impo
.
Cub
ex
xx
sand drein, spaarlshlng
Sho
s of
roo
, iv,
hos
ing,
mal
ne s
pare
par
t, co
sum
00 .
Dolrn Repblic
xx
xdi
ver
dam
a, li
tt, ip
erflS
hlng
xCe id IC on nshe Impo.
Lote overshe. III coth
of c
ols,
bir
ds, l
us, T
hpo
.H
ald
xx
man
groe
cle
ri fo
r ru
elx
xO
verx
plta
ll of
nsh
. Inv
erle
and she expo tr.
Jam
aic
xx
xx
dre spols, lnmplln, ancho
xx
xExtr overhlng. High sedimet
dam
a, d
ynam
itng,
spe
rflS
hlng
,Iong fro bauxite mining. El'lo
bot.
groi
ngs
fr sand real. Reel curi
co.
Pu
RI
xx
xan
c da
ma,
shi
p ln
ll,x
Hea
re
on fo
o Im
po.
sper
1hln
g, b
obi,
wrk
sT
hl p
oil.
Tur
& C
alcs
Is.
dren
g, II
t1r
xMinima resourc base.
~:x~
~;¡j
:,i.a
;:;.,'
.-_'

Tab
le 1
1 (c
ont'd
.)
~
Subr
egio
n li
Mar
in&
eost
aleo
ata
Dir
et D
amag
e 10
Ree
lstM
angr
oes
Del
or-
Sol
Unr
eIn
auat
eC
omel
sOlh
rPo
llut
Ero
sio
(othr thn nature hazards)
ta tI
Ero
sloe
ulal
euns
s-In
enlo
/ass
ml o
fSt
ata
(Co
d1m
ees
sed
man
eSe
w-
011
Fer
Min
ing
Solid
slrU
o)te
Uo
cost
elre
sopr
sag
Pet
oth
WIs
ieio
tllty
Inus
t
Ani
nanc damage, spearflShlng
xA
ntlu
a &
Bar
bx
sand remoal, ancho damage,
Lobs
t", o
vere
xplte
d.ex
plos
ives
Bar
bsx
xx
xx
dreng. conslrtion, explosives
Nea
rsho
fish
es o
vere
xplle
;lhl pout; chngng weie
circlati pall & quality.
Brl
Ush
Vir
gin
Is.
xx
man
ge c
lear
i, lit
ter,
dyn
amiti
ngx
Ool
rkx
xx
man
groe
cle
ari f
or f
ux
Shlp
-s ta
pou
t.G
rex
xx
xlin
... s
pear
1shl
ngx
Al f
ishe
s ov
xpl.
Ero
iofr
..nd
min
ing.
Seb
opo
lut.
Gua
elou
pex
xx
xx
dyna
miti
ngx
xx
Mar
tniq
uex
man
groe
cle
arin
gx
xM
onts
eml
xF
ishe
s ov
erxp
fol1
e.N
elh.
Ant
ills
xx
xmangroe clearing, anc & diver
xS
ho o
f frs
h W
Iie. F
ishe
sdamage, sper1hlng
dete orr Saba. Marine heblls
au1em fr lnusb11 and
retil uses.
SL K
Itt &
Nev
sx
xHea relia on fo Impo.
Nears ho fishes expl.
E=
1o fr
san
d re
al.
Inau
ate
po fe
dllS
s.S
L L
ucx
lors
t cle
ri, s
and
min
ing,
anc
xx
~s s
he
blls
sir
s se
d. T
h&
div
er d
amag
, spe
rflS
hlng
po.
SL Vinct &
xde
tert
sx
xS
ebo
tar
pout
. Was
ta fr
Gre
nes
;
yact
s.U
S V
irgin
Is.
xx
xaa
nd m
inin
g, a
nc d
ama,
litte
r,La 01 natura trshwle sous.
lnm
plln
, bot
grn
ding
Thl
pou
t.

Tab
le 1
1 (c
oot'd
.)
Subregion V
Man
n&C
osla
lC
o.ta
Dlrel Damage 10 Reef.lMangl'e.
Del
ore.
-So
lU
nre
Inae
quat
eC
omen
ts/O
thr
Polu
lE
ro.1
o(o
thr
!han
nat
ural
hlz
an:)
ta ll
Ero
oloe
ulat
eUN
I5s"
Inve
to/a
umi o
fSt
ale
(Co-
dlm
eea
sed
man
neSe
w-
011
Fer
Min
ing
Solid
o tnll)
ta ti
co.la
lre
.our
cpm
em.
age
Pe.t
oU-
wa.
teec
lllly
Indu
st
Arb
a.
.ref. cooldre largly dead
Soil poti.
Co
..
""
sand
e.in
tl, fi
llin,
enc
ho.
".
Water poti. Coti of
dam
a, li
ller,
dyn
amlH
ng, w
rk.
en ll speie.. Thrml
po.
Net
h. A
n~lIe
..
""
"mangl'e clearing, anc & diver
.S
ho o
f fr.
h w
ate.
Mar
ine
dam
a,. .
pear
lhln
ghlb/to su1em fr lnu.1r1 and
retll u.e.. n-i pout.
Trin
id &
Tob
..
.an
cho
dam
age,
lille
r, tr
mp6
ngReclllll ml.u.e of
.wam
plnd
.. C
o.ta
l zon
re.
ouco
fik:to
. Ove
r~ng
of b
.and .he..
Ven
ezue
la.
..
.m
angl
'e f
illin
g, .h
lp tr
rf.
.C
o1'd
ng d
end
on c
o. ta
lare.. Seimetati of la.
fr dams. De.tntl of nalura
hlb/
to. O
v.hl
n of
lurt
es a
ndIo
.ter.
0\ VI
Sub
regi
on V
IM
arir
iCo.
tal
Co.
taD
iret D
ama
to R
eefs
lang
l'e.
Def
or.
SOL
Unr
eIn
aequ
ate
Com
eWO
lhPo
luto
nE
ro.1
o(olh thn natura hlzard.)
tade
nE
ro.lo
eu1
tedu
na..-
Inve
ntor
/aum
t of
Stat
e(C
od1
me
8$'0
0m
arin
eSe
won
F ei
Min
ing
Soid
. tnt
l)la ti
co. tal
re.o
urcp
r.ag
Pe.t
oU-
wa.
teec
t!ly
Indu
st
Fre Guna
.G
uyan
a.
X.
Water po.
Suri
na.
.So
rc.:
UN
EPn
UC
N 1
98; E
ld a
nd P
erll,
199
1; R
o.s,
Fen
, and
Gab
le, 1
~ì G
lade
lte a
nd O
gen,
199
.

problem throughout the region is pollution of coastal waters by sewage effuent. Oil pollutionis another widespread problem, although one that tends to originate primarily from sources andactivities that are not based on land.
On average, the states in Subregions I and V do better than those in the other subregionsin providing sewerage services (an average of 73 % of citizens in Subregion I have access toservices, and an average of 64% of Subregion V citizens). Being the most heavily industrializedof the subregions, they share other, less desirable, traits as well. Readily apparent in Table 11
(and in the CEPPOL results), for example, are the pollutants associated with the heavy emphasison oil exploration and refining in both these subregions. Problems of a more localized naturein Subregions I and V include the coastal erosion associated with the high concentration ofpopulation in the coastal zone in Venezuela; soil erosion/sedimentation emanating from Mexico,the US Gulf Coast, and Venezuela; deforestation in Mexico, Colombia, and Venezuela; andstress to reefs and mangroves from ship traffic and wrecks off Colombia, the United States, andVenezuela.
The only other area in the WCR where ship traffc and groundings have been cited asa serious problem is the Greater Antilles, especially off Puerto Rico and Jamaica. Far moreimportant and common throughout Subregion III, however, is pollution by oil and grease,minig, and other industrial pollutants, which has left only the Bahamas and the Turks andCaicos Islands relatively untroubled. Jamaica, the most economically broad and balanced statein the subregion, suffers the broadest array of pollution and environmental degradation problemsas well, including stress to mangroves from sand removal and bauxite mining, deforestation, andsoil erosion. Haiti is noteworty for its very high rate of mangrove clearing for fuel to sustain
a tradition of charcoal-based cooking, and for its very low rate of access to sewerage services.Overall, Subregion III ranks in the middle range for provision of such services, which are
available to an average of 62 % of citizens thoughout the subregion. The broadest access isprovided by the Cayman Islands, where 97% of the population have access to sewerage services.
The contrasts between Subregions II and IV, and the relative homogeneity within each,are also evident in the environmental problems noted in Table 11. Deforestation is a problemfor every Subregion II country, whereas coastal erosion, sewage pollution, and overfishing arethe most pervasive natural resource problems in Subregion IV (in addition to the ubiquitousstresses to reefs and mangroves). In both subregions, an average of just 37% of the populationhas access to sewage services.
7 Within Subregion II, the coastal waters of Costa Rica,
7Accrding to the Britannica Book of the Year 1995. The Pan American Health Organization (PAHO) paints
an even more discouraging picture: P AHO estimates that -c 10 % of sewerage systems in Latin American countrieshave adequate treatment plants, and that only 5-10% of the collected wastewater receives adequate treatment
(PAHO/WHO 1992). For the countries of the Caribbean Common Market (CARICOM, including Antigua &Barbuda, Bahamas, Barbados, Belize, Doiinica, Dominican Republic, Grenada, Guyana, Haiti, Jamaica, Mexico,Puerto Rico, St. Kitts & Nevis, St. Lucia, St. Vincent & the Grenadines, Suriname, Trinidad & Tobago, and
66

Honduras, and Mexico contain substantial amounts of industrial pollutants, which is a problemas well for Barbados, Grenada, Guadeloupe, and the US Virgin Islands in Subregion IV.
The very few indications of pollution and natural resource degradation problems notedfor Subregion VI in Table 11 reflects primarily two factors: the relative lack of modernindustrialization in the subregion, and a lack of study of its environmental problems. Only thesewage problems associated with the heavily coastal concentration of the population arerecorded.
4. Extra-regional trade as a unifying force
Having emphasized the economic diversity of the Wider Caribbean Region and thedistinct characteristics of its individual states and subregions as crucial considerations in thedevelopment of an effective protocol on land-based marine pollution, it is equally importnt torecognize the degree to which this region has come to be defined and shaped into something ofa single, coherent entity by virte of its trade relations with the rest of the world. The stateswith importnt agricultural sectors, for example, are bound by their interest in preferential tradeagreements with the United States and the United Kingdom concernng sugar and bananas, andthe manufacturing-oriented economies are bound by a similar interest in agreements with theUnited States concernng garments and other consumer goods.
Currently there is considerable concern that at least some of these sectors are in jeopardyfrom the trend toward trade liberalization embodied in recent NAFTA and GATT/WTOdevelopments and from changes in UK import policies resulting from the integration of theEuropean market. (In addition, Caribbean shipping services have been predicted to lose marketshare in the wake of European integration and resulting effort to strengthen the position ofEuropean shipping services.) The fear of fallng prices and/or loss of market share hasintensified the trend.roward investmentin.tourism "thoughout virtally the entire region-justas banana production was intensified after a dramatic lowering of US sugar quotas in the 1980sled to a decline in the importnce of sugar to many WCR economies.
The increase in banana production has had serious environmental consequences (WorldBank 1993), primarily in the forms of soil depletion and erosion and high concentrations ofnutrients and pesticides in agricultural run-off. The intensification of tourism-related
constrction, sewage, transporttion, and other activities and services, particularly within thewell-established, beach-oriented tourist markets, could eventually prove even moreenvironmentally damaging. As one concerned observer has argued, "Tourism in the Caribbeancould cease within ten years if destruction of the environment continues at the present pace"
Venezuela), a recent PAHO survey concluded that only 2 % to 16% of the population is served by sewage systems(UNEP 1994a).
67

(Goodwin 1992).
One encouraging and potentially competing trend, in which Belize, Dominica, andGuyana have been leading the way, is an emphasis on ecotourism and nature activities, whichare particularly popular with the Europeans who account for most of the recent growth in touristarrivals in the region (Goodwin 1992). Another development, embraced by some governmentsand shunned by others, is the spread of casino gambling, which has proven quite successful inboosting tourism performance in Aruba, for example (Goodwin 1992).
E. Legal and Regulatory Frameworks
In the context of negotiating an international protocol, a particularly important aspect ofregional diversity in the WCR concerns the distinct legal traditions and systems which must beharmonied and upon which a system of effective protocol implementation depends. Themajority of states follow one of two primary legal/cultural systems prevailing in the region. Thefirst of these is the Roman civil law tradition of the Spanish-speaking countries, in which
patterns of resource use are based upon the principles of private ownership and have beencodified over time in a body of civil codes, statutes, and ordinances. The other major traditionin the region is that of Anglo-Saxon common law, which traditionally has emphasized custom,usage, and the decisions and precedents of courts of law, and only comparatively recently has
been codified by legislative action.
Characteristic of nearly all the WCR countries, however, irespective of legal tradition,is an incomplete and somewhat disjointed approach to environmental legislation andmanagement. Two common conclusions noted in studies of the environmental problems of theWider Caribbean Region are that (1) the laws, regulations, statutes, and ordinances with abearing on environmental matters typically are too fragmented to deal. comprehensively and
effectively with the full range of environmental problems in the region; and (2) the legal andloradmiistrative mechanisms for enforcing environmental rules are too often absent,ìhappropriate,andlor readily ignored or circumvented.
A 1991 study by the Inter-American Development Bank (IADB), for example, notes thatmost Bank borrower countries in the WCR8 lack coherent national policies for environmentalprotection, relying instead on so-called sectoral legislation and ministries, which typicallyaddress themselves to thee general categories of fundamentally "dissimilar" subjects:
(i) protection of certain natural resources such as water, soil, wildlife, marine and coastal
ecosystems, nonrenewable natural resources, etc.;
8lADB borrower countries in the region include the Bahamas, Barbados, Colombia, Costa Rica, Dominican
Republic, Guatemala, Guyana, Haiti, Honduras, Jamaica, Mexico, Nicaragua, Panama, Suriname, Trinidad &Tobago, and Venezuela.
68

(ii) management of the urban environment, such as human settlements and industrial sites; and
(iii) protection of human health from environmental impact (Brañes 1991).
The IADB study further notes that this purely administrative approach to environmentallegislation is generally accompanied by an approach to enforcement that revolves around thenotion of policing and the establishment of penalties. The fines associated with environmentalinfractions, moreover, are generally too low to constitute a serious deterrent, and in many casesthey are easily avoided because of the lack of resources to police effectively.
These points are reinforced in a 1994 World Bank study of the 16 member nations ofCARCOM (the Caribbean Common Market).9 The World Bank study rates the severity of 11key environmental issues in each of the 16 countries, using a scale of 1 (least severe) to 5 (mostsevere). Heading the list, in terms of combined score for all 16 countries, is inadequate"monitoring/enforcement" (54 points). Rated fourth most severe among the 11 issues are theadequacy of the "institutional framework" and "coastal zone degradation" (both at 44 points),after solid waste management (51) and sewage disposal (47).
A third and closely related problem with the institutional framework, according to theIADB study, is the tendency of WCR states to centralize legislative and administrative authorityunduly at the national leveL. Very few of the region's countries-only Cuba, Mexico, St. Kitts& Nevis, the United States, and Venezuela-have a federalized form of governent in whichstates or provinces are interposed between the national and municipal levels and given extensiveauthority for establishing or enforcing laws and regulations with environmental relevance. ioOne importnt consequence of this approach has been to limit severely the response capabilityof environmental administrations (Brañes 1991).
As a practical matter, however, the pattern in federalized and non-federalized states alikeis for "general issues of the ownership and use of environmental components, damage to theenvironment, and legal custodianship of the environment" to be governed not by comprehensivelegislation but by a 'patchwork of. sectoraL legislation and civil codes, under criteria that theIADB study criticizes as "totally inappropriate" (Brañes 1991). At the heart of the problem withthe legal and regulatory framework that is characteristic of most WCR countries is legislationthat fails to recognie what the World Bank (1994) has termed "the interlocking nature of theeconomy and the ecology" for most of the Caribbean countries:
9'e CARICOM members are Antigua & Barbuda, the Bahamas, Barbados, Belize, Dominica, DominicanRepublic, Grenada, Guyana, Haiti, Jamaica, Montserrat, St. Kitts & Nevis, St. Lucia, St. Vincent & the
Grenadines, Suriname, and Trinidad & Tobago.
lOIn Venezuela, however, although state governments generally have powers expressly assigned to them as well
as residual powers not expressly assigned to the national or municipal governents, authority for environmentalmatters is reserved for the national governent. In Mexico, similarly, the national governent has long reservedsuch powers, although recent reform allow for a gradual sharing of environmental powers by state and municipalgovernents (Brañes 1991).
69

This legislation ignores the fact that the behavior it attempts to correct through these sanctions does notnormally involve individual deviations from an imposed legal order, but generalized social behavior whichis deeply rooted in society as a result of the predominant style of development based on production andconsumption patterns that often clash with environmental protection. (Brañes 1991)
Nor does the typical pattern of sectoral legislation and civil codes reflect a modern, scientificunderstanding of the environment as a single, interlocking system.
There are some noteworthy exceptions to this pattern, however, which Brañes argues arecontributing to a trend throughout much of the region toward a more comprehensive approachto environmental legislation and management. The IADB study cites national legislation inColombia, Cuba, Guatemala, and Mexico as instances of "true" environmental legislation-thatis, legislation "based on a concept that views the environment as a whole, organied as asystem." The specific examples include Colombia's National Code on Renewable Natural
Resources and Environmental Protection (1974); Cuba's Act No. 33 on Environmental
Protection and the Rational Use of Natural Resources (1981); Guatemala's Environmental
Protection and Improvement Act (1986); and Mexico's General Act on Ecological Balance andEnvironmental Protection (1988), which combines and supersedes two earlier acts of similarcharacter (the 1971 Federal Act on the Prevention and Control of Environmental Pollution, andthe 1982 Federal Environmental Protection Act). Although not covered by the IADB studies,both Belize and the United States could be included in this group as well-Belize for its 1992Environmental Protection Act, and the United States for its 1969 National Environmental PolicyAct.
Evidence for the argument that other states in the region are beginng to recognie theintegrated nature of the environment and of the causes of its degradation is presented in Table12, which indicates the incidence of cabinet-level ministries, national committees, or othernational bodies whose charter is to provide comprehensive leadership and coordination on
environmental matters. Although comparatively few of the WCR states (Belize, Colombia,Grenada, Mexico, Trinidad & Tobago, and Venezuela) have yet accorded the environment theimportnce of a cabinet-level concern, most have at least established a nationaL:committee orsome other entity that addresses itself more or less exclusively to environmental matters.
National committees typically are housed in the office of the president and include in theirmembership the ministers of relevant sectoral agencies; they may also include representativesof other public or scientific organizations, industr, and NGOs.
Although national committees are generally less infuential than groups accorded cabinet-level status, as permanent bodies they help to ensure that environmental affairs receivecontinuous, comprehensive, high-level attention. Of the 25 sovereign WCR states!! listed inTable 12, only 6 have not established some form of national umbrella organization to providecomprehensive oversight and leadership on environmental matters, and there is no WCR statethat does not fill such a gap by vesting at least some measure of national environmental policy
"With few exceptions, the Dutch, UK, and US dependencies and the French overseas deparments in the regionconform to the laws and regulatory structures and procedures of their respective protector states, which are notconsidered in this discussion.
70

Table 12
Aut
horf
ly fo
r E
nviro
nmen
tal P
olle
y an
d E
nfor
cem
ent I
n th
e W
CR
Sla
tes
-i ..
Stal
eC
opre
oni""
Env
lrom
onio
l Aul
hrlly
SecO
nI A
gand
ea w
ith E
nYlr
ornn
tiil R
eapo
nslb
llltk
nShoro Aulhrt lo Lo Env. Moml
Mln
litt
Nol
l Coi
n..
Oth
erA
or1.
Hea
lthPl
anni
ngN
at R
eala
bor
Sle1
8M
unld
nty
Oth
erAntiue & BOrbda
XX
'X
Bah
amu
XX
,B
o~øo
iX
XB
eliz
eX
XX
XC
Oom
bio
XN
oll.
Pop.
& E
nv, C
oncM
XX
'X
X (
Ore
on C
oncO
l)R
oolo
l Co.
eo le
Ra
XX
XC
ubo
XA
cony
0' S
cien
c.X
Fish
er1e
s, H
ydnt
ulic
Rei
.X
Doi
nic
X'
XX
XvinoOO Condl,
Doinan Ropubl1
XX
XX
Gre
ada
XX
'X
XX
'E
nv. H
ealth
Ois
tnct
sG
uale
mila
XX
XG
uyan
aA
dviio
ry E
nv. C
onci
lX
Hai
tiX
Hon
dun!
sX
XX
XJ8
mal
aiN
ol. R
.i. &
CO
Ol..
1 A
uth_
XX
Mex
icX
XX
XN
icra
gaX
XX
Piin
ama
X
XSI
. KIt
to &
Nov
lX
X'
XX
XSI
. luc
loX
XX
'T
nide
, Ind
. & T
Oui
s.1
XS
I. V
once
l & O
ro.
XX
XSU
Mom
oX
XT
rlnl
do &
TO
boO
OX
XX
UrJ
led
Sta
tei
Env
. Pro
l. A
oone
yX
XX
XX
XSomo reloVconiy
~nd
apon
donl
ogo
ney)
'au
~tie
iV
enei
uel
X
X
See
next
pag
e fo
r no
tes.

Tables 12: Notes
'Ver
y w
eak
Coa
stal
Dev
elop
men
t Aut
horit
y.2J
oinl
Com
mitt
ee o
n E
nviro
nmen
tal A
ffairs
(IN
DE
RE
NA
), M
inis
try
of H
ealth
; rec
ently
IND
ER
EN
A
was
con
vert
ed in
to a
Min
istr
y of
the
Env
ironm
ent.
i-he Division of Forest and Wildlife is recognized throughout
the
Eas
tern
Car
ibbe
an fo
r its
str
ong
lead
ersh
ip r
ole
in d
omes
tic e
nvir
onm
enta
l mat
ters
.'E
nviro
nmen
tal C
onse
rvat
ion
Cou
ncil
esta
blis
hed
1983
, but
in a
ctiv
e si
nce
its fi
rst a
nd o
nly
mee
ting
that year.
5Loc
al g
over
nmen
t bod
ies
wer
e di
ssol
ved
by th
e ce
ntra
l gov
ernm
ent i
n 19
69; s
ince
then
thre
hav
e
been
occ
asio
nal p
ledg
es to
res
tore
them
.&
Min
istr
y of
Nat
ural
Res
ourc
es a
nd E
nviro
nmen
t est
ablis
hed
in 1
984,
but
it la
cks
an a
dmin
istr
ativ
est
ruct
ure
and
does
not
func
tion.
7Cen
tral
Pla
nnin
g U
nit i
s th
e ke
y co
rdin
atin
g m
echa
nism
.
&P
arks
and
Bea
ches
Com
mis
sion
.9P
resi
dent
Clin
ton
has
spok
en o
f mak
ing
the
EP
A a
cab
inet
-leve
l dep
artm
ent,
but n
o fo
imal
act
ion
has
been
take
n.
SO
UR
CE
S: B
rañe
s, 1
991;
Isla
nds
Res
ourc
es F
ound
atio
n, 1
991
a,b,
c,d,
e,f (
Cou
ntry
Pro
files
of A
ntig
ua &
Bar
buda
, Dom
inic
a,G
rena
da, S
l. K
itts
& N
evis
, St.
Luc
ia, S
t. V
ince
nt &
the
Gre
nadi
nes)
; Wor
ldm
ark
Enc
ylco
pead
ia o
f/he
Nat
ions
: Am
eric
as, 1
984;
Uni
ted
Nat
ions
, 199
2.
-i tv
;t5
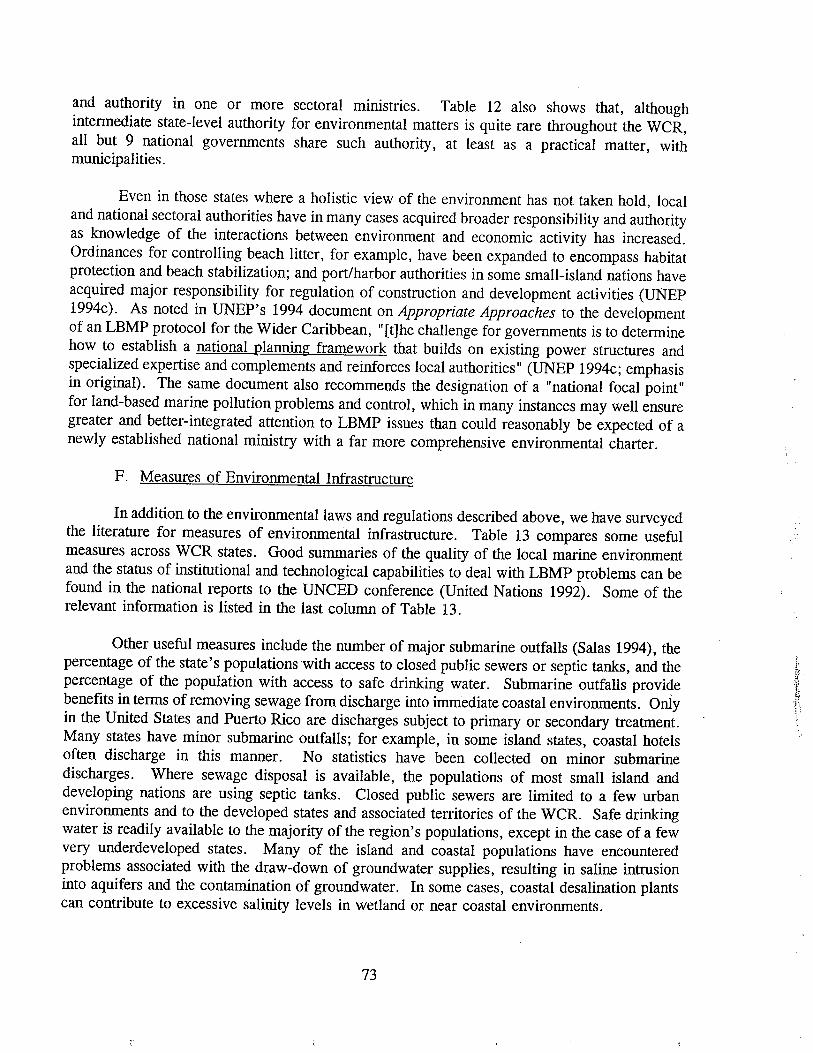
and authority in one or more sectoral mInistries. Table 12 also shows that, although
intermediate state-level authority for environmental matters is quite rare thoughout the WCR,all but 9 national governments share such authority, at least as a practical matter, withmunicipalities.
Even in those states where a holistic view of the environment has not taken hold, localand national sectoral authorities have in many cases acquired broader responsibility and authorityas knowledge of the interactions between environment and economic activity has increased.Ordinances for controlling beach litter, for example, have been expanded to encompass habitatprotection and beach stabilization; and port/harbor authorities in some small-island nations haveacquired major responsibility for regulation of construction and development activities (UNEP1994c). As noted in UNEP's 1994 document on Appropriate Approaches to the developmentof an LBMP protocol for the Wider Caribbean, "(t)he challenge for governents is to determinehow to establish a national plannng framework that builds on existing power structures andspecialized expertise and complements and reinforces local authorities" (UNEP 1994c; emphasisin original). The same document also recommends the designation of a "national focal point"for land-based marine pollution problems and control, which in many instances may well ensuregreater and better-integrated attention to LBMP issues than could reasonably be expected of anewly established national minstry with a far more comprehensive environmental charter.
F. Measures of Environmental Infrastructure
In addition to the environmental laws and regulations described above, we have surveyedthe literature for measures of environmental infrastructure. Table 13 compares some usefulmeasures across WCR states. Good summaries of the quality of the local marine environmentand the status of intitutional and technological capabilities to deal with LBMP problems can befound in the national reports to the UNCED conference (United Nations 1992). Some of therelevant information is listed in the last column of Table 13.
Other useful measures include the number of major submarine outfalls (Salas 1994), thepercentage of the state's populations with access to closed public sewers or septic tanks, and thepercentage of the population with access to safe drinking water. Submarine outfalls providebenefits in terms of removing sewage from discharge into immediate coastal environments. Onlyin the United States and Puerto Rico are discharges subject to primary or secondary treatment.Many states have minor submarine outfalls; for example, in some island states, coastal hotelsoften discharge in this manner. No statistics have been collected on minor submarine
discharges. Where sewage disposal is available, the populations of most small island anddeveloping nations are using septic tanks. Closed public sewers are limited to a few urbanenvironments and to the developed states and associated territories of the WCR. Safe drinkingwater is readily available to the majority of the region's populations, except in the case of a fewvery underdeveloped states. Many of the island and coastal populations have encounteredproblems associated with the draw-down of groundwater supplies, resulting in saline intrsioninto aquifers and the contamination of groundwater. In some cases, coastal desalination plantscan contribute to excessive salinity levels in wetland or near coastal environments.
".
.~¡,h'1',~ :
73

Table 13
Measures of Environmental
Infr
astr
uctu
re'
-i .t
Subm
arin
eSe
wag
eSa
feO
DF
Stat
eO
utfa
llsD
ispo
sal
Wat
erE
xpen
d.O
ther
(%)
Acc
ess
($U
S m
il)(%
)A
ngui
la
Ant
iQua
& B
arbu
da17
100
Sew
age
trea
tmen
t ser
ves
priv
ate
tour
ist f
acilt
ies
prim
arilv
: Cen
tral
Boa
rd o
f Hea
~h
mon
itors
sew
age
Aru
ba0.
87T
he B
aham
as63
100
Coastal and marlne environmental mon~Orln9 and environmentally sound waste disposal are prriie; Bahamas
Nat
iona
l Tru
st w
orks
to c
onse
rve
coas
tal a
n m
arln
e en
viro
nmen
ts.
Bar
bado
s1
6710
0C
oast
al C
onse
rvat
ion
Pro
ec U
nit c
ondu
cts
coas
tal m
onito
ring;
IAD
B fi
nanc
ing
for
sew
erag
e sy
stem
s In
Bri
dget
ow a
nd o
n w
est a
nd s
outh
coa
sts.
Bel
ize
3575
UN
IDO
spo
nsor
ing
Indu
stri
l Pol
lutio
n C
ontr
ol M
onito
rino
Pro
qram
me
for
Iiou
id w
aste
str
eam
s on
the
New
Riv
er.
Br~
ish
Vir
gin
Is.
1C
IDA
spo
nsor
s a
Coa
stal
Res
ourc
es In
vent
ory;
env
ironm
enta
l wat
er g
ualit
y is
mon
itore
d.C
aj'm
an I
slan
ds97
99C
olom
bia
7093
78.3
Paci
fc c
oast
ecy
stem
s ar
e pr
irity
.Costa Rica
6793
Agr
ohem
ical
mar
lne
pollu
tion
Is a
gro
ing
conc
em.
Cub
a61
98E
nviro
nmen
tal m
ana~
emen
t and
pro
tect
ion
of o
cean
s an
d ba
vs Is
of "
natio
nal i
mpo
rtan
ce."
Dom
inic
a12
771.
07Doinican Republic
5267
3.82
A U
n~ fo
r E
nviro
nmen
tal S
tudi
es h
as b
en e
stab
lishe
d.French Guiana
34G
rena
da23
85G
uade
loup
e25
Gua
tem
ala
2062
7.5
Pro
teci
on a
nd m
anag
emen
t of w
ater
shed
s an
d id
entif
catio
n of
pol
lutio
n so
urce
s ar
e pr
iorit
ies.
Guy
ana
1061
Uni
vers
it of
Guy
ana
Invo
led
In a
Wat
er R
esur
ce M
anag
emen
t pro
ect;
cont
rolln
g co
stal
pol
utan
ts,
espe
ially
fro
m s
UQ
ar P
rouc
tion
and
dist
ileri
es I
s a
prir
ltY..
Ha~
i2
39lOB Involved in san~atlon and drinking water financing; environmental
Infr
astr
uctu
re a
lmos
t non
exis
tent
.H
ondu
ras
1477
35.0
Mar
ine
ecsy
stem
stu
dy u
nder
way
.Ja
mai
ca10
0C
oast
al a
nd m
arin
e en
viro
nmen
tal m
anag
emen
t and
pol
lutio
n co
ntro
l are
prio
ritie
s; p
relim
inar
cos
t est
imat
es to
clea
n up
Kin
gsto
n H
arbu
r ar
e $1
60 m
illon
.M
artin
ique
142

Tab
le 1
3 (c
ontd
.)
.. Ui
Mex
Ico
261
7611
12.0
\A
ctio
n P
lan
on P
reve
ntio
n an
d C
ontr
ol o
f Mar
ine
Pol
lutio
n.
Mon
tser
rat
Net
herl
ands
Ant
iles
41.0
Teb
oln
Rep
Ort
sur
vevs
env
Iron
men
tal p
robl
ems
In h
arbr
s.
Nlc
araa
ua19
548.
9M
anar
ove
rest
orat
ion
pral
ects
.
Pana
ma
4483
Inte
rlnst
itutlo
n C
omm
Ittee
for
Wat
er S
anita
tion
and
the
Env
ironm
ent c
reat
ed In
199
0.
Puer
to R
ic14
96W
aW~
pollu
tlon
cont
rol e
mpl
oyl~
US
pro
cedu
res:
Env
ironm
enta
l Oua
llty
Boa
rd Is
sues
dis
char
ge p
erm
its; w
ater
Quail studIes conducted to eva uate Performance and ensure comrillance.
SI.
Kits
& N
evIs
3210
0P
roar
ams
have
ben
Impl
emen
ted
to c
ontr
ol w
ater
Qua
litv.
SI.
Luci
a36
67A
s In
oth
er O
EC
S s
tate
s. lo
-cos
t tec
hnol
oies
for
sew
arie
trea
tmen
t exI
st.
St.
VIn
cent
& T
he22
752.
66A
s In
oth
er O
EC
S s
tate
s, lo
w-c
ost t
echn
oloi
es fo
r se
wag
e tr
eatm
ent e
xlsl
.G
rena
dine
s
Suri
nam
eG
roun
dwat
er s
alln
atio
n re
conl
zed
as a
pro
blem
but
Is
not a
cle
ar e
nvir
omen
tal p
rltv
.
Trin
Idad
& T
obag
o41
97al
late
ral O
il S
pil C
ontin
genc
y P
lan
wlth
Ven
ezue
la: t
rans
boun
dary
aIr
pol
lutio
n fr
om la
nd-b
ased
sou
rces
see
n as
a co
ncer
n bu
t Is
not a
cer
a en
viro
nmen
tal p
rlorit
v.
Tur
k &
Cal
co I
s.0.
27E
nviro
nmen
tal r
evIe
w c
ondu
cted
In 1
966;
legi
slat
ion
unde
r de
velo
pmen
t: da
mag
e to
mar
ine
ecys
tem
from
laro
e-sc
ale
deve
lopm
ent I
s re
coni
zed.
Uni
ted
Sta
tes
9910
0U
S E
PA
tech
nolo
y st
anda
rds.
dis
char
ge p
erm
it. p
ublic
ly o
wed
trea
tmen
t wor
k: s
ome
cosI
dera
tion
of p
olnt
-no
nQ(in
t sou
rce
trad
ina:
mos
t ext
ensi
ve e
nviro
nmen
tal m
onlto
rlnc
In r
oolo
n.
U.S
. Vlra
ln Is
land
s94
US
mod
el' I
nfra
stru
ctur
e un
know
.
Ven
ezue
la39
8089
Pror
am to
upg
rade
wat
ersh
edSi
~itla
ted
wlh
hel
p of
Int
erna
tiona
l ban
ks a
nd E
uroa
n st
ates
: num
erau
s ou
tfal
ls,
but s
ome
are
old,
sU
aaes
tlna
a h
h de
aree
of
dete
rira
tion.
'Sege dispoalis a measure of the percntage of
the relevant state's polatio wi acc to cloed public seweni or septic tanks. Safe water Is a measure of the petae of the relevant state's
polati wi acc to safe drinking water. Ofal development financing Is estimated fro OECD data for 1990 on private secor and offcIal develoent assistance and on ofial develoent
finan
cing
by
purp
e.
Sourc: BrfannlcB Book ofthe YeBr(1993): United Nations (1992); OECD (1993).

A common plea in the national UNCED report is for foreign aid and other internationalfinancial assistance to help fortify the mostly inadequate capabilties for dealing with LBMPproblems in the region.
G. Scientific Capabiltiesii
Most countries and terrtories in the WCR support some level of marine scientificresearch, the most commonly tageted research areas being fisheries, coastal management, and,more recently, the development and maintenance of marine parks and reserves. Much of thisresearch is carried out at regional unversities or at small marine laboratories that are owned bya regional or a Nort American university, supported by competitively awarded governentfunding. Typically such scientific research programs are seriously constrained by small budgetsand associated limitations in staff siz and facilties. Formal cooperation among a number ofthe region's research intitutions is well established, however, partcularly cooperation towardthe goal of promoting general awareness in the region of mae problems and programs toaddress them. One promient example is the Association of Mare Laboratories of theCarbbean, which was founded in 1957 (as the Association of Island Mare Laboratories of theCarbbean) and in 1994 included 23 member intitutions located in 17 WCR states (see TableA.6, Appendix A).
An importnt component of the basic ecological research conducted in the Caribbea isresearch by US university-affiliated scientists workig in regional marine laboratories withsupport from such US governent agencies as the National Science Foundation, the NationalPark Service, and the Nationa Oceanc and Atmospheric Admistrtion. As orthe late 1980s,
the greater Caribbean accounted for one-fift of all US mare scientific projects requiring vesselclearances from foreign governents (Negroponte 1987). Included in Table A.6 is a list ofmember intitutions of the Southern Association of Mare Laboratories, a US organitionrepresenting governent and academic laboratories from the Virgina coast to the tropicalsoutheatern Nort Atlantic.
In addition to these US reseach activities, a substatial amount of the marine scientificreseach conducted in the region is cared out by scientists from Canda, the United Kigdom,the Netherlands, and other Euopea countres with fuding provided by their governents.
There are also a good many regionally sponsored cooperative projects or programs thatfocus on mare resources, pollution, and environmenta mangement. In the mid-1980s suchprojects numbered about 60 and ranged frm small, bilateral effort to large, long-termmultiateral or regionwide effort (Negroponte 1987) involving UN agencies, environmental non-
governenta organtions (NGOs, discussed separately in the next section), nationalgovernent agencies, and regional scientific organtions. In the last category is CARCOMP(for Carbbean Coastal Mare Productivity), a research and monitorig network of 24 Carbbeamare progra sites (laboratories, parks, and reserves) at which scientists monitor basic
iiUnless otherwise noted, the information in this section is drawn from Gladfelter and Ogden (1994), which was
prepared for use in this study.
76

oceanographic and meteorological variables as well as species type, abundance, and productivityin selected coral reef, seagrass, and mangrove systems. CARICOMP (with member institutionsalso listed in Table A.6) was established in the mid-1980s with funding assistance from
UNESCO and the U.S. National Science Foundation.
Lest the extent of mare scientific activity in the region be overstated, it is importnt tounderscore that national capabilties are in some cases extremely limited, as are the mechansmsand infrastrcture to support regional collaboration. According to a 1983 UNESCO survey, forexample, fewer than one-half of the marine scientists identified as working in the Caribbeanisland nations were at work in one of the much more numerous small island states; and only 63of the 583 scientists workig in Latin America were workig in the small Central Americannations.
H. The Role of NGOs in the WCR13
The extent to which NGOs (and citizens groups) play an importt role in bringingpopular and offcial attention to environmental affairs varies considerably across the WCR states,but overall it is markedly on the rise.
In general, NGOs tend to number in the hundreds and to be very well-established, varied,and inuential in the larger and more industralized countres, such as Colombia, Mexico, theUnited States, and Venezuela. All of these countries afford some legal basis for theestablishment of public bodies empowered to represent the public interest, under which NGOsand/or citizn action groups are assured representation.
Thoughout most of the WCR, the infuence of NGOs is somewhat more limited (thoughnot inbstatial), in par because of the more limited basis for public action, essentially based
on the rights of citizen complaint. Although the numbers and the range of interests of NGOsin many WCR countres are considerably more modest, there is nonetheless an unistaabletrend toward their proliferation. In the Bahamas there are fewer than two dozen NGOs, but theyhave a very long-stading and venerable status dating back to the establishment in 1959, by anact of parliament, of the Bahas National Trust. The Nationa History Society of Jamaica iseven older, but most of Jamica's 15 or so other active NGOs are less th 20 years old, as isgenerally tre of the growin number of NGOs thoughout Central and South America. Eventhe poorest and least developed of the WCR countres had at leat one major environmentalNGO by the early 1990s-the Foundation for a Beautiful Surie, for example, and in Haiti
the Friends of Nature Federation and the Association to Combat Erosion and for Full LandRehabiltation.
An importt element in fosterig the effort of NGOs is the emergence of regional
NGOs, notably the Regional Network of Nongovernental Environmental Organtions for
Sustained Development in Central America (REDES-CA), established in 1987, and theCaribbean Conservation Association (CCA), established in 1967. The first of these includes
13Unless otherwise noted, the informtion in this section is drawn from Brañes (1991).
77

NGOs from Belize, Costa Rica, Guatemala, Honduras, Nicaragua, and Panama; the latterincludes in its membership 17 governents, 65 NGOs, and 120 individuals from among theisland and coastal nations of the Gulf of Mexico and the Caribbean Sea, including the Bahamasand Guyan. Headquartered in Barbados, the CCA serves as a clearinghouse for informationon the environment and provides techncal assistance, environmental education, assistance forparks and protected areas, and regional and national plang services for sustainabledevelopment and resource management (Island Resources Foundation 1989).
i. Other Regional Organizations
Although the scope of the CCA's membership, interests, and areas of expertise may beunusually broad, the CCA is nonetheless but one of some 100 donor agencies and techncalassistace organitions supporting progras for sustainble resource development and
environmental management in the Eatern Carbbean alone (Island Resources Foundation 1989).Throughout the entire WCR there are hundreds of such agencies and organitions, including
multilateral investment bans, specializd UN agencies, chatable foundations, and NGOs,whose concern rage from disaster preparedess and relief to nutrtion and education.
Many of the UN agencies and other intergovernenta organtions focus in one way
or another on economic and social development (Table A.7, Appendix A), including public andenvironmenta health concern. Two of the most promient agencies active in the region in thslatter area are the Pan-American Health Organtion (pAHO), par of the World HealthOrgantion (WO) network; and the Caribbea Environmenta Health Institute (CEHI), an armof CARCOM (see Figure 13).
The Caribbean Environment Programe (CEP), whose legal fraework is provided forin the Cargena Convention, serves as an umbrella organtion for collaboration among themany social, economic, scientific, and techncal organtions active in the region. The CEPis adminstered by UNEP, though its Regional Coordinating Unit (RCD) in Kigston, Jamaica.Together with the relevant national and regional environmental intitutions (see Table 14), theRCU provides the intitutional capabilties necssar for the implementation of a land-based
mare pollution protocol. In ths . context, two of the CEP's most importt intitutionalnetworks are CEPPOL and a program on Information Systems for the Management of Marineand Coastal Resources (CEPNET), whose role is to ensure that scientific inormation obtainedthough CEPPOL is appropriately collated and dissemite though usefu databases.
Unlike many of the other organitions whose membership or concern are limted toeither the Caribbean island states or the contiental countres of Lati America, the CEPexpressly extends its reach to all the WCR coasta and island states. Moreover, it taes a broad,comprehensive view of environmental affairs and of the special lin between economic andenvironmental concern withn the region. Nonetheless, as mentioned in the precing section,the CEP has had only modest success in this coordinting role. As is tre of so many other
aspects of the Wider Caribbean Region and its environmental agenda, the rationae for acomprehensive approach may be gainng general acceptace, but many of the mechanisms thatallow coherent action are simply not in place.
78

Miiu
t r"~
nmm
nP",nmm1ni Ari
PriJ
ecPO
lle)
Form
ulai
loIi
lipltl
Clia
llon
Re¡
lR
ealo
l EI
1 CAlcowoncs -C CA1UCOWOECS
:.t\e
ß~"1
Enm
el/
I:ic loc pn1aramma
CO
BJM
OB
CO
IlMO
BD
cioi
nlir
lCllo
ind
O~NOP O~NOP
Ilr~ Polle
Poro
nulll
loU
NnI
'IEC
u.C
IMO
UN
EP
IlCI'n
i_k
l11l
'l1
111o
1 E
I. J: ttiilo Qol -C l1111o cimcl
!:le
ioc
prsr
mm
a. COIlDB COIlDB
EiI
/IU
lcal
l lo
O~NDP O~DP
Ð-l
b'ul
lil~
Nai
lo E
nIl
Nlil
o G
olWDl BI BOD COB
Mi '
PlIn
s
. Sho
ld h
e cc
plcd
In
199
D"""" "'... .1
"C
-( "'''''C..Nim.
2A.ln
rom
ilo S
)"et
nC
opui
er.b
aoc
Inlo
, S".
iem
UN
EP
UN
EPI
EC
lCC
B
Prn¡rmme i
Re¡ll Com. S)'em
CO
BU
NE
P/R
CU
Dci
onl
Geiriphlcllnlo. S)'lem
OA
SO
Ecs
AS.
.ON
NO
P
Prci 0( MaMaemel
auili
iy C
olro
l Pro
iram
me
OO
CO
/IE
Ee
UN
EP/
CO
B
Too
ind
.Bul
ldin
i B\o
.i'l Educ:rl
f CAICO""""
-( CXCCIU,O,"M"
UNES an
(UW
lyN
ili e
oRM
iB . Enrntll Educ:lkl
Inlorl Educ:llo
' UNICA
C:AIEClli NOO
.. Tnlnli
CC
CA
AR
IJR
F/B
HIJ
MA
Tnl
nlni
UW
lOB
CC
00..
12C.1!1lInshUiJ l- Haiilo 01 Lepsllo J- CAICOWOI!
_('O
JC1RMl! (U)
. S1rc¡llni Tedlcl Oipadiy Bulllni UWI . Ba
Prlie Couliani
..Eionmcnial La CU. Jamalc
\0U
NO
P
Proirimme 3
Ger
i SoU
ilo 1
0 Sp
er..
l!on
nint
llls.
eiJo
rArPiiclio ii Niiloill.l
Bul
ldin
i in
ElA
Tea
m J
-Ca Siudy eelont
Pnllo or Trilnlni Semina"
;S Q
l Zo
., MID¡e1
Niil
ol C
ìrnn
t -(
CC
CCB COB
Mul
lllal
er o
r P
rlie
Orp
iu~
. UW
Ibi
lalU
lI do
Co
Zo
DeI
' -C
' Niil
ol (
lP
Ia N
ltlol
OoI
Bc
Prll
. Qilt
l"ib
llll P
roU
lIo P
l J-
Ô~
NE
P D
Ii B
a M
ar L
abol
oiT
cdiJ
Rc:
Sa
MIi,
UW
I Jam
CE
ES
aoB
lND
P.
ScicMll,eme' l NlilolOomenl l l1liJOc
So Wase Mlnaielll WBBlIRI CEIJAHO/lDB/ECSB
Tod
Was
e M
anie
ii C
\CO
MM
unlc
palln
rrun
ictu
rc M
ai P
..HO
lCl
M~=
ni S
yste
m U
WI
. Trl
nlc
Prlie
Col
tl
3A El Proarmmc
Dci
onl
3C W
ase
Min
a¡cl
Figure 13.
Major Regional Areas i Actions, and Actors in Environmental
Management and Sustainable Development
Sour
ce: B
rew
s te
r 1
994
.
(continued on next page)
"."-
.::.::
~::t"
.~.,;
¡:,~
I;:;.
,o--
-.
II Bld
Cl
BO
D
CA
AR
lC
Al
CA
lCO
IdC
AC
iC
OB
CO
I!C
ElU
'C
lNB
. æi
ci..
C1æ
cu 001 CI
er...
CX
C
EC EC
LC
I! EtA ElC
O1'
.00
l.UV
TIO
NS
- 8eln Il 1a~lu.. (I) or ).c(W
uiiiy
- ao
"" W
a o-
tr-
Brli
Jb 0
e D
Ma
- C
a N
aii i
- la
~tu.
.- Ca A¡ta Ra &l Oopc
la~t.\D , . .
- Ca O:ul &l o,..io
Ca
IDIl
Il la
~i...
- C
a Q
)il A
uil.
- Ca l)i _
- c:
Dl I
! ilp
o.. .
._
Ca
~ta
He.
. 1A
~,..
.- Ca ~i ProJl WO..ii.
S)ta
N_
.._
Cel
tlo R
a W
ai-i
&l _
_Il
Siu4 (l -
- C
a ia
ii O
ot""
_ ~
~..i
J ~
pmi l
Ailt
uil..
00
- C
a La
lala
ll-
Ot M
cp: l
a~i..
._ CACOM Rcpo J!I Proni1M
_ Oi Tl.lil
_ O
t ~M
ltl.ll
N, C
ou.
- Eope Qiuliy
_ I!ii Q) lor Lall .l ud th Ca
be - l!
..l¡.
.,_ 1!.. talø po l. t
_ 1!..ta 1...... Olt1i Orop
- Fo
iad
Ant
,, O
rpiil
a

M.~
Prtl 3 (CoI'd)
Gcr\ $dutilO
Sp ~
~i. rot AtiJ M
lIii l
.
~4 Soul
"" 1
0 D
e to
bTrarW i-
00 o
J'n-mm S
Rem
cVlm
ctM
N1
10 D
e ""
lL o;
lroime 6
Fln
.nc
Rao
re in
dM
edls
I"jc Pul fonul.tI laipkai."Lltl
Ë' WMen Mltiemenl J- Niiio UOmmenl -c Niiio.i UOmmel
Wilc Ouall I'ecio FAO/lFADICEHV CEHIJMMWI.Jlmlie
So CoMiio CAOl
- A¡ku"" Mltlemnlio . CAOIJFAO/lICA
po C
Xnt
r '
Io Do Slac =t NlIio Gommeni -C Nltiol Gommtl
Mai- IMACIOA BeiiMNAAI
Ñr Rcir= MIt¡enl FAO CA
0 l/A
PVilubiolNliU"" R.r= J IIAO -(- Nltiol Cirnmcn i
La
Tec
ure
Pro
OA
S Pr
e C
ohan
iNIiIo ~Io Pi UNO P F AO/IFAD
Urt ~ki Ould COERMOB NcoOERA
OIorl"po IUCN Oo
La Capo Studie Cl A
hi1
an N
iiu""
Nu
I'mTou ai ib I! CO B
51""
.RepoAa Pr CAlCOMIRI
Shp
pl s
pina
Alfm
a U
NE
P/R
CU
1W~ IOCMO
SlacIiM:ntc"riH¡bI FAO,oECSMO/
Al . F ohri OC ()
I'dip
: Slo
c C
orltl
",M
a H
-ilni
Slie
/JEnloonl S)"=
lipt Conc
I' ~n
iM
onon
~pol
nll'~
Impi
uiJ
0( lh
lltl ca BIoM:
Impl
wl 0
( Ib
~ ca dlmae chia
rrii N-
3D W
.itt M
ina¡
enl
3H R
.lt I!
ipio
ltdoa
Cc
31' L
a U
.. M
ltie
.c P
'um
/'ut
lC
o.8
Mar
Fi S
lac
Mai
e
~ W... lin ai
Ti a
tI
l-i W
-i. C
odoa
0(
eidM
. Cle
chI
"
Reiloapp prun:
an pr rOC fund-ni
optlo 10 CO ih In!.
to O
(..b
l de
pr Nlil
ollp
p pr
utu
ind pr loc fund-(bli
opilo to CO ih In!.
CO
ol_
albl
~
Fig
ure
13 (
cont
ld.)
r- S
I~m
n C
r M
Mlie
Rem
M...
.S
p: R
_ (e
i- G
1oWani.1 lurr, e.l.
qUl~
drit
i, ~
t.L.
pot
J ...
.)
~ Re¡l
Eiul FocUiy
b~E
lc.iy 2 I
Nitl
eon
i'ipr
.C
RE
f¡O
Efl
Cpo
iy 2
1B
lhic
n do
pr
CA
F'R
UM
Rep
ol! Fund
hc t'i Fund
lo k
opo
tiWIDtl uUli l.
fu .. te caplW
CA
IC
O M
/EC
iU
IIE
P/R
CU
WlO
Bll!
llC
A
ICO
MN
WlB
W!l
ICO
M .
lnci
vual
, btb
ten.
l or
Mul
tilie
r,t d
o
CU
M'A
110I
CE
III
IMO
(l.~
lV"r
ood"
"'¡n
i Orp
nbt "
'
COB ",li CA
CO
MM
u It
l i e
r bl
i cr
do F
ondt
io .
NG
O
N.ilo Oommcnl
CO
B a
n ih
e R
e¡l
ind
Iolc
mat
iol d
oco
mun
lt)
IMM
lWl
VII
EP/
RC
UC
EH
I/U
Bd.
inE
CS
M N
F A
OtO
CA
ICO
M/O
CM
O
UII
El/R
C:U
/iMA
CACO M¡ ECSl IIi
CO
BN
NE
PNII
OP/
WB
WII
CO
MIO
llMO
IlIIÓ
O~
Re,
iuIC
OE
RA
.(C
AC
OM
UIIO
P)
Èxerit Aie:nc ar Ornttlior
COB. multilater bltcn ll
InMdu.l do. Prlie
Oriaoiio. NGO
COB. muliilalcn, bltcn Ll
InMdul1 dol'tc
Ori
.nlii
o. N
GO
Oel
IDB
!FA
D
IlC
A
lM !MO
IOC
IR NO
IN
ocO
AS
OI!
OE
esPA
HO
PVO
RC
U
TA
TFA
P
UN
ICA
UN
CE
UN
PU
N UN
uw VSA
WB
WF
AU
TIO
IIS (
-('4
)-
Olo
ba £
ia.W
l'ad
l)- lAiu.Am Depinl Ba
- IA
lWtli
iI'lo
r A
iiii D
ep..t
- IA
tc.A
m li
iJiu
tc lo
Cop
etl.
o.A
nUI
. . .
. liiJ
i,io
0( M
u A
I (I
lJ T
oh",
)- IAlWiJ Matl Orpntl.
- IA
tc.io
lI O
c 0:
.- Wu iw I'tl
- IA
lWt\
Uit
lX ib
eot
l. ol
1I.
lur
- No.~lI OrtlOl
- O
tpni
l 0(
Am
Su.
.- o.pntl lo BomJ Copetl.lJ
Dep
inl .
- O
.p.it
ll ol
Eül
C C
u. S
Ule
- PU
o.A
m H
etl O
rpnt
l.Prltc VOL..~ Orpntl.
- itpoii ~ili Volt (U)
- T
cd.lw
i- Trpla Poll Ae. PLU
- A
utl o
C C
a U
iitk
- UOLi- NliJ Q)ii o. £i~' lJ Delop-
..1, .
- V
OLi
- N
atlO
l PcP
..1 P
roin
- U
OLi
- N
itIO
lI!a.
t ~_
VO
Li-
NltI
.. E
4uat
l Sdi
i lJ
Cui
iiO
tpnt
la .
- Viil).o( ii w... li
_ V
oli-
S...
. Allo
IA
lWtli
i Dep
int
- Wor Ba .
W0n l' Pr

Table 14
Regional Environmental Insitutions
Rei10na IndludoDl Eivlroamcii Man
Uii N&toll Eiviiit Prgr,. Coinaton of UN. Regiii Sea Prgr foe
Regiona Coing Uni foe lhe Cabbe (UNEIRCU) the Cabe; nipo fex Cabbea EnviiiiPrgramme (CE)
i
Uii N&toll Develpment Prgr (UNDP) . Coinaton of GE NGO Sin Grants Actvity
Univcøit of che Wut Indi:. Depaent 0( Bikigy, Engineeg, Gelogy, and . Coures in envinmnt-rela studies
Zology . Reseach in mae resoe& COllalon and- Mare Ru and Envirnmnta Man~eint ma~ement
Prgr (MAR . Analysis of envirnmnta laws and regulons
- Cabbe Law Iiti (o.l). Traiing, reeach and inocon systems
- Cen~ foe Envinmnt and Development (UWlCED)development in envirnmnt and development
Caribbe Enviriit& He Inti (CEHI. Prvision of 1c and advior services in
envirnmnta maagemnt (e-8., wa.r supply, Liuiand soli waslC ma~ement, pecides contr!);collecton and dimia1on of envirnmenta da
Ocganizon of Earn Cabe Stas (OECS). Coinaton of na re maagement
Nat Resoce ma~eme Uni (NU)progra foe che OEC
Insttu of Mae Afai . Reseach in mae IeCC maagement and
polluton contrl
Tropic Fo Acn Pr¡n (IAP) . Tecni asistace foe iion¥ forstr resouCC.prolCctd iieas, and wilie ma~ement prgr
Cabe Coiiaton ~II (CC) . Advocy, prje ¡xpia1on and imlementaon,intuon buiing, pulic awarne., and educOii
Cabe N~ R.ce.Wt (CANARI . R. tring, and exlCnsli in Ihe fidd ofcoity pacipon and coma~ement of n&reso
Caòbe Agcuwral R. and Develpment Iititi. Covet enviriu im in Ihe course of it
(Cl) re on agncultual acviti
CACOM F"~ R. Aiint and Manemt. Sniies che mae fienes re of U1e region i
Prgr (æR \i
OEC Fisen Unit. Sniies OEC su-rgioii re
\3Ua Re Intu of McG Univeaity. Covea Mae and Co re - monilOnng and
assement
Cabbe Cen~ foe Admútrii Development (CARlCAD). Covet insttuona analysis and development
SOURCE:- WORLD BA 1,99
81

Although the impediments to implementation of the CEP are numerous and variedthoughout the region, four broad problems have been identified (see Section III and Brewster1994), including lack of adequate financial support. This point is borne out to some extent in
Figure 14, panel a, which displays the levels of contributions and deficits (on pledged amounts)for CEP member states during 1982 though 1992 (in current U.S. dollars). Eight of the 34member states are in arrears by amounts greater than their cumulative contributions, and itwould appear that a disproportionate share of the financial burden has been shouldered by Francein particular, and to a lesser extent by Mexico, the UlÙted States, Sweden, and Colombia. Itis useful, however, to examine different representations of the CEP contributions.
14 Figure 14,
panel b, displays each state's CEP contribution (deficit) per coastal inabitant. On this basis,
the British Virgin Islands, France, and the Turks & Caicos Islands make the leadingcontrbutions, and many of the British dependent territories are among some of the leadingcontrbutors. In Figure 14, panel c, each state's contribution (deficit) to CEP is shown as apercentage of its "capacity," or an estimate of its coastal GDP (as explained in Section V). Inths representation, the self-governg unts of the Dutch realm appear to be among the leading
contributors, although Nicaagua and France are the lead contributors. France shows up wellunder any comparison, and, as we wil hypothesiz in Section V, it may be one of the key statesin faciltating WCR trading relationships.
J. Summary
In ths section we have reviewed certin economic, demographic, intitutional, andenvironmental characteristics of the WCR states with the subregional framework establishedby the CEPPOL program. Our review indicates that only Subregions II and IV have a highdegree of homogeneity with respect to economic priorities, and that these priorities, on balance,constitute an incentive for Subregion IV to control LBMP and a disincentive for Subregion IIto do so. The other four subregions are all more economically heterogeneous. Although allthee Subregion I economies are highly diversified, they represent a tremendous range of livingstadards, intitutional capacities, and pollutat load contributions. Subregion V is apparently
the most polaried subregion, with. the notable predominance of ming and manufacturig inthe economies of Venezuela and Tridad & Tobago posing a substantial potential theat to thetourism upon which Arba and the Netherlands Antiles are heavily dependent.
In Section V, we draw upon ths review as the basis for identifying alternativesubgroupings of WCR states to faciltate control of LBMP.
14 In Figue 15, panels b and c, statistics for Guatemaa and Sweden have been left out because of the very smal
number of individuals in the coasta region (or none in the cae of Sweden).
82

00 w
Ven
ezue
laUnied Sttes
TU
/s &
. CeO
IT
ridad
&. T
obgo
SWed
enSi
.am
St V
lMen
t &. G
rena
iSl lila
SI Kl &. Nevi
Pan
Nic
arag
uaN
eth
Anb
lles
Mon
erra
tM
eidc
oJa
m81
caH onlI
Hai
Guy
anG
uate
ma
Gre
nada
Fran
eD
omin
ican
Rep
Dom
caC
uaC
osta
RIa
Col
oma
Cay
man
IsB
rish
Vig
in I
iB
eUza
Bar
ados
Bah
llA
Na.
Ant
igua
&. B
arA
n-Ö
.6o
Ven
ezue
laU
nned
Sla
tes
TU/s &. C81cos
Trin
idad
&. T
obag
oSw
eden
SlX
ame
St V
ince
nt &
. Gre
nadi
nes
Sl lucIa
SI Kis &. Nevis
Pana
ma
Nic
arag
uaNeth Antines
Mon
tser
rat
M eidco
Jam
81ca
Hon
durl
lH
aiG
uyan
aG
uate
mal
aG
rena
daFr
ane
Dom
inic
an R
epD
omin
ica
Cub
aCosta Rica
Col
ombi
aC
aym
an Is
Brish Virgln Is
Bel
ize
Bar
ados
Bah
amll
Alb
aA
ntig
ua &
. Bar
da.
Ang
ua-Ö
.t-0
.05
(a)
0.5
(Mm
iOns
)
(c)
o0.
05
1.5
0.1
2
Ven
ezue
laUnied Sttes
Tix &. Ca/OI
Tridad &. Tobago
SWec
lnSi
.S
t Vin
cent
&. G
rena
dis
Sllil
a.SI Kl &. Nevi
Pana
ma
Nic
arag
uaN
eth
Ann
esM
oner
rat
Mei
dco
J am
81ca
Hon
uras
Hai
Gua
naG
uate
m8a
Gre
naa
Fran
eD
omin
ican
Rep
Dom
nica
Cub
aCost Rica
Col
ombI
aC
aym
an Is
Brish Virgln Is
BeU
zeB
arad
osB
ah Ara
.A
ntig
ua &
. Bar
aA
ngui
lla-3
.2
(b)
.1o
:13
45
6
Fig
ure
14. C
EP
con
trib
utio
ns (
defic
its),
198
2-92
($U
S cu
rren
t): (
a) b
y co
untr
; (b)
per
coa
sta
inha
bita
t; (c
) as
a p
erce
ntag
e of
coa
sta
GD
P (s
eete
xt).
0.15

V. Analysis of the Incentives and Prospects for Collective Action
A. Analytic Approaches
In this section, we explore thee avenues to identifying promising opportnities formutually beneficial collaborations and "gains from trade" in pollution control. First, economiccommonalities thoughout the region are identified, with the states grouped and ranked accordingto their level of participation in relevant economic sectors. This information is useful, forexample, in identifying states engaged in a paricular polluting activity on a relatively smallscale, who could benefit from pollution control approaches and technologies that have alreadybeen adopted by another state engaged in the same activity at a much larger scale. Next weconsider the relative identities of WCR states as polluters and pollutees withn subregionalgroupings. Following the approach developed by Broadus et al. (1993), we estimate the extentto which each state is a source of LBMP, the extent to which it has a stae in controllng theproblem, and its relative economic capacity to underte corrective action. Finally, we developa rating system that attempts to tae into account not only the size but also the direction of astate's economic incentive with respect to controllng LBMP, and not only its economic capacitybut also its intitutional capacity to underte corrective action.
B. Economic Commonalities
As a prologue to an analysis of the incentives and prospects for collective action onLBMP problems in the Caribbean, we have organd the states of the region into "economicgroups." These groups are rankgs of states in terms of siz or value of production, or othermeasures, for specific industries, including hydrocarbon production and refinig, farming,marine fishing, and tourism. The states are also raned in terms of foreign aid receipts andindebtedness.
The purpose of ths subsection is to demonstrte simarities and differences among thestates of the region with regard to major industres tht are known either to affect water qualityadversely (hydrocarbon production and refining, industral chemical production, farming, coastaldevelopment) or to be affected by inerior water quaity (coasta development, tourism,
fisheries). We identify those states in the region that are incumbents in each broadly definedindustral sector. Furer, we identify the major, intermediate, and minor producers in each
industr. We arange states into subgroups as an aid in identifing those states with roughly the
84

same scale of industrial activity in the relevant industr. i
Some observers have hypothesized that, in any particular industr, subgroups of stateswith the same scale of industrial activity may encounter the same kinds of LBMP problems. Ifthis hypothesis is valid, then it is possible that one state's solutions to these problems may betransferable to others at low cost. Alternatively, subgroups might agree to collaborate onresearch or technological development to identify or improve LBMP control mechanisms.
A separate hypothesis is that states exhibiting larger scales of activity in any of theseindustres may have already encountered LBMP problems during their industries' growth andmaturation. In this case, states at an earlier stage of industrial development or with a smallerscale of activity might look to states with a more mature industr or a larger scale for solutionsto LBMP problems.
Of course, there are many assumptions behid these hypotheses. For example, in orderfor transfers to occur, we must assume that solutions to LBMP problems exist and that thosestates that have identified solutions are wiling to convey them to other states.
The economic groups described in ths subsection are, for the most part, self-explanatory;we describe the groups only briefly here. We expect that the identification of economic groupswil be useful as the Contracting Parties to a prospective LBMP protocol begin to considerpossibilties for trading relationships in pollution control. We discuss these possibilities at theend of this subsection.
Table 15, panels a and b, rank the leading oil and natural gas producers in the Caribbeanand the leading oil refiners, respectively. We note that some of the leading hydrocarbonproducing states have attempted to control marine pollution problems, some more successfullyth others. A group of Latin American national oil companies recently has produced a series
of operational practice guidelines for environmental protection (AREL 1994). These guidelinesare likely to be useful for all of the WCR oil producers and refiners.
Table 15, panel c, rank, in terms of gross sales revenues, the leading producers of
industral chemicals in the Caribbean.
Table 16, panels a, b, and c, ran states according to diferent measures of farming
activity. In panel a, the states are ranked in terms of the percentage of land area devote toagriculture. Panels b and c rank the states in sugarcae and bana production. Depending
i We note that this kind of comparison is very general, ignoring ecnomicaly relevant, but diffcult to obtai,
informion about market structure and firm behavior and penormance in these industries. Although industralorgantion data would be helpful to this kind of analysis, we expect that its absence wil not affect the qualitativepoints we make here.
85

Table 15
Led
ing
Oil
and
Nat
ural
Gas
Pro
duce
rs, O
il R
efin
ers,
and
Pro
duce
rs o
f In
dust
rial
Che
mic
als
a. Ledin~ Oil and Natural Gas Producers in the Caribben
(milion barls of oil or milion cubic meters of gas in 1992)
Uni
te S
tate
s26
1753
7542
Mex
ico
100
2549
9V
enez
uela
865
2287
7
Col
ombi
a16
040
78 .
Tri
nida
d &
Tob
ago
5124
000 0\ Cuba
731
Gua
tem
ala
28
Suri
nam
e2
Baa
dos
122
b. Ledine Oil Refiners in the Caribbean
(thousad barels per day in 1993)
Uni
ted
Stat
es15
210
Mex
ico
1524
Ven
ezue
la11
67
U.S. Virgin Islands
545
Net
herla
nds
Ant
illes
470
Cub
a28
0C
olom
bia
264
Tri
nida
d &
Tob
ago
246
Pue
rto
Ric
o12
7Pa
nam
a10
0
Dom
inic
an R
epub
lic48
Jam
aica
32M
arin
ique
16N
icar
agua
16G
uate
mal
a16
Costa Rica
15H
ondu
ras
14B
arba
dos
3
c. L
edin
e Pr
oduc
ers
of I
ndus
tria
l Che
mic
as in
the
Car
bbe
(milions of U.S. dollars in 1993)
Uni
te S
tate
3013
60
Mex
ico
1741
4
Col
ombi
a28
09V
enez
uela
190
Gua
tem
ala
432
Nic
agua
266
Jam
aica
235
Costa Rica
209
Cub
a18
7P
uert
o R
ico
180
Dom
inic
an R
epub
lic14
3
Bah
amas
58Pa
nam
a42
Tri
nida
d &
Tob
ago
36
Hon
dura
18B
eliz
e5

Table 16
Led
ing
Agr
icul
tura
l, Su
garc
ae, a
nd B
aana
Pro
duce
rs
a. Ledin2 A,riculture Producers in the Caribben
b. L
edin
e Su
earc
ae P
rouc
ers
in th
e C
arbb
enc.
Led
in2
Ban
ana
Prod
ucer
s in
the
Car
ibbe
(prct or tota land area in agriculture)
(tho
usad
s or
met
rc to
ns in
199
4)(t
hous
ads
of m
etric
tons
in 1
994)
Mar
niqu
e87
Cub
a44
00C
olom
bia
1950
Gua
delo
upe
84M
exic
o41
652
Mex
ico
1650
Cub
a78
Uni
te S
tate
s29
335
..Costa Rica
1633
Mex
ico
73C
olom
bia
290
Costa Rica
60V
enez
uela
1215
Gua
tem
ala
9788
Pana
ma
1110
Hat
i57
Hon
dura
1086
Jam
ca55
Ven
ezue
la67
00
Dom
inic
a R
epub
licSO
Gua
tem
ala
465
Nic
agua
48H
ondu
ra30
0B
aado
s46
Costa Rica
2840
Cub
a29
5
St. K
itt45
Jam
aica
2661
Mar
niqu
e25
5
00U
nite
Sta
te41
Nic
agua
2400
Hai
ti23
0-.
Hai
ti22
50G
uade
loup
e14
8
Pan
39N
icag
ua13
6
Puert Rico
39Pa
nam
a14
00
Gua
tem
aa38
Tri
nida
d &
Tob
ago
1210
Jam
aica
77
St.
Luci
a38
Bel
ize
1159
St. V
ince
nt &
Gre
nadi
nes
62
St.
Vin
cent
35Su
rina
me
50
Ven
ezue
la34
Baa
dos
533"
Bel
ize
41
Col
ombi
a27
Gua
delo
upe
516
Dom
inic
a40
Guy
ana
26St
. Kitt
s &
Nev
is20
0
Dom
inic
a26
Guy
ana
21
Trinida & Tobago
26M
arni
que
98G
rena
da10
Hon
dura
24Su
rina
me
45
U.S
. Vir
gin
Isla
nds
21
Bel
ize
10..
Our
ow
n es
timat
e.
Ant
igua
& B
abud
a9
Baa
mas
3

upon the irigation and erosion-control practices employed, farming can be a major nonpointsource of marine pollution from sediments, fertilizer nutrients, and pesticides.
Table 17, panel a, rank the states in terms of coastal '-development, as measured by
population density. Note that there may be considerable variation in the concentration ofpopulations within any particular state. This variation may be hidden in the data. Table 17,panels band c, rank the states in terms of marine fish landings and tourism receipts.
Table 18, panel a, ranks Caribbean states in terms of debt service ratio, which is ameasure of each state's abilty to repay loan from foreign sources. The debt service ratio givesa sense of the proportion of anual export receipts that could be used to pay interest andprincipal on international debts. A lower ratio implies that it is relatively easier for a state torepay its foreign debts.
We hypothesize that those states with a history of significant lending or traderelationships may be more likely to cooperate in seekig reductions of LBMP. Table 18, panelb, ranks Caribbean states in terms of the cumulative total of official development assistance from
OECD countres, including the United States, the United Kingdom, France, the Netherlands,Canada, and Sweden, during the period 1981 to 1991. This assistance includes grants as wellas concessionalloans that must be repaid. Table 19 describes exporting activity for each of theCaribbean states. For each state, both the leading importing states and the leading exportcommodities are identified. Table 19 helps to characterize existing trade relationships that mayfaciltate mutually beneficial relationships in the control of land-based sources of marinepollution.
The development of mutually beneficial relationships in pollution control is sometimesdescribed, in economic parlance, as a type of gain from trade. The possibilties of gains fromtrde with regard to a pollution problem can be shown clearly using a stylized model, which wedescribe in detail in Appendix C. In ths model, the rights of a state to a clean marieenvironment are clear, and states have the legal competency to enter into agreements to controlpollution. However, states may find other reasons for entering into an agreement to controlpollution. Even states that have a legal right to a clean marine environment may be wiling toaccpt some level of pollution in order to benefit in other ways, such as improved internationalrelations or perceived increased benefits to the state of a trading parer's economicdevelopment. For example, Mäler (1990) cites studies by John Krtila and Alan Kneese whichdemonstrate that:
. . . at least along the U.S.-Canada and U.S.-Mexico borders, agreements on
2 In Appendix C, we examne the effects of propert right distributions, burden of proof, and lack of clarty
in propert rights.
88

00 \0
Table 17
Coa
sta
Dev
elop
men
t and
Led
ing
Fish
Pro
duce
rs a
nd T
ouri
st D
estin
atio
ns
a. P
opul
atio
n D
ensi
ties
as a
Mea
sure
or
Coa
stal
Dev
eloo
men
l
(per
sons
per
squ
are
kilo
met
er)
Bar
bado
s61
2
Pue
rto
Ric
o36
8
Aru
ba32
6Si
. Vin
cenl
& G
rena
dine
s33
2M
artin
ique
321
U.S. Virgin Islands
284
St.
Luci
a25
1B
aham
as25
0
Gre
nada
247
Tri
nida
d &
Tob
ago
242
Hai
ii23
6Ja
mai
ca22
4
Gua
delo
upe
194
Net
herla
nds
Ant
illes
191
Dom
inic
an R
epub
lic14
8
Si. K
iiis
& N
evis
147
Ant
igua
& B
arbu
da14
6
Mon
tser
rat
120
Dom
inic
a11
3
Cay
man
Isl
ands
100
Cub
a96
Gua
lem
ala
85British Virgin Islands
80A
ngui
la75
Costa Rica
60
Hon
dura
s46
Mex
ico
44Pa
nam
a32
Col
ombi
a31
Nic
arag
ua29
Uni
led
Stat
es27
Ven
ezue
la22
Turks & Caicos
21
Bel
ize
8
Guy
ana
4
Suri
nam
e3
French Guiana
i
b. L
edin
e M
arne
Fis
h Pr
oduc
ers
in th
e C
arib
be
(thousands or metric tons in 1991)
Uni
te S
tale
s52
00
Mex
ico
1251
Ven
ezue
la33
2
Pana
ma
147
Cub
a14
4C
olom
bia
84
Guy
ana
40
Hon
dura
21
Costa Rica
16
Dom
inic
a R
epub
lic16
Tri
nida
d &
Tob
ago
10
Baa
mas
9G
uade
loup
e8
Si.
Vin
ceni
8
Jam
aica
7French Guiana
7
Nic
agua
5H
aiti
5G
uale
mal
a4
Mar
niqu
e4
Suri
nam
e4
Baa
dos
3
Pue
rto
Ric
o2
Bel
ize
2A
ntig
ua &
Bau
da2
Gre
nada
2
Neiherlands Antiles
Aru
baD
omin
ica
Si. KiilS
Si. Lucia
U.S
. Vir
gin
Isla
nds
c. L
edin
, Tou
risi
Des
tinat
ions
in th
e C
arbb
e
(milions or U.S. dollars in 1991)
Uni
te S
tale
4955
1
Mex
ico
4355
Baa
mas
1222
Dom
Inic
a R
epub
lic8n
Jam
aica
746
U.S
. Vir
gin
Isla
nds
708
Netherlands Antiles
484
Baa
dos
453
Col
ombi
a41
0A
ruba
401
Ven
ezue
la36
5C
osta
Ric
a33
1A
niig
ua &
Bau
da31
4C
uba
300
Gua
delo
upe
284
Mar
niqu
e25
5G
uate
mal
a21
1Pa
nam
a19
6S
t. Lu
cia
173
Tri
nida
d &
Tob
ago
101
Bel
ize
9551. Kitt5
74
51. V
ince
nt53
Hai
ti46
Gre
na38
Hon
dura
31
Guy
ana
30D
omin
ica
28
Nic
agua
17
Suri
nam
eII

Tab
le i
8D
ebt S
ervi
ce R
atio
s an
d L
edin
g R
ecip
ient
s of
For
eign
Aid
a. D
eb! S
ervi
ce R
atio
s in
the
Car
ibbe
nb.
Lt'.
arlin
l! R
ecip
ient
s of
For
eil!n
Aid
in th
e C
arib
ben
(tot
a de
bt s
ervi
ce (
inte
rest
plu
s pr
inci
pa r
epay
men
ts o
n in
tern
atio
nal d
ebts
)as a percent of export of goos and service in 1991)
(tot
a ne
t dis
burs
emen
ts o
f of
fcia
l dev
elop
men
t ass
ista
ce f
rom
all
OE
CD
Dev
elop
men
t Ass
ista
ce C
omm
ittee
sou
rces
dur
ing
1981
-199
1,ex
pres
se in
mill
ons
of 1
994
U.S
. dol
lars
)
Mex
ico
33
Col
ombi
a32
Hon
dura
s32
Mex
ico
5019
0
Guy
ana
32Pa
nam
a22
886
Nic
agua
25C
aym
an I
slan
ds18
860
Cub
a24
Gua
tem
ala
24C
olom
bia
9759
Pana
ma
22B
aam
as84
58
Jam
aica
20T
rini
dad
& T
obag
o19
Hon
dura
4338
Costa Rica
18Ja
mai
ca41
57
Baa
dos
16N
icag
ua38
03
\0 0A
ntig
ua &
Bau
da14
Cos
ta R
ica
3365
Dom
inic
a13
Gua
tem
ala
3249
Ven
ezue
la11
Dom
inic
a R
epub
lic27
92
Dom
inic
a R
epub
lic11
Net
herl
ands
Ant
iles
2755
Hai
ti22
89
Baa
mas
8
Netherlands Antiles
6G
uyan
a10
75
Bel
ize
6U
.S. V
irgi
n Is
land
s85
4
Gua
delo
upe
6Su
rina
me
644
French Guiana
5D
omin
ica
400
St.
Luci
a4
Aru
ba37
4
St.
Vin
cent
4B
eli z
e36
7
Suri
nam
e3
Baa
dos
336
Gre
nada
3G
rena
da27
3
Hai
ti3
Ant
igua
& B
auda
229
St. Kitts
3S
t. Lu
cia
219
Mar
iniq
ue2
Aru
ba1
SI. V
ince
nt &
Gre
nadi
nes
inT
urks
& C
acos
107
St. K
itts
& N
evis
102
Mon
tsrr
t69
Ang
uila
8

Table 19
Major Export and Primar Importg State
I'RYEXPORTIG IMRTIG I'ODUlSSTAn: STAn: ("1"'1Aauilb .. -An6ua " Øu Unite SCic (41): "" of pc pn
U.iic Kio_ (191;Gey (191
ANb - -II Uiuic Saia (7: ~Pu Ri (17) 4i1bi ru- Uniic lGnido (17): su cb cIUniic Saia (131 copo
Bdiz U.iic Sw (e7); supr oc~ ~Uniic IGdo (2el:Mcxõc (13)
Brsh Yiriin - ..IslCaya iib. .. -Cobi Uiuic Saia (391; !o pruc fi pcns
Gcy (91; prua; cooeV-i (9)c- Ri Uniic Swe (sSI: ba: cooe
Gcy (IICi as (60 su auDonic Uiuic IGdo (e21 ba; co-b _Doinic R.lc Uniic Saia (S); fenickd; su
tI. (niFrc Guya - -Cn Unite SUlC OS): b3; nutm: co t:
Uiuic lGnido (27)
Gulope Fra (781: ,&ritunl pruaMantquc (1-4)(l Un."' Saia OSI: cooe ""El s.vo (lei
eu Uaiic IGnc (33; suar: co: bauxiiUn;ic S.. (31
lWei Uni Sw !71 Ic l'ufacrt
Houru Uniic S.. (s. I: ba: cooe slmp an _Gcy (111J.. Uaik: SU.IC (4)): aluminaUniic lGid (lSI:Ca (10)
Munique Fro (6S): foo prua rd pcnsCu (27)
Mø Uoiic S.. (8 II ..ina dc cioñau pdMo .. ..
tI AIIc - ..
N"icua Uoiic Saia (191: cooe f.. an rl' in _Gcy (Ui.. Uni Sw 001: ba: slmpGcy (27)
Pu Ri Uaiic Sl (1 ciõa an ch i-roo: dc tl
St Ki " tl \J Sl (SSI: nw iu prUni i:do (26)
St Lu Uaic IG (St): ba; cIUaiic Su (211
St V_It Th \J IG (ell: bI _GR Tri " Tob(12) St Lu (10)Sa No o.): aluminaNc (26):Uniic S.. (ni
Tñi " Tob Uniro S.. (e7) mi..-f\ lublS ch anci;a prua
Tut " Ca - ..
Unilc Sc Ca (21; "" .. an po; ba onJap (10); misobn llraMcxõc (9)
u.s. Viriia Isl - -V.. U... Su (S au pc an pc
prua
91

water and water quality have involved "trades" in areas other than the ratherrestricted area defined by the environmental resource. The importnt point hereis that there have been trades, although they may not be directly visible.
Table 20, adapted from Kimball (1994), lists some examples of the kids of trades that mighttae place with respect to LBMP control in the Caribbean. We note tht even when the potentialfor trade exists outside the realm of pollution control, inormation about the gains from tradein pollution control per se wil be valuable to states negotiating broader agreements.
In the next two subsections, we tae a closer look at characteristics of states that mightenable mutually beneficial relationships in pollution control to develop. We offer suggestionson opportnities, but we do not identify any imediate solutions. The reduction and control of
LBMP in the Caribbean wil require much hard work from all of the Contracting Parties to aprospective protocol. As we begin to sketch out some possibilties for mutually beneficialrelationships, we have found it helpful to keep in mid the economic groups that have beenidentifed in ths subsection.
C. Sources and Staes
In ths subsection, we examine the identity of WCR states as polluters or pollutees. Weadopt the approach developed by Broadus et al. (1993) to measure "sources," "stakes," and"capacity." "Source" is a measure of a state's relative contribution of land~based marine
pollution to a region. "Stae" is a measure of a state's economic interest in reducing marine
pollution. "Capacity" is a measure of the economic capabilties that a state has at its disposalto reduce pollution, by cutting its own emissions or by subsidizing the reduction of emissionsin another state.
Implicit in this analysis (particularly in the "source" measure) is an assumption oftranboundar LBMP effects. Although we have note in ealier sections that transboundaryLBMP, where it occurs in the WCR, is generally limted to border areas shared by two states,we believe that ths anlytic approach has value as well in a somewhat broader (i.e., subregiona)
context, primarily because of the potential for larger-scale tranbounda effects to develop orbe deteted in the future. Even if th does not occur, however, and the aim of the protocol
remain one of responding collectively to common but nontranbounda LBMP problems, webelieve tht an understading of each state's relative stading with respect to source, stae, andcapacity should enhance the abilty of negotiatig paries to concentrate on those specific
collaborations and exchanges that are most likely to be successfully implemented.
For our source measure, we would like to have, ideally, data on ambient concentrationsof pollutants at any location in the Caribbea, combined with the abilty to identify costlesslythe exact origin of each pollutat. Such data do not now exist, nor is it likely that they wil ever
92

Tab
le 2
0Opportities for Exchange and Cooperation
\0 w
Cat
eaor
vI
TV
e of
exc
hanC
leE
xam
ple
Economies of Scale
Dat
abas
esIOCIBEI CEPPOL
Clearinghouse systems
CEPPOLI World Banki OECS
Scientific/technical Analyses
IOCIBEI CEPPOL
Technical training
University of the West Indiesi CAARI
Public education/awareness
CEPpOLI OECS
South to North Exchanges
Plan
ning
tech
niqu
esAssessment techniques
Island Resources Foundation
Conflict resolution techniques
Coastal management
Loal co..unity engagement
Costa Rica
Was
te r
euse
and
reC
yclin
Cl
North to South Exchanges
Clean production technologies
Uni
ted
Stat
es, E
urop
ean
co..u
nity
, CU
aForeign aid payments
United States, Canada, France,
United Kingdom, The Netherlands, Sweden,
Ven
ezue
laSU
bsid
ized
loan
sWorld Bank, IADB
Debt-for-nature swaps
Costa Rica (not a marine example)
Shar
ed w
ater
cour
ses
orBilateral or subregional compacts
Venezuela/Trinidad , Tobago (oil pollution)
boun
dari
esFinancial transfers
United states/Mexico
Tradeable emissions quotas
Mex
ico/
Bel
ize
Differentiated standards
Differentiateed timetables
Shar
ed m
arin
e re
sour
ces
Allocation of harvest to distant water
or habitat
natio
nsJoint venture fishing agreements
Barbados and Trinidad , Tobago
Inte
rnat
iona
llyF
orei
gn a
idD
esig
nate
d P
rote
cted
Tec
hnic
al a
ssis
tanc
eA
reas
or
spec
ies
Bilateral or subregional compact
Reciprocal National
National liability laws
Pollu
tion
Lia
bilit
yAccess to national legal systems
ReC
limes
Tra
nsbo
unda
ryRegional agreements
State-OWned oil company guidelines
Environmental Impact
Assessment Reaimes
International trade
Environmental protection rules
NAF'AI CARl
CO
M?
aClr
eem
ents
Bilateral Investment
Environmental protection rules
AC
lree
men
tsprivate Industry
Rec
reat
ion
Red
uctio
n of
gol
f c
ours
e ch
emic
al tr
eatm
ents
Marketing (group pollution control
technolog purchases)
Water conservation and reuse
Catalytic financing from international
dono
rsIADB sewerage system financing in Barbados
Env
ironm
enta
l aud
itsPrivate Tourism
Cruise Ship waste management a~d disposal
GEF Project on Ship-Generated Waste
CO-financing by local governent
Caribbean Tourist organization
Collective Bargaining
Tourist taxes
Barbados Hotel Association Tourism Enhancement
Fund
Don
or A
genc
ies
Replicability of subregional expertise
Donor government citizen benefits
Canada, Sweden, USAID/CEF Eastern Caribbean
Environment and Coastal Resources Management
Pro
j ect
Source: Kimball (1994)

exist. At present, we have incomplete data only on point sources of some pollutants from someof the WCR states and on point and nonpoint sources combined from the U.S. Gulf coast. Eventhese data may be biased, because data tend not to be collected from states with rudimentapollution control intitutions. Because of these limtations, we employ instead estimates of thepopulations within the WCR drainge area as a measure of source. (Appendix B contains adescription of how these estimates were developed.)
For our stake measure, we would like to have, ideally, data on the value of damagesassociated with ambient concentrations of pollutants at any location in the Caribbean. As in thecase of the ideal source measure, such data on impacts do not now exist. The actual impactsof ambient concentrations of pollutants are furter clouded by the issue of "synergistic" effectsraised by Gladfelter and Ogden (1994). We employ intead estimates of the proportion of eachstate's population tht is in the Caribbean coastal zone as a measure of stae (Appendix B).3
For our capacity measure, we nee to know somethg about the distribution of propertrights. If we assume, as in Appendix C, tht states have the right to a clean environment, thenfor source states we would like to have, ideally, an estimate of their abilty to offer payments(or in-kid services) to downstream states as compensation for pollution damages. This estimatewould be an aggregate of each source state's pollutig industries' marginl abatement costschedules (Figure C.1 in Appendix C). These data do not yet exist. As a proxy for an idealcapacity measure, we employ the stae-weighted gross domestic product for each state. (Notethat tls capacity statistic might be interpreted as a measure of the economic value of a state's"stae" in controlling or allowing pollution, depending on the nature of its predomiant
industries. )
Table 21 presents the data on sources, staes, and capacities for each WCR subregion,
as delineated by CEPPOL. A more generalized, geographic depiction of tls inormation ispresented separately for each measure in Figure 15, panels a though d. In Figure 15, we havedelineate the CEP subregions by following the actu or hypothetical maritime boundaies in
the region (panel a). In each of the other panels of Figue 15, states should be compared onlywith each subregion and not across subregions. Each subregion is associated with a specificcolor. There are five possible shades for each color; the lighter shades represent lower valuesof the relevant statistic, and vice versa. The five possible shades represent five possibleincrements (twenty percent each) of the relevant statistic.
We note that an alterntive organtion of the WCR into different subregions wouldresult in different measures of source, stae, and capacity for each state. It wil be importtfor the states involved in framg the term of the protocol to give caeful consideration to the
3 Note that this statistic is an improvement on that used by Broadus et al. (1993) becuse we use only the
proportion of a nation's population that is coastal, not the entire drainage basin population.
94

Table 21
Source, Staes, and Capaities with Subregions'
SlateiSubre~ion Sourc Share Slake Capacity Share"
Sub..ion ICuba 4.0 56.8 2.7
Mexico 24.0 6.0 4.7
United States 720 6.0 92.6
Subreion II
Belize 1.3 64.0 6.6
Cost Rica 10.4 20.8 28.6
Gualemala 36.8 - -Hondura 32.9 22.0 16.1
Mexico 4.1 0.5 34.9
Nicaral! 6.5 2.4 1.0
Panama 8.0 9.5 12.8
Subreion II
Bahama 0.1 100.0 8.3
Cayma i..lnds - 100.0 2.2
Cuba 19.0 16.3 8.9
Dominican Reouhlic 30.0 58.0 13.3
Haiti 27.0 29.2 2.5
Jamaica 10.0 55.4 6.2
Puerto Rico 13.6 80.0 58.5
Turks & Caico - 100.0 0.2
Subreion IV
Anl!ila 0.4 100.0 0.8
Antil! & Barbuda 3.9 100.0 7.4
Barbdos 16.1 47.4 15.0
British Vi..in Islands 0.7 100.0 2.3
Dominica 5.2 100.0 3.1
Gread 5.2 100.0 4.4
Guaelouoe 21.0 44.2 8.5
Martiniaue 20.9 69.0 24.2
Montsrrt 0.7 100.0 1.3
Netherlands Antilles 0.9 8.0 2.0
Si. Kitls & Nevis 2.5 100.0 2.5
5t. Lucia 9.4 100.0 4.4
51. Vincet & Gredines 6.9 100.0 3.0
US Vi..in Islands 6.1 100.0 3.0
Subreion V
Aniba 0.2 100.0 0.2
Colombia 60.4 5.4 8.4
Neterlands Antiles 0.3 92.0 4.8
Trinida & Tob"o 2.5 69.5 12.8
V enezela 36.6 36.9 73.7
Sub..ion VI
Frech Guian 7.6 85.0 27.6
Guyan 61.7 38.1 10.3
Suriname 30.7 41. 62.1
'Se Appedix B for data SOrc and methology us to esimate drainage populations (for calculationof sorc shre) and col zo poulation (for calculation of ste).
95

10°
(0) Subregions
0°
1000W 40°90°
80° 70° 60°
10°
(b) Source
0°
1000W 40°90°
80° 70° 60°
Figure i 5. Comparison of Sources, Stakes and Capacities within CEP Subregions.
96

(c) Stake
10°
0°
1000W90°
80°
(d) Capacity
10°
0°
1000W90°
80°
Figure is (contd).
97

delineation of appropriate subregions on the basis of relevant environmental characteristics. In
particular, care should be taken to delineate subregions such that they encompass only thosestates where sources of pollution originate and effects of that same pollution occur. 4 Ouranalysis should be interpreted as a first-cut using subregions previously designated by CEP.
In Subregion I, the United States is the major source, and Cuba has the major stake. TheUnited States and Mexico have already concluded a bilateral agreement relating to transboundarymarine pollution, the 1983 Mexico-United States Agreement on Cooperation for the Protectionand Improvement of the Environment in the Border Area. Reductions ofLBM pollutants fromU. S. sources through some tightenig of its existing water pollution rules might be one elementof a larger rapprochement between the United States and Cuba should Cuba begin to movetoward democratization and openness. However, given the primary current flows, Cuba isunlikely to be affected much by U.S. LBM pollutants. The nortern Bahamas, in Subregion III,would appear to be more at risk from land-based sources in Subregion I, and therefore shouldbe considered for inclusion in the same subregion as the United States.
In Subregion II, Guatemala and Honduras are the main sources and Belize has the largeststake. Encouraging agreement among these states concernng the Gulf of Honduras wouldappear to be a priority in this subregion. Accentuating Belize's large stae is the fact that it hasthe most extensive coral reef ecosystem in the Western Hemisphere. However, Belize City isa significant source of pollutants, and Belize is located upstream of the other two states, in termsof the predominant coastal countercurrent.
5 As alluded to in Section IV, Honduras may begin
to shift its banana agriculture to other industries, e.g., ecotourism, as U.K. subsidies are phasedout under new European Community rules. This should lower Belize's risks from nutrient andpesticide runoffs. The United States, as a major foreign aid provider to Guatemala and
Honduras, might playa role in facilitating agreement by encouraging Honduras and Guatemalato reduce LBM pollutant loads in return for reductions in sewage and industrial pollutantsemanating from Belize City. Belize and Guatemala currently are engaged in negotiations overa maritime boundary, and these negotiations might usefully include discussion of potentialtransboundary pollution flows.
Costa Rica has a significant stae and capacity share in this subregion, but it is locatedat a substantial geographic distance from the other three major sources and stakeholders. This
4 We note that subregions could overlap. For example, if pollution from state A affects state B, and pollution
from B affects state C, but pollution from A does not afect C, then two overlapping subregions should be
established. Furthermore, subregions could be "nested." For example, if pollution from A affects B and C, butpollution from B affects only C, then Band C form a subregion that is nested inside the subregion formed by A,B, and C.
5 Note that there may be some cycling of pollutants in the Honduras Gulf, suggesting that these three countries
may have a common pool type pollution problem.
98
point furter reiiûorces the critical need for a careful delineation of subregions: is it reasonable
to expect Costa Rica to expend much of its capacity on this problem when it is neither asignificant source of LBMP nor noticeably affected by the LBMP contributions of the majorsource states in the subregion?
In Subregion III, the Domincan Republic and Haiti are the major sources and PuertoRico has the largest stae and the largest capacity. But the priar current movements suggesttht Puerto Rico is upstream of both these states. Transboundary pollution, if it occurs, mightfollow a path from the Domican Republic and Haiti to Cuba and from the south coast of Cubatoward Jamaica. The United States, which is closely associated with Puerto Rico and a majorforeign aid provider to both the Dominican Republic and Haiti, might playa role in encouragingthe latter two states to control LBM pollutants, to reinorce the effects of the existing applicationof US pollution controls in Puerto Rico.
Subregion III includes thee states with economies tht are heavily dependent upon
tounsm: the Bahamas, the Tuks & Caicos Islands, and the Cayman Islands. The southernBahas and Turks & Caicos are relatively protected as upstream states. Reduction of pollutionin the southeastern section of Cuba, another significant source in the subregion, could reducemost of the risk faced by these two states. France, which is a major western source of foreignaid to Cuba, might play a role in encouraging Cuba to reduce pollution in ths region. TheCaymans are protected in a relatively remote area of the Carbbean Sea, but may be at risk,depending upon curent flows, to pollution pulses from upstream states in the .caribbean Sea.This risk is likely to be small.
In Subregion IV, Guadeloupe and Marque are the major sources. Because all of thestates in ths subregion are islands or island groups, they all have large stakes. Many of theisland states in ths subregion have undiversified economies, with tourism the overwhelminglypredominnt sector. Martinque has the largest capacity to deal with any potential pollutionproblems, and the U.S. Virgin Islands and Barbados have substatial capacities as well.Although there are some riks of tranbounda pollution problems among the states of thesubregion, it is likely tht actual tranbounda effects are small, if they exist at alL. Many ofthe Antiles are islands that have some kid of association with a Euopean state (France, theNetherlands, or the Unite Kigdom) tht ca draw upon its experiences in the Nort Sea LBMPprogram (and, in the case of Frace, in the Mediterranean Program as well). It wil be
importt to know whether these Europea states have already concluded other bilateral ormultiateral agreements for control of mare pollution that apply or tht ca be easily adapted
to relations between associated states in the Carbbean. Should tranboundary problems develop,or become apparent, states in ths region might use OECS resources to assist in the identificationof relevant gains from trde (see, e.g., Table 20). Moreover, current OECS member statesmight benefit from an expansion to include all of the Subregion IV states.
99

In Subregion V, Colombia and Venezuela are the primary sources. The island states,again, have major stakes; Aruba and the Netherlands Antiles are comparatively undiversifiedstates, dependent primarily upon their tourism economies. Venezuela and Trindad & Tobagoalready have entered into a bilateral agreement on marine pollution (Goodridge 1994). Althougha coastal countercurrent is thought to move from Colombia toward Venezuela, this is not likelyto add significantly to the pollutants generate along Venezuela's industrialized coast. In thiscontext, it is interesting to note that Colombia has been working to strengthen its environmentallaws, and its efforts have recently drawn praise from Venezuela.
6 Local pollution control
effort in Venezuela, which has significant source, stae, and capacity statistics, wil becomeincreasingly importnt to the domestic population as Venezuela continues to develop
economically.
In Subregion VI, the notions of source and stae are affected strongly by the predomitnortwestern current flow. All thee states are almost certiny affected by Amazon effuents,
which are defined to be outside the Wider Carbbean Region. (Notably, Guyan and Sureare on the Amazon Cooperation Council with BraiL.) Given the direction of current flows,Suriname is the leading source and Guyana has the largest stae. Surine also has the largest
capacity, suggesting that gain from trade, if transboundary effects are present, might derive
from an agreement between Surie and Guyan. The Netherlands, as a major trading parerwith Suriame, might playa critical role in facilitating such a trade.
Table 22 presents an overview of "key" source, staeholder, and faciltator states in eachof the subregions. Key faciltators are those states that provide significant amounts ofdevelopment assistance to key source states and so might be in a position to encourage a tradingrelationship to develop. Where the key source state is not receiving development assistance, amajor trading partner is identified as the key faciltator. (We reiterate the potential sensitivityof the results to the existing delineation of subregions.)
Matchig key faciltator states with key source states may provide clues to importtinternational relationships in the resolution of LBMP problems in the Carbbean. For example,the United States, with assistace from Mexico, might offer the following deal to Beliz: inreturn for the reduction of LBMP emissions in Beliz, the United States wil put pressure onHondur (and possibly Guatemala) to reduce its emissions.
Other interntional trdin relationships might cross subregions. For example, the Unite
States, as Venezuela's largest trdig parer, might encourge Venezuela to reduce itsemissions. The Netherlands would benefit directly from such a move. In retu, the
6 At the 25th anversar of INDERENA, Colombia's environment agency, Araldo Jose Gabaldon, Venezuelan
Environment Minister. praised the conversion ofINDERENA into a Minstr with broader legislative and reguatorypowers.
100

Tab
le 2
2K
ey S
tate
s an
d T
radi
ng R
elat
ions
hips
in th
e W
ider
Car
bbea
Reg
ion
~ o ~
Key
Key
Sou
rce
Stak
ehol
der
Key Facilitator
Stat
e(s)
Sta
te (
s)St
ate
Key Matchups
Sub
regi
on V
ISu
rina
me
Guy
ana
The Netherlands
The
Net
herla
nds
and Venezuela
Subregion V
Ven
ezue
la;
Aru
ba;
Uni
ted
Sta
tes
Uni ted States,
Trinidad &
Net
herl
ands
Venezuela, and The
Tob
ago
Ant
illes
Net
herl
ands
Subr
egio
n iv
Bar
bado
s;U
. S. V
irgi
nFr
ance
united States and
Mar
tiniq
ue;
Isla
nds
Fran
ceG
uade
loup
e
Subregion III
Pue
rto
Ric
o;C
uba
Uni
ted
Stat
esUnited States and
Dom
inic
anC
uba
Rep
ubl i
c ;
Hai
tisu
breg
ion
IIB
eliz
e;B
eliz
eU
ni te
d S
tate
sUnited States and
Hon
dura
sB
eliz
e
Subr
egio
n I
Uni
ted
Sta
tes;
United states and
Mex
ico
Cub
a

Netherlands might encourage Surinae to reduce its emissions, benefitting Guyana and,potentially, Venezuela. To the extent tht the Lesser Antiles are at risk from Venezuelanemissions, France would benefit from Venezuelan cutbacks. In return, France might encourageMarinque and Guadeloupe to control their LBMP emissions, benefitting the U.S. Virgin Islandsand thereby completing the lin. Although ths international negotiation ha many lin, it
involves only four states. In fact, a bargain strck among the United States, Venezuela, andFrance to reduce LBMP emissions in their respective territories and in the territories ofassociated states and states to which they give foreign aid might reduce much of the risksassociated with transboundary LBM pollution in the WCR.
D. An Alterntive Assessment of Capacities and Incentives to Control LBMP
As noted in the previous subsection, the. analytic approach developed by Broadus et aL.
(1993) to estimate sources, staes, and capacities of states proposing to underte collectiveaction on LBMP has as an underlying assumption the generaliz presence of trboundar
LBMP effects. This assumption limts the utiity of the analysis for a region like the Carbbean,where most LBMP effects have so far been demonstrated to be localiz, and where generalrecognition of ths fact has not precluded interest among the Contractig Paries to the CargenaConvention in negotiating a protocol that addresses common but not necessarily tranboundaryLBMP problems. The approach has certin other, more general limtations as well. Theseinclude the failure of the "stake" measure to distinguish between an economic stae incontrolling pollution vs. a stae in continuing to pollute, and the failure of..the "capacity"measure to capture environmental inrastructure as an importt component of a state's abiltyto underte effective action to control LBMP.
In this section we build on our review of economic, intitutional, and environmental
chaacteristics of the WCR states in an attempt to assess the individual and collective prospectsfor undertg sustained and effective action to control land-based marine pollution. This
assessment is based on the assumption that the factors upon which these prospects mainy dependare a combintion of (i) the states' economic and intitutional capacity to tae corrective actionand (ii)the extent to which their economic strengths and priorities represent an incentive tomaintain a healthy coastal environment or, alternatively, to value the suounding marineenvironment priary as a convenient sin for pollutats. Another importt difference hereis tht, unike the application of the Broadus et aL. approach in the preceding section, we do not
begin the assessment by assigng states to subregions, but rather by considerig all the WCRstates together, with a single, unorm context.
Table 23 displays some sumar results of ths assessment effort, expressed in terms ofqualitative ratings for each WCR state in the areas of economic capacity, institutional capacity,and economic incentive. On each of these thee measures, a state was assigned a rating on ascle of 1 (weak capacity or incentive) to 4 (strong), based on an admittedly subjective
102
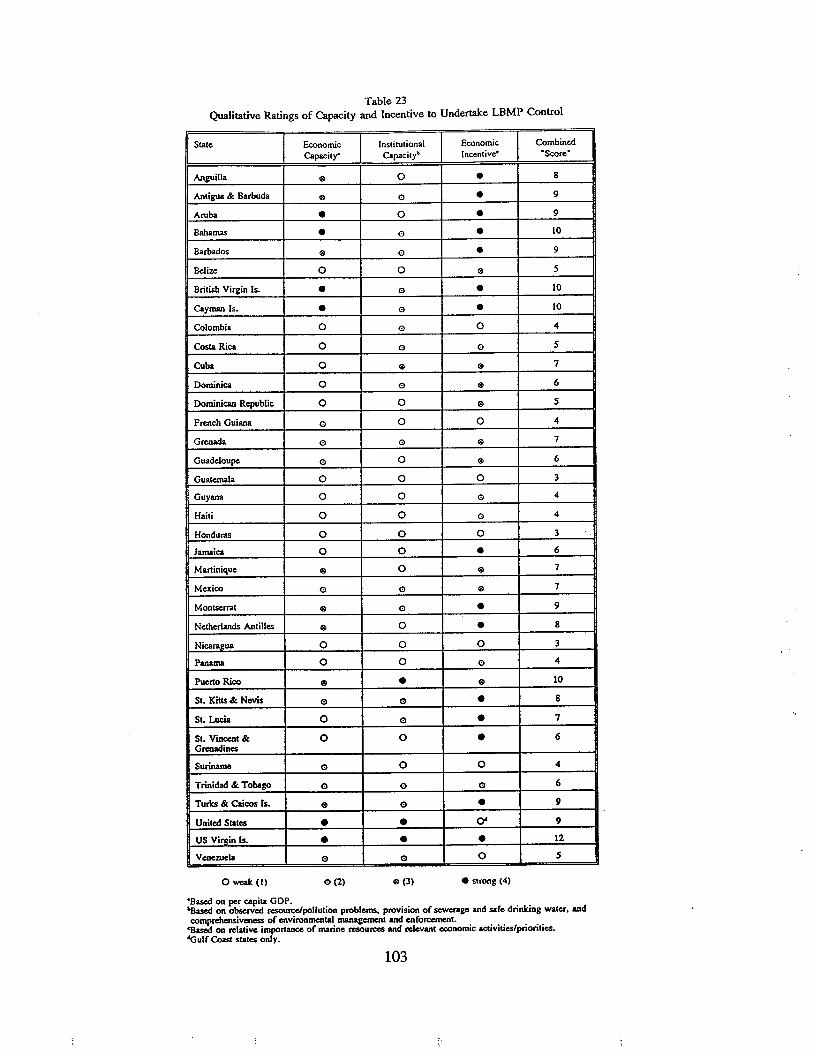
Table 23
Qulitative Ratigs of Capacity and Incentive to Underte LBMP Control
Slate Ecnomic Insiiiuiional Ecnomic CombinedCapaiiy" Capaciiy' IncetiveC . Scre'
Anguila 0 a . 8
Antigu &. Barbda 0 0 . 9
Aniba . a . 9
Bahama . 0 . 10
Barbados 0 0 . 9
Belize a a 0 5
British Virgin Is. . 0 . 10
Cayma Is. . 0 . 10
Colombia a 0 a 4
Co Rica 0 0 0 5
Cuba a 0 0 7
Dominica a 0 0 6
Dominica Republic a a 0 5
Frech Guian 0 a a 4
Gren 0 0 0 7
Guadeloupe 0 a 0 6
Guatemala a a a 3
Guyana a a 0 4
Haiti a a 0 4
Hondura a a a 3
Jamaica a a . 6
Martinique 0 a 0 7
Mexico 0 0 0 7
Montsmit 0 0 . 9
Neterlands Antilles 0 a . 8
Nicagua a a a 3
Pan 0 a ø 4
Puerto Rico 0 . 0 10
St. Kitls &. Nevis 0 ø . 8
St. Luia 0 ø . 7
St. Vint &. 0 0 . 6Greadines
Suriname ø 0 0 4
Trinidad &. Tobago 0 ø 0 6
Turl &. Caco (S. 0 0 . 9
United Slates . . 0' 9
US Virizin Is. . . . 12
Venezuela ø 0 0 5
o wek (i) 0(2) 0(3) . strong (4)
.Bas on pe capita GDP."Bas on obsrved rercpollution prolem. provision of sewerage and safe drinking water. ancompreensiven of environmeta magemt and enforct.
"Bas on relative importce of marine reurc an reevant ecnomic activities/priorties.'Gulf Coa slates only.
103

assessment of one or more relevant factors for which inormation was available. Specifically:
. economic capacity was rated solely on the basis of per capita GDP;
. institutional capacity was rated on the basis of a state's observed resource/pollution
problems, the extent to which it provides sewage services and safe drining water, andthe comprehensiveness of its environmental mangement and enforcement;
. economic incentive was rated on the basis of the significance of a state's marineresources and the relative importce and direction of pertinent economic activities andpriorities.
The assigned ratings for these thee factors, and the resulting total "score" for each WCR state,are also displayed in Table 23. Figure 16, panels a though d, display the geographic
distributions of the WCR states with respect to economic capacity, intitutional capacity,economic incentive, and total "score."
Admittedly, the thee rating factors constitute a limted and somewhat arbitrary basis forassessing somethg as complicated as a state's capacity-and especially its motivation or lackof motivation-to devote high-level attention, effort, and other resources to marineenvironmental concern. As a practical mattr, however, these factors reflect the limts of therelevant inormation that is available on a more or less uniform and comprehensive basis for allthe WCR states. At least equally importt, they constitute what we believe to be the most
reliable indicators of the WCR states' long-term capabilties, intentions, and priorities (incontrst to, for example, the charer or early statement of objectives of a fledgling environmentalministry) .
Table 24 arrays the WCR states according to their total "scores" for the thee qualitativeratig meaures, which range from 3 to 12. As indicated by the title of the table, we considerthese results to provide a qualitative idea of each state's overall prospect or likelihood of
engaging in sustained and effective action to control LBMP, based on its economic andintitutional capacity and its economic incentive to do so. Another way of describing theinormtion in Table 24 is to consider the states in the far-right colum (i.e., US VirginIslands, British Virgin Islands, Cayman Islands, and United States) as those most likely to brigto the effort the strongest mi of know-how, fmaciaI commitment, and political determtion,whereas those listed at the far left (i.e., Guatemala, Honduras, Nicaagua, Colombia, FrenchGuian, Guyana, Haiti, Pana, and Surie) are the states least likely to participate in anymeanigfl way without substantial fmanciaI and technca assistace and other, speciaIinducements.
Clearly, the majority of WCR states fall somewhere between these two extremes (i.e.,
104

10°
(a) Economic Capacity to Control LBMPweak D D D . strong
(1) (2) (3) (4)
0°
1000W90°
40°
80° 70° 60°
10°
(b) Institutional Capacity to Control LBMPweak D D D . strong
(1) (2) (3) (4)
0°
1000W90°
40°
80° 70° 60°
Figure i 6. Relative Capacities and Incentives to Control LBMP Throughout the WCR
105

10°
(c) Economic Incentive to Control LBMPweak D D D . strong
(1) (2) (3) (4)
0°
1 OooW 40°90°
80° 70° 60°
10°
(d) Overall Prospect of Sustained andEffective Action to Control LBMP
(TotalIScore")weak D D D Iä D D D . . . strong
(3) (4) (5) (6) (7) (8) (9) (10) (11) (12)
0°
1000W 40°90°
80° 70° 60°
Figure 16 (contd).
106

Tab
le 2
4
Ove
rall
Pro
spec
t of S
usta
ined
and
Effe
ctve
Act
ion
to C
ontr
ol L
BM
P
Wea
kest
Pro
spec
t
Tot
al S
core
:"- 0 ..
34
56
78
910
11
Gua
tem
ala
Col
ombi
aB
eliz
eD
omin
ica
Cub
aA
ngui
laA
ni &
Bar
Bah
amas
Hon
dura
sFr
ench
Gui
ana
Cos
ta R
ica
Gua
delo
upe
Gre
nada
Nel
h A
nli
Aru
ba
BV
I
Nic
arag
uaG
uyan
aD
omin
ican
Rep
Jam
aica
Mar
tiniq
ue51
. Kiii
s &
Nev
isB
arba
dos
Cay
man
Is.
Hai
tiV
enez
uela
Sl.
Vin
cent
&M
exic
oM
onts
erra
lP
uert
o R
ico
Pana
ma
Gre
nS
l. Lu
cia
Tur
ks &
Cal
cos
Suri
nam
eT
rin &
Tob
Uni
ted
Sla
tes
"Bas
ed o
n co
mbi
ned
qual
itativ
e ra
tings
of I
ndiv
idua
l sta
tes'
eco
nom
ic c
apac
ity, i
nsliu
tiona
l cap
acity
, and
eco
nom
ic In
cent
ive
(see
text
).
Strongest Prospect
12 USV
I

in groups with total "scores" ranging from 5 to 9), and the specifics of their circumstaceswarrant closer scrutiny. Fifteen of the WCR states-all of them island nations ordependencies-have very strong economic incentives to control LBMP (see Table 22 and Figure16, panel c). This group includes: Anguila, Antigua & Barbuda, the Bahamas, Barbados, theBritish Virgin Islands, the Cayman Islands, Jamaica, Montserrat, the Netherlands Antiles, St.Kitt & Nevis, St. Lucia, St. Vincent & the Grenadines, the Turks & Caicos Islands, and the
US Virgin Islands.
Of these 15, all but the US Virgin Islands have a substatial to very serious need fortechncal assistance to overcome weak intitutional capacity, and 4 of them (Jamaica, St. Kitts& Nevis, St. Lucia, and St. Vincent & the Grenadines) have a substantial to very serious needfor fincial assistance as well (Figue 16, panel a). In contrst to ths latter subgroup is another
subgroup of 3 (Arba, the Bahas, and the British Virgin Islands) that is in a comparativelystrong position to pay for the techncal assistace or intitutional strengthenig they would needto control LBMP to a level that is consonat with their economic incentive to do so.
Other than stress to coastal ecosystems, which is a ubiquitous problem thoughout theWCR, pollution from sewage is the most widespread of the serious LBMP problems confrontingths group of 15 states with especially strong economic incentives (affecting 9 of the 15).Sewage is followed by coastal erosion (affecting 7 of the 15 states). Other LBMP and relatedresource degradation problems that affect at least one-thd of ths group are pollution of coastalwaters by oil, ming, and other industrial effuents; deforestation; and overfshi. In addition,
5 of the states in ths group have been cited in various studies for failure to underte anassessment of their marine resources and problems, and an additional 2 (Jamaica and theNetherlands Antiles) have been criticizd for their general failure to regulate development andother activity in the coastal zone (refer again to Table 11 in Section IV).
The most obvious sources of both finacial strengt and techncal assistance with the
WCR are the Unite States and the US Virgin Islands (although the latter has its own diffcultieswith sewage management). Puerto Rico is another comparatively strong prospect for techncalassistace-perhaps paricularly to those neighborig countres that have yet to inventory theircoasta assets and problems or to develop and enforce effective regulations concerng coastalzone activity. Although not in the top tier in terms of overall intitutiona capacity, Cuba rateswell above average for the region, and it should be considered as a potential source of techncalassistace, especially on the use of "clean" technologies to reduce pollution by industral
effluents.
Cuba is one of 9 WCR states whose economic incentives to control LBMP may bedescribed as importnt but not compelling, in that industries such as tourism and fishig aretogether substantially less importnt thn manufacturing and/or agricultue. Cuba is notewortyamong ths group for having developed its quite strong intitutiona capacities despite a very low
108

standard of living,7 whereas something like the reverse is tre of Marinique, whose relativelyhigh standard of living has not tranlated into much progress in the area of environmental
inrastrctue. For the rest of ths group, there tends to be a much closer correspondence
between standard of living and institutional capacity to control LBMP and other environmentalproblems, with the need for both financial and techncal assistance being most serious for Belize,Domica, Haiti, and the Domican Republic.
Other than Belize and perhaps Costa Rica (as discussed furter below), the CentralAmerican countres should not be expected to paricipate in a sustained and meanigful waywithout special inducements.
8 All of these states have little in the way of economic capacity,
intitutional capacity, or economic incentive to paricipate. In Central America, two mainreasons for the low incentive are the predominance of the agriculture and manufacturig sectors,and the far greater orientation of population centers and economic activities toward the Pacificcoast and watershed.
For several of the WCR states, factors other th economic self-interest should not beoverlooked as major motivations to paricipate in a regiona protocol on LBMP. For the UnitedStates, for example, the apparent motive is a sense of responsibilty, as the dominnt economicpower in the region, to share its strong intitutional and techncal expertise with its neighbors(and to imrove the well-being of its own citins and resources in the Mexican border area as
well). Venezuela is likely to be motivated by similar sentiments, including a desire (or perhapsa political necessity) to improve the environmental quality of life for the very nïgh proportionof its population that is concentrated along the Carbbean coast. Perhaps most importt forVenezuela, however-and for Puerto Rico and Trindad & Tobago as well-is an awareness thatthese states account for most of the industral point-source pollution entering the Caribbean
proper (i.e., not including the Gulf of Mexico). Finally, Colombia and Costa Rica have bothtaen various steps which indicate that environmental concern are a much higher priority thantheir actual intitutional capacities would suggest, and it is likely that both these states see thecompletion of a regional protocol on LBMP as improving the chances that greater attntion andresours wil be made available to improve their domestic capabilties in ths area.
E. Concluding: Remarks
The anlytic approaches and examples described in ths section, together with the
7As noted by Broadus (pers. comr., 1994), one explanation that readily comes to mind is the low opportty
cost with a commd ecnomy, paricularly one that until recntly enjoyed tremendous foreign subsidies.
8The same is probably true for the three South Amenca states to the eat of Venezuela, although Guyan and
Sune do paricipate in the Amazn Cooperation Treaty, which may well be more relevant to their environmentaconcern than LBMP in the Carbbea.
109

information compiled in the previous section and in the Appendix A data tables, are intendedto serve as a basis for explicitly recogniing common and complementary self-interests,strengts, and weakesses in the design of protocol mechanisms to facilitate mutually beneficialcollaborations and exchanges.
No attempt has been made to integrate these anlytic approaches into a single "formula"for determinig the "best" organtion of states into subregions. Nonetheless, the present studyhas given attention to concern that were expressed by some reviewers of the earlier,comparative study (i.e., Broadus et aL. 1993) as to the desirabilty of relying on a single
indicator-population-to represent a state's stae in controlling LBMP. Specifically, Broaduset aL. (1993:48) used the percentage of a state's population in the relevant drainage area as aproxy for "political and economic interest in reducing marie pollution" -a measure for whichfew other reliable data are uniformy available.
In ths study, the approach of Broadus et al. has been refined by using an estiate of
coastal population rather than drainge area population to represent a state's "stae" in
controlling LBMP. 9 In addition, an attempt was made to test the validity of the above-mentioned criticism. The coasta population estimate was weighted by our composite indicator
of "economic incentive to control LBMP" (see Section V.D), which represents the significaceof a state's marie resources and the relative importce and direction of pertinent economicactivities and priorities.
Reviewers of the earlier study may be surrised to lear tht ths weighting exercise
resulted in only minor deviations from the results report in Section V.D. For example, CostaRica and Honduras exchanged places but remained fairly close in the middle range of staeswithin Subregion II; and in Subregion il, there was a simar reversal of position for theDominca Republic and Jamaica, with both remainig in the middle range.
Cuous readers can easily perform ths exercise and consider the results for themselves.The resuts are not report here because we remain skeptical about the utiity and validity ofweighting factors that provide only a naow sense of a large and complicated economic pictue
(e.g., agriculture as % of GDP) or caot be reliably quatified for such use (e.g., tageting ofindustries for concerted development effort). 10
9'e preferabilty of coasta population is obvious if one considers that residents of the US states of Montaaand Pennylvania, for example, although par of the WCR drage basin population, are unikely to see themselvesas having an ecnomic stake in the quaity of the Gulf of Mexico or WCR mare environment.
10Simlarly, we have rejected a suggestion that land-use data be used to weight population for a better indicator
of "stae." Lad-use data are quite diffcult to obta, especially for the smal island states. Far more imorttis the fact that, even where available, they are by their nature destied to capture only the relative imprtce ofpolluting and flpollution-neutral fl industries, while failing to capture the importce of industries that are vulnerableto LBMP. such as tourism and fisheries. As such, land-use data, were they more uniformy available, might more
110

A case in point is the evolving economic reality of Cuba, which was singled out by onereviewer as a state for which population alone suggests a far greater stake in controlling LBMPthan its overall economic make-up would suggest (Wood-Thomas, pers. comm., 1995). Whileit is tre that Cuba has an unusually high proportion of GDP accounted for by manufacturing(39%), there are other importnt (but diffcult to quantify) factors that account for Cuba'shaving been assigned a rating of "3" for economic incentive to control LBMP. The mostimportnt of these factors are the following:
Tourism has been targeted as the number one growt area by the governent, andforeign investment in tourism development has been very strong.
Cuba is the largest net exporter of fish in the WCR; the reported value of its net exportexces that of the second-largest net exporter (Bahamas) by more than 30 percent.
Manufacturing is heavily concentrted in paper products and has been tageted by the
governent for strategic diversification. An emerging industr tht could well benefitfrom ths move, and in which Cuba is a leader in the WCR, is the development andapplication of so-called clean technologies.
Such factors, we believe, constitute a sound basis for characterizing Cuba as having a muchstronger economic incentive to control LBMP than its historical emphasis on manufacturing (and,to a lesser extent, agriculture) would indicate. At the same time, however, suchinformation-being diffcult to quantify and not uniformy available or relevant across theregion-does not lend itself to use as a weighting factor.
The development of one or more weighting factors for use in anlyzing states' relativestae in controlling LBMP remain an intriguing area for furter effort, but one in which succsswil depend heavily on substantial improvement in the collection and availabilty of relevantdemographic and socioeconomic data. For the present, we offer the inormation and anlyses
report here as a framework for assessing which states are the most likely to engage insustained and succssful action to control LBMP, and the general categories of assistace orspial inducements tht the other states are likely to nee in order to participate successfully.
appropriately be used as a weighting factor for "source" if one were neeed (which, to our knowledge, has not beensuuggested).
111
Vi. Lesons Lerned i
A review of experience with regional programs to control land-based marine pollutionin the Baltic, Nort Sea, and Mediterranean has revealed a number of factors that can contributeto program effectiveness (Broadus et al. 1993). We compare these factors with expectationsabout a protocol for the Caribbean region, based upon regional characteristics and the currentstate of policy debate over the establishment of an LBMP protocol. 2
We present here and apply a checklist to help sumariz effectiveness factors across thefour regions (Table 25). In general, factors for success can be classified into thee categories.The first is a set of regional background characteristics associated with effective cooperation.The second is a set of program design elements, which are explicitly subject to the control ofprogr planners. The third is a set of indicators of program effectiveness. (Success breedsfurter succss, and evidence that a progr is in fact doing what it set out to do serves toreinorce or provide momentu for furter program effectiveness.)
In the case of the Caribbean, our checklist is necesarily incomplete because there is nopractice under an LBMP protocol to be observed and evaluated. Neverteless, we feel tht ths
checklist provides a useful comparson across the four regional interntional programs.
A. Regional Background Characteristics
1. Delineation of Subregions
The appropriate region must be defined in terms of the actual environmental relationshipbetween states. If pollutants do not circulate widely, then the inclusion of unaffected states ina regional program wil only complicate cooperative effort.
In the Baltic and Nort Sea regions, mare pollution is trly a transboundar problem.The Baltic is shallow and stagnat and thus tends to trap dischaged pollutats, affecting allstates borderig it. The counter-clockwise curents of the Nort Sea provide a bettr flushigmecham for that regiona sea, but a general tranboundar problem remain in tht thedischages of some states are exported to other states.
i Much of this section has been adapted from Broadus et aI. (1993) in order to faciltate the application of
"lessons leaed" from regional international program to control land-based mare pollution in the Mediterrean,Baltic, and Nort Sea regions to the Wider Carbbean. .
2 Ths comparson was intiated though discussions at a workshop conducted as par of this study, which was
held 4-6 Decmber 1994, at the University of the West Indies in Bndgetown, Barbados.
112

Table 25
Checklist: Factors for Regional Program Success
Regional Background Characteriics ror Baltic North Med CaribbeanErrective Cooperation Se
Is me region defined in terms of the pollution Ves Yes Doubiful No. focus should be on delineationproblem? Do the pollutanlS arreci all or the stales or subregionscmtering inlo the agremenl~
Is there coherence among member slates? Are they Largely. Ves No No. bui possibly yes al anal similar levels economic and scientific but some appropriiely delineatedevelopment. and do they have similar resources at dispanry subregional level stake?
Are ile member sialC politically committ 10 the Yes Yes No Doubtl. a1i1ough ise isprogiim? Is the condition of the regional se a regnizpnonty isse. and are high level politica offcialsinvolved in overseeing me program?
Was thre geneiii knowledge of die baseline Ves. fair No, por Some. IOCARBE and CEPPOL haveenyironmnial conditions in the se al th time of the paal made a goo sian; focus should beprogra's ineption? Where ile baic sorc and on pnonty problem aresshres of pollutani inpUlS kllwn?
Elen of Efecve Prgra De
Is die goal of die regional agremenl clearly Stte, Yes Yes Yes Should reive pnontyan are th progiim objecves designe to meel this
goal?
Dos ile agremenl oblige coniiicting panies to Ves Ves Ves Focs on encuraemenis:adopi mesures 10 meei progiim objecves? IInsctions coS! ~uctons
Do mesures spify ~uciion targeis and deadlines Ves Yes Few Enurae flexibility al subregional(or their achievement? leyel
Are progiim mesures designed efflcienUy? Do they No. bul No No Design proiocl instiOJlÏons 10target pollutin sourcs for which ile gretest improving encllge effcieni subregional
reuciions can be achieved al the lowesi marginal gains from Illdecost?
Does ile agremeni provide a mechanism 10 Ves. bul Ves Yes Environmental monitoring anddeienoine whedier or ii coniiicting panies comply not in the enforcmeni are roles for protoolwith adopied mesures? Is there an obligaiion In pal insiilUbonsrepoR on progiim implementaiion?
Does the progiim incorpiiie mechanisms for tiide Limiied No Some Encouiige bilatelli or small group10 increse prognim efficiency? agrements
Adequate finaing feaOJres? Yes Yes Problems Build on CEPPOL foundtin
Is die progiim's declisioiuing pross effectiye? Fair Yes Fair Fos shuld be on proure thiAre mere adOpied so as 10 keep dieir content aim to reuce ttnsactions costmeningful wiiloul alienating reluciani panicipanis' and define nghlS 10 a clean manne
environment
Is th progiim adapiable? Can ii be adjusted 10 Yes Yes Somewhai Design inio prolOlrefleci chaned circmsiaces and imrovedlcwledge?
Dyc Mea or EfecVCIIs thre complia widi th progra' Do Yes. bui , Some or De inlO prolOl usingconictng part imlemeni progia limite minima enyironmnia monilOnng suppon
remmendations'
Is ile goal being achieved? Has the regional Ves Yes Perhps -enyironmeni improved relative to the hypotheiicalsiOJalion thi would have ocrr withoui theregional progiim?
Haye naiiona abatemeni effons ben greter dian Ves Ves Doubtfl Aim shuld be 10 harnss explicidythy would have ben widioui regional copeiiiion? natinal abatemei effons dirogh
die faciltaiion of subregionalammgcments
Adapted from Broadus et al. (1993).
113

The weak currents and small tides of the Mediterranean Sea leave pollutants mostly inthe areas where they are discharged. Although some of the current flows in the Caribbean arestrong, most effects of LBM pollutant emissions are felt locally or subregionally. Pollutionproblems that are local or subregional imply that
subregional effort wil be more effective.
Effective reduction of pollutat discharges at the subregional level can reduce the risks of
regionwide effects.
Broadus et aL. (1993) found that cooperative efforts to control land-based sources ofmarine pollution are most appropriately based in regions defined in terms of the pollutionproblem itself. In regions where measures to control
land-based sources are only one component
of a larger umbrella agreement, it may be useful to focus on environmentally defined subregionswhen addressing land-based sources, rather th unecessarily including unaffected states.
In the WCR, CEPPOL has identifed 6 subregions of contiguous states for purposes ofanalyzing the distribution of pollutat loads (UEP 1994a). This delineation is a useful intialattempt, but we note that the ocurence of localiz LBMP problems does not follow thspattern in most cases. For example, some of the most common and pressing problems and theirdistrbution across WCR states (based on inormation sumarizd in Table 11) are as follows:
Sewage management: Arba, Bahas, Barbados, Belize, British Virgin Islands,Cayman Islands, Colombia, Costa Rica, Cuba, Domincan Republic, Grenada,Guadeloupe, Guyan, Haiti, Honduras, Jamaica, Marinque, Mexico, Netherlands
Antilles, Panaa, Puerto Rico, St. Kitt & Nevis, Surine, Trindad & Tobago, UnitedStates, US Virgin Islands, Venezuela
Indusrial pollutats: Barbados, British Virgin Islands, Colombia, Cuba, Domincan
Republic, Grenada, Guadeloupe Jamaica, Marinque, Mexico, Netherlands Antiles, St.Kitt & Nevis, Puerto Rico, Tnndad & Tobago, United States, US Virgin Islands,Venezuela
Need for better resource assesment/coas use reguation: Anguila, Bahamas,
Beliz, Colombia, French Guian, Guadeloupe, Guatemala, Guyana, Haiti, Jamica,
Honduras, Marinque, Mexico, Montserrt, Nicaragua, Pana, Sure, Tuks &Caicos Islands
Deforestion: Beliz, Colombia, Costa Rica, Domica, Grenada, Guatemaa, Haiti,
Honduras, Jamaica, Marinque, Mexico, Nicaagua, Panaa, St. Lucia, St. Vincent &Grenadines, Venezuela
Coas erosion: Antigua & Barbuda, Barbados, Dominca, Grenada, Guatemala,
Jamaica, St. Kitt & Nevis, St. Lucia, St. Vincent & Grenadines, Venezuela
114

Solid waste management: Colombia, Dominica, Grenada, Guadeloupe, Netherlands
Antiles
Delineation of subregions is one of the most importnt tasks that must be undertenunder the auspices of a protocol. Clearly some of the above problems are more common thanothers, suggesting that a system of overlapping subregions, defined by the presence of tagetedLBMP problems (as arayed in Table 26) might be appropriate. As scientific inormation isdeveloped, revision of existing subregions may be required.
2. Coherence Among Member States
The success of cooperative effort depends upon "coherence:" shared cultural values,public preferences that coincide, simlar stages of economic development, and compatiblepolitical organtions. Regions with states at simlar stages of economic development, such as
the Baltic and Nort Sea states, are able to contribute on a relatively equal basis to a marinepollution control progr, in term of the scientific, techncal, and fincial resources they haveat their disposal. Conversely, regions comprising states at varying stages of economic
development, such as the Mediterranean and Caribbean, may need specializ technology
transfer and financial assistace mechansms if their programs are to function on a fully regionalscale.
In the caes studied, the regions with the best coherence have the most effective regional
cooperation and are leat complicated by a number of tranfer issues. Furtermore, cooperativeeffort are most effective when member states are simarly affected by a degraded maeenvironment and have simar resources at stae. If they are not similarly affected by pollutatdischarges or do not perceive the condition of the mare environment as a priority issue, it ismore difficult to design a program in which participation is beneficial to all members.
The effectiveness of the Baltic and Nort Sea regional programs, relative to theMediterranean and, potentially, to the Carbbea, can be explained by the nature of each region's
member states and the degree of coherence among them. The Nort Sea region consists of asmall number of relatively homogeneous states, sharg simar staes in the condition of theirregiona sea. Most of the Baltic states similarly share a stae in and commtment to theirregiona sea's environment, though some disparty is evident between the traditional democraciesand the formerly communt states. Cooperative effort in these regions have ben able tofunction on a more uniform basis, with a higher level of political commtment and few tranferissues.
The disparty in levels of economic development in the Mediterranea, in paricular, ha
made uniform action virally impossible and has complicated relations by vire of the nee for
transfer mechansms. We expect tht the existence of similar types of disparities among
115

Table 26
Commonalty of Specific LBMP Problems as Basis for Subregional Groupings
Stte(ecnomic caaciiy-innitiona capaciiy-
ecnomic incentive)'
Defor- Solid Coas lnusui Resourc Sewageesction waste erosion pollutats inventory I mgmi
mgmi
..
.. .
. . .. . .
. .
Anila (3- I -4)
Anti & Baruda (3-2-4)
Arba (4-1-4)
Bah (4-2-4)
Barbados (3-2-4)
Beliz (1-1-3)
Bniih Virgin Is (4-2-4)
Cayma Is (4-2-4):::::::::::::::;:.:-.:::;::::::::=:=:::=:=;::':'::=;=:=;:::-:::::::::::.:.:.:.:-:::::;:::.:.......
jJ~almi#.ln~;¡b:mmmJJJ':Jmtti).:¡ --............. .'.....:..
:,'~..........___h__..._d._.~..,.,::."'__..,__,.d'. -:-:':-:-:':':';':':':':';':':':';':-:':':-.':-:-:-:.. '.:,'Jftttittt;Jt .,.,..... . .l
.Cost Rica (I -2-2) .Cuba (1-3.3)
Domica (1-2-3)
Domi Rep (1-1-3)
French Guia (2-1-1)
. .. . .
. .
....... .:'."'.'-
k,- -~ ____:!!t--
h__, _.".-..,-.~t.
Gutema (1-1-1)
Guyan (1-1-2)
Hai (1-1-2)
. . ...
.
..
_':::::;:::;:::;:;:;:;I:;::::;;;;;;;;:'l-:: '.~ . ~..~.:::;il.;:Ii.l~jI:,tI::::::;;:;::I::::¡;::¡':;:;:::::I;:;:::;:¡:::::¡:;:::::"::::;:::;: ::t:;¡t:::;::::iI:¡:::;:;;;;:I:::j:: :;;:::::::.':::::I:::I:::t:¡';::::;;:::: ~Monimit (3-2-4) .Nct. Antiles (3-1-4)
Nica (I-I-I)Pa (1-1-2)
Pul' Rico (3-43)
Sl Kill & Nevis (2-2-4)
St. Lucia (I -2-4)
St Vinnt & Gren (1-1-4)
Sunn (2-1-1)
Tnn & Tobao (2-2-2)
1\ & Cacos (3-2-4)
Unite Slltes (4-1)
US Virin Is (4--4)
. . ...
.
. ...
.
..
.
.
... .
...
. ...._....__u.................. ... .................................. ................. ..--:::::::::::::::::::;:::;:::::::::;:;:;:::::X::::::::;::". .~. ... ..:.;..... .. .. ..............:.=::
Jy'tg#.~:~;ntt:Jmtt::::::t:f:'ttttJdtt :::::;:::;::::::::::¡:i:¡:;::;:¡::¡::;:¡:--
'S Sen V.C. espiay Table 23.Shadin inicate those silIe suffenn frm at leat 4 of the 6 problems listed.
116

Caribbean states implies a high potential for lack of coherence there. A careful delineation ofsubregions would enhance the potential for coherence among states within each subregion.
Building upon the example introduced in the preceing subsection, we note that Table26 presents the qualitative ratings (from Section V) of individual states' economic capacity,
intitutional capacity, and economic incentive to control LBMP. Of the 37 political units in theregion, there are only 7, or fewer than one-fift, for which at least 4 of the 6 selected LBMPproblems are significant: Colombia, Grenada, Guadeloupe, Jamaica, Martinique, Mexico, andVenezuela (the shaded rows in Table 26). Five of these seven have strong to very strongeconomic incentives to participate in an LBMP protocol, but none has an intitutional capacityrating higher than 2, and the average economic capacity rating for the group is just 1.85. Theaddition of the United States (including Puerto Rico and the US Virgin Islands) and Cuba to thisgroup, however, could make for a kind of "super" subregion that is truly representative of thefull range of problems, incentives, and capacities thoughout the region. Withn a frameworkof overlapping subregions, a "super" subregion constitute on such a basis could be explicitlycharered to playa coordinative role among all the other subregions; to ensure equal accss tothe protocol's clearighouse products; and to promote fairess in the internal allocation offmacial and techncal assistace to all participating states and subregions.
3. High-Level Political Commtment and Oversight
The success of a regional program inevitably depends on the political commitment of itsmember states. Unless members accept the condition of their regional sea as a domestic priorityissue, it wil be difficult to get them to take costly effective action. One indicator of likelypolitical commitment is whether the program grew out of internl or external motivations. Aprogram that develops out of mutual concern for a shared resource is likely to enjoy a greaterlevel of commitment th a program initiated by external players, whose concern andmotivations differ from those of the regional states. The frequency of ministerial-level meetigsmay also indicate continued interest and commtment to a regional program. High-level politicalinvolvement in setting progr objectives and reporting on program implementation also adds
some accountabilty to the program framework.
Both the Baltic and Nort Sea programs were internly motivated, growing out of ashaed perception among regiona states tht the degradation of the marine environment was anissue of great importnce. Minsterial conferences have contributed to the success of theseprogr by producing specific commtments with meanigfu timetables and by encouraging
Contracting Parties to tae actions with greater scope.
Both the Mediterranean and Caribbean programs, on the other hand, have resultedprimarily from external UNEP intiatives. As in the other regions, minsterial-level meetings
117

have contributed to the effectiveness of the Mediterranea program by expediting the adoptionof common measures.
A sense of urgency and concern for the condition of a regional sea, essential to thesuccess of a pollution control program, canot be introduced into regional states by externalorganitions. Many WCR states already consider the risks of transboundary LBMP to be apressing problem, especially because of theats to tourism economies. Even nontransboundarypollution problems may harm other tourist economies, especially those lined by cruise shipbusiness, in that visitors may form a general impression of the Caribbean as polluted on the basisof localized problems. Institutions organd though a Caribbean regional protocol may havean importnt role to play in encouraging subregional agreements to reduce pollution by loweringtransactions costs, channeling foreign assistance effort, and serving as a clearinghouse.
4. Knowledge of Baseline Conditions
All four regions suffer from a lack of adequate baseline data. Without such inormationit is difficult to establish effective program priorities, to gauge program effect, or to adjust effortin response to changing conditions.
Than to the long tradition of environmental monitoring in the Baltic Sea, the natue ofthe region's pollution problem was relatively well understood at the time of the Helsin
Convention's inception. This knowledge of baseline environmental conditions has increased theeffectiveness of cooperative effort in the region.
The baseline conditions of the Nort Sea were not very well understood when cooperative
effort were first undertken. As of 1988, estiates have been developed for the inputs of
nutrients, heavy metals, and halogenated substances, with resultig improvements in
effectiveness.
Baseline pollution sources in the Mediterranean were loosely identified in 1972 by theFAO's General Fishery Council. Therefore, some inormation on the pollutats dischaged intothe Mediterranea and their sources was available in 1975 when the Med Plan was develope.However, the degree of pollutat tranport was overestiated.
CEPPOL has begun to assemble data from each state on its point source contrbutionsto the Carbbea Sea and connected waters. Furer reseach effort are neeed to develop a
better understading of current flows and the associated distrbution of pollutants. A regionamonitoring system would improve the quality of scientific data and deepen our understadingof pollutat dispersal and the potential for damages. Ths task is one of the most importnt tobe undertken by the WCR states. In combintion with IOCARE, the CEP program has taenvaluable first steps in characteriing baseline conditions.
118

Furter improvements could be made by encouraging the scientific community involvedin local monitoring of Caribbean waters to make coarse approximations and estimates of
environmental conditions, suitable for management guidance, rather than waiting for morethorough and exact research results. The World Bank has already taen steps in this direction(Elvis and Colbert 1994). These estimates should be employed in identifying priority bilateralrelationships, delineating subregions, and assisting states in the identification of potential gainfrom trade.
B. Elements of Effective Program Design
1. Clear Goals and Objectives
Effectiveness wil hige on the aptness of program objectives in light of the overall goal.When a regional program is established to improve the quality of the marine environment,objectives should be realistically designed to reduce emission of pollutants into the marineenvironment. A program is ineffective if the successful attinent of objectives does not resutin the achievement of the goal. For example, objectives that call for "confdence-building"exercises do not, in themselves, result in improved marine environmental quality.
All of the cooperative agreements operating in the Nort Sea region clearly state theirgoals. In the case of the Interministerial Nort Sea Conferences (INSC) and the Paris
Convention, objectives have been designed to meet the goal. The Paris Convention calls for theelimination of blacklisted substaces, the strct limitation or elimation of grey listed substances,and the prevention of pollution from radioactive substances in order to attin the goal of
reducing pollution of the Convention area from emissions of land-based sources. TheDeclarations of the INSC call for the development of timetables for the various actions aimingto achieve the goal of protecting the Nort Sea environment.
The goal of the Helsink Convention is clearly stated in the Convention text. Anexesto the Convention identify substaces that Baltic member states should. endeavor to prohibit ormi in order to attin the Convention's goal.
The Barcelona Convention is not very specific in outling its goals and the mea toachieving them. However, the Athens Protocol states its goal as tag "all appropriatemeaures to prevent, abate, combat, and control pollution from land-based sources." Programobjectives are outlined in Aricles 5,6, and 7 and call on Contracting Pares to elimate (Aricle5) or strctly limit (Aricle 6) pollution by substaces liste in Anexes 1 and 2, respectively.Aricle 7, however, limits ths obligation by conditionig the adoption of programs and measuesunder Arcles 5 and 6 on the "capacity to adapt and reconvert existing intallations, theeconomic capacity of the Parties and their need for development. "
119

A clear goal for the reduction and control of LBMP has not yet been articulated by theparies to the Cartgena Convention. In articulating such a goal, states should take advantageof existing intitutions, including bilateral agreements to control pollution, and interntionalorganitions, such as the CEP and the World Ban. We have argued in this report that anexplicitly subregional focus should be incorporated into an LBMP protocol for the WCR. Gainfrom trade are more readily apparent at the subregional, especially bilateral, leveL. Byencouraging states to control the actual incidence of pollution at the subregional level, the risks
of potentially widespread regional pollution can be lowered dramatically. By taking "small"initial steps requiring relatively few but more easily accssible resources, an effective approachto the reduction and control of LBMP in the Caribbean can be built. A careful examintion ofexisting intitutions and programs shows that some small steps in ths direction have already beentaen, providing a firm basis for the subregional approach we recommend.
Clarification of the term "appropriate measures" for LBMP reduction or control, as inthe Barcelona Convention, wil be another importt focus of discussions leading toward aprotocol for the Wider Caribbea Region. It is more likely that effective pollution controlmeasures wil be adopted if states are permitted to choose the most cost-effective approach forany given level of water quality. At the subregional level, WCR states should be given
flexibilty in the adoption of appropriate pollution control measures. Flexibilty wil permitcontrol measures to be one term of negotiation in a trading arangement.
2. Obligation to Adopt Measures: Targets and Deadlines
Effectiveness depends on the degree to which a program's objectives, however aptlydesigned, have been met by its Contractig Parties. Specific targets and timetables for emission
reductions are necessary first steps towards ensring that program objectives result in real action.The practice of including dates and proceures for reporting on implementation in issued
recommendations is also useful in ths regard.
PARCOM issues recommendations to its Contracting Paries and calls upon them toimplement the recommended progr and measures in order to attin adopted objectives. Theeffectiveness of these measures improved with the 1987 and 1990 Nort Sea Conferences, whenan emissions reduction program with speified tagets and time limts was adopted (Wettestad
1992). Prior to the 1987 Conference, the reduction program adopted were vague and reflectedthe position of the most reluctat paricipants.
HELCOM issues recommendations to its Contrcting Paries on the adoption of measuresnecssar to fulfill the program objectives. These meaes usually contain specific tagets anddeadlines for their accomplishment.
Recommended common measures have been adopted in conjunction with the Athens
120
Protocol, addressing 12 of the 28 substances covered in Anexes I and II. However, the contentof the adopted measures is general, with few fixed time limits related to concrete reductiongoals. Only four of these measures include target dates, or periods, for their achievement.Thus the recommendations effectively do not demand that practical action be taen by theContracting Parties. In such a diverse region, however, there may be so many local variablesthat common action becomes virally impossible. In these situations it may be more effectiveto adopt variable standards or differential timetables than to adopt uniform measures that resultin litte or no practical action.
A useful method of accommodating a region's developing states, or states otherwisesubject to drastically different conditions or incentives, is to employ differential timetables forcomplying with objectives, accompanied by mandatory reporting requirements on progress madetoward implementation. In ths way, Contracting Parties are encouraged to tae some sort ofaction toward meeting program objectives, at least in the form of enabling steps, and somerecrd of their progress can be observed.
The differential tietable method can be applied to subregions in the Carbbean. Withguidace from protocol intitutions, subregional groupings of WCR states should be encouraged
to set stadads, identify appropriate pollution control mechanisms, and determine appropriate
timetables for control. Regional institutions, such as the CEP or the W orId Bank, might becalled upon for general advice in selecting these parameters of a program.
3. Efficientlv Designed Progra Measures
Program measures are most effective when they target effuents and locations for whichthe greatest daage reduction can be achieved for the least cost. Reductions across the board,such as those required by uniform standards, tend to be more costly and less efficient than astrategy that bases reductions on the marginal damage done and the marginal cost of abatementfor each substance.
The measures adopted for the protection of the Nort Sea Convention area were notdesigned effciently. Improvements in the mare environment wil be made at a highereconomic cost than necessar (Wettestad 1992). Ths is evident in the apparent preference foruniorm emission reduction stadads over environmenta quality standards, and in the fact thtthe major problems in the region are confmed to several coastal hot spots whie the meauresadopted address the entire Nort Sea area.
Past HELCOM recommendations have not been designed efficiently. As with the 50percent reduction target, past measures have been taen across the board. However, the Balticprogram seems to be moving away from across-the-board reduction strategies. The pre-feasibilty studies of the Baltic Joint Comprehensive Programe focus on the most serious point
121

sources of pollution in an attempt to provide a basis for cost-effective action. Thus, if
HELCOM follows the lead of the Baltic Task Force, measures adopted for the protection of theBaltic Sea should become more effective and efficient.
The measures adopted for the protection of the Mediterranean region are ineffectivelydesigned and often do not result in practical action.
In the WCR case, arguments are now being made for regionwide uniform water qualitystandads and technology-based emission controls. These approaches are infexible and
potentially quite costly. Further, they are warranted only in special cases, where thesholdeffects are strongly suspected or actully evident. As in the case of the Mediterranean, it seemsunlikely that an "effective" protocol wil result from agreement on regionwide standards of these
types. WCR states should be encouraged to focus on relevant margin abatement benefits andcosts. Where water quality stadards are determed to be a more practical approach than thedetermintion of economic damages, states should be encouraged to adopt intrents of control
that allow the stadards to be met in the most cost-effective maner. Although there may be animportt role for technology-based controls on certin discharges or for certin industres, inthe interest of effectiveness, they should not be imposed arbitrarly as the only feasible pollutioncontrol measure.
4. Compliance Mechanisms
Reportg on measures taen toward implementation is a critical element of anysubregiona pollution control agreement. This is particularly tre in a common-poolenvironment, because many states may be reluctant to tae action without the knowledge thatother states are doing the same or at least not subverting their effort. In a unidirectional
pollution case, such as for many Caribbean pollutats, downstream state(s) have a strongincentive to monitor changes in environmental quality to ensure compliance by the upstreamstate(s).
In the absence of physical evidence to determine compliance, paries should be calledupon to report on their level of compliance, in term of legal, regulatory, or other measuestaen toward implementing progr objectives. However, it is essential that reporting be madeconvenient and easy, to ense tht failures to report are not mistaenly interpreted as failuresto comply.
Although there are no physical mechansms to monitor the compliance of ContractigParies in the Nort Sea region, the recommendations issued by the INSC and the Pars
Commssion inc1udea date and procedure for reporting on measures taen. Member statesreport on the implementation of recommendations at the meetigs of the Contracting Paries.
122

HELCOM is becoming increasingly effective at ensuring the compliance of itsContracting Parties. Until recently, reporting on compliance was voluntary. The 1992 HelsinkiConvention has expanded the requirement to report on domestic implementation, as well as theobligation to provide inormation on discharge permits, emissions, and environmental quality.This information is now to be provided upon the request of a Contracting Part or the
Commission, thus improving the Commission's effectiveness in determining compliance.
The Mediterranean regional program is relatively ineffective in monitoring compliance.Although the Barcelona Convention contains an article on "compliance control," it has neverbeen implemented. Thus, there is no effective, binding mechanism to assure the reporting orverification of actions taken.
In the WCR, a regional protocol might contain reporting mechanisms as one way inwhich to reduce the costs to individual parties of gaining information, negotiation, andenforcement ("tranactions costs"). A regional verification authority, deploying environmentamonitoring technologies, could be empowered to determne compliance in the event of a disputeover whether or not a state has made good faith effort to comply.
5. Mechanisms for Trade
Trading mechanisms can faciltate the accomplishment of mutual goals in regions wheremembers' abilties and preferences vary. Where there are substantial differences in levels ofeconomic development, the tranfer of financial resources, technology, and inormation todeveloping states may allow the region to achieve improvements in the mare environment thatwould otherwise be impossible. Such transfers may also serve as inducements for states to adoptgoals and actions more in line with those of their parers. Trading can also improve theefficiency of a regional program, if member states are allowed to exchange pollution reductionresponsibilties. None of the programs studied, however, has utilized mechansms such astradeable emissions quotas to increase program efficiency.
The Baltic regional program has been successful in utilizing the differing expertise of itsmember states. The "lead state" priciple has called upon states with a comparative advantagein deaing with particular substaces, sectors, or processes to be responsible for directing relateprogr intiatives. Ths inovation has provided Baltic states with access to expertise relevant
to the state-of-the-art technologies for paricular industral sectors. The 1992 HelsinConvention reinorces the importce of inormation exchage by expanding the duties of theCommission to include promoting relevant research and reciving, processing, and dissemintingrelevant scientific and techncal inormation.
The Mediterranean program, with its diverse paricipants, presents many opportnitiesfor trade. The Mediterranean program has done the most of the four to transfer financial
123

assistance and encourage capacity building among its members. Most information andtechnology tranfers in the Mediterranean region have focused on environmental monitoring
programs, treatment plant design, and traing for economic policy personnel in the region'sdeveloping states. The potential benefits of trade in the Mediterranean program have not beenfully realized, and other agencies have intervened to encourage and execute transfers.
Trading among member states improves a program's abilty to achieve the mutul goalsof its members. Trading mechanisms become increasingly importnt in regions with diversemember states. A successful program explicitly recognis the differences in the endowmentof its members, and faciltates trading that allows each state to do what it does relatively best.
In ths report, we have developed a styliz model of bilateral trade in pollution controlto clarfy the opportnities for gains in the Caribbean (Appendix C). These opportnities arediminshed to the extent that propert rights in a clean marine environment are obfuscated;
scientific, techncal, and economic inormation useful for characterizing marginal abatementschedules remains undeveloped or is kept proprieta; barrers to negotiation among polluter
and pollutee remain in place; and trading relationships are weakened by indequate enforcement.All of these hindrances to gain from trade are appropriate focuses for LBMP protocol
institutions .
6. Adequate Financing Features
The efforts involved in reaching, maintaing, and evolving regional agreement are costlyin themselves, and the measures required to implement program recommendations are muchmore so. The inclusion of adequate financing mechanisms is therefore indispensable forprogram success.
Financing of program organition and secretariat costs on the basis of equalcontrbutions or on shares pro-rated by economic capabilty (or with supplemental contributions
from host members) is simple and expedient as long as these costs are relatively modest. Thisformula, however, does not take account of the relative staes, responsibilties, and capabiltiesof the members with respect to the specific problem at hand. For example, both the percentageof France's population in the Mediterranean coastal region and its share of economic capacityin that region are less than one-thd of its required share of payments to support the program'soperating costs. Ths can lead to problems if, as in the Mediterranean, secretaiat and
adminstrative costs grow large. These problems may be exacerbate where fmancial tranfersbetween states are involved and when the mechansms for these transfers lack transparency.
¡.
r
Implementation of measures agree to by the program, such as installation of sewagetreatment facilties and introduction of modern industral production or control technologies,is a different problem. These measures wil cost orders of magmtude more thn cuupciative
124

program expenses. Reliance on domestic financial resolve for compliance seems unavoidable,although measures for international fincial assistace wil be needed where intra-regionaleconomic discrepancies are large. We have begun to see already an interest by the World Ban,GEF, IADB, and UNDP in assisting in the financing of marine pollution control facilities in theCaribbean.
The Baltic's Joint Comprehensive Programe (JCP) appears to offer a good example ofboth flexible targeting of regional priorities and realistic consolidation of financial resources toaddress those priorities. How successful it wil be in practice remain to be seen, and ths wildepend significantly on success in mobilizing and managing fmancial resources. The use ofexisting multilateral financial institutions in the region as executig agencies promises smoothand competent fmancial mangement though well-understood mechanisms. Greater tranfers
(from west to east) wil be required in the Baltic, but the regional program can also help guidethe allocation of assistance from outside the region though externl intitutions such as theWorld Ban, GEF, and EIB.
The Mediterranean program also has shown some success in shaping the fudingpriorities of external donor organitions, though to some degree ths has been in reaction tointiatives outside the program arising in part because of dissatisfaction with the program'seffectiveness and lack of fmancial transparency. The Mediterranean Trust Fund mechansm hasnot been notably effective in achieving regional program goals, though it should beacknowledged that it was not intended to finance domestic implementation and capital investmentprojects.
Based upon our analysis of the Baltic, Nort Sea, and Mediterranean cases, it has becomeapparent that a key to effective finncing is to sustain the program's credibilty by keeping itsgoals and recommended measures in line with the tre priorities of its members and by notallowing its recommended measures to outstrip realistic fincial means.
In the Caribbean, program funding might build upon the foundation already establishedthough the CEP . We recommend that small steps be taen, starting with a focus on theregion's existing priority tranboundary marine pollution problems. If waranted, the programand its resources can be expanded as experience in catalyzing subregional agreements is gained.Ths kid of "ramping up" approach is more likely to elucidate relevant protocol "scaleeconomies" and to build confdence among Contracting Paries than a more grandiose effortfrom the outset.
7 . Effective Decisionmaking Process
The means by which measures are adopted is likely to inuence the effectiveness of theprogram. Seeking consensus ensures broad-based support for adopted measures but tends to
125
drive the content down to a level that is palatable to the most reluctant parties (Sand 1991).Although the compromises necessary to reach a consensus may demonstrate a high capacity forpolitical problem solving, they often result in ineffective pollution control measures. Strictinistence on a unanious choice can be an obstacle to progress.
Conversely, measures adopted without consensus tend to be more substative, but may
also discourage a high level of consistent participation. Without consensus, and with nosupranational authority to enforce adopted measures, such an approach is likely to introduceproblems of non-compliance.
The approach adopted by the Paris Convention represents a feasible compromise.Consensus is sought, thus building support for adopted measures. However, if the ContractingParties canot reach a consensus, measures are adopted by a thee-quarters majority vote. Thus,Contracting Parties are not confined to the preferences of the least enthusiastic participants, andan "opt-out" opportnity is available.
In the Caribbean, the trade-off between the level of participation in the program and thelevel of action called for in adopted measures should be explicitly recognied and addressed inlight of a clearly articulated overall goal. Instead of focusing on consensus or majorityagreement over uniform stadards, the Contracting Parties might usefully decide on procedures
for clarifying the legal rights to a clean environment and reducing states' costs of inormationgathering, negotiation, and enforcement. These procedures can then be applied in any particularsubregional case.
8. Adaptabilty Over Time
The abilty to adjust the program to changed circumstances and improved knowledge isvital to its effectiveness over time. The method of keeping the framework convention quitespare and leaving program elaboration to subsequent protocols and recommendations is usefulin ths regard. So, too, is the periodic oversight and intervention of high-level political authority
from among the paries.
All four programs exhibit relatively spare framework conventions, leaving programelaboration to protocols and recommendations. The Baltic program introduces furteradaptabilty by devising specific priority projects and tasks without the need to adopt formalrecommendations. Both the inormal and formal interplay between the INSC and theCommission in the N ort- East Atlantic region help the Nort Sea program adapt to changingcircumstances and knowledge.
To a large extent, adaptabilty is related to decisionmaking rules. Reliance on consensushinders innovation and adaptabilty. Decision mechanisms that permit or specify variable
126
timetables or the ability to opt-out or opt-in on particular measures, as in the Nort Sea region,also enhance adaptabilty. So do mechansms that encourage the formation of subregionalcompacts and projects, again as in the Paris Convention.
The constant public and political pressure assured though high-level political oversightand involvement, as with the INSC and Baltic Ministerial meetings, encourages programadaptabilty. So does pressure from NGOs and public interest groups that is faciltated byprogram transparency and accessibilty.
Both the Baltic and Nort Sea programs have demonstrated adaptabilty with adoption ofrevised 1992 conventions, but even greater adaptabilty would not require so fundamental a
change at the framework leveL. There is some evidence that the adaptabilty of theMediterranean program, and, by implication, tht of the Caribbean program, may be hideredby their being embedded in the United Nations system. In the Med Program, for example, theabilty to generate baseline data was hindered to some extent by the inclusion of all parties inthe study effort, rather than relying on research intitutions that were already functionigeffectively in the region (Broadus et al. 1993; Skjaerseth 1992). There is already someindication that the CEPPOL program is following a similar approach and suffering simarconsequences (see Section II, especially footnote 6). Another intitutional problem encounteredby the Med Plan was a disagreement over funding between UNEP and UNDP, which caused athee-year delay in the implementation of a Priority Action Program (Broadus et al. 1993); inths respect, the negotiating parties would be well advised to learn what they can about theexperience to date of the GEF project on ship-generated waste in the WCR, which is a jointeffort of UNEP, UNDP, and the World Bank.
None of the thee earlier programs exhibits adaptive featues that specify uncertintiesor changed conditions whose resolution would lead to specific adaptation in the program. These,too, would be useful features.
C. Dynamic Measures of Effectiveness
1. Level of Compliance
Program effectiveness is in part reflected in the proportion of issued recommendationsthat are actually implemented by the Contracting Parties. If the program merely issuesrecommendations that none of the parties adopts in practice, then the program may be deemedineffective.
Although Nort Sea states report on the measures taken toward program implementationat the meetings of Contracting Parties, no coherent record of their comments is compiled by theINSC or P ARCOM, making it is impossible to monitor the effectiveness of the program in this
127

respect.
Mechanisms to monitor the compliance of Baltic Sea states have been put into place, butit is stil difficult to draw any concrete conclusions on the present degree of compliance. Theavailable information indicates that only 12 of the 47 LBS recommendations issued between 1980and 1991 have been implemented by Contracting Paries, implying that the regional program stilcannot be considered completely effective in this respect.
It is very difficult to determine the degree of compliance with the Mediterraneancooperative program. Despite the obligation to report on measures taen and results achieved,Contracting Parties show a great reluctance to provide such information (Skjaerseth 1992).
Requests for inormation on land-based sources and domestic legislation have received little orno response. Furtermore, there is evidence that most Contracting Paries have failed to adoptdomestic laws and legislation reflecting the provisions of the Athens Protocol and its Anexes
(UNEP 1991b). The available inormation suggests that the level of compliance is quite low.
Weare greatly concerned that if an LBMP protocol for the Caribbean follows along thelines of the development of the Mediterranean program, that compliance wil be predictably low.This lesson provides one of the strongest arguents for a subregional approach in whichdownstream WCR states have imediate incentives to seek pollution reduction from upstreamWCR states and a forum to which they can turn, at low cost, to see that such reductions can beimplemented.
2. Achievement of the Program Goal
A regional program can be considered effective if the regional environment has improvedrelative to the hypothetical situation that would have occurred without the regional program.Knowing the intial environmental conditions that the pollution control program is designed toalleviate is essential in this respect.
Following the agreement by states of the Nort Sea region to reduce pollutant emissionsby 50 to 70 percent by 1995, it appears that the goal of reducing pollution from land-based
sources is progressing toward being achieved. Although the physical evidence to support thsconclusion is scant, there is a general sense among expert that there has been someimprovement in the Nort Sea environment. In fact, the Quality Status Report produced inconjunction with the 1987 Nort Sea Conference noted that "the few sufficiently long time seriesavailable indicate that with a few exceptions, containation has been reduced or at least has notincreased over the last decade" (as reported in Wettestad 1992).
There is some evidence that HELCOM has been effective in achieving its goal andimproving the condition of the Baltic Sea. According to HELCOM experts, the Baltic
128

environment would have been much worse off in the absence of the Commission's activities
(Rodionov 1992). This view is corroborated by the official statement of the Finnsh Delegation,which concluded that "the state of the Baltic Sea today is definitely better than it would havebeen without the many efforts and concrete . . . measures of the Baltic Sea states" (Delegationof Finland 1990).
There are no reliable time series data that would indicate changes in marine
environmental quality resulting from Med Plan activities. The best available inormation isprovided by UNEP's 1989 "State of the Mediterranean Marine Environment" report (UNEP1989b), which gives a fragmented and uncertin account of the condition of the Mediterraneanenvironment. There is some evidence of localized improvements, but how these were inuencedby the Med Plan is unclear. Interviews with regional scientists indicate that they feel that thelevel of pollution has remained roughly constant over the last decade, while coastal populationand industr have grown steadily (Skjaerseth 1992). Thus it appears that the effects of increasesin population and industr may have been offset by the actions taen from 1976 to 1990. Theremay thus be some basis for believing that the Mediterranean marine environment would havebeen worse off without regional cooperation.
Progress has been made on characterizing baseline environmental conditions in theCaribbean. Further research wil be necessary, and ths research should focus on marine areas
that are seen to be priorities in terms of the incidence of actual transboundary pollution effectsor acute localized problems.
3. Increased Domestic Abatement Effort
If a regional program is operating effectively, one would expect member states to engagein greater pollution abatement efforts than they would without regional cooperation.
The pollution abatement efforts of the Nort Sea and Baltic states are probably at ahigher level than would have occurred in the absence of regional cooperation, especially withrespect to the adoption of the 50 percent emissions reduction target for the Nort Sea region.It is reasonable to assume that no single state would adopt so strgent a measure withoutreciprocal action from other discharging states.
Domestic abatement effort in the Mediterranean region are not obviously greater thanthey would have been without the Barcelona Convention and its Protocols. It can be argued thatthe effort of several states (specifically Greece, Albania, and Egypt) were affected by theregional program, because they embarked on vigorous new public adminstrative campaigns tointegrate environmental considerations into traditional coastal zone development and economicplanng. However, many polluting states had established domestic environmental authoritiesand legislation prior to the Med Plan's inception in 1976. Many actions taen during Med Plan
129

years were taen at the domestic level and likely would have been taen anyway. Although theMediterranean would have been worse off without regulation, the Med Plan probably onlyaccounts for a minor part of the achievement witnessed (Skjaerseth 1992).
WCR states already recognie the existence of LBMP problems, and many have begunalready to develop the infrastructure, including the legal institutions and technological controls,to begin to deal with these problems. An effective LBMP protocol would build upon thesenascent efforts, tang small but certin steps to move in the direction of pollution prevention,reduction, and control.
D. Sumary
At ths juncture, it is not yet possible to evaluate the effectiveness of a protocol on LBMPcontrol for the Caribbean. We can, however, say somethg about the general features andelements of a protocol that might be incorporated to improve its potential for effectiveness(Table 25). The WCR resembles the Mediterranean as a regional sea, suggesting that manylessons can be drawn from the Mediterranean experience. Experience with the control of LBMPin other regional seas can provide useful lessons as well, paricularly in the areas of programfinancing (Baltic), political commitment, (Baltic, Nort Sea), statements of goals (Baltic, NortSea), targets and deadlines (Baltic, Nort Sea), and compliance (Nort Sea).
We argue, in this section, for a careful consideration and delineation of subregions, basedon shared LBMP problems of a localized nature, and, where relevant, transboundary pollutioneffects. In the latter case, protocol mechanisms should build upon existing bilateral
arangements, if these are seen to be effective in themselves. A WCR protocol can also utilizeand build upon the resources and capabilties of existing intitutions for scientific research,monitoring, and clearinghouse fuctions. These intitutions should be expanded, or contracted,incrementally to determe their most appropriate and efficient scales of operation.
The rights of a state to a clean marine environment should be clariied with the
protocol, enabling staeholder states to seek beneficial reductions in actual or expected LBMPfrom source states. The Contracting Partes should employ the protocol and its intitutions asa forum with which the agreements to reduce LBMP, based upon transboundary effects orcommon needs, are faciltated, thereby reducing transactions costs (see especially Appendix C).The protocol should encourage states to adopt cost-effective intrments for pollution control,including tradeable pollution permits, emission charges, or technology-based controls, wheretheshold effects are apparent.
130

APPENDIX A
Data Tables
131

Table A. iEcoic and popaton Data for WCR Sta
Gros Domestic Prouct IGDPl' Population.
State T ota11991 Per caplta 1991 Avg. ann. Totl 199' Ann. Denty(SUS millon) ($US) ~rowt rate Gro (pe~
~) 19891 (%) 1m km95'
Anuill 47.4 680 6.5 680 0.6 75
Anaua-Barba" 424 660 1. 64 00 0.3 146
Arba" 85 1360 10.' 63 00 0.2 32
Bahamas" 260 10 20 3.0 24700 11 '8Barbdos" 180 700 14.01 26 00 0.6 612
Belze 420 2165 9.0' 190 00 2.03 8.3
Bñtish Vil'in Is." 133 1060 2.0 1200 1. 80
Cavmn Is." 670 23 00 4.4 26 00 4.f 100
Coombia 41700 126 3.7 32 30 00 1.66 31
Cos Rica 563 1810 3.1 3 04 00 2.41 60
Cuba" 17 00 1 58 120.01" 1061000 0.89 96
Dominica 174 2100 2.1 85 00 1. 113
Dominican ReD. 7148 976 1. 7 170 00 1.98 148
Fr. Guiana" 421' 439' - 98 00 3.4 1.
Greda" 25 300 10.41' 84 00 10.41 247
Guadeloooe" 1100' 3 30 - 34200 0.8 194
Guamala 935 98 1. 9 20 00 2.88 85
Guvna 349 435 7.0' 80 00 0.94 4.1
Haiti 2641 39 io.n 6 490 00 2.03 236
Honuras 300 567 2.7 514000 3.00 46
jamaica 3497 1431 1.6 2 420 00 1.02 224
Martnlau" 200' 6 00' - 34 00 0.9 321
Mexico 286 628 3321 1.2 84 490 00 2.06 44
Monrr 73 580 13.5' 1200 0.3 120
Netlrltnd 1,40 7,60 1.5 183,00 01 191Anlles
Nicaraaua 1736 456 11.91 3 68 00 3.74 29
Panama 554 2248 0.5 2.420 00 1.90 32
Puert Rico" 2280 620 2.t 3 30 00 0.1' 36
SL Kitt & Nevis" 142 350 6.8 40 00 0.3 147
SL Lua" 25 165 2.5 153 00 2.6 251
SL Vincnt f 17 1,50 3.ft 113,00 1.4 332GreneSuñname 1941 4513 12.5) 420 00 1.86 2.6
Tñnlda & Tobo 4939 394 14.41 1 240 00 1.08 242
TUlU & Calco" 68.5 500 - 900 2.3' 21
Unit State 5610802 22 219 2.6 249 98 00 1.03 27
U.5. Viraln Is." 120 1100 - 99 00 10.31 28
Venezula 53441 2705 1.5 1932000 2.12 22
WCR5~3r
Total:~~.:44 45 00
'Src: WR1199 exæpl for contr wh note "b" appie."src: CIA 199 for polali. CIA 1992 for GDP.
'GNP.
'1987.
,. ab micte deit CN 22 inbi island of a io of abo 700 isnd; hoever, polali is heviy cotrled on New Pi, whde ap 700 peliml.
132

Table A.2land Areas, Coastlnes, and EEZ
Land 1-rea WCR Coastline' EEl(km )'
Km As % of YearState nmtotal (~~ cllarenot 100
Anauila 91 61 NO
Antiaua & Barbuda 440 153 200 1982
Aruba 193 68.5 NO
Bahamas 10070 3542 NO
Barbados 430 97 200 -1979
Belize 22 960 386 200 1992
British Viroin Is. 150 80 NO
Cavman Is. 260 160 NO
Colombia 1 038 700 1760 55 200 1978
Costa Rica 50 660 212- 16 200 1975
Cuba 110860 3735 200 1977
Dominica 750 148 200 1981
Dominican Ren. 48 380 1268 200 1977
Fr. Guiana 89 150 378 200 1976
Grenada 340 121 200 1978
Guadelouoe 1760 306 200 1978
Guatemala 108430 8s" 22 200 1976
Guvana 196650 459 200 1977
Haiti 27 560 1771 200 1977
Honduras 111 690 591- 72 200 1980
Jamaica 10630 1022 200 1991
Martinioue 1060 290 200 1976
Mexico 1 923 040 2 070- 21 200 1976
Montserrat 100 40 NO
Netherlands Antiles 960 364 NO
Nicaraoua 129 240 478- 53 NO
Panama 75 990 624- 25 NO
Puerto Rico 6959 501 200 1983
St. Kits & Nevis 269 135 200 1964
St. Lucia 610 158 200 1964
St. Vincent & Grenadines 340 64 200 1983
Suriname 161 470 366 200 1978
Trinidad & Tobaoo 5130 362 200 1963
Turks & Caicos 430 389 NO
United States 9 166600 2 625- 13 200 1963
U.S. Viroin Is. 349 186 200 1963
Venezuela 862.050 2800 200 1978
NO not declared
'Source: CIA, 1994.-Source: Wordmark Encyclopedia of the Nations: Americas. 1964.'Source: Fenwick 1992.
133

Tab
le A
.3
Sel
ecte
d In
dica
tors
or
Land
-Bas
ed M
arin
e P
ollu
tion
Inpu
ts
.. w .t
Hurnn SetUemel1
A"r
1ullJ
'"M
lnl~
& M
onuf
oclu
~D
efor
tati'
Contrrr err
Popu
lati
199
." 0
1 po
with
No. ollocloslitallalll
Fors
t%
Ann
. ac
cess
toE
xton
t or
Len
d U
i.A
nnua
A9.
Inpu
ll_s
%or
Ch. In
sew
rae
As%
As%
Iota
lfo
rest
e~1
.m~3
or01
a_a"
,a~r
i~l
'(1
99)
1981
.90
Tot
alU
':,%
In~~
\,U
rbR
ur01
Foo
Sugr
liii
Ch.
Pape
Min
in(x
100
)'W
CR
Tot
al% Cl
F.rt
",nn
.pr
.al
cSo
ft=
nla
ndla
nd(k
g!P.
.LO
mk
(~~,
ha(m
oL
~io
)._
...7
NA
100
100
NA
NA
NA
91N
AN
AN
AN
AN
AN
AN
AN
AN
AN
AN
AN
AN
A
Anii &
64'
3110
010
0N
AN
A4
44O
.a'
-N
A5
-4
I-
--
-IG
0B
arb
An
63'
NA
100
100
NA
NA
NA
193
O.a
'N
AN
AI
22
I-
-a'
Aoh
ama
247"
64.3
100
1mN
AN
A9
ioom
""i.'
-N
A27
iN
.N
.N
AN
AN
AN
A32
/1.9
\
Bar
b26
t37
.910
047
.4N
AN
A5
430
0.0'
IG2'
NA
8i
53
4N
AN
AN
Aa'
BaI
ze19
048
.810
064
7G22
2322
80
2.5'
8917
80'
145
21
--
44m
.?\
Brll
lh \J
ln i.
.12
NA
100
100
NA
NA
NA
150
7'N
AN
AN
A5
-7'
NA
Co~
nla.
26'
NA
100
100
NA
NA
NA
26a'
NA
NA
NA
NA
NA
NA
NA
NA
NA
NA
23'
NA
Coa
32 3
0G
7.2
925.
464
1817
I 03
8 70
05.
2'10
47
ix29
i51
27
17I
49/O
.G\
Cot
a R
l30
444
.360
.820
.810
093
1850
66
10.4
'21
236
87"
19i
i2
-34
".6\
Cub
a10
6012
.810
073
.110
068
IG11
086
30.3
'15
8N
A43
319
225
75
217
m.9
\
Ool
ri85
'N
A10
010
0N
AN
A21
750
13.0
'N
AN
A7
4i
41'O
.G'
~n7.
170
60.4
100
5895
75is
48.3
829
.9'
603.
297"
191
I-
2-
--
13(2
.5)
Fre Guiana
98'
NA
100
85N
AN
AN
A89
.150
nel,'
NA
NA
NA
NA
NA
+N
AN
AN
AN
A82
0
G",
na64
'32
.210
010
0N
AN
A15
3426
.0'
NA
NA
G7
23
95.
0
Gua
pe34
2'48
.410
044
.2N
AN
A10
.11.
760
5.0'
NA
NA
5.3
NA
NA
+N
AN
AN
AN
A40
NA
Gua
lela
9.20
38.4
57""
.72
5226
108.
430
17.4
'71
5.10
015
+N
A+
NA
+N
AN
A40
(1.G
)
Guy
ana
8031
9938
.164
3622
196.
852.
5'30
6522
NA
NA
NA
NA
NA
NA
+83
(0.1
)
Hal
~6,
9030
.310
029
.244
1734
27.5
632
.8'
3N
A15
-+
NA
+N
AN
AN
A4
(3.9
)
Hon
5140
41.1
91.3
2289
4223
II I 8
918
.3'
143 .c
192
82
2i
i34
".0\

Table A,3 (contd.)
.. w VI
Human Senlets
Aan
cultu
re1."" & Monulac\Jri
Def
orta
ti i
Con
lrfT
etPopll 19l
% o
r po
p w
tlli
No. or lactoiiilal1l
Fori
l%
Ann
. aceSl 10
Ext
ol o
r la
nd U
i.A
nnua
Ag.
Inpu
ll.1
%or
Ch.
inlo
w.
Ai%
Ai"
Iota
lro
rilo
r~'3
oror
......
fg¡'
fg¡'
(19l
)19
81.9
0
(X;m
),u'
:n'
%in
~;:"
Urb
Ru
OU
Foo
Sugr
lB
_1C
I.Pa
peM
inIn
gW
CR
Tol
al%
Clp
- F.
rtre
nn.
pi.
.icSo
ft
=ß
Iond
land
~P.
ilD
mk
(~i
(mol
~Io
)
Jiilc
2~2O
52.3
100
55.~
1~5
10 lI
2~.9
'94
i ~:i
30i
179
23
I28
15.3
l
M.r
lniq
uo34
80.5
100
69.0
NA
NA
8.1
1,10
08.
0'N
AN
A8.
2I
++
NA
NA
NA
NA
26'
NA
Mex
ic84
~90
71.3
~18.
585
129.
0I 9
23 0
412
.9'
69~5
00"
25~
1812
~28
-24
11.2
1
Mon
ii.m
il12
NA
100
100
NA
NA
NA
100
0.0
NA
NA
NA
NA
NA
NA
NA
NA
NA
NA
~N
A
N.lI
nda
183
NA
100
100
NA
NA
I96
0.0'
-2.
0013
22
-3
--
-0'
-A
nalli
Nlc
niu.
368
8125
2.~
32-
3012
0 25
10.7
'29
NA
17N
AN
AN
AN
AN
AN
AN
A35
11.7
1
Piin
amø
2~2O
53.7
04.8
9.5
100
68II
75 9l
8.5'
SO5
009
I10
--
210
-54
11.7
1
Puo
Ric
o33
071
.210
080
NA
NA
1.~
9104
1~.3
NA
NA
~1~
72
211.
5
Sl K
lni &
Nev
i.4l
04.9
100
100
NA
NA
826
917
.0'
NA
NA
1~-
52
2-
--
170
Sl lu
c15
304
.~10
010
0N
AN
A1~
610
20.0
'N
AN
A9
..~
I3
1313
.8l
SL V
inen
l &iit
2~.6
100
100
NA
NA
1934
12.0
'N
AN
A9
-10
i3
--
-~1
(2.1
)G
roed
noi
Surn
a~2
O85
.293
.8~1
.564
3610
161,
~70
~.3'
2063
6'13
-II+
NA
NA
NA
NA
+97
(0.1
)
Triidd &
1.2~
69.1
100
69.5
100
922
5.13
023
.~'
672.
303'
392
~5
713
1-
44(1
.9)
Tob
'"
Tui1 & Calcoa
9'N
A10
010
0N
AN
AN
A~3
O0
NA
NA
NA
--
--
--
-0
NA
Unl
lod
Sla
i.a24
998'
"75
.2~.
76
99.~
"2
9166
6620
.599
4 5l
"21
72'
119'
151'
2'2'
2~'
2194
'31
.412
.51
US
Vi"
,ln I
i.99
NA
100
100
NA I NA
NA
352
6N
AN
AN
A1
-I
--
--
8N
A
Ven
zuel
a19
320
8493
36.9
97 I 72
588
2 05
4.4'
116
8 1~
3"39
313
48
8~1
239
11.2
1
NA
= In
form
atio
n no
t ava
ilabl
e+
= k
now
10
exIs
t, bu
t exl
enU
num
ber
not r
epor
ted
- = reported as zero or. non.existent
'So: Worl Re.oun:.. 1994-5 (unlei ollae nolod In lnuol cena).
2pAHO eiamiisa Ihl C 10% ollow IYI_iln laan Amn colrl ti. iile lrltl plenll, and "'I only 5-10% olll colele waitato rel odl. lrlm (PAHOIWO 1992). For li CARICOM colrl (AntiLI & Barb, BalilN.
Bar
b. B
.Uze
, Don
i. D
olrn
R.p
i, G
ri, G
u, H
Iia, J
amlc
, M.x
lc, P
u R
I, S
I. K
itt &
Nlla
, SI.
luc,
SI.
Vln
l & li
Gl'a
, Sur
, Trt
& T
ob. a
nd V
--uo
), a
ral
PA
HO
lury
co
"'I o
nly
2% 1
0 16
%oIlh polall Ii i..od by sa IYlla (UNEP 199).
'So: Encyclood Brilanr 199. (Ag lni nili an foilr.)
'So: UNEP Regio., Owl\w, 199. (Pull clti .. lo.. av, 198-&).
:So: CIA Wor Fac/ 1993.
So: C
IA W
or F
_ 19
90.

Stale Fish Non.Foo Uses Ash Expo Ash Imp Foo suppy fro fishCatc(metrto)
Metr As% Metr As% As%O( Metr As% Per TotlTon 0( Ton 0( Tol Ton O(Tota capi (metr
Catc Catc Foo Foo (kglyr) to)Su Sup!r froFi Fish
Anui NA NA NA NA NA NA NA NA NA NA
Antiua & Barb 233 0 0 201 8.6 5.0 1.90 47.2 62.6 4,04
An 48 0 0 30 6.2 1.4 1,713 79.1 35.5 2,167
Ba 764 18 " 1 4,08 53.4 65.8 2,33 37.5 24.8 6,2Bar 4870 1,33 17.5 105 1.4 1.4 4,151 54.7 29.5 7,582
Bee 1595 0 0 766 48.0 54.5 575 40.9 7.6 1.40
British VlIln Is. 133 0 0 NA NA NA NA NA 86.0 1,33
Caym Is. 613 0 0 574 93.6 72 757 95.0 324 796
Co 95,897 2 " 1 37,591 39.2 42.3 30,56 34.4 2.8 88,871
Cola Ri 20,64 0 0 17.191 83,3 113.3 11,72 77.3 5.1 15,172
Cu 203,85 37.38 18.3 2279 11.2 11.4 56,571 28.3 19.1 20.240
00 667 0 0 0 0 0 8S 56.3 21.1 1,52
Oon Republic 18,26 0 0 1.182 6,5 2.0 41,50 70.8 8.4 58,58
Fre Guiana 6.28 0 0 4.20 67.0 90.0 2,352 50.2 49.3 4,676
Gre 1.832 5 "1 59 3.2 1.9 1,38 44.0 34.8 3.155
Guape 8.373 0 0 42 0.5 "1 8,279 49.8 43.4 16,610
Guatela 4.60 0 0 3,112 67.7 57.0 4,183 76.7 0.6 5.456
Guyna 36.242 0 0 3,471 9.6 10.6 0 0 41.3 32,771
Hait 7.867 0 0 166 2.1 "1 19,148 71.3 4.2 26,84
Honras 17.519 1 "1 13,53 773 26.0 2,03 40.0 1.0 5,123
Jam 10.33 0 0 432 4.2 1.0 34,65 77.8 18.7 44.56
Maniue 3,251 2 "1 20 6.3 1.4 11,96 79.7 42.1 15,00
Mexic 1.414.332 402,813 28,5 141,09 10.0 15.5 19.274 2.1 11.0 911,911
Montsl 115 0 0 NA NA NA NA NA 10.5 115
Nelh Antill 1,20 0 0 29 2.4 "1 3,60 75.5 27.3 4.77
Nicua 4,108 0 0 1,824 44.4 80.0 0 0 0.6 2,28
Pana 157.63 116,631 74 13,93 8.9 38.7 9,157 25.3 15.3 36,167
Pu Ri NA NA NA NA NA NA NA NA NA NA
Sl Ki & Nev 1.700 0 0 221 13.0 11.6 424 22.3 45.1 1,90
Slluc 825 0 0 21 2.5 " 1 1,587 66.4 18.2 2,39
Sl Vinl & 6.302 0 0 5,700 90.4 496.0 54 47.5 10.8 1,149
GrenesSur 3.795 0 0 1,158 30.5 42.2 105 3.8 6.6 2,741
Tri & Tob 7.967 2 "1 1,351 17.0 10.5 6,2 48.6 10.6 12,90
Turs & Calc NA NA NA NA NA NA NA NA NA NA
Unite Slales. 4.269,416 1,072,802 25 88,070 20.7 27.7 1,30,60 41.0 6.8 3,196,614
Gul Cost" 737,582 NA NA NA NA NA NA NA NA NA
US VlIln Is. 763 0 0 NA NA NA NA NA 7.1 763
Venue 315,69 21,96 7 27,23 8.6 10.2 337 "1 14.1 26,82
Table A.4
Selected Fisheries Data, 1990
So (exlo us data): FAO YeBrl Rsry 51sli 1992 (FAO 1993a),'s: Rsris of th Unied 5/B/85, 1992 (NOAAMFS May 199).
136

Tab
le A
.S
Sele
cted
Eco
nom
ic D
ata
on C
ount
ries
and
Ter
rito
ries
of
WC
R, G
roup
ed b
y C
EPP
OL
-Des
igna
ted
Subr
egio
ns(S
US
199
1 un
les
othe
nvis
e no
ted)
- u: ..
Con
lrfT
erG
OP
Per
Ag
Min
ing
Mfc
lgTou.m repts:
Lal
9tC
ome
Sub
regi
on I
(miii
on.)
'ca
pita
a'as
%of
a. %
ofIn
$ m
ilio.
and
Secl
oG
OP'
% o
f G
OP'
GO
P'G
OP'
8' %
of
GO
P'
Cub
a17
,00
1,58
16""
4-'1
39'"
$30
1.8%
man
ufct
g."
Indu.trl dlverlftl a high prty (no colrled In pape). Touri.m.ee 8. larg.t
(GN
P)(G
NP)
pole
tll g
ro s
eclo
larg
e In
vest
mts
In
cost
rll,
Mai
n ex
po: .
ugr
cane
(w
o.Ial9t expo), nicel (four1 largt sourc), fih' For gros prl.ng $5 mil
In
Inveslmls over sevl yea~ for tori.m and rete sers secto.'
Mex
ic28
6,62
83,
321
92
23$4
,355
1.5%
lre
Lal9t for exchnge earn: peti, bo asse plnts, tom." 61% of
woor In ser.. Indu.Ii.: foo and been., lo, chicls, Ir end slel,
peti,
mIn
in, I
extil
e en
d cl
olhl
ng, l
nnsp
o eq
pl, t
om. M
ii re
ti an
d di
vng
deelng raply.' Uncnty over NAFTA In 1993 "nked to iha de In for
Inveslmls. Go puufng $5 miD ental caig, Inng re of wate and
a- cotr; $23 mni bute for 1993 to Impte sew and. driki wate lo to
elo US bo. estimate $1.6 bln 10 ba ipet on poul cotr eqt as of 199.'
Uni
te S
tate
.5,
610,
802
22,2
19t'
t'19
'S4
9,55
1c1
%m
anul
aclU
r.Ea of lh seclD rese abo 19% of GOP. Most po, i: an ie
Ing
& n
ocall adnc ecy In wo. MaJo In.tr: peti, sli, moto ve, ae
ftna
ncl
spa,
Ie,
chi
cls,
ellc
, foo
prS
iln, c
oum
go,
li, m
ISe
M,'
Sur fo pi fih catc of 4,4 mmio melr Io.
5 U
S G
uK75
2,rx
15,7
10N
AN
AN
A$2
0,00
2.6%
NA
Th
99 U
S G
ul C
o.ta
col
l CO
114
,00
rr e
nd e
re h
o 10
15.
6 m
l pe,
or
S%
Cos
ta s
lale
.of
lh e
ntire
US
pot
i (54
% o
f whi
c re
ids
In c
osta
l cot
ls).
SS
b8
ipet
only
ennll on doesti tr In Albama Fl, iou.lana. Mlsilslp, and Texs. whic Is 18%
of lo
tal U
S en
nu d
o.ti
lrel
exp
etu.
. GuK
of
Mex
fih
cat
c re
17.
7% o
flh entire US ftsh catc by weht end 19% (or $&1 minio) by Y8... In 199, :. 160 ou
cotin
etal
she
lese
s w
e In
pru
cll I
n lh
Gul
l, yi
in r
e 10
lh U
S Fe
dT
resu
r of
ebo
S3
b1lo
..

Table A.S (contd.)
- w 00
Con
lrfT
err
GD
PP
er c
ap!.
Agr
iultr
øM
inin
gM
lclg
Tourism recipts:
Lar
gest
' Com
ents
Sub
regi
on II
(mili
os)'
Is G
DP
'as
as%
olas
%01
In $
mili
ons
and
Sect
o%
of
GD
P'G
DP'
GD
P'as
% o
f GD
P'
Bel
ize
420
2,16
523
113
$95
23%
agri
ultu
reSugar Inustr mot cot-ellecll In English-speking Caribbn. Cltns, bana, ftsh, Umb,
garm
als
o Im
pot e
xpo.
Joi
nt lh
tmp-
farm
lng
vent
u w
ith U
S, I
n re
spo
10ov
hlng
. Tou
m b
oing
and
coi
dbl p
oten
UaI
rei
ns.'
Goa
mt r
eslla
s lo
cot I
nasl
man
t tos
m o
pUe
for
Bee
øns,
enr
as f
or 1
n1llm
t In
larg
prts
.'C
as ia
Ric
5,63
51,
930
16-
19'
$331
6%ltd
eM
ain
inus
trs:
foo
prsi
ng, t
exU
alcl
thln
g, c
ostn
Uo
mai
els,
flllz
er, p
lsti
pruc
ts.'
Mos
t prla
tot l
eto
In C
alrl
Am
, bu
un w
l cos
tre
te fr
Uf c
ete.
' US
co
prng
a w
o ch
ip m
ill fe
re lo
Ihll
se forsts, weUaI. br gros for whle, dophns, may tlh spe.'
Gua
tem
la9.
353
9826
-15
$211
2%ag
riul
ture
Agn
c co
ti 21
of
axpo
",n
gs; m
ain
cr a
re iu
grc,
co,
ban
as,
collae, bens; arna lote ft. Main Inuslrs: sug, telecIlh, fulure,
.ch
ics,
pel
r, m
eta,
ni,
tom
. Tou
rim
lCO
sta
be u
n.' I
MF
gulcng ecic po, wt li unerny opsed.'
Hon
ras
3,00
567
232
17$3
11%
agri
ultu
reA
gnc
prs
21 o
f ex
p, e
ms
62%
of
woo
r H
ea d
e id
ic o
n co
and banai, whic .uter .harp pr flluUos.' Ovshng on of man I' pr
(tlh
cal
i, es
p. .h
t fo
ex u
p 17
0 .in
198
). A
lso
toris
m a
c w
l no
enmelaa.sesme~ fnle cotaauls, tost-lle ae, defortaUo, so
erio
. Les
t de
mln
re
In C
arib
b (g
o, s
ilv, c
o. le
, zl,
nior
, and
mo,
co.
'
Mex
ic28
.628
3,32
19
223
$4.3
51.
5%lr
dela
t for
exc
hng
ea~
: pet
r, b
o ai
iem
bl p
lnts
, io'
81%
of
woor In 18." Indul\1: foo and bes, to, chls, ni an lte,
pelr. mlnl te an cllh, trpo eqpl, tom, Mari reti an div
ci niply.' Uncly fN NAA In 199 Inked lo lha de In fo
Inlmll. Go pli. $5 mi an .mta caig, In ni of wate an
se coln; $2 ml bu fo 1993 10 Im ii an di wate for to
alo
US
bo. E
atlle
S 1
.6 b
Ølo
be
ipet
on
pout
col
n eq
t as
of 1
99.'
Nic
raua
1,73
645
630
116
$17
1%ag
riul
tuE
xpo
01 a
g pr
uc, e
.pe
coee
and
cot
t, co
Uru
to b
e fo
ti of
ec. A
gncl
se
em 4
4% o
f Wlo
r E
xl d
el Is
on
01 h
lghe
l In
wo
on a
pe
ca b
ais.
' Tcu
coy
une
l.'Pa
nam
a5.
542,
248
11-
9$1
963.
5%In
nspo
-Coll ec re iin Nor c:ls (9.3% gi- In 1991, 8% In 199), de
all c
ohigh unl (15%). TrinspollcolcUo acts for roly 26% of GDP
mun
icbul only 6% of woor Go an counit lers Ii largst emplt leto (32l,
tions
o.c
fol byegll, hunll and ftshl (27%) and come, reslaUlts, hole (16%).
Tourim Is Intele with 18f and benkng ornle ecies. Shr marlltu
slgn
ifnl R
eso
pi ln
ud o
verh
lng
and
cotn
of l
us; n
mlle
Info
iial
lbl
on COstall'. Maj dru lnshpmt and moy Ia cete' rile cr
riin
iin
198
No
oule
.'

Table A.S (contd.)
.. W \0
Con
lrfT
err
GO
PP
er c
api-
A9r
iUur
eM
inin
gM
fctg
Tourism repls:
Lar
gest
Com
ets
Subr
egio
n II
(mili
osI'
la G
OP
'as
as%
ofas
%or
In $
mili
os a
ndSe
cto
% o
f G
OP'
GO
P'G
OP'
as %
or
GO
P'
Bah
ama
2,6!
10,2
09
324
$1,2
247
°'"
Iori
sm'
Tourism 50% of woor and 72% or GOP (Note: Varis estimatas of Iorim rang fro
60°'" 10 75% of GOP.). Depite ret slump, rein mot por Caribbn Iorisl desti.
nati.
Hal
d (r
efus
) an
d C
uba
(Ior
it co
ti) p
o ne
chl
lees
. Inc
sing
em
-phasis on shlpp relslr servics. GolntNes assisting slay expansio of expo
fishi
ng In
dusl
r.' S
31.8
mU
lIr lO
B lo
r el
etn
deve
iol
Cay
man
Is.
670'
23,0
0N
AN
AN
AN
AN
Ato
uris
m'
Tourism 70% of GOP, 75% of forign exch eamlngs. Majo ta haernancial celer.
with
cop
any
fees
pril
40%
or
ge r
eenu
e. T
raiti
l tur
t fis
hing
str
Uy
limite
d.Close coti with US on dru ntell.'
Cub
a17
,00
1,58
ur-'
4-.1
39-.
1$3
01.
8°'"
man
utct
g..
Indus.-l dlvenl1ll a high prty (no colrte In pape). Tourism see as largest
(GN
P)(G
NP)
potetil gro seto ia Ineslmls In colnll. Main ex: sugr cane (wo's
largt expo), niel (rou lat sorc), ftti For gro prlsng $5 mill
In
Inveslmts gyM seera years for Iosm an rete servic seto.'
Doi
nin
7,14
897
615
316
$877
12"'
"m
anuf
tgM
anul
ri se
has
he
dosl
l mae
t bi:
half
or m
fc Is
in s
ug r
efin
ing.
Nic
elR
epic
has surpsse sug as main ex aa. Tou deaa, alr main fon ex.
ch ea bei ac for 113 of 128 km codln.i Pl 10 op ne go mi wI
estimaie $6 bill in dell. Ih riin cots of gO pructi fo on mi sli
In 1
993.
'
Hal
d2,
641
3934
-15
$41.
7%ag
riul
ture
Agrl Is pt so of emt fo mo th 70% of Ih ni poti.
Pro
fital
ity ii
ml b
y se
so
arlo
la o
f 1r.
sm
ala
size
s. L
eng
cr:
coffee and sug. Fb haests sma an emll. Mfct acts lo 30 of Iota expo
(wos lat iup of ba: ii iO. ga. el). Most mfct Is lo cI
meill coumll. colr In folis. be. ho go, bulking
mat
es (
I.e.
. cet
).l
Jam
3.49
71,
431
510 _
20$7
4621
%ln
WeI
lf e
cy. 0
n of
wao
r in
se
Inlr
, onr
t in
agri
... f
thes
. fos
\a, W
.i m
fto
MO
fo
priln
, io
and
been
.C
hs, m
etas
. ..U
i.. c
olN
mai
-, W
0A1
Ihl p
luc
of b
auxl
ii.S
ug Is
mot
Impo
t ex
cr. T
h io
prp
etin
g co
ni s
e po
sibi
lity
ofgo
plu
cll.'
Pue
RI
22,8
06,
20i
-39
$1,4
456%
man
ufac
tur.
Mfc
lg a
cnts
for"
50
of e
x. h
a re
sug
sin
WM
i.J Im
pt In
dust
rIn
gIncud phUcli, eltr, pelrls, prse foos,' Seic secto (fina
and ln) Is sec, torism lhlr. Dene In sugr pructi: olh lrltil agriultre
Incuds frt and coffee.' Ashes neligibl, agrlture 0( 3% of GOP: ,. 50 of foo reuir
met
s Im
po.'
Tui
& C
alc
6f5,
00. NA
NA
NA
NA
NA
tour
ism
'O
utst
aing
bes
. col
ref
i. di
v. A
Imin
g 10
be
an Im
pot o
ffsho
fina
ncl c
ete. Ut agrilt. Ash~ Is lrlll. th on pructNe secto; but wate overeplol\e.
Subslanll BriUsh dvpt ald.

J- .t o
.., ~
. "~
Con
irlT
Ol
GO
PPe
r ca
p!.l
Min
inM
fclg
Touri.m nilS:
Lar
glC
ome
Subtvlon IV
(mill
io.)
'lO
GO
I'..
iii %
of81
%of
In $
mH
Ila1
and
See"
"%
or
GO
I'G
OI'
GO
I'..
% o
r G
OI'
An'
"47
"8.
80N
AN
AN
AN
AN
Ato
u.m
'T
ouna
rn I
i mei
o ie
ele
en o
ro a
n!. '
13 o
f G
OP;
rel
l'p6
gr ~
hO
le, o
lh g
ust
acm
olkl
.' L
oIe
an 1
1f a
r ie
elip
o.1
Miiuo &
.424
'6.
804
42
353
1..
74'4
to.m
Hoe "" on lo.m tw Ill: iilllol .ec In i. .nd - I..
B_
lor mony y.... Mon _ll. om... h." .hmod to ii .nd lit mf. ID dllf
ecfc
bel
..J D
r nn
IiH
p . Q
f c:
.&
Bar
biI.
&1'
7.oc
5I
7$4
5323
%\O
.Tou._ it moJO fo .. ._. ..lIlo .t 26 01 GOP. oi.ho ~no
l.rn
.oM. golnln ~! ~ -i. $3 mI._1o 0I1I c:
i-. Sug cr .1
82-i- i-.In'Y In i-hlp.'
Bril
Vkl
n I..
133
10.6
0N
AN
AN
ASI
0982
"1O
omTou.m 25% 01 GOP.. ti.10 lo do po ftnc .. bo i- ..
Impo
l Rl b
ti gn
: .._
801
gr
ro!
Oor
lt7
""-
2.10
021
i8
S28
IS%
ogiu
SIO domo 10 cn: og uo .. lo 30 GOP. 01_ __ 11% 01
pnll on 75% 0I1O up. Rll ge .onc,,1i1o 10 ~ .pe -i
.ec
(1""
.tIlo
io. _
ti'*
& .p
ebl d
M. e
o_ p
l or
un wo lo Inl- ft _ti pi. _I 1\.it._.i tw _! sa
mlnlo In 1993 re lo.. 01 ci..Hp 10.."' tiii...
G-
'J3.
ocis
-6
S315
%iir
iM1
M.1n ii _xp .. "" -. _'. rr. Fre li up. eap. 10
Con
o gr
ool
d U
S S
31n
Jii o
l lo
ne _
II en
tw tI
co... Toum "" Jil-. gr ia. i- de.&¥....V..pe,,1c -
.Iol
lne
(US
S25
mi i
r E
l __
II M
o _
up!
Ni
em Ioll .. 199 10 _ IMF.i ..io pm ro me IO 01
nu _tr. In.. wf _10 10 bol pf. Tou ii -- by
ri.1
n cr
.'
Gup
e1.
100
3,3f
'10
5.3
(co)
S28
26%
lo.
Tro iill lo 17% 01 OOP. Ma pr: .ug .. by (no. mole....).
i.__'. co... co. _ otli Il'* lo _h en oc . tl ~
li .n
d _t
i io
_ cI
po
no e
i. T
oum
10
~I e
nmol ~tI .oc. Heo __ .. .ut_ en ci i-Ie ir F..!
Mor
lnlq
2.oc
'6.
rx8.
16.
2(~)
S213
%AI ir
i..jo ei IN pu _u.r.... _ by ne. ..-- .. _.
Fro
ne II
Ag 10 Hnlle 01 OOP. I' lo up -. ni i-
70 01
lnat
i bhl
n co
-l 1
0.. f
o .u
p. ti
lI 0
1_ ~
Ir
GO
plA
q gr
ea.
_ p
r. In
dty
_la
by II
rn.
"l
...in
on
.ug
,.fi.
Tou
m I
m o
n up
(00
oi.l
o fr
F..)
!M
ontJ
ett
7:t
5.w
:N
AN
AN
.N
AN
Alo
uam
'Tou.m eclS fo 25% 01 GOP .nd Io.-i .il. SmelI-"'Y "" -
_.Ie_ic _II. do.. entr. "..ti bo mf! Ag I... ii 6% 01 GOP;
Ini al1slMl ftshe fo bb... co. f1nftih.'
Net
hndi
t.4O
7.60
I'13
"S4
3.%
loum
'Toun.m ,,plY' mol 01 it pe. Ag Ii mo. Indl1 iM mI: do
MllI
..Ioole by oR reli, _ 10 i- bu no -il FI en -i im (eap.
Cu). Flti In 10 .. Io -i .. J_... "ne bh on Sl
MM,len! Cu ti _I -- dr h Weaie -i.'
Sl K
1tt &
Nev
il14
2"3.
508
-14
ST4
52%
""eI
M.1n ..pe ." .ug & ii: _ ... 10_ co, co 01. _. rr.
ious
mIlnspo oq Ag 10 -* h ~ .. d\. ~ pr! Up 10 70 01
fo __II '" _ 8_ ei. Ge . mo -i (42" In
1967
).' s
a.6
milr
Kul
t __I
Fun
10
_ .._
_ co
S2
m11
rWor B.nk In_ l)l .._1I lo ro .nd ..po _li .
Sl L
u2S
1.66
141
6Sl
T3
69%
""eI
Ag (30 01 ".po oo). tom, and mi .re il_ pl 01"' ec.
lous
m50 of le .re I. cu.lo rn cn ., _'. co. co. co, ii.
Tou
.m ..
peng
dni
ll. e
ape
cn ..
it: o
n 01
~'i
pr y
el1
cal,,. i.i _nd mo.1 __ Intr _In _ ,.lea: do. fI.
..ic
It..io
pr.
.po
go! _
114
.8 m
i del
a co
_ -
10 m
ok"
Sl i
. _ m
a ~
.._1
cal
o S
20 m
i_"
hO-l
ooild
. fw
l by
irnfl
hoa
an r
ntl~
.'
Sl V
11 &
H'-
1.50
iV-
VS5
31%
iir1.
.Ag .ec (60 01_ _)'Io _lo by -l- - (dr
Cln
e.un
plt u
p 10
40)
. tili
ll _
pf l-
_oe
In
01_
__ u
p gr
(22
01
up -
i1n
196)
. oth
o tI
.. I
IIo
loo
.up.
ti S
i _ ..
a "
"i I
lh I
n. T
ou 1
ntr
~ 10
Il'
pi bel aa .... In ~ .._ SIOO .. _la In .. ,. ~
mor
i $3.
3"'1
r K
i- __
Fun
lool
ge.
'U
.S.V
klnl
..i .
2011
.oc'
NA
NA
NA
$T08 59%
1Oam
Toum 10 "' ie 1n'Y en mo.. _.' T.. _II li 01 re.
i-1lnWeaie _pi Otrn- -. -. ii - .
_ ~ o- 1O_1n _ RI'. _lo In "' oirn en
miat 10 US.,f 10 pi en.. .. uM pm lo iilIl
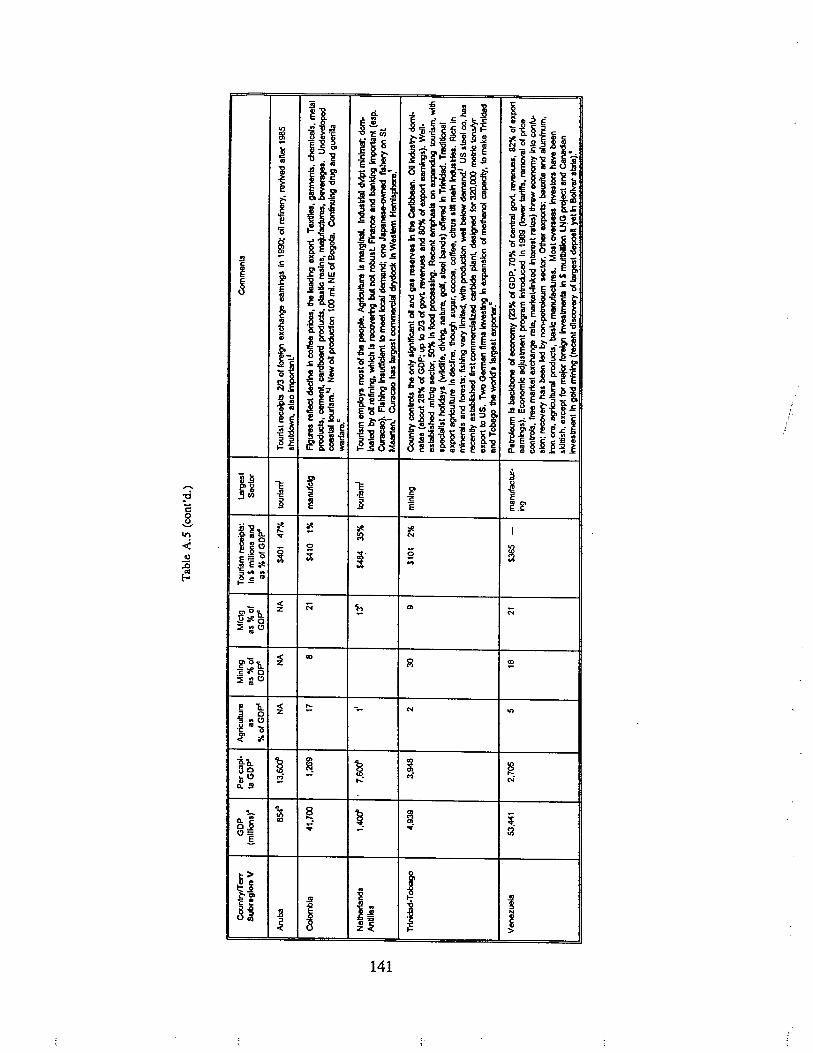
Tab
le A
.S (
cont
'd.)
I- .¡ I-
Con
trfT
enG
DP
Per
cap
l.A
grku
~ure
Min
ing
Mfc
lgTourism repts:
larg
est
Com
ents
Sub
regi
on V
(mlli
asl
ta G
DP
'as
as %
0185
%01
In $
mili
as a
ndSe
cto
% 0
1 G
DP'
GD
P'G
DP'
as %
01
GD
P'
Arb
a85
"13
,60
NA
NA
NA
$41 47%
tori
smT
ouris
t rei
pts
21 0
1 fo
exc
hng
eain
s In
199
; ~i r
efi,
reed
atl
1985
shut
d, a
lso
Impo
l'
Coi
a41
,700
1,26
917
821
$410
1%m
anuf
ctg
F1i
rs r
eflt
dene
In c
alfe
e pr
, ih
lein
exp
o T
ex, g
ats,
chi
cas,
met
alpr
ucts
, ce~
car
drd
pruc
, plti
res
ins,
maj
uac,
bes
. Und
elop
cost
al to
rlm.O
J N
ew 0
/ pru
ctio
n 10
0 m
i. N
E 0
1 B
ogta
Cot
luln
g dn
i and
gue
Da
war
fare
.'
Nel
lnds
1,40
7,60
l13
"$4
35%
tori
m'
Tousm emplyi moit of ih pe. Ag ia margina Indlr cMt minma; do
Ant
illes
lnele by 0/ reftnlng, whic lil' bu not rosl FI and bald Imnt (esp.
Cul. FIhing lnuftlo met
lo d
e on
J8p
ftli
on S
LMeart Cu has largt co dry In Wesle Hemsph.'
Tri
idT
ob4,
939
3,94
230
9$1
012%
min
ing
Con
lr c
olrs
ih o
n ilg
nlln
t 01
an g
ai r
esee
s In
ih C
ari.
oa I
nlr
d0nates (abo 28% of GDP; up lo 21 of ge reenue and ll of ex emlns). wen.
establshe mlctg seto, SO In fo pnilng. Rec em on ex torism,,.th
ipelst holdYI (wfe, dlv, neUe go, lte bands) oten In Tr1. Treitil
expo agriultre In deine, th lug, co. colfee, cis itI main 1nl1. RI In
mln
es a
nd lo
rsts
: fth
ln v
er li
mi w
ith p
ruc
-l be
de'
US
lte
co. 1
1re
Uy
esta
blsh
e ftl
Sl c
omel
z ca
p1n
~ d
eig
101
32,0
0 m
etr
IDr
expolo US. Two Gen ftnn inti In expansio of meth capø, lo make Trinid
and Tob ih wol last expo.'
V_z
ue53
,441
2,70
55
1821
S3-
man
uflu
r.Petr Is ba of ecy (23% of GDP, 70% of cetr go re, 82 01 expo
ineamlns). Ecoic ødjuslmt pr Intr In 198 (i ta, I' 01 pr
colr
, fre
mar
lel e
xchn
g ra
te, m
arle
t-lln
ed I
ntei
t rat
e) th
ec
Into
cof
ulio; reer has be le by no seto. Oth ex: bauxit and alumloom,
Iro
or, a
grilt
ral p
ruct
s, b
asic
man
uure
s. M
ost 0
V I
nlo
ha b
esk
Jtts
h, e
xcel
fO
l maj
o fo
Inl
mll
In S
mul
bllo
LN
G p
r an
d C
anan
Inveslmt In go mining (rel disc 01 largst depl yet
in B
o ita
te).
'
..".."
.,

Table A,S (contd)
I- .¡ N
Con
trfT
err
GO
PP
er c
api-
Agr
iultu
reM
inin
gM
rctg
. Tou
rism
rec
eipt
s:L
arge
. I
Com
ets
Sub
regi
on V
I(m
ilio.
)'la
GO
P'
a.a.
%of
a. ''
¡ of
In $
mill
on. a
ndSe
cto
%of
GO
P"G
OP'
GO
P"a.
% o
f GO
P"
Fre
421.
~4.
3rx~
NA
NA
NA
NA
NA
AI fro
Shr
mp
acts
for
50%
or
mo
of e
x ea
rnin
gs. S
ug Ie
th o
nly
sign
ifnt e
xpo
cr.
Gui
naF
ranc
IsForslr and coslrll are majo ocll. Ru pructi: unplle go end baux.
main In-
lte: uneI eclost potell (hll. fishl. ri and jule safaris, Amian
covi
llas)
. Cos
lalo
sm p
rspe
ts iu
fer
fr p
rxlm
lty 1
0 A
mon
(la
of
vibl
be
soor
ran
d cl
ean
wal
e.)
Hom
10
Eur
Man
e sp
a pr
ra, w
h ea
rns
appx
, $70
0~
mll1
_.1
Guy
ana
349
435
2213
9"S3 8,5%
agrt
lure
Nic
me
th "
b ba
sket
of
th C
arib
bn. b
u ag
rItu
, lie
aa
oth
secl
o. I
e un
d.de
elo.
Mai
n cr
are
iugr
& r
i. S
e.su
ft In
fth,
lat e
x In
rei
o of
fish
and
ihrm
p. W
oil I
argl
t bau
xIte
pr
ret e
mph
sla
on g
opru
c. R
ect
resl
rbsn
gclt
reac
ng u
nd IM
F g
unc.
Par
l Clu
b fo
e S
4 m
in b
itel d
ebt
In 1993 and scle ret CHar 23 yr: UK wrte 011 endre of det of $8.5 min,'
Suri
na1,
941
4,51
310
310
$11
-fi
nanc
ial
FInanc and rel eilate Ilnt for 22 of GDP bu empl C 3% of th woor, La.t
seri
c.emplomet aelo (37%) Is public admlnldefenses.' Ova eoy cotii- to
strle sinc enng of Dut delot aid In 1982 (an sup en 811/93). Baiite
mining. alumna pIsslng ere trilll mainstas (15% ofGDP, 75% of
expo
eai
ng.,
..3% of emplymt). Agriltu resents 10% of GDP end 25% of eangs (ri, bane""s.
cltr
s fr
ts, p
alm
011
); f
oo p
Iiin
g ac
fo
60 o
f al
in ii
, T' I
mpo
Lbut va.t lr rain fort Is unpl. Ovt of shr fann Is plnne,' Recnt EC
stuy cos no basIs for cofi In ec poic.'
'Sor
c (u
nle.
oth
se n
ote
In In
divi
dual
cel
l): W
RI 1
99.
.Sorc: CIA Worl Factbok 1993.
'Src
: Enc
clla
Bril
amic
199
. (A
griu
ltre
incl
l.. fi
.hln
g an
d lo
r.tr
.)'Incl.. manufacturing.
.196
.'G
lo s
ocl p
rucl
'Incl.. public udlll.
'198
7.'1
98.
'Sor
c: G
on 1
99'src: Slate Oet Background Noles.
's: Ros, Fen and Gabl 199.
"'rc: U,S. Oel of Co SlatJtJa/ Abstrct oflhe UnH"d Stales 1993.
'Sorc: Brous and Var1no 199.

Scientirc Associations and Member Insitutions in the WCR
Table A.6
Asation or Marine Laboralories or ih~ Caribhen(AMLqBelars Res Insilute or McGill University.BaBeud Biologica StaiionBitt En Field Swion. B V i
Cabisc Maren Biolisc Insiiuul. ÇUr2. NACa1i Ma Re Laboraiory. ilCeie for Ei an Enviromeia Res.
Pu RicoCeir de Invesgacon de Biologia Marina.
Reblica DomicaaCetr de Invesgaon Y de Estudios A vanzados del
lPN-Unida Merda. Mexico
Cetr Univert.re Aniilles-(uyane. Guadeloupe
CCF Baan Field Staiion. FloridaDemel of Mare Science. UPR. Puerto RicoDisver Bay Marne Laboratory. JamaicaEsion de Invesigaciones Marina de Magaria.VeiLaralorio Invesgacion Pesuera. Puero Rico
Fwion Citifica Lo Roques. Venezula
Intule or ~ar Affairs. Trinidad and Tobago
Iiitulo de Invesigacion Marina de PunlO de Beiin.
Colombialnluo Ooniico. VenezuelaMar Sceo Celer. UVI. USVIMOl Mar Laboratory. FloridaPort Royal Marne Laboraiory. Jama icaRosiel Scl of Marine and Atmospheric
Scien. U. Miami. Florida
Smiilian Troica Resrch InSlilute. Panma
Caribben Coatal Marine PrudiYily(CARICOMP)Funion La Salle De Cieoia Natues. VenUniveridad Simo Boliva. VenFoution CARMABI. CuracaoBore Marine ParlUniveida de Pan. PanINVEM Sata Mar ColoUniverly of Co RicaInsituto de Rocrs Natraes (IA). NicaguSmiilia Insitution. Cue Bo Cay. Beize
Hol Oi Marne Rese. BeizCINVESAV. Merda, MexicoUniv. Nac. Auto. de Mexico. Puo Morlos. MexicEPOMEX. Campehe, MexicoInsiiuto de Oclogia. CubaUnivcriiy or ihe Wes Indies. JamcaNaiura Resurc Unii. Cayma IslanUnivcridad Aulonoma de SaIO Domingo. Dominica
RepublicSaba Mare Par, Nciands AniillesBaan Field Slaiion. Sa SavadrBeud Biologica Station. BeCabb Enviromcia Heath lniu. St. LuInsituie of Marine Affiurs. Trinida an TobgoBelairs Resrc Insitute. Ba
Souihe Asation or Marine Laboratores (SAML)
Regular MembeBeict Esrine Resrc Labor-iiory. M DBeud Biological Station for R=rc. Inc.Oie Biological Labonitory. M DColee of ciIeson. SCDaupl Islan Se Lab. ALDue Univerity Marne Labonitory. NC
Flor Demet or Naiuni Resrc. FLFl lniiiuteofTeclogy. FLFl Sla Univeriiy. FLGulf Co Rcs Laboratory. MS
Haoa Univety. VAHar Bra Ocraic Insiiution, FLHon POiDI Envirometa Laboraiory. MDla Univeriiy, TXLo Univerties Marne Cortium. LAMot Mar Labolory. FLOld Dooa Univeriy. V ASava Scale COLLeg GASkway laiiute of Ocraphy. GASrri/ Envirota Re Ceter. MDSoih Calin Wildlife an Marne Resrc
Demei. SCTeu A&M Univeiy-Crp Christi. TXTeu A&M Univenityai Galveson. TXTexas Pari an Wildlife Dcrtmel. TXUniverty of Florida (Manne ubonitory). FLUDiverity of Florida (Witny uboniiory). FLUniveristy of Georgia Marine Insitute. GAUniveity or Miarr (RSMAS). FL
llniversity of Nort Calina-Cpc Hill. NCÜï.iverty of North CArolina-Wilrrngton. NCUniverity of Puo Rico. PRUniversity of South Carolina. SCUniverity of South Florida. FLUniveity of Souther Mississippi. MS
Univerity or Texas (Marine Biomeica Institute). TXUniveity of Texas-Austin (Marine Scien Insituie).
TXUnivCfity or Texas-Pan Amecan (Coal Studies
uboralory).TXVirginia Insiruie of Marine Scien. V A
Ast~ MembersFlorida Institute of Ocogniphy. FLNaiion Marine Fisheries Service (NM FS). Soth
Fisheres Center. Miarr. FLNMFS-Beufort uboratory. NCNMFS-ceson Laboratory. SCNMFS-Galveson. TXNMFS.Miam. FLNMFS-Pan City Laboory. FLNMFS-Pasgola uboniory. MSNor Calina Scale Universiy. NC
US Eavirometal Proeciion Agey-EavirotaResrch uborator. FL ,
,
.-,
143

Table A.7Parcipaon in Globa an Regiona Oranzaons
~ :: ~ ~ ~ ~ii ~ :: :: ::
3 0
.,OJ :: :: :: :: :: :: :: :: :: :: :: :: :: :: :: :: ::
:'
0:' :: ~ :: :: :: ~ :: :: :: :: :: :: :: :: :: :: :: :: ~ ~ :: :: ~ :: :: :: :: :: :: ~ ::0OJ
a :: :: :: ::~
j OJ :: :: :: ::II Ü~ .,
l2:
::
i:: :: :: :: :: :: :: :: :: :: :: :: :: :: :: :: :: :: ::
0
I ..0 :: ~ :: :: :: :: :: ::OJ0
., ::0 :: :: :: :: :: :: :: :: :: :: :: :: :: :: :: ::;!
~ii ii ,; ii ß
! ,;0 Jl :: :: :: :: ~ :: :: :: .a :: .a :: :: :: :: :: ~ .a
a: 0 0 0 0 0 0 0 0
¡)
Q. :: :: :: Q. :: :: :: :: ::0 :: :: :: :: :: :: ::0(
.. :: :: :: :: :: :: :: ::0( :: :: :: :: :: :: :: :: :: :: :: :: :: :: :: :: ::0
0~
:: ~ :: ~~
:: :: :: :: :: :: :: ::
0 :: :: :: :: :: :: :: :: :: :: :: :: :: :: :: :: :: :: :: :: :: :: ::;;
.~ :: :: :: :: :: :: :: :: :: :: :: :: :: :: :: :: :: :: :: :: :: :: :: ::
1~i
0ii :: :: :: :: :: :: :: :: :: :: :: :: :: :: :: :: :: :: :: :: :: :: :: ::!!0
i i:
i 0( :: :: :: :: :: :: :: :: :: .. :: :: :: :: :: :: Q. :: :: :: :: :: ::
0..z 0 :: :: :: :: :: :: :i :: :: :: :: :::: 0( :: :: :: :: :: :: :: :: :: :: :: :: :: ::
..
~.. ..
l ! ~ ~ ~r! i . i l ~ ~ ~ ~ ; ~ l ~
~ ; ~ ~ ~h .." 2 2 2 ~ 2
i
, i 1 l ~~
~
ii
J.: oS B. l Iz .. l! ; l
.. f ~ i j 11 i i i..
i.. JI
i-~ ~
l I.D i j
¡ i~
il ~ S l ¡ 'i .. ., l.. ~ ~ l ì
~ II
ii. l R' 11 ! ~ ~ : .I
~ i i l ~ í2 ~
"~ 2
.I ~ ~ .: .: 'C ~ i. ~ 'i ~ l l. ¡;J J l ? ~ ., ~.. .. .. :i :i :: :: ., ., ., .. :: ::
Se next page for key to abreviaons.
144

Tab
le A
.7 (
cont
'd.)
UN: Unite Nati.. eatSbll.hed 26 une 1945 to malntaln IntemUonel peace and s8Cut1ty and 10 promo
Ie c
oper
atio
n In
volv
ing
econ
omic
~O
Ci8
1. c
ultu
røl.
and
hum
anIta
rin p
robl
em!.
FAO
: Foo
iind
Aon
eultu
re O
rgan
izat
ion,
ell
16 O
c. 1
945:
UN
spe
dallz
ed a
genc
y 10
rai
se li
ving
ale
ndB
rda
Bnd
inci
iuue
ava
ilabi
lity
01 &
Qrl
ultv
ral p
ruct
s.G
AT
T: G
eerl
Agn
Mm
enl o
n T
iirti
and
Tra
de. e
it. 3
0 O
cl. 1
947
10 p
rte
the
expa
nsio
n of
inte
rnat
iona
l trd
e on
8 n
ondi
scrm
inat
ory
basi
..IB
RO
' Inl
eUo1
i1 B
ank
for
Rec
nstr
cton
and
Dee
lom
enl.
1111
0 kn
o as
the
Wor
1d B
ank,
eat
. 22
July
194
: UN
spe
ializ
ed a
genc
y th
at I
nltli
illy
prm
oted
eco
mic
reb
uild
ing
afte
r V
VlI
and
now
pro
vrde
i eco
nom
ic d
evel
opm
nl )
oani
.IMF' Intetlo.1 Mon.tory Fund, oiL. 22 July 194: UN ipolollz.d OQ.ncy cocernd wUh wold mon.tory itobllty .nd ecnoic dOv.lopmi.
IMO: Intetlo.1 M.ritima Org.nlzation, oiL. 17 M.",h 1958: UN ipod.llzod .g.ncy concem.d wllh world m.rilim. .Nai".
WT
O W
oi1
Tou
riam
Org
snlz
aöon
. 811
. 2 J
in. 1
975
to p
rte
tour
ism
81
8 m
ean.
of
cotr
butlr
\ to
&G
onom
ic d
evel
opm
ent,
Inte
rnliU
onel
und
erat
andl
nQ. a
nd p
eaee
.OAS: Organizatin of Amrin Sta
~. i.
eiL
. 30
AD
rtl 1
94 to
prm
ote
peac
e an
d le
cUr1
ly ø
s w
ell ø
s ec
onom
ic a
nd io
cløl
dev
elop
men
l (E
C. F
renc
e. N
elhe
r1øn
dl a
re n
on-r
egio
nal O
bser
vn)
ACP: Afrn, Caribbn, .nd Podll Contrli. oit. , April
1976
: m.m
bo"
av. 0
pr.
f...n
ll.1
econ
omic
and
.id
",'a
lionl
hip
with
th. e
c.C
AR
l C
OM
: Car
lbb.
n C
omun
ity .n
d C
omo
M.n
..i, è
.i. ~
Jul
y 19
73 to
prm
ol. e
cono
ic in
lOQ
"'lio
n an
d do
v.lo
pm.n
t. up
el.ll
y .m
o9 th
o LO
LL d
.vel
pod
coni
nu.
IAOB: Inter-Acan o.olopmonl B.nk. .il 8 April
1959
to p
rom
t. ec
noic
.nd
locl
.1 d
.val
open
lln L
atin
Am
.ric
an (
Fra
nc..
N.lh
erio
ndi,
UK
.r. n
on.r
elo.
1 M
.mbo
rs)_
oecs: Org.nlzllon 01 eOltom Caribban SlOtol; .11. 18 Jun. 1981 to promt. polllc.l, economic. .nd d.l.nl. cooporation.
CO
B: C
artn
o..l
omel
B.n
k, .1
1. 1
8 O
ct. 1
96 to
prm
ote
ecno
ic d
ev.lo
pmnt
.nd
coop
o",U
on (
Fran
ca .n
d U
K ..
. non
-rO
QIo
.1 M
.mbo
,,).
BC
IE: C
etrl
Am
can
Bon
k lo
r ec
oom
ic I
nter
ati,
.11.
13
Do.
196
to p
rmot
e ec
noic
Int
erat
io a
nd d
ev.lo
pmnl
.C
AC
M: C
etrl
Am
can
Com
o M
.n..I
, .11
. 13
Do.
196
to p
rte
..tob
llihm
ant 0
1. C
antr
l Am
rican
Com
o M
ar,,1
.eCLAc: Eco Colillon for LoUn Amrica .nd tho Cobbn, ..1. 25 F.b. 1~ to prte ecnomic d.v.lopmnl II . regional comiOllon of tho UN'I Ecoomic .nd Soal Concil (ECOSOC; Franc., Nolher1ndl, .nd UK.ra .mo
norelool Momb"i.
LA
ES:
Lal
l Am
can
Eco
omic
Sy.
ie. .
.lI7
Ocl
.197
5 to
prt
o oc
oom
lc .n
d .o
cl.1
dev
.lopm
.nl t
hrog
h re
lona
l cop
otio
n.LAIA: Lati Amn Interati Aoioclatin, ..1. 12 Augu.t 196 to prte fr regional trde (othr OblOrv" Indudo tho ec. tho IADB, tho OAS, tho Unite N.tloi o..lopmant Prrerr, and ECLAC).
.. +-
VI
So.: EntlI Sri"",* Y.. 1m CIA 19~.

146

APPENDIX B
Estimation of Drainage Basin and Coastal Populations
147

Appendix B: Estimation of Drainage Basin and Coastal Populations
A. Drainage Basin Populations
Estimation of drainage basin populations began with development of a drainage map forthe Wider Caribbean Region by cartographer Tamara Oshychny, based on existing drainagebasin maps for the Caribbean Sea and Atlantic Ocean (Oxford Atlas of the World 1992) and the
Orinoco and Amazon Rivers (The Times Atlas of the World 1985). The results were translatedto the UNEP map depicting the six CEPPOL-designated subregions of the Wider CaribbeanRegion (UNEP 1994a) and are included here as Figure B.1.
For countries that lie only partially withn the drainage basin, the drainage map wassuperimposed on country maps showing state/administrative divisions, and appropriateproportions of division-level populations were totaled for each country. For each countr, thesum was then calculated as a proportion of the total population reported for the same year by thesame source, and the proportion was applied to the 1990 population totals used throughout thsreport.
A comparable process was used in the cases of Mexico, Cuba, and the NetherlandsAntiles to determine the distribution \If drainage basin population across the two CEPPOLsubregions in which each is designated as lying. In the case of Cuba, however, which drainsvirtally entirely toward the south, an adjustment was made to capture the heavy concentrationof population in the nortwest Havana area and the related discharge into Gulf of Mexicowaters.
The resulting drainage area estimates are reported in Table B.1.
Data sources: State/adnistatve division mas an populaon daa
Twelve countries and one overseas departent of France lie only partially withn theWider Caribbean drainage basin. These are listed on the next page with the sources that wereconsulted for state/administrative division maps and population counts. Also listed are Cuba andthe Netherlands Antiles, for which drainage basin population counts were assigned to two
separate CEPPOL-designated subregions (as was also done for Mexico).
148

I- .. \0
Mis
siss
ipp
Riv
~r D
ra/n
sg~
1-~'
Ô'
,,_c-
.c-
,i--i
"
AIl
AN
/1C
OC
fM
Source: Broadus and
Vartanov (1994)
PN oc AN
.:....
,.,.:.
:.:.:
tt~tt Guir or Mexico/Caribben Sea Drainage
;::::;
::::::
:;:::
Olh
er A
llant
ic
fa ~ IIAtlaniic Ocn Drainage: Orinoco River
Figure B.l
Drainage area of the Wider Caribbean
(Prepared by Tamara Osychny, based on maps in the Oxford Atlas of the World 1992 and The Times Atlas of
of the World 1992).

Table B.l
Estimated Drainage Basin and Coastal Populations of the WCR States'
Subrcgion/$iatc Estimatc: Dr.lin,;i£c n..sin EsiilTlcd Coasl.i Populaiion
Populaiion 1990 199(x 1(0) . (x 100)
Subreeion I 141,836 26,210
Cuba 6,02 5,941
Mexico 34,050 5,069
United Slates 101,760 15,20Subreion (( 14,259 2,62 '
Beize 190 122
Costa Rica 1.488 632
Gualemala 5.244 -Hondura 4.693 1,131
Mexico 591 422
Nicarain 920 88
Panama 1,133 230
Subreion (( 24,246 12.04Bahama 247 247
Cayman Islands 26 26
Cuba 4.584 1,729
Dominican Republic 7.170 4.159
Haiii 6,490 1,895
Jamaica 2,420 1,341
Puerto Rico 3,300 2.640
Turk & Caicos Islands 9 9
Subre¡ion IV 1,629 1,188
An~uilla 7 7
Antil!ua & Barbuda 64 64
Bardos 263 125
British Vir~in Islands 12 12
Donúnica 85 85
Greada 84 &4
Guadeloupe 342 151
Martinique 340 235
Netherlands Aniilles 15 15
St. Kiiis & Nevis 40 40St. Vincet & Grenadines 113 113
US Vir~jn Islands 99 99
Suhreiion V 49,171 9,825Aruba 63 63
Colombia 29.700 1.603
Netherlands Antiles 168 168
Trinidad & Tobal!o 1,240 862Veneniela 18.00 7,129
Subreion VI 1,28 562F re Guian 98 83
Guyana 792 305Suriname 394 174
WCR TOTAL 232,425 52,456
150

Country Administrative map Population data
United States Broadus and Vartnov 1994" Statistical Abstract of the UnitedStates 1993
Britannica Book of the Year
1994Mexico James and Minel 1986b
Guatemala
Honduras
Nicaragua
Costa Rica
PanaaColombia
James and Minkel 1986
James and Minel 1986
James and Minel 1986
Worldmark Encylcopedia 1984c
U. S. State Dept. 1992d
James and Minkel 1986
James and Minel 1986
James and Minel 1986
James and Minkel 1986
James and Minel 1986
James and Minkel 1986
Britannica 1994
Britannica 1994
Britannica 1994
Britannica 1994
Britannica 1994
Britannica 1994
Britannica 1994
Britannica 1994
Britannica 1994
James and Minkel 1986
Britannica 1994
Venezuela
Guyana
Suriname
French Guiana
Cuba
NetherlandsAntiles Worldmark Encylcopedia 1984 Worldmark Encylcopedia 1984
"The Oceans and Environmental Security: Shared U.S. and Russian Perspectives, James M.Broadus and Raphael V. Vartanov, eds. (Washigton, DC: Island Press, 1994). This sourceincludes a map showing U.S. state boundaries and the drainage basin of the Gulf of Mexico.
bLatin America, Preston E. James and C. W. Minel, with Eileen W. James. (New York: John
Wiley & Sons, 5th edition, 1986). This source also includes population distribution maps forindividual countries, which were used as an inormal check on the methodology described above.
cWorldmark Encyclopedia of the Nations: Americas (New York: Worldmark Press and JohnWiley & Sons, Inc., 1984).
dBackground Notes: Panama (Washigton, DC, U.S. Departent of State, March 1992).
151

B. Coastal Populations
Where necessary, coastal populations were estimated using several methodologies,depending on the form and availability of data.
Populaons entrely within the coasal zone
The populations of the following island countries were deemed to be entirely coastal:Anguila, Antigua & Barbuda, Arba, Bahamas, British Virgin Islands, Cayman Islands,Dominica, Grenada, Montserrat, Netherlands Antiles, St. Kitts & Nevis, St. Lucia, St. Vincent& the Grenadines, U.S. Virgin Islands.
Counes for which relean coasal populon daa were directly availale
For the United States, 1990 Gulf of Mexico coastal population was directly available (asnumber of persons and as a percentage of U. S. total population) from the Statistical Abstract ofthe United States 1993.
For 17 countries-Barbados, Colombia, Costa Rica, Cuba, Dominican Republic,
Guadeloupe, Guatemala, Guyana, Haiti, Honduras, Jamaica, Mexico, Nicaragua, Panama,Suriname, Trinidad & Tobago, Venezuela-data were available from the World Resources1992-93 Data Base Diskette. The data used for the coastal population estimation included 1980coastal and total population and projected 2000 coastal and total population. For each country,the proportion of coastal to total population was calculated for 1980 and 2000, the results wereaveraged, and the average proportion (% coastal population) was applied to the 1990 totalpopulation data used throughout this report.
Countries for which Caribbean coasal populaon was calculaed from availale daa ontotal coastal populaon
For countries that also have coastlines outside the Wider Caribbean Region (i.e.,Colombia, Costa Rica, Honduras, Mexico, Nicaragua, Panama), data on the populations ofmajor cities (from Britannica Book of the Year 1994) were used to approximate the proportion ofa country's total coastal population (as reported in World Resources 1992-93 Data BaseDiskette) that is concentrated on the Caribbean coast. (Here, too, the relevant percentage wasthen applied to 1990 population data for use in the study analyses.) For countries with no majorurban concentrations on the Caribbean coast (e.g., Guatemala, Nicaragua), state/administrativedivision-level population data (also from Britannica 1994) were used instead of urban populationdata.
152

Countries/terrtories not includd in the World Resources Data Base, an countesspaning two CEPPOL-dsignaed subregions
The coastal populations of Puerto Rico and Guyana were estimated from urban populationdata (Britannica 1994) using a methodology comparable to the one described above for countrieswith coastal populations along more than one coast. This methodwas also used to estimate, in the case of Mexico, Cuba, and the Netherlands Antilles, theproportions of the total coastal population residing in each of two CEPPOL subregions spannedby these countries.
Finally, no urban or administrative-level population data could be found for FrenchGuiana. For purposes of this study, 85 % of the population was deemed to be in the coastalzone, based on statements in various sources (e.g., James and Minkel 1986, U.S. State Dept.Background Notes 1989, Worldmark Encyclopedia 1984) indicating that somewhat more thanfour-fifts of the population of French Guiana resides in the coastal lowlands.
The resulting coastal population estimates are reported in Table B.l.
153

154

APPENDIX C
Opportunities for Gains from Trade: A Stylized Model
155

Appendix C: Opportunities for Gains from Trade: A Stylized Model
i. Introduction
The possibilties of gains from trade with regard to a pollution problem can be shownclearly using a stylized model (Mäler 1990; Dasgupta 1982). We wil focus on the problem oftransboundary pollution effects between two states. i In this model, states have the legal
competency to enter into agreements to control pollution, and we assume that subnational agents,such as industries or consumers, are not involved directly in the negotiations.2 Note, however,that a negotiated outcome might involve the paricipation of subnational agents. For example,two states might decide that the best way in which to resolve a transboundary pollution problemis to create a market in pollution rights open to subnational agents from both states.
In order to ilustrate opportnities for gains from trade, we abstract from the real world
in another importnt way . We assume that the two states are strikng a bargain over pollutioncontrol. After all, pollution control is the main focus of the proposed protocol. However, statesmay find other reasons for entering into an agreement to control pollution. Even states that havea legal right to a clean marine environment may be wiling to accept some level of pollution inorder to benefit in other ways, such as improved international relations or perceived increasedbenefits to the state of a trading partner's economic development. For example, Mäler (1990)cites studies by John Krtila and Alan Kneese which demonstrate that:
. . . at least along the U.S.-Canada and U.S.-Mexico borders, agreements on water and waterquality have involved 'trades' in areas other than the rather restricted area defined by theenvironmental resource. The important point here is that there have been trades, although theymay not be directly visible.
We assume as well that, because of the strong directional nature of WCR current flows(Gladfelter and Ogden 1994), there exists an "upstream" polluter and a "downstream" pollutee.We believe that these assumptions characterize many of the potential transboundary pollutionproblems in the WCR. Some localized "commons-type" pollution problems (where each stateis both a polluter and a pollutee) may exist in the Caribbean, particularly in shared rivers,estuaries, or embayments. Gain from trade are possible in the commons context as well,
i This is known as the "producer-producer" externality problem of Coase (1960). Note, however, that where
smal countries are involved, income effects not unike those in a "producer-consumer" externality problem mayarise. See Baumol and Oates (1988) for details.
2 In reality, subnational agents could influence the negotiating position of the relevant states either by exerting
influence on their national governent or by opportnities provided though developing priciples of transnationallaw. Putnam (1988) develops a political model of "two-level games in which a national governent negotiates atboth the international and domestic levels. Sand (1991) advocates "opening local remedies to foreign paries" asone means for de-escalating transboundar environmental disputes.
156
although, for heuristic reasons, we wil not use the commons example here.3
Although we employ an economic model, and we identify an economically "efficient"level of pollution in the context of the model, we wil not be overly concerned with calculating"optimal" levels of pollution here. We are interested in characterizing the conditions underwhich economic incentives exist for states to reallocate their resources in a manner that improvesthe welfare of both states and, by definition, that of the relevant society as well. In ths sense,
"gains from trade" harness the economic self-interest of individual states to achieve a collectiveend (cf., Ridley and Low 1993). We identify the potential roles of WCR states in Section V.
In Figure C. 1, we represent the hypothetical benefits and costs of a problem of pollutioncontrol involving two hypothetical states, X and Y, at any point in time.4 Our analysis is static,although it is possible to interpret the representation in Figure C.1 as the present values of aflow of benefits or costs. State X is emitting a pollutant that has an impact on the waters ofstate Y.5 State Y would benefit from a reduction in X's emissions according to the total benefitscurve displayed in panel a. In a typical case, total benefits of pollution control rise quickly atfirst and then begin to diminsh as more and more emissions are controlled. Reduction ofemissions is costly for state X, and its total costs of reductions increase slowly at first and risemore rapidly with increasing reductions.
6
Panel b displays the slopes (marginal abatement schedules) of the total benefit and costcurves in panel a. According to coasean logic, if we assume either that the legal rights to befree of pollution have been assigned to Y or that rights to pollute have been assigned to X, thenthe two states can realize gain from trade by bargainng to level p*. To see ths- point, considera case where X has the legal right to emit pollutants into the Caribbean Sea from land-based
3 Several analysts have examned the problem of international pollution control in the case of a commons. See
Braden and Bromley (1980) and Hoel (1991) for static analyses. Dockner and Long (1993) show in a theoreticaldynamc model that nations may approach an economically effcient level of environmental quality even when theyhave not committed themselves to control pollution through an international agreement. What is required is thatthe countries communicate before choosing levels of economic output and associated levels of pollution (i.e., theyengage in "cheap talk"). Chander and Tulkens (1992) develop a sharing rule that allows states to divvy up the"ecological surplus" (gains from trade) and to allocate total abatement costs. Dockner and Long (1993) are skepticalabout the likelihood of approaching effcient outcomes where information is incomplete or nations are dissimilar ineconomic characteristics.
4 Note that the information requied to construct these relationships can, in some cases, be diffcult to acquire
(see Section IV).
5 Dasgupta (1982) refers to this example as a "unidirectional externality." Unidirectional externalities are
distinguished from "reciprocal externalities," which could occur when nations pollute each other. We believe thatthe case of transboundar land-based marine pollution in the WCR is best characterized as one in which there existssome risk of unidirectional pollution impacts.
6 Note that this curve also represents the polluter's "demand" for pollution as an input into its production
processes (Baumol and Oates 1988; Seibert 1987). As such, it can be interpreted as a measure of the polluterswilingness to pay compensation to a pollutee under a regime in which the pollutee has the right to a cleanenvironment. We discuss this in more detail below.
157

(a). :J.t
(-~ T1c-J '
~( Mli,fi
(b)
~
( l-)~At )
(e)
~OTf B~~~ 1' 1 t) r=Po\, L. v 'i o, Co ,J f" l-
o t / '" i-"To '"p-r
p..
i
I
I
,.pI' ?oi.i.VíoJlt-
~ ft ~tl~ ~O~~:i
/ ylM%y
/I::
! .!:f::~':- :.~~: . ... .. I-
. . i. vJ 60 4.iP~ MMJ
't
û ~.v
't(/li, 0 FoPn ..A-
t i loi-i.vnoJ4
Figure C.i. A Model of Tranboundary Pollution Control
158

(d)
(e)
pflI'A- )(
A\
p"'-pi' l
l I PO\I/ \M
~
'D
I
pA. ?l" pi-\~
?.. ~L. ~l
Figure C.! (continued)
159

sources. We start at point p'. Y would benefit by the amount Q+R from a reduction in
pollution from p' to p*. X would reduce pollution over ths range at a cost R. Y could affordto pay X an amount equal to R7 plus some part of Q, and both states would have gained fromthe bargain. Although there stil exists a measurable level of "pollution" at point p*, there isno economic reason to reduce pollution to a lower leveL.
This stylized scenario requires two furter assumptions. First, transactions costs,including costs associated with each state's gathering inormation about the benefits and costsof pollution control, striking a bargain, and enforcing it, must be zero. The effect of positivetranactions costs would be to shift the marginal abatement schedules for each state in therelevant direction and by an amount proportional to the transactions costs each must bear(Seibert 1987; Bromley 1986). We discuss ths in more detail below. Second, the effects ofcompensation payments on the wealth of the states involved must be negligible.
8 If these so-
called "income effects" are significant, the position of the marginal abatement schedules wil beaffected, perhaps in ambiguous ways, as trading taes place.9
II. Distribution of Propert Rights
Ignore for the moment the effect of transactions costs and income effects, and considerthe possibilty of gains from trade from pollution control in the Caribbean. The first thg onemust know is the nature and distribution of legal rights regarding pollution control. 10 If thereis no clear assigmnent of rights, then we can probably expect continuous disagreement over whois responsible for pollution control.
Rules of customary international law, such as the "no-harm principle," assert thatpolluting states have an obligation not to cause serious or significant harm to other states (HLR1991). Such rules imply that states have a right to be free of marine pollution from others.However, Boyle (1992) believes that such rules are "too general to afford useful guidance toStates in the control of land-based sources of pollution" (see also Churchil and Lowe 1985).
7 Note that, at the intemationallevel, ths payment could take many form: direct cash payments, subsidize
foreign loan, tied foreign aid payments, tranfer of pollution control technology, preferential access to fishing
grounds, among others. See Kimball (1994) for a list of additional suggestions.
8 We might expect that "income effects" are likely to occur. The reason is that if the pollution problem is so
smal that its resolution wil have a negligible effect on the wealth of the paries, then it seems unlikely that theparies wil be motivated to resolve it.
9 For example, the extent to which a country may be wiling to pay for environmental protection may depend
upon its level of development. Moreover, the distribution of propert rights may affect the position of maginalabatement schedules. The latter issue relates to whether or not the relevant par is income constrained. SeeMishan (1982) for an exposition of this issue.
10 The Coase Theorem does not apply unless propert rights are assigned to one of the paries.
160

Another principle, that of "polluter pays," appears, superficially, to say that pollutershave the responsibilty to reduce emissions (or possibly to compensate others for adverse
impacts). In Appropriate Approaches, UNEP (1994c) has recommended that the polluter paysprinciple be "phased-in" for the control of WCR land-based marine pollution, at least at thedomestic leveL. (However, ths principle was not incorporated explicitly into either UNCLOSIII or the Cartgena Convention.
11) In general, the polluter pays principle refers to thedistribution of rights at the domestic level (Hunter, Sommer, and Vaughan 1994). It is not clearthat the principle could be applied between states, although Boyle (1992) suggests that
transnational institutions, such as civil liabilty treaties or international supervisory mechanisms,might permit application of the principle.
Article 194(2) of UNCLOS III obliges states to ". . . tae all measures necessar toensure that activities under their jurisdiction or control are so conducted as not to cause damageto other states or their environment. . . . "12 Ostensibly, ths duty is clear in its requirement thatpollutee states have the right to a clean marine environment. However, Stevenson and Oxman(1994) explain that provisions found in UNCLOS III with respect to the enforcement ofinterntional standards on LBMP are weaker than many participants had hoped for. The reasonfor ths weakness is a familar one:
One difficulty was that delegates to a conference on the law of the sea had doubts about theircompetence to deal with activities on land that might cause mare pollution. Delegates to the1992 Rio Conference, who suffered from no such disabilty, witnessed the diffculty of gettingstates to agree to binding rules affecting significant activities on land.
We note further that the Law of the Sea Convention has not yet entered into "force for someCaribbean states that are major sources of LBMP, including the United States and Venezuela.
The "Montreal Guidelines" 13 refer to obligations that states have with respect totransboundary pollution flows (Meng 1987). Guideline 3 reads:
States have the duty to ensure that discharges from land-based sources within their territories donot cause pollution to the marine environment of other States or of areas beyond the limits ofnational jurisdiction.
Note that these "obligations" do not have the status or legal force of an interntional agreementor treaty. Even so, ths guideline, in combination with the customary "no-harm" principle andthe language in UNCLOS III, suggests that states have the right to a clean environment.
11 This principle has been incorporated into the 1986 Single European Act, implying that territories governed
by the Netherlands, France, and the United Kingdom must abide by it.
12 Article 207 contains specific language referring to the obligation of states to prevent, reduce, or control
pollution from land based sources. This obligation extends to the marine environment within national jurisdictions
(Charey, 1994).
13 Montreal Guidelines for the Protection of the Marine Environment against Pollution from Lad-Based
Sources, UNEPIWG. 120/3 (1985).
161

Here we wil assume that the international distribution of property rights is such that"downstream" states have the right to a clean environment.
14 Under this scenario, the extent
to which gains from trade exist may depend upon the existing level of pollution. Return toFigure C.1, panel b. If the current level of pollution is pO, then state X would be forced bylaw-costlessly under our assumptions, but probably not in reality-to reduce pollution at leastto p*. At any level below p*, X would be wiling to compensate Y to move back up to p*, ifthis is permitted by law. Note that p* is efficient from the standpoint of society (both states inour example). Society gain when X reduces pollution from p" to p*, but the distribution ofbenefits from such a move accrue completely to Y (Y is not required to compensate X). Thusthere is no explicit "trade" or, therefore, "gain from trade" in the legally required move fromp" to p*. However, if the current level of pollution is pI, then gains from trade are possiblewhen X compensates Y to move to p*.
As suggested by the quotation from Stevenson and Oxman above, we may be dealing witha difficult issue concernng the redistribution of assumed pollution rights. States havetraditionally benefited from using the ocean as a sin for the disposal of wastes from land-basedsources. Until relatively recently, this practice has been tolerated for the pragmatic reason thatit may have been much too costly to attempt to enforce nebulous customary rights to a cleanmarine environment. In special cases, such as the Trail Smelter litigation,15 principles ofcustomary international law, such as "no harm," have been invoked to curb serioustransboundary pollution (Churchill and Lowe 1985). More recently, international conventionssuch as UNCLOS III, and soft law, such as the Montreal Guidelines, have strengthened the legalrights of downstream states. In the classic coasean model, when downstream states have clearpropert rights, the scenario involves a move from zero pollution to an efficient leveL. Thesituation is different for what amounts to a switch in the distribution of propert rights frompolluter to pollutee: in ths kid of a situation, the polluter is required to shoulder the burden
of emission cuts to levels below its full emissions.
Another factor hidering the realization of gains from trade in this kind of model is acomplete understanding of state Y's marginl abatement benefits. In the absence of any actualtransboundar impacts, there are no benefits from pollution abatement, and, therefore, noopportnities for gain from trade. On the other hand, risks of pollution effects may be based
upon complicated dose-response relationships or cumulative effects about which little is known.If there is uncertinty about effects, then the marginl benefits of abatement may be moreaccurately represented as a range intead of a line (Figure C.1, panel c). Negotiations over
pollution compensation might stil tae place using expected marginal benefits, but it is likelythat agreement wil be more difficult to reach than in the absence of uncertinty. This suggeststhat there exist benefits to scientific research that help to elucidate the nature of the schedule of
14 We assume as well that we have a full understanding of the movement of pollution flows, the costs of
emission reductions, and the benefits of reduce damges on the downstream nations from such reductions.
15 United States v. Canada, II R.I.A.A. 1911 (16 April 1936).
162

abatement benefits. 16
Also of importnce are the international legal defintions of "pollution" and "pollution
control" . 17 Without a clear defintion of pollution and an understanding of the legal basis forits control, it is likely to be difficult for trading opportnities to arise. Extant definitions ofpollution and its control appear broad enough to incorporate interpretations ranging from
UNCLOS Ill's restrictive defintion (possibly requiring increasingly stringent pollution controlas the "best practical means" at a state's disposal change over time) to the Cartegena
Convention's looser definition (callng merely for "appropriate measures"). Boyle (1992)explain that "(o)ne of the objects of regional treaties is to identify what substances wil betreated as causing 'pollution,' and in what circumstances." One benefit of a protocol would beto give precise definitions to terms such as "pollution," as is commonly done through Anexeslisting "black" and "grey" substances, and to clarify opportnities for trade in pollution rightsas one "appropriate means" for pollution control.
III. Transactions Costs
After clarifying propert rights, the potential for lowering transactions costs is likely tobe one of the most importnt justifications for a protocol on land-based marie pollution in theWCR. In general, it is possible to identify thee broad types of transactions costs. The firsttype is that associated with inormation about the marginal costs and benefits of pollutionabatement. If such information is either highly uncertin or unequally distributed between the
states (or believed to be so by one or both states), then the potential for gains from trade is lessthan otherwise.
18 For example, in a survey of theories of bargaining delays, Kennan and
Wilson (1990) explain that "uncertinty about whether the gain from trade is positive requiressome inefficiency, either as delay or as a breakdown of negotiations." The clearinghouse roleof a protocol in providing scientific and techncal inormation and in channeling assistance todevelop such information can help to reduce the transactions costs associated with inormationabout marginal costs and benefits.
A second type of transactions costs concerns negotiations (or "contracting") betweenstates over pollution abatement. Model agreements, faciltation and arbitration services,
16 Note that Broadus et al. (1993) mae the important point that there exists an optimal level of "ignorance."In other words, there may be decreasing returns to the supply, though scientific research, of information aboutmarginal abatement benefits.
17 Meng (1987) traces the evolution of the definition from the Group of Experts on the Scientific Aspects of
Marne Pollution (GESAMP) in the late 1960s to the Stockholm Report and from there to UNCLOS II and regionalagreements such as the Caregena Convention. See also Kiball (1995).
18 Baumol and Oates (1988: 10) note that "(i)f both sides to such a negotiation try to outsmar one another by
devious strategies, an optimal outcome is by no mean certai." Maler (1990) explains a result from game theorywhich states that if both states know the parameters of probabilty distributions that describe the position of theirrespective schedules, then neither state has an incentive to outsma the other. This result was developed in aninternational pollution context by Smets (1973).
163

brokerage services, dispute resolution mechanisms, and other means of reducing negotiationcosts can enhance opportnities for gain from trade. These functions are among those that a
protocol might usefully incorporate or develop in order to increase effectiveness.
A third broad type of transactions costs are those associated with enforcement of a
negotiated "trade." These can include costs associated with environmental monitoring,
submitting to adjudication a complaint of a purported inraction, and imposing a penalty on thestate that deviates from an agreement. In their study of international compliance, Chayes andChayes (1993) argue for improvement of dispute resolution procedures, techncal and financialassistance to developing states to enhance their capacities to enter into and comply withagreements, and increased tranparency of domestic policy actions.
The existence of transactions costs, which may be closely associated with the incidenceof "burden of proof, " is an importt consideration. Historically, the burden of proof may haverested with the downstream state. Examine Figure C.L, panel d. Consider the case in whichX has already controlled pollution to some level, perhaps for its own internal reasons. We startat point pU. If the burden of proof rests with y, Y's marginal abatement benefits schedule couldshift downward, reflecting a decreased abilty to offer compensation to Y (Seibert 1987; Bromley1986). The shift may be so large as to cause the "optimal" level of pollution, as perceived byY, to be greater than pU. This kind of scenario might occur in cases where enforcement is
problematic'9 and upstream states have been allowed historically to emit pollutants into themarine environment.
An application of the "precautionary principle" implies that polluters. must shoulderresponsibilty for demonstrating that discharges wil not harm the marine environment (Hunter,Sommer and Vaughan 1994). If the burden of transactions costs fall on X, its marginal cost ofabatement wil shift downward (Bromley 1986). We show this in Figure C.l, panel e. In panele, we show also the effect of the "polluter pays principle" as an upward shift in the marginalabatement benefits schedule for Y (Mishan 1982). Such a shift might occur when Y'swilingness to accept compensation, unconstrained by its wealth or "capacity" (see section V.D.),exceeds its willngness to pay compensation if propert rights had been reversed.
20 The net
effect of these two principles is to shift the optimum from p*, in the absence of uncertinty,transactions costs, and propert assignment effects, to pl. As described above, this may implya movement, which does not involve any trades, from the unenforced outcome of p' to pl. Tothe extent that burden of proof involves transactions costs, the opportnities for gains from tradewil be enhanced through the reduction of these costs.
19 For example, Churchil and Lowe (1985: 248) explain that ti. . . there are no international agreements to
faciltate the bringing of claims for compensation by a national of one State who has suffered damage from pollutionemanating from another State. ti
20 In theory, wilingness to accept compensation should be the same as wilingness to pay compensation.
However, where unique marine resources, such as coral reef ecsystems, are at stake and where substantialuncertainty surrounds the potential damages caused by LBMP discharges, wilingness to accept might well differfrom wilingness to pay. See Freeman (1992) for a general discussion of the issues.
164

The extent to which transactions costs affect the marginal benefit curve wil depend uponthe nature of transactions costs as either fixed or varying with the level of pollution or pollutionabatement (Tietenberg, pers. comm., 1995). If tranactions costs are mostly fixed, e.g., costsassociated with a one-time negotiation, then the position of the relevant marginal schedules wilbe unaffected. If negotiation costs are large enough, however, then they may stil preclude thedesirabilty of pollution control. Furter work is required to examine the nature of transactions
costs in the context of trans boundary pollution in the WCR.
165

References
AREL (Asistencia Reciproca Petrolera Empresarial Latinoamericana). 1994. ARPELEnvironmental Guidelines. Montevideo, Uruguay: AREL.
Atwood, D.K., F.J. Burton, J.E. Corredor, G.R. Harvey, A.J. Mata-Jimenez, A. Vas que-Botello, and B.A. Wade, 1987. Petroleum pollution in the Caribbean. Oceanus30(4):225-32.
Baumol, W.J., and W. E. Oates. 1988. The Theory of Environmental Policy. Second Edition.Cambridge: Cambridge University Press.
Bernauer, T. 1995. The effect of international environmental institutions: how we might learnmore. International Organization 49(2):351-377.
BNA (Bureau of National Affairs). 1992. Venezuelan minster calls for strong, centralizedstate environmental agencies. International Environment Reporter Current Report16(23):872.
Borgese, E.M., and N. Ginsburg. 1982. Ocean Yearbook 3. Chicago: University of ChicagoPress.
Boyle, A.E. 1992. Land-based sources of marie pollution. Marine Policy 16(1):20-35.
Braden, J.B. and D. Bromley. 1981. The economics of cooperation over collective bads.Journal of Environmental Economics and Management 8:134-150.
Brañes, R. 1991. Institutional and Legal Aspects of the Environment in Latin America,Including the Participation of Nongovernmental Organizations in Environmental
Management. Washington, DC: Inter-American Development Bank.
Brewster, L. 1994. Comments at the Workshop on Regional Control of Land-Based Marine
Pollution: Lessons from Other Regions for the Wider Caribbean. December 1-3 at theUniversity of the West Indies, Bridgetown, Barbados. Sponsored by the Marine PolicyCenter of the Woods Hole Oceanographic Institution, with support from the U. S.Environmental Protection Agency.
Britannica Book of the Year 1995. Chicago: Encylcopaedia Britannca, Inc.
Britannica Book of the Year 1994. Chicago: Encylcopaedia Britaca, Inc.
Britannica Book of the Year 1993. Chicago: Encylcopaedia Britannca, Inc.
Broadus, J.M. 1992. Creature feature too: principiumprecautionarium. Oceanus 35(1): 6-7.
166

Broadus, J.M., S. Demisch, K. Gjerde, P. Haas, Y. Kaoru, G. Peet, S. Repetto, and A.Roginko. 1993. Comparative Assessment of Regional International Programs to ControlLand-Based Marine Pollution: The Baltic, North Sea, and Mediterranean. Woods Hole,MA: Marine Policy Center, Woods Hole Oceanographic Institution.
Broadus, J.M., and R V. Vartnov (Eds.). 1994. The Oceans and Environmental Security:
Shared U. S. and Russian Perspectives. Washington, DC: Island Press.
Bromley, D.W. 1986. Markets and externalities. Natural Resource Economics 37-88.
Brongersma-Sanders, M., 1957. Mass mortlity in the sea. Chapter 29 (In) J.W. Hedgpeth(ed.), Treatise on Marine Ecology and Paleoecology, Volume 1. Geol. Soc. AmericaMemoir 67.
C/CAA (Caribbean/Central American Action). 1986. C/CAA's 1987 Caribbean and CentralAmerican Databook. Washington, DC: Caribbean/Central American Action.
CIA (Central Intellgence Agency). 1990, 1992, 1993, 1994. The World Factbook.
Washington, DC: Central Intellgence Agency.
Chander, P. and H. Tulkens. 1992. Theoretical foundations of negotiations and cost sharingin transfrontier pollution problems. European Economic Review 36:388-398.
Charey, J.1. 1994. The marine environment and the 1982 United Nations Convention on the
Law of the Sea. The International Lawyer 28(4):879-901.
Chayes, A., and A.H. Chayes. 1993. On compliance. International Organization 47(2):175-205.
Churchil, RR and A.V. Lowe. 1985. The Law of the Sea. Manchester, England:Manchester University Press.
Coase, RH. 1960. The problem of social cost. Journl of Law and Economics 3:1-4.
Cortés, J., and M. J. Risk. 1985. A reef under siltation stress: Cahuita, Costa Rica. Bulletinof Marine Science 36(2):339-356.
Cropper, M.L., and W.E. Oates. 1992. Environmental economics: a survey. Journal ofEconomic Literature 30:675-740.
Cumberland, J. 1981. Efficiency and equity in interregional environmental management. TheReview of Regional Studies 10(2):1-9.
Curtis, C. 1993. The London Convention and radioactive waste dumping at sea: a globaltreaty regime in transition. Paper presented at the Conference on Radioactivity and
167

Environmental Security in the Ocean: New Research and Policy Priorities in the Arcticand Nort Atlantic, 7-9 June, Woods Hole Oceanographic Institution, Woods Hole, MA.
Dasgupta, P. 1982. The Control of Resources. Cambridge, Mass.: Harvard University Press.
Delegation of Finland. 1990. Protection of the marine environment of the Baltic Sea.Document submitted to the CSCE Meeting on Environmental Protection in theMediterranena, Palma de Mallorca, October.
Dewees, D.N. 1983. Instrument choice in environmental policy. Economic Inquiry 21:53-71.
Diagram Group. 1985. The Atlas of Central America and the Caribbean. New York andLondon: Coller Macmilan.
Dockner, E.J., and N.V. Long. 1993. International pollution control: cooperative versusnoncooperative strategies. Journal of Environmental Economics and Management 24: 13-29.
ECLAC (UN Economic Commission for Latin America and the Caribbean). 1990. The WaterResources of Latin America and the Caribbean-Planning, Hazards and Pollution.Santiago, Chile: United Nations Economic Commission for Latin America and theCaribbean.
. 1993. Population, Social Equity and Changing Production Patterns. Santiago, Chile:
Latin American Demographic Centre, United Nations Commission for Latin America andthe Caribbean.
Elder, D., and J. Pernett, Oceans: A Mitchell Beazley World Conservation Atlas. Mitchell
Beazley in association with IUCN: The World Conservation Union, London, 1991.
Elvis, D., and D. Colbert. 1994. Intiatives for regional action on Caribbean environmental
issues. Washington: Countr Departent III, Caribbean Division, World Bank.
Espenshade, E. G., Jr., and J. L. Morrison. 1986. Goode's World Atlas. Chicago, NewYork, San Francisco: Rand McNally.
Famighetti, R. (ed), 1995. The World Almanac and Book of Facts. Mahwah, NJ: Funk &Wagnalls.
FAO (Food and Agricultue Organation). 1993a. FAO Yearbook: Fishery Statistics 1992.Rome: United Nations Food and Agriculture Organization.
1993b. Marine fishery resources of the Antiles. FAO Fisheries Techncal Paper 326.Rome: Food and Agriculture Organiation of the United Nations.
168

Fenwick, J. 1992. International Profiles on Marine Scientifc Research: National MaritimeClaims, MSR Jurisdiction, and U.S. Research Clearance Histories for the World'sCoastal States. Woods Hole, MA: WHOI Sea Grant Program, Woods HoleOceanographic Institution.
. 1995. (Departent of Marine Chemistry, Woods Hole Oceanographic Institution).Personal communication.
Fisher, A.C., and F.M. Peterson. 1973. The environment in economics: a survey. Journalof Economic Literature 13:1-33.
Freeman, A.M. 1992. The Measurement of Environmental and Resource Values: Theory andMethods. Washington: Resources for the Future.
Froelich, P. N., Jr., D. K. Atwood, and G. S. Giese. 1978. Infuence of Amazon Riverdischarge on surface salinty and dissolved silcate concentration in the Caribbean Sea.
Deep-Sea Research 25:735-744.
GESAMP (Joint Group of Experts on the Scientific Aspects of Marine Pollution). 1990. Thestate of the marine environment. UNEP Regional Seas Reports and Studies No. 115.
Gladfelter, E. H., and J. C. Ogden. 1994. The status of relevant scientific capabilties andknowledge of land-based marine pollution problems in the Caribbean. Consultant
discussion paper prepared for "Regional Control of Land-Based Marine Pollution:Lessons from Other Regions for the Wider Caribbean," an EP A-supported project of theMarine Policy Center, Woods Hole Oceanographic Institution, Woods Hole, MA.
Goodridge, J.A. 1994. Comments at the Workshop on Regional Control of Land-BasedMarine Pollution: Lessons from Other Regions for the Wider Caribbean.
December 1-3 at the University of the West Indies, Bridgetown, Barbados.Sponsored by the Marine Policy Center of the Woods Hole Oceanographic
Institution, with support from the U. S. Environmental Protection Agency.
Goodwin, C. (Ed.). 1992. The Caribbean Handbook 1992/93. St. John's, Antigua: FTCaribbean.
Gray, C.R. 1992. History of tropical cyclones in the Carbbean: 1886-1986. Pp. 677-690 (in)J. O'Callahan (Ed.). Global Climate Change and the Rising Challenge of the Sea.Proceedings of the IPCC workshop held at Margarita Island, Venezuela, March 1992.Silver Spring, MD: U.S. National Oceanic and Atmospheric Administration.
Hammond Atlas of the World. 1993. Maplewood, NJ: Hamond Inc.
Harvey, G. R. 1987. A personal overview of oil in the marine environment. CaribbeanJournal of Science 23(1):5-10.
169

Helfand, G.E. 1991. Stadards versus standards: the effects of different pollution restrictions.The American Economic Review 81(3):622-634.
Henao, S., J. Finkelman, L. Albert, and H. W. de Koning. 1993. Pesticides and Health in theAmericas. Washington, DC: Division of Health and Environment, Pan America HealthOrganizationlW orld Health Organization (February).
Herbich, J.B. (ed.). 1992. Handbook of Coastal and Ocean Engineering. Volume 3. Harbors,Navigational Channels, Estuaries, Environmental Effects. Houston, TX: Gulf PublishigCo.
HLR (Harvard Law Review). 1991. Developments - International environmental law 104(7)Cambridge, MA: Harvard Law Review Association, Inc.
Hoe1, M. 1991. Global environmental problems: the effects of unilateral actions taen by onecountr. Journal of Environmental Economics and Management 20:55-70.
Hunte, W. 1994. Comments at the Workshop on Regional Control of Land-Based MarinePollution: Lessons from Other Regions for the Wider Caribbean. December 1-3 at theUniversity of the West Indies, Bridgetown, Barbados. Sponsored by the Marine PolicyCenter of the Woods Hole Oceanographic Institution, with support from the U. S.Environmental Protection Agency.
Hunter, D., J. Sommer, and S. Vaughan. 1994. Concepts and principles of internationalenvironmental law: an introduction. UNEP Environment and Trade.
IMO (International Maritime Organation). 1991. The London Dumping Convention: The FirstDecade and Beyond. London: IMO, Office for the London Dumping Convention.
Island Resources Foundation. 1989. Organtional profies of who is doing what in supportof programs for sustainable resource development and environmental management in theeastern Caribbean: a guide to donor organations and techncal assistance agencies. St.Thomas, U.S. Virgin Islands: Island Resources Foundation (Februar).
. 1991 a,b,c,d,e,f. Environmental Profiles of Antigua & Barbuda, Dominica, Grenada,St. Kitts & Nevis, St. Lucia, St. Vincent and the Grenadines. St. Thomas, U.S.Virgin Islands: Island Resources Foundation
IUCN (Interntional Union for Conservation of Nature and Natual Resources). n.d. DataAtlas: Planning a Marine Conservation Strategy for the Caribbean Region. Gland,Switzerland: IUCN.
Jacobsen, M. 1995. The United Nations Regional Seas Programe: How does it measure up?Coastal Management 23:19-39.
170

Jaffe, A.B., S.R. Peterson, P.R. Portney, and R. N. Stavins. 1995. Environmental regulationand the competitiveness of U.S. manufacturing: What does the evidence tell us? Journalof Economic Literature 33: 132-163.
James, P.E., and C. W. MineL. 1986. Latin America. Fift edition. New York: John Wiley
& Sons.
Kasten, T.J. 1994. Pollution control strategies to be consider (sic) for application and use inthe wider Caribbean-a conceptual document. UNEP Second meeting of experts on land-based sources of pollution in the wider Caribbean region, San Juan, Puerto Rico, 21-25March. UNEP(OCA)/CAR WG.14/INF.12.
Kennan, J., and R. Wilson. 1990. Theories of bargaining delays. Science 249: 1124-1128.
Kimball, L. A. 1994. Land-based source marine pollution: institutions and exchanges. Adiscussion paper on regional control of land-based marine pollution: lessons from otherregions for the wider Caribbean. Prepared under Cooperative Agreement No.
CX821540-01-0 with the Environmental Protection Agency/Office of InterntionalAffairs. 3Opp.
. 1995. The United Nations Convention on the Law of the Sea: A Framework for
Marine Conservation. Par I in: The Law of the Sea: Priorities and Responsibilities inImplementing the Convention. Gland, Switzerland: IUCN.
Lynne, G.D., P. Conroy, and F.J. Prochaska. 1981. Economic valuation of marsh areas formarine production processes. Journal of Environmental Economics and Management8:175-186.
Lyon, F. M., and S. Farrow. 1995. An economic analysis of Clean Water Act issues. WaterResources Research 30(1):213-223.
Mahon, R. 1993. "Lesser Antiles." Pp. 5-98 in Marine fishery resources of the Antiles.FAO Fisheries Techncal Paper 326. Rome: Food and Agriculture Organiation of theUnited Nations.
Mäler, K.-G. 1990. Interntional environmental problems. Oxford Review of Economic Policy6(1):80-108.
Mandell, E. F. 1994. Land-based sources of marine pollution, legal instruents andinstitutional capabilties in the Spanish-speaking countries of the Wider CaribbeanRegion. Consultant discussion paper prepared for "Regional Control of Land-BasedMarine Pollution: Lessons from Other Regions for the Wider Caribbean," an EP A-
supported project of the Marine Policy Center, Woods Hole Oceanographic Institution,Woods Hole, MA.
171

Mangone, G.S. 1990. Mangone's Concise Marine Almanac. New York: Taylor & Francis.
Maul, G.A. (Ed.). 1993. Climatic Change in the Intra-Americas Sea. London: Edward
Arnold.
. 1995. (University of Miami.) Personal communication.
Meng, Q-n. 1987. Land-based Marine Pollution: International Law Development. London:Graham and Trotman.
Mishan, E.J. 1982. What Poliical Economy is All About: An Expositon and Critique. NewYork: Cambridge University Press.
MPC (Marine Policy Center). 1993. Proposal for Study Grant Assistance. Regional Control
of Land-Based Marine Pollution: Lessons from Other Regions for the Wider Caribbean.Submitted to the U.S. Environmental Protection Agency. Woods Hole, MA: MarinePolicy Center, Woods Hole Oceanographic Institution (March).
Müller-Karger, F.E. 1993. River discharge variabilty including satellite-observed plumedispersal pattern. Chapter 8 (in) G.A. Maul (ed.). Climatic Change in the Intra-
Americas Sea. London: Edward Arnold.
Negroponte, J. D. 1987. Caribbean marine science. Oceanus 30(4):3-8.
New Oxford Atlas. 1975. Great Britain: Oxford University Press.
Nollkaemper, A. 1992. Laws of the sea. Marine pollution from land-based sources: towardsa global approach. Marine Pollution Bulletin 24(1):8-12.
NOAA/NMFS (National Oceanic and Atmospheric Admstration/National Marine FisheriesService). 1993. Fisheries of the United States 1992. Washington, DC: NOAA/NMFS.
Oates, W.E. and R. Schwab. 1988. Economic competition among jurisdictions: efficiencyenhancing or distortion inducing? Mimeo. College Park, Md.: Departent ofEconomics, University of Maryland.
OECD (Organisation for Economic Co-operation and Development). 1993. GeographicalDistribution of Financial Flows to Developing Countries, 1988/91. Paris: OECD.
. 1994. Managing the Environment: The Role of Economic Instruments. Paris: OECD.
Oxford Atlas of the World. 1992. London: George Philip Ltd.
PAHO/WHO (Pan American Health Organiation/World Health Organiation). 1992.Consultative Meeting on Excreta and Wastewater Disposal in Latin America and the
172

Caribbean. Washigton, DC: PAHO Environmental Health Program.
Pendleton, L.H. 1994. Environmental quality and recreation demand in a Caribbean coral reef.Coastal Management 22:399-404.
Putnam, R.D. 1988. Diplomacy and domestic politics: the logic of two-level games.International Organization 42:427-460.
Rand McNally Atlas of the Oceans. 1977. Chicago, New York, San Francisco: RandMcNally.
Rand McNally Universal World Atlas: Census Edition. (n.d.; includes 1980 census data).Chicago, New York, San Francisco: Rand McNally.
Ray, C. n.d. Data Atlas: Planning a Marine Conservation Strategy for the Caribbean Region.
Gland, Switzerland: IUCN.
Richardson, P. 1994. (Deparent of Physical Oceanography, Woods Hole Oceanographic
Institution). Personal communication.
Ridley, M., and B.S. Low. 1993. Can selfishness save the environment? The Atlantic Monthly76-86.
Rodionov, V. 1992. Perdonal communication with A. Roginko. A meeting at the Baltic MarineEnvironment Protection Commission, 14 January.
Ross, D. A., J. Fenwick, and F. Gable. 1990. Study on the viabilty of establishing aCaribbean regional center for marine industrial technology. Woods Hole, MA.
Salas, H.J. 1994. Sewage Disposal for Coastal Cities in Latian America and the Caribbean.Report prepared for the Experts Meeting on Land Based Sources of Pollution, San Juan,Puerto Rico, 1-5 November 1993.
Sand, P.H. 1991. Lessons learned in global environmental governance. Environmental Affairs18(213) :213-277.
Seibert, H. 1987. Economics of the Environment: Theory and Policy. New York: Spriger-Verlag.
Skjaerseth, J.B. 1992. The "effectiveness" of the Mediterranean Action Plan. Interntional
Environmental Affairs 4:313-334.
Smets, H. 1973. The mutual compensation principle. Paris: OECD.
Spurgeon, J. P. G. 1992. The economic valuation of coral reefs. Marine Pollution Bulletin
173
24(11):529-536.
Stevenson, J.R., and B.H. Oxman. 1994. The future of the United Nations Convention on theLaw of the Sea. American Journal of International Law 88(3):488-499.
Tietenberg, T.H. 1985. Emissions trading: an exercise in reforming pollution policy.Washington, DC: Resources for the Future, Inc.
. 1988. Chapter Fourteen. Economics of pollution control: an overview. Library ofCongress Cataloging-in-Publication Data, Environmental and natural resource economics,Harper-Collns, 306-332.
Times Atlas of the World. 1985. New York: Times Books.
Underdal, A., S. Andresen, J.B. Skjaerseth, and J. Wettestad. 1992. The effectiveness ofinternational resource cooperation. Draft paper prepared for the Inaugual Pan-EuropeanConference in International Relations in Heidelberg, 16-20 September.
UNEP (United Nations Environment Programe). 1983. Convention for the Protection andDevelopment of the Marine Environment of the Wider Caribbean Region (and) Protocolconcernng Co-operation in Combating Oil Spils in the Wider Caribbean Region.
UNEP, Nairobi and UN, New York.
1 QRQa. Regional Overview of Environmental Problems and Priorities Affecting theCoastal and Marine Resources of the Wider Caribbean. CEP Technical Report No.2.UNEP, Kingston, Jamaica.
. 1989b. State of the Mediterranean marine environment. MAP Techncal Report
Series No. 28. UNEP, Athens.
. 1991a. Background Document for the Development of a Protocol Concerning Land-
Based Sources of Marine Pollution to the Cartagena Convention for the Protection andDevelopment of the Marine Environment of the Wider Caribbean Region. Kingston,
Jamaica: UNEP-CARRCU.
. 1991b. Report on the CEPPOL Seminar in Monitoring and Control of Sanitary Qualityof Bathing and Shellfsh-Growing Marine Waters in the Wider Caribbean. Kingston,Jamaica: CEP Techncal Report No.9.
. 1992. Report of the Executive Director of UNEP on the Status of Implementation of
the Caribbean Environment Programme (1990-1992). Sixth Intergovernental Meeting
on the Action Plan for the Caribbean Environment Programme and Thid Meeting of theContracting Parties to the Convention for the Protection and Development of the MarineEnvironment of the Wider Caribbean Region. Kingston, Jamaica, 16-18 November,
UNEP (OC)/CAR IG.10/4.
174

. 1994a. Regional Overview of Land-Based Sources of Pollution in the Wider CaribbeanRegion. Second Meeting of Expert on Land-Based Sources of Pollution in the WiderCaribbean Region. San Juan, Puerto Rico, 21-25 March.
. 1994b. Submarine Outfalls-A Viable Alternative for Sewage Discharge of CoastalCities in Latin America and the Caribbean. Second Meeting of Experts on Land-BasedSources of Pollution in the Wider Caribbean Region. San Juan, Puerto Rico, 21-25March.
. 1994c. Appropriate Approaches to the Development of a Protocol on Land-Based
Sources of Marine Pollution for the Wider Caribbean Region. Second Meeting ofExperts on Land-Based Sources of Pollution in the Wider Caribbean Region. San Juan,Puerto Rico, 21-25 March.
UNEP/IUCN (UNEP and International Union for the Conservation of Nature and NaturalResources). 1988. Coral Reefs of the World. Volume 1: Atlantic and Eastern Pacifc.UNEP Regional Seas Directories and Bibliographies. Gland, Switzerland andCambridge, UKUNEP, Nairobi, Kenya.
United Nations. n.d. 1992 International Trade Statistics Yearbook.
1992. Nations of the Earth Report, Vols. 1-3. United Nations Conference on
Environment and Development National Report Summaries. Geneva: United Nations.
U.S. Deparent of Commerce. 1994. Statistical Abstract of the United States 1993.Washigton, DC: U.S. Dept. of Commerce.
U.S. Departent of State. 1992. Background Notes: Panama. Washington, DC: U.S. Dept.
of State.
. 1994. Background Notes: Suriname. Washington, DC: U.S. Dept. of State.
van't Hof, T. 1986. The Economic Benefits of Marine Parks and Protected Areas in the
Caribbean Region. Washington, DC: Sanctuary Programs Division, National Oceanicand Atmospheric Admstration, U.S. Dept. of Commerce.
Wettestad, J. 1992. The "effectiveness" of the Paris Convention on Marine Pollution fromLand-based Sources. International Environmental Affairs 4(20): 101-121.
Wood-Thomas, B. 1995. (US Environmental Protection Agency, Office of InternationalActivities.) Personal communication.
World Bank. 1993. Caribbean Region: Current Economic Situation, Regional Issues, andCapital Flows, 1992. Washington, DC: World Banle
175

1994. Initiatives for Regional Action on Caribbean Environmental Issues.
Washington, DC: World Bank Caribbean Division, Country Departent III, LatinAmerica and the Caribbean.
World Resources 1992-93 Data Base Diskette. Washington, DC: World Resources Institute.
Worldmark Encyclopedia of the Nations: Americas. 1984. New York: Worldmark Press.
WRI (World Resources Institute), in collaboration with UNEP and UNDP. 1994. WorldResources 1994-95. New York and Oxford: Oxford University Press.
WTO (World Tourism Organiation). 1986. Country Tourism Profiles.
WWF and ESI (World Wildlife Fund and Environmental Solutions International). 1994."Policy Principles Concernng Caribbean Land-Based Sources of Marine Pollution."Discussion Paper. Washigton, DC and London: World Wildlife Fund andEnvironmental Solutions International (November).
176

DOCUMENT LIBRARYDistribution List for Technical Report Exchange - May J 995
University of California, San DiegoSIO Library 0175C9500 Gilman DriveLa Jolla, CA 92093-0175Hancock Library of Biology & OceanographyAlan Hancock LaboratoryUniversity of Southern CaliorniaUniversity ParkLos Angeles, CA 90089-0371
Gifts & ExchangesLibraryBedford Institute of OceanographyP.O. Box 1006Dartmouth, NS, B2Y 4A2, CANADA
CommanderInternational Ice Patrol
1082 Shennecossett RoadGroton, CT 06340-6095
NOAA/EDIS Miami Library Center4301 Rickenbacker CausewayMiami, FL 33149
Research LibraryU.S. Army Corps of EngineersWaterways Experiment Station3909 Halls Ferry RoadVicksburg, MS 39180-6199
Institute of GeophysicsUniversity of HawaiiLibrary Room 2522525 Correa RoadHonolulu, HI 96822
Marine Resources Information Center
Building E38-320MITCambridge, MA 02139
LibraryLamont-Doherty Geological ObservatoryColumbia UniversityPalisades, NY zl0964
LibrarySerials DepartmentOregon State UniversityCorvalls, OR 97331
Pell Marine Science LibraryUniversity of Rhode IslandNarragansett Bay CampusNarragansett, RI 02882
Working CollectionTexas A&M UniversityDept. of OceanographyCollege Station, TX 77843
Fisheries-Oceanography Library151 Oceanography Teaching Bldg.University of WashingtonSeatte, WA 98195
LibraryR.S.M.A.S.University of Miami4600 Rickenbacker CausewayMiami, FL 33149
Maury Oceanographic LibraryNaval Oceanographic OfficeBuilding 1003 South1002 Balch Blvd.Stennis Space Center, MS, 39522-5001
LibraryInstitute of Ocean SciencesP.O. Box 6000Sidney, B.c. V8L 4B2CANADA
LibraryInstitute of Oceanographic SciencesDeacon LaboratoryWormley, GodalmingSurrey GU8 5UBUNITED KINGDOM
The LibrarianCSIRO Marine LaboratoriesG.P.O. Box 1538Hobart, TasmaniaAUSTRALIA 7001
LibraryProudman Oceanographic LaboratoryBidston ObservatoryBirkenheadMerseyside L43 7 RAUNITED KINGDOM
IFREMERCentre de BrestService Documentation - PublicationsBP 70 29280 PLOUZANE
, FRANCE

50272.101
REPORT DOCUMENTATION 11. REPORT NO.PAGE WHOI-95-104. Title and Subtitle
2. 3. Recipient's Accession No.
Toward an Effective Protocol on Land-Based Marne Pollution in the Wider CaribbeanRegion
7. Author(s)
Portr Hoagland, Mar E. Schumacher, Arur G. Gaines, Jf.9. Perfonning Organization Name and Address
5. Report DateJuly 1995
6.
8. Perfonning Organization Rept. No.WHO! 93-54
10. ProjectlaskIork Unit No.
The Woods Hole Oceanographic InstitutionWoos Hole, Massachusetts 02543
11. Contract(C) or Grant(G) No.
(C) CX821540-0l-0
(G)
12. Sponsoring Organization Name and Address 13. Type of Report & Period Covered
Funding was provided by the United States Environmental Protection Agency, Offce ofInternational Activities under Co-operative Agreement No. CX821540-0l-0.
Technical Report
14.
15. Supplementary Notes
This report should be cited as: Woods Hole Oceanog. Inst. Tech. Rept., WHOI-95-1O.
16. Abstract (Limit: 200 words)
This study was underten to advance the basis for discussions among Contracting Paries to the Cargena Conventionconcerning a protocol on land-based marne pollution (LBMP) in the Wider Caribbean Region (WCR). The study has four principalobjectives: (1) a review and summar of LBMP problems to determine common problems and priority areas; (2) a survey of broadlydefined environmental infrastrcture to help identify national commitments and national capacities to prevent, reduce, or controlLBMP; (3) a survey and analysis of subregional differences in commitment or interest in regional control of LBMP; and (4) acomparson of program approaches from other regions, providing lessons from which an effective program for the Carbbean mightbe designed. The study argues that the environmental, economic, and institutional diversity of the region as a whole suggests (l) anincremental approach to international resolution of LBMP problems, one that builds upon successful arangements among states thathave appropriate incentives for solving real trans boundar pollution problems; and (2) a subregional approach to the control ofloclized but widely occurrng pollution problems, in which the "umbrella" function of a regional protocol would concentrate on the
need to ensure uniform access to all clearinghouse products and on the internal allocation of financial and technical assistace toindividual states and subregions.
17. Doument Analysis a. Descriptors
1. marne pollution2. international protocols
3. UNP Regional Seas Programme
b.ldentifiersOpen.Ended Terms
c. COSATI Field/Group
18. Availabilty Statement
Approved for publication; distrbution unlimited.
19. Security Class (This Report)
UNCLASSIFIED21. No. of Pages
19222. Price20. Security Class (This Page)
(Se ANSI-Z39.18) Se Instructions on Reverse OPTIONAL FORM 272 (4-77(Formerly NTlS-35)Department of Commerce