DOCUMENT 1
400
DOCUMENT 1 Air Monitoring in Air Quality Management
-
Upload
khangminh22 -
Category
Documents
-
view
3 -
download
0
Transcript of DOCUMENT 1

DOCUMENT 1
Air Monitoring in Air Quality Management

PRESENTATION Air pollution is one of the main environmental and public health problems in Mexico. It is a phenomenon inherent in the economic, population and technological state of our country that is most seriously witnessed in the large cities and border and industrial zones. Air pollution is, in turn, one of the problems that are most difficult to understand, assess, establish standards for and control, because of the large amount and variety of emitting sources, dilution and/or transformation of pollutants in the air and the effects pollutants have on human health and ecosystems, among other reasons. In order to assess and minimize the impact of air pollution on the population and natural resources, it is essential that the country has adequate air monitoring systems, networks and programs under uniform operation and quality assurance schemes. The objective of the first stage of the National Air Monitoring Program (PNMA) is to resolve this deficiency with respect to standards, by establishing an air monitoring programming that guarantees diagnosis and surveillance of the state of air quality at national level, that generates real, valid information that can be compared among the different sites and networks of the country, as a fundamental instrument in the establishment of environmental policies for protecting the health of the population and ecosystems. One of the functions of SEMARNAT is the generation of scientific and technical information on environmental problems in order to inform society, support decision making, be a driving force behind environmental protection and promote the sustainable use of natural resources. The National Air Monitoring Program includes the strengthening of the National Air Quality Information System (SINAICA) that has been developed in the National Ecology Institute in compliance with what is set forth in the General Law for Ecological Equilibrium and Environmental Protection (LGEEPA) with the objective of establishing integral administration of air quality data that are generated in the country by both urban monitoring networks and individual monitoring stations belonging either to the government or private initiative. At present, SINAICA is a virtual space for linking local air monitoring systems in which free information is supplied to the public in general on air pollution, as close to real time as possible, through the Internet. The service offered by SINAICA on the administration, analysis and dissemination of air quality data is aimed at decision makers, researchers, academics and persons interested in the subject, and it therefore possesses technical and standards information, historical data bases and links to other national and international Internet pages on Air Quality.

Within this context, the Japanese International Cooperation Agency, through the Director General’s Office of the National Ambient Research and Training Center, CENICA, charged the College of Ambient Engineers of Mexico (CINAM) with the preparation of a study called “Asesoría Para la Definición de Criterios y Desarrollo de Procedimientos de Monitoreo Atmosférico” (Advice for the Definition of Criteria and Development of Air Monitoring Procedures), focused on generating guidelines to cover diverse requirements of the PNMA. As part of the specific scopes of the project, six documents on Air Monitoring in Mexico have been drawn up, whose subject matter is described below: Document 1.“Air Monitoring in Air Quality Management” This document is aimed at giving a response to the requirements of the first stage of the PNMA and therefore basically includes a diagnosis of the air monitoring systems in Mexico by describing, on the one hand, the administrative and operative system that prevails in the Air Quality monitoring networks operating in the Country and, on the other, the Legal, Political and Institutional framework on which this activity is based. Another chapter describes the importance of air monitoring in Ambient Management, principally as instruments to alert the population, for management, with health protection purposes, and for the analysis of air quality trends, among others. Finally, the last chapter presents the importance of establishing an SMA assessment and accreditation system that will have an influence on the quality of the data generated by said agencies. Document 2. “Objectives and components of Air Monitoring Systems” This document includes proposals for the establishment of SMAs using criteria related to the number of inhabitants and inventories of sources and emissions, together with the particular characteristics of the air basins. A second section puts at the consideration of the National Ecology Institute a network and station classification system in terms of representativity and territorial importance, as well as a classification of air quality monitoring stations in terms of ground use types, in both the urban and rural spheres. Chapter 2 sets forth the overall objectives of the SMAs that are recommended at national level and states the criteria used at international level for the assessment of quality of data in terms of representativity, measurement uncertainty (precision, bias and accuracy), as well as those corresponding to the limits of reliability and integrity. Chapter 3 defines the basic components of an SMA and a description and examples of the principal subsystems are given for each case.
ii

Document 3. “Design and Installation of Monitoring Networks” This document approaches the main aspects for the design and installation of SMAs based on a precise definition of objectives and characterization of the air basin where the project is to be carried out. Subsequently, criteria are given for the selection of the pollutants and meteorological parameters to be assessed and their respective measurement technologies and sampling times. The following section gives the basic criteria for determining the number of stations and requirements that must cover the selected sampling sites. A further section refers to the specific characteristics monitoring stations must comply with and the technical specifications and localization criteria for sample taking. Finally, the main considerations for the location of the computer center are presented in terms of its important role with respect to the acquisition and storage of information generated by the different monitoring stations. Document 4. “Operation, Maintenance and Calibration of Monitoring Systems” Chapter 1 describes the detection principles and main characteristics of the sampling and/or monitoring equipment used in the SMAs for the assessment of air pollutant criterion. Chapter 2 refers to the requirements for training the personnel that participate in the operation, maintenance and calibration activities of the SMAs and gives the basic criteria for team selection. Criteria are also included for the preparation of Operative Procedures (OPs) that represent an essential tool in Quality Assurance schemes. Chapter 3 sets forth the general guidelines and minimum requirements that the SMA preventive maintenance programs (PMP) must have. Basic aspects are also included related to the availability of parts, spares and equipment; the availability of appropriate Installations and the general characteristics of supervision and recording (Log) activities that must be documented in the PMPs. Chapter 4 refers to general aspects of the Calibration Programs whose convergence in this type of system with the maintenance activities in the test methods carried out is important, while the final part refers to aspects related to safety and attending emergencies.
iii

Document 5 “Management, Quality Assurance and Control in Air Monitoring Systems” The objective of this document is to introduce to those responsible for the SMAs the basic aspects for the introduction of a Quality Management System in their organizations and to give some general instructions on air monitoring practices. Chapter 3 of this document provides the bases with respect to the term ‘quality’ and a quality management system, starting with the eight principles of quality management. Subsequently, it explains how to design and implement a quality management system. Chapter 4 begins by stressing the importance of Quality Policy as a governing instrument of all activities related to quality. Subsequently, responsibilities and functions are defined based on organization structure. Similarly, the basic concepts of planning and quality objectives are described. Section 4.2 refers to the main requirements set forth in the quality standards for Quality Assurance with respect to the document system, document control, purchases, selection of infrastructure and calibration; while section 4.3 gives Quality Control criteria that are applicable to SMAs, placing special emphasis on aspects related to revision, verification and validation of data. Document 6 “Auditing Procedure for Air Monitoring Systems” This document proposes a federal auditing scheme under the precepts and guidelines set forth in the Federal Law on Metrology and Standardization concerning accreditation and the adoption of the guidelines and general criteria of the Auditing Program developed by USEPA, based on the execution of Technical System Audits, Functioning Audits and Data Quality Assessment. It is the intention that the preparation of these documents provides a series of guidelines for the preparation of both the future regulations of the General Law on Ecological Equilibrium and Protection to the Environment with respect to air quality monitoring, and the Official Mexican Standard that will set forth the minimum requirements those responsible for the operation of SMAs in Mexico must comply with. Finally, it is important to point out that the documents described above are not intended to be a technical manual, but a guide to the standards for designing, operating and maintaining air monitoring systems. It is the responsibility of the local authorities to prepare their own technical manuals on the details and quality assurance and control in accordance with the physical and technological configuration of their systems.
iv

INDEX PAGE1. INTRODUCTION 3 2. OBJECTIVES 4 2.1 Definition of Air Monitoring Systems 4 3. DIAGNOSIS OF AIR MONITORING SYSTEMS IN MEXICO 5 3.1 Current situation of Air Monitoring Networks at national level 5 3.2 Legal, Political and Institutional Situation at national level 10
3.2.1 Legal Framework 10 3.2.1.1 General Law on Ecological Equilibrium and Environmental Protection 10 3.2.1.2 Regulations on the Prevention and Control of Air Pollution 19 3.2.1.3 Official Mexican Standards 21
3.2.2 Policies 24 3.2.2.1 National Air Monitoring Program 24
3.2.3 Institutional Framework 26 3.2.3.1 SEMARNAT-INE-CENICA 26 3.2.3.2 Secretariat of Health 26 3.2.3.3 Federal Commission for Protection against Health Risks 27
4. IMPORTANCE OF AIR MONITORING IN ENVIRONMENTAL MANAGEMENT AND ITS USEFULNESS 29
4.1 Importance for alerting the population 29 4.1.1 Internal Technical Reports 29 4.1.2 External or Public Reports 30
4.1.2.1 Air Quality Indices 31 4.1.2.2 Periodical Publications 38 4.1.2.3 Statistical Indicators 39 4.1.2.4 Air Contingencies 42
4.2 Importance as Management Instrument and Other Uses 48 4.2.1 Assessment tool for environmental management programs 48 4.2.2 Correlation with Emission Inventory 51 4.2.3 Modeling 51
4.2.3.1 Advanced Modeling 52 4.2.4 Long and middle term epidemiological uses 53 4.2.5 Protection to vegetation and agriculture 54 4.2.6 Protection of ecosystems, materials and historical patrimony against acid deposits 54 5. IMPORTANCE OF ASSESSMENT AND ACCREDITATION OF MONITORING SYSTEMS 56
6. GENERAL GLOSSARY OF TERMS 58 7. BIBLIOGRAPHY 63

LIST OF TABLES PAGE
Table 3.1 Air Monitoring Networks in Mexico 7
Table 4.1. Air Quality Index Categories in the United States 32
Table 4.2. Guide to AQI Effects on Health 34
Table 4.3 Air Quality Index for Canada 35
Table 4.4 Interpretation of the IMECA 36
Table 4.5 Air Quality Indicators 40
Table 4.6 Environmental Pre-contingency 45
Table 4.7 Phase I Environmental Contingency 46
Table 4.8 Phase II Environmental Contingency 46
LIST OF FIGURES
Fig. 3.1 National Air Monitoring Program 25
Fig. 4.1 Air Quality Representation in Zones of the U.S.A 33
Fig. 4.2 Air Quality Representation in the Metropolitan Zone of the Valley of Mexico (ZMVM) 37
Fig. 4.3 Daily Maximum Levels of Ozone 1 41
Fig. 4.4 Daily Maximum Levels of Ozone 2 41
Fig. 4.5 Trends in the air monitoring of Pb 49
Fig. 4.6 Trends in the air monitoring trend of SO2 49
Fig. 4.7 Trends in the air monitoring trend of CO 50
Fig. 4.8 Concentration of PM2.5 in the U.S.A. 53
2

1 INTRODUCTION Mexico currently has a significant but insufficient number of systems, stations and equipment dedicated to the tasks of monitoring and surveillance of air quality. This infrastructure operates under a great diversity and variability of conditions and under the responsibility of agencies of different kinds, including state governments, municipal governments, boards of trustees and private and parastatal companies. Chapter 2 of this document describes their objectives and, for the purposes of this series of documents, what the Air Monitoring Systems (SMAs) are. Chapter 3 of this document provides the corresponding diagnosis of the general situation prevailing in the automatic monitoring networks that currently operate in the country (2004)., while the second part provides an analysis of the legal, institutional framework related to air quality assessment practices. Chapter 4 refers to the importance of air monitoring in Air Quality Management. It emphasizes its two primary functions: 1) to alter and protect the population from air pollution events that put health at risk; and 2) as a key instrument in the stages of planning, execution and assessment of programs, measures and actions of pollution prevention and control carried out by the authorities and society as a whole with respect to transport, fixed and area sources. Finally, chapter 5 refers to the importance of establishing a system of Accreditation for Air Monitoring Systems (SMAs) in order to have an influence on the quality of data generated by said entities.
3

2. OBJECTIVES
1. To draw up a diagnosis of the current air monitoring situation in Mexico in relation to the air quality monitoring networks that currently operate in the country and of the legal, political and institutional framework concerning air quality monitoring.
2. To stress the importance of air monitoring in environmental management
as instruments to alert the population and for management with health protection purposes.
3. To emphasize the importance of implementing an Accreditation and
Auditing System to improve the quality of the information generated by the Air Monitoring Systems operating in the country.
2.1 Definition of Air Monitoring Systems For the purpose of these documents, an Air Monitoring System (SMA) is defined as the organization responsible for generating and reporting data on air quality in an air basin under the criteria and conditions established in the PNMA. An SMA includes the human, administrative resources and infrastructure (air quality monitoring networks and meteorology networks, support laboratories and computer systems for information processing) operated under one accredited, approved quality management system.
4

3. DIAGNOSIS OF AIR MONITORING SYSTEMS AT A NATIONAL LEVEL
3.1 Current Situation of Monitoring Networks in Mexico Air quality monitoring in Mexico began to gain importance in the 1970s when it first had manual stations with which to undertake monitoring activities in such cities as the Mexico City Federal District, Monterrey, Nuevo León, Ciudad Juárez, Chihuahua and Guadalajara, Jalisco. In 1974, an automatic network was installed to monitor the Metropolitan Zone of the Valley of Mexico (ZMVM) with 15 stations, and in the 1980s the government promoted the development and operation of a monitoring network that did not reach an acceptable level of operation until 1986 (Martínez, et al, 2001). This air quality surveillance network consisted of two networks:
One automatic network with 25 stations that measured: SO2, CO, TSP, O3, NOx, NO2, Hydrocarbons with the exception of methane (HCNM), H2S and different meteorological parameters (wind velocity and direction, relative humidity and environmental temperature) One manual network with 16 stations for measuring TSP and SO2,
At the end of the 1980s, manual equipment was installed for the monitoring of TSP in Toluca, Cuernavaca, Puebla, Querétaro, San Luis Potosí, Hermosillo and the Villahermosa-Cárdenas Regional Network in Tabasco, and in the 1990s Aguascalientes, Morelia and Tepic were added. In 1992, the Automatic Air Monitoring Network (RAMA) of Mexico City was expanded and reinforced; its spatial coverage was extended to 32 remote stations, a meteorological radar, one solar, a new computer center and the installation of a redundant data acquisition system in each remote station. Similarly in that year the Monterrey Air Monitoring System (SIMA) began operations. In 1993, RAMA was transferred to what was then the Federal District Department and is now operating in the Director General’s Office for Air Environmental Management of the Environment Secretariat of the Government of the Federal District. That same year, a standard transfer laboratory was incorporated to guarantee calibration quality of the automatic field equipment.
5

In 1994, the operations of the Air Quality Monitoring Network of the Metropolitan Zone of Toluca started. Similarly, in 1996, operations began of the Air Quality Monitoring Network of the Metropolitan Zone of Guadajalara and the Network of Ciudad Juárez. INE-SEMARNAT (2003).
In 1998, the city of Zacatecas was added to the list with an automatic station for SO2, CO, NO2, O3, a meteorological station and two PM10 manual samplers. In 1997 and 2001, cities like Aguascalientes, Salamanca, Celaya, Irapuato, Puebla and Villahermosa, that had been conducting air monitoring with manual methods, started to install automatic systems. (INE/SEMARNAP, 2000). In 1999, the State Air Monitoring Network of Puebla (REMA) began to operate, as did the Air Quality Monitoring System in the Bajío Industrial Corridor, specifically in the city of Salamanca and in the year 2000 and 2001, the cities of Salamanca and Celaya joined, respectively (INE-SEMARNAT, 2003) Currently, the monitoring networks existing in the country assess the concentration of the following pollutants: sulfur dioxide (SO2), carbon monoxide (CO), particles (TSP, PM10 and PM2.5), nitrogen oxides (NOx), ozone (O3), lead (Pb), hydrosulfuric acid (H2S), heavy metals, sulfates, nitrates, and other parameters such as: solar radiation and air deposits (dry and humid). There are also devices for the determination of meteorological parameters, principally; wind direction (WD) and wind velocity (WV), environmental temperature (TMP) and relative humidity (RH). (INE-SEMARNAT, 2003) The current situation of the main monitoring systems in the country is described in Table 3.1. In general, all networks have serious financing problems and are on a much lower organic and budgetary level than the importance of the service they provide. This situation has progressively worsened over the last ten years with the economic crisis that began in 1995 and the new political stage of our country in which the subjects of greatest importance to the population are related with safety, employment and the fight against extreme poverty.
6

Table 3.1 Air Monitoring Networks in Mexico
Monitoring System Network
Number of Stations Parameters Measures
Air Monitoring Network of Mexico City (RAMA) 36 Equipped with 114 analyzers to measure: O3, SO2,NOx, CO, PM10 and
PM2.5.
Suspended Particles Manual Network (REDMA)
14 With 19 TSP sampling sites, 5 for sampling PM10, 7 remote stations for samplingPM2.5
Air Deposit Network (REDDDA
16 REDDA has 16 stations equipped with semi-automatic collectors (humid and dry deposit), the parameters measured are pH, anions and cations.
Mexico City
(Air Monitoring System of Mexico
City -(SIMAT)
Meteorological Network(REDMET)
15 Comprising 15 towers with meteorological sensors, determining such parameters: RH, TMP, WD and WV. There are 8 sties from monitoring ultraviolet radiation (UV-A and UV-B).
City of Toluca Air Quality Monitoring
Network of the Metropolitan Zone of Toluca (REDZMT)
7 Parameters measured: O3, CO, SO2, NO2, TSP, PM10, RH, TMP, WD,WVV.
Monterrey, Nuevo León
(Integral Air Monitoring System of
Monterrey-SIMA)
Automatic Network of the Metropolitan Zone of
Monterrey (REDZMM) 5
Each station is configured to measure the following parameters: O3, CO, SO2, NO2, PM10, RH, TMP, WD, WV, pluvial precipitation (PP), solar radiation and atmospheric pressure (AP).
Guadalajara, Jalisco
Air Quality Monitoring Network of the Metropolitan
Zone of Guadalajara (RAMAZMG)
8 The following parameters are measured: O3, CO, SO2, NO, PM10, NOX, and such meteorological parameters as: RH, TMP, WD and WV.
Air Quality Monitoring Network of Ciudad Juárez
(REDCJ) 3 The following parameters are measured SO2, O3, CO, NO2
meteorological parameters like: WD, WV, TMP, RH Ciudad Juárez, Chihuahua
Suspended Particles Manual Network (REDMA) 2 TSP and PM10
Puebla Automatic State Monitoring Network of Puebla (REMA) 4
Station configuration is homogeneous and consists of the following parameters: O3, CO, SO2, NO2, H2S, HCNM, PM10,
Meteorological: RH, TMP, WD, WV, UVA, UVB, PP.
Salamanca Network 3 The following parameters are measured: CO, SO2, NOx, O3, PM10
And meteorological parameters like: WD, WV, TMP. RH
Irapuato Network 3 The following parameters are measured: CO, SO2, NOx, O3, PM10
And meteorological parameters like: WD, WV, TMP. RH
Guanajuato
(Air Quality Monitoring
Systems of the Bajío Industrial
Corridor) Celaya Network 3
The following parameters are measured: CO, SO2, NOx, O3, PM10
And meteorological parameters like: WD, WV, TMP. RH
Tijuana-Mexicali, Baja California 6 Parameters measured: O3 ,NO2, SO2, CO, NO y NOx; PM10 and
meteorological parameters: TMP, WD, WV
Adapted from: PNMA (2003), www.sma.df.gob.mx/simat/, http://semades.jalisco.gob.mx/site/indexaire., www.nl.gob.mx/sduop/sima/sima_des.htm, www.edomex.gob.mx/portalgem/se/, www.arb.ca.gov/aqdpage.htm,
www.sedurbecop.pue.gob.mx/Monitoreo/Remareporte.html, Nevertheless, the level of commitment of the professionals involved in the operation of the networks is very high and professional pride can be observed in the work they do. This work mystique is particularly relevant for the future standards on the subject, since the operators have set goals far beyond those imposed by the official Mexican standards and all of them, with no exception, make extraordinary, non-remunerated efforts each day in order to comply with
7

them. From the start of their activity, all the operators have been exposed to the communication media and the population at large, a situation that can be compared to ongoing assessment of their performance as a professional work team and of their personal work. Given these circumstances, their level of commitment is greater since their work comes under the daily scrutiny of the population, including their friends and family. The most advanced administration in our country with respect to the management and monitoring of air quality is undoubtedly to be found in Mexico City. The Air Monitoring System of the Metropolitan Zone of the Valley of Mexico (SIMAT) could be the national model, which we can realistically aspire to either totally or partially in the other metropolitan, border or industrial regions of Mexico. However, it must be taken into account that the automatic air monitoring network operated in SIMAT is the oldest in the country and that the complexity and gravity of pollution in the Valley of Mexico is a strategic priority at national level and receives local resources and international support that are not replicable in other urban areas of the country. The air monitoring environmental infrastructure in Mexico is characterized by the following characteristics:
The air monitoring networks are located in metropolitan regions, capital cities, border towns and industrial zones with severe or evident problems of air pollution. The air quality monitoring networks in the country are essentially urban.
Some of the measurement networks are subject to quality assurance and control programs and have expansion plans, either because the urban areas where they are located have grown or because the original design of the networks thus determined. With the exception of the border networks, all the monitoring networks in the country have particular operative manuals and technical and administrative procedures that are different one from the other. Most of the measurement stations are located in “booths”, which
facilitates their identification, maintenance and in the case of the mobile booths, their reinstallation if necessary due to loss of representativity. The level of equipage in each station is highly varied and there are few stations that are “completely” equipped with instruments to measure all standardized parameters and those of meteorological interest. Most of the networks are equipped with instruments and equipment
from North America. The measuring equipment has operative characteristics and functions that reply to the standards imposed in the United States of America (USA), by the Environment Protection Agency (EPA), although some do not have all the internal and
8
peripheral additions requested by this agency, since they are not used in Mexico.
In general, the responsible executives and technicians in the monitoring networks have been formally trained by the manufacturers of the equipment, by personnel from the Secretariat of the Environment and Natural Resources (SEMARNAT), by personnel from the Mexico City government, by different academic institutions and by technical personnel from the EPA. The use of didactic and technical materials issued by this American agency is usual since it can be accessed for free on the Internet. Practical training in the work area is the common denominator in the training of operational technicians.
9

3.2 Legal, political and institutional situation at national level Air Quality Management in our country has been applied for little over three decades and has been fundamentally linked to the problem of air pollution to be found in the Valley of Mexico and the Northern Border. Since the first Federal Law on the Prevention and Control of Environmental Pollution in 1971, the subjects of air quality and pollution have been present, closely linked to policies and legal instruments in public health matters. The creation of the LGEEPA in the mid-eighties has meant that Air Quality Management today has a regulatory framework mainly to be found within environmental legislation, with a broadly developed institutional reflection in the administrative areas of the federal and local governments, linked to environmental protection and the promotion of sustainable development. 3.2.1 Legal Framework 3.2.1.1 General Law on Ecological Equilibrium and Environmental Protection In relation to the attributions of the federal government in air monitoring systems, the central matter of this document, the General Law on Ecological Equilibrium and Environmental Protection literally sets forth the following (SEMARNAP, 1998b):
FOURTH TITLE. Protection of the Environment CHAPTER II. Prevention and Control of Air Pollution ARTICLE 111. In order to control, reduce or avoid air pollution, the Secretariat will have the following powers: VII. To issue the official Mexican standards for the establishment and operation of air quality monitoring systems;
The attributions of SEMARNAT in matters of Air Quality Management are broader than those provided in this point. Indeed, air monitoring is just the operative component of an environmental policy aimed at protecting air quality. In our legislation it is implicit that Air is a natural resource that presents or may present problems with pollution from anthropogenic activities, which may affect the health of the population and the functional integrity of the ecosystems that comprise the national territory.
10

SEMARNAT to date has not issued any official Mexican standard to establish and operate air quality monitoring systems. The series of documents presented in this study are aimed at the compilation of the technical elements necessary to start a process in this respect, according to what is set forth in the Federal Law on Metrology and Standardization. The air monitoring systems (SMAs) operating currently in Mexico to a greater or lesser extent present functional and operative links with the Environmental Management activities that are applied in their respective localities. These links go from simple schemes such as the IMECA report to the public, the generation of leaflets for environment education purposes to schemes with greater complexity with emission inventory areas and health institutions in programs to improve air quality. In this way, there are cities in Mexico that only have manual operation monitors dedicated to the observation of the behavior of one pollutant (usually TSP or PM10) and there are, in turn, cities with air monitoring networks that have monitors and instruments and automatic systems for data acquisition and management that permit the use of information in programs of greater scope and complexity. The absence of official Mexican standards setting forth the minimum operation requirements of the SMAs that operate in Mexico has propitiated heterogeneous operation conditions in the existing networks. Even though technological differences are understandable, data quality can be affected to a larger extent due to the lack of homologation in operation criteria and quality assurance. The provisions contained in the LGEEPA with respect to Air Quality Management and air monitoring systems are adequately sufficient to issue the set of official Mexican standards necessary to design, construct, operate and maintain air quality measurement and surveillance networks at an urban or rural level.
11

3.2.1.1.1 Attributions of the Federation in matters of Air Quality management and monitoring
The Federation, through SEMARNAT, has the power to carry out the following generic tasks:
• Promotion, participation and supervision in matters of planning Air Quality Management,
• Prevention and control of air pollution,
• Processing and disclosure of information on air quality. These powers are assigned through different titles, chapters and articles in the LGEEPA, the following of which should be underlined as they have more direct linkage with the subject of air monitoring and the operative and institutional components linked to it (SEMARNAT, 2001b).
ARTICLE 5. The following are powers of the Federation: … VII. Participation in the prevention and control of environmental emergencies and contingencies, according to the civil protection policies and programs established to this effect; … XII. Regulation of air pollution from all types of emitting sources and prevention and control in zones or in the case of fixed and mobile sources of the federal jurisdiction; … XVII. Integration of the National System on Environmental Information and Natural Resources and its availability to the public under the terms of this Law; XVIII. The issuance of recommendations to Federal, State and Municipal authorities with the purpose of promoting compliance with environmental legislation; XIX. Surveillance and promotion, in the sphere of its competence, of compliance with this Law and other instruments that may derive from it;
As well as the generic attributions mentioned above, article five of the LGEEPA introduces the concept of “environmental contingency”, traditionally used to define the extraordinary intervention of the government in the face of the high air pollution indices in the Valley of Mexico.
12

The attributions of SEMARNAT on the subject are described in greater detail in Chapter II of the same LGEEPA related to the “Prevention and Control of Air Pollution”. The following articles of this chapter should be pointed out:
ARTICLE 110. The following criteria will be considered for atmospheric protection: I. Air quality must be satisfactory in all human settlements and regions of the country; and II. Emissions of air pollutants, from artificial or natural sources, fixed or mobile, must be reduced and controlled in order to ensure satisfactory air quality for the wellbeing of the population and ecological equilibrium. ARTICLE 111. The Secretariat shall have the following powers in order to control, reduce or avoid air pollution: I. To issue official Mexican standards establishing the environmental quality of the different areas, zones or regions of national territory, based on the maximum permissible concentration values for public health of pollutants in the environment, determined by the Health Secretariat; II. To integrate and keep up to date the inventory of air pollutant emitting sources of federal jurisdiction and to coordinate with local governments for the national inventory and corresponding regional inventories; … IV. To formulate and apply programs for the reduction of the emission of pollutants into the air, based on the air quality determined for each area, zone or region in national territory. Said programs shall give the objectives to be reached, the corresponding terms and the mechanisms for their instrumentation; V. To promote and technically support local governments in the formulation and application of air quality management programs that have the objective of complying with the applicable standards; … VII. To issue official Mexican standards for the establishment and operation of air quality monitoring systems; … X. To define the maximum permitted levels of emission of pollutants into the air by sources, areas, zones or regions, in such a way that the assimilation capacities of the air basins are not exceeded and that official Mexican standards on air quality are complied with;
13

XI. In accordance with the applicable provisions, to promote in coordination with the competent authorities, systems of transferable rights of emission of air pollutants; XII. To approve air quality management programs prepared by local governments in order to comply with the respective official Mexican standards; (SEMARNAP, 2001b)
The points of articles 110 and 111 of the LGEEPA allow SEMARNAT to carry out Air Quality Management processes for “air basins” in such a way that the integrity of the ecosystems and the economic and social activities linked to the so-called “fixed and mobile natural resources” are significantly transcended in a verifiable way, in public health, within a determined geographical space. The National Air Quality Information System (SINAICA) The sectorial provision most closely linked to the creation of air monitoring systems and the National Air Quality Information System (SINAICA) is the one set forth in the LGEEPA in CHAPTER II, Title Five on Social Participation, Environmental Information and specifically “Right to Environmental Information” that sets forth matters related to the functions of SEMARNAT.
ARTICLE 159 BIS. The Secretariat will develop a National System for Environmental Information and Natural Resources whose objective will be to record, organize, update and disseminate national environmental information that will be available for consultation and that will be coordinated and complemented with the National Basins System belonging to the National Statistics, Geography and Informatics Institute. In said System, the Secretariat shall, among other aspects, integrate information on the natural resources inventories existing in national territory, on the mechanisms and results obtained from the monitoring of the quality of the air, water and soil, on the ecological ordering of the territory, and the information given in article 109 BIS (Under the terms given in the regulations to this Law, the Secretariat shall draw up an inventory of air emissions....,) and information corresponding to the records, programs and actions carried out to preserve ecological equilibrium and environmental protection. The Secretariat shall collect relevant reports and documents resulting from scientific and academic activities, technical works or any other kind of work on environmental matters and the preservation of natural resources,
14

carried out in the country by national or foreign individuals or corporations, that will be remitted to the National Environmental Information and Natural Resources System. ARTICLE 159 BIS 1. The Secretariat shall prepare and publish biannually a detailed report of the general existing situation in the country in matters of ecological equilibrium and environmental protection. (SEMARNAP, 2001b)
The obligation the LGEEPA indicates for SEMARNAT to publish a report every two years on the state of the Environment in the country, also sets forth a periodicity for all systems that are integrated or linked to the National Environmental and Natural Resources System, including SINAICA. In other words, SINAICA shall provide available information on air quality from the main air basins of the country every two years which will be incorporated into the biannual report referred to above. This same periodicity can also be taken as reference for the goals and objectives of the Quality Assurance and Control Program set forth in the PNMA and the regional and local air monitoring systems. Air Quality Management By technically and chronologically ordering the activities derived from all the articles of the LGEEPA mentioned so far, we could define the following hypothetical work scheme within the Air Quality Management in Mexico:
a. An Air Basin is defined b. An air quality monitoring system is established c. The level of Environmental or Air Quality satisfactory for the wellbeing of
the population and ecological equilibrium is defined d. An inventory is made of polluting sources e. The maximum permitted levels of emission per type of source and set of
polluting sources are defined f. An Air Quality Management program is promoted, prepared and applied g. Persons unduly emitting pollution or violating the standards on the matter
are watched and sanctioned h. The population is periodically informed about Air Quality and the
administrative management of the same
15

Due to its importance, this management must support itself with reliable information provided by the air monitoring systems or networks since surveillance of air quality will allow the determination of which polluting sources are out of control, which sectors of the population are being affected, which ecosystems have been harmed, how effective the programs for the prevention and control of pollutants are, among others factors. In the following sections of this chapter the level of competence and coordination that must exist in Air Quality Management between the three levels of government, the population and, where applicable, industry will be defined pursuant to the prevailing legislation. 3.2.1.1.2 Attributions of the States and Municipalities in Air Quality
Management and Monitoring In general terms, the state and municipal authorities are responsible for applying and overseeing environmental standards at local level. In matters of air monitoring, an essential activity of surveillance, the LGEEPA is sufficiently explicit in point VII, article 112, that states that both the state and municipal governments indistinctly can operate air quality measurement systems. Similarly, state and municipal governments are implicitly linked to the activities of planning, emission inventory and attention to environmental contingencies. The LGEEPA literally says :
ARTICLE 112. In matters of air pollution prevention and control, the governments of the States, of the Federal District and the Municipalities, pursuant to the distribution of attributions set forth in articles 7, 8 and 9 of this Law, and the local legislation on the matter: … IV. Will integrate and keep updated the inventory of pollution sources; … VI. Will establish and operate, with the technical support of the Secretariat, where applicable, air quality monitoring systems. The local governments will remit to the Secretariat the local reports on air monitoring so that the Secretariat can incorporate them into the National Environmental Information System; …
16

VIII. They will take the necessary preventive measures to avoid environmental contingencies from air pollution; IX. They will prepare reports on the state of the environment in the corresponding state or municipality, to be agreed on with the Secretariat through the coordination agreements made; …
XI. They will formulate and apply air quality management programs, based on the official Mexican standards issued by the Federation in order to establish environmental quality in national territory, …(SEMARNAP, 1998b).
These attributions are complementary to those set forth by the LGEEPA in a general way in articles 7 and 8, cited below. It should be mentioned that point VI of article 112 establishes an obligation for the sending of information to the federal government. Nevertheless, as will be seen further on, the Regulations condition this dispatch to the signature of voluntary agreements in order to construct the National Air Quality Information System (SINAICA).
ARTICLE 7. Pursuant to the provisions of this Law and the local laws on the matter, the following powers correspond to the States: … III. The prevention and control of air pollution generated by fixed sources functioning as industrial establishments, and by mobile sources that, pursuant to what is set forth in this Law, are not of Federal competence; … XII. Participation in environmental emergencies and contingencies pursuant to the civil protection policies and programs established to this effect; XIII. Surveillance of compliance with the official Mexican standards issued by the Federation on the matters and suppositions referred to in points III, IV, VI and VII of this article; XIV. Management of state policy on information and diffusion in environmental matters;
ARTICLE 8. Pursuant to the provisions of this Law and the local laws on the matter, the following powers correspond to the Municipalities: … III. The application of the legal provisions on matters related to the prevention and control of air pollution generated by fixed sources that function as mercantile or service establishments, and the emissions of
17

pollutants into the air from mobile sources that are not considered to be of federal jurisdiction, with the participation that, according to state legislation, corresponds to the state government; … XI. Participation in environmental emergencies and contingencies pursuant to the civil protection policies and programs established to this effect; XII. Surveillance of compliance with the official Mexican standards issued by the Federation in the matters and suppositions referred to in points III, IV, VI and VII of this article; XIII. The formulation and management of municipal policy on the information and dissemination of environmental matters; (SEMARNAT, 2001b).
The establishment and operation of an air monitoring system at local level can be carried out, pursuant to the articles cited above, with or without the technical help of SEMARNAT. Nevertheless, the legal division of functions between the federal, state and municipal governments in matters of inspection and surveillance of polluting sources calls for coordination for both the exchange of information on air quality and emission inventories and for administrative management. The coordination mechanisms foreseen in the LGEEPA are general and there are no provisions or specific linkage models between the three levels of government for Air Quality Management. On the contrary, the modalities to be adopted can go from work groups to National Councils, going through metropolitan or regional coordinating offices such as those for the Valley of Mexico and the Bajío. In the administration of the Water resource, there is the figure of the “Basin Council” in which its users and the local and federal authorities meet. A similar figure could be established in the air basins. The example of the Metropolitan Environmental Commission (CAM) in the Valley of Mexico could be replicated in Monterrey, Guadalajara and the cities that already have programs to improve air quality. A more integral example of environmental authority in an air basin is the “South Coast Air Quality Management District (SCAQMD)” of the state of California in the USA that concentrates its functions of inspection and surveillance on the whole conurbation affected by the pollution of Los Angeles. Unlike CAM, SCAQMD has a mandate of Law, and its own budget and patrimony.
18

3.2.1.2 Regulations on the Prevention and Control of Air Pollution In general terms and specifically in matters of air monitoring, the Air Pollution Regulations of the LGEEPA ratify the contents of the Law and add very few precisions with respect to the formation or characteristics of the air monitoring systems. The Regulations date from 1988. From this date to the present, the institutional framework and the environmental sector plans and programs have changed substantially. In particular, national and international research into air pollution, at the level of the troposphere and stratosphere, and the international agreements which Mexico has adhered to, pose a scenario for Air Quality Management at local and global level that is not adequately reflected in the Regulations. These circumstances must be considered as a lag in the standards that must be corrected in the framework of the National Air Monitoring Program. Article 9 of the Regulations should be particularly stressed in this regard: a division is made between the functions of the Secretariat (now SEMARNAT) and the Federal District, since it indicates that the Secretariat will operate the monitoring network for the Valley of Mexico. At present, with the exception of San Luis Potosí and Zacatecas, where manual networks are operated for the determination of the concentrations of particles by SEMARNAT offices, no automatic air monitoring network is now operated by the federation. The first point of article 13 of the Regulations literally says that ”Air quality must be satisfactory in all human settlements and regions of the country”. This article ratifies the constitutional right of all Mexicans to an adequate environment for their development, health and wellbeing (Article 4 of the Political Constitution of the United Mexican States and Article 1 of the LGEEPA). (SEMARNAP, 1998a) In order to guarantee this right, it is fundamental to have monitoring networks that provide evidence of compliance with or violation of it. Article 7 that specifies the functions of the government federal in this respect is cited below:
ARTICLE 7. It is the competence of the Secretariat: … VI. To issue a technical decision on the air quality monitoring systems charged to the States and municipalities;
19

VII. Ensure that in the zones and sources of federal jurisdiction the provisions of the regulations are complied with and the applicable ecological technical standards are observed; … XIV. To propitiate the strengthening of ecological awareness, through the mass communication media and promote social participation for the prevention and control of air pollution; … XVIII. To promote the development of research into the causes and effects of environmental phenomena, and the development of techniques and procedures for the prevention and control of air pollution; … XXI. To issue the instructions, formats and manuals necessary for compliance with the regulations; XXII. To oversee compliance with the verification procedures and the ecological technical standards foreseen in the regulations; (SEMARNAP, 1998a)
As can be observed, the regulations cited above adduce the term of ecological technical standards that do not exist in the country today. Nevertheless, this article speaks of a “technical decision” as to local air monitoring systems, that in the current terminology of the sector’s plans and programs, we can translate as a technical decision based on the results of a voluntary Audit or a formal inspection process. To date, the federal authorities have not performed said function. Nevertheless, some of the operators of the monitoring networks have opted for ISO type certification mechanisms or for external audits with such institutions as the EPA of the USA or the TÜV of Germany. Similarly, the federal government upon a petition from and through the Director General’s Office of the National Environmental Research and Training Center (DGCENICA) conducts technical reviews and issues decisions for improving network operation. The Regulations do not have and must have a specific chapter on air monitoring systems that set forth general guidelines to this respect. Among others, it is necessary that the Regulations concretely set forth: the objectives the SMAs must have, where and why they must be installed, the minimum infrastructure (the components) they must have, the basic criteria for their operation and the general mechanisms for their assessment (audit) to guarantee the quality of their data. Additionally, the specific guidelines for the operation of the SMAs shall be issued in detail in one or several official Mexican standards.
20

The chapter most related to monitoring systems is Chapter IV that speaks about the integration of a national information system on air quality in the country. The most relevant parts are cited below.
CHAPTER IV OF THE NATIONAL AIR QUALITY INFORMATION SYSTEM ARTICLE 41. The Secretariat will establish and keep up to date a national air quality information system. This system will consist of data resulting from:
I. The air monitoring carried out by the competent authorities in the Federal District and in the States and municipalities, and II. The inventories of the pollution sources of federal and local jurisdiction and their emissions.
ARTICLE 42. OBSOLETE ARTICLE 43. The establishment and operation of air quality monitoring systems shall be subject to the ecological technical standards issued by the Secretariat to that end in coordination with the Health Secretariat with respect to human health. ARTICLE 44. The Secretariat, through coordination agreements, will promote before the States and municipalities, the incorporation of its monitoring systems and their inventories of zones and local jurisdiction sources into the national air quality information system. Similarly, it will promote before the Department for the Federal District the incorporation of its inventories of zones and sources into said national system. ARTICLE 45. The Secretariat will keep up to date the inventory of sources of federal jurisdiction and their emissions with the purpose of having a databank that will permit the formulation of the necessary strategies for the control of air pollution. This inventory will comprise the information presented under the terms of article 18 of the regulations. (SEMARNAP, 1998a).
3.2.1.3 Official Mexican Standards The official Mexican standards (NOM´s) in force that are directly related to air quality monitoring are those that have been issued by the Health Secretariat (key SSA) and that set forth the levels of concentration of pollutants, called “criterion” for the protection of the population. The standards issued to date are the following:
21

• NOM-020-SSA1-1993. Environmental health. Criterion for assessing the permitted limit value for the concentration of ozone (O3) for ambient air quality. Criterion to assess air quality. (SSA, 1993a)
• NOM-021-SSA1-1993. Criterion to assess ambient air quality with respect to carbon monoxide (CO). Permitted value for the concentration of carbon monoxide (CO) in the ambient air, as a measure of protection of the health of the population. (SSA, 1993b)
• NOM-022-SSA1-1993. Environmental health. Criterion to assess air quality, sulfur dioxide (SO2). Permitted value for the concentration of sulfur dioxide in ambient air as a measure of protection of the health of the population. (SSA, 1993c)
• NOM-023-SSA1-1993. Environmental health. Criterion for assessing air quality, nitrogen dioxide (NO2). Permitted value for the concentration of nitrogen dioxide in ambient air, as a measure of protection of the health of the population. (SSA, 1993d)
• NOM-024-SSA1-1993. Criterion to assess the quality of ambient air, with respect to total suspended particles (TSP). Permitted value for the concentration of total suspended particles (TSP) in ambient air, as a measure of protection for the health of the population. (SSA, 1993e)
• NOM-025-SSA1-1993. Criterion to assess ambient air quality with respect to particles less than 10 micras (PM10). Permitted value for the concentration of particles less than 10 micras (PM10) in ambient air, as a measure of protection for the health of the population. (SSA, 1993f)
• NOM-026-SSA1-1993. Environmental health. Criterion to assess air quality, lead (Pb). Permitted value for the concentration of lead in ambient air, as a measure of protection for the health of the population. (SSA, 1993g)
Furthermore, there are also the corresponding test methods to determine concentrations of CO, TSP, O3 NO2 SO2 in ambient air and the corresponding procedures to calibrate the measuring equipment, which have been published as NOMs with the SEMARNAT key 1 :
• NOM-034-SEMARNAT-1993 that sets forth the measurement methods to determine the concentration of carbon monoxide in ambient air and the procedures to calibrate measuring equipment. (SEMARNAT, 1993a)
• NOM-035-SEMARNAT-1993, that sets forth the measurement methods to determine the concentration of total suspended particles in the ambient air and the procedure to calibrate measurement equipment. (SEMARNAT, 1993b)
1 Under the Federal Law of Metrology and Standardization, test methods are termed Mexican Standard (NMX).
22

• NOM-036-SEMARNAT-1993 that sets forth the measurement methods to determine the concentration of ozone in the ambient air and the procedures to calibrate measurement equipment. (SEMARNAT, 1993c)
• NOM-037-SEMARNAT-1993 that sets forth the measurement methods to determine the concentration of nitrogen dioxide in the ambient air and the procedures for calibrating measurement equipment. (SEMARNAT, 1993d)
• NOM-038-SEMARNAT-1993 that sets forth the measurement methods to determine the concentration of sulfur dioxide in the ambient air and the procedures to calibrate the measurement equipment. (SEMARNAT, 1993e)
In this respect it is important to point out that in the case of Lead (Pb) and Particles less than 10 micrometers, the corresponding SEMARNAT standards have not been issued. Similarly, in the case of the O3 and SO2 parameters, the equivalent instrumental methods set forth in said standards are used, therefore, properly speaking, there are no procedures published in detail on the principles of visible UV and pulsed fluorescence, respectively.
23

3.2.2.1 National Air Monitoring Program The Secretariat of the Environment and Natural Resources, through the National Ecology Institute, has developed and presented the National Air Monitoring Program (PNMA), which sets forth a specific policy framework on the subject and follows the guidelines set forth to date by the National Democratic Planning System. The objective of this program is:
To establish an air monitoring program that guarantees diagnosis and surveillance of the state of air quality at national level, that generates real, valid information that can be compared among the different sites and networks of the country, as a fundamental instrument in the establishment of environmental policies for the protection of the health of the population and ecosystems (INE-SEMARNAT, 2003).
This program is divided into three sequential, progressive stages. In the first stage, the program sets forth the following objective: to draw up a diagnosis of the current state of air monitoring systems that operate in the country, revising the laws and institutions on which they are based and the financial mechanisms that economically sustain them. This first stage is concentrated on the development of tools and procedures governing the operation of air monitoring systems that makes it possible to guarantee the quality and “comparability” of the date these systems generate. The second stage of this program attempts to establish a set of strategies for the definition of areas or cities where the priority is to install air monitoring systems. These strategies will be designed to induce an integral Air Quality Management linked to air monitoring with an emphasis on actions like increasing the awareness of the population and the development of a state policy on the matter. The third stage seeks to apply tools and strategies to cover the demand for air monitoring in the priority sites, to homologate air monitoring practices, set up quality assurance and control systems and establish a system of supervision, assessment and surveillance through national level audits. This stage contemplates preparing a proposal for the integration of national networks for the measurement of toxic pollutants in the regions in which their existence is suspected or has been proved. The following figure shows the principal objectives of the National Air Monitoring Program that is being implemented by SEMARNAT.
24
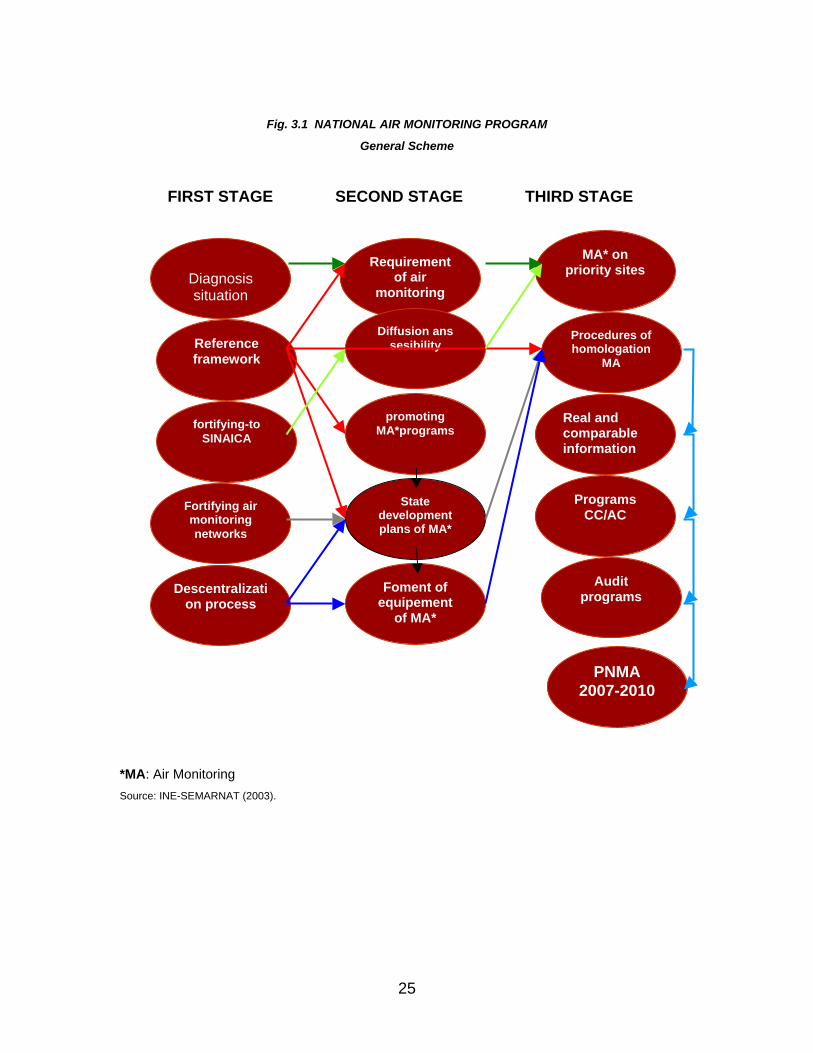
Fig. 3.1 NATIONAL AIR MONITORING PROGRAM
General Scheme
MA* on priority sites Requirement
of air monitoring
Diagnosis situation
Diffusion ans sesibility
Procedures of homologation
MA Reference framework
promoting MA*programs
Real and comparable information
fortifying-to SINAICA
Programs CC/AC
State development plans of MA*
Fortifying air monitoring networks
Audit programs
Foment of equipement
of MA*
Descentralization process
PNMA 2007-2010
FIRST STAGE SECOND STAGE THIRD STAGE
A: Air Monitoring ource: INE-SEMARNAT (2003).
*MS
25

3.2.3. INSTITUTIONAL FRAMEWORK
ir Quality Management is carried out in the federal government through several dministrative units located in the Secretariats of Health, the Interior and the nvironment and Natural Resources.
SEMARNAT-INE-CENICA
SEMARNAT, the subject is given transversal treatment and involves the dministrative structures of practically all the subsecretariats and agencies it omprises. The Director Generals’ Offices whose central objective is related to
y measurement are of particular portance.
etariat for Environmental Protection Management, a Director Recording and Transfer of Pollutants has
recently been formed and has different attributions related to air monitoring systems with air quality management at the level of air basins in coordination with state and municipal authorities. These attributions are given in detail in article 29 of the Internal Regulations of SEMARNAT. 3.2.3.2 Health Secretariat In the Health Secretariat and the health sector there are institutions with broad powers to intervene in air pollution matters for health reasons. Thus, epidemiological tasks linked to air monitoring systems are specified in the following articles of the Internal Regulations of the Health Secretariat:
Article 45. The following actions correspond to the National Epidemiological Surveillance and Disease Control Center:
XI. To coordinate the National Epidemiological Surveillance System, including the National Epidemiological Surveillance Committee and international epidemiological surveillance actions; … XIV. To opportunely disseminate the results and information generated by disease prevention and control actions, and attention to emergencies and disasters, epidemiological surveillance and other actions that are carried out; (SSA, 2003h).
AaE 3.2.3.1 Inacthe emission of pollutants and air qualitim In the UndersecrGeneral’s Office for Air Quality and the
26

3.2.3.3 Federal Commission for Protection against Health Risks (COFEPRIS)
n the DOF through the addition and repeal f different articles of the Health Law (LS). Said Commission shares attributions ith the SS for health regulation, control and development under the terms of the
EPRIS issued in April, 2004.
Health Surveillance: “The set of assessment, verification and supervisory actions with respect to compliance with the requirements set forth in the
ked with epidemiological urveillance in the country:
h its objective, COFEPRIS has been charged with the following attributions:
II To prepare and issue, in coordination with other corresponding competencies, the
V. To identify, analyze, assess, regulate, control, develop and disseminate the s;
strategies of research, assessment and follow-up of health risks, together with or assisting other competent authorities;
development e of
the population to chemical, physical and biological factors; XII. To participate, in coordination with the corresponding administrative units of the SS in the implementation of disease prevention and control actions, and in
COFREPRIS is a decentralized Health Secretariat (SS) agency that was created by a decree issued on 30 June, 2003 iowLS and those set forth in the Regulations of COF Article 2 of Chapter 1 referring to the General Provisions of this regulatory instrument defines the following as:
Health risk: “The probability of occurrence of an adverse, known or potential exogenous event that puts health or human life in danger”
applicable provisions that must be observed in the processes, products, methods, facilities, services or activities related to matters that are the competence of the Federal Commission”.
While article 3 sets forth the following points lins
Article 3. In order to comply wit
I. To exercise regulation, surveillance and health development that correspond to the SS under the terms of the applicable provisions in the matter of:
... n). harmful effects of environmental factors on human health. ...
Official Mexican Standards and other provisions of a general character referred to in point I;
...
conditions and requirements for the prevention and management of health risk... IX. To apply
... XI. To exercise the corresponding control, regulation and health actions in order to prevent and reduce health risks derived from the exposur
27

epidemiological surveillance, when they are related to health risks derived from the processes, products, methods, facilities, services or activities in the matters referred to in point I of this article. (COFEPRIS,2004)
al
Considering the direct responsibility of the Health Secretariat in issuing Air Quality Standards and the functions of COFEPRIS cited above, it can be determined that said Commission could and must play a determining role in the implementation of environmental air contingencies, specifically with reference to epidemiological surveillance, in coordination with the National Epidemiologic
e and Disease Control Center. Surveillanc
28

4. IMPOMANA
he main product of an air monitoring system is the information it generates. In this way air quality data are the input of highly diverse, interrelated planning, regulation, education and research processes. As will be seen in document 5, each Air Monitoring System must have a Quality Management System with effective procedures for document control. Under a Quality Administration approach, the documentary system must be consistently structured and permit traceability of the different stages of the process, from sampling and/or monitoring to the delivery of validated data for the generation of internal technical reports and external reports. In the following sections, the importance and principal characteristics and applications of the above mentioned reports are described. 4.1 IMPORTANCE FOR ALERTING THE POPULATION One of the primordial objectives in the control of air pollution is to guarantee a health environment that permits the population of a specific area to have satisfactory air quality. Air monitoring measures the necessary parameters to assess if air pollutants are in adequate concentrations; the legal instruments to determine this are air quality standards. Air monitoring practices involve the compilation, recording and processing of millions of annual data, therefore it is necessary to have efficient, reliable procedures to classify and synthesize said information starting with the preparation of internal technical reports and the corresponding external reports (public). 4.1.1 Internal Technical Reports This type of report can be generated daily, weekly or monthly or there can be special reports on emergency situations. They usually deal with concise reports
RTANCE OF AIR MONITORING IN ENVIRONMENTAL GEMENT AND ITS USEFULNESS
Air monitoring is fundamental in identifying and providing the necessary information for the assessment of air quality and its trends in the country. Similarly, it is an essential instrument for the development of policies and air pollution prevention and control strategies. T
29

on specific air quality data for determined pollutants per station or zone, given in oncentration units (ppm, ppb, µg/mboth c spective equivalents in
• Demonstrating to the internal and external Comptrollers’ Offices the
• Making decisions to undertake environmental pre or contingency plans according to the meteorological forecasts and reliability levels of the air
general, the internal technical reports generated by an SMA must comply with
the communication media. Similarly, for
description is given below of the functions of the short term public reports ollowing sections state the characteristics of
iddle and long term public reports that include an analysis of the data from the stical indicators.
3) and their rernal reports can be aimed at: IMECAS. The application of said inte
• Objectively and concisely informing top level authorities of the organization, for example, Secretaries of State, Governors, etc. of the prevailing air quality conditions.
appropriate use and budgetary exercise based on the compilation of periodical reports, as evidence of the functioning of the infrastructure and resources allocated to the air quality monitoring program.
quality data during critical periods.
• Replying to requests for air quality information for special study and/or research purposes (for example, data on PM10 concentrations recorded in one or more stations of interest during a specific period).
Inthe revision and authorization requirements contemplated in its document control procedures, and have sufficient documentary support to demonstrate their veracity in cases of claims or doubts. 4.1.2 External or Public Reports Another of the determining objectives of air monitoring is to oversee the behavior of air pollutants in relation to air quality standards for purposes of protecting the health of the population. Within this context, SMAs must comply with the important function of informing the population of the pollution levels to which they are exposed, through reports given out inthe population interested in the subject of air quality, it is necessary to supply periodical publications with necessary, sufficient information on historical data, behavior and trends of air pollutants in their locality and their interpretation in relation to the measures introduced within the air quality management programs. Acalled air quality indices, while the fmuse of stati
30

4.1.2.1 Air Quality Indices Air Quality Indices are oriented at informis
ng the population of pollution levels in a imple, precise, opportune way and permitting the environmental and health
propopula Theamong Frocou rthem o The Apolluta level present in ne zone or determined locality that can be easily understood by the public. The eighting factor used in different countries considers air quality standards and
United States, Canada and Mexico are escribed in a general way below.
nited States
tection authorities to undertake pertinent measures to protect the health of the tion in cases of contingency conditions.
information on pollution levels also has the objective of creating awareness the population on the importance of air quality for health.
m the seventies onwards, air quality indices have been used in different nt ies as the direct communication mechanism with the population to inform
f the state of air quality.
ir Quality indices are weighted and transform the concentrations of air nts to an adimensional value which indicates the pollution
owthe potential damage to the health of the population. The air quality indices used in the d U In the United States the Air Quality index currently used is known as AQI (Air Quality Index), its main objective is to communicate to the population the air pollutant levels and their respective effects on health. The AQI is based on the primary air quality standards for the following four pollutants: CO, O3, PM10 and PM2.5, and uses 6 categories, each category corresponding to a different level of adverse health effects, which is also identified with a color to provide better understanding as shown in table 4.1.
31

Table 4.1. Air Quality Index Categories in the United States
AIR QUALITY INDEX (AQI) Values
LEVELS OF HEALTH CONCERN COLORS
..when air quality is in this range...
...air quality conditions are:
.. as symbolized by this color
0 to 50
GOOD GREEN
51 to100
MODERATE YELLOW
101 to 150 UNHEALTHY FOR SENSITIVE GROUPS ORANGE
151 to 200
UNHEALTHY RED
201 to 300
VERY UNHEALTHY PURPLE
301 to 500
HAZARDOUS MAROON
Source: http://www.epa.gov/airnow/aqi.html
Similarly, the representation of the color code helps to rapidly identify the degree of adverse health effects in a zone due to the presence of air pollutants, information that the EPA presents to the public via Internet on a national scale (U.S.), as shown in Figure 4.1 where air quality conditions in some zones of the country can be seen to be moderate and harmful in others.
32

F ones of the U.S.A.
ig. 4.1. Representation of Air Quality in Different Z
Source http://www.epa.gov/airnow/weekend.html
Furthermore, so that the population can with air pollution the www.epa.go l
understand the effectv/airnow/aqi.htm
s associated AQI site gives additional
information on specific symptoms of exposure to each of the 4 pollutants at the wn in Table 4.2. different levels of the scale sho
33

Table 4.2. Guide to the Effects to Health of the AQI
Health Categories Ozone Particles,
PM2.5 Particles,
PM10
Carbon Monoxide
(CO)
VERY UNHEALTHY (201 to 300)
Active children and adult, and people with lung disease, such as asthma, should avoid all outdoor exertion (Participation in difficult sport exercise). Everyone else, especially children, should avoid prolonged or heavy exertion outdoors.
People with lung and heart disease, older adults and children should avoid all outdoor activity. Everyone else should avoid all prolonged exercise
People with lung disease, such as asthma, should avoid outdoor exertion. Everyone else, especially older adults and children, should reduce outdoor exercise.
People with cardiovascular disease, such as angina, should avoid exercise and CO emission sources such as heavy traffic.
UNHEALTHY (151 to 200)
Active children and adults, and people with lung disease, such as asthma, should avoid prolonged or heavy exertion outdoors. Everyone else, especially children, should reduce prolonged or heavy exertion outdoors.
People with lung and heart disease, older adults and children should avoid prolonged sports. Everyone else should reduce prolonged exertion.
People with lung disease, such as asthma, should avoid outdoor exercise. Everyone else, especially older adults and children, should reduce outdoor exertion.
People with cardiovascular diseases, such as angina, should reduce moderate sports and avoid heavy traffic.
UNHEALTHY FOR SENSITIVE GROUPS (101 to 150)
Active children and adults, and people with lung disease, such as asthma, should reduce prolonged or heavy exertion outdoors.
People with lung and heart disease, older adults and children should reduce prolonged exercise
People with lung disease, such as asthma, should avoid outdoor exercise.
People with cardiovascular diseases, such as angina, should reduce heavy sports and avoid heavy traffic.
MODERATE (51 to 100)
Unusually sensitive people should consider reducing prolonged or heavy exertion outdoors.
None None None
GOOD (0 to 500)
None None None None
Source: http://www.epa.gov/airnow/aqi.html
anada
nalogously, the Canadian Environment Agency, Environment Canada, has eveloped an Air Quality Index called AQUI (Air Quality Index), which consists of
C Ad
34

4 levels based on a color code with a range of 0 to 100 points. Table 4.3 shows the values and co quality situation.
Table 4.3. Air Quality Index for Canada
lor code used to inform the population of the air
INDEX
(AQUI) AIR QUALITY
0-25 Air quality is GOOD
26-50 Indicates FAIR air quality
51-100 Air quality is POOR
100 Air quality is VERY POOR Source: http:// /0www.gnb.ca/0009/0355 003/0011-e.html
Í are as follo
air pol
C ws:
• Good (AQUI= 25 or less). In this category, lution levels are very low.
• Fair, (AQUI = 26 to 50): At this level, pollutants are relatively low, but can to id hav act on
(A ) po usema ate ion.
oor, (AQUI higher than 100): As of this level, air pollutants present a significant risk to health and the environment.
Mexico
ct to Mexico, at the end of 1977, the Director General’s Office for Air riat of Ambient Improvement of the Health and
n Air Quality Index, “IMEXCA”, with the urpose of informing the public accurately and opportunely about air quality. The
structure of the IMEXCA was based on the Pollutant Standard Index ) used in the United States at that time.
The genera
l interpretation riteria of the AQU
cause aecosyste
• Poor, to hu
• Very P
dverse effectsms.
QUI = 51 to 100ns, animals, w
sensitive indiv
: At this level,r and vegetat
uals and can
llution can ca
e an imp
adverse effects
With respeSanitation of the UndersecretaWelfare Secretariat developed the Mexicaptechnical (PSI
35

The index is now called the Metropolitan Air Quality Index “IMECA” and is generated for the criterion pollutants that can be measured in real time: O3, NO2, SO2, CO and PM10. When the Metropolitan Air Quality Index of any pollutant reaches 100 points it means that said pollutant has reached the concentration permitted by the standard. As leve d 100 points they are harmful to health and as the value of the IMECA increases, symptom re acute. The IMECA also considers a range of 0 but at national level no color co established for the specific representation of each level, however in the case of SIMAT in the Metropolitan Zone of Mexico City, t eing used as shown in Table 4.4 where the sent the and criteria.
Table 4.4 Interpretation of the IMECA
ls excees become mo
to 500 points divided into 4 categoriesde has yet been officially
he use of colors is by pre IMECA interpretation levels
Interpretation of the IMECA
IMECA Condition Effects on Health
0 - 100 Condition within the norm None
101 - 200 Unsatisfactory Discomfort in eyes, nose and throat in sensitive condition people
201 - 300 Bad condition problems Avoid outdoor activities. Possible breathing
301 - 500 Very bad condition
become more acute in sensitive people, smokers and people with
chronic diseases
The above symptoms
S
ource: http://www.sma.df.gob.mx/simat/pnimeca.htm#imeca
e ZMVM air quality is unsatisfactory, hile in the rest of the urban area it is satisfactory. This information is given to
n the Internet.
Figure 4.2 shows a map of the Metropolitan Zone of the Valley of Mexico giving the IMECA levels for Ozone using the color code which helps to better identify and interpret the air quality prevailing at 2:00 pm on 15 August, 2004, in which it can be observed that in the south sector of thwthe public by SIMAT o
36

Fig. 4.2 Representation of Air Quality in the ZMVM
Ozone Intervals (Points in IMECA)
0-50 Good
51-100 Satisfactory
101-150 Unsatisfactory
151-200 Bad
>200 Very Bad
Interpolation Limit
Source: http://www.sma.df.gob.mx/imecaweb/mapa In this respect, it must be pointed out that in Mexic and calculation of the Metropolitan A Index health standards referred to above n standard, but on an intersecretarial agreement. Although the agreement binds
if it is an instrument adoption of heterogeneous
riteria in its dissemination. In this way, it will be appropriate if when the ensuing fficial Mexican standard is issued, a homologation criterion is given like the one
d by INEGI.
s/mapao3.php
o the use ir Quality , IMECA, is based on values defined in the
that are not specified in any official Mexica
the federal government to apply it, it is not legally clears, which has led to the applicable to local government
coproposed below:
• The daily dissemination of the Air Quality Index will be obligatory at least every two hours in the period from 6 a.m. to 10 p.m. in all urban areas with a population equal to or more than one million inhabitants based on the last population census publishe
37

• In order to homologate and modernize the way in which it is presented to the pub hat th recommend grading by colors including the complementary notes or figures judged to be convenient for its interpretation.
• Dissemination to the public of the state of air quality through IMECA must be carried out at least through two mass media such as: the T.V., radio and press in order to guarantee reasonable coverage of the population.
In most of the air quality monitoring systems currently operating in the country, dissemination of the IMECA is carried out only on Internet whose access level is highly limited for most of the population. 4.1.2.2 Periodical publications Air monitoring systems shall have an area devoted to the preparation of statistical, cartographic and interpretative reports on the air quality of the air basin under surveillance. Among other possible functions, this area will be responsible for validating the data generated by the measurement networks, creating the system’s databases and reporting values each hour as quality indices and transferring the information to the social communication area so that it can be disclosed to the public. Air Quality c e o e n through multiple possible statistical, cartographic methods, mathematexperimental simu er to be able to stablish explicative lines for the phenomena of dispersion, concentration and
licative reports with graphic and didactic elements for the best nderstanding possible of the population.
At preintegrafedera for the federal government agencies linked to the management of environmental and health information.
lic so t ey can understand it better, we fully
data an be corr lated with th se of th emissio s inventoryical modeling and
lation (for example, ozone chambers) in ordetransformation, in time and space, of the pollutants in the air basin under surveillance. Another aspect that must be considered is that in order to comply with the Federal Law on Transparency and Access to Public Government Information and the General Law on Ecological Equilibrium, the validated and interpreted data on Air Quality generated in the different monitoring systems operated in the country shall be published at least every two years, and it is desirable that they take the form of simple, expu
sent the air quality data report from the monitoring networks that is being ted into SINAICA is implicitly related to the different attributions of said l legal framework that has been drawn up
38

Ne tmodificthe offset for MAs shall issue perrep t
.1.2.3. Statistical Indicators
r a determined period of time. Similarly, om the use of said indicators, the current situation and/or the air quality trends
simple technical elements facilitates access to e different sectors of the population. ( Muñoz,1997)
nd Development (OECD).
First and second maximum concentrations in the year
ver heless, it would be expected that, in the middle term, using the ation in the related environmental legislation, and specifically the issue of icial Mexican standard referred to in document 6, specific guidelines are th for the terms in which those responsible for the S
iodical publications of the air quality data for their respective localities and the or requirements that must be covered for purposes of consolidating SINAICA.
4
Indicators are statistical tools used to clean and facilitate the interpretation of historical information on air quality data fofrcan be diagnosed or forecast. The Environment Secretariat of the Federal District through SIMAT has an Air Quality and Meteorology Indicator System. Its monthly updating makes it possible to opportunely know the evolution in time and space of the different parameters it measures and the incidence of extraordinary events. As a result of their reliability, these indicators are a tool that supports decision making at the moment of assessing the efficiency of the air pollution prevention and control programs. Their preparation with th The indicators used by SIMAT are based on the technical guidelines of the California Air Resources Board (CARB), and on the Pressure-State-Response Environmental Assessment Indicators (PSR) recommended by the Canadian Environmental Agency, Environment Canada, and the Organization for Economic Cooperation a These State Indicators are descriptive statistical parameters that summarize a large amount of information. Conceptually, they efficiently measure the “progress” in the reduction of emissions into the air in a specific area and illustrate Air Quality problems in order to assess the effect of control strategies. Hence the frequency and intensity of the concentrations that exceed a standard must be measured. The State Indicators commonly used are the following:
Percentiles (98,95, 90, 75, 50) Average of the 30 maximum daily concentrations in the year (top 30) Time indicators
39

Average length of annual excesses Annual average of exposure
Table 4.5 presents a description of said indicators.
Table 4.5 Air Quality Indicators
INDICATOR DESCRIPTION
First and second maximum
concentration of the year
These indicators are obtained from the first and second maximum annual concentration recorded in the monitoring stations with the best historical performance. The CARB recommends them for ozone, carbon monoxide, nitrogen dioxide and sulfur dioxide.
Due to their extreme nature, the use of methods to estimate missing data is not recommended.
Percentiles 98, 95, 90, 75 and 50
State of air quality, it is obtained from the ascending order of the maximum daily concentrations, in such a way that concentration 347 is the point where 95% of the data are accumulated and it would be the equivalent of the 95th percentile. This process involves only the monitoring stations with the best historic performance. Methods can be used to estimate missing data
A percentile is a value above which a specific percentage of the total number of values can be found. For example, 80% of observations can be found above the 20th percentile. As an Indicator of the
Average of the 30 maximum daily
concentrations of the year (top 30)
This Indictor is specific for ozone and is obtained by averaging the 30 maximum concentrations in a year in the monitoring stations with the best historic performance. In the trend analysis, a close association can be found with changes in emissions, and it permits attenuation of the influence of the annual meteorological variations.
Number of days of annual excess
This indicator is obtained as a frequency of hours or days in which an established concentration is exceeded, generally a health protection standard. This indicator makes it possible to observe when an area is soon to reach permitted pollution limits. Methodobtaining it.
s to estimate lost data can be used in
Annual average excess time
standard, providing a measurement of the impact of a pollutant on the health of the inhabitants.
It is used for ozone as it is the pollutant that most frequently exceeds its health standard. It supposes that the individuals exposed to concentrations measured by the monitoring network in such a way that it does not consider the daily activity patterns in microambients which can increase or decrease exposure.
This indicator shows average annual exposure time outdoors to concentrations that exceed a health
Source: Muñoz (1997) y www.sma.df.gob.mx/simat/ (2004)
In Figures 4.3 and 4.4 examples are shown of the application of these indicators to describe the behavior of ozone in the Metropolitan Zone of the Valley of Mexico during the period 1986-2004.
40

ximums of Ozone 1 Fig. 4.3 Daily Ma
Máximos Diarios de Ozono (O3), 1986 - agosto 2004
159
226
0.050
0.100
C
308 313325 335
317 320340
319308
146
0.000
00
0.250
0.300
1986 1987
once
ntra
ción
(ppm
)
60
180
240
300
360
mer
o de
día
s
317 311 305286
273 281
253120
Nú0.150
0.350
0.2
1988 1989 1990 1991 1992 1993 1994 1995 1996 1997 1998 1999 2000 2001 2002 2003 2004
Año
0
Días arriba del valor límite Promedio, TOP 30 Percentil 90
Source: http://www.s
ma.df.gob.mx/simat/tablas_xls/indicadores/O3.xls
Fig. 4.4 Daily Maximums of Ozone 2
Máximos diarios de Ozono (O3), 1986 - agosto 2004
0.000
0.200
0.400
0.500
Con
cent
raci
pm) Percentil 75
Máximo
Percentil 900.300ón
(p
Percentil 50
Mínimo
0.100
1986 1988 1990 1992 1994 1996 1998 2000 2002 2004
Año Percentil 25
Source: http://www.sma.df.gob.mx/simat/tablas_xls/indicadores/O3.xls
he trends in ozone behavior during the period from 1986 to August, 2004, can e observed in the graphs. The first graph illustrates the correlation existing etween percentile 90 and the Top 30 indicators as well as the downward trend at can be seen between 1995 and 2003. The second graph shows the
ing other indicators, such as percentiles 5, 50, 75, 90, 95, 98 and the maximum concentrations recorded in that period. he pink boxes only represent greatest uncertainty as to data.
Tbbthconfirmation of this trend. This is done us2T
41

Both the indicators and the indices are tools supporting air quality management with which strategies can e decisions made when there are high pollution levels; for example, the quality indices are the basis for the execution of environmental contingency programs. Similarly, when the value of the quality index of a pollutant systematically exceeds 100 points, whatever the prevailing meteorological conditions and seasonal changes in climate, it is necessary to develop and apply an integral air quality improvement program to establish immediate and middle term measures to protect the population, decrease polluting emissions leading to safe concentration levels for health in a reasonable period of time. 4.1.2.4. Air Contingencies
hen meteorological conditions are adverse with respect to the dispersion of ollutants and pollutants accumulate in the air in higher concentrations than
those marked by the air quality stauthorities must issue a public alert and co tions with the rest of the authorities of the city to protect the population and decrease the emission of the pollutant(s) that have exceeded their concentration in the air. As mentioned earlier, the Metropolitan Air Quality Index with a value of one hundred (100) corresponds to the standard considered as the maximum safe concentration, without harm to the health of persons from a pollutant. When the IMECA value of a parameter exceeds 100 points in an extraordinary way in an air basin or parcel, the public alert mentioned in the paragraph above must be given in the framework of an Air Contingency Program that complies with all the regulations set forth in the LGEEPA and the federal and state Civil Protection laws with respect to environmental contingencies.
ood to be the recording of high oncentrations of pollutants (higher than 100 points IMECA) caused by combined
be developed and immediat
Wp
andards, the environmental and health ordinate ac
An extraordinary air pollution event is understcphenomena of high air stability, detectable by the existence of a high pressure synoptic system, surface wind velocities less than 1 meter a second in the whole air basin under surveillance, zero pluvial precipitation and a surface layer of mixture less than 300 meters high leading to prolonged thermal inversion conditions that, together with high solar radiation indices, can aggravate the scenario and meteorological forecast of the air contingency.
42

But in terms of extraordinary events, an environmental contingency program should be introduced. Its principal characterizes are described in the following section. Air Contingency Programs
scale, from 100 to 500 points. The action phases will be defined with break-off points to be set by the health authorities, according to the levels of incidence of diseases associated to air pollution problems.
ures at two action levels: in order to decrease the problem pollutant(s) (primary or secondary and their precursors) and to avoid the simultaneous presence of pollutants in highly
• Communication mechanisms between the public and the authorities to activate and deactivate the contingency program.
Air contingency programs must contain the following defining elements:
• Actions to be taken by phases along the whole IMECA
• Emitting sources control meas
stable air.
• Protection measures for the following labile groups: children, pregnant women, older adults, cardiovascular patients, lung disease patients and sportsmen, in the case of contingencies due to photochemical or secondary pollutant contingencies.
• Internal communication mechanisms between the health, environment, civil protection, transport, education and energy authorities, among other possible participants according to federal and local environmental legislation.
• Environmental and epidemiological assessment mechanisms for the program for each event that occurs.
Air contingency programs should preferably be developed within the citizen coordination and participation agencies that have been set up or operate in each air basin. Similarly, information must be given about them through the mass media, electronic and written, so that the population is informed or can gain access to the program contents whenever necessary.
43

Example from the case of the ZMVM Inc
the case of the ZMVM, the air environmental contingency program (PCA) onsists of three phases as follows:
a) Precontingency
• Phase I contingency due to O3
• Phase II contingency due to PM10
Its terrconurb The Co through a declaration con m
1. corded.
event)
. Prevailing and expected meteorological conditions
f the Federal District transmits over the electronic communication media the ircular corresponding to the territorial areas affected and the agencies taking art in surveillance and compliance with the measures. With respect to oordination with Estado de México, the Technical Secretary of the Metropolitan nvironment Commission (CAM) informs the Ecology Secretariat of Estado de
b) Phase I
• Phase I contingency due to PM10 (regional or general)
• Phase I contingency due to a combination of O3 and PM10
c) Phase II
• Phase II contingency due to O3
itorial application is for the 18 divisions of the Federal District and 18 ation municipalities of the Estado de México.
ntingency Program follows an operative mechanismte plating the following points (SMA-DF, 2000):
The maximum level reached by the quality index, the time and zone in which it is re
2. The spatial dimension of the event (if there are high levels of pollutants over a wide area or if it is a punctual
34. The corresponding phase of the program and the applicable measures 5. The term during which the respective measure will remain in force
declaration has been made, the Environment SecretariatOnce the contingency
ocpcE
44

México of the activation of the PCA for the coordination of the corresponding ctions of a metropolitan character.
nvironmental Precontingency An environmental precontingency is declared by the competent authorities when the concentration p ls potentially harmful to the health of the most and suspension values are given in Table 4.6.
Table 4.6 Environmental Pre-contingency
a E
of ollutants in the air reaches leve vulnerable population. Its starting (SMA-DF, 2000)
Precontingenci des ue to: START (IMECA)
SUSPENSION (IMECA)
OZONE Levels between 200 and 240Levels less than 180
PM10 Levels between 160 and 175Levels less than 150Source: (SMA-DF, 2000)
Phase I Environmental Contingency With respect to Phase I, the activation and deactivation of an environmental conzones it comprises, one of the values givecase of contingency due to PMof tIn the event that contiin a a phase I contingency is dIf P se I is
tingency due to ozone takes place for the whole ZMVM when, in any of the n in table 4.7 is recorded. While in the
10, it is exclusively applied in the zone where one he IMECA values given in table 4.7 is recorded.
ngency values of PM10 are recorded in two or more zones period of 24 hours following activation in the first zone,eclared for the whole ZMVM. M10 contingency values are recorded simultaneously in two zones, pha
declared in the whole ZMVM. Activation and deactivation of environmental contingency due to the combination of O3 and PM10, occurs in the whole ZMVM when the values given in table 4.7 are recorded in any of the zones that comprise it. (SMA-DF, 2000)
45

Table 4.7 Phase I Environmental Contingency
Contingencies due to:
Activation (IMECA)
Deactivation (IMECA)
OZONE Levels greater than 240 Levels lower than 180
PM10 Levels greater than 175 Levels lower than 150
OZONE AND PM10
When levels of Ozone greater than 225 and of PM10 greater than 125 points are reached
simultaneously
Ozone levels lower than 180
Source: (SMA-DF, 2000):
hase II Environmental Contingency
Th of phase nmental Contin e to O3 and/or PM lied in it comprises, over 3 nd deactivation takes place w re recorded. (SMA-DF, 2000)
Environmental Contingency
P
e declaration of the start II Enviro gency du10, is appvalues of
the whole ZMVM when, i00 and 250 IMECAS, respect
n any of the zonesively, are recorded, a
hen levels less than those given in Table 4.8 a
Table 4.8 Phase II
Contingencies due to: Activation (IMECA)
Deactivation (IMECA)
OZONE Levels greater than 300Levels less than 180
PM10 Levels greater than 250Levels less than 150 Source: (SMA-DF, 2000)
Epidemiological surveillance during air contingencies
air contingency situations, the environmental and health authorities must ctivate an Epidemiological Surveillance Emergency Program. This program hall have provisions to make an exhaustive diagnosis of the health situation of e population and the possible needs for specific communication, attention or
As mentioned above, the fundamental purpose of air monitoring at an urban level is the protection of human health, by informing the population about the quality of the air they are breathing and activating contingency measures when pollution levels put their health at risk. Inasth
46

intervention. It mu lann e measures, and r rt morbidity and hrough public heal d indic xample, the numb es reported with as te respiratory infectious diseases). Specifically, the local health authorities must develop standardthe H enters that will follow-up effects during environmental contingencies and the days following the same. The re e be d d u a Opportune follow-up with rapid, results will serve to ascertain
e risk for the population and when the risk has decreased or been eliminated.
tersectorial and community coordination.
elay as part of the assessment process.
The National Epid al S le and long term, hall contain the same requirements as the report, in terms of incidences of daily
respiratory and cardiovascular effec en the rep e can be produc It is necessar tain e ly low pollution levels r to be the air quality standards and to estimate impacts
lish epidemiological urveillance at national level. The follow-up and results of these observations will
st have p ing and formulation of responsecord and repo
ators (for emortality ter of cas
th indices anthma or acu
ized protocols for of adverse health ealth C carry out the report and
port on healthaily, preferably
ffects identified during the contingency shall sing electronic media to capture, transmit and
systematic annalyze them.
secure analyticalthThis opportune response with a wide coverage that is efficacious and technicallyvalid must be carried out with internal, in The results of the assessment of the effects of pollution on human health are not necessarily immediately evident, and it is necessary to extend surveillance in the days subsequent to the event due to the delay in both the manifestations of the effects and the report on them. It is important to stress the need to incorporate study and follow-up of this d
emiologic urveillance System, in the midds
ts, even wh ort on the samed weekly.
y to main pidemiological surveillance even with relative in orde able to assess the protection level offered by
on the population from chronic levelsit possible to estabof air pollution. These reports will make
salso need intra, intersectorial and community coordination.
47

4.2 IMPORTANCE AS MANAGEMENT INSTRUMENT AND OTHER USES As well as the importance of Air Monitoring for the purpose of informing the opulation about the air quality prevailing in cities, another determinant role of aving air quality information is related to the development of policies and
at cilitate decision making processes of the authorities and the agencies
taken to fight pollution.
phstrategies within environmental management and the administration of air quality. The information generated by monitoring activities, together with the emissions inventories and pollutant dispersion models, can become tools of great use thfaresponsible for Air Quality Management. 4.2.1 Assessment Tool for Environmental Management Programs In order to illustrate the usefulness of air monitoring as an assessment tool for actions aimed at reducing critical pollutants in an urban zone, the best example is without doubt the experience in Mexico City where air monitoring has made it possible the existence of a historical stock of data on air quality going back more than 30 years. In this way, the specific actions undertaken to decrease the concentrations of lead (Pb), sulfur dioxide (SO2) and carbon monoxide (CO) that were carried out in 1990, through the Integral Program against Air Pollution (PICCA), can be followed up and their efficiency assessed. For example, the following figures derive from actions
48

Fig. 4.5 Trends in the air monitoring of lead and principal actions to reduce its emissions in
the ZMVM, 1990-2000.
Source: SEMARNAT (2002)
Fig. 4.6 Trends in the air monitoring of sulfur dioxide and principal actions to reduce its emission in
the ZMVM, 1990-2000.
Source: SEMARNAT (2002)
49

Fig. 4.7 Trends in the air monitoring of carbon monoxide and principal actions to reduce its emissions in the ZMVM, 1990-2000.
Source: SEMARNAT (2002)
undertake integral air quality management
Formulating air quality standards Determining, with certainty, the size and territorial and temporal extension
of pollution Carrying out epidemiological studies that relate the effects of the
concentrations of pollutants to health damage, and to estimate the effects of pollutants on the environment in the short and long term Studying the reactions of pollutants in the air Detecting the change from the use of fuel in some emitting sources Developing control strategies and to assess the effectiveness of restrictive
emergency measures Establishing the scientific bases for developing policies Developing urban planning and soil use policies in accordance with the
local systems Calibrating and assessing pollutant di
Other air monitoring applications to actions and strategies can be related to:
spersion models in the atmosphere
50

4.2.2 C ation with Emission Inventories orrel
Another important application of air quality data generated through Air Monitoring consists in a comparative analysis with emission standards generated by emission inventories. Here it is important to point out two aspects:
a) It is highly convenient that the SMAs integrate an emission inventory area, as an intrinsic part of their functions, or at least draw up a functioning scheme in which they have a close relationship.
b) The emission inventories are dynamic and, as progress is made in the identification and degree of accuracy of the estimates, the total estimated amounts of each of the criterion pollutants and precursors may substantially vary from one inventory to another.
4.2.3 Modeling
At a second level, the availability of Air Monitoring Networks makes it possible to corroborate and calibrate the application of models of different types, whic represent valuable tools for pur Management.
el oil in a refinery and a thermal-electric lant. Similarly, this city has an Air Monitoring Network that was installed in 1999.
In t lity data and meteorological parameters recorded by said network will make it possible to develop the following:
To run dispersion models with a multi-source modality, that is, considering the
mothe f 5 min, 1.0 h.
entrations must always be
If there is no correlation between the or
monitors, the model should then be calibrated which consists, basically, in the model until a
the
diagnostic possibilities for purposes of management are extremely useful, for example:
hposes of Air Quality
One simple application through a source-receptor model could be, for example, the city of Salamanca, where there have historically been high concentrations of SO2 originated by the intensive use of fup
his context, the availability of air qua
SO2 emission data of chimneys to be found, particularly in both installations. To compare the order of magnitude of the concentrations produced by the
del at floor level with those recorded by one or more stations according to selected scenario. Said comparisons can be for periods o
and 24 h. The influence of background concconsidered.
der of magnitude of the artificial concentrations (model) and the real concentrations recorded by the station
revising and adjusting the input data and attributes of reasonable correspondence is obtained, which will depend substantially on the quality and quantity of the available information and the characteristics of
model used. Once the model has been calibrated with an acceptable accuracy level, the
51

1. To get to know the spatial impact of emissions at different times of the year
2. What sectors of the city would be most affected under critical air
4. Desub
4.2.3.1
The importanwill, as well a on 41, permit the consolidation of the use of so-called 3rd generation models, whose
egional level and that represent powerful air quality diagnosis ransport and/or transformation of ambient air pollutants. For
em where the
conditions 3. To run different scenarios as support for the establishment of
precontingency and contingency levels crease in SO2 concentrations according to the percentages of stituting fuel oil for natural gas, among others.
Advanced Modeling
ce of extending monitoring practices throughout national territory s the benefits of alerting and protecting health described in secti
spatial scale is at rtools in terms of texample, the Models-3 known as Community Multiscale Air Quality (CMAQ) is a system with urban and regional scale capacities for the simulation of air quality of tropospheric O3, acid rain, visibility and fine particles. Figure 4.8 illustrates an example of the type of images produced by this kind of systaverage annual concentrations of PM2.5 in the United States are shown.
52

Fig. 4.8 Annual Concentration of PM2.5 in the U.S.A.
Source: http://www.epa.gov/asmdnerl/models3/index.html
4.2.4 Long and middle term epidemiological uses
the uses of SMAs is to alert the population in cases f environmental contingency. The prevention of episodes with high levels of air
e of preventing adverse health effects in the opulation in short time scales.
he effects on health of air pollutants have mainly been detected through al studies, where a subject is exposed to a polluting agent with a
redetermined level and its effects are recorded in controlled conditions. logical methods have been used where defined
opulations are co-located with air pollutant measurement systems, inferring these agents have been associated with
ffects to health. These studies can provide follow up of specific short term al contingencies or accidents for acute
ases. In addition, a population can be followed in the middle and long term (retrospectively or prospectively) or populations with different levels of pollutants an be compared.
Mexico, different epidemiological studies have associated air pollution with effects on health. One of the most relevant cases is that of the association of
As mentioned earlier, one of opollution has the main objectivp
TtoxicologicpAlternatively, epidemiopexposure to the measured pollutants;eevents, as in the case of environmentc
c
In
53

suspended particle eptible population. For example, the particles have been associated with respiratory symptoms in infants (Catillejos, et. al., 1992, Gold, et. al., 1999) and infants with asthma (Romieu, et. al., 1995 and 1996). In addition, particles suspended in the air have also been linked with mortality in the general and infant population (Loomis, et. al., 1996 and 1999, Borja-Aburto et. al., 1997 y 1998).
Thanks to the existence of air pollutant records and health indicators, it has been possible to associate effects on health with pollution levels.
4.2.5 Protection to vegetation and agriculture
Vegetation has also been affected by air pollution. Indeed, in the Central Valley of California, one of the most productive agricultural regions of the world, this could be one of the factors with the greatest impact on the economy. Another effect observed by air pollution is its contribution to stress in forests that is, in turn, associated with a propensity to silvicultural diseases.
Mexico, studies have been conducted on the effects of pollutants on forests and agriculture, and itadverse effects on vegetati
regions where there are no conventional SMAs.
l Park in the ZMVM, that seedlings one year of
an health. The precursors of these
s with morbidity and mortality in the susc
In has even been postulated that the visible, measurable
on can be used as qualitative indicators of air quality in
In 1976, Krupa y Bauer observed in the Ajusco Nationain the pine species Pinus hartwegii and Pinus leiophylla,age showed a typical banding caused by ozone (Bauer, et. al., 1990). In the forests of the ZMVM, the presence of lesions on trees as a result of the impact of pollution is reported in the form of a premature shedding of leaves and the presence of visual damage to the leaves (DDF, 1996)
The identification of the response of plants to different pollutants through the measurement of damage percentages can be used indirectly to determine the air quality of a zone (Posthumus, 1976, Guidi, et. al., 1988).
4.2.6 Protection of ecosystems, materials and historical patrimony against acid deposits
Deposits, precipitations or acid rain are generic terms to describe several ways in which acids detach themselves from the air. A more accurate term is acid deposition which has two parts: humid and dry. Acid deposition has a large number of effects, including damage to woods and soils, fish and other living beings, materials, visibility and humdepositions are principally sulfur dioxide and nitrogen oxides that are transformed in several acid species in the presence of humidity, culminating in a light sulfuric
54

acid and nitric acid solution that, in turn, forms sulfates and nitrates in a solid phase.
Since 1987, acid precipitations have been recorded in the ZMVM (Comisión Metropolitana para la Prevención y Control de la Contaminación Ambiental en el Valle de México, 1994). Indeed, the Program to improve air quality in the Metropolitan Zone of the Valley of Mexico 2002 – 2010 includes actions that will
term scope beyond political frontiers as occurred in the case between the United States and Canada nd the European countries.
urban infrastructure has been documented. It should be pointed out that studies have already been done on the
Being able to estimate the precursors of such acid depositions as sulfur and
reduce acid deposition in this region (CAM 2002). It should be mentioned that acid depositions can have an impact on the middle and long
a
In addition, the corrosive effect of acid aerosols on
deterioration of both the historical center of Mexico City and the Mayan ruins in the southeast of Mexico. For example, aerosols and acid deposits are already attacking the calcareous material of the historical monuments of Tulum and el Tajin causing deterioration (Bravo, et. al., 2004).
nitrogen oxides gives support to the control measures against these undesirable impacts on ecosystems and materials.
55

5. IMPORTANCE OF ASSESSMENT AND ACCREDITATION OF MONITORING SYSTEMS
Standardization.
atories and the verification units for the assessment of conformity; Calibration: the set of operations that has the purpose of determining the errors of a measuring instrument and, if necessary, other metrological characteristics; Certification: procedure that ensures that a product, process, system or service is adjusted to the standards or guidelines or recommendations of agencies devoted to standardization, be they national or international.
As can be observed, air monitoring systems have a very similar operation scheme to that of the test and calibration laboratories, providing the generation of air quality information is obtained from standardized test methods and with the use of manual sampling equipment, instrumental analyzers and, in some cases, with specific laboratory areas for the analysis of environmental samples (or through external laboratories) in order to finally process the information and make the relevant reports. Under this approach, those responsible for Air Monitoring Systems should subject themselves to accreditation – approval processes to demonstrate that they have a Quality System pursuant to standard NMX-EC-17025-INMC-2000 that sets forth the general requirements for the competence of test and calibration laboratories before an accreditation entity authorized by the Economy Secretariat.
Air monitoring systems are service units that form part of the environmental information infrastructure of a country. Their operation is of vital importance to Air Quality Management, hence their performance must be periodically assessed to ensure the quality of the service provided to the community. One of the main objectives of the monitoring systems is to oversee compliance with official Mexican standards, therefore their operation must be accredited pursuant to the Federal Law on Metrology and Article 2, point II of this Law states that its objective is “to foster transparency and efficiency in the preparation and observance of official Mexican standards and Mexican standards”, and each of these concepts is defined in article 3 in the following way:
Accreditation: the act by which an accreditation entity recognizes the technical competence and reliability of the certification agencies, the test laboratories, the calibration labor
56

portant to mention that in GermaIt is im ny the Quality Assurance Systems of the
ir quality monitoring networks use as reference standard NMX-EC-17025-INMC-ent of ISO/IEC 17025:1999 since its structure and
t present, only the SMAs of Mexico City and Puebla are in the process of em pursuant to the international
vention and Control.
In thisformalis the Secret Moreover, SEMARNAT and and audit agencies, inttheir dfor thelegal p ies
at generate pollution and risks to health or ecosystems. For these reasons and
forward a general proposal for the formation of a ederal Auditing Program.
a2000, which is the equivalscope have great applicability with the operative scheme of the Air Monitoring Systems, SMAs, essentially because of the requirements concerning calibration and maintenance programs, document and electronic archive control and verification and validation of data and aspects related to traceability and uncertainty. Acertifying their Quality Management Syststandard of the ISO-9000 series. In the case of the SMA of Toluca, the director general’s office they belong to has the ISO 9000–2000 certificate, but this is not specific for the air monitoring office, but for the whole Director General’s Office for Pollution Pre
way, there is no experience of an Air Monitoring system that has made a application for accreditation before the Mexican Accreditation Entity, which only accreditation entity that has been authorized to date by the Economics ariat.
the Health Secretariat can, through their inspection ervene in the operation of air monitoring systems to verify
ue functioning. However, the provisions of Law that both institutions have se cases are ambiguous in the case of local operator authorities, since all rovisions on the matter are explicitly oriented towards firms or industr
thin strict terms, the air monitoring systems form part of the environmental services in which formal inspection and audit procedures have not been applied. Nevertheless, the operation of air monitoring systems must be diagnosed, assessed and, if necessary, corrected, under an audit program scheme, through which the consistency of air quality data generated in the different SMAs is ensured. Document 6 putsF
57

6. GENERAL GLOSSARY OF TERMS
asic Geostatistics Area. Minimum census area defined by INEGI that at an
Audit. Carried out with verified data to document the capacity of a ata administration system to collect, interpret, analyze and report data
operation parameters of the samplers, analyzers and instruments to aterials or reference standards.
ARB. California Air Resources Board
means of which it is ensured that a product, process, system or service is adjusted to the standards, guidelines or recommendations of national or international agencies devoted to standardization. CO. Carbon monoxide.
Accreditation. Act through which an accreditation entity recognizes the technical competence and reliability of certification agencies, test laboratories, calibration laboratories and verification units for the assessment of conformity; AGEB. Basic Geostatistics Area. Minimum census area defined by INEGI that at an aggregate level provides information on municipalities, states and the nation. Baggregate level provides information on municipalities, states and the nation. Audit. Systematic, independent review and assessment of the systems and activities comprising a procedure, carried out to determine if its final products reach the specified objectives. Data Qualitydaccording to quality assurance project specifications. Functioning Audits. Functioning audits consists in verifying the response or other critical m Technical System Audit. This is a complete in-situ review of the organization of the SMA, in which the whole measuring system is revised (sample collection, sample analysis, data processing, preparation of reports, etc.). Calibration. Set of operations whose purpose is to determine the errors of a measuring instrument and, if necessary, other metrological characteristics. CAM. Metropolitan Environmental Commission C DGCENICA. Director General’s Office for the National Environmental Research and Training Center Certification. Procedure by
58

Comparability. Measure of confidence in which a set of data can be compared
culate freely
ist on paper or electronically.
the limits of an urban area
mpared with the data obtained in
stitute.
to another set. OVCs. Organic volatile compounds.
ir Basin. Geographical space where a stratified mass of air can cirAover the surface with a particular wind pattern. The basin is topographically delimited, taking as reference obstacles of a natural origin (coast lines, mountain ormations, etc.). f DOAS. Differential Optical Absorption Spectroscopy. Documents. A volume that contains information that describes, defines, specifies, reports, certifies, or provides data or results related to environmental rograms. The document can exp
EPA. Environmental Protection Agency.
rban monitoring stations. Stations located within Uand its surroundings. Rural monitoring stations. Stations that are located in non-urbanized spaces
hose use of the soil can vary from productive to conservation. w Assessment. Analysis process used to measure the performance of effectiveness of a system and its elements. It includes audits, performance ssessment, reviews of the management system, expert review, inspection or a
supervision, among other possible activities.
erformance assessment. Audit in which quantitative data are independently Pobtained from the measuring system and are co routine manner to assess the professionalism of the analyst, the laboratory or a
the measuring system. Exactness. Degree or percentage of conformity of a measured or calculated value in relation to a value considered as real. FTIR. Fourier Transform Infrared Radiometer. IMECA. Metropolitan Air Quality Index. INE. National Ecology In
59

Annual report of state air quality. Reports prepared by the individual systems and submitted to SEMARNAT for approval. They consist of a yearly summary of ata for all pollutants and a detailed report describing all the changes proposed
.
ich a competent government uthority verifies compliance with legislation by an individual or corporation.
O. International Standard Organization.
ethod can detect and express in orders
urements. Determination of wind velocity and direction,
equipment or
or pollutants present in
elopment.
ir monitoring systems operators. State and municipal authorities and f an air monitoring system.
Pb. Lead.
dfor their air quality monitoring network Integrity or sufficiency. Percentage of valid data obtained from a sampling system compared with the expected amount or amount programmed to be obtained under correct, normal operation conditions.
Legal protocolized act through whInspection. a IS LGEEPA. General Law of Ecological Equilibrium and Environmental Protection.
IDAR. Light Detection and Ranging. L
etection limits. Minimum value that a mDof magnitude.
eteorological measMbarometric pressure, temperature, relative humidity and solar radiation.
onitor. Instrument, sampler, analyzer or other measuringMequipment used in measuring air pollutants accepted for use in the monitoring of air quality pursuant to the respective standard. Air monitoring. Set of methodologies designed to make a sample, continuously nalyze and process the concentrations of substancesa
the air in a determined place and during a determined period of time. NARSTO. North American Research Initiative for Tropospheric Ozone.
ON 2. Nitrogen dioxide. NOx. Nitrogen oxides, defined as the sum of the concentrations of NO and NO2. OECD. Organization for Economic Cooperation and Dev Ainstitutions responsible for the operation o O3. Ozone.
60

PSR. Pressure, Status, Response PNMA. National Air Monitoring Program.
M10. Particles with an aerodynamic diameter equal to or less than 10
recision. Random error in an instrument on measuring, measured between property under similar conditions,
equently expressed through standard deviation. Refers to a set of independent
roduce the same value or result under the same input conditions and operating individual instrument, repeatedly operating
ith adjustments, the ability to produce the same value or result under the same
SP. Total suspended particles.
or other ocumentary material, independent of its physical form or characteristics,
CAQMD. South Coast Air Quality Management District.
ias. Systematic error in a measuring instrument. It can be determined as a entage of
e true value.
IMAT. Air Monitoring System of the Metropolitan Zone of the Valley of Mexico.
INAICA. National Air Quality Information System, operated by the National
the totality f criterion pollutants and meteorological parameters. These stations comply with
s of monitoring areas where maximum concentrations are expected air quality is combined with a high population density. In the second
patial distribution of the stations can be greater than in the first case.
PM2.5. Particles with an aerodynamic diameter equal to or less than 2.5 micrometers. Pmicrometers. Pindividual measurements of the samefrinstruments but of the same design, it is the ability of these instruments topin a same environment. Refers to an winput conditions and in the same environment. Synonym: reproducibility. T Records. Books, papers, maps, photos, machine readable material dproduced or received by the agencies responsible for the air monitoring system that are kept as evidence of the results obtained or the activities performed.. S SEMARNAT. Secretariat of the Environment and Natural Resources. Bnegative or positive deviation from the true value, expressible as a percth S SEcology Institute. Air quality monitoring systems of national interest. These are air monitoring systems or stations that must operate without interruption*, measuringothe objective
r where badocase, the s
61

SNPD. National Democratic Planning System.
for national air quality standards, the development of the quality anagement system of the air monitoring system, data assessment or the
ethod, and data processing.
SO2. Sulfur dioxide. Decision maker. Individual defined as the last user of air quality data who may be responsiblemdeclaration of a state of contingency. Standard traceability. Standard traceability is the process of transferring the exactness of a primary standard to a standard used in the field. Traceable means that a local standard has been compared and certified either directly or through an intermediate standard with a primary standard certified by the National Metrology Center or equivalent institution. Validation. Confirmation and stipulation of target tests so that the particular requirements of a specific procedure are complied with. It involves the revision of ach aspect of the measurement procedure including the measurement me
the operation method, calibration Validation of data for monitoring data quality. Process by means of which data obtained from a polluting particle or gas analyzer is assessed according to the different errors the measurement instrument may have, its operation conditions and the extraordinary events that may cause an unacceptable
easurement to be certain or representative. m
62

7. BIBLIOGRAPHY
.V. Krupa (1990). The Valley of Mexico: summary of observational studies on its air quality end effects on vegetation.
spect. 1998, 106(12), 849-855.
en. Am. Rev. Respir. Dis. 1992,
trol de la Contaminación
8. EPA (1998). Quality Assurance Handbook for Air Pollution Measurement Systems, Vol. II; Part 1, Office of Air Quality Planning and Standards, Research Triangle Park, USA.
9. EPA (2002). National Ambient Air Monitoring Strategy. Office of Air Quality Planning and Standards, Environmental Protection Agency, USA.
10. Gidi, I. B., P. Cicero, L. Flores, T. Hernández, M. Alegre y B. Delgadillo (1988). Biomonitoreo prospectivo de ozono en la ZMCM. Memorias del VI Congreso Nacional de la Sociedad Mexicana de Ingeniería Sanitaria y Ambiental. Querétaro, Querétaro
11. Gold, D.R.; Damokosh, A.I.; Pope, C.A.; Dockery, D.W.; McDonnell, W.F.; Serrano, P.; Retama, A.; Castillejos, M. (!999). Particulate and Ozone Pollutant Effects on the Respiratory Function of Children in Southwest Mexico City. Epidemiology. 1999, 10(8), 8-16.
12. Humberto Bravo; A. Rogelio Soto; E. Rodolfo Sosa; A. Pablo Sánchez; J. Ana Luisa Alarcó n; J. Kahl; J. Ruíz (1994). Acid Deposition Effects on Archeological Monuments in Mexico. 13th World Clean Air and Environmental Protection Congress and Exhibition, London, UK, August 22 - 27, 2004.
1. Bauer L.I., S
Environmental Pollution 65:109 - 118. 2. Borja-Aburto, V.H.; Castillejos, M.; Gold, D.R.; Bierzwinski, S.; Loomis, D.
(1998). Mortality and Ambient Fine Particles in Southwest Mexico City, 1993-1995. Environ. Health Per
3. Borja-Aburto, V.H.; Loomis, D.P.; Bangdiwala, S.I.; Shy, C.M.; Rascon-Pacheco, R.A.(1997). Ozone, Suspended Particulates, and Daily Mortality in Mexico City. Am. J. Epidemiol. 1997, 145(3), 258-268.
4. Catillejos, M.; Gold, D.R.; Dockery, D.; Tosteson, R.; Baum, T.; and Speizer, F.E. (1992). Effects of Ambient Ozone on Respiratory Function and Symptoms in Mexico City Schoolchildr145, 276-282.
5. COFEPRIS (2004). Reglamento de la Comisión Federal contra la Prevención de Riesgos Sanitarios. México.
6. Comisión Metropolitana para la Prevención y ConAmbiental en el Valle de México, (1994). La Contaminación Atmosférica en el Valle de México, Acciones para su Control 19889-1994
7. DDF, (1996). Compendio Estadístico 1986 – 1995. Dirección General de Prevención y Control de la Contaminación. Red Automática de Monitoreo Atmosférico.
63

13. IMNC (2000). Requisitos Generales para la Competencia de Laboratorios de Ensayo y Calibración. NMX-EC-17025-IMNC-2000, México.
16. mosférico.
17. orja-Aburto, V.H.
18.re and Daily Mortality in Mexico City: A Time-Series
19. n al Monitoreo Atmosférico.
20.
22. Ley Federal de Transparencia y Acceso a la Información
23. eral, México.
ting on
25.
dren Living in Mexico City. Am. J. Respir.
26.
d Asthma in Mexico City. J.
27.
14. INE/SEMARNAP, 2000. Gestión de la Calidad del Aire en México. Logros y Retos para el Desarrollo Sustentable 1995-2000.INE-DGGIAM, Primera Edición.
15. INEGI (1980). Ley de Información Estadística y Geográfica. Diario Oficial del 30.12.80
INE-SEMARNAT (2003). Programa Nacional de Monitoreo AtCentro Nacional de Investigación y Capacitación Ambiental (CENICA), México. Loomis, D.; Castillejos, M.; Gold, D.R.; McDonnell, W.; B(199). Air Pollution and Infant Mortality in Mexico City. Epidemiology. 1999, 10(2), 118-123. Loomis, D.P.; Borja-Aburto, V.H.; Bangdiwala, S.I.; and Shy, C.M. (1996). Ozone ExposuAnalysis. Health Effects Institute Research Report Number 75. Martínez, A; Romieu, I.(1997). Introducciócoedición OPS-GTZ-DDF, Hemes Impresores, 1er edición,. México
Martínez, et al (2001). Experiencia en Gestión de la Calidad del Aire en la ZMVM. OPS-CEPIS.
21. Muñoz (1997). Sistema de Indicadores del estado de la Calidad del Aire, Secretaria del Medio Ambiente Distrito Federal, México. PEF (2000). Pública Gubernamental. Poder Ejecutivo Federal (PEF), México. PND (2001). Plan Nacional de desarrollo 2001-2006. Presidencia de la República, Poder Ejecutivo Fed
24. Posthumus A.C. (1976) The use of higher plants as indicators for air pollution in the Netherlands. In: Proceedings of the Kuopio meeplant demages caused by air pollution. Lauri Kärenlampi (ed.) pp. 115-120. Romieu, I.; Meneses, F.; Ruiz-Velazco, S.; Sierra-Monge, J.J.; Huerta, J.; White, M.C.; and Etzel R. (1996). Effects of Air Pollution on the Respiratory Health Asthmatic ChilCrit. Care. Med. 1996, 154, 300-307. Romieu, I.; Meneses, F.; Sierra-Monge, J.J.; Huerta, J.; Ruiz-Velazco, S.; White, M.C.; Etzel, R. and Hernandez-Avila, M. (1995). Effects of Urban Air Pollutants on Emergency Visits for ChildhooEpidemiol. 1995, 141, 546-53. SEMARNAP (1988a). Reglamento en materia de Prevención y Control de la Contaminación a la Atmósfera. Diario Oficial del 25.11.88.
64

28. SEMARNAP (1998b). Ley General del Equilibrio Ecológico y la Protección al Ambiente, Editorial Porrúa, México.
29. SEMARNAT (1993a). Norma Oficial Mexicana NOM-034-SEMARNAT-1993, que establece los métodos de medición para determinar la concentración de monóxido de carbono en el aire ambiente y los
iento para la calibración de los equipos de medición. Diario
31. blece los métodos de medición para determinar la
32. MARNAT-
y los
36. SEMARNAT
37.
39. Mexicana NOM-020-SSA1-1993, Criterio
procedimientos para la calibración de los equipos de medición. Diario Oficial del 18.10.93
30. SEMARNAT (1993b). Norma Oficial Mexicana NOM-035-SEMARNAT-1993, que establece los métodos de medición para determinar la concentración de partículas suspendidas totales en el aire ambiente y el procedimOficial del 18.10.93
SEMARNAT (1993c). Norma Oficial Mexicana NOM-036-SEMARNAT-1993, que estaconcentración de ozono en el aire ambiente y los procedimientos para la calibración de los equipos de medición. Diario Oficial del 14.10.93
SEMARNAT (1993d). Norma Oficial Mexicana NOM-037-SE1993, que establece los métodos de medición para determinar la concentración de bióxido de nitrógeno en el aire ambiente procedimientos para la calibración de los equipos de medición. Diario Oficial del 14.10.93
33. SEMARNAT (1993e). Norma Oficial Mexicana NOM-038-SEMARNAT-1993, que establece los métodos de medición para determinar la concentración de bióxido de azufre en el aire ambiente y los procedimientos para la calibración de los equipos de medición. Diario oficial del 14.10.93
34. SEMARNAT (2001a). Programa Sectorial de Medio Ambiente y Recursos Naturales 2001-2006. México.
35. SEMARNAT (2001b). Ley General del Equilibrio Ecológico y la Protección al Ambiente. Diario Oficial del 31.12.2001
(2002). Programa para Mejorar la Calidad del Aire de la Zona Metropolitana del Valle de México 2002-2010. México. SEMARNAT (2003). Reglamento Interior de la SEMARNAT. Diario Oficial del 21.1.2003.
38. SMA-DF (1988). Manual para la Aplicación del Programa para Contingencias Ambientales Atmosféricas en el Distrito Federal. Diario Oficial del 30.10.1988
SSA (1993a). Norma Oficial para evaluar el valor límite permisible para la concentración de ozono (O3) de la calidad del aire ambiente. Criterio para evaluar la calidad del aire. Diario Oficial del 30.10.02
65

40. SSA (1993b). Norma Oficial Mexicana NOM-021-SSA1-1993, Criterio para evaluar la calidad del aire ambiente con respecto al monóxido de
41. para evaluar la calidad del aire, bióxido de azufre
42. ara evaluar la calidad del aire, bióxido de nitrógeno
43.
ar la calidad del aire, plomo (pb). Valor
población. Diario Oficial del
46.
INTER CES
1. _DATA/index_amon.html
3. 4. ma-etapa-tres.html
carbono (CO). Valor permisible para la concentración de monóxido de carbono (CO) en el aire ambiente, como medida de protección a la salud de la población. Diario Oficial del 23.12.04
SSA (1993c). Norma Oficial Mexicana NOM-022-SSA1-1993, Salud ambiental. Criterio (SO2). Valor permisible para la concentración de bióxido de azufre en el aire ambiente, como medida de protección a la salud de la población. Diario Oficial del 23.12.94
SSA (1993d). Norma Oficial Mexicana NOM-023-SSA1-1993, Salud ambiental. Criterio p(NO2). Valor permisible para la concentración de bióxido de nitrógeno en el aire ambiente, como medida de protección a la salud de la población. Diario Oficial del 23.12.94
SSA (1993e). Norma Oficial Mexicana NOM-024-SSA1-1993, Salud Ambiental. Criterio para evaluar la calidad del aire ambiente, con respecto a las partículas suspendidas totales (TSP). Valor permisible para la concentración de partículas suspendidas totales (TSP) en el aire ambiente, como medida de protección a la salud de la población. Diario Oficial del 23.12.94.
44. SSA (1993f). Norma Oficial Mexicana NOM-025-SSA1-1993, Salud Ambiental, Criterio para evaluar la calidad del aire ambiente, con respecto a las partículas menores de 10 micras (PM10). Valor permisible para la concentración de partículas menores de 10 micras (PM10) en el aire ambiente, como medida de protección a la salud de la población. Diario Oficial del 23.12.94
45. SSA (1993g). Norma Oficial Mexicana NOM-026-SSA1-1993, Salud Ambiental, Criterio para evalupermisible para la concentración de plomo en el aire ambiente, como medida de protección a la salud de la23.12.94
SSA (2003h). Ley de Salud. Diario Oficial del 30.06.2003
NET REFEREN
http://nett21.gec.jp/CTT2. http://www.arb.ca.gov/aqd/aqdpage.htm
http://www.edomexico.gob.mx/portalgem/se/ http://www.ine.gob.mx/cenica/pn
66

5. http://www.sedurbecop.pue.gob.mx/Monitoreo/Remareporte.html http://www.semarnat.gob.mx http://www.sma.df.gob.mx/simat http://www.sma.df.gob.mx/simat/tablas_xls/
6. 7. 8. indicadores/O3.xls
10.11.12. http://www.epa.gov/asmdnerl/models3/index.html
9. http://semades.jalisco.gob.mx/site/indexaire. www.nl.gob.mx/sduop/sima/sima_des.htm http://www.epa.gov/oar/oaqps/modeling.html#aqmg
67

DOCUMENT 2
AIR MONITORING SYSTEMS Establishment criteria and basic components
i

INDEX PAG.1. INTRODUCTION 1 2. CRITERIA FOR SETTING UP AIR MONITORING SYSTEMS (SMAs) 3 2.1 Corrective Management Criteria 3 2.2 Preventive Management Criteria 5 3. CLASSIFICATION OF AIR MONITORING SYSTEMS, NETWORKS AND MONITORING STATIONS 6
3.1 SINAICA Coding for Air Monitoring Stations. 6 3.2 Space Representativeness and Air Quality Management 12 4. AIR MONITORING SYSTEM TARGETS 15 4.1 General Procedure for the definition of monitoring,data and measurement quality targets 16
4.1.1 Definition of data quality and measurement quality targets 19
5 BASIC COMPONENTS OF AIR MONITORING SYSTEMS (SMAs) 26 5.1 General Characteristics of Functional Components 28
5.1.1 Measurement Networks and Instruments 29
5.1.2 Data Transmission and Storage 31
5.1.3 Computer Centers 33
5.1.4 Environmental Analysis and Standard Transfer Laboratories 34
5.1.5 Administrative Offices and Operational, Technical and Managerial Staff 35
5.1.6 Operation Maintenance Equipment and Tools 36
5.2 Specialty Area Products 37 5.2.1 Reports and Press Office 37
5.2.2 Emissions Inventories 38
5.2.3 Quality Management Systems 40
5.2.4 Attention to Air-related Emergencies 40
6. BIBLIOGRAPHY 44
ii

LIST OF TABLES PAG.
Tab. 3.1 Name of Geographical Areas 7 Tab. 3.2 Station Classification by Representativeness 10 Tab. 3.3 Classification by Environment 11 Tab. 3.4 List of Possible Representativeness Scales 13 Tab. 4.1 Example of Data Flagging Codes 23 Tab. 5.1 Measurement Parameters in Air Monitoring Stations 30
LIST OF FIGURES
Fig. 3.1 Geographical Areas for Air Monitoring to be incorporated in SINAICA 8 Fig. 5.1 Functional Components 27 Fig. 5.2 Official Image of the Air Monitoring Geography of Puebla 36
iii

1. INTRODUCTION Current Mexican environmental law does not specify the criteria for installing an air monitoring station, network or system (SMA – acronym as given in Spanish). Nor does it specify which components it should rely on to ensure reliability and its incorporation into national information, planning or administration systems for the country’s natural resources. The definition of criteria for locating air monitoring systems, networks and stations must contemplate, first of all, the distribution and dynamics of the country’s population, given that the main objective of such systems is to protect public health. In the last thirty years, there has been an accelerated concentration of the country’s population in urban areas, where air quality is deteriorating rapidly due to the activities of industry, services, transportation of people and the erosive effects of deforestation. The purpose of this document is to answer the following questions: Where should air monitoring systems be set up? What are their components, functions and main products? And, finally, how can they be incorporated into SINAICA (acronym as given in Spanish)? In order to answer these questions it was necessary to make accurate qualitative and quantitative recommendations, that were defined using national and international information where it could be found or, if not, on the basis of the experience and work of direct research performed by members of the Colegio de Ingenieros Ambientales de México (Mexican School of Environmental Engineers). This document is divided into the following chapters: chapter 1 of this document makes the reader aware of the importance of defining criteria for locating SMAs, as well as setting forth the main objective of this document. Chapter 2 looks at the setting forth of criteria in SMAs, such as corrective and preventive management criteria . Chapter 3 provides a classification of monitoring stations, networks and systems. It also gives a definition of SINAICA station coding and the special representativeness and management of air quality. Chapter 4 defines procedures for setting forth the basic targets of SMAs. Chapter 5 offers a description of basic components of SMAs and general characteristics of functional components, as well as the products of specialist areas. The aim of the recommendations provided in the chapters of this document, based on the Reference Terms of this project, is to convert the latter into instructions for setting forth standards. They have in fact been formulated with
1

the intention of setting a reference value that can be assessed and refined in the future depending on the experiences of their application, in order to build our own normative or regulatory basis rather than one adopted from experiences in other countries.
2

2. CRITERIA FOR SETTING UP AIR MONITORING SYSTEMS Air monitoring systems (SMAs) must be designed and incorporated taking into account all the different legal, administrative and technical aspects in connection with Air Quality Management, with special attention to care in the field of public health and ecosystems. 2.1 Corrective Management Criteria In an initial approximation of corrective management, SMAs must be installed in cities or regions in Mexico facing clear problems of air pollution, when they occur in the following situations, alone or combined:
There is scientific and technical evidence of air pollution reaching levels above the ones specified by official air quality standards issued by the Secretariat of Health There is reported medical and/or epidemiological evidence of harm to
health caused by air pollution The population has voiced, en masse and repeatedly, through public,
administrative or legal channels, concerns or complaints with regard to air quality There is scientific evidence of reductions of wild flora or fauna species
considered in danger of extinction, threatened or endemic, due to air pollution
It is recommendable that SMAs be installed in all cities with more than one million inhabitants, as well as in any areas where two or more of the following circumstances arise: Registration of 200,000 automobiles or more in circulation Constant emissions reaching levels of over 20,000 tons a year in air
criteria pollutants, produced by specific point and area emission sources, including household, industrial and service emissions
Overall consumption of refined hydrocarbons of more than 30,000 Megajoules per capita
The existence of damage caused by air pollution to buildings considered historical architectural patrimony registered by the INBA
3

Protected Natural areas experiencing air pollution of manmade origin with problems of soil acidification, loss of visibility, harm to wild flora or fauna and/or ecological alterations
Natural ecosystems and urban areas that are focal points of the tourist industry under pressure due to deficient air quality
In a city of 1 million inhabitants, the critical number of automobiles may be equal to that which proportionally exists in the Metropolitan Area of Valle de Mexico, where there is a low rate of ownership of private vehicles given the extension and variety of forms of public transport, but there is a large number of freight and public transport vehicles. A figure of one automobile per 5 inhabitants would be expected, in other words 200,000 vehicles.
Similarly, and in proportion to the above, a critical inventory of emissions from non-natural fixed sources may be the same as that registered in the Metropolitan Area of Mexico City, where a little over 20,000 tons per million inhabitants are emitted each year, and per capita consumption of refined hydrocarbons stands at over 33,000 Megajoules.
These averages are very similar to those of Guadalajara and Monterrey, with the exception of the industrial inventory, given that per capita emission levels in Monterrey, exceptionally, are double.
CITY
Population Number of
inhabitants per vehicle
Fixed Source Emissions (tons
per million inhabitants)
Valle de Mexico 17,919,618 5.5 20,433
Guadalajara 3,100,000 4.8 23,933
Monterrey 2,600,000 4.0 53,266
The recommendation to install SMAs in the country’s cities with a million inhabitants is a necessary minimum for dealing with the problem of air pollution in our country in the coming ten years. An ideal scenario for the medium term could be one in which the country has SMAs in all medium sized cities or in urban centers with more than half a million inhabitants, as well as in state capitals and major border or tourist areas or cities, as all of these register increased urban, industrial and service activities linked with the emission of air pollutants. Nonetheless, this would mean an effort that, at
4

the moment, seems financially unfeasible, given the current economic crisis and the budgetary limitations of certain local governments. 2.2 Preventive Management Criteria From a precautionary point of view or as an act of preventive management to improve air quality or prevent its deterioration, we suggest that, as far as economically and technically possible, urban air monitoring systems be installed when any of the following situations arises in a combined manner:
• Forecasts for demographic growth in a given locality indicate an urban concentration of more than 500,000 inhabitants over the next five years, with average annual growth rates of more than 2%
• The air sample area is closed and has little wind
• There is public concern and significant social awareness of the problem of air pollution
In the field of administration of natural ecosystems, it is also recommendable to have SMAs in protected natural areas (ANP – acronym as given in Spanish), run on a federal or local level, when they are subject to the following conditions:
• The total internal population of the ANP, rural and urban, stands at more than 100,000 inhabitants
• There are major sources of pollutant emissions affecting ANP air quality caused by transportation and depositations. These sources may be thermo-electrical plants, refineries, petrochemicals, chemical, mining or steel industries, as well as others.
• Visibility is being affected by local or external erosive processes or the propagation of fine particles
5

3. CLASSIFICATION OF AIR MONITORING SYSTEMS, NETWORKS AND MONITORING STATIONS
Monitoring stations in themselves, along with their networks and the air monitoring systems whose creation is being proposed in this series of documents, may be classified in many ways using as a reference the international experiences and practices applied by the operators of networks currently in use in our country. Taking into account the targets and objectives set forth by the Programa Nacional de Monitoreo Atmosférico (National Air Monitoring Program) to create the Sistema Nacional de Information sobre la Calidad del Aire (National Air Quality Information System), this document proposes that progress be made in the creation of a single and permanent code for identifying and classifying monitoring stations. In addition, we propose that the Instituto Nacional de Ecología (National Institute of Ecology), through the DCENICA, select a set of stations that, by their characteristics, are deemed suitable and representative of the national situation. These stations must guarantee continued operations in the long term and provide the basis for assessing national policy in the field of Air Quality Management. 3.1. SINAICA Coding for Air Monitoring Stations For the purposes of national classification in the National Air Quality Information System (SINAICA), all air monitoring stations in the country must be given a permanent and unique identity code, in accordance with their location, level of territorial representativeness and the characteristics of the natural or urban setting in which they are located. The code will consist of four subcodes with a fixed number of digits:
ZMCM PED N UH Geographical area to
which it belongs Site name Level of
Representativeness Natural or urban
setting
(4 digits) (3 digits) (1 digit) (2 digits)
6

The table below gives the subcodes of the geographical areas that are currently scheduled to be included in the SINAICA for the period 2003-2006 according to the National Air Monitoring Program:
Table 3.1 Name of Geographical Areas
Geographical Area Subcode Metropolitan Area of Valle de México ZMVM
Metropolitan Area of the City of Guadalajara
ZMGD
Metropolitan Area of Monterrey ZMTY
Metropolitan Area of the City of Toluca ZMCT
Metropolitan Area of the City of Puebla ZMCP
Conurbation of Bajío Guanajuatense León-Salamanca-Irapuato-Celaya
ZCBG
Ciudad Juárez ZFCJ
Cities along the Baja California Tijuana-Rosarito-Tecate-Mexicali Border
ZFTM
Conurbation of Comarca Lagunera Torreón-Gómez Palacio
ZCCL
City of Zacatecas CZAC
City of Aguascalientes CAGS
Conurbation of Valle de Cuernavaca CDVC
Conurbation of the City of Villahermosa CCVH
In addition to these geographical areas, in the country there are also cities and places with manned and unmanned monitoring networks and stations, in continuous or temporary operation, that will have to join the SINAICA in the future. To this end, it will be necessary for the operators of these networks and stations to apply the quality assurance programs and design principles for air monitoring systems presented by this series of documents, in order for their information to be valid, classified and distributed on a national level.
7

Figure 3.1 Geographical Areas for Air Monitoring
to be incorporated into the SINAICA 2003-2006
Source: www.sinaica.ine.gob.mx/ (INE, CENICA, 2004)
The Secretariat of the Environment and Natural Resources, through the National Institute of Ecology, will specify systems and stations of national interest in accordance with the following criteria:
They must be systems or stations that are representative of an air sample area with more than one million inhabitants They must be systems or stations that are representative of an air sample
area where there are species of wild flora or fauna under threat or in danger of extinction They must be systems or stations that are located in a sea or land border
area, where air pollutant interchange phenomena are registered They must be systems or stations that are located in strategic areas for
national development, in accordance with the National Development Plan,
8

regardless of whether this is because of their productive relevance, cultural value or scenic value Their representativeness must be scientifically and technically
documented Any air monitoring stations classified as being of national interest must measure all criterion pollutants in the field of health or the environment under official Mexican standards and pursuant to their design objectives, and they must also be in uninterrupted operation and not be relocated without prior notice and the authorization of the federal environmental authorities. Uninterrupted operation refers to continuous measurement of a parameter using equipment or instruments that will only stop their measurement functions for reasons of calibration, self-calibration, on site maintenance or immediate replacement, without exceeding a total accumulated loss for such causes of 5% of the total number of data programmed for collection each year, pursuant to their sampling protocol. If a station classified as being of national interest needs to be relocated for causes of force majeure, said relocation must take place without affecting its representativeness in the air sample area where it is located and after a comparative characterization survey of the new sampling site, which must be assessed and resolved by the corresponding federal environmental authorities. The National Ecology Institute, through the DGCENICA, will set forth specific agreements for technical support for maintaining uninterrupted operation of systems or stations of national interest and, if applicable, design such systems. It will also help the local authorities to obtain funds, identify financing schemes, and train human and technological resources to operate them and provide suitable maintenance. It is worth pointing out that some monitoring stations of national interest may start to operate in the meantime with unique parameters, if there are any major economic or financial restrictions for setting up a measurement network consistent with the criteria mentioned so far. Such is the case of manned and unmanned stations that measure PM10, manually or automatically, given the important health implications of this pollutant. Air monitoring system operators will be responsible for deciding which of their stations are representative of the sample area and which ones are local or represent a specific air sample area. To this end, they must be based on the
9

original design of the air monitoring system and take into consideration the technical criteria and specifications included throughout this series of documents. Similarly, operators may suggest to the federal authorities the classification of a station or of a whole network as being of national interest. We put forward that there are only three types of representativeness within SINAICA: national representativeness for statistical and long term continuity purposes; air sample area representativeness indicated by the LGEEPA; and local representativeness, in accordance with the specific problem being monitored. Technically, each station may have different levels of representativeness as is explained later on in section 3.2. The subcodes and characteristics of these stations are defined in the table below:
Table 3.2 Station Classification by Representativeness
Level of
Representativeness or Territorial Importance
Sub code
Characteristics
National N Air monitoring stations selected to represent the country on a statistical level, must have uninterrupted operation, measuring all criterion pollutants and weather parameters.
Air sample area C Air monitoring stations whose territorial representativeness is determined by the geographic / space limits of an air sample area. They include one or more municipalities of the same state or from different states and can monitor one or more criterion pollutants.
Local L These are systems or stations that represent local or micro-space air quality conditions only in a given air sample space, and can monitor one or more primary criterion pollutants.
Stations must also be classified in accordance with their immediate environment, whether it is a prime indicator of its representativeness or of territorial importance, especially if air emergency plans are applied. In order to avoid ambiguity in the description of the immediate environment of each station when it is located in an urban area, we suggest extending the basic nomenclature used in municipal Urban Development Plans, most of which are applied by the design handbooks of the Secretariat of Social Development (SEDESOL – acronym as given in Spanish).
10

If the station is located in a rural area, it is recommendable to indicate whether it is in a federal or local Protected Natural Area, if its environment is subject to temporary productive activities (agriculture, forestry, cattle raising, etc.) or if it is located in a relatively complete natural ecosystem, such as a beach, a forest or a prairie that is only used for tourist or recreational purposes or as a territorial reserve.
Table 3.3 Classification by Environment
Type of station Subcode Characteristics Urban
Industrial Residential (1)
Services Mixed Residential
UI UH US
UMH
It is located within the limits of an urban area and its surroundings are subject to predominant ground usage
Rural ANP
Natural ecosystem Induced productive
ecosystem (agriculture, cattle, forestry, tourist, etc.)
RA
RN (2)
RP
It is located in non urbanized areas where ground usage may range from production to conservation
(1) For mixed residential usage, industrial, service and infrastructure usage must be lower than 25%. (2) The RN subcode must be assigned to natural ecosystems that are NON productive and in a good state of conservation, such as sea, coastal, desert, high mountain ecosystems, as well as others.
The subcodes specified in Tables 3.1, 3.2 and 3.3 must be added to the denomination subcode for each station in the Database. For example, the Pedregal station of the Metropolitan Area of Valle de México, which has the subcode PED, must be encoded ZMVM-PED-N-UH, as it is a station of national interest and its urban environment is characterized as a residential usage area. The purpose of this codification in SINAICA is to homogenize the subcodes of each station, identifying the immediate environment and the function of the station in accordance with its space representativeness and territorial importance in the country’s Air Quality Management.
11

3.2 Space Representativeness and Air Quality Management Regardless of the classification given to stations in the SINAICA, air monitoring stations have a characteristic space representativeness within the monitoring network, which depends on the topography of the territory they are located in, as well as on their immediate natural or urban environment, weather conditions, the height at which air samples are taken and the type of pollutant or meteorological parameter they are measuring. Below is the classification of representativeness that is most useful and most widely used by international sampling stations:
Specific Point or Confined. Often referred to as “tunnel” or “street level”, because they are located in streets or avenues with buildings on both sides more than six meters high. Micro Scale. These are stations whose measurements are representative of an area with a radius of up to 100 meters. Medium Scale District or Neighborhood. Stations that represent air quality in an area with a radius of 100 to 500 meters. Medium Municipal Scale. Representative of an area with a radius of 4 kilometers, that may often coincide with the limits of a municipality or administrative district. Urban to City Level Scale. These represent a whole city covering an area of between 4 and 50 kilometers. Some pollutants need to be measured at more than one station in order to obtain representative data on such an extensive air sample area. Regional Scale. This scale includes rural areas with homogenous geographical characteristics, and which may extend several hundred kilometers, for example plains or large valleys. National Scale. These are stations capable of describing pollutant concentrations or characteristics over a very extensive common territory. The uneven topographical features of our country do not allow us to have stations of this type. (Note: it is important not to confuse this type of stations with those of national interest) Global. These are stations that measure parameters of global interest, such as greenhouse gases, and toxic and persistent pollutants.
Space representativeness is closely linked to monitoring objectives, the parameters to be measured and the different assignations of interest or functionality in the field of air quality policy and management.
12

The table below gives an optional assignation of criterion pollutants versus the space representativeness of stations and the representativeness subcode of SINAICA. The specifications of this table do not include the space coverage possibilities of remote air monitoring perception methods or optical route measuring instruments, such as LIDAR or the commercial optical system called DOAS.
Table 3.4 List of possible representativeness scales and
parameters to monitor1
Sample Area or Local Stations Stations of National Interest
Scale SO2 CO O3 NO2 Pb PST PM10 PM2.5 SO2 CO O3 NO2 Pb PST PM10 PM2.5
Micro scale
Medium neighborhood
Medium municipal
City
Regional
Adapted: EPA (1998).
The smaller the scale of representativeness, the more limited and specific the sampling objectives. So, in order to measure the impact of a specific source it is necessary to use small scales, while for estimating the impact on public health it is necessary to have stations with municipal or city level representativeness. This is also the case with air pollutants. Carbon monoxide, which is not very reactive and is easily dispersed, can be measured with very acceptable levels of representativeness in micro stations and at the urban level. On the other hand, photochemical or highly reactive or unstable pollutants, such as hydrocarbons, nitrogen oxide and ozone, require scales from medium to global in order for their measurements to be representative. If it is necessary to detect high levels of pollution that could put one or several vulnerable or sensitive groups of the population at risk, then stations with medium and small scales of representativeness should be used, so that air emergency programs may be implemented with a high degree of trust in the measurement.
13

If it is necessary to define, in a survey or monitoring campaign, the base level or the background contamination of a pollutant, as well as the effect of extended urban phenomena, such as public transport or the burning of LP gas, then the scales of representation must be medium to regional.
14

4. AIR MONITORING SYSTEM TARGETS Air Monitoring Systems (SMAs) must have clear and precise targets on a national, regional and local level. These targets must be set forth in qualitative terms, with quantitative definitions based on solid scientific and technical knowledge. These targets must be both general and particular for the different phases and components of air monitoring systems, so that targets are set with regard to measurements, the quality of data obtained, performance in the protection of the environment and public health, as well as budgetary and administrative efficiency targets, particularly in the case of systems run by government institutions. The general targets that must be met on a national level by all SMAs are the following:
1. Monitor compliance with air quality standards that protect public health and the integrity of ecosystems and natural resources in the national territory.
2. Activate environmental or air-related emergency measures or programs when pollution levels pose a serious risk to public health.
3. Gauge progress in the prevention and control measures of the federal and local Plans or Programs intended to conserve or improve the air quality of a region or city.
4. Gauge the impact of sources of air pollutant emissions, regulated by standards and legal procedures.
5. Define air quality trends in urban or rural air sample areas of national interest.
6. Set forth reliable databases to help public or private research into the environmental and social impact of air pollution on a global, national, regional and local level. In particular, air monitoring systems must be linked with the Sistema Nacional de Vigilancia Epidemiológica (National Epidemiology Monitoring System), coordinated by the Secretariat of Health of the Federal Government, and must allow research in the fields of ecology, meteorology, atmospheric chemistry, transport and pollutant dispersion, as well as other things.
15

4.1 General Procedure for the Definition of Monitoring, Data and Measurement Quality Targets Pursuant to the Regulation for the Prevention and Control of Air Pollution, it is the local authorities, with the help of the federal government, that must set forth and operate SMAs. As a result, the local authorities must set the system targets through a process that includes at least the following steps:
STEP 1. Precise definition of the problem of pollution, public health or environmental deterioration to be resolved.
If there is no monitoring network in operation and the level of pollution of the city or region in question is not known, it will be necessary to perform surveys or measurement campaigns and an accurate inventory of sources of pollution. It is recommendable that the measurement campaign last at least one year so that temporary variations in emissions and the impact of weather conditions on the dispersion and concentration of pollutants may be observed. Preferably, these surveys should be performed using standardized instruments and methods, but alternative instruments and methods may be used to cut costs or extend geographical and subject matter coverage.
STEP 2. Definition of vigilance and control indices and indicators pursuant to the standards in force and information needs for finding out about and understanding the future evolution of the problem to be resolved.
On the basis of the knowledge obtained on the problem, it is necessary to select the pollutants and meteorological parameters to be measured, including, to begin with, criterion pollutants or those subject to official Mexican standards in the health sector, as well as the Metropolitan Air Quality Index (IMECA – acronym as given in Spanish). Regardless of the indices and statistical indicators that are applied to analyze the current or historical data obtained at air monitoring stations, the IMECA must be considered the only index for public reporting purposes and the only reference index for applying air-related emergency plans. This will enable any inhabitant in Mexico to find out about and understand the problem of Air Quality in the city he or she lives in, visits or passes through.
STEP 3. Defining the Air Sample Area to be monitored. The concept of air sample area is basically a geographical one. Regardless of the area defined, it may be set in terms of geopolitical, natural or topographical boundaries. The air sample
16

area may also be stratified, seen always as a three-dimensional space, based on the average height of the mixture layer, the incidence of temperature inversion and other meteorological phenomena linked with air pollution.
STEP 4. Definition of Quality Targets for Data Quality and Measurement Quality, in accordance with the design and level of SMA reliability.
Once the indices and indicators to be used for taking decisions on the problem defined in Step 1 have been identified, it is necessary to define data quality characteristics and the maximum “Total Error” range acceptable to the local and health authorities that will be taking management decisions in this regard. Also, operational rules may be set forth for the actions of the authorities and the different actors in an air pollution control program, applying a “Precautionary Principal” to begin with.
STEP 5. Redefinition of Targets in accordance with the experiences obtained from their application.
The application of Quality Targets in a minimum period of one year, preferably three, must bring about an evaluation of said targets.
These procedures must be performed by the coordination agency set forth for Air Quality Management in the region or urban area in question. It is very important that government representatives from the health, industrial and transport sectors take part in the process, along with representatives from organized society, the media and the main sectors that emit pollutants. As can be seen, Step 4, which defines data acquisition quality targets, is crucial for incorporating the air monitoring system and, ultimately, for the integration of the SINAICA. The main product of an SMA is information or data generated by the networks and monitoring stations that comprise it. Air quality data are inputs for a whole range of different and interrelated planning, regulation, education and research processes, with major economic, political and social repercussions. If there is no trust in the data obtained, of it they are not of the quality required in order to be deemed valid or representative, the actions of the local and federal environmental and health authorities may be inhibited, jeopardized or questioned by the public and the scientific community.
17

One ideal and illustrative example of the Data Quality and Measurement Quality targets sought in the SMAs that operate and will be operating in the country, for a defined set of indicators, in this case “Volatile Organic Compounds”, is provided by the following:
To develop a representative database of volatile organic compounds (COV – acronym as given in Spanish) with a known and traceable environmental impact. Such data allow us to analyze and refine the emissions inventory and corroborate the progress made in controlling sources of emissions. Monitoring data will allow us to demonstrate, if applicable, +/- 3% of the annual trend in a 5-year period with a reliability level of 80%. It is also possible to demonstrate, if applicable, a change of +/- 20% in the seasonal average over two consecutive years, also with a reliability level of 80%.
(Summary of an example from the section “EPA-Enhanced Ozone Monitoring” from the website http://www.epa.gov/oar/enhozmon.html)
It is very important to define the changes that, with time, are sought, in the field of pollutant concentration, in order to choose the instruments and quality procedures that will make it possible to detect such change in a reliable manner. The smaller the changes and periods of time for demonstrating progress, the greater the level of instrumentation and work for each SMA component. A real example of the procedure described is given below, with a brief outline of the objectives and targets of the “Program to Improve the Air Quality of the Metropolitan Area of Valle de México. 2002-2010” for ozone (pag. 6-4), a pollutant that has been studied exhaustively:
“The Official Mexican Standard sets forth that ozone concentrations may not exceed 0.11 ppm (100 IMECA points), for periods of one hour, once a year. All the model-based work performed so far indicates that if this limit is to be complied with by the year 2010, it will be necessary to reduce ozone precursor emissions by more than 70% ...more realistically, the targets of the program ..are as follows:
• Eliminate any ozone concentrations higher than 200 IMECA
• Reduce the number of days on which ozone concentrations lie between 101 and 200 IMECA
• Increase the number of days with ozone concentrations within the limit set forth by the standards (100 IMECA points or less)”
18

These Management targets, which would comply with steps 1, 2 and 3 of the proposed procedure, should be assigned a set of Data Quality and Measurement Quality targets obtained in the Air Monitoring System of Mexico City (SIMAT – acronym as given in Spanish), in accordance with Step 4, which satisfies and publicly sets out the targets. In other words, the problem of ozone has been defined and studied extensively from the point of view of health, atmospheric photochemistry and environmental engineering; geographical area management and the air sample area of interest have been defined and modeled; and the quality standard indicator has been provided by environmental legislation. How can data and measurement quality targets be technically defined? The following section deals with answering this question. 4.1.1 Definition of Data Quality and Measurement Quality Targets Within the operational and functional framework of an SMA, it is only possible to know how valid the data obtained are if they meet the quality targets that should have been defined beforehand in the system design. In the creation of the SINAICA, this aspect is essential, given that the main objective of the system is to have reliable data that can be distributed among the public and enable the creation of a historic record of air quality in the country, correlated with statistics in the field of public health and the integrity of ecosystems and natural resources that make up the national territory. While the operators of an SMA may adopt their own statistical methods to measure the performance of their instruments and staff, it is recommendable that, through the SINAICA, the National Institute of Ecology set forth the general procedures, methods and calculations required for defining targets and ensuring the quality of data and measurements. In 1994, the US Environmental Protection Agency issued a guide called “Guidance for the Data Quality Targets Process: EPA QA/G-4” (EPA/600/R-96/055). This guide is strictly oriented towards the regulatory and administrative framework of the United States and is not transferable to our country. However, its basic concepts and definitions are universal in the field of creating monitoring networks and this is what has been taken for the purposes of this proposal. This section therefore provides a definition of general elements to be taken into consideration in order to define Data Quality and Measurement Quality targets. The document on the assurance and control of air monitoring system quality will
19

outline the administrative procedures and specific methods for quantifying the concepts and parameters presented here. In order to set forth Data Quality and Measurement Quality targets, it is necessary to take into account the following quantifiable concepts and parameters at the level of the measuring equipment, a station, a network or a whole air monitoring system:
Statistical representativeness Measurement uncertainty Operational failure Reliability
These four concepts may be integrated statistically in very different ways in the drafting of a Quality Target, as has already been illustrated. The form of integration may be as simple as
“having valid weekly data on particles smaller than 2.5 micrometers at the Xochitepec station representing the average air quality breathed by 90% of the population living in the urban area”
or as complex as
“detecting, at each measuring station, trends regarding concentrations of different chemicals consisting of particles smaller than 2.5 micrometers, with an annual range of variation of 3 to 5 per cent, in a historic series of data for 3 to 5 years, making a seasonal adjustment and with a reliability level of 80%, calculated using a statistical test”
This Data Quality target may be assigned a Measurement Quality target or acceptable “Total Error” target that may be worded as follows:
“the maximum acceptable total error for measurement, given as a percentage of the variation coefficient for the sample taking and analysis process, must be no more than 10% for all anions y cations, 15% for total carbon and 20% for elements detected using X-ray fluorescence”.
20

(Examples taken from the document “Quality Assurance Project Plan: PM2.5 Speciation Trends Network Field Sampling. EPA-454/R-01-001. December, 2000”)
At the end of the section, we suggest the adoption, as a basic operational indicator of sample efficiency levels in an item of equipment, a station or a network, of an air monitoring system or the SINAICA, using the database integrity percentage, in accordance with the amount of “validated” data out of the amount of theoretically “expected” data, for each pollutant, pursuant to the sampling protocol. Statistical representativeness of monitoring stations If we take, as a basis, the targets specified in the foregoing section and the instructions set forth by the LGEEPA and its Regulation in the field of Air Quality Management, the SMAs must provide data that are representative of the air sample area in which measuring stations will be installed or have already been installed. This data may also be representative of the quality of the air breathed by the population and of the air that affects the ecosystems to be protected. Data representativeness is therefore the first feature that must be defined as a quality target when designing an SMA. While representativeness may be defined in terms of time and space of a statistical sample for air quality, the representativeness of a station, a parameter or data may change with time if extraordinary meteorological and social events take place and on changing the usage or usage intensity of the soil or the natural resources to be protected. The representativeness of a system may be affected by the following aspects:
• Size, topographical complexity and weather conditions of the air sample area
• Intensity of demographic, urban, industrial and service sector dynamics in the air sample area
• Numbers and levels of monitoring station and network equipping and automation in the system
• Operational sampling plan specifying number and spacing, in terms of time and geography, of the samples taken
21

In an SMA, the statistical sample may be intended to describe the behavior, over time and space, of a toxic compound, the quality of air breathed by the human population, a meteorological event associated with air pollution or the dispersion of pollutants emitted by an industrial plant or highway. The representativeness of a statistical sample, such as the ones obtained from a monitoring network, may be measured as the degree of precision and accuracy of data describing a given “population”, with the term “population” understood in statistical terms. Measuring equipment uncertainty Any measuring instrument or procedure is subject to a degree of uncertainty due to failures, errors and unintentional deviations that affect the reliability and, ultimately, the representativeness of the data it provides. Because of this, air monitoring systems must define and operate under pre-set reliability and representativeness levels. Uncertainty in an instrument or measurement process may be calculated using mathematical and/or statistical methods, based on the four following concepts that will apply, at a later stage, to data quality assurance and control procedures:
Precision. This is a random error, usually measured using different expressions or statistical variations on standard deviation. Bias. This is a systematic error. Bias may be positive or negative and is measured as a persistent deviation or error regarding a value deemed correct. Accuracy. This is concept regarding closeness to a value defined as correct, and usually consists of a combination of precision and bias. Detection Level. This is the lowest critical value that can be measured by a measuring instrument or process (e.g. 0.05 ppm of CO)
The above concepts are associated only with data obtained using a standardized measuring process, in other words, when the instrument is working pursuant to manufacturer specifications and under the design and configuration criteria of the stations at which it is located. In general, the detection level is a value provided by the manufacturer that can be confirmed in the calibration laboratories of the air monitoring system. Precision, bias and accuracy values are calculated by equipment operators, system auditors and the environmental authorities, in
22

successive stages in the quality assurance system in which air monitoring systems operate. Operational failure in equipment and monitoring stations If, during the operation of a measuring instrument or process, an electrical, mechanical, physical or chemical failure takes place, or an event external to the instrument or air sample inlet occurs, the measured data must be labeled in the storage number base, with whichever signs, codes or flags (numerical and/or alphabetic) indicate the event that has taken place. Events and the codes that indicate them in the databases may vary from one system to another, according to the design of each network or to practices established previously. Some failures and typical codes are given below:
Table 4.1 Example of data flagging codes
Event taking place Code Interruption of electric power
FE
Increase in internal Station temperature
AT
Fire less than 25 meters away from the monitoring station
I25
Negative value VN
In additional to the uncertainties of an instrument and any external failures that could take place in the course of its normal operation, prolonged stoppages may also arise due to the lack of spare parts, calibration gases, power failure or even natural disasters, that would result in the loss of information. The absence of data, under a continuous sample take-up protocol, is an important assessment or performance factor to take into consideration in the operation of an air monitoring network.
23

Reliability and Efficiency The combination of station representativeness levels, the inevitable uncertainty of measuring instruments and failures that may occur during the operation of monitoring systems, gives us the total efficiency or reliability of the system. Efficiency is increased to the extent it has ample coverage, instruments are appropriate and punctually maintained, calibrated and stocked, and mechanisms are available for successfully dealing with any internal or external failures that may arise. The basic indicator that may be measured indirectly at the level of efficiency to be expected from the monitoring system, when it has representative stations, is the integrity or sufficiency of the database, the percentage value obtained for each criterion pollutant, by each station type, the network, the system and the also the SINAICA, as follows:
Amount of data validated in a year Amount of obtained data programmed
according to sampling protocol
INTEGRITY OR = SUFFICIENCY of
the database (%)
In a SMA, efficiency levels higher than 85 % are acceptable, those higher than 90% are ideal and those higher than 95% are impossible, given the need to perform stoppages for maintenance and the intrinsic and inevitable failures of measurement instruments. The total number of errors, accumulated throughout the whole process of sample take-up, sample preparation, if necessary, and analysis using a measuring instrument or laboratory, must not be greater than 20%. An acceptable level would be lower than 10% and the ideal level is lower than 5%. The parameters measured manually have a higher percentage of total error, even higher than that given in this paragraph, while measurements made with unmanned and remote monitors provide measurement with a low error rate. Equipping, automation, training and operational preparation levels of the staff involved in an air monitoring system also have a financial and administrative
24

impact that must be taken into consideration and which directly affects air monitoring system reliability. Monitoring networks are often installed under turnkey contracts and their operations are launched before they have been incorporated into a complete air monitoring system, so that stations deteriorate little by little or are subject to shortcomings in maintenance, data validation or report distribution. If total and annual efficiency levels are set at 90 or 95%, administration of the air monitoring system must seek to achieve this target. As a result, air monitoring system reliability must be agreed and committed to by institutions and agencies that use the data generated by this system.
25

5. BASIC COMPONENTS OF AIR MONITORING SYSTEMS The components of air monitoring systems (SMAs) must efficiently and reliably meet design objectives, as well as the information needs set forth by the official standards in force in the field of air quality. All SMAs operating in the country must generate, compile and interpret, either on their own or through interconnection with other complementary and external systems, sufficient and reliable information on atmospheric concentrations of criterion pollutants, their origin, mode of transport and transformation in the air sample area. SMA operators must, in turn, be capable of drafting and distributing among the printed and electronic media, hourly, daily, weekly, annual and historic reports for the general public. During any inspections and audits performed by the corresponding authorities and agencies, as well as during any environmental emergencies, SMAs must be able to generate instant and “minute by minute” reports from automatic measured instruments. SMA operators will be responsible for designing and putting into operation an air-related emergency attention program to protect the population during high concentrations of pollutants. The air-related emergency program must have clear and agreed ties with the National Epidemiology Monitoring System, the Federal Commission for Protection against Health Risks (COFEPRIS – acronym as given in Spanish) and the National Civil Protection System. The air-related emergency attention program is mandatory and any noncompliance with it on the part of the authorities and population must be punished pursuant to the laws in force. SMAs must interchange information on a regular and uninterrupted basis with any epidemiological monitoring system run by the health sector on a local and national level. SMAS may contain the following basic functional and operational components in accordance with their specific scopes:
1) Air quality measurement stations network, fixed or mobile 2) Weather stations network, fixed or mobile 3) Network for transmission of automatic data between measuring stations
and the computer center
26
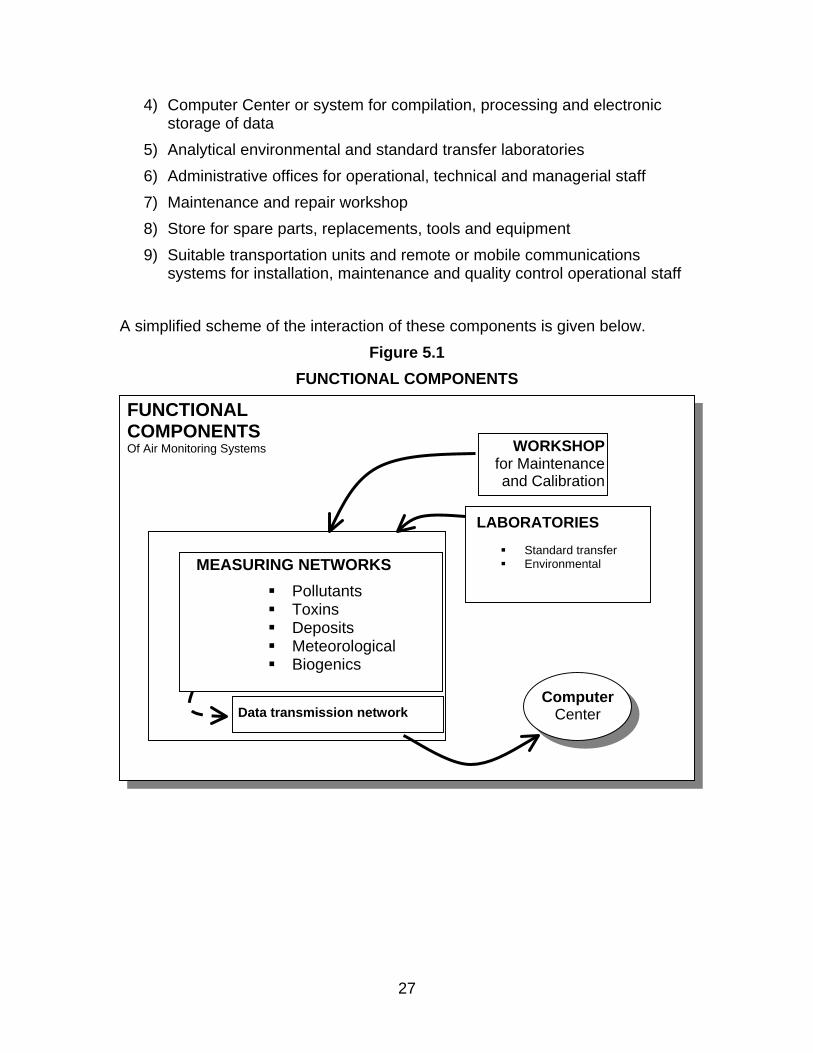
4) Computer Center or system for compilation, processing and electronic storage of data
5) Analytical environmental and standard transfer laboratories 6) Administrative offices for operational, technical and managerial staff 7) Maintenance and repair workshop 8) Store for spare parts, replacements, tools and equipment 9) Suitable transportation units and remote or mobile communications
systems for installation, maintenance and quality control operational staff A simplified scheme of the interaction of these components is given below.
Figure 5.1 FUNCTIONAL COMPONENTS
MEASURING NETWORKS Pollutants Toxins Deposits Meteorological Biogenics
WORKSHOPfor Maintenanceand Calibration
Computer Center
LABORATORIES
Standard transfer Environmental
FUNCTIONAL COMPONENTS Of Air Monitoring Systems
Data transmission network
27

It is also recommended that air monitoring system operators have or belong to an administrative organization, whose State Program for Air Quality Monitoring must include the eight areas of specialization given below:
1) Meteorology Area for pollution and forecasts 2) Technical Support and Equipment Maintenance and Calibration Area 3) Air Quality Data Statistical Analysis and Interpretation Area 4) Press Office 5) Environmental Training and Education Area 6) Quality Control and Assurance Area 7) Managerial and Administrative Area 8) Emissions Inventory Area
5.1 General Characteristics of Functional Components Measurement networks consist of sampling stations or sites. Air quality sampling sites should preferably coincide with the weather stations in order to provide a historic database for correlated data. Nonetheless, air monitoring networks may rely on meteorological data obtained from the National Meteorological System, which is an agency of the National Water Commission. Measurement networks may be located in urban, suburban, rural and natural protected areas, depending on the design objectives set forth for each SMA. In general, urban and suburban networks and stations measure air quality parameters relating to public health, and their main objective is to protect the health of the inhabitants of a city or region. Air quality measurement parameters in networks or stations located in rural or natural protected areas are generally oriented towards detecting ecological or scenic deterioration processes, such as soil acidification or the loss of visibility. Stations may be fixed, semi-fixed and mobile. In general, stations are considered fixed if the measuring instruments are placed inside a permanent building or edifice. Semi-fixed stations are those that have been prefabricated and transported to the monitoring site, where they are set and connected to the service network, but may be removed if necessary. Mobile stations tend to be
28
motorized or transportable, and are used only for temporary sampling campaigns. They are also linked to prospective or research work, and may serve as back-up if there is a failure in a fixed or semi-fixed station. They may be used, too, if any air-related emergencies arise, such as a volcanic eruption or an accident at an industrial plant. 5.1.1 Measurement Network and Instruments Stations may be equipped with manned, unmanned or remotely operated instruments for measuring the air quality parameters set forth by the official Mexican standards of the Health sector or institutional government programs set forth in the National Democratic Planning System. These instruments must comply with the official Mexican standards issued by the environmental sector. The standards that have been issued so far are given in table 5.1. As can be seen, for some air quality parameters and for all meteorological parameters, there is a lack of corresponding Mexican standards. It is even known to current operators of air monitoring networks that some standards are obsolete or have already been surpassed technologically. In order to remedy this deficiency it is very important that the SEMARNAT, through the INE-CENICA, take charge of the normative process leading to the creation of the absent testing methods, as well as to update the existing ones. In the short term, we propose that if a health standard or institutional program specifies a measurement parameter and no corresponding environment sector standard has been issued to indicate the type of method or instrument and the measurement and calibration procedures that will by applied, then the selection criteria must be based on procedures recommended by the World Health Organization and the Organization for Economic Cooperation and Development (OECD) and which apply to our country through agreements of a binding nature, as well as through reference and equivalent methods certified by the US Environmental Protection Agency, and it is also necessary to ensure that they coincide with the frameworks set forth by the aforementioned international organizations until such time as local regulations and procedures come into being.
29

Table 5.1 Measurement Parameters in
air monitoring stations
PARAMETER Health Standard Environment Standard
Air Quality Carbon Monoxide (CO) NOM-021-SSA1-1993 NOM-034-ECOL-1993
Total Suspended Particulates (PST) NOM-024-SSA1-1993 NOM-035-ECOL-1993
Ozone (O3) NOM-020-SSA1-1993 NOM-036-ECOL-1993
Nitrogen Dioxide (NO2) NOM-023-SSA1-1993 NOM-037-ECOL-1993
Sulfur Dioxide (SO2) NOM-022-SSA1-1993 NOM-038-ECOL-1993
Particulates smaller than 10 microns (PM10) NOM-025-SSA1-1993 N/E
Particulates smaller than 2.5 microns (PM2.5)
N/E N/E
Lead (Pb) NOM-026-SSA1-1993 N/E
Volatile Organic Compounds (COV)* N/E N/E
Humid Deposit (acid rain) N/E N/E
Dry Deposit N/E N/E
Meteorological
Wind speed N/E N/E
Wind direction N/E N/E
Temperature N/E N/E
Rain precipitation N/E N/E
Relative humidity N/E N/E
Ultraviolet Radiation A; B and Total Solar Radiation
N/E N/E
N/E means does not exist or has not been published in the Official Gazette of the Federation
Air monitoring networks and stations may not, for their routine operation and for official reporting purposes, be equipped with experimental items or commercial prototypes that have not been approved or authorized through an official procedure documented by the Mexican authorities or any that correspond to the agencies referred to in the foregoing paragraph. The National Metrology Center is the appropriate government agency for validating the use of measuring instruments under these circumstances.
30

Meteorological instruments and networks must preferably be authorized from a technical point of view by the National Meteorological Service, which belongs to the National Water Commission. Any meteorological data obtained by air monitoring systems must be shared or interchanged, in accordance with the standing defined by the article 59 of the Internal Regulation of the Secretariat of the Environment. 5.1.2 Data Transmission and Storage Measurement networks may generate a vast amount of data annually, depending on the sampling sites and the number of meteorological and air quality parameters determined at each site. Any air monitoring data generated is accompanied by manual and electronic registers and logs on the internal functioning of each instrument and the general conditions of the monitoring station. Such information is essential for validating overall system operation. The transmission and storage of these data and operation registers must be performed pursuant to the highest quality and security standards. Data transmission and storage are as important as data generation. The biggest risk that a SMA could face is the loss of data and the undue and intentional alteration of information generated. Because of this, special care must be taken in designing the transmission networks and the data processing and storage equipment in order to ensure no information is lost due to design errors (telephone line saturation, radio wave interference, etc.), equipment malfunctioning (computers, dataloggers, modems, etc.), sabotage (hackers, electronic viruses, telephone line outage, etc.) or interception of information by people alien to the system. The equipping and electronic automation levels of instruments, stations and networks must be such that data may be sent to a computer center or data inputting, processing and storage system. Data may be sent in several ways, through direct telephone lines, switched lines, optic lines, radiowave, satellite signal or any other means that complies with the following minimum criteria:
• Total Transmission. Any measurements taken pursuant to the official Mexican standards and defined sampling protocols must be sent to the computer center automatically and without interference from operational or
31

maintenance staff, in a timeframe of no more than 15 minutes hourly. Hourly data transmission should preferably be instantaneous, simultaneous in all network stations, automatic and complete.
• Secure Transmission. Transmission must be secure and not allow interference from any alien persons or signals that could extract or alter the data obtained by the measurement networks.
• Clear and Reliable Transmission. The data transmitted must remain unaltered and not undergo any change during transfer or storage.
• Direct Transmission. Transmission must be as direct as possible, between the station and computer center, avoiding transit through systems alien to the monitoring system operator administration, such as telephone exchanges, retransmitters or Internet companies.
• Auditable Transmission. The integrity of the data sent and received must be reviewed at least once every six months, to which end there must be operational records and logs of the transmission network, as well as quality reports.
The storage and back-up of the data generated and the operational information from stations are equally delicate activities. The stages for temporary and definitive data storage are as follows:
In the measuring instrument In the measuring station or unit In the equipment or unit receiving transmitted data In the Computer Center In an external historic file
Stations must have data inputting devices, so that in the event of transmission system failure it is possible to retrieve data manually. Stations must therefore be equipped with computers or electronic devices (datalogger) that allow on site storage of all data generated by measuring instruments for a minimum of one month. Also, in a redundant manner, automatic instruments measuring meteorological parameters, gases and particles must be able to store at least one week’s data generated by such instruments. The computer centers, for their part, must be capable of securely storing up to fifteen years of data and must provide an external physical back-up of the historic database to be located in a building other than the administrative offices where
32

they operate. The latter back-up must take the form of an official Historic file of the municipality or state. It is recommended that each station have a graphic record, additionally or as part of the operational log, of different control parameters, such as internal station temperature, electric power fluctuations, air pump flows, as well as any other parameters that the equipment manufacturer or operators deem important. If it is not possible to send data automatically due to causes of force majeure, the system operator must gather them on site in order to comply with public reporting requirements and local and federal information requirements. 5.1.3 Computer Centers The Computer Centers of SMAs are where information on air quality and the operational state of measurement networks are kept, administered and distributed. Given their importance, Computer Centers must have security systems that allow uninterrupted operation and protect the physical integrity of the equipment and staff members working there. The minimum security systems that Computer Centers must have are as follows: Access Control and Register Internal Environmental Control (e.g. Air Conditioning), especially for
computing equipment whose manufacturer specifications indicate this and when the Center is located in cities or places with extreme temperatures or humidity conditions
Emergency Electric Power Plant Fire System Automatic Back-up Units Permanent Vigilance with professional and trained Security Staff
Computers and peripheral equipment, such as screens, printers, scanners, telephones, speakers, as well as others, that are used for receiving, storing, validating and processing data for reporting purposes and to create databases, must be clearly labeled in terms of their function. Similarly, their location space must be indicated, extensive enough and sufficiently ergonomic so that operators may use them without encountering any difficulties or harm to their health and safety.
33

Computer equipment must be obtained from known brands and have technical support from the original manufacturer. It must also have original programs with licenses and guarantees issued pursuant to the legislation in force at the time. The buildings that house the Computer Center must be easily accessible by road and have a structural report recognized by the local urban authorities or Schools of Civil Engineers or Architects, guaranteeing their physical integrity in the event of an earthquake measuring up to 8.5 on the Richter Scale. 5.1.4 Environmental Analysis and Standard Transfer Laboratories SMAs generate data on air quality and meteorological conditions using Standardized test methods (National or International) in most cases, which means that their general operation is very similar to that of an assay laboratory, from the perspective of the Federal Metrology and Standardization Law (LFMN – acronym as given in Spanish). As a result, any SMAs that may include environmental analysis and standard transfer laboratories as an integral part of their structure, or as an externally subcontracted service, must be accredited, in order to evidence their technical capabilities regarding the specific techniques and procedures for determining criterion pollutants and meteorological parameters, by an accreditation agency that complies with the Federal Metrology and Standardization Law, with said accreditation being based on NMX-EC-17025-IMNC-2000 (equivalent to ISO-IS17025:1999), with regard to “General Requirements for the competency of assay and calibration laboratories”. Document 6 presents the proposal for an Audit Program that would make Accreditation by a Mexican Accreditation Agency (ema – acronym as given in Spanish) and, subsequently, the introduction of a Quality Management System mandatory, so that it is possible to audit quality control and assurance activities in the Air Quality data procurement process of SMAs. If such agencies rely on external analysis laboratories, NMX-EC-17025-1999 sets forth the requirements to be complied with for subcontracting.
34

5.1.5 Administrative Offices and Operational, Technical and Managerial Staff
Measurement networks, stations and instruments must be operated by highly skilled people who have at their disposal the necessary tools and means to comply with the relevant air monitoring system design standards. Managerial and operational staff must have suitable professional qualifications in the field of science and environmental engineering. They must also take part in a permanent update and training program, as an integral part of the Quality Assurance system. SMA administration and operation must be located in the air sample area in question, preventing any remote operation of measurement networks that could prevent or hamper preventive and corrective maintenance of stations and instruments. The location of SMA offices must provide managerial and operational staff with first hand experience of the meteorological and pollution phenomena being monitored and on which policy decisions are being made. Managerial and operational staff must have an identifiable, dignified and spacious working space in which to perform their tasks in an efficient manner. It is vital that SMAs have an Identity and Image Handbook, which includes, in addition to other institutional aspects, an official logo to be used on stationery, stations, mobile units, operator uniforms or the Internet website of the system. The official image of the system must be owned and easily recognizable to the population, the media and the different government agencies (example in figure 5.1).
35

Figure 5.2 Official image of the Air Monitoring Network
of the city of Puebla
Source: http://www.rema.gob.mx/rema_sima/
If the local authorities in charge of the SMAs contract out SMA operations to a private company or a government institution or agency, be it autonomous, deregulated or decentralized, it is necessary to ensure that the identity of the system does not get confused with that of the operator. 5.1.6 Operation Maintenance Equipment and Tools SMA operators must have internally proven skills for operating the equipment and instruments of the monitoring stations and maintaining them in optimum conditions. To this end, it is essential that they have the physical spaces, necessary tools and means of transport and communication to perform their work in a suitable manner. The systems must have a Maintenance Workshop that is either their own, obtained by agreement, directly contracted or guaranteed, in order to perform, outside the monitoring stations, any repair work, operation testing, cleaning and equipment calibration. These workshops must have a store for consumable goods, parts, spares and replacement equipment to allow the uninterrupted operation of stations and instruments measuring criterion pollutants. It is necessary to prevent, at all costs, any indefinite stoppages of measuring stations or instruments, due to shortages or tools, spares or consumable goods, through annual acquisition programs. These items must be purchased at least six months in advance, given that most of them are of overseas origin. In order to ensure suitable communication during periods of air-related emergencies, operational and maintenance teams must dispose of automobiles for the purposes of mobility, as well as remote communication systems, such as
36

cellular telephones, pagers, radios, etc. All of this equipment must be kept in good maintenance and operation conditions. 5.2 Specialty Area Products The eight specialty areas proposed for the Air Monitoring Systems can be set up as independent administrative units, institutions or consultancy firms that provide the service externally and under contract, or multi-institutional work teams that collaborate in the development of necessary inputs. In order to illustrate this proposal, it will suffice to summarize the current situation of many networks operating in the country, in which all the specialty areas may be brought together under one government General Management department or be assigned to external agencies. Emissions inventories may therefore be kept and updated by research institutions or private companies; weather forecasts may be provided by meteorologists at the local airport, the National Meteorological Service or free systems on Internet; technical support, maintenance and equipment calibration services may be delegated by the manufacturer, a certified national laboratory or a foreign entity pursuant to a bilateral agreement, as is the case with border networks; quality control and assurance may be performed by the Internal Controllership of the local government; and Press Office duties may be carried out through an agreement with a non government organization or the Press Office of the state or municipal governments. The organizational modalities for covering the eight specialist areas proposed are very broad and diverse, as a result of which an outline is provided below of the most general and relevant products of such areas, which, at the appropriate moment, must be requested in the air monitoring system section of the new Air Pollution Prevention and Control Regulation. 5.2.1 Reports and Press Office SMAs must have an area that makes statistical, cartographic and interpretative reports on air quality in the air sample area being monitored. In addition to other possible functions, this area or set of areas will be in charge of validating the data generated by the measurement networks, creating system databases, calculating Air Quality Index values on an hourly basis, compiling weather forecasts, incorporating policy decisions whenever necessary and sending the information to the press office to be disclosed to the public.
37

We propose that the following reports and actions be mandatory: The disclosure of Metropolitan Air Quality Index (IMECA) data every hour
between 6 a.m and 10 p.m, especially for systems or stations of national interest.
The declaration of an Air-Related Emergency when criterion pollutant
concentrations, measured pursuant to the IMECA, surpass the activation values set by the respective Air-Related Emergency Program or, if applicable, by the LGEEPA Regulation of Air Pollution Prevention and Control.
The disclosure of a daily weather forecast, linked to transport and pollutant
concentration phenomena, especially during periods of air-related emergency.
A public report after each Air-Related Emergency, giving a description of
the evolution of the phenomenon, the actions and decisions taken and the results obtained
A public annual air quality report on the air sample area monitored by the
monitoring system A two-yearly report, publishable as part of the report on Environmental
conditions issued by SEMARNAT at the orders of the LGEEPA. Pursuant to the Federal Law on Transparency and Access to Government Public Information and the General Ecological Equilibrium Law, all these reports must be presented in a simple and self-explanatory manner, with graphic and didactic elements, in order to make them more comprehensible to the general public. They must also be incorporated into the National Air Quality Information System (SINAICA) and published at the appropriate time in the mass media and websites of the cities or organizations running the air monitoring system. 5.2.2 Emissions Inventory The most useful tools for deciphering the mixture of pollutant gases and particles of an air sample area and performing Air Quality Management is the Air Pollutant Emissions Inventory. As a result, it is preferable that SMA operators include an
38

Emissions Inventory area in their organizational structure (or at least a very extensive relationship) with trained staff to work continuously on the inventory, dividing their efforts up among the following fields of work: Fixed Sources
• Specific: Industries and Services with medium to large combustion equipment and processes. Many of these are obliged to present an Annual Operation Record which is included in the Record of Pollutant Emissions and Transfer, RETC (acronym as given in Spanish).
• By Area: Services and residential houses with small capacity or diffuse emission processes and equipment.
Mobile Sources, automobiles running on gas, diesel, LP gas, natural gas or hybrids with the burning of fossil fuels
• Private vehicles
• Public transport
• Freight transport Natural Sources
• Areas with no vegetation
• Forests and green urban areas The emissions inventory must be created, updated and published at least once every six months. Air Quality data must be correlated with emissions inventory data through a number of different possible statistical, cartographic, mathematical and experimental simulation methods (e.g. ozone chambers), in order to set forth explanations for the phenomena of dispersion, concentration and transformation, in time and space, of pollutants in the air sample area being monitored. It is necessary to consider that the validated and interpreted data in the emissions inventory, as well as Air Quality data, must be published at least once every two years, pursuant to the Federal Law on Transparency and Access to Government Public Information and the General Ecological Equilibrium Law, in simple and self-explanatory reports with graphic and didactic elements, in order to make them more comprehensible to the general public.
39

5.2.3 Quality Management System (SGC) The operators of air monitoring systems must set up an SGC in their organization that includes at least the following features: Organic structure that monitors and administers the system continuously Definition of Quality Targets, especially for the main product of the system
which is: air quality information or data (in representativeness and amount)
Continuous staff training and update program Document organization system which includes a general handbook,
procedures, logs, reports and memories, as well as other things Procedures for:
• Installation, operation, maintenance, calibration, testing and replacement of measuring stations and instruments
• Sampling chain of custody and sample analysis for manual measurement parameters
• Collection, inputting, transmission, validation, storage and processing of meteorological and air quality data
• Statistical analysis and data report
• Attention to air-related emergencies
• Internal and external communications Auto-evaluation program, accreditations and/or certifications
We suggest that all air monitoring systems or networks operating in the country have their quality assurance and control system installed and registered with the SEMARNAT before the year 2010. SGC quality assurance and control activities must be updated if any modifications are made to environmental legislation and the official Mexican standards, or if any relevant extensions or modifications are made to the monitoring networks or administrative and operational structure of the air monitoring system. 5.2.4 Attention to Air-Related Emergencies If weather conditions are adverse to the dispersion of pollutants, which are then accumulated in the atmosphere in concentrations that exceed the limits set forth
40

by air quality standards, the environmental and health authorities must issue a public alert and coordinate actions with the other authorities of the city in order to protect the population and reduce emissions of any pollutants whose concentration in the atmosphere has surpassed the legal limits. With the creation of the Metropolitan Air Quality Index, the value of one hundred (100) corresponds to the maximum safe concentration of a pollutant, without causing harm to people’s health. If the IMECA value of a pollutant extraordinarily exceeds 100 points in an air sample area, the public alert specified in the foregoing point must be issued in the framework of an Air-Related Emergency Program, which complies with all the regulations set forth in the field of environmental emergencies by the LGEEPA and the federal and state Civil Protection laws. An extraordinary air pollution event is a phenomenon combining high concentrations of pollutants (higher than 100 IMECA points) and high air stability, detectable by the existence of a synoptic high pressure system, surface wind speeds of less than one meter per second through the whole air sample area being monitored, zero rain precipitation and a surface mixture layer with a height of less than 300 meters. Phenomena associated with the existence of prolonged temperature inversion lasting more than 24 hours and high indices of solar radiation may worsen the situation and the weather forecast for the air-related emergency. If the IMECA value of a pollutant systematically exceeds 100 points, regardless of the prevalent weather conditions and seasonal climatic changes, it is necessary to develop and apply a complete air quality improvement program, which sets forth immediate and medium term measures to protect the population, reduce pollutant emissions and restore concentration levels that are safe for human health in a reasonable time that is acceptable to the public. Air-related emergency programs must include the following elements: Actions to take in phases throughout the IMECA scale, starting at 100 and
going up to 500 points. Phases for action will be defined with breakdown points set forth by the health authorities, pursuant to the incidence levels of illnesses associated with air pollution.
Measures for controlling emissions sources on two levels of action: to reduce problem pollutants (primary or secondary and their precursors) and to avoid the simultaneous presence of pollutants in a highly stable atmosphere.
41

Measures for protecting the following vulnerable groups: children, pregnant women, elderly people, people suffering from cardiovascular or respiratory disorders, and sportsmen and sportswomen, in the case of emergencies due to photochemical or secondary pollutants.
Mechanisms for communication between the public and the authorities for activating and deactivating the emergency program.
Mechanisms for internal communication between the health, environment, civil protection, transport, education and energy authorities, as well as other possible participants, pursuant to federal and local environmental legislation.
Mechanisms for environmental and epidemiological assessment of the program per event.
Air-related emergency programs must be developed preferably within any citizens’ coordination and participation organizations that are set forth or operate in each air sample area. These must also be announced through the printed and electronic media, so that the public is aware of them or able to access the content of the program when necessary. 5.2.4.1 Epidemiological Monitoring during Air-Related Emergencies As was pointed out earlier, the basic purpose of urban air monitoring is to protect human health by informing the public of the air quality it breathes and taking emergency measures when pollution levels put people’s health at risk. In air-related emergency situations, the environmental and health authorities must activate an Emergency Epidemiological Monitoring Program. This program must be able to make an exhaustive diagnostic of the public health situation and the possible needs for specific communication, attention or intervention. It must be able to plan and formulate response measures, as well as record and report the impact on morbidity and mortality rates through public health indices and indicators (e.g. the number of reported cases of asthma or acute infectious respiratory illnesses). Specifically, the local health authorities must develop standardized protocols for Health Centers that will provide reports and continuity for environmental emergencies while they last and in the days after them. The specific impact of the emergency must be reported on a daily basis, using preferably electronic means for data inputting, transmission and analysis.
42

Timely continuity, with fast and sure analytical results, will help assess the risk posed to the public as well as indicate when it will diminish or vanish. Such a timely response, which offers coverage and efficiency and is technically valid, must be provided through coordination within and between different sectors and the community. The assessment of the effect of pollution on human health will not necessarily be clear at once, and may require extended monitoring on days after the event, due to the time lapse in the impact and in the reporting thereof. It is important to highlight the need to incorporate the study and continuity of this time lapse as part of the assessment process. The National Epidemiology Monitoring System, in the medium and long term, must contain the same reporting requirements, in terms of incidences of respiratory and cardiovascular affectations on a daily basis, even if the reporting of these effects may be done weekly. It is necessary to maintain epidemiological monitoring even when pollution levels are relatively low in order to assess the level of protection offered by air quality standards and estimate the impact on the public of chronic levels of air pollution. These reports will enable epidemiological monitoring to be set up on a national basis. Continuity and the result of these observations also requires coordination within and between different sectors and the community.
43

6. BIBLIOGRAPHY
1. EPA (2000).Quality Assurance Project Plan: PM2.5 Speciation Trends Network Field Sampling. EPA-454/R-01-001. December.
2. EPA (1998). Quality Assurance Handbook for Air Pollution Measurement Systems. Vol. II; Part 1, Office of Air Quality Planning and Standards, Research Triangle Park, USA.
3. EPA (1996). Guidance for the Data Quality Targets Process: EPA QA/G-4.(EPA/600/R-96/055.
4. SEMARNAT (2002). Programa para Mejorar la Air Quality de la Metropolitan Area of Valle de México 2002-2010. México.
INTERNET
1. http://www.sinaica.ine.gob.mx/ (INE, CENICA, 2004) 2. http://www.epa.gov/oar/enhozmon.html. Section “EPA-Enhanced Ozone
Monitoring” 3. http://www.rema.gob.mx/rema_sima/
44

DOCUMENT 3
Design and Installation of Air Monitoring Systems

INDEX
PAG.1. INTRODUCTION 1 2. DESIGN OF AN AIR MONITORING NETWORK 4 2.1 Characterization of an Air Sample Area 7
2.2 Parameter Selection and Frequency of Measurement and Reporting 11
2.2.1 Air Pollutants 12
2.2.2 Air Quality Measurement Technologies 19
2.2.3 Atmospheric, Climatic and Meteorological Phenomena linked to air pollution 25
2.2.4 Standardized Parameters and Measurement Times 31 2.3 Administrative and Functional Criteria in the Selection of Measurement Instruments 33
2.4 Selection of Measurement Site 35
2.4.1 Characteristics of Air Monitoring Networks in Urban Areas 37
2.4.2 Characteristics de Air Monitoring Networks in Rural Areas 40
2.4.3 Characteristics of the site where station to be located 42 3. MONITORING SHELTERS AND INSTALLATION OF MEASUREMENT INSTRUMENTS AND COMPUTER CENTER 47
3.1 Constructive and Functional Characteristics 50
3.2 Sample inlet 51
3.2.1 Residence time determination 54
3.2.2 Sample inlet height 55
4. BIBLIOGRAPHY 57
ii

LIST OF TABLES PAG.
Table 1 Accuracy Values and Resolutions 31 Table 2 Summary of standardized sample take-up time, frequency of measurement and
form of reporting 32
Table 3 Number of air quality measuring stations in urban areas proposed by the OPS 39
Table 4 Minimum separation distance between sample inlet and streets or avenues with vehicular traffic recommended by USA-EPA 46
Table 5 Height of sample take-up location 56 LIST OF FIGURES
Fig. 1 General Design and Functional Operation Scheme for an SMA 5 Fig. 2 Grid for selecting air monitoring sites in rural systems. 40 Fig. 3 Typical arrangement of an air monitoring station 49 Fig. 4 Ideal internal arrangement of an air monitoring shelter 51 Fig. 5 Example of Sample inlet arrangement 51 Fig. 6 Vertical Manifold with thermal insulation 52 Fig. 7 Horizontal Manifold with thermal insulation 52 Fig. 8 Sample inlet of an automatic particle analyzer 52
iii

1. INTRODUCTION Air monitoring systems (SMAs – acronym as given in Spanish) are basic tools in the environmental planning and management of cities or regions with problems of air pollution. Air, which was once regarded as a free and unlimited resource, is now scarce in quality for many sectors of the population. In fact, keeping the air free of manmade pollutants involves a good deal of human, technological and economic resources, as a result of which the measuring of air quality is not just the first step in dealing with the problem of air pollution but also an essential tool for providing continuity and assessment as part of a pollution control program. The deterioration of air quality in our country has been documented for over half a century through a number of research projects, measurement campaigns and the temporary and permanent operation of monitoring stations and networks. It wasn’t until the mid 1980s that the continuous and automatic operation of the first air quality monitoring network in our country was launched, specifically in the Metropolitan Area of Mexico City. Later on, other cities began installing networks or stations measuring air pollution in a constant manner, creating a consistent historic record for a large proportion of urban and industrial areas in the country. Given the absence of a national normative framework, the networks currently operating in Mexico were designed and installed under a broad range of engineering criteria and applying, in most cases, the regulations and technologies of developed countries with which Mexico has bilateral agreements in the field of scientific and technological interchange. Some of the supporting surveys and measurement instruments of these networks were donated by countries such as the United States, Japan, Germany and Spain. For instance, in the border cities of Tijuana, Mexicali and Ciudad Juárez, the Environmental Protection Agency donated stations and runs them in coordination with the SEMARNAT and the local authorities; the Monitoring network in Toluca was supported by the Spanish government with equipment from France; cooperation agencies of the German government have provided assistance for the creation of monitoring networks in el Bajío; and the governments of the United States, Japan and Germany often provide support, as they have done since the outset, for the SMA in Mexico City. On other occasions, air monitoring networks were developed under contract with private companies, thereby increasing the diversity of the criteria used for design and installation. In general, current operating conditions of air monitoring networks in Mexico are subject to significant limitations, mainly with regard to the availability of financial, human and material resources. For example, in the case of the Monitoring Network of the Metropolitan Area of Monterrey, the original design contemplated the installation of 10 stations, but the lack of funds limited installation to 5 stations.
1
Air monitoring networks in Mexico are largely influenced by normative and technological schemes in the United States. Most stations are equipped with measuring instruments made or standardized in that country pursuant to the standards of the US Environmental Protection Agency (USA-EPA). Many technicians currently operating these networks have been trained directly by EPA staff and then passed their knowledge on to Mexican technicians. Similarly, if network operators have any doubts or wish to expand or update their knowledge, they consult the EPA website on Internet, as this website has, beyond doubt, more on-line information on air quality and monitoring that any other in the world. Moreover, new generation instruments for sampling and/or measuring gases or particles manufactured in the United States and installed in Mexico have menus and internal work routines that comply with the specifications required by the EPA, through title 40 of the Code of Federal Regulations (CFR40), but they are underused in our country and could be used to strengthen the SINAICA. For example, the analyzers of the Monterrey and Puebla networks are equipped with software innovations that can automatically generate reports to be sent directly to the AIRS/AFS (Aerometric Information Retrieval System, currently the Air Facility Subsystem) of the EPA, as well as with systems that have auto-verification functions, zero and span adjustment, automatic data correction options, calibration curve preparation and internal storage for sets of instrument performance indicators. The design of new air quality measurement networks in our country, along with the design of current networks and their future expansions, in terms of both instruments and territory, may improve substantially if criteria are standardized on a national level in order to facilitate the interchange of administrative and management experiences, horizontal training, mutual support in maintenance, repairs and calibration, as well as pave the way for the strengthening and future growth of the SINAICA. This document has been drafted to set forth criteria and general procedures to facilitate the design and installation of SMAs, with particular emphasis on air quality measurement networks. It is intended for people in charge of Air Quality Management at the federal, state and municipal levels, as well as for monitoring network operators and air quality measurement field consultants. The purpose of this document is as follows:
2

To set forth basic design criteria for air monitoring networks To define the technical specifications that measurement sites and stations
must comply with
3

2 DESIGN OF AN AIR MONITORING NETWORK The air quality measurement station network is the basic component of an air monitoring system (SMA). This network usually also includes meteorological parameter measurement stations or instruments. For the purposes of this document and any future regulations in this regard, an air monitoring network is defined as a set of stations that measure air quality parameters and the meteorological parameters associated with air quality. As is shown in Figure 1, the design of an air monitoring network requires a set of definitions and prior surveys. Design is an exceptionally difficult task even with the help of geographical information systems and computerized statistical models. However, attempts at simplifying this task are common and erroneous if based on empirical methods only. In particular, it is a very risky matter to locate monitoring stations using administrative or budgetary criteria, dictated by the need to locate very delicate and costly equipment at sites that comply with gratuity, accessibility, security and long term presence requirements (Calder, 1975; Munn, 1981, Couling, 1993, Wiersma, 2004). In very general terms, it is not possible to design an air quality measurement network with being familiar beforehand, and with a certain degree of detail, with the characteristics of the air sample area in which it is going to operate. The most relevant characteristics of an air sample area for designing a network are of a topographic and meteorological nature. In Mexico, the National Institute of Statistics, Geography and Computing (Instituto Nacional de Estadística, Geografía e Informática - INEGI) and the National Meteorological System (Sistema Meteorológico Nacional) of the SEMARNAT allow such requirements to be met on the appropriate scale and with sufficiently reliable historic statistical data. Nonetheless, the designing of an urban network requires detailed meteorological information oriented towards meteorological phenomena linked to pollution, which must be obtained or estimated using atmospheric dispersion models on a micro-regional level. Meteorological models may be conceptual, using only official statistical information and the judgement of meteorologists with expert knowledge on the air sample area in question, using complex computerized systems with field verification to check predictions, such as the meteorological RAMS mesoscale model recently put into operation in Valle de México (Molina, 2002).
4

Figure 1
GENERAL DESIGN AND FUNCTIONAL OPERATION SCHEME FOR AN AIR MONITORING SYSTEM
RELEVANT CHARACTERISTICS OF THE AIR SAMPLE AREA
AIR DISPERSION MODELS
NECESSARYSURVEYS
HISTORIC QUALITY DATA
MONITORING CAMPAIGNS
PRELIMINARY ASSESSMENT OF AIR SAMPLE AREA
AIR QUALITY IMPROVEMENT POLICIES AND PROGRAMS
MEASUREMENT AND DATA QUALITY TARGETS
AIR MONITORING NETWORK DESIGN
INSTALLATION
OPERATION AND QUALITY
ASSURANCE
AIR QUALITY DATA
AIR QUALITY STANDARDS
METEOROLOGYTOPOGRAPHYPUBLIC HEALTHEMISSIONS INVENTORY
5
In addition to meteorological aspects, which will serve to locate representative stations, it is essential to be familiar with or estimate air quality in the air sample area beforehand. If any prior air quality surveys are available, they may be very useful. However, the design of a network, along with any redesign or expansion, will always require more recent measurement campaigns that take into account updated air pollutant emissions inventories and the main ground uses in the air sample area of interest. The type and number of measurement instruments to be used may vary to a large degree, ranging from hundreds of passive monitors for a saturation survey (Lacy, 2001), to a mobile station equipped with a single remote action, LIDAR, such as the one used in the first particle characterization campaigns in Valle de México (IMP, 1998). Pollutant dispersion models and the results of monitoring campaigns will help us characterize the air sample area, design our air pollution control program and define the data and measurement quality targets sought. In order to design the network, it is necessary to consider, first of all, the air quality standards that need to be monitored. These standards, strictly speaking, define the parameters to be measured, the methods and, as a result, the type of instruments to select. Nonetheless, network design depends to a greater extent on data quality and measurement targets. The definition of these targets was examined in detail in the earlier documents of this series, and will therefore not be repeated in this document. Locating stations is the most complicated and laborious design-related task. It requires the involvement of interdisciplinary working teams and the conducting of methodical procedures, as is explained later on in this chapter. The designing of shelters where the instruments and sample inlet will be placed is a more straightforward affair, thanks to the diversity of engineering and instrumentation companies marketing anything from prefabricated shelters to station equipment under contractual modalities such as turnkey. Monitoring network design may therefore be viewed as the execution of the following phases or stages (Martínez, 1997):
6

Phase I Definition of Objectives Phase II Characterization of the air sample area
Phase III Selection of sites and sampling parameters for measurement networks
Phase IV Selection of measurement technologies and instruments Phase V Design of measurement stations or shelters
It should be pointed out that air quality and the quality of any environment element in general is always measured in an imperfect manner, as a result of which the objectives referred to in Phase I correspond to the degree of imperfection in measurements that will be allowed by network operators or the local authorities. 2.1. Characterization of an Air Sample Area The concept of “air sample area” is geographical and three-dimensional, and includes the definition of a territory defined by topographical features identifiable in cartography, as well as the stratigraphic description of the atmosphere. An air sample area has a particular wind pattern, influenced mainly by natural obstacles in a given geographical space. These obstacles may be mountains, coastlines, gorges or any physical phenomenon that modifies the general wind pattern on a surface level. In Mexico, the concept of air sample area is clearly recognizable in the extensive and high valleys where cities like Puebla, Toluca, Guadalajara, Oaxaca, Querétaro and Mexico City are located. Nonetheless, it applies equally to open geographical spaces such as the coastal plain where the city of Villahermosa lies and in topographically uneven and irregular terrains such as the areas in which Jalapa, Tijuana, Guanajuato or Zacatecas are located. The physical territorial limits of an air sample area must be defined on the basis of the public interest and the perspective of performing Air Quality Management within it. Any air sample area must have a focal point and space of interest, which is where political environmental planning actions will be centered. This point or space may be a whole urban area defined by its municipal limits, or it may be the central zone of a protected natural area or a scenic area of great aesthetic or cultural value that is being affected by the loss of visibility. The territorial definition of the air sample area would preferably include all the emission sources, located in the opposite direction from the direction of the
7

prevailing winds, which directly affect that focal point or space of interest. It is also necessary to include areas with the greatest impact, located downwind, with preference being given to populated areas or areas with a strategic natural resource that is under threat or in danger of extinction. Limits may be geopolitical or topographical and must be defined taking the line of the prevailing winds as the central axis. It is very important that air sample area limits coincide with Basic Geo-statistical Areas (AGEBs – acronym as given in Spanish) defined by the INEGI, as census information on population, epidemiology and economics is grouped together in these territorial units. In order to characterize the air sample area, we recommend that the following surveys be conducted, coinciding with the aspects set out in Figure 1: General Meteorology of the Air Sample Area. This descriptive survey
includes data and elements of judgement that allow us to learn about the phenomena of air pollutant transportation, dispersion, concentration, depositation and transformation in the air sample area. It is important to have information on annual wind patterns, rainfall, solar radiation and temperature profiles, in historic data series (of more than 25 years). If the information available on the air sample area or its main sections is insufficient, it will be necessary to perform an annual measurement campaign.
Preliminary Diagnostic of Air Quality: There are many ways of finding
out about background pollution in an air sample area before installing a network with fixed monitoring stations, but all of them require that a measurement campaign be conducted using passive, traditional or remote methods. These surveys should preferably be performed using standardized methods and instruments, and measurements should be taken during periods or days with the highest incidence of pollution and in places where there is evidence of high levels of affectation to health and the ecosystems. The main objective of these surveys must be to find out, in terms, of time and space, in which specific geographical areas or sites the population or ecosystems of interest are affected with the greatest frequency and/or intensity by air pollution. This information is vital for selecting sites for locating fixed stations to continuously measure air quality.
8

We recommend the conducting of saturation surveys (see table) or the taking of measurements that make it possible to “map” the temporary distribution of each criterion or target pollutant. The use of mobile monitoring shelters or remote sweep sensors (LIDAR) is also recommended, as they allow short term coverage of a broad expanse of territory with highly accurate measurements. The results of these surveys may then be entered into dispersion models, geographical information systems or statistical models in order to define the ideal number and distribution of monitoring stations.
Saturation Surveys
A “saturation survey” consists of a intensive campaign, in terms of thenumber of measurement stations and instruments, based on theirdistribution over a territorial grid. Grids with an area of 1 or 2 square kilometers are the most common andmeasurement instruments must be placed in each section in order todetect the presence and concentration of the pollutants of concern. Theuse of passive monitors in this type of survey is ideal for Mexico, as theyare not expensive and allow accumulated pollution to be measured overlong periods of time. The results obtained are useful for making maps withisoconcentrations that can later be used in geographic informationsystems, for superimposing other features of the air sample area andlocating air monitoring stations of a permanent network.
Results of the saturation survey for Sulfur Dioxide, conducted in Lima, Peru (Lacy, 2001).Photo of an Ogawa Ozone monitor taken from its website in Internet http://ogawausa.com.
9

Exposure and epidemiology: Public health surveys are essential and
have top priority for calculating and raising the representativeness of sites that will be chosen for locating monitoring stations. It is necessary to perform exposure surveys defining the times and spaces in which different groups of the population are exposed to ambient air pollution. There is a broad range of methodologies and procedures for performing ambient exposure surveys, but all of them generally require surveys in order to define patterns of exposure to pollutants in the different groups that make up a population of interest (e.g. by age, sex, occupation, etc.) as well as extensive measurement campaigns in order to estimate the concentrations to which the population may be exposed. The data collected is always handled using statistical models and the results are very useful not just for the design of the network but also for defining pollution prevention and control programs, especially emergency programs. It is also important to find out about morbidity and mortality levels among the exposed population, underlining the symptomatology and illnesses associated with air pollution. Air monitoring network designers must review epidemiological surveys linked to air pollution in order to broaden and strengthen their objectives and criteria for selection stations.
Emissions Inventory: Even though methodologies for compiling
emissions inventories may be very complex and time-consuming in their application (see the methodology developed by the National Ecology Institute on www.ine.gob.mx), in order to characterize an air sample area and define its boundaries, it is necessary to locate the main specific point sources and emission area sources, and make a vehicle emissions inventory, based on the most recent vehicle pattern and traffic infrastructure in the area being surveyed. This information must be charted and used in geographic information systems, where it is superimposed on other features of the air sample area of interest.
Urban Space and Demographic Dynamics. The design of an air quality
measuring network requires updated urban mapping with a precise definition of ground use and use intensity. Demographic data and trends are particularly relevant, as the representativeness of stations is calculated using, in addition to other factors, data on densities (inh/km2) and the demographic pyramid. Similarly, in cities with more than 500,000 inhabitants it is important to have information on traffic and vehicles, “origin-destination” transport surveys and vehicle counts which allow the emissions inventory to be calculated and the internal urban dynamics of the city to be understood.
10

Natural Space. For air monitoring systems that cover protected natural areas or regions of environmental interest, it is necessary to provide a cartographic description of the natural resource or resources to be protected from air pollution and the type of interaction they have with energy and material interchanges at an atmospheric level.
All of these surveys must generate maps or charts containing the most relevant information on the case and allow the superimposing of cartographic data in order to identify the degree of homogeneity in the territory, as well as its particularities and the areas most affected by pollution. It is recommended that all of this information be made available in a geographic information system in order to facilitate its usage and analysis. 2.2 Parameter Selection and Frequency of Measurement and Reporting Stations must be equipped to measure the air quality parameters specified by the official Mexican standards or institutional government programs set forth in the National Democratic Planning System, using calibrated instruments that comply with the official Mexican standards set forth by the environmental authorities. In order to assess air quality, it is necessary to define which air pollutants are relevant for their measurement, even if it is legally necessary to measure all standardized pollutants. Depending on local conditions and the type of air sample area in question, it may be necessary to assess compounds or pollutants that have not been standardized. This is the case for places with a high propensity for generating photochemical pollutants or toxic substances, such as benzene or mercury, or where visibility may be affected. As was pointed out earlier, stations of national interest must measure all criterion pollutants. For air sample areas or local stations, network operators may select parameters in accordance with the surveys, plans, programs or local standards used to design their air monitoring system. A summarized version of the information contained in the official Mexican standards on standardized pollutants is presented below, along with an overview of the relevant aspects of non-standardized pollution parameters of interest on a national and international level. At the end of this chapter, there is a table with a summary of pollutants and the sampling times required by Mexican regulations.
11

2.2.1. Air Pollutants Air pollutants may be classified in terms of their:
origin, whether they are manmade or naturally created; physical state, gas or in aerosols, which in turn can be broken down
into liquids and solids; formation, if they are released directly into the atmosphere or of
primary origin, or if they are formed from the former, of secondary origin or photochemical;
specific source of emission, mobile or fixed; or toxicity, ranging from irritants to carcinogenic to lethal.
There are obviously many pollutants that can belong to more than one category. For legislative and administrative purposes in Air Quality Management, pollutants are classified as standardized or non-standardized. Of the non-standardized pollutants, the most notable are the precursors of secondary and/or photochemical pollutants, as well as those with levels of toxicity, particularly the ones that cause cancer. 2.2.1.1 Standardized Standardized pollutants have an operational definition. The operational definitions of pollutants in Mexico can be found in the Official Mexican Standards. These standardized pollutants are also referred to as “criterion pollutants”, because there is a legal criterion for assessing ambient air quality with regard to the specified pollutant. This is the case with ozone (O3) and standard NOM-020-SSA1-1993, which was issued by the Secretariat of Health as a suitable measure for protecting public health. Similarly, there is or there should be an Ecological Standard that defines measurement methods and calibration procedures required for assessing each pollutant in an appropriate manner. The standard that corresponds to ozone, for instance, is NOM-036-ECOL-1993. These standards have been mentioned previously in section 1.3 of this document. There are criteria currently available for assessing ambient air quality with regard to ozone (O3), carbon monoxide (CO), sulfur dioxide (SO2), nitrogen dioxide (NO2), total suspended particles (PST – acronym as given in Spanish), particles smaller than 10 micrometers (PM10), and lead (Pb) contained in total suspended particles. Each of these pollutants is outlined below along with its effect on human beings and the environment. Ozone. NOM-020-SSA1-1993 reads literally as follows:
Ozone (O3) is a gas consisting of tri-atomic oxygen molecules. Its presence in the air is the result of a combination of nitrous oxides, volatile
12

hydrocarbons and ultraviolet radiation, which consequently act as precursors. It is currently considered that their effect on living tissue is characterized by the extraordinary avidity of lipoproteins, which degenerate causing: 1. Alterations in cellular membranes and 2. Superoxidation of enzymes. The most sensitive tissues to these actions are mucous membranes, especially those in the eyes and respiratory system. The risk posed depends on the level of concentration of the pollutant in the ambient air and the exposure time of the individual, as well as susceptibility, especially among children, elderly people and chronic sufferers of lung disorders. It has been demonstrated that is a determining factor in the inflammation of these mucous membranes, as well as in facilitating the infections and premature degenerative processes (aging and emphysema). … The concentration of ozone, as an air pollutant, must not exceed the maximum standard limit of 0.11 ppm, which is equivalent to 216 µg/m3, in one hour, once a year, over a period of three years, in order to protect the health of the susceptible members of the population.
Carbon Monoxide. NOM-021-SSA1-1993 reads literally as follows:
Carbon monoxide (CO) is an odorless gas produced by the incomplete combustion of carbon compounds, as a result of which it is released into the air by automobiles and industrial plants, albeit to a lesser degree; some natural processes are also capable of releasing it, such as forest fires or natural processes that take place in the sea. Special mention should be made of its accumulation in homes because of domestic activities and the habit of smoking. The main potential harmful effect lies in its affinity for combining with hemoglobin, giving rise to the increased formation of carboxyhemoglobin which, as a result, reduces the amount of oxyhemoglobin and, consequently, the amount of blood delivered to the tissues. The risk of exposure to CO ranges from the effect of small atmospheric amounts in people suffering from circulatory deficiencies (with sufferers of angina and arteriosclerosis being especially probe to its effects), to acute intoxication due to the inhalation of large amounts of the pollutant in enclosed spaces and/or in a short period of time. … Concentrations of carbon monoxide, as an air pollutant, must not exceed the permissible level of 11.00 ppm, equivalent to 12,595 µg/m3, over an
13

average period of eight hours once a year, in order to protect the health of the susceptible members of the population.
Sulfur dioxide. NOM-022-SSA1-1993 reads literally as follows:
Sulfur dioxide (SO2) is generated by both natural sources and by the combustion of sulfur-rich compounds. It is water soluble and on hydrolysis creates the acids that give it its potentially harmful characteristics. It is associated with the dampness of mucous membranes in the eyes and respiratory system; it poses a risk by causing acute or chronic irritation and inflammation; it is also usually associated with suspended particles (PST) and gives rise to greater risks, given that its action is synergic. This combination of sulfur dioxide/total suspended particles (SO2/PST), under conditions that favor its accumulation and presence in the air, has been responsible for increased morbidity and mortality among chronic sufferers of heart and respiratory disorders. … Concentrations of sulfur dioxide as an air pollutant must not exceed the standard maximum limit of 0.13 ppm, equivalent to 341 µg/m3, for 24 hours once a year, and an annual arithmetical mean of 0.03 ppm (79 µg/m3), in order to protect the health of the susceptible members of the population.
Nitrogen dioxide. NOM-023-SSA1-1993 reads literally as follows:
Nitrogen dioxide (NO2) is produced by combustion processes, which are the main source of NO2 released into the air. It is a primary pollutant and plays a double role in the environment, as it is recognized for direct potentially harmful effect but also because it is a precursor of ozone. The accumulation of nitrogen dioxide (NO2) in the human body poses a risk to the respiratory system, as it has been demonstrated that: it starts, reactivates and can alter the capacity of cells to respond in the inflammatory process, as is the case of polymorphonuclear cells, alveolar macrophagi and lymphocytes, which occur more commonly in cases of chronic bronchitis. … The concentration of nitrogen dioxide, as an air pollutant, must not exceed the standard maximum limit of 0.21 ppm, equivalent to 395 µg/m3, in one hour once a year, in order to protect the health of the susceptible members of the population.
14

Total Suspended Particles. NOM-024-SSA1-1993 reads literally as follows:
Total suspended particles consist of the air pollution caused by fine particles of solid or liquid material. They are produced by a whole range of natural or manmade processes and, as a result, the risk they pose depends on any of a number of factors, on the one hand, and, on the other, on their specific composition, but more on the capacity to absorb additional elements and even the possibility of absorbing xenobiotic elements. They are considered capable of blocking defense mechanisms in the respiratory system, both in the upper part of the system and in the bronchioles and alveoli. Given its heavy metal content, in some cases, the specific corresponding symptoms may occur (lead, cadmium). They are often associated with acidic elements with which their potentially harmful effect is synergized, and they can also carry biological elements ranging from pollen to bacteria, fungi and viruses. In addition to their concentration and the time of exposure to them, the health risk they pose lies in the characteristics described. The people most prone to their effect are, par excellence, chronic sufferers of respiratory disorders that have caused damage to their mucous system. … The concentration of total suspended particles as an air pollutant must not exceed the maximum permissible limit of 260 µg/m3, in 24 hours, in a period of one year, and an annual arithmetical mean of 75 µg/m3, in order to protect the health of the susceptible members of the population.
Particles smaller than 10 micrometers. Particles smaller than 10 micrometers (PM10) are generated in similar processes to the ones that make total suspended particles, except for the smaller ones that are of secondary origin and generated by combustion products that may contain toxic compounds. NOM-025-SSA1-1993 reads literally as follows:
Their size is the most significant physical characteristic for determining their toxicity. Particles measuring more than 10 micrometers are essentially found in the upper section of the respiratory system. Particles smaller than 10 micrometers are more common in the breathing section and reach the alveoli of the lungs. … The concentration of particles smaller than 10 micras, as air pollutants, must not exceed the permissible limit of 150 µg/m3 in 24 hours once a
15

year, and an annual arithmetical mean of 50 µg/m3, in order to protect the health of the susceptible members of the population.
Lead. NOM-026-SSA1-1993 reads literally as follows: Lead (Pb) is one of the most commonly released heavy metals throughout the surface of the planet and, as a result, the risk of exposure faced by the general public varies substantially. One of the most common uses of lead is as lead tetraethylene (a gas anti-detonator) which is how it is released into the atmosphere. Lead can enter the body through the digestive tract, posing a more common risk due to the widespread nature of its applications, or through the respiratory system, which amounts to a less common but more direct risk; 10% is absorbed by the first means, while up to 40% may be absorbed through the respiratory system. Lead can cause acute intoxication or be accumulated chronically in teeth, bones and the hematopoyetic system. It is associated with alterations in the functions of the central nervous system as well as with interference in the body’s defense mechanisms, where the endothelial reticle system is involved. … The concentration of lead, as an air pollutant, must not exceed the permissible limit of 1.5 µg/m3 as an arithmetical mean over a three-month period, in order to protect the health of the susceptible members of the population.
Furthermore, it is very likely that other elements will be added to these standardized parameters, such as particles smaller than 2.5 micrometers (PM2.5) and total acidity in the environment, in view of the epidemiological and toxicological evidence of the harm they can cause to human health. 2.2.1.2. Non-standardized pollutants Precursors of secondary pollutants and secondary pollutants . As was pointed out previously, air pollutants may be released into the air directly and these are known as primary origin pollutants, such as carbon monoxide, which is produced by incomplete combustion. Similarly, nitrogen is released directly into the atmosphere and is one of the precursors of ozone, which is the product of a combination of nitrous oxides and volatile hydrocarbons in the presence of ultraviolet radiation.
16

Nitrous oxides are released directly into the air but are transformed on coming into contact with oxygen-rich air. Vehicle exhaust fumes release nitrogen monoxide mainly. Most of this is transformed into nitrogen dioxide, which in turn may form nitrates, combine with organic pollutants and help form photochemical pollutants, such as ozone. The other precursors of ozone are volatile organic compounds. Even if volatile organic compound levels are not subject to standards, it is important to measure them in order to formulate effective strategies to control the formation of photochemical oxidants. For example, total organic compounds or non-methane hydrocarbons (sometimes referred to as HCNM) are an indicator of the total hydrocarbon load that may take part in reactions that produce photochemical oxidants and are relatively easy to measure with continuous operation analyzers. As well as the additional measurement of non-methane hydrocarbons, the US Environmental Protection Agency has set forth a list of 54 hydrocarbons that must be assessed at least for stations measuring photochemical pollutants. Such hydrocarbons include alkanes or paraffins, such as ethane, alkenes or olefins, and pentane, as well as aromatic or benzene ring compounds, such as toluene. These compounds may be analyzed through gas chromatography by flame ionization detectors. Other compounds of great importance because of their reactivity are formaldehyde and other oxygenated organic compounds. Measurement of these compounds and volatile organic compounds, divided into compounds or groups of compounds, is more elaborate and requires field sample gathering procedures and laboratory analysis. These are briefly outlined in the next section. In spite of such challenges, it is necessary to understand air reactivity in a polluted area in order to formulate suitable control strategies. The US Environmental Protection Agency has underlined the need to set up monitoring stations for photochemical assessment, with clear guidelines, in regions where the air quality standard for ozone is often exceeded. North American Research into Tropospheric Ozone (NARSTO) has identified 60 priority compounds including the ones proposed by the US Environmental Protection Agency, with standardized detection methods. It is necessary to point out that there are other secondary origin pollutants that have a major impact on health, the ecosystem and visibility. Sulfates and nitrates are examples that have a negative impact on health and form part of the dry and damp deposits (acid rain) in the soil and surface water. In addition, the size of the particles they form has an adverse effect on visibility as will be seen later on.
17

Toxic Pollutants Even though all pollutants are toxic one way or another, it has been recognized that certain pollutants pose greater risks to human health. These pollutants have not been standardized yet in our country but clear international criteria have been put forward by the World Health Organization for regulating them. This organization divides them generically into organic and inorganic. The most notable organic pollutants are benzene, toluene and aromatic polycyclic hydrocarbons. Other pollutants that have been defined or are yet to be defined as toxic pollutants include diesel particles and cigarette smoke. The US Environmental Protection Agency has identified 189 compounds as dangerous, and these include, in addition to others, volatile organic compounds and metals in particulate material. Volatile organic compounds can be subdivided into aromatic: such as benzene, toluene and xylene. The latter are sampled in stainless steel canisters and assessed by gas chromatography using a photo-ionization detector. The non-volatile aromatic compounds of interest are usually halogenates such as chloroform or perchloroethylene, which like the previous compounds are sampled with canisters and analyzed by gas chromatography, but measured with electron capture detectors. Methylterbutylether is sampled and analyzed in the same way, but a flame ionization detector is used. Aldehydes (carbonyls), such as formaldehyde and acetaldehyde, are sampled with adsorbent tubes and analyzed by high resolution liquid chromatography with an ultraviolet detector. Aromatic polycyclic hydrocarbons are also considered very important because of their toxicity. These compounds may be in a gas or particulate phase, depending on their molecular weight, their vapor pressure and atmospheric conditions. Samples are mixed with stiff polyurethane foam and quartz filters, and they are analyzed by high resolution liquid chromatography with a fluorescence detector. There are also semi-volatile and/or persistent compounds, such as pesticides, biphenyl polychlorates and dioxins which are also sampled and analyzed chromatographically. Toxic compounds are usually analyzed using chromatographic methods, either by gas or liquid, and collection and detection methods range from detection by flame ionization to mass spectrometry. The use of mass spectrometry allows the quantification and identification of each compound using ionized fragments with very well-defined mass-load ratios that are associated with the original molecule.
18

The detection and quantification of volatile organic compounds, in many cases, is the same for photochemical precursors and toxic organic compounds. As has already been mentioned, the other toxic compounds are inorganic, the most notable being metals. Arsenic and cadmium contained in particulate material are sampled in fiber glass filters and analyzed by atomic absorption. For hexavalent chrome, cellulose filters and ion chromatography are used. Other metals such as lead and mercury are sampled in cellulose filters and analyzed with X-ray fluorescence. It should be pointed out that a broad diversity of methods is emerging for analyzing toxic pollutants, and these, in some cases, overlap with quantification and analysis. Some of these new methods are outlined in the next section on remote sensors. Pollutants that affect visibility It should be pointed out that the loss of visibility that is caused by high levels of pollution is what the public perceives on a day to day basis as “pollution”. This loss of visibility is due to the absorption and dispersion of light by pollutants. Of all the gaseous pollutants, nitrogen dioxide is the only one that contributes to visibility loss; its color is a mixture of orange and brown. Particles suspended in the air are responsible for most light dispersion and absorption in the atmosphere. Particles between 0.1 and 1 micrometer are the ones that disperse light most effectively. It is because of this that fine particles are highly relevant in preventing visibility deterioration. The elementary carbon contained in suspended particles is the only thing that absorbs light. In urban environments, sulfates, nitrates and elementary carbon are more closely associated with reductions in visibility. As has been said previously, humidity may also play a major role in this phenomenon and, in extreme cases, under conditions of humidity saturation, there is fog. Humidity also favors the formation of hydroscopic particles. 2.2.2 Air quality measurement technologies In recent times, air pollutant measurement technologies have developed rapidly. In fact, the current trend is to have continuous real time monitoring for all air pollutants. However, not all the new technologies have been standardized. For most standardized pollutants there are reference and equivalent measurement technologies, in other words technologies that comply with the measurement criteria of the reference methods. This section refers strictly to standardized
19

pollutant analyzers, given that a brief outline of the assessment and quantification of non-standardized pollutants has already been provided. 2.2.2.1 Gas analyzers A description of reference measurement methods and the equivalent method for measuring gases is given below, starting with carbon monoxide, for which NOM-034-ECOL-1993 reads literally as follows:
The reference method for determining the concentration of carbon monoxide in the ambient air is infrared absorption through a non-dispersive photometer… The reference method is based on the ability of carbon monoxide to absorb energy of certain wavelengths, which consists of measuring the infrared radiation absorbed by the carbon monoxide using a non-dispersive photometer…In this method, a beam of infrared energy is passed through a cell containing the air sample to be analyzed, and the infrared energy absorbed is measured by the amount of carbon monoxide present in that air sample using the photometer. … The equivalent method for determining the concentration of carbon monoxide present in the ambient air, is gas filter correlation photometry… This method is based on the same measurement principle as the reference method, which is based on the capacity of carbon monoxide to absorb infrared energy. In this method the gas being measured or another pattern gas is used as a filter.
For measuring ozone, NOM-036-ECOL-1993 reads literally as follows:
The reference method for determining the concentration of ozone in the ambient air is chemiluminiscence…The reference method is based on the capacity of ozone to emit light when it reacts with ethylene…In this method, air and ethylene are passed simultaneously into the mixing chamber of the analyzer. Here, the ozone present in the air reacts with the ethylene and emits light, which is detected using a photo-multiplier tube. The resulting photo-current is amplified and may be read directly or shown on a gage, in accordance with the kinetics of the (corresponding) reaction. … The equivalent method for determining the concentration of ozone in the ambient air, is photometry in the region of ultraviolet radiation… This method is based on the photometric principle of light absorption in the ultraviolet radiation range by ozone.
For measuring nitrogen dioxide, NOM-037-ECOL-1993 reads literally as follows:
The reference method for determining the concentration of nitrogen dioxide in the ambient air is gaseous phase chemiluminiscence…The
20

reference method allows the concentration of nitrogen dioxide (NO2) in the ambient air to be measured indirectly, by photometric determination of light intensity at wavelengths greater than 600 nanometers (nm), resulting from the chemiluminiscent reaction of nitrous oxide (NO) and the ozone (O3) generated in the same instrument. In this method, NO2 is quantitatively reduced to NO by a converter. The NO normally present in the air along with the NO2 pass through the converter unchanged, causing a resulting total concentration of nitrous oxides (NOx) equal to NO + NO2. A sample of incoming air that has not passed through the converter is also measured. This latter measurement of NO is subtracted from the first measurement (NO + NO2) to give the final measurement of NO2. Measurements of NO may be made jointly, using a dual system or cyclically, with the same system, when the duration of the cycle is no more than one minute…Chemiluminiscence analyzers for NO/NO2/NOx are also sensitive to other nitrogenated compounds, such as peroxyacetyl nitrate (PAN), which may be reduced to NO in the thermal converter. Atmospheric concentrations of these potential interferences tend to be low, compared with NO2, as a result of which it is not possible to obtain valid measurements of NO2.
For measuring sulfur dioxide, NOM-038-ECOL-1993 reads literally as follows:
The reference method for determining the concentration of sulfur dioxide in the ambient air, is the pararrosaniline method…The reference method makes it possible to determine the concentration of sulfur dioxide in the ambient air, using the damp pararrosaniline method…In this method, the sample is passed through a potassium tetrachloromercurate solution (TCM)…The sulfur dioxide reacts with the TCM solution to form a stable monochlorosulfonatemercurate complex. Once formed, this complex will resist air oxidation and is stable in the presence of powerful oxidizing agents such as ozone (O3) and nitrous oxides (NOx). Afterwards, the complex will react with pararrosaniline and formaldehyde, to form pararrosaniline methylsulfonic acid, which has an intense coloring. The optic density of this compound is determined by spectrophotometry…and is directly related to the amount of sulfur dioxide (SO2) collected. … The equivalent method for determining the concentration of sulfur dioxide in the ambient air is fluorescence…This method is based on the measurement of fluorescent light given off by certain molecules when they are excited by a suitable source of radiation.
It should be pointed out that most methods for measuring gases are based on the detection of light of a specific frequency, whether it is absorbed or emitted during the measurement process and captured by a photometer. With the exception of the reference method for sulfur dioxide, all of these methods allow
21

real time measurement of the pollutant and, as a result, of the capacity to transmit this information also in real time. 2.2.2.2 Particle analyzers Currently there is only an official Mexican standard setting forth the measurement method for determining the concentration of total suspended particles (PST) in the ambient air. The standard NOM-035-ECOL-1993 reads literally as follows:
The reference method for determining the concentration of total suspended particles in the ambient air is the high volume sampling method…The reference method makes it possible to measure the concentration of total suspended particles in the ambient air, using a suitably placed sampler, which sucks in a given amount of ambient air through a filter to the inside of a shelter or protective covering for a sampling period of 24 hours. The speed of the ambient air flow and the geometry of the sampler are such that the collection of particles with an aerodynamic diameter of up to 50 micrometers is favored, depending on the speed and direction of the wind. The filters used must also have a minimum collection efficiency level of 99 % for 0.3 micrometer particles…The filter is weighed in a laboratory under controlled humidity and temperature conditions, before and after use, in order to determine its net gain in weight (mass). The total volume of sampled air, corrected to reference conditions, is determined from the ambient air flow measured and the sampling time. The concentration of total suspended particles in the ambient air is calculated by dividing the mass of collected particles by the volume of sampled air, and is given in micrograms per cubic meter standard, corrected to the reference conditions…In any samples taken at temperatures and barometric pressures that differ substantially for the reference conditions, the corrected concentrations may vary from the real concentrations in micrograms per cubic metro, especially at high altitudes. Real concentrations of particles may be calculated from the corrected concentrations, using whichever temperatures and pressures were present during the sampling period.
As was mentioned previously, there is no Ecological Standard regarding particles smaller than 10 micrometers (PM10). These can be sampled and analyzed using processes similar to the ones used for total suspended particles, except that bigger fractions must be separated by a virtual impacter or cyclonic separator, prior to collection in a filter. The same concept may be applied to particles smaller than 2.5 micrometers (PM2.5). In addition to traditional gravimetric methods, the US Environmental Protection Agency recognizes semi-continuous or continuous methods equivalent to the reference method. The semi-continuous method uses beta radiation attenuation
22

from the particles collected in a filter. The continuous method works by collecting particles in a filter in constant vibration. By increasing the mass of the filter, the frequency of oscillation falls and may be associated with the change in filter mass. These samplers have an inlet for particles of a given size which removes particles with aerodynamic diameters of more than 10 micras. These samplers offer the benefit of being able to transmit information in real time or close to real time. It is worth pointing out that the use of traditional gravimetric samplers is, in many cases, necessary in order to assess toxic pollutants in the particulate phase, such as lead. Similarly, other major pollutants in the particulate phase, such as sulfates and nitrates, may be analyzed using these filters. 2.2.2.3 Remote sensors Remote sensors, even though they have not been universally accepted as equivalent methods for measuring standardized pollutants, are now being used by the US Environmental Protection Agency and provide a quick diagnostic of air quality. They are used in two main types of applications: for assessing emission rates from vehicles and/or industrial sources, and for assessing air quality in urban areas. These instruments may be used during the preliminary assessment period of the air monitoring system, and can define, with a greater degree of certainty and ease, where it would be suitable to locate upwind stations, where the highest levels of emissions are and where the site that receives the highest concentration of secondary origin pollutants is located. One advantage offered by these remote sensors is that they can measure a broad range of compounds. LIDAR, which is one of the sensors currently in use, is based on detection and positioning by luminosity at the beginning of the radar, FTIR, or open route Fourier transformed infrared spectrometers, and the DOAS, based on differential optic absorption spectroscopy. The FTIR method is one of the methods considered for determining toxic/volatile organic compounds used by the US Environmental Protection Agency. The DOAS can detect hydrocarbons, including its halogenated, nitrated and sulfated compounds, and oxigenates and benzoate compounds. These compounds are important because of their toxicity. The DOAS is also capable of detecting important photochemical inorganic compounds such as ozone, nitrous oxides and nitrous and nitric acids. It can also detect precursors of secondary particles such as ammonium and sulfur dioxide. These remote sensors are identified by NARSTO for such purposes.
23

The LIDAR may be used to detect and quantify aerosols. One clear benefit of these sensors is their ability to measure pollutant distributions at horizontal and vertical distances of several kilometers, including the detection of specific or line point sources or episodic emissions. All of these remote sensors still involve high acquisition and operation costs, and require highly skilled staff to use them and interpret the data they obtain. 2.2.2.4 Passive samplers In contrast with remote sensors, are the passive air pollutant samplers, which are relatively cheaper. The principle of these samplers is the diffusion of gases and their reactivity. The pollutant spreads out inside the passive sampler, where there is a surface with a layer of material that is reactive or absorbent or adsorbent of the pollutant. The pollutant may be quantified in the laboratory after it has reacted or been absorbed. The amount of substance measured will be proportional to the concentration of pollutant observed. For example, in passive samplers of nitrogen dioxide, the sampler is exposed to the pollutant which spreads out inside the passive monitor, where it is absorbed on the surface of a layer impregnated with triethanolamine. The measurement is taken on extracting the nitrogen dioxide with distilled water and making it react with a coloring, using a colorimetric method for quantification. The passive sampler may be carried by a person or be placed in a special sampling site. Calibration is usually performed by sampling in the same place where a continuous monitoring station is located in order to validate the concentration estimated by the passive monitor. Once calibration has been performed, the passive monitors may be placed in relatively large areas in order to observe the extension of the effect of the pollutant or to assess places where it is believed there is a high concentration, in accordance with local conditions, as well as the transportation and transformation of the pollutants. Extensive studies of this nature have been conducted in the United States, Canada, Europe, and South and Central America. It is currently possible to passively assess nitrous oxides, sulfur dioxide and ozone, as well as benzene, toluene and xylene. It should be pointed out that the use of passive monitors has enabled us to understand the space distribution of pollutants, given the possibility of placing a large amount of them in relatively extensive areas. It is also important to point out, given their portability, that they may be used to assess personal exposure of carriers and make inferences for the rest of the population. These monitors do
24

not have the resolution of a reference method, but they may be used in the aforementioned applications, such as the design of air monitoring systems, or as air quality monitoring stations. In this regard, it is possible to detect any places that have a maximum concentration, which are not covered by the air monitoring system and are in need of measures of control and/or vigilance. 2.2.3 Atmospheric, Climatic and Meteorological Phenomena linked to air
pollution The observed concentration of non-degrading primary pollutants will depend on two main component: pollutant emission rates and the volume of air available for mixing it. The emission rate will depend on the number and importance of each source and the technology used by the emitter or the degree of control exercised on the emitting source. The volume available for mixing will depend on climatic and meteorological conditions and the geographic situation of the place. The climatology of the place will help us describe the changes that take place during the year, namely seasonal changes, as well as tell us when to expect rainfall phenomena and when to expect the highest or lowest temperatures. Meteorology will allow us to predict and assess atmospheric conditions for given periods with horizontal and vertical atmospheric stability. On a synoptic or regional level, it is convenient to have access to information from the National Meteorological Service, run by the National Water Commission. The use of high pressure systems provide stability for the region they are located in, while a low pressure system will help the dispersion of pollutants via surface and vertical turbulence. This information is obtained from meteorological satellites and meteorological stations distributed over a very extensive region measuring temperatures, wind, humidity and barometric pressure. On a local level, airports tend to have dedicated meteorological stations and may also have morning probes in the atmosphere. These probes assess the profile of temperatures and winds in accordance with height. Temperature profiles make it possible to assess the presence of thermal inversion in the surface or at heights, along with its thickness and intensity. It is called thermal inversion because during the day temperature falls as height increases. This is why in our country there are volcanoes with permanent snow, and the coasts are hotter than the high plains. When the normal profile (adiabatic) of the temperature is inverted, this will not allow the vertical mixing of air pockets and encourages the accumulation of pollutants close to the surface, effectively reducing the volume available for mixing them. Wind speed and direction (surface) allow us to assess the potential for pollutant transportation in order to find out where the possible receptors of such pollutants
25

are located. Strong winds allow effective dispersion of pollutants, while weaker winds provide for a certain degree of pollutant dilution but help move pollutants over a medium and long distance. The geographical situation of the place will, to a large extent, define surface meteorological conditions. The location, in terms of longitude, latitude and altitude, along with the morphology, mountains, plains or bodies of water (translator’s note – this sentence is as given in Spanish, i.e. there is no verb). For example, if it is a valley, winds will spill over towards the middle of the valley by night, while the day will witness a reversed trend. Similarly, a place in the coastal area will experience winds from the sea during the day and a reversed trend at night. By virtue of the foregoing, it is important that an upwind station be considered during the designing of air monitoring systems, before the area with the highest emissions. It is also important to have a monitoring station at the place where the highest concentration of secondary pollutants is expected, specifically ozone. These objectives may be achieved by analyzing prevalent wind patterns during the design stage. Temperature is another highly relevant parameter that interacts in a number of ways with air quality. It encourages the formation of photochemical pollutants, and is an indicator of atmospheric stability and solar radiation. Temperature is a crucial element in photochemical pollutant formation kinetics which generally increases with temperature. It is also an indirect indicator of atmospheric stability. Lower temperatures are observed at night, which is the period of greatest vertical stability. To the extent that temperature or solar radiation increases during the day, there will also be an increase in the convective (vertical) transportation of pollutants, surface temperature will be higher than temperatures at greater heights and will cause air movement in that direction. The greater the solar radiation, the greater the temperature. The temperature falls when there is rain or cloudiness. Humidity leads to the formation of aerosols in the presence of hydroscopic compounds. It also interacts in the formation kinetics of secondary pollutants such as sulfates and nitrates. It is a parameter that can influence atmospheric stability and affect visibility. In extreme cases, in the event of conditions of air humidity saturation, this will give rise to mist. Solar radiation plays a direct role in the formation of photochemical pollutants. The amount of light reaching the surface contains a variety of wavelengths that excite or break up the molecules of photochemical compound precursors and give rise to reactions to form other compounds. These reactions will be proportional to the radiation available. This is why less ozone is formed during cloudy or rainy spells.
26

2.2.3.1 Meteorological Equipment The instruments required for measuring the most useful meteorological variables for studying air pollution tend to be the ones that measure wind speed and direction, ambient temperature, vertical temperature differences, solar radiation and the mixture height, NIWA (1995). There are currently a number of different types of equipment for measuring these atmospheric parameters. The choice of suitable sensors depends on the way the data obtained will be used. In addition to sensors, it may be necessary to have other equipment to condition the signal and the recording and, maybe, for electronic data recording. In order to ensure that representative data are collected, it is necessary to follow rigorous procedures for the identification, installation and maintenance of instruments. Korc, M. (2001). Wind Speed The two main type of instruments used to measure wind speed are the rotational wind gage and the helix wind gage. Both types of wind gage consist of two subsets: the sensor and the transducer. The sensor is the device that is made to rotate by the force of the wind. The transducer generates the signal to be recorded. A full package of instruments may also include an electronic system for receiving and recording electronic signals generated by the transducer. For example, the signal will probably need to be conditioned so that it produces a reportable amount. To this end, it is necessary to use a signal conditioner, which must be registered and/or recorded using recording equipment. NIWA (1995) The representative meteorological data obtained in air pollution surveys are of paramount importance for locating instruments in a suitable manner. Korc, M. (2001)
• The standard height for instrument exposure to wind in an open area is 10 m above the ground.
• An open area is defined as one in which the distance between the instrument and any source of obstruction (trees, buildings, etc.) is at least 10 times the height of said source of obstruction.
27

If emissions are released at a height of 10 m, it will probably be necessary to take additional wind readings at higher elevations. It is necessary to set suitable heights for taking readings on the basis of each case and in accordance with the application. If possible, it is recommended that the wind reading instruments be placed on a rack tower. They should also be placed at the top of this tower or, if they are located on a side of the tower, on a rod at a distance equivalent to at least twice the diameter/diagonal size of the tower, extending outwards in the direction of the prevailing wind. Korc, M. (2001) Temperature and temperature difference For the purposes of studying air pollution, it is useful to take readings of ambient air temperature at a single height (usually 1.5 to 2 m above ground level) as well as the temperature difference between two levels (usually 2 m and 10 m). These readings may be helpful for plume elevation calculations and for determining atmospheric stability. The three main types of temperature sensors are based on: (1) thermal expansion, (2) changes in resistance, and (3) the thermoelectric properties of different substances as a function of temperature. Mercury and alcohol thermometers are common examples of thermal expansion sensors. However, their value is limited in on site or remote monitoring networks given that they do not have automated data registration capabilities. One common type of sensor in on site meteorological measurement programs is the resistance temperature detector (DTR – acronym as given in Spanish). The DTR operates on the basis of resistance changes in certain metals, mainly platinum or copper, as a function of temperature. These two metals are the most commonly used because their resistance reveals a rigorous linear increase as temperature increases. NIWA (1995) Another type of resistance change thermometer is the thermistor, which is made from a mix of metal oxides fused together. The thermistor is usually subject to a change in resistance at temperatures higher than the DTR. Given that the relationship between resistance and temperature for a thermistor is not linear, these systems are usually designed to use a combination of two or more thermistors and fixed resistors that make it possible to obtain an almost linear response over a specific temperature range. Thermoelectric sensor operation is based on the flow of electric current between two different metals and depends on temperature. The installation of these
28

sensors, called thermopars, is subject to special requirements in order to avoid induction current from sources close to the alternating current that could lead to reading errors. Thermopars are also prone to voltage caused by humidity. As a result, their use is restricted in routine field measurements.
• Ambient air temperatures (surface) must be measured at a height of 2 m.
• The standard heights for measuring temperature difference are 2 and 10 m.
If emissions levels are considerable, it may be a good idea to take additional temperature readings at higher elevations. These elevations would be determined in accordance with the case and the application.
• The temperature sensor must be located in an open, flat and well-ventilated area with a diameter of at least 9 m.
• Temperature sensors must be placed at a distance equivalent to at least four times the height of any source of obstruction and at least 30 m from any extensive paved areas.
• The surface on which the sensor is placed must be covered by a natural layer of earth and far from any areas with stagnant water. Instruments must be shielded, in order to protect them from thermal radiation, and well ventilated with suitable systems.
Solar Radiation Solar radiation is related with atmospheric stability. Data on cloud coverage and height (the height from the base of the peak of the cloud that darkens almost half the sky) provide an indirect estimate of the effect of solar radiation and are used together with wind speed data to set forth an atmospheric stability category. The most commonly used instrument for measuring solar radiation is the pyranometer, which measures direct radiation spread out over the horizontal surface. It consists of a small flat disk with sections painted alternatively in black and white. When the apparatus is exposed to solar radiation, the black sections become hotter than the white ones. This temperature difference may be detected electronically. An electric voltage proportional to the inciding solar radiation is produced. A standard optic glass dome is installed on the disk which is transparent at wavelengths that range between approximately 280 and 2,800 nm.
29

Some pyranometers use a silicon glass dome to measure radiation in different spectrum intervals. Korc, (2001) Another type of sensor is the net radiometer, designed to measure the difference between upward radiation (solar) and downward radiation (land), through a horizontal surface. The basic purpose of a net radiometer is to determine day-time and night-time radiation as a stability indicator. However, the night-time stability categories generally used in air pollution surveys are based exclusively on wind speed and the appearance of the sky. NIWA (1995),
• Pyranometers used to measure incident radiation (solar) must be placed in open areas with a broad view of the sky in all directions and in all seasons. They must be placed at points where there are no obstructions that cast shadows over the sensor at any time. Furthermore, they should not be placed close to brightly colored walls or artificial sources of radiation. The height of the sensor is not a decisive factor for pyranometers. An elevated platform is a recommended location.
• Net radiometers must be placed approximately 1 m above ground level. The subsoil below the instrument must be representative of the general area. Net radiometers must also be placed where there are no upward or downward obstructions in the field of vision.
Mixing Height The vertical depth of the atmosphere where mixing takes place is called the mixing layer. The lower part of this layer is called the mixing height. The latter determines the vertical scope of the dispersion of pollutants released beneath it. It is also an important variable for air quality monitoring, as it limits the vertical dispersion of pollutants. Although mixing heights are not normally measured directly, it is possible to obtain approximate calculations on the basis of routine meteorological readings. As a general rule, mixing heights that take place in the morning and in the afternoon are estimated using vertical temperature profiles taken at sunrise and sunset, and surface temperature profiles. NIWA (1995), Korc, (2001) Vertical temperature profiles are measured using radio probes, which are transported instruments raised using balloons lighter than air (in other words, balloons usually filled with hydrogen or helium). For air quality models, mixing heights on a per hour basis may be estimated using mixing height values taken twice a day – on sunrise and sunset – and the hourly atmospheric stability. SODAR (Sound Detection And Ranging) systems and Doppler wind profile radar play an important role as efficient tools for taking remote readings of
30

meteorological variables at heights of up to several hundred meters above ground level. NIWA (1995), Korc, (2001) A SODAR transmits a strong acoustic pulse to the atmosphere and captures part of the pulse which expands and returns. Wind profile radar is based on SODAR semipar operation, but transmits electromagnetic pulses instead of acoustic ones. There has been a growing interest in the use of SODAR and wind profile radar for generating meteorological databases required for supporting dispersion models. Analysis of SODAR returns and wind profile radar may also help estimate mixing heights. Table 1 below gives accuracy values and resolutions for meteorological equipment:
Table 1 Accuracy Values and Resolutions
Meteorological Variable Accuracy of the variable Measurement Resolution
Wind Speed ± (0.2 m/s + 5 % of observed value) 0.1 m/s
Wind Direction ± 5 degrees 1 degree
Temperature ± 0.5 °C 0.1 °C
Temperature difference ± 0.1 °C 0.02 °C
Solar Radiation ± 5 % of observed value or W/m2 10 W/m2
Source: US EPA (1987)
2.2.4 Standardized Parameters and Measurement Times The standardized parameters that are usually measured in monitoring stations and the reference times used for comparison against air quality standards are given in Table 2. In the case of automatic gas analyzers in which concentrations are generated in real time, hourly averages of the total number of readings stored in an hour (usually one reading per minute) are used. For O3 and NO2, this comparison can be made directly given that the criteria for these two pollutants are based on hourly averages, while for CO and SO2 these reference times are 8 and 24 hours, respectively. Comparison may be performed
31

on the basis of mobile averages obtained using the last hourly average with the ones corresponding to the previous 7 or 23 hours in each case. In stations of national interest and urban stations located in residential areas, the frequency of readings may not be linked to diagnostic or research objectives, but must instead be linked strictly to officials Mexican standards. In stations of national interest, instruments for measuring standardized pollutants must be automatic in order to allow continuous measurement and hourly reporting which includes hourly averages for ozone and nitrogen dioxide and mobile hourly averages of 8 hours for carbon monoxide and 24 hours for particles (PM10 and PM2.5) and sulfur dioxide. This indication excludes the “total suspended particles” standardized parameter, for which the need to take readings must be assessed jointly by the federal and local environmental and health authorities, but which is going to stop being used as an air quality indicator.
Table 2 Summary of standardized sample take-up time, frequency of measurement and form of reporting
Pollutant
Summary of standardized sample take-
up time
Frequency of Measuremen
ts
Frequency of Reports
for continuous measureme
nts Total Suspended Particles1 24 hours Once every 3
or 6 days* Weekly average
Particles smaller than 10 micrometers
24 hours Once every 3 or 6 days*
and Continuous
Particles smaller than 2.5 micrometers
24 hours Continuous
Sulfur Dioxide 24 hours Continuous
Mobile 24 hour average
each hour
Carbon Monoxide 8 hours Continuous Mobile 8 hour average each
hour
Nitrogen Dioxide 1 hour Continuous
Ozone 1 hour Continuous
Hourly average
Hourly average
1 The Mexican standard indicates an manual measurement method * The frequency of readings goes from 6 to 3 days during periods with higher levels of pollution (e.g. low water)
It should be pointed out that, for continuous measurements of pollutants, hourly concentrations must be kept in an accessible database, independently of the public air quality report, with data averaged for 1, 8 and 24 hours.
32

The frequency of non-standardized parameter readings must be fixed in accordance with a research protocol or survey approved by the local and/or federal authorities, as the case may be. The reporting of these parameters to the public is not mandatory, but it is recommended that a final or annual report be published on them, if measurements are reliable and data is interpreted or presented in a scientifically sound manner. 2.3 Administrative and Functional Criteria in the Selection of Measurement Instruments Many air quality monitoring stations in Mexico currently operate using instruments of different makes and different technological “generations”. Even though gas analyzers are available with analog accessories, manually operated high volume particle samplers whose operation is governed by the reference method and gas analyzers with limited electronic components, and no internal memory or auto-diagnostic routines, or that are unable to receive remote instructions from the Computer Center. (translator’s note – this sentence is as given in Spanish, i.e. there is no verb) Much of this equipment was donated in support and technical interchange programs, while other items of equipment were acquired under different governments and public bidding processes in which different parts of the bid were won by different companies as a result of their low costs. All of these circumstances, far from lowering costs and providing “administrative efficiency”, have reduced the operational capacity of networks and increase the costs of maintenance and staff training. The likelihood of failure due to maintenance and the costs of operation, maintenance and training of staff to operate a measurement network may be reduced if the following conditions are met:
Brand name instrument homogeneity. It is necessary to make sure that gas analyzers and particle samplers, as well as meteorological instruments, are of the same commercial brand. If this is not possible, then they must operate using common or compatible components and peripheries, although compatibility tends to be an electronic fallacy, as a result of which compatibility must extend to 100% of the functions and be tested on site by the manufacturer, before any new equipment acquisitions are made. Advanced electronic automation. Most instruments manufactured and distributed internationally have increasingly complex electronic components and functions. In order to reduce the obsolescence of the
33

instruments to be acquired, it is broadly recommended that the “latest model”, the latest version or the most complete version be acquired. Remote control. The measurement and calibration instruments that need to be installed in a shelter will be subject to random, periodic and recurrent failure. Many failures may be corrected from the Control Center without the need to send maintenance staff and equipment to the site. It is recommended that each instrument installed have the appropriate devices for “communicating” with the Control Center and to be “questioned” and “instructed” in order to perform auto-diagnosis, self calibration and auto-correction electronically. There are a number of communication and administration computer programs for monitoring networks; these programs can administer the instruments, telematic networks, databases and reports to the public. Licenses, warranties and spare parts for three years. Any software acquired for internal usage and for the joint use of the measurement networks and the Computer Centers they are administered by must be accompanied by commercial licenses pursuant to the legislation in force at the time. Measurement instruments, both individually and jointly, must have a manufacturer warranty and a stock of spare parts and consumable items for a minimum period of uninterrupted operation of three years.
34

2.4 Selection of Measurement Sites The selection of sites and the number of measurement stations will initially depend on the nature and objectives of the air monitoring system. Systems oriented towards the monitoring of air quality in urban environments require a different number of stations and parameters from those used for the measurement of ambient air quality in protected natural areas or non-urbanized rural areas. For many years the World Health Organization (WHO, 1977) recommended the use of simple criteria for the location of stations in urban areas, for example, if the budget is sufficient only for the installation of three stations, these would have to be located in an industrial area, a commercial area and a residential area; if the topography is uneven, then one should be located in a valley and another on the mountain; if the city has an historical, administrative or business center, a station should be located there, etc. Nevertheless, when the cities or ecosystems of interest are very large and require a greater number of monitoring stations to cover the air sample area, it is necessary to offer an approximation based on statistical methods and spatial and temporal considerations. Statistical considerations for the design of a network. In order to guide the general design of a network, it has been suggested that the following criteria be borne in mind and applied in the measurement of a specific pollutant, the concentrations of which vary in space and time within the air sample area. (Munn, 1981): The value to be taken should be the average value for concentration of the
pollutant in the diverse time periods indicated by the official standards (see Table 2).
The possibility of not detecting violation of an air quality standard should be estimated in terms of probability and a value should be fixed that is accepted by health authorities and should not be exceeded by operators of the network.
When the concentration of a pollutant is estimated for a point in the air sample area where no measurement was taken, based on measurements from two or more stations forming the network, the value obtained via
35

regression or interpolation should not have a quadratic error also predetermined by local or health authorities.
The location of stations should be optimized in the light of the statistical parameters indicated above, eliminating location or design options that fall outside these predetermined parameters. This criterion should also be followed when stations are added to, or removed from, an existing network. (Zimmerman, 2002)
The density of stations forming a network should be sufficient to detect a change x in percentage terms of the concentration of a pollutant over a number of years, and with a 95% level of reliability. Both x and y in this recommendation should be fixed by plans and programs for air quality improvement and included in the quality objectives for data and measurements.
Put together a team for interdisciplinary tasks formed by Meteorologists, Environmental Statisticians, Environmental Engineers, Urban Planning specialists, Epidemiologists, Environmental Chemists, and they must all have knowledge and training in Air Pollution. (Munn, 1981)
Based on the studies mentioned at the beginning of this chapter, it is possible to undertake more complex and far reaching statistical analyses by minimizing the number of sites (Nychka, 1997) or designing multi-objective stations, and for these purposes there are a number of advanced spatial analysis models. (Sampson, 2001). Among the auxiliary computer models for the selection of monitoring sites, those of Geographic Information Systems (GIS) stand out. These have sub-routines that can assist in devising models for the location of air monitoring stations. In general terms, stations should be located at sites where the greatest concentrations of pollutants are expected, and where they are expected to have the greatest impact on public health and ecosystems, taking into account the statistical criteria previously mentioned.
36

2.4.1 Characteristics of Air Monitoring Networks in Urban Areas The main objective of this type of system is to measure the quality of air breathed by the population, and for this reason the receptor stations should be located above all where people are exposed to air pollutants for the longest periods. The preliminary description of an air sample area and its users should provide sufficient information to detect the geographical areas where this occurs. Exposure studies carried out by authorities and public health research centers are indispensable. Stations oriented towards measuring the impact of a specific source should be principally positioned downwind and following the line drawn by the direction of prevailing winds. If the source is specific and sufficiently important, as in the case of a thermoelectric plant, a refinery or a cement works, access to dispersion models that indicate the distance at which the plume of pollutants reaches ground level is indispensable. If the source is linear or from an area, such as a highway or industrial zone, it is necessary to have at least some preliminary measurements that define the distances and areas of major impact. Nevertheless, for air monitoring systems designed for the urban scale of a city, the measurement of micro climates highly affected by specific sources should be avoided as these will not be representative of the ambient air quality the majority of the population breathes. These spaces should be dealt with using specific monitoring programs for the control of pollutant sources. However, micro climates where the air quality is heavily impacted by unusual meteorological conditions should be included as these may be deep or mountain valleys with extremely stable atmospheres or wind deflector zones that tend to accumulate pollutants. The number of sampling or station sites that an urban air quality measurement system should include depends on the following critical factors:
Population density Territorial and urban homogeneity Direction of dominant winds Intensity of vehicular traffic Density of fixed sources of pollution Density of natural and green areas
37

In densely populated urban areas found in flatlands with a high level of homogeneity in the type of construction, it is possible to locate a medium urban scale air monitoring station, representative of an air sample area with a surrounding radius of 4 to 50 kilometers. If the topography is irregular and the urban space is characterized by a high level of heterogeneity, it will be necessary to locate more than one station and these will be of medium and micro scale, with a representativiteness of no more than the surrounding 4 kilometers (EPA, 1998). To illustrate the above we can employ two examples of the characteristics of the Valley of Mexico. The first is the municipality of Netzahualcóyotl, in the east of the valley, which has the highest population density in the Mexico City Metropolitan Area (189 inhabitants per hectare) (COLMEX, 2001) and occupies to a great extent what was formerly the bed of Lake Texcoco, an alluvial plain with little vegetation and which today is covered by civil constructions that in general are no more than 10 meters in height. There are two automatic monitoring stations in this municipality, one for PM10 and the other for PM2.5, that take highly representative readings at a medium municipal scale. In contrast, the west of the valley is characterized by lower population densities (86 inhab/hect) (COLMEX, 2001), but is home to intense urban activity and irregular topography, and the population is distributed in ridges and small mountain valleys with irregular wind flows and large natural and green areas mixed with urban design. In this area various stations have been located (Lomas, Plateros, Cuajimalpa, Tlalpan, etc.) on a medium municipal scale and a micro scale to measure particles and gases and achieve an acceptable level of representativeness. Natural and green areas, such as bodies of water (reservoirs, lakes, the sea or rivers) or areas lacking vegetation (plains, crop fields, soccer fields, etc.), can absorb or contribute pollutants. Equally, urban areas can be isolated where it is necessary to locate special measurement stations.
38

Stations may be fixed or mobile, depending on whether there exists a possibility of locating stations that operate at fixed sites with mobile sampling instruments. This is possible when particles are measured or when passive monitors are used. Stations or mobile shelters are generally vans or mobile shelters that comply with the same design characteristics as fixed stations and are placed where there are adequate and
previously arranged conditions concerning space, security and electricity. As was mentioned previously, these mobile shelters have great potential for use during the design stage of air monitoring systems. In general it can be stated that there is NO predetermined number of measurement stations to be installed in an air sample area, for pollutants or for the population. The number of sampling sites of an air monitoring system will depend on the description of the air sample area and the budget available to the operator. Nevertheless, the Pan-American Health Organization (OPS – acronym as given in Spanish) suggests the following numerical distribution for the size of population and type of pollutant.
Table 3 Number of air quality measuring
stations in urban areas proposed by the OPS 1
Urban population
millions of inhabitants
Particles
Sulfur Dioxide
Nitrous Oxides
OxidantsCarbon
Monoxide Meteorolo
gical Station
<1 2 2 1 1 1 1
1 to 4 5 5 2 2 2 2
4 to 8 8 8 4 3 4 2
> 8 10 10 5 4 5 3 1. Taken from the book “Introdución al Monitoreo Atmosférico”, by A.P. Martínez e Isabelle Romieu, jointly published by OPS, GTZ and DDF, 1997, making reference to the book “Diseño de Programas de Vigilancia del Aire para Zonas Urbanas e Industriales” by the OPS, published in 1978.
39

2.4.2 Characteristics of Air Monitoring Networks in Rural Areas The number of air monitoring stations that are focused on protected natural areas or non-urbanized areas where a resource or productive activity of national or local interest exists depends on the following critical factors:
Size of the natural or designated ecosystem to be monitored Density of the resource of interest Dominant meteorology in the ecosystem to be monitored Conditions at the edge of the air sample area
In order to determine the number of stations and their location, it is recommended that an approximation be made using a grid superimposed on the ecosystem or territory of interest. The squares can be formed with equidistant lines, each measuring 1, 5 or 10 kilometers, depending on the desired scale of representativeness and according to the critical factors listed.
Figure 2 Grid for selecting air monitoring sites in rural systems
Possible stations
Landscape point of observation
Prevailing wind direction
The grid can help in preliminary studies used to describe the air sample area, in such a way that prospective monitors for distinct pollutants are situated at each intersection of the grid or in the center of each square. In non-urbanized areas it is not obligatory to measure parameters with standardized instruments, nevertheless, it is important to do so in some of the stations used during the
40

preliminary measurement campaigns and in the final measurement networks in order to correlate data with pollution of manmade origin received by the ecosystem. Stations can be distributed according to the criteria of the designer of the monitoring networks, taking into consideration the nature of the parameter to be measured. In the case of secondary pollutants it is important to measure the axis indicated by the dominant winds, downwind and upwind, to estimate the impact and transformation of the same during their passage through the ecosystem. Since these are parameters that affect visibility, it is necessary to locate the sampling site in accordance with the landscape observation points that are of greatest interest to the tourist sector. If the objective of measurement networks is to measure acid deposit phenomena, it is necessary that the distance between stations permit the collection of sufficient information to process the data cartographically. Excessive spacing can affect representativeness while reduced spacing may lead to redundancy and a waste of resources.
41

2.4.3 Characteristics of the site where Station to be located Once the sampling site has been chosen, it is necessary to locate the precise location where the station or measurement shelter will be installed. The site must have the following general attributes:
• Accessibility. The site should have easy access by road. Narrow, unsafe, or unpaved roads should be avoided, as should roads with access controlled by residents, companies, non governmental groups or the government and should be available for use at any time of day or night.
• Security. The station should be located on an enclosed site, preferably in a school, health center, government office or any other building or block of land continually watched by security staff. It is not suitable to locate stations on communal sites with no perimeter fencing such as median strips, parks, public squares, etc. as these sites are exposed to the possibility of vandalism.
• Services. The site should offer all necessary services such as: piped water, sanitary and rainwater drainage, electricity, garbage collection and telephone lines.
Station located on a site within a school
Measurement instruments can be installed inside a shelter located on the floor or the roof, or they can be located in a room or office of a building or construction within the site. This final option is not recommended, but it is a possibility and can be chosen if budget restrictions affect the purchase of monitoring shelters.
42

Measurement instruments located on a roof
There should be no obstructions or activities that may alter the air sample to be taken or the free flow of wind. The following restrictions are obligatory:
• No obstruction within a radius of 20 meters around the station, using as a point of reference the sample inlet. If samples are taken from a window of the building, this restriction applies for 180o visibility from that building. An obstruction is understood as any building, tree or physical structure that is located above the height of the sample inlet.
• No air inlet or vent (injection or extraction) forming part of a ventilation, heating or air conditioning system in a radius of 20 meters around the station, using as a point of reference the sample inlet.
43

Station Obstructed by Vegetation
• The following activities are incompatible with the location of a shelter within a radius of 100 meters of the following: Gas stations, gas companies or gas plants or any installation for
the distribution or sale of fuel Chimneys or any fixed source of combustion, particularly boilers,
electricity generating plants, ovens and incinerators Open air sports fields, with or without a surface consisting of
concrete, clay, grass or any other material Industries or workshops where paint or solvents are used, or where
gases or particles are released as part of the production process Landfills, transfer stations for dangerous or solid waste, garbage
dumps or recycling depots Bodies of water Areas or roads without vegetation or covering Buildings or structures that exceed twice the height of the sample
inlet or any architectural form that prevents the free flow of wind Furthermore, it is necessary to avoid the performance of a number of activities in the area immediately surrounding the stations. If such activities are inevitable for reasons of maintenance, the data should be marked and eventually invalidated. These activities are:
44

Waterproofing of roofs, especially when the shelter is located on the roof or samples are taken in this area
The burning of wood, grass, branches or vegetable waste as a result of gardening works
The application of paint or architectural coverings in which solvents or volatile hydrocarbons are used
Demolition Bonfires, barbecues, open air cooking or use of fireworks Welding by electrical means.
It is necessary for monitoring stations NOT to be located close to, or at a distance of less than 100 meters from, the following sources of vehicle concentration or traffic or transport installations: Bus terminals, taxi ranks and bus-stops Traffic lights Toll booths or weigh stations Parking lots, in particular their entrances and exits Loading bays for materials or consumer products Streets or avenues with pronounced slopes, greater than 15% Busy intersections, entrances and exits of congested roads Schools, factories and offices with heavy vehicle traffic during arrival and
departure times of students, workers or employees Monitoring stations should be located at a prudent distance from linear sources of pollution such as roads, bridges, highways or railroad lines. The volume of traffic flow and the nature of vehicles using the roads (gasoline, diesel, LP gas, etc.) is an important factor to consider. In the following table the distances recommended by the USA-EPA are specified.
45

Table 4* Minimum separation distance between sample inlet and streets or avenues with vehicular traffic recommended by USA-EPA
Minimum separation distance in meters between streets/avenues and sample inlet on various scales.
Pb
Streets or avenues with daily vehicle
traffic per day O3
UrbanNO2
UrbanCO
UrbanMicro Med. Urb./Reg.
≤ 10,000 10 10 10 5-15 >15-50 >50 15,000 20 20 25 5-15 20,000 30 30 45 5-15 >15-75 >75 30,000 80 ≥ 40,000 >15-100 >100 40,000 50 50 115 50,000 135 ≥ 60,000 150 70,000 100 100
≥ 110,000 250 250 *Code of Federal Regulations. Title 40-Protection of the Environment. Part 58-Ambient Air Quality Monitoring
46

3 MONITORING SHELTERS AND INSTALLATION OF MEASURING INSTRUMENTS Once the site for the monitoring station and the measurement parameters have been selected, it is necessary to choose a shelter that can house the greatest number of measurement instruments possible, and that space is provided for additional future equipment. 3.1 Construction and functional characteristics Shelters are now manufactured commercially and sold or distributed in Mexico by national or foreign manufacturers. In general, shelters should possess the following characteristics:
Self-contained. Shelters should be designed to contain all typical sampling instruments, either within the shelter itself or in the roof. Likewise, they should have the necessary provisions for the connection of all electrical, air, water and gas supplies. Ergonomic. Internal spaces and
external points of access, with or without equipment, should permit the free movement of operatives and there should be no structures that pose health risks. Adaptable. The design should
permit adaptations in the positioning of racks, desks, protection zones for calibration gases and storage of samples, as well as other devices. Thermally isolated. The whole
structure of the shelter should be isolated to maintain internal temperature, with assistance, between 18 and 30 degrees centigrade. Resistant. The construction
Shelter
47

materials should be resistant to impact and rust, preferably steel and aluminum. Portable. Shelters should be
portable as a single unit, with the exception of external access steps, if these are required. Modular. The internal and
external structure of the shelters should permit modular enlargement for placing new measurement instruments. Hermetic. Internal hermeticism
is important so that noise is not transmitted to the exterior or the different internal areas of the shelter.
Shelter
48

Figure 3
Typical Air Monitoring Station Arrangment
Transmission Network
Measuring Station
Weather Tower
Figure 4 shows a typical internal arrangement of a weather monitoring station (Lacy, 2001), with three areas that should preferably be separated by insulated walls with interconnecting doors. These areas are:
1. Measuring Instrument Area. This area is where racks are usually placed to hold gas analyzers and particle samplers. Also, it is here where the sample inlet manifold is placed. This area must be acclimatized and have an internal temperature within the range of 20 to 30 oC with a maximum variation of +/- 2 oC. If the internal temperature of this area goes beyond the specified range, the data obtained by pollution monitors must be flagged for later validation.
49
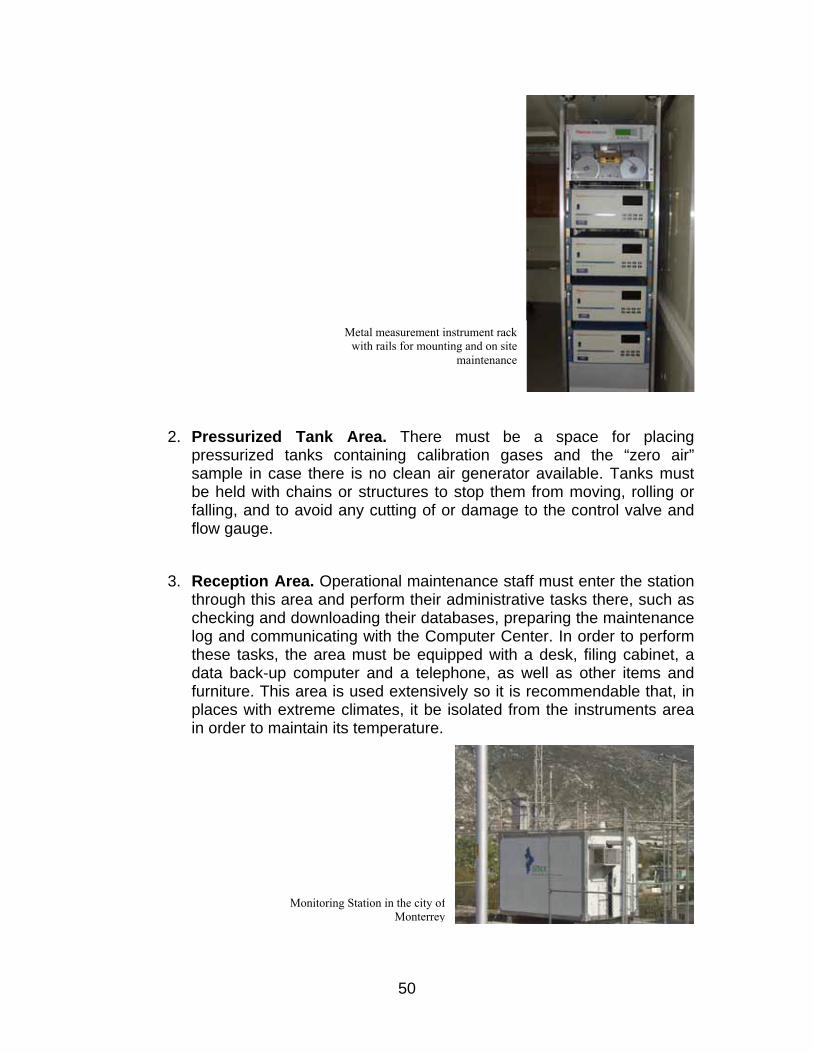
Metal measurement instrument rackwith rails for mounting and on site
maintenance
2. Pressurized Tank Area. There must be a space for placing
pressurized tanks containing calibration gases and the “zero air” sample in case there is no clean air generator available. Tanks must be held with chains or structures to stop them from moving, rolling or falling, and to avoid any cutting of or damage to the control valve and flow gauge.
3. Reception Area. Operational maintenance staff must enter the station
through this area and perform their administrative tasks there, such as checking and downloading their databases, preparing the maintenance log and communicating with the Computer Center. In order to perform these tasks, the area must be equipped with a desk, filing cabinet, a data back-up computer and a telephone, as well as other items and furniture. This area is used extensively so it is recommendable that, in places with extreme climates, it be isolated from the instruments area in order to maintain its temperature.
Monitoring Station in the city ofMonterrey
50

Figure 4
Ideal Internal Arrangement of an Air Monitoring Station
MEASURING INSTRUMENT AREA
Sample inlet GAS
AREA
Temperature Control
ADMINISTRATIVE AREA
AirConditioning
3.2 Sample Inlet The sample inlet in a monitoring station is the critical station representativeness control device. The ambient air sample must not be altered during it route from the outside to the inside of the measuring instruments, and it must be taken preferably from a body of air that is breathed by the population.
There are many forms and arrangements for the sample inlet. Figure 5 gives the most common one, standing out of the Monitoring Station through the roof in which Teflon piping and borosilicate glass are used for components. The photographs below show the most commonly used arrangements for placing the manifold in the station, which leads the air sample to the gas analyzers along inert Teflon tubes. The manifold may be placed horizontally or vertically, although horizontally is recommended for safety reasons as this reduces the risk of accidental breakage.
Figure 5
51
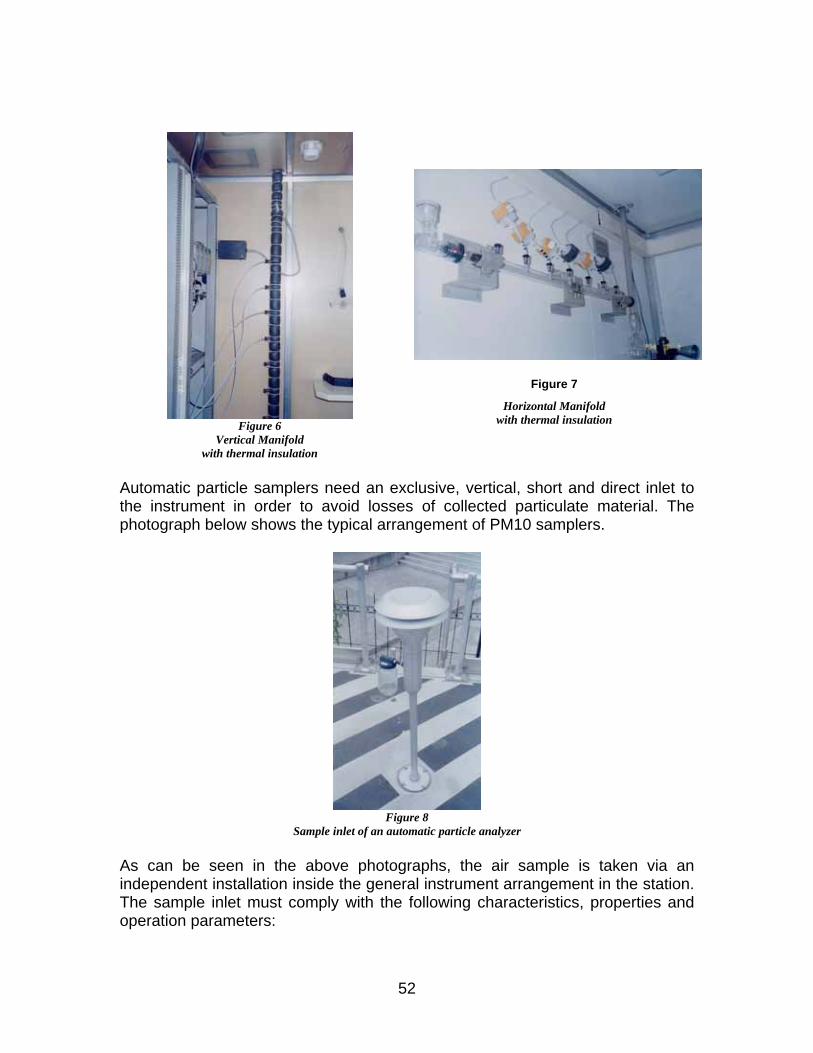
Figure 6
Vertical Manifold with thermal insulation
Figure 7
Horizontal Manifold with thermal insulation
Automatic particle samplers need an exclusive, vertical, short and direct inlet to the instrument in order to avoid losses of collected particulate material. The photograph below shows the typical arrangement of PM10 samplers.
Figure 8
Sample inlet of an automatic particle analyzer As can be seen in the above photographs, the air sample is taken via an independent installation inside the general instrument arrangement in the station. The sample inlet must comply with the following characteristics, properties and operation parameters:
52

Inert. All installation materials for taking the air sample must be inert, preferably transparent, in order to allow viewing for cleanliness and functioning, to which end Pyrex glass, Teflon or stainless steel may be used. It is an essential requirement that the air sample be subjected to as little chemical and physical alteration as possible. Because of this, the tubular installation of the sample inlet must also be insulated in order to avoid a temperature clash between the inside and outside of the station.
Outside and Safe. The sample inlet must be located in the upper section of the station, be rigid and stand out from the roof by at least one meter. The sample to be taken must be air only, avoiding contamination by water or any material alien to the gas analyzers. To this end, the inlet must be provided via a tube folded into a “u”, with a half-turn ending in an inverted cone.
Isolation of dampness and heavy solids. The roof sample inlet must be connected to a tube that vertically penetrates the station, leads air through a “T” junction towards a manifold and ends up in a recipient that receives any humidity retained or alien solid material by gravity.
Multiple distribution of calibration gas and air sample. The manifold must be made of transparent glass and distribute the air sample or calibration gases to the gas analyzers. It may be placed horizontally or vertically and be modular, depending on the available space in the station and the arrangement and number of instruments to be connected. It is recommended that analyzers for O3 and NO2 be connected to the closest ports.
Controlled or induced flow. The air sample, which passes through the aforementioned arrangement, must be induced and controlled with an air pump or blower that operates with a flow range of between 85 and 140 liters per minute. The air sample must circulate from the outside to the inside of the gas analyzers in no more than 10 seconds. This length of time is called residence time (EPA,1998).
53

3.2.1 Residence time determination Residence time of the air sample in the tube and manifold guiding it towards the analyzers is a critical factor that must be controlled. According to the registrations conducted by the USA-EPA, a reactive gas such as ozone is subject to insignificant losses if its residence or passage time through a tube with a diameter of 13 mm is less than 10 seconds. Over 20 seconds, losses become detectable, and when residence time is greater than 60 seconds, loss is total. Residence time is calculated by dividing the total volume of all the tubes, the manifold and humidity traps by the air flow achieved by the pump or blower. The flow must be adapted to a time of less than 10 seconds, as indicated above. The formulas for calculating residence time TR in minutes for an air sample through sample inlet installation, are as follows: VT total sample inlet device volume in liters
TR in minutes = -------------------------------------------------------------------------------------------FB pump flow in liters per minute
VT = Vt + Vm + Vd Where Vt = Volume of all tubes Vm = Manifold volume Vd = Volume of all additional devices, such as humidity traps
54

The volume of each tube is calculated as follows:
Vt = π (d/2)L
d
L
Where π = 3.1416 L= tube length d = tube diameter
The volume of sample inlet tubes and the tubes from the manifold tothe gas analyzers, as well as their internal tubes, must be included.
3.2.2 Sample inlet height For each pollutant there is a height that has been determined or allowed for locating the sample inlet, depending on the representativeness scale of the station where measurements are being taken. Table 5 below shows the acceptable height ranges. In practice, all pollutant gases may be measured with a single inlet, as a result of which inlets at each site tend to be located at the same height. At stations located at street level, where the pollutants of concern come from automobiles, the sample inlet may be placed at a height of 2 meters, which may be taken as the average height between the exhaust pipe of a private sedan vehicle at ground level (30 cm. approx.) and the exhaust pipe of a bus or truck (3 meters approx.).
55

Table 5 Sample Inlet Location Height*
Pollutant
Scale
Height from ground level to sample inlet (meters)
SO2 All 3-15
CO Specific point and Micro
Average
2±0.5 3-15
O3 All 3-15 Ozone Precursors All 3-15
NO2 All 3-15
Pb Specific point and Micro
Average, urban and regional
2-7
2-15
PM10 Specific point and Micro
Average, urban and regional
2-7
2-15
PM2.5 Specific point and Micro
Average, urban and regional
2-7
2-15
*(Martínez, 1997),(EPA, 1998) (WHO, 1977) Particles are collected in independent samplers with their own sample inlet. In general, it is recommended that PM10 and Pb samplers be placed 2 to 4 meters apart from each other if the samplers are different. Also, in order to place PM2.5 samplers in position, there must be a gap of 1 to 4 meters separating each sampler if they are placed on the roof of the station or outside it. Weather parameters are measured using instruments placed at two different heights. Direction and speed gauges must be placed at the top of a tower with a height of between 10 and 25 meters, depending on the location of the base, while rain samplers and ultra violet radiation gauges may be placed on the roof of the monitoring station itself.
56

4. BIBLIOGRAPHY 1. Calder, K.L. (1975). Objective Procedures for Optimum Location of Air
Pollution Observation Stations. EPA-650/4-75-005. 2. Code of Federal Regulations. Title 40-Protection of Environment. Part 58-
Ambient Air Quality Surveillance. 3. Colegio de México (2001). La Ciudad de México en el fin second milenio.
Colegio de México. 4. Couling, Suzanne. (1993). Measurement of Airborne Pollutants. Warren
Spring Laboratory. Butterworth-Heinemann Ltd. 5. Environment Protection Agency, USA. (1998). Quality Assurance
Handbook for Air Pollution Measurements Systems. EPA-454/R-98-004. 6. Instituto Mexicano del Petróleo. (1998). Investigación sobre Materia
Particulada y Deterioro Atmosférico. Subdirección de Protección Ambiental.
7. Korc, M. (2001). Conceptos básicos sobre meteorología de la contaminación del aire. Adaptado del manual de auto-instruction "SI:049 Basic air pollution meteorology course U.S. EPA”, CEPIS.
8. Lacy, Rodolfo. (2001). Diseño de la Red de Monitoreo de la Ciudad de Lima, Perú. Reporte Final del Estudio de Saturación. COSUDE.
9. Martínez, A; Romieu, I.(1997). Introducción al Monitoreo Atmosférico. coedición OPS-GTZ-DDF, Hemes Impresores, 1er edition,. México.
10. Molina, Mario. (2002). Air Quality in the Mexico Megacity. Kluwer Academic Publishers.
11. Munn, R. E. (1981). The Design of Air Quality Monitoring Networks. Macmillan Publishers Ltd.
12. NIWA (1995). National Ambient Air Quality Network Design for New Zealand.
13. Nychka, Douglas. Gilleland, Eric. (1997). Measuring Air Quality Standards and Spatial Design. National Center for Atmospheric Research.
14. Sampson, Paul. (2001). Air Quality Monitoring Network Design Using Pareto Optimality Methods for Multiple Objective Criteria. NRCSE University of Washington and EPA.
15. U.S. EPA (1987) (Revised 1993). On-Site Meteorological Program Guidance for Regulatory Modeling Applications. EPA-45/4-87-013.
16. WHO (1977). Air Monitoring Programme; Design for Urban and Industrial Areas.
17. Wiersma, G. Bruce. (2004) Environmental Monitoring. CRC Press. 18. Zimmerman, D. L. (2002). Optimal Spatial Design. Encyclopedia of
Environmetrics. Wiley, N. Y.
57

DOCUMENT 4
Operation, Maintenance and Calibration in Air Monitoring Systems
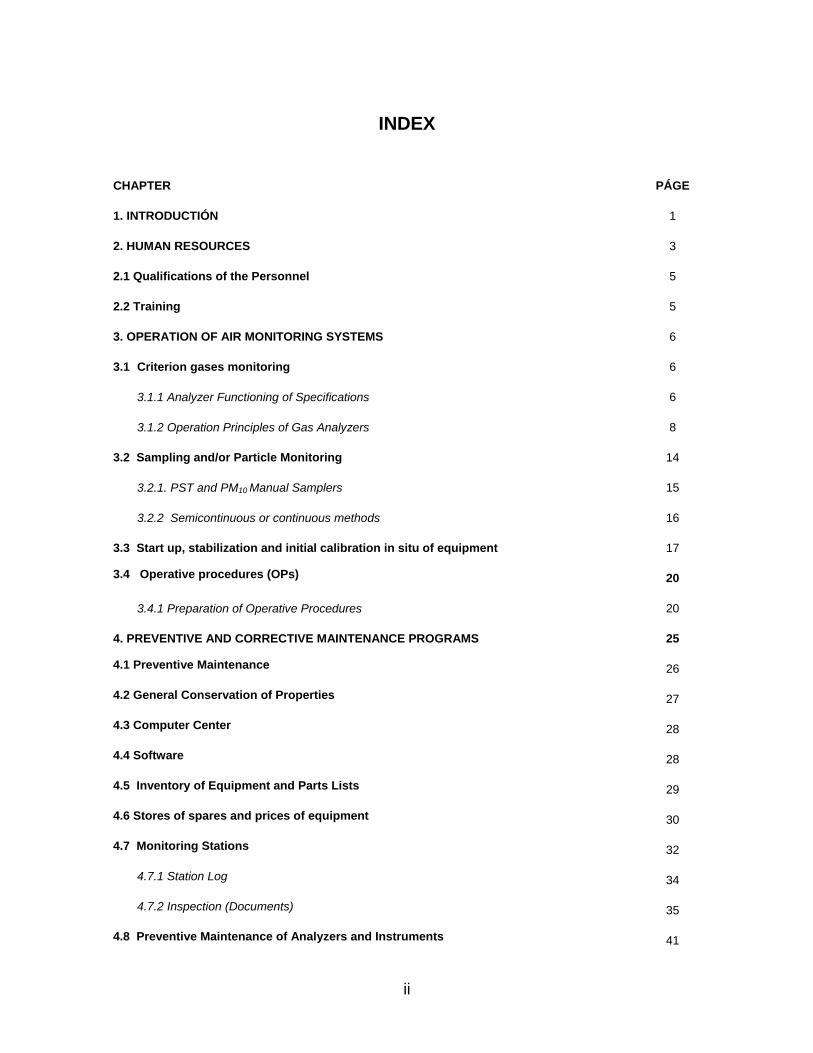
INDEX
CHAPTER PÁGE
1. INTRODUCTIÓN 1
2. HUMAN RESOURCES 3
2.1 Qualifications of the Personnel 5
2.2 Training 5
3. OPERATION OF AIR MONITORING SYSTEMS 6
3.1 Criterion gases monitoring 6
3.1.1 Analyzer Functioning of Specifications 6
3.1.2 Operation Principles of Gas Analyzers 8
3.2 Sampling and/or Particle Monitoring 14
3.2.1. PST and PM10 Manual Samplers 15
3.2.2 Semicontinuous or continuous methods 16
3.3 Start up, stabilization and initial calibration in situ of equipment 17
3.4 Operative procedures (OPs) 20
3.4.1 Preparation of Operative Procedures 20
4. PREVENTIVE AND CORRECTIVE MAINTENANCE PROGRAMS 25
4.1 Preventive Maintenance 26
4.2 General Conservation of Properties 27
4.3 Computer Center 28
4.4 Software 28
4.5 Inventory of Equipment and Parts Lists 29
4.6 Stores of spares and prices of equipment 30
4.7 Monitoring Stations 32
4.7.1 Station Log 34
4.7.2 Inspection (Documents) 35
4.8 Preventive Maintenance of Analyzers and Instruments 41
ii

5. EQUIPMENT AND INSTRUMENT CALIBRATION PROGRAMS 47
5.1 General Aspects 47
5.2 Standard transfer laboratory 48
5.3 Certification of Transfer Standards 50
5.3.1 Certification of flow calibrators 50
5.3. 2 Photometers 55
5.4 Calibration gases 56
5.5 Calibration of Dynamic Calibrators 59
5.5.1 Calibration procedure 59
5.6 Analyzer Calibration 66
5.6.1 Multi-point calibrations 66
5.6.2 Zero and Span Calibration 72
5.6.3 Automatic verification of the Zero and the Span 73
5.7 Calibration of meteorological sensors 74
5.8 Calibration frequency and analyzer adjustment 75
5.9 Data Validation using Calibration Information 76
6. SAFETY AND EMERGENCY PLANS 77
6.1 Safety in the installations 77
6.2 Safety practices around the installations 79
7. BIBLIOGRAPHY 81
iii

LIST OF FIGURES
FIG. 2.1 Technical Personnel 4
FIG. 3.1 Simple NDRI Detection Principle 8
FIG 3.2 NDIR Detection Principle of Filter for Gas Correlation 9
FIG. 3.3 Principle of UV Fluorescence Detection 10
FIG. 3.4 Principle of Chemoluminescence Detection 11
FIG 3.5 Principle of UV Photometry Detection 13
FIG. 3.6 High Volume Sampler with PM10 Head 16
FIG. 3.7 Basic Components for the Preparation of an OP 21
FIG. 4.1 Storage of Out of Operation Analyzers 31
FIG. 4.2 Spares Storage Area 32
FIG 4.3 The A/C System is a Priority Component of the PMP 33
Fig. 4.4 Revision and Cleaning of a PM10 Head 45
FIG. 4.5 Meteorological Instruments in the Guadalajara Monitoring Station 46
FIG 5.1 Multiple connectors inside a standard transfer laboratory 49
FIG 5.2 Kit for the calibration of flow meters in monitoring stations 51
FIG 5.3 BROOKS primary calibrator referred to for flow calibrators 52
FIG 5.4 General Arrangement of Orifice gauges 54
FIG 5.5 Calibration curve for orifice units 54
FIG 5.6 Certification against reference standard photometer 55
FIG 5.7 Typical arrangement for calibration of an O3 transfer standard 56
FIG 5.8 Diagram for the certification of calibration gases. Dilution Method 58
FIG 5.9 Diagram for the certification of calibration gases. Method without Dilution 58
FIG. 5.10 Ozone Calibration Diagram 61
FIG 5.11 Zero drift control card 74
FIG 6.1 Electric energy distribution board in the monitoring station 78
FIG.6.2 Compressed gas tanks in monitoring station without fastening 79
iv
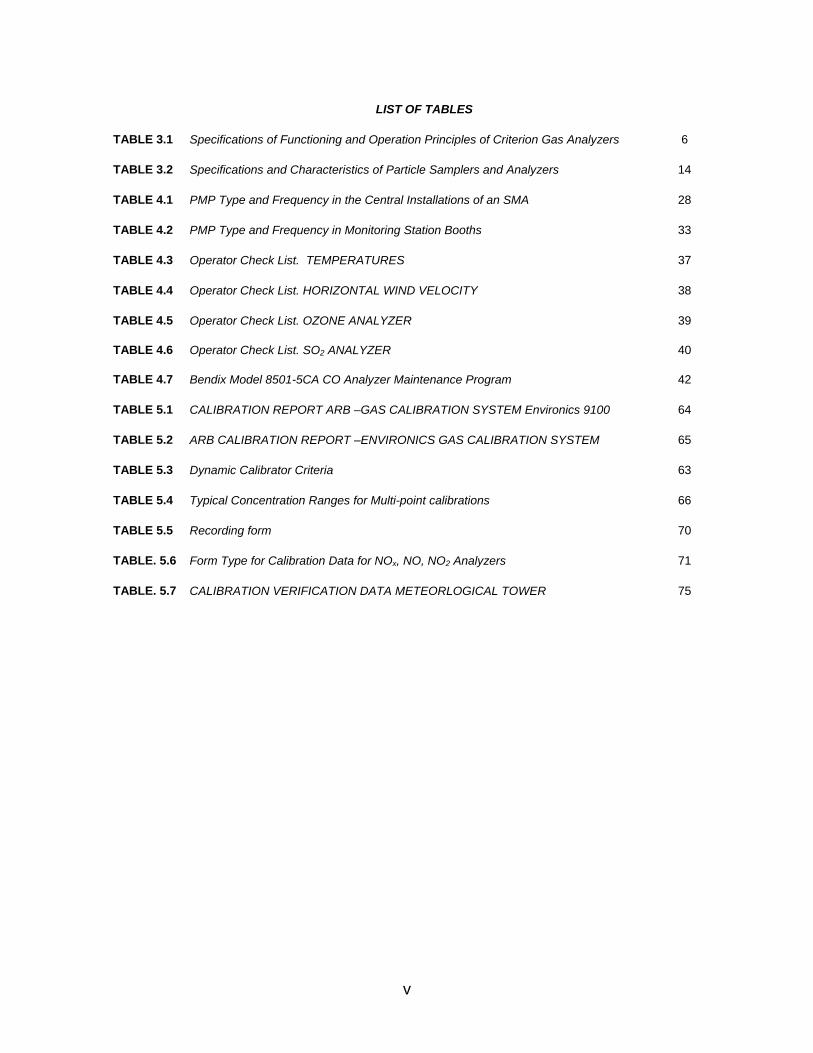
LIST OF TABLES
TABLE 3.1 Specifications of Functioning and Operation Principles of Criterion Gas Analyzers 6
TABLE 3.2 Specifications and Characteristics of Particle Samplers and Analyzers 14
TABLE 4.1 PMP Type and Frequency in the Central Installations of an SMA 28
TABLE 4.2 PMP Type and Frequency in Monitoring Station Booths 33
TABLE 4.3 Operator Check List. TEMPERATURES 37
TABLE 4.4 Operator Check List. HORIZONTAL WIND VELOCITY 38
TABLE 4.5 Operator Check List. OZONE ANALYZER 39
TABLE 4.6 Operator Check List. SO2 ANALYZER 40
TABLE 4.7 Bendix Model 8501-5CA CO Analyzer Maintenance Program 42
TABLE 5.1 CALIBRATION REPORT ARB –GAS CALIBRATION SYSTEM Environics 9100 64
TABLE 5.2 ARB CALIBRATION REPORT –ENVIRONICS GAS CALIBRATION SYSTEM 65
TABLE 5.3 Dynamic Calibrator Criteria 63
TABLE 5.4 Typical Concentration Ranges for Multi-point calibrations 66
TABLE 5.5 Recording form 70
TABLE. 5.6 Form Type for Calibration Data for NOx, NO, NO2 Analyzers 71
TABLE. 5.7 CALIBRATION VERIFICATION DATA METEORLOGICAL TOWER 75
v

1. INTRODUCTION The operation of an Air Monitoring System (SMA) implies different tasks and activities that are coordinated and carried out by trained personnel and guarantee the correct measurement of air pollutants and meteorological parameters, as well as the acquisition, storage and processing of the data generated. This document refers to the most relevant aspects of calibration and maintenance Programs that must be introduced to guarantee the ongoing, reliable operation of an SMA. This document contains five chapters:
Chapter 2 includes the training requirements of the personnel that participate in the operation, maintenance and calibration activities of Air Monitoring Systems (SMAs). Chapter 3 describes the functioning principles of the automatic gas analyzers and samplers and particle monitors used in measuring the concentrations of criterion pollutants in the air. It also includes criteria for the selection of equipment and the activities to be carried out for its start up, installation and operation. The final part of the chapter mentions basic considerations for the preparation of Operative Procedures (OPs) that are an essential tool in the quality schemes of organizations responsible for Air Monitoring Programs. Chapter 4 lays down general guidelines and the minimum requirements for the preventive maintenance programs (PMP) of Air Monitoring Systems (SMAs). This chapter also includes basic aspects related to the availability of parts, spares and equipment; the availability of appropriate Installations and the general characteristics of the supervision and recording (Log) activities that must be documented in said programs. Chapter 5, lays down the general aspects of the types of calibrations required in this type of system, to demonstrate the trazability of the measurements that are made, emphasizing in the necessity to arrange in the country to medium term, of services of certification and verification of transference standards
It is important to point out that preventive maintenance and calibration activities are implicit in the operation of an SMA and that, as an integral part of the Quality Management System of the SMAs, must be documented to demonstrate traceability.
1

Similarly, the Preventive Maintenance and Calibration Programs must be efficacious in terms of coverage and temporality. Coverage refers to the integral inclusion of the SMA infrastructure that includes installations, equipment, instruments, vehicles, etc. While temporality is related to the frequency with which the different activities of checking, substitution, revision, maintenance and calibration are programmed and executed in order to guarantee compliance with the quality objectives laid down by top management. It is also necessary to consider that for certain critical aspects, said frequencies and other specific requirements may obey the regulatory requirements and/or standards established by the competent authorities which may be based on middle and long term goals and objectives for the strengthening of the National Air Quality Information System (SINAICA), which represents an essential element for Air Quality Management.
2

2. HUMAN RESOURCES The persons responsible for operating the Air Monitoring Systems (SMAs) must ensure the competence and suitability of the technical personnel that install, test, calibrate, check the operation and give preventive and/or corrective maintenance to the analyzers, sampling and calibration equipment and other instruments included in the basic infrastructure of the following networks: air monitoring, meteorological and acquisition, data transmission and storage, and the support and/or standard transfer laboratories. The personnel that carry out the specific tasks of operation, maintenance and/or calibration, data processing and interpretation must be qualified with an appropriate professional and/or technical formation, training and/or proven skill, as required. As described in documents 5 and 6, SMAs, in their Quality Management System (QMS), must have training policies and procedures that include relevant induction activities so that new personnel can carry out their first tasks with help and under rigorous supervision and can also become familiar with and get to know the operative procedures of Quality Assurance related to the functions and activities they will have to develop. As well as the skills, profile, training, experience and satisfactory knowledge of the Operative Procedures related to their activities, the personnel responsible for both the supervision and execution of routine operation, calibration and maintenance activities, must have, according to their level of responsibility:
• Proven knowledge of the principles of operation and functioning of the sampling equipment, analyzers, calibration equipment, among others, and practical aspects related to their installation, use, maintenance routines, common failures and critical components.
• General knowledge of the basic concepts of air pollution and the units in which the concentrations of the pollutants are expressed and their relation to standards, indicators and test methods.
• Good understanding of the meaning of deviations found with respect to the normal behavior of pollutants, for example: the evolution of the concentration curves of CO, O3 and NOX throughout the day or the decreases and increases in particle concentrations during the rainy and dry seasons, respectively.
3

• Knowledge of basic statistics and the typical indicators used in air monitoring to ensure and control data quality, such as: precision, bias, exactness, representativity, detectability, comparability and integrity.
In this way, the profile and experience of the technical personnel of the SMAs will be a determining factor for the appropriate operation, implementation, maintenance and calibration programs and activities corresponding to the management and assessment of air quality data. In inspections made of the automatic air quality monitoring networks, it was corroborated that although in most cases there is a limited number of persons to cover all the operational aspects of said monitoring systems, a good number of persons have more than 4 to 5 years’ experience and at least one participated in the installation stage and system start up.
Figure 2.1 Technical Personal
Computer Center in Monterrey-SIMA
4

2.1 Qualifications of the Personnel In the QMS, each SMA must have a job description of all the personnel involved. Personnel assigned to air quality sampling activities must comply with the requirements laid down for their position with respect to profile, work experience, responsibilities and personal qualifications. The members of staff of an SMA must consist of an interdisciplinary group including engineers and technicians: environmental, chemical, electronic. In air monitoring systems operated in metropolitan zones like Mexico City, Guadalajara and Monterrey specialists in meteorology may also be needed for purposes of air quality forecasts. Records of the qualifications of the personnel and their training must be kept and made available for any review process or audit according to the document control procedure established in the Quality Management System. 2.2 Training Each SMA must set up an Annual Training Program leading to the professional strengthening and updating of its personnel in the different subjects related to air quality monitoring and those corresponding to quality management. Training for each position must be programmed according to identification of the needs of personnel and with previously defined coverage goals indicating the desirable frequency of training. Training can be internal or external and given through formal courses, workshops, conferences (they can be virtual) and on-site training. Among the training courses the air Monitoring Systems personnel must take, the following are recommended:
• General knowledge of air pollution • Units and conversions used in Air Pollution • Pollution control • Principles and practices of air pollution control • Introduction to ambient air monitoring • Quality assurance and control for air monitoring systems • Sampling and air monitoring • Analytical methods for air quality standards • Basic metrology (traceability, statistics, uncertainty, etc.) • Data quality assessment • Technical Audits of the System and Functioning Audits
5

3. OPERATION OF AIR MONITORING SYSTEMS 3.1 Criterion gas monitoring 3.1.1 Analyzer Functioning Specifications In practice, the monitoring systems that operate in Mexico measure criterion pollutants using reference methods in the cases of CO and NO2 (NOX) and equivalent methods for O3 and SO2. In the case of these gases, said categorization is applicable both for Mexico and the USA. Table 3.1 indicates the minimum performance specifications for monitors established by USEPA. As it is important to mention that the new generations of monitors completely comply with said performance criteria, the principles of analyzer detection of gas pollutants discussed in the following section are also included.
Table 3.1 Specifications of Functioning and Operation Principles of Criterion Gas Analyzers
P o l l u t a n t
Technical Specification
Carbon Monoxide
REFERENCE METHOD
Ozone
EQUIVALENT METHOD
Nitrogen Oxides REFERENCE METHOD
Sulfur Dioxide EQUIVALENT METHOD
Detection Principle
Infrared Correlation of gas
filter
UV Photometry
Chemoluminiscence
UV Fluorescence
Detection Limit 0.1 ppm 0.002 ppm 0.005 ppm 0.002 ppm Precision +/- 0.1 ppm +/- 0.002 ppm +/- 0.002 ppm +/- 0.002 ppm Lineality 1.0% EC 1.0% EC 1.0% EC 1.0% EC
Displacement from zero 24h
+/- 0.2 ppm +/- 0.002 ppm +/- 0.002 ppm +/- 0.002 ppm
Displacement from span 24h
1.0% EC 1.0% EC 1.0% EC 1.0% EC
Noise +/- 0.05 ppm +/- 0.001 ppm +/- 0.002 ppm +/- 0.002 ppm Response Time
95% 90 s 90 s 180 s 180 s
Operation Temperature
(Range)
10 – 40 °C
10 – 40 °C
10 – 40 °C
10 – 40 °C
Humidity Range 100% 100% 100% 100% Maximum Cycle
Time 1.0 min. 1.0 min. 3.0 min. 3.0 min.
Voltage 105 – 115 VCA/60 HZ
105 – 115 VCA/60 HZ
105 – 115 VCA/60 HZ
105 – 115 VCA/60 HZ
6

These general performance specifications of the air monitoring continuous analyzers are defined in the following way:
a) Minimum Detection Limit This is the lowest concentration that the analyzer can reliably detect. It is defined as double the level of noise of the analyzer. b) Precision Is the degree in variation of the response of the analyzer with respect to the means of a series of repeated measurements of one same concentration value expressed as the standard deviation around the mean. c) Lineality Is the maximum deviation between the current response of the analyzer and the output response pre-established by the lineal regression (minimum squares) of the current readings. d) Displacement from zero (Zero drift) Is the change in output response of the analyzer to a constant zero concentration in a continual operation period without making any adjustments. e) Span displacement Is the percentage change in the output response of the analyzer on a complete scale to a known concentration of the pollutant in a continual operation period without making adjustments. f) Noise Is the spontaneous short length deviations in analyzer output in relation to the mean which are not caused by changes in input concentration. g) Response time Is the time that elapses from the first observable change in analyzer response and the 95% reading of the test concentration in stable form. h) Range of Operation Temperatures Are the maximum and minimum ambient temperatures around the analyzer at which it can operate without significant changes in its response or functioning.
7

3.1.2 Operation Principles of Gas Analyzers Carbon Monoxide (CO)
Non-dispersive infrared spectrophotometry (NDIR) These instruments measure light absorption of the CO molecules based on the use of filters or other mechanisms over relatively small ranges of wave lengths “bands” centered on the maximum absorption region (peaks) of said compound. Figure 3.1 schematically shows the basic components of a traditional NDIR analyzer and its functioning principle. Jahnke (1993)
Figure 3.1 Simple NDIR Detection Principle
Modified from: Jahnke (1993) Infrared light is emitted by a lamp and transmitted through two cells: one reference cell and one sample cell. The reference cell contains an inert gas, commonly N2 or Ar, that does not absorb IR light at the wavelength used in the analyzer. In this way, as the beam of infrared light goes through the sample cell, the CO molecules absorb part of the IR light and therefore at the exit of the cell there will be less energy than at the entrance and also less than at the exit of the reference cell. This difference in energy between the two cells is measured by some type of solid state detector, which is directly proportional to the amount of CO contained in the gas sample. However, the more modern CO analyzers apply a variation called Gas Filter Correlation whose functioning pattern is shown in Figure 3.2.
8

Figure 3.2 NDIR Detection Principle with Gas Filter Correlation
Modified from: Jahnke (1993) In this case, the beam of IR light goes through a rotational filter made up of two cells that contain CO and N2 in order to create the reference beam in such a way that the detector measures the amplitude between the light absorbed in the sample cell and the signal modulated by the alternation between the gas filters. The detector signal is processed and conditioned by microprocessors to display it as a CO concentration reading in ppm or ppb. Sulfur Dioxide (SO2)
The UV fluorescence method The functioning principle of these analyzers is based on the fact that when they absorb ultraviolet (UV) light at a wave length in the range of 210m, the SO2 molecules go into an instantaneous state of excitation to then drop to a lower energy state emitting UV light at a greater wave length in the 240 to 410 nm range as indicated below:
SO2+hγ210 nm → SO2 * → SO2 * + hγ240-410 nm
. The intensity of the fluorescent light released is in proportion to the concentration of SO2, Jahnke (1993). The basic components of an analyzer of this type are shown in Fig. 3.3.
9

Figure 3.3 Principle of UV Fluorescence Detection
Modified from: Jahnke (1993)
As can be observed, the selection of specific wave lengths is carried out through band filters of both light irradiated by the UV lamp and fluorescent light emitted in the chamber which is received by a photoelectric tube (photomultiplier) that detects the light signal and converts into an electric signal whose magnitude is directly proportional to the concentration of SO2 in the sampled gas. Jahnke (1993) In practice, commercial equipment also has scrubbers to remove hydrocarbons or other mechanisms to minimize interference. Nitrogen Oxides (NOX)
Chemoluminiscence Chemoluminiscence is the name given to the generation of light through a chemical reaction; the NOx analyzers use this principle starting from the reaction that takes place between the nitric oxide (NO) and the ozone (O3), where a radiation in the infrared range between 500 and 3000 nm is produced as shown in the following reaction:
2*23 ONOONO +→+
10

hvNONO +→ 2*2
As can be observed, the NO in an air sample will react with the O3 to generate nitrogen dioxide in its excited state (NO2*). Subsequently, when the nitrogen dioxide generated goes back to its initial state, it emits the chemoluminiscent light in an amount proportional to the concentration of NO contained in the sample. Jahnke (1993). Fig. 3.4 shows the basic components of an NOx analyzer.
Figure 3.4 Principle of Chemoluminescence Detection
Modified from: Jahnke (1993)
iven that the NO2 present in ambient air does not participate in the
Gchemoluminiscence reaction, the analyzer is provided with a converter where the air sample is alternately passed through it to reduce (convert) the nitrogen dioxide into NO.
221/
2 ONONO rcatalizadocalor +⎯⎯⎯⎯⎯ →⎯
s can be observed in Fig. 3.4, the generation of O3 takes place through UV irradiation of oxygen in the quartz tube. The O3 is supplied in excess to the reaction
A
11

chamber to ensure the complete reaction and to minimize “quenching” effects. Jahnke (1993) NOx determination takes place in two stages. In the first, the NO2 present in the ample does not go through the converter and therefore the concentration detected
zone (O3)
etric ultraviolet (UV)
The etry for the continual measurement of this ambient air pollutant. Said method is based on measuring the amount of ultraviolet
ich establishes the lationship between the amount of light absorbed at a specific wavelength by one
Where:
ity without absorption
tion
ined wavelength
L
3)
scorresponds exclusively to the NO present, while in the second stage the NO2 of the sample is reduced to NO in the converter and therefore the concentration detected corresponds to the total NOx. The determination of NO2 is carried out taking the difference between the recorded readings. O
Photom
O3 analyzers use UV photom
rays absorbed by the O3 with a wavelength of around 254 nm. This detection principle is based on the Beer-Lambert Law whremolecule of gas at a determined distance and certain pressure and temperature conditions. The equation for said parameters is as follows:
I = I0 eα LC (a CN de P y T)
I = Light intens I0 = Light intensity of light with absorp α = Absorption coefficient of O3 at a determ = Length of Cell or absorption tube C = Concentration of absorbing gas(O
12
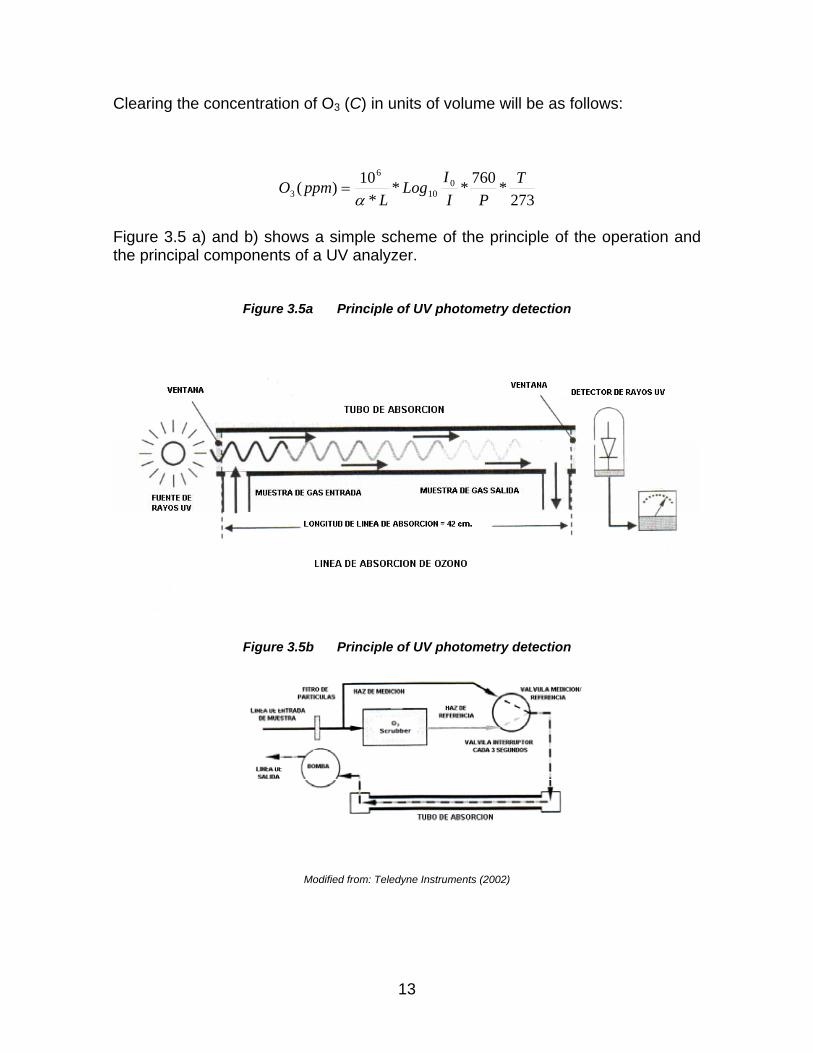
Clearing the concentration of O3 (C) in units of volume will be as follows:
273*760**
*10)( 0
10
6
3T
PII
LogL
ppmOα
=
Figure 3.5 a) and b) shows a simple scheme of the principle of the operation and the principal components of a UV analyzer.
Figure 3.5a Principle of UV photometry detection
Figure 3.5b Principle of UV photometry detection
Modified from: Teledyne Instruments (2002)
13

Commonly, commercial e mercury steam lamp to ough a filter of an inert material to
ample and total reference intensity coming from
f PM10 is principally applied and, in
rticles equal to and
onitoring systems are given in the following table:
Particle Analyzers
Aerosols
quipment uses a high energygenerate the UV light beam. The beam goes thrthe O3 and transparent UV 254 nm transparent light. Given that O3 very efficiently absorbs UV light the length of the chamber required could be relatively short (e.g. 40 – 42 cm.). Finally, the beam of UV light goes through a similar filter located in the end part of the absorption tube to be detected by a vacuum diode selective to said wavelength whose intensity is converted into a voltage output directly proportional to the concentration. Figure b shows the analyzer, using alternative detection of the intensity of the beam of light obtained from the sthe sample going through a cartridge for the removal of O3 (Scrubber); in modern analyzers this cycle lasts for 5 to 6 seconds. 3.2 Sampling and/or Particle Monitoring In the automatic monitoring networks that operate in Mexico, the semi-continuousbeta attenuation method for the assessment osome cases, such as in the ZMCM, TEOM methods are used. There is, furthermore, a large number of manual networks that use high volume samplers to determine total Suspended Particles (TSP) and Paless than 10 um (PM10). This section gives a general description of sampling and/or monitoring. The principal characteristics of the particle assessment techniques applied in the air quality m
Table 3.2 Specifications and Characteristics of Samplers and
Manual Methods Semi-continuous or Continuous Methods
Specification Total Suspended Particles
REFERENCE METHOD
less than
10um REFERENC METHOD
AttenuatioEQUIVALE HOD
EQUIVALE METHOD
Technical
(TSP) Particles
E
BETA n
NT MET
TEOM
NT
Measurement or Detection Principle
Gravimetry Beta Radiation
Oscillating MiScale
avimetryGr
Absorption of
cro
Lower Detection
Limit 2.0 ug/Nm3 2.0 ug/Nm3 10.0 ug/Nm3 2.0 ug/Nm3
Precision 3 to 5% 5 to 7% ppm 3% (24 h) +/- 0.0 m 02 ppManaged Flow 1.1 in - 1.7 Nm3/m 1.1 Nm3/min 18.9 lpm 16.7 lpms Sampling Time 24 h 24 h Semi-continuous Continuous
1.0 h 1 – 3 min
14
3 PM10 al samplers
m d articles (TSP) in ambient air that has been traditionally used both in the USA and
e range of 1.1 and 1.7 m3/min and
rrected sampled air under reference
he typical sampling frequency of
s equal to or less than 10 µm
me Standard for the determination of articles less than 10 micrometers (PM10). However, manual determination is
ral equipment that comprise it for the induction of the air flow (motor); the
.2.1. PST and manu ) Total Suspended Particles (TSP)a
The anual measuring method to determine the concentration of total suspendepMexico is called the high volume method, where the total suspended particle concentration in ambient air is determined from the gravimetric determination of the gain in weight of the particles retained in a fiber glass filter previously stabilized in controlled humidity and temperature conditions. The acceptance criteria established by the method are related to the air flow managed through the sampler that must be in thSampling time must be 24 h +/- 60 minutes. The concentration of TSP in the ambient air is calculated by dividing the mass of he collected particles by the volume of cotconditions and expressed in micrograms per cubic meter of air, e.g.
CPST = 190 µg/Nm3
T these manual determinations of Aerosols is every 6 days.
) Particleb As ntioned above, there is no Mexican pcarried out by adopting the criteria of the USEPA method of reference where a high volume sampler is also used coupled to a virtual head, as it must be kept constant as far as possible at 1.1 m3/min (40 acfm) in order to achieve optimal cut conditions in the virtual separation of the PM10 particles that takes place in the head. Figure 3.6 shows a typical high volume sampler with its respective head and other peripherecording of the flow and the accessories to hold the filter.
15

Fig. 3.6 High Volume PM10 Sampler with Head
is important to point out that from the samples obtained with the traditional
gravimetric samplers it is possib omplementary analyses for the haracterization of the aerosols, the most common being lead, sulfates and nitrates.
essment of particles equal to or ss than 2.5 micrometers (PM2.5).
uous methods
addition to the traditional gravimetric methods, the Environmental Protection uous or continuous methods
quivalent to the reference method. The semi-continuous method uses attenuation
mi-continuous determination of PM10 is the ost used in the monitoring networks currently operating in the country, in which
mass concentration is obtained from the increase in the absorption of beta rays
Source: ACGIH (1989)
Itle to carry out c
cHowever, said analytical assessments are not being carried out in operation networks but in universities and research centers. There are also other types of average volume gravimetric manual samplers on the market which were principally developed for the assle 3.2.2 Semi-continuous or contin InAgency of the United States recognizes semi-contineof beta radiation. These samplers have the advantage that they can transmit information in real time or near to real time. The operation principle is described below.
a) Beta Attenuation Method
The beta attenuation method for the sem
16

due to the deposition of particles on the filter paper tape. Said beta absorption is increased in direct proportion to the mass of the substance when its quality is unalterable and a low energy ray is irradiated on said substance.
The relationship between the intensity of the beta ray that is transmitted and the mass of particles is given by the following equation:
I = Io exp(-um/Xm)
Where:
I : Intensity of Beta radiation transmitted through the filter with
Io : Intensity of Beta radiation transmitted through the clean filter um :
of particles (g/cm )
Clearin s follows:
Xm = 1/um ln(Io/I)
Where the concentration is expressed in the following way
C = S/V€Xm × 10 = (S/V)e(1/um)eln(Io/I) × 106
C : Concentration of PM (ug/m ) S : CollectiV : Volume sampled at CN (Nm )
.3 Start up, stabilization and initial calibration of equipment in situ
lection m
spects such as:
of measurement principle • sensitivity of analyzer
nt in the sampling site other equipment
particles
Mass Absorption Coefficient (cm2/g) Xm : Mass 2
g in this way, the mass is calculated a
6
310
on area (cm2) 3
3 This section presents the technical criteria that must be considered in the sef a onitoring method for some application. They must, in particular, considero
a
• Initial cost and operation costs • advantages
• possibilities of interference prese• requirements for calibration gases and • reliability • maintenance requirements
17

It is important to consider that in Mexico most of the analyzers installed and in ope t Environmental Protection Agency of the United States (EPA) provides useful references for the assessment and selection of
age during shipment • Checking of connections of tubing and electrical connections
r program and procedures
ble parts
Once the a be calibrated and checked that the instrument is operating correctly. Performance characteristics such as: response me, noise, disphase from zero and the short term span and precision must be
model 42 that uses the principle of non-dispersive infrared etection (NDIR) with the following specifications is given below:
200, 500, 1000 ppm
Lineality: +/- 1 % t zero):
Response time (0–95 %): etection limit: m
ppm per day complete scale/day
emperature: 15-30
ra ion are from America. The
automatic analyzers. It is to be recommended that in the purchase of a new analyzer EPA approval is requested and the functioning specifications guarantee terms, delivery time and test period and what happens if the analyzer received does not comply with specifications. On receiving a new analyzer, the user should carefully read the operation manual corresponding to the equipment, which should contain exact instructions concerning:
• Unpacking and verification that all the components were sent • Checking of possible dam
• Operation Principle • Installation of analyzer • Calibration of analyzer • Operation of analyze• Preventive maintenance• List of failures • List of parts and adapta• Diagram
an lyzer has been installed, it must
tirevised or measured using adequate formats. The acceptance of the analyzer must be based on the results of said performance tests. Once the analyzers have been accepted they must have a guarantee from the manufacturer to operate within said specifications for at least one year, with a maintenance and parts guarantee for three to five years. An example of the general activities for the installation of a Carbon Monoxide analyzer CO, TECOd
Range: 0-1, 2m 5, 20, 50, 100,
Noise (a 0.05 ppm RMS 1 min
Minimum d 0.00 1 ppPrecision: +/- 0.1 ppm Dephasement from zero: +/- 0.1 Span dephasement: +/- 1 % ene Operation t C
18

a) I
to the ambient air multiple connector. Connect the filter output to port 3 of the solenoid valve located in the front of the calibrator. Connect the sample line to the port of the solenoid valve marked
•
b)
The analyzer automatically goes into start mode, during this me the following will happen: the power source lights up, all the electronic evices, the detector cooler, the motor and the pump, the heater and the
tput must be zero volts.
c) s
put response of the analyzer, conduct a multi-point alibration and record the results in the corresponding calibration format as dicated in chapter 5 on Calibration.
nstallation Instructions
• Connect the filter input line
as “common”. Take care to ensure that the sample line is not polluted with dust, damp or any other foreign materials. Tubing of teflon, borosilicate or a similar tube with a 1 inch diameter is needed for all the connections. The length of the tubing must be as short as possible between connections. For the best results, the distance between the multiple connector and the analyzer must be less than 3m.
Connect the recording equipment to the output channels of the instrument located at the back.
• Unless otherwise specified, recorder signals are 0-1 VCD. Install the cable to the equipment plug. Check that the voltage is appropriate.
• The 48 model must be operated with a particle filter. The filter must be made of teflon with a capacity to retain particles of 5 to 10 micrometers.
Turning on
Turn on the switch.tidprogram begin by themselves. It takes a few minutes to stabilize and appropriate operation of the instrument must be observed:
• When the switch is turned on, the word “HELLO” appears on the instrument display, followed by “CO”. During this time (approx. 2 min.), the analog ou
• The instrument will automatically go on sample mode (run sample)
Te t calibration In order to verify the outcin
19

3.4 Operative Procedures (OPs)
loped specifically in each Air Monitoring ystem, depending on the technological characteristics and the technical quirements demanded by the instruments with which the monitoring stations,
must be found in each monitoring station: a copy of these rotocolized procedures, and manufacturer’s manuals for each piece of equipment r instrument integrated into said station. These manuals constitute the most
n operative procedure (OP) is a detailed, consistently structured document that escribes stage by stage the implicit activities of a test method or the use of an nalyzer or an activity or process; for example, data revision and report generation,
is an extremely useful tool in the practices of monitoring or boratory that are conducted in an SA, as it reduces recurrences in errors, cilitates operation tasks, maintenance and calibration and even serves for
.4.1 Preparation of Operative Procedures
up an OP. Assuming, for example, protocolized procedure for an Air Monitoring test method.
The operation procedures must be devesrecomputer center, calibration laboratories and repair and maintenance workshops were made. The followingPospecific level of information to carry out the tasks of operation, calibration and maintenance which, in aggregate and joint form, must be circumscribed in general procedures and work instructions. Special care must be taken with respect to the custody and/or safekeeping of the original documents under control procedures of documents established in the quality management system (QMS). Adaetc. OPs are documents that form part of the GQS of an organization and therefore are revised and authorized for issue by the personnel responsible for their issue, term and revision. A well prepared OPlafatraining purposes for new members of staff. 3 Fig. 3.7 shows the basic elements used to drawa
20

Fig. 3.7 Basic elements for the preparation of an OP
S elaboration of Operative pr
Test Meted rdized
OP from QM
ocedures Standa
OPERATIVE PROCEDURE
Operation Manual and
Maintenance equipment
Internal practices of
resources and laboratories
a) e of the QMC for the preparati
his document sets forth the guidelines, structure and format all the operative MC
rocedures. It specifies the coding procedures, table content in terms of validity,
t applied in the Air Monitoring Systems correspond to tandardized methods and must be used to extract the most relevant technical spects and are integrated in a structured way into the operative procedure.
th the easurement methods to determine the concentration of carbon monoxide in the
thods ust be referred to in the Reference section or Bibliography of an OP according to
Field of Application or applicability Interferences
General Procedur on of procedures.
Tprocedures of the organization must contain and forms part of the general Qpdate of issue, revisions, number of pages, among others. b) Test Method The est methods sa In the air monitoring field in Mexico, the standardized methods are NOMs (NMX) of the SEMARNAT series, for example: NOM-SEMARNAT-1993, which sets formambient air and the calibration procedures for the measurement equipment. In the absence of NOM (or NMX), standardized methods like the Reference Methods or equivalents of the EPA can be used to draw up OPs. Said memthe criteria used. Similarly, these test methods can have important aspects, such as:
The method principle
Range and Precision Detection Limits
21

Sampling Flows
c) on Manuals or Instructions
manuals or instructions r the sampling equipment, analyzers, calibrators, among others, are the primary
ource of information for drawing up operative procedures, since specific
in sections be translated into Spanish and learly included in the structure of the OP being drawn up. When a very large
e manual.
Similarly, especific instru an be adopted by the organization as instruction manuals or formats that will form
ailed, step by step description of the way in which e sampling, monitoring, calibration and maintenance are to be applied according operative practices. Similarly, these instructions are specific to the
cord d or analyzer equipment, for an OP to be drawn up the uality control area establishes the order and type of sections that must be
Acceptance Criteria
Instrument Operati In air monitoring practices, the operation and maintenancefosinstructions can be found in them for their installation, operation, maintenance, detection of failures, “troubleshooting”. Since, in most cases, said manuals are in English, it is very important that the most relevant aspects or summaries of certacamount of information is contained in the manual, organizations can opt to give references in the OP to the sections of the manual for the corresponding instrument for the execution of the activities in question; for example:
• Initialize the control sequence of the parameters described in section 7.10 the analyzer TEI model 42 operation and maintenanc
th operation and maintenance of the automatic gas analyzers contain
ctions and formats for calibration and maintenance practices whichcan integral part of the OPs as annexes or appendices. d) Operation Practices The OPs must also include a detthtocharacteristics of the sampling equipment, calibrators or analyzers and to the recording formats or check lists that are used. In the terms of quality systems, it is established that the operative procedures must include a description of the activities as they are carried out in practice. f) Structure of an OP Ac ing to the test methoq
22

included in the organization’s OPs. An example is given below of the typical structure of an OP:
1. Scope and Applicability 2. Method Summary
echnician materials
ethod
sample and analysis
dware (used to manage the results and data reports)
elow an example is given of the thematic structure (index) of an Operative rocedure from CARB for BENDIX MODEL 8501-5CA CARBON MONOXIDE
3. Definitions 4. Health and safety 5. Precautions 6. Interferences 7. Profile of the T8. Equipment and9. Instrument or calibration m10. Sample collection 11. Management and preservation of 12. Failure detection 13. Acquisition of data, calculations and data revision 14. Software and Har15. Management of data and recordings
BPANALYZER (CO).
23

B.1 – PROCEDURE FOR STATION OPERATORS
Page Revision Date
B.1.0 GENERAL INFORMATION 2 0 08-01-78 B.1.0.1 Theory B.1.0.2 Analytical Cycle B.1.0.3 Precautions B.1.1 INSTALLATION PROCEDURES 2 0 08-01-78 B.1.1.1 Physical Inspections B.1.1.2 Initial Turn On B.1.1.3 Analyzer Alignment B.1.1.4 Calibration B.1.2 SERVICE (ROUTINE REVISIONS) 4 1 02-01-84 B.1.2.1 General Information B.1.2.2 Daily Revisions B.1.2.3 Weekly Revisions B.1.2.4 Monthly Revisions B.1.2.5 Six-monthly Revisions B.1.2.6 Annual Revisions B.1.3 MAINTENANCE PROCEDURES 9 0 08-01-78 B.1.3.1 Input line Filter B.1.3.2 Gas cartridge (filter) B.1.3.3 Sampling Pump B.1.3.4 Analyzer Cleaning B.1.3.5 Analyzer Alignment B.1.4 FAILURE GUIDE (Trouble shooting) 2 0 08-01-78 B.1.4.1.General information B.1.4.2 Electronic failures B.1.4.3 Optic failures B.1.4.4 Flow failures B.1.4.5 Failures in peripheral equipment B.2. ACCEPTANCE CRITERIA 3 0 08-01-78 B.2.0. Test procedures B.2.0.1 General information B.2.0.2 Physical inspections B.2.0.3 Operation tests B.2.0.4 Final revision B.3. CALIBRATION PROCEDURES 3 1 08-01-78 B.3.0 Calibration procedure B.3.0.1 Apparatus B.3.0.2 Statistical recordings Source: CARB Air Monitoring Quality Assurance Volume II Standard Operating Procedures
24

4. PREVENTIVE AND CORRECTIVE MAINTENANCE PROGRAMS
Those responsible in the state or local entities for the operation of an SMA must develop a Preventive Maintenance Program (PMP) with the consistency necessary to maintain the equipage of its subsystems (networks) in operation, service and in order to prevent repairs and/or extra costly acquisitions and/or the rapid deterioration of their equipment. The PMP is an extension of the Quality control program that is normally developed within the daily, weekly, monthly, quarterly, six-monthly and annual routines. EPA, (1998) Preventive Maintenance (PM) of the system is the responsibility of the station operators, support laboratories and personnel from the computer center under a function and responsibilities assignation scheme where its success will substantially depend on the appropriate supervision of the work of the PM and the ongoing verification of the program. In this way, the personal supervisor has the responsibility to ensure that preventive maintenance is complied with opportunely. PM is a dynamic process and therefore the corresponding operative procedures must be updated in such situations as: acquisition of new models or types of instruments; changes in test methods; changes in the data acquisition system (DAS) or in computer programs, among others. All the components of the monitoring stations that include: booths, air conditioning, analyzers, instruments and other support equipment must have a log and/or files in which a record is kept of all the activities of the PM and repairs to an instrument in particular. Said records must always remain next to the instrument wherever it is and are indispensable in giving evidence of the effective application of the programs. In general, Preventive Maintenance programs must incorporate documented records of the routine activities of the calibrations, inspections and corrective maintenance tasks carried out due to failures or not programmed events of the analyzers, instruments and peripheral monitoring equipment. The preventive maintenance programs include such elements as:
• Equipment inventory by organization or station. • Lists of parts and spares per piece of equipment including suppliers. • Frequency of inspection/maintenance per piece of equipment. • Calibration Programs.
25

• Equipment substitution program. • Sites and persons responsible for equipment repair. • Service Contracts. • Monthly forms (records) of the test, inspection and maintenance
activities and forms for receipt of fuel, spares and equipment. • Requisitions and/or purchase orders.
4.1 Preventive Maintenance Preventive maintenance can be defined as the capacity of an organization to monitor, control and record the operation and environmental conditions required by specifications, methods and relevant procedures in proportion to their influence on the quality of the results. While corrective maintenance is related to the response capacity of the SMA to respond to failures, breakdowns or damages such as: total damage to an analyzer from dropping or an electric charge, theft, etc. in order to re-establish in the shortest period of time possible the generation of data and/or in general the operation conditions prevailing before the event. Based on the above, the preventive maintenance program (PMP) must include both the central installations of the SMA such as: the computer center, the standard transfer laboratory, maintenance and analyzer calibration workshop with their respective areas for the storage of parts, consumables and equipment and instruments; and the remote installations that consist mainly of the monitoring stations with their respective monitoring equipage, calibration and peripheral equipment, energy sources, lighting and environmental conditions (temperature and relative humidity). Said installations must be conceived and maintained is such a way that they facilitate the correct execution of the tests and/or calibration, transmission and store of information, as well as data and report processing in their different modalities. Therefore the PMP must be designed to ensure that the environmental conditions or other events do not invalidate the results or adversely affect the required quality of any of the elements of the process of measuring air pollutants concentrations and other meteorological parameters. Similarly, special attention must be paid to the aspects related to dusts, electromagnetic disturbances, radiation, humidity, electrical supply, temperatures, and vibrations, to the extent that this is appropriate for the technical activities
26

concerned. Measurements and/or calibrations must be suspended when environmental conditions compromise the results of the same. Evidently, for the development of good preventive maintenance practices, it is necessary that the SMAs have installations that are large enough for there to be an effective separation between the work areas, in such a way that there are no incompatible activities or some that affect the other work areas (e.g. a sudden rise in room temperature in a computer area or monitoring station). The following section describes the principal practices and elements that take part in a preventive maintenance program of an air monitoring system. 4.2 General Conservation of Properties With respect to the central installations of the SMAs and monitoring stations, general maintenance practices of the properties must be principally aimed at the prevention of deterioration and enhancing the image according to the importance of their functions. The general administration of the agencies must therefore arrange for general programs for Conservation Maintenance, including the following activities:
• Painting inside and out • Waterproofing • Wiring and general electrical installations • Hydraulic and sanitary installations • Gardening, where necessary • General Ventilation
Under this focus, as well as efficient supervision, communication and diagnosis practices, the determining factors to efficaciously respond to this type of contingencies include:
• Availability of sufficient Stock of Parts and Spares • Availability of Samplers, analyzers and other substitute key pieces of
equipment. • Trained personnel prepared to work overtime. • Where necessary, the availability of competent, committed suppliers
of external services.
27

4.3 Computer Center Of the central installations of the SMAs, the computer center is doubtlessly the essential area that must be included in the Preventive Maintenance Program of the organization, since this area concentrates, administers and disseminates information on air quality and the state of operation of the networks and measuring stations. In order to guarantee an ongoing operation and to protect both the physical integrity of the data bases and the equipment and installation in general, the PMP must include:
Table 4.1 Type and frequency of PMP in the Central Installations of an SMA
PM Activity Minimum Frequency
1 Revision and cleaning of Computer Equipment Four monthly
2 Revision and check of leaks and controls of the Air Conditioning system Six monthly
3 Start up test of Emergency Plant Two weekly
4 Revision and reloading of Extinguishers, if necessary Yearly
5 Functioning tests of NO-BREAKS Quarterly
6 Revision of the state of Connections, physical earths and Lighting Six monthly
7 Revision of most important Electrical Installations Yearly
8 Revision of roofs, walls, windows, etc. for the detection of damp, dripping, dust accumulation, etc.
Yearly
4.4 Software Protection of the integrity of the information that is processed in the computer Centers calls for appropriate control practices of the Software used, from this approach, the routine practices and revisions recommended are aimed at: Use of Original Programs and hiring of the corresponding updating service. In the specific case of anti-virus programs, updates must be with a minimum frequency of one week or less when a high risks virus is known to have spread through the media or other sources. Similarly, the persons responsible for the computer center systems area must draw up a program of backups with the necessary frequency to guarantee integrity of all
28

the information generated by the SMA. Said frequency can vary substantially according to the type and capacity of the memory of the equipment (analyzers, DAS and/or computers of each SMA). For those calculation sheets developed by personnel of the SMA, for purposes of the internal processing of information such as that required for the transformation of concentration values into air quality Indicators, they must be subject to systematic verifications for their validation so as to ensure that the calculations are made correctly. Said validations must be documented using pertinent recordings. It is also very important that accurate instructions are given in writing with respect to the exclusive use of the computers used for processing the information on air quality, and their use for other functions must not be allowed, nor the installation of packets that are not needed for said process. Finally, in the computer center, the accesses to electronic information, apart from the access key which should only be known by authorized persons, must be controlled. 4.5 Inventory of Equipment and Parts Lists The persons responsible for the PMP must design and keep updated a detailed inventory of all the equipment, parts, consumables and principal accessories, either of their property or assigned to them by the SMA and through which the amount, location and operative state can be controlled as well as their situation in terms of the personnel responsible for keeping them and for their good use. One fundamental aspect of an inventory is the correct identification of the equipment using a logical coding design, the assignation of a Sole Inventory No. that represents something like a kind of “Personal” Identity Card for the piece of equipment in question. The identification codes must be securely stuck on or attached to the component on the inventory in a visible place. The idea is to have a coded system that will substantially facilitate identification and location and, in general, preventive maintenance tasks. At a second level, but probably of greater importance, is the availability in the PMP of updated Lists of Parts that must be generated provisionally before receiving newly acquired equipment after consultation with the supplier so as to have batches of consumables and critical spares when it arrives. Subsequently, said lists of parts are consolidated on the basis of the revision and understanding of the
29

Operation Manual of the instruments and formats are designed containing at least, but not limited to:
• Mark, model and description of the larger instrument to which they belong
• Part number and supplier data • Where necessary, specifications or type • Unit Price at the last acquisition • Average delivery time • Supplier availability (in stock or must be ordered) • Desirable amount in stock • Amount currently in stock • Status in terms of importance • Revision date
At present, the use of computers and calculation sheets permits the design of iterative databases for managing Inventories and lists of parts that can even give preventive warnings or alarms when a critical number of the stock of a certain consumable, spare or component is reached. As in many cases of the practice of Quality Assurance, the design of these computerized formats can require time and many hours of work the first time, but once they have been drawn up they become powerful tools that facilitate the PCM Programs and make it possible to document and trace from updated print outs and summaries by station, type of analyzer, etc. 4.6 Stores of Spares and Pieces of Equipment The central installations of the SMA must have specific areas destined to the storage of Parts (consumables and spares) and another store specifically for equipment (samplers, analyzers and calibrators, etc.) which should preferably be physically separated and have access restricted to authorized personnel only. It is advisable to assign the function of store manager to some of the persons which is to follow and record all the operative instructions in terms of the control of entries and exits under a scheme of signatures of authorization and receipt. Said person is normally directly responsible for maintaining the equipment and lists of parts up to date and to begin the requisition process through the generation of notice forms. In both cases said stores must observe “Good Work Practices” with respect to order and cleaning. In each spares or equipment store, the components should be well identified and placed in cabinets or drawers in such a way as to facilitate their
30

location and counting. Similarly, their storage place should minimize the possibility of their falling or breaking or being damaged in any other way and so there must also be concrete instructions of the safety and handling requirements, packaging, and transportation of those components if so required. Figures 4.2 and 4.3 show the storage of equipment not being used and spare parts for functioning equipment in the SIMA of Monterrey, where the limitations of space can be observed and lack of satisfactory storage practices due to lack of human resources. Said situation is common in most of the networks operating in Mexico.
Figure 4.1 Storage of analyzers out of operation
31

Figure 4.2 Spares Storage Area
4.7 Monitoring Stations Fixed and mobile monitoring stations represent the remote infrastructure of the SMAs and they therefore need special preventive maintenance practices because they are operated most of the time in the absence of personnel. In the case of booths or buildings, the PMP must include activities aimed at guaranteeing the continuity of operation of external and internal monitoring equipment. The station maintenance Program must include activities of revision and cleaning as shown in table 4.2.
32

Table 4.2 Type and frequency of PMP in Monitoring Station Booths
ACTIVITY FREQUENCY
Cleaning of the inside of the booth (floor, furniture, walls, etc.) Monthly
General inspection of the booth Six monthly
Revision of Air Conditioning Four monthly
Change of Air Conditioning filter Yearly
Grass cutting, tree pruning, among others When necessary
Cleaning and repair of roof Six monthly
General cleaning Six monthly
Garbage removal Each visit
Revision of electrical system Quarterly
Revision of telephone installations Quarterly
Most of the monitoring booths must be operated under temperature ranges specified in order to guarantee the appropriate functioning of the analyzers. Said range is normally from 20° to 25° C. The person responsible for preparing the PMP should pay special attention to the air conditioning system in order to obtain valid air quality data.
Figure 4.3 The A/C system is a priority component in the PMP
During inspections, the operator must make a routine check-up to ensure appropriate work conditions for the equipment, first by making a visual inspection
33

of the equipment to ensure that they are functioning and second, by continually checking that the temperature is within the operation range, that is the temperature in the booth must be in the 20° to 25° C range. As indicated in the table, service must be give to the air conditioning system every four months by a certified technician, which will help to prevent damage to the hardware and loss of monitoring data. Another important aspect consists in the adequate distribution of the racks in the booth, as well as maintaining the work area tidy and free of objects with the purpose of preventing accidents. As well as the above, the external components of the booth such as the sample, high volume samplers, meteorological instruments and the pylon, the entrance door, the wiring and the electrical installations and other components judged necessary must be checked with respect to their coverings, corrosion and exposure and general state. To this end, sufficient check lists and service order forms must be available to guarantee the respective corrective actions. 4.7.1 Station Log Each station must have a station log to record the chronology of events that take place there. The log is of extreme importance for documenting the problems and their solutions. It is recommended that these logs contain notes of a more narrative type than details of a technical type since the technical aspects must be recorded in the corresponding log for each instrument. The aspect to be covered in a monitoring station log is as follows:
• Record of visits (date, time and name and signature of personnel visiting the site).
• Brief description of climate (e.g. clear, cloudy, rain, etc.).
• Brief description of site surroundings. Any change that may affect the data, for example, if a car is nearby that could explain high values of NOx.
• Any unusual noise, vibrations or any other strange event.
• Description of the purpose of the visit to the site (e.g. calibration of instruments, repair of an analyzer, etc.).
• Detailed information on the instruments or peripheral equipment that need maintenance or present failures.
34

4.7.2 Inspection (Documents)
During each station inspection (three times a week is recommended), the technician must document all the activities in the log and fill out the check lists, like those included in the example, which can be multi-paged forms including questions that need the technician’s answer and guarantee that the technician makes a general revision of the most important concepts and/or aspects of the operation of the equipment and that are relevant to data validation and, in general, to quality objectives. The station log is perhaps the most important record available on the operations that are carried out, and therefore it is essential that the information is clear, legible and detailed. Some of the guidelines recommended to ensure that the log’s records are useful in any revision are described below.
1. The log should not be removed from the site. 2. The pages of the log should not be easy to remove. If possible they must be
numbered. Carbon paper copies are recommended so that the original page stays in the notebook and the copies can be taken out.
3. All the data should be written in ink and in printed letters to ensure they are legible.
4. During each inspection, the date, time of arrival and departure of the technician should be recorded.
5. The date must be written at the top of each new page. 6. The events must be described in as much detail as possible to facilitate their
interpretation by third parties, since any information not recorded as it should be can be lost.
7. If a channel goes out of operation for any reason, record the exact time it went out and on and explain the reason why it happened.
8. Record the exact time of the start and finish of manual calibrations. Note if the calibration results were within the established control limits.
9. Describe all the routine or not programmed operations of maintenance, failures, repairs and substitution of equipment, noting down the exact time of beginning or ending the activity.
10. If necessary, record the time and date on which filters are placed and removed from the TSP or PST ó PM10 sampler. Also include the identification number of the filter and the sampler, and the flow time measured at the end of the run.
35

11. Record observations of the weather and other environmental conditions. Include any abnormal condition; for example, dust clouds, significant smog, unusual smells, strong rainfall, heavy winds, heavy traffic, etc.
Tables 4.3, 4.4, 4.5 and 4.6 respectively, below show the operator’s check list forms for:
1. Temperature sensors. 2. Wind velocity. 3. O3 analyzers. 4. SO2 analyzers
36

Tabla 4.3 OPERATOR (Check List)
TEMPERATURES
OPERATOR_______________SING________________MONTH______________
DATE
TEMPERATURE
I. Outside Temperature
A. ¿Does the hardcopy temperature agree with current conditions?
II. Inside Temperature
A. ¿Does the hardcopy temperature agree with the current inside conditions?
B. ¿is the inside temperature 23ºC to 26ºC on the Max/Min thermometer?
C. ¿is the air conditioner/ heater cycling properly?
1. ¿has the air conditioner filter been cleaned is the last 30 days?
COMMENTS If some part of the system is not operating correctly, please comment in the comments section. Give times and dates.
Please put a yes or no the blanks unless a specific question in asked
37

Table 4.4 OPERATOR (Check List)
HORIZONLTAL WIND DIRECTION
OPERATOR_______________SIGN________________MONTH______________ Please put a yes or no the blanks unless a specific question in asked
DATE
HORIZONTAL WIND DIRECTION
I. ¿Does the hardcopy temperature agree with current conditions?
II. Sensor and vane operating
A. ¿is the vane bent or damaged?
B. ¿is the van turning freely?
C. ¿are the bearings okay?
COMMENTS If some part of the system is not operating correctly, please comment in the comments section. Give times and dates
38

Table 4.5 OZONE ANALYZER
OPERATOR_______________SIGN________________MONTH______________ Please put a yes or no the blanks unless a specific question in asked
DATE
OZONE ANALYZER (DASIBI 1003-RS)
Sample Flow?___________ Correct Flow ______________
*May need to tap on ratometer to get correct flow
A. ¿ sample pump switch on? II. Calibtation System A. Pump and ozone switch?
B. Mode Switch in (auto) remote?
C. test calibtation air flow? Correct flow_________ * May need to tap on ratometer to get correct flow
D. adjustment setting O3? Proper setting ________________
III. last O3 sample inlet filter change
DASIBI 5008 CALIBRATOR I.¿Display lit? II. status display and control menu showing proper setup?
III. fan operating? COMMENTS If some part of the system is not operating correctly, please comment in the comments section. Give times and dates
39

TABLE 4.6
Lista de Revisión del operador ANALYZER SO2
OPERATOR_______________SIGN________________MONTH______________
DATE
THERMO ELECTRÓN 43A ANALYZER SO2
Sample Flow?___________ Correct Flow ______________
II. VACUUM GAUGE? ________ Correct reading?_________
III. Test panel switches
IV. ¿last SO2 sample inlet filter change ? COMMENTS If some part of the system is not operating correctly, please comment in the comments section. Give times and dates
Please put a yes or no the blanks unless a specific question in asked
40

4.8 Preventive Maintenance of Analyzers and Instruments Due to the enormous amount of equipment that can potentially be used in the SMA, in this section it would not be possible to give specific guidelines for the maintenance of each type of equipment in particular. However, it is important to stress that the operative procedures for the equipment must include basic aspects of preventive maintenance based on the operation manuals of each analyzer or instrument in question and on the experience of the personnel that operate, calibrate and give maintenance to the equipment. When introducing an Integral Preventive Maintenance Program all must be done to affect data quality and continuity of the operation of equipment and instruments as little as possible. It must also be taken into account that both the equipment and its respective parts and accessories have a determined useful life which can vary in terms of effective operation time, location and season; for example, more protection filters used by the analyzers are changed in the dry season than in the rainy season). Within the basic quality control schemes, the best way to document that the preventive maintenance tasks are programmed, executed and recorded is, without doubt, the maintenance and calibration log of the equipment. The main characteristics these recording instruments must comply with are given below. Equipment Logs
Each support instrument and piece of equipment (except for the racks) must have a record log. The log should preferably be a folder or file containing pre-established forms, for example, for calibrations and maintenance. Dates and other data that can be easily identified for purposes of traceability must always be recorded in the log. A log must contain the repair and calibration history of the particular instrument. For each calibration, maintenance, and repair activity or change of site detailed notes must be recorded in the instrument log. The log contains the report of multi-point calibrations, a preventive maintenance sheet and acceptable test information. If an instrument breaks down and it is decided to transport it to another site, the instrument must be accompanied by its log. The log can be reviewed by the personnel in order to identify possible causes of the break down of the instrument.
41

Also if the instrument is send to the manufacturer or other external supplier, the log could be very useful for purposes of interpretation and diagnosis of the breakdown or failure.
Preventive Maintenance Practices
a) Automatic Gas Analyzers ( SO2, CO, O3 and NOx)
Table 4.7 presents an example of the specific Maintenance Program for a Bendix Model 8501 CO analyzer and it is important to stress the respective Operative Procedures must make reference to the Routine Checks, Maintenance Procedures and Trouble Shooting Guide, the latter being an essential tool to be found in analyzer operation manuals that should be well translated and included in the operative procedures.
Table 4.7 Bendix Model 8501-5CA CO Analyzer Maintenance Program
Activity Daily Weekly Monthly Three Monthly Yearly
Sampling Flow X Graph Plotters Tracers X Zero check X Span check X Pump pressure X Change input filter X 1 Change gas cartridge X1 Quality Control Sheet X X Cleaning of Rotameters As required CO2 Interference test X H20 interference test X 1 MAY BE NEEDED EARLIER AT CERTAIN TIMES OR UNDER CERTAIN CONDITIONS REFERENCE 2 CARB In general, maintenance of the instrument analysis equipment involves activities of cleaning, lubrication, reconditioning of parts that can get covered in dust or are subject to damp and a change of protection devices like filters and elements to remove interference or damp (scrubbers). Furthermore, not programmed maintenance activities arising from abnormal functioning of the analyzers which are identified through programmed revision routines or the failure indicators of the equipment must be attended to according to the instructions in the instrument operation and maintenance manuals.
42

It is vitally important to bear in mind that multi-point calibrations must always be carried out after performing corrective maintenance activities that might have an influence on changes in analyzer response. Taking as an example an automatic SO2 analyzer with a pulsing fluorescence detection principle, the typical preventive maintenance activities that must be performed according to the respective operation instructions would be as follows:
• Change of input filter once a month or earlier if problems are identified through the failure guide.
• Cleaning of the ventilator filter once a year. Use warm water to clean the filter and then apply the oil cover spray.
• Replacement of the sample taking line once a year or more frequently if there are signs of degradation.
• Inspect the capillary tube every six months and check to see if there is any dust/damp, if this is the case, rinse and clean the capillary with warm water, allow it to dry and put it back. Also change the “O” ring each time the capillary is checked.
• Change of the element to remove hydrocarbons (scrubber) once a year or more often when the failure manual so indicates.
• Test of leak detection, conduct a test in order to detect leaks. To do so, seal off the input line and observe the reading on the rotameter. If some reading is recorded of over zero this is a sign of leaks in the system. In order to located leaks, see section 5.3.1 of the manufacturer’s Manual.
• Leak check, check the diaphragm of the sampling pump, if the vacuum recorded during the leak test is less than 10” Hg and there are no leaks in the system then replace the pump diaphragm.
b) Automatic PM10 Samplers In the case of automatic Beta Attenuation Samplers, which are used in several monitoring networks in Mexico, such as Monterrey, Toluca and Guadalajara, the routine checks and preventive maintenance activities included in the Standard Operative Procedure (SOP) of CARB corresponding to a BAM-1020 model are given below:
43

Routine checks General information
Carry out the following revisions of BAM – 1020 with the specified periodicity. Record all the related information in the Quality Control Monthly Maintenance check list.
Daily:
Revise the data logger values of the station for the correct operation of the BAM- 1020.
Weekly: Revise the filter (tape) of the BAM-1020 and replace when necessary. One roll of filter is 22 m. long and should last at least 60 days. Every fifteen days: .
Verify input flow to corroborate a rate of 16.7 lpm (+/- 4 %). Remove PM10 input only during flow measurement.
Check for leaks. If the value observed on the instrument display is less than
1.0 lpm comply with the manufacturer’s specification. The fifteen day verification of the flow can be done while the BAM 1020 is in normal operation mode. Remove FMR PM10 input only. Place either the masic flow calibrator or the volumetric flow calibrator and record the volumetric flow on the quality control monthly record form.
Monthly
Fill out the monthly quality control record form for the BAM –1020 ;
Rigorously clean the PM10 FMR entry; 3) Unload data from the BAM –1020 Data Logger and printed recordings (graph plotter) and fill out the form.
Six monthly
Check external ambient temperature; internal pressure; check for leaks and volumetric flow.
44

Maintenance
General Information: Normal maintenance of the BAM-1020 means keeping the equipment’s central unit free from dust and keeping the entrance clean.
The PM10 input head must be removed from the input tube, dismantled and
cleaned as shown in figure 4.5. The entrance must be rigorously cleaned each month with a damp, fluff-free cloth. Check that the O-Rings are in a good state and put them back in place during the reinstallation. If necessary, replace them. With respect to the detector, another source that was consulted specifies that in general detectors should not be disturbed or removed, however it is observed that if their surface has been polluted it must be cleaned with a special substance provided by the manufacturers. This action is delicate and consultation with the manufacturer before carrying it out is recommended.
Figure 4.4 Revision and cleaning of a PM10 head
c) Meteorological Instruments
The preventive maintenance that must be given to the equipment that measure wind direction and velocity, and the solar radiation, temperature and humidity sensors consist basically in cleaning, lubrication, substitution of damaged parts of pieces that are usually covered in dust. Similarly, not programmed maintenance activities may be needed when abnormal functioning of some instrument is observed upon physical inspection or the
45

presence of illogical readings displayed by the instruments. In these cases, the specific instructions in the equipment manuals should be followed or, if necessary, consult the manufacturers directly. As in the case of the analyzers, when a meteorological instrument is submitted to major maintenance, the calibration must be checked after the repair. All maintenance activities must be recorded in the corresponding instrument log.
Figure 4.5 Meteorological instruments in the Guadalajara monitoring station
46

5. EQUIPMENT AND INSTRUMENT CALIBRATION PROGRAMS 5.1 General Aspects Air Monitoring Systems (SMAs) require consistent Calibration Programs for all the sampling equipment, monitors and sensors. All the data and calculations involved in these calibration activities must be recorded in a calibration log. An individual log is recommended for each apparatus or sampler used in the program. Calibration of an analyzer consists of establishing the quantitative relationship between the real concentration of the pollutant (input in ppm, ppb, ug/m3, etc.) and analyzer response (reading on the record card, output in volts or digital output). In automatic monitoring practices, it must be taken into account that the response of most analyzers has a tendency to change with time (displacement), hence the calibration must be updated (or the analyzer response adjusted) periodically to maintain a high degree of exactness. Each analyzer must be calibrated by closely following the operation conditions, according to procedures based on both the specific instructions in the equipment operation manual and the general guidelines provided by the reference standards used which normally contain detailed calibration criteria. A fundamental concept that must be considered in calibration programs is that of Traceability, which, according to NMX–Z- 055:1996 INMC, is defined as “Property of the result of a measurement or pattern value that can be related to national or international references through an interrupted comparison chain with all uncertainties determined”. In this respect, there is really no national reference laboratory in Mexico that has primary calibrators to provide certification and calibration services of the transfer standards used by the monitoring networks operating in the country. CENAM has currently made certain progress with respect to certified gases; however, there is no availability of primary and secondary calibrators for the certification of UV photometers for O3 analyzers and primary calibrator meters and such flows as electronic bubble meters and orifice gauges used in PST and PM10 High Volume Samplers. In general, it can be stated that in order to draw up a National Air Monitoring Program it will be essential in the middle term to have a
47

National Standard Transfer Reference Laboratory to offer primary calibration services to the SMAs operating in the country. In this context, CENICA could comply with this important function in the middle term as it has certain infrastructure for this purpose and its flow chart shows a specific Standard Transfer Laboratories department. So then, the SMAs could need other materials, patterns or certified reference instruments with respect to mass, temperature and volume in order to document traceability, in terms of complexity and the specific types of test methods they are carrying out or intend to carry out in the short and middle term. 5.2 Standard transfer laboratory With the exception of the Air Monitoring System (SIMAT) of the Metropolitan Zone of Mexico City, the other automatic monitoring networks in the country are relatively small, including the 4 to 7 fixed monitoring stations and in certain cases 1 to 2 mobile stations. The latter therefore do not have a Standards Transfer Laboratory properly speaking. In the case of SIMAT, whose scope involves the operation of 32 monitoring stations, there is a specific area for this purpose. Due to its importance in the SMA Calibration Programs, a description is given below of the characteristics and activities carried out in these laboratories. In this area, calibrations and performance tests and cleaning are mainly carried out of the samplers, analyzers, dynamic calibrators and reference instruments and meteorological sensors. In general, repairs or changes of parts that are done in this area are of major failures that could not be mended in the monitoring stations, therefore it is common to include different areas in the standards laboratory: meteorological, electrical, workshops, tests, store, etc. It is usual in these areas to have several work tables and instrument racks. One table and one rack are devoted to Ozone traceability. The other racks are used for repairs and calibrations. For practical reasons, it is highly convenient for them to be near the store of spares, consumables and analyzers and other peripheral equipment. Said area must have a multiple connector for sample taking as shown in figure 5.1 which must be mounted near a work bench. If possible, sample taking must also be able to be induced from outside in order to corroborate the behavior of the analyzers that are being tested.
48

Figure 5.1 Multiple connectors inside a standard transfer laboratory
There must be forced or natural ventilation in zones where an excess of calibration gases are vented. It is recommended that the pump or extractor is located outside to eliminate noise in the work area. Each work bench must have an instrument rack beside it. The instrument rack must be equipped with sliding supports or rails to facilitate instrument mounting and dismounting. If the instruments need to be repaired and then calibrated, this must be done on the bench or within the rack. The Analyzers must be turned on, allowed to stabilize and then calibrated by a calibration unit. The instruments that are going to be tested are connected to the multiple sample connector allowing induction of ambient air in the same way in which they operate in a monitoring station. The analog voltage output of the analyzer is connected to the Data Acquisition System (DAS) and the card graph plotter to test its operation. If intermittent problems are presented, these can be observed on the graph plotter. The analyzer must be operated for several days to see if the anomaly or problem continues. If that happens, the problem must be recorded on the card. If the instrument has a DAS and a calibrator, span and zero night checks can be performed to see how the analyzer behaves with known concentrations.
49

In the operation of Air Monitoring Systems, the main traceable chains that must be demonstrated are related to:
The use of certified transfer standards for calibration or verification of flows of PM10 and PM2.5 from dynamic calibrators and automatic and manual samplers.
The use of certified photometers for the calibration of ozone analyzers.
The use of certified calibration gases at precision levels with the use of
pattern calibration gases.
The calibration of air and gas flows and test concentrations of ozone generated by the dynamic calibrators also constitute a very important aspect in this field of study.
Routine calibrations of analyzers and samplers.
Calibrations of meteorological instruments and other sensors and
instruments used in air quality monitoring practices. The following sections describe in a general way some of the aspects related to said certification and calibration activities for purposes of traceability. It is important to mention that said examples mainly represent cases taken from the bibliographic sources referred to so that readers interested in the complete documents or detailed procedures can consult them. 5.3 Certification of Transfer Standards 5.3.1 Certification of flow calibrators Bubble Meters The exactness of flow measurements is critical in many calibration procedures. Flow and volume measurement instruments must be certified or verified at appropriate times (each 3 to 6 months) against standard patterns of reference traceable to NIST or CENAM.
50

Figure 5.2 shows a kit of flow meters used by most of the SMAs and known as electronic or optic bubble meters. Said calibrators are considered to be primary patterns, due to the high precision and reproducibility of their functioning principle, which is based on the generation of a film of soap whose upward movement induced by the air flow being measured is recorded by optic sensors located at the bottom and top of the bottle. These signals are recorded by the instrument’s integrated chronometer and the microprocessor calculates the flow using the corresponding volume data and time. In practice, a series of repetitions of the readings of a determined flow are carried out and used for calculating or verifying average value.
Figure 5.2 Kit for the calibration of flow meters in monitoring stations
In spite of the high reliability of these calibrators, the veracity of their readings must be corroborated to demonstrate traceability. Failures such as: misalignment of the sensors or leaks can cause important errors in the readings. Commonly, the certification of these calibrators is carried out in reference or calibration laboratories. Figure 5.3 shows a Brooks primary positive displacement calibrator used for the certification or verification of these transfer standards, owned by the Reference Standards laboratory, CARB.
51

Figure 5.3 BROOKS primary calibrator referred to for flow calibrators
This equipment has three quartz tubes with three very different high precision volumes. Its functioning principle is very similar to that described above, with the exception that the displacement element is a “friction free” displacement. The calibration test is carried out by connecting both calibrators in series and comparisons are made of the flows recorded by each instrument; the readings are corrected for pressure and temperature conditions and are submitted to statistical treatment to determine if the test equipment complies with acceptance levels. Calibrations are made at 5 points at 100, 75, 50, 25 and 12.5% of the transfer standard scale. Three readings are made for each point and the related standard deviation (RSD) is calculated. The acceptance criteria of a verification are that the correlation coefficient is 0.999 or more; and that the slope is within 5% of the expected value and less than 1%. Certification consists of performing the protocol for 4 different days with the purpose of corroborating instrument stability. Orifice gauges The calibration kits used to quantify the air flow of the high volume samplers are also transfer standards that need to be calibrated every year. There are two types of orifice units, those with plates and those with a switch for flow variation. Calibration of these units is performed through the use of a root or cycloid positive displacement meter (PDM), which is a secondary reference pattern and its functioning principle is based on the measurement of the air volume coming in and
52

going out, through the internal cavities in its rotational elements (lobes). Calibration consists of:
1. Coupling the orifice unit to be calibrated to the positive displacement meter as shown in figure 5.4.
2. Connecting the tubing of the water manometers and the mercury manometer to the orifice unit and the PDM, respectively and making adjustments to level the zero in both cases.
3. Checking the support level of the positive displacement meter and adjusting the leveling screws if necessary.
4. Installing plate number 18 between the orifice unit and the PDM. 5. Turning on the sampler motor and allowing its operation for 5 min to
stabilize it. 6. Recording the data of the orifice number and the PDM number on the
calibration form and also the date and time. 7. Recording the temperature and the barometric pressure. 8. Recording the readings of Hg from the barometer and the manometer and
H20 9. Using an APRA chronometer to measure the time in minutes and
hundredths of exactly 10 revolutions of the PDM counter or for 100 ft3 of air through the meter.
10. Recording the data and time measured in the corresponding columns on the form.
11. Repeating steps 3 to 11 for plates 13, 10, 7 and 5 Once calibration data have been obtained, a graph is then plotted for the flow measured against total pressure by orifice unit and the corresponding calibration curve of the orifice unit is obtained. One example of the curve can be observed in Fig. 5.5.
53

Figure 5.4 General Arrangement of Orifice gauges
Source: CARB (1997)
Figure 5.5 Calibration curve for orifice units
0.0 0.5 1.0 1.5 2.0 2.5 3.0 3.5 4.0 4.5 5.0 5.5 6.0 6.5 7.0
Caída de presión en el motor (inH2O)
0
10
20
30
40
50
60
70
80
90
Fluj
o R
eal C
orre
g ido
(ft3
/min
)
CALIBRACION INICIAL :
PUNTO 1
m =b =r =
8.616916.42640.9967
CURVA DE CALIBRACIÓN TIPO PARA MUESTREADORES DE ALTOS VOLUMENES
54

5.3.2 Photometers Figures 5.6 and 5.7 show a typical arrangement for the certification or verification of O3 analyzers that are used as transfer standards that include: a reference UV photometer (local primary standard); the O3 analyzer being tested; the O3 generator; the chamber of multiple distribution connector of the SRP control panel and the computer to store data.
Figure 5.6 Certification against reference standard photometer
Fig. 5.7 schematically shows the interconnection of the components to make the comparisons in ozone readings recorded between the transfer standard and the reference primary photometer. The calibration frequency recommended for local primary standards is 1 year, while that corresponding to transfer standards is every 3 months. The acceptance criteria recommended by the EPA are based on differences in +/- 4 % or +/- 4 ppm (whichever is greater) and a relative standard deviation of 6 3.7% slopes.
55

Figure 5.7 Typical arrangement for calibration of an O3 transfer standard
CONTROLADOR
SRP #4
CONTROLADOR DE SRP
GENERADOR DE OZONO
ANALIZADOR DE OZONO
CÁM ARA DE DISTRIBUCIÓN
NOTA: Las líneas rojas indican la red de controles. Las líneas verdes indican los conductos del gas ozono
Source; CARB (1997) 5.4 Calibration gases In general, environmental monitoring instruments must be calibrated through sampling and the analysis of gases of known concentrations in a determined air pollutant. All the test concentrations (not zero) must be derived from local or work standards (e.g. compressed gas cylinders or permeation tubes) that are certified with traceability to a national or international primary standard (e.g. CENAM; NIST, among others). In the United States, in 40 CFR parts 50 and 58, “Traceable” is defined: as that local standard that has been compared and certified, either directly or through no more than one intermediate standard, against a primary standard like a standard reference material (SRM) of the National Institute Standard and Technology (NIST) or a certified reference material (CRM) approved by either EPA or NIST.. Normally, the work standard must be certified directly as an SRM or CRM, with an intermediate standard only when necessary. The direct use of a CRM is acceptable, but the direct use of an NIST SRM as work standard is not recommendable due to its limited availability and high cost. The “Red Book” establishes as minimum that the certification procedure for a work standard must cover the following aspects:
56

• Establish the concentration of the work standard relative to the primary standard
• Certify that the primary standard (and therefore the work standard) is traceable to an NIST primary standard
• Include a stability test of the work standard of many days (expiry)
• Specify a recertification interval for the work standard In the United States certification of the work standard can be established by the manufacturer or by the standard user. In the case of zero concentration test gases, they are considered as valid standards and do not need to be traceable to a primary standard. However, it must be ensured that they are really free from all those substances that could cause a detectable response by the analyzer being tested. Figures 5.8 and 5.9 show the arrangements that are used for the certification of calibration gases using the dilution method and the method without dilution, respectively. In Mexico, certification of calibration gases is principally carried out by the manufacturers. However, it is not common practice to recertify mixtures of gases after expiry date because the certification costs are as high as the cost of acquiring a new mixture.
57

Figure 5.8 Diagram for the certification of calibration gases. Dilution Method
Source: CARB (1997)
Figure 5.9 Diagram for the certification of calibration gases. Method without Dilution
Source: CARB (1997)
58

5.5 Calibration of Dynamic Calibrators Due to its importance in the SMA traceability chain, this section presents the most relevant aspects of the calibration section of the Operative Procedure (OP) of a Multi-flow Calibrator (MFC) Environics 9100 of the California Air Resources Board (CARB). CARB (1997) The Environics 9100 dynamic calibrator is equipped with two mass flow controllers. The air mass flow controller has a range of 0–20 standard liters per minute (SLPM) and is operated at 13 SLPM for daily precision and span checks. The gas mass controller operates at a range of 0–100 standard cubic centimeters a minute (SCCM) and controls the flow at 82 SCCM for both the daily zero and span checks and the weekly precision checks. The basic operation principle of the mass flow controllers is thermal Conductivity. The gas mass flow is referenced at normal conditions (760 mm Hg and 25° C). Corrections in pressure and temperature are therefore carried out automatically by the instrument to maintain exact flows operating in any environment. As with many other models used in the SMAs, the Environics 9100 also has its own ozone generator. Ozone can be generated to obtain the desired concentration through the keyboard. An ultraviolet light lamp with a wavelength of 184.9 nm produces O3 in the dry air inside the generator. The ozone concentration is controlled by the voltage applied to the lamp. They can also carry out titration in gas phase of nitric oxide (NO) with Ozone (O3) to produce nitrogen dioxide (NO2). CARB (1997). 5.5.1 Calibration procedure The mass flow controllers and the ozone (O3) generator must be calibrated on a six monthly basis. The mass flow controllers are calibrated through comparisons against a certified flow measurement transfer standard. The O3 generator is calibrated comparing the instrument output with an ozone (O3) transfer standard traceable to NIST. The sequence of steps carried out in this calibration procedure for gas flows is described below, while table 5.1 shows the format for recording the calibration data displayed by the computer used by this SMA.
59

a) Air Flow Calibration. (“As it is”)
1. Connect the flow transfer standard and turn on the instrument so that it heats up for at least one hour.
2. Close the calibration gas tank regulator ( span )
3. Ensure that the digital input connector is disconnected from the back of the
Data Acquisition System (DAS), if not the 9100 calibrator will mark all the criterion pollutants with “C” on the DAS.
4. Disconnect the ¼” teflon tubing from the Environics output to the input of the
station probe and seal the probe input with a plastic cap. Connect the output tube of the certified flow transfer standard with capacity to manage a range of 0– 30 SLPM.
5. Fill in the AS –IS MFC electronic format with the data as shown in table 5.1.
6. Carry out the calibration “As it is” according to the sections as described
below.
7. Press the FLOW MODE button on the principal menu. 8. Set the gas selector at 0.0 SCCM and the Ozone at 0.00 ppm 9. Operate the Environics 9100 in the range of 20 SLPM for 5 flow points,
which will be 15, 14, 13, 12 and 11 SLPM.
10. Put the MFC 1 (air) selector at 15 SLPM. Press START. Turn on the Aadco pure air generator. Ensure that the pressure in the manometer in the output line is 35 psig.
11. After 5 minutes, record the reading of the “Current Flow” of the calibrator
and the corresponding reading of the display of the reference standard (flow calibrator) and calculate the true flow using the certified reference standard equation in the calibration form.
12. Select target flow at 14 SLPM and press the UPDATE button. Wait for 2
minutes and record the flows. Repeat this procedure for 13, 12 and 11 SLPM. Once all the flow data have been recorded press STOP.
60

b) Gas Flow Calibration. (“As it is”) Analogically, the gas flow calibration is carried out taking the nine point comparison: 92.0, 82.0, 72.0, 62.0, 52.0, 42.0, 32.0, 22.0 and 12.0 SCCM between the Environics 9100 and the reference standard. The recordings of the readings obtained in each instrument, the corrections from the reference standard calibration curve and their respective differences are also shown in table 5.1. c) Calibration of the Ozone Generator The ozone generator calibration is carried out by comparing the output of the Environics 9000 with an ozone transfer standard traceable to NIST. Figure 5.10 shows an arrangement scheme used for said calibration. The instructions carried out to such an end are described below, while table 5.2 presents the reading records corresponding to each test.
Figure. 5.10 Ozone Calibration Diagram
ENVIROMICS 9100 Pto 1 Pto 2
GENERADOR DE AIRE CERO
BOMBA
ANALIZADOR DE OZONO
(OPCIONAL)
FOMETRO DE REFERENCIA
Adapted: CARB (1997)
61
OZONE CALIBRATION (“As it is”)
1. Disconnect the air supply line from port 2. Connect the line of the calibration gas cylinder to port 2 and turn to open position. Connect the air supply in port 1. It is necessary for the DAS to be disabled for this procedure. Ensure that the filter from the input line to the analyzer has been recently changed. Record the pressure of the Magnetic manometer of the multiple connector whose range is from 1–1 inches C.A.
2. Use the “Ozone as it is” form on the displayed pages in the Environics 9100
laptop, and fill in all the general data required before beginning calibration.
3. Carry out the connections of the Environics 9100, the ozone analyzer and the reference photometer to the multiple connector as shown in fig. 5.10. The following established steps and the figure mentioned above assume that the ozone analyzer will be calibrated together with the Environics 9100. If the ozone analyzer of the station does not need calibrating, make the appropriate adjustments.
a) Check that the air line pressure of the zero air generator (Aadco) to the
9100 input (port 1) is at 35 psig
b) The ozone/air mixture flows from equipment 9100 through a teflon tube in the highest port of the multiple input connector of the station.
c) The sample input line of the ozone analyzer is connected to the lower port
of the multiple connector.
d) A Port near the lower part of the glass multiple connector is connected to the ozone transfer standard using a ¼ inch teflon tube.
e) The first point with the highest ozone concentration is run for approximately
45 minutes. The fall in pressure in the multiple connector must not exceed 1.0 inch CA.
f) All excess gas must be vented through the probe, extraction from the
station or an additional tube with a larger diameter. 4. Press FLOW MODE in the main menu. 5. Adjust total flow to 13 SLPM. Ensure that the gas flow is adjusted at 0.00 ppm
(this is done by positioning NO “Target Gas” at a concentration of 0.00) and the ozone at 0.00 ppm
6. PRESS START. Check that the output pressure of the Aadco is at 35 psig. Ensure that the pressure adjustment of the manometer is on. Operate the
62
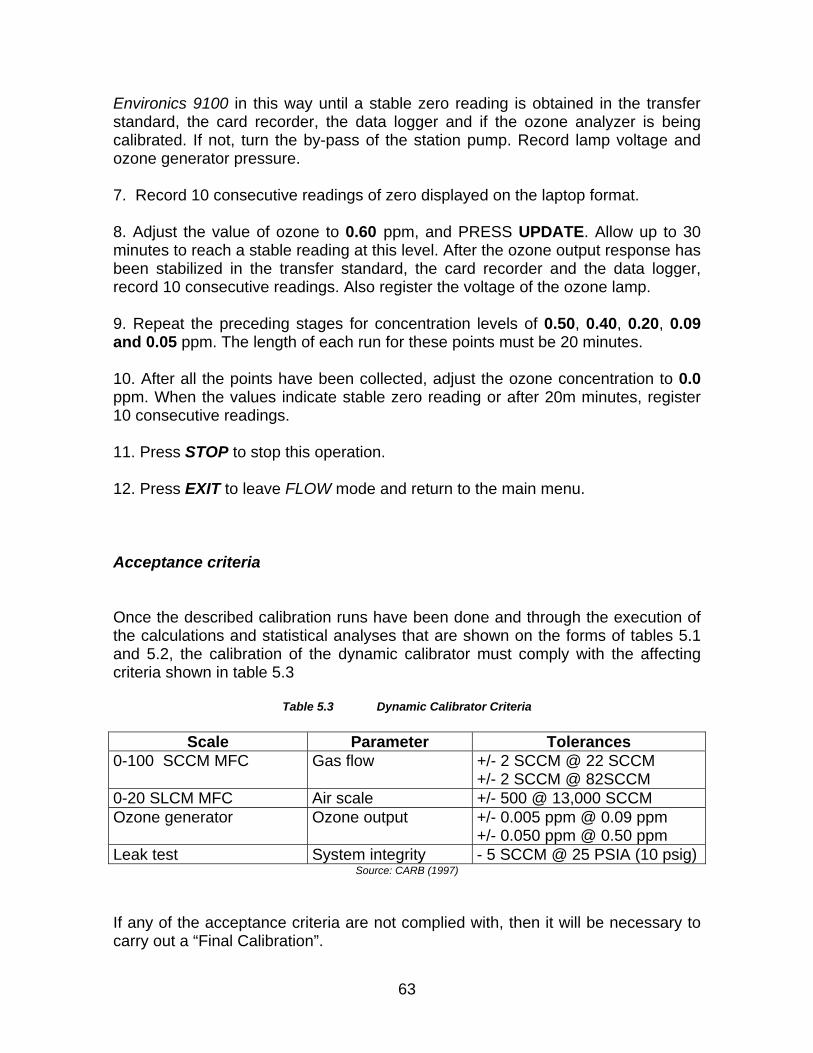
Environics 9100 in this way until a stable zero reading is obtained in the transfer standard, the card recorder, the data logger and if the ozone analyzer is being calibrated. If not, turn the by-pass of the station pump. Record lamp voltage and ozone generator pressure. 7. Record 10 consecutive readings of zero displayed on the laptop format. 8. Adjust the value of ozone to 0.60 ppm, and PRESS UPDATE. Allow up to 30 minutes to reach a stable reading at this level. After the ozone output response has been stabilized in the transfer standard, the card recorder and the data logger, record 10 consecutive readings. Also register the voltage of the ozone lamp. 9. Repeat the preceding stages for concentration levels of 0.50, 0.40, 0.20, 0.09 and 0.05 ppm. The length of each run for these points must be 20 minutes. 10. After all the points have been collected, adjust the ozone concentration to 0.0 ppm. When the values indicate stable zero reading or after 20m minutes, register 10 consecutive readings. 11. Press STOP to stop this operation. 12. Press EXIT to leave FLOW mode and return to the main menu. Acceptance criteria Once the described calibration runs have been done and through the execution of the calculations and statistical analyses that are shown on the forms of tables 5.1 and 5.2, the calibration of the dynamic calibrator must comply with the affecting criteria shown in table 5.3
Table 5.3 Dynamic Calibrator Criteria
Scale Parameter Tolerances 0-100 SCCM MFC Gas flow +/- 2 SCCM @ 22 SCCM
+/- 2 SCCM @ 82SCCM 0-20 SLCM MFC Air scale +/- 500 @ 13,000 SCCM Ozone generator Ozone output +/- 0.005 ppm @ 0.09 ppm
+/- 0.050 ppm @ 0.50 ppm Leak test System integrity - 5 SCCM @ 25 PSIA (10 psig)
Source: CARB (1997) If any of the acceptance criteria are not complied with, then it will be necessary to carry out a “Final Calibration”.
63

TABLE 5.1 CALIBRATION REPORT ARB –GAS CALIBRATION SYSTEM Environics 9100
MFC Calibration:
Flow Transfer Standard I.D.: Calibration: Tyland 4-1 Cal. Type: “as it is”
Prop. #: 20603865 Calibration Date: 10/21/96 Cart. Date: 10/15/96 Prev. Cal. Date : 5/20/96
Cert. issued: 01/14/97
Flow Transfer Equation: m: X: B:
0-30 MCF : Air flow = 0.9752 “Prom. Display +/- -0.2025 SLPM
0-100 cc MFC : Gas flow = 0.9947 “Prom. Display +/- -0.5973 SLPM
Air Flow Calibration Data– 0.30 slpm MFC: Manual flow adjustment: 16.0 14.0 13.0 12.0 11.0 Envir output flow, <(Display): 14.97 13.99 13.00 12.01 10.72 Transfer standard (Display): 15.54 14.67 13.67 12.67 11.32 Real air flow (sccm): 15.05 14.10 13.13 12.15 10.34 Net Change (set point - T.F.): -0.05 -0.10 -0.13 -0.15 0.16 Note: +/- Lpm Tolerant Gas flow calibration data – 0-100 sccm MFC: Manual flow adjustment: 92.0 82.0 72.0 62.0 52.0 42.0 32.0 22.0 12.0 Env output flow<(Display): 91.99 82.00 72.02 62.00 52.03 42.00 30.01 22.01 12.01 Transfer standard: 91.46 81.75 71.73 61.81 52.12 42.22 32.26 22.20 12.20 Real air flow (sccm): 90.28 80.62 70.65 60.79 51.15 41.30 31.41 21.39 11.39 Net Change (set point - T.F.): 1.72 1.38 1.36 1.21 0.35 0.70 0.59 0.61 0.54
Note: +/- 2cc Tolerant
Air flow Cal. – 030 sccm MFC: MFC Linear regression of air at output:: Manual flow adjustment
(X)
Real air flow: (Y) Linear Cal. Constant -0.43460
15.0 15.05 15.13 Std Er and Est 0.13030
MFC REGRESSION
14.0 14.10 14.09 R Squared 0.99529 13.0 13.13 13.05 No. observations: 5 12.0 12.15 12.02 Degrees of freedom 3 11.0 10.84 10.98 Correlation 0.99764
Linear regression equation of air flow X Coefficient 1.0376 TAF (Stope): 1.0376 Coefficient of Error 0.041 Setpt (interception) -0.4346
Gas Flow Cal. – 0-100 sccm MFC: MFC Linear regression of output gas Manual Flow Setpoint (X)
Real air flow: (Y) Linear Cal. Constant -0.21189
92.0 90.2780 90.40 Std Er and Est 0.12334
MFC REGRESSION
82.0 80.5194 80.55 R Squared 0.99998 72.0 70.5525 70.70 No. observations: 9 62.0 60.7851 60.85 Degrees of freedom 7 52.0 51.1465 51.00 Correlation 0.9999 42.0 41.2989 41.15 X Coefficient 0.9849 32.0 31.4116 31.31 Std Err of Coef. 0.002 22.0 21.3850 21.46 Gas flow linear regres equ.: 12.0 11.4579 11.61 TAF (Slope): 0.9849
Setpt (Interception): -0.2119
Comments: Calibrated by: Revised by:
64

Table 5.2 ARB CALIBRATION REPORT –ENVIRONICS GAS CALIBRATION SYSTEM
Calibration of ozone generator: Infc.Calibration: Ozone Transfer Standard I.D.: Type of: As Is Mark and Model: 5009 CP Span Dial Number: 308 Calibration Data: 10/22/96 Property No.: 20003850 P/T (On/off): On Data from Prev. Cal.: 5/20/96 Series No. 309 P/T Corr. Value : 1.383 Gas pressure (mmHg): 610.0 Air flow (Volts): Environics Display: Gas temperature (°C): 26.9 Gas flow (Volts): Temp. Block Temp. (°C): 51.000 Air flow (sipm): 2.0 Cart. Date: 10/15/96 Air flow (SLPM): 13.13 Air flow adjustment: 2.5 Cart. Exp.: 1/14/96 O3 Gen. Pres. (PSIA): 23.7 Ozone flow (CCM): 494.1 Correction factor of real ozone factor (TOCF): m: X: b:
True O3 = 0.9982 “Avg. Display +/- 0.0001 ppm O3 Calibration data (transfer standards) for ozone:
Number Pre-zero 1st 0.600
2nd 0.500
3rd 0.400
4th 0.200
5th 0.90
6th 0.50 Post-zero
O3 lamp voltage: 0.735 12.76 12.66 12.51 11.47 9.95 9.350 0.732 1 -0.002 0.604 0.510 0.415 0.207 0.089 0.050 0.000 2 -0.002 0.604 0.510 0.415 0.207 0.089 0.050 0.000 3 -0.002 0.604 0.510 0.415 0.207 0.089 0.050 -0.001 4 -0.001 0.604 0.510 0.415 0.207 0.089 0.050 -0.001 5 -0.002 0.604 0.510 0.415 0.207 0.089 0.050 -0.001 6 -0.001 0.604 0.510 0.415 0.207 0.090 0.050 -0.001 7 -0.001 0.604 0.510 0.415 0.207 0.089 0.050 -0.001 8 -0.001 0.604 0.510 0.415 0.207 0.090 0.050 -0.001 9 -0.001 0.604 0.510 0.415 0.207 0.089 0.050 -0.001 10 -0.001 0.604 0.510 0.415 0.207 0.089 0.050 -0.001
Average Display: -0.001 0.604 0.510 0.415 0.207 0.089 0.050 -0.001 Corr. Av. (ppm): 0.604 0.510 0.415 0.208 0.090 0.051 Graph values for Ozone conc..: Ozone Regression Output: Set point:
(X) True O3
(Y) Line
calculation Constant 0.00233 Pre-post zero
0.60 0.604 0.610 Std Err of Est 0.00533 Pre: -0.0010.50 0.510 0.509 R Squared 0.99955 Post: -0.0010.40 0.415 0.408 No. of observations 6 Average: -0.0010.20 0.208 0.205 Degrees of Freedom 4 0.09 0.090 0.094 Correlation 0.99978 0.05 0.051 0.053 X Coefficient(s) 1.013335
OZONE REGRESSION
Std Err of Coef. 0.010630 Regression equivalent of Ozone flow:
TCF (Stope): 1.0133 Interception: 0.0023 Comments: Calibrated by: Revised by:
65

5.6 Analyzer Calibration In the practical operation of the calibration programs, different types of calibration are made, whose complexity and application can vary in terms of the circumstances and quality objectives established. However, it is important to bear in mind that calibrations in this field must include the following elements: 1) Traceability of reference materials or known inputs; 2) Established, validated procedures; 3) Carry out in a programmed way and 4) Document results. The main types of calibrations carried out with SMA gas analyzers are described below. 5.6.1 Multi-point calibrations Multi-point calibrations consist of three or more test concentrations, including zero and a concentration between 80% and 90% of the complete scale of the range of the analyzer being calibrated and one or more intermediate concentrations spaced along approximately equal intervals within the operation range. These multi-point calibrations are used to establish and/or verify the lineality of the analyzers in their initial installation, after major repairs and at a certain time. Most of the modern analyzers have a linear response or a response very close to the reference concentration. Table 5.4 shows the concentration ranges used in the practice for this type of calibrations in criterion pollutant analyzers.
TABLE 5.4 Typical Concentration Ranges for Multi-point calibrations
NO. TEST POINT SO2,NOX and O3(ppb)
CO
(ppm) 1 Zero 0.0 0.0 2 First point 30 – 80 3.0 – 8.0 3 Precision 80 –100 8.0 – 10.0 4 Third point 150 – 200 15.0 – 20.0 5 Fourth point 275 – 325 27.5 – 32.5 6 Level 1 350 - 450 35.0 – 45.0
Source: CFR (2004)
Calculation of the calibration gas concentrations for SO2 NOX and CO, is carried out with the following equation:
66

Equation A
DAGGSGC
+=
*
Where: C : Concentration of calibration gas (ppb = ppm*1000) SG : Concentration of SPAN (ppm) G : Gas flow of SPAN (cc/min), and DA : Dilution air flow through the calibrator (cc/min) For example, when: SG = 100 ppm, G= 9 cc/min and DA = 10 L/min (10 000 cc/min),
( )( )
( )1000099100
+=C
C = 0.090 ppm = 90 ppb
The following equation is used to calculate the percentage difference between the input concentration and the observed values:
( )⎟⎠⎞
⎜⎝⎛ −
=C
CObsDiff %100%
Where: % Diff : Percentage difference Obs : Concentration observed as measured by the analyzer and recorded
by the data system, in the same units as C, and C : Concentration of calibration gas (ppm). The general procedure for carrying out multi-point calibrations is the following:
1. Fill in the general data in the top of the form, which identify site, instrument, date, time, operator and identification of the calibration gas.
2. Mark the appropriate channel 3. Connect the calibration line to the port marked “VENT” on the
calibrator 4. Disconnect the filter from the multiple line of the sample 5. Connect the line filter to the stainless steel “t” closest to the calibrator
on the calibration line, verifying that the calibrator flow flows in the direction indicated on the filter line.
6. Up to three instruments can be calibrated using this method. Special care must be taken to ensure that the instrument does not receive
67

calibration gas at a high pressure and that there is sufficient flow to the analyzer input in such as way that the sample is not diluted with ambient air.
7. Operate the calibrator to substitute calibration gas in the required ranges. Let the analyzer reach a stable response; record the input gas information and the result of the analyzer on the form. Calculate the % difference, using equation A.
8. Compare the results of the percentage differences with the acceptance criteria. If the results exceed said limits, make the adjustments or relevant maintenance and then repeat the calibration again.
9. After calibration is complete, disconnect the calibration line and reconnect the analyzer samples to the multiple connector.
10. Purge the calibrator with zero air to prevent possible errors in calibrations during the subsequent self-calibrations.
Table 5.5 shows a typical calibration format for SO2, CO and O3 analyzers. In the case of the Nox analyzers, calibration for NO2 and the determination of the converter efficiency are done through a calibration of 2 stages known as titration in gas phase (TGP). This consists of the addition of ozone to the nitric oxide (NO) to obtain nitrogen dioxide (NO2) in the same proportion in which the O3 is fed. Table 5.6 shows an example of the calibration form used for a multi-point calibration of NOx, NO and NO2, and the calculation of converter efficiency. It is recommended that the analyzer response readings are obtained from the same recording device (graph plotter, display, data acquisition system, etc.) which will be used for the subsequent measurements of the concentrations in the ambient air. In general, the analyzer calibration data are plotted against their respective test concentrations, and the best linear adjustment curve for the points must be determined as of the resulting minimum squares regression, where the slope and the interception point of the calibration curve is obtained with the equation:
y = mx + a where: y: is the analyzer response, x: is the pollutant concentration m: is the slope, and a: is the interception point of the best adjustment curve
68

When the calibration equation issued to express the concentrations (x) measured by the analyzer of the analyzer response readings (y), they can be corrected by cleaning the formula:
x = (y - a)/m. Two indicators that are typically used for purposes of Quality Control of calibrations are the standard deviation and/or the correlation coefficient that can be calculated in the corresponding linear regression. A standard error control or correlation coefficient card can be drawn up to monitor the degree of dispersion of the calibration points and verify that they are within the limits of acceptance previously established.
69

Table 5.5 Recording form
MULTI-POINT CALIBRATION DATA
PARÁMETER
Station/Site:
Technician:
Date and Time
Analyzer Model:
Inventory No. (ID):
Analyzer Range
Calibrator Model:
Inv/ series No.:
Cal. Gas/ No Cylin..:
Concentration: PPM
Ultra Pure Air Cylinder NO.
WITHOUT ADJUSTMENT: Recalibrate if the response is +/- 10 %
Calibration Gas Flow SCCM
Dilution Flow SCCM
Input Concentration (ppm). A
Analyzer Response (ppm). B
Percent Difference
%100 =⎟⎠⎞
⎜⎝⎛ − x
AAB
0.000
ADJUSTMENT: Adjust Analyzer response to 40% of the complete scale
0.000
Comments:
70

Table 5.6 Form Type for Calibration Data for NOx, NO, NO2 Analyzers
Station : Mass Flow Calibration Model:
Technician: Inventory No. Or Series No.:
Date/Time: Calibration Gas Cylinder No :*
Mass Flow Meter Mod: Calibration Gas Concentration:*
Inv.No. or series No. *or Permeation tube
CALIBRATION DATA NO
Calibration Gas Flow Dilution Flow
NO input ppm
NOx Output ppm
NO Output ppm
NO2 % Difference
NO % Difference
NOx Slope ( m ) Interception ( b ) Conc. NOx
NO Slope ( m ) Interception ( b ) Conc. NO
Calibration Data for NO2 NO2 Input
Approximate value NO2 Input
Meter Position O3
(NO Initial – NO Final)__________= NO2 input NO Slope*
0.050 ppm - - - 0.100 ppm - - - 0.200 ppm - - - 0.300 ppm - - - 0.400 ppm - - -
* Do not forget to divide by the NO slope
NO2 Output NO2 Converted
NOx Final – NO Final = NO2 output NO2 Input – (NOx Initial – NOx Final) = NO2 Converted
ZERO - = - ( - ) =
- = - ( - ) =
- = - ( - ) =
- = - ( - ) =
- = - ( - ) =
Calibration Data NO2 Conversion Data
NO2 Input NO2 Output NO2 % Diff. NO2 input x axis NO2 Converter y-axis
NO2 Calib. – Slope ( m ) Interception (b)
Converter efficiency is calculated by performing the linear regression between input NO2 and converted NO2. Then the slope of the curve is multiplied by 100 to obtain efficiency.
Correlation Coefficient Conversion Efficiency of NO2
71

5.6.2 Zero and Span Calibration Zero and span calibration are simplified to the calibration of two points (the zero and the span). The procedure and forms used are the same as with the multi-point calibration. Some manufacturers call this level 1 calibration. Although lacking in the advantages of a multi-point calibration, the two point calibration can and must be carried out much more often. This type of calibration can also be easily automated. The frequent checks or updates of the calibration relation help to improve data quality with the control of the drifts in the response of each analyzer. When this type of calibration is done, it is recommended to record the response readings of the zero and the span before making any adjustment to the analyzer, since these recordings without adjustment provide valuable information for: (1) confirming validity (or invalidity) of the measurements obtained immediately before calibration, (2) monitoring the drift trends of the zero and span of the analyzer, and (3) determining recalibration frequency. The general procedure followed for the calibration of the zero and the span is the following:
1. Disconnect the analyzer input from the ambient air sample and connect it to the calibration system. Leave the analyzer in its normal operation mode and do not adjust the analyzer.
2. Measure and record the response concentration of the analyzer with respect
to the calibration gas once stable and without adjustment (S'). 3. Measure and record the zero air test concentration in stable conditions, also
without adjustment. (Z').
4. Make any adjustment the analyzer needs (e.g. flow or pressure) or related to maintenance.
5. If adjustment of the zero is necessary of if any adjustment has been made to
the analyzer, adjust the zero to the reading wanted for zero. Record the adjusted zero reading (Z) in stable conditions. Note that if no adjustment is made to the zero then Z=Z’. Displacing the reading of the Zero (e.g. at 1% of the scale) can help to observe any negative displacement of the zero that may occur. If a displacement (A) is used, record the reading without displacement as Z-A.
6. Measure the calibration gas concentration (span). If it is necessary to adjust
the span, adjust the response of the span to the desired value, leaving the
72

adjusted zero used in the previous stage. Record the final reading of the adjusted span in stable conditions (S). If the span is not adjusted then S=S’.
7. After any adjustment made to the zero or the span or any other parameters,
restabilization of the analyzer to these new conditions must be allowed and then the readings of the zero and the span must be checked and the new values of Z and S recorded if necessary.
If the calibration is updated for each calibration of the zero and the span, a new calibration curve must be drawn up using the readings Z and S or the interception point and the slope must be determined as follows: EPA (1998)
I=Interception = Z
trationspanconcenZSslopeM −
==
5.6.3 Automatic verification of the Zero and the Span For the purposes of this manual, automatic verification refers to checks that can be carried out remotely using the data acquisition system and the analyzer calibration system, which is generally done during the night. In this type of check, both the zero and the span are introduced sequentially into the analyzer through its sampling ports from the calibrator. The supply of zero and span gas takes place in 10 to 15 minutes for each one. The results are stored in a calibration table and printed by the station and/or computer center printer. These checks must be programmed to begin 45 minutes after the hour so as not to invalidate the measurement data of the preceding or subsequent hour in the event of calibration. Figure Fig. 5.11 shows an example of a control card that can be generated from the daily monitoring of the zero drifts through this type of remote verification, which is an extremely useful tool for data quality control purposes.
73

Figure 5.11 Zero drift control card
-30
-20
-10
0
10
20
30
0 20 40 60 80 100 120 140 160 180
DAYS
ZER
O D
RIF
T
Adapted from: EPA (1998)
5.7 Calibration of meteorological sensors There are two ways to calibrate the meteorological station sensors, the first is one in which the sensor response can be compared to a known quality reference measurement while the sensor and audit article are submitted to the same environmental condition in which the response is theoretically predictable. In the cases of wind direction and wind speed, solar radiation and rainfall it is common to calibrate the sensors against elements in an artificial condition, while the temperature and pressure sensors can be compared through traceable patterns. For example, in the case of anemometers (air flow meters), verification of their calibration is done by indirectly comparing the output response in units of velocity with the revolutions per minute of a reference tachometer. The form type for recording data is shown in the following table 5.7.
74

Table 5.7
CALIBRATION VERIFICATION DATA METEORLOGICAL TOWER
Site: Date: Time started: Time finished:
Meteorological Parameter
Reference Pattern SH
(Expiry Date)
Zero value or static position
Reference Value
Instrument Response
(Data system)
Absolute difference
(sign + o -)
Acceptance criteria
Wind Direction (WD)
Wind Speed (WS)
Temperature (Temp.)
Rainfall (RFL)
Solar Radiation (SRD)
Barometric Pressure (PRES)
Comments:
Name and signature:
Source: Radian (1992) 5.8 Calibration frequency and analyzer adjustment As indicated above, a multipoint calibration must be performed on the new analyzers or after major repairs in order to establish analyzer lineality. It is also appropriate to carry out a multi-point calibration of each analyzer in routine operation at least four times a year in order to recheck lineality; however the annual multi-point audit can serve instead. The calibrations referred to below could normally be zero and span 2 point. However, a multi-point calibration can always substitute the 2 point calibration. An analyzer can be calibrated or recalibrated:
• During the initial installation • After relocation • After any repair or service that could affect calibration • After interruption of operation for some days • At any indication of malfunctioning of the analyzer or change in calibration • At some routine interval (see below)
The analyzers in continual operation must be periodically recalibrated in order to maintain an appropriate relationship between calibrations. The frequency of this periodic recalibration routine is a matter of opinion and assessment of the following aspects: the inherent stability of the analyzer under prevailing temperature,
75

pressure, voltage, etc. conditions in the sample site; the cost and inconvenience of carrying out calibrations; the quality of the environmental data required; the number of data lost during calibration; and the risk of collecting invalid data due to malfunctioning or analyzer response problems that could not be discovered until a calibration is carried out. When a new instrument is installed for the first time, calibrations must be done frequently, daily or three times a week, as there is no or very little information on the behavior of the analyzer drift. Information from another piece of equipment of the same model may be useful; however, they may have different functioning and responses. After a sufficient amount of information has been collected on drift functioning, the frequency of the calibrations must be determined to satisfactorily cover several of the considerations mentioned above. However, a wise suggestion is that calibration frequency must be at least once every two weeks. In general, the minimum calibration frequencies adopted as quality objectives by different air monitoring systems in the United States are the following:
• Multi-point calibrations, four a year or after a failure in quality control checks or after maintenance.
• Zero span calibrations, one calibration every two weeks. • Flow meter calibrations, one very three months. • In the case of ozone, certification of the pattern photometer is done once a
year. • The orifice calibrations for high volume samplers are calibrated once every
two years. 5.9 Data Validation using Calibration Information When the zero and span drift acceptance limits are exceeded, environmental measurements must be invalidated backwards until the point in which said measurements are considered to be valid. Usually, this point is the previous calibration (or precision audit), unless another point in time can be identified as the cause of excessive drift (such as a failure in energy supply or breakdown). Also, after an analyzer failure or period out of operation, measurements must be considered to be invalid until the next calibration is done, unless the zero and span readings support reading validity without adjustment.
76

6. SAFETY AND EMERGENCY PLANS As well as the maintenance and calibration programs discussed in the preceding chapters, the SMAs must set up specific safety procedures both to protect the physical integrity of the operators and to guarantee the safety of the remote installations infrastructure (monitoring booths) and the sites where the equipment of the installation is kept. Similarly, there must be procedures and precise instructions for attending emergencies that put information integrity or equipage at risk as well as the operative personnel. The following sections include aspects related to these topics that have been considered of most interest. 6.1 Safety in the installations The personnel that carry out maintenance, calibration and supervisory routines in the operation of monitoring systems should have adequate personal protection equipment in order to carry out activities classed as hazardous through a risk analysis drawn up to that end. The operative personnel should have sufficient means to perform their activities in the monitoring stations and sufficient vehicles in appropriate maintenance and safety conditions to transport the personnel, equipment and tools to the installations. It is important to consider that on many occasions, night transport is necessary. It is recommended that the operation, maintenance, storage, transit and pedestrian access areas are delimited and well-defined as far as possible. Similarly, safety notices and signs identifying zones considered to be at risk should be installed, mainly stressing restricted access to unauthorized personnel. Both the central installations and the sampling stations should have an extinguisher according to the type of fire risk and their loading and validity should be controlled as part of the maintenance routines. Their installation and location should bide by the safety Standards in force in Mexico. The permanent electrical installations of the monitoring station should have thermo-magnetic devices for cutting off energy and signals according to the voltage and current of the load installed. The electric energy distribution boards should be marked and identified according to the prevailing Standards. Furthermore, the
77

stations should have lightning conductor systems where applicable. Should static electricity represent a risk for the personnel, it should be controlled according to the corresponding Standards.
Figure 6.1 Electric energy distribution board in the monitoring station
In the case of the handling of solvents or chemically dangerous materials or substances in and off the monitoring stations, derived from maintenance operations or operation, this should be done in technical conditions of safety in order to prevent and avoid damage to the health of the personnel and to the installations and to have precise instructions in order not to temporally store said substances in the monitoring booths or areas where the equipage or information is kept. In the case of monitoring stations that handle and store substances, inflammable gases, fuel or explosive substances, signs and notices should be placed in visible places indicating the prohibition on smoking, having matches, using devices with open flames, incandescent objects and on any other substance that could cause a fire or explosion. Similarly, appropriate fastening of compressed gas tanks inside the installations must be guaranteed.
78

Figure 6.2 Compressed gas tanks in monitoring station without fastening
The solid residuals generated during the stay of the operators in the monitoring stations should be frequently removed and adequately placed in a container near the monitoring site. For those stations with very high meteorological pylons, there should be a specific safety procedure for personnel from the organization or from service companies who climb up the pylons. It is recommendable to include basic first aid courses for operative personnel in the SMA training programs and to establish an installation and supply program for first aid kits. 6.2 Safety practices around the installations The air monitoring stations that are found in public places or on official installations should have safety specifications to safeguard the installations from acts of vandalism and meteorological inclemency, which should include the following safety measures: The perimetrical wire mesh that safeguards the installations should be at least 2.5 m high with barbed wire on the top of the fence.
79

Install announcements on the perimetrical fence of the stations which should announce the type of property and the telephone numbers to request or report information on the station. Cooperation programs must be set up with the administrative personnel of the official installations or the neighbors should be informed of the objective of the monitoring station and they should be persuaded to participate in surveillance of the installations, giving notification of acts of vandalism and events that put the installations at risk. The peripheries of the installations should be inspected to prevent damage caused by trees and other weak structures that could affect the vulnerable structures of the installation. The installations should have restricted access and adequate mechanisms such as bolts and locks to prevent access of personnel foreign to the stations.
80
7. BIBLIOGRAPHY
1. American Conference of Governmental Industrial Hygienists (1989). Air sampling Instruments. Susanne Hering, Technical editors, 7th edition, Cincinnati, Ohio.
2. CARB (1997). Standard Operating Procedures for Air Quality Monitoring.
Vol. II, Appendix A, B, C, California Air resources Board, State of California.
3. EPA (1998). Quality Assurance Handbook for Air Pollution Measurement
Systems, Vol. II; Part 1, Office of Air Quality Planning and Standards, Research Triangle Park, USA.
4. Janhke. J, (1993). Continuous Emission Monitoring. Van Nostrand Reinhold,
Ontairo, Canada
5. Ness. S (1991). Air Monitoring for Toxic Exposures, an Integrated Approach.
Van Nostrand Reinhold, New York. 6. Radian (1992). Operation manual Ambient Air Monitoring Systems-SIMA.
Radian Corporation, Austin, Texas.
7. Teledyne Instruments (2002). Instructor Manual Ozone Analyzer Model 400
E. Teledyne Technologies Company, San Diego, CA. 8. CFR (2004). Code of Federal Registers Title 40. Protection of Environment,
PART 58-AMBIENT AIR QUALITY SURVEILLANCE.
81

i
DOCUMENT 5
Quality Management, Quality Assurance and Quality Control
in Air Monitoring Systems

ii
CONTENTS
1. INTRODUCTION 1
2. OBJECTIVES 3
3 GENERAL ASPECTS OF QUALITY MANAGEMENT SYSTEMS 4
3.1 Institutional Focus on Quality of the National Air Monitoring Program (PNMA). 4 3.1.1 Functions and Responsibilities 5 3.1.2 Definitions 7 3.1.3 The Origin of Quality Assurance in Air Quality Measurements 8
3.2 Principles of Quality Management 9
3.3 Preliminary Activities of the Quality Management System (SGC) 12 3.3.1. Activity Program 14
4 DEVELOPMENT OF QUALITY MANAGEMENT SYSTEMS
4.1. Aspects related to Quality Management in Air Monitoring Systems (SMAs) 17 4.1.1. Quality Policy 17 4.1.2. Responsibilities 17 4.1.3. Quality Planning 20 4.1.4. Quality Objectives 22 4.1.5. Resource Management for the SGC 23
4.2 Aspects Related to Quality Assurance 24 4.2.1. Document System 25 4.2.2. Quality Assurance Procedures (PACs) 26 4.2.3 Operational Procedures (POs) 27 4.2.4 Work and Records Instructions 29 4.2.5. Document Control 29 4.2.6. Criteria for the Selection and Purchase of Equipment, Instruments, Materials and Consumables 31 4.2.7. Internal and External Audits 34
4.3 Aspects Related to Quality Control 36 4.3.1 Criteria for quality control in air monitoring systems 36 4.3.2. Standards and calibration transfer laboratory 37 4.3.3. Revision, checks, validation and reconciliation of data for quality objectives 41
5. BIBLIOGRAPHY 57
ANEX 1 59

iii
INDEX OF FIGURES FIG. Pag.
3.1 Hierarchical – Organizational Structure of PNMA 4 3.2 Interrelation of diverse instances for quality assurance in air monitoring 9 3.3 Stages for the implementation of an SGC 12 3.4 Activity Program for the Implementation of an SGC 15 4.1 Pyramid of existing documentation in a quality management system 26 4.2 Data Verification Flow 39 4.3 Data Verification and Validation in a project cycle 43
INDEX OF TABLES
Table Pag.
4.1 Documents to be submitted to document control 30
4.2 Standards assigned by the Central Processing System to hourly data obtained by SIMAT 45
4.3 Inspections commonly used for verification of data 47 4.4 Representativeness of Air Monitoring Data 54 4.5 Number of samples required to assure representativeness of a sample period 54 4.6 Precision and Accuracy Requirements for Established Parameters 55

1
1. INTRODUCTION Quality is a topic that is attracting greater interest and attention at the international level and is currently recognized as an extremely important parameter in the industrial, service and public sectors through the establishment of product Quality Management Systems (SGC – acronym as given in Spanish)1. Quality can therefore be considered an effective instrument to strengthen production and/or service processes and business relations. Air Monitoring Systems (SMAs – acronym as given in Spanish) are not excluded from these tendencies and in the case of Mexico there is the National Air Monitoring Program (PNMA – acronym as given in Spanish) which, in its first stage of implementation, seeks to establish a frame of reference for air monitoring procedures and, in the third stage, support SMAs in Mexico with the description and introduction of quality control and quality assurance systems (PNMA, 2003). As a point of reference the following activities of the PNMA are highlighted due to their importance:
Establish criteria for design, operation, maintenance and calibration of SMAs Establish requirements for data use and reports as well as for the national
release of information Set Forth Guidelines and Criteria for quality control and assurance Formulate Procedures for the assessment and/or auditing of SMA´s
Among the best known and applicable standards for the development and implementation of Quality Management Systems at the international level are those of the ISO (International Standards Organization) series. The standards to be taken as reference for the development of SGCs in the bosom of the organization relevant to air monitoring are ISO 9001:2000 and ISO/IEC 17025:1999, with the corresponding Mexican standards being NMX-CC-9001-IMNC-2000 and NMX-EC-17025-1999 respectively. According to that stated in Document 1 (chap. 5) an SMA could certify the quality of the service offered by demonstrating it has introduced an SGC in accordance with NMX-CC-9001-IMNC-2000. On the other hand, in accordance with Federal Metrology and Standards Law, SMAs should be subject to an accreditation process through the authorized body (currently the ema – acronym as given in Spanish) to demonstrate its technical competence and reliability as a laboratory for experiments based on its meeting the general requisites established in NMX-EC-17025-1999. Given that both standards establish as a basic requirement the introduction of an SGC, the present document will set out the standards that SMAs will need to implement for said purpose based on NMX-CC-9001-IMNC-2000, while document 6 will emphasize the more specific technical requirements for accreditation in NMX-EC-17025-1999.
1 PRODUCT IN QUALITY ALSO INCLUDES SUCH INTANGIBLES AS SERVICES, PROCEDURES ETC

2
In Mexico there are currently more than 15 accredited national and international organizations for the certification of quality systems, and it is important to point out that the federal government as well as state and local authorities either possess or are in the process of obtaining ISO 9000 certification, since they already have certain experience in the Environmental sector. In this context, the present document outlines the most relevant aspects for the design and implementation of an SGC with a focus oriented towards current and future air monitoring systems achieving said purpose in the medium term. In all cases it should be borne in mind that an SGC should conform to the specific characteristics of the organizational structure, the technological automation and equipment and testing (process) methods employed. Chapter 2 sets forth the principal objectives of this document. Chapter 3 of the present document initially offers a simple outline of the desirable role to be performed by the different governmental areas in the promotion of Quality Assurance and Control practices in SMAs. It later indicates the eight basic principles of quality management and finally sets out general guidelines for the design and implementation of an SGC. Chapter 4 explains the basic requisites of quality standards, beginning with Quality Policy as a leading instrument of all SGCs (sec. 4.1.1.); this is followed by a highlighting of the importance of the objective allocation of personnel functions and responsibilities. Subsequent sections refer to the aspects related to quality planning and objectives and the importance of resource availability within an SGC. Section 4.2 details the standard points related to Quality Assurance. First it outlines the basic concepts related to the type of measurements effected by SMAs, then goes on to describe the principal characteristics of an SGC document system and the requisites to be complied with in the control of documents. The final parts deal with the selection and acquisition of materials and equipment (purchase), as well as calibration and reference materials. Finally, the importance of audits for the identification of deviations in the functioning of an SGC is described. Section 4.3 offers the criteria for Quality Control that SMAs should use, highlighting such activities as revision, verification and validation of data and their correspondence as a means of proving compliance with quality objectives established by the organization.

3
2. OBJECTIVES
1. Introduce those responsible for SMAs to the concepts of quality and basic aspects required for the implementation of a Quality Management System. (SGC).
2. Describe the general characteristics of Quality Assurance contained in the ISO-9000 standard and their relation to the practices of air monitoring.
3. Indicate the Quality Control practices applicable to SMAs related to the acquisition, storage and purging of data.

4
3 GENERAL ASPECTS OF QUALITY MANAGEMENT SYSTEMS 3.1 Institutional Focus on Quality of the National Air Monitoring Program (PNMA). Before mentioning generic aspects of quality to be considered by SMAs for the development of their respective Quality Management Systems (SGC), it is necessary to offer a schematic structure of the PNMA from an institutional focus oriented towards quality and whose ultimate goal should be to guarantee the reliability of air quality information based on SMA schemes of accreditation and certification. To achieve this aim, an active and determined participation on the part of all actors involved in Air Quality Management is indispensable. Figure 3.1 sets out the hierarchical – organizational structure formed by those dependencies or institutions that directly or indirectly intervene in the PNMA. This is followed by a description of some of the functions, responsibilities and/or actions considered important for the consolidation of Quality Management practices within the PNMA.
Fig. 3.1 Hierarchical Organizational Structure of the PNMA
SEMARNAT
PROFEPA INE SGPA
SSA
DGICUR y G DG.CENICA DGCA y RETC
COFEPRIS
Gobierno estatal
SMA del estado
Redes Diversasáreas
State government
State SMA State SMA
Various areasNetworks

5
3.1.1 Functions and Responsibilities SEMARNAT-SGPA General Management of Air Quality Management and RETC
• Support and Strengthen the National Air Monitoring Program; • Promote the installation of SMAs at a national level; • Define the air quality objectives to be achieved at a national level; • Issue and/or update regulations, corresponding standards and guidelines related to Air
Quality Monitoring; • Provide technical support and advice to state monitoring systems or other authorities; • Prepare biannual Reports on the state of Air Quality in the different Air Sample Areas
at a national level. National Ecology Institute General Management of the National Research and Environmental Training Center (CENICA – acronym as given in Spanish):
• Promote, justify and assume leadership in the updating of and compliance with testing methods (NMX) that will be officially recognized as methods of reference and equivalents for the determination of pollutant criteria as regards Air Quality.
• Promote, justify and assume leadership in the drawing up and issuing of the Official
Mexican Standard which establishes the minimum Requirements of operation, reporting and quality assurance that should be met by those responsible for SMAs operating in Mexico.
• Justify and identify possible sources of financing for the establishment of a National
Reference Library that allows the setting up of a traceability chain required for the reliable operation of SMAs.
• Design, establish and participate in the procedures of auditing and/or assessment
applicable to SMAs to guarantee the quality of information generated by said bodies.
Federal Office of Environmental Protection (PROFEPA – acronym as given in Spanish):
• Strengthen the verification of compliance with emission standards for major fixed sources and improve observation coverage during the declaration of air quality alerts.

6
HEALTH SECRETARIAT
National Institute of Public Health:
• Develop and/or compile scientific information relative to the assessment of risks and exposure to air pollutants and where relevant promote the up-dating of air quality standards and levels for the activation of air quality alert programs operating in the country’s air sample areas.
Mexican Accreditation Organization (EMA – acronym as given in Spanish):
• Support SEMARNAT in the design of an Ad Hoc accreditation process for SMAs • Establish a specific subcommittee for air quality which in turn should draw up
procedures and assessment standards required for SMA accreditation.
State Environmental Secretariats or Agencies:
• Develop state air quality plans for critical areas determined in conjunction with the Federation;
• Implement adequate measures in the case of air quality alerts for the purpose of protecting public health;
• Install air monitoring systems in those air sample areas requiring them • Provide the necessary resources for air monitoring, including laboratories for the
transfer of standards and calibration; • Communicate the results of air monitoring to the Federation indicating precision,
direction and accuracy in the determination of quarterly and annual data quality; • Communicate the results of air monitoring to the public.

7
3.1.2 Definitions In the context of Quality Management Systems, terms such as quality management, quality assurance and quality control are used. Their definition may vary from one source to another but of primary importance here is that throughout this document the user comes to correctly understand said concepts in their direct application to the implementation of an SGC in those organizations dedicated to the Monitoring of Air Quality. As an initial approach, what follows are the definitions given in the standard NMX-CC-9000-IMNC-2000 “Quality Management Systems – Fundamentals and Vocabulary” as well as those given by Decanini, a prestigious writer on the subject of quality. In the figures below some of the interactions between said concepts are given.
ORGANIZATION (SMA)
Sistemas de Gestión de CalidadPolítica y Objetivos de Calidad
Aseguramiento de la Calidad (AC)Realizada por personal ajeno a la operación
directa
Control de la CalidadR
(CC)realizada por operadores directos
SalidaEntrada
AcciónCC
Aseguramiento de la Calidad (AC)Realizada por personal ajeno a la operación
directa
Control de la CalidadR
(CC)realizada por operadores directos
Quality Assurance Performed by staff unconnected to
direct operation
AcciónCCQC
Action
Quality Control (QC) Performed by direct operators
EntradaInlet SalidaOutlet
Sistemas de Gestión de CalidadPolítica y Objetivos de CalidadQuality Policy and Objectives
Quality Management Control Quality Management System NMX-CC-900-IMNC-2000 and Continual Improvement
R e q u i r e m e n t s
C U S T O M E R
CUSTOMER
sati
sfaction
Management Responsibilities
Measurement, analysis and improvement
Resource Management
Completion of Product
and/or service
“Quality assurance is the part of quality management oriented towards providing confidence that quality requisites will be met” (NMX-CC-9000-IMNC-2000). “Quality assurance is the combination of planned and systematic activities carried out by an organization with the object of offering the appropriate confidence that a product or service meets the specified quality requirements.” (Decanini, 1997) “Quality control is the part of quality management oriented towards compliance with quality requisites.” (ISO-IMNC,2001) and is also defined as: “the combination of operative methods and activities employed to satisfy compliance with established quality requirements “ (Decanini, 1997) “Quality management is the combination of activities through which quality policy is determined and applied, including in turn the establishment of quality objectives, the identification of processes necessary for the quality management system, the determination

8
and interaction of these processes, the determination of the criteria and methods for the efficient control of said processes, the allocation of resources and a commitment to the continual improvement of these processes.” (Decanini, 1997). “The quality management system is defined as a combination of mutually related or interactive elements for establishing policy and objectives and for the achievement of said objectives and which is the system for directing and controlling an organization with respect to quality”. (ISO-IMNC,2001) 3.1.3 The Origin of Quality Assurance in Air Quality Measurements2
Quality Assurance in the practice of air monitoring has its origins in monitoring programs carried out by the government, universities, research organizations, private companies and test laboratories, all of which have done important work in those aspects related to:
• The provision of reference methods for measurement. • The preparation and undertaking of assessment of the aptitude of measuring
equipment. • The qualifications and recognition of the authority of experts or technicians. • Inter-laboratory or inter-institutional tests for measurement tasks in the area of
air quality monitoring for accredited monitoring stations. Fig. 3.2 offers an example of the interaction between the different actors that have participated in the development of air monitoring techniques and the subsequent need to introduce quality control and quality assurance systems to guarantee the quality of data in the measurement of the concentration of air pollutants in Germany.
2 http://www.umweltbundesamt.de/messeinrichtungen/moimi12.htm

9
Fig. 3.2 Interrelation of the diverse authorities for the development of the AC in air monitoring
Public Administration
Universities and research institutes
Research and development requests
Grading of experts and technicians
Research and
development requests
Development
Reference method procedures Aptitude Tests
Scientific bases Regulations, standards,
guides (federal dependencies)
Approval
Guides
Performance of assessments
Application
Standardization, technical guides
Approval
Test Application
Assessment of measurement reports
On-site inspection
Comparative measurements Application
Private Companies
Calibration and Analysis
Laboratories
Translated from: http://www.umweltbundesamt.de/messeinrichtungen/moimi12.htm 3.2 Principles of Quality Management Quality management is based on eight principles, the precepts of which are briefly described below. Said principles should be understood and applied by Senior Management to achieve a successful development of quality in their organizations (ISO-IMNC,2001)
1. Focus on the client The basic rule of quality is that “the client is of primary importance”, and for this reason in a traditional scheme the general benefits of this principle are reflected in an increase in profits and market participation with the achievement of the complete satisfaction of the client via timely and flexible responses to their requirements. In the case of SMAs the product is an intangible service, specifically data concerning the concentration of pollutants and the value of the meteorological parameters generated. The customers are the users of said information: authorities and the public, while the quality would be essentially indicated by the reliability of the data.

10
2. Leadership Any organization committed to Quality requires an ultimate enterprising authority whose leadership reaches each and every member of the organization. The benefits of this principle will be translated into the motivation of personnel and their commitment to the organization’s goals and objectives, which should be ambitious but realistic. Likewise, the middle management level of an SGC should promote and strengthen the individual leadership of all members of the organization. In this context it is very important to provide the resources, necessary training and recognize the contributions of personnel within the scope of their functions. 3. Teamwork Once personnel are motivated, committed and involved, it is indispensable that each member of the organization knows their functions and responsibilities, as well as the determinant role they play in the productive process for the achievement of objectives and the relevance of teamwork. The benefits of this principle are that the performance of personnel and their willingness to participate and contribute to continual improvement in the achievement of common objectives and goals is noted. 4. Process based focus This principle is based on the identification of key processes and activities to obtain desired results based on the allocation of responsibilities and methods of monitoring (supervision) and measurement of results. In the identification of processes the stages, control measurements, training, activities, information, equipment, materials and other resources to achieve the desired result should be taken into account. Likewise, it is also very important to evaluate the possible risks, consequences and impact of the processes on clients, suppliers and other interested parties. The benefits of this principle are the optimization of costs by means of the efficient use of resources with improved, consistent and predictable results.
5. Systematic Management Focus This principle consists of the integration and alignment of processes and activities that achieve better results, also in the ability to focus efforts on critical activities. The benefits of this principle are translated into confidence, consistency and efficiency by both internal and external customers. External customers are the end receivers of a service or product, and internal customers are the intermediate receivers of a component or activity within a production chain, e.g. in an SMA laboratory an analyst is the customer (internal) of the sampling technician.

11
6. Continual improvement This principal requires the periodic revision of not only the activities and procedures but also the deviations identified through the SGC to identify opportunities for improvements. The benefits of this practice are the incorporation of innovations or forecasts that that are translated into a higher level of quality in the products or services offered to the customer.
7. Decision Making based on Results Decision making in an SGC should be effected on the basis of available data and/or sufficient and reliable information to justify or demonstrate that changes or innovations undertaken within the system are desirable for the organization. The benefits of this principle are essentially to provide necessary and sufficient support for the management of resources leading to improvements in quality. 8. Mutually beneficial relationship with suppliers Suppliers play a Fundamental role in the achievement of the quality objectives and goals of an organization, therefore policies are required that benefit both parties based on schemes known as “Win/Win”, whereby each party states its critical needs, for example, delivery time of a material and the payment method required by the other party to satisfy said demand and where solutions are sought for the mutual benefit of the parties.

12
3.3 Preliminary Activities of the Quality Management System (SGC) Any Air Monitoring System to be implemented by an SGC, in accordance with the requirements of standards: NMX-CC-9001-IMNC-2000 and NMX-EC-17025-1999, should generally follow the six initial stages indicated in Fig. 3.3, the description of which follows.
Fig. 3.3 Stages for the introduction of an SGC
a).- Identificar los procesos y/o actividades en el SGC y como serán manejadodentro de la organización.
s
b).- Determinar la secuencia e interacción de estos procesos.
c).- Determinar los criterios y métodos necesarios para asegurar la operación y elControl de los procesos.
d).- Asegurar la disponibilidad de recursos e información necesarios para apoyala operación y el seguimiento de estos procesos.
r
e).- Realizar el seguimiento, la medición y el análisis de estos procesos.
f).- Implementar las acciones necesarias para alcanzar los resultados planificados la mejora continua de estos procesos.y
C O
N C
E P
T U
A L
I Z
A C
I Ó
N
a).- Identificar los procesos y/o actividades en el SGC y como serán manejadodentro de la organización.
s
b).- Determinar la secuencia e interacción de estos procesos.
c).- Determinar los criterios y métodos necesarios para asegurar la operación y elControl de los procesos.
d).- Asegurar la disponibilidad de recursos e información necesarios para apoyala operación y el seguimiento de estos procesos.
r
e).- Realizar el seguimiento, la medición y el análisis de estos procesos.
f).- Implementar las acciones necesarias para alcanzar los resultados planificados la mejora continua de estos procesos.y
a).- Identify the processes and/or activities in the SGC and how they will be managed within the organization
C O
N C
E P
T U
A L
I Z
A C
I Ó
NC
ON
CE
PT
UA
LIZ
AT
ION
b).- Determine the sequence and interaction of these processes
c).- Determine the necessary criteria and methods to secure the operation and control of the processes
d).- Secure the availability of necessary resources and information to support the operation and monitoring of these processes
e).- Conduct monitoring, measurement and analysis of these processes
f).- Implement necessary
The conceptualization activities of the SGC indicated in the previous figure are briefly described below:
a) Identify the processes and/or activities that should form an SGC and how they will be managed within the organization. This would mean in the case of a specific SMA, review all processes and/or activities involved in obtaining the data (product), for example: samples and/or monitoring; laboratory analysis, reports, processing, transmission and validation of data, including publication for the public or, when the case arises, SEMARNAT.

13
b) Determine the sequence and interaction of these processes. This analysis is conducted to identify the most relevant control points, which help minimize faults in the processes, as well as increasing the reliability and quantity of data to report, as well as determining the existing interaction between different areas or activities.
c) Determine the criteria and necessary methods to ensure that that both the operation
and control of these processes is efficient.
In this context, it is necessary to review both the methods employed and those necessary to ensure quality, for example, for the optimum functioning of the unmanned analyzers, the AC elements used to achieve said objectives, whether Calibration Program and maintenance, calibration procedures, training requirements for operating personnel, etc.
d) Secure the availability of necessary resources and information to support the
operation and monitoring of these processes.
Resources are an indispensable factor in any operational process. For SMAs these should be considered from the moment of annual budget planning, taking into account not only the means necessary for operation, but also the resources necessary for preventative and corrective maintenance, as well as training to ensure systems function efficiently at all times and are updated. It is essential to draw up the operating and purchase plan in a timely fashion.
e) Undertake monitoring, measurement and analysis of these processes.
This requirement is related to the supervision and assessment of processes and activities, via recording systems such as logs, calibration formats, control cards, etc. in which who reported to whom and with what frequency is established.
f) Implement necessary action to achieve planned results and continual improvement of
these processes.
This stage refers to the development of internal and external audits and, when necessary, inspection. Air monitoring systems should additionally develop corrective and preventative action based on audit or inspection results. Additionally, processes for the continual improvement of quality management systems should be established and applied.

14
3.3.1 Activity Program
Once a conceptual view of activities and processes necessary for an SGC is established, the next stage is the elaboration of a work program which establishes in greater detail the logical sequence of activities necessary for the progressive implementation of the SGC. In this phase it is essential that key personnel in the organization who will actively participate in the introduction of the SGC have thorough knowledge of the specific requirements of the standard so that in each of the programmed activities there is verification that all requirements established in each number are taken into consideration. It is also of fundamental importance that for each Program activity responsibility is designated for the coordination and monitoring of the same and that periodic meetings are scheduled where those responsible report their respective advances and engage in an exchange of ideas and proposals for the solution of problems identified by the participants. Fig.3.4 offers a simple example of an activity program for the implementation of an SGC.

15
Fig. 3.4 Activity Program for the Implementation of an SGC
AIR MONITORING SYSTEM General Program of activities for the establishment, documentation, implementation, monitoring and improvement
of the quality management system -SGC- according to Mexican standard NMX-CC-9001-IMNC-2000.
200x
Month 1 Month 2 Month 3 Month 4 Month 5 Month 6 Month 7 Person
Responsible M.R.F.
Activities for the introduction of the SGC
1 2 3 4 1 2 3 4 1 2 3 4 1 2 3 4 1 2 3 4 1 2 3 4 1 2 3 4 Progress(%)
Review of existing processes and establishment of Policies and Objectives
90 %
Identification and determination of processes and their sequence
80 %
Definition and integration of quality handbook 15 %
Circulation of quality handbook 0 %
Revision and implementation of obligatory and necessary procedures
30 %
Revision of SGC by Management 0 %
Internal audit of SGC 0 % Management of corrective and preventative action 0 %
Continual improvement projects 0 %
External audit 0 %

16
4. DEVELOPMENT OF QUALITY MANAGEMENT SYSTEMS The National Air Monitoring System (PNMA) has the stated objective that before the year 2010 all air monitoring systems (SMAs) operating in the country will have introduced a Quality Management System (SGC) approved by the SEMARNAT Said SGCs should include as a minimum the following aspects:
• Organizational Structure (Functions and Responsibilities). • Definition of quality objectives, in particular in relation to air quality data. • Program for personnel training. • Document organization system, including a general handbook, procedures, logs,
reports and records, among others • Program of self-evaluation, accreditation and/or certification. • Procedures for:
− Installation, operation, maintenance, calibration, testing and replacement of stations and measurement instruments.
− Collection, recording, transmission, validation, storage and processing of meteorological and air quality data.
− Statistical analysis and data reports. − Attention to air quality alerts. − Internal and external communication. − Survey, chain of custody and sample analysis for manual measurement
parameters. “Quality Management” begins by determining and establishing quality policy which in turn includes the establishment and fulfillment of quality objectives, the identification of necessary processes for the SGC and its respective interaction, determination of criteria and efficient methods for control, the allocation of resources and commitment to continual improvement of these processes (Decanini, 1997). With relation to SMAs, the aspects of Quality Management that can be grouped in this category are: the definition of a policy and quality objectives, quality planning, the definition of responsibilities based on organizational charts, the definition of quality programs and activities, the allocation and management of resources, the revision of quality management systems focused on continual improvement. In the case of SMAs, the activities of quality assurance includes such aspects as administration, finances, design of networks and associated services, purchasing (including contracting), testing methods applied in operation, document systems and control, data management and release of information, training and assessment activities such as audits of various kinds. With regard to air monitoring systems, the aspects grouped as quality control include calibration and maintenance, revision and validation of data.

17
4.1. Aspects related to Quality Management in Air Monitoring Systems (SMAs) 4.1.1. Quality Policy To comply with the principles of an SGC, policy should be adapted to the objective of the organization. Policy represents the frame of reference to establish quality objectives which should be periodically reviewed to determine their validity and where necessary updated. Likewise, a guarantee is required that the Quality Policy will be communicated to and understood by all members of the organization. The Quality Policy of each SMA should be formulated and supported by senior management and should be adapted to its objectives, taking into account the objectives of the Air Monitoring System (SMA) in question and including a commitment to meet the relevant certification or accreditation standards (e.g. NMX-CC-9001-IMNC-2000 and NMX-EC-17025-1999), as well as to continually improve the efficiency of the Quality Management System for the benefit of customers. An example of Quality Policy for a hypothetical SMA operating in the city of Querétaro, Qro. could be set forth in the following terms:
“All members of the SIMAQ accept the commitment to generate reliable air quality data for the benefit of the community. For this reason we make a daily effort to satisfactorily meet current quality objectives and the requirements of NMX-CC-9001-IMNC-2000, based on a continual process of improvement of our Quality Management System”
4.1.2. Responsibilities In any SGC the responsibilities and degree of authority of each actor within the organization should be clearly established and it should be verified that these are communicated to and understood by all participants. It is understood that the maximum authority of the SMA should be committed to quality and its responsibilities and functions related to Quality should be declared in document form in the Quality Handbook of the SGC. An example of the terms in which said commitments should be expressed in a Quality Handbook are as follows:

18
Example 1: Declaration of Responsibility of the SGC with General Management
1. In my capacity as Director of the Querétaro Air Monitoring System, I declare to all members of our organization and representatives of accreditation and certification bodies; our clients and suppliers, my absolute responsibility for the planning, development, application, revision and authorization of an SGC in our Monitoring System consistent with Mexican standards: NMX-CC-9001-IMNC-2000 and NMX-EC-17025-1999 concerning quality systems or their equivalent (ISO 9001:2000 and ISO/IEC 17025:1999), to comply with the guidelines established by the National Air Monitoring Program (PNMA) and the requirements of data reports and quality entrusted to us via the SINAICA.
2. I also delegate, as their assigned tasks, corresponding responsibilities concerning functions and
activities, so that all members of our organization with their respective training, ensure the correct application and demonstrative fulfillment of this SGC handbook.
3. I designate a person with sufficient authority and organizational freedom, as well as my full support,
to conduct audits and inform me periodically of the results of the general application of the system.
4. I give my total support to the maintenance and continual improvement of our SGC for the benefit of all our clients and our SMA.
5. It is my responsibility that that SGC of the SMA is documented and distributed specifically in
correspondence with all areas and technical, operative and administrative levels as the principal tool for the development of our activities to ensure the quality of functions and in general all activities implicit to the sampling, monitoring and analysis activities performed by our organization.
6. The procedures and other documents derived from the scope of this Quality Assurance handbook
should be developed by the managers, Area Managers and the General Management, according to their competence, as part of programs planned, documented, assigned and introduced by the SGC manager.
For the following levels of the organizational structure of the SMA the responsibilities and degree of authority should also be documented in the Quality Handbook. The following are to be included in the documents named Description of Functions in a clear and unambiguous manner:
1) Job Title 2) Person to whom reports 3) Management level to which belongs: 4) Personnel under their control 5) Justification and objective of position 6) Generic responsibilities of the Position 7) Interdepartmental Communication 8) Level of authority within the organization 9) Level of authority outside the Organization 10) Place of work or alternatives
In this way the generic responsibilities of the Position are declared and documented in the SGC as indicated in the following examples 2 and 3.

19
Example 2: Allocation of Responsibilities for the Quality Management Department Manager.
1. Prepare, review and distribute updated SMA Quality Handbook (MAC – acronym as given in Spanish).
2. Prepare, review, update and distribute Quality Assurance Procedures (PACs – acronym as given in Spanish)
3. Review and approve operational procedures and verify their distribution 4. Conduct annual purging of quality assurance files 5. Verify processes performed in the SMA to ensure they are executed with the specified quality 6. Coordinate the activities of data review, verification and validation, based on the established
acceptance criteria for quality control 7. Formulate specific programs of verification, testing and registers that should be applied at each
operative and functional phase of the SMA 8. Design, prepare and introduce with the authorization of General Management an efficient procedure
for the treatment of complaints (non-conformities) and the respective preventative and corrective action
9. Coordinate and participate with the SGC internal audits, analyze the results, verify that relevant preventative and corrective measures in each area’s field of competence have been applied and inform General management of the results of said action
10. Facilitate, promote and develop training programs in all SMA areas
Example 3: Allocation of responsibilities for the Air Monitoring Area Manager
1. Supervise and organize personnel to achieve a satisfying conclusion to programmed sample and analysis activities
2. Assign activities to technical personnel for the completion of work programs 3. Guarantee, in agreement with operational procedures, an adequate sample selection and the
performance of analysis 4. Guarantee, in agreement with that established by the SGC, an adequate system of identification
and tracing of completed jobs 5. Guarantee, in agreement with operational instructions, adequate handling of equipment and
instruments 6. Evaluate the good condition and functioning of equipment, and also its compliance with calibration
and maintenance programs 7. Perform periodic reviews of the condition of equipment or instruments, consumables, equipment
subject to wear and parts with the objective of determining the economic and technical needs that permit the planning of corrective activities and/or, where necessary, reinvestment
8. In coordination with Management, participate in the review of operational procedures in the area and verify compliance with the guidelines established by the SGC.
9. Verify the adequate handling of samples during the development, transportation, analysis and even in the transmission of reports
10. Verify the appropriate filling out of sampling conducted, the results of the analysis, calculations and information required for the issuing of the report
11. Review field formats of the sampling conducted, results of the analysis, calculations and information required for the report of same.
12. Verify that all stages of the air quality monitoring process up to the reception of personnel at the computer center are registered according to that established by the SGC.

20
. Finally, it is important to point out that in all SGCs the allocated functions and responsibilities should be transmitted via efficient communication channels that guarantee their understanding and application.
4.1.3. Quality Planning Each SMA should have a Quality Assurance Plan (PAC – acronym as given in Spanish), (or Quality Plan, PC, as you prefer to name it) which is defined as: “The formal document that objectively describes the technical and administrative activities of quality assurance and control (AC/CC – acronyms as given in Spanish) that should be introduced to ensure that results of work performed satisfy the declared performance criteria” (ANSI/ASQC Std E4-9) Based on the above, the PACs of the SMAs should be oriented towards a description of the aspects and activities of the most relevant AC and CC that will be introduced in each of the stages implicit in air monitoring to ensure that the quality of the data meets declared objectives. A PAC is usually structured by sections and includes a basic description of the following points related to Quality Assurance:
1. Quality policy and objectives. 2. The organization responsible for the monitoring system, the organizational chart, the
respective responsibilities for key activities in the quality management system and training requirements.
3. Quality control and assurance activities, including the description of methods used, equipment, purchasing procedures, operation handbooks, work procedures and instructions, calibration procedures.
4. Standards used, traceability and certification criteria. 5. Processing of data and validation of same. 6. Audits, corrective and preventative action, revision of the quality management system
and 7. Reporting Schemes 8. Quality Management System documentation.
It is recommended that in said plan there is a detailed breakdown of the quality assurance and control the organization will adopt in its principle operational processes, which could include:
1. Installation, operation, maintenance, calibration, testing and reposition of measuring stations and instruments
2. Collection, recording, transmission, validation, storage and processing of meteorological and air quality data
3. Statistical analysis and data report
21
4. Attention to air quality alerts 5. Internal and external communication 6. Training 7. Sampling, chain of custody and analysis of samples for manual measurement
parameters As can be seen, preparation of the PAC begins with the definition of the objectives of each monitoring system. All subsequent steps refer to the development of programs, procedures and activities to meet established objectives.

22
4.1.4. Quality Objectives To support and manage the appropriate quality assurance activities, the organization should establish and declare the objectives it plans to achieve in terms of quality, and at an initial level it could set general objectives such as:
1. Provide data with the required accuracy and precision to verify compliance with air quality standards.
2. Minimize air quality data loss due to faults in the functioning of measuring
equipment and instruments.
3. Evaluate the quality of air monitoring data to guarantee its representativeness and comparability
At a more specific level, each SMA should focus its quality assurance activities on the greatest control possible of the quality of data concerning concentrations of pollutants in the air being assessed. As part of the considerations of the PNMA, it is both desirable and recommended that said data quality objectives be established by SEMANART-INE via the DGCENICA by means of a similar process practiced by the EPA in the U.S.A. Evidently, the complexity and criteria of precision and accuracy applicable in Mexico in an initial stage should be assessed. Some examples of data quality objectives could be expressed in the following way:
• Accuracy – based on functioning audits, air quality data should be within +/- 15 % of the theoretical value considered true (VTCV), with the exception of flow details of PM10, which should be within +/- 10 % of the VTCV. For the NOx analyzers the efficiency of conversions should be equal to or greater than 96 %. The confidence interval at 95 % of probability limits should be greater than 80 %.
• The minimum percentage of integrity for annual data bases for each standardized pollutant should be 75%.
• The data obtained by monitoring stations for standardized pollutants should have an 80% minimum level of confidence, in relation to representativeness and scale.
• Instrumental error in the measurement of each standardized gaseous pollutant should not be greater than +/- 5% in a single year.
• Instrumental error in the measurement of standardized particles should not be greater than +/- 7% in a single year.
Other quality objectives and specific goals of each SMA could be established in the pertinent functions and levels within the same SMA and its respective SGC and should be coherent with the quality policy established.

23
Likewise, when the PAC involves activities or unavailable materials to ensure the quality of a particular process, these should be programmed and established as objectives and quantifiable indicating periods, responsibilities and necessary resources for their attainment. Additionally, whether the specification of the operational processes and related resources in order to meet quality objectives is required. 4.1.5. Resource Management for the SGC In general terms resource management could be defined as: “... the ability of the organization to provide the SGC with the financial and human resources as well as infrastructure (installations, equipment and materials) necessary and sufficient to guarantee appropriate performance”. Indicated below are some criteria and ideas that facilitate the interpretation of this normative quality requisite applied to SMAs. Financial Resources Any organization operating an SGC inevitably requires a budget in accordance with the specific characteristics of its scope. In the case of systems established in productive organizations it is understood that the financial resources are self-generated via production activity. In the case of SMAs located where there are no profitable activities, the availability of financial resources is complicated and will normally come from government derived budgets. Nevertheless, it is important to point out that one of the most critical factors to be observed in current monitoring networks is precisely the serious limitations of economic resources for the performance of functions. With respect to this point, it should be considered that it is difficult to introduce and maintain an SGC without funds. By the very nature of this activity it is of vital importance, on the one hand, to convince senior government authorities of the importance of measuring air quality in air sample areas within their jurisdiction and, on the other; that SMAs design alternative financing strategies to make their operation viable. Human Resources In the case of Human Resources, each SMA should ensure it has the quantity and quality of personnel necessary for the appropriate operation. In this way, via the SGC the performance of personnel doing work directly related to the quality of data should be assessed and an adequate profile should be guaranteed in each case. Said process is to be conducted by including a description of the profiles for positions in the document section of the SGC.

24
In turn, SGC management should consider the requirements of the standard with regard to training programs, oriented towards improvement of the technical level, capacities and skill of its personnel, and providing documentation through registers of their application. It is also recommended that operative and management personnel possess sufficient and proven experience in the field of engineering and environmental science and also undergo a program of periodic retraining and education. This training can be conducted via formal and virtual courses, workshops, conferences and on-the-job training. Infrastructure With regard to infrastructure, the organization should provide and maintain the installations, equipment and necessary materials for the appropriate performance of its functions. The infrastructure includes buildings, workspaces, associated services, sampling and monitoring equipment, consumables, spare parts, meteorological instruments, purchasing systems, data transmission systems and support systems such as transport and communications. The management of said resources in the SGC also includes the design of appropriate programs for replacement and stock control that guarantee the continuing operation of said infrastructure as a fundamental condition in the process of air quality data generation.
4.2 Aspects Related to Quality Assurance One of the most easily understood definitions of Quality Assurance (AC), identified for the present document, is the following: “Quality Assurance is the system integrated by activities including planning, implementation, assessment, reporting and improvement to ensure that a process, product or service is of the type and quality required and desired by the customer”
(ANSI/ASQC Std E4-9) Based on this definition, it can be concluded that the AC includes those activities planned and implemented to ensure the quality of the product or final service, which should be objectively demonstrated, that is to say, they should be documented to demonstrate correspondence with this fundamental requisite implicit in all quality standards. Demonstration of said requisite is effected via a Document System that constitutes a central component of all SGCs and the principle characteristics of which are referred to below.

25
4.2.1. Document System Returning to some of the aspects discussed in previous sections, such as declared quality policy and objectives, SMAs should incorporate a document system that integrates, organizes and interrelates all activities related to quality. A document system normally includes the following:
• A quality handbook offering coherent information concerning the quality management system.
• General procedures of the AC, which explain the specific policies practiced by the
organization to meet quality standard requirements and others established by certification or accreditation authorities or entities.
• Operational procedures that describe in detail the different stages in the
development of an air monitoring process including the submission of reports.
• Work instructions and formats related to the various processes. • Registers that may consist of data that offers objective evidence of the activities
performed or results obtained. In addition there should be complementary documents that establish specifications, reference standards and guidelines related to activities performed, and which should form part of the organization’s Document archive. Figure 4.1 illustrates the typical hierarchical structure of an SGC’s Document System in relation to the importance and volume of related documents.

26
Fig. 4.1. Pyramid of existing documentation in a quality management system
Política
y
Obj adetivos de Calid
Manual de Calidadcon sus diversas secciones
Procedimientos mandatorios delsistema y los que agregan valor
yprocedimientos de operación
Instrucciones de trabajo
Registros
Quality
Policy
and objectives
Quality handbook
with various sections
Mandatory system procedures
and those that add value, and operational procedures
Work instructions
Records
4.2.2. Quality Assurance Procedures (PACs) As can be observed at the second level of the documentation pyramid, the middle part consists of the Quality Assurance Procedures (PACs) which, as mentioned previously, explain the policies and general activities required to meet the requirements of quality standards and others established by certification and accreditation authorities or entities. In practice some organizations choose to include PACs as an integral part of the quality handbook and in other cases as a separate handbook detailing quality assurance.

27
A tentative table of contents for a Quality Assurance Procedures Handbook for an SMA could appear as follows: 4.0 QUALITY ASSURANCE HANDBOOK 4.1 Introduction 4.2 Contents
• PAC 01 Drawing Up of Procedures • PAC 02 Document Control • PAC 03 Purchase of Services and Supplies • PAC 04 Complaints and Claims • PAC 05 Test Control or unsatisfactory calibration • PAC 06 Corrective Action and Preventative Action • PAC 07 Control of registers • PAC 08 Internal audits • PAC 09 Personnel and Training • PAC 10 Installations and Environmental Conditions • PAC 11 Test Methods • PAC 12 Measuring Equipment and Instruments and Laboratory • PAC 13 Traceability, Reference Materials and transfer standards • PAC 14 Data handling (revision, verification and validation) • PAC 15 Reporting, transmission and publication of Data
4.2.3 Operational Procedures (POs) At the next level of the documentation structure we find the Operational Procedures which explain in detail the form in which the methods of testing, measurement, analysis, revision, calibration, maintenance and other activities are conducted to ensure quality in the development of the processes, the accuracy and precision of data and the credibility of the organization. Wording of the procedures should be clear and understandable for personnel. Document 4 offered a detailed description of the usefulness of POs as a working tool in the practice of Air Monitoring and the basic components used to draw them up. Considering the characteristics of Air Monitoring Systems currently operating in the country, for which infrastructure is basically oriented towards the evaluation of criteria for pollutants and meteorological parameters, the Operational Procedures to be developed based on a criteria of Testing Methods employed by an SMA could include, among others, the following:
P0 - SIMAQ-001 Selection of Sample Sites and Installation of Probes P0 - SIMAQ-002 Procedure for the Determination of PM10 concentrations in the air
(Manual Method –High Volume) P0 - SIMAQ-003 Procedure for the Determination of PM10 concentrations in the air
(Instrumental Method – Beta Optical Attenuation)

28
P0 - SIMAQ-004 Procedure for the Determination of Ozone concentrations (O3) in the air (Instrumental Method – UV Phonometry)
P0 - SIMAQ-005 Procedure for the Determination of Sulfur Dioxide concentrations (SO2) in the air (Instrumental Method – Florescent Pulsation)
P0 - SIMAQ-006 Procedure for the Determination of Nitrogen Dioxide (NOX) concentrations in the air (Instrumental Method - Chemiluminescence)
P0 - SIMAQ-007 Procedure for the Determination of Carbon Monoxide (CO) concentrations in the air (Instrumental Meted – Non dispersive infrared)
P0 - SIMAQ-008 General Procedure for the Determination of Wind Velocity and Direction.(Vw and Dw); Temperatures( Bs and Bh) and Barometric Pressure Pbar. in the SIMAQ Meteorological network.
P0 - SIMAQ-009 Acquisition, storage, revision and transmission of data at SIMAQ Monitoring Stations.
P0 - SIMAQ-010 Pulley Procedures, Acquisition, Central Storage of information. 1st and 2nd Level Revisions, verification and validation of data to the SIMAQ Computer Center.
P0 - SIMAQ-011 Procedures for the writing of Reports (internal, public and transmission of data to SINAICA.)
Each of the POs should be structured and written according to the PAC for the drawing up of Procedures current in the SGC and in the case of Operational Procedures for Air Monitoring Methods, the content should include such sections as:
1. Objectives and application 2. Summary of method 3. Definitions 4. References 5. Preventative measures 6. Interference 7. Personnel and Responsibilities 8. Equipment and materials 9. Instrument calibration or method 10. Collection of Samples 11. Handling and conservation, preparation of samples and analysis 12. Routine Maintenance and Fault List 13. Collection of data, calculations, and reduction of data 14. Acceptance Criteria

29
4.2.4 Work and Records Instructions At the final level of the document system we find the work and records instructions. Work instructions are documents that set out the steps in the development of specific work to be done and can often be included in the POs as an appendix, for example the specific procedures for calibration and the maintenance service of an analyzer. Frequently these are summaries translated from the instructions provided by the suppliers of equipment and instruments used in air monitoring, while in some cases certain actions are determined with reference to the original instructions for execution. In the case of SMAs, the records are logs and formats used during such activities as sampling, calibration and maintenance, analysis and reports, which indicate the date, person responsible and data concerning the activities of AC and CC conducted throughout the process of air quality data generation. 4.2.5. Document Control “Document control” refers to the way all existing documents of an organization’s SGC are ordered, easily located and protected (e.g. from damp or other conditions that could lead to damage), displaying an issue date and validity to avoid confusion and inappropriate use. Furthermore, obsolete documents should be identified, for example with a stamp or marking that states “obsolete”. It is important to point out that with respect to documents related to operational procedures, in this case air samples, special care should be taken to ensure that the current versions of pertinent documents are available in all locations where essential operations to ensure the efficient running of an air monitoring and quality control system are conducted. It should be ensured that changes are identified and that the current revision is visible on the documents. It is recommended that the work procedures or instructions for testing, inspection and equipment maintenance work be available at each monitoring station. An SGC document system should be periodically updated as part of a series of programmed revisions, or in special circumstances. For example, when modifications are made to environmental legislation, official Mexican standards, relevant extensions or modifications to monitoring systems, modifications to plans and programs of Air Quality Management or relevant modifications to the administrative and operational structure of the air monitoring system. To control these activities and procedures for the timely preparation, revision, approval, issue and use, control and maintenance/protection of documents and records should be established. Operational procedures and work instructions should be reviewed once a year, reviewed when necessary and adequately approved by authorized personnel. All information considered to be a document and record should be retained for a minimum of 5 years from the date of issue or from the date it was submitted to the SEMARNAT. In cases where it is

30
related to an investigation, audit, or other action involving records, these will be retained until such time as all related matters have been resolved. Table 4.1, offers a list of the type of documents that should be controlled in an SGC. Table 4.1 Documents that should be subject to document control Categories Examples
Organization, management and structure
• National Air Monitoring Program • Internal Regulations of federal and state Environmental Secretariats; Organizational
charts of air monitoring systems; • Personnel qualifications and training; • Quality Management System implementation program; • Document control procedure; • Support contracts.
Information concerning the air sample area to be monitored
• Studies of the air sample area characteristics, • Description of the air sample area to be monitored ; • File detailing site of the station. • Photos/ maps of the networks and the station site
Quality Management
• SGC Manual • AC procedures • AC instructions • AC Records • Control cards or forms • Internal and external audits
Quality Assurance and Control
• Quality Assurance Plan • Operational procedures • Maintenance and calibration logs • Chain of custody of handling and protection of samples, reports and audits; • Inspection and maintenance records.
Raw data • Data bases • Any original data (concerning routine or quality control)
Data reports • IMECA Reports • Statistical Reports • Publications
Note: the organization may integrate the documentation in the way it finds most convenient the purposes of handling, distribution and protection. Data security In the case of a fault in the transmission systems, stations should be equipped with computers or electronic equipment (datalogger) that allow for on-site storage of all data generated by measuring equipment during a minimum period of one month. Likewise,

31
automatic measuring instruments for meteorological parameters, gases and particles should possess a built-in capacity to store a minimum of one week’s self-generated data. For their part, computer centers should have the capacity to store in a secure form up to five years’ data and should effect an external physical back-up of the historical data base, to be stored in a building distinct to that housing the administrative offices where they operate. This final back-up should be housed in an official municipal or state Historical Archive. 4.2.6. Criteria for the Selection and Purchase of Equipment, Instruments, Materials and Consumables The process of selection and purchase is fundamental for product quality. A poor selection of equipment or materials place the quality of data at risk and can lead to the failure to achieve planned objectives. It is important to have all information relative to specifications concerning instruments, equipment, reagent or others that may be obtained to ensure they meet established quality requirements.
A) Criteria
• It is desirable that sampling equipment, monitors and calibrators used by SMAs have a National or International performance certificate. SEMARNAT, via the CENICA, may use, in the short and medium term, lists of analyzers certified by the EPA as a means of reference or Equivalents and annually notify all organizations responsible for air monitoring systems of the lists of authorized instruments and equipment for measurement and control, verification and calibration.
B) Selection
As a minimum requirement, each SMA should consider the following points when selecting equipment and instruments for control and verification:
• Objectives of the monitoring, • Accuracy of the required measurements, • On the list of authorized equipment or instruments, whether those offering services are
certified by the respective accreditation authorities, • The quality and prices of equipment and services offered to the systems, • The availability of parts and repair services.
In the selection of a monitoring method for a particular application, the following considerations, which in part are derived from the instruments operating under this method, should be taken into account:
• The aptitude of the measurement principle, including sensitivity, accuracy and precision,
• The sensitivity of the analyzer,

32
• Susceptibility to interference that may be present at the monitoring station site, • Requirements of support gases and other equipment, • Reliability of the method, • Maintenance requirements, • Initial purchase and installation costs, as well as operational costs, • Characteristics such as zero check and internal span, whether completely automatic,
or adjustment capacity, among others. Air monitoring networks should evaluate and select suppliers based on their ability to provide equipment, instruments, materials or services according to the needs of the organization. In purchasing procedures for all air monitoring networks the criteria for selection, assessment and reassessment should be established. Records of the results of the assessments and any necessary action derived from them should be maintained according to that established in document and records control. Air monitoring networks should ensure that purchasing information exists describing the equipment, instruments, material or service to be purchased. In addition, it should include documentation corresponding to requisites for the approval of purchases of equipment, material or services that may depend on technical, economic or purchasing policy, qualification requirements for personnel in the case of contracting services, and requisites of the quality management system. The purchasing procedure should also establish arrangements for proposed verification against purchasing requirements and methods for release of payments for equipment, materials and services or, when the case arises, payment policy, delivery time and guarantees required from the supplier. Some of the recommended characteristics for the selection of support equipment used in SMAs are indicated below: Dynamic Calibrators: This may have either volume flow control or permeation equipment. It is recommended they are 110 VCA, compatible with data collection systems for automatic calibration and have true logic transistor-transistor systems. Data Collection Systems: It is recommended they have 16 bit minimum logic, modem capacities, permit remote control and access to initiate remote calibration. Analog cards for Graphics Devices: It is recommended card recorders are able to support various nibs, accept entries of differing voltage (e.g. able to accept entries of 1, 5 or 10 volts) and can be programmed.

33
Instrument racks: Racks should be made of steel and have sliding rails. Open racks help to maintain equipment temperature low and facilitate air circulation. Zero air systems: These systems should be capable of supplying 10 liters/minute of pollutant-free air, free for example from ozone, NO, NO2, SO2 up to 0.001 ppm and CO and hydrocarbons up to 0.1 ppm. Verification Instruments Verification instruments can be equipment for the review of correct electronic functioning of equipment with reference gases. Control and verification activities can be subcontracted provided that those performing the tasks are recognized and certified for such activities by the EMA or any other entity with certification powers. Each air quality monitoring network should possess control instruments and verification procedures for equipment and components of sampling equipment to guarantee the performance of the network in line with levels established by the SEMARNAT. Computational systems used for Quality Control The choice of computational systems to process and deliver information on time merits special attention. These systems should be able to:
• Calculate calibration equations. • Calculate measurements of calibration linearity (e.g. standard deviation or correlation
coefficient). • Print calibration curves. • Calculate zero/span deviation or range results. • Print zero/span deviation data. • Calculate precision and accuracy of results. • Calculate limits of control cards. • Print control cards. • Provide automatic registration of results indicating an abnormal state – outside control
of instruments or sampling and analysis arrangements. • Maintain and obtain calibration and performance records.
Equipment should always be in good condition and subjected to inspection tests and appropriate maintenance to guarantee reliable operation and performance. Due to the great variety and number of existing sets of equipment, here we will only indicate general aspects to be taken into consideration:
• List of equipment by network and station, • List of equipment or spare parts – by equipment set, including suppliers for same. • Frequency of inspection and maintenance of set of equipment,

34
• Frequency of testing and source of test concentration or testing equipment, • Programs for equipment replacement, • Instances or repairs of set of equipment, • Service agreements existing on site, • Monthly check lists and record formats to document tests, inspections and
maintenance conducted. These concepts are defined in greater detail in the document “Operation, Maintenance and Calibration of Air Monitoring Systems”(documents 3 and 4 of this series). 4.2.7. Internal and External Audits The effective operation of an SGC should be periodically assessed via Internal and External Audit Programs. The first are an evaluation requisite of Quality Standards that should be performed as an integral part of the SGC of the SMAs. The second will be related to demonstrate compliance for the purposes of certification and/or accreditation. Internal Audits Those responsible for SMAs should conduct periodical internal audits of their activities based on a scheduled program, with predetermined procedures to check that operations continue to meet the requirements of the SGC. The objective of these audits is to identify deviations or omissions in order to later undertake relevant corrective action and formulate preventive measures leading to the minimization of their recurrence and therefore a strengthening of the continual improvements process. The internal audit program should be directed at all components included within the scope of the SGC. The person responsible for the SGC should plan and organize audits according to the program or when an important deviation in the system has been identified that leads to a complaint or claim. Internal audits should be performed by trained and qualified personnel (internal auditors) from within the SMAs, this is a very important requisite for meeting the standard and it should always be ensured that those auditing specific areas or activities are not directly related to them. Auditors should define the requirements of each audit, plan the audit., evaluate document support for the activities they perform and determine whether they are sufficient. If a deviation is discovered this should be communicated immediately to the person responsible for the area being audited both for their information and agreement that said deviation will be recorded, whether as a fault or as an observation corresponding to the fault, reporting any important obstacle encountered during the audit and giving the results of the audit in a clear and conclusive fashion.
35
In this context reviews by management are important and should also be scheduled with established procedures for the review of the SGC, ensuring its adequacy, continuing effectiveness and the introduction of necessary changes or improvements. External Audits Once SMAs have implemented their SGC, the PNMA has anticipated the development of a procedure involving periodic audits to ensure the quality of the service offered to the community, given that the objective of monitoring systems is to ensure the meeting of official Mexican air quality standards. The proposal for external audits to which said bodies would be subject are set out in document 6, and these audits are based not only on the accreditation procedure current in Mexico as established by the federal metrology and standardization law but also on audit programs developed in the United States via the EPA for the evaluation of the performance of SMAs. The audits would include the following three types of evaluation: 1) technical system audits, 2) functional audits and 3) data audits the functional reach of which are described in said document.

36
4.3 Aspects Related to Quality Control 4.3.1 Criteria for quality control in air monitoring systems In general terms quality control is defined in the following way: “ The system of technical tasks that measure the attributes and performance of a process, product or service against defined standards to check that these meet quality requirements established by the customer and/or testing methods, and/or authorities” Based on the above, in the specific field of Air Monitoring, Quality Control includes those tasks related to control during the collection of samples, handling, analysis, revision, verification of data and reports. Evidently this includes periodic calibration, routine service checks, monthly maintenance checks for the quality control of specific instruments and sampling and analysis of duplicated or enriched samples. Quality control activities are performed to ensure that in air monitoring the reading of measurements reflect air quality values and that these are maintained within accepted criteria for meeting data quality objectives. Quality control is corrective as well as proactive, establishing techniques to prevent the generation of unacceptable data and establishing policy for corrective action via:
• Techniques used for quality control; • Frequency of checks and the point in the measurement process when checks
are introduced; • The traceability of standards; • The scheme for verifying the sample; • The concentration level of the substance to be analyzed; • Action to be taken if a quality control check identifies a measurement system
that fails or has changed; • Formulas to estimate data quality indicators; • Procedures to document the results of quality control, including control or
protocol cards or forms: • Description of how data will be used to determine whether performance of the
measurement is acceptable in the context of data verification and validation. Other SGC elements that may include requirements related to quality control include:
• Design of the sampling that identifies planned quality control samples as well as procedures for the preparation and handling of quality control tests;
• Requirements for sampling methods that include requirements to determine whether collected samples adequately represent the population under consideration,

37
• Requirements for handling and protection of samples that should describe any quality control equipment used to ensure the samples are not altered (e.g. protective seals) or subject to other unacceptable conditions during transport,
• Requirements for analytical methods that include information of methods prior to and after sampling and the information for the preparation of quality control samples (e.g. blanks and replicas) ,
• Calibration of instruments and frequency that define prescribed criteria for requesting calibration (e.g. checks of a failed calibration).
4.3.2. Standards and calibration transfer laboratory The standards and calibration transfer laboratory is considered an aspect of quality assurance as it offers a group of planned and systematic activities that are carried out with the object of providing the appropriate assurance that air monitoring and associated services meet specified quality requirements, although the laboratory itself may include aspects classified under “quality control”. (EPA, 1998). Each air quality monitoring network should have a standards and calibration transfer laboratory. These laboratories may be subcontracted for this service when they possess the relevant accreditation from the EMA or another laboratory certification body for the purposes described. (EPA, 1998). Laboratories should be integrated into the quality system of the respective air monitoring systems and should apply the “Good Laboratory Practices”. (EPA, 1998). “Good Laboratory Practices” refer to general or common practices related to a great number, although not necessarily all, measurements conducted in the laboratory. Good laboratory practices are normally independent of standard operational methods, such as, for example: maintenance of installations, records, handling and storage of samples and the cleaning of glassware in the laboratory, among others. These practices are not usually documented in a formal manner as they are considered common sense. Nevertheless, they should be documented if they could possibly lead to unnecessary insecurity in measurement or may represent a significant deviation or bias. (EPA, 1998). The following are principles of “Good Laboratory Practices”:
• Administration of testing installations • Administration of personnel. • Equipment, materials, reagents and installations. • Testing systems. • Standard operational procedures. • Completion of the study. • Report on results of the study. • Storage and retention of records and materials.

38
The definition of each of the above points needs to be drawn up in detail for each particular laboratory, reflecting its specific characteristics. In general, the following basic principles should be met by all standards and calibration transfer laboratories:
• Equipment should be calibrated and maintenance conducted frequently and adequately.
• Personnel conducting the analysis should be qualified. • Analytical procedures should conform to accepted practice. • Complete and precise records should be kept.
In air monitoring programs, laboratory activities should be focused principally on pollutants associated with manual measurements (e.g. lead, particles and Coves). Nevertheless, many laboratories also prepare reference materials, conduct tests and certify equipment and undertake other necessary activities to collect and report measurement data. Each laboratory should define these critical activities and ensure that consistent methods for their implementation exist. (EPA, 1998). It is recommended that standards and calibration transfer laboratories possess quality control systems developed according to the standard NMX-EC-17025-IMNC 2000. For the acceptance of data in the calibration process, a process such as that demonstrated in figure 4.4 Data Verification Flow is recommended.
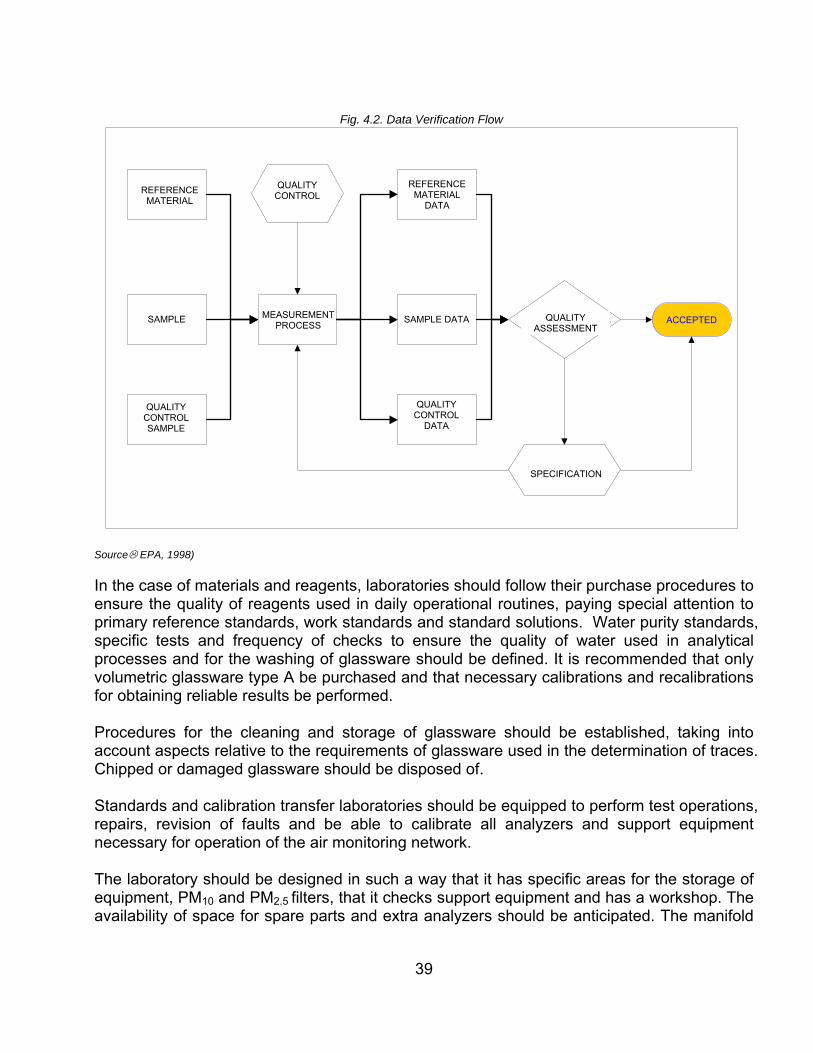
39
Fig. 4.2. Data Verification Flow
M DATOS DELATERIAL DE
FERENC
ATERIAL DEEFERENCIAR
MUESTRA
M ELC E
UESTRA DONTROL DCALIDAD
CONTROLDE CALIDAD
PROCESO DEMEDICIÓN
MRE IA
DATOS DE LAMUESTRA
DC
C
ATOS DELONTROL DE
ALIDAD
EV AALUACIÓN DE LCALIDAD
ESPECIF ACIÓNIC
REFERENCE MATERIAL
DATA
QUALITY CONTROL REFERENCE
MATERIAL
SAMPLE
SAMPLE DATAMEASUREMENT
PROCESS QUALITY
ASSESSMENT ACEPTADOACCEPTED
QUALITY CONTROL
DATA
QUALITY CONTROL SAMPLE
SPECIFICATION
Source EPA, 1998) In the case of materials and reagents, laboratories should follow their purchase procedures to ensure the quality of reagents used in daily operational routines, paying special attention to primary reference standards, work standards and standard solutions. Water purity standards, specific tests and frequency of checks to ensure the quality of water used in analytical processes and for the washing of glassware should be defined. It is recommended that only volumetric glassware type A be purchased and that necessary calibrations and recalibrations for obtaining reliable results be performed. Procedures for the cleaning and storage of glassware should be established, taking into account aspects relative to the requirements of glassware used in the determination of traces. Chipped or damaged glassware should be disposed of. Standards and calibration transfer laboratories should be equipped to perform test operations, repairs, revision of faults and be able to calibrate all analyzers and support equipment necessary for operation of the air monitoring network. The laboratory should be designed in such a way that it has specific areas for the storage of equipment, PM10 and PM2.5 filters, that it checks support equipment and has a workshop. The availability of space for spare parts and extra analyzers should be anticipated. The manifold

40
system or taking of samples should be installed behind the bank of instruments. It is recommended that a sampling tube be installed in the ceiling of the laboratory in order to take air from the exterior to test analyzers. Any surplus calibration gas should be directed to the exterior atmosphere. Mounting of the test instruments and analyzers should be conducted as if it were a monitoring station. Functional tests should be run over the course of various days to observe whether there are problems with the equipment or the recording of data. If there is a rack consisting of a system for data collection and a calibrator, automatic nocturnal calibrations can be conducted to see how the analyzer responds to concentrations of known gases. For example, the ozone recertification bench and rack should be fixed to the work table. The rack should contain the primary ozone standard and the ozone transfer standards that are checked for recertification. The “Zero Air” should be fixed to the rack for calibration and ozone analyzer tests and transfer standards.
Equipment and Instrument Calibration As part of the process of air monitoring, an important quality control parameter is the calibration check of equipment to guarantee the capacity of measurement instruments to achieve standardized parameters or planned results. In the process of air monitoring data collection, as indicated above, this means, for example:
• Verification that conditions established for monitoring stations are met (electricity, temperature control, humidity control, data transmission lines and others).
• Calibration of measurement equipment is updated and traceable. • Standards for gases and reagents are in force. • Data checks generate reliable data.
Measurement equipment should be calibrated and checked at defined intervals before being brought into service and should be adjusted and readjusted when necessary according to the respective procedure. The frequency of calibration depends on the equipment and/or method used for determining the diverse pollutants. Respective checklists should be maintained at all times to provide evidence of the current state of equipment. Equipment should be identified in order to determine its state of calibration. Calibration or checks should be conducted with comparison to patterns of measurements traceable to national or international measurement patterns; if these patterns do not exist, the bases used for calibration or checks should be indicated and recorded. Equipment for measurement, control and checks should be protected against adjustments that could invalidate the results of monitoring and measurements, and protected against damage and deterioration during use, maintenance and storage.

41
Analytical procedures For the correct and reliable development of processes conducted in analytical laboratories, the following should be taken into consideration:
• Human factors, • Installation and environmental conditions, • Test and calibration methods and verification of methods, • Equipment, • Traceability of measurements, • Sampling, • Handling of test and calibration elements.
These factors should be considered in the total uncertainty of measurement. On the other hand, these provide opportunities for improving the development of methods and procedures for testing or calibration, training, qualifications of personnel and selection of equipment used. Technical requisites related to analysis are established in the respective Mexican reference standards and/or EPA reference methods. 4.3.3. Revision, checks, validation and reconciliation of data for quality objectives The revision, verification and validation of data are techniques used to accept, reject or assess data in an objective, consistent or systematic way. The revision of data consists of a primary assessment of the data in a simple way, applying criteria such as whether the data exists or not. Verification can be defined as confirmation by means of an assessment and the application of objective tests to demonstrate that specific requirements have been met, for example, verification that sampling and analysis techniques have been adequately applied. Validation can be defined as confirmation via an assessment and the application of objective tests to determine whether special requirements for specific use are being met, for example, confirming that data obtained with certain techniques can be used to assess the quality of air in a certain delimited space of an air sample area. It is important to specify the assessment criteria to determine the degree to which each type of data meets quality specifications described in the quality control program of an air monitoring system. In general, quantitative methods are taken into account for complete validation, such as the range of application or measurement, selectivity with regard to pollutants measured, the function of calibration, the precision of the method used, accuracy, decision limits to decide whether a value is valid, detection limits, bias, the influence of external factors and uncertainty in measurement.

42
The procedures, personnel and frequency of assessments should be included in the quality control program of air monitoring systems (see clause covering implementation of a quality management system). Reports issued on air quality should only include valid data. Design of the sampling program, sample collection procedures, handling of samples, analytical procedures, quality control, calibrations, data reduction and processing should be considered in the process of revision, verification and validation of data. In the process of arriving at validated values we can speak of various assessment phases:
1. Revision of an adequate selection of equipment, of a design suitable for sampling to achieve objectives, of correct calibration of measuring equipment
2. Initial revision of data 3. Verification of data 4. Validation of data
Figure 4.4 indicates at which step or stage in the process the diverse actions related to verification and validation are applied.

43
Fig. 4.3 Verification and validation of data in a project cycle
PLANIFICACIÓN D
PROYECTOEL
Actividades encampo
Recepción de lamuestra
Pr am
eparación de luestra
An aálisis de la muestr
Rde rio
evisión de registroslaborato
Revisión deentos de cadocum mpo
Regis os de
verificados
Ma
PROJECT PLANNING
trverificación dedatos y datos
Repo te de
seleccionados
rvalidación de
datos
Va osse slidación de dat
leccionado
Validación de datos analíticosde laboratorio y campo
Reporte devalidación dedatos y datos
validados
Evalua d deción de calidadatos
nejo de la muestra
Verificación y evaluación de datos
Verificación de los d
tos
Field activities Review of field documents
aD
ata verification
Sample handling
Receipt of sample
Preparation of sample
Verification data and verified data records
Sample analysis
Review of laboratory records
Validación de los d
tos a
Data validation
Validation of analytical data from field and laboratory
Report on selected
data validation
Report on data validation and validated data
Selected data validation
Data quality assessment
Data verification and assessment
Translated from: ( EPA. 2002) Equipment selection and adequate sampling design to achieve objectives have already been covered in other chapters of this handbook, as well as in documents 1 and 2 of this series. Data revision methods The data flow from environmental field data operations to storage in a data base requires diverse and clearly identified steps, including among others:
• Initial selection of physical equipment and software for the collection, storage, recovery and transmission of data.
• Organization and control of data flow from sampling site to analytical laboratory. • Data collection. • Data validation.

44
• Data handling. • Data analysis. • Systematic storage of data. • Delivery of data to the SINAICA central data base.
Both the manual and computer handling of data require individual assessment of all tables and calculations of existing data, for example in the form of logs, with the objective of verifying the correction of these given the possibility of error in handling. A first stage of assessment would consist of manual inspection of the data. The purpose of manual inspection is to recognize extreme values, whether high or low, that may indicate a serious error in the sampling system and recording of data. To identify whether the reported concentration of a pollutant is extremely high or low, it is recommended that the person in charge has sufficient knowledge of the cyclical behavior of the most important pollutants and of the usual air quality conditions in the sampling area. The values of data considered questionable should be taken for verification. This data revision detects errors when extreme values are present but does not detect errors related to intermediate values, which may also have considerable effect. Manual revision of tables and data calculations also permits the detection of an incorrect bias in the zero base line of continual measurement equipment. Movement or bias from zero can be demonstrated if the minimum daily concentration tends to increase or decrease in comparison with the usual concentration observed over a period of several days. For example, in the majority of sampling stations, readings taken very early in the day (from 3: 00 a.m. to 4: 00 a.m.) show concentrations of carbon monoxide that tend towards the minimum (for example. 2 to 4 ppm). If the minimum concentration is significantly different from this, it may be suspected that there is a bias from zero. The bias from zero can be confirmed by reviewing the original graphic data register for a period of several days. In an automated data processing system, procedures for the review of data on basic software can easily be included. The computer can be programmed to review data values and detect those that fall outside the range for the pollutant. These checks can be programmed in detail to register an exact time of day, day of the week and other cyclical conditions. Questionable data should be registered or marked in a log to indicate a possible error. Other types of data review could take the form of preliminary assessment of a collection of data, calculating certain basic percentage statistics and reviewing data via graphics. In the case of the Automatic Air Monitoring Network (RAMA – acronym as given in Spanish) of the Federal District Air Monitoring System, the review processes are conducted automatically every hour. As an example of the use of flags, the following table 4.2 lists the most commonly used flags in this air monitoring system.

45
Table 4.2. Flags assigned by the Central Processing System for hourly data collected by the Air Monitoring System (Mexico City).
FLAG MEANING X Void M Maintenance O Observation * T Transmission problems P Incommunicado N Negatives A Transmission and Negatives No Flag or S Correct data from principal system
* Data marked for observation are subject to a verification process. Source: SIMAT, (direct consultation,2004)
The criteria for accepting data as correct include: The criteria for detection limits are applied when the detection limit is the minimum measured value of a pollutant that can be differentiated with a reliability of 95% of zero. Obviously these detection limits depend on the methods and equipment used for the measurement of pollutants and are indicated in the description of the method or in the equipment manufacturer’s handbook. The automatic system flags values inferior to the detection limits “X” as void. In the case of NO2 measurement, the difference in value indicated for NO and NOx is considered. The detection limit for NO2 consists of the sum of the detection limits for NO and NOx. In the case that the difference between measurements of NO and NOx is greater than 0.006 ppm the system automatically flags the value “void” for NOx values. The values are sent for observation in the following hours, that is to say the verification process. In the case of instability existing in the operation of the automatic equipment TEOM of PM10, caused by vibration (e.g. due to strong winds over the head) and other reasons which can lead to the registering of negative values below the detection limit, the automatic data review system will flag these values as “negative” and these values will be considered void.
In the case of meteorological equipment to measure wind velocity, wind direction and relative humidity, negative values or constant values are flagged and taken as “void”. In the case of measurement values for UVA and UVB between the hours of 21:00 and 6:00, these should be equal to zero. If this is not the case these values will be flagged and taken as “void”, indicating the corresponding temperature value.

46
Power cuts These cuts are detected by the automatic data verification system when the registered values for automatic analyzers of SO2 and PM10 register negative values for a period of several minutes.
Internal temperature and controlled functioning temperature: To ensure the correct functioning of electronic equipment, the internal temperature of air monitoring stations should be between 14°C and 24°C. Accordingly, this criteria is taken into account during the data review phase and the data verification phase, principally with regard to the values of SO2 and PM10 measured with automatic equipment. In the case of sensors that measure UVA and UVB radiation, the temperature should be between 24 and 26°C to guarantee optimum functionality, if this is not the case the automatic system flags the values as “void”. Data verification methods Data verification is defined as the confirmation by means of a test and the collection of objective evidence that demonstrates specific requirements are being met. These requirements related to each data operation should be included in the quality control programs and systems of the air monitoring systems. The data verification process involves the technical audit, analysis and approval of field data or sample data. Technical system audits can be internal or external and are conducted frequently by field and laboratory technicians. Guide questions for the verification process:
• Were the environmental data operations conducted according to standard operational procedures?
• Were the environmental data operations conducted at the correct time and on the originally specified date? (Monitor timing mechanisms should have functioned correctly so that samples have been taken within the specified period.)
• Did the sampler or monitor function correctly? (The individual verification of escape, flow verification, meteorological influences, and other evaluations, audits and verification of performance should have been conducted and documented.)
• Did the environmental sample pass an initial visual revision and assessment? (Many environmental samples can be flagged during the initial visual revision, for example with an “O” which means that processes and data should continue to be verified in connection with this information.)
• Were processes related to the required environmental data conducted to meet the quality objectives of data designed for processes related to specific data? (This refers, for example, to activities to ensure they can provide reliable data for a specific research study) and

47
• Were the processes performed according to what was specified? (Objectives for processes related to environmental data should be clear and understood by all those involved in data collection.)
Records that can support data verification and which require laboratory analysis are listed in the following table.
Table. 4.3 Records commonly used for data verification Operation Records Source of records Sampling Logs of daily field registers
from monitoring stations or from the air monitoring system office, logs of samples sent to the laboratory
Project quality plan, procedures and work instructions
Receipt of samples Electronic registers from automatic stations, laboratory reception registers
Project quality plan, procedure relative to transmission and reception of data, procedures for reception of samples from laboratory
Preparation of samples Required analytical services, laboratory reception formats and other laboratory formats related to handling of sample, certificates from producer of standards, gases and reagents
Project quality plan, reference methods, laboratory procedures for preparation of the sample and others
Sample analysis Required analytical services, laboratory reception formats and other laboratory formats related to handling of sample, certificate from producer of standards, gases and reagents, calculations sheet, raw data records, quality control results
Project quality plan, reference methods, laboratory procedures, work instructions, formats
Review of records Checklists used in laboratory and/or stations
Project quality plan, procedures with regard to analysis method
48
Data validation methods Data validation is a routine process designed to ensure that reported values satisfy quality objectives for processes of environmental data generation. The validation of data is defined as the testing and supply of objective evidence that requirements for a specific use have been met. (EPA, 1998). The objective of data validation is to detect and then verify any value that cannot represent the quality conditions of real air in the sampling station. Data validation procedures can be conducted separately from the procedures related to the initial collection of data. A progressive and systematic focus should be used for data validation to ensure and assess the quality of data. (EPA, 1998). By means of computational calculations the validity of data that is neither particularly high nor low can be quickly determined. Validation procedures are recommended as standard operational procedures. One means of doing this is to review the difference between successive data values for concentrations of a single pollutant, e.g. in a report period of 5 minutes or up to an hour during which rapid changes are not anticipated. If the difference between the successive values exceeds a predetermined value, the table of values can be marked with an appropriate symbol, that is to say using flags (EPA, 1998). Quality control data can support the data validation procedures. If the results of data assessment indicate an evidently serious response problem with an analyzer, the organization responsible for operation of the monitoring network should examine all pertinent quality control information to determine whether any environmental data, as well as any associated valuation data, should be invalidated. If the precision assessment, bias or accuracy readings are collected during a period for which environmental data readings are determined invalid at the moment the data are raised, or just after collection, for justified reasons, it is also necessary to invalidate the readings of corresponding data for precision, bias and accuracy. Any data quality calculation made using the invalidated readings should be repeated. Checks for precision, bias or accuracy should also be reprogrammed, preferably for the same quarter. The basis or justification for all invalidations of data should be documented and permanently maintained. (EPA, 1998). Some criteria based on standardization, the judgement of a station operator and the judgement of a laboratory technician can be used to invalidate a sample or measurement. These criteria should be explicitly identified in the organizations’ Quality Management System. (EPA, 1998). The flagging or signposting or labeling of the result of a data evaluation is used to identify potential problems with the data or a sample:
(a) The results did not lead to a numerical result, (b) A numerical result was generated but is labeled for some reason related to the type or
validity of the results,

49
(c) A numerical result was produced that for administrative reasons should not be communicated beyond the organization.
The signposting can be used both in the field and the laboratory to identify data that may be questionable given the pollution levels, special events or that they exceed the limits of quality control. The signposting can be used to determine whether individual samples or samples from a particular instrument are not valid. In all of these cases the sample should be assessed with precision before any invalidation. (EPA, 1998). The signposting can be used in isolation or in combination to invalidate samples. Organizations should review in depth combinations of signposting and determine whether individual values or the values of a station should be invalidated for a specific period of time. The monitoring system should keep a register of the combination of flags/signposts that resulted from the invalidation of a sample or a group of samples. (EPA, 1998).). Procedures to review whether data contains errors or anomalies should be implemented. Validation of automated methods The results of air measurements should be invalidated when the limits for the deviation from zero or span are exceeded. Invalidation is enforced from the most recent point where confidence exists that the data is valid, which is normally the moment of the previous calibration (or the accuracy audit), unless some other moment can be identified when there is probable cause to suspect an excessive deviation (such as a power cut or defective functioning). In addition, data immediately following the poor functioning of an analyzer or after a non-operational period should be considered invalid until the moment of the following calibration (Level 1 which is a simplified two point calibration, used when the linearity of the analyzer does not require revision or verification), except when readings of a poorly adjusted zero and readings of the span in the calibration can be supported if the data is valid. (EPA, 1998). Validation of manual methods For manual methods the acceptance or rejection of observed data based on the results of checks/revisions of selected processes to monitor critical parameters is applied as a first purging of data validation. For this purging the three most important phases of the manual methods must be taken into account: the collection of samples, analysis, and the reduction of data. Reduction of data refers to the elimination of all reported and analyzed data that does not meet quality criteria. (EPA, 1998). In addition to this verification of processes, with its objective of validating data, all the limiting conditions should be observed, such as approval limits and interferences previously described in reference methods and equivalents, as in themselves they can invalidate the data. In addition it is recommended that results of audits or performance assessments are not used as the only criteria to invalidate data as this verification is used to assess the quality of data. (EPA, 1998).

50
Reconciliation with data quality objectives (OCD) Reconciliation with data quality objectives (OCD) includes the routine revision of data as well as quality assurance and control data to determine whether data quality objectives have been met and whether the data is adequate for its intended use. This data assessment process, compared with the objectives of data quality, is defined as Data Quality Evaluation (ECA – acronym as given in Spanish). (EPA, 1998). As part of data quality assurance, in the statistical tests forming the basis of the assessment, calculation of the precision, bias and accuracy of the data is required. These calculations are given in greater detail in Annex A. On the other hand, data concerning the integrity and representativeness of the data should be taken. (EPA, 1998). The ECA process has been developed for cases where formal OCDs have been established. Nevertheless, these procedures can be used for data that do not officially have OCDs. (EPA, 1998). Using the ECA process, responses can be formulated for two fundamental questions:
1. Can a decision be made with the desired confidence, taking into account the collected data? 2. How good can the performance of the sampling design be expected to be for a wide range of possible results?
The ECA is of key importance in the evaluation of the lifecycle of data as it is very similar to the lifecycle of quality assurance for air monitoring. As a step in the verification and validation of data, the ECA determines how well the validated data support their intended use. (EPA, 1998). The five steps in the process of Data Quality Evaluation (ECA) are the following (EPA, 1998). Step 1. Review the data quality objectives and sampling design.
Examine the results of the OCD to guarantee they are still applicable. If the OCDs have not been developed, specify OCDs before evaluating the data (for example, for environmental decisions, define the statistical hypothesis and specify the tolerance limits for decision errors; for estimate problems, define a probability interval of acceptable confidence). Review the documentation for the sampling design and recollection of data to see its consistency with OCDs.

51
Step 2. Conduct a review of preliminary data.
Review quality assurance reports, calculate the basic statistics and generate graphics with this data. Use this information to recognize the structure of data and identify patterns, relationships or potential anomalies.
Step 3. Select the statistical test.
Select the most appropriate procedure to summarize and analyze the data, based on the revision of OCDs, the design of sampling and the evaluation of preliminary data. Identify the fundamental assumptions that support the validity of the statistical procedures.
Step 4. Verify the assumptions of the statistical test.
Decide whether the underlying assumptions are sustained or whether exclusions could be applied, based on true data and other information from the study. The assumptions behind the statistical test include those associated with the development of the OCDs additional to the assumptions related to bias and precision. These are:
• The OCDs take as their base the annual arithmetic mean of air pollutants according to the statistical test in step 3.
• Measurement errors demonstrate normal distribution (an assumption generally applied in environmental measurements).
• Decision errors occur if the average estimated on the basis of three years varies from the true value for those three years. (This is not really an assumption but an observation.)
• The precision and bias limits are based on the lowest number of sampling values required in a three year period.
• Limits for decision errors were defined at 5%. (This is not really an assumption but a determinant.)
• The imprecision of measurement is established at 10% of the variation coefficient.
• The limits of accuracy and bias are met. Verification should be based on available data when there is no data for the three year period. The estimate for the three year period is calculated valuing the quarterly components and based on the most adequate assumption:
a. The accuracy and bias of the most recent quarters are the most representative for what will occur in future quarters.

52
b. The accuracy and bias of all previous quarters are equally representative for what will occur in future quarters.
c. Something unusual occurred in the most recent quarters, for which reason the representative quarters will be all of those excepting the most recent.
Step 5. Drawing conclusions from the data. Carry out the required calculations for statistical tests and document the interferences based on the calculation results. If the design is used again, the performance of the sampling design should be assessed. As indicators of data quality, accuracy, precision, data recording, representativeness, completeness and comparability are used. All air monitoring systems should report data to the SEMARNAT quarterly and annually with the precision and accuracy of the sampling within standardized parameters. Likewise, they should meet the following conditions:
• Accuracy +/- 15% of the real value with the exception of flow data for PM10, which should be within a range of +/- 10%. For NOx, analyzers, converter efficiency should be equal to or greater than 96%. The confidence intervals of 95% for each air monitoring system should be less than 20%. “As a technical note, a 95% confidence interval does not mean that there is a 95% probability that the interval contains the true mean. The interval computed from a given sample either contains the true mean or it does not. Instead, the level of confidence is associated with the method of calculating the interval. The confidence coefficient is simply the proportion of samples of a given size that may be expected to contain the true mean. That is, for a 95% confidence interval, if many samples are collected and the confidence interval computed, in the long run about 95% of these intervals would contain the true mean.“ 1
• Precision The precision of air quality data is based on values obtained from checks performed five days a week and should be found within the range of +/- 15% of the real value. The reliability intervals of 95% reported for air monitoring systems every three months should be less than 20%.
• Recording of data, also named data integrity
1 Taken from:www.itl.nist.gov/div898/handbook/eda/section3/eda352.htm

53
Air monitoring systems should obtain a minimum of 75% of data recorded, maintaining values of precision and accuracy. This is calculated taking the collected data from a single pollutant in a sampling station, during a specified period, among all the possible data to be collected.
Total number of possible hours – number of hours lost due to calibration – number of hours lost due to stoppages % of recording = ---------------------------------------------------------------------------------- X 100 Total number of possible hours The recording of data for a complete air monitoring system for a specific pollutant is calculated in the following way:
% of data recording for a single pollutant system =
1/n ∑n
i=1 % of the data recording of each station
Where „n“ is equal to the number of reporting stations.
• Representativeness
Representativeness is determined, among other factors, by a correct positioning of the sampling stations, the objective of the sampling and of the design of the monitoring networks and is detailed in documents 1 and 2 of this series and according to the statistical data shown in table 4.4 that demonstrates the representativeness of the air monitoring data.
• Completeness The data for a station is considered complete if representative data exists for the required daily hours, during the required months and for the required year. The purpose of the completeness criteria for this data is to determine the minimum data necessary to ensure the sampling occurred during periods when alerts were expected.
• Comparability The comparability of data is achieved using uniform procedures and the methods of reference or equivalents established by the corresponding standardization for each case.

54
Table 4.4 Representativeness of Air Monitoring Data
Statistical Representativeness
Period Sampling period Base Data Number of representative periods
required
Annual Any Four representative quarters 24 hours Based on daily sample Three representative months Quarterly Based on hourly samples 1,643 hours or more Less than 24 hours Based on daily statistics 69 days or more
Based on a single sample every 6 days 4 x 24 hour samples or more
24 hours Based on a sample every 3 days 8 x 24 hour samples or more Monthly Based on daily statistics 23 days or more Based on hourly samples 548 hours or more Less than 24 hours Based on all 2 hour samples 274 x 2 hour samples or more Based on all 3 hour samples 183 x 3 hour samples or more
1 hour
6 hours or more every eight hours (starting from 0 hours to 7, from 8 to 15, from16 to 23), without losing more than two consecutive hourly samples
Daily 2 hours Based on all 2 hour samples 9 samples or more 3 hours Based on all 3 hour samples 6 samples or more
24 hours Based on all daily samples Between 22 and 26 hours of sample
Source: CARB (2003)
Table 4.5. Number of samples required to ensure representativeness of a sampling period
N Number of samples required Average of period of N hours 24 18 x hourly samples or more 8 6 x hourly samples or more 6 5 x hourly samples or more 4 3 x hourly samples 3 3 x hourly samples 2 2 x hourly samples 1 30 minutes or more of a continuous sample
Source: CARB (2003)
Table 4.6 indicates the precision and accuracy requirements depending on whether it is an individual instrument or the monitoring network of standardized parameters.

55
Table 4.6 Precision and Accuracy for Requirements For Standarized Parameters
Single analyzer NO2 (chemiluminescence)
O3 ( ultraviolet photometry) SO2 ( ultraviolet fluorescence)
Parameter Frequency Acceptance Criteria Information
Precision Single Analyzer 1 – 2 weeks None Concentration = Monitoring System or Network 1 – 3 months Confidence Interval
95% - +/- 15% 0.08 – 0.10 ppm
Accuracy Single Analyzer 20% of all sites None 4 concentration ranges
Monitoring System or Network
Quarterly (all sites yearly)
Confidence Interval 95%- +/- 20%
If fails, it’s necessary to recalibrate, often failure requires corrective actions
Parameter Frequency Acceptance Criteria Information
Precision Single Analyzer 1 – 2 weeks None Concentration = Monitoring System or Network 1 – 3 months Confidence Interval
95% - +/- 15% 8 – 10 ppm
Accuracy Single Analyzer 20% of all sites None 4 concentration ranges
Monitoring System or Network
Quarterly (all sites yearly)
Confidence Interval 95%- +/- 20%
If fails, it’s necessary to recalibrate, often failure requires corrective actions
CO (No dispersive infrared photometry)
Source: EPA (1998).

56
Pb ( Adsorption Atomic Spectrometry)
Precision Single Analyzer 1 – 6 days None Both lead (Pb) values Monitoring System or Network 1 – 3 months Confidence Interval
95% - +/- 15% Must be greater than 15 µg /m3
Accuracy
Single Analyzer 20% of all sites Difference
percentage +/- 16% To analyze in three samples of audit in each one of the two concentration ranges
Monitoring System or Network
Quarterly (all sites yearly)
Confidence Interval 95%- +/- 20%
The audit sampling must be spread for all the year.
PM10 ( Dicotomic analyzer)
Precision
Single Analyzer 1 – 6 days 5 µg/ m3 of a
concentration of 80 µg/m3
Both values of PM10 must be larger than 20 µg/m3
Monitoring System or Network
1 – 3 months 7 % for a concentration larger than 80 µg/m3 and confidence level of 95% +/- 15%
Accuracy
Single Analyzer 20 % of all sites None Transfer standards must be
different of calibration standards
Monitoring System or Network
Quarterly (all sites yearly)
Confidence Interval 95%- +/- 20%
To recalibrate before any additional sampling To invalidate data until arriving to last accepted check flow if it differs more or by equal to 10%.
Source: EPA (1998).
Parameter Frequency Acceptance Criteria Information
Parameter Frequency Acceptance Criteria Information

57
5. BIBLIOGRAPHY
1. CARB (2003). Air Monitoring Quality Assurance. State of California, Air Resources Board, Monitoring and Laboratory Division: Vol.1, Quality Assurance Plan, October 2003 2. CFR (2004). Code of Federal Registers Title 40. Protection of Environment, PART 58-AMBIENT AIR QUALITY SURVEILLANCE.
3. DDF-GCM (2004). Verificación y Validación de Datos. Sistema de Monitoreo Atmosférico, Gobierno de la Ciudad de México, 2004.
4. Decanini, Alfredo E. (1997). Manual ISO-9000, Ediciones Castillo, tercera edición, 1997. 5. EPA (1998).Quality Assurance Handbook for Air Pollution Measurement Systems. Vol.II: Part 1, Ambient Air Quality Monitoring Program Quality System Development, EPA-454/R-98-004 , Office of Air Quality Planning and Standards, Washington, August 1998.
6. EPA (2002a). Guidance for Quality Assurance Project Plans. EPA QA/G-5, Office of Environmental Information, Washington, December 2002. 7. EPA (2002b). Guidance on Environmental Data Verification and Data Validation. EPA QA/G-8, Office of Environmental Information, Washington, November 2002.
8. INE-SEMARNAT (2003). Programa Nacional de Monitoreo Atmosférico. CENICA, México, 2003. 9. ISO / IMNC (2001a). Sistemas de Gestión de la Calidad – Requisitos, ISO 9001:2000, COPLANT/ISO 9001-2000, NOM-CC-9001-IMNC-2000. Enero 2001.
10. ISO /IMNC (2001b). Requisitos generales para la competencia de los laboratorios de ensayo y de calibración. ISO /IEC 17025:1999, NMX-EC-17025-IMNC-2000, 2001.
11. ISO/ IMNC (2001). Sistemas de gestión de la calidad–Fundamentos y vocabulario, ISO9000:2000; COPANT/ISO 9000-2000, NMX-CC-9000-IMNC-2000. Enero 2001.
12. Ministry for the Environment in New Zealand (2000). Good-practice guide for Air Quality Monitoring and Data Management, New Zealand, December 2000.
13. Umweltbundesamt (2004). “QS-Handbuch , Das Qualitätsmanagementsystem im Messnetz” , rev. März 2004.

58
Internet
1. http://www.itl.nist.gov/div898/handbook/eda/section3/eda352.htm Definición del intervalo de confianza.
2. http://www.umweltbundesamt.de/messeinrichtungen/moimi12.htm

59
ANEX 1
Calculations for Data Quality Assessment.
A. Precision of Automated Methods Excluding PM2.5 Estimates of the precision of automated methods are calculated from the results of biweekly precision. At the end of each calendar quarter, an integrated precision probability interval for all SLAMS analyzers in the organization is calculated for each pollutant. A.1 Single Analyzer Precision.
A.1.1 The percent difference (di) for each precision check is calculated using equation 1, where Yi is the concentration indicated by the analyzer for the I-th precision check and Xi is the known concentration for the I-th precision check, as follows:
Equation 1
100xX
XYdi
iii
−=
Where i run from 1 to n. A.1.2 For each analyzer, the quarterly average (dj) is calculated with equation 2, and the standard deviation (Sj) with equation 3, where n is the number of precision checks on the instrument made during the calendar quarter. For example, n should be 6 or 7 if precision checks are made biweekly during a quarter. Equation 2 and 3 follow:
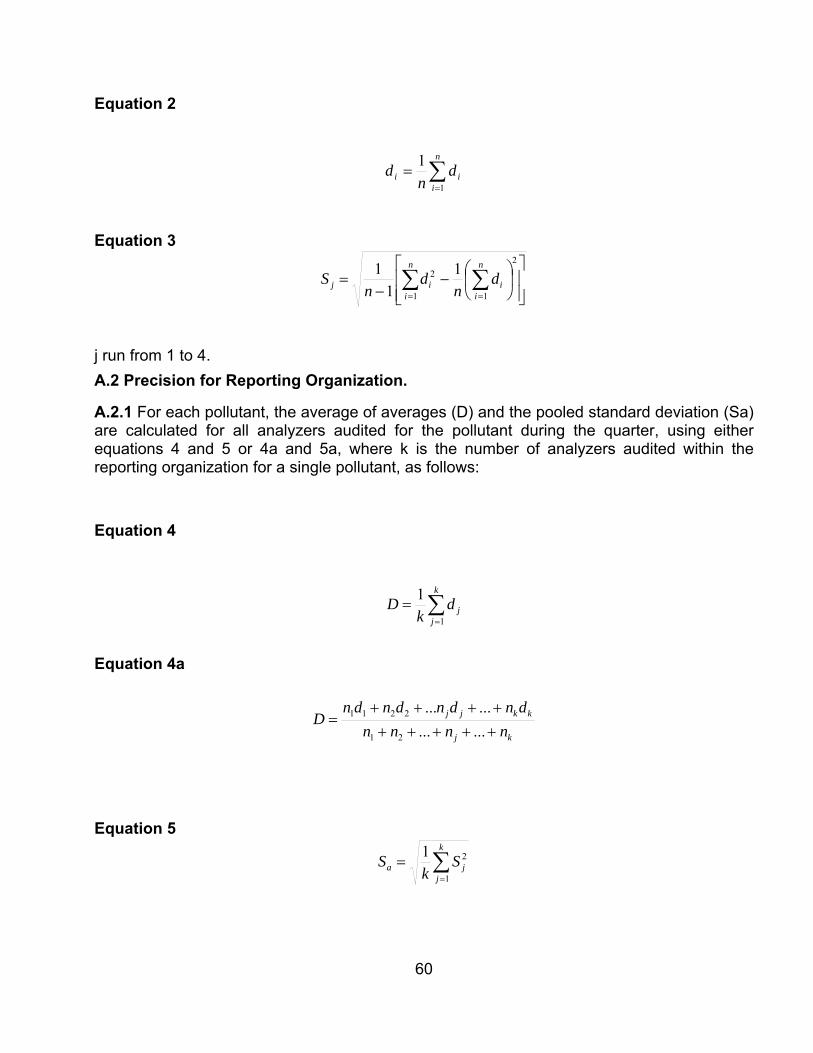
60
Equation 2
∑=
=n
iii d
nd
1
1
Equation 3
⎥⎥⎦
⎤
⎢⎢⎣
⎡⎟⎠
⎞⎜⎝
⎛−
−= ∑ ∑
= =
n
i
n
iiij d
nd
nS
1
2
1
2 11
1
j run from 1 to 4. A.2 Precision for Reporting Organization.
A.2.1 For each pollutant, the average of averages (D) and the pooled standard deviation (Sa) are calculated for all analyzers audited for the pollutant during the quarter, using either equations 4 and 5 or 4a and 5a, where k is the number of analyzers audited within the reporting organization for a single pollutant, as follows:
Equation 4
∑=
=k
jjd
kD
1
1
Equation 4a
kj
kkjj
nnnndndndndn
D+++++++++
=............
21
2211
Equation 5
∑=
=k
jja S
kS
1
21

61
Equation 5a
knnnnSnSnSnSn
Skj
kkjja −+++++
−++−++−+−=
......)1(..)1(...)1()1(
21
22222
211
Equations 4 and 5 are used when the same number of precision checks are made for each analyzer. Equations 4a and 5a are used to obtain a weighted average and a weighted standard deviation when different numbers of precision checks are made for the analyzers.
A.2.2 For each pollutant, the 95 Percent Probability Limits for the precision of a reporting organization are calculated using equations 6 and 7, as follows: Equation 6 Límite del intervalo de confianza superior al 95% aSDLímite 96.1+= Equation 7 Límite del intervalo de confianza inferior al 95% aSDLímite 96.1−=

62
B Accuracy of Automated Methods Excluding PM2.5. Estimates of the accuracy of automated methods are calculated from the results of independent audits. At the end of each calendar quarter, an integrated accuracy probability interval for all SLAMS analyzers audited in the reporting organization is calculated for each pollutant. SSEMARNATrate probability limits are calculated for each audit concentration level.
B.1 Single Analyzer Accuracy.
The percentage difference (di) for each audit concentration is calculated using equation 1, where Yi is the analyzer's indicated concentration measurement from the I-th audit check and Xi is the actual concentration of the audit gas used for the I-th audit check
B.2 Accuracy for Reporting Organization.
B.2.1 For each audit concentration level of a particular pollutant, the average (D) of the individual percentage differences (di) for all n analyzers audited during the quarter is calculated using equation 8, as follows:
Equation 8
∑=
=n
iid
nD
1
1
B.2.2 For each concentration level of a particular pollutant, the standard deviation (Sa) of all the individual percentage differences for all n analyzers audited during the quarter is calculated, using equation 9, as follows:
Equation 9
⎥⎥⎦
⎤
⎢⎢⎣
⎡⎟⎠
⎞⎜⎝
⎛−
−= ∑ ∑
= =
n
i
n
iiia d
nd
nS
1
2
1
2 11
1
B.2.3 For reporting organizations having four or fewer analyzers for a particular pollutant, only one audit is required each quarter. For such reporting organizations, the audit results of two consecutive quarters are required to calculate an average and a standard deviation, using equations 8 and 9. Therefore, the reporting of probability limits shall be on a semiannual (instead of a quarterly) basis.

63
B.2.4 For each pollutant, the 95 Percent Probability Limits for the accuracy of a reporting organization are calculated at each audit concentration level using equations 6 and 7. C Precision of Manual Methods Excluding PM2.5. Estimates of precision of manual methods are calculated from the results obtained from collocated samplers. At the end of each calendar quarter, an integrated precision probability interval for all collocated samplers operating in the reporting organization is calculated for each manual method network. C.1 Single Sampler Precision. C.11 At low concentrations, agreement between the measurements of collocated samplers, expressed as percent differences, may be relatively poor. For this reason, collocated measurement pairs are selected for use in the precision calculations only when both measurements are above the following limits: (a) TSP: 20 µg/m3. (b) SO2: 45 µg/m3. (c) NO2: 30 µg/m3. (d) Pb: 0.15 µg/m3. (e) PM10: 20 µg/m3. For each selected measurement pair, the percent difference (di) is calculated, using equation 10, as follows: Equation 10
100xXX
XYdii
iii +
−=
where:
Yi is the pollutant concentration measurement obtained from the duplicate sampler; and Xi is the concentration measurement obtained from the primary sampler designated for reporting air quality for the site.

64
(a) For each site, the quarterly average percent difference (dj) is calculated from equation 2 and the standard deviation (Sj) is calculated from equation 3, where n= the number of selected measurement pairs at the site.
C.2 Precision for Reporting Organization.
C.2.1 For each pollutant, the average percentage difference (D) and the pooled standard deviation (Sa) are calculated, using equations 4 and 5, or using equations 4a and 5a if different numbers of paired measurements are obtained at the collocated sites. For these calculations, the k of equations 4, 4a, 5 and 5a is the number of collocated sites
C.2.2 The 95 Percent Probability Limits for the integrated precision for a reporting organization are calculated using equations 11 and 12, as follows:
Equation 11 aSDLímite 96.1+= Equation 12 aSDLímite 96.1−= D Accuracy of Manual Methods Excluding PM2.5.
Estimates of the accuracy of manual methods are calculated from the results of independent audits as described in section 3.4 of this appendix. At the end of each calendar quarter, an integrated accuracy probability interval is calculated for each manual method network operated by the reporting organization.
D.1 Particulate Matter Samplers other than PM2.5 (including reference method Pb samplers).
Single Sampler Accuracy. For the flow rate audit, the percentage difference (di) for each audit is calculated using equation 1, where Xi represents the known flow rate and Yi represents the flow rate indicated by the sampler.
D.1 Accuracy for Reporting Organization.

65
For each type of particulate matter measured (e.g., TSP/Pb), the average (D) of the individual percent differences for all similar particulate matter samplers audited during the calendar quarter is calculated using equation 8. The standard deviation (Sa) of the percentage differences for all of the similar particulate matter samplers audited during the calendar quarter is calculated using equation 9. The 95 Percent Probability Limits for the integrated accuracy for the reporting organization are calculated using equations 6 and 7. For reporting organizations having four or fewer particulate matter samplers of one type, only one audit is required each quarter, and the audit results of two consecutive quarters are required to calculate an average and a standard deviation. In that case, probability limits shall be reported semi-annually rather than quarterly.
D.2 Analytical Methods for SO2, NO2, and Pb.
D.1 Single Analysis-Day Accuracy.
For each of the audits of the analytical methods for SO2, NO2, and Pb described in sections 3.4.2, 3.4.3, and 3.4.4 of this appendix, the percentage difference (dj) at each concentration level is calculated using equation 1, where Xj represents the known value of the audit sample and Yj represents the value of SO2, NO2, or Pb indicated by the analytical method.
Accuracy for Reporting Organization.
For each analytical method, the average (D) of the individual percent differences at each concentration level for all audits during the calendar quarter is calculated using equation 8. The standard deviation (Sa) of the percentage differences at each concentration level for all audits during the calendar quarter is calculated using equation 9. The 95 Percent Probability Limits for the accuracy for the reporting organization are calculated using equations 6 and 7.
E. Precision, Accuracy and Bias for Automated and Manual PM2.5 Methods.
(a) Reporting organizations are required to report the data that will allow assessments of the following individual quality control checks and audits:
(1) Flow rate audit.
(2) Collocated samplers, where the duplicate sampler is not an FRM device.
(3) Collocated samplers, where the duplicate sampler is an FRM device.
(4) FRM audits.
(b) SEMARNAT uses the reported results to derive precision, accuracy and bias estimates according to the following procedures.

66
E.1 Flow Rate Audits.
The reporting organization shall report both the audit standard flow rate and the flow rate indicated by the sampling instrument. These results are used by SEMARNAT to calculate flow rate accuracy and bias estimates.
Accuracy of a Single Sampler - Single Check (Quarterly) Basis (di).
The percentage difference (di) for a single flow rate audit di is calculated using equation 13, where Xi represents the audit standard flow rate (known) and Yi represents the indicated flow rate, as follows:
Equation 13
100xX
XYdi
iii
−=
E.1.2 Bias of a Single Sampler - Annual Basis (Dj). For an individual particulate sampler j, the average (Dj) of the individual percentage differences (di) during the calendar year is calculated using equation 14, where nj is the number of individual percentage differences produced for sampler j during the calendar year, as follows: Equation 14
∑=
=i
j
n
iinj dxD
1
1
E.1.3 Bias for Each NOM Federal Reference and Equivalent Method Designation Employed by Each Reporting Organization - Quarterly Basis (Dk,q). For method designation k used by the reporting organization, quarter q's single sampler percentage differences (di) are averaged using equation 16, where nk,q is the number of individual percentage differences produced for method designation k in quarter q, as follows: Equation 15
∑=
=qk
qk
n
iinqk dxD
,
,1
1,
E.1.4 Bias for Each Reporting Organization - Quarterly Basis (Dq). For each reporting organization, quarter q's single sampler percentage differences (di) are averaged using equation 16, to produce a single average for each reporting organization, where nq is the

67
total number of single sampler percentage differences for all federal reference or equivalent methods of samplers in quarter q, as follows: Equation 16
∑=
=q
q
n
iinq dxD
1
1
E.1.5 5 Bias for Each NOM Federal Reference and Equivalent Method Designation Employed by Each Reporting Organization - Annual Basis (Dk). For method designation k used by the reporting organization, the annual average percentage difference, Dk, is derived using equation 17, where Dk,q is the average reported for method designation k during the qth quarter, and nk,q is the number of the method designation k's monitors that were deployed during the qth quarter, as follows:
Equation 17
∑
∑
=
== 4
1,
4
1,, )(
qqk
qqkqk
k
n
DnD
E.1.6 Bias for Each Reporting Organization - Annual Basis (D). For each reporting organization, the annual average percentage difference, D, is derived using equation 18, where Dq is the average reported for the reporting organization during the qth quarter, and nq is the total number monitors that were deployed during the qth quarter. A single annual average is produced for each reporting organization. Equation 18 follows: Equation 18
∑
∑
=
== 4
1
4
1)(
qqq
n
DnD

68
E.2 Collocated Samplers,
Where the Duplicate Sampler is not an FRM Device. (a) At low concentrations, agreement between the measurements of collocated samplers may be relatively poor. For this reason, collocated measurement pairs are selected for use in the precision calculations only when both measurements are above the following limits:
PM2.5 : 6 µg/m3
Collocated sampler results are used to assess measurement system precision.
organization, and nationally for each NOM Federal reference method and equivalent method designation.
Percent Difference for a Single Check (di).
The percentage difference, di, for each check is calculated by SEMARNAT using equation 19, where Xi represents the concentration produced from the primary sampler and Yi represents concentration reported for the duplicate sampler, as follows:
Equation 19
100
2)( xXY
XYdii
iii +
−=
E.2.2 Coefficient of Variation (CV) for a Single Check (CVi). The coefficient of variation, CVi, for each check is calculated by NOM by dividing the absolute value of the percentage difference, di, by the square root of two as shown in equation 20, as follows: Equation 20

69
2i
i
dCV =
E.2.3 Precision of a Single Sampler - Quarterly Basis (CVj,q). (a) For particulate sampler j, the individual coefficients of variation (CVj,q) during the quarter are pooled using equation 21, where nj,q is the number of pairs of measurements from collocated samplers during the quarter, as follows: Equation 21
qj
ni
ii
qj n
CVCV
,
1
2
,
∑==
(b) The 90 percent confidence limits for the single sampler's CV could be calculated by SEMARNAT using equations 22 and 23, where X2 0.05,df and X2 0.95,df are the 0.05 and 0.95 quantiles of the chi-square (X2) distribution with nj,q degrees of freedom, as follows: Equation 22
inferior Limit 2
1
,,95.02
,, ⎟
⎠⎞
⎜⎝⎛=
qnj
qjqj X
nCV
Equation 23 Límite superior del intervalo de confianza
superior limit 2
1
,,05.02
,, ⎟
⎠⎞
⎜⎝⎛=
qnj
qjqj X
nCV
E.2.4 Precision of a Single Sampler - Annual Basis. For particulate sampler j, the individual coefficients of variation, CVi, produced during the calendar year are pooled using equation 21, where nj is the number of checks made during the calendar year. The 90 percent confidence limits for the single sampler's CV are calculated by SEMARNAT using equations 22 and 23, where X2 0.05,df and X2 0.95,df are the 0.05 and 0.95 quantiles of the chi-square (X2) distribution with nj degrees of freedom.

70
E.2.5 Precision for Each NOM Federal Reference Method and Equivalent Method Designation Employed by Each Reporting Organization - Quarterly Basis (CVk,q). (a) For each method designation k used by the reporting organization, the quarter's single sampler coefficients of variation, CVj,qs, obtained from equation 21, are pooled using equation 24, where nk,q is the number of collocated primary monitors for the designated method (but not collocated with FRM samplers) and nj,q is the number of degrees of freedom associated with CVj,q, as follows: Equation 24
( )
∑
∑
=
==qj
qj
n
jqj
n
jqjqj
qk
n
nCVCV
,
,
1,
1,
2.
,
(b) The number of method CVs produced for a reporting organization will equal the number of different method designations having more than one primary monitor employed by the organization during the quarter. (When exactly one monitor of a specified designation is used by a reporting organization, it will be collocated with an FRM sampler.) E.2.6 Precision for Each Method Designation Employed by Each Reporting Organization - Annual Basis (CVk).
For each method designation k used by the reporting organization, the quarterly estimated coefficients of variation, CVk,q, are pooled using equation 25, where nk,q is the number of collocated primary monitors for the designated method during the qth quarter and also the number of degrees of freedom associated with the quarter's precision estimate for the method designation, CVk,q, as follows:
Equation 25

71
( )
∑
∑
=
== 4
1,
4
1,
2,
qqk
qqkqk
k
n
nCVCV
E.3 Collocated Samplers, Where the Duplicate Sampler is an FRM Device.
At low concentrations, agreement between the measurements of collocated samplers may be relatively poor. For this reason, collocated measurement pairs are selected for use in the precision calculations only when both measurements are above the following limits: PM2.5: 6 µg/m3. These duplicate sampler results are used to assess measurement system bias. Quarterly bias estimates are calculated by SEMARNAT for each primary sampler and for each method designation employed by each reporting organization. Annual precision estimates are calculated by SEMARNAT for each primary monitor, for each method designation employed by each reporting organization, and nationally for each method designation. E.3.1 Accuracy for a Single Check (d′i). Accuracy for a Single Check (d′i). The percentage difference, d′i, for each check is calculated by SEMARNAT using equation 26, where Xi represents the concentration produced from the FRM sampler taken as the true value and Yi represents concentration reported for the primary sampler, as follows: Equation 26
%100´ xXi
XiYidi−
=
E.3.2 Bias of a Single Sampler - Quarterly Basis (D′j,q). (a) For particulate sampler j, the average of the individual percentage differences during the quarter q is calculated by SEMARNAT using equation 27, where nj,q is the number of checks made for sampler j during the calendar quarter, as follows: Equation 27
∑=
qjn
ii
qjqj dx
nD
,
1,
´,
1

72
(b) The standard error, s′j,q, of sampler j's percentage differences for quarter q is calculated using equation 28, as follows: Equation 28
( )qj
qjqj
n
ii
qjqj n
xDndxn
sqi
,
2´,,
1
2´
,
´,
11
1 ,
⎥⎥⎦
⎤
⎢⎢⎣
⎡−⎟
⎟⎠
⎞⎜⎜⎝
⎛
−= ∑
=
(c) The 95 Percent Confidence Limits for the single sampler's bias are calculated using equations 29 and 30 where t0.975,df is the 0.975 quantile of Student's t distribution with df = nj,q-1 degrees of freedom, as follows:
Equation 29
inferior limit ´,,975.0
´, qjglqj xstD −=
Equation 30
superior limit ´,,75.0
´, qjglqj xstD −=
E.3.3 Bias of a Single Sampler - Annual Basis (D′j).
(a) For particulate sampler j, the mean bias for the year is derived from the quarterly bias estimates, D′j,q, using equation 31, where the variables are as defined for equations 27 and 28, as follows:
Equation 31
( )
∑
∑
=
== 4
1,
4
1
´,,
´
qqj
qqjqj
j
n
DnD
(b) The standard error of the above estimate, sej′ is calculated using equation 32, as follows: Equation 32

73
)
( )[ ]
( ) (∑ ∑
∑
= =
=
−
−= 4
1
4
1,,
4
1,
´,
´
1
12
q qqjqj
qqjqj
j
nn
nxsse
(c) The 95 Percent Confidence Limits for the single sampler's bias are calculated using equations 33 and 34, where t0.975,df is the 0.975 quantile of Student's t distribution with df = (nj,1 + nj,2 + nj,3 + nj,4−4) degrees of freedom, as follows:
inferior limit confidence ´,975.0
´jglj xsetD −=
Equation 33 y 34
Superior limit confidence ´,975.0
´jglj xsetD −=
E.3.4 Bias for a Single Reporting Organization (D′) - Annual Basis. The reporting organizations mean bias is calculated using equation 35, where variables are as defined in equations 31 and 32, as follows: Equation 35
∑=
=in
jj
Dxn
D11
´´ 1
E.4 FRM Audits.
FRM Audits are performed once per quarter for selected samplers. The reporting organization reports concentration data from the primary sampler. Calculations for FRM Audits are similar to those for collocated samplers having FRM samplers as duplicates. The calculations differ because only one check is performed per quarter.
Accuracy for a Single Sampler, Quarterly Basis (di). The percentage difference, di, for each check is calculated using equation 26, where Xi represents the concentration produced from the FRM sampler and Yi represents the concentration reported for the primary sampler. For quarter q, the bias estimate for sampler j is denoted Dj,q.
Bias of a Single Sampler - Annual Basis (D′j). For particulate sampler j, the mean bias for the year is derived from the quarterly bias estimates, Dj,q, using equation 31, where nj,q equals 1 because one FRM audit is performed per quarter.

74
Bias for a Single Reporting Organization - Annual Basis (D′). The reporting organizations mean bias is calculated using equation 35, where variables are as defined in equations 31 and 32.

DOCUMENT 6
Federal Audit Procedure for
Air Monitoring Systems
i

INDEX
PAGE
1. AUDIT OF AIR MONITORING SYSTEMS 1
1.1. Introduction 1
2.0 LEGAL AND INSTITUTIONAL CONSIDERATIONS 2
2.1 General Law on Ecological Equilibrium and Environmental Protection 2
2.2 Federal Metrology and Standardization Law 2
2.3 Institutional Aspects 3
3.0 FOCUS ON AN SMA AUDIT PROGRAM 6
3.1 Technical System Audit 6
3.2. Operating Audits 8
3.3 Data Audits 8
4.0 AIR MONITORING SYSTEM AUDIT SCHEME 10
4.1 Overview 10
4.2 Technical System Audit (ATS – acronym as given in Spanish) 11
4.2.1 Frequency Of Technical System Audits 12
4.3 Operating Audits (AF-acronym as given in Spanish) 12
4.3.1 Frequencyof operating audits 13
ii

4.4 Data Audits 13
5.0 PROCEDURES AND DIRECTIVES 14
5.1 General Accreditation Procedure by EMA 14
5.2 Guide for meeting NMX – 7025-INMC 2000 requirements 19
5.3 Examples of Operating Audits 36
6.0 BIBLIOGRAPHY 55
iii

1. AUDIT OF AIR MONITORING SYSTEMS 1.1 . Introduction Given the importance of Air Monitoring Systems (SMAs – acronym as given in Spanish) for the purposes of Air Quality Management, the third stage of the National Air Monitoring Program, PNMA, contemplates an audit scheme for the periodic assessment of its performance, with the aim of ensuring the quality of information generated by said SMAs. The main purpose of the monitoring systems is to measure air pollutant concentrations in order to gauge compliance with the air quality criteria set forth by the NOMs (Official Mexican Standards) of the Secretariat of Health (SS – acronym as given in Spanish) to protect public health. Furthermore, air pollutant concentrations (gases and particles) are measured using standardized testing methods, either because Mexican standards NMX already exist for some or, in other cases, because the detection principles used in certain methods have been validated internationally. Chapter 2 offers a compendium of legal and international provisions that can provide the basis for a Federal Audit Program (PFA – acronym as given in Spanish) for SMAs, referred to in the PNMA. Chapter 3 sets forth the general concept of audits and gives a brief outline of the different types of audits that have been developed for assessing air quality monitoring Systems and/or Networks. Chapter 4, which accounts for the main section of this document, puts forward a federal audit scheme, pursuant to the precepts and guidelines set forth by the Federal Metrology and Standardization Law with regard to accreditation and pursuant to the general criteria and directives of the Audit Program developed by the USEPA to assess quality assurance and control practices for Air Monitoring Systems (SMAs). Finally, chapter 5 provides a textual description of accreditation procedures and the requirements Guide for complying with NMX-17025- INMC-2000, while section 5.3 includes examples of operating audit procedures used by CARB.
1

2.0 LEGAL AND INSTITUTIONAL CONSIDERATIONS 2.1 General Law on Ecological Equilibrium and Environmental Protection As was mentioned in the Legal Framework section of document 1, article 111, point VII, of the General Law on Ecological Equilibrium and Environmental Protection sets forth the powers of SEMARNAT to: VII.- Issue official Mexican standards for the setting forth and operation of air quality monitoring systems; SEMARNAT (2001) Even though no official Mexican standard has, to date, been issued to set forth and run air quality monitoring systems, it is important to point out that one of the most relevant objectives of these documents is to set forth the basis for formulating the Official Mexican Standard for SMA operations. As has already been mentioned, the objectives of the PNMA include the use of tools and strategies to cover demand for air monitoring at priority locations, homologize air monitoring practices, set forth control and quality assurance systems and set forth a vigilance system through nationwide audits. It should also be reiterated that article 112, point VI, of the General Law on Ecological Equilibrium and Environmental Protection, sets forth that state and municipal governments “shall set forth and operate air quality Monitoring Systems with the technical support, if applicable, of the secretariat. Local governments shall send the secretariat local reports on air monitoring so that the latter may add them to the National Air Quality Information System” (SINAICA – acronym as given in Spanish). SEMARNAT (2001). 2.2 Federal Metrology and Standardization Law It is also important to consider the provisions of the Metrology and Standardization Law (LFMN – acronym as given in Spanish) in the field of accreditation, which sets forth, in article 70, that the competent agencies must approve any accredited persons that may be required to assess compliance with official Mexican standards (NOMs). In this context, in the field of air quality monitoring, the normative framework in force in Mexico includes both the NOM-SS, which set forth criteria for maximum permissible levels of pollutants in the air ( PST, PM10, Pb, CO, NO2,SO2 and O3), and the ”NOMs” of SEMARNAT, which should strictly speaking be NMX, given that
2

they correspond to testing methods that set forth measurement procedures to determine pollutant concentrations in the air. However, given that the General Law on Ecological Equilibrium and Environmental Protection is contemplating the creation of a specific NOM, setting forth the minimum requirements to be complied with by SMAs, SEMANART/INE would be given much greater scope for pursuing its objectives through the PNMA and the SINAICA in the field of compliance assessment.
It is also important to consider point II of said article, which sets forth that the competent approbatory authorities must avoid duplicating the necessary requirements for their accreditation, notwithstanding the setting forth of any additional ones, if it is justifiably demonstrated before the Secretariat (of the Economy) that they are indeed necessary in order to safeguard both the object of the official Mexican standard and the results of the assessment of compliance therewith and verification of whether or not the applicant meets the conditions for his or her approval. Article 71 states that the competent agencies may at any time perform inspections in order to check compliance with the Metrology and Standardization Law, its regulations and the official Mexican standards on the part of: accreditation agencies, accredited persons or any other entity or agency that performs activities relating to the fields referred to by this Law, as well as any that provide their services. Article 37 sets forth that competent agencies shall set forth, with regard to the official Mexican standards, procedures for assessing compliance when it is necessary to verify compliance therewith for official purposes. In this regard, accreditation should be understood to refer to the documented process by which an entity with recognized authority grants formal recognition that a natural person or a corporation is competent to perform specific work.
2.3 Institutional Aspects On a federal level, responsibility for Air Quality Management lies basically with the SEMARNAT and the Secretariat of Health. The National Institute of Ecology (INE), in turn, as the decentralized agency of the SEMARNAT, with regard to the field of pollution and air quality monitoring, is treated in a more explicit manner in the functions set forth by the Interior Regulation of the Secretariat.
Within the INE, the General Management of Investigation into Urban, Regional and Global Pollution, along with the National Research and Training Center and the
3

General Management of the National Center of Environmental Research and Training (CENICA – acronym as given in Spanish) share the main roles of the institution regarding air monitoring systems. Article 113, point XVIII, sets forth the following:
… XVIII. Promote and coordinate the maintenance and improvement of the quality assurance database and subsystems.
The roles of the General Management of CENICA regarding air monitoring systems are outlined in article 115 below, which sets forth that: “The General Management of the National Center of Environmental Research and Training shall perform the following functions”:
… II. To participate in assessment committees for the accreditation and approval of test laboratories in the field of sampling and analysis of air pollutants, substances and residues, whenever this may be required for the purposes of assessing compliance with the official Mexican standards, pursuant to the terms of the Federal Metrology and Standardization Law and pursuant to any criteria and guidelines set forth for such purposes by the Undersecretariat of Environmental Promotion and Standards; III. To propose to the competent administrative units of the Secretariat, technical specifications, designs, bases and protocols for operating and handling air monitoring system data; to supervise and assess quality operation and assurance for air monitoring systems, as well as to promote, coordinate and supervise the setting forth of air pollution monitoring systems in the states; … X. To propose to the competent administrative units of the Secretariat,
the development of analytical methods and quality control and assurance procedures for air pollution measurement and characterization processes;
… XVI. To operate like reference laboratories in the field of air
pollutant measurement equipment analysis and calibration, and XVII. To issue opinions and draft technical reports based on studies
and research, participation in technological assessment programs, supervision and assessment of air monitoring systems, whenever this may be required by the competent administrative units of the Secretariat and its decentralized agencies.
4

As is set forth in point XVl, the CENICA shall operate as a laboratory that transfers standards, and which may also play a decisive role in the support provided to the SMAs with regard to traceable chains, given that the basic aim of the audits performed on such systems will be to guarantee the quality of results by using traceable reference standards. As a result, the CENICA is considered the natural candidate with necessary and sufficient powers to coordinate a systematic assessment program for the country’s Air Monitoring Systems (SAMs), to which end, in the following sections the CINAM puts forward a Federal Audit scheme based on the provisions of the Federal Metrology and Standardization Law and the aforementioned legal and institutional provisions.
3. FOCUS ON AN SMA AUDIT PROGRAM In general terms, “an audit is a systematic and independent assessment to determine whether or not quality activities and the related results comply with the
5

planned requirements, and whether such requirements have been effectively set forth and are suitable for achieving the objectives”. In the case of the SMAs, the primary objective of an audit program must be designed to make sure that any published air quality data are provided by monitoring stations manned by trained staff and using approved methods based on well documented procedures and traceable materials and instruments, as well as that such results are reported with the required precision and accuracy. The audit program must also ensure that air quality data are comparable and used in a reliable manner in the air quality management programs executed by the environmental and health authorities or, if applicable, by researchers and any other parties involved. These audit programs are generally formulated in the United States by the Environmental Protection Agency (EPA) and contemplate three types of audits for SMAs: Technical System Audits, Operating Audits and Data Audits whose operational scopes are described below.
3.1 Technical System Audit
A technical system audit is a full review of the Monitoring Program, of the organization in charge of the SMA, in which technical aspects are reviewed including the following: measuring systems (sample collection, sample analysis, data processing, drafting of reports etc.). The audit includes a review of staff, operational procedures, installations and documentation to ensure compliance, as well as of administrative matters in terms of quality assurance.
A technical audit generally includes the assessment of the following elements:
A. Staff appraisal:
6

1. Level and professional experience of staff . 2. Functions and duties. 3. Staff training. B. Assessment of installations: 1. Review of site staff using questionnaires and checklists. 2. Review of laboratory practices. 3. Review of field activities. 4. Inspection of laboratory and support installations. 5. Review of monitoring stations with regard to location and representativeness criteria 6. Review of the environmental conditions of the laboratories and stations (temp, RH, etc.) C. Document data and control assessment: 1. Review of custody chain forms. 2. Review of daily operation records. 3. Review of field document records. 4. Review of report forms, including the processes used for data gathering. 5. Review of data handling and retention time. D. Quality assurance program assessment: 1. Review of quality policies, plans and objectives 2. Review of operational procedures 3. Review of content and degree of procedure application
3.2 Operating Audits
7

Operating audits consist of checking the response or other critical operation parameters of samplers, analyzers and instruments against reference materials or standards. Operating audits may be divided into the following categories:
A. Audits performed with probes, in which cylinders with known concentrations of criteria gases or hydrocarbons are used to check the reliability of the response of analyzers operating in the SMAs. B. Flow Audits of samplers, applicable to different items of equipment for determining particles (PM10, PM2.5) where flows are checked using transfer standards, such as orifice calibrators or certified flow gauges (by mass or volume). Said device is usually connected in series to the flow measuring device of the sampler, and the flow rate is measured under normal sampling conditions.
C. Laboratory Audits which consist of the use of traceable standard solutions of the analyses to be assessed, such as: lead or toxic organic compounds, that are determined in the audited systems.
D. Meteorological Instrument Audits, which are performed in order to assess the response of sensors against the ones obtained using traceable reference instruments or instruments accepted as such.
3.3 Data Audits In general, a data quality audit must be aimed at exhaustively assessing the procedures used to gather, interpret and report air quality data. The assessment criteria used are related to the data quality objectives set forth by the SMA itself and which include the statistical procedures used for their control. Data audits, and others, may include the assessment of the following aspects:
Registration, storage and transfer of raw data Data review, verification and validation procedures Data handling, calculation and electronic page validation procedures Selection and discussion of data quality Indicators, such as: Precision,
Accuracy, Completeness, Comparability and Representativeness. In this regard, it is important to bear in mind that data audits are closely linked to the activities of technical audits and operating audits, as well as to the reporting
8

requirements set forth for checking the quality of information on air pollutant concentrations.
9

4.0 AIR MONITORING SYSTEM AUDIT SCHEME 4.1 Overview Pursuant to the information set out in the foregoing sections, it is considered that a viable scheme for guaranteeing the obligatory installation of Auditable Quality Management Systems in the SMAs may be provided by following the sequence of stages given in figure 1, which is discussed below.
Fig. 1 FEDERAL AUDIT SCHEME FOR SMAs P L A N N I N G
FORMULATION AND ISSUANCE
OF NOM COORDINATION WITH
SEMARNAT-SE-EMA CREATION OF A SUBCOMMITTEE
FORMULATION OF
ASSESSMENT GUIDES
E X E C U T I O N RESPONSIBLE TYPE OF AUDIT FREQUENCY
EMA ACCREDITS
TECHNICAL SYSTEM AUDIT
RENEWAL 4 YEARS
VIGILANCE 2 YEARS
CENICA APPROVES DATA
AUDIT (LEVEL A)
PRELIMINARY STAGE CENICA FINAL STAGE
PARTICULAR ASPECTS
OPERATING AUDIT
100 % EQUIPMENT 2 YEARS1
100 % EQUIPMENT 3 YEARS2
SINAICA PERIODIC REPORTS DATA AUDIT (LEVEL B)
SIX-MONTHLY (ACCORDING TO
SCOPE)
SINAICA DATA AUDIT (LEVEL C) DAILY REPORTS
1. Number of analyzers per parameter < 10. 2. Number of analyzers per parameter > 20.
As is shown in figure 1, under the proposed scheme, the equivalent to the Technical System Audit type will be performed through the accreditation and approval system set forth by the Federal Metrology and Standardization Law. Under these conditions, it would be essential to speed up the formulation and issuance of the Official Mexican Standard setting forth the homogenization criteria and the requirements that must be complied with by the persons responsible for the operation of the Air Monitoring Systems in the national territory.
10

The central elements of the standard must set forth the binding nature (or, if applicable, induce it) of the following:
Accreditation from the Mexican Accreditation Agency, EMA (acronym as given in Spanish).
Additional approval criteria from the competent authority of
SEMARNAT-INE-CENICA. The commitment to play an active role in the National Air Monitoring
Program. The compulsory nature of reporting to the SINAICA pursuant to the terms of
article 112 of the General Law on Ecological Equilibrium and Environmental Protection in whichever forms and electronic mediums are set forth.
Install, maintain and improve an Environmental Management System
pursuant to the Standard NMX-17025- INMC-2000. Comply with whichever data quality targets and/or acceptance criteria are
set forth in said Standard.
The frequency and types of Calibration of instruments, analyzers and transfer standards.
4.2 Technical System Audit (ATS) Under these conditions, the Technical System Audit would be performed in the accreditation process which, in terms of the Metrology and Standardization Law, is called “Assessment”, but whose scopes in the Standard NMX-17025-INMC-2000 amount to a Detailed Audit of all the components that make up the quality system of an organization that uses test methods, such as: Quality System, Document Control, Corrective and Preventive Action, Record Control, Internal Audits. Also, the scope of said standard in point 5 of the technical requirements includes auditable elements, such as: staff, installations and environmental conditions, assay and calibration methods, equipment, traceability, quality assurance for results, etc, which are largely in accordance with the type of activities currently performed in the SMAs in operation, where, in general terms, it may be set forth that they are limited to the automatic monitoring of criteria pollutants and, in some cases, to manual methods used for particle determination (PST and PM10). While it is true that the conceptual scheme of the accreditation process put forward through the EMA is deemed “Ad Doc” for Auditing SMA Quality Systems, it is
11

necessary to make an objective assessment of the current performance of this entity and of the likelihood, in the medium term, that it will have assessors and technical experts with a proven track record in Air Monitoring test methods. The creation of a specific subcommittee for air quality in coordination with the EMA is highly recommended. The accreditation of test methods for the determination of air pollution by private or institutional laboratories is currently performed through the Fixed Source and Residues subcommittee. 4.2.1 Frequency of Technical System Audits Under the current accreditation procedure, assessments for accreditation renewal are conducted every four years, but there are also annual vigilance inspections, which may be documentary in form in the first year, while in the second (halfway through the Accreditation period) it is conducted on site. 4.3 Operating Audits The scheme of Operating Audits, which consist of checking responses to a given number of items of equipment-instruments of each air monitoring system based on the comparison of reference materials or instruments conducted in the field, would take place in two stages: Stage I: Short term Proposed period 2005 - 2007 The first stage of Operating Audits would be conducted by the General Management of the CENICA itself based on the strengthening and accreditation of its reference laboratory and the certification of the transfer standards at its disposal. To this end, it is highly recommended that an agreement be sought with the CARB Standards Laboratory, as well as that the help of International Agencies be requested in order to acquire and maintain complementary materials, equipment and instruments for such activities. Stage II Medium and long term 2008 onwards Afterwards, in the medium term, a process for approving private entities will be set up by the General Management of CENICA, in which the natural candidates for carrying out such Operating Audits would de Calibration Laboratories (current and future) accredited by ema and that provide automatic analyzer calibration and/or maintenance services both for vehicle emissions (Verification Centers) and for instrumental analyzers used at fixed sources. To this end, it would be important to conduct a survey of the market today and of its trends in order to determine how financially viable it is.
12

4.3.1 Frequency of Operating Audits The temporary coverage proposed for Operating Audits is as follows: Every two years all the criteria pollutant analyzers in any networks with 10 or fewer analyzers and/or samplers per parameter and/or measuring instruments deemed critical for guaranteeing station data quality. This category includes all the automatic and manual networks currently operating in the country with the exception of the one corresponding to the ZMCM. In the case of the SIMAT of the ZMCM, a specific criterion for total coverage in three years is proposed. 4.4 Data Audits Data Audits will be performed as of three levels of the Integral operation scheme of the National Air Monitoring Program.
LEVEL A. During on site Assessment for the purposes of Accreditation where the general assessment of the Quality System is performed, the technical staff of CENICA as the Competent Authority would take part in these assessments, where the primary aim would be to conduct an in-depth review for the purposes of data quality assessment. To this end, the drafting of an “Assessment Guide” to support the Approval decision is highly recommended. Also, during the vigilance inspection conducted in the field every two years, the relevant reviews at this level would be performed. LEVEL B. The second Mechanism would consist of the requirements of the three-monthly or six-monthly reports with statistics on precision, accuracy or completeness as set forth in the NOM.
LEVEL C. On the basis of the reception of data sent daily to the SINAICA, via indicators aimed at the detection of evident failures in monitor operation and/or due to extraordinary events, and whose purpose would be of a preventive nature in order to minimize the possible invalidation of a substantial amount of data.
13

5.0 PROCEDURES AND DIRECTIVES Section 5.1 of this chapter presents the sequence of stages involved in the procedures of the Mexican accreditation entity (ema) currently in force. In this regard, it is important that an Air Monitoring System be conceived as an assay laboratory, in other words, as an organization whose basic processes are related to the execution of test methods for quantitatively determining a substance in the air. 5.1 General Accreditation Procedure by EMA The need to ensure that calibration and assay laboratories have a scheme accrediting or endorsing services and that they be recognized both nationally and internationally has made it necessary to set forth accreditation systems, to which end the Mexican Accreditation Entity (EMA) has developed a methodology for assessment and accreditation, based on NMX-EC-17025-INMC-2000. IMNC (2000) The following items provides an outline of the process: I. Presentation of requirements The presentation of requirements by the customer must cover the following points: 1. Have a Quality System 2. Technical procedures developed and implemented 3. Internal Quality Audit (already performed) 4. Official letter setting forth the intention to provide accreditation Il. Presentation of application The application presented must cover the following: 1. Definition of scopes 2. Customer commitment to comply with the accreditation process 3. To pay any costs related to the process 4. Liability
14
lll. Review of Documents 1. This consists of an in-depth review of the documents of points l and ll, making sure that they are complete and the right ones. lV. Designation of an Auditor Group The auditor group shall be assigned by the EMA 1. The auditor group will consist of at least two persons who will perform
document assessment, on site assessment and follow-up assessment. 2. The EMA will notify the customer of the designation of the assessor group.
The Customer may refuse to receive any of the group members because of: the existence of a customer-supplier relationship, the existence of a working relationship in the last two years or because there is an advisory-guidance relationship
3. If the customer accepts the assessment date, the EMA will be notified in writing. V. Document Assessment 1. Step II assessment will be performed prior to on site assessment. The head
assessor must send the customer the report on the document assessment with the corrective action plan application
2. If there are no non-conformities, the following must be done:
a) the corrective action plan must be presented, including an explanation of how any non-conformities will be dealt with and the time
b) if the action plan is not delivered to the customer on time, it shall be deemed that the assessment and accreditation process has come to an end
3. The assessor group will review and issue a report with the results referring to
the action plan. The report will be sent to the customer.
15

4. The corrective actions will be reviewed during on site assessment. If corrective actions are not taken in a period of no more than six months, the EMA will end the assessment and accreditation process.
5. If no non-conformities are encountered, but only observations, then Step VIII will begin.
VI. Pre-Assessment
1. This is an optional activity at the request of the customer, and it allows preliminary diagnosis and a general identification of the installation of the quality system, the technical part and the clarification of the interpretation of standard NMX-EC-17025-INMC-2000. The entity issues a report on the results with any observations and non-conformities.
VII. Preparation of the Assessment 1. The EMA will notify the customer and assessor group of the date for on site
assessment 2. The customer must confirm the date of on site assessment VIII. On Site Assessment 1. Customer installations are assessed, checking the quality and technical
system, as well as compliance with the requirements set forth in standard NMX-EC-17025-INMC-2000.
2. Assessment will be performed only in accordance with the scope of the application for accreditation.
3. The on site assessment procedure will consist of the following:
a) an opening meeting b) document installation verification c) a closing meeting to present any non-conformities or observations
detected and the delivery of the assessment results.
4. The head assessor may suspend on site assessment if:
16

a) the quality or technical system has not been installed b) the customer fails to provide any facilities c) the assessed party attacks the integrity and dignity of the assessor group d) the reasons for suspension must be specified in the respective report
IX. Decision 1. The report is presented to the Technical Opinion Commission so that it may
issue its technical opinion 2. The EMA will notify the customer of the status of his application in this step
and the timeframe for the remedying of 100 % of his non-conformities 3. The decision will correspond to the three following cases: in the case of an
initial accreditation application or a renewal (reassessment) or an extension, and in the case of an assessment of vigilance or continuity update.
4. The EMA must remit the decision on its accreditation 5. The decision may consist of a denial, a suspension or a partial or full
withdrawal of the accreditation. 6. The accreditation document (with an effective term of 4 years, as of its
issuance), and the accreditation diploma, issued by the EMA, may only be modified by the EMA itself.
X. Continuity 1. This step takes place upon issuance of a technical report requesting the
presentation of corrective action, if any complaints or claims are received regarding the actions of the laboratory, and this continuity may be conducted in two ways:
a) By document assessment b) By on site assessment.
XI. Vigilance 1. This consists of an annual assessment of the accredited party in order to
check that it is maintaining the conditions under which it was accredited
17

2. The first year of vigilance is conducted on the basis of documents, while in the second year an on site inspection takes place. On the basis of the latter, the Assessment Committee will determine the scope of the third vigilance.
3. Vigilance in the fourth year will be conducted as determined in the renewal stage
4. The EMA is responsible for notifying the customer of the vigilance XII. Accreditation Renewal 1. This consists of repeating the whole assessment and accreditation process
at the end of the effective term with the aim of obtaining the re-issuance of the accreditation. This is conducted at the request of the customer, who must notify the EMA four months prior to the accreditation expiration date.
2. Renewal will be performed pursuant to steps III to XI. XIII. Accreditation Extension and/or Update 1. For an extension: this consists of conducting an assessment at the customer
installations in order to check it has the resources necessary for the extension.
2. Extensions may be granted for: calibration and/or assay methods and techniques, measurement scopes already accredited, staff, installations and equipment. This type of extension assessment may be conducted together with Step XI.
3. For updates, the process consists of conducting a document assessment or an assessment at the customer installations in order to assess the requested update.
4. The update may be granted in the following cases: in the quality part of the system, the technical part, the administrative part, change of installations. In the case of updates of the quality and technical administrative part, internal EMA staff will perform document assessment. In the case of basic updates of the technical or quality part, as well as administrative ones, the steps of the procedure (IV to X) must be followed, in this case, accreditation will be temporarily suspended until the procedure is completed.
5. The customer must present the application to EMA in the cases of points II and III of this step.
18

5.2 GUIDE FOR MEETING NMX-EC-17025-INMC-2000 REQUIREMENTS
This section provides an adaptation of the Internal Procedure of the Mexican Accreditation Entity (ema) MP-FE005-00, which represents the guide for meeting the administrative and technical requirements of NMX-EC-17025-2000 for the purposes of accreditation. In this regard, it is important to clarify the following points: 1) the term laboratory has been replaced by SMA; 2) numbers in brackets correspond to points in the standard and 3) the term assay/calibration has been left in because of the large number of calibrations performed in an SMA, but the original sense in the ema procedure is that this standard applies both for assay laboratories and for calibration laboratories. ADMINISTRATIVE REQUIREMENTS
Organization [4.1] The aim is to identify the position of the SMA and all its staff in the organization, as well as to indicate the functions and duties of each member of the same system. Criteria: The SMA must:
a) Identify, in its quality management system, the legal standing that takes on any legal responsibilities derived from its activities [4.1.1].
b) Analyze and document all the activities it performs and that are different from
those of the assay and/or calibration in order to determine whether there are any conflicts of interest affecting key members of staff in the organization. If the SMA belongs to a bigger organization, the analysis must include the activities performed by this organization [4.1.4].
c) Define the responsibilities of key members of staff and document the steps
taken to guarantee the elimination of any conflicts of interest it may have identified [4.1.4].
d) Document the commitment of all laboratory staff to comply with the
measures taken on to ensure the protection of confidential information and the property rights of its customers [4.1.5 c].
e) Not perform any activities that could jeopardize trust in the independence of
its judgement, as well as its operational impartiality and integrity. This applies to the laboratory, the organization and staff [4.1.5 d].
f) Have one or several updated organizational charts that clearly reflect the
organization and the levels of responsibility, lines of communication and staff
19

hierarchies. These charts must cover the whole organization including the laboratory, not just the area of the laboratory applying for accreditation, and reflect the position of the laboratory in the organization. Partial organizational charts may be presented in each section or department [4.1.5 e].
g) Present proof that constant supervision is provided (at least once a week) to
staff who perform assays and/or calibrations, as well as to any in the induction process. Supervisory staff must have specific experience in the area to be supervised [4.1.5)
h) If the technical management consists of more than one person, it is
necessary to specify the duties and responsibilities of each member of the management team [4.1.5 i].
5.2.2 Subcontracting of assays and calibrations [4.5] Underline the importance of ensuring trust in the reported results, if they are not issued by the SMA itself. Criteria: The only subcontracted methods considered are the ones that lie within the scope of the accreditation. However, the SMA must be able to demonstrate that any unaccredited assays and/or calibrations are being contracted to an accredited supplier. The SMA must:
a) State, in the quality management system, when it is not performing assay and/or calibration subcontracting activities, or not intending to do so.
b) Demonstrate the competency of subcontractors through the up to date
accreditation thereof with Mexican standard NMX-EC-17025-IMNC-2000 [4.5.1]. If there are no accredited laboratories, the subcontracting of unaccredited laboratories will be permitted, but the subcontracting party will be liable for checking compliance with the standard NMX-EC-17025-IMNC-2000 of the subcontracted party .
c) Provide proof of customer acceptance of the subcontracted service [4.5.2].
d) Clearly identify the subcontracted methods, both in the contract accepted by
the customer and in the certificates and reports [5.10.6].
e) Avoid any type of usage of the brand name or logo of the entity or any reference at all to the accreditation, in which the scopes of accreditation and subcontracted work are not perfectly well defined and could give rise to
20

incorrect interpretations. Purchase of Services and Supplies [4.6] The intention is to ensure that any supplies, reagents and consumer materials that affect the quality of assays and/or calibrations comply with the technical requirements set forth. Criteria: Verification of compliance by supplies, reagents and consumer materials with requirements as set forth by standards or with requirements defined in the assay and/or calibration methods does not involve the conducting of any chemical analysis unless otherwise stated in the standardized assay or calibration method or unless it is contemplated by the laboratory as part of the quality control of its results. Compliance by the supplies, reagents and consumer materials with the required technical characteristics may be demonstrated with quality certificates or reference material certificates evidencing traceability, as required [4.6.2]. The SMA must:
a) Clearly define which supplies, reagents and consumer materials affect the quality of the assays and/or calibrations within the scope of accreditation [4.6.3].
b) Provide proof that the technical characteristics of the supplies, reagents and
materials specified in the purchase documents are reviewed and approved in order to guarantee that the service or supply obtained complies with the technical requirements set forth [4.6.3].
Non-compliant Assay and/or Calibration Work Control [4.9] This ensures that “the customers” do not receive any non-compliant work and, if they do, then they must be informed, an assessment thereof must be conducted and any necessary steps must be taken to correct it. Criteria: SMA product is understood to refer to the results of the assay/calibration reflected in the results report or the calibration report. Any non-compliant assay/calibration work may be detected in any of the assay/calibration process stages (from the taking of the sample to data transcription), as a result of which the applicable procedures must contemplate this scope. The SMA must have the following records:
21

a) an assessment of the impact of each non-compliant piece of work detected. b) the immediate action taken [4.9.2]. c) full continuity of corrective action.
Corrective Action [4.10] The aim of this is to correct any type of deviation detected either in the assays/calibrations conducted or in the quality system, and to take action to prevent any repetition. Criteria: The SMA must:
a) Have records of all the activities performed for corrective actions provided there is no non-conformity derived from any source (complaints, internal and external audits, supervision, non-compliant assay or calibration work, management reviews or others), from the investigation of the causes through to the verification of the effectiveness of the action taken [4.10.2, 4.10.3, 4.10.4].
b) Provide proof that the full corrective action procedure is followed for any
non-conformities derived from the different stages of the assessment and accreditation process.
Preventive Action [4.11] The aim of this is to detect any type of potential deviation, either in the assays/calibrations performed or in the quality system and to stop it from turning into an non-conformity. Criteria: Preventive action is not a reaction to any problems, complaints, quality system deviations, etc. as it is performed before any problems take place. It should be noted that once any non-conformity has been detected, any step taken to prevent the recurrence thereof is a corrective action. The SMA must be able to detect any trends that will help it anticipate non-conformities either in the management system or in the assays/calibrations within its scope of accreditation. A single procedure for corrective and preventive action is permissible, provided that the difference between the two is specified and instructions are given on how to proceed in each case.
22

Control of Records [4.12] The traceability of assay or calibration results issued by the SMA is ensured by the correct use of technical and quality records, as well as the protection and confidentiality thereof. Criteria: Technical and quality records must be kept in a live or dead file for at least four years or for whichever length of time is set forth by other applicable legal provisions, or for whichever length of time the customer himself may request (the longest of these). Any stations that do no yet provide assay and/or calibration services must start keeping records as of the initiation of the activities described in section (5.4) of the technical aspects of this document, which refers to newly set up laboratories. Procedures for the control of technical and quality records may be included in the technical and quality system procedures they are derived from. The SMA must:
a) Keep a record system either in hard copy or electronically that is suitable for its particular circumstances.
b) Maintain and retain technical records, including any original observations
that may arise from the different stages of the assay or calibration processes, from sampling and/or the reception of the assay or calibration elements through to the drafting of the results report that makes full result traceability possible.
c) Use logs or notebooks to record the data obtained from the assay and/or
calibration process. If records are kept electronically, then it is necessary to set forth and document the equivalent measures to prevent any losses of or changes to the original data.
d) Not use any loose sheets of paper to record assay and/or calibration data.
Internal Audits [4.13] These provide the laboratory with a powerful tool for checking the degree of installation of the quality management system and the technical requirements that allow assays and/or calibrations to be performed. Criteria:
23

Internal audits may be performed by an internal auditor or an external auditor hired for such purposes. They may not, under any circumstances be replaced by external audits, such as the ones performed by “the customer”, certification agencies, etc. It should be pointed out that the corrective actions that arise from internal audits may be found in the attention process when assessment is conducted by the entity. In this regard, it is also necessary to clarify that, for accreditation purposes, it is an essential requirement that any non-conformities arising from this accreditation process be dealt with. In addition to this, the SMA must:
a) Plan internal audits.
b) Demonstrate that it conducts a full internal audit at least once a year, and that it includes all the laboratory areas (including assay and/or calibration methods), as well as complies with all the requirements of NMX-EC-17025-IMNC-2000. [4.13.1].
c) Contemplate knowledge of the standard NMX-EC-17025-IMNC-2000 in the
required profile for members of staff who will conduct internal audits. It is recommended that said profile be based on ISO 19011 [4.13.1].
d) Provide proof that the staff member designated as an internal auditor is
qualified in accordance with the profile set forth [4.13.1].
e) Include auditors who are familiar with the technical area, or, if none are available, it is necessary to demonstrate that members of staff with technical knowledge have taken part in the drafting of an assessment list or guide [4.13.1].
f) Provide proof that internal audits take into account all the points of
requirement 4.13 of the Mexican Standard NMX-EC-17025-IMNC-2000 even if they are performed using a quality system based on a different standard (e.g. ISO 9001). Any findings in the internal audits that raise doubts as to the validity of the assay or calibration results must, in all cases, be dealt with pursuant to 4.9 “Control of Non-Compliant Assay and/or Calibration Work”.
Management Review [4.14] This equips the executive management of the SMA with a tool that allows the taking of strategic decisions based on an overall analysis of the quality system. Criteria: The management review is not the same as the internal audits and the review of quality management system documents, but rather an overall analysis of the
24

laboratory’s quality system aimed at gauging its efficiency and/or to make any necessary improvements or changes. The management review must be performed by the executive level with authority for taking decisions and providing resources. As a result, the SMA must:
a) Plan the management review.
b) Conduct a management review at least once a year [4.14.1].
c) Provide proof that the management review takes into account all the points of requirement 4.14.1 of the Mexican Standard NMX-EC-17025-IMNC-2000 even if it is performed using a quality system based on a different standard (e.g. ISO 9001).
Technical Requirements Staff [5.2] The aim of this is to ensure that the members of staff involved in assays/calibrations are technically competent and familiar with the quality management system of their organization. Criteria: Even if the standard NMX-EC-17025-IMNC-2000 does not include the concept of the authorized signatory, the ema continues to use this term, which is defined in the assessment and accreditation procedure as: “The person in charge of the calibration and/or assay area, proposed by the customer and authorized by ema to sign and endorse any calibration and/or assay reports issued by the laboratory”. It is understood that not all the members of staff designated as signatories perform assays and/or calibrations (managers, supervisors, directors, etc.) as part of their day to day duties, but, given that they are responsible for the reports issued, they must demonstrate a sound knowledge of these activities. In view of the foregoing, all the signatories proposed in the accreditation application must:
a) Demonstrate that they have knowledge (in practice and with documents) of the technical procedures, based on the scope of the accreditation they have applied for [5.2.1] and in accordance with their duties and responsibilities [4.2.1].
b) Be familiar with the laboratory’s quality system, in accordance with their
duties, responsibilities and interaction with other areas [4.2.1].
25

In addition to the foregoing, the SMA must:
a) Keep records on the performance assessment results of the assays and/or calibrations performed by the staff members involved in technical operations (those who perform sampling, assays and/or calibrations, even if they have not been proposed as signatories) [5.2.1; 5.2.5].
b) Demonstrate that the internal and/or external training granted to laboratory
staff corresponds to the technical and administrative activities performed by each person and any training needs identified [5.2.2].
Assay and Calibration Methods and Method Validation [5.4] The aim of this is to select and formulate assay and/or calibration methods, as this is a central part of the SMA, given that this involves the product offered “to the customer” (or the public), and it is therefore essential to be able to control it. Criteria: The methods considered are those that have been standardized, sufficiently validated, published in Official Mexican Standards, Mexican Standards or issued by recognized international or foreign standardization organizations, such as ISO, ASTM, AOAC, EPA, USP, Standard Methods, etc. The SMA must:
a) Document any assay and/or calibration methods included in the scope of its accreditation (including procedures for sampling, handling, transportation, storage and preparation of the elements to assay and/or calibrate) and have them available for consultation at the location where assay and/or calibration activities are conducted [5.4.1; 5.4.2]. The technical standard for the development of an assay and/or calibration method may be referred to, provided there is a particular procedure indicating that the specific details of the method are not included in the aforementioned technical standard, such as: installations, equipment, preparation, care and disposal of the element on which the assay and/or calibration is to be performed, etc. [5.4.1 note].
b) Check the method to ensure that it complies with the specifications thereof
and has the technical competence to do so suitably taking into consideration its installations, equipment and staff [5.4.1]. This may include for example: verification of equipment performance against method requirements, use of reference materials required by the method, compliance by the installations and environment of the laboratory with the provisions of the method, profile and competency of the staff members performing the method, as well as the overall ability of the laboratory to achieve repeatability, accuracy, detection limit (if applicable), linearity (if applicable), compliance with the acceptance
26

criteria when the method specifies this or, if applicable, the criteria set forth by the laboratory using performance data.
c) Demonstrate that any occasional deviations in the documented methods and
procedures are: technically justified, authorized by the functions of the laboratory with authority to allow such deviations and accepted by the customer in writing [5.4.1].
d) Have procedures for estimating the degree of accuracy of the measurements
pursuant to the provisions of the “Measurement Traceability and Uncertainty Policy” of ema currently in force [5.4.6].
For any own methods or methods developed by the laboratory or obtained from scientific publications, as well as standardized, modified or extended methods or methods used beyond the proposed scope, the laboratory must: a) Have validation procedures [5.4.5.2]. b) Keep validation records and a declaration on whether the method is suitable for the proposed use [5.4.3]. c) Document and validate modifications to the standardized methods. When a method is written in one way and performed in another, this amounts to a deviation of the method and not a modification. It is necessary to validate all the computer applications developed by the laboratory on commercial platforms with specific purposes and a direct impact on the acquisition, storage, processing, registration or reporting of assays or calibration data. This includes calculation sheets, databases, word processors, etc. The integrity and confidentiality of data in computers may be guaranteed by the user code access levels. Frequently performed methods may be accredited. However, under special circumstances methods that are not performed frequently may be accredited. In such cases, the laboratory must present the method performance assessment at least once a year in order to demonstrate its technical competency to perform it. A newly created assay and/or calibration laboratory may be accredited even if it has not provided service to the customer, taking into account the following considerations:
a) It is necessary to demonstrate, both in practice and with documents, the knowledge, experience and training of the members of staff involved in performing each technical procedure or method that lies within the scope of accreditation.
b) If the method result or results depend on the skills of the staff members, as is
27

the case of analytical chemical methods, it is then necessary to:
− Perform at least one statistically valid internal suitability assay for each of the technical procedures or methods that lie within the scope of accreditation, and
− Conduct at least three complete practical assay or calibration
exercises (from the registration of the assay or calibration element to the drafting of the results report or the calibration report) for each of these technical procedures or methods that lie within the scope of accreditation.
c) If the method or methods do not require any specific skills on the part of the
staff, then at least three complete practical assay or calibration exercises (from the registration of the assay or calibration element through to the drafting of the results report or the calibration report) must be performed for each of these technical procedures or methods that lie within the scope of accreditation.
Equipment [5.5] To ensure that the equipment used for assays/calibrations complies with the required specifications to ensure the reliability thereof. Criteria: If the SMA uses rented equipment, there must be records of the inspections performed prior to usage thereof, in order to check for any damage or malfunctioning. The laboratory is responsible for ensuring that this equipment is given the same treatment regarding checks and/or calibrations as the equipment that belongs to the laboratory before, during and after the period of usage. The corresponding calibration certificates must be presented, along with the verification records. All aspects of any rented equipment must be integrated into the quality system, as if it were owned equipment, including any necessary training for correct operation. In this case, the SMA must present documentation endorsing the renting of the equipment, such as: Financial leasing agreement with a purchase option. Pure leasing agreement for a specified period. Leasing agreement for a specific task or project.
In all of these cases, these agreements must include the conditions under which the equipment is rented regarding installation, calibration, verification and maintenance,
28

and who is responsible for providing such services. The laboratory must provide proof of how compliance with said conditions is ensured. For any networks using rented equipment, vigilance assessments will be performed on site. As far as owned and rented equipment is concerned, the SMA must:
a) Have the procedures currently in force for equipment operation [5.5.3], maintenance [5.5.3], storage [5.5.6], calibration [5.5.2] and verification [5.5.10] available at the sites where they are used.
b) Specifically identify the staff members who are responsible for equipment
handling, calibration and maintenance [5.5.3].
c) Keep records of compliance with the calibration and maintenance programs for all the equipment and each element thereof. Said records must contain: the date, the site where the activity was carried out, the person who carried it out, and details on storage when the equipment is not in use [5.5.5].
d) Analyze the effect caused by the absence of instruments, when they are sent
for external calibration, on normal laboratory operations and take action in this regard [5.5.9].
e) Perform on site calibration of any equipment that may be sensitive to any
movements, in other words this must be done where they operate [5.5.2].
f) Ensure the inclusion of equipment handling procedures, the precautions to take for handling or transfer, in the case of equipment or patterns sensitive to any movements [5.5.6].
g) Examine the effect on assays or calibrations performed prior to the detection
of any equipment that does not meet the specifications, has incorrect settings or is incorrectly calibrated. There must be application records of the non-compliant assay or calibration work control procedures, including notice to any affected customers.
Traceability of Measurements [5.6] The aim of this is to ensure that the reliability of measurements, given quantitatively by the margin of error associated with it, is known in terms of the reliability of national or international measurement patterns referred to as the origin of traceability for such measurements. Criteria: Not all equipment, or elements thereof, used for performing assays or calibrations
29

needs to be calibrated. The SMA must:
a) Calibrate any equipment that may have a substantial effect on the accuracy or validity of assay or calibration results [5.6.1].
b) Justify and document calibration periods of critical equipment based on the
frequency of equipment usage and statistical methods [5.6.1]. In any cases in which the assay and/or calibration method specifically indicates these periods, then they must be complied with.
c) Take appropriate measurements to ensure calibration status is kept
whenever it is necessary to transport reference patterns for use on site.
d) Find out and document the effect of environmental conditions or other important parameters on reference patterns.
e) Comply with the “measurement traceability and uncertainty policy” of the
ema currently in force. Assay and Calibration Result Quality Assurance [5.9] The aim is to underline the need to ensure that any assay and/or calibration results reported are reliable from a technical point of view. Criteria: The SMA must:
a) Adopt a set of quality control procedures for assay or calibration results, suitable for the type of work carried out and the number of analysts or technicians performing assays or calibrations, for each technical procedure or method included in the scope of accreditation.
b) Keep records of compliance on the calibration and maintenance programs
for all equipment and each element thereof. Said records must contain: the date, the site where the activity was carried out, the person who carried it out, and details on storage when the equipment is not in use [5.5.5].
c) Analyze the effect caused by the absence of instruments, when they are sent
for external calibration, on normal laboratory operations and take action in this regard [5.5.9].
d) Perform on site calibration of any equipment that may be sensitive to any
movements, in other words this must be done where they operate [5.5.2].
30

e) Ensure the inclusion of equipment handling procedures, the precautions to take for handling or transfer, in the case of equipment or patterns sensitive to any movements [5.5.6].
f) Examine the effect on assays or calibrations performed prior to the detection
of any equipment that does not meet the specifications, has incorrect settings or is incorrectly calibrated. There must be application records of the non-compliant assay or calibration work control procedures, including notice to any affected customers.
Measurement Traceability [5.6] The aim of this is to ensure that the reliability of measurements, given quantitatively by the margin of error associated with it, is known in terms of the reliability of national or international measurement patterns referred to as the origin of traceability for such measurements. Criteria: Not all equipment, or elements thereof, used for performing assays or calibrations needs to be calibrated. The SMA must:
a) Calibrate any equipment that may have a substantial effect on the accuracy or validity of assay or calibration results [5.6.1].
b) Justify and document calibration periods of critical equipment based on the
frequency of equipment usage and statistical methods [5.6.1]. In any cases in which the assay and/or calibration method specifically indicates these periods, then they must be complied with.
c) Take appropriate measurements to ensure calibration status is kept
whenever it is necessary to transport reference patterns for use on site.
d) Find out and document the effect of environmental conditions or other important parameters on reference patterns.
e) Comply with the “measurement traceability and uncertainty policy” of the
ema currently in force. Assay and Calibration Result Quality Assurance [5.9] The aim is to underline the need to ensure that any assay and/or calibration results reported are reliable from a technical point of view.
31

Criteria: The SMA must:
a) Adopt a set of quality control procedures for assay or calibration results, suitable for the type of work carried out and the number of analysts or technicians performing assays or calibrations, for each technical procedure or method included in the scope of accreditation.
b) Keep records of compliance on the calibration and maintenance programs
for all equipment and each element thereof. Said records must contain: the date, the site where the activity was carried out, the person who carried it out, and details on storage when the equipment is not in use [5.5.5].
c) Analyze the effect caused by the absence of instruments, when they are sent
for external calibration, on normal laboratory operations and take action in this regard [5.5.9].
d) Perform on site calibration of any equipment that may be sensitive to any
movements, in other words this must be done where they operate [5.5.2].
e) Ensure the inclusion of equipment handling procedures, the precautions to take for handling or transfer, in the case of equipment or patterns sensitive to any movements [5.5.6].
f) Examine the effect on assays or calibrations performed prior to the detection
of any equipment that does not meet the specifications, has incorrect settings or is incorrectly calibrated. There must be application records of the non-compliant assay or calibration work control procedures, including notice to any affected customers.
Measurement Traceability [5.6] The aim of this is to ensure that the reliability of measurements, given quantitatively by the margin of error associated with it, is known in terms of the reliability of national or international measurement patterns referred to as the origin of traceability for such measurements. Criteria: Not all equipment, or elements thereof, used for performing assays or calibrations needs to be calibrated.
32

The SMA must:
a) Calibrate any equipment that may have a substantial effect on the accuracy or validity of assay or calibration results [5.6.1].
b) Justify and document calibration periods of critical equipment based on the
frequency of equipment usage and statistical methods [5.6.1]. In any cases in which the assay and/or calibration method specifically indicates these periods, then they must be complied with.
c) Take appropriate measurements to ensure calibration status is kept
whenever it is necessary to transport reference patterns for use on site.
d) Find out and document the effect of environmental conditions or other important parameters on reference patterns.
e) Comply with the “measurement traceability and uncertainty policy” of the
ema currently in force. Assay and Calibration Result Quality Assurance [5.9] The aim is to underline the need to ensure that any assay and/or calibration results reported are reliable from a technical point of view. Criteria: The SMA must:
a) Adopt a set of quality control procedures for assay or calibration results, suitable for the type of work carried out and the number of analysts or technicians performing assays or calibrations, for each technical procedure or method included in the scope of accreditation
b) Comply with the “policy on suitability assays for laboratories that have been
accredited or to be accredited” of the ema currently in force. The absence of any suitable assay programs in certain technical areas on the part of the ema does not mean that the laboratory does not need to comply with this point [5.9 b)].
c) Conduct internal suitability assay schemes.
d) Use more than one means of quality control in order to supervise the validity
of assay or calibration results.
e) Carefully examine the controls required when developing or introducing new methods. These must be documented as part of the quality assurance plan
33

for such assays or calibrations.
f) Make sure that the quality control applied to assay or calibration methods is sufficient to ensure the quality of the results of said assay or calibration. Some commonly used quality control procedures are:
Periodic and programmed use of reference materials and other
materials with known characteristics during the performance of assay methods. If this practice is performed as a routine, it will allow the use of control charts and continuity for the precision and accuracy levels attained by the laboratory when performing the methods.
Regular repetitions of the assay or calibration on the same sample,
performed by the same analyst or technician (repeatability testing). This makes it possible to find out and provide continuity to the repeatability achieved by each analyst or technician in the laboratory.
Periodic repetitions of the assay or calibration on retained assay or
calibration elements, performed by two or more analysts or technicians. This makes it possible to gauge the degree of precision between analysts or technicians in a given assay or calibration method, as well as identify any substantial deviations in the results of a given analyst or technician.
Conducting assays on the same sample in a programmed manner,
using different assay or calibration methods or two different samples tested by the same equipment. For calibration, the same calibration element may be calibrated with different instruments or using different methods. This makes it possible to identify deviations in the results of assays or calibrations derived from the method or the equipment used by the laboratory.
Recording and monitoring of assay or calibration results obtained by
customers or suppliers of the laboratory on the same sample. With enough data, this allows the use of control charts to find out and provide continuity to the level of precision of results between the laboratories involved. The data obtained may be compared with published reproducibility data for the particular method, if such data is available, provided that the two laboratories use the same method.
34

Participation in suitability assay programs or other forms of conducting inter-laboratory comparison.
This allows the laboratory to compare its performance with that of the laboratories taking part and which use the same assay or calibration methods. This practice provides an alert mechanism for detecting failures in the methods or techniques used, in the laboratory analyses or the equipment used, which it would not be possible to detect using other methods. It also offers a means of ascertaining the reproducibility of specific assay or calibration methods.
35

5.3 EXAMPLES OF OPERATING AUDITS As examples, are presented some procedures about audit performance from Air California Air Resources Board. CARB (2003).
PERFORMANCE AUDIT PROCEDURES FOR
OZONE ANALYZERS USING A PORTABLE OZONE TRANSFER STANDARD.
A.1.0 PROCEDURE A.1.0.1 – Introduction Introduction - Auditors use compressed gas cylinders of ultrapure zero air and ambient levels of carbon monoxide (CO), total hydrocarbons (THC), sulfur dioxide (SO2), nitric oxide (NO), and nitrogen dioxide (NO2) to conduct performance audits. Gas concentrations of these audit standards are traceable to National Bureau of Standards, Standard Reference Materials. See Volume I of this Manual for standards traceability protocol. Ambient level concentration compressed gas cylinders can be used until the cylinder pressure reads 500 psig. Using a capillary controlled flow panel with a bypass flow meter, auditors feed the audit gas to the analyzer through the sample inlet line. This procedure insures that the audit gas is sampled in the same fashion as the ambient air. Certain CO analyzers may have to have their vacuum pumps turned off due to the large flow rates; however, the audit gas must still be fed through the normal sampling train. Normally, zero and up to four upscale concentrations covering the full analyzer operational range, are used (see the Federal Register 40 CFR Part 58 Appendix A or Volume I of this Manual). The analyzer response, corrected for zero shifts and calibration factors, is compared to the audit concentration at each audit point for computing data accuracy statistics. Environmental Protection Agency (EPA) regulations for Air Quality Surveillance and Data Reporting, require that the audit results be calculated to represent the accuracy of each individual analyzer. Quarterly, and again annually, individual analyzer accuracies are used to determine a reporting organization data accuracy estimates. Volume I of this manual contains detailed procedures for making the calculations and preparing those reports. Preaudit Inspection If necessary, conduct a preaudit inspection of the monitoring site. Special equipment needs should be noted on the preaudit inspection report.
36

Equipment The basic equipment required for performance audits is listed below. Other equipment may be required depending upon the particular requirements of a site or analyzer. 1. Audit flow control panel designed to deliver compressed audit gas concentrations to analyzers in the same fashion as ambient air samples. 2. Compressed gas standards of concentrations necessary to meet EPA's required audit. The minimum assay frequency of the compressed gas standards shall be:
a. Three cylinder assays (two preaudit and one post audit) are required to determine a gas standard's mean value. b. Ultrapure zero air cylinders require a preaudit assay against laboratory zero air.
3. Specific regulators, fittings, and Teflon* lines, dedicated to each pollutant. 4. The following test equipment with calibration frequencies meeting or exceeding those
presented in EPA guidelines are required:
a. Digital volt meter with A/C adapter and test leads. b. An NBS certified precision thermometer. c. A Vol-o-Flo laminar flow measuring device (0 to 3 liters), or equivalent. 5. Audit log book and forms. 6. A tool kit.
7. Spare parts (stainless steel fittings, Teflon lines, etc.). Equipment Setup 1. Prepare the flow control panel. Select and install the appropriate capillary to provide approximately 1.2 times the analyzer flow demand 2. Connect the CGA 590 pressure regulator to the ultrapure air cylinders. Connect the ultrapure air cylinder to the flow control panel. 3. Connect the digital volt meter in parallel with the analyzer's signal output. If possible, use the volt meter's AC adapter to conserve the internal battery. 4. If an analyzer draws its sample from a sampling manifold, disconnect the analyzer's sample inlet line from the sample manifold port. Connect the audit sample line to the analyzer's sample inlet port. Plug the open sample manifold port to prevent room air from entering the manifold. Several analyzers may be audited at one time. 5. If an analyzer draws its sample directly from the ambient air via a sample inlet line, disconnect at the analyzer inlet and connect the audit line directly to the analyzer's sample inlet port.
37

Audit Procedure 1. Connect the calibrated Vol-o-Flo to the sample inlet line of the analyzer to be audited. Determine and record the sample flow rate in the audit log book on the preliminary audit report form. 2. Disconnect the Vol-o-Flo and connect the inlet line from the flow control panel to the analyzer's inlet port. Using the zero air cylinder's second stage pressure regulator, adjust the pressure until a flow corresponding to approximately 100 sccm is shown on the bypass flow meter of the flow control panel. CAUTION: Even though bypass flow is indicated on the bypass flow meter there could be a leak in the flow panel downstream of the flow meter. Therefore, always make sure all fittings are tightened and leak free before conducting the audit. Obtain a stable analyzer output of no less than 10 minutes duration. The audited agency's staff shall determine when a stable output is obtained and shall provide the auditor with the value of the analyzer’s response to the audit gas. Record the value as reported by the air monitoring staff member and the digital volt meter reading in the audit log book and on the preliminary audit report form. 3. Disconnect the ultrapure zero air cylinder from the flow panel and the zero air inlet line from the analyzer. Correct the appropriate pollutant gas line coming from the panel to the analyzer’s sample inlet. Attach the designated pressure regulator to the highest level ppm audit standard cylinder. Connect the audit cylinder to the appropriate inlet of the flow control panel. The inlets and sample lines are marked to denote the pollutant to be used with each channel. Do not swap regulators, sample lines, capillaries or bypass flow meters between pollutants. Verify that the cylinder pressure is 500 psi. Adjust the pressure regulator until a flow of approximately 100 sccm is shown on the bypass flow meter. After the air monitoring staff member determines that the analyzer response is steady, record the reported value and the digital volt meter reading in the audit log book and on the preliminary audit report form. 4. Repeat Step 3 with other compressed gas cylinder concentrations as required by EPA 5. Remove the audit standard from the inlet line and reconnect the sample inlet to the manifold. Verify that each audit cylinder’s control valve is fully closed. 6. Remove the equipment from the site as you complete the equipment inventory sheet. Data Handling 1. Transmit the data from the log book to the Single Continuous Analyzer Audit/Accuracy Report and calculate the audit statistics. 2. After the results are calculated, have an independent check of your calculations. 3. Send copies of the Single Continuous Analyzer Audit/Accuracy report to the ARB quality assurance coordinator after the completion of the audit. Note on the report that the results are preliminary. After the final report is complete, file a copy of the accuracy report in the ARB-QA file.
38

Example:
PERFORMANCE AUDIT PROCEDURES FOROZONE ANALYZERS USING A PORTABLE OZONE TRANSFER
STANDARD 1. INTRODUCTION Ozone audits are used to validate ambient air data collected at air monitoring stations. The Quality Assurance Section (QAS) of the California Air Resources Board (CARB) currently employs two methods of conducting ozone performance audits. In the first method, an Environics 9100S gas calibrator is used as an ozone source and an API 400 ozone analyzer as a transfer standard for auditing the air monitoring station’s ozone analyze). The audit van is driven to the air monitoring station and the audit van’s 150 foot gas presentation line is connected to the air monitoring station’s inlet probe. The ozone transfer standard is then used to generate a known amount of ozone in the United States Environmental Protection Agency’s (U.S. EPA’s) required audit ranges. This ozone concentration is then introduced into the station’s inlet probe. The response of the air monitoring station’s ozone analyzer to this concentration is then compared to the actual ozone levels measured by the API 400 ozone analyzer, and a percent difference is calculated. In the second method, an API 401 portable ozone transfer standard is transported to the air monitoring site. This procedure addresses that method for ozone determination. In the event that the Environics 9100 gas calibrator cannot be used as an ozone source and the API 400 ozone analyzer as the transfer standard for the site’s ozone analyzer, it will be necessary to conduct the audit using a portable ozone transfer standard. The audit is performed by transporting the portable ozone transfer standard (transfer standard) to the site and connecting it to the ozone analyzer to be audited (host analyzer). The ozone output from the transfer standard is then compared to the results obtained during the audit from the host analyzer. From the analysis of these results, a percent difference is calculated and an audit report issued. The transfer standards are certified quarterly by the Air Resources Board (ARB) Standards Laboratory using a U.S. EPA verified Primary Photometer. This procedure addresses the actual set-up and operation of the portable ozone transfer standard. 2. AUDIT EOUIPMENT The performance audit, utilizing the API 401 portable ozone transfer standard, requires the following equipment:
39

1. Currently certified API 401 transfer standard. 2. One five foot section and one twenty foot section of PTFE Teflon tubing complete with 1/4 inch Teflon fittings. 3. Vol-o-flo, 0-10 liters per minute (1pm) 4. Portable ozone transfer standard worksheet. 5. Computer, printer, and related audit software. 6. A multiplug surge protector. Para la ejecución de la auditoría usando el estándar de transferencia de ozono API 401 se requieren los siguientes equipos y materiales: 3. API 401 OZONE TRANSFER STANDARD AUDIT PROCEDURE 1. Connect the API 401 ozone transfer standard to a 110 VAC outlet and allow a minimum of one hour warm-up time before beginning the audit. The transfer standard may be warming up while en route to the audit location. 2. While the transfer standard is warming up, complete the portable ozone transfer standard worksheet (worksheet), Fig. A 3. After one hour warm-up time, connect the transfer standard to the host analyzer in the following manner:
i. Disconnect the sample inlet line from the sample inlet port of the hostanalyzer.
ii. Connect one end of the five foot Teflon line to the first open port of the “IZS Vent” on the transfer standard. Connect the other end of the five foot line to the sample inlet port of the host analyzer
iii. Connect one end of the twenty foot Teflon line to the center port of the transfer standard “IZS Vent”. Allow the other end of the twenty foot line to remain unconnected to vent excess flow
iv. Do not uncap the third port on the transfer standard. 4. Once the set-up is complete, begin the audit by pressing the button located under “ZERO” on the transfer standard. The pump will turn on, and there will be an output flow of five liters per minute (5 1pm). Continue in the following manner: NOTE: The excess flow can be measured by connecting the open end of the twenty foot Teflon line to the 10 LPM Vol-o-flo. The API 401 generates five liters per minute flow at all times, so the excess flow should be equal to the total flow minus the flow required by the host analyzer.
a. Allow the zero to stabilize for at least 15 minutes. b. After 20 minutes have elapsed, record the zero response for the
transfer standard and the host analyzer on the worksheet under Audit Point 1.
40

c. Press the button located under “O3GN” (or "CONC" on the 401X model) on the front panel display on the transfer standard. Press the second button from the left until a 4 is displayed. Next, press the third button from the left until a 0 is displayed. Then, press the fourth button until a 0 is displayed. The display should now read 0400. Press “ENTER”.
d. Allow this point to stabilize. This may take from 15 minutes to one half hour. When the transfer standard and the host analyzer are stable, record their responses on the worksheet under Audit Point 2.
NOTE: While the transfer standard is warming up, complete the Station Instrument Information on the Portable Ozone Transfer Standard Worksheet (worksheet)
e. Press the button under “O3GN” (or "CONC"), and the display should read 0400. Press the corresponding buttons, as in “c” above, until 0175 is displayed. Press “ENTER”.
f. Again, allow the transfer standard and the host analyzer to stabilize (from 15 to 30 minutes). After they have both stabilized, record the responses on the worksheet under Audit Point 3. g. Press the button located under “O3GN” (or "CONC") 0175 is still displayed. Press the corresponding buttons, as in “c” above, until 0070 is displayed. Press “ENTER”. h. After the transfer standard and host analyzer have stabilized (15 to 30 minutes), record their responses on the worksheet under Audit Point 4. i. Press the button located under “ZERO” on the transfer standard. After the transfer standard and the host analyzer have stabilized (15 to 30 minutes), record their responses on the worksheet under Audit Point 5. j. Return the host analyzer to the “On Line” condition by disconnecting the five foot line from the host analyzer’s sample port, and reconnecting the sample line.
k. Turn off the transfer standard, disconnect the five foot line and the three foot line, and secure the transfer standard in the van.
5. The audit is now complete, and the information can be entered into the computer Print a preliminary report in two copies.
41

4. CERTIFICATION The ozone transfer standards are submitted to the Standards Laboratory on a quarterlybasis for recertification. The transfer standards are certified against a U.S. EPA verified Primary Ozone Photometer. This certification includes a verification that the new certification does not differ by more than ±1.5% from past certification values and that the slope and intercept fall within one standard deviation of the last six certification equations.
Figure .A
42

Example:
PERFORMANCE AUDIT PROCEDURES FOR PM10 SAMPLERS
. AUDITING PROCEDURES
The primary goal of an auditing program is to identify system errors that may result
. Without special preparation or adjustment of the system to be audited.
. By an individual with a thorough knowledge of the instrument or process being
. With accurate certified National Institute of Standards Technology (NIST)
. With complete documentation of audit data for submission to the operating
n independent observer should be present, preferably the routine operator of the
. FLOW RATE PERFORMANCE AUDITS OF THE MASS FLOW
udit procedures provided here are specific to Hi-Vol PM10 samplers that are
1
in suspect or invalid data. The absolute efficiency of the monitoring system (labor input versus valid data output) is contingent upon effective quality assurance procedures. This true assessment of the accuracy and efficiency of the High Volume (Hi-Vol) particulate measurement system can only be achieved by conducting an audit under the following guidelines: A Bevaluated, but not by the routine operator. Ctraceable transfer standards that are completely independent of those used in routine calibration. Dagency. Audit information includes, but is not limited to, types of instruments and audit transfer standards, model and serial numbers, transfer standard traceability, calibration information, and collected audit data. Asampling equipment. This practice not only contributes to the integrity of the audit, but also allows the operator to offer any explanations and information that will help the auditor to determine the cause of discrepancies between measured audit data and the sampling equipment response. 2
CONTROLLED AND VOLUMETRIC FLOW CONTROLLED HIGH VOLUME PM10 SAMPLERS
Aequipped with fractionating inlets that require an actual flow rate of 1.13 m3/min (40.0 CFM). Audit techniques may vary among different models of samplers because of differences in required flow rates, flow controlling devices, options utilized (i.e., continuous flow recorder), and the configuration of the sampler. In this subsection, the following conditions are assumed:
43
A. The mass flow controlled sampler utilizes a flow sensor to adjust the flow rate by
. The sampler inlet is designed to operate at a volumetric flow rate of 1.13 m3/min
. The certified audit transfer standard will be a BGI variable orifice equipped with a
. The calibration relationship for the audit variable orifice is expressed in terms of
. PERFORMANCE AUDIT PROCEDURES - MASS FLOW
he auditor should adhere to the following procedures during an audit of the
. Collect the following equipment and transport to the monitoring station:
. A certified (NIST traceable) variable orifice device with the most recent
. A differential pressure gauge with a range of 0-20” H2O and a minimal scale
. A temperature measuring device (i.e., thermometer, thermometer, thermistor,
. A barometer capable of accurately measuring ambient pressure to the nearest
ST traceable
controlling the motor’s output and is usually equipped with a flow recorder. The volumetric flow controlled sampler utilizes a critical flow orifice for flow control and is not equipped with a flow recorder, although this option is available. B(40.0 CFM) at actual conditions; the acceptable (manufacturer specified) flow rate fluctuation range is ±10% of this value. In some cases the actual flow rate must be corrected in relationship to the elevation of the site.. If the sampler is volumetric flow controlled and operated by the Air Resources Board. . Cdifferential pressure gauge. This equipment is NIST traceable and certified once a quarter with the Standard deviation within 1.5% of the last two certifications. Dtrue volumetric flow rate (Qc) as indicated by the audit orifice; these units being ft3/min [Cubic Feet per Minute (CFM)]. 3
CONTROLLED (MFC) SAMPLER
TMFC sampler: A 1certification report. 2division of at least 0.2” H2O. 3thermocouple) capable of accurately measuring temperature over the range of -20°C to +60°C and accurate to the nearest 1°C. It must be referenced to an NIST or ASTM thermometer and be checked annually. The thermometer should be within ±2°C on the annual check. 4millimeter mercury (mm Hg) over the range of 500 to 800 mm Hg. The barometer must be referenced within ±5 mm Hg of an NIbarometer, at least annually. 5. QA Audit Worksheet
44

6. Spare recorder charts, clean filters, and miscellaneous hand tools.
OTE: The site operator is responsible for providing the sampler’s calibration
. On the back side of a clean recorder chart, record the parameters listed
. Sampler ID number.
r’s initials.
OTE: Use a chart equivalent to the type of chart used by the site operator to
. Install a clean filter in the HV PM10. DO NOT use a filter cassette; place the
. Install the audit variable orifice on the sampler. Do not restrict the flow rate
sealing gasket. on
. Inspect the audit orifice device for correct zero and adjust if necessary.
. Switch on the sampler and allow it to reach operating temperature (5
e sampler inlet may be partially lowered, within 2 inches, over the
. Observe and record the following parameters on the QA Audit Worksheet
. Site name, audit date and site number n
t calibration date
Nrelationship (calibration curve or factor) for the subsequent determination of the MFC sampler’s actual flow rate (Qa). B
below and install the chart in the recorder.
12. Site name. 3. Date. 4. Audito Neliminate error due to different brand variation in the chart printing. If the MFC sampler was calibrated by using square root function paper, the audit must be conducted with a similar recorder chart. Observe the recorder zero setting. Ask the operator if they normally adjust the zero as part of their weekly routine. If they do, instruct them to adjust the pen to Indicate true zero. Cfilter directly on the sampler filter screen. Dthrough the orifice (i.e., by using plates or closing the valve). Use an unrestricted orifice. Simultaneously tighten the faceplate nuts on alternate corners to prevent leaks and to assure even tightening. The fittings should be hand-tightened, as too much compression can damage the Make sure the orifice gasket is present and the orifice is not cross-threaded the faceplate. E Fminutes). NOTE: Thaudit orifice to act as a draft shield. G(Figure I.1.0.4): 12. Altitude, auditors, agency and technicia3. Sampler make, model, ID number and las4. Orifice ARB #, audit quarter and year
45

5. Ambient temperature (Ta) in degrees Centigrade (°C)
. When the sampler has reached operating temperature, read the pressure
Ask the operator to read the corresponding recorder response and record it on
OTE: Make sure the operator relieves the recorder pen drag by tapping the
. Switch off the sampler until zero is attained and repeat Steps H and I, of
. Confirm that the flow controller and motor are operating properly. Run the
. Switch off the sampler and remove the audit orifice.
. Verify that the correct audit device and sampler recorder responses have
. Ask the operator to calculate the sampler’s standard flow rate (Qstd) as
. If the standard flow rate is Qstd, convert Qstd to Qa (actual flow) by using
c.1)
a = sampler’s actual flow rate ate
6. Ambient barometric pressure (Pa) in mm Hg 7. Unusual weather conditions Hdeflection across the differential pressure gauge on the audit device and record as ∆P on the audit worksheet. I.the audit worksheet as the sampler’s indicated flow rate (Qind). Nside of the recorder before reading the chart. This ensures a true reading. JI.1.0.3, two more times for a total of three observations. Record the audit device and sampler responses for each step on the audit worksheet. Ksampler with one filter in place and mark the recording device (chart recorder). Without turning off the sampler, partially close the valve on the audit orifice and check that the flow drops and returns to the original operating point within several minutes. Then without turning off the motor, reopen the valve on the audit orifice and check again for over-shoot and verify that the flow again returns to the original operating point. If the flow controller and motor are not responding to this type of systems check, then a double filter test is performed. This is accomplished by the addition and removal of a second filter on top of the original filter. Check again for the correct flow responses and document the Information on the QA Audit Worksheet. L Mbeen written on the audit worksheet. Ndetermined by the calibration relationship and record on the audit worksheet. OEquation 1: (E 15.298//760 PaxTaxQQ stda = Where: QQstd = sampler’s standard flow r
46

Ta = ambient temperature, °K (°K = °C + 273.15)
OTE: Subsections O through R are generated as a result of the data input into
. Determine the true flow rate through the audit transfer standard orifice using
* Qc [ H2O) (Ta/Pa)] (Ec.2)
here:
c = true volumetric flow rate as indicated by the audit orifice,
sure change across the orifice, in Inches of water (H2O)
ip qual to EPA’s use of slope and
. Determine the percent difference between the sampler actual flow rate and
Diferencia % = [Oa – Oc]/ Qc x 100 (Eq. 3)
OTE: Deviations exceeding ±7% will require recalibration. Deviations
. Determine the percent difference between the Inlet design flow rate of 40.0
iferencia % = [Oc – 40.0]/ 40.0 x 100 (Eq. 4)
OTE: Deviations exceeding ±7% will require an investigation. Deviations
Pa = ambient barometric pressure, mm Hg Nthe Compaq computer. These calculations are provided to show the method used to generate percent difference. PEquation 2. .
∆P(= m W Qft3/min. (CFM) ∆P(H2O) = presTa = ambient temperature, °K (°K = °C + 273.15) Pa = ambient barometric pressure, mm Hg m = slope of the orifice calibration relationsh*NOTE: The orifice calibration relationship is eintercept in the Quality Assurance Handbook, Volume II, Section 2.11.7.1.15. Qthe corresponding audit measured true flow rate using Equation 3: Nexceeding ±10% require an Air Quality Data Action (AQDA) request to be issued. Upon investigation the invalidation or correction of all data from the last calibration forward or known date of change (to be determined by the reporting agency) may result. RCFM and the audit measured true flow rate using Equation 4: D Nexceeding ±10% (or the acceptable design flow rate range specified by the inlet manufacturer) require an Air Quality Data Action (AQDA) request to be issued. Upon investigation the invalidation or correction of all data from the last calibration forward or known date of change (to be determined by the reporting
47

agency) may result. S. Generate the preliminary audit report by entering the responses recorded on
. PERFORMANCE AUDIT PROCEDURES - VOLUMETRIC FLOW
he auditor should adhere to the following procedures during an audit of the
. Collect the following equipment and transport to the monitoring station:
. A certified (NIST traceable) variable orifice device with the most recent
. A differential pressure gauge with a range of 0-20” H2O and a minimal
. A temperature measuring device (i.e., thermometer, thermistor,
. A barometer capable of accurately measuring ambient pressure to the
. QA Audit Worksheet
. Spare recorder charts, clean filters and miscellaneous hand tools.
OTE: The site operator is responsible for providing the sampler’s calibration
. Sampler ID number.
the audit worksheet into the computer. The final report will be generated uponthe final certification of the BGI variable orifice at the end of the quarter. These results will then be mailed to the district. 4
CONTROLLED (VFC) SAMPLER
TVFC sampler: A 1certification report. 2scale division of at least 0.2” H2O. 3thermocouple) capable of accurately measuring temperature over the range of -20°C to +60°C and accurate to the nearest 1°C. It must be referenced to an NIST or ASTM thermometer and be checked annually.nThe thermometer should be within ±2°C on the annual check. 4nearest millimeter mercury (mm Hg) over the range of 500 to 800 mm Hg. The barometer must be referenced within ±5 mm Hg of an NIST traceable barometer, at least annually. 5 6 NInformation and any needed equipment required (i.e., 0 to 8 in. mercury manometer) to determine the sampler’s actual flow rate (Qa). B. If the sampler utilizes a chart recording device, record the parameters listed below on the back of a clean chart and install in the recorder. 12. Site name. 3. Date.
48

4. Auditor’s initials.
OTE: Use a chart equivalent to the type of chart used by the site operator to
. Install a clean filter (within a cassette) in the VFC sampler.
. Install the audit variable orifice on the sampler. Do not restrict the flow rate
. Inspect the audit orifice device for correct zero and adjust if necessary.
. Switch on the sampler and allow it reach operating temperature (5 minutes).
OTE: The sampler inlet may be partially lowered, within 2 inches, over the
. Observe and record the following parameters on the QA Audit Worksheet
. Site name, audit date, and site number t calibration date
Centigrade (°C)
. When the sampler has reached operating temperature, read the pressure rd
Ask the operator to read the corresponding recorder response and record it n
NOTE: Make sure the operator relieves the recorder pen drag by tapping the
Neliminate error due to different brand variation in the chart printing. If the VFC sampler was calibrated by using square root function paper, the audit must be conducted with a similar recorder chart. Observe the recorder zero setting. Ask the operator if they normally adjust the zero as part of their weekly routine. If they do, instruct them to adjust the pen to indicate true zero. C Dthrough the orifice (i.e., by using plates or closing the valve). Use an unrestricted orifice. Simultaneously tighten the faceplate nuts on alternate corners to prevent leaks and to assure even tightening. The fittings should be hand-tightened, as too much compression can damage the scaling gasket. Make sure the orifice gasket is present and the orifice is not cross-threaded on the faceplate. E F Naudit orifice to act as a draft shield. G 12. Altitude, auditors, agency and technician3. Sampler make, Model, ID number and las4. Orifice ARB #, audit quarter and year 5. Ambient temperature (Ta), In degrees 6. Ambient barometric pressure (Pa), mm Hg 7. Unusual weather conditions Hdeflection across the differential pressure gauge on the audit device and recoas ∆P on the audit worksheet. I.the audit worksheet as the sampler’s indicated flow rate (Qind). side of the recorder before reading the chart. This ensures a true reading. If the sampler is not utilizing a chart recorder ask the operator to determine the
49

sampler’s indicated flow rate using the same method used to determine the sampler’s flow rate during normal operation. J. Switch off sampler until zero is attained and repeat Steps H and I, of I.1.0.4, two more times for a total of three observations. Record the audit device and sampler responses for each step on the audit worksheet. K. Verify that the correct audit device and sampler recorder responses have been written on the audit worksheet. L. Ask the operator to calculate the sampler’s standard flow rate (Qstd) as determined by the calibration relationship and record on the audit worksheet. M. If the standard flow rate Is Qstd, covert Qstd to Qa (refer to Section I.1.0.3, Item O). N. Determine the true flow rate (Qc) through the audit transfer standard orifice. O. Determine the percent difference between the sampler actual flow rate and the corresponding audit measured true flow rate NOTE: Deviations exceeding ±7% will require recalibration. Deviations exceeding ±10% require an Air Quality Data Action (AQDA) request to be issued. Upon investigation the invalidation or correction of all data from the last calibration forward or known date of change (to be determined by the reporting agency) may result. P. Determine the percent difference between inlet design flow rate of 40.0 CFM and the audit measured true flow rate. NOTE: Deviations exceeding ±7% will require an investigation. Deviations exceeding ±10% (or the acceptable design flow rate range specified by the inlet manufacturer) require an Air Quality Data Action (AQDA) request to be issued. Upon investigation the invalidation or correction of all data from the last calibration forward or known date of change (to be determined by the reporting agency) may result. Q. Generate the preliminary audit report by entering the responses recorded on the audit worksheet into the Compaq computer (Figure I.1.0.5). The final report will be generated upon the final calibration of the BGI variable orifice at the end of the quarter. These results will then be mailed to the district.
50
5. AUDIT PROCEDURES - VOLUMETRIC FLOW CONTROLLED (VFC) SAMPLER MODIFIED WITH A LAMINAR FLOW ELEMENT (MAGNEHELIC)
The auditor should adhere to the following procedures during an audit of the VFC sampler: A. Collect the following equipment and transport to the monitoring station: 1. A certified (NIST traceable) variable orifice device with the most recent certification report. 2. A differential pressure gauge with a range of 0-20” H2O and a minimal scale division of at least 0.2” H2O. 3. A temperature measuring device (i.e., thermometer, thermistor,thermocouple) capable of accurately measuring temperature over the range of -20°C to +60°C and accurate to the nearest 1°C. It must be referenced to an NIST or ASTM thermometer and be checked annually. The thermometer should be within ±2°C on the annual check. 4. A barometer capable of accurately measuring ambient pressure to the nearest millimeter mercury (mm Hg) over the range of 500 to 800 mm Hg. The barometer must be referenced within ±5 mm Hg of an NIST traceable barometer, at least annually. 5. QA Audit Worksheet 6. Spare recorder charts, clean filters and miscellaneous hand tools. NOTE: The site operator is responsible for providing the sampler’s calibration Information and any needed equipment required (i.e., 0 to 8 in. mercury anometer) to determine the sampler’s actual flow rate (Qa). B. If the sampler utilizes a chart recording device, record the parameters listed below on the back of a clean chart and install in the recorder. 1. Sampler ID number. 2. Site name. 3. Date. 4. Auditor’s initials. NOTE: Use a chart equivalent to the type of chart used by the site operator to eliminate error due to different brand variation in the chart printing. If the VFC sampler was calibrated by using square root function paper, the audit must be conducted with a similar recorder chart. Observe the recorder zero setting. Ask the operator if they normally adjust the zero as part of their weekly routine. If they do, instruct them to adjust the pen to indicate true zero.
51

C. Install a clean filter (within a cassette) Into the VFC sampler. D. Switch on the sampler and allow it to reach operating temperature (5 minutes). NOTE: The sampler inlet may be partially lowered, within 2 inches over the audit orifice, to act as a draft shield. E. Observe and record the following parameters on the QA Audit Worksheet 1. Site name, audit date, and site number 2. Altitude, auditors, agency and technician 3. Sampler make, Model, ID number and last calibration date 4. Orifice ARB #, audit quarter and year 5. Ambient temperature (Ta), in degrees Centigrade (°C) 6. Ambient barometric pressure (Pa), mm Hg 7. Unusual weather conditions F. When the sampler has reached operating temperature, record the pressure deflection across the differential pressure gauge in the comments section of the QA Audit Worksheet. G. Switch off the sampler and remove the filter cassette. Install the audit variable orifice on the sampler. Simultaneously tighten the faceplate nuts on alternate corners to prevent leaks and to assure even tightening. The fittings should be hand-tightened, as too much compression can damage the scaling gasket. Make sure the orifice gasket is present and the orifice is not cross-threaded on the faceplate. NOTE: Do Not use a filter when installing the audit equipment. H. Inspect the audit orifice device for correct zero and adjust if necessary. I. Switch on the sampler. Adjust the audit variable orifice until the pressure deflection on the sampler’s magnehelic matches the pressure deflection recorded earlier in the comments section of the audit worksheet. J. Allow the sampler to reach operating temperature (5 minutes). Check the sampler’s magnehelic to ensure the pressure deflection has not shifted. Readjust the flow by using the audit variable orifice if necessary. K. When the sampler has reached operating temperature, read the pressure deflection across the differential pressure gauge on the audit device and record as ∆P on the audit worksheet. L. Ask the operator to read the corresponding recorder response and record it on the audit worksheet as the sampler’s indicated flow rate (Qind). M. Switch off sampler until zero is attained and repeat Steps K and L, of I.1.0.4.1, two more times for a total of three observations. Record the audit device and sampler responses for each step on the audit worksheet.
52

N. Remove the audit device. Verify that the correct audit device and sampler recorder responses have been written on the audit worksheet. O. Ask the operator to calculate the sampler’s standard flow rate (Qstd) as determined by the calibration relationship and record on the audit worksheet. P. If the standard flow rate is Qstd, covert Qstd to Qa (refer to Section I.1.0.3, Item Q. Determine the true flow rate (Qc) through the audit transfer standard orifice: R. Determine the percent difference between the sampler actual flow rate and the corresponding audit measured true flow rate NOTE: Deviations exceeding ±7% will require recalibration. Deviations exceeding ±10% require an Air Quality Data Action (AQDA) request to be issued. Upon investigation the invalidation or correction of all data from the last calibration forward or known date of change (to be determined by the reporting agency) may result. S. Determine the percent difference between inlet design flow rate of 40.0 CFM and the audit measured true flow rate (refer to Section I.1.0.3, Item R). NOTE: Deviations exceeding ±7% will require an investigation. Deviations exceeding ±10% (or the acceptable design flow rate range specified by the inlet manufacturer) require an Air Quality Data Action (AQDA) request to be issued. Upon investigation the invalidation or correction of all data from the last calibration forward or known date of change (to be determined by the reporting agency) may result. T. Generate the preliminary audit report by entering the responses recorded on the audit worksheet into the Compaq computer. The finalreport will be generated upon the final calibration of the BGI variable orifice at the end of the quarter. These results will then be mailed to the district.
6. AUDIT DATA REPORTING The operating agency should be given a copy of the preliminary audit results when the audit is completed. The preliminary data should never be used to make monitoring system adjustments. A post-audit verification of audit equipment and data is essential before inferences can be drawn regarding the sampler’s performance. An auditor should be able to support audit data with quarterly pre- or post-audit equipment verification documentation. Final verified audit data should be submitted to the operating agency as soon as possible. Delays may result in data loss. A sampler out of audit limits is also out of calibration limits, and the data collected may be invalid. If a sampler exhibits
53

unsatisfactory agreement with the verified audit results (audit differences exceed ARB’s control limits) a calibration should be performed immediately (prior to the next run day). NOTE: Sections of the above procedure were taken from the reference “Method for Determination of Particulate Matter as PM10 in the Atmosphere”, Section 2.11.7, published by the Environmental Protection Agency.
54

6. BIBLIOGRAFY
1. CARB (2003). Audit Procedures for Air Quality Monitoring. State of California Air Resources Board, Monitoring and Laboratory Division. Vol V., February.
2. IMNC (2000). Requisitos Generales para la Competencia de Laboratorios de
Ensayo y Calibración. NMX-EC-17025-IMNC-2000, México.
3. Ley Federal de Metrología y Normalización. Diario Oficial del 01.07.1992 4. SEMARNAT (2001). Ley General del Equilibrio Ecológico y la Protección al
Ambiente. Diario Oficial del 31.12.2001.
5. SEMARNAT (2003). Reglamento Interno de la SEMARNAT. Diario Oficial del
21.1.2003.
55