Cover 20 1 2015 CDR15.cdr - Scientific Journals of ICARD
69
-
Upload
khangminh22 -
Category
Documents
-
view
0 -
download
0
Transcript of Cover 20 1 2015 CDR15.cdr - Scientific Journals of ICARD
JITV Vol. 14. No. 2, Th. 2009
Indonesian Journal of Animal and Veterinary Sciences
Volume 22, Number 4, December 2017 ISSN 0853-7380 E-ISSN 2252-696X
LIST OF CONTENT
Page
Genetic polymorphisms of IGF1, GH, and OPN genes in crosses Peranakan
Ongole cattle based on birth type in Central Java
Anggraeni A, Talib C, Asmarasari SA, Herawati T, Andreas E ................................... 165-172
Effect of Bali cattle ovarian status on oocytes nuclear maturation and in vitro
fertilization rate
Sonjaya H, Yusuf M, Hamdana A, Utamy RF, Gustina S, Hasbi H ............................. 173-178
Supplementation of molasses and branched-chain amino acid to increase in vitro
digestibility of ammoniated corn cob in ruminants feed
Puastuti W, Yulistiani D, Handiwirawan E .................................................................. 179-187
Growth and feed utilization of Boer x Kacang crossbred goats offered total mixed
rations of different protein and energy levels
Ginting SP, Simanihuruk K, Antonius, Tarigan A ........................................................ 188-195
Anticoccidial activity of Artemisinin and extract of Artemesia annua leaves in
chicken infected by Eimeria tenella
Wiedosari E, Wardhana AH .......................................................................................... 196-204
Contamination of Escherichia coli O157:H7 in dairy cow farms Rachmawati F, Ariyanri T ................................................................................ ............ 205-211
Author Index 212
Key Words Index 213
Abstract of IJAVS Vol. 22 214-223
Acknowledgement

Anggareni et al. Genetic polymerphisms of IGF1, GH, and OPN genes in crosses Peranakan Ongole cattle based on birth type in Central Java
165
Genetic Polymorphisms of IGF1, GH, and OPN Genes in Crosses Peranakan
Ongole Cattle Based on Birth Type in Central Java
Anggraeni A1, Talib C1, Asmarasari SA1, Herawati T1, Andreas E2
1Indonesian Research Institute for Animal Production, PO Box 221 Ciawi, Bogor, Indonesia 2Faculty of Animal Science, Bogor Agriculture University, Bogor, Indonesia
E-mail: [email protected]
(received 13-11-2017 ; revised 27-11- 2017; accepted 11-12-2017)
ABSTRAK
Anggraeni A, Talib C, Asmarasari SA, Herawati T, Andreas E. 2017. Polimerfisme genetik dari gen IGF1, GH dan
OPN pada persilangan sapi PO berdasarkan tipe kelahiran di Jawa Tengah. JITV 22(4): 165-172. DOI:
http://dx.doi.org/10.14334/jitv.v22i4.1625
Polimorfisme genetik dari gen IGF1, GH, dan OPN pada sapi hasil persilangan Sapi Peranakan Ongole (PO)
silangan Berdasarkan Tipe Kelahiran di Jawa Tengah. Perbaikan produktivitas dengan cara menyilangkan sapi PO
terhadap sapi potong eksotik melalui kawin IB disukai banyak peternak di Jawa Tengah. Fertilitas menentukan
kemampuan seekor induk sapi dalam menghasilkan anak. Gen IGF1 diduga mempengaruhi kelahiran kembar dan
ganda pada sapi, sedangkan gen GH dan OPN menentukan kesuburan reproduksi. Polimorfisme genetik ketiga gen
ini dipelajari pada sapi PO silangan untuk kelahiran tunggal (T) dan kelahiran (histori) kembar dan ganda (G)
berasal dari dua kabupaten di Jawa Tengah, yaitu dari Sragen (T = 7 ekor, dan G = 13 ekor) dan dari Kendal (T = 9
ekor, dan G = 16 ekor). Polimorfisme genetik diidentifikasi dengan metoda PCR-RFLP (polymerase chain reaction
- restriction fragment length polymorphism) menggunakan enzim restriksi SnaBI (gen IGF1), MSpI (gen GH), dan
BsrI (gen OPN). Lokus IGF1|SnaBI dari sapi PO silangan yang diamati tidak memberikan varian SNP atau bersifat
monomorfik untuk tipe kelahiran tunggal maupun kembar dan ganda. Sebaliknya lokus GH|MSpI dan OPN|BsrI
bersifat polimorfik dengan tingkat keragaman cukup tinggi. Disimpulkan lokus IGF1| SnaBI tidak bisa dipakai
untuk melihat kemungkinan adanya kontrol genetik kelahiran kembar (ganda), tetapi lokus GH|MSpI dan OPN|BsrI
bisa dipertimbangkan sebagai informasi awal untuk seleksi molekular pada sifat kesuburan dari sapi potong.
Kata Kunci: Sapi Potong, Polimorfisme Genetik, Gen Kesuburan
ABSTRACT
Anggraeni A, Talib C, Asmarasari SA, Herawati T, Andreas E. 2017. Genetic polymorphisms of IGF1, GH, and
OPN genes in crosses Peranakan Ongole cattle based on birth type in Central Java. JITV 22(4): 165-172. DOI:
http://dx.doi.org/10.14334/jitv.v22i4.1625
Genetic Polymorphisms of IGF1, GH, and OPN Genes in Crossbred of Peranakan Ongole Cattle Based on Birth
Type in Central Java. Improved productivity by crossing Peranakan Ongole (PO) cattle to exotic beef cattle through
AI mating is preferred by many farmers in Central Java. Fertility determines the ability of a cow to give birth. IGF1
gene is predicted to affect either twin or multiple births in cattle, whereas GH and OPN genes determine
reproductive fertility. Genetic polymorphisms of these three genes were studied in the crossbred of PO cattle for
single birth (S) as well as twin and multiple (M) births or their historical (M) ones from two districts in Central
Java, from Sragen (S = 7 hd and M = 13 hd.) and from Kendal (S = 9 hd, and M = 16 hd.). Genetic polymorphisms
were identified by PCR-RFLP (polymerase chain reaction - restriction fragment length polymorphism) method
using restriction enzymes of SnaBI (IGF1 gene), MSpI (GH gene), and BsrI (OPN gene). IGF1|SnaBI locus in the
observed crossbred PO did not have SNP polymorphism or monomorphic for single and twins or multiple births. In
contrast, GH|MSpI and OPN|BsrI loci were polymorphic with quite a high degree of diversity. In conclusion, the
IGF1|SnaBI locus cannot be used to investigate possible genetic control of twins and multiple births, whilst
GH|MSpI and OPN|BsrI polymorphisms can be considered as initial information for selection on fertility traits in
beef cattle.
Key Words: Beef Cattle, Genetic Polymorphism, Fertility Genes
JITV Vol. 22 No 4 Th. 2017: 165-172
166
INTRODUCTION
Beef cattle have a strategic role in producing red
meat for the national population. Java Island is one of
the centers of national beef cattle agribusiness, with the
highest beef cattle population in the year 2016, as an
example, are from East Java 4.407.807 hd., Central Java
674.573 hd., West Java 413.372 hd., and Yogyakarta
Special Regency 309.018 hd respectively (DGLAH
2017). Central Java thus becomes one of the national
beef cattle production. Animals are mostly raised by
small farmers under a cow-calf operation (CCO)
system. Crossbreeding through artificial insemination
technique is preferred especially by farmers in many
areas in Central Java. This is due to adequate facilities
and human resources (inseminator) in supporting the
easy implementation for artificial insemination (AI)
mating. The crossing is preferred because farmers like
calves to grow rapidly to give heavier weights,
compared to those calves of local beef cattle. Crosses
by AI mating are usually performed between local
Peranakan Ongole (PO) cattle by the frozen semen of
exotic beef cattle bulls mainly from Bos taurus, such as
Simmental, Limousine, and Brahman.
The ability of reproduction of a cow to produce a
calf within a short calving interval (around 12 months)
is crucial for the success of beef cattle agribusiness.
Another aspect that is also interesting to note, is to see
the chances of twinning or multiple births in beef cattle.
Large ruminant is very well known as uniparous
species. It is very common for beef cattle to have a
single calf in one birth (Komisarek & Dorynek 2002;
Çobanoğlu 2010). However, at a low level, incidences
of cows calving twins or multiple calves per birth occur.
The natural frequency of twin and multiple parturitions
in cattle ranges from 0.5-4% depending on many
genetic and environmental factors (Sawa et al. 2012).
Many studies have reported the cows of having
twinning and multiple births without extra management
and health services could cause detrimental for both
cow and calves. Some negative effects from twin and
multiple pregnancies were for decreasing fertility of
cows by causing longer calving interval by 18 d.,
reproductive rest period by 9 d., and service period by
10 d., as well as increasing services per conception by
0.15 (Sawa et al. 2012). Twins and multiple births cause
to lessen overall cow reproductive efficiency and
productivity. However, twinning and multiple calves
can give profitability under an intensive beef cattle
breeding condition. Twinning or multiple births were
possible to improve biological efficiency and
production as a result of lower input costs during
pregnancy and lactation cows (Karlsen et al. 2000).
Using molecular technology makes it possible to
identify possible genes for having the control on twins
and multiple births in beef cattle. Twins and multiple
births in cows are known as a trait that follows a
quantitative pattern, controlled by many genes. In
addition, reproductive traits have many limitations for
genetic improvement due to low heritability, sex-related
expression, and difficult phenotypic measurements
(Singh et al. 2014). The molecular selection at DNA
level may help to get an earlier decision-making of
animals to be considered as breeding stocks. Many
studies have investigated genetic polymorphisms of
major genes in relation to their effect on fertility. A
number of growth and reproductive genes are predicted
to affect twins and multiple births in cattle. Those genes
are thought in affecting the number of ova produced
and the number of transferable embryos, leading as
potential gene markers for superovulation response
(Yang et al. 2010; Deb et al. 2012; Singh et al. 2014).
Twinning rate in cattle is basically a sequential
product of ovulation rate, conception rate, and embryo
survival. Twinning and ovulation rates in cattle are
strongly genetically correlated (0.75–0.9) (Gregory et
al. 1997). This indicates the two traits are influenced by
common loci (Lien et al. 2000). Certain variant SNPs or
genotypes of IGF1 gene are presumed for having
genetic control on twins and multiple births in beef
cattle. A study by Echternkamp et al. (1990) proved that
twinning and multiple pregnancies in cattle is
associated by the increasing IGF-1 concentrations in
both blood serum and follicular fluid. The IGF-1
stimulates mitogenesis of granulosa cells and
steroidogenesis of ovarian cell cultures. This gene plays
an important role in the regulation of folliculogenesis
and may be involved in the process of multiple
ovulations in cattle. IGF1 gene stimulates ovarian
function by acting with gonadotropins to promote
growth and steroidogenesis of ovarian cells (Lucy
2001). This is essential in stimulating multiple
ovulation rates to give potential twins or multiple
pregnancies during the process of fertilization.
GH and OPN genes are two of the other genes that
play another role in maintaining twins and multiple
pregnancies in cattle. Their roles are to give success on
conception rate and embryo survival. Osteopontin
(OPN) gene in cattle is located at chromosome 6
(BTA6) closed to quantitative trait loci (QTL) of
fertility and milk production (Leonard et al. 2005). OPN
is known as secreted phosphoprotein 1 (SPP1). OPN is
expressed on maternal and foetal interface suggesting
indicating that OPN gene has an important role in
maintaining uterine-embryonic microenvironment
(Johnson et al. 2003). This gene has the function to
profoundly impact pregnancy, embryo implantation and
placental development (Li et al. 2013). Whereas
Growth Hormone (GH) gene plays a key role in
postnatal growth and developments in tissue, muscle,
bone, adipose tissue, udder gland (Sami et al. 2011).
GH gene is involved in the processes of sexual
Anggareni et al. Genetic polymerphisms of IGF1, GH, and OPN genes in crosses Peranakan Ongole cattle based on birth type in Central Java
167
differentiation and pubertal maturation as well as
participated in gonadal steroidogenesis, gametogenesis
and ovulation. This gene has additional roles in
pregnancy and lactation through the actions as
reflecting direct endocrine actions of pituitary GH or be
mediated by its induction of hepatic or local IGF-I
production (Hull & Harvey 2001). Significant
relationships have been reported between GH
concentrations and postpartum period and fertility of
cows (Lucy 2008).
This study was aimed to investigate genetic
polymorphisms of IGF1, OPN and GH genes in the
crossbred PO cattle from two districts in Central Java
Province. Information on genetic polymorphisms at
certain DNA fragments of IGF1, OPN, and GH genes
can be useful to investigate possible genetic control of
twins and multiple births as well as fertility traits in
beef cattle.
MATERIALS AND METHODS
Beef cattle as samples
Animals as samples in this study were crossed
Peranakan Ongole (PO) cattle as the offsprings of
crossbreeding PO females to exotic beef cattle breeds
such as Simmental, Limousin, and Brahman. The
crossed PO cattle were observed from Sragen Regency
and Kendal Regency in Central Java Province. A
female or a cow determined of having twins or multiple
births was that cow for giving twins or multiple births at
least once during her life, while that of historical twin
or multiple births was that animal calved from twins or
multiple births. Abbreviation of cows having
(historical) twins or multiple births called M, whilst
cow with single birth was grouped as control (S). A
total number of the crossed PO cattle observed from
Sragen amounted by 20 hd., consisting of the cows
having twins or multiple births (M) by 13 hd. (9
females and 4 males), while those with single birth (S)
by 7 hd. (all females). Further, the total number of the
crossed PO cattle from Kendal were 25 hd, consisting
the cows having twins or multiple births (M) by 16 hd
(15 females, 1 male), while cows having single birth (S)
by 9 hd. (4 females, 5 males).
Blood collection
All of those crossed PO cattle as samples were
collected their fresh blood. Blood samples were taken
for DNA analysis collected from jugular vein using a 21
G X 1 ½ sized vacutainer or 10 ml syringe containing
heparin anticoagulant substance. A total of 1 to 2 ml of
blood samples was stored in a 10 ml tube and added 8
ml of ethanol (EtOH) absolute containing 1 mM
EDTA).
DNA extraction
DNA extraction was done by following four steps.
1. Sample preparation: 200 μl blood sample was
inserted into 1.5 ml tube, added by distilled water 1000
μl, and centrifuged at 8000 rpm for 5 min. 2.
Degradation of protein: 1xSTE sample was added to a
solution of 350 μl, 40 μl SDS 10% and 10 μl proteinase
K 5 mg/ml and incubated at 55°C for 2 hours. 3.
Degradation of organic matter: the solution was added
to 400 μl of phenol, 400 μl chloroform-isoamyl alcohol
(24: 1) and 40 μl NaCl, then gently whisked at a room
temperature for 1 hour. 4. DNA precipitation was
performed by adding: 400 μl supernatant added 40 μl
NaCl 5 M and 800 μl ethanol absolute, homogenized,
frozen overnight.
DNA amplification
DNA genomes of the crossed PO cattle from single
birth and twin (multiple) births were used as template in
DNA amplification reaction (PCR reaction). The primer
used for IGF1 gene, namely forward 5-
CCTCTGCGGGGCTGAGTTGGT-3 and reverse 5-
CGACTTGGCGGGCTTGAGAGGC-3 following
Siadkowska et al. (2006). Primer used for Osteopontin
(OPN) gene, namely forward GCAAATCAGAAGTGT
GATAGAC-3, and reverse CCAAGCC
AAACGTATGAGTT-3 following Leonard et al.
(2005). While Growth Hormone (GH) gene used two
pairs of primers, namely forward CCC ACG GGC
AAG GC and GAG AAG; and reverse TGA GGA ACT
GCA GGG GCC CA in accordance to Zhou et al.
(2005).
PCR reaction
PCR reaction was performed with a total volume of
25 μl of solution mixture comprising Taq Polymerase
DNA and 10X Taq Polymerase buffer (100 mM Tris-
Cl, pH 8.3, 500mM KCL; 15mM MgCl2; 0.01%
gelatin); dNTP'S mix (dGTO, dATP, dTTP and dCTV)
(Pharmacia); and sterile dH2O. While PCR reaction
conditions in the thermocycler engine were designed
with pre-denaturation temperature by 93°C,
denaturation by 94°C, annealing by 58-60°C, extension
by 72°C, and post PCR 4°C. Cycles were repeated 33
times for multiplication.
JITV Vol. 22 No 4 Th. 2017: 165-172
168
Genotyping
To detect genetic variants of specific base fragments
of each IGF1, OPN and GH genes were performed by
PCR 5 μl product added 1 μl distillation water, 0.7 μl
buffer, and restriction enzime 0.3 μl, then incubated at
37°C for 16 h. DNA cutting products were visualized
on 2% agarose gel with 0.5 x TBE buffer (Tris-Borate
EDTA, then coloured ethidium bromide.
Electrophoretic results were observed with the aid of
UV light transilluminator.
Analysis of genetic polymorphism
Analysis of genetic polymorphism or SNPs (single
nucleotide polymorphisms) from each locus of
IGF1|SnaBI GH|MSpI and OPN|BsrI were conducted by
Poggene 32 packet programme for:
a. Genotype and allele frequency by computing
genotype number of all genotypes in a population
b. Hardy-Weinberg (H-W) Equilibrium by testing Chi-
Square calculation
c. Heterozygosity observation (Ho) and expectation
(He) by estimating on the base on allele frequency
d. Shannon's Information index
RESULTS AND DISCUSSION
Genotyping genes
SNP polymorphisms in IGF1 gene to be considered
as potential molecular markers for economic traits
providing reproduction traits (Leonard et al. 2005; Lucy
2008; Sami et al. 2011; Singh et al. 2014). DNA
amplification of IGF1, OPN, and GH genes using PCR
techniques by following specific primer design was
successfully performed on all blood samples of the
crossed PO cattle observed. Amplification products
were obtained for single birth as well as twins and
multiple births of the crossed PO cattle from Sragen (S
= 7 hd, and M = 13 hd.) and also from Kendal (S = 9
hd, and M = 16 hd).
IGF1 gene
Bovine IGF1 gene is located on chromosome 5
(BTA5) at nucleotide positions 66,532,877- 66,604,734
(UMD_3.1, Chromosome, Bos taurus, Ensembl) with
the provisional nucleotide sequence is approximately 72
kb (ID number 281239) (Reyna et al. 2010). DNA
amplification was performed at intron 1 of IGF1 gene
that resulted in a DNA fragment size by 249 bp
(Siadkowska et al. 2006). Amplicon products were
genotyped by SnaBI restriction enzyme. However,
SnaBI enzyme did not cut specific DNA cutting sites at
the intron 1 of IGF1 of all the crossed PO cattle
observed. This happened both for single birth as well as
for twins and multiple births from the two locations.
Genotyping IGF1|SnaBI locus in the crossed PO cattle
produced only one fragment of 249 bp. This means that
all these animals had only one type of genotype, namely
BB genotype. In contrast, there was not found either
AA genotype (223 and 26 bp) or AB genotype (249,
223 and 26 bp). None of the genetic variation or SNP of
IGF1|SnaBI locus was possibly due to no C/T base
transition as a specific cutting site of SnaBI restriction
enzyme.
OPN gene
Bovine OPN gene or SPP1 gene comprises 7 exons
spanning about 7 kb of genomic DNA (GenBank
accession number NW 255516). OPN gene is composed
of 6961 bp in total length: 1331 bp in processed length
and 278 in protein product lengths. DNA amplicons of
OPN gene were cut by a BsrI enzyme to detect a point
mutation at specific base fragment at intron 4. Genetic
polymorphism of OPN gene was studied by following
Leonard et al. (2005) that found a C/T transition at
intron 4 in a non-code 5 'region of OPN gene in Bos
taurus cattle. Amplification products of DNA fragments
of OPN|BsrI locus resulted in a base fragment size by
290 bp. For restricting DNA fragments of OPN|BsrI
locus into two DNA bands by 200 and 90 bp was
expressed as CC genotype. While, CT genotype was
identified for the occurrence of three DNA bands by
290, 200, and 90 bp. If the DNA amplicons was not cut
off by restriction enzyme resulting only one DNA band
by 290 bp for TT genotype resulted.
GH gene
PCR products of GH gene were cut by the Msp1
enzyme to detect a point mutation at intron 3 of GH
gene. When DNA fragments at intron 3 of GH gene
after the cutting by the Msp1 enzyme produced two
bands by 223 bp and 104 bp, so it was identified as BB
genotype. For the producing only one DNA band by
327 bp was called AA genotype. When the existing
three DNA bands of 327 bp, 223 pb, and 104 bp were
named AB genotype. Results from this study were
consistent to the previous study by Khatib et al. (2009)
for identifying three AA, AB, and BB genotypes from
the GH|Msp1 gene in Bos taurus dairy cattle.
Genotype and allele frequency
Genetic diversity is expressed as the total number of
genetic characters that build the genetic makeup of a
species, breed or population. Genetic diversity serves as
a way for populations to adapt to changing
environments. While more genetic variations exist, it is
Anggareni et al. Genetic polymerphisms of IGF1, GH, and OPN genes in crosses Peranakan Ongole cattle based on birth type in Central Java
169
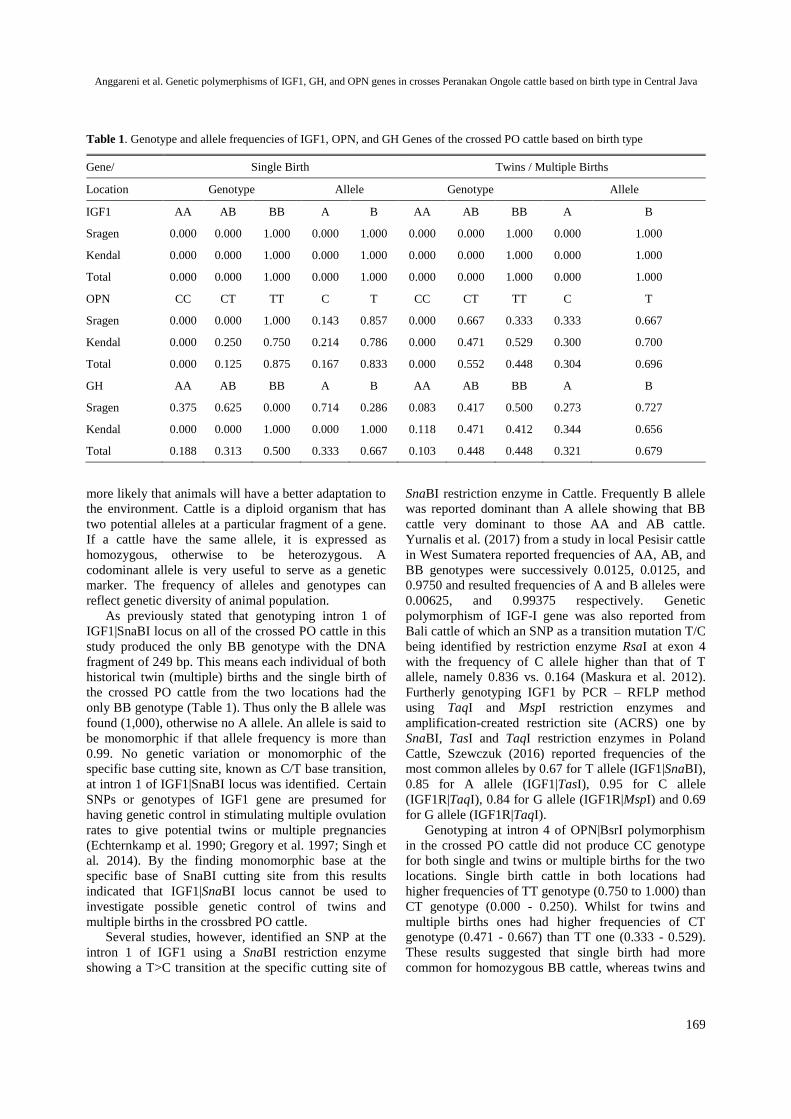
Table 1. Genotype and allele frequencies of IGF1, OPN, and GH Genes of the crossed PO cattle based on birth type
Gene/ Single Birth Twins / Multiple Births
Location Genotype Allele Genotype Allele
IGF1 AA AB BB A B AA AB BB A B
Sragen 0.000 0.000 1.000 0.000 1.000 0.000 0.000 1.000 0.000 1.000
Kendal 0.000 0.000 1.000 0.000 1.000 0.000 0.000 1.000 0.000 1.000
Total 0.000 0.000 1.000 0.000 1.000 0.000 0.000 1.000 0.000 1.000
OPN CC CT TT C T CC CT TT C T
Sragen 0.000 0.000 1.000 0.143 0.857 0.000 0.667 0.333 0.333 0.667
Kendal 0.000 0.250 0.750 0.214 0.786 0.000 0.471 0.529 0.300 0.700
Total 0.000 0.125 0.875 0.167 0.833 0.000 0.552 0.448 0.304 0.696
GH AA AB BB A B AA AB BB A B
Sragen 0.375 0.625 0.000 0.714 0.286 0.083 0.417 0.500 0.273 0.727
Kendal 0.000 0.000 1.000 0.000 1.000 0.118 0.471 0.412 0.344 0.656
Total 0.188 0.313 0.500 0.333 0.667 0.103 0.448 0.448 0.321 0.679
more likely that animals will have a better adaptation to
the environment. Cattle is a diploid organism that has
two potential alleles at a particular fragment of a gene.
If a cattle have the same allele, it is expressed as
homozygous, otherwise to be heterozygous. A
codominant allele is very useful to serve as a genetic
marker. The frequency of alleles and genotypes can
reflect genetic diversity of animal population.
As previously stated that genotyping intron 1 of
IGF1|SnaBI locus on all of the crossed PO cattle in this
study produced the only BB genotype with the DNA
fragment of 249 bp. This means each individual of both
historical twin (multiple) births and the single birth of
the crossed PO cattle from the two locations had the
only BB genotype (Table 1). Thus only the B allele was
found (1,000), otherwise no A allele. An allele is said to
be monomorphic if that allele frequency is more than
0.99. No genetic variation or monomorphic of the
specific base cutting site, known as C/T base transition,
at intron 1 of IGF1|SnaBI locus was identified. Certain
SNPs or genotypes of IGF1 gene are presumed for
having genetic control in stimulating multiple ovulation
rates to give potential twins or multiple pregnancies
(Echternkamp et al. 1990; Gregory et al. 1997; Singh et
al. 2014). By the finding monomorphic base at the
specific base of SnaBI cutting site from this results
indicated that IGF1|SnaBI locus cannot be used to
investigate possible genetic control of twins and
multiple births in the crossbred PO cattle.
Several studies, however, identified an SNP at the
intron 1 of IGF1 using a SnaBI restriction enzyme
showing a T>C transition at the specific cutting site of
SnaBI restriction enzyme in Cattle. Frequently B allele
was reported dominant than A allele showing that BB
cattle very dominant to those AA and AB cattle.
Yurnalis et al. (2017) from a study in local Pesisir cattle
in West Sumatera reported frequencies of AA, AB, and
BB genotypes were successively 0.0125, 0.0125, and
0.9750 and resulted frequencies of A and B alleles were
0.00625, and 0.99375 respectively. Genetic
polymorphism of IGF-I gene was also reported from
Bali cattle of which an SNP as a transition mutation T/C
being identified by restriction enzyme RsaI at exon 4
with the frequency of C allele higher than that of T
allele, namely 0.836 vs. 0.164 (Maskura et al. 2012).
Furtherly genotyping IGF1 by PCR – RFLP method
using TaqI and MspI restriction enzymes and
amplification-created restriction site (ACRS) one by
SnaBI, TasI and TaqI restriction enzymes in Poland
Cattle, Szewczuk (2016) reported frequencies of the
most common alleles by 0.67 for T allele (IGF1|SnaBI),
0.85 for A allele (IGF1|TasI), 0.95 for C allele
(IGF1R|TaqI), 0.84 for G allele (IGF1R|MspI) and 0.69
for G allele (IGF1R|TaqI).
Genotyping at intron 4 of OPN|BsrI polymorphism
in the crossed PO cattle did not produce CC genotype
for both single and twins or multiple births for the two
locations. Single birth cattle in both locations had
higher frequencies of TT genotype (0.750 to 1.000) than
CT genotype (0.000 - 0.250). Whilst for twins and
multiple births ones had higher frequencies of CT
genotype (0.471 - 0.667) than TT one (0.333 - 0.529).
These results suggested that single birth had more
common for homozygous BB cattle, whereas twins and
JITV Vol. 22 No 4 Th. 2017: 165-172
170
multiple births were more frequent in heterozygous CT
cattle. High CT and TT genotypes resulted in higher T
allele against C allele for both single birth or twins and
multiple births of the crossed PO cattle in this study.
Pareek et al. (2008) reported OPN or SPP1 C>T SNP
polymorphism was also found within the intron IV of
bovines SPP1 gene that was investigated in selected
breeds of beef (Hereford and Limousine) and dairy
(Polish HF and Polish Red) cattle. The study revealed
significant differences in the distribution of C and T
alleles among the analysed panel of cattle breeds. In
general allele frequencies of T and C were 0.59 and
0.41 respectively; so frequencies of TT, CT and CC
genotypes were 34.69, 48.62, and 16.69 respectively.
Growth hormone (GH) is an anabolic hormone
synthesized and secreted by somatotropic cells in an
anterior pituitary lobe (Ayuk & Sheppard 2006). The
specific DNA cutting site at intron 3 of GH|MspI locus
lies at position 1547 (Zhang et al. 1993). Genotyping
DNA fragments at intron 3 of GH|MspI SNP
polymorphism in the crossed PO cattle in twin and
multiple births had higher frequencies of AB genotype
(0.417 - 0.471) and BB genotype (0.412 - 0.500) than
AA genotype (0.083 - 0.118). The same pattern was
found in single birth type. AB cattle were found higher
than AA one. Even in Kendal, single birth cattle was
just identified only for BB genotype. These results
indicated that both single birth and twins (multiple)
births of the crossed PO cattle had higher AB and BB
genotype than AA one. Thus frequencies of B allele
were higher than those of A allele A across birth type
and location. DNA polymorphism of GH|MspI locus in
Aceh cattle was reported by Putra et al. (2013) to have
only TT genotype (BB genotype) resulting frequency of
T allele was 1,000 and monomorphic.
Heterozygosity
Estimation of heterozygosity value was obtained to
determine the level of genetic diversity in the crossed
PO cattle population observed. This information can be
used to help the effectiveness of selection program on
breeding stocks to be used as a genetic source in the
next generation (Marson et al. 2005). Heterozygosity
observation (Ho) of OPN|BsrI and GH|MspI loci of the
crossed PO cattle by birth type are listed in Table 2.
Heterozygosity expectation (He) is required to know the
difference to heterozygosity observation (Ho). For the
IGF1|SnaBI locus with the only BB genotype in all of
the crossed PO cattle lead to Ho value of 0.000.
For OPN|BsrI locus in the crossed PO cattle from
both locations showed Ho values were higher than He
values. It was for single birth namely Ho = 0.2857 -
0.4286 vs He = 0.2637 - 0.3626; while that for multiple
births, namely Ho = 0.6000 - 0.6667 vs He = 0.4345 -
0.4638. Ho values were higher than the He values from
this OPN|BsrI locus could be an indication for a good
heterozygosity level this gene polymorphism in the
crossed PO cattle either for single birth and twins or
multiple births. OPN|BsrI locus, therefore, could be
considered as a molecular selection in regarding
increase probability of twins or multiple births in beef
cattle. According to Javanmard et al. (2005), a
heterozygosity value above 0.5 (50%) indicates a high
variation of a gene in a population. Molecular selection
by using OPN|BsrI gene might be possible to give a
good selection respond in improving twin or multiple
births in beef cattle.
However, the opposite result was found to GH|MspI
locus in which the crossed PO cattle in multiple births
had relatively smaller Ho values compared to He
values, ie Ho = 0.3636 - 0.4375 vs He = 0.4156 -
0.4657. This indicated heterozygosity level of GH|MspI
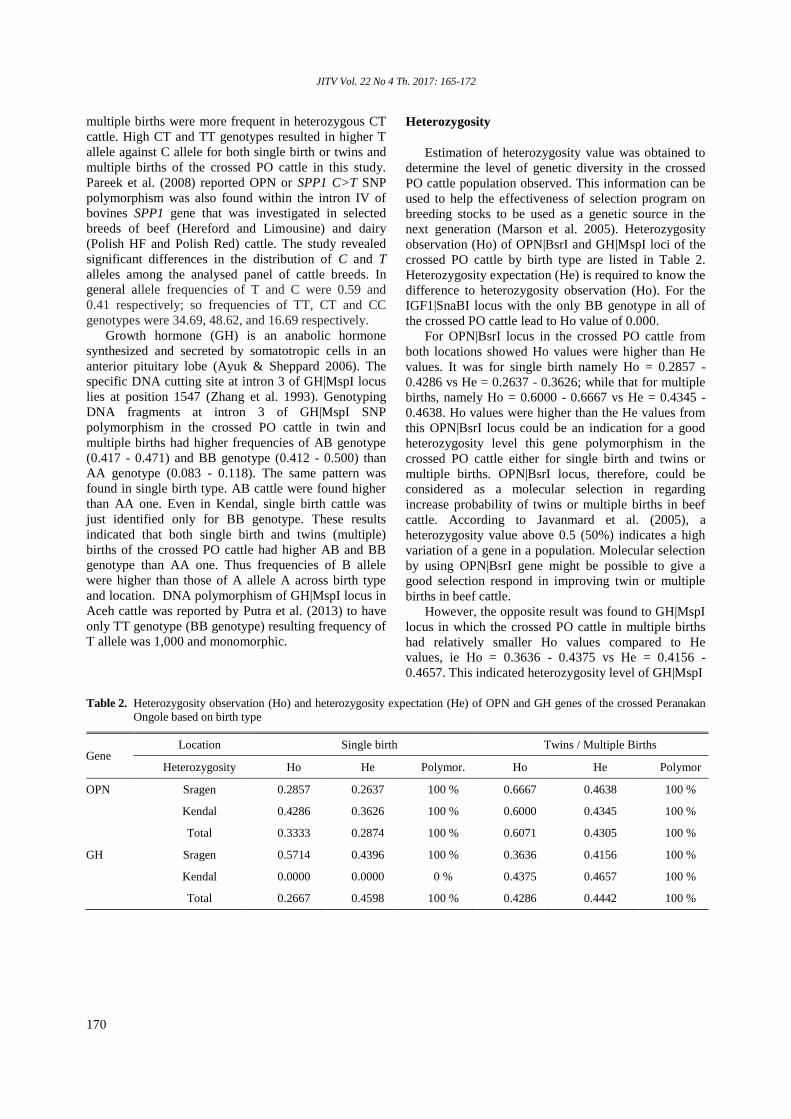
Table 2. Heterozygosity observation (Ho) and heterozygosity expectation (He) of OPN and GH genes of the crossed Peranakan
Ongole based on birth type
Gene Location Single birth Twins / Multiple Births
Heterozygosity Ho He Polymor. Ho He Polymor
OPN Sragen 0.2857 0.2637 100 % 0.6667 0.4638 100 %
Kendal 0.4286 0.3626 100 % 0.6000 0.4345 100 %
Total 0.3333 0.2874 100 % 0.6071 0.4305 100 %
GH Sragen 0.5714 0.4396 100 % 0.3636 0.4156 100 %
Kendal 0.0000 0.0000 0 % 0.4375 0.4657 100 %
Total 0.2667 0.4598 100 % 0.4286 0.4442 100 %
Anggareni et al. Genetic polymerphisms of IGF1, GH, and OPN genes in crosses Peranakan Ongole cattle based on birth type in Central Java
171
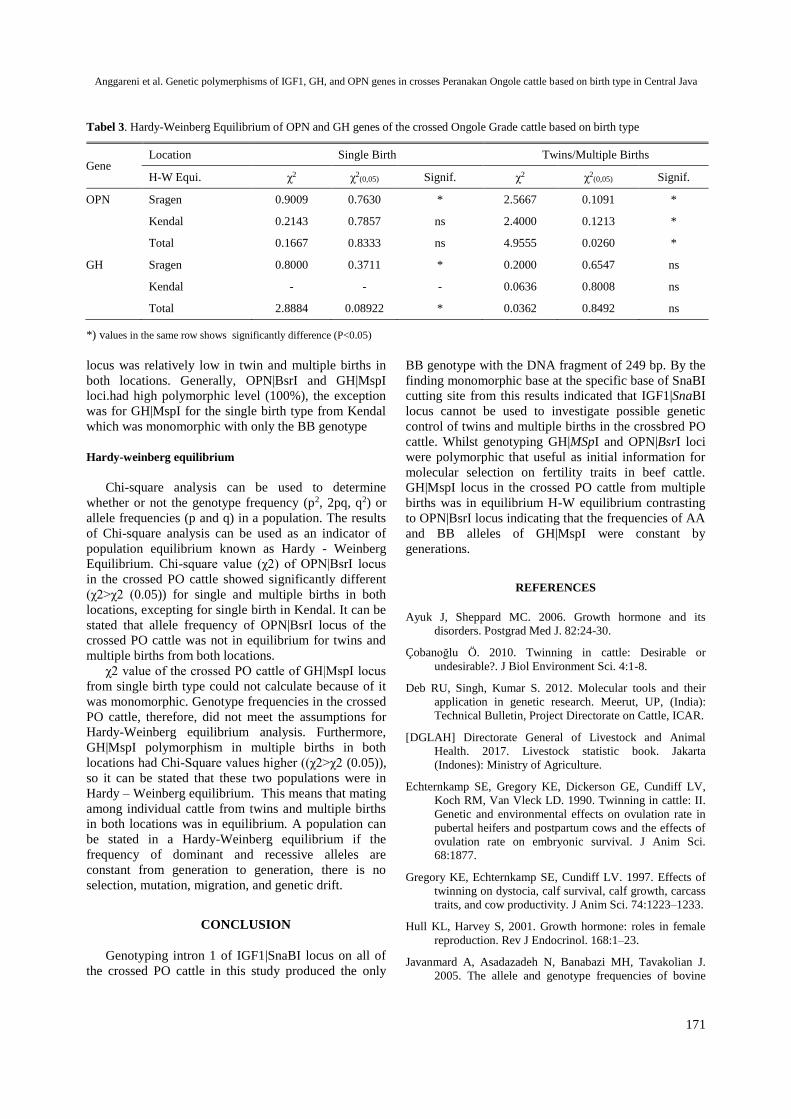
Tabel 3. Hardy-Weinberg Equilibrium of OPN and GH genes of the crossed Ongole Grade cattle based on birth type
Gene Location Single Birth Twins/Multiple Births
H-W Equi. χ2 χ2(0,05) Signif. χ2 χ2
(0,05) Signif.
OPN Sragen 0.9009 0.7630 * 2.5667 0.1091 *
Kendal 0.2143 0.7857 ns 2.4000 0.1213 *
Total 0.1667 0.8333 ns 4.9555 0.0260 *
GH Sragen 0.8000 0.3711 * 0.2000 0.6547 ns
Kendal - - - 0.0636 0.8008 ns
Total 2.8884 0.08922 * 0.0362 0.8492 ns
*) values in the same row shows significantly difference (P<0.05)
locus was relatively low in twin and multiple births in
both locations. Generally, OPN|BsrI and GH|MspI
loci.had high polymorphic level (100%), the exception
was for GH|MspI for the single birth type from Kendal
which was monomorphic with only the BB genotype
Hardy-weinberg equilibrium
Chi-square analysis can be used to determine
whether or not the genotype frequency (p2, 2pq, q2) or
allele frequencies (p and q) in a population. The results
of Chi-square analysis can be used as an indicator of
population equilibrium known as Hardy - Weinberg
Equilibrium. Chi-square value (χ2) of OPN|BsrI locus
in the crossed PO cattle showed significantly different
(χ2>χ2 (0.05)) for single and multiple births in both
locations, excepting for single birth in Kendal. It can be
stated that allele frequency of OPN|BsrI locus of the
crossed PO cattle was not in equilibrium for twins and
multiple births from both locations.
χ2 value of the crossed PO cattle of GH|MspI locus
from single birth type could not calculate because of it
was monomorphic. Genotype frequencies in the crossed
PO cattle, therefore, did not meet the assumptions for
Hardy-Weinberg equilibrium analysis. Furthermore,
GH|MspI polymorphism in multiple births in both
locations had Chi-Square values higher ((χ2>χ2 (0.05)),
so it can be stated that these two populations were in
Hardy – Weinberg equilibrium. This means that mating
among individual cattle from twins and multiple births
in both locations was in equilibrium. A population can
be stated in a Hardy-Weinberg equilibrium if the
frequency of dominant and recessive alleles are
constant from generation to generation, there is no
selection, mutation, migration, and genetic drift.
CONCLUSION
Genotyping intron 1 of IGF1|SnaBI locus on all of
the crossed PO cattle in this study produced the only
BB genotype with the DNA fragment of 249 bp. By the
finding monomorphic base at the specific base of SnaBI
cutting site from this results indicated that IGF1|SnaBI
locus cannot be used to investigate possible genetic
control of twins and multiple births in the crossbred PO
cattle. Whilst genotyping GH|MSpI and OPN|BsrI loci
were polymorphic that useful as initial information for
molecular selection on fertility traits in beef cattle.
GH|MspI locus in the crossed PO cattle from multiple
births was in equilibrium H-W equilibrium contrasting
to OPN|BsrI locus indicating that the frequencies of AA
and BB alleles of GH|MspI were constant by
generations.
REFERENCES
Ayuk J, Sheppard MC. 2006. Growth hormone and its
disorders. Postgrad Med J. 82:24-30.
Çobanoğlu Ö. 2010. Twinning in cattle: Desirable or
undesirable?. J Biol Environment Sci. 4:1-8.
Deb RU, Singh, Kumar S. 2012. Molecular tools and their
application in genetic research. Meerut, UP, (India):
Technical Bulletin, Project Directorate on Cattle, ICAR.
[DGLAH] Directorate General of Livestock and Animal
Health. 2017. Livestock statistic book. Jakarta
(Indones): Ministry of Agriculture.
Echternkamp SE, Gregory KE, Dickerson GE, Cundiff LV,
Koch RM, Van Vleck LD. 1990. Twinning in cattle: II.
Genetic and environmental effects on ovulation rate in
pubertal heifers and postpartum cows and the effects of
ovulation rate on embryonic survival. J Anim Sci.
68:1877.
Gregory KE, Echternkamp SE, Cundiff LV. 1997. Effects of
twinning on dystocia, calf survival, calf growth, carcass
traits, and cow productivity. J Anim Sci. 74:1223–1233.
Hull KL, Harvey S, 2001. Growth hormone: roles in female
reproduction. Rev J Endocrinol. 168:1–23.
Javanmard A, Asadazadeh N, Banabazi MH, Tavakolian J.
2005. The allele and genotype frequencies of bovine
JITV Vol. 22 No 4 Th. 2017: 165-172
172
pituitary-specific transcription factor and leptin genes in
Iranian cattle and buffalo populations using PCR-RFLP.
Iranian J Biotechnol. 3:104-108.
Johnson GA, Burghardt RC, Joyce MM, Spencer TE, Bazer
FW, Gray CA, Pfarrer C. 2003. Osteopontin is
synthesized by uterine glands and a 45-kDa cleavage
fragment is localized at the uterine-placental interface
throughout ovine pregnancy. Biol Reprod. 69:92–98.
Karlsen A, Ruane J, Klemetsdal G, Heringstad B. 2000.
Twinning rate in Norwegian cattle: Frequency,
(co)variance components, and genetic trends. J Anim
Sci. 78:12-20.
Khatib H, Huang W, Wang X, Tran AH, Bindrim AB,
Schutzkus V, Monson RL, Yandell BS. 2009. Single
gene and gene interaction effects on fertilization and
embryonic survival rates in cattle. J Dairy Sci. 92:2238–
2247.
Komisarek J, Dorynek Z. 2002. Genetic aspects of twinning
cattle. J Appl Genet. 43:55-68.
Leonard S, Khatib H, Schutzkus V, Chang YM, Maltecca C.
2005. Effects of the osteopontin gene variants on milk
production traits in dairy cattle. J Dairy Sci. 88:4083–
4086.
Li MC, Fang Q, He ZM, Gao Y, Zhou Y. 2013. Placental
expression of osteopontin (OPN) in monochorionic
twins with discordant growth. Placenta. 34:288–290.
Lien S, Karlsen A, Klemetsdal G, Vcge DL, Olsaker I,
Klungland H, Aasland M, Heringstad B, Ruane J,
Gomez-Raya L. 2000. A primary screen of the bovine
genome for quantitative trait loci affecting the twinning
rate. Mamm Genome. 11:877-882.
Lucy MC. 2001. Reproductive loss in high-producing dairy
cattle: Where will it end?. J Dairy Sci. 84:1277–1293.
Lucy MC. 2008. Functional differences in the growth
hormone and insulin-like growth factor axis in cattle
and pigs: implications for post-partum nutrition and
reproduction. Reprod Domest. Anim. 43(Suppl. 2), 31–
39.
Maskura C, Armana C, Sumantrib E, Gurnadi, Muladno.
2012. A Novel single nucleotide polymorphism in exon
4 of insulin-like growth factor-1 associated with
production traits in Bali cattle. Media Peternakan.
35:96-101.
Marson EP, Ferraz JBS, Meirelles FV, Balieiro JCC, Eler JP,
Figuerido LGG, Mourao GB. 2005. Genetik
characterization of European-Zebu composite bovine
using RFLP markers. J Genet Mol Res. 4:496-505.
Pareek CS, Zięba M, Michno J, Czarnik U, Zwierzchowski L.
2008. Study of SNP C>T polymorphism within the
candidate genes for dairy and beef traits in a panel of
selected cattle breeds. J. Agro-Biology. 25:121-124.
Putra WPB, Hartatik T, Sumadi. 2013. Growth hormone gene
genotyping by Msp I restriction enzyme and PCR-RFLP
methods in Aceh cattle breed at Indrapuri district of
Aceh province. J Indones Trop Anim Agric. 38:207-
211.
Reyna XF, De la Rosa, Montoya HM, Castrellón VV, Rincón
AMS, Bracamonte MP, Vera WA. 2010. Poly-
morphisms in the IGF-1 gene and their effect on growth
traits in Mexican beef cattle. Genet Mol Res. 9:875-883.
Sami AJ, Nazir MT, Jabeen Z, Shakoori AR. 2011. Gene
study within the 5' flanking regions of growth hormone
gene of the first exon in Bos indicus. Afr J Biotechnol.
10:332-336.
Sawa A, Bogucki M, Kr˛e˙zel-Czopek S. 2012. Reproduction
performance of cows with single, twin and triplet
calves. Acta Vet Brno. 81:347–352.
Siadkowska E, Zwierzchowski L, Oprządek J, Strzałkowska
N, Bagnicka E, Krzyżewski J. 2006. Effect of
polymorphism in IGF-1 gene on production traits in
Polish Holstein-Friesian cattle. Anim Sci Papers
Reports. 24:225-237.
Singh U, Deb R, Alyethodi RR, Alex R, Kumar S,
Chakraborty S, Dhama K, Sharma A. 2014. Molecular
markers and their applications in cattle genetic research:
A review. Biomark Genom Medic. 6:49-58.
Szewczuk M. 2016. Association of single nucleotide
polymorphisms in genes coding insulin-like growth
factor 1 system and milk production traits in
Montbeliarde cows. South Afr J Anim Sci. 46:191-195.
Yang WC, Li SJ, Tang KQ. 2010. Polymorphisms in the 50
upstream regions of the FSH receptor gene, and their
association with superovulation traits in Chinese
Holstein cows. Anim Reprod Sci. 119:172-177.
Yurnalis, Arnim, Putra DE. 2017. Polymorphism of insulin-
like growth factor 1 gene (IGF1/TasI, IGF1/SnaBI,
IGF1/RsaI) and the association with daily gain of
Pesisir cattle local breed from West Sumatera,
Indonesia. Pak J Biol Sci. 20:2010-2016.
Zhang HM, Maddock KC, Brown DR, Denise SK, Ax RL.
1993. A novel allele of the bovine somatotropin gene
detected by PCR-RFLP analysis. J Anim Sci. 71:2276.
Zhao Y, Xu H, Zhao Z, Narisu, Mao J, Guan D, Xie C. 2015.
Polymorphisms of osteopontin gene and their
association with placental efficiency and prolificacy in
goats. J Appl Anim Res. 43:272-278.
Zhou GL, Jin HG, Guo SL, Zhu Q, Whu YH. 2005.
Association of genetic polymorphism in GH gene with
milk production traits in Beijing Holstein cows. J
Biosci. 30:595-598.
Sonjaya et al. Effect of Bali Cattle Ovarian Status on Oocytes Nuclear Maturation and In Vitro Fertilization Rate
173
Effect of Bali Cattle Ovarian Status on Oocytes Nuclear Maturation and In
Vitro Fertilization Rate
Sonjaya H1, Yusuf M1, Hamdana A1, Utamy RF1, Gustina S2, Hasbi H1
1Department of Livestock Production, Faculty of Animal Science, University of Hasanuddin,
Jl. Perintis Kemerdekaan Km.10, Makassar 90245, Indonesia 2Department of Animal Science, Faculty of Animal and Fisheries Science, University of West Sulawesi,
Jl. Prof. Dr. Baharuddin Lopa, Tande Timur, Majene, 91412
E-mail: [email protected]
(received 09-10- 2017; revised 13-11-2017; accepted 02-12-2017)
ABSTRAK
Sonjaya H, Yusuf M, Hamdana A, Utamy RF, Gustina S, Hasbi H. 2017. Pengaruh status ovarium sapi Bali terhadap maturasi
inti oosit dan tingkat fertilitas in vitro. JITV 22(4): 173-178. DOI: http://dx.doi.org/10.14334/jitv.v22i4.1585
Penelitian ini dilakukan untuk mengetahui pengaruh status reproduksi ovarium yang ditandai dengan keberadaan corpus
luteum (CL) dan folikel dominan (FD) terhadap tingkat pematangan inti dan fertilisasi oosit sapi bali in vitro. Pasangan ovarium
dari rumah potong hewan (RPH) dipisahkan menjadi empat kelompok, yaitu: 1) ovarium dengan CL dan FD, 2) ovarium tanpa
CL dan ada FD, 3) ovarium dengan CL dan tanpa CL, dan 4) ovarium tanpa CL dan FD. Penelitian ini dibagi dalam dua tahap.
Tahap I, oosit dikoleksi dengan teknik pencacahan dalam medium Phosphate Buffer Saline (PBS) yang disuplementasi dengan
Fetal Bovine Serum (FBS) 10% dan penicilin streptomycin 100 IU/ml. Oosit dimatangkan selama 24 jam, 38,5°C dalam
inkubator CO2 5%, menggunakan medium TCM-199 yang disuplementasi dengan FBS 10%, Follicle Stimulating Hormone
(FSH) 10 IU/ml, Luteinizing Hormone (LH) 10 IU/ml, dan gentamycin 50 µg/ml. Tahap II, oosit dimatangan dalam media
seperti pada penelitian tahap I, kemudian difertilisasi secara in vitro untuk mengamati pembentukan pronukleus. Hasil penelitian
tahap I menunjukkan bahwa jumlah oosit yang mencapai fase metaphase II (MII) lebih tinggi (P<0,01) pada pasangan ovarium
ada CL dan tanpa FD (89,47%) dibandingkan dengan tanpa CL dan tanpa FD (75,47%), tanpa CL dan ada FD (74,41%), dan ada
CL dan ada FD (65,52%). Status reproduksi ovarium yang memiliki CL tetapi tanpa FD memiliki jumlah oosit yang mencapai
tahap MII tertinggi. Penelitian tahap II menunjukkan bahwa status reproduksi ovarium tidak berpengaruh terhadap tingkat
fertilisasi oosit sapi bali. Hasil penelitian menyimpulkan bahwa persentase oosit yang mencapai tahap MII dari ovarium yang
memiliki CL dan tidak memiliki FD tertinggi, namun tingkat fertilisasi tidak dipengaruhi oleh status reproduksi ovarium.
Kata Kunci: Status Ovarium, Oosit, Sapi Bali, Pematangan, Fertilisasi
ABSTRACT
Sonjaya H, Yusuf M, Hamdana A, Utamy RF, Gustina S, Hasbi H. 2017. Effect of Bali cattle ovarian status on oocytes nuclear
maturation and in vitro fertilization rate. JITV 22(4): 173-178. DOI: http://dx.doi.org/10.14334/jitv.v22i4.1585
The aim of this study was to investigate whether the reproductive status influences the nuclear maturation and fertilization
rates of bali cattle oocytes in vitro. Several pairs of ovary were classified into four groups: 1) ovaries with Corpus Luteum (CL)
and Dominant Follicle (DF), 2) ovaries without CL and with DF, 3) ovaries with CL and without DF, 4) ovaries without both CL
and DF. In the first experiment, oocytes were collected by slicing method in Phosphate Buffer Saline (PBS) medium
supplemented with 10% Fetal Bovine Serum (FBS) and 100 IU/ml penicillin streptomycin. Oocytes were matured in tissue
culture medium (TCM)-199 supplemented with 10% Fetal Bovine Serum (FBS), 10 IU/ml Follicle Stimulating Hormone (FSH),
10 IU/ml Luteinizing Hormone (LH), and 50 µg/ml gentamycin. Oocytes were matured in 5% CO2 incubator, 38oC for 24 h. In
the second experiment, oocytes were matured and then fertilized in vitro to observe pronuclear formation. The first experiment
showed that the percentage of oocytes reached methaphase-II (MII) stage on ovaries with CL and without DF (89.47%) were
higher (P<0,01) compared to ovaries without both CL and DF (75,47%), ovaries without CL and with DF (74.,41%), or ovaries
with CL and DF (65,52%). The result of second experiment showed that the ovarian reproductive status was not significantly
different (P>0.05) on fertilization rate.
Key Words: Ovarian Status, Oocytes, Bali Cattle, Maturation, Fertilization
INTRODUCTION
Embryo production in vitro (EPIV) is one of the
assisted reproductive technology (ART) consisted of in
vitro maturation (IVM), in vitro fertilization (IVF) and
in vitro culture (IVC) (Rahman et al. 2008, Hegab et al.
2009). Genetic material of the animal with abnormal
reproduction function may be rescued by this EPIV
technology.
JITV Vol. 22 No 4 Th. 2017: 173-178
174
The success of the EPIV technology is determined
by many factors, such as oocytes source used. Oocytes
grow in the follicle environment in the ovary following
certain growth circle. Follicle growth wave consists of
recruitment phase, selection, dominant and some have
atresia (Campanile et al. 2010). In cattle and sheep, it is
possible for several follicle waves in one estrus circle,
generally two to three times in sheep which each may
produce more than dominant follicle (DF) (Evans
2003). This dominant follicle existence will decrease
FSH concentration (Gonzalez-Bulnes et al. 2004) and
leading a pressure to other follicle growths in the same
wave causing a regression (Varishaga et al. 1998).
Then, the DF will ovulate if there is no corpus lutheum
(CL). Remnant of ovulated DF forms CL. This CL
consists of cells that will produce progesterone
hormone useful in implantation process and pregnancy
maintenance. The aim of this study was to investigate
whether the reproductive status influences the nuclear
maturation and fertilization rates of bali cattle oocytes
in vitro.
MATERIALS AND METHODS
Stage I. Oocytes collection and maturation In Vitro
Ovarium of bali cattle were collected from a
slaughterhouse and transported to the laboratory in the
solution of 0.9% NaCl supplemented with 100 IU/ml
penicilin and 100 µg/ml streptomycin sulfate. Oocyte
collection was performed by aspiration technique using
a 18-G syringe. Phosphate buffered saline (PBS)
supplemented with 10% fetal bovine serum (FBS)
(Sigma, USA) was used as the collection medium.
Oocytes with homogenous cytoplasm and surrounded
by ≥3 layers of cumulus cells were selected under a
stereo-microscope and were graded into either A or B
(Abdoon et al. 2014). The selected oocytes were
washed three times in the maturation media, then the
maturation was performed in the tissue culture medium
(TCM) 199 (Sigma, USA) supplemented with 10 IU/ml
pregnant mare serum gonadotrophin (PMSG)
(Intergonan, Intervet Deutschland GmbH), 10 IU/ml
human chorionic gonadotrophin (hCG) (Chorulon,
Intervet international B.V. Boxmeer-Holland), 1 µg/ml
estradiol (Intervet international B.V. Boxmeer-Holland)
and 50 µg/ml gentamycin (Sigma, USA). The oocyte
maturation was performed in a 35-mm Petri dish
(Nunclon, Denmark) in the form of drop, 50 µl in
volume, containing 10-15 oocytes per drop, covered
with mineral oil (Sigma, USA). The oocytes were
incubated in a 5% CO2, 38.5°C incubator for 24 hours
(modified from Hasbi et al. 2017).
Evaluation of nucleus maturation level and the
staining process
Evaluation of nucleus maturation level was assessed
on the basis of meiosis from germinal vesicle (GV) to
metaphase II (MII) on 2%-aceto-orcein staining.
Germinal vesicle stage was characterised by a clearly
visible nucleus and its membrane. Germinal vesicle
breakdown (GVBD) was marked by the fragmentation
of the nucleus membrane and indistict nucleus.
Metaphase I (MI) was marked by the existence of
homolog chromosomes lined up in the equator, whereas
in the anaphase I (AI) stage, the chromosomes were
moved to both poles. In the telophase I (TI) stage, the
chromosomes had reached both poles. Metaphase II
(MII) was marked by polar body I and the same
chromosome structure with the one in the MI stage
(Shirazi & Sadeghi 2007). Nucleus maturation level
was determined on the basis of oocytes percentage able
to reach the MII (Bijttebier et al. 2008).
After 24 hours maturation, the cumulus cells
surrounding the oocytes were removed using 0.25 %
hyaluronidase (Sigma, USA) followed by denotation by
repeated pipetting using a 110-120 µm syringe
(according to oocyte size). The oocytes were suspended
in 0.7 % KCl and placed as a drop on the cover glass
with paraffin and vaseline pads in its four corners. The
cover glass was placed upside down on an object glass.
The oocytes were fixed by dipping the glasses into
fixation solution consisting of acetic acid and ethanol (1
: 3) for 3 days. The cells were dehydrated by soaking in
ethanol, then stained with 2% aceto-prcein for 5
minutes. The dye was cleaned using 25% acetate acid
and the four corners of cover glass was smeared by
clear nail polish. Then, the morphology of the oocytes
was performed under microscope (Zeiss Axio Imager
A2) using Zeiss Axiocam HRc.
Stage II. In Vitro fertilization
Collection and maturation of oocytes followed the
same procedure as in the stage I. Frozen semen was
thawed in 37°C for 20 second and then centrifuged at
700 G for 5 minutes in the fertilization media (Suzuki et
al. 2000). After the centrifugation, sperm sediment was
suspended in fertilization media to a concentration of
1.5×10⁶ spermatozoa/ml. After the IVM, the oocytes
were washed in fertilization media twice, then moved
into drop fertilization media (10-15 oocytes in 100 μl
fertilization media) and covered with mineral oil
(Sigma-Aldrich. Inc, M-8410) followed by incubation
at 38.5°C for 16 hours in 5% CO2 incubator (modified
from Hasbi et al. 2017). Fertilization level was
evaluated in a basis of pronucleus formation with 2%
aceto-orcein staining as in stage 1.
Sonjaya et al. Effect of Bali Cattle Ovarian Status on Oocytes Nuclear Maturation and In Vitro Fertilization Rate
175
Data analysis
Data were presented in the form of percentage.
Differences between treatments were analyzed using
ANOVA. In case significant differences were found,
the smallest real test was carried out. All statistical
analyses were carried out using SPSS 17 (SPSSInc).
RESULTS AND DISCUSSION
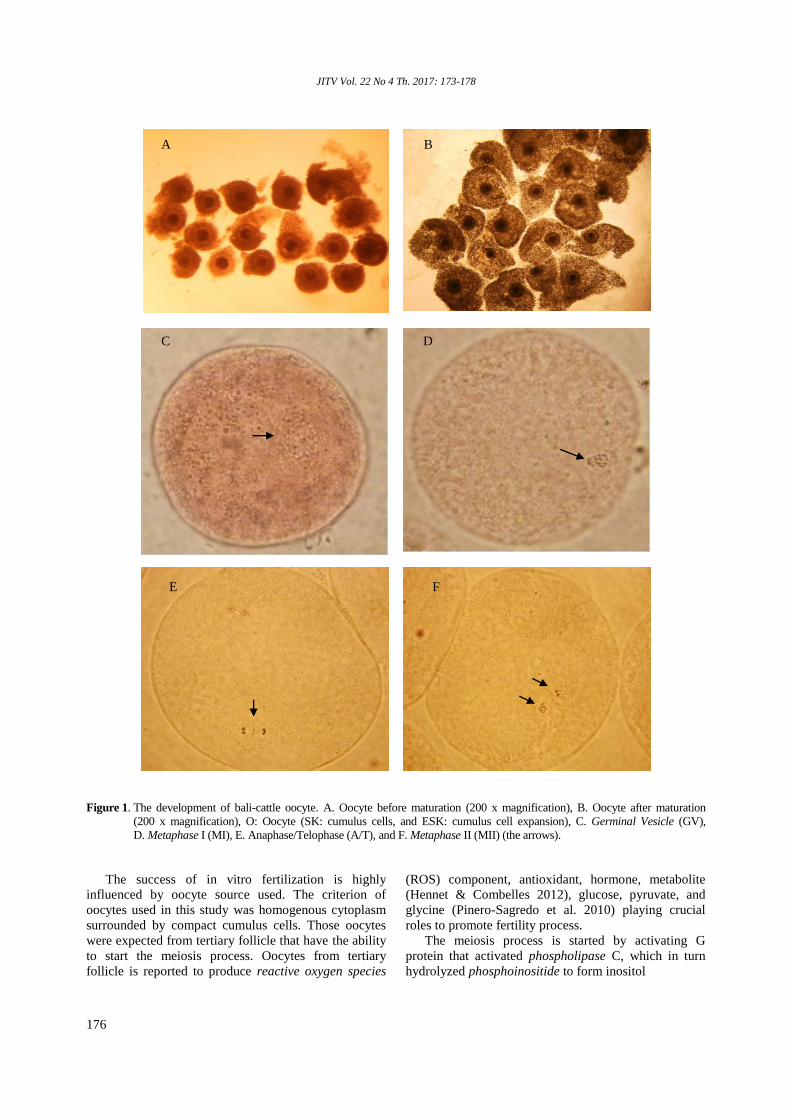
Maturation stage of oocytes nucleus
Oocyte in vitro maturation stage is detemined by
quality of the oocytes used. In this study, cumulus cells
were formed after in vitro maturation for 24 hours
(Figure 1B). Rahman et al. (2008) reported that
formation of cumulus cells is followed by changes in
the gap junction consisted of transmembrane channels.
The latter were formed by hexamer proteins including
connective proteins. In horse, cattle, sheep and mouse,
the cumulus cells have about 43 connective proteins.
The existence of cumulus cells played a crucial role in
the protein synthesis process before the germinal
vesicle breakdown (GVBD). In sheep and cattle
oocytes, the GVBD functions as supply of nutrient,
energy substrate, messenger molecules for oocytes
development and hormone effect in the cumulus oocyte
complexes (COCs) (Rahman et al. 2008).
The communication between oocytes and cumulus
cells plays crucial role in future maturation and
development process of oocytes during IVC. Tthe
communication is connected by gap junctional
communication (GJC), where the components activate
the meiosis process, glutathione or substrate glutamine
and cysteine, a small regulator molecule lighter than 1
kDa, substrat molecule with lighter than 1,200 Da such
as Ca2+; nucleotide and amino acids are transferred
from cumulus cells through the GJC (Shirazi et al.
2007).
This study showed that the most matured oocytes
have started the meiosis stage indicated by the change
of nuclear oocytes from GV to MII stages (Figure 1C-
F). The number of oocytes reached MII stage based on
the ovarium reproduction status was presented in the
Table 1.
This study showed that reproduction status of ovary
was significantly (P<0.01) influenced the number of
oocyte of bali cattle that reached metaphase II (MII)
stage. The statistic test showed reproduction status of
ovary +CL –FD (89.47%) had more (P<0.01) oocytes
reached MII than the +CL +FD (65.52%), -CL +FD
(74.41%), and -CL –FD (75.47%). Whereas, the
number of oocytes reached MII stage in the ovary -CL
+FD was not different (P>0.05) with the ovary -CL –
FD, but significantly higher than the +CL +FD. The
existence of CL and DF on the ovarian couple affects in
vitro maturation stage of oocyte nucleus of bali cattle.
Generally, maturation stage of oocytes nucleus from
ovarian couple that have CL and DF tends to be lower.
This showed that progesterone from the CL and inhibin
from the DF gives a negative effect to in vitro
maturation process of nucleus. Ooe et al. (1997)
reported that in the cattle, ultrasonography use and FSH
hormone administration showed that the number of
follicle, the number of aspirated oocyte, the number of
life oocyte which then experiencing division and
forming blastocyst in vitro; the lowest was in the animal
with DF compared to the animal without DF. This FSH
administration on the animal with DF did not give
positive response to subordinate follicle development.
In vice versa, Boediono & Setiadi (2006) stated that CL
existence in the ovary has positive correlation with the
number of grow follicle. Progesterone produced from
CL may inhibit DF growth and remove inhibin effect,
so that subordinate follicle is able to grow (Kor 2014).
Varishaga et al. (1998) reported that the highest number
of collected oocyte, division and blastocyst level was
obtained from the ovary with CL and without DF
followed by oocyte from ovary with CL and DF. Then,
Vassena et al. (2003) reported that there was no
significant difference in blastocyst level result of cattle
in basis of the difference of reproduction status of ovary
marked by CL and DF existence. Even though,
generally the blastocyst level continue to rise on the
ovary with CL. This is allegedly that CL produced
progesterone plays a role to conquer negative effect
inflicted by inhibin existence. High A inhibin on the
follicle will drive to FSH secretion and another follicles
development on the cattle, sheep and buffalo (Perera
2011).
In Vitro fertilization level of oocytes
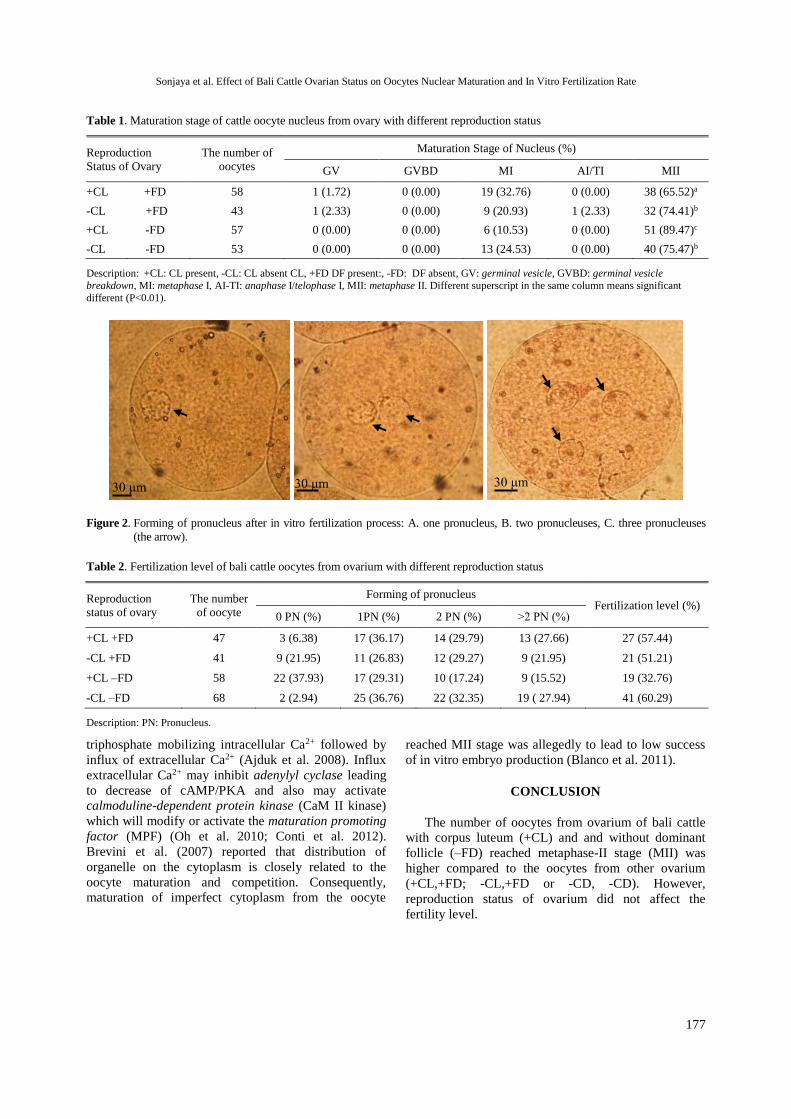
Fertilization level was assessed by counting the
number of oocyte forming two or more pronucleus
(Figure 2).
This study showed that reproduction status of ovary
did not significantly affect (P˃0.05) the number of
fertilized oocytes (forming two or more pronucleus).
This study also revealed a higher fertility level
(60.29%) on the oocyte from ovary without CL and DF
than other ovary reproductive status (Table 2). The
quality of oocyte used in this study was uniform with
the homogenous cytoplasm surrounded by compact
cumulus cells indicating a uniform development. This
study also provided an indication that inhibit
supposedly produced by DF may not affect in vitro
fertility level of bali cattle oocytes.
JITV Vol. 22 No 4 Th. 2017: 173-178
176
Figure 1. The development of bali-cattle oocyte. A. Oocyte before maturation (200 x magnification), B. Oocyte after maturation
(200 x magnification), O: Oocyte (SK: cumulus cells, and ESK: cumulus cell expansion), C. Germinal Vesicle (GV),
D. Metaphase I (MI), E. Anaphase/Telophase (A/T), and F. Metaphase II (MII) (the arrows).
The success of in vitro fertilization is highly
influenced by oocyte source used. The criterion of
oocytes used in this study was homogenous cytoplasm
surrounded by compact cumulus cells. Those oocytes
were expected from tertiary follicle that have the ability
to start the meiosis process. Oocytes from tertiary
follicle is reported to produce reactive oxygen species
(ROS) component, antioxidant, hormone, metabolite
(Hennet & Combelles 2012), glucose, pyruvate, and
glycine (Pinero-Sagredo et al. 2010) playing crucial
roles to promote fertility process.
The meiosis process is started by activating G
protein that activated phospholipase C, which in turn
hydrolyzed phosphoinositide to form inositol
A B
C D
E F
Sonjaya et al. Effect of Bali Cattle Ovarian Status on Oocytes Nuclear Maturation and In Vitro Fertilization Rate
177
Table 1. Maturation stage of cattle oocyte nucleus from ovary with different reproduction status
Reproduction
Status of Ovary
The number of
oocytes
Maturation Stage of Nucleus (%)
GV GVBD MI AI/TI MII
+CL +FD 58 1 (1.72) 0 (0.00) 19 (32.76) 0 (0.00) 38 (65.52)a
-CL +FD 43 1 (2.33) 0 (0.00) 9 (20.93) 1 (2.33) 32 (74.41)b
+CL -FD 57 0 (0.00) 0 (0.00) 6 (10.53) 0 (0.00) 51 (89.47)c
-CL -FD 53 0 (0.00) 0 (0.00) 13 (24.53) 0 (0.00) 40 (75.47)b
Description: +CL: CL present, -CL: CL absent CL, +FD DF present:, -FD: DF absent, GV: germinal vesicle, GVBD: germinal vesicle
breakdown, MI: metaphase I, AI-TI: anaphase I/telophase I, MII: metaphase II. Different superscript in the same column means significant
different (P<0.01).
Figure 2. Forming of pronucleus after in vitro fertilization process: A. one pronucleus, B. two pronucleuses, C. three pronucleuses
(the arrow).
Table 2. Fertilization level of bali cattle oocytes from ovarium with different reproduction status
Reproduction
status of ovary
The number
of oocyte
Forming of pronucleus Fertilization level (%)
0 PN (%) 1PN (%) 2 PN (%) ˃2 PN (%)
+CL +FD 47 3 (6.38) 17 (36.17) 14 (29.79) 13 (27.66) 27 (57.44)
-CL +FD 41 9 (21.95) 11 (26.83) 12 (29.27) 9 (21.95) 21 (51.21)
+CL –FD 58 22 (37.93) 17 (29.31) 10 (17.24) 9 (15.52) 19 (32.76)
-CL –FD 68 2 (2.94) 25 (36.76) 22 (32.35) 19 ( 27.94) 41 (60.29)
Description: PN: Pronucleus.
triphosphate mobilizing intracellular Ca2+ followed by
influx of extracellular Ca2+ (Ajduk et al. 2008). Influx
extracellular Ca2+ may inhibit adenylyl cyclase leading
to decrease of cAMP/PKA and also may activate
calmoduline-dependent protein kinase (CaM II kinase)
which will modify or activate the maturation promoting
factor (MPF) (Oh et al. 2010; Conti et al. 2012).
Brevini et al. (2007) reported that distribution of
organelle on the cytoplasm is closely related to the
oocyte maturation and competition. Consequently,
maturation of imperfect cytoplasm from the oocyte
reached MII stage was allegedly to lead to low success
of in vitro embryo production (Blanco et al. 2011).
CONCLUSION
The number of oocytes from ovarium of bali cattle
with corpus luteum (+CL) and and without dominant
follicle (–FD) reached metaphase-II stage (MII) was
higher compared to the oocytes from other ovarium
(+CL,+FD; -CL,+FD or -CD, -CD). However,
reproduction status of ovarium did not affect the
fertility level.
A B C
30 μm 30 μm 30 μm
JITV Vol. 22 No 4 Th. 2017: 173-178
178
REFERENCES
Abdoon AS, Gabler C, Holder C, Kandil OM, Einspanier R.
2014. Seasonal variations in developmental competence
and relative abundance of gene transcripts in buffalo
(Bubalus bubalis) oocytes. Theriogenology 82:1055-
1067.
Ajduk A, Małagocki A, Maleszewski M. 2008. Cytoplasmic
maturation of mammalian oocytes: development of a
mechanism responsible for sperm-induced Ca2+
oscillations. Reprod Biol. 8:3-22.
Bijttebier J, Van Soom A, Meyer E, Mateusen B, Maes D.
2008. Preovulatory follicular fluid during in vitro
maturation decreases polyspermic fertilization of
cumulus-intact porcine oocytes in vitro maturation of
porcine oocytes. Theriogenology. 70:715–724.
Blanco MR, Demyda S, Moreno-Millán M, Genero E. 2011.
Developmental competence of in vivo and in vitro
matured oocytes: A review. Biotechnol Mol Biol Rev.
6:155-165.
Boediono A, Setiadi MA. 2006. Tingkat pematangan inti oosit
domba dari ovarium dengan status reproduksi dan
medium maturasi yang berbeda. Hayati J Biosci.
13:131-136.
Brevini TL, Cillo F, Antonini A, Gandolfi F. 2007.
Cytoplasmic remodeling and the acquisition of
developmental competence in pig oocytes. Anim
Reprod Sci. 98:23-38.
Campanile G, Baruselli PS, Neglia G, Vecchio D, Gasparrini
B, Gimenes LU, Zicarelli L, D’Occhio MJ. 2010.
Ovarian function in the buffalo and implications for
embryo development and assisted reproduction. Anim
Reprod Sci. 121:1-11.
Conti M, Hsieh M, Zamah AM, Oh JS. 2012. Novel signaling
mechanisms in the ovary during oocyte maturation and
ovulation. Mol Cell Endocrinol. 356:65-73.
Evans ACO. 2003. Ovarian follicle growth and consequences
for fertility in sheep. Anim Reprod Sci. 78:289-306.
Gonzalez-Bulnes A, Souza CJH, Campbell BK, Baird DT.
2004. Systemic and intraovarian effects of dominant
follicles on ovine follicular growth. Anim Reprod Sci.
84:107-119.
Hasbi H, Gustina S, Karja NWK, Supriatna I, Setiadi MA.
2017. Insulin-like growth factor-I concentration in the
follicular fluid of bali cattle and its role in the oocyte
nuclear maturation and fertilization rate. Media
Peternakan. 40:7-13.
Hegab AO, Montasser AE, Hamman AM, Abu El-Naga
EMA, Zaabel SM. 2009. Improving in vitro maturation
and cleavage rates of buffalo oocytes. Anim Reprod.
6:416-421.
Hennet ML, Combelles CMH. 2012. The antral follicle: a
microenvironment for oocyte differentiation. Int J Dev
Biol. 56:819-831
Kor NM. 2014. The effect of corpus luteum on hormonal
composition of follicular fluid from different sized
follicles and their relationship to serum concentration in
diary cows. Asian Pac J Trop Med. 7:S282-S288.
Oh JS, Han SJ, Conti M. 2010. Wee1B, Myt1, and Cdc25
function in distinct compartments of the mouse oocyte
to control meiotic resumption. J Cell Biol. 188:199-207.
Ooe M, Rajamahendran R, Boediono A, Suzuki T. 1997.
Ultrasound-guided follicle aspiration and IVF in dairy
cows treated with FSH after removal of estrous cycle. J
Vet Med Sci. 59:371-376.
Perera BM. 2011. Reproductive cycles of buffalo. Anim
Reprod Sci. 124:194-199.
Pinero-Sagredo E, Nunes S, Delossantos MJ, Celda B, Esteve
V. 2010. NMR metabolic profile of human follicular
fluid. NMR Biomedicine. 23:485-495.
Rahman ANMA, Abdullah RB, Wan Khadijah WE. 2008. In
vitro maturation of oocytes with special reference to
goat: A review. Biotechnology. 7:599-611.
Shirazi A, Sadeghi N. 2007. The effect of ovine oocyte
diameter on nuclear maturation. Small Rumin Res.
69:103-107.
Shirazi A, Shams-Esfandabadi, Hosseini SM, Karimi I. 2007.
The presence of cumulus cells on nuclear maturation of
sheep oocytes during in vitro maturation. Small Rumin
Res. 68:291-295.
Suzuki K, Eriksson B, Shimizu H, Nagai T, Rodrigues-
Martines H. 2000. Effect of hyaluronan on
monospermic penetration of porcine oocytes fertilized
in vitro. Int J Androl. 23:13-21.
Varishaga MD, Sumantri C, Murakami M, Fahrudin M,
Suzuki T. 1998. Morphology classification of the
ovaries in relation to the subsequent oocyte quality for
IVF produced bovine embryos. Theriogenology
50:1015-1023.
Vassena R, Mapletoft RJ, Stefano A, Singh J, Adams GP.
2003. Morphology and developmental competence of
bovine oocytes relative to follicular status.
Theriogenology. 60:923-932.
Puastuti et al. Supplementation of molasses and branched-chain amino acids to increase in vitro digestibility of ammoniated corn cob
179
Supplementation of Molasses and Branched-Chain Amino Acids to Increase
In Vitro Digestibility of Ammoniated Corn Cob in Ruminants Feed
Puastuti W1, Yulistiani D1, Handiwirawan E2
1Indonesian Research Institue of Animal Production, PO Box 221, Bogor 16002 2Indonesian Center for Animal Research and Development, Jalan Raya Pajajaran Kav. E-59 Bogor 16151
E-mail: [email protected]
(received: 23-10-2017; revised: 30-11-2017: accepted: 15-12-2017)
ABSTRAK
Puastuti W, Yulistiani D, Handiwirawan E. 2017. Suplementasi molases dan asam amino bercabang pada tongkol jagung
amoniasi sebagai pakan ruminansia untuk meningkatkan kecernaan in vitro. JITV 22(4): 179-187. DOI:
http://dx.doi.org/10.14334/jitv.v22i4.1664
Tongkol jagung memiliki kandungan serat kasar dan lignin yang tinggi sehingga menyebabkan kecernaan nutriennya rendah.
Penelitian bertujuan untuk meningkatkan kecernaan tongkol jagung (TJ) amoniasi melalui suplementasi molases dan asam
amino bercabang (BCAA) valin, leusin dan isoleusin. Tongkol jagung diolah dengan penambahan urea 3%. Uji in vitro tahap
pertama dilakukan dengan 4 taraf molases 0, 5, 10 dan 15% dari bahan kering (BK) TJ. Percobaan dilakukan dengan RAL 4
perlakuan yang diulang 4 kali. Uji in vitro tahap kedua, suplementasi valin = V, leusin = L dan isoleusin = I dengan taraf
masing-masing 0,1 dan 0,2% dari BK TJ amoniasi. Terdapat 8 perlakuan yaitu A = V0,1 L0,1 I0,1; E = V0,2 L0,1 I0,1; B = V0,1
L0,1 I0,2; F = V0,2 L0,1 I0,2; C = V0,1 L0,2 I0,1; G = V0,2 L0,2 I0,1; D = V0,1 L0,2 I0,2; H = V0,2 L0,2 I0,2 dan 1 kontrol
(V0,0 L0,0 I0,0). Percobaan dilakukan dengan RAL 9 perlakuan dan diulang 3 kali. Hasil percobaan menunjukkan bahwa
pengolahan TJ dengan urea mampu meningkatkan kadar protein sebesar 78% (3,34% menjadi 5,95%) sedangkan NDF menurun
sebesar >15,4%, ADF sebesar 7,9% dan lignin 16,7%. Nilai kecernaan BK TJ amoniasi meningkat (P<0,05) sebesar 7,5% (41,9
vs 43,51-46,26%) dan NDF sebesar 17,7% (38,41 vs 43,76-46,31%) karena tambahan molases. Suplementasi BCAA
menghasilkan kecernaan BK, BO dan NDF tertinggi (P<0,05) pada perlakuan A, C, D dan G. Kecernaan BK, BO dan NDF pada
perlakuan G dibandingkan dengan I masing-masing sebesar 31,4%, 27,5% dan 36,5% serta menghasilkan populasi bakteri total
rumen tertinggi sebesar 12,4 x 10⁹ koloni/ml. Dapat disimpulkan bahwa kecernaan TJ amoniasi meningkat melalui suplementasi
molases 5% dan kombinasi BCAA yang terdiri dari valin 0,2%, leusin 0,2% dan isoleusin 0,1%.
Kata Kunci: Tongkol Jagung, Amoniasi, Molases, Asam Amino Bercabang
ABSTRACT
Puastuti W, Yulistiani D, Handiwirawan E. 2017. Supplementation of molasses and branched-chain amino acid to increase in
vitro digestibility of ammoniated corn cob in ruminants feed. JITV 22(4): 179-187. DOI: http://dx.doi.org/10.14334/jitv.v22i4.1664
Corn cob contains high fiber and lignin which causes low nutritive value. The objective of the study was to improve the
digestibility of ammoniated corn cob (CC) by supplementation of molasses and branched-chain amino acid (BCAA: valine,
leucine and isoleucine). CC was processed by addition 3% urea. The first stage of in vitro test was done with 4 levels of molases
0, 5, 10 and 15% of dry matter (DM) of CC. The experiment was carried out using complete randomized design with 4
treatments and 4 replications. The second stage was also in vitro study of supplementation of two levels each for valine = V,
leucine = L and isoleucine = I namely 0.1 and 0.2% of DM of ammoniated CC. There were 8 treatments combination of the
BCAA as follow: A = V0.1 L0.1 I0.1; E = V0.2 L0.1 I0.1; B = V0.1 L0.1 I0.2; F = V0.2 L0.1 I0.2; C = V0.1 L0.2 I0.1; G =
V0.2 L0.2 I0.1; D = V0.1 L0.2 I0.2; H = V0.2 L0.2 I0.2 and 1 control (V0.0 L0.0 I0.0). The experiments were done using
completely randomized design with 9 treatments and 3 replications. The results showed that treated CC with urea was able to
increase protein content by 78% (increased from 3.34% to 5.95%) while neutral detergent fiber (NDF) decreased by 15.4%, acid
detergent fiber (ADF) by 7.9% and lignin 16.7%. Addition of molasses in ammoniated CC increased DM digestibility (P <0.05)
by 7.5% (41.9 vs 43.51-46.26%) and NDF by 17.7% (38.41 vs 43.76 – 46.31%). Supplementation of BCAA resulted in the
highest DM, OM and NDF digestibility (P <0.05) in the treatment of A, C, D and G. Compare to treament I, the digestibility of
DM, OM and NDF in G treatment increased by 31.4%, 27.5% and 36.5%, respectively and produced the highest total
population of rumen bacterial of 12.4 x 10⁹ colonies /ml. It can be concluded that the digestibility of ammoniated CC increased
by the supplementation of 5% molases and BCAA combination consisted of 0.2% valine, 0.2% leucine and 0.1% isoleucine.
Key Words: Corn Cob, Ammoniation, Molasses, Branched-Chain Amino Acid
JITV Vol. 22 No 4 Th. 2017: 179-187
180
INTRODUCTION
National production of corn grain in 2017 was
27.957 million tons (Pusdatin 2017). The potential of
corn cob availability calculated based on ratio of grain,
straw, husk and corn cob, was 55.0, 20.3 12.3 and
12.3%, respectively (Yulistiani et al. 2012). Corn cob
production in 2017 was 6.251 million tons. The
utilization of corn cob as feed was still limited. Some of
dry corn cob was used as fuel, while most leaves were
piled up and rotten in the field. Corn cob had low
nutrient quality due to low protein (1.5-3.5%), high
fiber (35-45%) high lignin (5.2%), and high cellulose
(30%) contents (Yulistiani et al. 2012; Hastuti et al.
2011). Lignin in corn cob caused low nutrient
availability and low dry matter digestibility (45.5%) and
organic matter digestibility (42.5%) (Yulistiani et al.
2012). Lower digestibility (29.34%) was also reported
by Setyadi et al (2013).
To increase the nutrient quality of fibrous feed,
many processing methods have been done such as
physical, chemical and biological or combination of
these methods. Those treatments were reported able to
increase the utilization and digestibility of agricultural
by-products feedstuff (Van Soest 2006; Zain et al.
2010; Nurhaita 2010).
Physical treatment by grinding resulted in easier
feed handling and for consumption, however it did not
significantly increase feed digestibility. Increasing
quality of roughage was reported by using chemical
treatment of sodium hyadroxide (Adeniji 2010) or urea
(Oji et al. 2007; Dean et al. 2008; Yalchi et al. 2009;
Puastuti et al. 2010; Yulistiani et al. 2012, Ubwa et al.
2014). Urea treatment on rice straw was able to increase
nutrient content increasing animal growth through
improving rice straw palatability (Huyen et al. 2012),
increased nutrient digestibility in dairy cattle (Wanapat
et al. 2009) and increased NDF and ADF digestibility in
goat and bull (Gunun et al. 2013). The increased of
nutrient content and digestibility due to urea treatment
was also reported in Triticale straw (Yalchi et al. 2009),
cacao pod (Puastuti et al. 2010; Laconi & Jayanegara
2015), corn cob (Yulistiani et al. 2012), oil palm frond
(Febrina 2012) and rice husk (Ubwa et al. (2014). The
mechanism of urea treatment in improving nutrient
content of low quality feed is through hemicellulose
solubilization, swollen of plant cell wall and disruption
of lignin and cellulose linkage (Yalchi et al. 2009).
Consequently the digestibility of cellulose and
hemicellulose was increased. This increased
digestibility was not followed by the loss of lignin (Bata
2008). Differed to biological treatment, urea treatment
in low quality feed is simple and applicative for small
holder farmers.
The nutritive value of fibrous feed beside affected
by processing method also affected by enzymatic
digestion produced by rumen microbes. Various rumen
microbes have important role in digesting feed in the
rumen. Beside that rumen microbes also be used as
protein source in ruminant. Rumen microbes at least
supplied two third or 70-80% of amino acid required by
ruminants (Chumpawadee et al. 2006; Pathak 2008).
The higher rumen microbes population particularly
cellulolytic bacteria produced more enzyme
consequently increased fiber digestibility. Feeding low
quality feeds with low protein and high fiber contents
would limit its nutrient availability for microbial.
(Puastuti 2009; Nurhaita & Ningrat 2011).
Fermentable energy source (sugar, starch) was
needed for the growth of rumen microbials. Molases
was fermentable source of carbohydrate and could be
used as energy source for rumen microbes (Bata 2008).
Amino acid was main nitrogen source for microbial
synthesis in the rumen. Although cellulolytic rumen
microbial was able to use ammonia, but amino acid and
protein had better advantage compared to urea for
microbial synthesis (McAllen & Smith 1983; Clark et
al. 1992). High degradable protein will be fast degraded
by rumen microbes in the rumen into amino acid and
partly will be further degraded and produced ammonia.
This ammonia is used as nitrogen source and as carbon
skeleton source for rumen microbial synthesis.
Therefore amino acid composition of feed protein is
important for ruminant animals. Methionin, lysine,
fenylalanin and threonine were amino acid needed by
ruminants (Scholljegerdes et al. 2005). Other amino
acid also needed by ruminants were valin, isoleusin, dan
leusin (Volden 1999; Zain 2007). These three amino
acids were known as branched chain amino acid
(BCAA) in the rumen which would be decarboxylated
and oxidative deaminated into branched-chain volatile
fatty acid (BCVFA) which had important role in the
activity of cellulolytic bacteria (Tedeschi et al. 2015).
BCVFA could increase dry matter digestibility, increase
rumen microbial growth and increase microbial
function and enzyme activity in the rumen of sheep
(Moharrery 2004). Considering results from the
previous studies, this study was aimed to increase
ammoniated corn cob digestibility through
supplementation of molasses and combination of
branch-chain amino acid valin, leusin, and isoleusin.
MATERIALS AND METHODS
Corn cob was obtained from Majalengka District,
West Java Province. The cob was ground, then
processed using ammoniation by urea addition at 3% of
cob dry matter (DM) (Yulistiani et al. 2012). Corn cob
and urea mixture was then kept anaerobically condition
for 21 days. Ammoniated corn cob then dried and
ground for chemical analysis and evaluated for its in
vitro digestibility. First in vitro digestibility study was
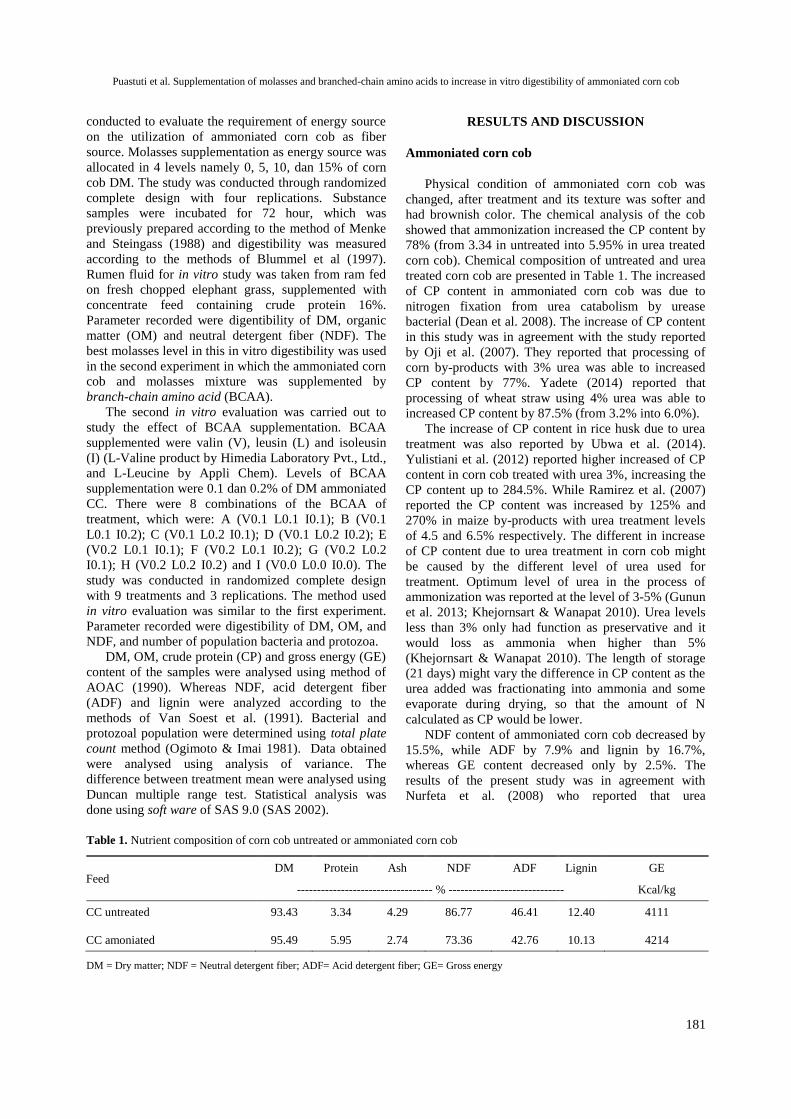
Puastuti et al. Supplementation of molasses and branched-chain amino acids to increase in vitro digestibility of ammoniated corn cob
181
conducted to evaluate the requirement of energy source
on the utilization of ammoniated corn cob as fiber
source. Molasses supplementation as energy source was
allocated in 4 levels namely 0, 5, 10, dan 15% of corn
cob DM. The study was conducted through randomized
complete design with four replications. Substance
samples were incubated for 72 hour, which was
previously prepared according to the method of Menke
and Steingass (1988) and digestibility was measured
according to the methods of Blummel et al (1997).
Rumen fluid for in vitro study was taken from ram fed
on fresh chopped elephant grass, supplemented with
concentrate feed containing crude protein 16%.
Parameter recorded were digentibility of DM, organic
matter (OM) and neutral detergent fiber (NDF). The
best molasses level in this in vitro digestibility was used
in the second experiment in which the ammoniated corn
cob and molasses mixture was supplemented by
branch-chain amino acid (BCAA).
The second in vitro evaluation was carried out to
study the effect of BCAA supplementation. BCAA
supplemented were valin (V), leusin (L) and isoleusin
(I) (L-Valine product by Himedia Laboratory Pvt., Ltd.,
and L-Leucine by Appli Chem). Levels of BCAA
supplementation were 0.1 dan 0.2% of DM ammoniated
CC. There were 8 combinations of the BCAA of
treatment, which were: A (V0.1 L0.1 I0.1); B (V0.1
L0.1 I0.2); C (V0.1 L0.2 I0.1); D (V0.1 L0.2 I0.2); E
(V0.2 L0.1 I0.1); F (V0.2 L0.1 I0.2); G (V0.2 L0.2
I0.1); H (V0.2 L0.2 I0.2) and I (V0.0 L0.0 I0.0). The
study was conducted in randomized complete design
with 9 treatments and 3 replications. The method used
in vitro evaluation was similar to the first experiment.
Parameter recorded were digestibility of DM, OM, and
NDF, and number of population bacteria and protozoa.
DM, OM, crude protein (CP) and gross energy (GE)
content of the samples were analysed using method of
AOAC (1990). Whereas NDF, acid detergent fiber
(ADF) and lignin were analyzed according to the
methods of Van Soest et al. (1991). Bacterial and
protozoal population were determined using total plate
count method (Ogimoto & Imai 1981). Data obtained
were analysed using analysis of variance. The
difference between treatment mean were analysed using
Duncan multiple range test. Statistical analysis was
done using soft ware of SAS 9.0 (SAS 2002).
RESULTS AND DISCUSSION
Ammoniated corn cob
Physical condition of ammoniated corn cob was
changed, after treatment and its texture was softer and
had brownish color. The chemical analysis of the cob
showed that ammonization increased the CP content by
78% (from 3.34 in untreated into 5.95% in urea treated
corn cob). Chemical composition of untreated and urea
treated corn cob are presented in Table 1. The increased
of CP content in ammoniated corn cob was due to
nitrogen fixation from urea catabolism by urease
bacterial (Dean et al. 2008). The increase of CP content
in this study was in agreement with the study reported
by Oji et al. (2007). They reported that processing of
corn by-products with 3% urea was able to increased
CP content by 77%. Yadete (2014) reported that
processing of wheat straw using 4% urea was able to
increased CP content by 87.5% (from 3.2% into 6.0%).
The increase of CP content in rice husk due to urea
treatment was also reported by Ubwa et al. (2014).
Yulistiani et al. (2012) reported higher increased of CP
content in corn cob treated with urea 3%, increasing the
CP content up to 284.5%. While Ramirez et al. (2007)
reported the CP content was increased by 125% and
270% in maize by-products with urea treatment levels
of 4.5 and 6.5% respectively. The different in increase
of CP content due to urea treatment in corn cob might
be caused by the different level of urea used for
treatment. Optimum level of urea in the process of
ammonization was reported at the level of 3-5% (Gunun
et al. 2013; Khejornsart & Wanapat 2010). Urea levels
less than 3% only had function as preservative and it
would loss as ammonia when higher than 5%
(Khejornsart & Wanapat 2010). The length of storage
(21 days) might vary the difference in CP content as the
urea added was fractionating into ammonia and some
evaporate during drying, so that the amount of N
calculated as CP would be lower.
NDF content of ammoniated corn cob decreased by
15.5%, while ADF by 7.9% and lignin by 16.7%,
whereas GE content decreased only by 2.5%. The
results of the present study was in agreement with
Nurfeta et al. (2008) who reported that urea
Table 1. Nutrient composition of corn cob untreated or ammoniated corn cob
Feed DM Protein Ash NDF ADF Lignin GE
---------------------------------- % ----------------------------- Kcal/kg
CC untreated 93.43 3.34 4.29 86.77 46.41 12.40 4111
CC amoniated 95.49 5.95 2.74 73.36 42.76 10.13 4214
DM = Dry matter; NDF = Neutral detergent fiber; ADF= Acid detergent fiber; GE= Gross energy

JITV Vol. 22 No 4 Th. 2017: 179-187
182
treatment in wheat straw reduced NDF content.
Chemical treatment by urea addition cause disruption
the linkage between cell wall component particularly
linkage between lignin and cellulose or hemicellulose
so that digestibility by enzymatic become easier.
Previously Sumarsih et al. (2007); Mapato et al. (2010)
stated that ammonia treatment increased digestibility by
lossen lignocellulose bound consequently carbohydrate
digestibility increased. Beside that urea treatment also
increased feed palatability. The increase of digestibility
in urea treated in rice straw caused the increase in feed
consumption (Hailu et al. 2011)
Effect of molasses supplementation on digestibility
of ammoniated corn cob
Different levels of molasses supplementation
significantly (P<0.05) affected DM, OM and NDF
digestibility. Nutrient digestibility of ammoniated corn
cob supplemented by molasses is presented in Table 2.
Digestibility evaluation of DM, OM and NDF of
ammoniated CC with molasses addition as energy
source, was significantly different (P<0.05) among
levels of molasses supplementation. Digestibility value
of ammoniated CC supplemented by molasses
presented in Table 2.
Result from Duncan analysis showed that molassess
supplementation up to 5% was not able to increased
DM and OM digestibility. The digestibility was
increased (P<0.05) at 10 and 15% molasses
supplementation compare to control (without molasses
supplementation). The NDF digestibility was increased
(P<0.05) at 5% molasses supplementation compared to
control, but this was not significantly different from 10
and 15% supplementation. DM digestibility of 41.9% of
ammoniated CC in this study was similar to the results
reported by Prastyawan et al. (2012). Who reported that
fermented ammoniated corn cob without starter
microbes for 4 weeks incubation resulted in DM
digestibility of 41.3%. The value was higher than
reported by Setyadi et al. (2013) which was 29.34%.
Compared to control, the average incrase in DM
digestibility due to molasses supplementation was 9.2%
(41.9 vs 43.51-46.26%), whereas the incrase in NDF
digestibility was 17.7% (38.41 vs 43.76-46.31%) (Table
2). The increase digestiility with the increase of urea
treatment could be due to urea treatment producing
nitrogen in the form of NH3. Similar results was also
reported on nitrogen supplementation in rice straw
which was able to improve deficiency of CP content,
consequently the straw digestibility was increased due
to the ammonia (NH3) availability which was needed
for the activity of rumen microbial for the fermentation
of feed (Wanapat et al. 2009). Microbial protein
synthesis required NPN and carbohydrate source from
feed (Al Qori’ah et al. 2016). Therefore, the high
potential of ammonia had to be synchronized with
availability of fermentable energy. Ammoniated feed
which directly fed to ruminants will result in
imbalanced N caused by high N degradation but lack of
fermentable carbohydrate and consequently more N
release which in turn caused low feed digestibility.
Therefore this feed should be balanced with
fermentable carbohydrate which will optimize rumen
microbial activity. The available fermentable
carbohydrate ammonia will be converted into protein
microbial and stimulate multiplication of rumen
microbial, which will be able to increase feed
digestibility (Bata 2008).
The increase of rumen microbial population which
produces more enzymes resulted in the increased feed
digestibility. Therefore in the present study
ammoniated corn cob as feed supplemented with
fermentable carbohydrate such as molasses which was
expected to be able to optimize the activity of rumen
microbial through the available N in the form of
ammonia and energy which needed for rumen microbial
multiplication and optimizing microbial activity in
Table 2. Effect of molasses supplementation on nutrient digestibility of ammoniated corn cob
Molasses levels Digestibility
Dry Matter Organic Matter Neutral Detergent Fiber
-------------------------%--------------------
0% 41.90±1.02b 43.19±0.95b 38.41±1.07b
5% 43.51±0.77ab 44.84±0.94ab 43.76±1.50a
10% 45.30±2.00a 46.56±1.98a 45.53±1.63a
15% 46.26±2.57a 47.35±2.60a 46.31±3.35a
Values in same column with different superscripts indicates significantly different (P<0.05)
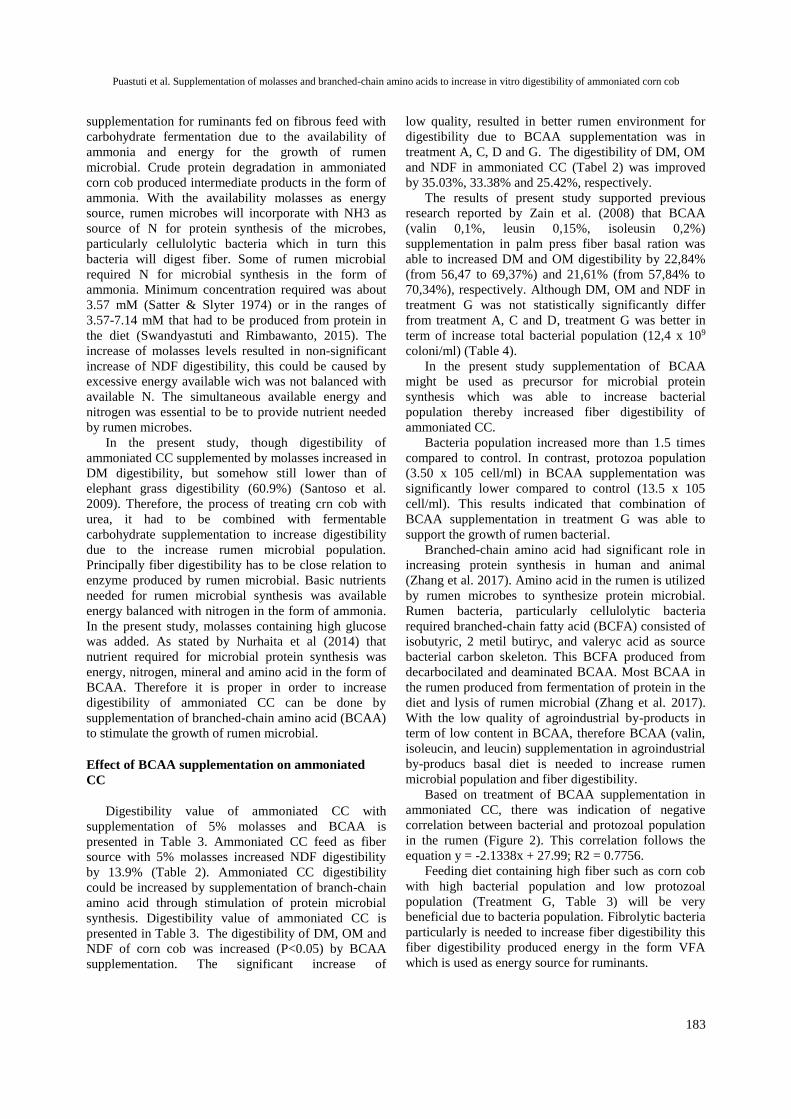
Puastuti et al. Supplementation of molasses and branched-chain amino acids to increase in vitro digestibility of ammoniated corn cob
183
supplementation for ruminants fed on fibrous feed with low quality, resulted in better rumen environment for
carbohydrate fermentation due to the availability of
ammonia and energy for the growth of rumen
microbial. Crude protein degradation in ammoniated
corn cob produced intermediate products in the form of
ammonia. With the availability molasses as energy
source, rumen microbes will incorporate with NH3 as
source of N for protein synthesis of the microbes,
particularly cellulolytic bacteria which in turn this
bacteria will digest fiber. Some of rumen microbial
required N for microbial synthesis in the form of
ammonia. Minimum concentration required was about
3.57 mM (Satter & Slyter 1974) or in the ranges of
3.57-7.14 mM that had to be produced from protein in
the diet (Swandyastuti and Rimbawanto, 2015). The
increase of molasses levels resulted in non-significant
increase of NDF digestibility, this could be caused by
excessive energy available wich was not balanced with
available N. The simultaneous available energy and
nitrogen was essential to be to provide nutrient needed
by rumen microbes.
In the present study, though digestibility of
ammoniated CC supplemented by molasses increased in
DM digestibility, but somehow still lower than of
elephant grass digestibility (60.9%) (Santoso et al.
2009). Therefore, the process of treating crn cob with
urea, it had to be combined with fermentable
carbohydrate supplementation to increase digestibility
due to the increase rumen microbial population.
Principally fiber digestibility has to be close relation to
enzyme produced by rumen microbial. Basic nutrients
needed for rumen microbial synthesis was available
energy balanced with nitrogen in the form of ammonia.
In the present study, molasses containing high glucose
was added. As stated by Nurhaita et al (2014) that
nutrient required for microbial protein synthesis was
energy, nitrogen, mineral and amino acid in the form of
BCAA. Therefore it is proper in order to increase
digestibility of ammoniated CC can be done by
supplementation of branched-chain amino acid (BCAA)
to stimulate the growth of rumen microbial.
Effect of BCAA supplementation on ammoniated
CC
Digestibility value of ammoniated CC with
supplementation of 5% molasses and BCAA is
presented in Table 3. Ammoniated CC feed as fiber
source with 5% molasses increased NDF digestibility
by 13.9% (Table 2). Ammoniated CC digestibility
could be increased by supplementation of branch-chain
amino acid through stimulation of protein microbial
synthesis. Digestibility value of ammoniated CC is
presented in Table 3. The digestibility of DM, OM and
NDF of corn cob was increased (P<0.05) by BCAA
supplementation. The significant increase of
digestibility due to BCAA supplementation was in
treatment A, C, D and G. The digestibility of DM, OM
and NDF in ammoniated CC (Tabel 2) was improved
by 35.03%, 33.38% and 25.42%, respectively.
The results of present study supported previous
research reported by Zain et al. (2008) that BCAA
(valin 0,1%, leusin 0,15%, isoleusin 0,2%)
supplementation in palm press fiber basal ration was
able to increased DM and OM digestibility by 22,84%
(from 56,47 to 69,37%) and 21,61% (from 57,84% to
70,34%), respectively. Although DM, OM and NDF in
treatment G was not statistically significantly differ
from treatment A, C and D, treatment G was better in
term of increase total bacterial population (12,4 x 10⁹
coloni/ml) (Table 4).
In the present study supplementation of BCAA
might be used as precursor for microbial protein
synthesis which was able to increase bacterial
population thereby increased fiber digestibility of
ammoniated CC.
Bacteria population increased more than 1.5 times
compared to control. In contrast, protozoa population
(3.50 x 10⁵ cell/ml) in BCAA supplementation was
significantly lower compared to control (13.5 x 10⁵
cell/ml). This results indicated that combination of
BCAA supplementation in treatment G was able to
support the growth of rumen bacterial.
Branched-chain amino acid had significant role in
increasing protein synthesis in human and animal
(Zhang et al. 2017). Amino acid in the rumen is utilized
by rumen microbes to synthesize protein microbial.
Rumen bacteria, particularly cellulolytic bacteria
required branched-chain fatty acid (BCFA) consisted of
isobutyric, 2 metil butiryc, and valeryc acid as source
bacterial carbon skeleton. This BCFA produced from
decarbocilated and deaminated BCAA. Most BCAA in
the rumen produced from fermentation of protein in the
diet and lysis of rumen microbial (Zhang et al. 2017).
With the low quality of agroindustrial by-products in
term of low content in BCAA, therefore BCAA (valin,
isoleucin, and leucin) supplementation in agroindustrial
by-producs basal diet is needed to increase rumen
microbial population and fiber digestibility.
Based on treatment of BCAA supplementation in
ammoniated CC, there was indication of negative
correlation between bacterial and protozoal population
in the rumen (Figure 2). This correlation follows the
equation y = -2.1338x + 27.99; R2 = 0.7756.
Feeding diet containing high fiber such as corn cob
with high bacterial population and low protozoal
population (Treatment G, Table 3) will be very
beneficial due to bacteria population. Fibrolytic bacteria
particularly is needed to increase fiber digestibility this
fiber digestibility produced energy in the form VFA
which is used as energy source for ruminants.
JITV Vol. 22 No 4 Th. 2017: 179-187
184
Table 3. Effect of combination of BCAA valin, leusin and isoleusin supplementation on ammoniated corn cob (CC) digestibility
Treatments
Digestibility
DM OM NDF
------------------------------ % -------------------------
A 59.54±0.37a 59.67±0.38a 55.85±2.18a
B 55.76±1.42ab 57.28±1.48ab 51.84±1.31ab
C 58.88±1.48a 60.24±1.54a 55.19±1.37a
D 58.51±2.3a 59.84±2.41a 54.30±2.12a
E 52.85±0.60ab 54.57±0.91ab 49.07±0.91ab
F 51.54±2.75ab 53.72±2.86ab 47.22±2.53ab
G 58.06±2.19a 59.49±2.35a 54.19±1.99a
H 51.10±3.51ab 53.71±3.69ab 45.33±3.22ab
I 44.18±6.47b 46.67±6.36b 39.70±6.13b
DM = Dry matter; OM = Organic matter; NDF = Neutral detergent fiber A = (V 0.1, L 0.1 I 0.1); B = (V 0.1, L 0.1, I 0.2); C = (V 0.1, L 0.2); D = (V 0.1, L 0.2, I 0.2); I 0.1); E = (V 0.2, L 0.1, I 0.1)
F = (V 0.2, L 0.1, I 0.2); G = (V 0.2, L 0.2, I 0.1); H = (V 0.2, L 0.2, I 0.2); I (control)= (V 0.0, L 0.0, I 0.0).
Values in same column with different superscripts indicates significantly different (P<0.05).
Table 4. Effect of combination of valin, leusin and isoleusin supplementation in ammoniated CC on rumen microbial population
Treatments Bacteria (10^9 col/ml) Protozoa (10^6 cell/ml)
A 2.80±0.14f 2.58±0.12a
B 6.98±0.60c 1.70±0.10c
C 3.87±0.12e 2.23±0.03b
D 6.06±0.56d 1.27±0.11d
E 7.46±0.83c 0.85±0.15e
F 10.11±0.08b 0.55±0.05f
G 12.40±1.1a 0.50±0.05g
H 7.12±0.73dc 1.20±0.05d
I 4.63±0.38e 1.35±0.05d
DM = dry matter; OM = Organic matter; NDF = Neutral detergent fiber, A = (V 0.1, L 0.1 I 0.1); B = (V 0.1, L 0.1, I 0.2); C = (V 0.1, L 0.2); D = (V 0.1, L 0.2, I 0.2); I 0.1); E = (V 0.2, L 0.1, I 0.1)
F = (V 0.2, L 0.1, I 0.2); G = (V 0.2, L 0.2, I 0.1); H = (V 0.2, L 0.2, I 0.2) I (control)= (V 0.0, L 0.0, I 0.0).
Values in same column with different superscripts indicates significantly different (P<0.05) .
Nutrition needed by protozoa is protein and
fermentable energy in the form of starch or sugar, on
the other hand corn cob contain carbohydrate mostly in
the form of fiber this condition retarded the growth of
protozoa. Mustofa et al. (2012) reported that
fermentation of ammoniated CC which was processed
using commercial starter produced 113 mM VFA,
increased cellulolytic microbial population increased
VFA production as energy source for livestock. The
amount of supply protein from microbial biomass into
small intestine could be up to 50‐80% from total
absorbed protein (Bach et al. 2005). Treatment G (V
0.2, L 0.2, I 0.1) produced highest bacterial population
among four BCAA combination. Fibrous fermented
bacterial such as Ruminococcus albus, Ruminococcus
flavefaciens, Fibrobacter succinogenes, and Butyrivibio
fibrisolvents required branched-chain fatty acid (BCFA)
such as isobutyric, isovaleric, valeric, and 2-
methylbutyric acids for their growth (Zhang et al.
2013). BCFA could be obtained from feed protein or
recycled of rumen bacterial protein through oxidative
deamination and decarboxylation from valin, leucin,
and isoleucin (Moharrery 2004). The best BCAA
combination in the present study was different to the
study reported by Zain et al. (2008).
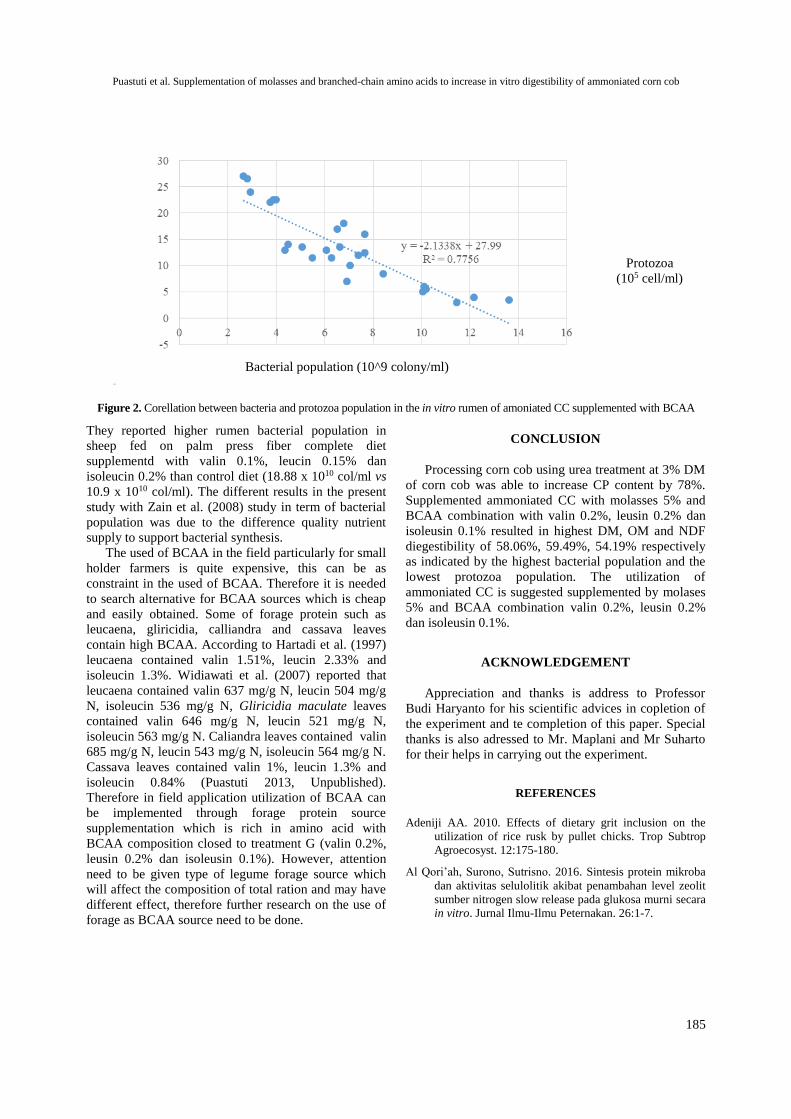
Puastuti et al. Supplementation of molasses and branched-chain amino acids to increase in vitro digestibility of ammoniated corn cob
185
Figure 2. Corellation between bacteria and protozoa population in the in vitro rumen of amoniated CC supplemented with BCAA
They reported higher rumen bacterial population in
sheep fed on palm press fiber complete diet
supplementd with valin 0.1%, leucin 0.15% dan
isoleucin 0.2% than control diet (18.88 x 10¹⁰ col/ml vs
10.9 x 10¹⁰ col/ml). The different results in the present
study with Zain et al. (2008) study in term of bacterial
population was due to the difference quality nutrient
supply to support bacterial synthesis.
The used of BCAA in the field particularly for small
holder farmers is quite expensive, this can be as
constraint in the used of BCAA. Therefore it is needed
to search alternative for BCAA sources which is cheap
and easily obtained. Some of forage protein such as
leucaena, gliricidia, calliandra and cassava leaves
contain high BCAA. According to Hartadi et al. (1997)
leucaena contained valin 1.51%, leucin 2.33% and
isoleucin 1.3%. Widiawati et al. (2007) reported that
leucaena contained valin 637 mg/g N, leucin 504 mg/g
N, isoleucin 536 mg/g N, Gliricidia maculate leaves
contained valin 646 mg/g N, leucin 521 mg/g N,
isoleucin 563 mg/g N. Caliandra leaves contained valin
685 mg/g N, leucin 543 mg/g N, isoleucin 564 mg/g N.
Cassava leaves contained valin 1%, leucin 1.3% and
isoleucin 0.84% (Puastuti 2013, Unpublished).
Therefore in field application utilization of BCAA can
be implemented through forage protein source
supplementation which is rich in amino acid with
BCAA composition closed to treatment G (valin 0.2%,
leusin 0.2% dan isoleusin 0.1%). However, attention
need to be given type of legume forage source which
will affect the composition of total ration and may have
different effect, therefore further research on the use of
forage as BCAA source need to be done.
CONCLUSION
Processing corn cob using urea treatment at 3% DM
of corn cob was able to increase CP content by 78%.
Supplemented ammoniated CC with molasses 5% and
BCAA combination with valin 0.2%, leusin 0.2% dan
isoleusin 0.1% resulted in highest DM, OM and NDF
diegestibility of 58.06%, 59.49%, 54.19% respectively
as indicated by the highest bacterial population and the
lowest protozoa population. The utilization of
ammoniated CC is suggested supplemented by molases
5% and BCAA combination valin 0.2%, leusin 0.2%
dan isoleusin 0.1%.
ACKNOWLEDGEMENT
Appreciation and thanks is address to Professor
Budi Haryanto for his scientific advices in copletion of
the experiment and te completion of this paper. Special
thanks is also adressed to Mr. Maplani and Mr Suharto
for their helps in carrying out the experiment.
REFERENCES
Adeniji AA. 2010. Effects of dietary grit inclusion on the
utilization of rice rusk by pullet chicks. Trop Subtrop
Agroecosyst. 12:175-180.
Al Qori’ah, Surono, Sutrisno. 2016. Sintesis protein mikroba
dan aktivitas selulolitik akibat penambahan level zeolit
sumber nitrogen slow release pada glukosa murni secara
in vitro. Jurnal Ilmu-Ilmu Peternakan. 26:1-7.
Protozoa
(105 cell/ml)
Bacterial population (10^9 colony/ml)
JITV Vol. 22 No 4 Th. 2017: 179-187
186
Alam MK, Ogata Y, Sato Y, Sano H. 2016. Effects of rice
straw supplemented with urea and molasses on
intermediary metabolism of plasma glucose and leucine
in sheep. Asian Australas J Anim Sci. 29:523-529.
[AOAC] Association of Official Analytical Chemist. 1990.
Association of Official Analytical Chemist, Official
Method of Analysis. 12th ed. AOAC.
Bach A, Calsamiglia S, Stern MD. 2005. Nitrogen metabolism
in the rumen. J Dairy Sci. 88:E9‐E21.
Bata M. 2008. Pengaruh molases pada amoniasi jerami padi
menggunakan urea terhadap kecernaan bahan kering
dan bahan organik in vitro. Agripet. 8:15-20.
Blummel M, Steingass H, Becker K. 1997. The relationship
between in vitro gas production, in vitromicrobial
biomass yield and 15N incorporation and itsimplications
for the prediction of voluntary feed intake of roughages.
Br J Nutr. 77:911-921.
Chumpawadee S, Sommart K, Vongpralub T, Pattarajinda V.
2006. Effects of synchronizing the rate of dietary energy
and nitrogen release on ruminal fermentation, nitrogen
and nutrient digestibility in beef cattle. Asian-Australas
J Anim Sci. 19:181-188.
Clark JH, Klusmeyer TH, Cameron MR. 1992. Microbial
protein synthesis and flows of nitrogen fractions to the
duodenum of dairy cows. J Dairy Sci. 75:2304-2323.
Dean DB, Adesogan AT, Krueger NA, Little RC. 2008. Effect
of treatment with ammonia or fibrolytic enzymes on
chemical composition and ruminal degradability of hays
produces from tropical grasses. Anim Feed Sci Technol.
145:68-83.
Febrina D. 2012. Kecernaan ransum sapi Peranakan Ongole
berbasis limbah perkebunan kelapa sawit yang
diamoniasi urea. Jurnal Peternakan. 9:68-74.
Gunun P, Wanapat M, Anantasook N. 2013. Effects of
physical form and urea treatment of rice straw on rumen
fermentation, microbial protein synthesis and nutrient
digestibility in dairy steers. Asian-Australas J Anim Sci.
26:1689-1697.
Hartadi H, Reksohadiprodjo S, Tillman AD. 1997. Tabel
komposisi pakan untuk Indonesia. Cetakan Kedua.
Yogyakarta (Indones): Gadjah Mada University Press.
Hastuti D, Shofia Nur A, Iskandar Muda B. 2011. Pengaruh
perlakuan teknologi amofer (amoniasi fermentasi) pada
limbah tongkol jagung sebagai alternatif pakan
berkualitas ternak ruminansia. Mediagro. 7:55-65.
Hailu A, Melaku S, Tamir B, Tassew A. 2011. Body weight
and carcass characteristics of Washera sheep fed urea
treated rice straw supplemented with graded levels of
concentrate mix. Livest Res Rural Develop. Vol. 23
Article 164. http://www.lrrd.org/lrrd23/8/hail23164.
htm.
Huyen NT, Wanapat M, Navanukraw C. 2012. Effect of
mulberry leaf pellet (MUP) supplementation on rumen
fermentation and nutrient digestibility in beef cattle fed
on rice straw-based diets. Anim. Feed Sci. Technol.
175:8-15.
Khejornsart P, Wanapat M. 2010. Effect of chemical
treatment of rice straw on rumen fermentation
characteristic, anaerobic fungal diversity in vitro. J
Anim Vet Adv. 9:3070-3076.
Laconi EB, Jayanegara A. 2015. Improving nutritional quality
of cocoa pod (Theobroma cacao) through chemical and
biological treatments for ruminant feeding: In vitro and
in vivo evaluation. Asian-Australas J Anim Sci.
28:343–350.
Mapato C, Wanapat M, Cherdthong A. 2010. Effect of urea
treatment of straw and dietary level of vegetable oil on
lactating dairy cows. Trop Anim Health Prod. 42:1635-
1642.
McAllen AB, Smith RH. 1983. Factor influencing the
digestion of dietary carbohydrat between the mouth and
abomasum of steers. Br J Nutr. 50:445.
Menke KH, Steingass H. 1988. Estimation of the energetic
feed value obtained from chemical analysis and in vitro
gas production using rumen fluid. Anim Res Dev. 28:7-
55.
Moharrery A. 2004. Effect of isoacids on some rumen
enzymes. J Anim Feed Sci. 13:159-162.
Mustofa Z, Tampoebolon BIM; Subrata A. 2012. Peningkatan
kualitas tongkol jagung teramoniasi melalui teknologi
fermentasi menggunakan starter komersial terhadap
produksi VFA dan NH3 rumen secara in vitro. Anim
Agric J. 1:599-609.
Nurfeta A, Tolera A, Eik LO, Sundstol F. 2008. Feeding value
of enset (Ensete ventricosum), Desmodium intortum
hay and untreated or urea and calsium oxide treated
wheat straw for sheep. J Anim Physiol Anim Nutr
93:94-104.
Nurhaita, Ningrat RWS. 2011. Efek suplementasi daun ubi
kayu terhadap kecernaan daun sawit amoniasi secara in
vitro. Jurnal Peternakan Indones. 13:43-47.
Nurhaita N, Jamarun L, Warly, Zain M. 2010. Kecernaan
ransum domba berbasis daun sawit teramoniasi yang
disuplementasi sulfur, fosfor, dan daun ubi kayu. Media
Peternakan, 2010:144-149.
Nurhaita, Ruswendi, R Wismalinda, Robiyanto. 2014.
Optimizing rumen bioprocess through supplementation
of microbe precursor nutrient in ammoniation of palm
oil frond-base cattle ration. J Adv Agric Technol. 1:10-
13.
Ogimoto K, Imai S. 1981. Atlas of rumen microbiology.
JSSP. Tokyo.
Oji UI, Etim HE, Okoye FC. 2007. Effects of urea and
aqueous ammonia treatment on the composition and
nutritive value of maize residues. Small Rumin Res.
69:232-236.
Pathak AK. 2008. Various factors affecting microbial protein
synthesis in the rumen. Vet World. 1:186-189.

Puastuti et al. Supplementation of molasses and branched-chain amino acids to increase in vitro digestibility of ammoniated corn cob
187
Prastyawan RM, Tampoebolon BIM, Surono. 2012.
Peningkatan kualitas tongkol jagung melalui teknologi
amoniasi fermentasi (amofer) terhadap kecernaan bahan
kering dan bahan organik serta protein total secara in
vitro. Anim Agric J. 1:611-621.
Puastuti W, Yulistiani D, Mathius IW, Giyai F, Dihansih E.
2010. Ransum berbasis kulit buah kakao yang
disuplementasi Zn organik: Respon pertumbuhan pada
domba. JITV. 16:269-277.
Puastuti W. 2009. Manipulasi bioproses dalam rumen untuk
meningkatkan penggunaan pakan berserat. Wartazoa.
19:180-190.
Ramirez GR, Aguilera-Gonzalez JC, Garcia-Diaz G, Nunez-
Gonzalez AM. 2007. Effect of urea treatment on
chemical composition and digestion of Cenchrus ciliaris
and Cynodon dactylon hays and Zea mays residues. J
Anim Vet Adv. 6:1036-1041.
SAS Institute. 2002. The SAS System for Windows. Release
Version 9.0. Cary. NC (USA): SAS Inst.
Santoso B, Hariadi BTj, Manik H, Abubakar H. 2009.
Kualitas rumput unggul tropika hasil ensilase dengan
bakteri asam laktat dari ekstrak rumput terfermentasi.
Media Peternakan. 32:137-144.
Satter LD, Slyter LL. 1974. Effect of ammonia concentration
of rumen microbial protein production in vitro. Br J
Nutr. 32:199-208.
Scholljegerdes EJ, Weston TR, Ludden PA, Hess BW. 2005.
Supplementing a ruminally undegradable protein
supplement to maintain essential amino acid supply to
the small intestine when forage intake is restricted in
beef cattle. J Anim Sci. 83:2151‐2161.
Setyadi JH, Tri Rahardjo, Suparwi. 2013. Kecernaan bahan
kering dan bahan organik tongkol jagung (Zea mays)
yang difermentasi dengan aspergillus niger secara in
vitro. Jurnal Ilmiah Peternakan. 1:170-175.
Sumarsih S, Sutrisno CI, Pangestu E. 2007. Kualitas nutrisi
dan kecernaan daun eceng gondok amoniasi yang
difermentasi dengan Trichoderma viride pada berbagai
lama pemeraman secara in vitro. J Indones Trop Anim
Agric. 32:257-261.
Tedeschi LO, Fox DG, Fonseca MA, Francis L, Cavalcanti L.
2015. Models of protein and amino acid requirements
for cattle: Invited Riview. R Bras Zootec. 44:109-132.
Ubwa ST, Abah J, Oshidi BA, Otokpa E. 2014. Studies on
urea treated rice milling waste and its application as
animal feed. Afr J Pure Appl Chem. 8:23-31.
Van Soest PJ. 2006. Rice straw the role of silica and treatment
to improve quality. J Anim Feed Sci Technol. 130:137-
171.
Van Soest PJ, Robertson JB, Lewis BA. 1991. Methods for
dietary fiber, neutral detergent fiber and non-starch
polysaccharides in relation to animal nutrition. J Dairy
Sci. 74:3583-3593.
Volden H. 1999. Effects of level of feeding and ruminally
undegraded protein on ruminal bacterial protein
synthesis, escape of dietary protein intestinal amino acid
profile, and performance of dairy cows. J Anim Sci.
77:1905‐1918.
Wanapat M, Polyrach S, Boonnop K, Mapato C, Cherdthong
A. 2009. Effect of treating rice straw with urea and
calcium hydroxide upon intake, digestibility, rumen
fermentation and milk yield of dairy cows. Livest Sci.
125:238-243.
Widiawati Y. 2002. The utilisation of shrub legumes:
Leucaena leucocephala, Gliricidia sepium and
Calliandra callothyrsus for growing sheep (Thesis).
Townsville (Australia): James Cook University.
Yadete GK. 2014. Effect wheat straw urea treatment and
Leucaena leucochepala foliage hay supplementation on
intake, digestibility, nitrogen balance and growth of
lambs. Int J Livest Prod. 6:88-96.
Yalchi T, Afzalzade A, Sharifi RS. 2009. Effects of liquid
ammonia and urea treatment on chemical composition
and in vitro digestibility of triticale straw. J Anim Vet
Adv. 8:1916-1920.
Yulistiani D, Puastuti W, Wina E, Supriati. 2012. Pengaruh
berbagai pengolahan terhadap nilai nutrisi tongkol
jagung: Komposisi kimia dan kecernaan in vitro. JITV.
17:59-66.
Zain M. 2007. Optimalisasi penggunaan serat sawit sebagai
pakan serat alternatif dengan suplementasi daun ubi
kayu dalam ransum ruminansia. J Indones Trop Anim
Agric. 32:100-105.
Zain M, Jamarun N, Nurhaita. 2010. Effect of sulfur
suplementation on in vitro fermentability and
degradability of ammoniated rice straw. Pak J Nutr.
9:413-415.
Zain M, Sutardi T, Suryahadi; Ramli N. 2008. Effect of
defaunation and supplementation methionine hydroxy
analogue and branched chain amino acid in growing
sheep diet based on palm press fiber ammoniated. Pak J
Nutr. 7:813-816.
Zhang HL, Chen Y, Xu XL, Yang YX. 2013. Effects of
Branched-chain Amino Acids on In vitro Ruminal
Fermentation of Wheat Straw. Asian-Aust J Anim Sci.
26:523-528.
JITV Vol. 22 No 4 Th. 2017: 188-195
188
Growth and Feed Utilization of Boer x Kacang Crossbred Goats Offered
Total Mixed Rations of Different Protein and Energy Levels
Ginting SP, Simanihuruk K, Antonius, Tarigan A
Indonesian Goat Research Station, P.O. Box 1 Galang, Sumatera Utara
E-mail: [email protected]
(received 10-10-2017; revised 21-11-2017; accepted 18-12-2017)
ABSTRAK
Ginting SP, Simanihuruk K, Antonius, Tarigan A. 2017. Pertumbuhan dan pemanfaatan pakan kambing persilangan Boer x
Kacang yang diberi pakan komplit dengan kandungan protein dan energi berbeda. JITV 22(4): 188-195. DOI:
http://dx.doi.org/10.14334/jitv.v22i4.1782
Penelitian bertujuan untuk mengevaluasi pertumbuhan dan pemanfaatan pakan pada kambing persilangan Boer x Kacang
yang diberi pakan komplit dengan taraf protein dan energi berbeda. Empat kombinasi pakan komplit yang mengandung 16 atau
18% protein kasar dan 2650 atau 2850 Kkal ME/kg BK digunakan dalam penelitian acak lengkap dengan pola faktorial.
Sebanyak 28 ekor kambing persilangan Boer x Kacang (14,5±1,14 kg) dan umur antara 4-5 bulan secara acak dialokasikan
kepada salah satu dari keempat perlakuan pakan komplit (7 ekor ternak/TMR). Pengaruh perlakuan pakan dianalisis dengan
analisis sidik ragam model linier dan apabila terdapat pengaruh perlakuan selanjutnya di uji dengan uji Duncan’s Multiple
Range. Terjadi peningkatan konsumsi BK (P<0,05) jika kandungan energy metabolism pakan meningkat dari 2650 menjadi 2850
Kkal/kg BK, namun konsumsi BK tidak dipengaruhi (P>0,05) oleh taraf protein kasar dalam pakan. PBBH tidak meningkat
(P>0,05) dengan peningkatan kandungan protein kasar dan energy metabolism dalam pakan. Disimpulkan bahwa dengan
konsumsi pakan komplit pada kambing persilangan Boer x Kacang yang tergolong tinggi, maka kandungan protein kasar 16%
dan densitas energy metabolism 2850 Kkal/kg BK dapat menghasilkan PBBH yang tinggi.
Kata Kunci: Kambing, Pakan Komplit, Taraf Protein, Taraf Energi
ABSTRACT
Ginting SP, Simanihuruk K, Antonius, Tarigan A. 2017. Growth and feed utilization of Boer x Kacang crossbred goats offered
total mixed rations of different protein and energy levels. JITV 22(4): 188-195. DOI: http://dx.doi.org/10.14334/jitv.v22i4.1782
The aim of this study was to evaluate the growth of and feed utilization by Boer x Kacang crosses goats fed on total mixed
ration differing in protein and energy levels. Four total mixed rations combination were formulated to contain 16 and 18% crude
protein and 2650 and 2850 Kcal ME/ kg DM (dried matter) energy density. Twenty-eight male Boer x Kacang crosses goats
(14.5 ± 1.14 kg) and of age ranging from 4 to 5 months were randomly allocated to one of these four TMRs (total mixed rations)
(7 animals/TMR). The effects of dietary treatment were assessed using the general linear model and significance of the diet
effects was detected using Duncan’s multiple range test. Dry matter intake increased as metabolizable energy density of diet
increased from 2650 to 2850 Kcal/kg DM, but it is not affected by increasing crude protein level from 16 to 18%. The average
daily gains were not improved (P>0.05) as the crude protein levels and metabolizable energy density of diet increased. Crude
protein levels and ME density did not affect (P>0.05) the DM, OM and energy digestibility, but NDF digestibility was affected
by the ME density of diets (P<0.05). Daily N intakes were greater (P<0.0%) in goats received diets higher in the crude protein
and metabolizable energy levels. At this high rate of feed intake this type of goats are able to gain optimally when offered feed
with crude protein level of 16% and metabolizable energy density of 2850 Kcal/kg DM.
Key Words: Goats, Total Mixed Ration, Protein Level, Energy Level
INTRODUCTION
Crossbreeding schemes between introduced Boer
goats and indigenous Kacang Goats have been
undertaken at the Goat Research Institute at Sungai
Putih, North Sumatera. The production performances
evaluation of the Boer x Kacang crossbreds are
currently in progress, and the ultimate goal of this
program is to create a 50% Boer and 50% Kacang
genotype with superior performance potentials
compared to that of native Kacang goats, particularly in
the trait of growth rate and body weight. It is generally
accepted that crossbred genotypes would only express
their performances to their genetic potentials when
raised under optimum production system (Bryant et al.
2005), in which nutrition plays a critical element.
Improving the nutrition status of ruminants through
increasing the intake of main nutrients such as crude
Ginting et al. Growth and feed utilization of Boer x kacang crossbred goats offered total mixed ration of different protein and energy levels
189
protein and metabolizable energy resulted in increased
dry matter intake and digestibility, N retention and
liveweight gain (Rios-Rincon et al. 2014; Singh et al.
2013). However, the magnitude of the responses vary
greatly across breeds (Negesse et al. 2001; Hwangbo et
al. 2009). This is indicative of different protein and
energy requirements for maintenance and production of
various genotype of goats under different production
system.
In Indonesia, the integration of ruminant animals
including goats with palm oil plantation is being
promoted as one of the prospective production systems.
The availability and efficient utilization of various types
of feeds to support animal production under this
production system play a vital role. The aim of this
study was to evaluate the growth and feed utilization of
Boer x Kacang crossbreds offered diets differing in the
crude protein and metabolizable energy levels in the
form of totally mixed ration and using palm oil fronds
as the sole roughage.
MATERIALS AND METHODS
Diets, animals and experimental design
Four total mixed rations (TMR) using palm oil
fronds as the sole roughage were formulated to have
different crude protein levels (16% and 18%) and
metabolizable energy levels (2650 Kcal/kg DM and
2850 Kcal/kg DM). Ingredients and the calculated
chemical compositions (DM basis) of the four TMRs
are presented in Table 1. Oil palm fronds were obtained
from the oil palm plantations. After removing the
leaves, the stems were ground using shredder and
mixed thoroughly with other ingredients. Twenty-eight
male Boer x Kacang crossed goats of similar body
weight (14.5±1.14 kg) and age (4 to 5 months old) were
randomly allocated to one of the four dietary treatments
each replicated seven times with one goat per replicate.
Animals were put in individual metabolic cage
equipped with troughs and water container. Feeds were
offered ad libitum by allowing refusal at approximately
10%. The animals were fed twice daily at 08:00 and
14:00 each of equal amounts. Water was available at all
the times. Animals were adapted to their pens and
dietary treatments for 14 days and the feeding trial
lasted for 90 days. During the feeding trial feeds offered
and refusals were recorded daily while animal’s body
weights were measured biweekly. Following the
feeding trial a digestion trial was performed during
which offered feed and individual refusals, feces and
urine were collected and sampled daily for five
consecutive days. Faecal samples (10%) were collected
and pooled by animal. Parts of the faecal samples were
processed for DM determination (80°C for 48 h). Other
parts were dried at 600°C, ground to pass through 1 mm
screen and stored in refrigerator for laboratory analyses.
Urine from individual animal was collected in plastic
container containing 100 ml of 10% sulphuric acid to
maintain pH below 3.0 and keep in a freezer until
analysed. Blood was sampled at the end of the digestion
trial from the jugular vein just before morning meal.
Blood samples were stored at -20°C before analyses.
Laboratory analyses
Feeds, individual refusals, faeces were analyzed for
dry matter (DM), organic matter (OM) and nitrogen
according to the standard procedures (AOAC 2012) and
for neutral detergent fiber (NDF) and acid detergent
fiber (ADF) using the procedures described by Van
Soest et al. (1991). Urine was analyzed for nitrogen.
Blood samples were analyzed for glucose and urea-N
using Vitalab Flexor auto analyzer kits.
Statistical analyses
The experiment was arranged in a completely
randomized design with a 2 x 2 factorial arrangement.
Each treatment consisted of seven replicates. The
effects of dietary treatments on daily gains, intake,
digestibility, nitrogen balances, blood metabolites were
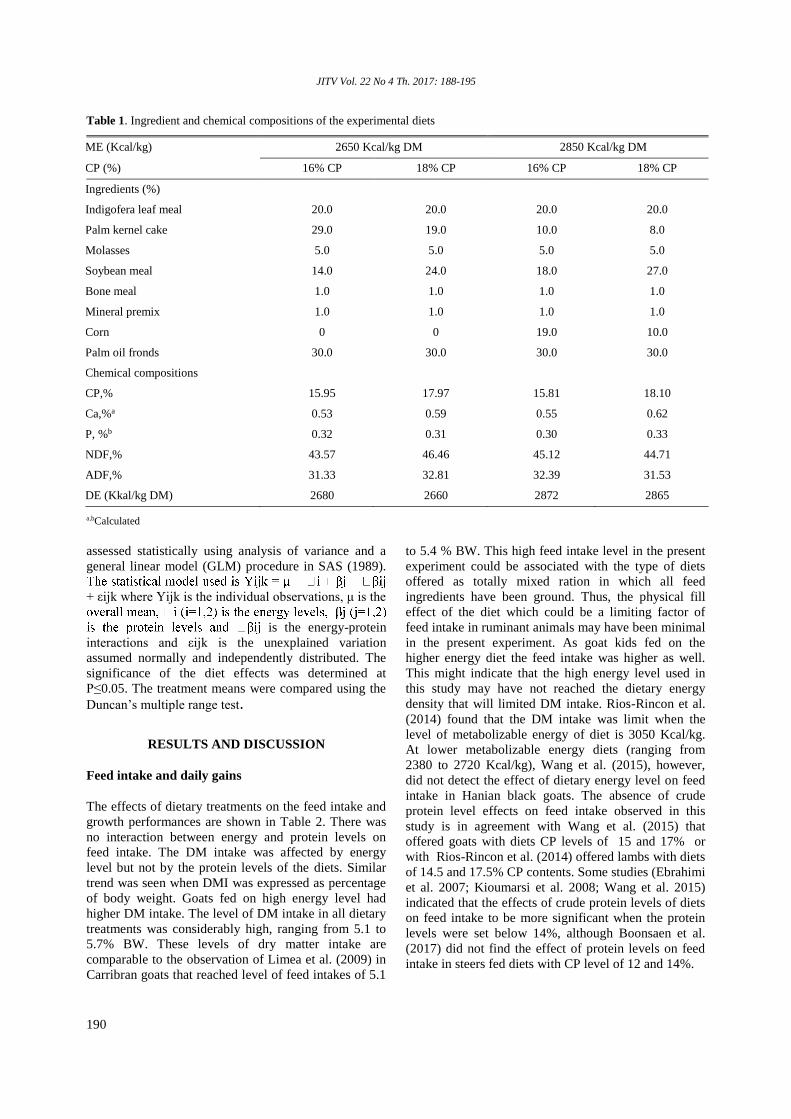
JITV Vol. 22 No 4 Th. 2017: 188-195
190
Table 1. Ingredient and chemical compositions of the experimental diets
ME (Kcal/kg) 2650 Kcal/kg DM 2850 Kcal/kg DM
CP (%) 16% CP 18% CP 16% CP 18% CP
Ingredients (%)
Indigofera leaf meal 20.0 20.0 20.0 20.0
Palm kernel cake 29.0 19.0 10.0 8.0
Molasses 5.0 5.0 5.0 5.0
Soybean meal 14.0 24.0 18.0 27.0
Bone meal 1.0 1.0 1.0 1.0
Mineral premix 1.0 1.0 1.0 1.0
Corn 0 0 19.0 10.0
Palm oil fronds 30.0 30.0 30.0 30.0
Chemical compositions
CP,% 15.95 17.97 15.81 18.10
Ca,%a 0.53 0.59 0.55 0.62
P, %b 0.32 0.31 0.30 0.33
NDF,% 43.57 46.46 45.12 44.71
ADF,% 31.33 32.81 32.39 31.53
DE (Kkal/kg DM) 2680 2660 2872 2865
a,bCalculated
assessed statistically using analysis of variance and a
general linear model (GLM) procedure in SAS (1989).
+ εijk where Yijk is the individual observations, μ is the
is the energy-protein
interactions and εijk is the unexplained variation
assumed normally and independently distributed. The
significance of the diet effects was determined at
P≤0.05. The treatment means were compared using the
Duncan’s multiple range test.
RESULTS AND DISCUSSION
Feed intake and daily gains
The effects of dietary treatments on the feed intake and
growth performances are shown in Table 2. There was
no interaction between energy and protein levels on
feed intake. The DM intake was affected by energy
level but not by the protein levels of the diets. Similar
trend was seen when DMI was expressed as percentage
of body weight. Goats fed on high energy level had
higher DM intake. The level of DM intake in all dietary
treatments was considerably high, ranging from 5.1 to
5.7% BW. These levels of dry matter intake are
comparable to the observation of Limea et al. (2009) in
Carribran goats that reached level of feed intakes of 5.1
to 5.4 % BW. This high feed intake level in the present
experiment could be associated with the type of diets
offered as totally mixed ration in which all feed
ingredients have been ground. Thus, the physical fill
effect of the diet which could be a limiting factor of
feed intake in ruminant animals may have been minimal
in the present experiment. As goat kids fed on the
higher energy diet the feed intake was higher as well.
This might indicate that the high energy level used in
this study may have not reached the dietary energy
density that will limited DM intake. Rios-Rincon et al.
(2014) found that the DM intake was limit when the
level of metabolizable energy of diet is 3050 Kcal/kg.
At lower metabolizable energy diets (ranging from
2380 to 2720 Kcal/kg), Wang et al. (2015), however,
did not detect the effect of dietary energy level on feed
intake in Hanian black goats. The absence of crude
protein level effects on feed intake observed in this
study is in agreement with Wang et al. (2015) that
offered goats with diets CP levels of 15 and 17% or
with Rios-Rincon et al. (2014) offered lambs with diets
of 14.5 and 17.5% CP contents. Some studies (Ebrahimi
et al. 2007; Kioumarsi et al. 2008; Wang et al. 2015)
indicated that the effects of crude protein levels of diets
on feed intake to be more significant when the protein
levels were set below 14%, although Boonsaen et al.
(2017) did not find the effect of protein levels on feed
intake in steers fed diets with CP level of 12 and 14%.
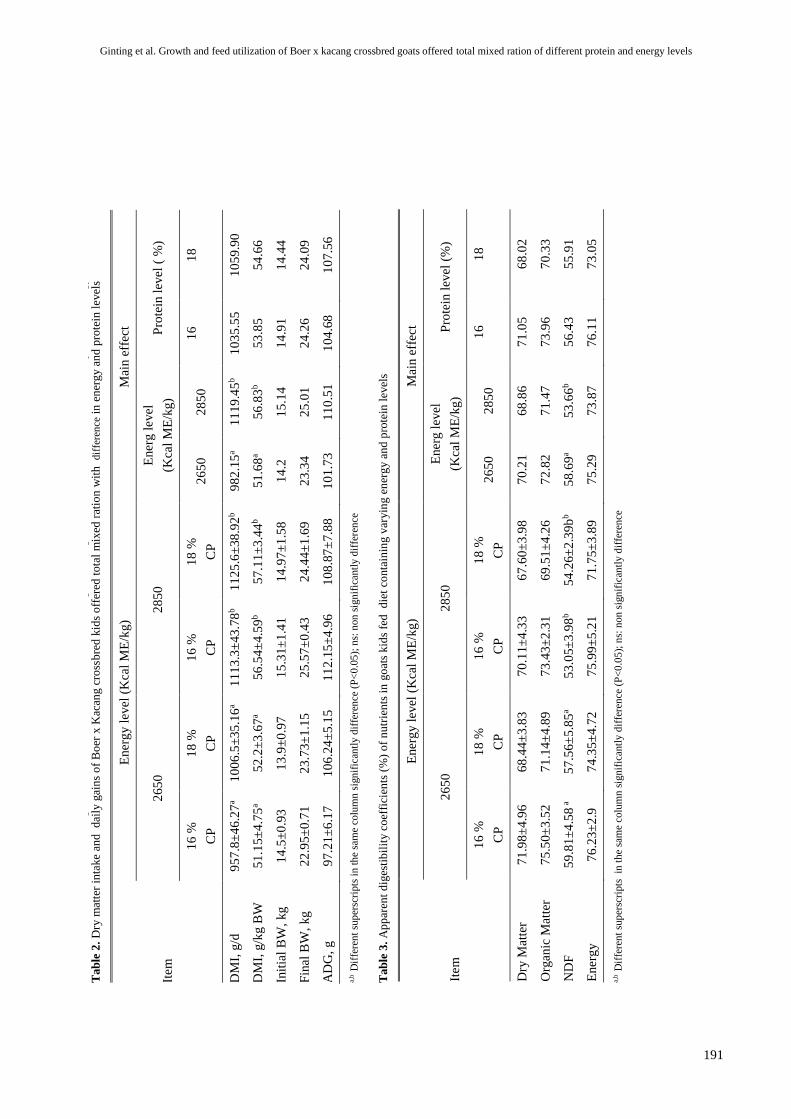
Gin
tin
g e
t al
. G
row
th a
nd
fee
d u
tili
zati
on
of
Boer
x k
acan
g c
ross
bre
d g
oat
s off
ered
tota
l m
ixed
rat
ion
of
dif
fere
nt
pro
tein
an
d e
ner
gy l
evel
s
19
1
Tab
le 2
. D
ry m
atte
r in
take
and
dai
ly g
ain
s o
f B
oer
x K
acan
g c
ross
bre
d k
ids
off
ered
to
tal
mix
ed r
atio
n w
ith
dif
fere
nce
in
en
erg
y a
nd
pro
tein
level
s
Item
Ener
gy l
evel
(K
cal
ME
/kg)
Mai
n e
ffec
t
26
50
28
50
Ener
g l
evel
(Kca
l M
E/k
g)
Pro
tein
lev
el (
%)
16
%
CP
18
%
CP
16
%
CP
18
%
CP
2
65
0
28
50
16
18
DM
I, g
/d
95
7.8
±4
6.2
7a
10
06
.5±
35
.16
a 1
11
3.3
±43
.78
b
11
25
.6±
38
.92
b
98
2.1
5a
11
19
.45
b
10
35
.55
10
59
.90
DM
I, g
/kg B
W
51
.15±
4.7
5a
52
.2±
3.6
7a
56
.54±
4.5
9b
57
.11±
3.4
4b
51
.68
a 5
6.8
3b
53
.85
54
.66
Init
ial
BW
, kg
1
4.5
±0
.93
1
3.9
±0
.97
1
5.3
1±
1.4
1
14
.97±
1.5
8
14
.2
15
.14
1
4.9
1
14
.44
Fin
al B
W,
kg
2
2.9
5±
0.7
1
23
.73±
1.1
5
25
.57±
0.4
3
24
.44±
1.6
9
23
.34
25
.01
2
4.2
6
24
.09
AD
G,
g
97
.21±
6.1
7
10
6.2
4±
5.1
5
11
2.1
5±
4.9
6
10
8.8
7±
7.8
8
10
1.7
3
11
0.5
1
10
4.6
8
10
7.5
6
a,b D
iffe
ren
t su
per
scri
pts
in t
he
sam
e co
lum
n s
ign
ific
antl
y d
iffe
ren
ce (
P<
0.0
5);
ns:
non
sig
nif
ican
tly d
iffe
ren
ce
Tab
le 3
. A
pp
aren
t d
iges
tib
ilit
y c
oef
fici
ents
(%
) o
f n
utr
ien
ts i
n g
oat
s kid
s fe
d
die
t co
nta
inin
g v
aryin
g e
ner
gy a
nd
pro
tein
lev
els
Item
Ener
gy l
evel
(K
cal
ME
/kg)
Mai
n e
ffec
t
26
50
28
50
Ener
g l
evel
(Kca
l M
E/k
g)
Pro
tein
lev
el (
%)
16
%
CP
18
%
CP
16
%
CP
18
%
CP
2
65
0
28
50
16
18
Dry
Mat
ter
71
.98±
4.9
6
68
.44±
3.8
3
70
.11±
4.3
3
67
.60±
3.9
8
70
.21
68
.86
7
1.0
5
68
.02
Org
anic
Mat
ter
75
.50±
3.5
2
71
.14±
4.8
9
73
.43±
2.3
1
69
.51±
4.2
6
72
.82
7
1.4
7
73
.96
70
.33
ND
F
59
.81±
4.5
8 a
57
.56±
5.8
5a
53
.05±
3.9
8b
54
.26±
2.3
9b
b
58
.69
a 5
3.6
6b
56
.43
55
.91
Ener
gy
7
6.2
3±
2.9
7
4.3
5±
4.7
2
75
.99±
5.2
1
71
.75±
3.8
9
75
.29
73
.87
7
6.1
1
73
.05
a,b D
iffe
ren
t su
per
scri
pts
in
th
e sa
me
colu
mn
sig
nif
ican
tly d
iffe
ren
ce (
P<
0.0
5);
ns:
non s
ign
ific
antl
y d
iffe
ren
ce
Ginting et al. Growth and feed utilization of Boer x kacang crossbred goats offered total mixed ration of different protein and energy levels
191
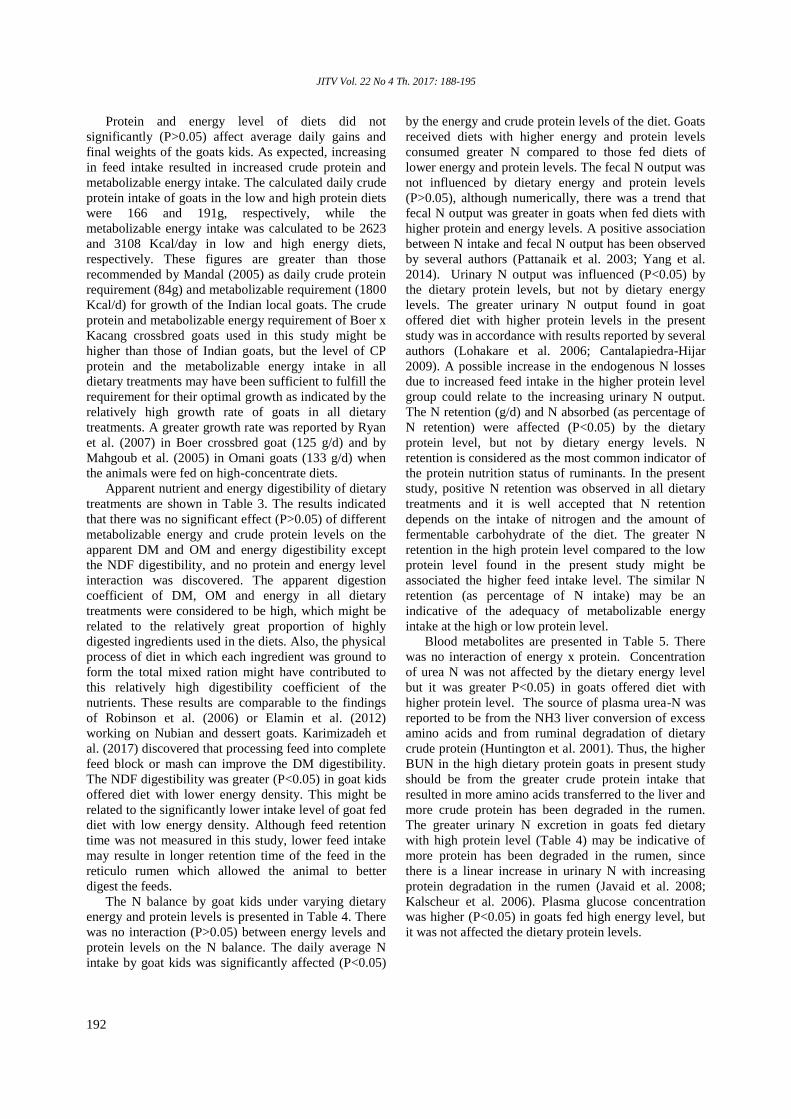
JITV Vol. 22 No 4 Th. 2017: 188-195
192
Protein and energy level of diets did not
significantly (P>0.05) affect average daily gains and
final weights of the goats kids. As expected, increasing
in feed intake resulted in increased crude protein and
metabolizable energy intake. The calculated daily crude
protein intake of goats in the low and high protein diets
were 166 and 191g, respectively, while the
metabolizable energy intake was calculated to be 2623
and 3108 Kcal/day in low and high energy diets,
respectively. These figures are greater than those
recommended by Mandal (2005) as daily crude protein
requirement (84g) and metabolizable requirement (1800
Kcal/d) for growth of the Indian local goats. The crude
protein and metabolizable energy requirement of Boer x
Kacang crossbred goats used in this study might be
higher than those of Indian goats, but the level of CP
protein and the metabolizable energy intake in all
dietary treatments may have been sufficient to fulfill the
requirement for their optimal growth as indicated by the
relatively high growth rate of goats in all dietary
treatments. A greater growth rate was reported by Ryan
et al. (2007) in Boer crossbred goat (125 g/d) and by
Mahgoub et al. (2005) in Omani goats (133 g/d) when
the animals were fed on high-concentrate diets.
Apparent nutrient and energy digestibility of dietary
treatments are shown in Table 3. The results indicated
that there was no significant effect (P>0.05) of different
metabolizable energy and crude protein levels on the
apparent DM and OM and energy digestibility except
the NDF digestibility, and no protein and energy level
interaction was discovered. The apparent digestion
coefficient of DM, OM and energy in all dietary
treatments were considered to be high, which might be
related to the relatively great proportion of highly
digested ingredients used in the diets. Also, the physical
process of diet in which each ingredient was ground to
form the total mixed ration might have contributed to
this relatively high digestibility coefficient of the
nutrients. These results are comparable to the findings
of Robinson et al. (2006) or Elamin et al. (2012)
working on Nubian and dessert goats. Karimizadeh et
al. (2017) discovered that processing feed into complete
feed block or mash can improve the DM digestibility.
The NDF digestibility was greater (P<0.05) in goat kids
offered diet with lower energy density. This might be
related to the significantly lower intake level of goat fed
diet with low energy density. Although feed retention
time was not measured in this study, lower feed intake
may resulte in longer retention time of the feed in the
reticulo rumen which allowed the animal to better
digest the feeds.
The N balance by goat kids under varying dietary
energy and protein levels is presented in Table 4. There
was no interaction (P>0.05) between energy levels and
protein levels on the N balance. The daily average N
intake by goat kids was significantly affected (P<0.05)
by the energy and crude protein levels of the diet. Goats
received diets with higher energy and protein levels
consumed greater N compared to those fed diets of
lower energy and protein levels. The fecal N output was
not influenced by dietary energy and protein levels
(P>0.05), although numerically, there was a trend that
fecal N output was greater in goats when fed diets with
higher protein and energy levels. A positive association
between N intake and fecal N output has been observed
by several authors (Pattanaik et al. 2003; Yang et al.
2014). Urinary N output was influenced (P<0.05) by
the dietary protein levels, but not by dietary energy
levels. The greater urinary N output found in goat
offered diet with higher protein levels in the present
study was in accordance with results reported by several
authors (Lohakare et al. 2006; Cantalapiedra-Hijar
2009). A possible increase in the endogenous N losses
due to increased feed intake in the higher protein level
group could relate to the increasing urinary N output.
The N retention (g/d) and N absorbed (as percentage of
N retention) were affected (P<0.05) by the dietary
protein level, but not by dietary energy levels. N
retention is considered as the most common indicator of
the protein nutrition status of ruminants. In the present
study, positive N retention was observed in all dietary
treatments and it is well accepted that N retention
depends on the intake of nitrogen and the amount of
fermentable carbohydrate of the diet. The greater N
retention in the high protein level compared to the low
protein level found in the present study might be
associated the higher feed intake level. The similar N
retention (as percentage of N intake) may be an
indicative of the adequacy of metabolizable energy
intake at the high or low protein level.
Blood metabolites are presented in Table 5. There
was no interaction of energy x protein. Concentration
of urea N was not affected by the dietary energy level
but it was greater P<0.05) in goats offered diet with
higher protein level. The source of plasma urea-N was
reported to be from the NH3 liver conversion of excess
amino acids and from ruminal degradation of dietary
crude protein (Huntington et al. 2001). Thus, the higher
BUN in the high dietary protein goats in present study
should be from the greater crude protein intake that
resulted in more amino acids transferred to the liver and
more crude protein has been degraded in the rumen.
The greater urinary N excretion in goats fed dietary
with high protein level (Table 4) may be indicative of
more protein has been degraded in the rumen, since
there is a linear increase in urinary N with increasing
protein degradation in the rumen (Javaid et al. 2008;
Kalscheur et al. 2006). Plasma glucose concentration
was higher (P<0.05) in goats fed high energy level, but
it was not affected the dietary protein levels.
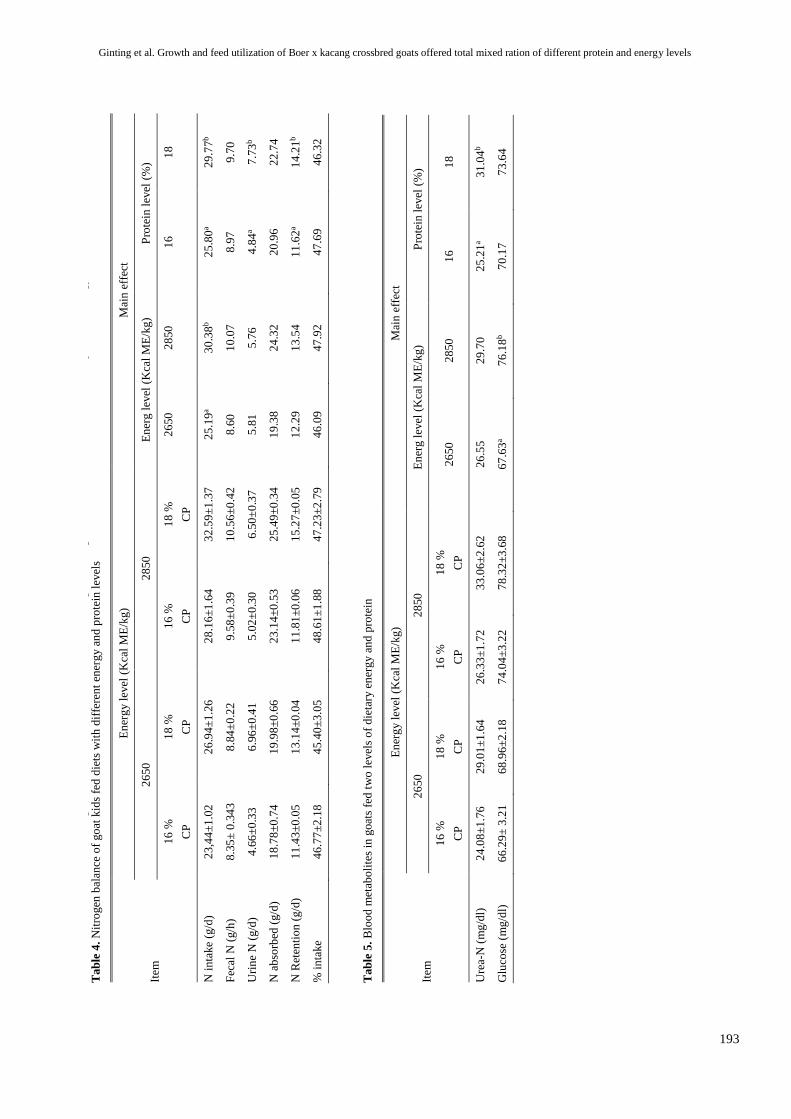
Gin
tin
g e
t al
. G
row
th a
nd
fee
d u
tili
zati
on
of
Boer
x k
acan
g c
ross
bre
d g
oat
s off
ered
tota
l m
ixed
rat
ion
of
dif
fere
nt
pro
tein
an
d e
ner
gy l
evel
s
19
3
Tab
le 4
. N
itro
gen
bal
ance
of
go
at k
ids
fed
die
ts w
ith
dif
fere
nt
ener
gy a
nd
pro
tein
lev
els
Item
En
erg
y l
evel
(K
cal
ME
/kg)
Mai
n e
ffec
t
26
50
28
50
En
erg l
evel
(K
cal
ME
/kg)
Pro
tein
lev
el (
%)
16
%
CP
18
%
CP
16
%
CP
18
%
CP
26
50
28
50
16
18
N i
nta
ke
(g/d
) 2
3,4
4±
1.0
2
26
.94
±1
.26
2
8.1
6±
1.6
4
32
.59
±1
.37
2
5.1
9a
30
.38
b
25
.80
a 2
9.7
7b
Fec
al N
(g/h
) 8
.35
± 0
.34
3
8.8
4±
0.2
2
9.5
8±
0.3
9
10
.56
±0
.42
8
.60
10
.07
8.9
7
9.7
0
Uri
ne
N (
g/d
) 4
.66
±0
.33
6
.96
±0
.41
5.0
2±
0.3
0
6.5
0±
0.3
7
5.8
1
5.7
6
4.8
4a
7.7
3b
N a
bso
rbed
(g/d
) 1
8.7
8±
0.7
4
19
.98
±0
.66
2
3.1
4±
0.5
3
25
.49
±0
.34
1
9.3
8
24
.32
20
.96
22
.74
N R
eten
tio
n (
g/d
) 1
1.4
3±
0.0
5
13
.14
±0
.04
1
1.8
1±
0.0
6
15
.27
±0
.05
1
2.2
9
13
.54
11
.62
a 1
4.2
1b
% i
nta
ke
46
.77
±2
.18
4
5.4
0±
3.0
5
48
.61
±1
.88
4
7.2
3±
2.7
9
46
.09
47
.92
47
.69
46
.32
Tab
le 5
. B
loo
d m
etab
oli
tes
in g
oat
s fe
d t
wo
lev
els
of
die
tary
en
erg
y a
nd
pro
tein
Item
En
erg
y l
evel
(K
cal
ME
/kg)
Mai
n e
ffec
t
26
50
28
50
En
erg l
evel
(K
cal
ME
/kg
) P
rote
in l
evel
(%
)
16
%
CP
18
%
CP
16
%
CP
18
%
CP
2
650
28
50
16
18
Ure
a-N
(m
g/d
l)
24
.08
±1
.76
2
9.0
1±
1.6
4
26
.33
±1
.72
3
3.0
6±
2.6
2
26
.55
29
.70
25
.21
a 3
1.0
4b
Glu
cose
(m
g/d
l)
66
.29
± 3
.21
6
8.9
6±
2.1
8
74
.04
±3
.22
78
.32
±3
.68
6
7.6
3a
76
.18
b
70
.17
73
.64
Ginting et al. Growth and feed utilization of Boer x kacang crossbred goats offered total mixed ration of different protein and energy levels
193

JITV Vol. 22 No 4 Th. 2017: 188-195
194
The plasma concentration ranged from 66 to 78 mg/dl
and was comparable to those reported by Karimizadeh
et al. (2017) fed goats diet with metabolizable energy
concentration of 2500 Kcal/kg DM. This plasma
glucose levels may indicative of adequate energy intake
at both levels and related to the relatively high DM
intake of the goats (Table 2). Sing et al. (2013) found
lower plasma glucose level (47-52 mg/dl) at lower DM
intake (500-600 g DM/day) compared to the DM intake
in the present study. This is supported also by the
insignificant effects of dietary energy levels on the
blood N level, since energy deficiency could result in in
reduced blood glucose with concomitant increase in
blood urea (Yurtman et al. 2002). The insignificant
effects of dietary protein level on the concentration of
blood glucose observed in the present study were
similar to result study of Meng et al. (2016) offered
goats diet with crude protein level of 10, 12.5 and 15%.
CONCLUSION
The present study shows that the Boer x Kacang
crossbred goats have high level of DM intake when
offered feeds in the form of total mixed rations. At this
high rate of feed intake this type of goats are able to
gain optimally when offered feed with crude protein
level of 16% and metabolizable energy density of 2850
Kcal/kg DM.
REFERENCES
[AOAC] Association of Official Analytical Chemist. 2012.
Official methods of analyses. 19th ed. Maryland (USA):
AOAC International.
Boonsaen P, Soe NW, Maittreejet W, Majarune S, Reungprim
T, Sawanon S. 2017. Effects of protein and energy
sources in total mixed ration on feedlot performance and
carcass quality of Kamphaeng Saen steers. Agric Nat
Res. 51:57-61.
Bryant M, Glina C, Carles A. 2005. Breeding strategies for
sustainable improvement. In: Owen E, Kitalyi A,
Jayasuriya N, Smith T, editors. Livestock and wealth
creation. Nottingham (UK): Nottingham University
Press. p. 215-232
Cantalapiedra-Hijar G, Yanez-Ruiz DR, Martin-Garcia AI,
Molina-Alcaide E. 2009. Effects of forage:concentrate
ratio and forage type on apparent digestibility, ruminal
fermentation, and microbial growth in goats. J Anim
Sci. 87:622-631.
Ebrahimi R, Ahmadi HR, Zamiri Mj, Rowghani E. 2007.
Effect of energy and protein levels on feedlot
performance and carcass characteristics of Mehfaban
ram lambs. Pak J Biol Sci. 10:1679-1684.
Elamin KM, Eldar AAT, Amin AE, Abdalla FS, Hassan HE.
2012. Digestibility and nitrogen balance of Sudan goats
ecotype fed different energi/protein level. Asian J Anim
Sci. 6:230-239.
Javaid A, Nisa M, Sarwar M, Shahzad MA. 2008. Ruminal
characteristics, blood pH, blood urea nitrogen and
nitrogen balance in Nili-ravi Buffalo (Bubalus bubalis)
bulls fed diets containing various levels of ruminally
degradable protein. Asian-Aust J Anim Sci. 21:51-58.
Huntington GB, Poore M, Hopkins B, Spears J. 2001. Effect
of ruminal protein degradability on growth and N
metabolism in growing beef steers. J Anim Sci. 79:533-
541.
Hwangbo S, Choi SH, Kim SW, Son SS, Park HS. 2009.
Effects of crude protein levels in total mixed rations on
growth performance and meat quality in growing
Korean Black goats. Asian-Aust J Anim Sci. 22:1133-
1139.
Kalscheur KF, Baldwin RL, Glenn BP, Kohn RA. 2006. Milk
production of dairy cows fed differing concentration of
rumen-degraded protein. J Dairy Sci. 89:249-259.
Karimizadeh E, Chaji M, Mohammadabadi T. 2017. Effects
of physical form of diet on nutrient digestibility, rumen
fermentation, rumination, growth performance and
protozoa population of finishing lambs. Anim Nutr.
3:139-144.
Kioumarsi H, Khorsidi KJ, Zahedifar M, Sedavi AR,
Mirhosseini SJ, Taherzadeh MR. 2008. The effect of
dietary energy and protein level on performance,
efficiency and carcass characteristics of Taleshi lambs.
Asian J Anim Vet Adv. 3:307-313.
Liméa L, Boval M, Mandonnet N, Garcia G, Archimède H,
Alexandre G. 2009. Growth performance, carcass
quality, and noncarcass components if indigenous
Carribean goats under varying nutritional densities. J
Anim Sci. 87:3770-3781.
Lohakare JD, Pattanaik AK, Khan SA. 2006. Effect of dietary
protein levels on the performance, nutrien balancea,
metabolic profile and thyroid hormones of crossed
calves. Asian-Aust J Anim Sci. 19:1588-1596.
Mahgoub O, Lu CD, Hameed MS, Richie A, Al-Halhali AS,
Annamalai K. 2005. Performance of Omani goats fed
diets containing various metabolizable energy densities.
Small Rumin Res. 58:175-180
Mandal AB, Paul SS, Mandal GP, Kannan A, Pathak NN.
2005. Deriving nutrient requirements of growing Indian
goats under tropical condition. Small Rumin Res.
58:201-217.
Meng F, Yuan C, Yu Z. 2016. Effects of dietary protein levels
on milk production performances and serum
biochemical indicators of diary goat. J Adv Dairy Res.
4:1-5.
Negesse T, Rodehutscord M, Pfeffer E. 2001. The effect of
dietary crude protein level on intake, growth, protein
retention and utilization of growing male Saanen kids.
Small Rumin Res. 3:1-8.
Ginting et al. Growth and feed utilization of Boer x kacang crossbred goats offered total mixed ration of different protein and energy levels
195
Pattanaik AK, Sastry VRB, Katiyar RC, Lal M. 2003.
Influence of grain processing and fietary protein
degradability on nitrogen metabolism, energy balance
and methane production in young calves. Asian-Aust J
Anim Sci. 16:1443-1450.
Rios-Rincόn FG, Estrada-Angulo A, Plascencia A, Lόpez-
Soto MA, Castro-Pérez BI, Portillo-Loera JJ, Robles-
Estrada JC, Calderόn-Cortes JF, Dávila-Ramos H. 2014.
Influence of protein and energy level in finishing diets
for feedlot hair lambs: Growth performance, dietary
energetics and carcass characteristics. Asian-Aust J
Anim Sci. 27:55-61.
Robinson TF, Sponheimer M, Roeder BL, Passey B, Cerling
TE, Dearing MD, Ehleringer JR. 2006. Digestibility and
nitrogen retention in llamas and goats fed alfalfa, C3
grass and C4 grass hay. Small Rumin Res. 64:162-168.
Ryan SM, Unruh JA, Corrigan ME, Drouillard JS, Seyfert M.
2007. Effects of concentrate levels on carcass traits of
Boer crossbred goats. Small Rumin Res. 73:67-76.
[SAS] Statistical Analysis System. 1989. SAS User’s guide
International Version 6. 4th ed. Cary, NC (USA):
Statistical Analysis Institute Inc.
Singh VK, Pattanaik AK, Goswami TK, Sharma K. 2013.
Effect of varying the energy density of protein-adequate
diets on nutrien metabolism. Clinical chemistry,
immune responses and grouwth of Muzaffarnagari
lambs. Asian-Aust J Anim Sci. 26:1089-1101.
Van Soest PJ, Robertson JB, Lewis BA. 1991. Methods for
dietary fibre, neutral detergent fibre, and nonstarch
carbohydrates in relation to animal nutrition. J Dairy
Sci. 74:3583-3597.
Wang D, Zhou L, Zhou H, Hou G, Shi L, Huang X, Guan S.
2015. Effects of nutritional level of concentrate-based
diets on meat quality and expression levels of genes
realted to meat quality in Hainan blak goats. Anim Sci J.
86:166-173.
Yang SY, Oh YK, Ahn HS, Kwak WS. 2014. Maintenance
crude protein requirement of penned female Korean
spoted deer (Cervus nippon). Asian-Aust J Anim Sci.
27:30-35
Yurtman IY, Savas T, Karaagac F, Coskuntuna L. 2002.
Effects of daily protein intake levels on the oral
stereotypic behaviours in energy restricted lambs. Appl
Anim Behav Sci. 77:77-88.
JITV Vol. 22 No 4 Th. 2017: 196-204
196
Anticoccidial Activity of Artemisinin and Extract of Artemesia annua Leaves
in Chicken Infected by Eimeria tenella
Wiedosari E, Wardhana AH
Indonesian Research Center for Veterinary Sciences
E-mail: [email protected]
(receiced: 05-10-2017; revised: 16-11-2017; accepted 20-12-2017)
ABSTRAK
Wiedosari E, Wardhana AH. 2017. Aktivitas antikoksidia artemisinin dan ekstrak daun Artemesia annua pada ayam yang
diinfeksi dengan Eimeria tenella. JITV 22(4): 196-204. DOI: http://dx.doi.org/10.14334/jitv.v22i4.1622
Penggunaan antikoksidia pada ayam yang terus menerus telah memicu timbulnya resistensi obat dan residu dalam jaringan,
sehingga perlu dicari obat alternatif yang berbasis herbal. Tujuan penelitian ini adalah untuk menguji aktivitas antikoksidia
artemisinin dan ekstrak daun Artemesia annua pada ayam yang diinfeksi dengan Eimeria tenella. Sebanyak 35 ayam jantan
strain Cobb dibagi menjadi tujuh perlakuan dengan lima ulangan, yaitu kelompok ayam normal (P I), diinfeksi tanpa pengobatan
(P II), diinfeksi dan diobati dengan 8,5 ppm, 17 ppm, 34 ppm masing-masing untuk P III, P IV dan P V, diinfeksi dan diobati
dengan 17 ppm ekstrak daun A. annua (P VI) dan diinfeksi dan diobati dengan Sulfa (P VII). Setiap ayam diinfeksi dengan E.
tenella dosis rendah, yaitu 2000 ookista kecuali kelompok ayam normal. Pengobatan dilakukan setiap hari selama delapan hari
secara oral. Variabel yang diamati adalah gejala klinis, jumlah ookista dalam feses, pertambahan bobot badan, skor perlukaan
sekum, nilai hematokrit (PCV) dan hemoglobin (Hb). Hasil penelitian menunjukkan bahwa pemberian 17 ppm ekstrak daun A.
annua (P VI) paling efektif dalam menurunkan jumlah ookista (74,18%) diikuti dengan perlakuan 34 ppm artemisinin (58,14%).
Ekstrak daun A. annua dan artemisinin juga mampu mengurangi perlukaan sekum secara nyata (P<0,05). Walaupun
pertambahan bobot badan dan nilai Hb juga tidak menunjukkan perbedaan yang nyata pada semua perlakuan (P>0,05), tetapi
pemberian artemisinin dan ekstrak daun A. annua mampu mempertahankan nilai PCV secara nyata dibandingkan P II dan P IV
(p<0,05) sehingga dapat digunakan sebagai antikoksidia alternatif untuk ayam.
Kata kunci: Eimeria tenella, Artemisinin, Artemesia annua, Koksidiosis
ABSTRACT
Wiedosari E, Wardhana AH. 2017. Anticoccidial activity of Artemisinin and Extract of Artemesia annua leaves in chicken
infected by Eimeria tenella. JITV 22(4): 196-204. DOI: http://dx.doi.org/10.14334/jitv.v22i4.1622
The continuous use of anticoccidial drug in chicken often continuously generates drug resistance and tissue residue; so
thatconsequently, a safe alternative anticoccidial drug based on herb is fundamentally required. The aim of thise study was to
examine anticcocidial activity of artemisinin and extract of Artemesia annua leaves in chicken infected by Eimeria tenella. A
total of 35 chickens of Cobb strain was divided into seven groups with five replicates birds per group, i.e. uninfected chicken
group (P I), infected but untreated chicken group (P II), infected and treated chicken group with 8.5 ppm, 17 ppm, 34 ppm, for P
III, P IV and P V respectively, infected and treated chicken with 17 ppm of A. annua extract (P VI) and infected and treated
chicken with Sulfa (P VII). All chicken, except the uninfected group, whereas infected with 2000 infective oocyst of E. tenella
except the uninfected group. Treatment was delivered by oral, once per day for eight days. The criteria observed were clinical
manifestation of chickens, number of oocyst in feces, body weight, cecal lesion score, haematocrit (packed cell volume) and
haemoglobin value. The results showed that extract of A. annua leaves (P VI) was the most effective treatment to reduce the
number of oocyst in feces (74.18%), followed by 34 ppm of artemisinin group (P VII). In addition, application of A. annua
extract and artemisinin was significantly able to decreased the cecal lesion score (P<0.05). Even though body weight and Hb
value were not indifferent significantly different (p>0.05), however A. annua extract and artemisinin treatments were
significantly able to hold PCV value on normal level compared to P II and P IV (P<0.05). It concluded that extract A. annua
leaves and artemisinin could be used an alternative anticoccidial in chickens.
Key Words: Eimeria tenella, Artemisinin, Artemesia annua, Coccidiosis
INTRODUCTION
Coccidiosis in chicken remains a major problem in
poultry industry in Indonesia and many other countries.
This disease is caused by intracellular protozoa, Eimeria
spp, which is highly pathogen and able to multiply at 21
– 32°C and 75-85% humidity. Infection of the E. tenella
in poultry injures intestinal mucosae which results in
Wiedosari E, Wardhana AH. Anticoccidial activity of Artemisinin and Extract of Artemesia annua leaves in chicken infected by Eimeria tenella
197
decreases nutrient absorbtion and feed eficiency, and
increase secondary bacteria infection (Morris et al.
2007; Cooper & Songer 2009). Adamu et al. (2013)
showed that E. tenella infection in chicken caused
decreases in hematocryte (packed cell volume, PCV)
and hemaglobin (Hb) that led to the enamia. The annual
economic loss caused by the disease is estimated to be
1.5 billion US dollars in the United States alone, or 3
billion US dollaarrs worldwide (Dalloul & Lillehoj
2006; Lee et al. 2009). Tresnani et al. (2012) reported
that the morbidity of coccidiosis in Indonesia was 80-
90% with the loss reached 70% consisting of decrease
body weight, delay in laying, decrease egg production,
and decrease in feed efficiency, incraese operational
cost (Dalloul & Lillehoj 2006; Wiedosari et al. 2014).
So far, the control of coccidiosis relys on
coccidiostate of sophonamide group such as
sulfaquinoxalin, sulfadimetoxin, amprolium and
decoquinate (Tabbu 2006). However, intensive use of
the coccidiostate in the feed reported to induces
resistance to E. tenella and coccidiostate residue in the
poultry products (El-Sadawy et al. 2009; Kheirabadi et
al. 2014). This problem could be overcome by rotating
the use of coccidiostate with different active substances.
Unfortunately, this strategy will raise the production
cost of the poultry industrial, and therefore this strategy
is rarely used (Abbas et al. 2010). Herbal-based-anti
coccidia are an attractive analternative because it does
not leave residue in the products or induce resistance to
the protozoa. In addition, herbal-based-anti coccidia is
compatible for the medication of sub clinical infection
or infection with low number of E. tenella (Habibi et al.
2016).
Plant of the Artemisia genus was reported to have
antiprotozoa activities (Aryanti et al. 2006; del Cacho et
al. 2010). The use of A. Sieberi was reported effective
for E. tenella and E. acervulina but not for E. maxima
(Arab et al. 2006). Compared to the A. sieberi, A. annua
is available more abundantly, and had been used widely
for treatment many parasitic diseases. Artemisia annua
contains complex terpenoid compounds, including
sesquiterpenes lactone compounds known as
artemisinin. This plant has been used as an alternative
treatment for malaria and in addition it has anti-
bacterial, anti-protozoa anti-inflammatory, and anti-
tumor activities (Ferreira et al. 2011). A methanol
exctract of the A. annua leaf and its powder proved to
ehance humoral and cellular immune system of broiler
chickens (Gholamrezaie et al. 2013). Synthetic
artemisinin at 17 ppm concentrations was able to block
the formation of ookista walls and prevent the
occurrence of E. tenella sporulation (del Cacho et al.
2010). Addition of 20% powdered leaf of A. annua in
feed was reported to increase egg production and the
colour intensity of the yolk (Brisibe et al. 2008).
(Drăgan et al. 2014) found that the effectiveness of
herbal-based anticoxidia is influenced by several factors
such as plant parts used, seasonal variations, herbal
drying methods, herbal concentrations, strain and dose
of E. tenella, application route of anticoxidia, poultry
strains. The A-annua leaves dried air-dried- have higher
artemisinin content than freeze- dried- methods
(Ferreira & Luthria 2010). The objective of this study
was to investigate the antikoksidia activity of synthetic
artemisinin and A. annua leaf extract in Cobb strain
chicken infected with E. tenella of local isolate at low
doses or sub-clinical infections.
MATERIALS AND METHODS
Plant collection and extraction
Leaves of A. annua was obtained from the
Indonesian Spice and Medicinal Crops Research
Institute (BALITTRO) at Lembang, West Java. The
leaves were dried at room temperature for 1 week.
The leaves were first macerated, and as much as 300
grams of the leaf powder was soaked in 3 L petroleum
ether in Erlemeyer and agitated for 2 hours. The
petroleum ether solution that contained the active
compound was filtered and evaporated. The A. annua
leaf extracts which appered as thickly paste was stored
in 4°C until used.
Artemisinin
Synthetic artemisinin used in this study was
Artemisinin 99% powder (parchem). Artemisinin
powder was dissolved in sterile distilled water until
used.
Experimental animal
Day old Cobb broiler chicks were kept in a cage that
previously had been decontaminated with potassium
permanganate (KMnO4) and 40% formalin solution at a
ratio of 1 : 2. Vaccination against New castle disease
was given when the chicks was at 1 week old. The birds
are fed on pelleted ration that did not contain any
coccidiostat. Drinking water was given ad libitum.
Isolation and propagation of E. tenella
Eimeria tenella used in this study was isolated from
infected chicken in Sukabumi. The contents of the
cecum were removed, suspended in solution of Sheather
sugar, filtered and carified by centrifugation. The
presence of oocysts in the supernatant was examined
under a microscope. The E. tenella, after confirmed by
its morphology and size was isolated. The parasites
JITV Vol. 22 No 4 Th. 2017: 196-204
198
were passaged in six days old, free-coccidia chicks. The
oocysts were put into a Petri dish, potassium
bichromate (K2Cr2O7) at a concentration of 2.5% was
added, and incubated at room temperature for three
days in a slightly opened Petri dish. Sporulated oocysts
were used to infect by experimental chickens (Jiang et
al. 2012; Khaier et al. 2015).
E. tenella infection
Prior to experimental infection, the oocysts were
washed in distilled water and inoculated orally to
chicken at a dose of 2000 sporulated oocysts per bird.
The chickens were put into a cage based on the
treatment group. Clinical symptoms and the occurrence
of blood defecation observed until day eight.
Treatment
Thirty five chickens were divided into 7 groups, 5
birds/ group. Following was the groups and treatment
applied:
PI : Uninfected
PII : Infected but untreated
PIII : Infected and treated with 8.5 ppm of
arteminisin powder
PIV : Infected and treated with 17 ppm of
arteminisin powder
PV : Infected and treated with 34 ppm of
arteminisin powder
PVI : Infected and treated with17 ppm of A.
annua leaf extract
PVII : Infected and treated with sulfonamide
compound (sulfadiazine 200 mg)
The treatments were performed once a day since the
first day after E. tenella infection orally for eight days.
Observation of caeca lesion
Necroption was performed eight days after
infection. All abnormalities on the cecum were recorded
and the damage on the mucosal surface was scored,
from scor 0 to 4 (Tabbu 2006). Score 0 was for normal
or no lesion; score 1 was mild lesion, ptechiae spread
on the surface of the caecal mucosa with slight changes
in wall color or contents of the gastro intestinal tract
(cecum); score 2 was moderate lesion characterized by
more severe haemarrhage and a slightly thickening of
the cecum wall; score 3 indicated severe haemarrhage
with blood clots in the caeca lumen, and; a score of 4
indicated very severe lesions characterized by severe,
widespread haemarrhages, blood clots in the lumen and
bluish-red coloring of the caeca walls.
Oocyst Excretion
This examination was carried out daily on several
birds. One gram of chicken feces or litter was
suspended in 29 mL saturated salt solution. Then, the
suspension was centrifuged at 1500 rpm for 10 minutes.
The supernatant was loaded into a McMaster's chamber
and the number of oocyst was counted under a
microscope at 400 x magnification. The total number of
oocysts in both boxes of the Mc Master chamber was
counted and then divided by two. The average oocyst
yield is multiplied by 200 to obtain the number of
oocysts per gram of feces (Khaier et al. 2015).
Body Weight Gain and Haematology
Birds were weight daily from the day of infection
until the day of necropsies. Examination of hemoglobin
(Hb) was performed by Sahli method using
Haemoglobinometer (Ogbe et al. 2010). Measurement
of hematocrit values (packed cell volume, PCV) was
performed according to previous method (Ogbe et al.
2010).
Statistical Analysis
A Completely Randomized Design with 7
treatments was used. Data on body weight gain and
oocysts excretion were analyzed by analysis of variance
(ANOVA) while the data of caeca lesions were
analyzed using Kruskal Wallis. When significant
differences in the means were found, the smallest real
differences test was carried out. For the Hb and PCV,
the values were analyzed descriptively by comparing
values with normal reverence values.
RESULTS AND DISCUSSION
Artemisinin in A. annua is synthesized in the root
and accumulated in leaves and other plant parts.
Artemisinin content in leaves is the highest which may
reaches 89% of the total content of plants (Laughlin
2002). Based on HPLC-UV analysis, (Drăgan et al.
2014) reported that A. annua leaf contained 0.75%
artemisinin (Art), 0.18% dihydroartemisinic acid
(DHAA) and 0.03% artemisinic acid (AA). The buds
and flowers contained only 0.2% artemisinin (Art) and
0.3% dihydroartemisinic acid (DHAA) (Dragan et al.
2013). Brisibe et al. (2009) successfully identified
bioactive compounds in A. annua as flavanoids,
coumarins, steroids, phenolics, purines, lipids, aliphatic
compounds, monoterpenoids, triterpenoids and
sesquiterpenoids. In addition, A. annua leaves also
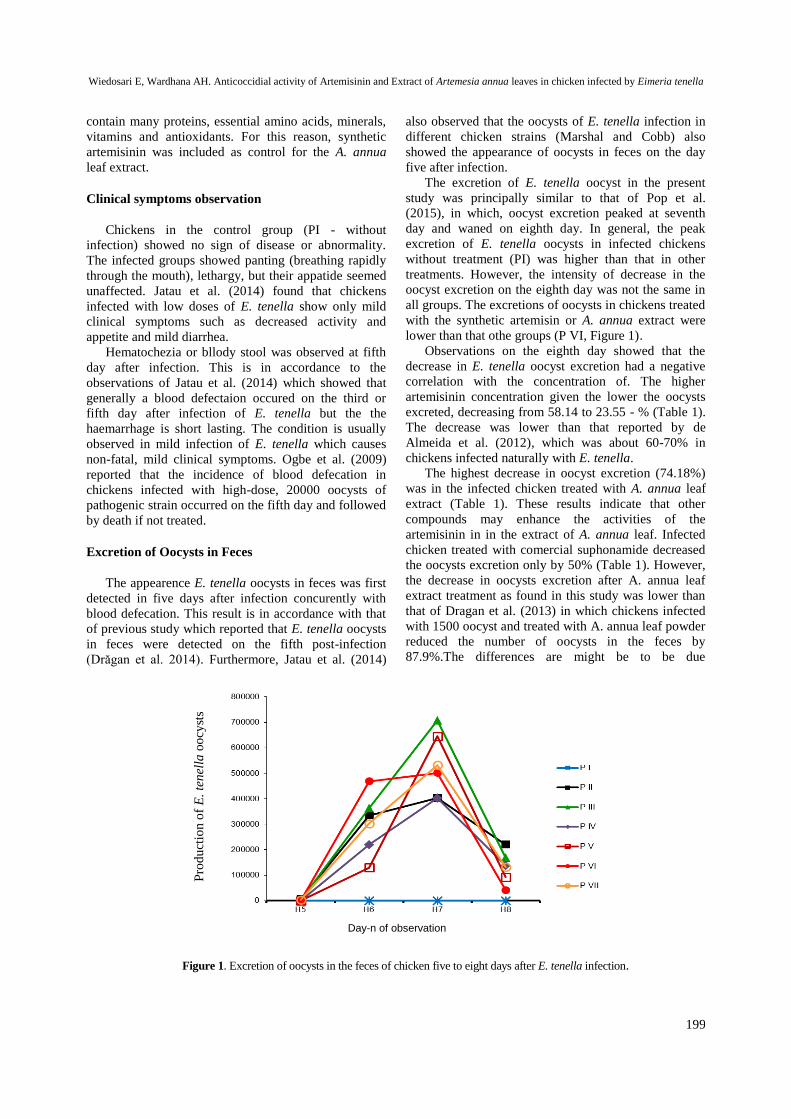
Wiedosari E, Wardhana AH. Anticoccidial activity of Artemisinin and Extract of Artemesia annua leaves in chicken infected by Eimeria tenella
199
contain many proteins, essential amino acids, minerals,
vitamins and antioxidants. For this reason, synthetic
artemisinin was included as control for the A. annua
leaf extract.
Clinical symptoms observation
Chickens in the control group (PI - without
infection) showed no sign of disease or abnormality.
The infected groups showed panting (breathing rapidly
through the mouth), lethargy, but their appatide seemed
unaffected. Jatau et al. (2014) found that chickens
infected with low doses of E. tenella show only mild
clinical symptoms such as decreased activity and
appetite and mild diarrhea.
Hematochezia or bllody stool was observed at fifth
day after infection. This is in accordance to the
observations of Jatau et al. (2014) which showed that
generally a blood defectaion occured on the third or
fifth day after infection of E. tenella but the the
haemarrhage is short lasting. The condition is usually
observed in mild infection of E. tenella which causes
non-fatal, mild clinical symptoms. Ogbe et al. (2009)
reported that the incidence of blood defecation in
chickens infected with high-dose, 20000 oocysts of
pathogenic strain occurred on the fifth day and followed
by death if not treated.
Excretion of Oocysts in Feces
The appearence E. tenella oocysts in feces was first
detected in five days after infection concurently with
blood defecation. This result is in accordance with that
of previous study which reported that E. tenella oocysts
in feces were detected on the fifth post-infection
(Drăgan et al. 2014). Furthermore, Jatau et al. (2014)
also observed that the oocysts of E. tenella infection in
different chicken strains (Marshal and Cobb) also
showed the appearance of oocysts in feces on the day
five after infection.
The excretion of E. tenella oocyst in the present
study was principally similar to that of Pop et al.
(2015), in which, oocyst excretion peaked at seventh
day and waned on eighth day. In general, the peak
excretion of E. tenella oocysts in infected chickens
without treatment (PI) was higher than that in other
treatments. However, the intensity of decrease in the
oocyst excretion on the eighth day was not the same in
all groups. The excretions of oocysts in chickens treated
with the synthetic artemisin or A. annua extract were
lower than that othe groups (P VI, Figure 1).
Observations on the eighth day showed that the
decrease in E. tenella oocyst excretion had a negative
correlation with the concentration of. The higher
artemisinin concentration given the lower the oocysts
excreted, decreasing from 58.14 to 23.55 - % (Table 1).
The decrease was lower than that reported by de
Almeida et al. (2012), which was about 60-70% in
chickens infected naturally with E. tenella.
The highest decrease in oocyst excretion (74.18%)
was in the infected chicken treated with A. annua leaf
extract (Table 1). These results indicate that other
compounds may enhance the activities of the
artemisinin in in the extract of A. annua leaf. Infected
chicken treated with comercial suphonamide decreased
the oocysts excretion only by 50% (Table 1). However,
the decrease in oocysts excretion after A. annua leaf
extract treatment as found in this study was lower than
that of Dragan et al. (2013) in which chickens infected
with 1500 oocyst and treated with A. annua leaf powder
reduced the number of oocysts in the feces by
87.9%.The differences are might be to be due
Figure 1. Excretion of oocysts in the feces of chicken five to eight days after E. tenella infection.
Day-n of observation
Pro
du
ctio
n o
f E
. te
nel
la o
ocy
sts

JITV Vol. 22 No 4 Th. 2017: 196-204
200
to the variation in concentration of active compounds in
the A. annua leaf or differences in the pathogenicity E.
tenella strain used.
The decraese in E. tenella oocysts in chicken feces
after the administration of artemisin is also reported by
del Cacho et al. (2010). A flow-cytometry analysis
revealed that pure artemisinin (99.5%) at 17 ppm dose
damaged the cell wall of oocysts as indicated by the
uptake of propidium iodide resulting in the death or
failure of the oocysts to sporulate. A significant
decrease by 24.85% - 36.34% in spontaneous oocyst
sporulation amount was observed. This finding may
explain the decrease in the excretion of E. tenella
oocysts found in feces (del Cacho et al. 2010).
Chicken body weight
The body weight gain of chicken is presented in
Table 1. The mean body weight gain between groups of
chicken were not significantly different (P>0.05). This
result indicates that treatment of chicken with
artemisinin daily does not significantly affect body
weight gain.
This result is in aggrement with Dragan et al. (2013)
which compared weight gain E. tenella- infected
chicken treated with powder of A. annua leaves,
essential oli of A. annua leaves, Tween 80 and
cocsidiostat (Lasalocid). The means of weight gain
from the age of 7 - 35 days were not significantly
different between treatments. As a matter of fact,
chicken treated with A. annua leaf powder tended to
decrease body weight on day 41. Engberg et al. (2012)
demonstrated that chickens treated with hexane extract
of A. annua leaf at a concentration of 500 mg/kg of diet
showed no significant body weight gain compared to
control treatment.
de Almeida et al. (2012) also reported that there was
no significant differences in mean weight gain between
chickens fed with A. annua leaf and controls. Prior to
infection with E. tenella, chickens fed with A. annua
leaf mixture even had a lower body weight gain than
controls. The study also showed that the chickens
infected with E. tenella and treated with commercial
anti coccidia sulfonamide had similar body weight gain
as that in the group of chicken treated with A. annua
leaf extract.
Several factors may explain those different results.
There is a possibility of variation in the concentration of
compound components contained in A. annua leaf due
to differences in planting season, the differences in the
methods of A. annua leaf preparation, differences in
research design, and differences in the susceptibility
Eimeria species used against active compounds of A.
annua (Drágan et al. 2010; Ferreira & Luthria 2010).
Furthermore, de Almeida et al. (2012) explained that
artemisinin in A. annua causes a bitter taste in the diet
leading to the decrease in chicken palatability.
Therefore, there is a demand for additional natural
ingredients that can reduce bitter taste in feeds such as
Stevia rebaudiana leaves or molasses to increase
chicken palabilaty that ultimately increases body weight
and reduces the production of E. tenella oocysts
(Kheirabadi et al. 2014).
Table 1. Body weight gain and inhibition oocysts excretion in chicken infected by E. tenella treated with artemisinin and A.
annua leaf extract for eight days
Treatment
Average body weight (g) SE
Body weight gain (g)*
Inhibition of
oocysts excretion
(%) Initial End
P I 426 9.27 808 26.34 381 ± 22.67; - -
P II 428 12.00 744 34.87 316 ± 39.06; 00.00 0
P III 450 20.25 860 45.14 410 ± 27.34; 29.75 23.54
P IV 426 42.38 794 41.06 368 ± 62.40; 16.46 37.5
P V 422 25.57 880 24.29 458 ± 27.82; 44.94 58.14
P VI 430 21.08 794 24.82 364 ± 16.91; 15.19 74.18
P VII 432 14.28 797 21.35 364 ± 16.31; 15.19 50.00
* Not significantly difference (P>0.05)
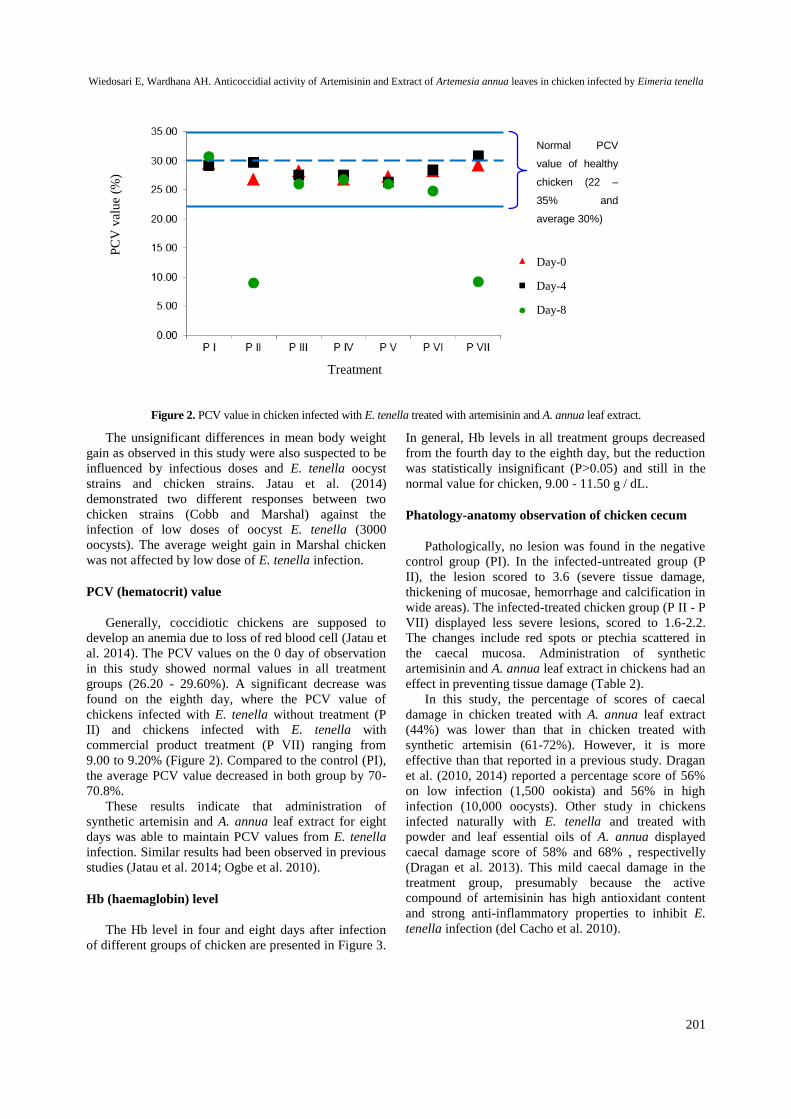
Wiedosari E, Wardhana AH. Anticoccidial activity of Artemisinin and Extract of Artemesia annua leaves in chicken infected by Eimeria tenella
201
Normal PCV
value of healthy
chicken (22 –
35% and
average 30%)
Treatment
PC
V v
alu
e (%
)
Figure 2. PCV value in chicken infected with E. tenella treated with artemisinin and A. annua leaf extract.
The unsignificant differences in mean body weight
gain as observed in this study were also suspected to be
influenced by infectious doses and E. tenella oocyst
strains and chicken strains. Jatau et al. (2014)
demonstrated two different responses between two
chicken strains (Cobb and Marshal) against the
infection of low doses of oocyst E. tenella (3000
oocysts). The average weight gain in Marshal chicken
was not affected by low dose of E. tenella infection.
PCV (hematocrit) value
Generally, coccidiotic chickens are supposed to
develop an anemia due to loss of red blood cell (Jatau et
al. 2014). The PCV values on the 0 day of observation
in this study showed normal values in all treatment
groups (26.20 - 29.60%). A significant decrease was
found on the eighth day, where the PCV value of
chickens infected with E. tenella without treatment (P
II) and chickens infected with E. tenella with
commercial product treatment (P VII) ranging from
9.00 to 9.20% (Figure 2). Compared to the control (PI),
the average PCV value decreased in both group by 70-
70.8%.
These results indicate that administration of
synthetic artemisin and A. annua leaf extract for eight
days was able to maintain PCV values from E. tenella
infection. Similar results had been observed in previous
studies (Jatau et al. 2014; Ogbe et al. 2010).
Hb (haemaglobin) level
The Hb level in four and eight days after infection
of different groups of chicken are presented in Figure 3.
In general, Hb levels in all treatment groups decreased
from the fourth day to the eighth day, but the reduction
was statistically insignificant (P>0.05) and still in the
normal value for chicken, 9.00 - 11.50 g / dL.
Phatology-anatomy observation of chicken cecum
Pathologically, no lesion was found in the negative
control group (PI). In the infected-untreated group (P
II), the lesion scored to 3.6 (severe tissue damage,
thickening of mucosae, hemorrhage and calcification in
wide areas). The infected-treated chicken group (P II - P
VII) displayed less severe lesions, scored to 1.6-2.2.
The changes include red spots or ptechia scattered in
the caecal mucosa. Administration of synthetic
artemisinin and A. annua leaf extract in chickens had an
effect in preventing tissue damage (Table 2).
In this study, the percentage of scores of caecal
damage in chicken treated with A. annua leaf extract
(44%) was lower than that in chicken treated with
synthetic artemisin (61-72%). However, it is more
effective than that reported in a previous study. Dragan
et al. (2010, 2014) reported a percentage score of 56%
on low infection (1,500 ookista) and 56% in high
infection (10,000 oocysts). Other study in chickens
infected naturally with E. tenella and treated with
powder and leaf essential oils of A. annua displayed
caecal damage score of 58% and 68% , respectivelly
(Dragan et al. 2013). This mild caecal damage in the
treatment group, presumably because the active
compound of artemisinin has high antioxidant content
and strong anti-inflammatory properties to inhibit E.
tenella infection (del Cacho et al. 2010).
Day-0
Day-4
Day-8
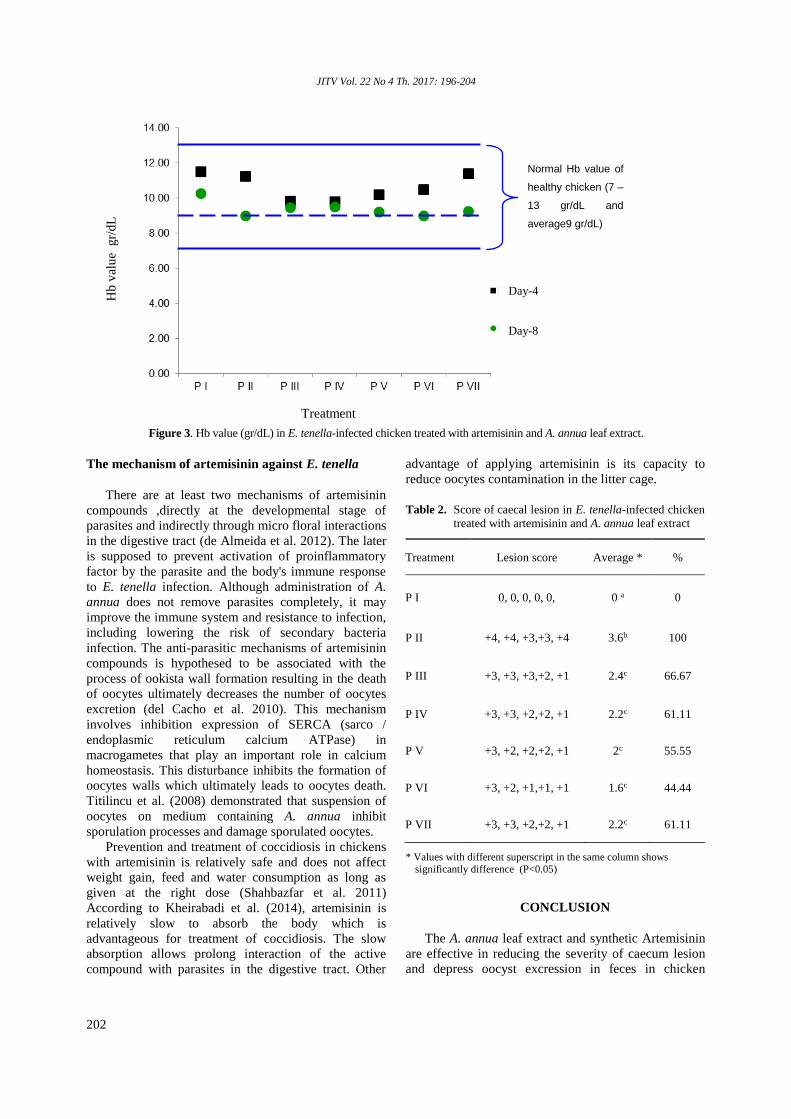
JITV Vol. 22 No 4 Th. 2017: 196-204
202
Normal Hb value of
healthy chicken (7 –
13 gr/dL and
average9 gr/dL)
Figure 3. Hb value (gr/dL) in E. tenella-infected chicken treated with artemisinin and A. annua leaf extract.
The mechanism of artemisinin against E. tenella
There are at least two mechanisms of artemisinin
compounds ,directly at the developmental stage of
parasites and indirectly through micro floral interactions
in the digestive tract (de Almeida et al. 2012). The later
is supposed to prevent activation of proinflammatory
factor by the parasite and the body's immune response
to E. tenella infection. Although administration of A.
annua does not remove parasites completely, it may
improve the immune system and resistance to infection,
including lowering the risk of secondary bacteria
infection. The anti-parasitic mechanisms of artemisinin
compounds is hypothesed to be associated with the
process of ookista wall formation resulting in the death
of oocytes ultimately decreases the number of oocytes
excretion (del Cacho et al. 2010). This mechanism
involves inhibition expression of SERCA (sarco /
endoplasmic reticulum calcium ATPase) in
macrogametes that play an important role in calcium
homeostasis. This disturbance inhibits the formation of
oocytes walls which ultimately leads to oocytes death.
Titilincu et al. (2008) demonstrated that suspension of
oocytes on medium containing A. annua inhibit
sporulation processes and damage sporulated oocytes.
Prevention and treatment of coccidiosis in chickens
with artemisinin is relatively safe and does not affect
weight gain, feed and water consumption as long as
given at the right dose (Shahbazfar et al. 2011)
According to Kheirabadi et al. (2014), artemisinin is
relatively slow to absorb the body which is
advantageous for treatment of coccidiosis. The slow
absorption allows prolong interaction of the active
compound with parasites in the digestive tract. Other
advantage of applying artemisinin is its capacity to
reduce oocytes contamination in the litter cage.
Table 2. Score of caecal lesion in E. tenella-infected chicken
treated with artemisinin and A. annua leaf extract
Treatment Lesion score Average * %
P I 0, 0, 0, 0, 0, 0 a 0
P II +4, +4, +3,+3, +4 3.6b 100
P III +3, +3, +3,+2, +1 2.4c 66.67
P IV +3, +3, +2,+2, +1 2.2c 61.11
P V +3, +2, +2,+2, +1 2c 55.55
P VI +3, +2, +1,+1, +1 1.6c 44.44
P VII +3, +3, +2,+2, +1 2.2c 61.11
* Values with different superscript in the same column shows significantly difference (P<0.05)
CONCLUSION
The A. annua leaf extract and synthetic Artemisinin
are effective in reducing the severity of caecum lesion
and depress oocyst excression in feces in chicken
Treatment
Hb
val
ue
gr/
dL
Day-4
Day-8
Wiedosari E, Wardhana AH. Anticoccidial activity of Artemisinin and Extract of Artemesia annua leaves in chicken infected by Eimeria tenella
203
infected by E. tenella. Extract of A. annua leaf that
contains artemisinin can be used as an alternative to
commercial sulfonamides.
ACKNOWLEDGEMENT
The authors would to thank Indonesian Research
Center for Veterinary Science for the financial support.
Also to M. Dahlan, Opi Sajeli and Soedrajat for
technical support during this research.
REFERENCES
Abbas RZ, Iqbal Z, Khan MN, Zafar MA, Zia MA. 2010.
Anticoccidial activity of Curcuma longa L. in broilers.
Brazilian Arch Biol Technol. 53:63–67.
Adamu N, Boonkaewwan C, Gongruttananun N, Vongpakorn
M. 2013. Hematological, biochemical and
histopathological changes caused by Coccidiosis in
chickens. J Nat Sci. 47:238–246.
de Almeida GF, Horsted K, Thamsborg SM, Kyvsgaard NC,
Ferreira JFS, Hermansen JE. 2012. Use of Artemisia
annua as a natural coccidiostat in free-range broilers and
its effects on infection dynamics and performance. Vet
Parasitol. 186:178–187.
Arab HA, Rahbari S, Rassouli A, Moslemi MH, Khosravirad
F. 2006. Determination of artemisinin in Artemisia
sieberi and anticoccidial effects of the plant extract in
broiler chickens. Trop Anim Health Prod. 38:497–503.
Aryanti, Ermayanti TM, Prinadi KI, Dewi RM. 2006. Uji daya
antimalarial Artemesia spp. terhadap Plasmodim
falciparum. Maj Farm Indones. 17:81–84.
Brisibe EA, Umoren UE, Brisibe F, Magalhäes PM, Ferreira
JFS, Luthria D, Wu X, Prior RL. 2009. Nutritional
characterisation and antioxidant capacity of different
tissues of Artemisia annua L. Food Chem. 115:1240–
1246.
Brisibe EA, Umoren UE, Owai PU, F B. 2008. Dietary
inclusion of dried Artemesia annua leaves for
management of coccidiosis and growth enhancement in
chickens. African J Biotechnol. 7:4083–4092.
del Cacho E, Gallego M, Francesch M, Quílez J, Sánchez-
Acedo C. 2010. Effect of artemisinin on oocyst wall
formation and sporulation during Eimeria tenella
infection. Parasitol Int. 59:506–511.
Cooper KK, Songer JG. 2009. Necrotic enteritis in chickens:
A paradigm of enteric infection by Clostridium
perfringens type A. Anaerobe. 15:55–60.
Dalloul R, Lillehoj HS. 2006. Poultry coccidiosis: recent
advancements in control measures and vaccine
development. Expert Rev Vaccines. 5:143–163.
Dragan L, Gyorke A, Ferreira JFS, Oprea O, Pop IA, Dragan
M, Dan I, Pop L, Pastiu AI, Micrean V, et al. 2013.
Performance and infection dynamics with Eimeria spp.
in broilers medicated with Artemisia annua in
comparison with laslocid and kept in field conditions.
Lucr Stiint Med Vet. 46:51–62.
Drăgan L, Györke A, Ferreira JFS, Pop IA, Dunca I, Drăgan
M, Mircean V, Dan I, Cozma V. 2014. Effects of
Artemisia annua and Foeniculum vulgare on chickens
highly infected with Eimeria tenella (Phylum
Apicomplexa). Acta Vet Scand. 56:22.
Drágan L, Titilincu A, Dan I, Mircean V. 2010. Effects of
Artemesia annua and Pimpinella anisum on Eimeria
tenella (Phylum Apicomplexa) low infection in
chickens. Sci Parasitol. 11:77–82.
El-Sadawy H, El-Khateeb RM, Kutkat MA. 2009. Preliminary
in vitro trial on the efficacy of products of Xenorhabdus
and Photorhabdus spp. On Eimeria oocyst. Blobal Vet.
3:489–494.
Engberg RM, Grevsen K, Ivarsen E, Fretté X, Christensen LP,
Højberg O, Jensen BB, Canibe N. 2012. The effect of
Artemisia annua on broiler performance, on intestinal
microbiota and on the course of a Clostridium
perfringens infection applying a necrotic enteritis
disease model. Avian Pathol. 41:369–376.
Ferreira JF, Luthria DL. 2010. Drying Affects Artemisinin,
Dihydroartemisinic Acid, Artemisinic Acid, and the
Antioxidant Capacity of Artemisia annua L. Leaves. J
Agric Food Chem. 58:1691–1698.
Ferreira JF, Peaden P, Keiser J. 2011. In vitro trematocidal
effects of crude alcoholic extracts of Artemisia annua,
A. absinthium, Asimina triloba, and Fumaria officinalis.
Parasitol Res. 109:1585–1592.
Gholamrezaie SL, Mohammadi M, Jalali SJ, Abolghasemi
SA, Roostaie AMM. 2013. Extract and leaf powder
effects of Artemesia annua on performance, cellular and
humoral immunity in broilers. Iran J Vet Res. 14:15–20.
Habibi H, Firouzii S, Nili H, Razavi M, Asadi SL, Daneshi S.
2016. Anticoccidial effects of herbal extracts on Eimeria
tenella infection in broiler chickens: in vitro and in vivo
study. J Parasit Dis. 40:401–407.
Jatau ID, Odika AN, Thlama M, Talba AM, Bisalla M, Musa
IW. 2014. Response of 2 breeds of broiler chicks to
experimental infection with low dose of Eimeria tenella
sporulated oocysts. Turkish J Vet Sci. 38:398–404.
Jiang L, Zhao Q, Zhu S, Han H, Dong H, Huang B. 2012.
Establishment of Eimeria tenella (local isolate) in
chicken embryos. Parasite. 19:285–289.
Khaier MAM, Abdelhalim AI, Abukashawa SMA. 2015.
Isolation and morphological identification of Eimeria
tenella (Family : Eimeriidae) from Khartoum State
(Sudan). J Appl Ind Sci. 3:177–181.
Kheirabadi KP, Katadj JK, Bahadoran S, da Silva JAT,
Samani AD, Bashi MC. 2014. Comparison of the
anticoccidial effect of granulated extract of Artemisia
sieberi with monensin in experimental coccidiosis in
broiler chickens. Exp Parasitol. 141:129–133.
JITV Vol. 22 No 4 Th. 2017: 196-204
204
Laughlin JC. 2002. Post-harvesting drying treatment effects
on antimalarial constituents of Artemesia annua L. In:
Bernanth J, editor. Proc Int Conf MAP Acta Hort.
Tasmania (Australia); p. 315–320.
Lee JT, Broussard C, Fitz-Coy S, Burke P, Eckert NH,
Stevens SM, Anderson PN, Anderson SM, Caldwell DJ.
2009. Evaluation of live oocyst vaccination or
salinomycin for control of field-strain Eimeria challenge
in broilers on two different feeding programs. J Appl
Poult Res. 18:458–464.
Morris GM, Woods WG, Richards DG, Gasser RB. 2007.
Investigating a persistent coccidiosis problem on a
commercial broiler–breeder farm utilising PCR-coupled
capillary electrophoresis. Parasitol Res. 101:583–589.
Ogbe AO, Atawodi, S E Abdu P, Oguntayo BO, Noel D.
2010. Oral treatment of Eimeria tenella -infected
broilers using aqueous extract of wild mushroom
(Ganoderma sp): effect on haematological parameters
and histopathology lesions. Afr J Biotechnol. 9:8923–
8927.
Ogbe AO, Atawodi SE, Abdu PA, Sannusi A, Itodo AE. 2009.
Changes in weight gain, faecal oocyst count and packed
cell volume of Eimeria tenella-infected broilers treated
with a wild mushroom (Ganoderma lucidum) aqueous
extract : article. J S Afr Vet Assoc. 80:97–102.
Pop L, Györke A, Tǎbǎran AF, Dumitrache MO, Kalmár Z,
Magdaş C, Mircean V, Zagon D, Balea A, Cozma V.
2015. Effects of artemisinin in broiler chickens
challenged with Eimeria acervulina, E. maxima and E.
tenella in battery trials. Vet Parasitol. 214:264–271.
Shahbazfar AA, Mardjanmehr SH, Arab HA, Rassouli A,
Abdollahi M. 2011. Effects of artemisinin in broiler
chickens following chronic oral intake. Trop Anim
Health Prod. 43:843–849.
Tabbu CR. 2006. Penyakit ayam dan penanggulangannya. Vol
2. Yogyakarta (Indones): Kanisius.
Titilincu A, Santha B, Cozma V. 2008. Effects of polioel 3 on
sporulation and inefectivity of Eimeria oocysts. Lucr
Stiint Med Vet. 41:372–378.
Tresnani G, Prastowo J, Nurcahyo W, Daryono. 2012. Profil
protein stadium sporozoit Eimeria tenella isolat
Yogyakarta melalui analisis protein SDS-PAGE. J Vet.
13.
Wiedosari E, Suhirman S, Sembiring BBR. 2014. Pengaruh
jamu herbal sebagai antikoksidia pada ayam pedaging
yang diinfeksi Eimeria tenella. J Penelit Tanam Ind.
20:9–16.

Rachmawati F, Ariyanti T. Contamination of Escherichia coli O157:H7 in dairy cow farms
205
Contamination of Escherichia coli O157:H7 in Dairy Cow Farms
Rachmawati F, Ariyanti T
Indonesian Research Center fo Veterinary Science (IRCVS), Jl. RE Martadinata No. 30, Bogor 16114
(receiced: 23-10-2017; revised: 27-11-2017; accepted 18-12-2017)
ABSTRAK
Rachmawati F, Ariyanti T. Kontaminasi bakteri Escherichia coli O157:H7 pada peternakan sapi perah. JITV 22(4):
205-211. DOI: http://dx.doi.org/10.14334/jitv.v22i4.1674
Bakteri E.coli O157:H7 adalah foodborne pathogen yang membahayakan kesehatan manusia. Ternak sapi
merupakan reservoir utama dari bakteri ini. Bakteri E.coli O157:H7 yang keluar dari ternak kemudian dapat
mengkontaminasi lingkungan sekitar, produk susu, daging, tanaman sayur-sayuran ataupun buah, sehingga dapat
berperan sebagai sumber infeksi dan mengakibatkan penyakit pada manusia. Penelitian ini dilakukan untuk
identifikasi adanya kontaminasi bakteri E.coli O157:H7 pada peternakan sapi perah sehingga diketahui situasinya
terkini. Pengambilan sampel untuk penelitian ini adalah peternakan sapi perah di wilayah Depok, Cianjur,
Sukabumi dan Bandung. Jenis sampel yang diambil yaitu ulas dubur sapi atau feses segar dan air minum ternak.
Isolasi bakteri E.coli dilakukan pada media mTSB, MacConkey Agar, Eosin Methylene Agar. Identifikasi bakteri
sebagai E.coli O157:H7 dilakukan dengan uji biokimia dan untuk penetapan serotipe digunakan uji agglutinasi
menggunakan antiserum monospesifik untuk O157 dan H7. Hasil penelitian memperlihatkan bahwa sampel kotoran
dan air minum sapi dari seluruh peternakan sapi perah yang diteliti telah terkontaminasi oleh bakteri E.coli. Dari
178 sampel yang diuji telah diidentifikasi sebanyak 126 (70,8%) sampel diantaranya mengandung bakteri E.coli.
Dari jumlah 126 sampel yang mengandung bakteri E.coli, ternyata sebanyak 94 (74,6%) adalah bakteri E.coli
serotipe O157:H7. Keberadaan kontaminan bakteri E.coli O157:H7 pada peternakan sapi perah, potensi dampaknya
bagi kesehatan manusia, serta upaya pencegahan dan pengendalian bakteri ini dibahas dalam tulisan ini.
Kata Kunci: Sapi Perah, E. coli, E. coli O157:H7, Lingkungan
ABSTRACT
Rachmawati F, Ariyanti T. Contamination of Escherichia coli O157:H7 in dairy cow farms. JITV 22(4): 205-211.
DOI: http://dx.doi.org/10.14334/jitv.v22i4.1674
E. coli serotype O157:H7 is a foodborne pathogen that endangers human health. Cattle are the main reservoir of
this bacterium. E. coli O157:H7 that come out of the livestock can contaminate the surrounding environment, dairy
products, meat, vegetable or fruit crops, so it can act as a source of infection and disease in humans. This research
was conducted to identify the contamination of E. coli O157:H7 on dairy cow farms so the current situation is
known. Sampling area for this research was dairy cow farm in Depok, Cianjur, Sukabumi, and Bandung. Types of
samples taken are cow anal swab or fresh feces and livestock drinking water. Isolation of E. coli bacteria was done
on mTSB media, agar MacConkey, and Eosin Methylene Agar. Identification of bacteria as E. coli O157:H7 was
done by biochemical test and for serotype determination was used agglutination test using monospesifik antiserum
for O157 and H7. The results of research showed that of the total 178 samples had 126 (70.8%) samples containing
E. coli bacteria. Of the 126 samples containing E. coli bacteria, 94 (74.6%) were determined as E. coli serotype
O157:H7. The presence of E. coli O157:H7 contaminants on dairy cow farms, their potential impacts on human
health, prevention and control of the disease is discussed in this paper.
Key Words: Dairy Cow, E. coli, E. coli O157:H7, Environment
INTRODUCTION
Escherichia coli (E. coli) is a bacterium that lives
normally in the digestive tract of animals and humans.
E. coli is one of the bacteria belonging to the family of
Enterobacteriaceae in the form of a straight, single,
paired or short chain rod, measuring 2.0-6 µm in length
and 1.1-1 µm in diameter. This bacterium is a Gram-
JITV Vol. 22 No 4 Th. 2017: 205-211
206
negative, motile or non-motil, aerobic or anaerobic
facultative group. E. coli bacteria were first discovered
by Theodore Escherich in 1885 (Scheutz & Nancy
2005).
E. coli O157:H7 is one of the E.coli serotypes
belonging to the pathogenic Enterohaemorrhagic
Escherichia coli (EHEC) group. The cow is an EHEC
reservoir, and the bacteria can contaminate the
environment as well as its contacts with feces. This
bacteria is associated with outbreak of foodborne
pathogen and sporadic cases in humans in the world
(Karmali et al. 2010; Rangel et al. 2005).
The typical symptoms of EHEC infection in
livestock and humans are bloody diarrhea. Bleeding
diarrhea as a results from verotoxin or Shiga Like Toxin
(SLT) produced by EHEC, especially serotype
O157:H7. This serotipe was first isolated in 1982 in the
United States, during an outbreak of haemorrhagic
colitis (HC) in Oregon and Michigan (Bonardi et al.
1999). This serotype is often called verotoksigenik E.
coli (VTEC). Verotoksin is extracellular, neurotoxic
and immunogenic (Ball et al. 1994; Pirro et al. 1995).
Human EHEC infection results in haemorrhagic colitis
(HC) and haemolytic uremic syndrome (HUS) were
also reported (Konowalchuk et al. 1977). Since it was
first isolated, the EHEC infection that caused an
outbreak of food poisoning was reported as a result of
consuming milk, beef, vegetables and fruits
contaminated by E. coli O157:H7. In the United States
the disease is the second order after Salmonella
infection (CDC 1997; Karmali 1989; Hara-Kudo et al.
2000).
In Canada, there was human HUS case as a result
consumption of milk in a dairy farm in Canada in 1986.
The E. coli O157:H7 was isolated from young cow
feces in that dairy farm. Other studies showed that E.
coli O157:H7 has been isolated from faecal samples
from 16 head of cattle or calves and 1 dairy cow from
22 farms, 1 calf from fattening cattle; 2 samples of beef,
and 1 milk sample (Wells et al. 1991). Bonardi et al.
(1999) reported that the VTEC O157 strain was isolated
from faecal samples collected from one of the
slaughterhouses in Northern Italy, faecal samples from
59 head of cows, faecal sample from 450 cows of 133
farms, 37 cows from 223 fattening places, 22 from 137
dairy cows that were derived from 60 farms.
In Indonesia, the presence of EHEC bacteria was
reported in dairy calves in Bandung, Sukabumi,
Cianjur, and Bogor, with symptoms of bloody diarrhea.
The bacteria were identified belong to the VTEC O157
group that lyses vero cells (Kusmiyati & Supar 1998),
However no further identification whether the bacteria
as serotype O157:H7. Suwito (2009) identified the
presence of this E. coli O157:H7 in milk samples from
dairy cow farms in Bogor, Sukabumi and Cianjur
districts. Other studies reported that E. coli O157:H7
was detected as bacterial contamination of beef, fresh
milk, pasteurized milk, crabs, white shrimp, bottled
water and refills (Sartika et al. 2005; Suardana et al.
2007; Kandau 2009; Marlina et al. 2009. Aryanti &
Maryam (2015) also reported that of 120 samples
consist of meat, fresh milk, beef meatballs, beef jerky,
sausage, abon, UHT milk, yoghurt and cheese, 39
(32%) of those contained E. coli O157:H7. Suardana et
al. (2016) reported 5 (8.6%) of 58 samples of cow feces
in seven villages in Kecamatan Petang, Kabupten
Badung, Bali were positive for E. coli O157:H7.
This research was conducted to identify the
contamination of E. coli O157:H7 bacteria on dairy cow
farms so the current situation is known to minimize risk
to human health.
MATERIALS AND METHODS
Bacteria of reference
Bacteria used as a reference in this study were E.
coli O157:H7 ATCC 43984.
Collection of samples
Samples, swab of anal or fresh feces and drink water
of cow, were collected from dairy farms in Depok,
Cianjur, Sukabumi and Bandung areas of West Java
Province. The feces were taken using sterile cotton
swabs and then were inserted into a sterile bottle
containing bacto pepton water (transport medium).
Sample of drinking water was taken from the pot and
put it in sterile plastic bag. All samples were stored in
an ice box and transported to the Bacteriolgy
Laboratory, IRCVS Bogor.
Isolation and identification of E. coli
Isolation of E. coli O157:H7 followed the procedure
of BSN (2008) with modification, i.e 1 gram of feses, or
1 ml of cattle drinking water added with 9 ml mTriptic
Soy Broth (mTSB) which was added Novobiocin, then
incubated for ± 24 hours at 37˚C. Furthermore, the
culture was grown on MacConkay Agar or Eosin
Methylene Blue (EMB) agar medium at 37°C for ± 24
hours. The alleged colony of E. coli will indicate
lactose or pinkish pink fermentation on MacConkey
media Agar or metallic green in EMB. Furthermore,
Gram staining is done, planted it in identification media
such as Triple Sugar Iron (TSIA), semisolid media /
motility test and Indol test, Methyl Red, Voges
Prouskauer, Simmon's Citrate (IMViC). After the
bacteria was identified as E.coli, the culture was
subsequently grown on Sorbitol MacConkay Agar
(SMAC) added with Cefixime-Tellurite selective
supplementation according to Oxoid Microbiology

Rachmawati F, Ariyanti T. Contamination of Escherichia coli O157:H7 in dairy cow farms
207
Product procedure, then incubated at 37°C for 16-20
hours. Confirmation of serotype E. coli O157: H7 was
performed by serotyping it using a monospecific O157
and H7 antiserum (Bonardi et al. 1999; Barrow &
Feltham 2003).
Serotyping isolates as E. coli O157:H7
All of the isolated E.coli were examined by
agglutination test using monospecific O157 and a
monospecific H7 antiserum produced from previous
studies (Supar et al. 1988). All E. coli isolates were
grown on Nutrient Agar (NA) medium and incubated at
37˚C for ± 24 hours were then suspended with a
physiological NaCl solution with turbidity equivalent to
Mc Farland No. 10. Furthermore, the bacterial
suspension was heated to a temperature of 100°C for 2
hours or at 121°C for 1 hour, then cooled and checked
with a monospecific antiserum O157. Agglutination test
was carried out by means of twenty microliters of
E. coli antigen (sample) mixed with 20 μL
monospecific O157 antiserum. The agglutination occure
within 1-3 minutes in the form fine clumps like sand.
As for examination of somatic antigen H7, all
E. coli isolates were grown on a semisolid medium in a
tube equipped with a craigic tubes and were incubated
at 37°C for ± 24 hours. Bacterial cells grown outside
the craigic tube were grown onto NA medium and
incubated at 37°C for ± 24 hours. By using a sterile ose,
the culture of E. coli on NA medium was taken and
placed it on the glass object, then it was added with 20
μL sterile aquades and mixed it with 20 μL
monospesifik H7 antiserum for agglutintaion test. The
agglutination occurs within 1-3 minutes.
Statistical analysis
Data of microbes identified, percentage and its
distribution was descriptively analyzed.
RESULTS AND DISCUSSION
The results of sample collection from dairy cow
farms and summary of laboratory testing is presented in
Table 1.
To identify contamination status of dairy cow farm
with the E. coli O157:H7, West Java Province was used
for sample collection since the population of dairy cattle
in this area is high enough, ie 122.811 (22.5%) of total
population 545.000 head of dairy cattle in Indonesia
(DGLAH 2017).
Biochemical examination of the bacteria isolated
from samples (feces and drinking water) grown on the
media for Eosin Methylene Blue and IMViC showed
that 126 (70.78%) of 178 samples containing E .coli.
Number percentage of E. coli isolated in feces samples
was around 40.40 - 85.18 %, while E.coli in drinking
water of cow was from 11.11 – 100%. (Table 1). The
E.coli contamination was found in all dairy cow farm
located in all location under studied.
Confirmation test of the E. coli isolated into
O157:H7 serotype using O157 and H7 monospesific
antiserum showed that 94 (74.6%) of 126 E. coli
isolates were positive as O157:H7. Distribution of
location contaminated by E. coli O157:H7 serotype and
its percentage can be seen in Table 1, indicating that all
locations were contaminated by the microbe.
Off the total E. coli serotype O157:H7 isolated,
1.06% (1/94) of E. coli O157:H7 isolate was from the
original faecal samples of dairy cow farms in Depok; as
much as 20.2% (19/94) of E. coli O157:H7 isolates
were from faecal samples of dairy cow farm in Cianjur;
2.12% (2/94) of E.coli O157:H7 isolate were obtained
from drinking water sample of dairy cow farm in
Cianjur, and as much as 34% (32/94) isolate E. coli
O157:H7 obtained from faecal sample of dairy cow
farm in Sukabumi, and 1.06% (1/94) isolate E. coli
O157:H7 obtained from drinking water of dairy cow
farm. Isolates of E. coli O157:H7 obtained from the
Bandung area were 31.9% (30/94) of faecal samples
and 1.06% (1/94) of the drinking water in the farm.
The number and percentage of E. coli O157:H7
identified from E. coli isolated from the feces samples
of its size varied between 14.28 - 100% (Table 1, Figure
1). While in drinking water for livestock on farms the
contamination may reach 100% (Table1, Figure 2).
In this study, the percentage of E. coli O157:H7
identified in dairy farms is quite high from faecal
samples. In drinking water of the dairy cow the
microbes extracted from 100% of the farms. This data
may indicate that majority of dairy cow farm in
Indonesia seem to be infected with E. coli O157:H7.
Based on the results of this study, shows that all
dairy cow farm in all location has been found the
existence of E. coli O157:H7, both in feces and
drinking water of dairy cow. E. coli O157:H7 found in
the feces potentially may contaminate the environment
around farms, such as drinking water pot, equipment,
soil, grass, milk udders, milk, other healthy cow, or
technician who operate the pens, or the farmer and
family member itself, so that horizontal transmission
can occur.
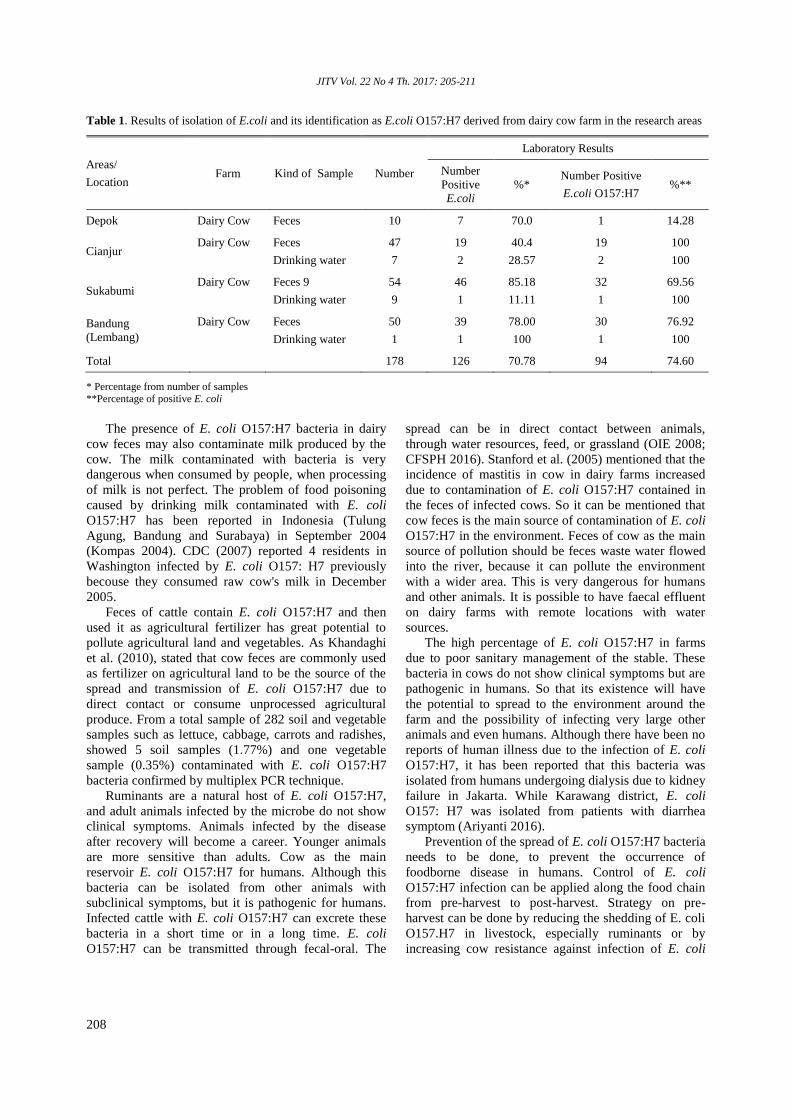
JITV Vol. 22 No 4 Th. 2017: 205-211
208
Table 1. Results of isolation of E.coli and its identification as E.coli O157:H7 derived from dairy cow farm in the research areas
Areas/
Location Farm Kind of Sample Number
Laboratory Results
Number
Positive
E.coli
%* Number Positive
E.coli O157:H7 %**
Depok Dairy Cow Feces 10 7 70.0 1 14.28
Cianjur Dairy Cow Feces
Drinking water
47
7
19
2
40.4
28.57
19
2
100
100
Sukabumi Dairy Cow Feces 9
Drinking water
54
9
46
1
85.18
11.11
32
1
69.56
100
Bandung
(Lembang)
Dairy Cow Feces
Drinking water
50
1
39
1
78.00
100
30
1
76.92
100
Total 178 126 70.78 94 74.60
* Percentage from number of samples **Percentage of positive E. coli
The presence of E. coli O157:H7 bacteria in dairy
cow feces may also contaminate milk produced by the
cow. The milk contaminated with bacteria is very
dangerous when consumed by people, when processing
of milk is not perfect. The problem of food poisoning
caused by drinking milk contaminated with E. coli
O157:H7 has been reported in Indonesia (Tulung
Agung, Bandung and Surabaya) in September 2004
(Kompas 2004). CDC (2007) reported 4 residents in
Washington infected by E. coli O157: H7 previously
becouse they consumed raw cow's milk in December
2005.
Feces of cattle contain E. coli O157:H7 and then
used it as agricultural fertilizer has great potential to
pollute agricultural land and vegetables. As Khandaghi
et al. (2010), stated that cow feces are commonly used
as fertilizer on agricultural land to be the source of the
spread and transmission of E. coli O157:H7 due to
direct contact or consume unprocessed agricultural
produce. From a total sample of 282 soil and vegetable
samples such as lettuce, cabbage, carrots and radishes,
showed 5 soil samples (1.77%) and one vegetable
sample (0.35%) contaminated with E. coli O157:H7
bacteria confirmed by multiplex PCR technique.
Ruminants are a natural host of E. coli O157:H7,
and adult animals infected by the microbe do not show
clinical symptoms. Animals infected by the disease
after recovery will become a career. Younger animals
are more sensitive than adults. Cow as the main
reservoir E. coli O157:H7 for humans. Although this
bacteria can be isolated from other animals with
subclinical symptoms, but it is pathogenic for humans.
Infected cattle with E. coli O157:H7 can excrete these
bacteria in a short time or in a long time. E. coli
O157:H7 can be transmitted through fecal-oral. The
spread can be in direct contact between animals,
through water resources, feed, or grassland (OIE 2008;
CFSPH 2016). Stanford et al. (2005) mentioned that the
incidence of mastitis in cow in dairy farms increased
due to contamination of E. coli O157:H7 contained in
the feces of infected cows. So it can be mentioned that
cow feces is the main source of contamination of E. coli
O157:H7 in the environment. Feces of cow as the main
source of pollution should be feces waste water flowed
into the river, because it can pollute the environment
with a wider area. This is very dangerous for humans
and other animals. It is possible to have faecal effluent
on dairy farms with remote locations with water
sources.
The high percentage of E. coli O157:H7 in farms
due to poor sanitary management of the stable. These
bacteria in cows do not show clinical symptoms but are
pathogenic in humans. So that its existence will have
the potential to spread to the environment around the
farm and the possibility of infecting very large other
animals and even humans. Although there have been no
reports of human illness due to the infection of E. coli
O157:H7, it has been reported that this bacteria was
isolated from humans undergoing dialysis due to kidney
failure in Jakarta. While Karawang district, E. coli
O157: H7 was isolated from patients with diarrhea
symptom (Ariyanti 2016).
Prevention of the spread of E. coli O157:H7 bacteria
needs to be done, to prevent the occurrence of
foodborne disease in humans. Control of E. coli
O157:H7 infection can be applied along the food chain
from pre-harvest to post-harvest. Strategy on pre-
harvest can be done by reducing the shedding of E. coli
O157.H7 in livestock, especially ruminants or by
increasing cow resistance against infection of E. coli
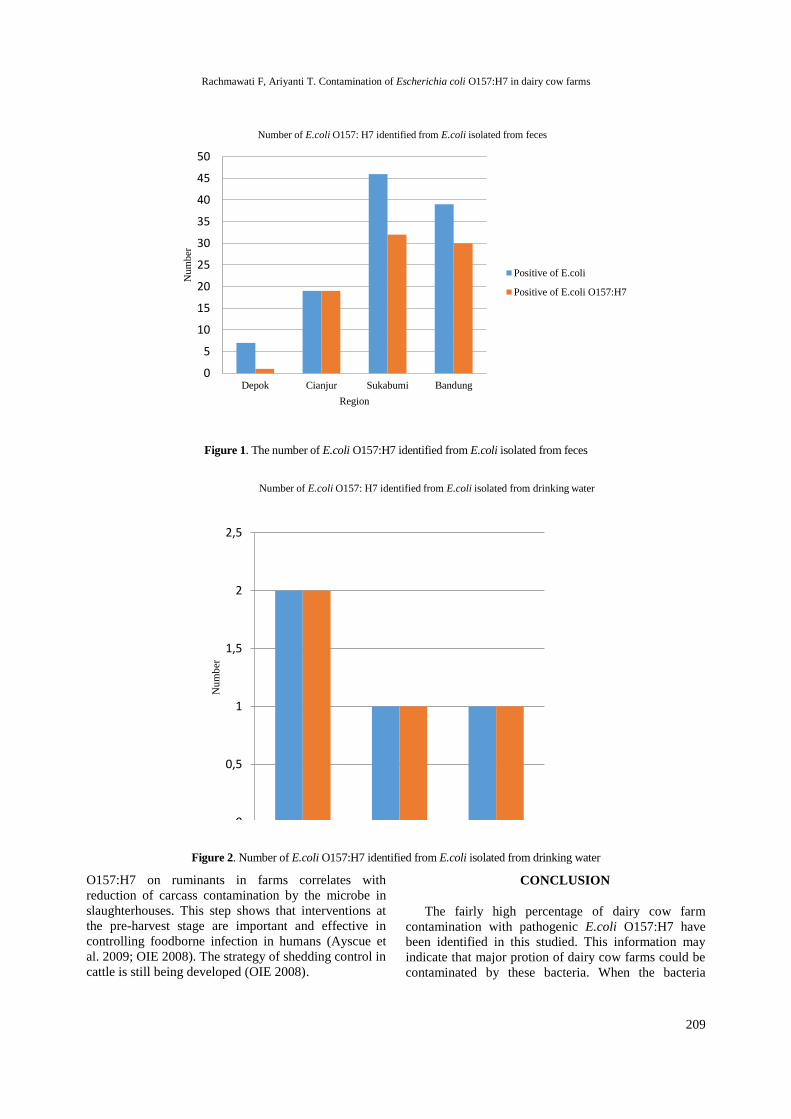
Rachmawati F, Ariyanti T. Contamination of Escherichia coli O157:H7 in dairy cow farms
209
0
5
10
15
20
25
30
35
40
45
50
Depok Cianjur Sukabumi Bandung
Nu
mb
er
Region
Number of E.coli O157: H7 identified from E.coli isolated from feces
Positive of E.coli
Positive of E.coli O157:H7
Figure 1. The number of E.coli O157:H7 identified from E.coli isolated from feces
0
0,5
1
1,5
2
2,5
Cianjur Sukabumi Bandung
Nu
mb
er
Number of E.coli O157: H7 identified from E.coli isolated from drinking water
Positive of E.coli
Positive E.coli O157:H7
Figure 2. Number of E.coli O157:H7 identified from E.coli isolated from drinking water
O157:H7 on ruminants in farms correlates with
reduction of carcass contamination by the microbe in
slaughterhouses. This step shows that interventions at
the pre-harvest stage are important and effective in
controlling foodborne infection in humans (Ayscue et
al. 2009; OIE 2008). The strategy of shedding control in
cattle is still being developed (OIE 2008).
CONCLUSION
The fairly high percentage of dairy cow farm
contamination with pathogenic E.coli O157:H7 have
been identified in this studied. This information may
indicate that major protion of dairy cow farms could be
contaminated by these bacteria. When the bacteria
JITV Vol. 22 No 4 Th. 2017: 205-211
210
found in the feces, the bacteria may found also in
drinking water of cattel in the farms. The presenst E.
coli O157:H7 in the cow farm has a potential risk to
human health through contamination to wider
environments such as soil, grass, drinking water source
(well), pons, ditch, vegetables, or fruits planted in
surrounding contaminated cow farm areas. Prevention
and control of E.coli O157:H7 infection should always
be promoted such as improvement management of
animal health and healthy culture in the community.
Further research needs to be done is to test the
sensitivity of microbes to antibiotics.
REFERENCES
Aryanti T, Maryam R. 2015. Deteksi Escherichia coli
O157:H7 pada pangan asal ternak dan olahannya
dengan teknik IDAS-ELISA. Noor SM, Handiwirawan
E, Martindah E, Widiastuti R, Sianturi RG, Herawati T,
Purba M, Anggraeny YN, Batubara A, editors.
Prosiding Seminar Nasional Teknologi Peternakan dan
Veteriner. Bogor (Indones). Indonesian Center for
Animal Research and Development. p. 681-687.
Ariyanti T. 2016. Isolasi, Karakterisasi dan pemanfaatan
bakteriofaga untuk identifikasi Escherichia coli
O157:H7 (Disertation). [Jakarta (Indones)]: Universitas
Indonesia.
Ayscue P, Lanzas C, Ivanek R, Grohn YT. 2009. Modeling
on-farm Escherichia coli O157:H7 population
dynamics. Foodborne Pathol Dis. 6:461-470.
[BSN] Badan Standarisasi Nasional. 2008. Standar Nasional
Indonesia Nomor 2897-2008: Tentang metode
pengujian cemaran mikroba dalam daging, telur dan
susu, serta hasil olahannya. Jakarta (Indones): Badan
Standarisasi Nasional.
Ball HJ, Finlyerry D, Burn L, Mackie DP. 1994. Application
of monoclonal antibody base on ELISAs to detect
verotoxins in cattle feses. Res Vet Sci. 57:225-232.
Barrow GI, Feltham RKA. 1993. Cowan and Steel's manual
for the identification of medical bacteria. 3rd ed.
Cambridge (UK): United Kingdom Syndicate of the
University of Cambridge.
Bonardi S, Maggia E, Bottarellia A, Pacciarinib ML,
AnsuinibA, Vellinic G, Morabitod S, Capriolid A. 1999.
Isolation of Verocytotoxin-producing Escherichia coli
O157:H7 from cattle at slaughter in Italy. Vet
Microbiol. 67:203-211.
[CDC] Center of Disease Control and Prevention. 1997.
Human pathogens on the farms. Morbidity and
Mortality Weekly Report. 42:258-263.
[CDC] Center of Disease Control and Prevention. 2007.
Escherichia coli O157:H7 infection associated with
drinking raw milk Washington and Oregon, November--
December 2005. Morbidity and Mortality Weekly
Report. 56:165-167.
[CFSPH] The Center for Food Security and Public Health.
2016. Enterohemorrhagic Escherichia coli and Other E.
coli Causing Hemolytic Uremic Syndrome. [Akses
Februari 03 2017]. http://www.cfsph.iastate.edu.
[DGLAH] Directorate General of Livestock and Animal
Health. 2017. Statistik peternakan dan kesehatan hewan
(livestock and animal health statistics). Jakarta
(Indones): Directorate General of Livestock and Animal
Health, Ministry of Agriculture.
Hara-Kudo Y, Ikedo M, Kodaka H, Nakagawa H, Goto K,
Masuda T, Konuma H, Kojima T, Kumagai S. 2000.
Selective enrichment with a resuscitation step for
isolation of freeze-injured Escherichia coli O157:H7
from foods. Appl Environ Microbiol. 66:2866-2872.
Kandau FEF. 2009. Analisis molekuler Escherichia coli
serotipe O157:H7 pada air minum dalam kemasan dan
isi ulang menggunakan teknik Polymerase Chain
Reaction (PCR) dengan rfbE sebagai gen target. Chem
Prog. 2:8-14.
Karmali MA. 1989. Infection by verotoxin producing
Escherichia coli. Clinic Microbiol Rev. 2:15-38.
Karmali MA, Gannon V, Sargeant JM. 2010. Verocytotoxin-
producing Escherichia coli (VTEC). Vet Microbiol.
140:360-370.
Khandaghi J, Razavilar V, Barzgari A. 2010. Isolation of
Escherichia coli O157:H7 from manure fertilized farms
and raw vegetables grown on it, in Tabriz city in Iran.
Afr J Microbiol Res. 4:891-895.
Kompas. 2004. 11 siswa SD keracunan susu kotak. Sabtu 4
September 2004. Jakarta (Indones): Kompas Gramedia
Konowalchuk J, Speirs JL, Starvic S. 1977. Vero response to
a cytotoxin of Escherichia coli. Infect Immun. 18:775-
779.
Kusmiyati, Supar. 1998. Escherichia coli verotoksigenik dari
anak sapi perah penderita diare. Hardjoutomo S,
Darminto, Darmono, Suhardono, Bahri S, editors.
Prosiding Seminar Hasil-hasil Penelitian Veteriner.
Bogor (Indones): Balai Penelitian Veteriner. p. 103-108.
Marlina, Husni E, Amalinda F, Radu S, Nishibuchi M. 2009.
Isolasi bakteri pathogen Escherichia coli O157:H7 pada
sampel seafood dan deteksi gena flich7 secara PCR.
Majalah Farmasi Indonesia. 20:73-76.
Mustika OC, Pinatih KJP, Suardana IW. 2015. Uji kepekaan
Escherichia coli O157:H7 feses sapi di Kecamatan Kuta
Selatan Badung Bali terhadap antibiotik. Indones Medic
Vet. 4:342-350.
[OIE] Office International des Epizooties. 2008. Terrestrial
manual: Verocytotoxigenic Escherichia coli. [accessed
October 11th 2011]. http://www.oie.int.
Pirro F, Wieler LH, Failing K, Bauerfeind R, GBaljer G.
1995. Neutralizing antibody against Shiga-like toxins
from Escherichia coli in colostra and sera of cattle. Vet
Microbiol. 43:131-141.
Rangel JM, Sparling PH, Crowe C, Griffin PM, Swerdlow
DL. 2005. Epidemiology of Escherichia coli O157:H7
Rachmawati F, Ariyanti T. Contamination of Escherichia coli O157:H7 in dairy cow farms
211
Outbreaks, United Status, 1982-2002. Emerging
Infectious Diseases. 11(4):603-609. [accessed
December 6th 2016]. www,cdc.gov/eid.
Sartika RAD, Indrawani YM, Sudiarti T. 2005. Analisis
mikrobiologi Escherichia coli O157:H7 pada hasil
olahan hewan sapi dalam proses produksinya. Makara
Kesehatan. 9:23-28.
Scheutz F, Nancy AS. 2005. Bergey’s manual of systematic
bacteriology. In: Garrity GM, editor. 2nd ed. Vol. Two
Part B. New York (USA): Springer Publishing. p. 607-
613.
Stanford K, Croy D, Bach SJ, Wallins GL, Zahiroddini H,
McAllister TA. 2005. Ecology of Escherichia coli
O157:H7 in commercial dairies in Southern Alberta. J
Dairy Sci. 88:4441–4451.
Suardana IW, Sumiarto B, dan Lukman DW. 2007. Isolasi
dan identifikasi Escherichia coli O157:H7 pada daging
sapi di Kabupaten Badung Provinsi Bali. J Vet. 8:16-23.
Suardana IW, Putri PJRA, Besung INK. 2016. Isolasi dan
identifikasi Escherichia coli O157:H7 pada feses sapi di
Kecamatan Petang, Kabupaten Badung-Bali. Buletin
Veteriner Udayana. 8:30-35.
Supar, Hirst RG, Patten BE. 1988. K-adhesins and O-
serogroups of enterotoxigenic Escherichia coli in calves
and piglets with diarrhoea. Proceedings of the sixth
conggress federation of Asian Vet Ass. Bali (Indones).
p: 479-485.
Stringer SC, George SM, Peck MW. 2000. Thermal
inactivation of Escherichia coli 0157:H7. J Appl
Microbiol Symp Suppl. 88:798-898.
Synge BA. 2000. Verocytotoxin-producing Escherichia coli: a
veterinary view. Symp Ser Soc Appl Microbiol. 88:31S-
37S
Wells JG, Shipman LD, Greene KD, Sowers EG, Green JH,
Cameron DN, Downes FP, Martin ML, Griffin PM,
Ostroff SM, Potte ME, Tauxe RV, Wachsmuth IK.
1991. Isolation of Escherichia coli serotype O157:H7
and other shiga-like-toxin-producing E. coli from dairy
cattle. J Clin Microbiol. 29:985-989.
.

213
Key Words Index
Ammoniation 179
Artemesia annua 196
Artemisinin 196
Aspergillus niger 100
Aspergillus oryzae 100
Bali Cattle 173
Beef Cattle 165
Biomass Production 135
Bovine 80
Branched-Chain Amino Acid 179
Buffalo Calve 59
C. calothyrsius 114
Carcass Cuts 24
Cellulose 101
Coccidiosis 196
Cocoa Pod Husk 100
Corn Cob 179
Crossbred 16
Cryopreservation 30
Cultivar 135
Cytokine 151
Dairy Cattle 9
Dairy Cow 205
Detection 91
Dietary Lysine 1
DMSO 30
E. coli 205
E. coli O157:H7 205
Eimeria tenella 196
ELISA 80
Empty Carcass 24
Energy Level 188
Environment 205
EPMp Broiler Duck 1
ESAG6/7 Gene 38
Feed 114
Feed Technology Adoption 9
Female SenSi-1 Agrinak Chicken 24
Fertility Genes 165
Fertilization 173
Forage 124
Gaok Chicken 30
Genetic Polymorphism 165
Goats 51, 188
Gonad 144
Green Concentrated Pellets 114
Grower Period 63
Growth 63
HyCole Rabbit 16
Indigofera. zollingeriana 114
IFN γ 151
IL-10 151
Legume 124
Leptospirosis 80
LipL32 80
Local White Muscovy 63
Mammary Fat Pads (MFP) 57
Mannanase 101
Maturation 173
Molasses 179
Native Chicken 144
NZW Rabbit 16
Oil Palm 124
Oocytes 173
Ovarian Status 173
Palm Oil Fronds 51
Pasteurella multocide 91
Path Analysis 9
PGCs 30, 144
Polymerase Chain Reaction (PCR) 91
Protein level 188
Qualitative Character 68
Quality 135
Quantitative Character 68
SenSi-1 Agrinak Chicken 68
Sequencing 91
Snoring Disease 91
Sorghum 135
Starter Period 63
Supplementation 51
Surra 151
T. evansi 38
TNF-α 151
Total Mixed Ration 188
Trypanosoma evansi 151
Udder 57
Udder Parenchymal (PAR) 57
Ultrasonography 57
Variability 38
Virulence 38
Zinc 51
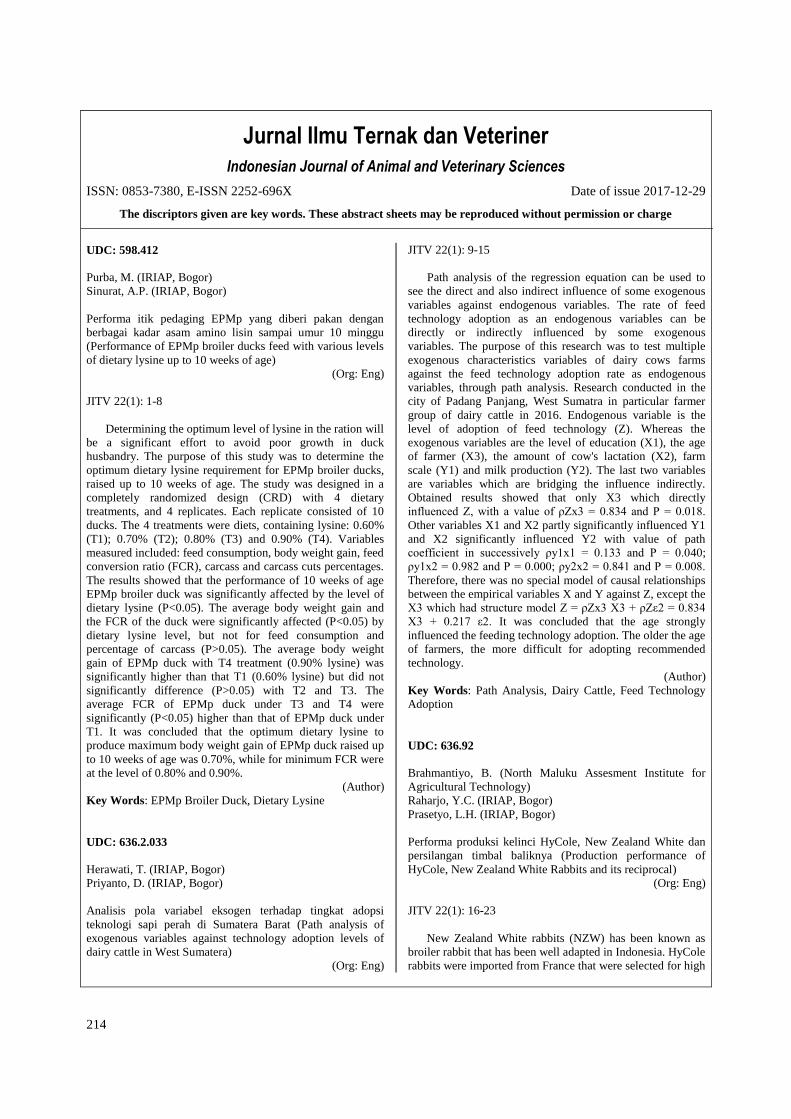
JITV Vol. 22 No. 4 2017: 213-222
214
Jurnal Ilmu Ternak dan Veteriner
Indonesian Journal of Animal and Veterinary Sciences
ISSN: 0853-7380, E-ISSN 2252-696X Date of issue 2017-12-29
The discriptors given are key words. These abstract sheets may be reproduced without permission or charge
UDC: 598.412
Purba, M. (IRIAP, Bogor)
Sinurat, A.P. (IRIAP, Bogor)
Performa itik pedaging EPMp yang diberi pakan dengan
berbagai kadar asam amino lisin sampai umur 10 minggu
(Performance of EPMp broiler ducks feed with various levels
of dietary lysine up to 10 weeks of age)
(Org: Eng)
JITV 22(1): 1-8
Determining the optimum level of lysine in the ration will
be a significant effort to avoid poor growth in duck
husbandry. The purpose of this study was to determine the
optimum dietary lysine requirement for EPMp broiler ducks,
raised up to 10 weeks of age. The study was designed in a
completely randomized design (CRD) with 4 dietary
treatments, and 4 replicates. Each replicate consisted of 10
ducks. The 4 treatments were diets, containing lysine: 0.60%
(T1); 0.70% (T2); 0.80% (T3) and 0.90% (T4). Variables
measured included: feed consumption, body weight gain, feed
conversion ratio (FCR), carcass and carcass cuts percentages.
The results showed that the performance of 10 weeks of age
EPMp broiler duck was significantly affected by the level of
dietary lysine (P<0.05). The average body weight gain and
the FCR of the duck were significantly affected (P<0.05) by
dietary lysine level, but not for feed consumption and
percentage of carcass (P>0.05). The average body weight
gain of EPMp duck with T4 treatment (0.90% lysine) was
significantly higher than that T1 (0.60% lysine) but did not
significantly difference (P>0.05) with T2 and T3. The
average FCR of EPMp duck under T3 and T4 were
significantly (P<0.05) higher than that of EPMp duck under
T1. It was concluded that the optimum dietary lysine to
produce maximum body weight gain of EPMp duck raised up
to 10 weeks of age was 0.70%, while for minimum FCR were
at the level of 0.80% and 0.90%.
(Author)
Key Words: EPMp Broiler Duck, Dietary Lysine
UDC: 636.2.033
Herawati, T. (IRIAP, Bogor)
Priyanto, D. (IRIAP, Bogor)
Analisis pola variabel eksogen terhadap tingkat adopsi
teknologi sapi perah di Sumatera Barat (Path analysis of
exogenous variables against technology adoption levels of
dairy cattle in West Sumatera)
(Org: Eng)
JITV 22(1): 9-15
Path analysis of the regression equation can be used to
see the direct and also indirect influence of some exogenous
variables against endogenous variables. The rate of feed
technology adoption as an endogenous variables can be
directly or indirectly influenced by some exogenous
variables. The purpose of this research was to test multiple
exogenous characteristics variables of dairy cows farms
against the feed technology adoption rate as endogenous
variables, through path analysis. Research conducted in the
city of Padang Panjang, West Sumatra in particular farmer
group of dairy cattle in 2016. Endogenous variable is the
level of adoption of feed technology (Z). Whereas the
exogenous variables are the level of education (X1), the age
of farmer (X3), the amount of cow's lactation (X2), farm
scale (Y1) and milk production (Y2). The last two variables
are variables which are bridging the influence indirectly.
Obtained results showed that only X3 which directly
influenced Z, with a value of ρZx3 = 0.834 and P = 0.018.
Other variables X1 and X2 partly significantly influenced Y1
and X2 significantly influenced Y2 with value of path
coefficient in successively ρy1x1 = 0.133 and P = 0.040;
ρy1x2 = 0.982 and P = 0.000; ρy2x2 = 0.841 and P = 0.008.
Therefore, there was no special model of causal relationships
between the empirical variables X and Y against Z, except the
X3 which had structure model Z = ρZx3 X3 + ρZε2 = 0.834
X3 + 0.217 ε2. It was concluded that the age strongly
influenced the feeding technology adoption. The older the age
of farmers, the more difficult for adopting recommended
technology.
(Author)
Key Words: Path Analysis, Dairy Cattle, Feed Technology
Adoption
UDC: 636.92
Brahmantiyo, B. (North Maluku Assesment Institute for
Agricultural Technology)
Raharjo, Y.C. (IRIAP, Bogor)
Prasetyo, L.H. (IRIAP, Bogor)
Performa produksi kelinci HyCole, New Zealand White dan
persilangan timbal baliknya (Production performance of
HyCole, New Zealand White Rabbits and its reciprocal)
(Org: Eng)
JITV 22(1): 16-23
New Zealand White rabbits (NZW) has been known as
broiler rabbit that has been well adapted in Indonesia. HyCole
rabbits were imported from France that were selected for high
Abstract: JITV Vol. 22, 2017
215
reproduction and growth rate. This study was aimed to
evaluate the productivity of HyCole and New Zealand White
rabbits and their reciprocal as the basis to develop broiler
rabbit which adaptive to tropical climate. Forty heads of doe
(PBPB) and 17 heads of buck (PAPA) of HyCole rabbit, and
30 heads of doe and 6 heads of buck of New Zealand White
rabbits (NN) were used. The ration was given according to
IRIAP standard ration (18 % CP, 2500 kcal ME/kg and 14 %
CF). The diet was provided in the morning and the evening,
and drinking water was provided ad libitum. Reproductive
performance of does (litter size at birth, litter size at wean,
mortality and weekly does body weight) and the kit’s growth
performance (weekly body weight from weaning until the age
of 20 weeks) were evaluated. Data were analyzed using the
SAS program (SAS 2001). Rabbits growth data were
periodically analyzed by Gompertz model (Blasco & Gomez
1993). HyCole rabbit which was bred in Indonesia had
production performance better than NZW rabbit and PAN
crossbred (HyCole bucks x NZW does) had the potential to
be bred as superior rabbit adaptive to tropical climate because
they had hybrid vigor of the number of litter size at birth and
kit’s growth rate.
(Author)
Key Words: HyCole Rabbit, NZW Rabbit, Crossbred
UDC: 636.58
Hidayat, C. (IRIAP, Bogor)
Iskandar, S. (IRIAP, Bogor)
Estimasi berat karkas dan potongan karkas ayam SenSi-1
Agrinak betina (Weight estimation of empty carcass and
carcass cuts of female SenSi-1 Agrinak chicken)
(Org: Eng)
JITV 22(1): 24-29
SenSi-1 Agrinak chicken is Indonesian local chicken that
was selected for growth rate for six generations. The aim of
this study was to estimate of carcass weight and carcass cuts
of female SenSi-1 Agrinak chicken, based on age and live
weight. The chicks were reared intensively in colony wire
cages and they were slaughtered with Islamic method when
they reached age of 5, 8 and 15 weeks. Empty carcass and
carcass cuts were weight in fresh. Data were analyzed using
correlation and regression analysis method. Results showed
that the live weight had a high positive correlation to carcass
weight and carcass cuts weight of female SenSi-1 Agrinak
chickens aged 5, 8 and 15 weeks. Estimation of live weight,
carcass, carcass cuts, gizzard, liver and abdominal fat of
female SenSi-1 Agrinak, using mathematical model, showed
small value differences (0.09 - 4.43%) from the actual data. It
was concluded that female SenSi-1 Agrinak chicken’s carcass
weight and carcass cuts, could be estimated based on of age
in days and live-body weight in gram without slaughtering.
(Author)
Key Words: Female SenSi-1 Agrinak Chicken, Empty
Carcass, Carcass Cuts
UDC: 636.58
Kostaman, T. (IRIAP, Bogor)
Yusuf, T.L. (Department of Clinic, Reproduction, and
Pathology, Faculty of Veterinary Medicine, Bogor
Agricultural University)
Fahrudin, M. (Department of Anatomy, Physiology and
Pharmacology, Faculty of Veterinary Medicine, Bogor
Agricultural University)
Setiadi, M.A. (Department of Clinic, Reproduction, and
Pathology, Faculty of Veterinary Medicine, Bogor
Agricultural University)
Efektivitas konsentrasi DMSO terhadap recovery rate dan
viabilitas primordial germ cell ayam Gaok (Effectiveness of
DMSO concentration on recovery rate and viability of
primordial germ cell of Gaok chicken)
(Org: Eng)
JITV 22(1) 30-37
Recent technological developments to produce germ line
chimeras with primordial germ cell (PGC) transfer into the
recipient embryo provide an opportunity to conserve and
retrieval of chicken genetic resources in complete form. The
study was conducted to obtain the most effective DMSO
percentage to recovery rate and viability of Gaok chicken
PGC after freezing which will later be feasible to be
transferred. In this study, the eggs of Gaok chicken were
incubated for about 2.5 - 3 days to obtain embryos at stages
14 - 16. Blood retrieval was done through the dorsal aorta
using micropipettes under microscope. The procedure of PGC
isolation of Gaok chicken with centrifugation gradient was
using nycodenz as a substance. Commercially available
cryoprotectants (dimethyl sulfoxide = DMSO) were used for
PGC freezing. Isolated and frozen PGCs of Gaok chicken
were diluted with cryoprotectants containing 2.5; 5 and 10%
DMSO in fetal bovine serum (FBS). The recovery rate of 2.5;
5 and 10% DMSO concentration were 36.4; 48.2 and 48 %
respectively. The viability of PGC after freezing was
significantly higher for 5% DMSO compared with 2.5%
DMSO (P<0.05), but not different from 10% DMSO. It can
be concluded that the concentration DMSO of 5 % was
effectve contration in freezing Gaok chicken PGC.
(Author)
Key Words: Cryopreservation, DMSO, PGCs, Gaok Chicken
UDC: 578.5
Sawitri, D.H. (IRCVS, Bogor)
Wardhana, A.H. (IRCVS, Bogor)
Variabilitas genetik dari gen ESAG 6/7 Isolat T. evansi
(Genetic variability of ESAG6/7 gene Trypanosoma evansi)
(Org: Eng)
JITV 22(1): 38-50
Trypanosoma evansi as an agent of Surra is one of the
crucial parasitic diseases that cause great economic losses in
Indonesia. These parasites need iron for growth and
propagation phase which is obtained by receptor-mediated
uptake of host transferin. The transferrin receptors are
encoded by Expression Site Associated Genees (ESAGs).

JITV Vol. 22 No. 4 2017: 213-222
216
ESAG6/7 encodes transferrin receptors which reported have
different affinities of a different host. The distinction of T.
evansi pathogenicity is supposed to cause variability in the
ESAG6/7 gene. This research was aimed to investigate the
variability of genes ESAG6/7 T. evansi with different
virulence in mice. This research was conducted in two steps:
bioassay pathogeneicity in mice and analysis of ESAG6/7
gene sequences. The median survival time of mice was
investigated after each group of mice infected by 25 T. evansi
isolates from buffaloes where its geographically differ. The
test results showed a difference of pathogenic virulence on 25
T. evansi isolates in mice. Sequence analysis of the ESAG6/7
gene from 25 T. evansi isolates origin from Indonesia tended
to be homogeneous on the transferrin binding site but there
was variability in the hypervariable site. These changes are
able to separate high and low virulence of the T. evansi
isolates. Phylogenetic tree analysis was formed 11 clades of
25 T. evansi. High virulence T. evansi was included in clades
7 and 10, while low virulence T. evansi was included in clade
5 and 11 and the moderate virulence was divided into those
four clades.
(Author)
Key Words: T. evansi, ESAG6/7 Gene, Variability,
Virulence
UDC: 636.085.8
Ginting, S.P. (IGRS, Medan)
Antonius (IGRS, Medan)
Simanihuruk, K. (IGRS, Medan)
Suplementasi campuran Zn anorganik dan organik pada
kambing Boerka yang diberi pakan pelepah kelapa sawit
(Supplementation of inorganic and organic zinc mixtures in
feed of Boerka goats fed by oil palm fronds)
(Org: Eng)
JITV 22(2): 51-56
Zinc is an element of many enzymes and hormones
having very important physiological functions in the body so
that it influences the production and reproduction of animals
including the activity of the rumen microflora in degrading
fiber in a diet. The aim of this study was to improve the
performances of goats offered oil palm fronds based diets
through the supplementation of 35 ppm of Zn in the form of
inorganic (ZnO) and organic zinc (Zn-methionine). Thirty
mature male crossing Boer x Kacang (Boerka) goats were
divided into five groups and randomly allocated to one of the
five feed treatments as follows: P1: complete feed based on
the palm oil fronds (Control), P2: P1 + 35 ppm Zn (100%
Zn0), P3: P1 + 35 ppm Zn (75% Zn0 + 25% Zn-methionine),
P4: P1 + 35 ppm Zn (50% Zn0 + 50% Zn-methionine), P5:
P1 + 35 ppm Zn (25% Zn0 + 75% Zn-methionine). The
experiment was conducted in a Completely Randomized
Design of six replications. Increasing the proportion of Zn
methionine in the mixtures elevated feed consumption, and
the highest feed intake was observed in goats received 75%
Zn-methionine/25% ZnO. Daily body weight gains was only
affected (P<0.05) by the 75% Zn-methionine/25% ZnO
supplement. The concentration of Zn in the blood increased
significantly (P<0.05) when Zn methionine was added and it
increased steadily as the proportion of Zn methionine greater
in the mixtures, but the VFA compositions of the rumen were
not affected (P>0.05) by Zn supplementation. It is concluded
that the performances of goat fed complete diets based on the
oil palm fronds could be improved by supplementation of
inorganic and organic Zn mixture.
(Author)
Key Words: Goats, Zinc, Supplementation, Palm Oil Fronds
UDC: 599.735.51
Ulum, M.F. (Departement of Reproduction and Pathology
Clinic, Faculty of Veterinary, Bogor Agricultural University)
Raudlowi, H. (Education Program for Doctor of Veterinary
Medicine, Faculty of Veterinary, Bogor Agricultural
University)
Krisnan, R. (IRIAP, Bogor)
Pencitraan ultrasonografi jaringan parenkim ambing anak
kerbau Murrah dan Rawa (Ultrasonography of udder
parenchymal tissue of Murrah and Swamp buffalo calves)
(Org: Eng)
JITV 22(2): 57-62
The examination of udder through a parameter such as
parenchymal tissue (PAR) and mammary fat pads (MFP) can
be used to evaluate health status and the development of
mammary gland. This research was conducted to evaluate the
PAR and MFP of Murrah (n=4) and Swamp (n=4) buffalo
heifer calve udder using brightness-mode ultrasonography
transcutaneously. Eight buffalo consisted of Murrah (n=4)
and Swamp (n=4) buffalo aged of six months old reared at
Indonesian Research Institute for Animal Production, Ciawi,
Bogor were used this study. Ultrasonography imaging was
performed on the udder nipple for the four quarters: left front,
left back, right front, and right back. The ultrasonography
image was evaluated and then assessed for score,
echogenicity and PAR area on MFP. The results showed that
sonogram PAR was aniconic to hypoechoic, while the MFP
was hypoechoic to hyperechoic. Even though there was a
variation in the four quarters of udder, Murrah buffalo calve
had the highest (P>0.05) value of score, echogenicity, and
PAR area compared to the Swamp buffalo.
(Author)
Key Words: Udder, Buffalo Calve, Udder Parenchymal
(PAR), Mammary Fat Pads (MFP), Ultrasonography
UDC: 636.5
Susanti, T. (IRIAP, Bogor)
Purba, M. (IRIAP, Bogor)
Pertumbuhan entog putih lokal periode starter dan grower
(The growth local white muscovy growth during starter and
grower period)
(Org: Eng)
JITV 22(2): 63-67
Abstract: JITV Vol. 22, 2017
217
Livestock animals with relatively fast growth and great
body weight are potential as a producer of meat. In Indonesia,
the local muscovy, especially the feathered white is one of the
meat-producing livestock. However, an analysis of the
growth on local white muscovy is still rarely done. Therefore,
the purpose of this study was to determine the point of
inflection as growth variables, thus simplifying the
preparation of development programs of local white
muscovy. A total of 168 of the local unsex white muscovy
were examined for their growth since the DOD until 112 days
of age. The data of growth i.e. body weight individually
examined in every two weeks. The data were analyzed using
Gompertz model. The result obtained was the growth
equation of local white Muscovy based on the model of
Gompertz: Y=2591.3*exp (-3.8636*exp-0.0272*t). Based on
these equations, the point of inflection of the local white
muscovy occurred at the age of 50 days with a weight of
953.29 g. The maximum body weight gain achieved was
2591.30 g. It is conclude that the growth of local white
muscovy was relatively slow, but the body weight was very
heavy.
(Author)
Key Words: Local White Muscovy, Growth, Starter Period,
Grower Period
UDC: 636.58
Hasnelly (IRIAP, Bogor)
Iskandar, S. (IRIAP, Bogor)
Sartika, T. (IRIAP, Bogor)
Karakteristik kualitatif dan kuantitatif ayam SenSi-1 Agrinak
(Qualitative and quantitative characteristics of SenSi-1
Agrinak chicken)
(Org: Eng)
JITV 22(2): 68-79
One of local chicken breeds develop in Indonesian
Research Institute for Animal Production (IRIAP) is local
SenSi-1 Agrinak chicken. This new improved local-meat-type
breed was released with Ministry Agriculture Decree Number
39/Kpts/PK.020/1/2017 on 20th January 2017. SenSi-1
Agrinak was originally selected from native Sentul chicken
breed obtained from Ciamis district in West Java Province.
Selection criteria were two feather colors of grey or black
spotted white (pucak), which were applied to both males and
females. Pea-comb type was also one criterion for males,
applied at the age of 10 weeks. Live weight at the age of 10
weeks with the selection intensity of 25% was applied to each
generation of males chicken. Selection proceeded for six
generations. Selection program was carried out under
standard feed formulae containing around 17% crude protein
with 2850 kcal ME/ kg, and containing other nutrients
following the ones recommended for modern chicken of
White Leghorn. Observation was conducted on each of about
2000 young chickens of grey and of Pucak SenSi-1 Agrinak
both males and females age of 10 and 84 weeks. Results
showed that grey SenSi-1 Agrinak chicken in total
population, had: i) Grey feather color distribution of 55.51%
in males, and 60.77% in females; ii) Yellow shank color of
52.51% in males, and 33.33% in females; iii) Pea type comb
of 90.98% in males, and 89.23% in females; iv). Ten weeks
live weight of 886.38+142.93 g/bird in males, and 739.17+
118.87 in females. Pucak SenSi-1 Agrinak chicken in total
population, had: i) Pucak feather color of 75.65% in males,
and 8330% in females; ii) Yellow shank color of 51.91% in
males, and 36.59% in females; iii) Pea type comb of 91.55%
in males, and 92.28% in females; iv) Ten weeks live weight
of 908.76+ 130.98 g/bird in males, and 750.53+ 110.56 g/bird
in females. Whilst for grey SenSi-1 Agrinak male chicken
after selection had live weight at 10 weeks old of 1015+107
g/bird, and for Pucak SenSi-1 Agrinak male chicken was
1051+76 g/bird. This initial performance information for
those two breeds of considerably improved local chicken can
be used as the base of information for SenSi-1 Agrinak breed
for male line of meat type of local chicken breeding.
(Author)
Key Words: Qualitative Character, Quantitative Character,
SenSi-1 Agrinak Chicken
UDC: 599.735.51
Sumarningsih (IRCVS, Bogor)
Susanti (IRCVS, Bogor)
Tarigan, S. (IRCVS, Bogor)
Evaluasi pada LipL32 ELISA untuk deteksi bovine
leptospirosis di Jawa Barat (Evaluation of LipL32 ELISA for
detection of bovine leptospirosis in West Java)
(Org: Eng)
JITV 22(2): 80-90
The current diagnosis of leptospirosis, micro
Agglutination Test (MAT) and isolation, is expensive,
impractical and technically demanding. This study was aimed
at developing an ELISA based on recombinant LipL32 as a
practical, inexpensive test for Leptospirosis. The DNA
encoding LipL32 was isolated from Leptospira pomona,
inserted into pRSET-C plasmid then expressed in E.coli
BL21 as a poly-histidine-tagged protein. The amount of
LipL32 protein, which was purified from the supernatant of
lysed cells by a Ni-NTA column, was 1mg/l culture. This
purified LipL32 was used as the coating antigen at 5µg/ml.
The accuracy of ELISA was evaluated based on ROC
analysis, by comparing the ELISA and MAT results of 517
bovine sera. Result in this study showed that the area under
curve (AUC) was 0.853, which categorised the LipL32
ELISA as a “moderately accurate” test and indicates that the
ELISA was able to differentiate positive and negative
Leptospirosis serum. The result also showed ELISA LipL32
could detect serum positive MAT to Hardjo, Grippotyphosa,
Tarrasovi, Rachmati and Bataviae. The optimal cut off for
OD ELISA determined based on ROC curve was 0.504, and
it showed sensitivity and specificity of ELISA LipL32
relative to MAT were 86.0% and 69.5%, respectively.
Overall, the result in this study showed that ELISA LipL32
can be used as a rapid test for identification of anti-Leptospira
antibodies in bovine.
(Author)
Key Words: ELISA, LipL32, Leptospirosis, Bovine
JITV Vol. 22 No. 4 2017: 213-222
218
UDC:
Prihandini, S.S. (IRCVS, Bogor)
Noor, S.M. (IRCVS, Bogor)
Kusumawati, A. (Faculty of Veterinary, Universitas Gadjah
Mada)
Deteksi serotipe, karakterisasi molekuler dan studi
kekerabatan genetik isolat lokal Pasteurella multocide
(Serotype detection, molecular characterization and genetic
relationship study on Pasteurella multocide local isolate)
(Org: Eng)
JITV 22(2): 91-99
Pasteurella multocide is a bacteria that causes snoring
disease or Haemorrhagic Septicaemia (HS) in Indonesia with
high mortality and morbidity in heterogeneous species
including cattle as a source of animal products with high
economic value. The complexity of conventional and
biochemical identification is a major obstacle in the detection
of this disease because P. multocide has five serotypes A, B,
D, E and F, while serotype B is the leading cause of HS cases
in Asia including Indonesia. Therefore, it is necessary to
conduct a research that can determine the serotype and
molecular characterization and genetic study of five isolates
of P. multocide from Lampung and Kupang by Polymerase
Chain Reaction (PCR) technique. After PCR was performed
on specific genes, capsular genes, 16S rRNA genes,
sequencing and analysis using Bioedit, BLASTn,
CLUSTALW and MEGA7.0.25, it was found that the five
isolates were divided into two serotype groups: A and B.
Isolate P. multocide (code: PMc) from Lampung is high
homolog with ATCC isolate 12945, so it can be used as a
positive control serotype A in the detection of other P.
multocide isolates with PCR. Whereas, isolate P. multocide
from Kupang can be used as positive control of serotype B
because it is identical to P. multocide PMTB2.1
(CP007205.2) from Malaysia that is isolated from buffalo
infected by HS.
(Author)
Key Words: Pasteurella multocide, Snoring Disease,
Detection, Polymerase Chain Reaction (PCR), Sequencing
UDC: 633.3
Rakhmani, S.I.W. (IRIAP, Bogor)
Purwadaria, T. (Atma Jaya Catholic University)
Peningkatan nilai gizi kulit buah kakao melalui fermentasi
oleh Aspergillus spp. dengan dua tingkat urea dan amonium
sulfat (Improvement of nutritional value of cocoa pod husk
fermented by Aspergillus Spp. with two levels of urea and
ammonium sulphate)
(org: Eng)
JITV 22(3): 101-113
Cocoa pod husk is abundant as a waste product of cocoa
plantation and potential as feed ingredient but has low
nutritional value. To increase the nutritive value of cocoa pod
husk (CPH), biological process through solid substrate
fermentation using Aspergillus oryzae and Aspergillus niger
and addition of two doses (N1 and N2) of nitrogen mixture
had been done. The product is Fermented Cocoa Pod Husk
(FCPH). Protein content increased from 50 g/kg before
fermentation to 133.8 g. kg-1 for N1 for A. niger and 150 g/kg
using A. oryzae. True protein were 99.8 and 93.5 g/kg for N1
and N2 treatments (A. niger); 119 and 104.1 g/kg for N1 and
N2 treatments (A. oryzae). Aspergillus niger showed a
superiority in term of enzymes production when compared to
Aspergillus oryzae. Mannanase activy in A. niger
fermentation product with N1 dose reached up to 2654 U/g
and A.oryzae was 1122 U/g. Dry matter and protein
digestibility for A. niger FCPH were 47 and 57% and A.
oryzae FCPH were 52 and 62% repectively. Fermentation
processed of CPH yield a product that very potential as an
alternative feed with higher in protein content and contain
mannanase enzyme.
(Author)
Key Words: Cocoa Pod Husk, Aspergillus niger, Aspergillus
oryzae, Mannanase, Cellulose
UDC: 633.31/.37
Tarigan, A. (Graduate School of Animal Nutrition and Feed
Science, Bogor Agricultural University)
Ginting, S.P. (IGRS, Medan)
Arief, I.I. (Department of Production Science and Animal
Husbandry Technology, Faculty of Animal Science, Bogor
Agricultural University)
Astuti, D.A. (Department of Animal Nutrition and Feed
Technology, Faculty of Animal Science, Bogor Agricultural
University)
Abdullah, L. (Department of Animal Nutrition and Feed
Technology, Faculty of Animal Science, Bogor Agricultural
University)
Identifikasi kualitas fisik dan pelet konsentrat hijau berbasis
Indigofera zollingeriana secara In Vitro (The physical quality
and digestibility in vitro determination of green pellet
concentrate based on Indigofera zollingeriana)
(Org: Eng)
JITV 22(3): 114-123
This study aims to determine the physical quality and
digestibility of green pellet concentrate based on I.
zollingeriana. The composition of green pellet concentrate
feed contains I. zollingeriana and C. calothyrsus in the
following combinations: 1) I. zollingeriana /C. calothyrsus
(90/0; R0), 2) I. zollingeriana/C. calothyrsus (75/15; R1), 3)
I. zollingeriana/C. calothyrsus (60/30; R2) and 4) I.
zollingeriana / C. calothyrsus (45/45; R3). The physical
quality study of green pellet concentrate was performed using
a completely randomized design with four types of green
concentrate as treatments of three replications. Green pellet
concentrate studies conducted in vitro rumen fermentation
were performed using in a randomized block design with
four treatments and three sources of liquid rumen as a block.
The results of the experiments conducted with pellet criteria
containing I. zollingeriana/C. calothyrsus composition
(60/30; R2) have the best physical character (water activity =
0.58; particles size = 12.69 mm; degree value angles =
Abstract: JITV Vol. 22, 2017
219
21.01o; collision endurance = 99.78%; endurance friction =
90.42 %; bulk density = 590 kg/m3) compared to the other
treatments. The quality of diet based on digestibility in vitro,
dry matter and organic material having a pattern equal to R0
is higher (P<0.05) compared with other treatments, while the
rough digestibility of In Vitro protein is seen R0, R1, and R2
(P>0.05), but (P<0.05) was higher than the treatment of R3.
There was no difference of pH and total bacteria on green
pellet concentrate type. The treatment of R3 has the lowest
NH3, VFA and total gas concentration (P<0.5) compared
with R2, R1 and R0. It was concluded that concentrate green
pellet of I. zollingeriana composition (60%) and
C.calothyrsus (30%) had better physical and nutritional
quality.
(Author)
Key Words: I. zollingeriana, C. calothyrsius, Green
Concentrated Pellets, Feed
UDC: 633.31/.37
Hutasoit, R. (IGRS, Medan)
Evaluasi empat spesies legume herba sebagai sumber hijauan
dan cover crop pada perkebunan kelapa sawit (Evaluation of
four pasture legumes species as forage and cover crop in oil
palm plantation)
(Org: Eng)
JITV 22(3): 124-134
Pasture legumes is a very high quality of forage. The
limited land is the problem of its development. Integration
with oil palm plantations is one of the potentials for its
development. This study was aimed to investigate the
productivity of several legumes (Arachis glabrata,
Stylosanthes guianensis, Clitoria ternatea, and Chamaecrista
rotundifolia) as forages and cover crop. The potential tests
were conducted in oil palm area of 4608 m2, in a complete
block design with four treatments (legume species) and three
replications. Parameters observed were: Legum production,
leaf/stem ratio, chemical composition of legume,
concentration of N, P in the soil, microbes in the soil,
leguminous digestibility and palm fruit production. Results
showed that the highest legume production (DM) was
(P<0.05) in the species of Clitoria ternatea (16.15 tons ha-
1year-1), the highest leaf/stem ratio (P<0.05) was in the
Arachis glabrata (2.09). The chemical composition (DM) did
not differ (P>0.05) ranged from 33.75 to 35.75%, the organic
matter (OM) varied greatly (P<0.05) the highets was in
Clitoria ternatea. The highest Crude protein (P<0.05) was in
Clitoria ternatea 17.84%. NDF concentrations did not differ
(P>0.05). The lowest ADF concentration (P<0.05) was in
Chamaecrista rotundifolia. The concentration of N in the soil
indicated that early year of activity was similar (average
0.10%), at the end of activity increased (P<0.05) in treatment
Stylosanthes guianensis (0.16%). The highest population of
N-fixation bacteria of 1.76x10⁹ and phosphate solvent of
9.8x10⁵ were in the treatment of Clitoria ternatea.
Production of fresh fruit bunches of the palm was relatively
similar (P>0.05) ranged from 16.52-19.21 tons ha-1year-1. It
is concluded that Clitoria ternatea is the best species of
legume tested as forage and cover crop in oil palm
plantations.
(Author)
Key Words: Legume, Forage, Oil Palm
UDC: 633.3
Sajimin (IRIAP, Bogor)
Purwantari, N.D. (IRIAP, Bogor)
Sarijan (Yogyakarta Assesment Institute for Agricultural
Technology)
Sihono (National Nuclear Energy Agency of Indonesia)
Evaluasi performa beberapa kultivar Sorghum bicolor sebagai
sumber hijauan pakan di lahan kering iklim kering
(Evaluation on performance of some Sorghum bicolor
cultivars as forage resources in the dry land with dry climate)
(Org: Eng)
JITV 22(3): 135-143
The aim of this study was to evaluate the performance of
several Sorghum bicolor cultivars as forage on a dry land
with pH of 5.4, N of 0.08%; C/N of 9%, P of 0.06% and K of
0.01%. Nine cultivars of S. bicolor (Super 1, Super 2,
Numbu, Kawali, G2, G5, PAC 537, PAC 593 and PAC 501)
were evaluated. Plot size was 16 m2 with space planting of
15 x 75 cm. The experimental design used was randomized
block design with three replications. Parameters observed
were plant height, time of flowering, forage production and
quality. The result showed that the primary plant growth was
not different in all cultivars. In the 65 days old primary plant,
the Super 2, PAC 537 and Kawali had no flower yet. Biomass
production varied in primary plant between cultivars of 11.35
- 26.17 kg/16 m2. The highest biomass production was
obtained in PAC 537 of 26.17 kg/16 m2 (16.34 t/ha) which
were significantly higher than G2 of 11.35 kg/16 m2 (7.09
ton/ha) and was not significantly different with other
cultivars. In the 45 days ratoon I, Super 2, G5 and Super 1
showed faster growth. Biomass production increased in the
ratoon I around 19.88 kg/16 m2 (12.42 ton/ha). PAC 537
produced the highest biomass of 30.14 kg/16 m2 (18.84
ton/ha) and was not significantly different with other
cultivars, except with the G2. Biomass production of ratoon II
decreased around 1.83 kg/16 m2 (1.14 t/ha)–4.77 kg/16 m2
(2.98 t/ha) and increased in the ratoon III of 15.72 kg/16 m2
(9.82 t/ha)–26.05 kg/16 m2 (16.28 t/ha). The quality of forage
ratoon I was better compared to the primary plant with the
lowest one was in ratoon II. It could be concluded that Super
1, Super 2 and PAC 537 cultivars might be recommended as
potential forage.
(Author)
Key Words: Sorghum, Cultivar, Biomass Production,
Quality
UDC: 591.465.3
Kostaman, T. (IRIAP, Bogor)
Sopiyana, S. (IRIAP, Bogor)
JITV Vol. 22 No. 4 2017: 213-222
220
Gambaran primordial germ cell yang diinkubasi selama 24
jam dalam larutan phosphat bufer saline [-] (Primordial germ
cells profiles incubated for 24 hours in phosphate buffer
saline [-] solution)
(Org: Eng)
JITV 22(3): 144-150
Gonadal development is a sequential process that can be
divided into three major events: the PGCs migration, sex
determination and gonadal differentiation. This study was
aimed to see the development of PGCs isolated from the
gonads of embryos after being incubated for 7 days and then
was incubated using a solution of Phosphate Buffer Saline
(PBS) [-]. The developing gonad can be isolated from 7 days
old chick and can be incubated at a temperature of 37.8oC in
a solution of PBS [-]: without Ca2+ and Mg2+. The release of
gonadal PGC was observed within 1, 8, 16, and 24 hours after
the embryonic gonad was placed in a PBS solution [-]. The
results showed that PGCs can be separated from gonadal
tissues and can be collected by entering the developing gonad
to the PBS [-] solution. The highest percentage of PGCs and
survival rate was obtained after gonad was incubated for 1
hour and was not different with 8 hours (P>0.05). Those
result was significantly different (P<0.05) with the 16 and 24
hours incubation. The highest purity rate percentage was in
the 8 hours incubation, but did not show a significant
difference (P>0.05) with the 1 and 16 hours incubation. The
percentage of the purity differed (P<0.05) after the 24 hours
incubation. It can be concluded that the most appropriate
incubation time to obtain PGCs from the KUB chicken
embryonic gonad is no more than 8 hours.
(Author)
Key Words: Gonad, PGCs, Native Chicken
UDC: 578.81
Sawitri, D.H. (IRCVS, Bogor)
Wardhana, A.H. (IRCVS, Bogor)
Wibowo, H. (IRCVS, Bogor)
Profil sitokin tikus yang terinfeksi dengan virulensi tinggi dan
rendah isolat T. evansi Indonesia (Cytokines profile of mice
infected by high and low virulences of Indonesian T. evansi
isolates)
(Org: Eng)
JITV 22(3): 151-164
Surra in livestock is caused by Trypanosoma evansi, a
homoflagella blood protozoa that circulate in extracellular.
This disease is widespread in Asia, Africa, South and Central
America. According to the immunological aspect, the severity
of surra in livestock and mice which infected by trypanosoma
is associated with an inflammatory response. On the other
hand, the survival time of mice depends on the regulation of
Th1 synthesis and proinflammatory cytokines such as IFN-γ
and TNF-α. The aim of this study was to observe the
responses of proinflammatory cytokines IFN γ, TNF-α and
anti-inflammatory IL-10 which result from interaction with
parasites. This information is needed for improvements in the
management of prevention of Surra in animals. A total of 30
mice were divided into 3 groups. The group was infected with
a low virulency T. evansi (Pml287); high virulence (Bang87)
respectively and one group was not infected as control. Mice
sera were collected in every 4 days for cytokine measurement
using an Enzyme Link-Immunosorbent Assay (ELISA). The
result showed a difference response of proinflammatory and
antiinflammation cytokine profile between the infected mice
by isolates Bang 87 and Pml 287. Early deaths in mice
infected by Bang 87 isolate were suspected as a result of the
response of systemic inflammation syndromes characterized
by elevated IFN-γ levels that were not adequately
compensated by anti-inflammatory. Anemia contributes to the
cause of death in mice that support multiple organ failures
(multiple organ disfunction).
(Author)
Key Words: Surra, Trypanosoma evansi, Cytokine, IFN γ,
TNF-α, IL-10
UDC: 636.2.033
Anggraeni, A. (IRIAP, Bogor)
Talib, C. (IRIAP, Bogor)
Asmarasari, S.A. (IRIAP, Bogor)
Herawati, T. (IRIAP, Bogor)
Andreas, E. (Faculty of Animal Science, Bogor Agriculture
University)
Polimerfisme genetik dari gen IGF1, GH dan OPN pada
persilangan sapi PO berdasarkan tipe kelahiran di Jawa
Tengah (Genetic polymorphisms of IGF1, GH, and OPN
genes in crosses Peranakan Ongole cattle based on birth type
in Central Java)
(Org: Eng)
JITV 22(4): 165-172
Genetic Polymorphisms of IGF1, GH, and OPN Genes in
Crossbred of Peranakan Ongole Cattle Based on Birth Type
in Central Java. Improved productivity by crossing Peranakan
Ongole (PO) cattle to exotic beef cattle through AI mating is
preferred by many farmers in Central Java. Fertility
determines the ability of a cow to give birth. IGF1 gene is
predicted to affect either twin or multiple births in cattle,
whereas GH and OPN genes determine reproductive fertility.
Genetic polymorphisms of these three genes were studied in
the crossbred of PO cattle for single birth (S) as well as twin
and multiple (M) births or their historical (M) ones from two
districts in Central Java, from Sragen (S = 7 hd and M = 13
hd.) and from Kendal (S = 9 hd, and M = 16 hd.). Genetic
polymorphisms were identified by PCR-RFLP (polymerase
chain reaction - restriction fragment length polymorphism)
method using restriction enzymes of SnaBI (IGF1 gene),
MSpI (GH gene), and BsrI (OPN gene). IGF1|SnaBI locus in
the observed crossbred PO did not have SNP polymorphism
or monomorphic for single and twins or multiple births. In
contrast, GH|MSpI and OPN|BsrI loci were polymorphic with
quite a high degree of diversity. In conclusion, the
IGF1|SnaBI locus cannot be used to investigate possible
genetic control of twins and multiple births, whilst GH|MSpI
and OPN|BsrI polymorphisms can be considered as initial
information for selection on fertility traits in beef cattle.
(Author)
Abstract: JITV Vol. 22, 2017
221
Key Words: Beef Cattle, Genetic Polymorphism, Fertility
Genes
UDC: 636.2.033
Sonjaya, H. (Department of Livestock Production, Faculty of
Animal Science, University of Hasanuddin)
Yusuf, M. (Department of Livestock Production, Faculty of
Animal Science, University of Hasanuddin)
Hamdana, A. (Department of Livestock Production, Faculty
of Animal Science, University of Hasanuddin)
Utamy, R.F. (Department of Livestock Production, Faculty of
Animal Science, University of Hasanuddin)
Gustina, S. (Department of Animal Science, Faculty of
Animal and Fisheries Science, University of West Sulawesi)
Hasbi, H. (Department of Livestock Production, Faculty of
Animal Science, University of Hasanuddin)
Pengaruh status ovarium sapi Bali terhadap maturasi inti oosit
dan tingkat fertilitas in vitro (Effect of Bali cattle ovarian
status on oocytes nuclear maturation and in vitro fertilization
rate)
(Org: Eng)
JITV 22(4): 173-178
The aim of this study was to investigate whether the
reproductive status influences the nuclear maturation and
fertilization rates of bali cattle oocytes in vitro. Several pairs
of ovary were classified into four groups: 1) ovaries with
Corpus Luteum (CL) and Dominant Follicle (DF), 2) ovaries
without CL and with DF, 3) ovaries with CL and without DF,
4) ovaries without both CL and DF. In the first experiment,
oocytes were collected by slicing method in Phosphate Buffer
Saline (PBS) medium supplemented with 10% Fetal Bovine
Serum (FBS) and 100 IU/ml penicillin streptomycin. Oocytes
were matured in tissue culture medium (TCM)-199
supplemented with 10% Fetal Bovine Serum (FBS), 10 IU/ml
Follicle Stimulating Hormone (FSH), 10 IU/ml Luteinizing
Hormone (LH), and 50 µg/ml gentamycin. Oocytes were
matured in 5% CO2 incubator, 38oC for 24 h. In the second
experiment, oocytes were matured and then fertilized in vitro
to observe pronuclear formation. The first experiment showed
that the percentage of oocytes reached methaphase-II (MII)
stage on ovaries with CL and without DF (89.47%) were
higher (P<0,01) compared to ovaries without both CL and DF
(75,47%), ovaries without CL and with DF (74.,41%), or
ovaries with CL and DF (65,52%). The result of second
experiment showed that the ovarian reproductive status was
not significantly different (P>0.05) on fertilization rate.
(Author)
Key Words: Ovarian Status, Oocytes, Bali Cattle,
Maturation, Fertilization
UDC: 633.255
Puastuti, W. (IRIAP, Bogor)
Yulistiani, D. (IRIAP, Bogor)
Handiwirawan, E. (ICARD, Bogor)
Suplementasi molases dan asam amino bercabang pada
tongkol jagung amoniasi sebagai pakan ruminansia untuk
meningkatkan kecernaan in vitro (Supplementation of
molasses and branched-chain amino acid to increase in vitro
digestibility of ammoniated corn cob in ruminants feed)
(Org: Eng)
JITV 22(4): 179-187
Corn cob contains high fiber and lignin which causes low
nutritive value. The objective of the study was to improve the
digestibility of ammoniated corn cob (CC) by
supplementation of molasses and branched-chain amino acid
(BCAA: valine, leucine and isoleucine). CC was processed
by addition 3% urea. The first stage of in vitro test was done
with 4 levels of molases 0, 5, 10 and 15% of dry matter (DM)
of CC. The experiment was carried out using complete
randomized design with 4 treatments and 4 replications. The
second stage was also in vitro study of supplementation of
two levels each for valine = V, leucine = L and isoleucine = I
namely 0.1 and 0.2% of DM of ammoniated CC. There were
8 treatments combination of the BCAA as follow: A = V0.1
L0.1 I0.1; E = V0.2 L0.1 I0.1; B = V0.1 L0.1 I0.2; F = V0.2
L0.1 I0.2; C = V0.1 L0.2 I0.1; G = V0.2 L0.2 I0.1; D = V0.1
L0.2 I0.2; H = V0.2 L0.2 I0.2 and 1 control (V0.0 L0.0 I0.0).
The experiments were done using completely randomized
design with 9 treatments and 3 replications. The results
showed that treated CC with urea was able to increase protein
content by 78% (increased from 3.34% to 5.95%) while
neutral detergent fiber (NDF) decreased by 15.4%, acid
detergent fiber (ADF) by 7.9% and lignin 16.7%. Addition of
molasses in ammoniated CC increased DM digestibility (P
<0.05) by 7.5% (41.9 vs 43.51-46.26%) and NDF by 17.7%
(38.41 vs 43.76 – 46.31%). Supplementation of BCAA
resulted in the highest DM, OM and NDF digestibility (P
<0.05) in the treatment of A, C, D and G. Compare to
treament I, the digestibility of DM, OM and NDF in G
treatment increased by 31.4%, 27.5% and 36.5%,
respectively and produced the highest total population of
rumen bacterial of 12.4 x 10⁹ colonies /ml. It can be
concluded that the digestibility of ammoniated CC increased
by the supplementation of 5% molases and BCAA
combination consisted of 0.2% valine, 0.2% leucine and 0.1%
isoleucine.
(Author)
Key Words: Corn Cob, Ammoniation, Molasses, Branched-
Chain Amino Acid
UDC: 636.39
Ginting, S.P. (IGRS, Medan)
Simanihuruk, K. (IGRS, Medan)
Antonius (IGRS, Medan)
Tarigan, A. (IGRS, Medan)
Pertumbuhan dan pemanfaatan pakan kambing persilangan
Boer x Kacang yang diberi pakan komplit dengan kandungan
protein dan energi berbeda (Growth and feed utilization of
Boer x Kacang crossbred goats offered total mixed rations
of different protein and energy levels)
(Org: Eng)
JITV Vol. 22 No. 4 2017: 213-222
222
JITV 22(4): 188-195
The aim of this study was to evaluate the growth of and
feed utilization by Boer x Kacang crosses goats fed on total
mixed ration differing in protein and energy levels. Four total
mixed rations combination were formulated to contain 16 and
18% crude protein and 2650 and 2850 Kcal ME/ kg DM
(dried matter) energy density. Twenty-eight male Boer x
Kacang crosses goats (14.5 ± 1.14 kg) and of age ranging
from 4 to 5 months were randomly allocated to one of these
four TMRs (total mixed rations) (7 animals/TMR). Animals
were put in individual metabolic cage equipped with troughs
and water container. The effects of dietary treatment were
assessed using the general linear model and significance of
the diet effects was detected using Duncan’s multiple range
test. Dry matter intake increased as metabolizable energy
density of diet increased from 2650 to 2850 Kcal/kg DM, but
it is not affected by increasing crude protein level from 16 to
18%. The average daily gains were not improved (P>0.05) as
the crude protein levels and metabolizable energy density of
diet increased. Crude protein levels and ME density did not
affect (P>0.05) the DM, OM and energy digestibility, but
NDF digestibility was affected by the ME density of diets
(P<0.05). Daily N intakes were greater (P<0.0%) in goats
received diets higher in the crude protein and metabolizable
energy levels. Fecal N output was not influenced (P>0.05) by
the crude protein and metabolizable energy levels, but urinary
N output was higher (P<0.05) as the level of diet crude
protein increased. The N retention was affected (P<0.05) by
the crude protein levels but not (P>0.05) by the metabolizable
energy density of diets. The BUN (blood urea nitrogen) was
not affected by the metabolizable energy density but it was
higher (P<0.05) in goats offered diets with higher crude
protein contents. The plasma glucose level was affected by
the metabolizable energy density (P<0.05), but not by the
crude protein levels. It is concluded from the present study
that the Boer X Kacang crossbred goats have high level of
DM intake when offered feeds in the form of total mixed
rations. At this high rate of feed intake this type of goats are
able to gain optimally when offered feed with crude protein
level of 16% and metabolizable energy density of 2850
Kcal/kg DM.
(Author)
Key Words: Goats, Total Mixed Ration, Protein level,
Energy Level
UDC: 636.58.033
Wiedosari, E. (IRCVS, Bogor)
Wardhana, A.H. (IRCVS, Bogor)
Aktivitas antikoksidia artemisinin dan ekstrak daun
Artemesia annua pada ayam yang diinfeksi dengan Eimeria
tenella (Anticoccidial activity of Artemisinin and Extract of
Artemesia annua leaves in chicken infected by Eimeria
tenella)
(Org: Eng)
JITV 22(4): 196-204
The continuous use of anticoccidial drug in chicken often
continuously generates drug resistance and tissue residue; so
thatconsequently, a safe alternative anticoccidial drug based
on herb is fundamentally required. The aim of thise study was
to examine anticcocidial activity of artemisinin and extract of
Artemesia annua leaves in chicken infected by Eimeria
tenella. A total of 35 chickens of Cobb strain was divided
into seven groups with five replicates birds per group, i.e.
uninfected chicken group (P I), infected but untreated chicken
group (P II), infected and treated chicken group with 8.5 ppm,
17 ppm, 34 ppm, for P III, P IV and P V respectively,
infected and treated chicken with 17 ppm of A. annua extract
(P VI) and infected and treated chicken with Sulfa (P VII).
All chicken, except the uninfected group, whereas infected
with 2000 infective oocyst of E. tenella except the uninfected
group. Treatment was delivered by oral, once per day for
eight days. The criteria observed were clinical manifestation
of chickens, number of oocyst in feces, body weight, cecal
lesion score, haematocrit (packed cell volume) and
haemoglobin value. The results showed that extract of A.
annua leaves (P VI) was the most effective treatment to
reduce the number of oocyst in feces (74.18%), followed by
34 ppm of artemisinin group (P VII). In addition, application
of A. annua extract and artemisinin was significantly able to
decreased the cecal lesion score (P<0.05). Even though body
weight and Hb value were not indifferent significantly
different (p>0.05), however A. annua extract and artemisinin
treatments were significantly able to hold PCV value on
normal level compared to P II and P IV (P<0.05). It
concluded that extract A. annua leaves and artemisinin could
be used an alternative anticoccidial in chickens.
(Author)
Key Words: Eimeria tenella, Artemisinin, Artemesia annua,
Coccidiosis
UDC: 636.2.034
Rachmawati, F. (IRCVS, Bogor)
Ariyanti, T. (IRCVS, Bogor)
Kontaminasi bakteri Escherichia coli O157:H7 pada
peternakan sapi perah (Contamination of Escherichia coli
O157:H7 in dairy cow farms)
(Org: Eng)
JITV 22(4): 205-211
E. coli serotype O157:H7 is a foodborne pathogen that
endangers human health. Cattle are the main reservoir of this
bacterium. E. coli O157:H7 that come out of the livestock can
contaminate the surrounding environment, dairy products,
meat, vegetable or fruit crops, so it can act as a source of
infection and disease in humans. This research was conducted
to identify the contamination of E. coli O157:H7 on dairy
cow farms so the current situation is known. Sampling area
for this research was dairy cow farm in Depok, Cianjur,
Sukabumi, and Bandung. Types of samples taken are cow
anal swab or fresh feces and livestock drinking water.
Isolation of E. coli bacteria was done on mTSB media, agar
MacConkey, and Eosin Methylene Agar. Identification of
bacteria as E. coli O157:H7 was done by biochemical test and
for serotype determination was used agglutination test using
monospesifik antiserum for O157 and H7. The results of
research showed that of the total 178 samples had 126
Abstract: JITV Vol. 22, 2017
223
(70.8%) samples containing E. coli bacteria. Of the 126
samples containing E. coli bacteria, 94 (74.6%) were
determined as E. coli serotype O157:H7. The presence of E.
coli O157:H7 contaminants on dairy cow farms, their
potential impacts on human health, prevention and control of
the disease is discussed in this paper.
(Author)
Key Words: Dairy Cow, E. coli, E. coli O157:H7,
Environment
AUTHOR GUIDELINES
Indonesian Journal of Animal and Veterinary
Sciences, or IJAVS contains:
(i) Primary scientific manuscript of unpublished
research results.
(ii) Elucidation of research methods and innovative
techniques which is useful for research
development.
AUTHOR GUIDANCE Manuscript is written in good English, accompanied
with abstract in English and Indonesian. Manuscript is
typewritten on the A4 paper size with 2 spaces
distance and 4 cm from left side, 3 cm from right side,
3 cm from top and bottom sides. We provide you with
IJAVS Template that you can find in our website:
http://medpub.litbang.pertanian.go.id/index.php/jitv.
SCRIPTWRITING SYSTEMATICS
1. Title:
Should be comprehensive, but it is made as short
as possible. Subtitle can be given if it needed.
2. Name and Address of Author: Author’s name is written completely (without
degree) and typewritten by CAPITAL letter. If
the author is more than 1 person with different
address, Arabic numbers superscript should be
given behind each name. Author’s address
written under author’s name, consisting of
institution name and its complete address, made
in line with number of index on behalf of the
author and typewritten by ITALIC.
3. Abstract:
Abstract is gift of manuscript, written in
Indonesian or English, do not more than 250
words and stated in one paragraph. Abstract
consists of backgound, purpose, material and
methode, result and conclusion. The author’s
name (in CAPITAL form), publication year,
manuscript title and journal name are listed
before abstract content with layout as reference.
Keywords are listed under the abstract,
maximum 5 words.
4. Introduction:
Is consisting of research background, issue,
efforts which have been made, approach taken to
solve the problem and research purpose.
5. Materials and Methods:
Elucidating clearly about materials used and
method carried out. If the material using animals
in the experiment, please indicate that the
animals are performed according to animal ethics
and welfare. See ethical statement in the
attachment.
6. Results and Discussion:
It presents and discusses clearly and completely
achieved research results based on the purpose.
Result and discussion may be presented
separately or united. Result description may be
completed by consise tables and clear
illustrations (black and white graphics, figures
or photos) on separated page. Tabel description
(on top) and illustrations (in bottom) should be
clear and independent, so readers may easily
understand the table without read the text.
Discussion description consists of description of
result and research mean and benefit associated
with issue which will be solved. Measurement
units both in table or illustrations use metric
system.
7. Conclusion:
It is a manuscript final summary.
8. Acknowledgement:
It can be written if needed.
9. References:
The author is recommended to use Mendeley
Program (http://www.mendeley.com) and
citation style of Taylor & Francis - Council of
Science Editors (author-date). Mendeley
program utilization is aimed to avoid mistakes in
citations and references writting. Cited
references (preferably, 80% is primary article
and the last 10 years publication). and should
not from unpublished articles such as practical
guidance and research report, except thesis and
dissertation. Download is allowed if it is from
electronic magazine, genom database or patent.
Citation in the references:
Literatures in reference are written
alphabetically based on the author’s name. Same
author is written sequentially starting from
earlier order.
Example of reference writing
Primary paper:
Bhanja SK, Anjali DC, Panda AK, Sunder GS.
2009. Effect of post hatch feed deprivation on
yolk-sac utilization and young broiler chickens.
Asian-Aust J Anim Sci. 22:1174-1179.
Book:
a. Lawrence TLJ, Fowler VR. 2002. Growth of
farm animals. 2nd ed. New York (USA):
CABI Publishing.
b. Bamualim A, Tiesnamurti B. 2009.
Konsepsi sistem integrasi antara tanaman
padi, sawit, dan kakao dengan ternak sapi di
Indonesia. In: Fagi AM, Subandriyo,
Rusastra IW, penyunting. Sistem integrasi
ternak tanaman padi, sawit, kakao. Jakarta
(Indones): LIPI Press. p. 1-14.
c. Paloheimo M, Piironen J, Vehmaanpera J.
2010. Xylanases and cellulases as feed
additives. In: Bedford MR, Partridge GG,
editors. Enzymes in farm animal nutrition.
2nd ed. New York (USA): CABI Publishing.
p. 12-53.
Proceeding:
Umiyasih U, Antari R. 2011. Penggunaan
bungkil inti sawit dan kopra dalam pakan
penguat sapi betina berbasis limbah singkong
untuk pencapaian bobot badan estrus pertama
>225 kg pada umur 15 bulan. Prasetyo LH,
Damayanti R, Iskandar S, Herawati T, Priyanto
D, Puastuti W, Anggraeni A, Tarigan S,
Wardhana AH, Dharmayanti NLPI, editors.
Proceeding of National Seminar on Livestock
Production and Veterinary Technology. Bogor
(Indones): Indonesian Center for Animal
Research and Development. p. 192-199.
Thesis:
Krisnan R. 2008. Kombinasi penggunaan
probiotik mikroba rumen dengan suplemen
katalitik pada pakan domba (Thesis). [Bogor
(Indones)]: Institut Pertanian Bogor.
Electronic magazines:
Wina E, Tangendjaja B, Dumaria. 2008. Effect
of Calliandra calothyrsus on in vitro
digestibility of soybean meal and tofu wastes.
Livest Res Rural Develop. Vol. 20 Issue 6.
http://www.lrrd.org/lrrd20/6/wina 20098.htm.
Institution:
a. [NRC] National Research Council. 1985.
Nutrient requirements of sheep. 6th revised.
Washington DC (USA): National Academic
Press.
b. [CDC] Centers for Disease Control. 2006.
Standard operating procedure for the direct
Rapid Immunohistochemistry Test (dRIT) for
the detection of rabies virus antigen. [accessed
December 20th 2011]. http://www.rabiesblue
print.com/IMG/pdf/DRIT_SOP.pdf.
Patent:
Blanco EE, Meade JC, Richards WD. 1990.
Ophthalmic ventures, assignee. Surgical stapling
system. United States patent US 4,969,591. 1990
Nov 13.
10. Citation in text:
Citation consists author’s last name and
publication year.
Example:
a. One author: .......... grow slower than lamb fed
cattle’s milk (Supriyati 2012). Supriyati
(2012) formulates..........
b. Two authors: .......... expect, end maintenance
weight (Khasrad & Rusdimansyah 2012).
Khasrad & Rusdimansyah (2012)
argued..........
10. c. Three authors or more: ......... based on DNA
mitochondria analysis (Mtileni et al. 2011).
Mtileni et al. (2011) reports.....
d. Same author cited from 2 different papers:
(Purwadaria et al. 2003a, 2003b).
e. Author with same family name is written
consecutive: (Dawson J 1986; Dawson M
1986).
f. Several different authors are written
consecutive: (Kannan et al. 2000; Grandin
2007; Santosa et al. 2012).
g. Institution: CSA (2011)............
11. Table:
a. Standard word used is Times New Roman
with 1 space distance and 11 of font size.
b. Title is simple, clear, and understable
sentence without reads the manuscript.
c. Each column from table should has heading.
Its unit separated from title by comma, in
parentheses, or at its bottom.
d. Table description is written under the table
with 1 space distance and 11 of font size. Data
source is written under the table or in the table
in own header.
Dividing line is made in form of horizontal.
12. Figure and graphic:
a. Title uses Times New Roman with 1 space
distance and 11 of font size. It is a simple and
clear sentence which is laid under the figure or
graphic.
b. Line in graphic should show clearly difference
of one and others, if there is more than one
curve.
c. Clear contrast figure with proportionate size
and high resolution to present the best
performance.
Write figure or graphic source under the title.
1. If written manuscript is more than one, it needed an
approval from the other authors by enclose initial
behind each name.
2. Complete manuscript is sent in three copies to
Editorial Board of IJAVS and its electronic file, or
by online: http://medpub.litbang.pertanian.go.id/
index.php/jitv
The author is entitled to 1 original journal and 10 its
reprints.
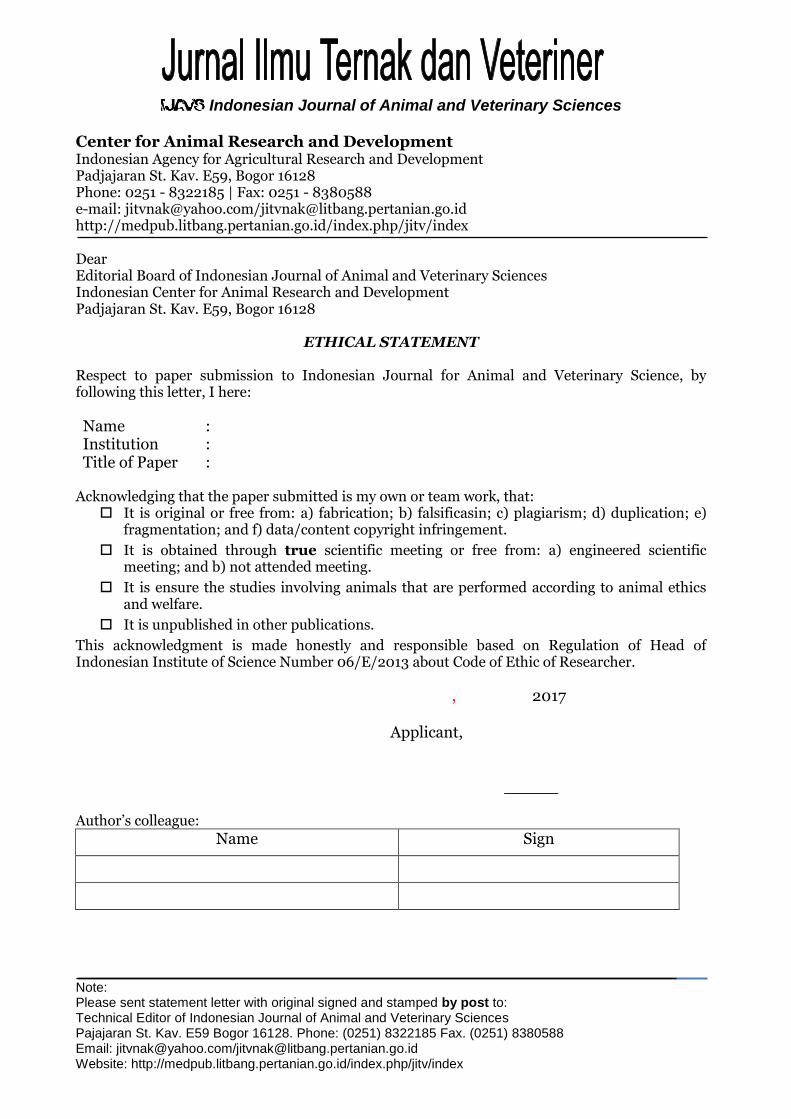
Note: Please sent statement letter with original signed and stamped by post to: Technical Editor of Indonesian Journal of Animal and Veterinary Sciences Pajajaran St. Kav. E59 Bogor 16128. Phone: (0251) 8322185 Fax. (0251) 8380588 Email: [email protected]/[email protected] Website: http://medpub.litbang.pertanian.go.id/index.php/jitv/index
Indonesian Journal of Animal and Veterinary Sciences Center for Animal Research and Development Indonesian Agency for Agricultural Research and Development Padjajaran St. Kav. E59, Bogor 16128 Phone: 0251 - 8322185 | Fax: 0251 - 8380588 e-mail: [email protected]/[email protected] http://medpub.litbang.pertanian.go.id/index.php/jitv/index
Dear Editorial Board of Indonesian Journal of Animal and Veterinary Sciences Indonesian Center for Animal Research and Development Padjajaran St. Kav. E59, Bogor 16128
ETHICAL STATEMENT
Respect to paper submission to Indonesian Journal for Animal and Veterinary Science, by following this letter, I here:
Name : Institution : Title of Paper :
Acknowledging that the paper submitted is my own or team work, that:
It is original or free from: a) fabrication; b) falsificasin; c) plagiarism; d) duplication; e) fragmentation; and f) data/content copyright infringement.
It is obtained through true scientific meeting or free from: a) engineered scientific meeting; and b) not attended meeting.
It is ensure the studies involving animals that are performed according to animal ethics and welfare.
It is unpublished in other publications.
This acknowledgment is made honestly and responsible based on Regulation of Head of Indonesian Institute of Science Number 06/E/2013 about Code of Ethic of Researcher. , 20 March 2017
Applicant,
Author’s colleague:
Name Sign
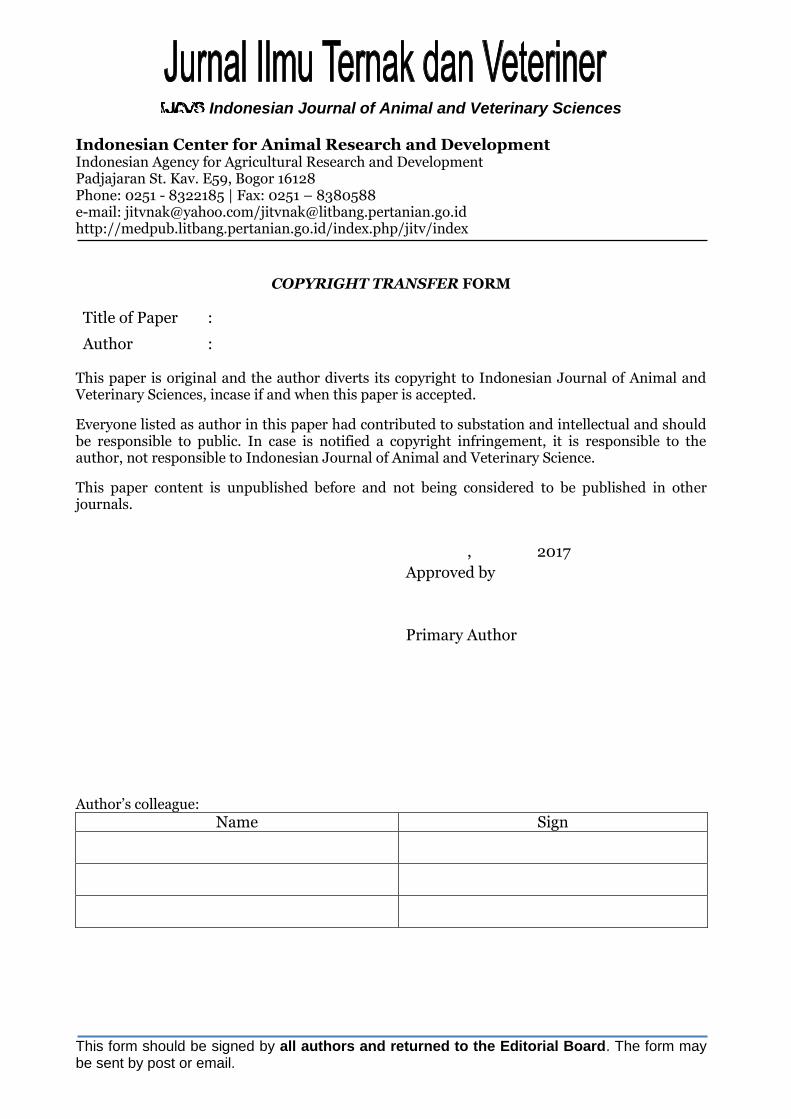
This form should be signed by all authors and returned to the Editorial Board. The form may be sent by post or email.
Indonesian Journal of Animal and Veterinary Sciences Indonesian Center for Animal Research and Development Indonesian Agency for Agricultural Research and Development Padjajaran St. Kav. E59, Bogor 16128 Phone: 0251 - 8322185 | Fax: 0251 – 8380588 e-mail: [email protected]/[email protected] http://medpub.litbang.pertanian.go.id/index.php/jitv/index
COPYRIGHT TRANSFER FORM
Title of Paper :
Author : This paper is original and the author diverts its copyright to Indonesian Journal of Animal and Veterinary Sciences, incase if and when this paper is accepted.
Everyone listed as author in this paper had contributed to substation and intellectual and should be responsible to public. In case is notified a copyright infringement, it is responsible to the author, not responsible to Indonesian Journal of Animal and Veterinary Science.
This paper content is unpublished before and not being considered to be published in other journals.
, 2017
Approved by
Primary Author
Author’s colleague:
Name Sign

Acknowledgement
Editorial board and executive editor of Indonesian Journal for Animal and Veterinary Science (IJAVS) extent
high appreciation to the expertises of peer reviewer of IJAVS (Volume 22 No. 4 2017).
1. Prof. Dr. Budi Haryanto : Feed and Nutrition - IRIAP
2. Dr. Elizabeth Wina : Feed and Nutrition - IRIAP
3. Dr. drh. Eny Martindah, MSc : Paracitology and Epidemiology - IRCVS
4. Dr. Drh. Susan M. Noor., MVSc : Bacteriology - IRCVS
5. Fitra Aji Pamungkas, SPt., MSi : Physiology and Reproduction - ICARD
We hope this good collaboration would be continued in the future in improving IJAVS quality.