The communicatory significance of localised defecation sites in bushbuck ( Tragelaphus scriptus )

MARINE ECOLOGY PROGRESS SERIESMar Ecol Prog Ser
Vol. 229: 151–164, 2002 Published March 20
INTRODUCTION
Zooplankton play a key role in the efficiency of thebiological pump (the flux of biologically producedorganic carbon from the euphotic zone to deep waters)through modification of the composition and size spec-trum of the particulate matter in the water column.This is in turn achieved by selective ingestion and sub-sequent processing of food resources (Fowler & Knauer
1986, Small et al. 1989, Altabet & Small 1990). Of par-ticular importance to the gravitational component ofthe biological pump is the production of large, rapidlysinking fecal pellets (Fowler & Knauer 1986, Noji1991)—a process which is ultimately constrained bythe zooplankter ingestion rate. In turn, food typeaffects ingestion rate (Vanderploeg 1990) as well as thesize and density, and hence the sinking velocity offecal pellets (Bienfang 1980, Dagg & Walser 1986, Voss1991, Urban et al. 1992, Feinberg & Dam 1998).
The relevance of the relationship between ingestion(I) and defecation (E) is not confined to biogeochemicalprocesses. For instance, other factors being equal, itwould be advantageous to an organism to maximize its
© Inter-Research 2002 · www.int-res.com
**Present address: Institute of Marine Sciences, Middle EastTechnical University, PO Box 28, Erdemli, Icel 33731,Turkey
**Corresponding author. E-mail: [email protected]
Coupling of ingestion and defecation as a functionof diet in the calanoid copepod Acartia tonsa
Sengul Besiktepe*, Hans G. Dam**
Department of Marine Sciences, University of Connecticut, Groton, Connecticut 06340-6048, USA
ABSTRACT: The relationship between the rates of ingestion and defecation of the calanoid copepodAcartia tonsa was examined in laboratory experiments with different diets: the diatom Thalassiosiraweissflogii, the autotrophic dinoflagellate Prorocentrum minimum, the heterotrophic dinoflagellateOxyrrhis sp., the flagellate Dunaliella tertiolecta, and the bacterivorous scuticociliate Uronemasp. Experiments were run typically using between 6 and 8 concentrations ranging from 10 to1150 µg C l–1. Both diet and food concentration had significant effects on ingestion rate, pellet pro-duction rates and pellet volume. Ingestion and pellet production rates increased curvilinearly withfood concentration. Copepods achieved the highest pellet production rates, the largest pellets andthe shortest estimated gut passage times with the diatom diet. For all diets, gut passage timedecreased with food concentration in the range 0 to ca. 250 µg C l–1, but little thereafter. In addition,for all diets, but most obviously in the case of the diatom, pellet volume increased curvilinearly withfood concentration. Maximum pellet volume was achieved at food concentrations ranging from 50 to150 µg C l–1. The defecation and ingestion rates were best correlated when the copepods fed on thediatom and the autotrophic dinoflagellate. Likewise, a decrease in estimated assimilation efficiencywith increasing food concentration was apparent only for these 2 diets. This latter pattern is primar-ily due to an increase in pellet production rate, instead of pellet volume, relative to ingestion rate atthe high food concentrations. We conclude that a diatom diet is the most likely one to result in attrib-utes that enhance zooplankton-mediated export flux: high fecal pellet production rates, large pelletsize and relatively low assimilation efficiency.
KEY WORDS: Carbon flux · Zooplankton · Copepod · Ingestion · Fecal pellet · Digestion ·Assimilation efficiency · Omnivory
Resale or republication not permitted without written consent of the publisher

Mar Ecol Prog Ser 229: 151–164, 2002
assimilation efficiency (1 – E/I). In addition, if the rela-tionship between defecation and ingestion is wellestablished, defecation rate may be used to deriveingestion rate (e.g. Reeve & Walter 1977, Ayukai &Nishizawa 1986, Båmstedt et al. 1999). Finally, sinceingestion depends on food concentration and type(Vanderploeg 1990), the coupling of ingestion anddefecation helps one understand the relationshipbetween defecation and food concentration and type.
Some previous studies have established a positivelinear relation between the rate of fecal pellet produc-tion and food ingestion rate (Corner et al. 1972, Gamble1978, Paffenhöfer & Knowles 1979, Ayukai & Nishi-zawa 1986, Tsuda & Nemoto 1990). However, the slopeof this relationship may vary with diet (Båmstedt et al.1999). Less is known about the relationship betweenfood ingestion rate and fecal pellet size. For instance,when the copepod Calanus finmarchicus feeds on thecryptophyte Rhodomonas baltica, pellet volume is inde-pendent of food ingestion (Båmstedt et al. 1999). How-ever, since ingestion rate is related to food concentra-tion and size (Vanderploeg 1990), and pellet sizedepends on food concentration (Dagg & Walser 1986,Tsuda & Nemoto 1990, Butler & Dam 1994) and type(Bienfang 1980, Feinberg & Dam 1998), there may be arelationship between pellet size and ingestion rate.Furthermore, Dagg & Walser (1986) hypothesized thatif the ingested material is processed continuously bythe digestive system, then pellet size could be a func-tion of the ingestion rate. On the other hand, if the gut isfirst filled and the food is subsequently digested, thenpellet size could be independent of ingestion.
This paper is an extension of previous work (Butler &Dam 1994, Feinberg & Dam 1998) that seeks to sys-tematically understand the factors that regulate theproduction rates and characteristics of copepod fecalpellets. In this study, we examine the functional re-sponses (both ingestion and defecation) of the copepodAcartia tonsa as a function of 5 diets. The diets repre-sent several planktonic groups, and also cover motileand non-motile preys. We then explore the couplingbetween ingestion rate, fecal pellet production rateand pellet size. Finally, we discuss our findings in thecontext of digestive processes and the implications forthe downward flux of material in the ocean.
MATERIALS AND METHODS
Food and copepod cultures. All food and copepodcultures were grown in a walk-in chamber at 20 ± 1°C.The diatom Thalassiosira weissflogii was maintainedin exponential growth in f/2 medium (Guillard 1975).The photosynthetic flagellate Dunaliella tertiolectaand the photosynthetic dinoflagellate Prorocentrum
minimum were kept in exponential growth in f/2medium without silica (Guillard 1975). The bacteri-vorous scuticociliate Uronema sp. was grown in amedium of 0.2 µm filtered seawater with yeast extract(0.01 to 0.02% by volume) to sustain the bacteria uponwhich the ciliate fed (Feinberg & Dam 1998). All ofthese food cultures were kept in a 12 h light: 12 h darkcycle (~100 µE m–2 s–1). The heterotrophic dinofla-gellate Oxyrrhis sp. was grown in f/50 medium withIsochrysis galbana as food. However, the culture waskept in the dark to prevent growth of I. galbana.
The calanoid copepod Acartia tonsa was continu-ously cultured in the laboratory in 15 l plastic bucketsbubbled with air. Cohorts of A. tonsa were grown fromeggs of females collected from Long Island Sound,USA, and kept on a mixture of Isochrysis galbana, Tha-lassiosira weissflogii, Rhodomonas lens, Dunaliella ter-tiolecta and Tetraselmis impellucida, at a concentra-tion of approximately 500 µgC l–1. The copepodculture medium was entirely replaced 3 times a wk.
Acclimation and incubation of copepods. Activeadult females with intact appendages were selectedfrom Acartia tonsa cultures and acclimated to theexperimental food concentrations in 1 l bottles for 48 h(Table 1). Cell numbers were measured using anElzone 280 particle counter (Particle Data, USA). Theinitial volume and carbon content of the copepod foodwere measured as described in Feinberg & Dam(1998). To measure cell carbon concentration, samplesfor CHN analysis were filtered onto combusted (at 450to 500°C) GF/D filters with 2.7 µm pore size to mini-mize particulate carbon contribution by bacteria in theculture. The filters were dried at 55 to 60°C within alu-minum foil capsules for approximately 36 h, and pro-cessed using a Carlo Erba EA 1108 CHN analyzer(Fisons Instruments, Italy). Blank samples were pre-pared with culture medium using the same volume asthe cell culture samples.
Experiments were run typically using between 6 and8 concentrations ranging from 10 to 1150 µgC l–1. Wechose the lower food concentration based on the feed-ing threshold (assuming a C:chl a ratio of 50) of about7 to 18 µgC l–1 as observed by Reeve & Walter (1977)for Acartia tonsa; the upper level of food concentrationwas determined by increasing food concentration tolevels at which ingestion rate achieved steady state.We used 6 to 10 replicates of 144 ml bottles each con-taining a single adult female for each experimentaldiet and concentration. The use of single females perbottle and the volume of the experimental containerswere intended to minimize artifacts of bottle enclo-sures on ingestion rates and coprophagy, as well as toallow reliable measurements of ingestion rates. Forinstance, while larger experimental volumes wouldmost likely result in less chance of coprophagy, we
152

Besiktepe & Dam: Ingestion and defecation in the calanoid copepod
found in preliminary experiments with larger volumes(260 ml) that we were unable to measure reliablyingestion rates at the lower food concentrations. Tripli-cate controls consisted of similar bottles without cope-pods. Bottles were placed on a rotating plankton wheeland after 24 h the contents of each bottle were gentlysieved through a 20 µm Nytex mesh to retain thefemales and the fecal pellets, whose width ranged from29 to 57 µm. The filtrate was used for cell counts.Whether the female in each bottle was alive and activewas recorded, then fecal pellets and the female wererinsed with 0.2 µm filtered seawater and preserved in5% formaldehyde. Prosome length and maximumwidth of females were measured using a dissectingmicroscope. The dry weight of females was calculatedfrom the length-weight relationship given by Kiørboeet al. (1985) and their carbon content was calculated as40% of their dry weight (Parsons et al. 1984). Bottleswith dead copepods and with no measurable ingestionwere not used in the analysis (~7% of the cases). Cellconcentrations at the start and end of the experimentswere determined with the Elzone particle counter. Theingestion and clearance rates of food in each replicatewere calculated according to the equations of Kiørboeet al. (1982). Whole pellets and pellet fragments werecounted under a dissecting microscope and daily pelletproduction rates determined. To account for break upof pellets, pellet fragments were classified as either 1/2or 1/3 of a pellet, the total number of each type of frag-ment divided by 2 or 3, as appropriate, and then addedto the whole number of pellets. The length and widthof intact pellets were measured at 50× magnificationusing a dissecting microscope. The volume of pelletswas estimated assuming a cylindrical shape.
Gut passage time. The gut evacuation rate constant,GERC (t –1) as a function of food concentration for eachdiet was estimated as:
GERC = F/P (1)
where F = pellet production rate (pellet ind.–1 t –1) andP = instantaneous number of pellets in the gut per indi-vidual. We never observed more than 2 pellets in thegut and rarely more than 1 pellet, which is similar tothe observations of Kleppel et al. (1988). Hence, weassumed P = 1 pellet ind.–1. Gut passage time, GPT (t),was estimated as 1/GERC.
Assimilation efficiency. Assimilation efficiency (AE)= (1 – E/I) × 100, where E and I are the defecation andingestion rates, respectively. From this definition, AE isderived from knowledge of 3 parameters measured inthis study—ingestion rate, pellet production rate andpellet volume:
AE = [1 – ((F × V × D × CW × DW )/I )] × 100 (2)
in which F is the defecation rate (number of fecal pel-lets copepod–1 d–1), V is volume of fecal pellets (µm3
pellet–1), D is density (specific gravity) of fecal pellets(µg µm–3), CW is carbon concentration in fecal pellets(% of dry weight), DW is the dry weight (% of wetweight) and I is the ingestion rate (µgC copepod–1 d–1).Values of D used were the mean pellet densities ofeach diet measured by Feinberg & Dam (1998). Sincethe densities of Prorocentrum minimum and Dunaliellatertiolecta were not measured in that study, we usedthose of Oxyrrhis marina (a dinoflagellate) and Tetra-selmis sp. (a flagellate), respectively. Although in somecases pellet density varies with food concentrationwithin a food (Feinberg & Dam 1988), this is a smalleffect (<5% change), which is ignored here. DW wasassumed to be 30% of the wet weight of the pellet(V × D) and CW was assumed to be 25% of DW(Morales 1987).
Statistical analysis. Statistical comparisons of theeffects of food concentrations and type on ingestion,
153
Functional group Species ESD Strain origin Cell carbon Experimental concentration(µm) (µgC µm–3) (µgC l–1)
Diatom Thalassiosira 10.2 NMFS collection 5.8 × 10⁻⁸ 11, 20, 28, 50, 61, 118, 238weissflogii (Milford, CT) (4.7 × 10⁻⁹)
Flagellate Dunaliella 7.3 NMFS collection 1.7 × 10⁻⁷ 45, 86, 126, 135, 250,tertiolecta (Milford, CT) (1.2 × 10⁻⁸) 358, 767, 1132
Autotrophic Prorocentrum 12.0 NMFS collection 2.8 × 10⁻⁷ 34, 89, 173, 268, 537, 771dinoflagellate minimum (Milford, CT) (1.1 × 10⁻⁸)
Heterotrophic Oxyrrhis sp. 13.9 Isolated from LIS 6.6 × 10⁻⁸ 25, 52, 89, 99, 187, 264dinoflagellate (1.1 × 10⁻⁸)
Scuticociliate Uronema sp. 7.9 D. A. Caron (WHOI) 1.1 × 10⁻⁷ 18, 35, 63, 121, 272, 435, 723BBcil strain (2.4 × 10⁻⁸)
Table 1. Summary of diets and concentrations used in experiments. ESD = equivalent spherical diameter. Values in parenthesesare standard deviations of triplicate replicates. NMFS = National Marine Fisheries Service; CT: Connecticut, USA; LIS = Long
Island Sound, USA; WHOI = Woods Hole Oceanographic Institution (Woods Hole, MA, USA)

Mar Ecol Prog Ser 229: 151–164, 2002
fecal pellet production, pellet volume and totalpellet volume were done with 2-level nestedANOVA (Sokal & Rohlf 1981). Linear and curvi-linear (Ivlev) regressions were derived withSigmaPlot® for Windows (V. 4.00). The Ivlevmodel employed was: Y = a(1 – e–bX), where a isthe asymptotic maximum value of Y (the de-pendent variable), and b represents the rate ofincrease of Y with respect to X (the indepen-dent variable). Analysis of covariance (ANCOVA)was employed for comparisons of slopes of linearregressions.
RESULTS
Ingestion and clearance rates
To ease comparison among diets, we shallrefer to them by their functional group (Table 1).The functional response of ingestion for all dietswas fitted well by the Ivlev equation (Fig. 1a).The coefficients of determination ranged from0.54 (the autotrophic dinoflagellate) to 0.89 (thediatom) (Fig. 1a). The functional response ofingestion changed significantly with diets (p <0.025, 2-level nested ANOVA). Maximum inges-tion rate ranged between 4.5 and 28.9 µgCind.–1 d–1 depending on the diet. Acartia tonsafeeding on the flagellate had the highest maxi-mum ingestion rate, estimated as 28.9 µgCind.–1 d–1 as compared to 10.7, 10.0, 7.5 and4.5 µgC ind.–1 d–1 on the scuticociliate, theautotrophic dinoflagellate, the diatom and theheterotrophic dinoflagellate, respectively. Witha typical body weight of 4.0 µgC, maximal dailyingestion of A. tonsa ranged from the equivalentof 92% (the heterotrophic dinoflagellate) to610% (the flagellate) of body carbon.
Clearance rate typically first increased withfood concentration to a maximum and thendeclined, except in the case of the scuticociliate.(Fig. 1b). Maximum clearance rate was achievedfrom around 28 to 358 µgC l–1, depending on thediet—approximately 30 µgC l–1 for both thediatom and the scuticociliate, and 89 and 52 µgCl–1 for the autotrophic and heterotrophic dino-flagellates, respectively. Clearance peaked at358 µgC l–1 for the flagellate, but a subsequentdecrease was not obvious (Fig. 1b). To estimatethe optimum size of food particles, the maximumclearance for each food was plotted against thecell size (ESD) (Fig. 2). With the exception ofthe heterotrophic dinoflagellate, the maximumclearance rate increased with cell ESD. Acartia
154
Fig
. 1. A
cart
ia t
onsa
. Fu
nct
ion
al r
esp
onse
ver
sus
die
t. (
a) I
ng
esti
on r
ate
(I)
vers
us
food
con
cen
trat
ion
. (b
) C
lear
ance
rat
e (ƒ
)ve
rsu
s fo
od c
once
ntr
atio
n.
Eac
h p
oin
t re
pre
sen
ts
the
mea
n ±
stan
dar
d d
evia
tion
of
6 to
10
rep
lica
tes.
Reg
ress
ion
s re
pre
sen
t th
e Iv
lev
mod
el f
its
to t
he
dat
a. F
ull
sp
ecie
s n
ames
giv
en i
n T
able
1

Besiktepe & Dam: Ingestion and defecation in the calanoid copepod
tonsa had the highest clearance with the autotrophicdinoflagellate and the diatom, at around 80 ml ind.–1
d–1, whereas maximum clearance on the flagellate andthe heterotrophic dinoflagellate was around 35 mlind.–1 d–1.
Fecal pellet production
Fecal pellet production by number and volume var-ied significantly with diet and with food concentrationfor each diet (p < 0.01, 2-level nested ANOVA). Acartiatonsa tended to produce more pellets when fed the
diatom and the autotrophic dinoflagellate (Fig. 3a).The maximum mean daily fecal pellet production wasabout 180 fecal pellets on the diatom diet. The volumeof fecal pellet produced with the diatom was abouttwice as high as the other diets (Fig. 3b). Fecal pelletlengths were more variable than the widths. The coef-ficient of variation for pellet length ranged from 4%(the flagellate) to 20% (the diatom), and from 4% (theautotrophic dinoflagellate) to 11% (the diatom) for pel-let width. Pellet production rate (number and total vol-ume) increased curvilinearly with increasing food con-centration in all diets (Fig. 3), with the Ivlev fit being,as indicated by the r2 values, best for the autotrophicdinoflagellate and worse for the heterotrophic dinofla-gellate (Table 2). In contrast, a strong relationship (r2 =0.51) between pellet volume and food concentrationwas apparent only in the case of the diatom diet.Regardless of diet, mean pellet volume appeared toreach a maximum at relatively low food concentrations(50 to 150 µgC l–1).
Ingestion-defecation relationship
The relationships between fecal pellet productionrate (number and volume) and total fecal pellet volumeversus ingestion of Acartia tonsa are presented inFig. 4. Because the independent variable (ingestion)was not experimentally controlled, all pairs of observa-tions are plotted. Where applicable, the summary sta-tistics for Ivlev and linear fits for the relations men-tioned above are presented in Table 3. In all cases, the
155
Fig. 2. Acartia tonsa. Maximum clearance rate (mean ± SD,n = 6 to 10) versus mean food particle equivalent sphericaldiameter (ESD). Each ESD corresponds to a different diet (see
Table 1)
Regression T. weissflogii D. tertiolecta Uronema sp. P. minimum Oxyrrhis sp.
Conc. vs FPPa 196.6 ± 12.3 44.1 ± 3.71 53.7 ± 4.4 294.1 ± 45.0 59.0 ± 6.6b 0.015 ± 0.002 0.004 ± 0.0009 0.007 ± 0.002 0.001 ± 0.0003 0.018 ± 0.006r2 0.77** 0.50** 0.58** 0.91** 0.29**n 55 67 64 54 39
Conc. vs Fec. vol.a 3.93 ± 015 1.33 ± 0.066 1.44 ± 0.075 1.99 ± 0.05 1.87 ± 0.084b 0.052 ± 0.008 0.025 ± 0.007 0.06 ± 0.02 0.048 ± 0.01 0.05 ± 0.012r2 0.51* 0.098* 0.095* 0.14** 0.19**n 55 67 64 54 39
Conc. vs Tot. vol.a 850.9 ± 91.4 54.8 ± 4.9 74.1 ± 0.23 410.3 ± 46.5 115.8 ± 16.2b 0.01 ± 0.002 0.004 ± 0.001 0.007 ± 0.003 0.002 ± 0.0005 0.016 ± 0.006r2 0.66** 0.43** 0.38** 0.82** 0.26**n 55 67 64 54 39
*p < 0.02, **p < 0.01
Table 2. Summary of Ivlev models fitted to the data on relationship between food concentration (Conc.) and daily fecal pelletproduction (FPP), pellet volume (Fec. vol.) and total pellet volume production (Tot. vol.) of Acartia tonsa females. The Ivlev modelemployed was: Y = a (1 – e–bX), where a is the asymptotic maximum value of Y (FPP or Fec. vol or Tot. vol.), and b represents therate of increase of Y with respect to X (food concentration). Units of Y and X are given in Fig. 3. n = sample size, r2 = coefficient
of determination, and p = probability that b is not different from zero. Full species names given in Table 1
Mar Ecol Prog Ser 229: 151–164, 2002156
Fig
. 3.
Aca
rtia
ton
sa.
Fec
al p
elle
t p
rod
uct
ion
(F
PP
) an
d s
ize
vers
us
die
t. (
a) D
aily
fec
al p
elle
t p
rod
uct
ion
ver
sus
food
con
cen
trat
ion
. (b
) V
olu
me
of i
nd
ivid
ual
pel
lets
ver
sus
food
con
cen
trat
ion
. (c
) T
otal
pel
let
volu
me
vers
us
food
con
cen
trat
ion
. E
ach
poi
nt
rep
rese
nts
th
e m
ean
±S
D o
f 6
to 1
0 re
pli
cate
s. S
ome
of t
he
SD
bar
s ar
e sm
alle
r th
an t
he
dot
rep
rese
nti
ng
th
e m
ean
. Fu
ll s
pec
ies
nam
es g
iven
in
Tab
le 1

Besiktepe & Dam: Ingestion and defecation in the calanoid copepod 157
Fig
. 4.
Aca
rtia
ton
sa.
Fec
al p
elle
t p
rod
uct
ion
(F
PP
) an
d s
ize
vers
us
ing
esti
on a
s a
fun
ctio
n o
f d
iet.
Ivl
ev (
soli
d l
ine)
an
d l
inea
r (d
ash
ed l
ine)
mod
els
fitt
ed t
o th
e d
ata.
Su
m-
mar
y of
th
e fi
ts i
s p
rese
nte
d i
n T
able
3. F
ull
sp
ecie
s n
ames
giv
en i
n T
able
1

Mar Ecol Prog Ser 229: 151–164, 2002
number of pellets and the total fecal volume produceddaily increased with ingestion. However, the patternwas best described by a linear fit for the diatom (r2 =0.69 for number and r2 = 0.59 for total volume) andworst for heterotrophic dinoflagellate (r2 = 0.097 fornumber and r2 = 0.14 for volume); in the latter, thecurvilinear fit was slightly better (r2 = 0.23 for numberand r2 = 0.25 for total volume). In the 3 other diets, dif-ferences between the linear and curvilinear fits wererelatively small (<14% difference in r2 values), but ther2 values (0.4 to 0.6) were quite higher than in the caseof the autotrophic dinoflagellate. Pellet volume wascurvilinearly related to ingestion for the diatom, withvolume being more or less constant once ingestionreached 2 µgC ind.–1 d–1. Pellet volume was weaklyrelated to ingestion in the case of the heterotrophicdinoflagellate, and independent of ingestion in theother 3 diets.
Gut passage time
The relationship between gut passage time (GPT)and food concentration is shown in Fig. 5. GPTdeclined rapidly with food concentration for all diets, atthe lower food concentrations (0 to ~250 µgC l–1). GPTvaried little with food concentration once concentra-tions were beyond ~250 µgC l–1. GPT ranged from aminimum of about 10 min to a maximum of about300 min. We derived regressions of GPT versus foodconcentration assuming an exponential decay model(Ln Y versus X). To compare the slopes of these rela-tionships, we excluded values beyond ~250 µgC l–1.The rank of the slopes, which varied by more than anorder of magnitude among foods, was as follows:diatom (–0.003) > flagellate (–0.0094) = autotrophicdinoflagellate (–0.0091) = scuticociliate (–0.0076) >heterotrophic dinoflagellate (–0.0028) (ANCOVA, p <0.05).
Assimilation efficiency
The relationship between assimilation efficiency(AE) and food concentration varied with diet (Fig. 6).AE were lowest for the diatom (~15 to 50%) and high-est for the flagellate (>90%). AE were also relativelyhigh (>80%) with the ciliate diet. There appeared tobe a decrease in assimilation efficiency with food con-centration with the diatom, and both the autotrophicand heterotrophic dinoflagellate diet. However, thepattern was significant only in the case of the diatom(Y = 0.41e–0.042X, r2 = 0.16, n = 32, p < 0.01) and theautotrophic dinoflagellate diet (Y = 0.77e–0.005X, r2 =0.26, n = 51, p < 0.01). We did not attempt to examine
158
Fig
. 5.
Aca
rtia
ton
sa.
Est
imat
ed g
ut
pas
sag
e ti
me
vers
us
food
con
cen
trat
ion
as
a fu
nct
ion
of
die
t. E
ach
poi
nt
rep
rese
nts
th
e m
ean
±S
D o
f 6
to 1
0 re
pli
cate
s. F
ull
sp
ecie
s n
ames
giv
en i
n T
able
1

Besiktepe & Dam: Ingestion and defecation in the calanoid copepod
the relationship of AE with ingestion rate (e.g. Gaudy1974) because AE is partly based on ingestion rate(Eq. 1).
DISCUSSION
Ingestion rate and food type
The maximum ingestion rates, expressed as percent-age of carbon body weight consumed daily, observedin this study are within the range observed for thegenus Acartia, which can readily achieve rates equiva-lent to 100% of body carbon at high food concentra-tions (Durbin & Durbin 1992), or higher. For instance,Paffenhoffer (1988) reported values of up to 360% ofdaily body weight for A. tonsa, and Deason (1980)reported up to 660% of body carbon for A. hudsonica.
The relationship between ingestion and food con-centration in the present study showed, regardless offood type, the typical curvilinear pattern exhibited bymany copepod species (Vanderploeg 1990). In addi-tion, the 2-level ANOVA revealed the effect of foodtype on the functional response, as has been reportedby others (Houde & Roman 1987, Rothhaupt 1990). Theeffect of food type on the functional response was man-ifested in at least 2 ways. One is the relationshipbetween the rate at which ingestion rate increases withfood concentration versus food type, as evidenced bythe slopes of Ivlev curvilinear fits in Fig. 1. The highestslopes corresponded to copepods feeding on the dia-
tom and the autotrophic dinoflagellate. The other wayis the relationship between maximum clearance rateand food size, with maxima also obtained when thecopepods fed on these same 2 diets (Fig. 2). In the pre-sent study, the food ESD ranged from 7.3 (the flagel-late) to 13.9 µm (the heterotrophic dinoflagellate). Theoptimum food size (the size at which clearance ismaximum) is a complex function of many variables,including the retention ability and the size of copepods(Berggreen et al. 1988, Støttrup & Jensen 1990). ForCalanus finmarchicus, the optimum size is 30 µm(Gamble 1978), and around 17 µm for Pseudocalanuselongatus (Koski et al. 1998). We observed the opti-mum food size for Acartia tonsa to be 10 to 12 µm,which is identical to the lower limit of optimum particlesize reported by Berggreen et al. (1988), and Støttrop &Jensen (1990) for A. tonsa.
Factors other than food size also influenced thefunctional response. The rates of ingestion of the het-erotrophic dinoflagellate were much lower than thoseof the flagellate and the scuticociliate, despite thelarger size of the former. The latter 2 foods are notoptimal at supporting metabolism and growth ofAcartia tonsa (Støttrup & Jensen 1990, Thor et al. inpress). Thus, the high ingestion rate for these 2 foodsmay have been necessary to achieve the copepoddaily requirements of biochemical compounds forgrowth (Tang & Dam 1999). Alternatively, sloppyfeeding (incomplete ingestion of particles) may haveoccurred. Typically, sloppy feeding results in foodparticle fragmentation. However, if that was the case
159
Regression T. weissflogii D. tertiolecta Uronema sp. P. minimum Oxyrrhis sp.Linear Ivlev Linear Ivlev Linear Ivlev Linear Ivlev Linear Ivlev
Ing. vs FPPa 25.3 ns 10.498 45.3 13.55 55.76 18.5 247.2 34.1 53.67b 0.85 ns 1.43 0.14 3.01 0.214 10.14 0.07 4.49 1.25r2 0.69** ns 0.50** 0.62** 0.43** 0.54** 0.46** 0.48** 0.097* 0.23**n 55 67 67 64 64 54 54 39 39
Ing. vs Fec. vol.a 2.31 3.8 ns ns ns ns ns ns 1.54 nsb 0.34 1.41 ns ns ns ns ns ns 0.087 nsr2 0.38** 0.64** ns ns ns ns ns ns 0.12* nsn 55 55 39
Ing. vs Tot. vol.a 48.66 ns 13.8 56.65 18.66 80.34 27.49 574.5 55.26 114.01b 115.78 ns 1.78 0.15 4.33 0.21 20.69 0.055 11.85 0.74r2 0.59** ns 0.44** 0.56** 0.30** 0.37** 0.54** 0.56** 0.14* 0.25**n 55 67 67 64 64 54 54 39 39
*0.05 < p > 0.02, **p < 0.01
Table 3. Summary of linear and Ivlev models fitted to the data on relationship between ingestion, Ing. (µgC ind.–1 d–1), and daily fecalpellet production (FPP), pellet volume (Fec. vol.) and total pellet production (Tot. vol.) of Acartia tonsa females. In the Ivlev model X isIng., and Y is FPP or Fec. Vol. or Tot. vol. Units of the dependent variables are given in Fig. 4. Other abbreviations of the Ivlev modelas in Table 2. For the linear regression, a = intercept and b = slope. ns = not significant (p > 0.05). Full species names given in Table 1

Mar Ecol Prog Ser 229: 151–164, 2002
in our study, then the food fragments had to be belowthe size detection limit of 3 µm of our particle counterbecause the particle size spectrum before and afterincubation experiments with these 2 diets did notchange significantly.
Defecation rate, gut passage time and assimilationefficiency versus food type
Previous studies of zooplankton fecal pellets indicatethat different diets yield different pellet productionrates and pellet characteristics (summarized in Fein-berg & Dam 1998). However, with few exceptions (e.g.Gaudy 1974, Griffin 2000) most studies have dealt with
1, or at best 2 diets. Hence, comparison of diet effectsamong studies is complicated by many other factors. Inthe present study, the fecal pellet production in termsof number and total volume changed significantly withdiet and with food concentrations, and a curvilinearfunctional response curve was observed for the pelletproduction (Fig. 3). Pellet volume increased curvilin-early with food concentration. However, this relation-ship was strong only in the case of the diatom. Thismay simply reflect the fact that many more measure-ments were done at the low food concentration withthis diet than with the rest. Clearly, for all diets pelletvolume appears unrelated to food concentration whenthe latter exceeds ~100 µgC l–1. This is consistent withprevious observations (Dagg & Walser 1986, Tsuda &
160
Fig. 6. Acartia tonsa. Estimated carbon as-similation efficiency versus food con-centration as a function of diet. Each pointrepresents the mean ± SD of 6 to 10 repli-cates. Full species names given in Table 1

Besiktepe & Dam: Ingestion and defecation in the calanoid copepod
Nemoto 1990, Butler & Dam 1994, Båmstedt et al.1999).
Estimates of gut passage time, which are related tothe pellet production rate, showed rapid decrease withfood concentration for all diets. A similar pattern hasbeen observed in other studies using a diatom (Dagg &Walser 1987), and natural seston (Tsuda & Nemoto1987) as food. Numerous studies have derived gut pas-sage time from the empirical relationship between gutclearance rate and temperature of Dam & Peterson(1988). However, since that relationship was derivedunder non-limiting food conditions, the results fromthe present study suggest that at very low food con-centrations, gut passage time will be underestimatedwhen derived from temperature alone.
Assimilation efficiencies in the present study arerough estimates because total recovery of the fecalmatter produced may not have occurred. This wouldresult in an overestimation of the assimilation effi-ciency. There are also possible unknown errors in thefactors employed in Eq. (2) to convert wet and dryweight to carbon. For instance, Urban-Rich et al.(1998) found that the carbon to volume ratio of cope-pod pellets was independent of food type at a con-stant concentration, but increased with food concen-tration. We reasoned that the latter finding does notapply to Acartia tonsa since their pellet density doesnot increase significantly with food concentration(Feinberg & Dam 1998). Moreover, the main purposeof estimating assimilation efficiencies in the presentstudy was to reveal gross differences among diets.Conover (1978) reported a mean zooplankton assimi-lation efficiency of 70 ± 30%, which was based onseveral hundreds of measurements. However, there issome evidence that copepod assimilation efficiencydecreases with food concentration (Gaudy 1974,Landry et al. 1984), and that it can be much lower (10to 20%) than the 70% mean at high food concentra-tions (Gaudy 1974). Assimilation efficiency decreasedwith food concentration when copepods fed on thediatom and the autotrophic dinoflagellate, but thiswas not clear for the other diets, particularly for theflagellate and the scuticociliate (Fig. 6). The resultsof the present study thus suggest that a decrease inassimilation efficiency with increasing food concen-tration is not always warranted, even in copepodsacclimated to their food source. Assimilation efficien-cies on the latter 2 diets were also quite high (>90%),whereas those of the former diet were lower (~20 to85), particularly in the case of the diatom. These lowerassimilation efficiencies may reflect a larger fractionof the organic carbon being associated with thestructural components of the cells that are not easilydigested (Reinfelder & Fisher 1991, Cowie & Hedges1996).
Potential bias due to pellet degradation andcoprophagy
Pellet degradation and coprophagy can lead tounderestimation of fecal pellet production or pelletvolume, which in turn would bias estimates of assimi-lation efficiency and the relationship between inges-tion and defecation rate. Diet and food concentrationinfluence fecal pellet degradation (Lee & Fisher 1994,Hansen et al. 1996). Hansen et al. (1996) observedfaster fecal pellet degradation rates for pellets pro-duced on a ciliate diet than on a diatom diet. Hence,we tested the degradation of fecal pellets by using thescuticociliate, Uronema sp. Fecal pellets were incu-bated at 1 low (30 µgC l–1) and 1 high (500 µgC l–1)concentration of Uronema sp. for 24 h. Before and afterthe incubation, their length and width were measuredusing a dissecting microscope with 50× magnification.In contrast with the findings of Hansen et al. (1996), wedid not observe any significant differences in fecalpellet length and width, before and after the experi-ments (Paired-samples t-test, p > 0.05, n = 6). A similarresult to ours was obtained by Feinberg & Dam (1998).Thus, we can be confident that the measured pelletproduction rates and the pellet sizes in this study werenot unduly affected by degradation.
Fecal pellet repackaging (coprophagy) has beenreported at low food concentrations (Paffenhöfer &Knowles 1979, Green et al. 1992). We did a simple testto examine coprophagy with Uronema sp. as the foodsource at low food concentration (30 µgC l–1). Uronemacells were labeled with yellow fluorescent dye (Dolan& Coats 1991), and female Acartia tonsa were allowedto feed on these cells, and produced fluorescent (yel-low) pellets (normally pellets produced on Uronemaare white). Eight replicates (single female in 144 mlbottles) incubations, each with 30 µgC l–1 of unlabeledUronema cells and 5 labeled pellets, were prepared.Two bottles were sacrificed at 2.5 and 3.5 h, respec-tively. The other 4 bottles were sacrificed at 24 h. Ofthe 40 fluorescent pellets, we observed 2 eaten by A.tonsa females (one in the gut at t = 2.5 h, and another(half fluorescent, half white) at t = 3.5 h). Hence, loss ofpellets to cophrophagy was 5%. Thus, cophropaghyin this study did not appear to result in gross under-estimation of fecal pellet production.
Ingestion-defecation relationship
A main goal of this study was to be able to quantifythe relationship between ingestion and fecal pelletproduction. Fecal pellet production in terms of numberand total pellet volume was dependent on ingestion forall diets (see Table 3). Past studies have shown a posi-
161
Mar Ecol Prog Ser 229: 151–164, 2002
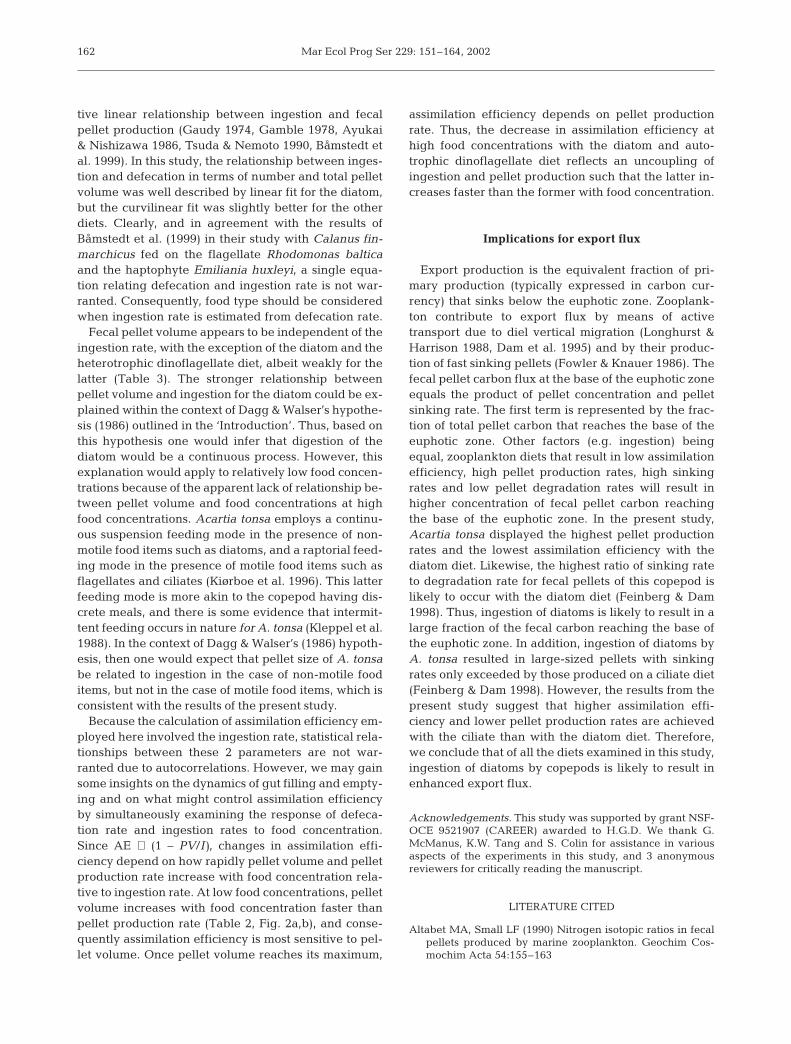
tive linear relationship between ingestion and fecalpellet production (Gaudy 1974, Gamble 1978, Ayukai& Nishizawa 1986, Tsuda & Nemoto 1990, Båmstedt etal. 1999). In this study, the relationship between inges-tion and defecation in terms of number and total pelletvolume was well described by linear fit for the diatom,but the curvilinear fit was slightly better for the otherdiets. Clearly, and in agreement with the results ofBåmstedt et al. (1999) in their study with Calanus fin-marchicus fed on the flagellate Rhodomonas balticaand the haptophyte Emiliania huxleyi, a single equa-tion relating defecation and ingestion rate is not war-ranted. Consequently, food type should be consideredwhen ingestion rate is estimated from defecation rate.
Fecal pellet volume appears to be independent of theingestion rate, with the exception of the diatom and theheterotrophic dinoflagellate diet, albeit weakly for thelatter (Table 3). The stronger relationship betweenpellet volume and ingestion for the diatom could be ex-plained within the context of Dagg & Walser’s hypothe-sis (1986) outlined in the ‘Introduction’. Thus, based onthis hypothesis one would infer that digestion of thediatom would be a continuous process. However, thisexplanation would apply to relatively low food concen-trations because of the apparent lack of relationship be-tween pellet volume and food concentrations at highfood concentrations. Acartia tonsa employs a continu-ous suspension feeding mode in the presence of non-motile food items such as diatoms, and a raptorial feed-ing mode in the presence of motile food items such asflagellates and ciliates (Kiørboe et al. 1996). This latterfeeding mode is more akin to the copepod having dis-crete meals, and there is some evidence that intermit-tent feeding occurs in nature for A. tonsa (Kleppel et al.1988). In the context of Dagg & Walser’s (1986) hypoth-esis, then one would expect that pellet size of A. tonsabe related to ingestion in the case of non-motile fooditems, but not in the case of motile food items, which isconsistent with the results of the present study.
Because the calculation of assimilation efficiency em-ployed here involved the ingestion rate, statistical rela-tionships between these 2 parameters are not war-ranted due to autocorrelations. However, we may gainsome insights on the dynamics of gut filling and empty-ing and on what might control assimilation efficiencyby simultaneously examining the response of defeca-tion rate and ingestion rates to food concentration.Since AE ∝ (1 – PV/I), changes in assimilation effi-ciency depend on how rapidly pellet volume and pelletproduction rate increase with food concentration rela-tive to ingestion rate. At low food concentrations, pelletvolume increases with food concentration faster thanpellet production rate (Table 2, Fig. 2a,b), and conse-quently assimilation efficiency is most sensitive to pel-let volume. Once pellet volume reaches its maximum,
assimilation efficiency depends on pellet productionrate. Thus, the decrease in assimilation efficiency athigh food concentrations with the diatom and auto-trophic dinoflagellate diet reflects an uncoupling ofingestion and pellet production such that the latter in-creases faster than the former with food concentration.
Implications for export flux
Export production is the equivalent fraction of pri-mary production (typically expressed in carbon cur-rency) that sinks below the euphotic zone. Zooplank-ton contribute to export flux by means of activetransport due to diel vertical migration (Longhurst &Harrison 1988, Dam et al. 1995) and by their produc-tion of fast sinking pellets (Fowler & Knauer 1986). Thefecal pellet carbon flux at the base of the euphotic zoneequals the product of pellet concentration and pelletsinking rate. The first term is represented by the frac-tion of total pellet carbon that reaches the base of theeuphotic zone. Other factors (e.g. ingestion) beingequal, zooplankton diets that result in low assimilationefficiency, high pellet production rates, high sinkingrates and low pellet degradation rates will result inhigher concentration of fecal pellet carbon reachingthe base of the euphotic zone. In the present study,Acartia tonsa displayed the highest pellet productionrates and the lowest assimilation efficiency with thediatom diet. Likewise, the highest ratio of sinking rateto degradation rate for fecal pellets of this copepod islikely to occur with the diatom diet (Feinberg & Dam1998). Thus, ingestion of diatoms is likely to result in alarge fraction of the fecal carbon reaching the base ofthe euphotic zone. In addition, ingestion of diatoms byA. tonsa resulted in large-sized pellets with sinkingrates only exceeded by those produced on a ciliate diet(Feinberg & Dam 1998). However, the results from thepresent study suggest that higher assimilation effi-ciency and lower pellet production rates are achievedwith the ciliate than with the diatom diet. Therefore,we conclude that of all the diets examined in this study,ingestion of diatoms by copepods is likely to result inenhanced export flux.
Acknowledgements. This study was supported by grant NSF-OCE 9521907 (CAREER) awarded to H.G.D. We thank G.McManus, K.W. Tang and S. Colin for assistance in variousaspects of the experiments in this study, and 3 anonymousreviewers for critically reading the manuscript.
LITERATURE CITED
Altabet MA, Small LF (1990) Nitrogen isotopic ratios in fecalpellets produced by marine zooplankton. Geochim Cos-mochim Acta 54:155–163
162

Besiktepe & Dam: Ingestion and defecation in the calanoid copepod
Ayukai T, Nishizawa S (1986) Defecation rate as a possiblemeasure of ingestion rate of Calanus pacificus pacificus(Copepoda: Calanoida). Bull Plankton Soc Jpn 33:3–10
Båmstedt U, Nejstgaard JC, Solberg PT (1999) Utilisation ofsmall-sized food algae by Calanus finmarchicus (Cope-poda, Calanoida) and the significance of feeding history.Sarsia 84:19–38
Berggreen U, Hansen B, Kiørboe T (1988) Food size spectra,ingestion and growth of the copepod Acartia tonsa duringdevelopment: implications for determination of copepodproduction. Mar Biol 99:341–352
Bienfang PK (1980) Herbivore diet affects fecal pellet settling.Can J Fish Aquat Sci 37:1352–1357
Butler M, Dam HG (1994) Production rates and characteristicsof fecal pellets of the copepod Acartia tonsa under simu-lated phytoplankton bloom conditions: implications forvertical fluxes. Mar Ecol Prog Ser 114:81–91
Conover RC (1978) Transformation of organic matter. In:Kinne O (ed) Marine ecology, Vol 4. Wiley-Liss Inc, NewYork, p 221–499
Corner EDS, Head RN, Kilvington CC (1972) On the nutritionand metabolism of zooplankton VIII. The grazing of Bid-dulphia cells by Calanus helgolandicus. J Mar Biol AssocUK 52:847–861
Cowie GL, Hedges JI (1996) Digestion and alteration of thebiochemical constituents of a diatom (Thalassiosira weiss-flogii) ingested by a herbivorous zooplankton (Calanuspacificus). Limnol Oceanogr 41:581–594
Dagg MJ, Walser WE Jr (1986) The effects of food concen-tration on fecal pellet size in marine copepods. LimnolOceanogr 31:1066–1071
Dagg MJ, Walser WE Jr (1987). Ingestion, gut passage, andegestion by the copepod Neocalanus plumchrus in thelaboratory and in the subarctic Pacific ocean. LimnolOceanogr 32:178–188
Dam HG, Peterson WT (1988) The effect of temperature onthe gut clearance rate constant of planktonic copepods.J Exp Mar Biol Ecol 123:1–14
Dam HG, Roman MR, Youngbluth MJ (1995) Downwardexport of respiratory carbon and dissolved inorganic nitro-gen by diel-migrant zooplankton at the JGOFS Bermudatime-series station. Deep-Sea Res I 42:1187–1197
Deason EE (1980) Grazing of Acartia hudsonica (A. clausi) onSkeletonema costatum in Narragansett Bay (USA): influ-ence of food concentration and temperature. Mar Biol 60:101–113
Dolan JR, Coats DW (1991) A study of feeding in predaciousciliates using prey ciliates labeled with fluorescent micro-spheres. J Plankton Res 13(3):609–627
Durbin EG, Durbin AG (1992) Effects of temperature and foodabundance on grazing and short term weight change inthe marine copepod Acartia hudsonica. Limnol Oceanogr37:361–378
Feinberg RL, Dam HG (1998) Effects of diet on dimensions,density and sinking rates of fecal pellets of the copepodAcartia tonsa. Mar Ecol Prog Ser 175:87–96
Fowler SW, Knauer GA (1986) Role of large particles in thetransport of elements and organic compounds through theoceanic water column. Prog Oceanogr 16:147–194
Gamble JC (1978) Copepod grazing during a declining springphytoplankton bloom in the Northern North Sea. Mar Biol49:303–315
Gaudy R (1974) Feeding four species of pelagic copepodsunder experimental conditions. Mar Biol 25:125–141
Green EP, Harris RP, Duncan A (1992) The production andingestion of faecal pellets by nauplii of marine calanoidcopepods. J Plankton Res 14(12):1631–1643
Griffin SL (2000) Influence of food type on the production andsettling rate of faecal pellets produced by an estuarinecopepod. Mar Freshw Res 51(4):371–378
Guillard RRL (1975) Culture of phytoplankton for feedinginvertebrates. In: Smith WL, Chanley MH (eds) Culture ofmarine invertebrates. Plenum Press, New York, p 29–60
Hansen B, Fotel FL, Jensen NJ, Madsen SD (1996) Bacteriaassociated with a marine planktonic copepod in culture. II.Degradation of fecal pellets produced on a diatom, ananoflagellate or a dinoflagellate diet. J Plankton Res 18:275–288
Houde SE, Roman MR (1987) Effects of food quality on thefunctional ingestion response of the copepod Acartiatonsa. Mar Ecol Prog Ser 86:229–238
Kiørboe T, Møhlenberg F, Nicolajsen H (1982) Ingestion rateand gut clearance in the planktonic copepod Centropageshamatus (Lilljeborg) in relation to food concentration andtemperature. Ophelia 21:181–194
Kiørboe T, Møhlenberg F, Hamburger K (1985) Bioenergeticsof the planktonic copepod Acartia tonsa: relation betweenfeeding, egg production and respiration, and compositionof specific dynamic action. Mar Ecol Prog Ser 26:85–97
Kiørboe T, Saiz E, Viitasalo M (1996) Prey switching behav-iour in the planktonic copepod Acartia tonsa. Mar EcolProg Ser 143:65–75
Kleppel GS, Pieper RE, Trager GS (1988) Variability in gutcontent of individual Acartia tonsa from waters off south-ern California. Mar Biol 97:185–190
Koski M, Breteler WK, Schogt N (1998) Effect of food qualityon rate of growth and development of the pelagic copepodPseudocalanus elongatus (Copepoda, Calanoida). MarEcol Prog Ser 170:169–187
Landry MR, Hassett RP, Fagerness V, Downs J, Lorenzen CJ(1984) Effect of food acclimation on assimilation efficiencyof Calanus pacificus. Limnol Oceanogr 29:361–364
Lee BG, Fisher NS (1994) Effects of sinking and zooplanktongrazing on the release of elements from planktonic debris.Mar Ecol Prog Ser 110:271–281
Longhurst AR, Harrison WG (1988) Vertical nitrogen fluxfrom the oceanic photic zone by diel migrant zooplanktonand nekton. Deep-Sea Res 35:881–889
Morales C (1987) Carbon and nitrogen content of copepodfaecal pellets: effects of food concentration and feedingbehaviour. Mar Ecol Prog Ser 36:107–114
Noji TT (1991) The influence of macrozooplankton on verticalparticulate flux. Sarsia 76:1–9
Paffenhöfer GA (1988) Feeding rates and behavior of zoo-plankton. Bull Mar Sci 43:430–445
Paffenhöfer GA, Knowles SC (1979) Ecological implications offecal pellet size, production and consumption by cope-pods. J Mar Res 37:35–49
Parsons TR, Takahashi M, Hargrave B (1984) Biologicaloceanographic processes, 3rd edn. Pergamon Press, Ox-ford, p 330
Reeve MR, Walter MA (1977) Observations on the existenceof lower threshold and upper critical food concentrationsfor the copepod Acartia tonsa Dana. J Exp Mar Biol Ecol29:211–221
Reinfelder JR, Fisher NS (1991) The assimilation of elementsingested by marine copepods. Science 251:794–796
Rothhaupt KO (1990) Changes of the functional responses ofthe rotifers Brachionus rubens and Brachionus calycifloruswith particle sizes. Limnol Oceanogr 35(1):24–32
Small LF, Landry MR, Eppley RW, Carlucci AF (1989) Role ofplankton in the carbon and nitrogen budgets of SantaMonica Basin, California. Mar Ecol Prog Ser 56:57–74
Sokal RR, Rohlf FJ (1981) Biometry. The principles and prac-
163

Mar Ecol Prog Ser 229: 151–164, 2002
tice of statistics in biological research, 2nd edn. WH Free-man and Co, New York
Støttrup JG, Jensen J (1990) Influence of algal diet on feedingand egg production of the calanoid copepod Acartia tonsaDana. J Exp Mar Biol Ecol 141:87–105
Tang KW, Dam HG (1999) Limitation of zooplankton produc-tion: beyond stoichiometry. Oikos 84:537–542
Thor P, Cervetto G, Besiktepe S, Ribera-Maycas E, Tang KW,Dam HG (in press) Influence of two different green algaldiets on specific dynamic action and incorporation of car-bon into biochemical fractions in the copepod Acartiatonsa. J Plankton Res
Tsuda A, Nemoto T (1987) The effect of food concentrationon the gut clearance time of Pseudocalanus minutusKroyer (Calanoida: Copepoda). J Exp Mar Biol Ecol 107:121–130
Tsuda A, Nemoto T (1990) The effect of food concentration on
the fecal pellet size of marine copepod Pseudocalanusnewmani Frost. Bull Plankton Soc Jpn 37:83–90
Urban LJ, McKenzie CH, Deibel D (1992) Seasonal differ-ences in the content of Oikopleura vanhoeffeni andCalanus finmarchicus faecal pellets: illustrations of zoo-plankton food web shifts in coastal Newfoundland waters.Mar Ecol Prog Ser 84:255–264
Urban-Rich J, Hansell DA, Roman MR (1998) Analysis ofcopepod fecal pellet carbon using a high temperaturecombustion method. Mar Ecol Prog Ser 171:199–208
Vanderploeg HA (1990) Feeding mechanisms and particleselection in suspension feeding-zooplankton. In: WottonRS (ed) The biology of particles in aquatic systems. CRCPress, Boca Raton, p 183–211
Voss M (1991) Content of copepod fecal pellets in relation tofood supply in Kiel Bight and its effect on sedimentationrate. Mar Ecol Prog Ser 75:217–225
164
Editorial responsibility: Kenneth Tenore (Contributing Editor),Solomons, Maryland, USA
Submitted: August 4, 2000; Accepted: July 27, 2001Proofs received from author(s): February 26, 2002
Copyright © 2022 FDOKUMEN