Facilitation of contrast detection in near-peripheral vision
Upload
independentCategory
view
1download
0
Climatic Facilitation of the Colonization of an Estuary byAcartia tonsaAurelie Chaalali1,2*, Gregory Beaugrand3,4,5, Virginie Raybaud3,4, Eric Goberville3,4,6, Valerie David1,2,
Philippe Boet7, Benoit Sautour1,2
1 Universite Bordeaux 1, UMR 5805 EPOC, Environnements et Paleoenvironnements Oceaniques et Continentaux, Station marine d’Arcachon, Arcachon, France, 2 CNRS,
UMR 5805 EPOC, Environnements et Paleoenvironnements Oceaniques et Continentaux, Arcachon, France, 3 Universite Lille 1, UMR 8187 LOG, Laboratoire d’Oceanologie
et de Geosciences, Wimereux, France, 4 CNRS, UMR 8187 LOG, Laboratoire d’Oceanologie et de Geosciences, Wimereux, France, 5 SAHFOS, Plymouth, United Kingdom,
6 Universite Lille 1, UMR 8198 GEPV, Laboratoire de Genetique et Evolution des Populations Vegetales, Villeneuve d’Ascq, France, 7 Irstea, Unite Ecosystemes estuariens et
Poissons migrateurs amphihalins, Cestas Gazinet, France
Abstract
Global change has become a major driving force of both terrestrial and marine systems. Located at the interface betweenthese two realms, estuarine ecosystems are probably the place where both direct and indirect effects of human activitiesconspire together to affect biodiversity from phytoplankton to top predators. Among European estuarine systems, theGironde is the largest estuary of Western Europe and many studies have provided evidence that it has been affected by avariety of anthropogenic stressors such as thermal and chemical pollution, physical alterations and exploitation, especiallyfor maritime traffic. In such a context, species introduction is also a current major issue with the establishment of strongcompetitive species that could lead to ecosystem reorganization with potential decrease or even disappearance of nativespecies. In the Gironde estuary, this hypothesis was proposed for the invasive shrimp species Palaemon macrodactylus as adecrease in the native species abundance was observed at the same time. Although species introduction often takes placevia ballast water, the influence of climate-driven changes on the establishment of new species remains a key issue. Thecalanoid copepod Acartia tonsa, observed in the Gironde estuary for the first time in 1983, have since colonized most part ofthe estuary, reaching a level of abundance comparable to the dominant native species Eurytemora affinis. In this study,using both the concept of the ecological niche sensu Hutchinson (fundamental and realized niches) and statistical models,we reveal that the dynamics of the colonization of A. tonsa was facilitated by environmental conditions that have becomecloser to its environmental optimum with respect to temperature and salinity.
Citation: Chaalali A, Beaugrand G, Raybaud V, Goberville E, David V, et al. (2013) Climatic Facilitation of the Colonization of an Estuary by Acartia tonsa. PLoSONE 8(9): e74531. doi:10.1371/journal.pone.0074531
Editor: Myron Peck, University of Hamburg, Germany
Received February 18, 2013; Accepted August 6, 2013; Published September 30, 2013
Copyright: � 2013 Chaalali et al. This is an open-access article distributed under the terms of the Creative Commons Attribution License, which permitsunrestricted use, distribution, and reproduction in any medium, provided the original author and source are credited.
Funding: The data the authors used for their research article come from monitoring programs supported by Electricite de France (EDF), the Institut Francais deRecherche pour l’Exploitation de la Mer (IFREMER), and the Centre National de la Recherche Scientifique (CNRS). This study was funded by the Conseil Regionald’Aquitaine. The funders had no role in study design, data collection and analysis, decision to publish, or preparation of the manuscript.
Competing Interests: The data the authors used for their research article come from monitoring programs supported by Electricite de France (EDF), the InstitutFrancais de Recherche pour l’Exploitation de la Mer (IFREMER), and the Centre National de la Recherche Scientifique (CNRS). This study was funded by the ConseilRegional d’Aquitaine. The funders had no role in study design, data collection and analysis, decision to publish, or preparation of the manuscript. There are nopatents, products in development or marketed products to declare. This does not alter the authors’ adherence to all the PLOS ONE policies on sharing data andmaterials.
* E-mail: [email protected]
Introduction
Marine biodiversity and ecosystems are being altered by many
human-induced factors including overexploitation of marine
resources [1,2], chemical pollution and physical alterations [3],
eutrophication and invasion of exotic species [4–6]. Fisheries have
affected the marine environment through both direct and indirect
effects [1,2,7]. After habitat degradation, the introduction of non-
native species in an environment is a major cause of extinction
[8,9]. So far, marine invasions have been less investigated although
their magnitude and frequency may lead to profound changes in
ecosystem functioning and biological community structure
[4,10,11].
Estuaries, located at the interface between terrestrial and
marine realms, constitute habitat for many species or even
nursery, refuge and growth areas [12–14]. However, these
ecosystems are being affected by human activities such as fishing,
polluting, and maritime traffic [15,16]. For example, maritime
traffic increases the number of invasive species (e.g. copepods [17];
shrimps [18]) potentially transported via ballast waters. Survival of
these species depends on environmental conditions within their
new ecosystem and climate change may influence the establish-
ment of alien species [19]. For example, Raitsos et al. [20] showed
that the appearance of benthic and pelagic tropical species in the
eastern part of the Mediterranean Sea was highly positively
correlated with sea surface warming.
When they manage to survive, invasive species may impact their
new ecosystem by affecting both its structure and functioning with
implications for the structure and function of the entire food web
[17,18,21]. For example, the establishment of the invasive
copepod species Acartia tonsa in the oligo-mesohaline zone of the
Gironde estuary led to a phenological shift in the native copepod
Acartia bifilosa production period being advanced one month
earlier in the year [17]. Acartia tonsa also invaded the estuary of
PLOS ONE | www.plosone.org 1 September 2013 | Volume 8 | Issue 9 | e74531

Bilbao and altered the spatial distribution of the native copepod
Acartia clausi [21].
In this study, we used the concept of the ecological niche sensu
Hutchinson (fundamental and realized niches) to investigate the
drivers involved in the colonization of A. tonsa. We considered two
climate-driven parameters, temperature and salinity, for their well-
known influence on biological processes. Indeed, temperature
controls the kinetics of many metabolic reactions (e.g. speed of
enzymatic reaction, increase in metabolism; Arrhenius [22]) and
influences species reproduction, locomotion, feeding rates and
interaction between species [23–25]. Salinity may induce potential
osmotic stress, increasing the risk of species mortality [26].
Considering these two parameters, we evaluated the importance
of climate change in the colonization of the Gironde estuary by the
copepod Acartia tonsa. We applied a double modeling approach,
based on both realized and fundamental niches, to provide
evidence that the successful establishment of Acartia tonsa was the
result of changes in both temperature and salinity.
Materials and Methods
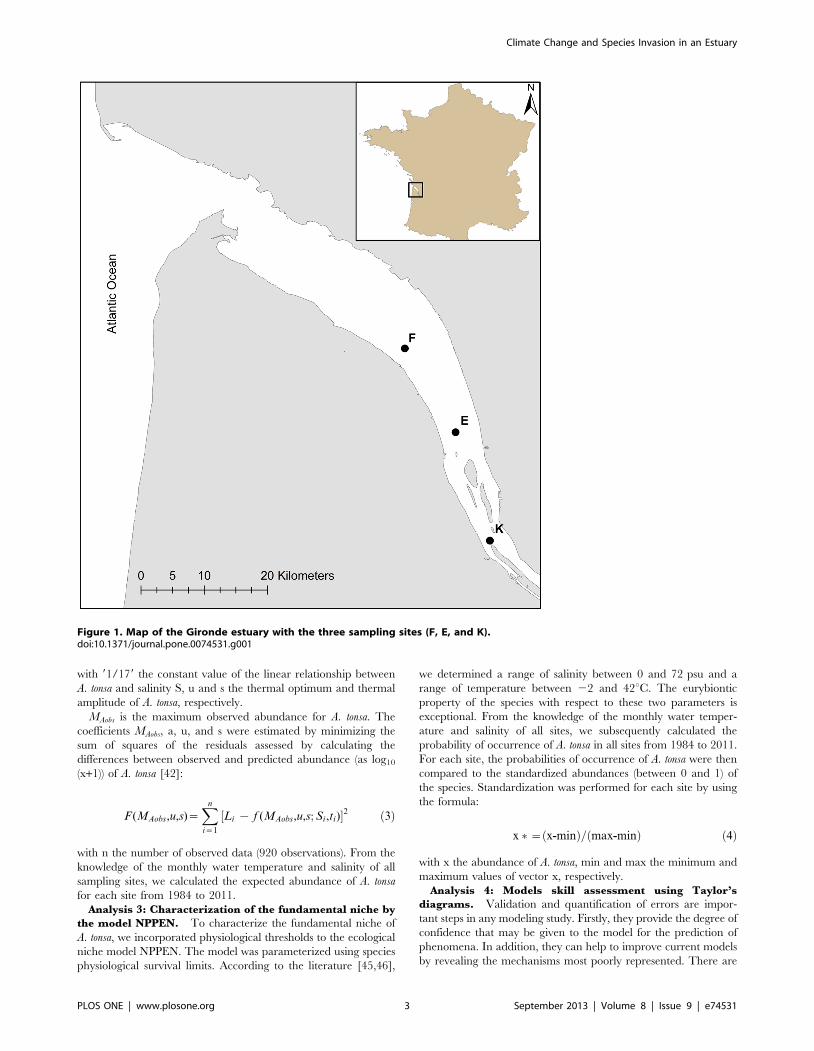
Study areaThe Gironde estuary (latitude 45u20’N, longitude 0u459W), a
70-km long estuary formed by the junction of the Dordogne and
Garonne rivers [27], is the largest south-western European
estuary. With a mean suspended mater concentration higher than
500 mg.L21 [28,29], it is one of the most turbid European
estuaries. The Gironde is characterized by a strong spatial and
temporal variability in both physical and chemical properties [30].
In addition to the natural variability, this ecosystem is also
subjected to anthropogenic pressures including climate changes
[17,30–33]. Among the other anthropogenic pressures, the
maritime traffic (Bordeaux harbor; hull fouling, semi-dry ballast,
and ballast water) represents an important cause of species
introduction [17,18]. Therefore, the Gironde estuary can be
considered as a hotspot for species introduction. The calanoid
copepod species Acartia tonsa, first introduced in 1983 by ballast
waters, is an example of species that found suitable conditions to
establish in the Gironde estuary.
Environmental and zooplankton dataEnvironmental data were provided by both the ‘‘Blayais’’
nuclear power plant and the SOMLIT (Service d’Observation en
Milieu LITtoral, a French coastal monitoring network: http://
somlit.epoc.u-bordeaux1.fr; see [33] or [34]) joint monitoring.
Twelve environmental parameters and the five zooplankton
species abundances (including 3 copepods and 2 mysids) were
monitored at monthly intervals from March 1978 to November
2009. Here, we only focused on water temperature, salinity and
abundance of Acartia tonsa per m3. Samples were collected nine
times a year (except for site F monitored eight times a year) at
three given sites (Figure 1): (1) site E, located at 52 km from
Bordeaux city, since 1978; (2) site K, located at 30 km from
Bordeaux city, since 1984; (3) site F, located at 67 km from
Bordeaux city, since 1992 [30]. Sampling was carried out at 1 m
below the surface and 1 m above the bottom at 3 h intervals
during a tidal cycle (high and low tide, flood and ebb tide).
We combined all triplets of temperature/salinity/Acartia tonsa
abundance available in all sampling sites and obtained the data
matrix: 5178 observations 63 variables (Matrix 1). To only
consider the period since species establishment, from 1999 to
2010, (the year 2011 being incomplete), we extracted data from
Matrix 1. Only considering data from site E, we obtained a second
matrix: 920 observations 63 variables (Matrix 2).
Data analysesBased on these two matrices, we determined the ecological
niche of Acartia tonsa as a function of both monthly water
temperature and salinity. Analysis 1 determined the realized
niche, i.e. the niche including the effect of species interaction and
dispersal [35,36] by using categories of temperature and salinity in
a discrete model. Analysis 2, applying a mixed Gaussian-linear
model, also estimated species realized niche. Analysis 3determined the fundamental niche, i.e. the niche without the
effect of dispersal or species interaction [35]. Physiological
thresholds obtained from literature were subsequently implement-
ed in the new ecological niche model NPPEN (Non-Parametric
Probabilistic Ecological Niche model; [37]). This model presents
several advantages: it requires presence-only data and is based on
a non-parametric procedure using a simplification of the Multiple
Response Permutation Procedure (MRPP) based on the Gener-
alized Mahalanobis distance [37]. NPPEN was already applied to
many marine organisms, for instance as fishes [37,38] or benthic
macrofauna [39].
The three models (discrete, Gaussian-linear and NPPEN) were
then compared using Taylor diagrams (Analysis 4; [40]).
Analysis 1: Characterization of the realized niche by
discrete model (DM). Using an approach similar to Beau-
grand et al. [41], we used Matrix 2 (1999–2010 for site E) to
compute the realized niche of A. tonsa (abundances transformed in
log10(x+1)) as a function of monthly water temperature (from 0 to
35uC every 1uC) and salinity (from 0 to 35 psu every 1 psu). This
estimation of A. tonsa realized niche for the period 1999–2010 was
compared to the realized niche computed from all available data
(for all sampling sites, i.e. Matrix 1). Using only data from site E
(the longest time series) and the reference period 1999–2010, we
removed any problem of circularity as the test of the model
(Analysis 4) was performed on data from site E and other sites (F
and K) for the period 1984–1998. From the knowledge of monthly
water temperature and salinity of all sites, we retrieved the
expected abundance of A. tonsa in all sites from 1984 to 2011 (see
Figure 2B).
Analysis 2: Characterization of the realized niche by a
Mixed Gaussian-linear (MGL) model. For this second
analysis, we used monthly water temperature and salinity data of
sampling site E for the period 1999–2010 (Matrix 2) to estimate
the realized niche of A. tonsa. We graphically examined the
relationships between the abundance of A. tonsa and the two
environmental variables (not shown). The model was Gaussian for
temperature because the examination of the data showed a
maximum of abundance (as log10 (x+1)) flanked by two decreasing
slopes. Such a function is often used to model the ecological niche
[42–44]. As the relationship between salinity and abundance (as
log10 (x+1)) was linear between 0 and 17 psu and leveled off after,
we used a linear function between 0 and 17 psu. For salinities
under 17 psu, the resulting model was the product of a linear
relationship for salinity ‘S’ and a Gaussian relationship for water
temperature ‘t’ (Eq. 1). For salinities over 17 psu, the model only
considered the effect of temperature (Eq. 2):
For S,17 psu:
A~S
17MAobse
{t{uð Þ22s2
� �ð1Þ
For S$17 psu:
A~MAobse{
t{uð Þ22s2
� �ð2Þ
Climate Change and Species Invasion in an Estuary
PLOS ONE | www.plosone.org 2 September 2013 | Volume 8 | Issue 9 | e74531
with 91/179 the constant value of the linear relationship between
A. tonsa and salinity S, u and s the thermal optimum and thermal
amplitude of A. tonsa, respectively.
MAobs is the maximum observed abundance for A. tonsa. The
coefficients MAobs, a, u, and s were estimated by minimizing the
sum of squares of the residuals assessed by calculating the
differences between observed and predicted abundance (as log10
(x+1)) of A. tonsa [42]:
F (MAobs,u,s)~Xn
i~1
½Li { f (MAobs,u,s; Si,ti)�2 ð3Þ
with n the number of observed data (920 observations). From the
knowledge of the monthly water temperature and salinity of all
sampling sites, we calculated the expected abundance of A. tonsa
for each site from 1984 to 2011.
Analysis 3: Characterization of the fundamental niche by
the model NPPEN. To characterize the fundamental niche of
A. tonsa, we incorporated physiological thresholds to the ecological
niche model NPPEN. The model was parameterized using species
physiological survival limits. According to the literature [45,46],
we determined a range of salinity between 0 and 72 psu and a
range of temperature between 22 and 42uC. The eurybiontic
property of the species with respect to these two parameters is
exceptional. From the knowledge of the monthly water temper-
ature and salinity of all sites, we subsequently calculated the
probability of occurrence of A. tonsa in all sites from 1984 to 2011.
For each site, the probabilities of occurrence of A. tonsa were then
compared to the standardized abundances (between 0 and 1) of
the species. Standardization was performed for each site by using
the formula:
x �~ x-minð Þ= max-minð Þ ð4Þ
with x the abundance of A. tonsa, min and max the minimum and
maximum values of vector x, respectively.
Analysis 4: Models skill assessment using Taylor’s
diagrams. Validation and quantification of errors are impor-
tant steps in any modeling study. Firstly, they provide the degree of
confidence that may be given to the model for the prediction of
phenomena. In addition, they can help to improve current models
by revealing the mechanisms most poorly represented. There are
Figure 1. Map of the Gironde estuary with the three sampling sites (F, E, and K).doi:10.1371/journal.pone.0074531.g001
Climate Change and Species Invasion in an Estuary
PLOS ONE | www.plosone.org 3 September 2013 | Volume 8 | Issue 9 | e74531

many statistical methods to compare models and measurements
and to define the level of performance of a model [47]. Each of
them gives different but complementary information. Each can be
used separately to test one aspect of the model, but the
simultaneous use of several methods can be performed to get an
overall assessment of the adjustment given by the simulation to the
observed variations. This is the solution chosen by Taylor [40],
which proposed to assess the performance of models by
representing on a single diagram the standard deviation of the
data and those of the model, the Root Mean Square Deviation
(RMSD) and the correlation coefficient r between the model and
the data. A detailed description of the Taylor diagram and
formulas involved are given in ref 40 [40]. This useful tool have
first been developed for atmospheric general circulation models
[40] but has also been applied to physical-biogeochemical coupled
models [48,49] and generalized additive models [50]. In our case,
we used Taylor’s diagrams to compare the results of our three
models, in each sampling site: DM’ for the Discrete Model, ‘MGL’
for the Mixed Gaussian-Linear model and ‘NPPEN’ for the
ecological niche model. For the comparison, all data having been
previously normalized between 0 and 1 using Eq. 4.
All methods were computed using the MATLAB language.
Results
Estimation of both realized and fundamental niches of A.tonsa
The discrete and mixed Gaussian-linear models, estimating the
realized niche of A. tonsa (Figures 2B and 2C), revealed patterns
similar to the observed one (Figure 2A) despite the fact that we
considered less data on Figure 2B (only data from period 1999–
2010). Regarding species maximal abundances, the mixed
Gaussian-linear model suggested a thermal optimum around
21.5uC (64.5uC according to the function minimizing the sum of
squares of the residuals) and salinity suitable conditions over
,15 psu. Low species abundances were estimated for tempera-
tures below 10uC and salinities below 3–5 psu (Figures 2A–C).
The fundamental niche of A. tonsa estimated by the NPPEN
model was more extended than its realized niche (Figure 2D).
Species environmental optima (i.e. probabilities .0.8) were
obtained for a temperature ranging from 13 to 24uC and a
salinity exceeding 15 psu.
Estimation of A. tonsa abundance and occurrenceprobabilities times series
When both observed and estimated abundances of A. tonsa were
compared for each sampling site, we found that both the discrete
and mixed Gaussian-linear models reproduced well the seasonality
of A. tonsa. However, the two models systematically underestimated
species abundances at site K where the species is less abundant
(Figures 3C and 4C). Regardless of the model used, both modeled
and observed time series suggested a spatial saline gradient with
maximal abundances observed at site F (the more downstream).
Finally, both models reproduced the long-term trends observed at
each site for the species (r varying between 0.35 and 0.81; Figure 5).
Estimates from the two models were similar as suggested by their
close positions on the Taylor diagrams (Figure 5). However, the
mixed Gaussian-linear model (MGL) was more accurate than the
two other models. Indeed, although the standard deviation of the
discrete model (DM) was close to the observations (only for
sampling site F, sDM = 0.32 and sOBS = 0.35 respectively;
Figure 5A), the Pearson correlation coefficients were systematically
higher for the mixed Gaussian-linear model than for the discrete
model while the RMSD were low.
Year-to-year changes in the probabilities of occurrence of A.
tonsa, assessed by the NPPEN model, showed a phase of increasing
probabilities from 1983 (first observation of the species) to ,1992
in both sites E and K. Although the seasonality was detected, the
pattern was less clear than the pattern retrieved from both the
Figure 2. Observed and modeled ecological niche of Acartia tonsa in the Gironde estuary. A. Observed niche of A. tonsa (log10 (x+1)) as afunction of monthly water temperature and salinity (considering all available data). B. Realized niche of A. tonsa (log10 (x+1)) as a function of monthlywater temperature and salinity. C. Realized niche of A. tonsa (log10 (x+1)) as a function of monthly water temperature and salinity modeled by amixed Gausian-linear model. D. Fundamental niche of A. tonsa (occurrence probability) modeled by the NPPEN model.doi:10.1371/journal.pone.0074531.g002
Climate Change and Species Invasion in an Estuary
PLOS ONE | www.plosone.org 4 September 2013 | Volume 8 | Issue 9 | e74531

discrete and mixed Gaussian-linear models. However the NPPEN
model estimated a spatial distribution of A. tonsa in accordance
with the salinity gradient: higher probabilities were estimated for
the site F (Figure 6A), intermediate for site E (Figure 6B) and low
probabilities for site K (Figure 6C). The RMSD and correlation
coefficients between observed (i.e. abundances having been
standardized) and estimated times series from the NPPEN model
were similar to those of the empirical models (‘DM’ and ‘MGL’;
Figure 5). Its position away from the observations on Taylor
diagrams was due to the low standard deviations (sNPPEN #0.13)
of the NPPEN model. One explanation could be that the
occurrence probability range was already between 0 and 1 before
normalization.
Relation between hydro-climatic evolution and A. tonsaabundance
The monthly temperature and salinity associated with each
sampling of A. tonsa at site E for the period 1978–1983 were
characterized by maximal values of ,26uC and , 14 psu (and
23.5uC and 13.5 psu for August; Figure 7 C). We recall here that
we only disposed of data before 1983 for sampling site E. Changes
in both salinity and temperature in the Gironde estuary (blue dots,
Figure 7) between the two periods, before (1978–1983, Figure 7A)
and after the apparition of A. tonsa (1984–2011, Figure 7B)
highlighted the influence of warming and marinisation processes;
the changes in environmental conditions being associated with
higher estimated abundance of A. tonsa (Figure 7). Comparable
results with the NPPEN model (results not shown) were observed.
Although the estimated probabilities of occurrence of A. tonsa were
low for the period 1978–1983 (between 0 and 0.4), high
probabilities (between 0.7 and 1) were observed from 1984
onwards.
Discussion
Brylinski [51] first presented a map of the spatial distribution of
the copepod A. tonsa in Europe. Originating from the North
American coast, A. tonsa could have been transported by maritime
traffic to Europe. According to David et al. [17], the copepod was
observed in the Gironde estuary for the first time in 1983. Many
studies have been conducted on the ecology of the species to assess
its physiological traits [45,52–58]. All the authors defined A. tonsa
as a euryhaline and eurytherm species with a very large range of
tolerance measured by both in situ and laboratory experiments
[45]. These two properties explain its ubiquity in many Atlantic
Ocean estuaries [45,46,51]. Gonzales [46] evaluated species
critical thermal maximum and lethal temperature. By gradually
increasing temperature until ‘‘uncoordinated’’ movements of the
species, a critical thermal maximal value around 37uC (50% of
individuals being able to tolerate a temperature of 37uC for 4 h)
was evaluated and a lethal temperature near 41–46.3uC was
assessed. The species was able to tolerate a wide range of
temperatures between 21uC and 32uC, Gonzales [46] collected
Figure 3. Comparison between observed (in red) and estimated (in blue) abundance of Acartia tonsa (log10(x+1)) at three samplingstations in the Gironde estuary. A. Station F. B. Station E. C. Station K. Estimated data originated from the realized niche assessed bydiscretization from monthly water temperature and salinity (see Fig. 2B).doi:10.1371/journal.pone.0074531.g003
Climate Change and Species Invasion in an Estuary
PLOS ONE | www.plosone.org 5 September 2013 | Volume 8 | Issue 9 | e74531

several individuals in the Narragansett Bay (Rhode Island, USA) at
temperature of about 21uC. Cervetto et al. [45] experimentally
characterized both the maximum and minimum values of salinity
in which A. tonsa could survive. They estimated an impressive
range between ,1 and 72 psu with an optimal adaptation of the
species between 15 and 22 psu for copepodites. These results were
in accordance with previous observations [59], which found a
maximal salinity threshold of 25 psu for nauplii stages. This upper
value would limit the colonization of marine waters by the early
stages of development of A. tonsa, these stages being more sensitive
than the adults to changes in salinity [59].
Our estimations of both fundamental and realized niches are
therefore in accordance with these experimental measurements.
Estimated optimal salinity conditions were observed for values
over 15–17 psu and a maximal value of 34 psu was observed in
the estuary for the period 1999–2011. Moreover, our results
estimated low abundances of A. tonsa for a salinity value under 3–
5 psu. These results are supported by previous studies on species
eggs quiescence and hatching success. Hojgaard et al. [53] showed
that a strong quiescence process was induced at 0 salinity (and at
both 17 and 25uC) and Holste and Peck ([54]; see also Peck and
Holste [56]) observed an asymptotical increase in eggs hatching
success for salinity between 0 and 17 psu, a maximum being
observed between 17 and 25 psu.
Regarding temperature, we estimated an optimal value around
17–25uC with all modeling approaches and an abundance
reduction being estimated under a temperature value of 10uC
for empirical models and 13uC for the NPPEN model. However
this species is also known to potentially produce diapause eggs (or
low quality eggs; Zillioux and Gonzalez [60]), at a thermal
threshold experimentally estimated at about 10–13uC. Under this
minimal temperature value, species may produce diapause eggs
and no hatching was observed for eggs incubated at low
temperatures (,12uC) by Holste and Peck [54] and interestingly
a maximum was observed between 22–23uC.
When the realized niche of A. tonsa was compared to its
fundamental niche (Figures 2A, B, C versus 2D), we noticed some
differences, especially for species occurrence at low temperatures
(,13uC). These temperature values, mainly corresponding to
winter conditions, are associated to species absence from
samplings (see [30,61]) even if the NPPEN model did not estimate
null probabilities of species occurrence (with all salinity values
associated; from 0 to ,30 psu). However, the success of an
invader population over time can not only be linked to abiotic
parameters such as temperature or salinity. Biotic resistance
exerted by native species can also possibly play a role and induce
some differences between invader’s realized and fundamental
niches [62–64]. Indeed, the native copepod species Eurytemora
affinis has a production period centered around March [30]. E.
affinis would be favored at this period when the Maximum
Turbidity Zone (‘MTZ’, located upstream during summer and
more downstream during both autumn and winter; Sottolichio &
Castaing [65]) is particularly important because this species is
known (i) to be able to feed on detritus and detrital vegetal matter
Figure 4. Comparison between observed (in red) and modeled (in blue) abundance of Acartia tonsa (log10(x+1)) at three samplingstations in the Gironde estuary. A. Station F. B. Station E. C. Station K. Modeled data originated from the realized niche assessed from monthlywater temperature and salinity and using a mixed Gausian-linear model (see Fig. 2C).doi:10.1371/journal.pone.0074531.g004
Climate Change and Species Invasion in an Estuary
PLOS ONE | www.plosone.org 6 September 2013 | Volume 8 | Issue 9 | e74531

Figure 5. Comparison for the period 1984–1998 of the three models performances using Taylor diagrams (Taylor 2001) (‘DM’ fordiscrete model, ‘MGL’ for the mixed Gaussian-linear model, and ‘NPPEN’ for the ecological niche NPPEN model). A. Station F. B. Station E. C. Station K.doi:10.1371/journal.pone.0074531.g005
Climate Change and Species Invasion in an Estuary
PLOS ONE | www.plosone.org 7 September 2013 | Volume 8 | Issue 9 | e74531

Figure 6. Comparison between observed (in red) and modelled (in blue) abundance of Acartia tonsa (log10(x+1)) at three samplingstations in the Gironde estuary. A. Station F. B. Station E. C. Station K. Modeled data originated from the NPPEN model (see Fig. 2D).doi:10.1371/journal.pone.0074531.g006
Figure 7. Monthly water temperature and salinity of each record of Acartia tonsa at Station E. A. Occurrences of Acartia tonsa (blue dots)for period 1978–1983 (all months). B. Occurrences of Acartia tonsa (blue dots) for period 1978–1983 (August). C. Occurrences of Acartia tonsa (bluedots) for period 1984–2011 (all months). D. Occurrences of Acartia tonsa (blue dots) for period 1984–2011 (August). The estimated realized niche wassuperimposed (see Fig. 2A). Both temperature and salinity maxima from period 1978–1983 were also superimposed as black dotted lines.doi:10.1371/journal.pone.0074531.g007
Climate Change and Species Invasion in an Estuary
PLOS ONE | www.plosone.org 8 September 2013 | Volume 8 | Issue 9 | e74531

in contrast with A. tonsa [17], and (ii) to have a higher ability to
select its prey among inorganic matter compared to Acartia spp.
[66]. Thus, the NPPEN model would have not taken into account
the presence of E. affinis. This hypothesis may be especially true for
salinities between 0 and 18 psu (conditions encountered in the
oligo-mesohaline estuarine regions). Regarding higher salinities,
other species are present – some neritic copepod species -, that also
have not been considered in the NPPEN model. Moreover, some
of these species have recently been proved to significantly progress
in the estuary in response to the estuary marinisation [67]. In
conclusion, the physiological niche of Acartia tonsa estimated by the
NPPEN model only reflected what would be the fundamental
niche if no other parameter was acting, for example, with no
predation, resource or space competition. This may also explain
the difference observed between species realized and fundamental
niches.
Considering species temporal variability with only 2 climate-
driven parameters, we estimated values of A. tonsa abundances at
each site. Although our models underestimated species abundance
especially at the more upstream site, the seasonality of A. tonsa was
well reproduced with a production peak around August. This
result was in accordance with species seasonal pattern character-
ized by an autumnal peak of abundance regardless the time series
period or site (see [17]) and with other studies in many North
European estuaries (the Scheldt, [68]; the Ems, [69]). Although a
temporal lag is sometimes noticed between times series of
modeled and observed data, no lag was detected in the present
study. That explains why some models include a temporal lag to
account for a development (generation time) of a species. Our
model also estimated a spatial distribution responding to the
estuary haline gradient with maximal abundances estimated at
the more downstream site. This result was not surprising as A.
tonsa was observed in the polyhaline area of the Gironde estuary a
long time before it was first recorded in the oligo-mesohaline area
in 1983 [17]. This result could be more investigated by a study on
the distribution of A. tonsa as a longitudinal shift in the
distribution of its congeneric species, A. bifilosa, was already
noticed by Chaalali et al. [67] during the same period (from 1975
to 2003).
Since the first record of A. tonsa in the Gironde estuary in 1983,
species abundance substantially increased [17]. After 1999, this
copepod became more abundant than its autochthonous conge-
neric species, A. bifilosa and even reached abundances comparable
with the dominant native species E. affinis [17,30]. The coloniza-
tion process of the species took place in different phases: from 1978
to 1982, A. tonsa was absent; from 1983 to 1987, species was
sporadically observed; from 1988 to 1992, the calanoid was
present in low abundance; from 1993 to 1998, the species
exponentially increased; and since 1999 high abundances of A.
tonsa are regularly observed [17]. Regarding the NPPEN
estimations, similar long-term trends were noticeable as we
observed an increasing trend in estimated probabilities of
occurrence; higher probabilities being estimated toward the end
of the time series, reflecting the establishment of the species.
However, the NPPEN model did not reproduce/estimate the
seasonality of A. tonsa as well as the two empirical models. We
suspect that one of the possible explanations could be linked/due
to the parameterization of species physiological niche. The limit
ranges of temperatures and salinities reported in the literature for
species survival were different from the environmental conditions
experienced by A. tonsa in the estuary. Indeed, the upper and lower
limit values of temperature and salinity measured in the estuary
during the study period ranged from 4 to 28uC for temperature
(vs. 22 and 42uC reported in the literature as thermal limits; [46])
and from 0 to 33 psu for salinity (vs. 0 and 72 psu [45]).
Finally our results suggest that both warming and marinisation
of the Gironde estuary between the beginning (1978–1983) and
the end (1984–2011) of the studied period, facilitated the
establishment of an invasive species, in accordance with Raitsos
et al. [20] observations. Changes at a seasonal scale provided
similar results (results not shown), comforting previous studies
already pointing out strong links between temperature or salinity
and A. tonsa abundances [17,21]. Our study also highlights it is
important to consider coupled/mixed approaches to deal with
both species fundamental (i.e. physiological) and realized niches.
Nevertheless previous studies (dealing with ecological niches
modeling) only focused on realized niches of species (see Hirzel
et al. [70] or Helaouet & Beaugrand [71]), regardeless their
fundamental niches. Recent works also pointed out the importance
of considering both niches [43]. As an example, Helaouet &
Beaugrand [43] showed a close relationship between Calanus
finmarchicus fundamental and realized niches that remained
constant at both biogeographical and decadal scales. They
observed that changes in environmental forcing propagated from
the physiological to the macroecological level and, projected a
potential poleward shift in species spatial distribution in the North
Atlantic over the 21st century. Such approaches are relevant to
examine the habitat suitability of species (Diekmann et al. [72])
and to improve our knowledge about the ecology of species [43].
In the pursue of our study on a species providing a new food
resource for fish and shrimps juveniles [73], there is a necessity of
further investigations on species future evolution in the Gironde
system in response to different climate scenarios [37]. Regarding
the use of the NPPEN model for invasive species, such studies
would need to integrate co-occurring species as invasions could
dramatically affect other species [74] and some possible
consequences were already observed [17,67]. Such predictions
have indeed to be carefully considered as non-linear evolutions
may occur as some abrupt shifts were previously documented
(concerning other species) and make predictions difficult [31,67].
Moreover, while species distribution models assume equilibrium -
or at least pseudo-equilibrium – between the environment and
observed occurrence, a non-equilibrium phenomenon is more
realistic in ecology. However, such a drawback is compensated
here by both our knowledge of the physiology of the species and
a large-scale approach [75] which allows us to cautiously
extrapolate beyond baseline conditions to project future species’
range.
Another key issue would be to study the consequences of species
colonization on the structure and the function of the trophic food
web, a progression of marine fish species such as the sprat (Sprattus
sprattus) or the European anchovy (Engraulis encrasicolus) being
already documented [76]. Indeed, previous studies revealed an
increase in the abundance of small pelagics in relation to global
climate change (marinisation and water warming; [76]). These
species are known to predate on copepods and in particular on
Acartidae [77–79]. For example, the abundance of the European
anchovy in the Gironde showed a confounding trend close from
the exponential trend noticed on A. tonsa (Delpech personal
communication). While our study focused on the importance of
climatic facilitation, investigations on the biotic factors that
influence both the spatial and temporal colonization of A. tonsa
would also be required.
Acknowledgments
We express our thanks to staff of the National Institute for the Sciences of
the Universe (OASU), the Irstea Bordeaux, and the entire SOMLIT team
Climate Change and Species Invasion in an Estuary
PLOS ONE | www.plosone.org 9 September 2013 | Volume 8 | Issue 9 | e74531

– technicians, researchers, captains and crews – who have contributed to
the collection of samples since 1978. Data since 1997 are available at:
http://somlit.epoc.u-bordeaux1.fr/fr. We also thank Drs. Berenike Tietjen
and Myron Peck for their help and comments that improved the
manuscript.
Author Contributions
Conceived and designed the experiments: BS. Performed the experiments:
BS VD AC. Analyzed the data: AC GB VR. Contributed reagents/
materials/analysis tools: BS. Wrote the paper: AC GB VR EG VD PB BS.
References
1. Jennings S, Kaiser MJ (1998) The effects of fishing on marine ecosystems.Advances In Marine Biology, Vol 34. London: Academic Press Ltd-Elsevier
Science Ltd. pp. 201–352.
2. Omori M, Vanderspoel S, Norman CP (1994) Impact Of Human Activities OnPelagic Biogeography. Progress In Oceanography 34: 211–219.
3. Norse EA (1993) Global marine biological diversity. A strategy for building
conservation into decision making; conservation WCfm, editor. 383 p.
4. Carlton JT, Geller JB (1993) Ecological Roulette – The Global Transport Of
Nonindigenous Marine Organisms. Science 261: 78–82.
5. Edwards M, John AWG, Johns DG, Reid PC (2001) Case history andpersistence of the non-indigenous diatom Coscinodiscus wailesii in the north-east
Atlantic. Journal Of The Marine Biological Association Of The UnitedKingdom 81: 207–211.
6. Staneck RS (1998) Human influences on coastal ecosystems: does overfishing
create trophic cascades? Trends In Ecology & Evolution 13: 429–430.
7. Omori M, Norman CP (1998) Anthropogenic short-term effects on distributionpatterns and food webs of pelagic organisms. Workshop Report. 279–284.
8. MacDonald IAW (1994) Global change and alien invasions: implications for
biodiversity and protected area management. In: Solbrig OT, van Emden HM,
van Oordt PGWJ editors. Biodiversity and global change. Wallingford, Oxon,UK: CAB International. pp. 199–209.
9. Vitousek PM, Mooney HA, Lubchenco J, Melillo JM (1997) Human domination
of Earth’s ecosystems. Science 277: 494–499.
10. Jousson O, Pawlowski J, Zaninetti L, Zechman FW, Dini F, et al. (2000) Invasivealga reaches California – The alga has been identified that threatens to smother
Californian coastal ecosystems. Nature 408: 157–158.
11. Ricciardi A, MacIsaac HJ (2000) Recent mass invasion of the North American
Great Lakes by Ponto-Caspian species. Trends In Ecology & Evolution 15: 62–65.
12. Beck MW, Heck KL, Able KW, Childers DL, Eggleston DB, et al. (2001) The
identification, conservation, and management of estuarine and marine nurseriesfor fish and invertebrates. Bioscience 51: 633–641.
13. Blaber SJM, Blaber TG (1980) Factors Affecting The Distribution Of Juvenile
Estuarine And Inshore Fish. Journal Of Fish Biology 17: 143–162.
14. Haedrich RL (1983) Estuarine fishes. In: Ketchum BH, editor. Estuaries and
Enclosed Seas Ecosystems of the World. Amsterdam: Elsevier. pp. 183–207.
15. Beaugrand G, Kirby RR (2009) Spatial changes in the sensitivity of Atlantic codto climate-driven effects in the plankton. Climate Research 41: 15–19.
16. Pauly D (2003) Ecosystem impacts of the world’s marine fisheries. Global
Change Newsletter 55: 21–23.
17. David V, Sautour B, Chardy P (2007) Successful colonization of the calanoidcopepod Acartia tonsa in the oligo-mesohaline area of the Gironde estuary (SW
France) – Natural or anthropogenic forcing? Estuarine Coastal and Shelf
Science 71: 429–442.
18. Beguer M, Berge J, Martin J, Martinet J, Pauliac G, et al. (2011) Presence ofPalaemon macrodactylus in a European estuary: evidence for a successful invasion of
the Gironde (SW France). Aquatic Invasions 6: 301–318.
19. Gucu AC (2002) Can overfishing be responsible for the successful establishmentof Mnemiopsis leidyi in the Black Sea? Estuarine Coastal And Shelf Science 54:
439–451.
20. Raitsos DE, Beaugrand G, Georgopoulos D, Zenetos A, Pancucci-Papadopou-
lou AM, et al. (2010) Global climate change amplifies the entry of tropicalspecies into the Eastern Mediterranean Sea. Limnology and Oceanography 55:
1478–1484.
21. Aravena G, Villate F, Uriarte I, Iriarte A, Ibanez B (2009) Response of Acartia
populations to environmental variability and effects of invasive congenerics in
the estuary of Bilbao, Bay of Biscay. Estuarine Coastal And Shelf Science 83:621–628.
22. Arrhenius S (1889) On the reaction velocity of the inversion of cane sugar byacids. Zeitschrift fur Physikalische Chemie 4: 226–248.
23. Beaugrand G, Reid PC (2003) Long-term changes in phytoplankton,
zooplankton and salmon related to climate. Global Change Biology 9: 801–817.
24. Magnuson JJ, Crowder LB, Medvick PA (1979) Temperature as an ecologicalresource. American Zoologist 19: 331–343.
25. Mauchline J (1998) The Biology of Calanoid Copepods. San DiegoUSA:
Academic Press. 710 p.
26. Vilas C, Drake P, Pascual E (2009) Inter- and intra-specific differences ineuryhalinity determine the spatial distribution of mysids in a temperate
European estuary. Journal of Experimental Marine Biology and Ecology 369:
165–176.
27. Allen GP, Castaing P, Klingebi A (1972) Study on circulation of water masses atmouth of Gironde. Comptes rendus hebdomadaires des seances de l’academie
des sciences Serie D 275: 181-.
28. Abril G, Etcheber H, Le Hir P, Bassoullet P, Boutier B, et al. (1999) Oxic/anoxicoscillations and organic carbon mineralization in an estuarine maximum
turbidity zone (The Gironde, France). Limnology and Oceanography 44: 1304–
1315.
29. Sautour B, Castel J (1995) Comparative spring distribution of zooplankton in 3
macrotidal European estuaries. Hydrobiologia 311: 139–151.
30. David V, Sautour B, Chardy P, Leconte M (2005) Long-term changes of the
zooplankton variability in a turbid environment: The Gironde estuary (France).Estuarine Coastal and Shelf Science 64: 171–184.
31. Chaalali A, Beaugrand G, Boet P, Sautour B Climate-caused abrupt shifts in aEuropean macrotidal estuary. Estuaries & Coasts. In press.
32. Coupry B, Neau M, Leurent T (2008) Evaluation des impacts du changementclimatique sur l’estuaire de la Gironde et prospective a moyen terme. EAUCEA.
120 p.
33. Goberville E, Beaugrand G, Sautour B, Treguer P (2010) Climate-driven
changes in coastal marine systems of western Europe. Marine Ecology ProgressSeries 408: 129–148.
34. Savoye N, David V, Morisseau F, Etcheber H, Abril G, et al. (2012) Origin andcomposition of particulate organic matter in a macrotidal turbid estuary: The
Gironde Estuary, France. Estuarine Coastal And Shelf Science 108: 16–28.
35. Hutchinson GE (1978) An introduction to population ecology: Yale University
Press. 256 p.
36. Pulliam HR (2000) On the relationship between niche and distribution. Ecology
Letters 3: 349–361.
37. Beaugrand G, Lenoir S, Ibanez F, Mante C (2011) A new model to assess the
probability of occurrence of a species, based on presence-only data. MarineEcology Progress Series 424: 175–190.
38. Lenoir S, Beaugrand G, Lecuyer E (2011) Modelled spatial distribution ofmarine fish and projected modifications in the North Atlantic Ocean. Global
Change Biology 17: 115–129.
39. Rombouts I, Beaugrand G, Dauvin JC (2012) Potential changes in benthic
macrofaunal distributions from the English Channel simulated under climatechange scenarios. Estuarine Coastal And Shelf Science 99: 153–161.
40. Taylor KE (2001) Summarizing multiple aspects of model performance in asingle diagram. Journal Of Geophysical Research-Atmospheres 106: 7183–7192.
41. Beaugrand G, Lindley JA, Helaouet P, Bonnet D (2007) Macroecological studyof Centropages typicus in the North Atlantic Ocean. Progress In Oceanography 72:
259–273.
42. Fort J, Beaugrand G, Gremillet D, Phillips RA (2012) Biologging, Remotely-
Sensed Oceanography and the Continuous Plankton Recorder Reveal the
Environmental Determinants of a Seabird Wintering Hotspot. Plos One 7.
43. Helaouet P, Beaugrand G (2009) Physiology, ecological niches and speciesdistribution. Ecosystems 12: 1235–1245.
44. Nicolas D, Chaalali A, Drouineau H, Lobry J, Uriarte A, et al. (2011) Impact ofglobal warming on European tidal estuaries: some evidence of northward
migration of estuarine fish species. Regional Environmental Change 11: 639–
649.
45. Cervetto G, Gaudy R, Pagano M (1999) Influence of salinity on the distribution
of Acartia tonsa (Copepoda, Calanoida). Journal Of Experimental Marine BiologyAnd Ecology 239: 33–45.
46. Gonzales JG (1974) Critical thermal maxima and upper temperature for thecalanoid copepods Acartia tonsa and A. clausi. Marine Biology 27: 219–223.
47. Allen JI, Somerfield PJ, Gilbert FJ (2007) Quantifying uncertainty in high-
resolution coupled hydrodynamic-ecosystem models. Journal Of Marine Systems
64: 3–14.
48. Raick C, Soetaert K, Gregoire M (2006) Model complexity and performance:
How far can we simplify? Progress In Oceanography 70: 27–57.
49. Raybaud V, Nival P, Prieur L (2011) Short time-scale analysis of the NW
Mediterranean ecosystem during summer-autumn transition: A 1D modellingapproach. Journal Of Marine Systems 84: 1–17.
50. Loots C, Vaz S, Planque B, Koubbi P (2010) What controls the spatialdistribution of the North Sea plaice spawning population? Confronting
ecological hypotheses through a model selection framework. ICES Journal OfMarine Science 67: 244–257.
51. Brylinski JM (1981) Report on the presence of Acartia tonsa Dana (Copepoda) inthe harbour of Dunkirk (France) and its geographical distribution in Europe.
Journal of Plankton Research 3: 255–260.
52. Gaudy R, Cervetto G, Pagano M (2000) Comparison of the metabolism of
Acartia clausi and A. tonsa: influence of temperature and salinity. Journal OfExperimental Marine Biology And Ecology 247: 51–65.
53. Hojgaard JK, Jepsen PM, Hansen BW (2008) Salinity-induced quiescence ineggs of the calanoid copepod Acartia tonsa (Dana): a simple method for egg
storage. Aquaculture Research 39: 828–836.
54. Holste L, Peck MA (2006) The effects of temperature and salinity on egg
production and hatching success of Baltic Acartia tonsa (Copepoda: Calanoida): alaboratory investigation. Marine Biology 148: 1061–1070.
Climate Change and Species Invasion in an Estuary
PLOS ONE | www.plosone.org 10 September 2013 | Volume 8 | Issue 9 | e74531

55. Pastorinho R, Vieira L, Re P, Pereira M, Bacelar-Nicolau P, et al. (2003)
Distribution, production, histology and histochemistry in Acartia tonsa (Copepoda:Calanoida) as means for life history determination in a temperate estuary
(Mondego estuary, Portugal). Acta Oecologica-International Journal Of Ecology
24: S259–S273.56. Peck MA, Holste L (2006) Effects of salinity, photoperiod and adult stocking
density on egg production and egg hatching success in Acartia tonsa (Calanoida:Copepoda): Optimizing intensive. Aquaculture 255: 341–350.
57. Svetlichny L, Hubareva E, Belmonte G, Isinibilir M, Ustun F, et al. (2010)
Vulnerability of copepod eggs in salinity and temperature gradients of theMarmara and Black Seas. Marine Ecology Progress Series 419: 109–120.
58. White JR, Roman MR (1992) Egg-Production By The Calanoid CopepodAcartia tonsa In The Mesohaline Chesapeake Bay – The Importance Of Food
Resources And Temperature. Marine Ecology Progress Series 86: 239–249.59. Tester T, Turner JT (1991) Why is Acartia tonsa restricted to estuarine habitats?
Bulletin of the Plankton Society of Japan: 603–611.
60. Zillioux EJ, Gonzales JG (1972) Egg dormancy in a neritic calanoid copepod andits implications to overwintering in boreal waters. pp. 217–230.
61. Selleslagh J, Lobry J, N’Zigou AR, Bachelet G, Blanchet H, et al. (2012)Seasonal succession of estuarine fish, shrimps, macrozoobenthos and plankton:
Physico-chemical and trophic influence. The Gironde estuary as a case study.
Estuarine Coastal And Shelf Science 112: 243–254.62. Dzialowski AR (2010) Experimental effect of consumer identity on the invasion
success of a non-native cladoceran. Hydrobiologia 652: 139–148.63. Parkes SM, Duggan IC (2012) Are zooplankton invasions in constructed waters
facilitated by simple communities? Diversity And Distributions 18: 1199–1210.64. Taylor CM, Duggan IC (2012) Can biotic resistance be utilized to reduce
establishment rates of non-indigenous species in constructed waters? Biological
Invasions 14: 307–322.65. Sottolichio A, Castaing P (1999) A synthesis on seasonal dynamics of highly-
concentrated structures in the Gironde estuary. Comptes Rendus de l’Academiedes Sciences de Paris, IIa 329: 895–900.
66. Gasparini S, Castel J (1997) Autotrophic and heterotrophic nanoplankton in the
diet of the estuarine copepods Eurytemora affinis and Acartia bifilosa. Journal OfPlankton Research 19: 877–890.
67. Chaalali A, Chevillot X, Beaugrand G, David V, Luczak C, et al. Changes in thedistribution of copepods in the Gironde estuary: A warming and marinisation
consequence? Estuarine Coastal And Shelf Science. In press.
68. Bakker C, de Pauw N (1975) Comparison of plankton assemblages of identical
salinity ranges in estuarine tidal, and stagnant environments. II. Zooplankton.
Netherlands Journal of Sea Research 9: 145–165.
69. Baretta JW, Malschaert JFP (1988) Distribution and abundance of the
zooplankton of the Ems estuary (North Sea). Netherlands Journal of Sea
Research 22: 69–81.
70. Hirzel AH, Hausser J, Chessel D, Perrin N (2002) Ecological-niche factor
analysis: How to compute habitat-suitability maps without absence data?
Ecology 83: 2027–2036.
71. Helaouet P, Beaugrand G (2007) Macroecology of Calanus finmarchicus and C.
helgolandicus in the North Atlantic Ocean and adjacent seas. Marine Ecology
Progress Series 345: 147–165.
72. Diekmann ABS, Clemmesen C, St John M, Paulsen M, Peck MA (2012)
Environmental cues and constraints affecting the seasonality of dominant
calanoid copepods in brackish, coastal waters: a case study of Acartia, Temora and
Eurytemora species in the south-west Baltic. Marine Biology 159: 2399–2414.
73. Sorbe JC (1981) La macrofaune vagile de l’estuaire de la Gironde – Distribution
et migration des especes: modes de reproduction, regimes alimentaires. Oceanis
6: 579–592.
74. Williams RJ, Berlow EL, Dunne JA, Barabasi AL, Martinez ND (2002) Two
degrees of separation in complex food webs. Proceedings Of The National
Academy Of Sciences Of The United States Of America 99: 12913–12916.
75. Guisan A, Zimmermann NE (2000) Predictive habitat distribution models in
ecology. Ecological Modelling 135: 147–186.
76. Pasquaud S, Beguer M, Larsen MH, Chaalali A, Cabral E, et al. (2012) Increase
of marine juvenile fish abundances in the middle Gironde estuary related to
warmer and more saline waters, due to global changes. Estuarine, Coastal and
Shelf Science 104: 46–53.
77. Lobry J, David V, Pasquaud S, Lepage M, Sautour B, et al. (2008) Diversity and
stability of an estuarine trophic network. Marine Ecology Progress Series 358:
13–25.
78. Pasquaud S, Elie P, Jeantet C, Billy I, Martinez P, et al. (2008) A preliminary
investigation of the fish food web in the Gironde estuary, France, using dietary
and stable isotope analyses. Estuarine Coastal And Shelf Science 78: 267–279.
79. Pasquaud S, Pillet M, David V, Sautour B, Elie P (2008) Determination of fish
trophic levels in an estuarine system. Estuarine Coastal And Shelf Science 86:
237–246.
Climate Change and Species Invasion in an Estuary
PLOS ONE | www.plosone.org 11 September 2013 | Volume 8 | Issue 9 | e74531
Copyright © 2022 FDOKUMEN