Between Objectivity and Openness—The Mediality of Data for Journalism

International Journal of Energy Economics and Policy
Vol. 5, No. 1, 2015, pp. 121-137
ISSN: 2146-4553
www.econjournals.com
Could the Expanding Economic Growth and Trade Openness of the United
Kingdom Pose a Threat to its Existing Energy Predicaments?
Abdulkadir Abdulrashid Rafindadi
Department of Economics,
Usmanu Danfodiyo University, Sokoto, Nigeria.
Email: [email protected]
ABSTRACT: This study examined whether the expanding economic growth prospects of the UK
could pose a threat to its existing energy predicaments. To ensure this, time series data from 1970-
2013 was used while the Zivot-Andrew structural break unit root test, the Bayer-Hank
combined cointegration test, the ARDL bounds test and the VECM Granger causality test were
applied, and this was validated using the innovation accounting test. The findings of the study confirmed the existence of cointegration among the variables. Following to this development, the
study discovered that economic growth is negatively linked with energy demand in the UK, while
trade openness adds to energy consumption; in addition to that, the position of the capital-labour ratio
in UK was discovered to have a composite effect and with significant pressure on the country’s energy
consumption. To support the direction of these findings, the study discovered that while a 1% increase
in economic growth in UK declines energy consumption by 0.5422% surprisingly however, a 1%
increase in Trade openness and capital-labour ratio were found to lead to an escalation of energy
demand by 0.9817% and 3.3906% respectively. These statistics may be a threat to the UK energy
predicaments only if electricity generation should fall below the expected requirement. In view of this
development, the study proposes the need to pursue mix energy policies and strategies that will ensure
the use of advanced technology at the industrial level; an exclusive use of renewable energy at the
household level and ensure adequate investment priorities within the renewable energy sector among
others.
Keywords: Electricity demand; Economic Growth; Innovation accounting test; Zivot-Andrew test
JEL Classifications: C61; D24; Q42
1. Introduction
In 2007, a White paper was made available in the United Kingdom intended to “Meet the
Energy Challenge” for the entire of the UK. Subsequent to this development, the White Paper details
the manner in which the international and domestic energy strategy should be implemented to address
the long-term energy predicaments faced by the country, and to also offer four key policy objectives:
(1) To position the UK on a course of reducing carbon dioxide emission by 60% by the year 2050,
with actual improvement by 2020; (2) To sustain reliable reserves of energy supplies; (3) To advance
competitive markets within the UK and beyond with the hope of raising the extent of sustainable
economic growth in the UK that will as best as possible lead to the improvement of productivity; and
(4) To ascertain that every household is sufficiently and economically heated. To carry out this
strategic mission, the scope of the energy policy as contained in the white paper was detailed to
encompass the generation and distribution of electricity, transport fuel usage, and method of heating
(this refers to the efficient provision of, Natural Gas). This policy aims at making energy as the most
essential aspect of daily life and for the general success of the UK economic system. To ensure this,
the UK government observe the need for tackling two key long-term challenges and these are: (a)
controlling the challenges of carbon dioxide emission both within the UK and abroad; and (b)
Ensuring secure, clean and affordable energy taking into consideration the huge sum engulfed by fuel
importation and its fluctuating costs. Apart from these challenges the UK also estimated the need for
about 30-35GW of newly established electricity generation possibilities for the next two decades in
order to attain objective 3 and 4 that requires the UK to meet its energy challenge Notwithstanding
these laudable developmental goals, surprisingly, in June 2013, the major energy regulator in UK

International Journal of Energy Economics and Policy, Vol. 5, No. 1, 2015, pp. 121-137
warned that there could be every possibilities for electricity power production capacity to fall by 2% in
2015, thereby, increasing the risk of blackouts"(BBC, 2013).
In another development DECC (2013) established that the total electricity generated in the UK
was 364,346 GWh in 2011, 360,439 GWh in 2012 and 356,253 GWh in 2013. These figures exclude
the total existing electricity in storage. To sum up with the existing pumped electricity figures in
storage, the total electricity supplied in the UK in 2011 was put at 373,473 GWh while in 2012 it was
375,277 GWh and 373,581 GWh in 2013. Notwithstanding this laudable development, in 2013,
indigenous electricity production declined to the tune of 1.2% (DECC 2013). The DECC (2013)
statistics continued to show that importation of electricity from France and the Netherland rose
significantly from 22% in 2012, to 28% in 2013. This trend indicate that electricity generation in the
UK is declining amidst a corresponding excess in demand which is put at 0.5% in 2012, while in
2013 primary energy production also fell by 6.3% creating an excess demand to the tune of 0.7%
(DECC, 2013). In contrast to the earlier development, the renewable energy sector in the UK was
found to be doing remarkably well. In 2013 electricity generation from renewable energy rose to 30%
accounting for 14.9% of total electricity generated in the UK as against 11.3% in 2012 (DECC, 2013).
Theoretically four views were identified by scholars that established the direction leading to
the causal relationship between energy consumption and economic growth. The first being, “the
growth hypothesis” which established the existence of significant correlation between energy
consumption and economic growth irrespective of whether the country is developed or developing,
this theory further suggests that economic growth absolutely relies on energy consumption;
consequent to this, any procrastination on energy will undoubtedly lead to a commensurate reduction
on economic growth. In addition to this, the theory continued to establish that energy may have the
tendency to restrict economic growth if concrete efforts were not put to ensure its sustainability and
diversification. The second view, commonly known as “the conservative hypothesis”, asserts that there
is unidirectional causality between economic growth and energy consumption, meaning that energy
conservation policies may have minimal impact on economic growth whenever conservation policies
are applied in such a situation. The thrust of the theory continue to establish that if an increase in real
GDP leads to an increase in energy consumption then this supports the conservative hypothesis. The
third view, “neutrality hypothesis”, suggests that there is no causality between energy consumption
and economic growth. The fourth view, “feedback hypothesis”, claims that there is bi-directional
causal relationship between energy consumption and economic growth reflecting how they are
interdependent and complementary to each other (Payne 2010, and Ozturk 2010) Having regard to the foregoing, and considering the mixed result yielded by other past studies
this study aims to investigate empirically the position of the long-run and short-run relationship of
whether the expanding economic growth and Trade Openness of the United Kingdom could pose a
threat to its existing energy predicaments. This is in consideration of the rising demand for energy
amidst rising production shortfalls and other electricity generation constraints. In addition to that what
are the positions of capital-labour ratio relation and the UK’s Trade openness in energy demand? To
ensure this, the paper is organised as follows: Section 2 provides an overview of the recent empirical
literature on energy consumption, linking energy consumption to trade openness and economic
growth; Section 3 the methodology section which introduce the data, the model specification, and the
model estimation procedure; Section 4 contains the results and discussion. Finally, section 5 presents
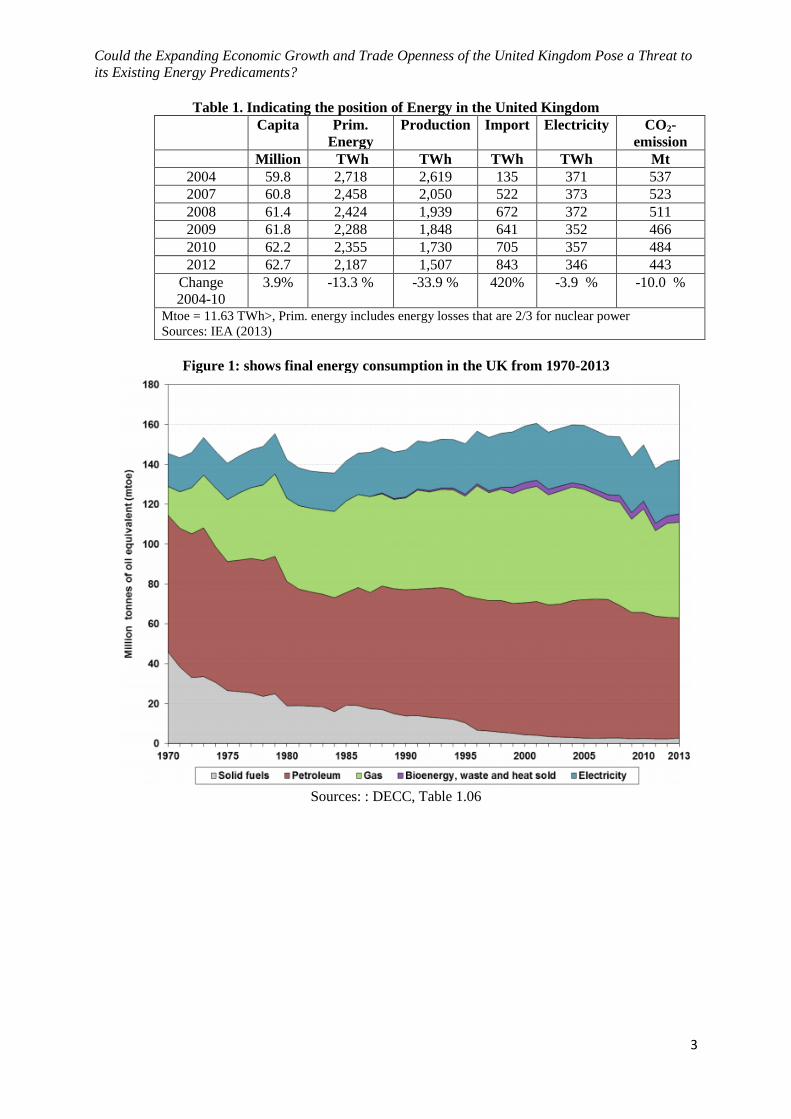
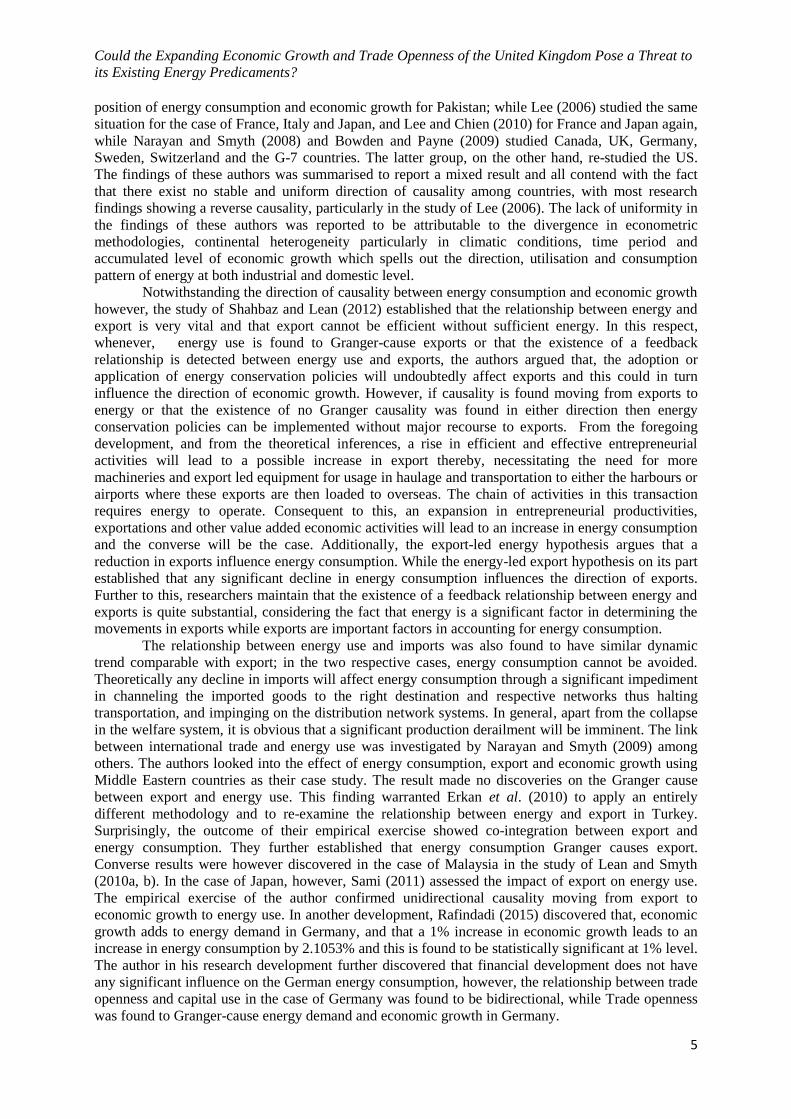
the conclusion and policy implication. In the figures and tables below, Table 1 indicates the position of
Energy in UK and Figure 1 shows final energy consumption in the UK from 1970-2013
Could the Expanding Economic Growth and Trade Openness of the United Kingdom Pose a Threat to
its Existing Energy Predicaments?
3
Table 1. Indicating the position of Energy in the United Kingdom
Capita Prim.
Energy
Production Import Electricity CO2-
emission
Million TWh TWh TWh TWh Mt
2004 59.8 2,718 2,619 135 371 537
2007 60.8 2,458 2,050 522 373 523
2008 61.4 2,424 1,939 672 372 511
2009 61.8 2,288 1,848 641 352 466
2010 62.2 2,355 1,730 705 357 484
2012 62.7 2,187 1,507 843 346 443
Change
2004-10
3.9% -13.3 % -33.9 % 420% -3.9 % -10.0 %
Mtoe = 11.63 TWh>, Prim. energy includes energy losses that are 2/3 for nuclear power
Sources: IEA (2013)
Figure 1: shows final energy consumption in the UK from 1970-2013
Sources: : DECC, Table 1.06

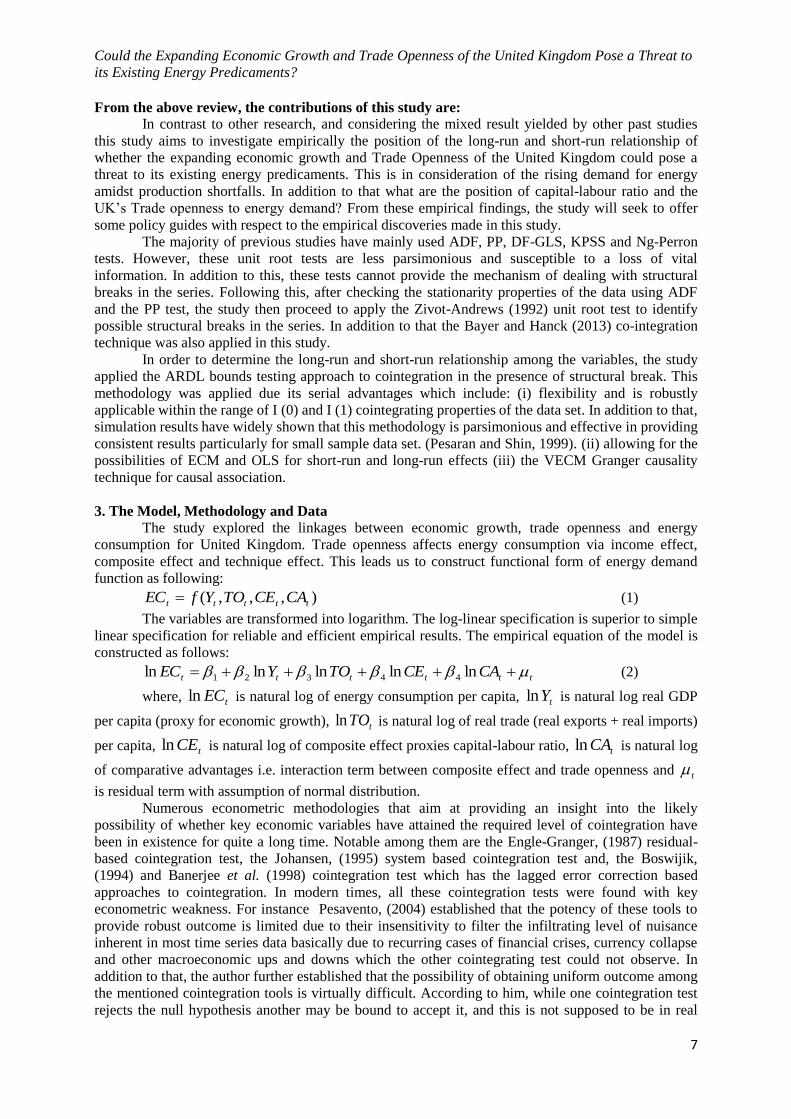
International Journal of Energy Economics and Policy, Vol. 5, No. 1, 2015, pp. 121-137
Figure 2: Shows UK electricity demand by sector in 2012
Sources: Department of Energy and Climate Change DECC.
2. Empirical Review
The pioneering work of Kraft and Kraft (1978) on the nexus between economic growth and
energy is still regarded as the leading authority in the field of energy economics. The authors were the
first to discover a unidirectional causal relationship between GNP growth and energy usage in the
United States in the period from 1947-1974. Following this noble finding, several distinguished
researchers like Akarca and Long (1980) made a follow-up investigation with respect to the finding of
Kraft and Kraft (1978), while using different data set and different study periods the authors refuted
the finding of a unidirectional link between energy and economic growth. This reaction led to the
stimulation of early writers to continue the research investigation in the field of energy economics
through using a different research background. For instance, Erol and Yu (1988) strategically
conducted their study from 1952-1982 by dichotomising their case study areas into six world leading
industrial nations commonly known to have strong energy consumption. The findings of their study
revealed significant bidirectional causality for Japan. However, a contrasting result was obtained in the
case of their findings of Canada which exhibited some tendencies of unidirectional causality from
energy to economic growth, similarly, non-uniform research findings were also discovered with
respect to Germany and Italy which in that period showed that it is economic growth that stimulates
energy consumption and surprisingly none for France and England.
In another startling empirical research similar to that of Erol and Yu (1988), Masih and Masih
(1996) discovered how energy use piques economic growth in India, and converse was found to be the
case with regard to the author’s findings in the case of Pakistan and Indonesia. In addition to that, the
research discovered that it is economic growth that piques energy consumption in Pakistan and
Indonesia, and no causal relationship exists with respect to the findings on Malaysia, Singapore and
the Philippines. These degrees of mixed results stimulated Soytas and Sari (2003) to commission their
research investigation and to adopt different research methodology. In their finding, the authors
reported that economic growth Granger causes energy consumption in Italy and South Korea, but the
case was different with respect to their findings on Germany, Japan, Turkey and France where the
study discovered a simple unidirectional causality from energy use to economic growth. Similar to this
finding, Huang et al. (2008) discovered the absence of any causal link between energy consumption
and economic growth in low-income countries, rather, it was discovered that there is a unidirectional
link from economic growth to energy use in the case of middle and high income countries. This
startling finding stimulated Shahbaz and Lean (2012) and Shahbaz and Feridun (2012) to re-study the
Could the Expanding Economic Growth and Trade Openness of the United Kingdom Pose a Threat to
its Existing Energy Predicaments?
5
position of energy consumption and economic growth for Pakistan; while Lee (2006) studied the same
situation for the case of France, Italy and Japan, and Lee and Chien (2010) for France and Japan again,
while Narayan and Smyth (2008) and Bowden and Payne (2009) studied Canada, UK, Germany,
Sweden, Switzerland and the G-7 countries. The latter group, on the other hand, re-studied the US.
The findings of these authors was summarised to report a mixed result and all contend with the fact
that there exist no stable and uniform direction of causality among countries, with most research
findings showing a reverse causality, particularly in the study of Lee (2006). The lack of uniformity in
the findings of these authors was reported to be attributable to the divergence in econometric
methodologies, continental heterogeneity particularly in climatic conditions, time period and
accumulated level of economic growth which spells out the direction, utilisation and consumption
pattern of energy at both industrial and domestic level.
Notwithstanding the direction of causality between energy consumption and economic growth
however, the study of Shahbaz and Lean (2012) established that the relationship between energy and
export is very vital and that export cannot be efficient without sufficient energy. In this respect,
whenever, energy use is found to Granger-cause exports or that the existence of a feedback
relationship is detected between energy use and exports, the authors argued that, the adoption or
application of energy conservation policies will undoubtedly affect exports and this could in turn
influence the direction of economic growth. However, if causality is found moving from exports to
energy or that the existence of no Granger causality was found in either direction then energy
conservation policies can be implemented without major recourse to exports. From the foregoing
development, and from the theoretical inferences, a rise in efficient and effective entrepreneurial
activities will lead to a possible increase in export thereby, necessitating the need for more
machineries and export led equipment for usage in haulage and transportation to either the harbours or
airports where these exports are then loaded to overseas. The chain of activities in this transaction
requires energy to operate. Consequent to this, an expansion in entrepreneurial productivities,
exportations and other value added economic activities will lead to an increase in energy consumption
and the converse will be the case. Additionally, the export-led energy hypothesis argues that a
reduction in exports influence energy consumption. While the energy-led export hypothesis on its part
established that any significant decline in energy consumption influences the direction of exports.
Further to this, researchers maintain that the existence of a feedback relationship between energy and
exports is quite substantial, considering the fact that energy is a significant factor in determining the
movements in exports while exports are important factors in accounting for energy consumption.
The relationship between energy use and imports was also found to have similar dynamic
trend comparable with export; in the two respective cases, energy consumption cannot be avoided.
Theoretically any decline in imports will affect energy consumption through a significant impediment
in channeling the imported goods to the right destination and respective networks thus halting
transportation, and impinging on the distribution network systems. In general, apart from the collapse
in the welfare system, it is obvious that a significant production derailment will be imminent. The link
between international trade and energy use was investigated by Narayan and Smyth (2009) among
others. The authors looked into the effect of energy consumption, export and economic growth using
Middle Eastern countries as their case study. The result made no discoveries on the Granger cause
between export and energy use. This finding warranted Erkan et al. (2010) to apply an entirely
different methodology and to re-examine the relationship between energy and export in Turkey.
Surprisingly, the outcome of their empirical exercise showed co-integration between export and
energy consumption. They further established that energy consumption Granger causes export.
Converse results were however discovered in the case of Malaysia in the study of Lean and Smyth
(2010a, b). In the case of Japan, however, Sami (2011) assessed the impact of export on energy use.
The empirical exercise of the author confirmed unidirectional causality moving from export to
economic growth to energy use. In another development, Rafindadi (2015) discovered that, economic
growth adds to energy demand in Germany, and that a 1% increase in economic growth leads to an
increase in energy consumption by 2.1053% and this is found to be statistically significant at 1% level.
The author in his research development further discovered that financial development does not have
any significant influence on the German energy consumption, however, the relationship between trade
openness and capital use in the case of Germany was found to be bidirectional, while Trade openness
was found to Granger-cause energy demand and economic growth in Germany.

International Journal of Energy Economics and Policy, Vol. 5, No. 1, 2015, pp. 121-137
Using a panel data approach, Sadorsky (2011) examined the short-run and long-run Granger
causality between export and energy use in the Middle Eastern countries between 1980 to 2007. The
findings of the study showed a dynamic relationship between exports to energy use. The author further
argued that a bidirectional feedback effect exists in the short-term and positive long-term effects were
also observed on the variables. The study of Squalli (2007) determined the long-term relationship
between energy consumption and economic growth among the OPEC countries. The study
underscored the relevance of energy use in enhancing the economic prospects of these continents and
further established that relying on the exportation of energy products by these continents is not a
sufficient criteria for attaining economic growth. However, there should be a significant need for
electricity consumption in countries like Nigeria, Indonesia, Iran, Venezuela and Qatar if an enhanced
and sustainable economic growth is to be achieved.
From a continental African perspective, studies on energy consumption and economic growth
were relatively found to be yielding mixed results. For instance, using Nigerian data Akinlo (2009)
investigated the causality between energy consumption and economic growth for the periods of 1980-
2006. The findings of his study indicated that real gross domestic product and electricity consumption
are cointegrated, and there is unidirectional Granger causality running from electricity consumption to
real gross domestic product. In another similar development, Kouakou (2011) investigated the causal
relationship between the electric power industry’s supply of the country and the economic growth of
Cote d’Ivoire from 1971-2008. The findings reveal bidirectional causality between per capita
electricity consumption and per capita gross domestic product in the short-term, but a unidirectional
causality from electricity to gross domestic product was discovered in the long-term.
Odhiambo (2009) studied the link between energy consumption and economic growth in
Tanzania for the period 1971-2006. The study utilises the Granger causality tests and the ARDL
methodology. The finding of the study established the existence of stable, long-term relationship
between the variables. The results of the causality test, on the other hand, revealed the existence of
unidirectional causal relationship between energy consumption to economic growth. In another
development, Jumbe (2004) examined the relationship between electricity consumption and overall
gross domestic product of Malawi. The author in his research wisdom divided the time series data into
agricultural gross domestic product and non-agricultural gross domestic product from 1970-1999. In a
bid to obtain robust result, the residual-based cointegration approach was applied. The outcome of
this empirical exercise suggests that electricity consumption is co-integrated with the gross domestic
product of the non-agriculturally based gross domestic product, and cointegration relationship was not
found with respect to agricultural gross domestic product of Malawi. The Granger causality tests
proved bidirectional causality between electricity consumption and gross domestic product, but a
unidirectional causality running from non-agricultural gross domestic product to electricity
consumption. With these findings, the author proceeds to examine the elasticity of the variables and
the finding indicates that the impact of electricity consumption is only significant in the long-term.
Panel data studies on energy and economic growth that relate to Africa can be traced to the
noble work of Wolde-Rufael (2006). The author used data of 17 African countries for the period 1971-
2001 and investigated the long-term causal relationship between electricity consumption per capita
and real gross domestic product per capita. He applied the ARDL bounds test to cointegration; in
addition to the causality test proposed by Toda and Yamamoto. The findings reveal unidirectional
causality moving from electricity consumption per capita to real gross domestic product per capita for
Benin Congo, DR, and Tunisia. On the other hand, the results suggest unidirectional causality moving
from real gross domestic product per capita to electricity consumption per capita for the case of
Cameroon, Ghana, Nigeria, Senegal, Zambia, and Zimbabwe. The study further reported bi-directional
causal relationship with respect to Egypt, Gabon, and Morocco, while no causality was found for
Algeria, Congo Rep., Kenya, Sudan and South Africa. Squalli (2007) on his part reported a
contradictory finding with respect to the research efforts of Wolde-Rufael (2006). In his finding, the
author established a unidirectional causal relationship moving from economic growth to electricity
consumption for the case of Algeria and a bidirectional relationship between economic growths to
electricity consumption for Nigeria.
Could the Expanding Economic Growth and Trade Openness of the United Kingdom Pose a Threat to
its Existing Energy Predicaments?
7
From the above review, the contributions of this study are:
In contrast to other research, and considering the mixed result yielded by other past studies
this study aims to investigate empirically the position of the long-run and short-run relationship of
whether the expanding economic growth and Trade Openness of the United Kingdom could pose a
threat to its existing energy predicaments. This is in consideration of the rising demand for energy
amidst production shortfalls. In addition to that what are the position of capital-labour ratio and the
UK’s Trade openness to energy demand? From these empirical findings, the study will seek to offer
some policy guides with respect to the empirical discoveries made in this study.
The majority of previous studies have mainly used ADF, PP, DF-GLS, KPSS and Ng-Perron
tests. However, these unit root tests are less parsimonious and susceptible to a loss of vital
information. In addition to this, these tests cannot provide the mechanism of dealing with structural
breaks in the series. Following this, after checking the stationarity properties of the data using ADF
and the PP test, the study then proceed to apply the Zivot-Andrews (1992) unit root test to identify
possible structural breaks in the series. In addition to that the Bayer and Hanck (2013) co-integration
technique was also applied in this study.
In order to determine the long-run and short-run relationship among the variables, the study
applied the ARDL bounds testing approach to cointegration in the presence of structural break. This
methodology was applied due its serial advantages which include: (i) flexibility and is robustly
applicable within the range of I (0) and I (1) cointegrating properties of the data set. In addition to that,
simulation results have widely shown that this methodology is parsimonious and effective in providing
consistent results particularly for small sample data set. (Pesaran and Shin, 1999). (ii) allowing for the
possibilities of ECM and OLS for short-run and long-run effects (iii) the VECM Granger causality
technique for causal association.
3. The Model, Methodology and Data
The study explored the linkages between economic growth, trade openness and energy
consumption for United Kingdom. Trade openness affects energy consumption via income effect,
composite effect and technique effect. This leads us to construct functional form of energy demand
function as following:
),,,( ttttt CACETOYfEC (1)
The variables are transformed into logarithm. The log-linear specification is superior to simple
linear specification for reliable and efficient empirical results. The empirical equation of the model is
constructed as follows:
tttttt CACETOYEC lnlnlnlnln 44321 (2)
where, tECln is natural log of energy consumption per capita, tYln
is natural log real GDP
per capita (proxy for economic growth), tTOln
is natural log of real trade (real exports + real imports)
per capita, tCEln is natural log of composite effect proxies capital-labour ratio,
tCAln is natural log
of comparative advantages i.e. interaction term between composite effect and trade openness and t is residual term with assumption of normal distribution.
Numerous econometric methodologies that aim at providing an insight into the likely
possibility of whether key economic variables have attained the required level of cointegration have
been in existence for quite a long time. Notable among them are the Engle-Granger, (1987) residual-
based cointegration test, the Johansen, (1995) system based cointegration test and, the Boswijik,
(1994) and Banerjee et al. (1998) cointegration test which has the lagged error correction based
approaches to cointegration. In modern times, all these cointegration tests were found with key
econometric weakness. For instance Pesavento, (2004) established that the potency of these tools to
provide robust outcome is limited due to their insensitivity to filter the infiltrating level of nuisance
inherent in most time series data basically due to recurring cases of financial crises, currency collapse
and other macroeconomic ups and downs which the other cointegrating test could not observe. In
addition to that, the author further established that the possibility of obtaining uniform outcome among
the mentioned cointegration tools is virtually difficult. According to him, while one cointegration test
rejects the null hypothesis another may be bound to accept it, and this is not supposed to be in real

International Journal of Energy Economics and Policy, Vol. 5, No. 1, 2015, pp. 121-137
economic sense. It is following to this shortcoming that Bayer and Hanck, (2013) developed a more
parsimonious method that helps in eliminating the likely bias of the old existing estimators with
respect to determining the cointegrating properties of time series data. The methodology of the Bayer
and Hanck, (2013) cointegration test as applied in this study aim at providing efficient estimates by
eliminating the undue multiple testing procedures that is the common problem with other cointegration
methodologies. To ensure its robustness, the Bayer and Hanck, (2013) when formulating their
cointegrating model followed Fisher, (1932) formula, and this is given below:
)]ln()([ln2 JOHEG PPJOHEG (3)
)]ln()ln()ln()([ln2 BDMBOJOHEG PPPPBDMBOJOHEG (4)
In determining the possibility of the existence of cointegration among respective variables,
Engle-Granger, (1987); Johansen, (1995); Boswijik, (1994) and, Banerjee, Dolado and Mestre, (1998)
used the following notations as a key econometric guide: BOJOHEG PPP ,, and BDMP respectively.
However, in the case of the Bayer and Hanck (2013) their cointegration test mechanism was guided by
the Fisher statistic. In this respect, to establish whether cointegration exists between the variables the
null hypothesis of no cointegration must be rejected, and this can be ascertained when the critical
values generated by Bayer and Hanck analysis are found to be less than the estimated Fisher statistics
and vice versa. To determine the causal relationship between the variables on the other hand, the
study applied the VECM (vector error correction method) and this is given by the following equation:
t
t
t
t
t
t
t
t
t
t
t
mmmmm
mmmmm
mmmmm
mmmmm
mmmmm
t
t
t
t
t
t
t
t
t
t
ECM
CA
CE
TO
Y
EC
BBBBB
BBBBB
BBBBB
BBBBB
BBBBB
CA
CE
TO
Y
EC
BBBBB
BBBBB
BBBBB
BBBBB
BBBBB
b
b
b
b
b
CA
CE
TO
Y
EC
5
4
3
2
1
1
5
4
3
3
1
1
1
1
1
1
,55,54,53,52,51
,45,44,43,42,41
,35,34,33,32,31
,25,24,23,22,21
,15,14,13,12,11
1
1
1
1
1
1,551,541,531,521,51
1,451,441,431,421,41
1,351,341,331,321,31
1,251,241,231,221,21
1,151,141,131,121,11
5
4
3
2
1
)(
ln
ln
ln
ln
ln
...
ln
ln
ln
ln
ln
ln
ln
ln
ln
ln
(5)
Where stands for the notation of the difference operator, while the 1tECM is obtained from the
estimation of the long-run relationship of the ARDL model estimation result. In this case, the long-run
causal relationship is ascertained by determining the significant position of the coefficient for the
1tECM following the T-test statistics. Apart from that, the F-test statistics for the first-differenced
lagged independent variables is used for testing the direction of short-run causal relationship between
the selected variables. The time series data of the United Kingdom from 1970-2013 as used in this
study was obtained from the World Bank, development indicators (2013). Following to this, the data
for the UK’s real GDP, energy consumption (kg of oil equivalent) per capita, real exports, real
imports, real capital, and labour force was obtained.
4. Results and Discussions
The study applied the ADF and PP unit root tests in order to investigate the unit root
properties of the variables. Table 2 reveals that unit root problem exists at level with constant and
trend. The variables such as energy demand, economic growth, trade openness, capital-labour ratio,
interaction term of capital-labour ratio and trade openness are found to be stationary at first difference
at 1% and 5% levels of significance respectively.
Could the Expanding Economic Growth and Trade Openness of the United Kingdom Pose a Threat to
its Existing Energy Predicaments?
9
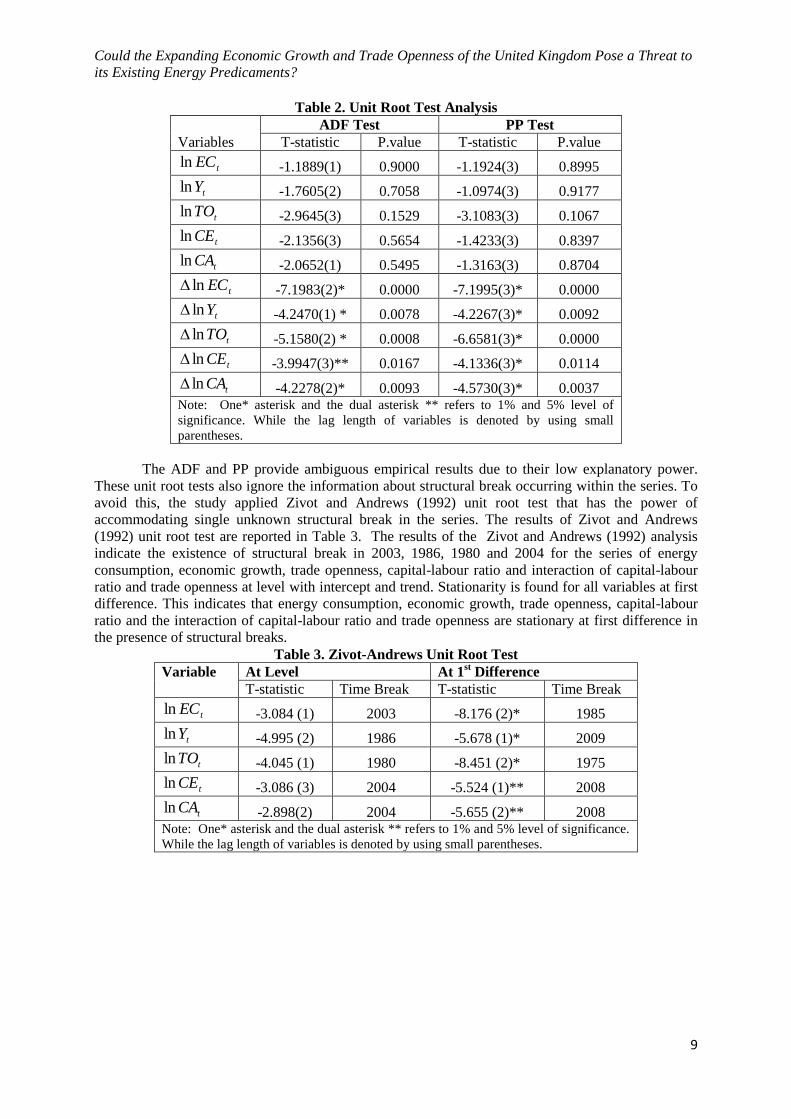
Table 2. Unit Root Test Analysis
Variables
ADF Test PP Test
T-statistic P.value T-statistic P.value
tECln -1.1889(1) 0.9000 -1.1924(3) 0.8995
tYln -1.7605(2) 0.7058 -1.0974(3) 0.9177
tTOln -2.9645(3) 0.1529 -3.1083(3) 0.1067
tCEln -2.1356(3) 0.5654 -1.4233(3) 0.8397
tCAln -2.0652(1) 0.5495 -1.3163(3) 0.8704
tECln -7.1983(2)* 0.0000 -7.1995(3)* 0.0000
tYln -4.2470(1) * 0.0078 -4.2267(3)* 0.0092
tTOln -5.1580(2) * 0.0008 -6.6581(3)* 0.0000
tCEln -3.9947(3)** 0.0167 -4.1336(3)* 0.0114
tCAln -4.2278(2)* 0.0093 -4.5730(3)* 0.0037
Note: One* asterisk and the dual asterisk ** refers to 1% and 5% level of
significance. While the lag length of variables is denoted by using small
parentheses.
The ADF and PP provide ambiguous empirical results due to their low explanatory power.
These unit root tests also ignore the information about structural break occurring within the series. To
avoid this, the study applied Zivot and Andrews (1992) unit root test that has the power of
accommodating single unknown structural break in the series. The results of Zivot and Andrews
(1992) unit root test are reported in Table 3. The results of the Zivot and Andrews (1992) analysis
indicate the existence of structural break in 2003, 1986, 1980 and 2004 for the series of energy
consumption, economic growth, trade openness, capital-labour ratio and interaction of capital-labour
ratio and trade openness at level with intercept and trend. Stationarity is found for all variables at first
difference. This indicates that energy consumption, economic growth, trade openness, capital-labour
ratio and the interaction of capital-labour ratio and trade openness are stationary at first difference in
the presence of structural breaks.
Table 3. Zivot-Andrews Unit Root Test
Variable At Level At 1st Difference
T-statistic Time Break T-statistic Time Break
tECln -3.084 (1) 2003 -8.176 (2)* 1985
tYln -4.995 (2) 1986 -5.678 (1)* 2009
tTOln -4.045 (1) 1980 -8.451 (2)* 1975
tCEln -3.086 (3) 2004 -5.524 (1)** 2008
tCAln -2.898(2) 2004 -5.655 (2)** 2008
Note: One* asterisk and the dual asterisk ** refers to 1% and 5% level of significance.
While the lag length of variables is denoted by using small parentheses.
International Journal of Energy Economics and Policy, Vol. 5, No. 1, 2015, pp. 121-137
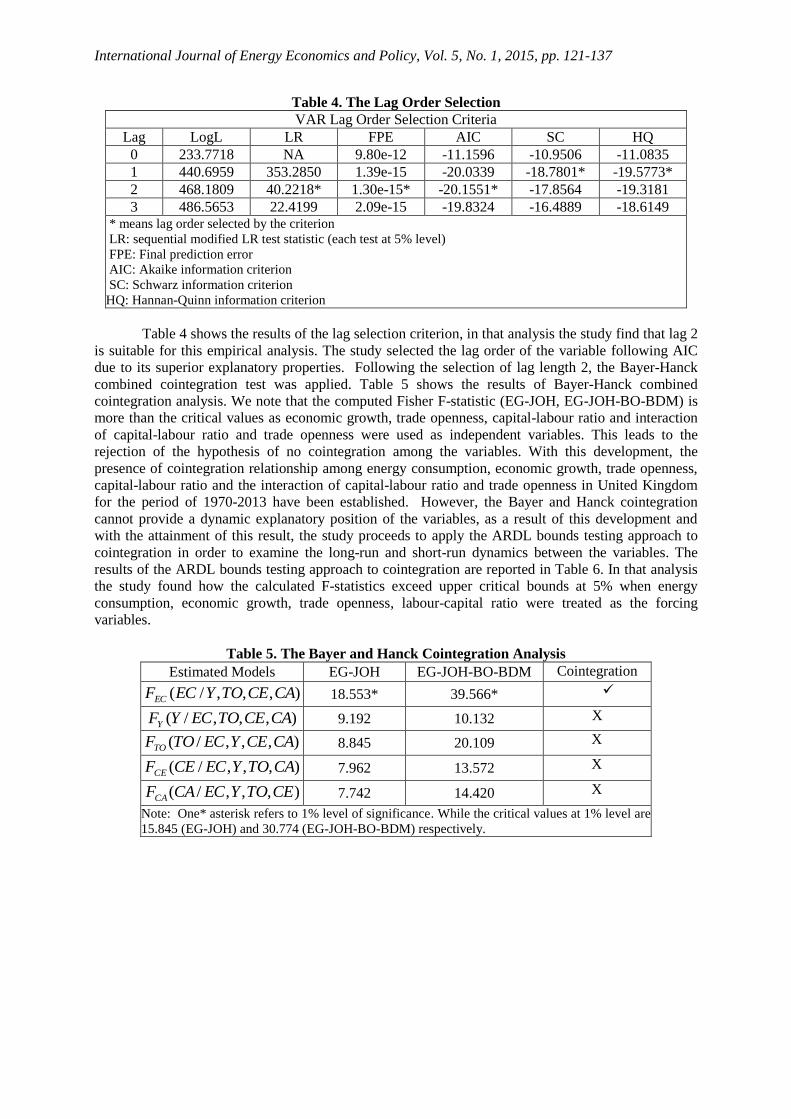
Table 4. The Lag Order Selection
VAR Lag Order Selection Criteria
Lag LogL LR FPE AIC SC HQ
0 233.7718 NA 9.80e-12 -11.1596 -10.9506 -11.0835
1 440.6959 353.2850 1.39e-15 -20.0339 -18.7801* -19.5773*
2 468.1809 40.2218* 1.30e-15* -20.1551* -17.8564 -19.3181
3 486.5653 22.4199 2.09e-15 -19.8324 -16.4889 -18.6149 * means lag order selected by the criterion
LR: sequential modified LR test statistic (each test at 5% level)
FPE: Final prediction error
AIC: Akaike information criterion
SC: Schwarz information criterion
HQ: Hannan-Quinn information criterion
Table 4 shows the results of the lag selection criterion, in that analysis the study find that lag 2
is suitable for this empirical analysis. The study selected the lag order of the variable following AIC
due to its superior explanatory properties. Following the selection of lag length 2, the Bayer-Hanck
combined cointegration test was applied. Table 5 shows the results of Bayer-Hanck combined
cointegration analysis. We note that the computed Fisher F-statistic (EG-JOH, EG-JOH-BO-BDM) is
more than the critical values as economic growth, trade openness, capital-labour ratio and interaction
of capital-labour ratio and trade openness were used as independent variables. This leads to the
rejection of the hypothesis of no cointegration among the variables. With this development, the
presence of cointegration relationship among energy consumption, economic growth, trade openness,
capital-labour ratio and the interaction of capital-labour ratio and trade openness in United Kingdom
for the period of 1970-2013 have been established. However, the Bayer and Hanck cointegration
cannot provide a dynamic explanatory position of the variables, as a result of this development and
with the attainment of this result, the study proceeds to apply the ARDL bounds testing approach to
cointegration in order to examine the long-run and short-run dynamics between the variables. The
results of the ARDL bounds testing approach to cointegration are reported in Table 6. In that analysis
the study found how the calculated F-statistics exceed upper critical bounds at 5% when energy
consumption, economic growth, trade openness, labour-capital ratio were treated as the forcing
variables.
Table 5. The Bayer and Hanck Cointegration Analysis
Estimated Models EG-JOH EG-JOH-BO-BDM Cointegration
),,,/( CACETOYECFEC 18.553* 39.566*
),,,/( CACETOECYFY 9.192 10.132 X
),,,/( CACEYECTOFTO 8.845 20.109 X
),,,/( CATOYECCEFCE 7.962 13.572 X
),,,/( CETOYECCAFCA 7.742 14.420 X
Note: One* asterisk refers to 1% level of significance. While the critical values at 1% level are
15.845 (EG-JOH) and 30.774 (EG-JOH-BO-BDM) respectively.

Could the Expanding Economic Growth and Trade Openness of the United Kingdom Pose a Threat to
its Existing Energy Predicaments?
11
Table 6. The Results of ARDL Cointegration Test
Bounds Testing to Cointegration Diagnostic tests
Estimated Models Optimal lag
length
Structural
Break F-statistics
2
NORMAL 2
ARCH 2
RESET
),,,/( CACETOYECFEC 2, 1, 2, 2, 2 2003 8.649** 1.2486 [1]: 1.4742 [1]: 1.4271
),,,/( CACETOECYFY 2, 2, 2, 2, 1 1986 5.286 5.5350 [1]: 0.0995 [2]: 3.0173
),,,/( CACEYECTOFTO 2, 2, 2, 2, 2 1980 1.872 0.5147 [1]: 0.9933 [2]: 0.0036
),,,/( CATOYECCEFCE 2, 1, 1, 2, 2 2004 2.721 0.9877 [1]: 1.2866 [2]: 6.7414
),,,/( CETOYECCAFCA 2, 2, 1, 2, 1 2004
Significant level
Critical values (T= 44)
Lower bounds
I(0)
Upper bounds
I(1)
1 per cent level 7.317 8.720
5 per cent level 5.360 6.373
10 per cent level 4.437 5.377
Note: The asterisks, ** denote significance at 5% levels. While the optimal lag length is determined by AIC. [ ] is the
order of diagnostic tests. Critical values are obtained from Narayan (2005).
The results of the ARDL long-run and short-run impact of economic growth, trade openness,
capital-labour ratio and the interaction of capital-labour ratio and trade openness on energy
consumption are reported in Table 6. In that analysis the study discovered that economic growth has a
negative and significant relationship with energy consumption in the United Kingdom. Following to
this it was discovered that a 1% increase in economic growth will lead to the decrease in energy
consumption in the UK by 0.5422, all else is same. In contrast to that development, Trade openness
was found have a positive and significant effect on energy consumption. As a result of that a 1%
increase in Trade openness is found to increases energy consumption by 0.9817% and it is statistically
significant at 1% level. Composite effect was also found to affect energy consumption positively, and
it is significant at 1% level. All else is same; following to this a 1% increase in capital-labour ratio
increases energy consumption in the UK by 3.3906%. The relationship between comparative
advantage and energy demand is negative and statistically significant at 1% level. Keeping other
things constant, a 0.3159% decrease in energy demand is linked with 1% increase in comparative
advantage.
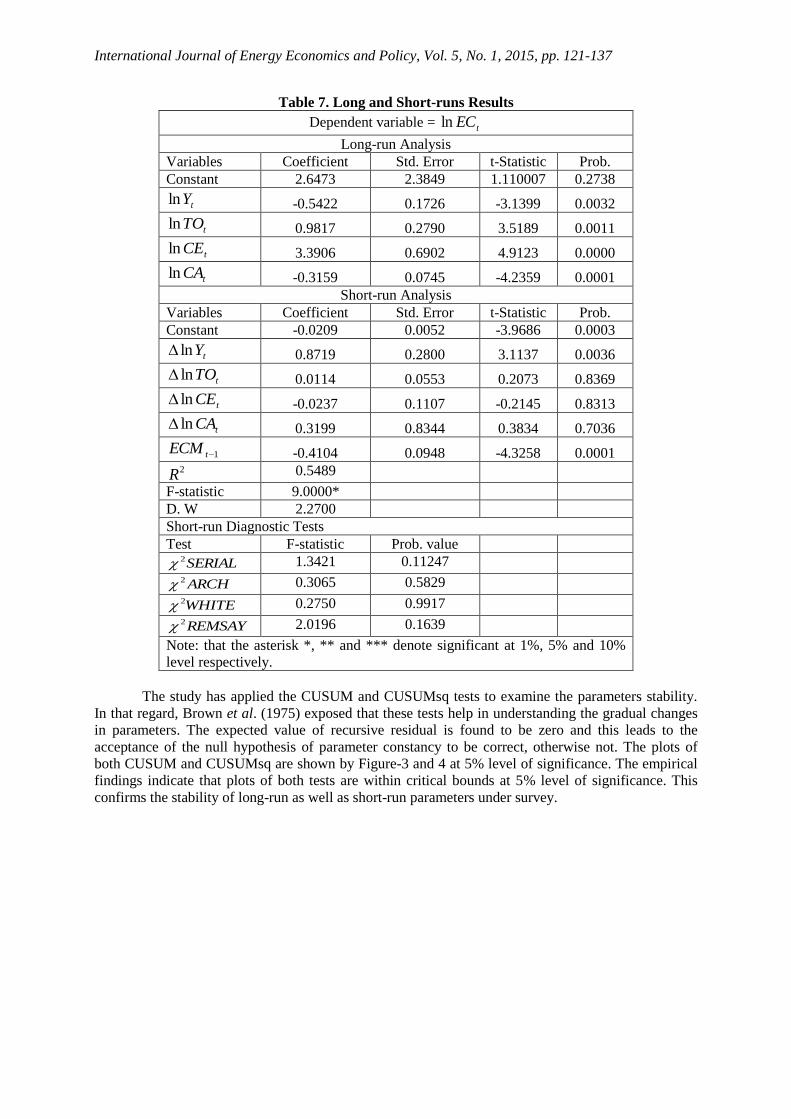
The short-run analysis is also reported in lower segment of Table 7. In the short-run
perspective, the study discovered that economic growth is positively and significantly linked with
energy consumption. The relationship between Trade openness and energy consumption is positive but
insignificant. Capital-labour ratio was found to affect energy consumption negatively although the
relationship was found to be insignificant. Comparative advantage has positive but insignificant
impact on energy consumption. The value of ECM term is negative and significant which shows the
convergence from short-run towards long-run equilibrium path. The estimate of ECM term is
equivalent to -0.4104 which confirms that short-run deviations are corrected by 41% every year. This
shows that convergence from short-run towards long-run will take 2 years and 5 months. The results
of diagnostic test show the absence of serial correlation, autoregressive conditional heteroskedasticity,
and white heteroskedasticity. The results of Ramsey Reset test confirm the specification of the short-
run model.
International Journal of Energy Economics and Policy, Vol. 5, No. 1, 2015, pp. 121-137
Table 7. Long and Short-runs Results
Dependent variable = tECln
Long-run Analysis
Variables Coefficient Std. Error t-Statistic Prob.
Constant 2.6473 2.3849 1.110007 0.2738
tYln -0.5422 0.1726 -3.1399 0.0032
tTOln 0.9817 0.2790 3.5189 0.0011
tCEln 3.3906 0.6902 4.9123 0.0000
tCAln -0.3159 0.0745 -4.2359 0.0001
Short-run Analysis
Variables Coefficient Std. Error t-Statistic Prob.
Constant -0.0209 0.0052 -3.9686 0.0003
tYln 0.8719 0.2800 3.1137 0.0036
tTOln 0.0114 0.0553 0.2073 0.8369
tCEln -0.0237 0.1107 -0.2145 0.8313
tCAln 0.3199 0.8344 0.3834 0.7036
1tECM -0.4104 0.0948 -4.3258 0.0001
2R 0.5489
F-statistic 9.0000*
D. W 2.2700
Short-run Diagnostic Tests
Test F-statistic Prob. value
SERIAL2 1.3421 0.11247
ARCH2 0.3065 0.5829
WHITE2 0.2750 0.9917
REMSAY2 2.0196 0.1639
Note: that the asterisk *, ** and *** denote significant at 1%, 5% and 10%
level respectively.
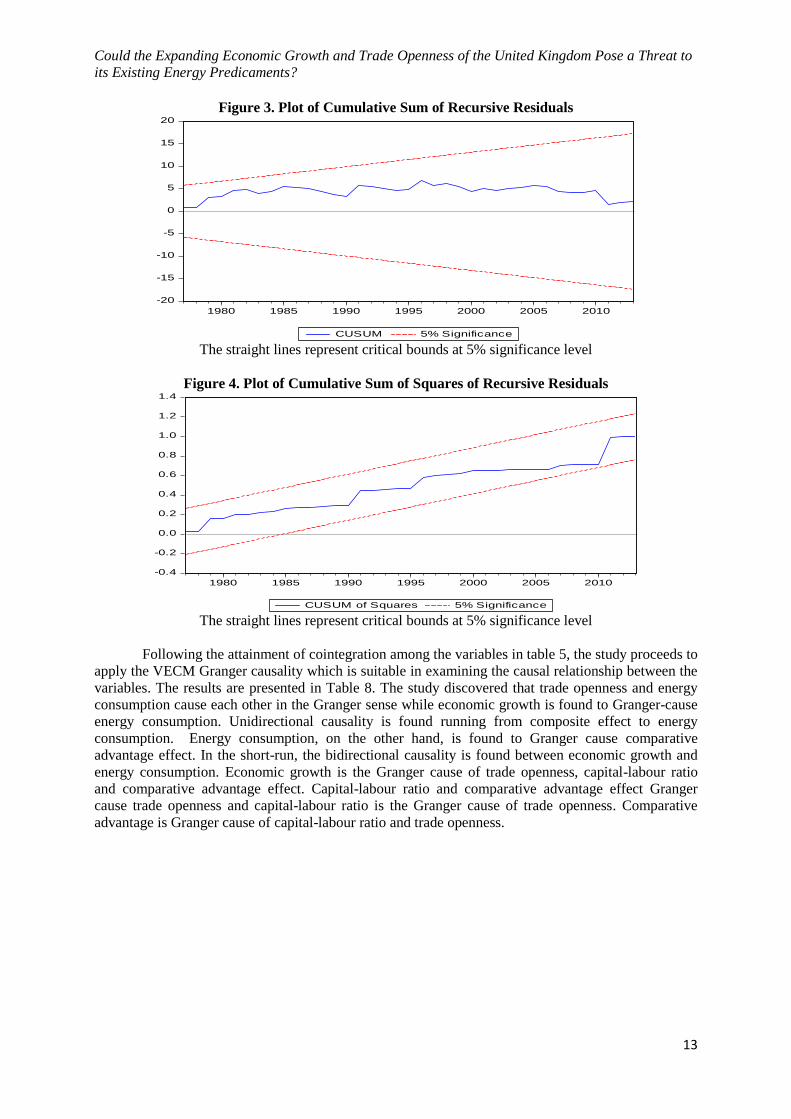
The study has applied the CUSUM and CUSUMsq tests to examine the parameters stability.
In that regard, Brown et al. (1975) exposed that these tests help in understanding the gradual changes
in parameters. The expected value of recursive residual is found to be zero and this leads to the
acceptance of the null hypothesis of parameter constancy to be correct, otherwise not. The plots of
both CUSUM and CUSUMsq are shown by Figure-3 and 4 at 5% level of significance. The empirical
findings indicate that plots of both tests are within critical bounds at 5% level of significance. This
confirms the stability of long-run as well as short-run parameters under survey.
Could the Expanding Economic Growth and Trade Openness of the United Kingdom Pose a Threat to
its Existing Energy Predicaments?
13
Figure 3. Plot of Cumulative Sum of Recursive Residuals
-20
-15
-10
-5
0
5
10
15
20
1980 1985 1990 1995 2000 2005 2010
CUSUM 5% Significance The straight lines represent critical bounds at 5% significance level
Figure 4. Plot of Cumulative Sum of Squares of Recursive Residuals
-0.4
-0.2
0.0
0.2
0.4
0.6
0.8
1.0
1.2
1.4
1980 1985 1990 1995 2000 2005 2010
CUSUM of Squares 5% Significance The straight lines represent critical bounds at 5% significance level
Following the attainment of cointegration among the variables in table 5, the study proceeds to
apply the VECM Granger causality which is suitable in examining the causal relationship between the
variables. The results are presented in Table 8. The study discovered that trade openness and energy
consumption cause each other in the Granger sense while economic growth is found to Granger-cause
energy consumption. Unidirectional causality is found running from composite effect to energy
consumption. Energy consumption, on the other hand, is found to Granger cause comparative
advantage effect. In the short-run, the bidirectional causality is found between economic growth and
energy consumption. Economic growth is the Granger cause of trade openness, capital-labour ratio
and comparative advantage effect. Capital-labour ratio and comparative advantage effect Granger
cause trade openness and capital-labour ratio is the Granger cause of trade openness. Comparative
advantage is Granger cause of capital-labour ratio and trade openness.
International Journal of Energy Economics and Policy, Vol. 5, No. 1, 2015, pp. 121-137
Table 8. The VECM Granger Causality Analysis
Dependent
Variable
Direction of Causality
Short-run Long-run
1ln tEC 1ln tY 1ln tTO 1ln tCE 1ln tCA 1tECT
tECln ….
8.3852*
[0.0012]
0.1947
[0.8240]
0.0991
[0.9058]
0.2123
[0.8098]
-0.5238*
[-4.2631]
tYln 7.2071*
[0.0026] ….
2.2080***
[0.0775]
2.0553***
[0.0935]
2.7171***
[0.0813]
….
tTOln 1.0665
[0.3565]
0.2771
[0.7628] ….
3.6570**
[0.0500]
5.3773*
[0.0078]
-0.2266***
[-1.8735]
tCEln 0.1387
[0.8710]
0.4673
[0.6309]
3.6089***
[0.0623] ….
10.0067*
[0.0010]
….
tCAln
0.2508
[0.7797]
0.4698
[0.6294]
5.1145*
[0.0098]
10.6800*
[0.0009]
….
…. Note: * and ** show significance at 1% and 5% respectively.
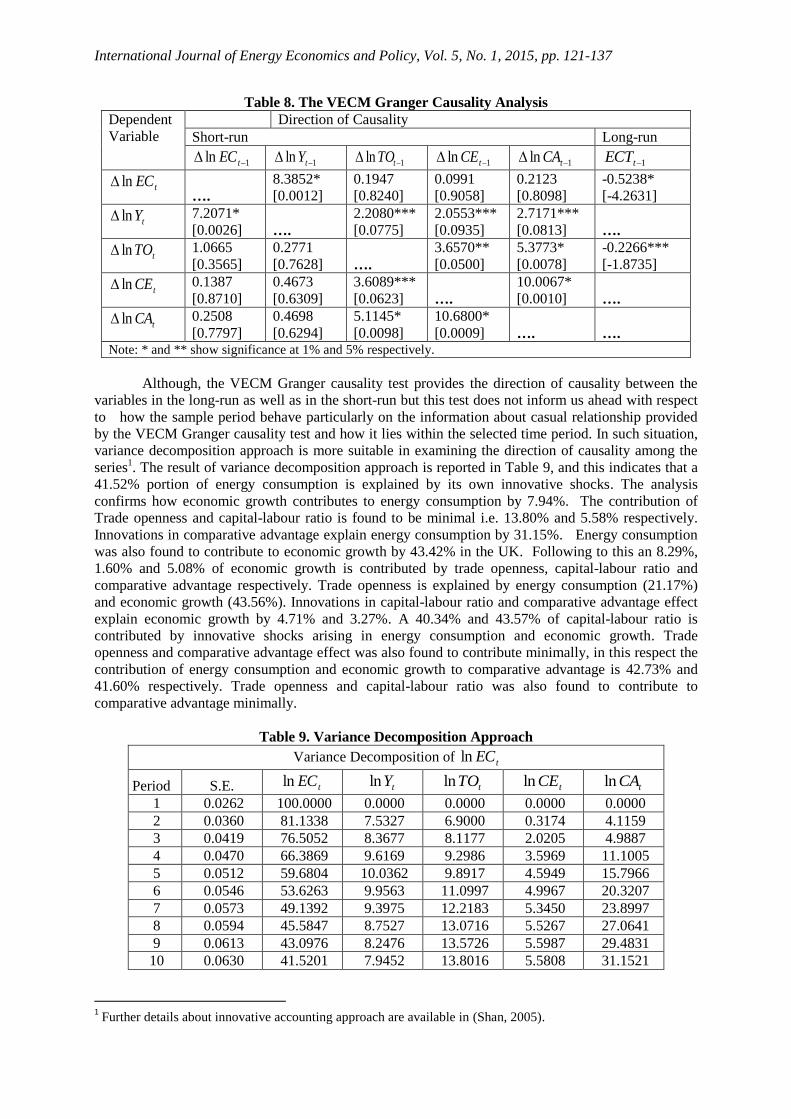
Although, the VECM Granger causality test provides the direction of causality between the
variables in the long-run as well as in the short-run but this test does not inform us ahead with respect
to how the sample period behave particularly on the information about casual relationship provided
by the VECM Granger causality test and how it lies within the selected time period. In such situation,
variance decomposition approach is more suitable in examining the direction of causality among the
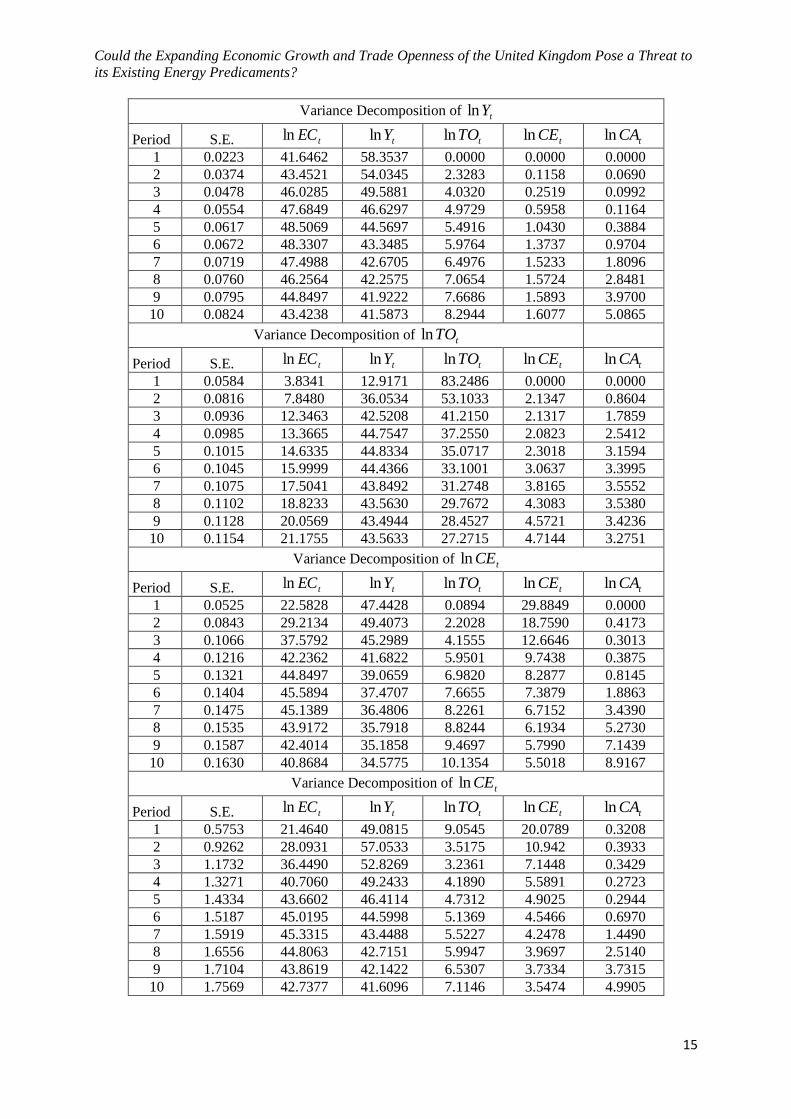
series1. The result of variance decomposition approach is reported in Table 9, and this indicates that a
41.52% portion of energy consumption is explained by its own innovative shocks. The analysis
confirms how economic growth contributes to energy consumption by 7.94%. The contribution of
Trade openness and capital-labour ratio is found to be minimal i.e. 13.80% and 5.58% respectively.
Innovations in comparative advantage explain energy consumption by 31.15%. Energy consumption
was also found to contribute to economic growth by 43.42% in the UK. Following to this an 8.29%,
1.60% and 5.08% of economic growth is contributed by trade openness, capital-labour ratio and
comparative advantage respectively. Trade openness is explained by energy consumption (21.17%)
and economic growth (43.56%). Innovations in capital-labour ratio and comparative advantage effect
explain economic growth by 4.71% and 3.27%. A 40.34% and 43.57% of capital-labour ratio is
contributed by innovative shocks arising in energy consumption and economic growth. Trade
openness and comparative advantage effect was also found to contribute minimally, in this respect the
contribution of energy consumption and economic growth to comparative advantage is 42.73% and
41.60% respectively. Trade openness and capital-labour ratio was also found to contribute to
comparative advantage minimally.
Table 9. Variance Decomposition Approach
Variance Decomposition of tECln
Period S.E. tECln tYln tTOln tCEln tCAln
1 0.0262 100.0000 0.0000 0.0000 0.0000 0.0000
2 0.0360 81.1338 7.5327 6.9000 0.3174 4.1159
3 0.0419 76.5052 8.3677 8.1177 2.0205 4.9887
4 0.0470 66.3869 9.6169 9.2986 3.5969 11.1005
5 0.0512 59.6804 10.0362 9.8917 4.5949 15.7966
6 0.0546 53.6263 9.9563 11.0997 4.9967 20.3207
7 0.0573 49.1392 9.3975 12.2183 5.3450 23.8997
8 0.0594 45.5847 8.7527 13.0716 5.5267 27.0641
9 0.0613 43.0976 8.2476 13.5726 5.5987 29.4831
10 0.0630 41.5201 7.9452 13.8016 5.5808 31.1521
1 Further details about innovative accounting approach are available in (Shan, 2005).
Could the Expanding Economic Growth and Trade Openness of the United Kingdom Pose a Threat to
its Existing Energy Predicaments?
15
Variance Decomposition of tYln
Period S.E. tECln tYln tTOln tCEln tCAln
1 0.0223 41.6462 58.3537 0.0000 0.0000 0.0000
2 0.0374 43.4521 54.0345 2.3283 0.1158 0.0690
3 0.0478 46.0285 49.5881 4.0320 0.2519 0.0992
4 0.0554 47.6849 46.6297 4.9729 0.5958 0.1164
5 0.0617 48.5069 44.5697 5.4916 1.0430 0.3884
6 0.0672 48.3307 43.3485 5.9764 1.3737 0.9704
7 0.0719 47.4988 42.6705 6.4976 1.5233 1.8096
8 0.0760 46.2564 42.2575 7.0654 1.5724 2.8481
9 0.0795 44.8497 41.9222 7.6686 1.5893 3.9700
10 0.0824 43.4238 41.5873 8.2944 1.6077 5.0865
Variance Decomposition of tTOln
Period S.E. tECln tYln tTOln tCEln tCAln
1 0.0584 3.8341 12.9171 83.2486 0.0000 0.0000
2 0.0816 7.8480 36.0534 53.1033 2.1347 0.8604
3 0.0936 12.3463 42.5208 41.2150 2.1317 1.7859
4 0.0985 13.3665 44.7547 37.2550 2.0823 2.5412
5 0.1015 14.6335 44.8334 35.0717 2.3018 3.1594
6 0.1045 15.9999 44.4366 33.1001 3.0637 3.3995
7 0.1075 17.5041 43.8492 31.2748 3.8165 3.5552
8 0.1102 18.8233 43.5630 29.7672 4.3083 3.5380
9 0.1128 20.0569 43.4944 28.4527 4.5721 3.4236
10 0.1154 21.1755 43.5633 27.2715 4.7144 3.2751
Variance Decomposition of tCEln
Period S.E. tECln tYln tTOln tCEln tCAln
1 0.0525 22.5828 47.4428 0.0894 29.8849 0.0000
2 0.0843 29.2134 49.4073 2.2028 18.7590 0.4173
3 0.1066 37.5792 45.2989 4.1555 12.6646 0.3013
4 0.1216 42.2362 41.6822 5.9501 9.7438 0.3875
5 0.1321 44.8497 39.0659 6.9820 8.2877 0.8145
6 0.1404 45.5894 37.4707 7.6655 7.3879 1.8863
7 0.1475 45.1389 36.4806 8.2261 6.7152 3.4390
8 0.1535 43.9172 35.7918 8.8244 6.1934 5.2730
9 0.1587 42.4014 35.1858 9.4697 5.7990 7.1439
10 0.1630 40.8684 34.5775 10.1354 5.5018 8.9167
Variance Decomposition of tCEln
Period S.E. tECln tYln tTOln tCEln tCAln
1 0.5753 21.4640 49.0815 9.0545 20.0789 0.3208
2 0.9262 28.0931 57.0533 3.5175 10.942 0.3933
3 1.1732 36.4490 52.8269 3.2361 7.1448 0.3429
4 1.3271 40.7060 49.2433 4.1890 5.5891 0.2723
5 1.4334 43.6602 46.4114 4.7312 4.9025 0.2944
6 1.5187 45.0195 44.5998 5.1369 4.5466 0.6970
7 1.5919 45.3315 43.4488 5.5227 4.2478 1.4490
8 1.6556 44.8063 42.7151 5.9947 3.9697 2.5140
9 1.7104 43.8619 42.1422 6.5307 3.7334 3.7315
10 1.7569 42.7377 41.6096 7.1146 3.5474 4.9905

International Journal of Energy Economics and Policy, Vol. 5, No. 1, 2015, pp. 121-137
Overall, we find that the feedback effect exists between energy consumption and economic
growth. The unidirectional causal relationship was also found to exist and running from energy
consumption and economic growth to trade openness, capital-labour ratio and comparative advantage.
5. Conclusion and Policy Implications This study investigated the linkages between economic growth, trade openness and energy
consumption using energy demand function in the case of the United Kingdom. This is in a bid to find
whether the expanding economic growth prospects of the UK may add to its energy predicaments or
otherwise. To ensure this, the study used annual data over the periods of 1970-2013. The unit root
properties of the data were investigated using the traditional, as well as the standard structural break
unit root tests. These results from the structural break unit root analysis were then used in the Bayer-
Hank combined cointegration approach in order to examine the cointegration relationship between the
variables. The ARDL bounds test approach was also used to examine the dynamics of the long-run
and short-run relationship, while the VECM Granger causality approach was then used to determine
the causal relationship between the series, and this was validated using the innovation accounting test.
The results confirmed the existence of cointegration among the variables. Following to this, the study
discovered that in the long-run economic growth is negatively linked with energy demand in the UK
while Trade openness was found to add to energy consumption. The Capital-labour ratio was
discovered to have a composite effect, and it influence energy consumption significantly. Our
investigation on the comparative advantage, on the other hand, was found to decline energy demand.
Following to this, the study found the existence of bidirectional causal relationship between energy
consumption and Trade openness; as a result of this, economic growth was found to Granger cause
energy consumption; energy consumption is Granger cause of composite effect and comparative
advantage effect. To support the claims made, the result of this study established that a 1% increase in
economic growth decreases energy consumption by 0.5422%. By this finding, it means that the UK
energy predicaments cannot be aggravated by the country’s economic growth prospects all things
being equal. However, Ferguson et al (2000) argued that for the global economy as a whole, there is a
stronger inter-relation between electricity consumption and the creation of wealth (economic growth)
than that connecting total use of energy and wealth (economic growth). The author continue to insist
that, in the same rich nations like the UK, the rise in economic growth with time will correlate with the
rise in the amount of energy that is used and this will modestly make energy consumption as a root
cause to economic growth. Meaning energy will in due course become the Granger cause to economic
growth in rich countries.
In contrast to the earlier finding, this study discovered Trade openness of the UK to have a
positive and significant effect on energy consumption. As a result of this development, the study
found that a 1% increase in trade openness increases energy consumption by 0.9817% in the UK, and
it is significant at 1% level. Following to this development and according to the report from the UK
Office for National Statistics, (2014) it is asserted that international Trade represents almost 60% of
the UK’s GDP. This development positioned the country to assume the world's second biggest
exporting nation and the third biggest importer of commercial services, as well as the tenth biggest
exporter and the sixth biggest importer of goods in the world. Despite this vibrant position, yet, the
United Kingdom has experienced huge trade deficit. For example in 1998, the UK’s trade deficit was
estimated to be about US$ 3.5 billion or 1.5 percent of its GDP. To show that the figure did not
improve but rather worsened, in February, 2014 the UK recorded a Trade deficit of £9.1 billion which
is almost 4.4% of its GDP (Office for National statistics, 2014). The more compounding issue with
this development which is the key policy implication that this study was able to identify is that the UK
operates 7 free trade zones in Birmingham, Humberside, Liverpool, Prestwick, Sheerness,
Southampton, and Tilbury. By this development, it means a strong pressure to the country’s energy
sector. This is in the sense that the greater the energy consumption of the UK’s 7 free trade zones, the
more stressing this may be to the energy consumption of the country, particularly when considering
the rising trade deficit, from this operation and also when considering the huge volume of trading
activities of the country i.e. 60% of the GDP.
In another related development, the composite effect of energy consumption was found to
have a positive and significant effect on energy demand in the UK; as a result of this, the study
discovered that a 1% increase in capital-labour ratio increases energy consumption in the UK by

Could the Expanding Economic Growth and Trade Openness of the United Kingdom Pose a Threat to
its Existing Energy Predicaments?
17
3.3906% from these developments, the UK energy predicaments could only worsen if electricity
generation should fall below the expected requirement of these and other existing energy requirement
statistics as well as key potential once. More so, that energy consumption was found to contribute
43.42% to the UK economic growth prospects as found in this study. Following to this and in order to
ameliorate the issue of energy predicaments, and place the UK economy towards a sustainable path of
affluence already attained, we argue for strong commitment on the side of policy makers to embrace
alternative long-run and short-run measures of energy provision by pursuing mix energy policies and
strategies that will ensure the exclusive use of renewable energy at the household level. This can be
ensured by encouraging heavy investments in renewable energy source. In addition to that, this study
is also of the belief that when the UK economy continue to grow from its current position the stress on
energy demand will undoubtedly be high and could exert more on the energy predicaments of the
country particularly if the minimum electricity supply could not be met. To further mitigate this effect
we argue for the adoptions of those policies and strategies that will ensure the use of advanced
technology at the industrial level. This development will not only palliate the UK’s energy
predicaments but will equally prevent environmental degradation by lessening the extent of energy
consumption and also sustain the welfare position of the UK citizens through reduction in carbon
dioxide emission particularly if the use of renewable energy is prioritized. This development if
implemented will also enable the UK to be in track with the 2007 white Paper that is aimed at
“Meeting the Energy Challenge” of the country as well as keeping abreast with the EU vision
20/20/20.
References
Akarca, A.E. & Long, T.V.I.I., (1980). On the relationship between energy and GNP: a reexamination.
Journal of Energy Development 5, 326–331.
Akinlo, A.E. (2009). Electricity Consumption and Economic Growth in Nigeria: Evidence from
Cointegration and Co-feature Analysis. Journal of Policy Modeling, 31, 681-693.
Banerjee, A., Dolado, J., Mestre, R., (1998). Error-correction mechanism test for cointegration in a
single-equation framework. Journal of Time Series Analysis, 19, 267-283.
Bayer, C., and Hanck, C. (2013). Combining Non‐Cointegration Tests. Journal of Time Series
Analysis 34, 83-95.
BBC (2013) http://www.bbc.com/news/business-23081695. Retrieved 19th September, 2014.
Boswijk, H.P., (1994). Testing for an unstable root in conditional and structural error correction
models. Journal of Econometrics, 63, 37-60.
Bowden, N. & Payne, J.E.,( 2009). The causal relationship between US energy consumption and real
output: a disaggregated analysis. Journal of Policy Modeling, 31, 180–188.
Brown, R.L., Durban, J. and Evans, J.M. (1975). Techniques for testing the constancy of regression
relationships over time, Journal of the Royal Statistical Society 37, 149 -192.
Clemente, J., Antonio, M. & Marcelo, R., (1998). Testing for a unit root in variables with a double
change in the mean. Economic Letters., 59, 175–182.
DECC (2014). https://www.gov.uk/government/uploads/system/uploads/attachment_data/file /337452/ecuk_chapter_1_overall_factsheet.pdf, Retrieved 29th September, 2014.
DECC (2013). https://www.gov.uk/government/uploads/system/uploads/attachment_data/file
/279523/DUKES_2013_published_version.pdf, Retrieved 29th September, 2014.
Engle, R.F., Granger C.W.J., (1987). Co-integration and error correction: Representation, estimation,
and testing. Econometrica, 55, 251-276.
Erkan, C., Mucuk, M. & Uysal, D., (2010). The impact of energy consumption on exports: The
Turkish case. Asian Journal of Business Management., 2,17–23.
Erol, U. & Yu, E.S.H., (1988). On the causal relationship between energy and income for
industrialized countries. Journal of Energy Development., 13, 113–122.
Fisher, R. A. (1932). Statistical Methods for Research Workers, Oliver & Boyd, Edinburgh, 4th
Edition.
Ferguson, R. Wilkinson, W. and Hill, R., (2000). Electricity use and economic development. Energy
Policy 28, 923-934.
Huang, B., Hwang, M.J. & Yang, C.W., ( 2008). Causal relationship between energy consumption and
GDP growth revisited: a dynamic panel data approach. Ecological Economics, 67, 41–54.
International Journal of Energy Economics and Policy, Vol. 5, No. 1, 2015, pp. 121-137
IEA (2013) Key World Energy Statistics, http://www.iea.org/publications/freepublications/
Johansen.S., (1995). Likelihood based Inference in Cointegrated Vector Autoregressive Models
Oxford Oxford University Press.
Jumbe, C.B.L., (2004). Cointegration and Causality between Electricity Consumption and GDP:
Empirical Evidence from Malawi. Energy Economics, 26, 61-68.
Kouakou A.K., (2011). Economic Growth and Electricity Consumption in Cote d’Ivoire: Evidence
from Time Series Analysis. Energy Policy, 39, 3638-3644.
Kraft, J. & Kraft, A., (1978). On the relationship between energy and GNP. Journal of Energy
Development., 3, 401–403. Lean, H.H. & Smyth, R., (2010a). On the dynamics of aggregate output, electricity consumption
and exports in Malaysia: evidence from multivariate Granger causality tests. Applied Energy,
87, 1963–1971.
Lean, H.H. & Smyth, R., (2010b). Multivariate Granger causality between electricity generation,
exports, prices and GDP in Malaysia. Energy, 35, 3640–3648.
Lee, C., (2006). The causality relationship between energy consumption and GDP in G-11 countries
revisited. Energy Policy, 34, 1086–1093.
Lee, C. & Chien, M., (2010). Dynamic modeling of energy consumption, capital stock, and real
income in G-7 countries. Energy Economics, 32, 564–581.
Masih, A.M.M. & Masih, R., (1996). Energy consumption, real income and temporal causality: results
from a multi-country study based on cointegration and error-correction modeling techniques.
Energy Economics, 18, 165–183.
Narayan, P.K. & Smyth, R., (2005). Electricity consumption, employment and real income in
Australia: evidence from multivariate granger causality Tests. Energy Policy, 33, 1109–1116.
Narayan, P.K. & Smyth, R., (2008). Energy consumption and real GDP in G7 countries, new
evidence from panel cointegration with structural breaks. Energy Economics 30, 2331–
2341.
Narayan, P.K. & Smyth, R., (2009). Multivariate Granger causality between electricity
consumption, exports and GDP: Evidence from a panel of Middle Eastern countries.
Energy Policy, 37, 229–236. Odhiambo, N.M., (2009). Electricity Consumption and Economic Growth in South Africa: A
Trivariate Causality Test. Energy Economics, 3111, 635-640.
Office for National statistics, (2014), Summary of UK trade statistics.
http://www.ons.gov.uk/ons/rel/uktrade/uk-trade/february-2014/summ-uk-trade--february-
2014.html.
Ozturk, I., (2010). A literature survey on energy-growth nexus. Energy Policy 38, 340-349.
Payne J., (2010). A survey of the electricity consumption-growth literature. Applied Energy 87, 3723-
3731.
Pesavento, E., (2004). Analytical evaluation of the power of tests for the absence of cointegration.
Journal of Econometrics, 122, 349-384.
Pesaran, M.H. & Shin, Y., (1999). An autoregressive distributed-led modeling approach to
cointegration analysis. In Econometrics and Economic Theory in the 20th Century. The Ragnar
Frisch Centennial Symposium, ed. Steiner Strom. Cambridge: Cambridge University Press.
Rafindadi, A.A., (2015) Econometric prediction on the effects of Financial Development and Trade
Openness on the German Energy consumption: A startling new revelation from the data set.
International Journal of Energy economics and policy, 5, PLS. INSERT PAGE NO
Sadorsky, P., (2011). Financial development and energy consumption in Central and Eastern European
frontier economies. Energy Policy, 39, 999–1006.
Sami J.V., (2011). Capital Mobility and Saving-Investment Nexus: Empirical Evidence from
Mauritius, Malta and Maldives, paper presented in Tenth International Conference on
Operations and Quantitative Management held in Symbiosis Institute of Operations
Management Nasik, June 28-30, 2011.
Shahbaz, M. & Feridun, M., (2012). Electricity consumption and economic growth empirical evidence
from Pakistan. Quality and Quantity. 46, 1583–1599.

Could the Expanding Economic Growth and Trade Openness of the United Kingdom Pose a Threat to
its Existing Energy Predicaments?
19
Shahbaz, M. & Lean, H.H., (2012). Does financial development increase energy consumption? The
role of industrialization and urbanization in Tunisia. Energy Policy, 40, 473–479.
Shan, J., 2005. Does Financial Development 'lead' Economic Growth? A Vector Auto-Regression
Appraisal, Applied Economics, 37, 1353-1367.
Soytas, U. & Sari, R.,(2003). Energy consumption and GDP: causality relationship in G-7
countries and emerging markets. Energy Economics., 25, 33–37. Squalli, J., (2007). Electricity Consumption and Economic Growth: Bounds and Causality Analyses
of OPEC Countries. Energy Economics, 29, 1192-1205.
UK Office of National Statistics (2014). https://www.gov.uk/government/statistics/uk-trade-statistics-
with-countries-in-the-european-union-august-2014. Retrieved, 29th September, 2014.
Wolde-Rufael, Y., (2006), Electricity Consumption and Economic Growth: A Time Series Experience
for 17 African Countries. Energy Policy, 34, 1106-1114.
World Bank (2013). World Development Indicators. Washington, D.C: World Bank.
Zivot, E. & Andrews, D., (1992). Further evidence of great crash, the oil price shock and unit root
hypothesis. Journal of Business Economics & Statistics., 10, 251–270.
Copyright © 2022 FDOKUMEN