The influence of critical thinking on Christians belief and belief ...
Upload
khangminh22Category
view
1download
0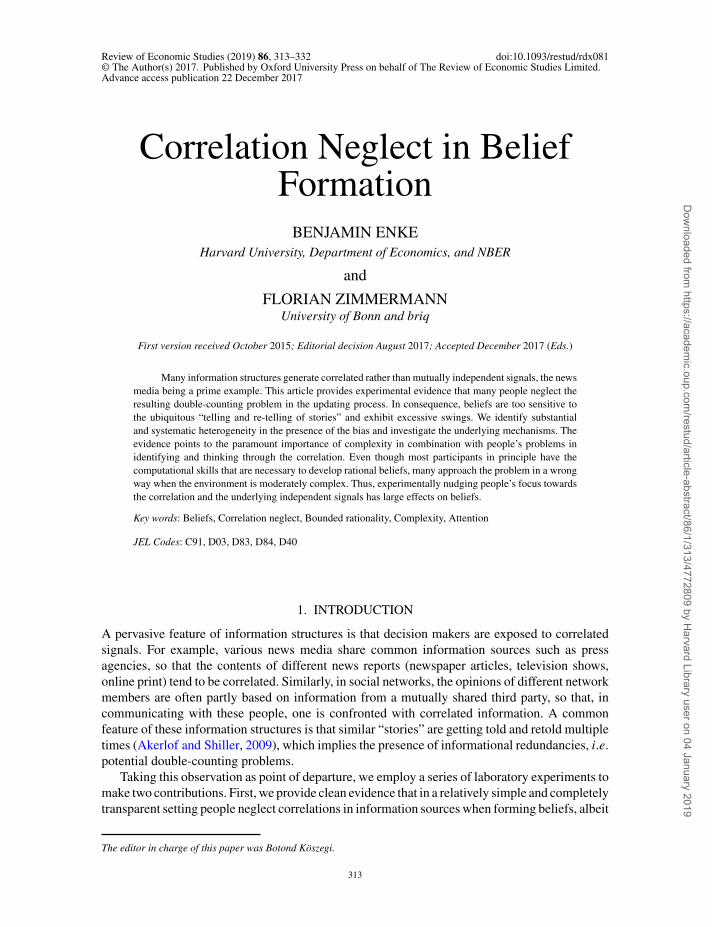
[11:01 12/12/2018 OP-REST170108.tex] RESTUD: The Review of Economic Studies Page: 313 313–332
Review of Economic Studies (2019) 86, 313–332 doi:10.1093/restud/rdx081© The Author(s) 2017. Published by Oxford University Press on behalf of The Review of Economic Studies Limited.Advance access publication 22 December 2017
Correlation Neglect in BeliefFormation
BENJAMIN ENKEHarvard University, Department of Economics, and NBER
and
FLORIAN ZIMMERMANNUniversity of Bonn and briq
First version received October 2015; Editorial decision August 2017; Accepted December 2017 (Eds.)
Many information structures generate correlated rather than mutually independent signals, the newsmedia being a prime example. This article provides experimental evidence that many people neglect theresulting double-counting problem in the updating process. In consequence, beliefs are too sensitive tothe ubiquitous “telling and re-telling of stories” and exhibit excessive swings. We identify substantialand systematic heterogeneity in the presence of the bias and investigate the underlying mechanisms. Theevidence points to the paramount importance of complexity in combination with people’s problems inidentifying and thinking through the correlation. Even though most participants in principle have thecomputational skills that are necessary to develop rational beliefs, many approach the problem in a wrongway when the environment is moderately complex. Thus, experimentally nudging people’s focus towardsthe correlation and the underlying independent signals has large effects on beliefs.
Key words: Beliefs, Correlation neglect, Bounded rationality, Complexity, Attention
JEL Codes: C91, D03, D83, D84, D40
1. INTRODUCTION
A pervasive feature of information structures is that decision makers are exposed to correlatedsignals. For example, various news media share common information sources such as pressagencies, so that the contents of different news reports (newspaper articles, television shows,online print) tend to be correlated. Similarly, in social networks, the opinions of different networkmembers are often partly based on information from a mutually shared third party, so that, incommunicating with these people, one is confronted with correlated information. A commonfeature of these information structures is that similar “stories” are getting told and retold multipletimes (Akerlof and Shiller, 2009), which implies the presence of informational redundancies, i.e.potential double-counting problems.
Taking this observation as point of departure, we employ a series of laboratory experiments tomake two contributions. First, we provide clean evidence that in a relatively simple and completelytransparent setting people neglect correlations in information sources when forming beliefs, albeit
The editor in charge of this paper was Botond Köszegi.
313
Dow
nloaded from https://academ
ic.oup.com/restud/article-abstract/86/1/313/4772809 by H
arvard Library user on 04 January 2019
[11:01 12/12/2018 OP-REST170108.tex] RESTUD: The Review of Economic Studies Page: 314 313–332
314 REVIEW OF ECONOMIC STUDIES
with a strong heterogeneity at the individual level.1 As a consequence, just like recent modelsof boundedly rational social learning predict, people’s beliefs are excessively sensitive to well-connected information sources and hence follow an overshooting pattern. Secondly, we develop aseries of treatment variations to uncover that people do in principle possess the mathematical andcomputational skills that are necessary to process correlated information in our setting. However,when the informational environment is sufficiently complex, many people exhibit conceptualproblems in identifying and thinking through the correlation in the first place. As a consequence,exogenously shifting subjects’ focus towards the correlation and the underlying independentsignals has large effects on beliefs.
In the baseline experiment, subjects need to estimate an ex ante unknown state of the worldand are paid for accuracy. The key idea of our experimental design is to construct two sets ofinformation (one with and one without a known and simple correlation) that are identical in termsof informational content, and should thus result in the same belief. In a between-subjects design,one group of subjects receives correlated, the other uncorrelated information. The entire signal-generating process is computerized, and subjects know the precise process generating the data. Inthis setup, computers A through D generate four unbiased i.i.d signals about the state of the world.In the Uncorrelated condition, subjects observe these four independent signals. In the Correlatedtreatment, participants also receive four messages, which consist of the signal of computer Aas well as the average of the signals of A and B, of A and C, as well as of A and D. Thus, thesignal of the common source A is partially recurring in multiple messages, implying a potentialdouble-counting problem. Viewed through the lense of our motivating examples, this setup couldreflect a news reader who has access to different news sources, all of which partially rely onthe same press agency. Similarly, the setup mirrors a network context in which an individualcommunicates with various friends, all of which have previously communicated with a mutuallyshared acquaintance.
In this setting, the correlation structure has a particularly simple form because the signal ofcomputer A is known, so that subjects only need to invert averages to back out the underlyingindependent signals. Despite extensive instructions and control questions, our results indicatethat, on average, subjects treat correlated information partially as independent and hence double-count the signal of the common source A. Thus, while beliefs remain statistically unbiased ex ante,they are highly sensitive to the well-connected information source and exhibit excessive swings,an effect that is sizeable, significant, and causes lower payoffs. In light of the strong averagetendency to neglect correlations, we proceed by specifying the precise and possibly heterogeneousupdating rules subjects employ. We find that beliefs follow a roughly bimodal distribution: mostpeople are either fully sophisticated or very naïve about the correlation, which points to thepresence of two fundamentally different belief formation types. In particular, those subjects thatdo not successfully process correlations form beliefs by following a particular simple heuristic ofaveraging the correlated messages. The strong type heterogeneity is significantly associated withcognitive skills. At the same time, the relationship between subjects’ response times (a commonlyused proxy for cognitive effort; Rubinstein, 2007, 2016) and beliefs is weak at best, both within themain treatment condition and when we exogenously increase response times through a moderateincrease in financial incentives.
The second part of the article investigates the mechanisms underlying the observed neglectof correlations. We start our corresponding quest by examining the role of complexity, which haspreviously been shown to affect updating mistakes and thus serves as a natural starting point forour analysis (e.g. Charness and Levin, 2009). We exogenously manipulate the complexity of the
1. Throughout the article, a correlation is implicitly understood as being conditional on a state realization. Also,we only refer to positive correlations.
Dow
nloaded from https://academ
ic.oup.com/restud/article-abstract/86/1/313/4772809 by H
arvard Library user on 04 January 2019
[11:01 12/12/2018 OP-REST170108.tex] RESTUD: The Review of Economic Studies Page: 315 313–332
ENKE & ZIMMERMANN CORRELATION NEGLECT IN BELIEF FORMATION 315
updating problem by reducing the number of signals and resulting messages, so that subjects onlyneed to process two pieces of information. In this low complexity version of our experiments,correlation neglect essentially disappears.
While this finding highlights that correlation neglect is not universal, but rather a functionof the environment, it leaves open the precise mechanism through which complexity generatesneglect. To make progress, we conceptualize belief formation as three steps of reasoning, all ofwhich are potentially affected by our complexity manipulation: first, people need to notice thedouble-counting problem inherent in our experimental environment, i.e. they need to realize thattaking the correlated messages at face value is suboptimal; secondly, subjects need to understandthat this double-counting problem can be overcome by backing out the underlying independentsignals; thirdly, they need to be willing and able to execute the mathematical computations thatare necessary to develop unbiased beliefs. Crucially, in this framework, the first two steps referto conceptual problems that people might have in processing correlations, while the last step isabout mathematical or computational problems.
Given that conceptual and mathematical limitations likely have different implications for bothpolicy and potential formalizations of correlation neglect, we develop two treatment variationsto separate these two broad mechanisms. First, building on the low complexity environment,we elucidate the role of the size of the information structure. We design a treatment in whichwe fix the mathematical steps that are required to solve the problem, but manipulate how manymessages subjects observe based on the independent signals. The corresponding results establishthat a “larger” information structure causes significantly more correlation neglect even when therequired mathematical operations are unaffected. Thus, the complexity of information structuresseems to affect belief updating (also) through its effect on people’s ability to notice and thinkthrough the correlation, which rationalizes the observed difference in correlation neglect betweenthe baseline and low complexity experiments.
To lend further credence to the idea that subjects struggle predominantly with the conceptualdifficulty of detecting and thinking through the correlation, and to provide evidence on howsubjects could be debiased, we design an additional treatment variation. Here, the experimentalprocedures exogenously draw people’s focus towards the mechanics that generate the correlation,but again hold fixed the mathematical steps that are required to be rational. In a within-subjects treatment, participants are confronted with both the correlated and the uncorrelatedinformation structure from the baseline treatments, which is meant to induce subjects to focuson the key difference between the two environments. The results show that the vast majority ofsubjects states rational beliefs in this condition. Thus, taken together, two conceptually distincttreatment variations show that correlation neglect can be meaningfully affected by features of theenvironment that are independent of purely math-based explanations. This set of results pointsto the importance of people’s problems in noticing and thinking through the correlation in thefirst place, and speaks against the notion that people cannot (or do not want to) engage in thecalculations that are necessary to process relatively simple correlated messages.
This article contributes to the literature on boundedly rational belief formation by identifyingan error in statistical reasoning that is associated with a pervasive feature of real informationstructures such as the news media (see e.g. Charness and Levin, 2009; Charness et al., 2010;Benjamin et al., 2013; Esponda and Vespa, 2014; Hanna et al., 2014; Ngangoue and Weizsäcker,2015; Jin et al., 2016, for recent documentations of bounded rationality in other contexts).Conceptually, our article moves beyond existing work by studying in detail the roles of complexityand focus for biased statistical reasoning.2
2. Brocas et al. (2014) highlight the relevance of attention in strategic settings. Gennaioli and Shleifer (2010),Bordalo et al. (2016), and Schwartzstein (2014) provide models of attention-driven updating errors.
Dow
nloaded from https://academ
ic.oup.com/restud/article-abstract/86/1/313/4772809 by H
arvard Library user on 04 January 2019
[11:01 12/12/2018 OP-REST170108.tex] RESTUD: The Review of Economic Studies Page: 316 313–332
316 REVIEW OF ECONOMIC STUDIES
Our experiments can be interpreted in terms of learning in networks. Eyster and Rabin (2014)develop a model to show that rationality often requires people to anti-imitate others because of theneed to subtract off sources of correlations. In consequence, these authors argue, empirical tests areneeded to separate whether people follow others for rational reasons or due to correlation neglect.We establish correlation neglect (and the resulting excessive “imitation”) in a setup in whichthe signal-generating process is known and simple.3 Our findings hence support the assumptionsunderlying recent theories of inferential naïveté in social interactions (e.g. DeMarzo et al., 2003;Eyster and Rabin, 2010; Golub and Jackson, 2010; Bohren, 2016) as well as bounded rationalitymodels in political economy (Levy and Razin, 2015; Ortoleva and Snowberg, 2015).4
Relatedly, Shiller (2000) and Akerlof and Shiller (2009) have argued that “exuberant” publicopinions or “panics”, driven by the multiple occurrence of similar stories in social networks,may be a driver of aggregate distortions. In Online Appendix F, we report on experiments alongthese lines and show that, in an experimental asset market, the incidence of correlated (and hencepartially recurring) news leads to pronounced and predictable price distortions.
The remainder of the article is organized as follows. In the next section, we present our baselineexperiments. Section 3 investigates the mechanisms underlying correlation neglect. Section 4discusses extensions of our experiments and concludes.
2. EVIDENCE FOR CORRELATION NEGLECT
2.1. Experimental design
An environment in which updating from correlated sources can be studied requires (i) control oversignal precision and correlation; (ii) subjects’ knowledge of the data-generating process; (iii) acontrol condition that serves as benchmark for updating in the absence of correlated information;and (iv) incentivized belief elicitation. Our design accommodates all of these features.
Subjects were asked to estimate an ex ante unknown continuous state of the world μ and werepaid for accuracy. The task was framed as guessing how many items are contained in an imaginarycontainer. In order to keep the experiment as simple as possible, we refrained from inducing priorbeliefs.5 The only information provided to participants consisted of unbiased computer-generatedsignals about the true state. The key idea of the between-subjects design was to construct twosets of signals (one with and one without a known and simple correlation), which are identical interms of their objective informational content. As depicted in Figure 1, subjects in the Correlatedtreatment received correlated and subjects in the Uncorrelated condition uncorrelated informationabout μ.
The computers A–D generated four unbiased i.i.d signals about μ, which were identical acrosstreatments and subjects. Technically, this was implemented by random draws from a truncateddiscretized normal distribution with mean μ and standard deviation σ =μ/2.6 In the Uncorrelatedtreatment (left panel), the intermediaries 1–3, who are fictitious computers themselves, observedthe signals of computers B through D, respectively, and simply transmitted these signals to
3. A literature in cognitive psychology explores how people aggregate potentially correlated opinions in settings inwhich the structure generating the information is left ambiguous to subjects (Budescu and Rantilla, 2000; Budescu and Yu,2007). These papers focus on non-incentivized confidence ratings. Kahneman and Tversky (1973) note that correlatedinformation sources tend to produce consistent signals and may hence lead to an “illusion of validity” (also see Maines,1990, 1996).
4. Section 4 relates our findings to the experimental literature on learning in networks. Spiegler (2016) usesBayesian networks to provide a formal framework for boundedly rational belief formation.
5. Online Appendix D shows that inducing prior beliefs does not affect our findings.6. Truncation was at μ±2σ =μ±μ in order to avoid negative signals.
Dow
nloaded from https://academ
ic.oup.com/restud/article-abstract/86/1/313/4772809 by H
arvard Library user on 04 January 2019
[11:01 12/12/2018 OP-REST170108.tex] RESTUD: The Review of Economic Studies Page: 317 313–332
ENKE & ZIMMERMANN CORRELATION NEGLECT IN BELIEF FORMATION 317
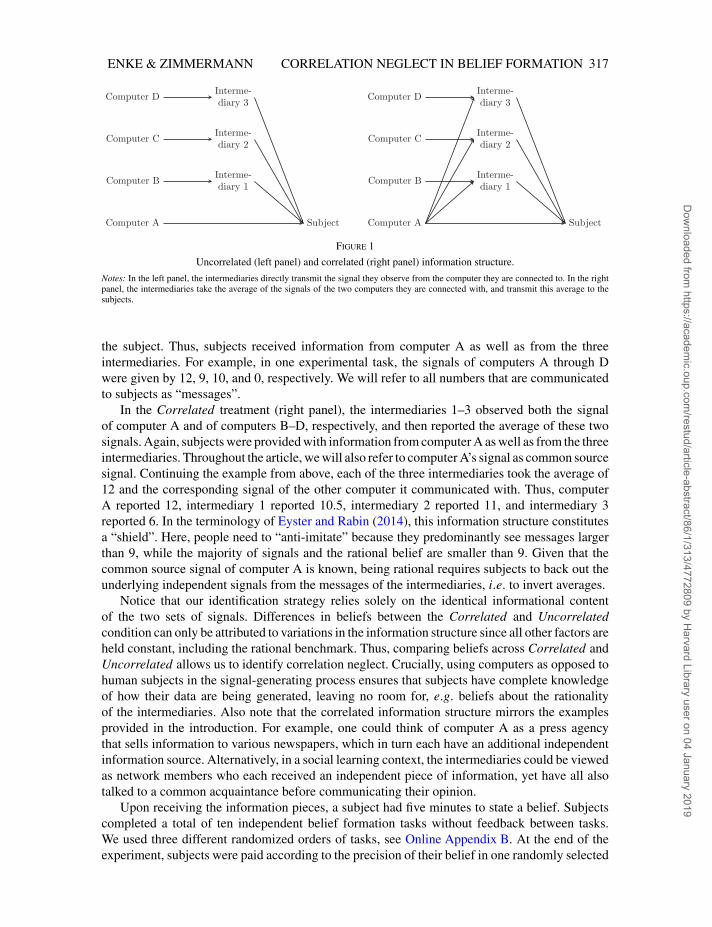
Figure 1
Uncorrelated (left panel) and correlated (right panel) information structure.
Notes: In the left panel, the intermediaries directly transmit the signal they observe from the computer they are connected to. In the rightpanel, the intermediaries take the average of the signals of the two computers they are connected with, and transmit this average to thesubjects.
the subject. Thus, subjects received information from computer A as well as from the threeintermediaries. For example, in one experimental task, the signals of computers A through Dwere given by 12, 9, 10, and 0, respectively. We will refer to all numbers that are communicatedto subjects as “messages”.
In the Correlated treatment (right panel), the intermediaries 1–3 observed both the signalof computer A and of computers B–D, respectively, and then reported the average of these twosignals. Again, subjects were provided with information from computer A as well as from the threeintermediaries. Throughout the article, we will also refer to computer A’s signal as common sourcesignal. Continuing the example from above, each of the three intermediaries took the average of12 and the corresponding signal of the other computer it communicated with. Thus, computerA reported 12, intermediary 1 reported 10.5, intermediary 2 reported 11, and intermediary 3reported 6. In the terminology of Eyster and Rabin (2014), this information structure constitutesa “shield”. Here, people need to “anti-imitate” because they predominantly see messages largerthan 9, while the majority of signals and the rational belief are smaller than 9. Given that thecommon source signal of computer A is known, being rational requires subjects to back out theunderlying independent signals from the messages of the intermediaries, i.e. to invert averages.
Notice that our identification strategy relies solely on the identical informational contentof the two sets of signals. Differences in beliefs between the Correlated and Uncorrelatedcondition can only be attributed to variations in the information structure since all other factors areheld constant, including the rational benchmark. Thus, comparing beliefs across Correlated andUncorrelated allows us to identify correlation neglect. Crucially, using computers as opposed tohuman subjects in the signal-generating process ensures that subjects have complete knowledgeof how their data are being generated, leaving no room for, e.g. beliefs about the rationalityof the intermediaries. Also note that the correlated information structure mirrors the examplesprovided in the introduction. For example, one could think of computer A as a press agencythat sells information to various newspapers, which in turn each have an additional independentinformation source. Alternatively, in a social learning context, the intermediaries could be viewedas network members who each received an independent piece of information, yet have all alsotalked to a common acquaintance before communicating their opinion.
Upon receiving the information pieces, a subject had five minutes to state a belief. Subjectscompleted a total of ten independent belief formation tasks without feedback between tasks.We used three different randomized orders of tasks, see Online Appendix B. At the end of theexperiment, subjects were paid according to the precision of their belief in one randomly selected
Dow
nloaded from https://academ
ic.oup.com/restud/article-abstract/86/1/313/4772809 by H
arvard Library user on 04 January 2019
[11:01 12/12/2018 OP-REST170108.tex] RESTUD: The Review of Economic Studies Page: 318 313–332
318 REVIEW OF ECONOMIC STUDIES
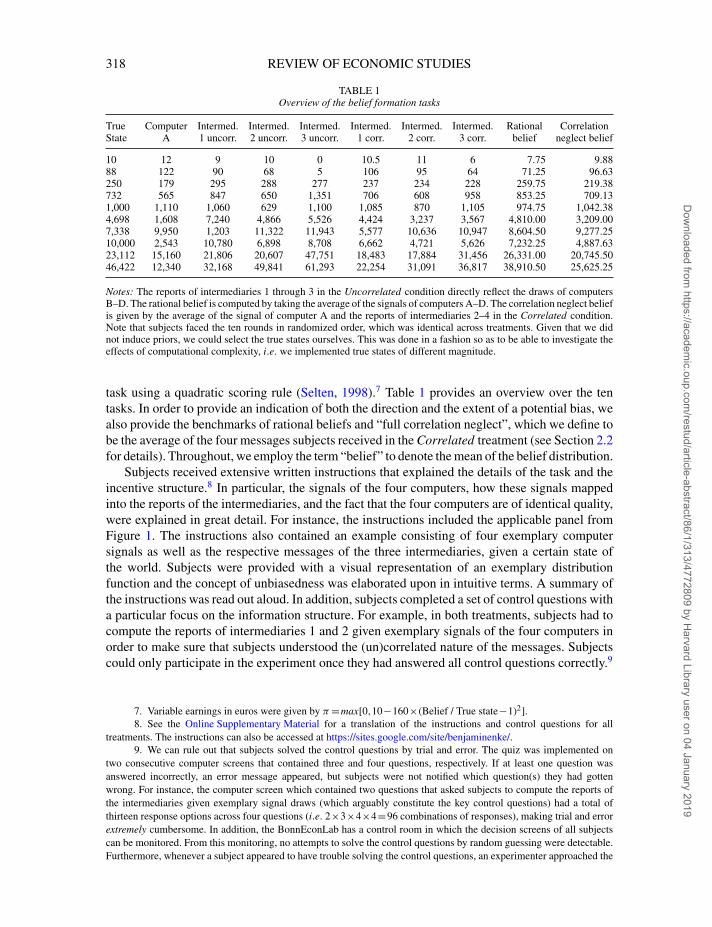
TABLE 1Overview of the belief formation tasks
True Computer Intermed. Intermed. Intermed. Intermed. Intermed. Intermed. Rational CorrelationState A 1 uncorr. 2 uncorr. 3 uncorr. 1 corr. 2 corr. 3 corr. belief neglect belief
10 12 9 10 0 10.5 11 6 7.75 9.8888 122 90 68 5 106 95 64 71.25 96.63250 179 295 288 277 237 234 228 259.75 219.38732 565 847 650 1,351 706 608 958 853.25 709.131,000 1,110 1,060 629 1,100 1,085 870 1,105 974.75 1,042.384,698 1,608 7,240 4,866 5,526 4,424 3,237 3,567 4,810.00 3,209.007,338 9,950 1,203 11,322 11,943 5,577 10,636 10,947 8,604.50 9,277.2510,000 2,543 10,780 6,898 8,708 6,662 4,721 5,626 7,232.25 4,887.6323,112 15,160 21,806 20,607 47,751 18,483 17,884 31,456 26,331.00 20,745.5046,422 12,340 32,168 49,841 61,293 22,254 31,091 36,817 38,910.50 25,625.25
Notes: The reports of intermediaries 1 through 3 in the Uncorrelated condition directly reflect the draws of computersB–D. The rational belief is computed by taking the average of the signals of computers A–D. The correlation neglect beliefis given by the average of the signal of computer A and the reports of intermediaries 2–4 in the Correlated condition.Note that subjects faced the ten rounds in randomized order, which was identical across treatments. Given that we didnot induce priors, we could select the true states ourselves. This was done in a fashion so as to be able to investigate theeffects of computational complexity, i.e. we implemented true states of different magnitude.
task using a quadratic scoring rule (Selten, 1998).7 Table 1 provides an overview over the tentasks. In order to provide an indication of both the direction and the extent of a potential bias, wealso provide the benchmarks of rational beliefs and “full correlation neglect”, which we define tobe the average of the four messages subjects received in the Correlated treatment (see Section 2.2for details). Throughout, we employ the term “belief” to denote the mean of the belief distribution.
Subjects received extensive written instructions that explained the details of the task and theincentive structure.8 In particular, the signals of the four computers, how these signals mappedinto the reports of the intermediaries, and the fact that the four computers are of identical quality,were explained in great detail. For instance, the instructions included the applicable panel fromFigure 1. The instructions also contained an example consisting of four exemplary computersignals as well as the respective messages of the three intermediaries, given a certain state ofthe world. Subjects were provided with a visual representation of an exemplary distributionfunction and the concept of unbiasedness was elaborated upon in intuitive terms. A summary ofthe instructions was read out aloud. In addition, subjects completed a set of control questions witha particular focus on the information structure. For example, in both treatments, subjects had tocompute the reports of intermediaries 1 and 2 given exemplary signals of the four computers inorder to make sure that subjects understood the (un)correlated nature of the messages. Subjectscould only participate in the experiment once they had answered all control questions correctly.9
7. Variable earnings in euros were given by π =max[0,10−160×(Belief / True state−1)2].8. See the Online Supplementary Material for a translation of the instructions and control questions for all
treatments. The instructions can also be accessed at https://sites.google.com/site/benjaminenke/.9. We can rule out that subjects solved the control questions by trial and error. The quiz was implemented on
two consecutive computer screens that contained three and four questions, respectively. If at least one question wasanswered incorrectly, an error message appeared, but subjects were not notified which question(s) they had gottenwrong. For instance, the computer screen which contained two questions that asked subjects to compute the reports ofthe intermediaries given exemplary signal draws (which arguably constitute the key control questions) had a total ofthirteen response options across four questions (i.e. 2×3×4×4=96 combinations of responses), making trial and errorextremely cumbersome. In addition, the BonnEconLab has a control room in which the decision screens of all subjectscan be monitored. From this monitoring, no attempts to solve the control questions by random guessing were detectable.Furthermore, whenever a subject appeared to have trouble solving the control questions, an experimenter approached the
Dow
nloaded from https://academ
ic.oup.com/restud/article-abstract/86/1/313/4772809 by H
arvard Library user on 04 January 2019
[11:01 12/12/2018 OP-REST170108.tex] RESTUD: The Review of Economic Studies Page: 319 313–332
ENKE & ZIMMERMANN CORRELATION NEGLECT IN BELIEF FORMATION 319
At the end of the experiment, we conducted a questionnaire in which we collected informationon sociodemographics. To capture dimensions of cognitive ability, we asked subjects for their highschool GPA (German “Abitur”) and had them solve ten rather difficult IQ test Raven matrices.
Apart from the two baseline Correlated and Uncorrelated treatments, we implemented anumber of straightforward extensions and robustness checks. (i) First, we ran high stakes versionsof the two baseline treatments. These experiments featured the same procedures, except that thestake size was tripled.10 (ii) Secondly, we re-ran the Correlated treatment using a slightly differentprocedure: in treatment Reading time, subjects were free to start the control questions and theexperiment at any point in time after we had distributed the paper-based instructions, whichallows us to measure the time subjects take to read and engage with the instructions beforecompleting the tasks. (iii) Thirdly, we conducted two robustness treatments in which we slightlyaltered certain aspects of the design, including inducing a prior belief (see Online Appendix Dfor details). Online Appendix A presents an overview of all treatments that are part of this study,including extensions and further robustness checks.
2.2. Hypothesis
In the information structure described above, the computers generated four i.i.d signals of the formsh ∼N (μ,(μ/2)2) (truncated at (0,2μ)) for h∈{1,...,4}. In the Correlated condition, subjectsobserved messages s1 and sh = (s1 +sh)/2 for h∈{2,3,4}. When prompted to estimate μ, arational decision maker would extract the underlying independent signals from the messages sh
and compute the mean rational belief as bB =∑4h=1sh/4, which by design also equals the rational
belief in Uncorrelated.11
Now suppose that the decision maker suffers from correlation neglect, i.e. he does not fully takeinto account the extent to which sh reflects s1, but rather treats sh (to some extent) as independent.Call such a decision maker naïve and let his degree of naïveté be parameterized by χ ∈[0,1] suchthat χ =1 implies full correlation neglect. A naïve agent extracts sh from sh according to the rule
sh =χ sh +(1−χ )sh =sh + 1
2χ (s1 −sh) (1)
where sh for h∈{2,3,4} denotes the agent’s (possibly biased) inference of sh. He thus forms meanbeliefs according to
bCN =s1 +
3∑h=1
sh
4= s+ 3
8χ (s1 − s−1) (2)
where s= (∑4
h=1sh)/4 and s−1 = (∑4
h=2sh)/3. Thus, a (perhaps partially) naïve belief is givenby the rational belief s plus a belief bias component which depends on the degree of naïveté χ
and the magnitude of the common source signal relative to the other signals.
subject, clarified open questions, and (very rarely) excluded the subject if they did not show an adequate understandingof the task.
10. Variable earnings in euros were given by π =max[0,30−480×(Belief / True state−1)2].11. For simplicity, when computing the rational belief, we ignore the truncation in the signal distribution and
assume that subjects hold vague priors. Note that the quantitative errors resulting from this are likely to be very smallin magnitude. Given the information provided to subjects, potential priors are very likely to be weak. Also, the tailsoutside the truncation are fairly thin. Moreover, our definition of the rational belief conforms with observed behaviourin the Uncorrelated treatment, where subjects tended to merely take the average of the four signals. Finally, and mostimportantly, regardless of the precise definition of the rational benchmark, beliefs should be identical across treatments.
Dow
nloaded from https://academ
ic.oup.com/restud/article-abstract/86/1/313/4772809 by H
arvard Library user on 04 January 2019
[11:01 12/12/2018 OP-REST170108.tex] RESTUD: The Review of Economic Studies Page: 320 313–332
320 REVIEW OF ECONOMIC STUDIES
Hypothesis. Assuming that χ >0, beliefs in the Correlated treatment exhibit an overshootingpattern. Given a high common source signal, i.e. s1 > s−1, beliefs in the Correlated treatmentare biased upward compared to the Uncorrelated treatment. Conversely, if s1 < s−1, beliefs in theCorrelated condition are biased downward.
Intuitively, by partially neglecting the redundancies among the signals, the decision makerdouble counts the first signal, so that beliefs are biased in the corresponding direction. At thesame time, note from equation (2) that the beliefs of a naïve agent remain statistically unbiased:since the first signal is unbiased, any double counting leads to a zero expected error. The upshotof this is that naïve agents are correct on average, yet exhibit excessive swings in their beliefs.
2.3. Procedural details
The experiments were conducted at the BonnEconLab of the University of Bonn. Subjects weremostly students from the University of Bonn and were recruited using the online recruitmentsystem by Greiner (2004). No subject participated in more than one session. The experimentwas run using the experimental software z-Tree (Fischbacher, 2007). A total of 234 subjectsparticipated in the individual belief formation treatments, 94 in the baseline, 94 in the highstakes, and 46 in the Reading time treatments. Within the baseline and high stake treatments, theCorrelated and Uncorrelated condition were randomized within session. Sessions lasted about1.5 hours and average earnings equalled E11.60 in the baseline treatments (≈ USD 15 at thetime) andE21.90 in the high stakes treatments (≈ USD 28). In all treatments, payments includeda E6 show-up fee.
2.4. Results
2.4.1. Beliefs across treatments.
Result 1. In all but one belief formation task, beliefs differ significantly between treatments inthe direction predicted by correlation neglect. This pattern is unaffected by the tripling of thestake size.
As we will establish formally below, beliefs are strikingly similar between the baseline and thehigh stakes treatments. Given the otherwise identical procedures, we hence pool the data acrossstake size conditions in all analyses unless noted otherwise.
Table 2 provides summary statistics for all tasks and reveals that in nine out of ten cases dobeliefs in Correlated significantly differ from those in the Uncorrelated treatment. The bias isvery stable across tasks and does not seem to depend on the magnitude of the true state.12 Asa consequence of these biased beliefs, subjects in the baseline condition earned roughly E2.70less than those in the Uncorrelated group, which amounts to almost 50% of subjects’ averagevariable earnings. The earnings difference is significant (p=0.0025, Wilcoxon ranksum test). Inthe high stakes treatments, the earnings difference is E5.40 (p=0.0887).
Our experiments provide no feedback and hence little scope for learning. Indeed, in the data,subjects do not seem to learn to deal with correlations over time (see Online Appendix C.4). It isdoubtful for at least two reasons that subjects would learn within the course of ten experimentalperiods even in the presence of feedback. First—given the small sample of four signals—occasionally the “naïve” (correlation neglect) belief is closer to the true state than the rational
12. Our two robustness treatments replicate these findings, see Online Appendix D for details.
Dow
nloaded from https://academ
ic.oup.com/restud/article-abstract/86/1/313/4772809 by H
arvard Library user on 04 January 2019
[11:01 12/12/2018 OP-REST170108.tex] RESTUD: The Review of Economic Studies Page: 321 313–332
ENKE & ZIMMERMANN CORRELATION NEGLECT IN BELIEF FORMATION 321
TABLE 2Correlation neglect by belief formation task
True Rational Correlation Median belief Median belief Ranksum teststate belief neglect belief Uncorr. treatment Correlated treatment (p-value)
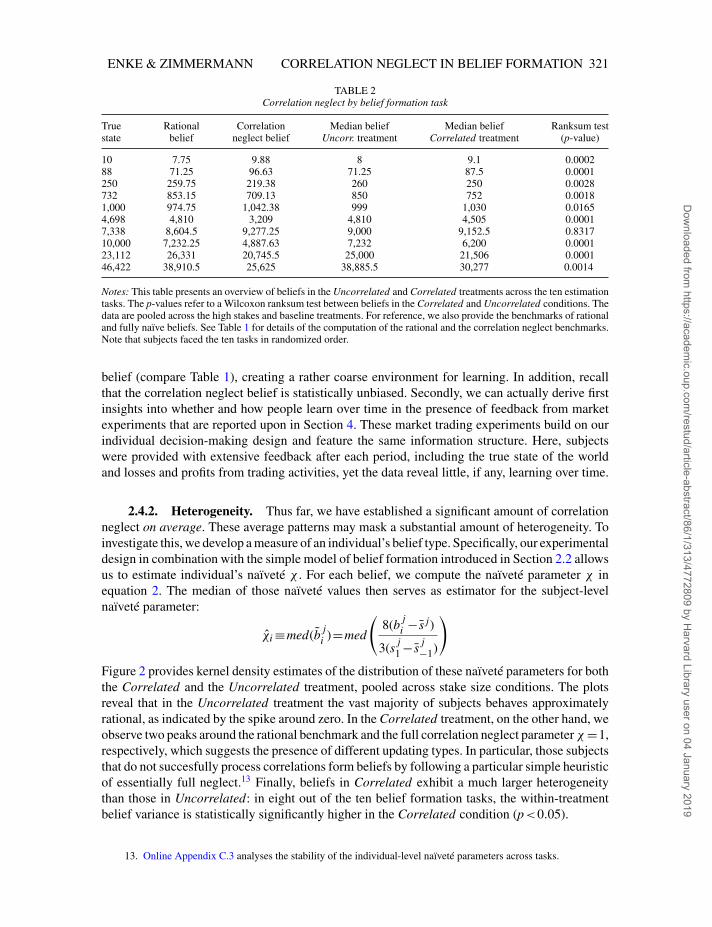
10 7.75 9.88 8 9.1 0.000288 71.25 96.63 71.25 87.5 0.0001250 259.75 219.38 260 250 0.0028732 853.15 709.13 850 752 0.00181,000 974.75 1,042.38 999 1,030 0.01654,698 4,810 3,209 4,810 4,505 0.00017,338 8,604.5 9,277.25 9,000 9,152.5 0.831710,000 7,232.25 4,887.63 7,232 6,200 0.000123,112 26,331 20,745.5 25,000 21,506 0.000146,422 38,910.5 25,625 38,885.5 30,277 0.0014
Notes: This table presents an overview of beliefs in the Uncorrelated and Correlated treatments across the ten estimationtasks. The p-values refer to a Wilcoxon ranksum test between beliefs in the Correlated and Uncorrelated conditions. Thedata are pooled across the high stakes and baseline treatments. For reference, we also provide the benchmarks of rationaland fully naïve beliefs. See Table 1 for details of the computation of the rational and the correlation neglect benchmarks.Note that subjects faced the ten tasks in randomized order.
belief (compare Table 1), creating a rather coarse environment for learning. In addition, recallthat the correlation neglect belief is statistically unbiased. Secondly, we can actually derive firstinsights into whether and how people learn over time in the presence of feedback from marketexperiments that are reported upon in Section 4. These market trading experiments build on ourindividual decision-making design and feature the same information structure. Here, subjectswere provided with extensive feedback after each period, including the true state of the worldand losses and profits from trading activities, yet the data reveal little, if any, learning over time.
2.4.2. Heterogeneity. Thus far, we have established a significant amount of correlationneglect on average. These average patterns may mask a substantial amount of heterogeneity. Toinvestigate this, we develop a measure of an individual’s belief type. Specifically, our experimentaldesign in combination with the simple model of belief formation introduced in Section 2.2 allowsus to estimate individual’s naïveté χ . For each belief, we compute the naïveté parameter χ inequation 2. The median of those naïveté values then serves as estimator for the subject-levelnaïveté parameter:
χi ≡med(b ji )=med
(8(b j
i − s j)
3(s j1 − s j
−1)
)
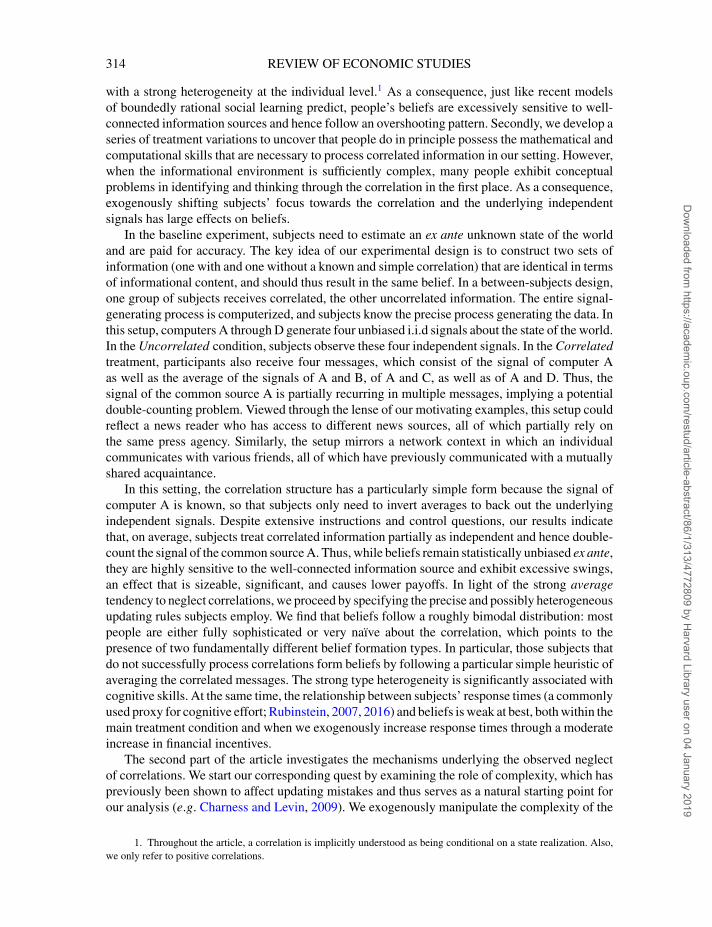
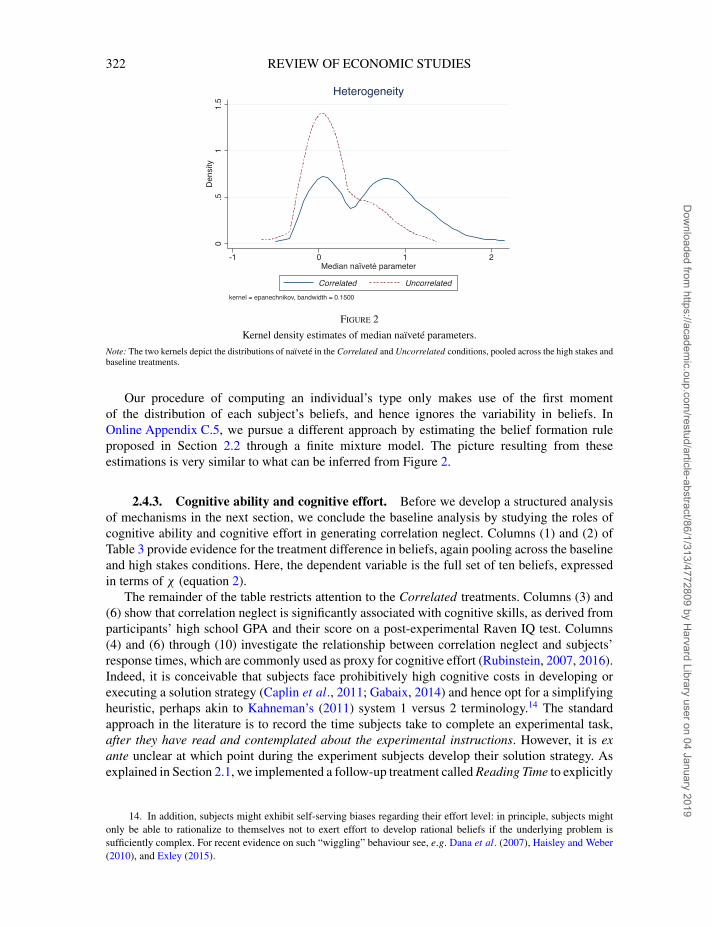
Figure 2 provides kernel density estimates of the distribution of these naïveté parameters for boththe Correlated and the Uncorrelated treatment, pooled across stake size conditions. The plotsreveal that in the Uncorrelated treatment the vast majority of subjects behaves approximatelyrational, as indicated by the spike around zero. In the Correlated treatment, on the other hand, weobserve two peaks around the rational benchmark and the full correlation neglect parameter χ =1,respectively, which suggests the presence of different updating types. In particular, those subjectsthat do not succesfully process correlations form beliefs by following a particular simple heuristicof essentially full neglect.13 Finally, beliefs in Correlated exhibit a much larger heterogeneitythan those in Uncorrelated: in eight out of the ten belief formation tasks, the within-treatmentbelief variance is statistically significantly higher in the Correlated condition (p<0.05).
13. Online Appendix C.3 analyses the stability of the individual-level naïveté parameters across tasks.
Dow
nloaded from https://academ
ic.oup.com/restud/article-abstract/86/1/313/4772809 by H
arvard Library user on 04 January 2019
[11:01 12/12/2018 OP-REST170108.tex] RESTUD: The Review of Economic Studies Page: 322 313–332
322 REVIEW OF ECONOMIC STUDIES
Figure 2
Kernel density estimates of median naïveté parameters.
Note: The two kernels depict the distributions of naïveté in the Correlated and Uncorrelated conditions, pooled across the high stakes andbaseline treatments.
Our procedure of computing an individual’s type only makes use of the first momentof the distribution of each subject’s beliefs, and hence ignores the variability in beliefs. InOnline Appendix C.5, we pursue a different approach by estimating the belief formation ruleproposed in Section 2.2 through a finite mixture model. The picture resulting from theseestimations is very similar to what can be inferred from Figure 2.
2.4.3. Cognitive ability and cognitive effort. Before we develop a structured analysisof mechanisms in the next section, we conclude the baseline analysis by studying the roles ofcognitive ability and cognitive effort in generating correlation neglect. Columns (1) and (2) ofTable 3 provide evidence for the treatment difference in beliefs, again pooling across the baselineand high stakes conditions. Here, the dependent variable is the full set of ten beliefs, expressedin terms of χ (equation 2).
The remainder of the table restricts attention to the Correlated treatments. Columns (3) and(6) show that correlation neglect is significantly associated with cognitive skills, as derived fromparticipants’ high school GPA and their score on a post-experimental Raven IQ test. Columns(4) and (6) through (10) investigate the relationship between correlation neglect and subjects’response times, which are commonly used as proxy for cognitive effort (Rubinstein, 2007, 2016).Indeed, it is conceivable that subjects face prohibitively high cognitive costs in developing orexecuting a solution strategy (Caplin et al., 2011; Gabaix, 2014) and hence opt for a simplifyingheuristic, perhaps akin to Kahneman’s (2011) system 1 versus 2 terminology.14 The standardapproach in the literature is to record the time subjects take to complete an experimental task,after they have read and contemplated about the experimental instructions. However, it is exante unclear at which point during the experiment subjects develop their solution strategy. Asexplained in Section 2.1, we implemented a follow-up treatment called Reading Time to explicitly
14. In addition, subjects might exhibit self-serving biases regarding their effort level: in principle, subjects mightonly be able to rationalize to themselves not to exert effort to develop rational beliefs if the underlying problem issufficiently complex. For recent evidence on such “wiggling” behaviour see, e.g. Dana et al. (2007), Haisley and Weber(2010), and Exley (2015).
Dow
nloaded from https://academ
ic.oup.com/restud/article-abstract/86/1/313/4772809 by H
arvard Library user on 04 January 2019
[11:01 12/12/2018 OP-REST170108.tex] RESTUD: The Review of Economic Studies Page: 323 313–332
ENKE & ZIMMERMANN CORRELATION NEGLECT IN BELIEF FORMATION 323
TABLE 3Heterogeneity in correlation neglect
Dependent variable:
Naiveté χ Response time
Full sample Correlated treatments
(1) (2) (3) (4) (5) (6) (7) (8) (9) (10)
0 if Uncorrelated, 1 if Correlated 0.38∗∗∗ 0.35∗∗∗(0.06) (0.06)
Cognitive skills −0.15∗∗∗ −0.27∗∗∗ −0.27∗∗∗ 0.20∗∗ 0.24∗(0.03) (0.05) (0.06) (0.10) (0.14)
Response time (in minutes) −0.15∗∗∗ −0.13∗∗∗ −0.10∗(0.04) (0.04) (0.05)
0 if Baseline, 1 if High stakes −0.029 −0.0093 0.35∗ 0.42∗∗(0.10) (0.09) (0.20) (0.19)
Reading time (in minutes) −0.017 −0.0026(0.03) (0.03)
Constant 0.24∗∗∗ 0.31 0.66∗∗∗ 0.85∗∗∗ 0.63∗∗∗ 0.58∗ 0.50 −0.17 1.43∗∗∗ 0.093(0.03) (0.20) (0.05) (0.07) (0.07) (0.35) (0.33) (0.92) (0.13) (1.10)
Additional controls No Yes No No No Yes No Yes No Yes
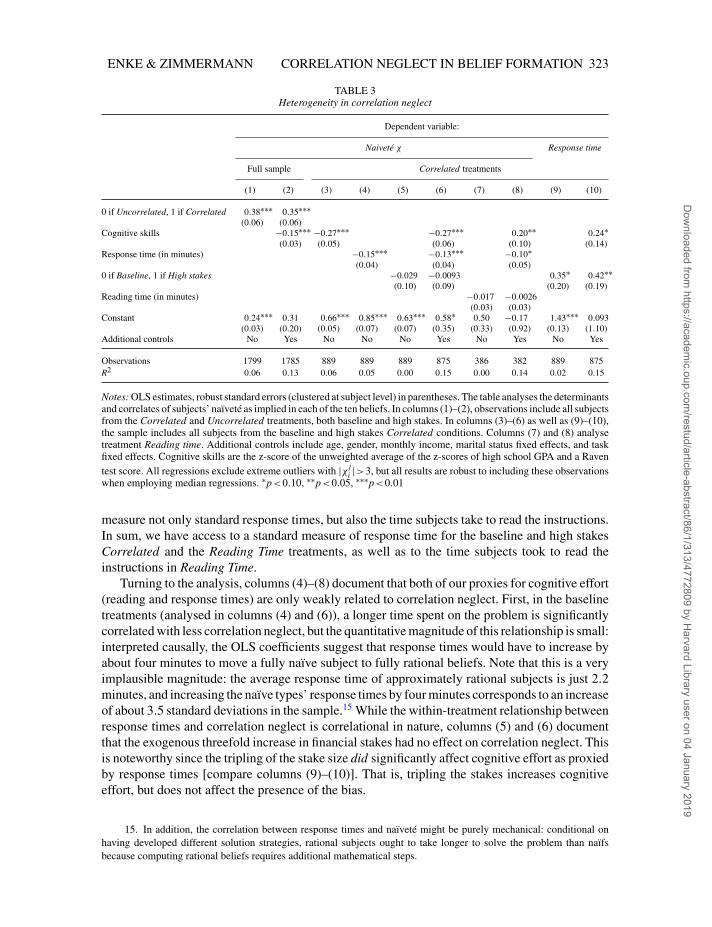
Observations 1799 1785 889 889 889 875 386 382 889 875R2 0.06 0.13 0.06 0.05 0.00 0.15 0.00 0.14 0.02 0.15
Notes: OLS estimates, robust standard errors (clustered at subject level) in parentheses. The table analyses the determinantsand correlates of subjects’ naïveté as implied in each of the ten beliefs. In columns (1)–(2), observations include all subjectsfrom the Correlated and Uncorrelated treatments, both baseline and high stakes. In columns (3)–(6) as well as (9)–(10),the sample includes all subjects from the baseline and high stakes Correlated conditions. Columns (7) and (8) analysetreatment Reading time. Additional controls include age, gender, monthly income, marital status fixed effects, and taskfixed effects. Cognitive skills are the z-score of the unweighted average of the z-scores of high school GPA and a Raventest score. All regressions exclude extreme outliers with |χ j
i |>3, but all results are robust to including these observationswhen employing median regressions. ∗p<0.10, ∗∗p<0.05, ∗∗∗p<0.01
measure not only standard response times, but also the time subjects take to read the instructions.In sum, we have access to a standard measure of response time for the baseline and high stakesCorrelated and the Reading Time treatments, as well as to the time subjects took to read theinstructions in Reading Time.
Turning to the analysis, columns (4)–(8) document that both of our proxies for cognitive effort(reading and response times) are only weakly related to correlation neglect. First, in the baselinetreatments (analysed in columns (4) and (6)), a longer time spent on the problem is significantlycorrelated with less correlation neglect, but the quantitative magnitude of this relationship is small:interpreted causally, the OLS coefficients suggest that response times would have to increase byabout four minutes to move a fully naïve subject to fully rational beliefs. Note that this is a veryimplausible magnitude: the average response time of approximately rational subjects is just 2.2minutes, and increasing the naïve types’ response times by four minutes corresponds to an increaseof about 3.5 standard deviations in the sample.15 While the within-treatment relationship betweenresponse times and correlation neglect is correlational in nature, columns (5) and (6) documentthat the exogenous threefold increase in financial stakes had no effect on correlation neglect. Thisis noteworthy since the tripling of the stake size did significantly affect cognitive effort as proxiedby response times [compare columns (9)–(10)]. That is, tripling the stakes increases cognitiveeffort, but does not affect the presence of the bias.
15. In addition, the correlation between response times and naïveté might be purely mechanical: conditional onhaving developed different solution strategies, rational subjects ought to take longer to solve the problem than naïfsbecause computing rational beliefs requires additional mathematical steps.
Dow
nloaded from https://academ
ic.oup.com/restud/article-abstract/86/1/313/4772809 by H
arvard Library user on 04 January 2019

[11:01 12/12/2018 OP-REST170108.tex] RESTUD: The Review of Economic Studies Page: 324 313–332
324 REVIEW OF ECONOMIC STUDIES
TABLE 4Overview of main treatments
Treatment Description Purpose
Baseline correlated Four Computers, three Intermediaries Establish correlation neglectBaseline uncorrelated Four Computers, three Intermediaries Establish correlation neglectHigh stakes corr. & uncorr.; Reading time Four Computers, three Intermediaries Role of cognitive effortReduced complexity correlated Two Computers, one Intermediary Importance of complexityReduced complexity uncorrelated Two Computers, one Intermediary Importance of complexityMany Stimuli Two Computers, three Intermediaries Importance of size of information structureAlternating Four Computers, three Intermediaries Importance of conceptual aspect
Finally, columns (7) and (8) show that the relationship between correlation neglect andsubjects’ reading times is also weak. Neither in unconditional nor in conditional regressionsis reading time significantly associated with the bias.16
In sum, (i) neglect types do not take less time to read the instructions; (ii) they take onlyslightly less time to work on the specific tasks; and (iii) exogenous increases in effort do nottranslate into better beliefs. While mostly descriptive in nature, these various pieces of evidenceare suggestive that correlation neglect is not driven by laziness.
3. MECHANISMS AND DEBIASING
We investigate the mechanisms behind correlation neglect through a series of treatment variations,as summarized in Table 4.17 We will refer back to this table as we move along. Table 6 in theOnline Appendix provides a complete list of all treatments that are part of this study, includingrobustness checks and extensions.
3.1. The role of complexity
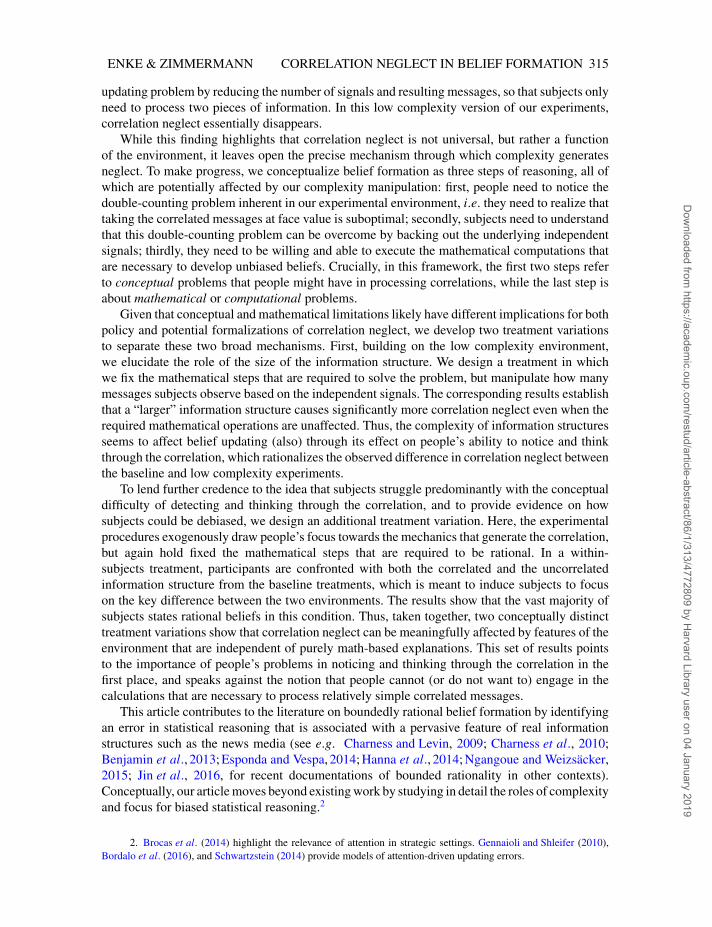
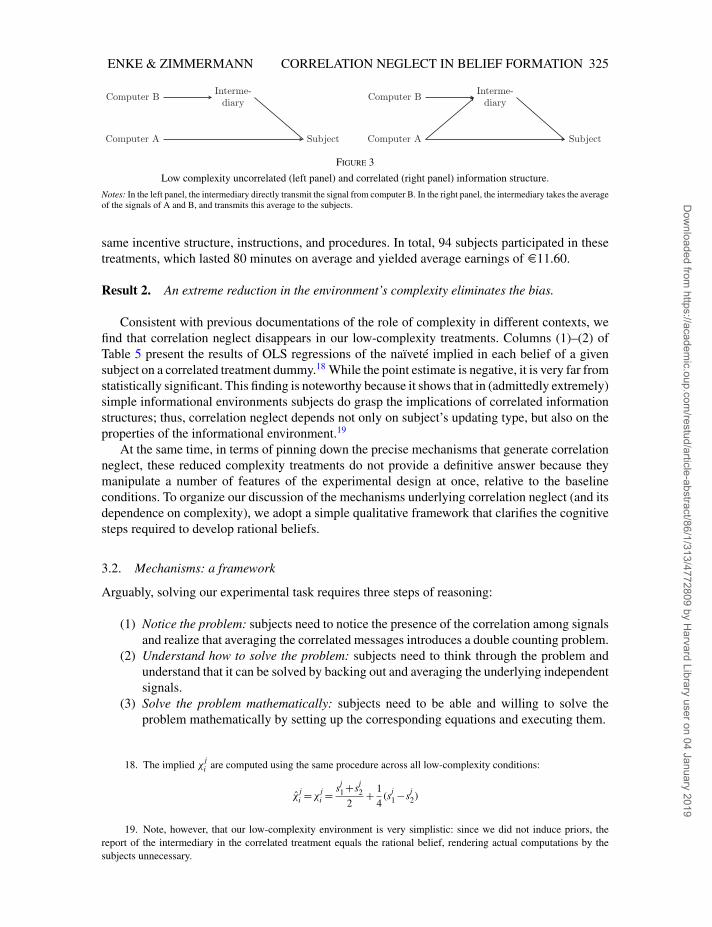
A common theme in the literature is that the degree of complexity of a decision problem exertsa substantial effect on the existence and magnitude of cognitive biases (e.g. Charness and Levin,2009). To examine the effects of complexity on correlation neglect, we implemented a set of low-complexity treatments that were identical to the baseline conditions, except that we reduced thenumber of computers and intermediaries. In these low-complexity conditions, only two computers(A and B) generated unbiased i.i.d signals about the state μ, and only one intermediary was present(see Figure 3). In both treatments, subjects were provided with information from computer A aswell as from the intermediary. In the Low Complexity Uncorrelated treatment, the intermediarydirectly transmitted the signal of computer B. In the Low Complexity Correlated treatment,the intermediary reported the average of the signals of computers A and B. Thus, the type ofcorrelation is identical to the baseline condition and requires the same conceptual understandingof double counting, yet the complexity of the environment is severely reduced (see also Table 4).We implemented the same ten belief formation tasks as in the baseline treatments using the
16. The R2 in most of these regressions is fairly small (similarly so in Table 5), which directly results from the largeamount of heterogeneity in the data, both across subjects and within subjects across experimental tasks.
17. Online Appendix E.2 investigates whether correlation neglect is driven by a simple “face value” heuristic. Thishypothesis posits that people never think through the process generating their information and instead treat each numberas if it were an unmanipulated independent signal realization, regardless of whether the signals are correlated or distortedin other ways. We design two treatments to evaluate the empirical validity of such an extreme heuristic. The results rejecta face value heuristic, and correlation neglect persists even when face value bias makes opposite predictions.
Dow
nloaded from https://academ
ic.oup.com/restud/article-abstract/86/1/313/4772809 by H
arvard Library user on 04 January 2019
[11:01 12/12/2018 OP-REST170108.tex] RESTUD: The Review of Economic Studies Page: 325 313–332
ENKE & ZIMMERMANN CORRELATION NEGLECT IN BELIEF FORMATION 325
Figure 3
Low complexity uncorrelated (left panel) and correlated (right panel) information structure.
Notes: In the left panel, the intermediary directly transmit the signal from computer B. In the right panel, the intermediary takes the averageof the signals of A and B, and transmits this average to the subjects.
same incentive structure, instructions, and procedures. In total, 94 subjects participated in thesetreatments, which lasted 80 minutes on average and yielded average earnings of E11.60.
Result 2. An extreme reduction in the environment’s complexity eliminates the bias.
Consistent with previous documentations of the role of complexity in different contexts, wefind that correlation neglect disappears in our low-complexity treatments. Columns (1)–(2) ofTable 5 present the results of OLS regressions of the naïveté implied in each belief of a givensubject on a correlated treatment dummy.18 While the point estimate is negative, it is very far fromstatistically significant. This finding is noteworthy because it shows that in (admittedly extremely)simple informational environments subjects do grasp the implications of correlated informationstructures; thus, correlation neglect depends not only on subject’s updating type, but also on theproperties of the informational environment.19
At the same time, in terms of pinning down the precise mechanisms that generate correlationneglect, these reduced complexity treatments do not provide a definitive answer because theymanipulate a number of features of the experimental design at once, relative to the baselineconditions. To organize our discussion of the mechanisms underlying correlation neglect (and itsdependence on complexity), we adopt a simple qualitative framework that clarifies the cognitivesteps required to develop rational beliefs.
3.2. Mechanisms: a framework
Arguably, solving our experimental task requires three steps of reasoning:
(1) Notice the problem: subjects need to notice the presence of the correlation among signalsand realize that averaging the correlated messages introduces a double counting problem.
(2) Understand how to solve the problem: subjects need to think through the problem andunderstand that it can be solved by backing out and averaging the underlying independentsignals.
(3) Solve the problem mathematically: subjects need to be able and willing to solve theproblem mathematically by setting up the corresponding equations and executing them.
18. The implied χji are computed using the same procedure across all low-complexity conditions:
χji =χ
ji = sj
1 +sj2
2+ 1
4(sj
1 −sj2)
19. Note, however, that our low-complexity environment is very simplistic: since we did not induce priors, thereport of the intermediary in the correlated treatment equals the rational belief, rendering actual computations by thesubjects unnecessary.
Dow
nloaded from https://academ
ic.oup.com/restud/article-abstract/86/1/313/4772809 by H
arvard Library user on 04 January 2019
[11:01 12/12/2018 OP-REST170108.tex] RESTUD: The Review of Economic Studies Page: 326 313–332
326 REVIEW OF ECONOMIC STUDIES
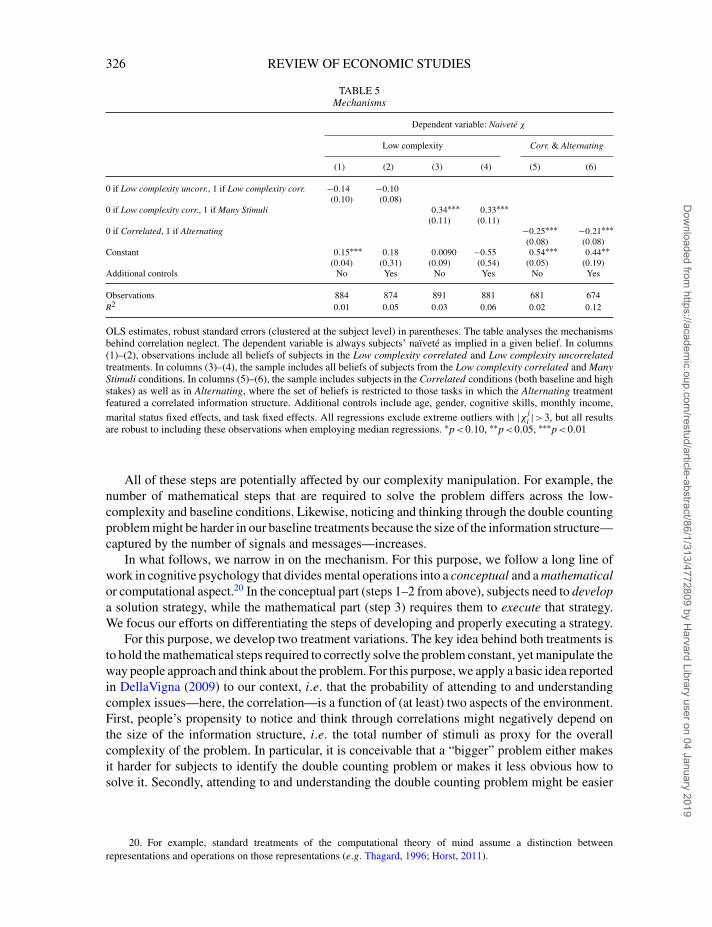
TABLE 5Mechanisms
Dependent variable: Naiveté χ
Low complexity Corr. & Alternating
(1) (2) (3) (4) (5) (6)
0 if Low complexity uncorr., 1 if Low complexity corr. −0.14 −0.10(0.10) (0.08)
0 if Low complexity corr., 1 if Many Stimuli 0.34∗∗∗ 0.33∗∗∗(0.11) (0.11)
0 if Correlated, 1 if Alternating −0.25∗∗∗ −0.21∗∗∗(0.08) (0.08)
Constant 0.15∗∗∗ 0.18 0.0090 −0.55 0.54∗∗∗ 0.44∗∗(0.04) (0.31) (0.09) (0.54) (0.05) (0.19)
Additional controls No Yes No Yes No Yes
Observations 884 874 891 881 681 674R2 0.01 0.05 0.03 0.06 0.02 0.12
OLS estimates, robust standard errors (clustered at the subject level) in parentheses. The table analyses the mechanismsbehind correlation neglect. The dependent variable is always subjects’ naïveté as implied in a given belief. In columns(1)–(2), observations include all beliefs of subjects in the Low complexity correlated and Low complexity uncorrelatedtreatments. In columns (3)–(4), the sample includes all beliefs of subjects from the Low complexity correlated and ManyStimuli conditions. In columns (5)–(6), the sample includes subjects in the Correlated conditions (both baseline and highstakes) as well as in Alternating, where the set of beliefs is restricted to those tasks in which the Alternating treatmentfeatured a correlated information structure. Additional controls include age, gender, cognitive skills, monthly income,marital status fixed effects, and task fixed effects. All regressions exclude extreme outliers with |χ j
i |>3, but all resultsare robust to including these observations when employing median regressions. ∗p<0.10, ∗∗p<0.05, ∗∗∗p<0.01
All of these steps are potentially affected by our complexity manipulation. For example, thenumber of mathematical steps that are required to solve the problem differs across the low-complexity and baseline conditions. Likewise, noticing and thinking through the double countingproblem might be harder in our baseline treatments because the size of the information structure—captured by the number of signals and messages—increases.
In what follows, we narrow in on the mechanism. For this purpose, we follow a long line ofwork in cognitive psychology that divides mental operations into a conceptual and a mathematicalor computational aspect.20 In the conceptual part (steps 1–2 from above), subjects need to developa solution strategy, while the mathematical part (step 3) requires them to execute that strategy.We focus our efforts on differentiating the steps of developing and properly executing a strategy.
For this purpose, we develop two treatment variations. The key idea behind both treatments isto hold the mathematical steps required to correctly solve the problem constant, yet manipulate theway people approach and think about the problem. For this purpose, we apply a basic idea reportedin DellaVigna (2009) to our context, i.e. that the probability of attending to and understandingcomplex issues—here, the correlation—is a function of (at least) two aspects of the environment.First, people’s propensity to notice and think through correlations might negatively depend onthe size of the information structure, i.e. the total number of stimuli as proxy for the overallcomplexity of the problem. In particular, it is conceivable that a “bigger” problem either makesit harder for subjects to identify the double counting problem or makes it less obvious how tosolve it. Secondly, attending to and understanding the double counting problem might be easier
20. For example, standard treatments of the computational theory of mind assume a distinction betweenrepresentations and operations on those representations (e.g. Thagard, 1996; Horst, 2011).
Dow
nloaded from https://academ
ic.oup.com/restud/article-abstract/86/1/313/4772809 by H
arvard Library user on 04 January 2019
[11:01 12/12/2018 OP-REST170108.tex] RESTUD: The Review of Economic Studies Page: 327 313–332
ENKE & ZIMMERMANN CORRELATION NEGLECT IN BELIEF FORMATION 327
if people are nudged to focus on and think about the correlation and the underlying independentsignals.21
We test these two predictions by increasing the size of the information structure (Section 3.3.1)and nudging subjects to pay special attention to the double counting problem and the underlyingindependent signals (Section 3.3.2), respectively, while holding the computational steps constant.
3.3. Conceptual versus mathematical problems
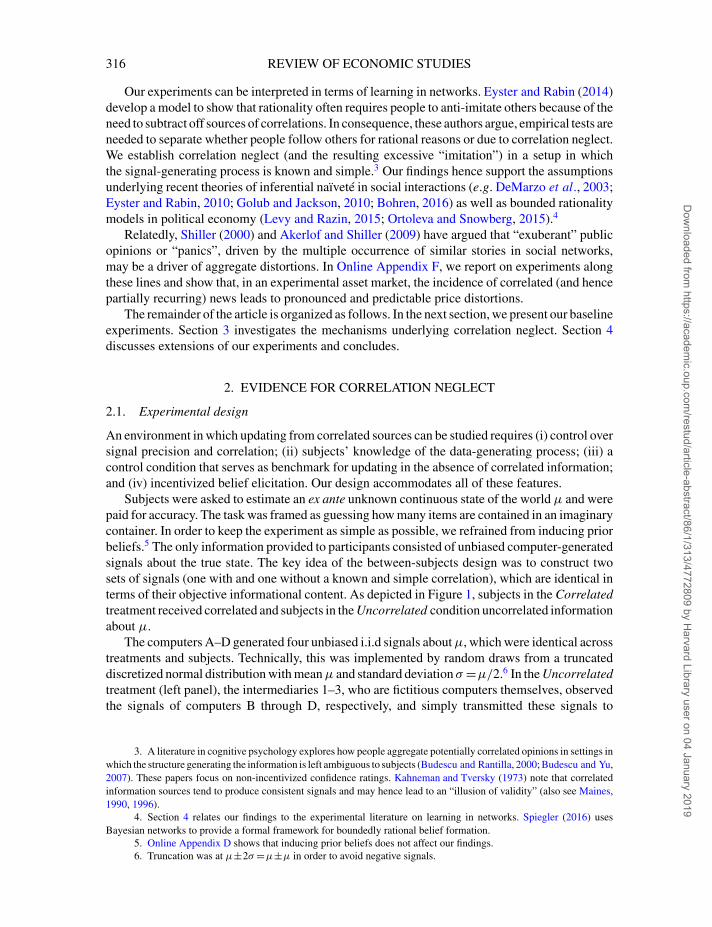
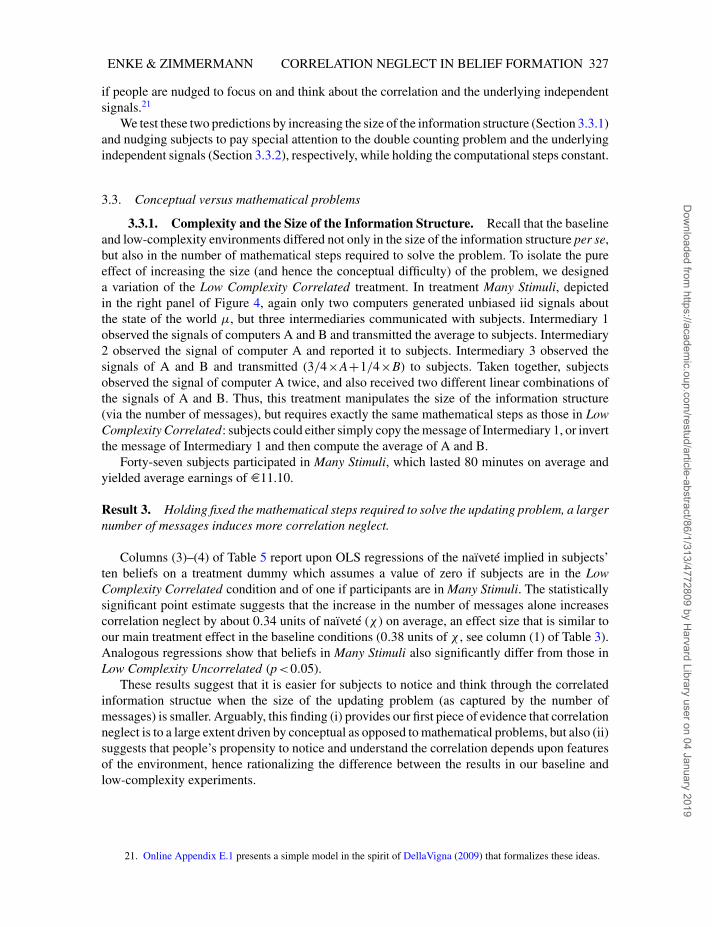
3.3.1. Complexity and the Size of the Information Structure. Recall that the baselineand low-complexity environments differed not only in the size of the information structure per se,but also in the number of mathematical steps required to solve the problem. To isolate the pureeffect of increasing the size (and hence the conceptual difficulty) of the problem, we designeda variation of the Low Complexity Correlated treatment. In treatment Many Stimuli, depictedin the right panel of Figure 4, again only two computers generated unbiased iid signals aboutthe state of the world μ, but three intermediaries communicated with subjects. Intermediary 1observed the signals of computers A and B and transmitted the average to subjects. Intermediary2 observed the signal of computer A and reported it to subjects. Intermediary 3 observed thesignals of A and B and transmitted (3/4×A+1/4×B) to subjects. Taken together, subjectsobserved the signal of computer A twice, and also received two different linear combinations ofthe signals of A and B. Thus, this treatment manipulates the size of the information structure(via the number of messages), but requires exactly the same mathematical steps as those in LowComplexity Correlated: subjects could either simply copy the message of Intermediary 1, or invertthe message of Intermediary 1 and then compute the average of A and B.
Forty-seven subjects participated in Many Stimuli, which lasted 80 minutes on average andyielded average earnings of E11.10.
Result 3. Holding fixed the mathematical steps required to solve the updating problem, a largernumber of messages induces more correlation neglect.
Columns (3)–(4) of Table 5 report upon OLS regressions of the naïveté implied in subjects’ten beliefs on a treatment dummy which assumes a value of zero if subjects are in the LowComplexity Correlated condition and of one if participants are in Many Stimuli. The statisticallysignificant point estimate suggests that the increase in the number of messages alone increasescorrelation neglect by about 0.34 units of naïveté (χ ) on average, an effect size that is similar toour main treatment effect in the baseline conditions (0.38 units of χ , see column (1) of Table 3).Analogous regressions show that beliefs in Many Stimuli also significantly differ from those inLow Complexity Uncorrelated (p<0.05).
These results suggest that it is easier for subjects to notice and think through the correlatedinformation structue when the size of the updating problem (as captured by the number ofmessages) is smaller. Arguably, this finding (i) provides our first piece of evidence that correlationneglect is to a large extent driven by conceptual as opposed to mathematical problems, but also (ii)suggests that people’s propensity to notice and understand the correlation depends upon featuresof the environment, hence rationalizing the difference between the results in our baseline andlow-complexity experiments.
21. Online Appendix E.1 presents a simple model in the spirit of DellaVigna (2009) that formalizes these ideas.
Dow
nloaded from https://academ
ic.oup.com/restud/article-abstract/86/1/313/4772809 by H
arvard Library user on 04 January 2019
[11:01 12/12/2018 OP-REST170108.tex] RESTUD: The Review of Economic Studies Page: 328 313–332
328 REVIEW OF ECONOMIC STUDIES
Figure 4
Information structure in Low Complexity Correlated (left panel) and Many Stimuli (right panel).
Notes: In the left panel, the intermediary directly transmit the signal from computer B. In the right panel, intermediary 1 observes thesignals of computers A and B and transmits the average to subjects. Intermediary 2 observes the signal of computer A and reports it tosubjects. Intermediary 3 observes the signals of A and B and transmits (3/4×A+1/4×B).
3.3.2. Nudge evidence. We proceed by testing the idea that drawing subjects’ attention tothe double counting problem and the underlying independent signals may help them in noticingthe correlation and understanding how to cope with it. To achieve this goal while holding themathematical complexity of the problem constant, treatment Alternating (see Table 4) varies thenature of the information structure (correlated or uncorrelated) within subjects between tasks.The basic design of the Alternating treatment (e.g. the number of computers and intermediaries)is identical to the baseline conditions. The key difference is that the instructions for this treatmentintroduced both the correlated and the uncorrelated information structure from our baseline design,which were framed as “Scenario I” and “Scenario II”, respectively. Subjects were told that insome tasks they would receive information according to Scenario I and in some tasks accordingto Scenario II and that, in each task, they would be informed of the scenario before seeing themessages of computer A and of the intermediaries. Consequently, subjects solved five taskswith correlated and five with uncorrelated information. The instructions emphasized that subjectswould have to pay special attention to the prevailing scenario. In addition, the control questions inthis treatment required subjects to compute the messages of intermediaries 1 and 2 for exemplarycomputer signals for both the correlated and the uncorrelated scenario, which presumably furtherincreased the salience of the workings of the intermediaries.
Arguably, alternating the correlated and uncorrelated information structure might manipulateboth steps 1 and 2 of our framework above, i.e. (i) this treatment might make it easier for subjectsto notice the double counting problem, but (ii) it may also help subjects understand that thisproblem can be solved by backing out the underlying independent signals because it makes therole of the underlying signals more salient. At the same time, the treatment does not provideany hints on how to mathematically compute the correct solution and hence leaves step 3 of theframework unaffected. Forty-seven subjects took part in the Alternating treatment and earnedE13.10 on average.
Result 4. Exogenously increasing subjects’ focus on the correlation and the underlyingindependent signals reduces the bias.
Columns (5)–(6) of Table 5 present the regression results. Here, we regress the naïveté impliedin beliefs in Correlated and Alternating on a treatment dummy. The point estimate indicatesthat shifting subjects’ focus reduces correlation neglect by 0.25 units of naïveté. To provide a
Dow
nloaded from https://academ
ic.oup.com/restud/article-abstract/86/1/313/4772809 by H
arvard Library user on 04 January 2019
[11:01 12/12/2018 OP-REST170108.tex] RESTUD: The Review of Economic Studies Page: 329 313–332
ENKE & ZIMMERMANN CORRELATION NEGLECT IN BELIEF FORMATION 329
complementary perspective, Online Appendix E.3 provides kernel density estimates of (median)beliefs in Alternating.
In sum, if subjects are nudged to focus on the correlation and the underlying independentsignals, the bias is substantially reduced. Arguably, this treatment also provides evidence thatpeople are in principle well capable of and sufficiently motivated to perform the calculationsthat are needed to develop rational beliefs—after all, treatment Alternating manipulates neithersubjects’ mathematical skills nor their incentives to solve the problem.22
3.4. Discussion
The analysis of mechanisms has revealed that people do not struggle so much with the mathematicsinvolved in solving our experimental task, but more with the conceptual problem of noticing andthinking through the correlation. In addition, we have provided causal evidence that people aremore likely to adequately process correlations if the information structure is “smaller”, henceindicating the importance of complexity for noticing and understanding correlations. While thegeneral idea behind these comparative statics effects may well extend to different environments,it should be acknowledged that the results are conditional on this particular type of (relativelysimple) correlation.
The distinction between developing and executing a solution strategy appears potentiallyimportant for both policy and economic theory. For example, if people’s shortcomings inprocessing correlations were closely linked to mathematical problems, then an obvious policyimplication is to teach more basic math. On the other hand, if people’s problems werepredominantly conceptual in nature, meaning that they fail to notice or think through thecorrelations, then policy remedies may focus on making people aware of the correlation andnudging them towards the underlying independent signals. Crucially, in contrast to teaching math,such a policy will likely be context-specific: pointing people to the presence of correlations inone context would not necessarily help them in another context. In addition, from the perspectiveof theory, the distinction between developing and executing a strategy is potentially importantas the former appears linked to having a wrong subjective model of the environment, while thelatter could perhaps be formalized by modelling cognitive effort costs.
While the distinction between the conceptual and mathematical steps in our framework appearsto be of direct economic relevance, this is arguably less the case for the distinction between steps1 and 2. From the viewpoint of policy, treatment Alternating has shown that making the doublecounting problem and the underlying signals very salient largely eliminates the bias—whetherthis is the case because people do not even notice the double counting problem to begin withor do not understand how to solve it seems rather subtle and likely less relevant in practice. Forexample, in the context of the news media, a policy intervention that reminds people of the factthat many news articles rely on the same press agencies or journalists, is likely to manipulateboth people’s awareness of the correlation, and their propensity to develop the correct solutionstrategy. Likewise, it is difficult to foresee whether the rather subtle distinction between steps 1and 2 could be productive for economic theory, especially given that both steps are related to the
22. That subjects appear to be sufficiently motivated confirms findings from Section 2.4.3 about the role of cognitiveeffort. Online Appendix E.4 presents the results from two further treatment variations that lend further credence to theinsight that people struggle much more with noticing the double counting problem in the first place, rather than solving itmathematically. For example, when subjects receive the hint “…Think carefully about what the intermediaries do! Whatdoes that imply for the estimates of the intermediaries?”, they notice and solve the double counting problem in a verysimilar fashion as in Alternating.
Dow
nloaded from https://academ
ic.oup.com/restud/article-abstract/86/1/313/4772809 by H
arvard Library user on 04 January 2019
[11:01 12/12/2018 OP-REST170108.tex] RESTUD: The Review of Economic Studies Page: 330 313–332
330 REVIEW OF ECONOMIC STUDIES
conceptual difficulty of processing correlations. For these reasons, we refrain from attempting tofurther disentangle steps 1 and 2 from our motivating framework.
4. EXTENSIONS AND CONCLUDING REMARKS
Using experiments with more than 1,000 subjects, this article provides clean evidence forpeople’s tendency to neglect correlations in information sources when forming beliefs and thecorresponding mechanisms. While we deliberately designed a tightly controlled and abstractinformation structure to obtain a clean view on the cognitive bias, it would be interesting to extendthe analysis to more naturalistic information. In Online Appendix G, we explore one possibleavenue by confronting subjects with real newspaper reports covering correlated information. Wemake use of a naturally occurring informational redundancy in professional GDP forecasts thatarose because a German research institute contributed to a joint forecast, but also issued a separate(different) forecast at the same time. Again, the incentivized beliefs subjects state after they haveread these correlated forecasts are indicative of correlation neglect.
Correlation neglect is likely to have implications in applied settings such as inter-active social network or herding setups. In this respect, our findings contribute to anactive empirical literature on naïve social learning, which has often identified updatingpatterns consistent with correlation neglect (Brandts et al., 2015; Chandrasekhar et al., 2016;Eyster et al., 2016; Grimm and Mengel, 2016).23 Similarly, our paper also relates to work onfinancial decision-making in the presence of correlated asset returns (Kallir and Sonsino, 2010;Eyster and Weizsäcker, 2011). What sets us apart from all of these contributions is our focus ona simple and completely transparent information structure as well as a study of the underlyingmechanisms. For example, our updating environment is stripped of the complexities that pervadeexperiments of social interactions in networks, such as lack of common knowledge of rationality,complicated updating processes after several rounds of communication, or the need to evaluate“indirect” information of uncertain origin (Golub and Jackson, 2010). Also, the correlationstructure in our setup is very simple compared to the typically non-trivial correlations amongfinancial assets. By documenting a “pure” form of correlation neglect, our findings arguablyhighlight the potential importance of this bias in a wide range of applied settings. In addition,our article provides evidence on the mechanisms underlying correlation neglect, and how thepresence of the bias depends on features of the environment.
Markets are an additional obvious candidate to study correlation neglect. For instance, simplemarket interaction might already suffice to debias the neglect types: first, subjects could learn fromfeedback including profits and losses from trading; secondly, subjects might learn by observingothers trade on evidently different beliefs. Alternatively or in addition, the correlation neglecttypes might be less certain about their beliefs than the rational types and hence engage in onlymoderate trading. If so, this would imply that despite the heterogeneity in updating types, themarginal (price-setting) trader would be rational. Online Appendix F reports upon experimentsin which we embedded our correlated information structure into a standard continuous doubleauction in which subjects traded financial assets of ex ante unknown value. In these experiments,subjects received extensive feedback after each trading round, including the true state from thepast period and the resulting profits and losses from trading. In addition, subjects could observe allbids from all market participants, which provided further opportunities to learn. The results showthat experimental market interaction does not induce correlation neglect types to learn: in periods
23. Other studies, such as the ones by Corazzini et al. (2012), Möbius et al. (2013), and Weizsäcker (2010) findbelief patterns that are less consistent with correlation neglect.
Dow
nloaded from https://academ
ic.oup.com/restud/article-abstract/86/1/313/4772809 by H
arvard Library user on 04 January 2019

[11:01 12/12/2018 OP-REST170108.tex] RESTUD: The Review of Economic Studies Page: 331 313–332
ENKE & ZIMMERMANN CORRELATION NEGLECT IN BELIEF FORMATION 331
in which correlation neglect leads to overly optimistic beliefs, market prices in the correlatedtreatment are too high, and when neglecting correlations implies overpessimism, market pricesare too low. In addition, within the correlated market treatment, subjects’ propensity to ignorecorrelations predicts both individual trading behaviour and the degree of price distortions. In sum,correlation neglect also has predictable effects in simple experimental markets.
Acknowledgments. For valuable comments and discussions we are grateful to the editor, Botond Koszegi, and threereferees. We also thank Steffen Altmann, Sandro Ambuehl, Doug Bernheim, Stefano DellaVigna, Thomas Dohmen,Christine Exley, Erik Eyster, Armin Falk, Holger Herz, Alex Imas, Muriel Niederle, Matthew Rabin, Frederik Schwerter,Andrei Shleifer, Joel Sobel, Georg Weizsäcker, and Matthias Wibral. Helpful comments were also received from manyseminar and conference audiences. Financial support from the Russell Sage Foundation, the International Foundationfor Research in Experimental Economics, the Bonn Graduate School of Economics, and the Center for Economics andNeuroscience Bonn is gratefully acknowledged.
Supplementary Data
Supplementary data are available at Review of Economic Studies online.
REFERENCES
AKERLOF, G. A. and SHILLER, R. J. (2009), Animal Spirits: How Human Psychology Drives the Economy, and Whyit Matters for Global Capitalism (Princeton, NJ: Princeton University Press).
BENJAMIN, D., MOORE, D. and RABIN, M. (2013), “Misconceptions of Chance: Evidence from an IntegratedExperiment” (Mimeo).
BOHREN, J. A. (2016), “Informational Herding with Model Misspecification”, Journal of Economic Theory, 163,222–247.
BORDALO, P., COFFMAN, K., GENNAIOLI, N. and SHLEIFER, A. (2016), “Stereotypes”, Quarterly Journal ofEconomics, 131, 1753–1794.
BRANDTS, J., GIRITLIGIL, A. E. and WEBER, R. A. (2015), “An Experimental Study of Persuasion Bias and SocialInfluence in Networks”, European Economic Review, 80, 214–229.
BROCAS, I., CARRILLO, J. D., WANG, S. W., et al. (2014), “Imperfect Choice or Imperfect Attention? UnderstandingStrategic Thinking in Private Information Games”, Review of Economic Studies, 81, 944–970.
BUDESCU, D. V. and RANTILLA, A. K. (2000), “Confidence in Aggregation of Expert Opinion”, Acta Psychologica,104, 371–398.
BUDESCU, D. V. and YU, H.-T. (2007), “Aggregation of Opinion Based on Correlated Cues and Advisors”, Journal ofBehavioral Decision Making, 20, 153–177.
CAPLIN, A., DEAN, M. and MARTIN, D. (2011), “Search and Satisficing”, American Economic Review, 101, 2899–2922.CHANDRASEKHAR, A. G., LARREGUY, H. and XANDRI, J. P. (2016), “Testing Models of Social Learning on
Networks: Evidence from a Framed Field Experiment” (Mimeo).CHARNESS, G. and LEVIN, D. (2009), “The Origin of the Winner’s Curse: A Laboratory Study”, American Economic
Journal: Microeconomics, 1, 207–236.CHARNESS, G., KARNI, E. and LEVIN, D. (2010), “On the Conjunction Fallacy in Probability Judgment: New
Experimental Evidence Regarding Linda”, Games and Economic Behavior, 68, 551–556.CORAZZINI, L., PAVESI, F., PETROVICH, B., et al. (2012), “Influential Listeners: An Experiment on Persuasion Bias
in Social Networks”, European Economic Review, 56, 1276–1288.DANA, J., WEBER, R. A. and KUANG, J. X. (2007), “Exploiting Moral Wiggle Room: Experiments Demonstrating an
Illusory Preference for Fairness”, Economic Theory, 33, 67–80.DELLAVIGNA, S. (2009), “Psychology and Economics: Evidence from the Field”, Journal of Economic Literature, 47,
315–372.DEMARZO, P. M., VAYANOS, D. and ZWIEBEL, J. (2003), “Persuasion Bias, Social Influence, and Unidimensional
Opinions”, Quarterly Journal of Economics, 118, 909–968.ESPONDA, I. and VESPA, E. (2014), “Hypothetical Thinking and Information Extraction in the Laboratory”, American
Economic Journal: Microeconomics, 6, 180–202.EXLEY, C. L. (2015), “Excusing Selfishness in Charitable Giving: The Role of Risk”, Review of Economic Studies, 83,
587–628.EYSTER, E., RABIN, M. and WEIZSÄCKER, G. (2016), “An Experiment on Social Mislearning”. Available at SSRN:
https://ssrn.com/abstract=2704746EYSTER, E. and RABIN, M. (2010), “Naïve Herding in Rich-Information Settings”, American Economic Journal:
Microeconomics, 2, 221–243.—— (2014), “Extensive Imitation is Irrational and Harmful”, Quarterly Journal of Economics, 129, 1861–1898.EYSTER, E. and G. WEIZSÄCKER (2011), “Correlation Neglect in Financial Decision-Making” (DIW Discussion
Papers, No. 1104).
Dow
nloaded from https://academ
ic.oup.com/restud/article-abstract/86/1/313/4772809 by H
arvard Library user on 04 January 2019

[11:01 12/12/2018 OP-REST170108.tex] RESTUD: The Review of Economic Studies Page: 332 313–332
332 REVIEW OF ECONOMIC STUDIES
FISCHBACHER, U. (2007), “z-Tree: Zurich Toolbox for Ready-Made Economic Experiments”, ExperimentalEconomics, 10, 171–178.
GABAIX, X. (2014), “A Sparsity-Based Model of Bounded Rationality”, Quarterly Journal of Economics, 129,1661–1710.
GENNAIOLI, N. and SHLEIFER, A. (2010), “What Comes to Mind”, Quarterly Journal of Economics, 125, 1399–1433.GOLUB, B. and JACKSON, M. O. (2010), “Naïve Learning in Social Networks and the Wisdom of Crowds”, American
Economic Journal: Microeconomics, 2, 112–149.GREINER, B. (2004), “The Online Recruitment System ORSEE 2.0 – A Guide for the Organization of Experiments in
Economics”, University of Cologne, Working Paper Series in Economics, 10, 63–104.GRIMM, V. and MENGEL, F. (2016), “An Experiment on Belief Formation in Networks”. Available at SSRN:
https://ssrn.com/abstract=2361007HAISLEY, E. C. and WEBER, R. A. (2010), “Self-Serving Interpretations of Ambiguity in Other-Regarding Behavior”,
Games and Economic Behavior, 68, 614–625.HANNA, R., MULLAINATHAN, S. and SCHWARTZSTEIN, J. (2014), “Learning through Noticing: Theory and
Experimental Evidence in Farming”, Quarterly Journal of Economics, 129, 1311–1353.HORST, S. (2011), “The Computational Theory of Mind”, Stanford Encyclopedia of Philosophy. Available at:
https://plato.stanford.edu/entries/computational-mind/JIN, G. Z., LUCA, M. and MARTIN, D. (2016), “Is No News (Perceived As) Bad News? An Experimental Investigation
of Information Disclosure”.KAHNEMAN, D. (2011), Thinking, Fast and Slow (Basingstoke, United Kingdom: Macmillan).KAHNEMAN, D. and TVERSKY, A. (1973), “On the Psychology of Prediction”, Psychological Review, 80, 237–251.KALLIR, I. and SONSINO, D. (2010), “The Neglect of Correlation in Allocation Decisions”, Southern Economic Journal,
75, 1045–1066.LEVY, G. and RAZIN, R. (2015), “Correlation Neglect, Voting Behavior, and Information Aggregation”, American
Economic Review, 105, 1634–1645.MAINES, L. (1990), “The Effect of Forecast Redundancy on Judgments of a Consensus Forecast’s Expected Accuracy”,
Journal of Accounting Research, 28, 29–47.—— (1996), “An Experimental Examination of Subjective Forecast Combination”, International Journal of Forecasting,
12, 223–233.MÖBIUS, M. M., PHAN, T. and SZEIDL, A. (2013), “Treasure Hunt: Social Learning in the Field” (Working Paper).NGANGOUE, K. and WEIZSÄCKER, G. (2015), “Learning from Unrealized Versus Realized Prices” (Working Paper).ORTOLEVA, P. and SNOWBERG, E. (2015), “Overconfidence in Political Behavior”, American Economic Review, 105,
504–535.RUBINSTEIN, A. (2007), “Instinctive and Cognitive Reasoning: A Study of Response Times”, Economic Journal, 117,
1243–1259.—— (2016), “A Typology of Players: Between Instinctive and Contemplative”, Quarterly Journal of Economics, 131,
859–890.SCHWARTZSTEIN, J. (2014), “Selective Attention and Learning”, Journal of the European Economic Association, 12,
1423–1452.SELTEN, R. (1998), “Axiomatic Characterization of the Quadratic Scoring Rule”, Experimental Economics, 1, 43–62.SHILLER, R. J. (2000), Irrational Exuberance (Princeton, NJ: Princeton University Press).SPIEGLER, R. (2016), “Bayesian Networks and Boundedly Rational Expectations”, Quarterly Journal of Economics,
131, 1243–1290.THAGARD, P. (1996), Mind: Introduction to Cognitive Science, Vol. 4 (Cambridge, MA: MIT Press).WEIZSÄCKER, G. (2010), “Do We Follow Others When We Should? A Simple Test of Rational Expectations”, American
Economic Review, 100, 2340–2360.
Dow
nloaded from https://academ
ic.oup.com/restud/article-abstract/86/1/313/4772809 by H
arvard Library user on 04 January 2019
Copyright © 2022 FDOKUMEN