corporate-presentation-september-2015.pdf - Link REIT
51
Link Real Estate Investment Trust Corporate Presentation September 2015
-
Upload
khangminh22 -
Category
Documents
-
view
1 -
download
0
Transcript of corporate-presentation-september-2015.pdf - Link REIT

Link Real Estate
Investment Trust
Corporate Presentation
September 2015
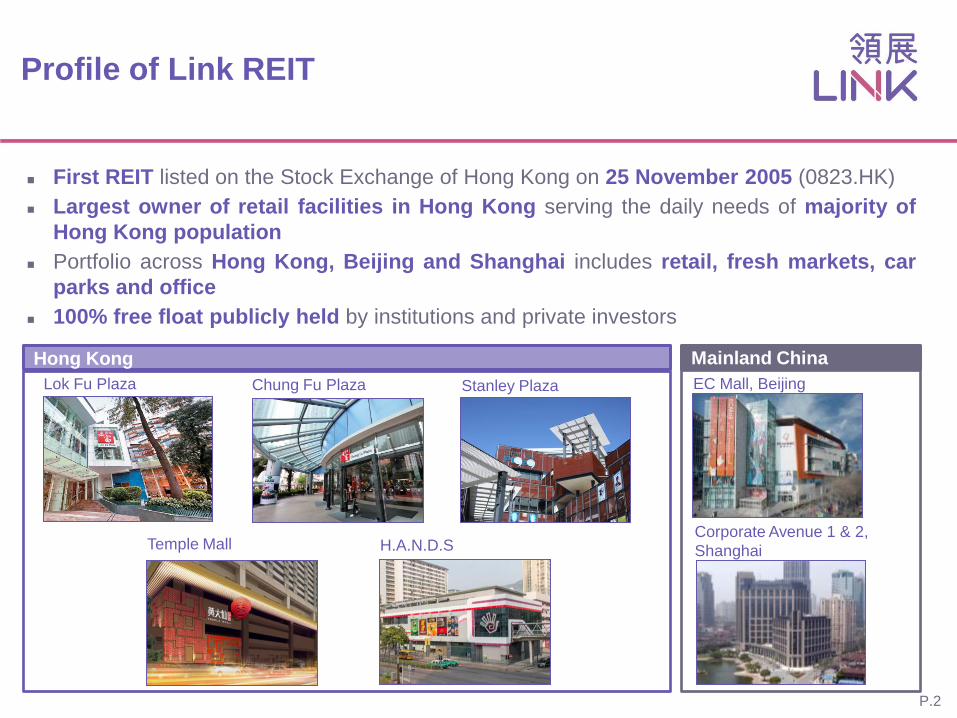
Profile of Link REIT
P.2
First REIT listed on the Stock Exchange of Hong Kong on 25 November 2005 (0823.HK)
Largest owner of retail facilities in Hong Kong serving the daily needs of majority of
Hong Kong population
Portfolio across Hong Kong, Beijing and Shanghai includes retail, fresh markets, car
parks and office
100% free float publicly held by institutions and private investors
Lok Fu Plaza Chung Fu Plaza
Temple Mall
EC Mall, Beijing
Mainland China Hong Kong
Corporate Avenue 1 & 2,
Shanghai
Stanley Plaza
H.A.N.D.S

One of the largest retail-focused REITs
in the world
Link REIT is the largest REIT in Asia
Note: Comparison of selected major REITs in the world based on market capitalisation.
Source: Bloomberg as of 11 Sep 2015 P.3
US$B
55.4
24.9 22.1
14.4 14.4 12.0 11.7 10.6 9.5 8.9
6.5 6.1 5.8 5.7 4.6 4.6 4.2 1.9
0.0
10.0
20.0
30.0
40.0
50.0
60.0

Strong operating performance
5,353
5,932
6,506
7,155
7,723
10/11 11/12 12/13 13/14 14/15
(HK$’M)
Revenue
1,709 1,747 1,890 1,953 2,054
10/11
Property Operating Expenses
Net Property Income Margin
(HK$’M)
Property Expenses / NPI Margin
Revenue growth
supported by
continuous
tenant mix
enhancement
P.4
5Y CAGR 9.6%
1,709 1,747 1,890 1,953 2,054
68.1%
70.5% 70.9%
72.7% 73.4%
10/11 11/12 12/13 13/14 14/15
Disciplined
expense control
to drive margin
expansion
Property Expenses
5Y CAGR 4.7%
91.5%
92.9%
94.1% 94.4%
94.8%
Mar-11 Mar-12 Mar-13 Mar-14 Mar-15
Occupancy
5Y +3.3%pts
Valuation (%)
67,318 76,672
95,366
109,899
138,383
Mar-11 Mar-12 Mar-13 Mar-14 Mar-15
(%)
(HK$’M)
5Y CAGR 19.7%
Active leasing
strategies to lift
occupancy
Notable growth
in valuation

P.5
Delivering sustainable growth
110.45
129.52
146.46
165.81
182.84
50
70
90
110
130
150
170
190
210
230
250
0
50
100
150
200
250
1/10/2010 1/04/2011 1/10/2011 1/04/2012 1/10/2012 1/04/2013 1/10/2013 1/04/2014 1/10/2014 1/04/2015
DPU Unit Price US Treasury
Unit Price 5Y CAGR
25.7%
DPU 5Y CAGR
13.4%
(1) (HK cents)
Notes:
(1) 5-Year CAGR for the past 5 financial years.
(2) 5-Year CAGR from 31/3/2010 to 31/3/2015.
(3) A combination of unit price appreciation and distribution paid out since listing in November 2005 to 30 June 2015.
(4) Unit price and US treasury yield rebased as at 30/9/2010 market close (i.e. 30 Sep 2010 = 100).
(2)
2010/2011
2011/2012
2012/2013
2013/2014
2014/2015
Compound annualised total return since listing +19.3% (3)
(4) (4)

Prudent capital management
Maintain a strong balance sheet
Relatively low gearing
Attractively priced loans with extended
repayment tenure
Disposition of non-core assets as a means of
capital recycling
Well protected from potential interest rate increases
P.6
Average debt
maturity Credit ratings
A2/ Stable
A/ Stable
Proforma adjusted
gearing ratio
18.7%
Effective interest
rate
5.2 years
Recent financing activities
Medium-Term Notes • 7-year 2022 HK$650M @2.4%
• 10-year 2024 US$500M @3.6%
• 15-year 2030 HK$740M @3.0%
Bank loans • 3-year bilateral loan HK$1.5B @HIBOR + 110bps all-in
• 4-year club loan HK$4B @ HIBOR + below 120bps all-in
• 5-year syndicated loan HK$4B @HIBOR +123bps all-in
Notes:
(1) As of 31 March 2015.
(2) After adjusting for the impact of final distribution paid on 7 July 2015 and the acquisition of EC Mall and Corporate Avenue 1 & 2 .
(2) (1)
2013/2014 3.7 years Maintained since 2010 2013/2014 11.0%
2.66%
2013/2014 2.77%
(1) Fixed rate debt/
total debt (1)
59%
2013/2014 52%

Well-positioned to mitigate impact of rate increase
67 77 95 110 138
6.2% 6.1%
5.4% 5.3% 4.6%
3.5%
2.2% 1.8%
2.7%
1.9%
0
20
40
60
80
100
120
140
160
0%
2%
4%
6%
8%
Mar-11 Mar-12 Mar-13 Mar-14 Mar-15
Property Valuation Cap. Rate (Average) 10-year UST
HK$'B
Impact on asset value
Cap rate compression supported by improving
property income and growth potential
No direct relationship between cap rate & long term
interest rate
Property value supported by rental growth offsets
risk of potential cap rate expansion
P.7
Impact on DPU
Average debt maturity extended to 5.2 years
Approx. 60% of our gross debt fixed
Only HK$4B net floating debt with small exposure to
interest rate increase
Shoppers from public rental housing would not be
affected by mortgage rates increase
Extended average life of debt and
small amount of net floating debt
Improving asset quality offsets pressure on cap rate
expansion due to interest rate increase
3 4 3 3 4 6 7 7 6 10
69 79
99 113
143
4.3 4.3 4.0
3.7
5.2
2
3
4
5
6
7
0
20
40
60
80
100
120
140
160
Mar-11 Mar-12 Mar-13 Mar-14 Mar-15
Net Floating Debt* Fixed Debt
Total Assets Average debt maturity
* Net Floating Debt = Floating-rate Debt - Cash and Deposits
Years HK$'B
yrs yrs yrs
yrs
yrs

100
110
120
130
140
150
160
170
180
190
2011 2012 2013 2014 2015
2nd acquisition
in Hong Kong –
Maritime Bay 1st acquisition
in Hong Kong –
Nan Fung Plaza
2011
Expansion of
asset class to
non- residential
real estate
2012
Expansion of
investment mandate to
include property
development
2014 Expansion of
geographical scope
2014
Disposal of 9 non-
core properties
2015
Acquisition of
commercial
site in
Kowloon East
3rd acquisition
in Hong Kong –
Lions Rise Mall
Acquisition of
Corporate
Avenue 1 & 2,
Shanghai
2012
Improve asset quality + DPU growth DPU (HK cents)
P.8
Acquisition of
EC Mall,
Beijing
Continuous development over the past 5 years

Expanded business model
To secure long-term growth trajectory
PROPERTY
RE-
DEVELOPMENT
ASSET
MANAGEMENT
ASSET
ENHANCEMENT
ASSET
ACQUISITION
ASSET
DISPOSAL
PROPERTY
DEVELOPMENT
CO
RE
N
EW
F
UT
UR
E
Improve asset quality
+
DPU growth
P.9

Each growth driver adding to DPU growth
FY06 FY07 FY08 FY09 FY10 FY11 FY12 FY13 FY14 FY15 and
beyond
Asset Management Asset Enhancement Asset Acquisition Property Development
DPU
($)
Note:
(1) For illustration purpose only, not to scale
(1)
P.10
Sustain DPU growth

Our Portfolio

Multiple business segments to create value
Retail Office
Fresh market Car park
• Focus on mass-to-mid
market retail malls
targeting non-discretionary
spending
• Improve rental returns
through active asset
management and selected
asset enhancements
• Invest only in premium
Grade A offices, as
standalone buildings or
part of mixed-use
complexes
• Focus in core CBDs in
Hong Kong and first tier
cities in Mainland China
• Continue upgrading
existing traditional markets
into modern fresh markets
• Offer a pleasant shopping
environment with better
facilities and services for
daily groceries and
necessities
• Conduct district analyses
on Link’s car park
catchments
• Identify opportunities to
improve return by
enhancing utilisation and/or
closing price gap with the
market
Continuously adding value to Link REIT’s portfolio and improving return to unitholders
P.12

Diversified portfolio mix
P.13
71.9%
16.9%
3.9%
2.7%
4.6%
Hong Kong retail Hong Kong car park
Hong Kong office China retail
China office
HK portfolio 93%
China portfolio 7% (all income generating
and yield accretive)
Existing portfolio mix (by value)
Notes:
(1) China assets are valued in RMB and converted to HK$ at RMB1 = HK$1.212 (exchange rate as of 20 Aug 2015).
(2) Value of retail portfolio in China includes the value of retail and car park facilities of EC Mall and retail facilities of Corporate Avenue 1 & 2.
(3) Value of office portfolio in China includes the value of office and car park facilities of Corporate Avenue 1 & 2.
(4) The investment cap for property development is 10% of gross asset value as stipulated in the HK REIT Code.
Core market in Hong Kong and additional investments in Mainland China
Portfolio mix guidance (by value)
China Below 12.5%
Office Below 12.5%
Property development (4) Below 10.0%
(in Hong Kong only)
Capital structure policy
Maintain current A (S&P) and A2 (Moody’s) ratings
Gearing ratio Below 25%

Hong Kong retail
Organic growth through tenant mix enhancement
Selected new tenants Existing tenants expanding their businesses
P.14
Refine tenant mix
Improve service
standards
Introduce innovative marketing campaigns
Support tenant sales
FY13: 0 FY15: 8 shops
FY13: 2 shops FY15 :16 shops
FY13: 0 FY15: 7 shops
FY13: 4 shops FY15: 31 shops
FY13: 0 FY15: 5 shops
FY13: 0 FY15: 6 shops
Fashion
F&B
FY13: 0 FY15: 4 shops
FY13: 1 shop FY15: 5 shops
F&B Grocery Fashion
Cosmetics
FY13: 1 shop FY15: 11 shops
(1)
Notes:
(1) Newly recruited in 2014/2015.

19.8%
8.6% 7.5%
-1.0% 0.2%
7.9%
5.2% 4.5% 4.4% 3.3%
15.8%
11.6% 10.1%
6.5%
-5.0%
0.0%
5.0%
10.0%
15.0%
20.0%
25.0%
11/12 12/13 13/14 14/15 Apr-Jun 2015
HK - All retail outlets
HK - Non-discretionary trades
Link REIT - Non-discretionary trades YoY (%)
Hong Kong retail
Focus on stable non-discretionary trades
Notes:
(1) Percentage figures represent year-on-year change in tenants’
average monthly sales per square foot of the respective years.
(2) Non-discretionary trades include food & beverage, supermarket
and foodstuff.
(2)
(2)
Financial Year
P.15
25.2%
22.8%
14.1%
11.1%
1.3%
8.2%
17.3%
Food and beverage Supermarkets and foodstuff Markets/Cooked food stalls Services Education/Welfare, office and ancillary Personal care, medicine, optical, books and stationery Others
Trade mix by monthly rent (as at 31 March 2015)
Link REIT tenant sales outperform
Hong Kong market with stable outlook
F&B and supermarkets as the major
sources of rental income
(1)
~62% food
related
trades
(includes clothing, department stores, electrical and household
products, leisure and entertainment and valuable goods.)

Hong Kong retail
Continuous pipeline of asset enhancements
Proven track record
Completed 39 asset enhancements projects
as at 31 March 2015
On average complete 4-6 projects a year,
with an annual CAPEX budget at approx.
HK$600-800M
Most of the completed projects exceed
ROI target of 15%
Notes:
(1) Estimated figures as at 31 March 2015.
(2) Estimated return on investment (“ROI”) is calculated based on projected net property income post project minus net property income
pre-project divided by estimated project capital expenditures and loss of rental.
(3) Excluding the 2 fresh markets refurbished by external market operators and other 2 fresh markets integrated in other AE projects.
2015 2016 2017 2018 2019 2020
6 projects (HK$1,277M)
Projects to commence 10 projects (HK$1,200M)
Others under planning 14 projects (HK$1,634M)
(1)
(1)
(1)
Continuous pipeline extending to 2020
P.16
29
8
2
Top 50
Beyond top 50
Fresh market only
Targeting both large and small assets
Completed AE projects
(by valuation)
(by valuation)
(2)
Projects underway
(3)

Hong Kong retail
Capitalising on district potential
Select assets for enhancement through continuous review of district growth potential
Projected Population Growth, 2013(1) – 2023E
Tai Po
+ 26.1%
Tuen Mun
+ 12.4%
Yuen Long including Tin Shui Wai
+ 18.2%
Sai Kung including Tseung Kwan O
+ 17.9%
Sha Tin
+ 10.3%
Link REIT portfolio
As at 31 Mar 2015
% of total
Retail IFA
Hong Kong 7.4%
Kowloon 33.5%
New Territories 59.1%
Total 100.0%
Note:
(1) 2013 refers to the base year estimates by Planning Department.
Source: Planning Department, December 2014. Projected Population by District Council District, 2014-2023. P.17

Hong Kong retail
Strategic investment in New Territories West
Completed AE projects
2008/2009
2009/2010
2011/2012
2012/2013
2013/2014
Tin Shui Wai /Yuen Long Tuen Mun
Tin Yiu Plaza
(CAPEX: HK$33M)
Tin Shui Shopping Centre
(CAPEX: HK$78M)
Chung Fu Plaza
(CAPEX: HK$170M)
Butterfly Plaza
(CAPEX: HK$95M)
Leung King Plaza
(CAPEX: HK$243M)
H.A.N.D.S
(CAPEX:HK$477M)
AE projects underway
2014/2015
Tin Shing
HK$212M/ early 2016 (1) Long Ping
HK$196M / late 2015 (1)
Butterfly Plaza
HK$329M / mid 2016 (1)
Note: (1) Estimated total CAPEX / target completion date as at 31 March 2015.
P.18

Hong Kong retail
Repositioning of large assets: H.A.N.D.S
P.19
Extend catchment from immediate vicinity to nearby districts
Create one-stop shopping destination for young families in northwest New Territories
IFA 193,091 sq.ft.
Location
• Tuen Mun, largest new town in
northwest New Territories
• Well-connected by transportation
network
Previous
condition
Old style shopping podium housed in
separate blocks
AE work scope
• Connect separate podium into an
integrated mall
• Reposition as a young trendy mid-tier
shopping destination
• Contemporary design with wider
shop-fronts and better circulation
CAPEX HK$477M
AE completion 2014/2015
ROI 15.3%
(1)
Note:
(1) Total IFA of Yau Oi Commercial Centre and On Ting Commercial Complex as at 31 March 2015.

Hong Kong retail
Repositioning of large assets: Temple Mall
P.20
IFA 289,095 sq.ft.
Location
• Next to Wong Tai Sin Temple, one of
Hong Kong’s top tourist attractions with
over 3 million visitors a year
• Connected to the Wong Tai Sin MTR
station
Previous
condition
Two malls – Lung Cheung Plaza and
Wong Tai Sin Plaza had much
duplication in tenant mix
AE work
scope
• Unify identity and rebrand into Temple
Mall
• Reduce tenant duplication and enrich
tenant mix to appeal to visitors
CAPEX HK$353M
Expected AE
completion
date
End of 2015
Leverage asset location to appeal to locals and visitors
(1)
Notes:
(1) Included IFA of Lung Cheung Plaza and Wong Tai Sin Plaza as at 31 March 2015.
(2) CAPEX of Lung Cheung Plaza asset enhancement estimated as at 31 March 2015.
(3) Asset enhancement of Lung Cheung Plaza is expected to be completed by end of 2015.
(2)
(3)

Hong Kong retail
Refurbishment of smaller assets: Hoi Fu Shopping
Centre
P.21
IFA 40,360 sq.ft.
Location In the middle of a large residential
area in Kowloon West
Previous condition Retail podium and market area with
high vacancy
AE work scope
• Refurbished mall and repartitioned
fresh market into shop area
• Introduced more F&B to target
nearby residents
CAPEX HK$39M
AE completion 2014/2015
ROI 19.1%
Capture the change in district demographics to better serve catchment population
(1)
Note:
(1) IFA of Hoi Fu Shopping Centre as at 31 March 2015.

Hong Kong retail
Enhancement of fresh markets
6 out of >80 fresh markets have been upgraded
Revitalise traditional fresh markets by improving hardware (e.g. upgrade ventilation and
lighting systems) and software (e.g. shopping carts and customer service ambassadors)
Improve fresh market performance in footfall, occupancy and revenue growth
Drive footfall not only into fresh markets but also shopping centres and car parks
Lok Fu Market Tai Yuen Market Siu Sai Wan Market
P.22
Creating modern fresh markets as vibrant and appealing marketplaces

Hong Kong retail
Disposal to streamline portfolio and recycle capital
Disposal criteria
Relatively smaller assets
Lack of synergy
Limited enhancement potential
Properties disposed in
2014/2015
9
Total consideration HK$2,956M
Premium to valuation
as at 31 March 2014
33%
P.23
Recycle capital
For new investments to expand and
upgrade portfolio
Unit buyback to neutralise loss in
distribution
Working capital to support operations
Streamline portfolio
Focus resources on core assets
Improve operational efficiency
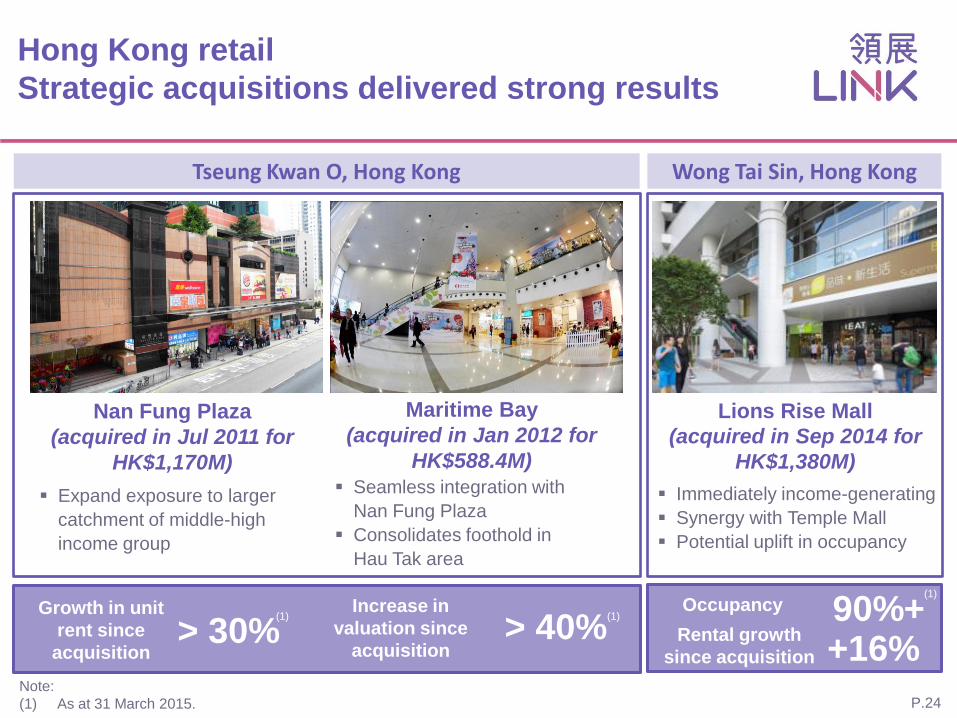
Hong Kong retail
Strategic acquisitions delivered strong results
Maritime Bay
(acquired in Jan 2012 for
HK$588.4M)
Seamless integration with
Nan Fung Plaza
Consolidates foothold in
Hau Tak area
Nan Fung Plaza
(acquired in Jul 2011 for
HK$1,170M)
Expand exposure to larger
catchment of middle-high
income group
Increase in
valuation since
acquisition > 40%
Growth in unit
rent since
acquisition > 30%
Lions Rise Mall
(acquired in Sep 2014 for
HK$1,380M)
Immediately income-generating
Synergy with Temple Mall
Potential uplift in occupancy
Occupancy 90%+ Rental growth
since acquisition +16%
P.24
Tseung Kwan O, Hong Kong Wong Tai Sin, Hong Kong
(1)
Note:
(1) As at 31 March 2015.
(1) (1)

Hong Kong office
Kowloon East commercial development
Government to develop Kowloon East into
new CBD
Plans to build a monorail to enhance
district connectivity
Major multinational companies such as
Manulife, Citibank and China Construction
Bank are moving into this new CBD district
P.25
Link REIT
project site
Best-in-class office at the heart of new CBD
Max.GFA 884,000 sq.ft.
Estimated total
development cost
HK$10.5B
Ownership 60%
(partner with Nan Fung Dev.)
Expected completion June 2020

Hong Kong office
Favorable Kowloon East office market outlook
P.26 Source: CBRE, 2Q 2015
Kowloon East office vacancy rate at
downward trend
Rental gap between Central and
Kowloon East expected to narrow
Central 1.7%
Kowloon
East
6.6%
(single ownership 1.5%;
stratified 15.1%)
Vacancy rate
(1)
(1)
(1)
Note:
(1) Data as of 2Q 2015

Mainland China retail
EC Mall in Beijing: Overview
In the middle of “Silicon Valley of China” with many
universities and technology companies nearby
Well connected by two metro lines
Experienced local team to manage the property
P.27
Committed
Occupancy 99%+ 1/3 total leasable area expiring in 2015 & 2016
Note:
(1) Figure as at 31 July 2015.
(1)
Prime location with stable income and proven performance
Property
acquisition price
RMB 2,500M
Acquired in
April 2015
1KM
Peking
University
Tsinghua
University
Renmin
University of
China
Central
University of
Finance and
Economics
China University of
Political Science
and Law
Beihang University
EC Mall
Existing Corporations
Existing Universities
Existing Residential
Tencent
Intel
Yahoo!
Sohu
Sina
ZTE
Youku

23.4%
53.1%
8.0%
15.5%
F&B
Fashion
Services
General Retail and Others
Mainland China retail
EC Mall in Beijing: Tenants and trades
P.28
Selected tenants Trade mix by base rent (1)
Note:
(1) Data as at 31 July 2015.
Fashion and Services
F&B
Continue to refine trade mix targeting young shoppers in the 18-35 age bracket
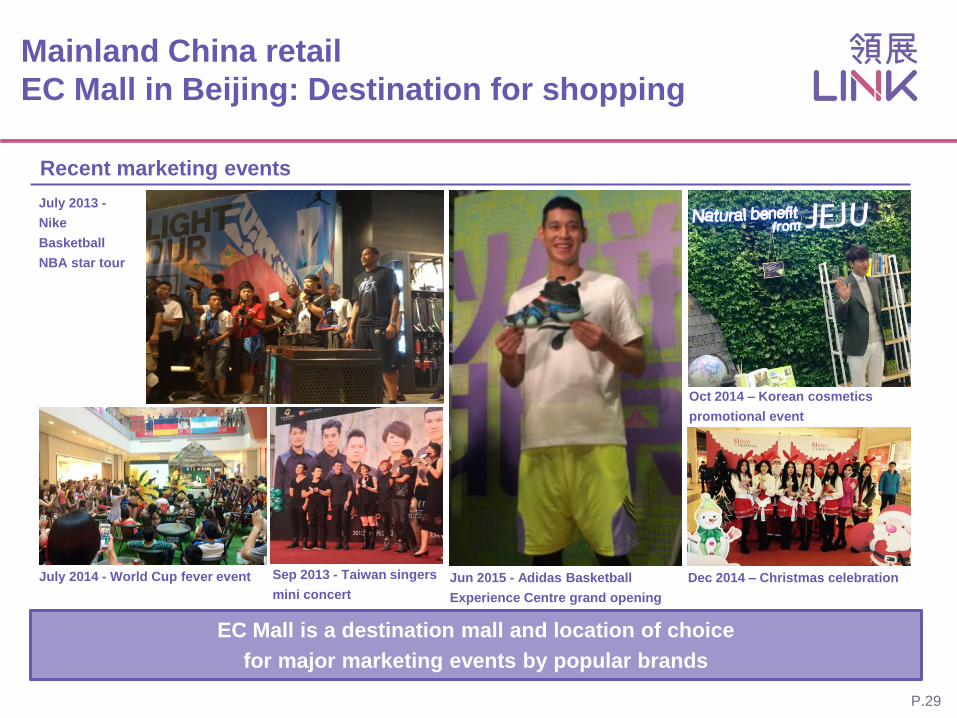
Mainland China retail
EC Mall in Beijing: Destination for shopping
Recent marketing events
EC Mall is a destination mall and location of choice
for major marketing events by popular brands
July 2013 -
Nike
Basketball
NBA star tour
Sep 2013 - Taiwan singers
mini concert
Jun 2015 - Adidas Basketball
Experience Centre grand opening
P.29
Oct 2014 – Korean cosmetics
promotional event
July 2014 - World Cup fever event Dec 2014 – Christmas celebration

Mainland China office
Corporate Avenue 1 & 2 in Shanghai : Overview
In the heart of Huai Hai Middle Road CBD, a renowned
and affluent commercial area
Excellent hardware and competitive specifications
Relatively under-rented with good growth prospects
Attractive supply-demand dynamics
CA 1
Office
CA 2
Office
Retail
P.30
Andaz
Hotel
CA
1 & 2 Langham
Hotel
Shanghai
Xintiandi
Corporate
Avenue 3 (soon to
complete)
Corporate
Avenue 5
Taipingqiao
Lot 124
(currently
under
planning)
Premium Grade A office in core CBD with established track record
Property
acquisition price
RMB 6,600.86M
Acquisition
completed in
August 2015

Mainland China office
Corporate Avenue 1 & 2 in Shanghai : Tenants
Top 5 tenants (by income) (1)
PwC 16.0%
Eli Lilly 9.8%
Walt Disney 8.3%
Sony 6.9%
Pernod Ricard 6.5%
Subtotal 47.5%
P.31
High calibre tenants Prime location and hardware
Note:
(1) Based on information from vendor as at 30 June 2015.
11.6%
23.5%
29.6%
5.0% 7.1%
23.2%
2015 2016 2017 2018 2019 2020 2021
Stable expiration profile (by area) (1)
32.1%
17.2% 12.7%
12.9%
8.5%
16.6%
Professional Services
Pharmacy
Industrial Goods and Services TMT
Retailers & Consumer Products Others
Diversified tenant mix (by rental) (1)
Note:
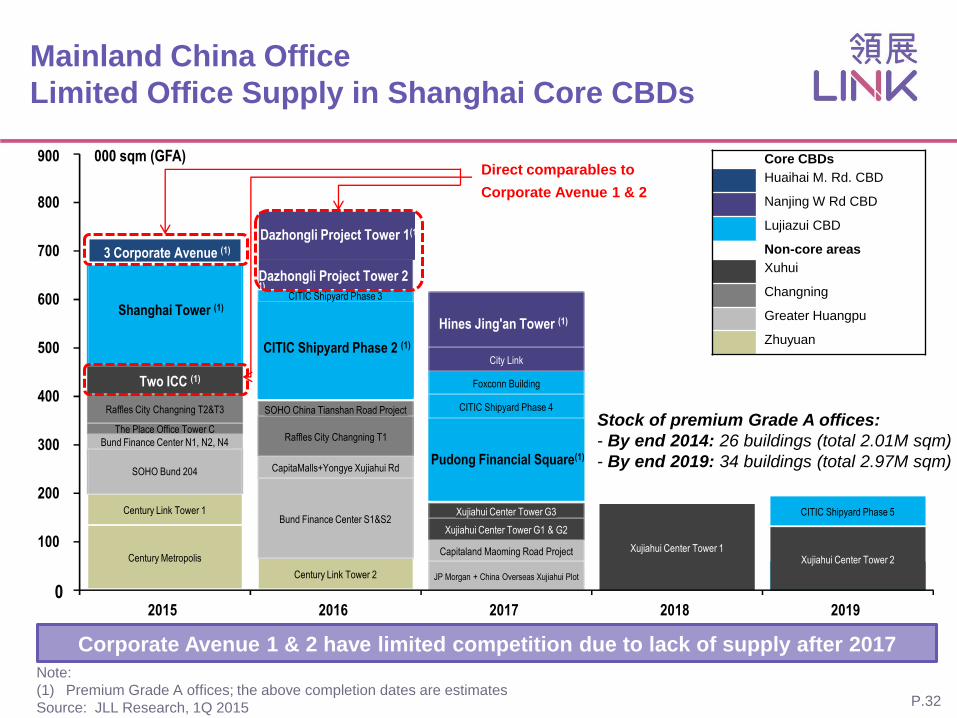
(1) Premium Grade A offices; the above completion dates are estimates
Source: JLL Research, 1Q 2015
Stock of premium Grade A offices:
- By end 2014: 26 buildings (total 2.01M sqm)
- By end 2019: 34 buildings (total 2.97M sqm)
Mainland China Office
Limited Office Supply in Shanghai Core CBDs
Shanghai Tower (1)
Century Metropolis
Century Link Tower 1
SOHO Bund 204
3 Corporate Avenue (1)
Bund Finance Center N1, N2, N4
Two ICC (1)
The Place Office Tower C
Raffles City Changning T2&T3
CITIC Shipyard Phase 2 (1)
CITIC Shipyard Phase 3
Century Link Tower 2
Dazhongli Project Tower 2 (1)
Dazhongli Project Tower 1(1)
Bund Finance Center S1&S2
CapitaMalls+Yongye Xujiahui Rd
Raffles City Changning T1
SOHO China Tianshan Road Project
Pudong Financial Square(1)
CITIC Shipyard Phase 4
Foxconn Building
City Link
Hines Jing'an Tower (1)
JP Morgan + China Overseas Xujiahui Plot
Capitaland Maoming Road Project
Xujiahui Center Tower G1 & G2
Xujiahui Center Tower G3
Xujiahui Center Tower 1
CITIC Shipyard Phase 5
Xujiahui Center Tower 2
0
100
200
300
400
500
600
700
800
900
2015 2016 2017 2018 2019
000 sqm (GFA) Core CBDs
Huaihai M. Rd. CBD
Nanjing W Rd CBD
Lujiazui CBD
Non-core areas
Xuhui
Changning
Greater Huangpu
Zhuyuan
P.32
Corporate Avenue 1 & 2 have limited competition due to lack of supply after 2017
Direct comparables to
Corporate Avenue 1 & 2

Strategies and Outlook

Diversifying portfolio mix to be exposed to
different property cycles
Continue focus on long-term
income generating assets
Resilient retail portfolio targeting
non-discretionary spending
Premium office assets leveraging on prime
location and strong demand
Contain expenses
to track inflation
Selective acquisitions
to create long-term value
Maintain strong
capital structure and credit ratings
Market Outlook
Stable economic growth
Unemployment remains at low level
Mild slowdown in tourist arrival
Lack of new supply of quality
commercial properties
Outlook
Ongoing strategy
Hong Kong
Tier-1 cities in Mainland China
Rising household income and
urbanisation
Continuous government spending on
infrastructure such as metro lines and
highways
Stimulus measures to drive domestic
consumption
P.34
Sustain steady DPU growth

Recognised by Various Global Indices
MSCI
P.35
Note:
(1) Link REIT has become a member of Hang Seng Corporate Sustainability Index 2015-2016 which effective from 14 September
2015.

Appendix

Year ended
31 Mar 2015
HK$’M
Year ended
31 Mar 2014
HK$’M
YoY
%
Revenues 7,723 7,155 7.9
Property operating expenses (2,054) (1,953) 5.2
Net property income 5,669 5,202 9.0
General and administrative expenses (1) (437) (222) 96.8
Interest income 32 28 14.3
Finance costs on interest bearing liabilities (359) (393) (8.7)
Gain on disposal of investment properties 445 - N/A
Profit before taxation, change in fair values of
investment properties and transactions with
Unitholders
5,350 4,615 15.9
Change in fair values of investment properties 22,699 13,445 68.8
Taxation (819) (755) 8.5
Profit for the year, before transactions with
Unitholders 27,230 17,305 57.4
Additional Data 1:
Income Statement Summary
Note: (1) Increase in general and administrative expenses was mainly due to transaction costs incurred for the acquisition of Lions Rise
Mall and the disposal of nine properties during the year. P.37

Additional Data 2:
Distribution Statement Summary
Year ended
31 Mar 2015
HK$’M
Year ended
31 Mar 2014
HK$’M
YoY
%
Profit for the year, before transactions with Unitholders 27,230 17,305 57.4
Change in fair values of investment properties (22,699) (13,445) 68.8
Gain on disposal of investment properties, net of
transaction costs (421) - N/A
Other non-cash income (46) (30) 53.3
Total distributable income 4,064 3,830 6.1
Discretionary distribution (1) 128 - N/A
Total distributable amount 4,192 3,830 9.5
Distribution per unit (HK cents) 182.84 165.81 10.3
Note: (1) Total distributable amount included discretionary distribution of HK$128m paid as part of interim distribution to offset the
transaction costs relating to the acquisition of Lions Rise Mall in September 2014.
P.38

Additional Data 3:
Revenue Analysis
Year ended
31 Mar 2015
HK$’M
Year ended
31 Mar 2014
HK$’M
YoY
%
Percentage
contribution
Year ended
31 Mar 2015
%
Retail rentals:
Shops (1) 4,638 4,338 6.9 60.1
Markets / Cooked Food Stalls 767 695 10.4 9.9
Education / Welfare / Office /
Ancillary 145 137 5.8 1.9
Mall Merchandising 161 156 3.2 2.1
Car park rentals:
Monthly 1,224 1,108 10.5 15.8
Hourly 432 386 11.9 5.6
Expenses recovery and other miscellaneous revenue:
Property related revenue (2) 356 335 6.3 4.6
Total 7,723 7,155 7.9 100.0
Notes: (1) Rental from shops includes turnover rent of HK$169 million (2014: HK$141 million).
(2) Including other revenue from retail properties of HK$353 million (2014:HK$331 million) and car park portfolio of HK$3 million
(2014:HK$4 million).
P.39

Additional Data 4:
Expenses Analysis
Year ended
31 Mar 2015
HK$’M
Year ended
31 Mar 2014
HK$’M
YoY
%
Percentage
contribution
Year ended
31 Mar 2015
%
Property managers’ fees, security
and cleaning 554 543 2.0 27.0
Staff costs 381 325 17.2 18.5
Repair and maintenance 201 200 0.5 9.8
Utilities 300 296 1.4 14.6
Government rent and rates 236 209 12.9 11.5
Promotion and marketing expenses 108 111 (2.7) 5.3
Estate common area costs 113 114 (0.9) 5.5
Other property operating expenses 161 155 3.9 7.8
Total property expenses 2,054 1,953 5.2 100.0
(1)
Note: (1) Included higher long-term incentive plan accrual due to unit price appreciation from HK$38.15 to HK$47.80.
P.40

Additional Data 5:
Financial Position & Investment Properties
HK$’M
As at
31 Mar 2015
As at
30 Sep 2014
As at
31 Mar 2014
Total Assets 143,144 129,932 113,466
Total Liabilities 25,038 19,322 17,115
Net Assets Attributable to Unitholders 118,106 110,610 96,351
Units in Issue (M) 2,291.8 2,293.2 2,310.9
Net Asset Value Per Unit $51.53 $48.23 $41.69
HK$’M
As at
31 Mar 2015
As at
30 Sep 2014
As at
31 Mar 2014
At beginning of period / year 109,899 109,899 95,366
Acquisition 1,320 1,320 -
Additions 6,969 403 1,088
Disposals (2,504) (897) -
Change in fair values of investment properties 22,699 14,761 13,445
At end of period / year 138,383 125,486 109,899
Financial Position Summary
Fair Value of Investment Properties
(1)
Note: (1) Represents acquisition of Lions Rise Mall only. Acquisition of Beijing EC Mall was completed on 1 April 2015.
(2) Additions include property under development in Kowloon East of HK$5,880 million.
(2)
P.41

HK$’M
As at
31 Mar 2015
As at
30 Sep 2014
As at
31 Mar 2014
Retail properties 107,326 102,492 91,245
Car parks 25,177 22,994 18,654
Property under development 5,880 - -
Total 138,383 125,486 109,899
Income Capitalisation Approach – Capitalisation Rate
Retail properties 3.40 – 5.20% 3.40 – 5.80 % 4.40 – 6.60 %
Retail properties: weighted average 4.57% 4.76% 5.09 %
Car parks 3.80 – 6.00% 3.80 – 6.60 % 4.80 – 7.60 %
Car parks: weighted average 4.78% 5.09 % 6.16 %
Overall weighted average 4.61% 4.82 % 5.27 %
DCF Approach
Discount rate 7.50% 7.50 % 7.50 %
Additional Data 6:
Valuation
Independent valuer: CBRE
P.42

Additional Data 7:
Retail Portfolio by Valuation
Note: (1) Properties ranked by retail valuation as at 31 March 2015. Figures for 2014 exclude nine properties disposed in
July and December 2014.
Valuation
HK$’M
Retail rentals
HK$’M
Average monthly unit
rent
HK$ psf
Occupancy rate
%
As at
31 Mar 2015
Year ended
31 Mar 2015
As at
31 Mar
2015
As at
31 Mar
2014
As at
31 Mar
2015
As at
31 Mar
2014
1-10 28,453 1,433 64.5 60.5 98.4 98.7
11-50 50,892 2,627 49.8 46.1 95.5 95.8
51-100 24,118 1,360 34.6 32.1 92.8 91.7
Remaining 3,863 233 23.3 22.2 92.1 89.6
Properties
disposed - 58
Overall 107,326 5,711 45.4 42.5 94.8 94.4
P.43

As at
31 Mar 2015
%
As at
31 Mar 2014
%
YoY
ppts
Food and Beverage 25.2 24.9 0.3
Supermarket and Foodstuff 22.8 22.9 (0.1)
Markets / Cooked Food Stalls 14.1 14.3 (0.2)
Education / Welfare, Office and Ancillary 1.3 1.3 -
Services 11.1 11.1 -
Personal Care, Medicine, Optical, Books and
Stationery 8.2 8.3 (0.1)
Valuable Goods (Jewellery, Watches and Clocks) 0.6 0.7 (0.1)
Others (1) 16.7 16.5 0.2
Total 100.0 100.0 -
Additional Data 8:
Retail Trade Mix by Monthly Base Rent
Note: (1) Including clothing, department store, electrical and household products, leisure and entertainment.
P.44
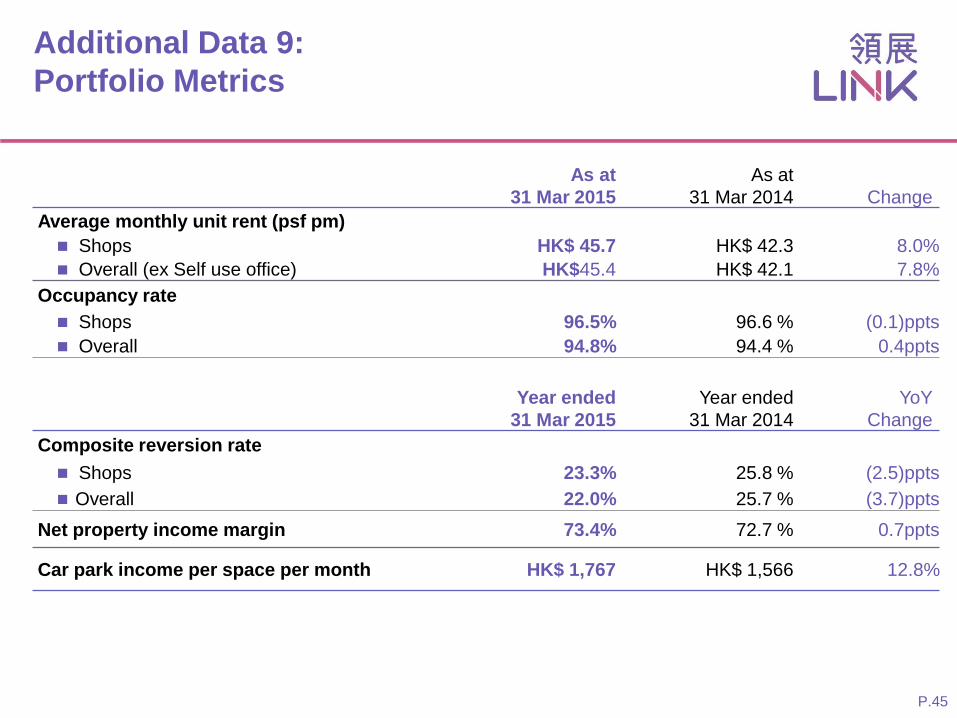
Additional Data 9:
Portfolio Metrics
As at
31 Mar 2015
As at
31 Mar 2014 Change
Average monthly unit rent (psf pm)
Shops HK$ 45.7 HK$ 42.3 8.0%
Overall (ex Self use office) HK$45.4 HK$ 42.1 7.8%
Occupancy rate
Shops 96.5% 96.6 % (0.1)ppts
Overall 94.8% 94.4 % 0.4ppts
Year ended
31 Mar 2015
Year ended
31 Mar 2014
YoY
Change
Composite reversion rate
Shops 23.3% 25.8 % (2.5)ppts
Overall 22.0% 25.7 % (3.7)ppts
Net property income margin 73.4% 72.7 % 0.7ppts
Car park income per space per month HK$ 1,767 HK$ 1,566 12.8%
P.45

Additional Data 10:
Lease Expiry Profile
As at 31 March 2015
As % of total IFA
%
As % of monthly base rent
%
FY 2015/16 35.7 32.4
FY 2016/17 23.3 28.2
FY 2017/18 and Beyond 30.8 34.7
Short-term Lease and Vacancy 10.2 4.7
Total 100.0 100.0
P.46

Additional Data 11:
Key Credit Metrics by Rating Agencies
As at
31 Mar 15 (3)
As at
31 Mar 14(3)
S&P
(A / Stable)
Moody’s
(A2 / Stable)
Total debt / total assets 11.9% 11.0% N/A < 30%
Debt / debt and equity (1) 10.9% 9.8% < 35% N/A
FFO (2) / debt 29.6% 39.3% > 15% N/A
EBITDA interest coverage 13.6x 12.7x N/A > 3.5x
Total debt / EBITDA 3.2x 2.5x N/A < 5.0x
Notes: (1) Equity is equal to net assets attributable to Unitholders.
(2) Funds from operations is calculated by net cash generated from operating activities with adjustments for operating lease expense,
interest expenses and income.
(3) Figures based on reports of rating agencies.
P.47

3.0x 3.2x 3.0x 2.5x
3.2x
10/11 11/12 12/13 13/14 14/15
Total Debt (1) / Total Asset Total Debt / EBITDA
EBITDA Interest Coverage Funds from Operations (2) / Total Debt
Notes: (1) Total Debt is calculated as Short Term Borrowings + Long Term Borrowings.
(2) Funds from Operations is calculated by net cash generated from operating activities with adjustments for operating lease expense
and interest .
Additional Data 12: Credit Profile – Strong Credit Metrics
27.3% 27.8% 32.2%
39.3%
29.6%
10/11 11/12 12/13 13/14 14/15
15.2% 16.0% 13.6%
11.0% 11.9%
10/11 11/12 12/13 13/14 14/15
6.6x
8.6x 10.0x
12.6x 13.2x
10/11 11/12 12/13 13/14 14/15
>30% – Moody’s rating trigger >5.0x – Moody’s rating trigger
<3.5x – Moody’s rating trigger
Buffer
Buffer
Buffer
Buffer
<15% – S&P rating trigger
P.48

-30%
-20%
-10%
0%
10%
20%
30%
40%
50%
92 93 94 95 96 97 98 99 00 01 02 03 04 05 06 07 08 09 10 11 12 13 14 Jan-Jul 15
Supermarkets
Jewellery
Foods & alcoholic drinks
Department stores
Clothing
Asian financial crisis
Tech bubble burst
Global financial crisis
SARS outbreak
Additional Data 13:
Year-on-year Change of Retail Sales Value
Source: Census & Statistics Department
P.49
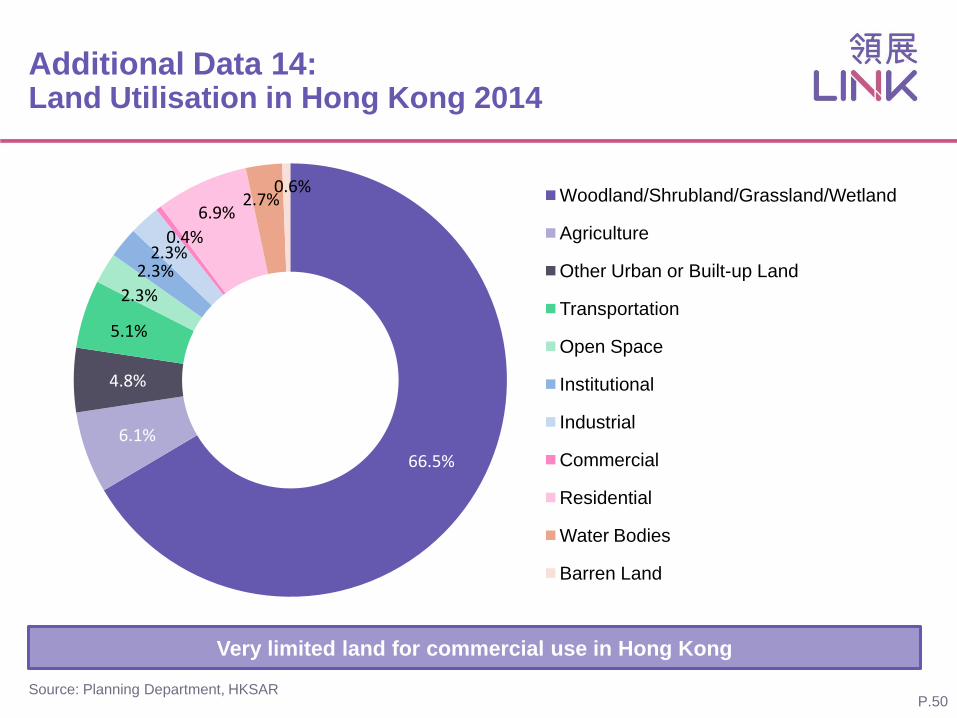
Additional Data 14: Land Utilisation in Hong Kong 2014
66.5%
6.1%
4.8%
5.1%
2.3%
2.3% 2.3%
0.4%
6.9% 2.7%
0.6% Woodland/Shrubland/Grassland/Wetland
Agriculture
Other Urban or Built-up Land
Transportation
Open Space
Institutional
Industrial
Commercial
Residential
Water Bodies
Barren Land
Very limited land for commercial use in Hong Kong
Source: Planning Department, HKSAR P.50

This document has been prepared by Link Asset Management Limited in its capacity as the Manager (the “Manager”) of Link Real Estate Investment Trust (“Link REIT”) solely for use at the presentations/meetings held and may not be reproduced or redistributed without permission. Neither this document nor any copy may be taken or transmitted into or distributed, directly or indirectly, in the United States or to any U.S. person (within the meaning of Regulation S under the United States Securities Act of 1933, as amended). Neither this document nor any copy may be taken or transmitted into or distributed or redistributed in Canada or to the resident thereof. The distribution of this document in other jurisdictions may be restricted by law and persons into whose possession this document comes should inform themselves about, and observe any such restrictions. By attending this presentation/meeting, you are deemed to agree to be bound by the foregoing restrictions and represent that you have understood and accepted the terms of this disclaimer. Any failure to comply with these restrictions may constitute a violation of applicable securities laws.
All information and data are provided for reference only. All opinions expressed herein are based on information available as of the date hereof and are subject to change without notice. The slides forming part of this document have been prepared solely as a support for oral discussion about Link REIT. No representation or warranty, express or implied, is made as to, and no reliance should be placed on, the fairness, accuracy, completeness or suitability of any information or opinion contained herein. None of Link REIT, the Manager, or any of its directors, officers, employees, agents or advisors shall be in any way responsible for the contents hereof, nor shall they be liable for any loss arising from use of the information contained in this presentation or otherwise arising in connection therewith.
This document may contain forward-looking statements. The past performance of Link REIT is not necessary indicative of the future performance of Link REIT and that the actual results may differ materially from those set forth in any forward-looking statements herein. Nothing contained in this document is, or shall be relied on, as a promise or forecast as to the future.
This document does not constitute an offer or invitation to purchase or subscribe for any securities of Link REIT and neither any part of it shall form basis of or be relied upon in connection with any contract, commitment or investment decision whatsoever. No action has been taken or will be taken by Link REIT, the Manager or any of its directors, officers, employees, agents or advisers, to register this document as an offering document or otherwise to permit public distribution of this document.
Disclaimer
P.51