Corporate Presentation December 2021 - Akumin
31
Akumin Inc. Corporate Presentation December 2021 Riadh Zine, Chairman & Co-CEO Rhonda Longmore-Grund, President & Co-CEO Bill Larkin, Chief Financial Officer
-
Upload
khangminh22 -
Category
Documents
-
view
3 -
download
0
Transcript of Corporate Presentation December 2021 - Akumin
Akumin Inc.
Corporate Presentation
December 2021
Riadh Zine, Chairman & Co-CEO Rhonda Longmore-Grund, President & Co-CEO Bill Larkin, Chief Financial Officer

Disclaimer and Disclosure Forward-LookingStatements
This presentation may contain forward-looking information or forward-looking statements w ithin the meaning of the U.S. Private Securities Litigation Reform Act of 1995 and/or applicable Canadian securities legislation (collectively, “forward-looking statements”). Forward-looking statements may include statements regarding, among other things, our prospects, business outlook, operations and strategy; service areas; competition; changes in law s and regulations and the impact of such changes on us; our estimates for future performance and operating results, including future revenues, cash flows and capital requirements. In some cases, forward-looking statements can be identif ied by the used of forward-looking terminology like “could,” “may,” “expects,” “anticipates,” “believes,” “intends,” “estimates,” and other similar w ords. Forward-looking statements are necessarily based upon a number of internal expectations, estimates, projections, assumptions, and beliefs that, w hile considered reasonable by management, are inherently subject to signif icant business, economic, competitive, and other uncertainties and contingencies, some of w hich are beyond the Company’s control. Forw ard-looking statements involved know n and unknow n risks, uncertainties, and other factors, including, but not limited to, the risks described in greater detail in the “Risk Factors” section of Akumin’s Management’s Discussion and Analysis for the quarter ended September 30, 2021 dated December 14, 2021, w hich is available at www.sedar.comand www.sec.gov. In light of these risks and uncertainties, there can be no assurance that the forward-looking statements contained in this presentation w ill in fact be realized, and actual results, performance or achievements could differ materially. Unless otherw ise specif ied, all forward-looking statements are given as of the date of Akumin’s last reported f iscal quarter and based on the opinions and estimates of management as at such date. Akumin and its aff iliates, employees, representatives and advisors expressly disclaim any and all liability based, in w hole or in part, on such forward-looking statements, and further disclaim any intention or obligation to update or revise such forward-looking statements, w hether as a result of new information, future events or otherw ise. Readers are cautioned not to put undue reliance on these forw ard-looking statements.
COVID-19
In addition and w ithout limiting the foregoing, Akumin notes that the COVID-19 pandemic has caused signif icant volatility and uncertainty, w hich could result in a prolonged economic dow nturn that has disrupted and is expected to continue to disrupt Akumin’s business. Akumin cannot reasonably estimate the ultimate length or severity of this pandemic, nor the impact on its future procedure volumes and revenues. The extent to w hich the COVID-19 pandemic ultimately impacts Akumin’s business, f inancial condition, results of operations, cash flows, and liquidity may differ frommanagement’s current estimates due to inherent uncertainties regarding the duration and further spread of the outbreak, its severity, actions taken to contain the virus or treat its impact, and how quickly and to w hat extent normal economic and operating conditions can resume.
Non-GAAP Measures
This presentation refers to certain non-GAAP measures. These non-GAAP measures are not recognized measures under United States generally accepted accounting principles (“GAAP”) and do not have a standardized meaning prescribed by GAAP. There is unlikely to be comparable or similar measures presented by other companies. Rather, these nonGAAP measures are provided as additional information to complement those GAAP measures by providing further understanding of our results of operations from management’s perspective. Accordingly, these non-GAAP measures should not be considered in isolation nor as a substitute for analysis of our f inancial information reported under GAAP. We use non-GAAP financial measures, including “EBITDA”, “Adjusted EBITDA”, “Adjusted EBITDA Margin”, “Free Cash Flow ” and “Pro forma” These non-GAAP measures are used to provide readers w ith supplemental measures of our operating performance and thus highlight trends in our core business that may not otherw ise be apparent w hen relying solely on GAAP measures. We believe the use of these non-GAAP measures, along w ith GAAP financial measures, enhances the reader’s understanding of our operating results and is useful to us and to investors in comparing performance w ith competitors, estimating enterprise value, and making investment decisions. Our management regularly communicates Adjusted EBITDA and their interpretation of such results to our board of directors. We also believe that securities analysts, investors, and other interested parties frequently use non-GAAP measures in the evaluation of issuers. Our management uses non-GAAP measures to facilitate operating performance comparisons from period to period, to prepare annual operating budgets and forecasts and to determine components of management compensation. Except as otherw ise specif ied in this presentation, definitions and reconciliations of non-GAAP measures to the relevant reported measures can be found in our Management’s Discussion and Analysis dated September 30, 2021 (our “Interim MD&A”) available in our public disclosure at www.sedar.comand www.sec.gov. When w e use “Pro forma” in this presentation, unless otherw ise noted means trailing tw elve for September 30th, 2021 for Akumin and includes Alliance as though acquired at the beginning of the trailing tw elve month period.
-
2

Today’s Presenters
Riadh Zine Chairman of the Board and Co-CEO
• Akumin’s CEOsince it started in 2014,now serves as Chairman and Co-CEO
• Previously Managing Director in Global InvestmentBanking at RBC Capital Markets, providing strategic and financial advice to many corporations and private equity firms
• 13+ years of experience executing public or private equity and debt financing, as well as mergers and acquisitions for a wide range of companies in the consumer, retail, healthcare, transportation and industrial sectors
• Began career at Royal Bank of Canada in strategic projects including mergers and integrations
• Master of Science in financial engineering from University of Montreal (Ecole des Hautes Études Commerciales)
Rhonda Longmore-Grund Presidentand Co-CEO
• Previously Presidentand ChiefExecutive Officer of Alliance HealthCare Services from 2018 to 2021. Joined Alliance in 2016 as Executive Vice Presidentand CFO
• Significant international and capital market experience; successfullyled organizations through strategic expansion and growth.
• Prior to Alliance, SVP and CFO for Printronix, global provider of industrial print technologysolutions serving Fortune 500 customers in 100 countries
• Served on the executive teams of Ingram Micro, Inc., Exult, Inc., Velocium (now owned by Northrop Grumman) and Digital Equipment Corporation (DEC)
• Master of Arts in Law and Diplomacy focusing and International Business Relations from The Fletcher School of Law and Diplomacyat Tufts University.
Bill Larkin ChiefFinancial Officer
• Previously Executive Vice President& Chief Financial Officer of Alliance HealthCare Services, having joined the companyin 2019.
• Experience spans a diverse setof corporate environments ranging from entrepreneurial startups,high growth mid-caps and mature multi-billion enterprises.
• Prior to Alliance, he served as Chief Financial Officer of both public and privately held companies atFuel Systems Solutions, Westport Innovations and SouthWest Dealer Services Inc. In each case, the companies were experiencing significant growth, expansion and change in operating complexities both in the U.S. and internationally.
• CPA with Deloitte & Touche, veteran of the US Army; B.S. in Accounting from the University of Southern California
3

Akumin At a Glance
• #2 overall radiology servicesprovider: ~2 million procedures/yearin 46 states
• #1 provider of PET/CT services• #2 provider of MRI services• #2 fixed site clinic locations• #1 mobile radiology provider
• #2 provider of radiation therapyservices to U.S. hospitals treatingmore than 10,000 cancer patients peryear
• Serving ~1,000 hospitalrelationships across the nation
• ~$730M of Revenue1 betweenRadiology and Oncology
1Revenue based on Pro forma trailing twelve months (“TTM”) Sept 2021 excluding the recent sales of !lliance Interventional (executed in the first half of 2021) and Alliance Oncology of Arizona (executed Q4 2021).
4
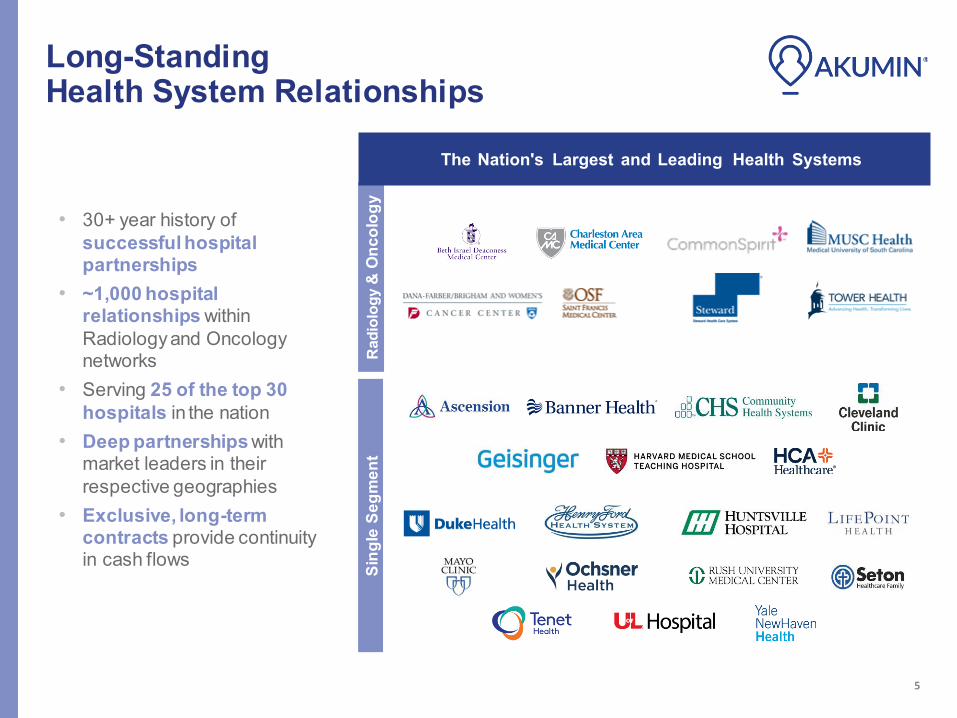
Long-Standing Health System Relationships
• 30+ year history ofsuccessful hospitalpartnerships
• ~1,000 hospitalrelationships withinRadiologyand Oncologynetworks
• Serving 25 of the top 30hospitals in the nation
• Deep partnerships withmarket leaders in theirrespective geographies
• Exclusive, long-termcontracts provide continuityin cash flows
The Nation’'s Largest and Leading Health Systems
Rad
iolo
gy &
Onc
olog
ySe
gmen
t
Sing
le
5

Flexible Approach Focused on Fixed Site Development & Growth
• Comprehensive solutions delivered through a flexible approach to partnership
• Capability to create affiliations tailored to the needs and goals of the partner(s) and community
• Solutions and structures developed collaboratively in context of:• Competition• Referral source dynamics• Payor backdrop• Provider environment
• Experience in executing countless partnership structures with health systems • Complete Outsourcing• Management Services• Economic Partnerships• Joint Ventures
Mobile
• Shared platform, part-time, daily, weekly
• Long term contracts and interim solutions
• Single & Multi-modality • Outpatient focused
On-Campus
Fixed Sites
• Within or adjacent to hospital
• Single or multi-modality• Partial or full service
line offering• Outpatient focused
Outpatient Fixed Sites
• Convenient location• Independent or multi
partner• Integrated services• Long-term, often in JVs• Entirely outpatient
Outpatient Networks
• Market or regional leadership strategy
• On/off campus• Long-term, multi
partner integrated care• Majority outpatient
-
-
Fixed Site Count – As Reported
204
35
129 74 96
39
2017 2018 2019 2020 YTD 2021
Radiology Oncology
Oncology sites exclude div ested Alliance Oncology of Arizona (Q4 2021)
6

Outpatient-Focused Platform
~95% of the company’s overall revenue is derived from outpatient procedures
• 50% of revenue is receivedvia third party andgovernment payers, forwhich we bill outpatientservices
• 50% of revenue is receivedvia health systems andhospitals, of which virtuallyall is for outpatientservices
Overall Payor Mix (% of Revenue)
Hospital 50%
Third-Party
Payors 40%
Medicare/ Medicaid 10%
Hospital Mix of Outpatient (% of Revenue)
Outpatient Revenue 97%
Inpatient Revenue
3%
Pro f orma TTM Sept 2021 f or Radiology and Oncology 7

Diverse Service Lines and Modalities
• Continued diversification ofrevenue between Radiologyand Oncology divisions
• Akumin provides a full suite ofradiology and oncologyservices with a focus on high-growth and high-valuemodalities
Service Lines (% of Revenue)
80%
Radiology
20%
Oncology
Radiology Procedure Mix (% of Revenue)
8 Excludes Interv entional segment which was div ested in f irst half of 2021; Pro Forma; TTM as of Sept 30, 2021.
80%
20%

A Powerhouse in Radiology
Akumin is the nation’s #2 overall radiology company, with more than 2 million patient visits per year
Akumin is the nation’s #2 MRI provider
• A critical diagnostic tool for complexhealth conditionsand surgical planning; leads to significant downstreamrevenue for hospitals
Akumin is the nation’s #1 PET/CT provider
• PET/CT is one of the fastest growing modalities in cancercare, and increasing in cardiologyand neurology
• Akumin is the largest employerof PET/CT technologistsin the US
Total RadiologyVolume/Year (Pro Forma)
Modality Volume – Q3’21 TTM (Pro Forma)
2,006,759
1,916,412
2,134,415
FY2019 FY2020 Q3'21 TTM
MRI 857,892
PET/CT 126,423
Other Modalities 1,150,100
9
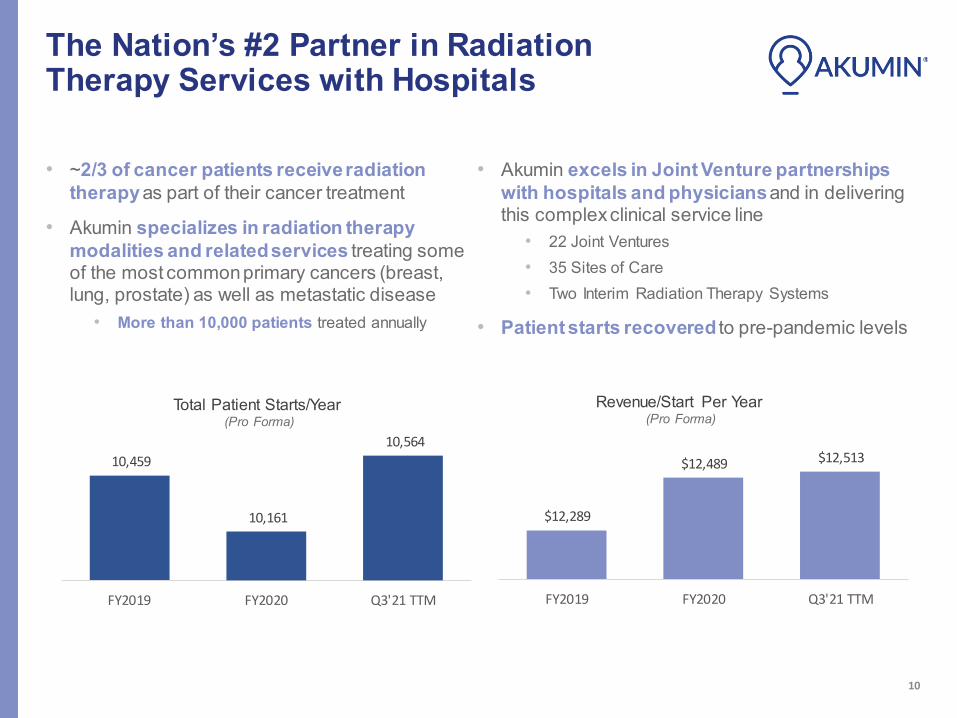
The Nation’s #2 Partner in RadiationTherapy Services with Hospitals
• ~2/3 of cancer patients receiveradiationtherapy as part of their cancer treatment
• Akumin specializes in radiation therapymodalities and relatedservices treating someof the most commonprimary cancers (breast,lung, prostate) as well as metastatic disease
• More than 10,000 patients treated annually
Total Patient Starts/Year (Pro Forma)
10,564
10,459
10,161
FY2019 FY2020 Q3'21 TTM
• Akumin excels in Joint Venture partnershipswith hospitals and physicians and in deliveringthis complexclinical service line
• 22 Joint Ventures• 35 Sites of Care• Two Interim Radiation Therapy Systems
• Patient starts recovered to pre-pandemic levels
Revenue/Start Per Year (Pro Forma)
$12,513 $12,489
$12,289
FY2019 FY2020 Q3'21 TTM
10
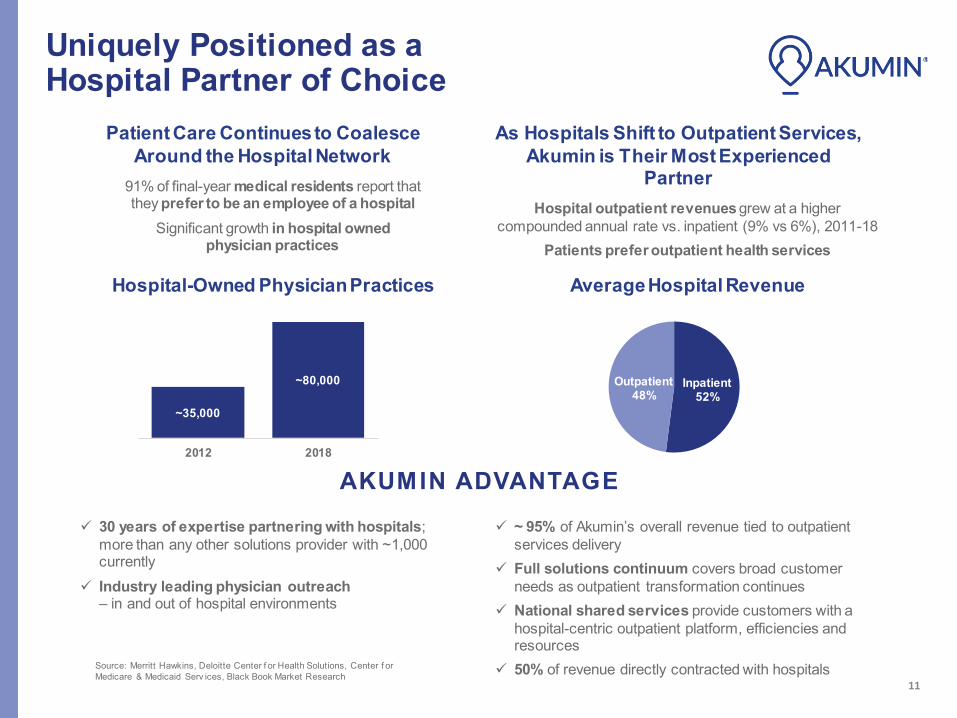
Uniquely Positioned as a Hospital Partner of Choice
Patient Care Continuesto Coalesce Around the Hospital Network
91% of final-year medical residents report that they prefer to be an employee of a hospital
Significant growth in hospital owned physician practices
Hospital-Owned PhysicianPractices
~35,000
~80,000
2012 2018
As Hospitals Shift to Outpatient Services, Akumin is Their Most Experienced
Partner Hospital outpatient revenues grew at a higher
compounded annual rate vs. inpatient (9% vs 6%), 2011-18 Patients prefer outpatient health services
AverageHospital Revenue
Inpatient 52%
Outpatient 48%
AKUMIN ADVANTAGE
✓ 30 years of expertise partnering with hospitals; more than any other solutions provider with ~1,000 currently
✓ Industry leading physician outreach – in and out of hospital environments
✓ ~ 95% of Akumin’s overall revenue tied to outpatient services delivery
✓ Full solutions continuum covers broad customer needs as outpatient transformation continues
✓ National shared services provide customers with a hospital-centric outpatient platform, efficiencies and resources
✓ 50% of revenue directly contracted with hospitals Source: Merritt Hawkins, Deloitte Center f or Health Solutions, Center f or Medicare & Medicaid Serv ices, Black Book Market Research
11
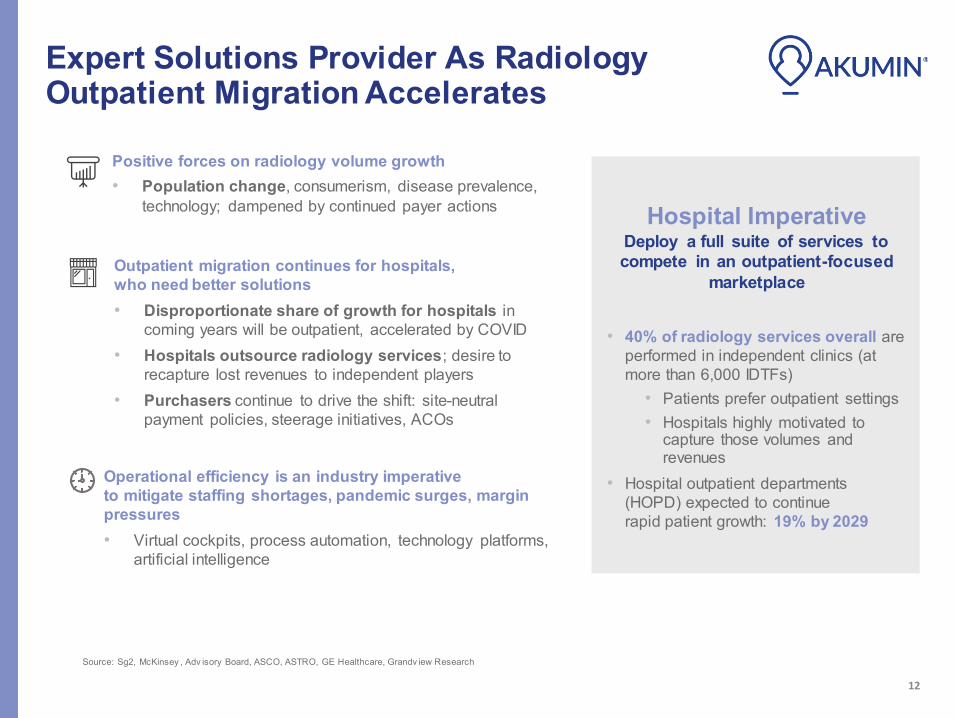
Expert Solutions Provider As Radiology Outpatient Migration Accelerates
Positive forces on radiology volume growth • Population change, consumerism, disease prevalence,
technology; dampened by continued payer actions
Outpatient migration continues for hospitals, who need better solutions • Disproportionate share of growth for hospitals in
coming years will be outpatient, accelerated by COVID • Hospitals outsource radiology services; desire to
recapture lost revenues to independent players • Purchasers continue to drive the shift: site-neutral
payment policies, steerage initiatives, ACOs
Operational efficiency is an industry imperative to mitigate staffing shortages, pandemic surges, margin pressures • Virtual cockpits, process automation, technology platforms,
artificial intelligence
Hospital Imperative Deploy a full suite of services to compete in an outpatient-focused
marketplace
• 40% of radiology services overall are performed in independent clinics (at more than 6,000 IDTFs)
• Patients prefer outpatient settings • Hospitals highly motivated to
capture those volumes and revenues
• Hospital outpatient departments (HOPD) expected to continue rapid patient growth: 19% by 2029
Source: Sg2, McKinsey , Adv isory Board, ASCO, ASTRO, GE Healthcare, Grandv iew Research
12

Strategic Partner in a Cancer Care Market Demanding Efficiency and Collaboration
COVID-19 impacts are ongoing and evolving • Many cancer screening monthly volumes have
returned to pre-pandemic levels• Still deficits for those who skipped screenings in
2020/2021• Per a recent survey, Radiation Oncologists:
66% are seeing more advanced-stage cancers
73% are seeing more advanced- stage cancers
Purchasers focus: cost reductions in cancer care • Commercial plans focused on utilization, site-of-care
shifts (OP), price transparency and prior authorizations• Employers utilizing second-opinion services and
narrowed networks, as cancer care makes up 12% of employers’ total medical spend
• CMS is reducing payments via value-based care anddrug spend controls – and receiving pushback
Cancer incidence, overall, continues to grow • Number of newly diagnosed cancers per year is projected
to double in the next two decades
Overall Five-Year Growth: Cancers We Treat
7.6% 7.3% 11.2%
6.6% 8.8%
13.2% 10.1% 11%
Brain, CNS Breast Colon, GI Gynecologic Head and Lung Melanoma Prostate, Neck Urologic
Radiology and technological advances continue to impact oncology market • Radiology and radiation oncology are increasingly
integrated partners in diagnoses and treatment • Precision and accuracy in radiation therapy are continuing
to increase due to technological advancements• Exciting developments are ahead: theragnostics, artificial
intelligence, etc.
Source: Adv isory Board ASCO, ASTRO, GE Healthcare, Grandv iew Research
13
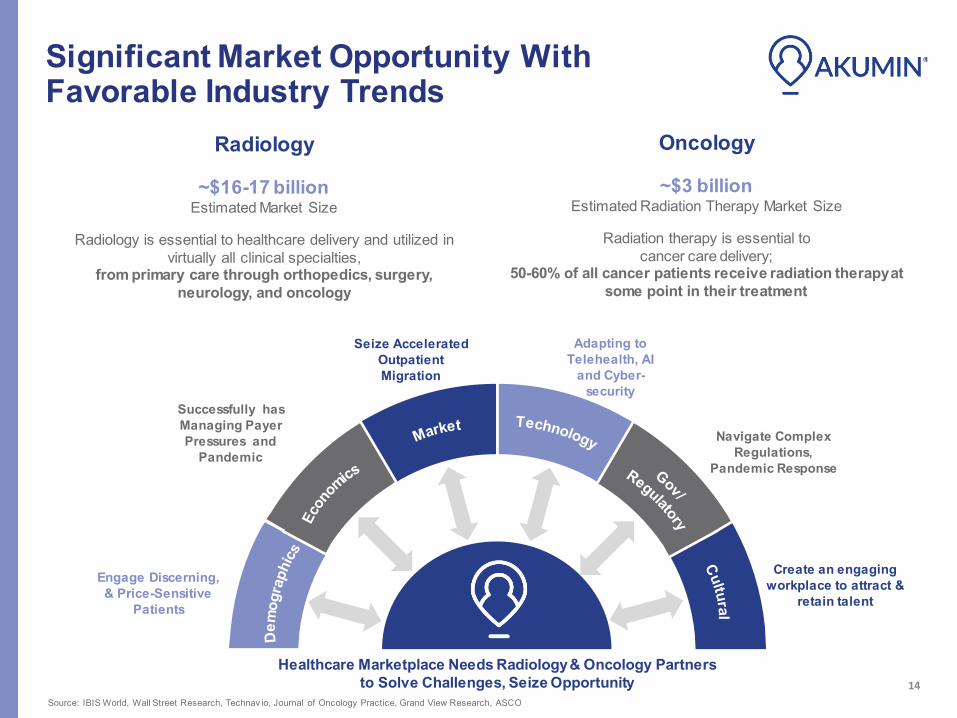
Significant Market Opportunity With Favorable Industry Trends
Radiology
~$16-17 billion Estimated Market Size
Radiology is essential to healthcare delivery and utilized in virtually all clinical specialties,
from primary care through orthopedics, surgery, neurology, and oncology
Oncology
~$3 billion Estimated Radiation Therapy Market Size
Radiation therapy is essential to cancer care delivery;
50-60% of all cancer patients receive radiation therapyat some point in their treatment
Engage Discerning, & Price-Sensitive
Patients
Successfully has Managing Payer Pressures and
Pandemic
Seize Accelerated Outpatient Migration
Adapting to Telehealth, AI
and Cyber-security
Navigate Complex Regulations,
Pandemic Response
Create an engaging workplace to attract &
retain talent
Healthcare Marketplace Needs Radiology& Oncology Partners to Solve Challenges, Seize Opportunity
Source: IBIS World, Wall Street Research, Technav io, Journal of Oncology Practice, Grand View Research, ASCO
14
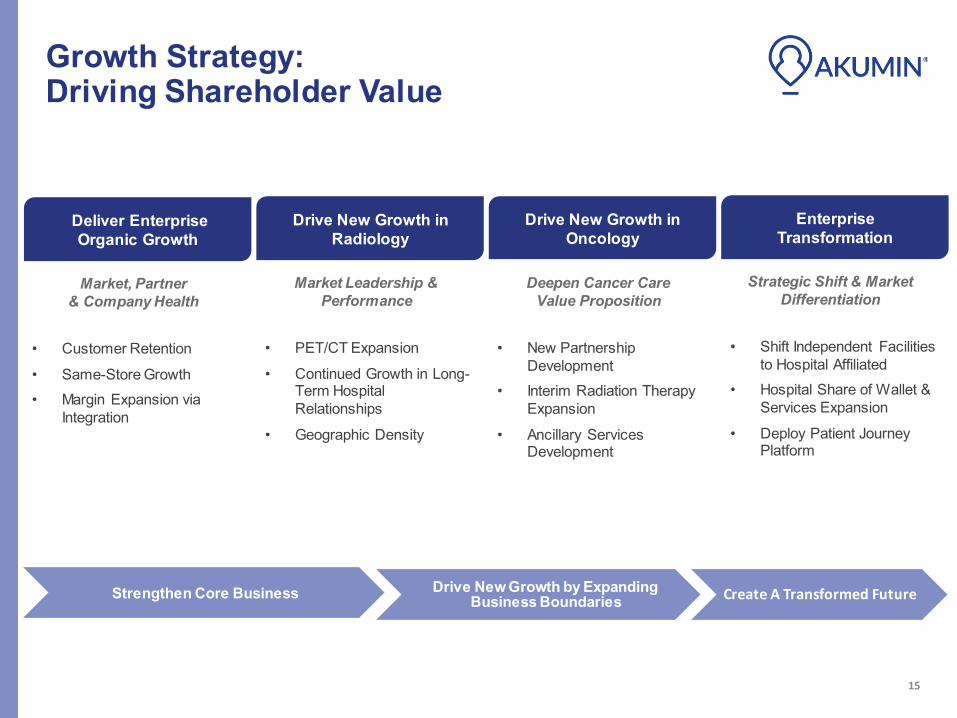
Growth Strategy: Driving Shareholder Value
Deliver Enterprise Organic Growth
Market, Partner & Company Health
• Customer Retention
• Same-Store Growth • Margin Expansion via
Integration
Drive New Growth in Radiology
Market Leadership & Performance
• PET/CT Expansion
• Continued Growth in Long-Term Hospital Relationships
• Geographic Density
Drive New Growth in Oncology
Deepen Cancer Care Value Proposition
• New Partnership Development
• Interim Radiation Therapy Expansion
• Ancillary Services Development
Enterprise Transformation
Strategic Shift & Market Differentiation
• Shift Independent Facilities to Hospital Affiliated
• Hospital Share of Wallet & Services Expansion
• Deploy Patient Journey Platform
Strengthen Core Business Drive New Growth by Expanding Business Boundaries Create A Transformed Future
15

Enabling Value Creation Via Operational Platform Transformation
We are building innovative standardization in
• Patient journey • Clinical workflow • Data
Focusedon creating a scalable service deliveryplatform
Because delivering exceptional patient engagement and experiences is the foundation of our value to partners
Patient Experience
16
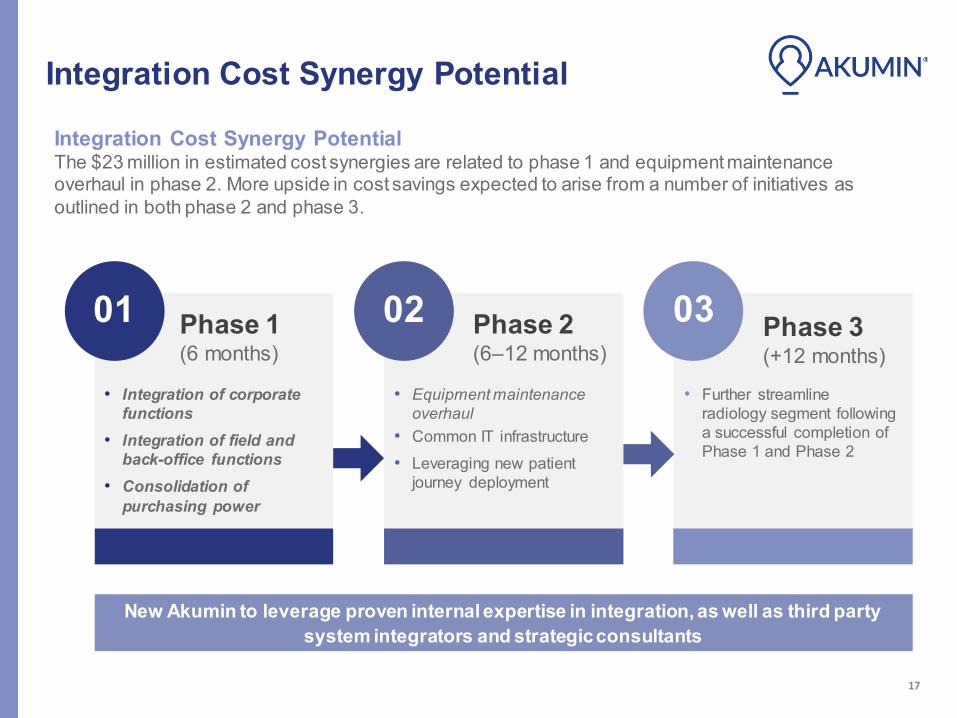
Integration Cost Synergy Potential
Integration Cost Synergy Potential The $23 million in estimated cost synergies are related to phase 1 and equipment maintenance overhaul in phase 2. More upside in cost savings expected to arise from a number of initiatives as outlined in both phase 2 and phase 3.
01 Phase 1 (6 months)
• Integration of corporate functions
• Integration of field and back-office functions
• Consolidation of purchasing power
02 Phase 2 (6–12 months)
• Equipment maintenance overhaul
• Common IT infrastructure • Leveraging new patient
journey deployment
03 Phase 3 (+12 months)
• Further streamline radiology segment following a successful completion of Phase 1 and Phase 2
New Akumin to leverage proven internal expertise in integration, as well as third party system integrators and strategic consultants
17

Financial Performance

Radiology Volume Trends – Pro Forma • Same Store MRI Volume Growth: +8.5% in Q3 2021 • Same Store PET/CT Volume Growth: +2.2% in Q3 2021 • Same Store Total Procedures Volume Growth: +8.9% in Q3 2021
Same Store Volume Growth
Total Volumes MRI PET/CT Total Procedures
19
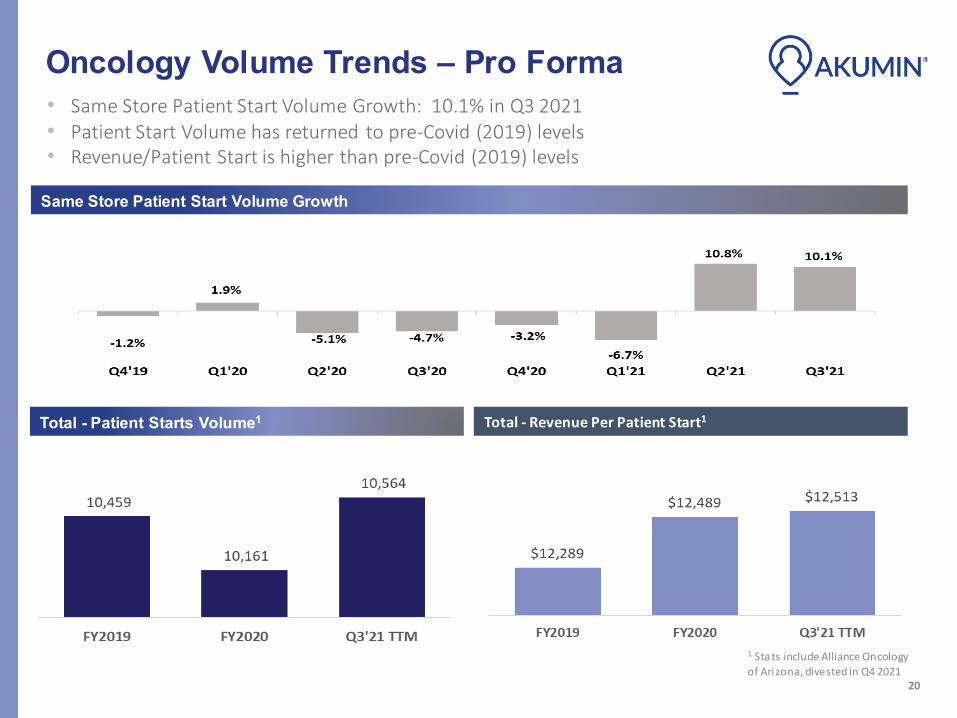
Oncology Volume Trends – Pro Forma • Same Store Patient Start Volume Growth: 10.1% in Q3 2021• Patient Start Volume has returned to pre-Covid (2019) levels• Revenue/Patient Start is higher than pre-Covid (2019) levels
Same Store Patient Start Volume Growth
Total - Patient Starts Volume1 Total - Revenue Per Patient Start1
1 Sta ts include Alliance Oncology of Arizona, divested in Q4 2021
20

Financial Performance Trend Statutory (As Reported) and Pro Forma Revenue1
($M)
Adjusted EBITDA2
($M)
Maintenance CAPEX3
($M)
Growth CAPEX3
($M)
1 Pro forma includes A lliance O ncology of A rizona (div ested Q 4 2021) which contributed $13.2M of Rev enue TTM and Interv entional Div ision (div ested first half 2021) which contributed $18.4M TTM.
Both segments were div ested. 2 Pro forma includes A lliance O ncology of A rizona (div ested Q 4 2021) which contributed ($3.0M) of A djusted EBITDA TTM and Interv entional Div ision (div ested first half 2021) which contributed $1.1M A djusted EBITDA TTM. Both segments were div ested. A djusted EBITDA is not a standardized financial measure under GA AP and might not be comparable to similar financial measures disclosed by other issuers. See “Non-GAAP Measures” and “How We A ssess the Performance of O ur Business” in our Interim MD&A . See page 29 for defnii tion of A djusted EBITDA. 3 C apex may be financed w ith cash, capital leases, change in deposits and A P.
21

Segment Financial Performance Statutory & Pro Forma
Q3 2021
($ in M) RAD ONC Corp Total
Revenue $ 95.0 $ 13.2 $ - $ 108.2% vs prior year 50.3% n/m 71.1%
Adjusted EBITDA $ 16.6 $ 4.9 $ (3.5) $ 18.0 % vs prior year 35.9% n/m 47.4%
Adjusted EBITDA Margin 17.4% 37.2% 16.6%
Q3 2021 YTD
($ in M) RAD ONC Corp Total
Revenue $ 228.5 $ 13.2 $ - $ 2 41.6 % vs prior year 27.8% n/m 35.2%
Adjusted EBITDA $ 42.5 $ 4.9 $ (8.0) $ 3 9.4 % vs prior year 48.8% n/m 37.9%
Adjusted EBITDA Margin 18.6% 37.2% 16.3%
Q3 2021 Pro Forma1
($ in M) RAD ONC Corp Total
Revenue $150.5 $39.5 -$ $ 190.0 % vs prior year 4.4% 9.6% 5.5%
Adjusted EBITDA $ 29.0 $14.2 $ (5.7) 37.5 $ % vs prior year -22.5% 0.7% -12.7%
Adjusted EBITDA Margin 19.2% 36.1% 19.7%
Q3 2021 YTD Pro Forma1
($ in M) RAD ONC Corp Total
Revenue $ 449.6 $ 111.1 $ - $ 560.7 % vs prior year 10.4% 6.0% 9.4%
Adjusted EBITDA $ 97.1 $ 37.5 $(16.5) $ 1 18.1 % vs prior year 6.3% -2.3% 4.8%
Adjusted EBITDA Margin 21.6% 33.8% 21.1%
1Pro Forma segment results excludes Interventional segment which was divested in first half of 2021.
Adjusted EBITDA and Adjusted EBITDA Margin are not standardized financial measures under GAAP and might not be comparable to similar financial measures disclosed byother issuers.See “Non-GAAP Measures” and “How We Assess the Performance ofOur Business” in our Interim MD&A.
22

Guidance & Valuation
2022 Guidance
•
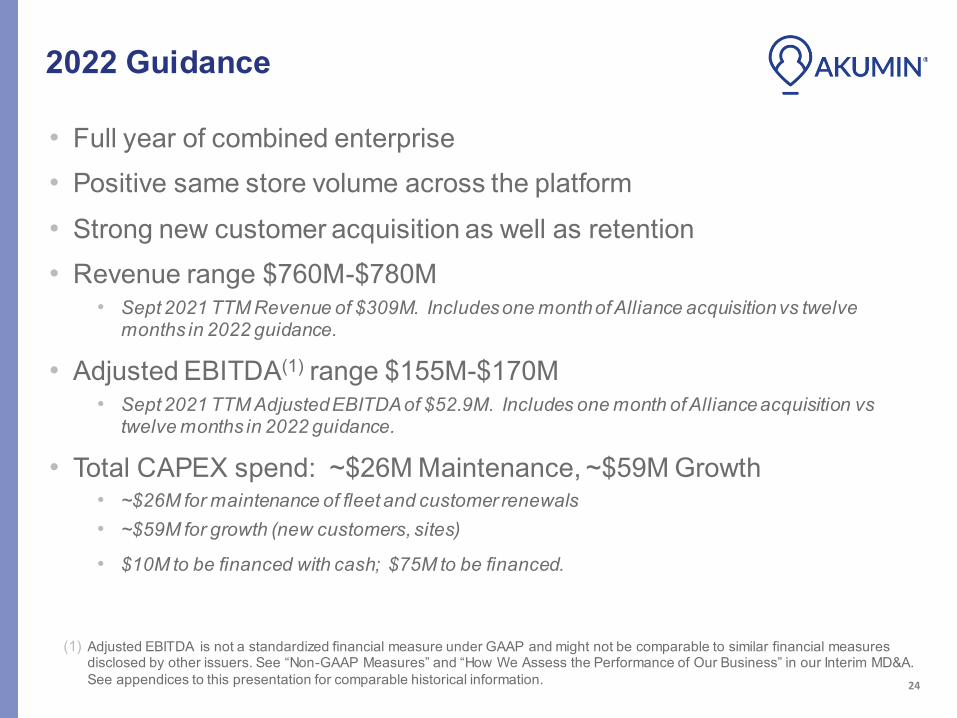
Full year of combined enterprise • Positive same store volume across the platform • Strong new customer acquisition as well as retention • Revenue range $760M-$780M
• Sept 2021 TTM Revenue of $309M. Includesone monthof Alliance acquisitionvs twelve months in 2022 guidance.
•Adjusted EBITDA(1) range $155M-$170M • Sept 2021 TTM AdjustedEBITDAof $52.9M. Includes one month of Allianceacquisition vs
twelve months in 2022 guidance.
•Total CAPEX spend: ~$26M Maintenance, ~$59M Growth • ~$26M for maintenance of fleet and customer renewals • ~$59M for growth (new customers, sites)
• $10M to be financed with cash; $75M to be financed.
(1) Adjusted EBITDA is not a standardized financial measure under GAAP and might not be comparable to similar financial measures disclosed by other issuers. See “Non-GAAP Measures” and “How We Assess the Performance of Our Business” in our Interim MD&A. See appendices to this presentation for comparable historical information. 24

Free Cash Flow Generation
The company expects to generate free cash flows of ~$55mm as per the following assumptions:
• Mid range of the 2022 guidance
• Full deployment of 2022 Growth CAPEX of $59M and Maintenance Capex of $26mm
• After integration synergies andrun-rate of planned 2022 growth investments
• Stonepeak interest payment are PIK’s during 2022
$3.7M LTM Sept 2021 represents only one month of Alliance, vs 2022 Midpoint which includes a full twelve months period for the combined entities.
LTM
Sep 30 2021
2022
Midpoint
2022
Runrate
Adjusted EBITDA(1) $ 42.1 $ 160.6 $ 186.8 (2)
Less:
Cash interest payments (20.0) (67.5) (67.5)
Capital lease payments (6.1) (32.4) (32.4)
Cash Capex (7.5) (10.0) (10.0)
Cash MI Distributions (4.8) (22.0) (22.0)
Free Cash Flow (2) $ 3.7 $ 28.8 $ 55.0
(1) Run rate Adjusted EBITDA includes 2022 mid point guidance, run-rate adjustments f or 2022 business dev elopment inv estments plus targeted integration sy nergies. See Appendix 1 f or reconciliation to net income. (2) Free Cash Flow is not a standardized f inancial measure under GAAP and might not be comparable to similar f inancial measures disclosed by other issuers. See the appendices to this presentation f or a def inition of such term and f or comparable historical inf ormation. 25

Capital Structure – A Solid Foundation for Growth
Strong Alignment of Interests Management and insiders, including Stonepeak, own approximately 40% resulting in strong alignment of interests with all stakeholders
Akumin’s capital structure is comprised of a diverse set of capital providers including traditional banks, bondholders and Stonepeak as debt and equity stakeholders
This diverse investor base provides a solid foundation as the company executes on its integration, planned growth and transformational initiatives
(US$ millions, unless noted)
Share Price ($) $ 1.70 Total Shares Outstanding (mm) 89.0 Equity Value $ 151.3
Total Secured Debt $ 903.2 Less: Cash $ (55.9)
Net Secured Debt $ 847.3
Adj. EBITDA (1) $ 160.6 Net Secured Debt / Adj. EBITDA 5.3x
Equity Value $ 151.3 Plus: Net Secured Debt $ 847.3 Stonepeak Debt $ 357.0 Minority Interest $ 211.0
Enterprise Value $ 1,566.6 EV / Adj. EBITDA 9.8x
Based on mid-point of 2022 guidance pre-sy nergies and excluding run-rate impact of 2022 planned growth initiativ es
26

Strong Partners Well-Aligned With Shareholders
•The support of Stonepeak was integral to the successful completionof the Alliance acquisition and, through its subordinated notes, equity position and warrant holdings, is well-aligned with shareholders as key beneficiaries of Akumin’s future growth.
Stonepeak at a glance • Leading alternative investment firm
with over $39 billion of assets under management (as of June 30, 2021).
• Sponsors investment vehicle focused on private equity and credit
• Provides capital, operational support, and committed partnership to sustainably grow investments in target sectors
• 30 portfolio companies • Headquartered in New York; offices
in Austin, TX and Hong Kong.
27

Thank you! Riadh Zine, Chairman & Co-CEO Rhonda Longmore-Grund, President & Co-CEO Bill Larkin, Chief Financial Officer

Appendix 1: Net Income to Adjusted EBITDA Reconciliation ~AKUMIN"
Three monthsended
September 30, 2021
(Restated-Note 4)
Three months ended
September 30, 2020
Nine months ended
September 30, 2021
(Restated-Note 4)
Nine months ended
September 30, 2020
Net income (I oss) $ 1, 180 $ (6,376) $ (8, 182) $ (16, 175) Interest expense 16,932 8,961 34,221 24,437 Income tax expense (benefit) (22,070) (473) (21, 999) 498 Depreciation and amortization 11 ,286 4, 359 20,359 13,001
EB I TOA 7,328 6,471 24,399 21, 761 Adjustments:
Stock-based com pensation 785 568 1, 997 1,726 Acquisition-related costs 8,784 174 14,412 474 Settlement and related costs (recoveries) (52) 1,611 (394) 2,491 Financial instrum ents revaluation and related losses (gains) (50) 2,895 (3,410) (1 ,178)
Severance, restructuring and other charges 532 532 Other losses (gains) 20 63 320 283 Deferred rent expense 621 409 1, 525 3,002
Adjusted EBITDA $ 17,968 $ 12,191 $ 39,381 $ 28,559
EBITDA means net income (loss) before interest expense (net), income tax expense (benefit) and depreciation and amortization. Adjusted EBITDA” means EBITDA, as further adjusted for stock-based compensation, asset impairments, settlement and related costs (recoveries), financial instrument revaluation and related losses (gains), acquisition-related costs, severance and related costs, restructuring charges, other losses (gains), deferred rent expense (credit), and one-time adjustments. “Adjusted EBITDA Margin” means Adjusted EBITDA divided by the total revenue in the period. 29

Appendix 2Income Statement ~AKUMIN" Three months
ended September 30,
2021
(Restated-Note 4) Three months
ended September 30,
2020
Nine months ended
September 30, 2021
(Restated-Note 4) Nine months
ended September 30,
2020
Revenues $ 108, 177 $ 63,213 $ 241,636 $ 178,747
Operating expenses: Cost cl operations, excludng depreciation and amortization 91 ,496 51 ,045 204,406 152,588 Depreciation and amortization 11 ,286 4,359 20, 359 13,001 Stock-based compensation 785 568 1,997 1,726 Operational financial instruments revaluation and other
losses (gains) (68) 3,630 278 (4,482) Tctal operating expenses 103,499 59,602 227,040 162,833 Income from operations 4,678 3,611 14, 596 15,914
Other expense (income): Interest expense 16,932 8,961 34, 221 24,437 Acquisition-related costs 8,784 174 14, 412 474 Settlement and related costs (recoveries) (52) 1,611 (394) 2,491 Other financial instruments revaluation and other
losses (gains) (96) (286) (3,462) 4,189 Tctal other expense, net 25,568 10,460 44, 777 31 ,591 Loss before income taxes (20,800) (6,849) (30, 181) (15,677) Income tax expense (benefit) (22,070) (473) (21,999) 498
Net income (lossj 1, 180 (6,376) (8,182) (16,175)
Less: Net income attributable to noncontrolling interest 2,517 835 3,388 1,876
Net loss attributable to common shareholders $ (1 ,337) $ (7,211) $ (11,570) $ (18,051)
Comprehensive income (lossj, net of taxes: Net income (loss) $ 1, 180 $ (6,376) $ (8, 182) $ (16,175)
Unrealized loss on hedging transactions , net of taxes (8) (8) Reclassification adjustment for losses included in net
loss, net of taxes 7 7 Comprehensive inccme (loss), net of taxes 1, 179 (6,376) (8, 183) (16,175) Less: Comprehensive income attributable to
noncontrol ling interest 2,517 835 3,388 1,876 Comprehensive Joss att ributable to common
shareholders $ (1 ,338) $ (7,211) $ (11,571) $ (18,051)
Net Joss per share attributable to common shareholders: Basic and Diluted $ (002) $ (0 10) $ (0 16) $ (026)
30
Appendix 2Income Statement
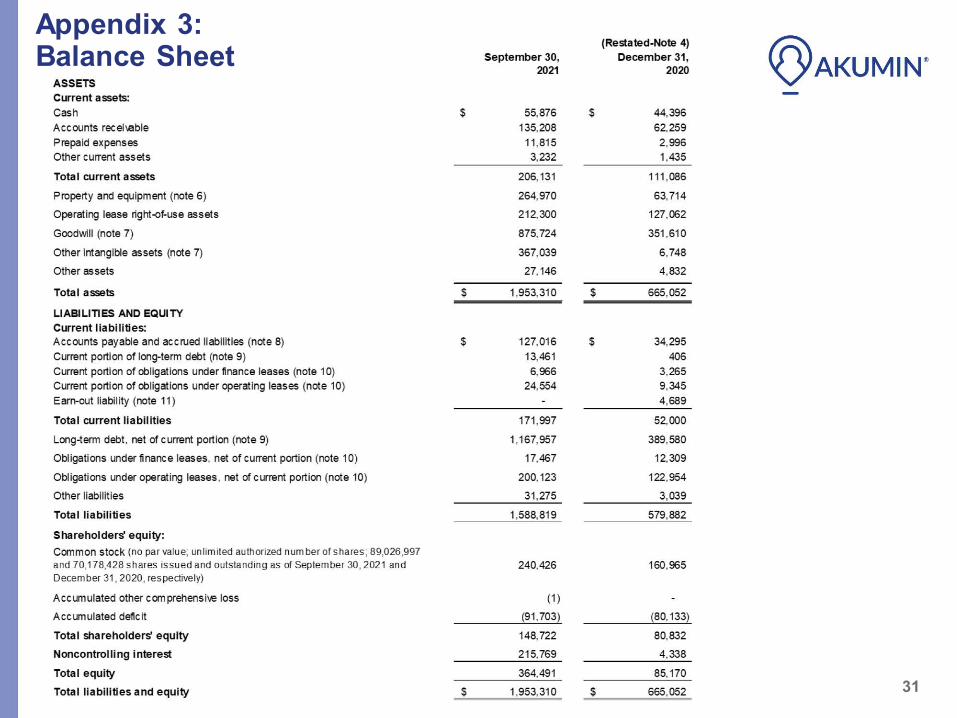
Appendix 3: Balance Sheet ~AKUMIN"
31
September 30, 2021
(Restated-Note 4) December 31,
2020 ASSETS Current assets: Cash $ 55,876 $ 44,396 Accounts receilable 135,208 62,259 Prepaid expenses 11,815 2,996 Other current assets 3,232 1,435
Total current assets 206, 131 111 ,086
Property and equipment (note 6) 264,970 63,714
Operat ing lease right-of-use assets 212,300 127,062
Goodwill (note 7) 875,724 351 ,610
Other intangible assets (note 7) 367,039 6,748
Other assets 27, 146 4,832
Total assets $ 1,953,310 $ 665,052
LIABILITIES AND EQUITY Current liabi lities: A ccounts payable and accrued liabilities (note 8) $ 127,016 $ 34,295 Current portion of long-term debt (note 9) 13,461 406 Current portion of obligations under finance leases (note 10) 6,966 3,265 Current portion of obligations under operating leases (note 10) 24,554 9,345 Earn-out liability (note 11 ) 4,689
Tota I current Ii abilities 171,997 52,000
Long-term debt, net of current portion (note 9) 1,167,957 389,580
Obl igations under fi nance leases, net of current portion (note 10) 17,467 12,309
Obligations under operating leases , net of current portion (note 10) 200, 123 122,954
Other liabilities 31 ,275 3,039
Tota l liabilities 1,588,819 579,882
Sharehol ders' equity: Common stock (no par value; unlimited authorized number of shares ; 89,026,997 and 70, 178,428 shares issued and outstanding as of September 30, 2021 and December 31 , 2020, respectively)
240,426 160,965
Accumulated other comprehensive loss (1)
A ccumulated defic it (91 , 703) (80, 133)
Tota l shareholders' equity 148,722 80,832
Noncontrolling interest 215,769 4,338
Total equity 364,491 85, 170
Total liabilities and equity $ 1,953,310 $ 665,052
Appendix 3: Balance Sheet
31