Corporate Governance and Market Liquidity: An Empirical Analysis
31
Electronic copy available at: http://ssrn.com/abstract=1929116 Electronic copy available at: http://ssrn.com/abstract=1929116 Corporate Governance and Market Liquidity: An Empirical Analysis Pawan Jain Doctoral Student The University of Memphis Christine Jiang Professor of Finance The University of Memphis Mohamed Mekhaimer Doctoral Student The University of Memphis This Draft: 16 September 2011
-
Upload
independent -
Category
Documents
-
view
0 -
download
0
Transcript of Corporate Governance and Market Liquidity: An Empirical Analysis
Electronic copy available at: http://ssrn.com/abstract=1929116Electronic copy available at: http://ssrn.com/abstract=1929116
Corporate Governance and Market Liquidity:
An Empirical Analysis
Pawan Jain Doctoral Student
The University of Memphis
Christine Jiang Professor of Finance
The University of Memphis
Mohamed Mekhaimer Doctoral Student
The University of Memphis
This Draft: 16 September 2011
Electronic copy available at: http://ssrn.com/abstract=1929116Electronic copy available at: http://ssrn.com/abstract=1929116
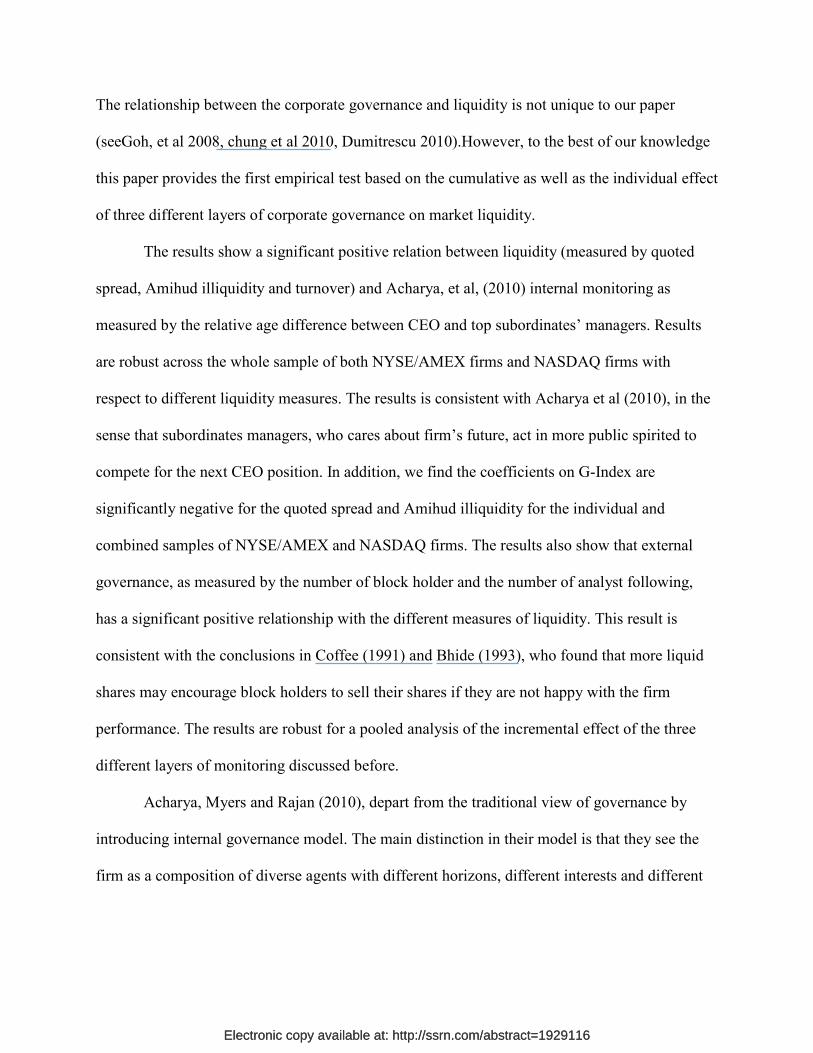
Introduction
Corporate governance deals with the set of mechanisms designed to mitigate the agency
problem that arise from the separation of ownership and control in a firm. It provides different
ways in which investors or suppliers of finance assure that the agents or managers act for their
investors’ ultimate benefits (Shlelifer and Vishny, 1997, La porta et al 2000, Lin et al 2009).
Corporate governance is important as it influences firm valuation (Gomper, Ishii, and Metrick
2003, Danies 2001, Morck and Yang 2001 and Bhagat and Bolton 2008), capital structure
(Skaife et al 2004, Novaes and zingales 1999), and liquidity (Goh, et al 2008, Chung et al 2010).
In this paper we provide a comprehensive analysis of the various channels through which
the corporate governance impacts the stock market liquidity of a firm. Liquidity is a very
important aspect of financial markets. Kyle (1985) notes that ‘‘Liquidity encompasses a number
of transactional properties of markets, including tightness, depth, and resiliency” (p. 1316).
Liquid market provide block holders with the mechanism by which they can easily to intervene
more effectively to correct managers’ actions (Maug, 1998), control management compensations
(Holmstrom and Tirole, 1993), decrease the information asymmetry of stock price through
stimulating trades of informed investors (Subrahmanyam and Titman, 2001; Khanna and Sonti,
2004)and lessen executives opportunism (Edmans, 2009; Admati and Pfleiderer, 2009).
Prior studies examined how external corporate governance (e.g., the institutional
ownership, analyst following, legal/regulatory environments and markets for corporate control)
and internal corporate governance (e.g. managerial compensation, director independence and
charter provisions) affect firm value, cost of capital, stock returns and liquidity. In this paper we
provide a comprehensive analysis of three different layers of corporate governance namely
external, internal and the intersection between both layers and their effect on market liquidity.
Electronic copy available at: http://ssrn.com/abstract=1929116Electronic copy available at: http://ssrn.com/abstract=1929116
The relationship between the corporate governance and liquidity is not unique to our paper
(seeGoh, et al 2008, chung et al 2010, Dumitrescu 2010).However, to the best of our knowledge
this paper provides the first empirical test based on the cumulative as well as the individual effect
of three different layers of corporate governance on market liquidity.
The results show a significant positive relation between liquidity (measured by quoted
spread, Amihud illiquidity and turnover) and Acharya, et al, (2010) internal monitoring as
measured by the relative age difference between CEO and top subordinates’ managers. Results
are robust across the whole sample of both NYSE/AMEX firms and NASDAQ firms with
respect to different liquidity measures. The results is consistent with Acharya et al (2010), in the
sense that subordinates managers, who cares about firm’s future, act in more public spirited to
compete for the next CEO position. In addition, we find the coefficients on G-Index are
significantly negative for the quoted spread and Amihud illiquidity for the individual and
combined samples of NYSE/AMEX and NASDAQ firms. The results also show that external
governance, as measured by the number of block holder and the number of analyst following,
has a significant positive relationship with the different measures of liquidity. This result is
consistent with the conclusions in Coffee (1991) and Bhide (1993), who found that more liquid
shares may encourage block holders to sell their shares if they are not happy with the firm
performance. The results are robust for a pooled analysis of the incremental effect of the three
different layers of monitoring discussed before.
Acharya, Myers and Rajan (2010), depart from the traditional view of governance by
introducing internal governance model. The main distinction in their model is that they see the
firm as a composition of diverse agents with different horizons, different interests and different

opportunities for misappropriation and growth and the best way to administer the agency cost
and the diverse ways of managing the firm is the internal governance.
Acharya, et al. (2011) argues that subordinate managers are important stakeholders in the
firm, who care about its future. Because of their power to withdraw their contributions to the
firm, these stakeholders can force the CEO to act in a more public-spirited and far-sighted way,
even if the CEO acts in his or her own short-term self interest and shareholders are dispersed and
powerless. The authors further states that the Three ingredients go into producing the firm’s cash
flow include the firm’s capital stock; the CEO’s ability to manage the firm, which depends on his
skill and firm-specific knowledge; and the young subordinate manager’s effort, which allows her
to learn and prepare for promotion. Hence, Acharya et al. (2011) model (see also Prendergast
(1993)) suggests that the rewards to learning may be prospective control rents from promotion in
the firm, which, in turn, make employees far more effective in exerting internal governance.
However, they do not do this by asserting “voice” in Hirschman’s terminology (probably an easy
way to get fired), but by reducing effort. None of this needs any coordination on the part of
employees or any appeal to the board of directors, nor does it require external governance.
There are various theoretical models that examine the potential trade-off between
liquidity and control. Coffee (1991) argues that large investors have increasingly supported
measures that improve internal corporate governance because such measures also improve stock
market liquidity (which makes their exit less costly). Bhide (1993) holds that high stock market
liquidity discourages internal monitoring (by active stockholders) and the benefits of market
liquidity must be weighed against the cost of impaired shareholder activism.
In contrast, Faure-Grimaud and Gromb (2004) show that information generated by liquid
markets increases the large shareholder’s incentive to undertake value-enhancing activities, such
as monitoring. Using an alternative definition of liquidity (i.e., the ability to trade anonymously)
several authors also show that liquidity increases the incentive to monitor by lowering the cost of
acquiring large positions (see Kahn and Winton (1998), Maug (2002), and Noe (2002)).
More recently, Chung, Elder and Kim (2011) analyzed the relationship between internal
corporate governance (based on governance index) and stock market liquidity. They find that
firms with better corporate governance have narrower spread and higher market quality index.
Goh, Ng and Yong (2008) also study the effect of internal governance (based on the institutional
ownership and board independence) through mediating factors on the market liquidity. However,
considering the model presented by Acharya et al (2010), we argue that Chung et al 2010 and
Goh et al 2008 measures of internal liquidity do not truly measures the construct.
Prior literature shows that external corporate governance is linked to various capital
market consequences. We use two widely accepted external corporate governance measures
found in previous literature- the number of block holders and analyst coverage. There are various
incentives for the block holders to engage inactivities that will increase firm value and enhance
its performance in the capital market. The most important one is theirown stake in the firm. Since
the block holder participates in a value increase in proportion to his equity stake, a larger stake
increases the benefit to him from the firm value being high (Faure-Grimaud and Gromb, 2004).
The view that large shareholders affect firm value is indeed widespread (Shleifer and Vishny,
1997). They alleviate the free-rider problem pervasive in firms with passive dispersed investors,
unable or unwilling to affect the firm's operations, that is, outsiders. The market for corporate
control can provide some discipline, but it is hard to see it as effective in controlling operational
decisions (Acharya, Myers and Rajan, 2010). Institutional holding reflect the extent of external
monitoring imposed by the outsiders to reduce the agency cost and divergence among investors
and firm managers benefits.
The effect of analyst coverage on the firm behavior has two competing effects
(Knyazeva, 2007). The first perspective argues that the analyst have incentive to build their own
reputation to increase the compensation. To achieve a better reputation and higher compensation,
they try to obtain private information to reduce the information asymmetry among market
participants. Lang, Lins and Miller (2003) reported that analyst are more likely to follow poor
governed firms and the value of analyst coverage is much higher in the countries with weak
investor rights protection. While the second perspective considers firms that are widely followed
by analysts may be pressured to adopt better corporate governance (Chung, et. al., 2011). Also,
there exist possible behavioral biases in analyst coverage such as herding, anti-herding,
investment banking affiliation and optimism (Clarke and Subramanian 2006, Hong et al 2000).
Kenyazeva (2007) reported that analyst following serve as a partial substitute for the corporate
governance mechanisms.
Poor governanceimplies poor financial and operational transparency (Chung, et al, 2011),
which increases information asymmetries between insiders and outside investors (e.g., outside
owners and liquidityproviders), as well as among outside investors. Poor transparency insulates
management,which can expropriate firm value through shirking,empire building, risk aversion,
and perquisites [see Gompers, Ishii, and Metrick (2003) and Bebchuk,Cohen, and Ferrell
(2005)]. Diamond (1985) shows that such information asymmetries betweenmanagement and
traders increase the latter’s incentive to acquire private information, leading to
greaterheterogeneity among trader beliefs and larger speculative positions among informed
traders. Liquidityproviders may therefore post wider spreads and smaller depths for stocks of
poorly governed companiesbecause they face greater adverse selection problems in these stocks
(Glosten and Milgrom, 1985).
Theory therefore suggests that poor corporate governance may impair stock market
liquidity tothe extent that poor governance is associated with low transparency and poor investor
protection. In thisbroad context, we examine the effect of corporate governance on liquidity.We
present a comprehensive empirical analysis of the relationship between corporate governance
and monitoring. We propose 3 levels of corporate governance: pure internal, internal/external
and pure external and analyze how each level affects stock market liquidity. Monitoring is costly
and hence, any organizational structure that promotes internal monitoring would be very
beneficial for the institutional investors or block holders and will improve the efficiency of the
capital markets. Also, internal governance can be effective when there is a breakdown of external
governance.
Corporate Governance Measures
An index of corporate governance that is relevant for stock market liquidity requires data
on governance standards that would, in theory, improve financial/operational transparency and
investor protection. Existing metrics of corporate governance are not completely adequate in this
regard. We intend to use the following three measures of corporate governance.
Internal Governance
Relative Age of top executives to CEO: The Relative age difference is the average
difference between the CEO’s ageand subordinate managers’ ages in each company.If the CEO
believes that undertaking future-oriented actions will increase current cash flows, and thus his
welfare, then she would require key stakeholders like customers and employees (see Hirschman
(1970), Titman (1984)) to be interested in the future, even if the CEO is not. Customers are,
however, typically at a distance, and leaving aside the purchase of high-value durable goods, are
unlikely to be appropriately informed or concerned about a seller’s future health. This then
leaves employees, particularly early- or mid-career managers, as the stakeholders most
concerned, informed, and able to act against short-sighted CEOs (Acharya, et al, 2010).
However, they do not do this by asserting “voice” in Hirschman’s terminology (probably an easy
way to get fired), but by reducing effort. None of this needs any coordination on the part of
employees or any appeal to the board of directors, nor does it require external governance.
CEO Tenure: The tenure is measured number of years CEO holds her office.The longer
the tenure, the more influence the CEO can have on directors and internal pay practices (Core,
Holthausen, and Larcker (1999); Cyert, Kang, and Kumar (2002); and Harford and Lie (2007))
Internal/External Monitoring
We use the governance index created by Gomper et al (2003) as a measure of
internal/external monitoring (GIM hereafter). The 24 governance standards provided by
Gompers et al (2003) can be influenced by both, the insiders and outsiders. For e.g. standard
related to the independence of the audit committee (to capture the extent to whichgovernance
may improve financial and operational transparency as well as protect shareholder interests) can
be changed either by the firm insiders or by outside investors. The GIM index is commonly used
in to measure corporate governance (Chung et al 2011, Bhagat and Bolton 2008, Venkatachalam
2005). The index construction is straightforward: for every firm (GIM) add one point for every
provision that restricts shareholder rights. The 24 governance standards are equally weighted in
the index construction.
External Monitoring:
Number of block holders: Since the block holder participates in a value increase in
proportion to his equity stake, a larger stake increases the benefit to him from the firm value
being high (Faure-Grimaud and Gromb, 2004). The view that large shareholders affect firm
value is indeed widespread (Shleifer and Vishny, 1997). We also have used the number of
analyst following to proxy the external governance of the firm. Lang, Lins and Miller (2003)
reported that analyst are more likely to follow poor governed firms and Kenyazeva (2007)
reported that analyst following serve as a partial substitute for the corporate governance
mechanisms.
Liquidity Measures
Liquidity is difficult to define and even more difficult to estimate. Kyle (1985) notes that
‘‘liquidity is a slippery and elusive concept, in part because it encompasses a number of
transactional properties of markets, these include tightness, depth, and resiliency,’’ (p. 1316).
Empirical liquidity definitions span direct trading costs (tightness), measured by the bid–ask
spread (quoted or effective), to indirect trading costs (depth and resiliency), measured by price
impact. The literature provides a menu of measures and proxies to consider for estimating
liquidity.
The first class of liquidity estimators measure trading costs directly. Proportional bid-ask
spread is commonly measured as the difference between the best ask quote and the best bid quote
as a percentage of bid-ask midpoint.
where Aski,τ is the ask price for stock i at time τ, Bidi,τ is the bid price for stock i at time τ, and
Mi,τ is the mean of Aski,τ and Bidi,τ.

Our next measure of liquidity is the one provided by Amihud (2002), which is the ratio of
the absolute stock return to its dollar volume:
It can be interpreted as the daily price response associated with one dollar of trading volume,
thus serving as a rough measure of price impact (Lipson and Mortal, 2009).
Finally, we use share turnover as our final liquidity measure. Turnover is simply the
dollar volume as a percentage of shares outstanding.
Data sources
Our sample includes 6 years of data on all firms listed on NYSE, AMEX and Nasdaq for
the period 1996 to 2001. Stock prices, closing bid and ask prices, trading volume, shares
outstanding, exchange information are provided from the Center for Research in Stock Prices
(CRSP) database. The Data on number of analyst following is extracted from the Institutional
Brokers' Estimate System (I/B/E/S) dataset while the number of Institutional owners is provided
by the Blockholders database. Block holder’s data is available only for 1996-2001 period. Risk
metrics database provide the GIM index or the Governance index (G-Index). Finally, we obtain
financial and accounting data such as total assets, intangible assets, dividend information, and R
& D expenses from Compustat database. The trading data included some trades with zero trading
prices and bid and ask quotes for the locked and crossed markets (bid price less than/equal to ask
price). These observations are removed from the final sample and the cleaned data included
observations for 14,475 firm years, with 5007 being NYSE/AMEX firm years and the remaining
9,468 being the Nasdaq firm years.
Results
Descriptive Statistics
Table 1 reports the descriptive statistics on Governance- Index (g-index), liquidity
measures, CEO age and other stock and CEO attributes for the sample firms included in the
study. Given the differences in both the market structure and the governance standards for
listing, we report our results separately for NYSE/AMEX and NASDAQ firms as well. For the
NYSE/AMEX firms in our sample, the mean value of g-index is 9.32, while for Nasdaq firms the
mean g-index is 7.91, indicating that, on average, Nasdaq firms meet about one-third of the
governance standards. Average age of a CEO of a typical firm is about 55 years and a CEO
typically holds the office for 9.21 years. The average age and tenure for CEO of NYSE/AMEX
firms is higher than the Nasdaq firms. The average age gap between the CEO and subordinate
managers is 6.89 years for NYSE/AMEX firms which is much lower than the mean age gap of
9.54 years for Nasdaq firms. Hence, based on the argument presented by Acharya et al. (2011),
the internal governance should be more visible in Nasdaq firms than the NYSE/AMEX firms.
The descriptive statistics also show that NYSE/AMEX firms in our sample tend to be
larger in size as measured by total assets, have greater trading volume, and exhibit lower return
volatility than NASDAQ firms. NYSE/AMEX firms tend to be more liquid with lower quoted
spreads and exhibit smaller Amihud illiquidity than NASDAQ firms. In addition, NYSE/AMEX
firms are followed by more analysts, and exhibit higher institutional ownership. For example, the
mean number of analysts (4.90) for the NYSE/AMEX sample is significantly greater than the
corresponding figure (3.67) for the NASDAQ sample. Total intangible assets, R&D expenditure
and dividend yield are much larger for the NYSE/AMEX firms in comparison with the Nasdaq
firms.
Regression Results
In this section, we examine how our liquidity measures are related to corporate
governance after controlling for other possible determinants of stock market liquidity.
To examine the relation between liquidity and corporate governance, we regress the
liquidity measures: quoted spreads, Amihud’s illiquidity and turnover, on the different layers of
monitoring and a number of control variables using the pooled cross-sectional and time-series
data. Prior studies show that a significant portion of cross-sectional and time-series variation in
spreads can be explained by select stock attributes such as dollar trading volume, share price,
return volatility and dividend yield (McInish and Wood, 1992; Chung, Van Ness, and Van Ness,
1999; and Stoll, 2000). To isolate the effect of corporate governance on liquidity, we include
stock price (in log), return volatility, dollar trading volume (in log) and dividend yield in the
regression model as control variables.
We note that level of monitoring and our measures of market liquidity could be
spuriously correlated because they are related to a common set of variables. Including the
variables that are related to both level of monitoring and market liquidity in the regression model
reduces the possibility that any estimated relation between level of monitoring and market
liquidity is spurious. For example, larger firms may simultaneously exhibit better governance
structure due to higher investor interest and lower spreads due to smaller adverse selection risks
(e.g., more information is available on largerfirms). To examine whether corporate governance
has an independent, direct impact on liquidity, we include firm size (as measured by the book
value of total assets) in the regression model.
For the same reason, we also include asset tangibility and R&D expenditure as additional
control variables. Asset tangibility could reduce asymmetric information problems as payoffs on
tangible assets’ are easier to observe. In contrast, high R&D intensity may increase asymmetric
information problems because payoffs from R&D are difficult to predict.
Based on these considerations, we estimate the following regression model for our study
sample ofNYSE/AMEX firms, NASDAQ firms, and the combined sample of NYSE/AMEX and
NASDAQ firms, respectively:
Quoted Spreadi,tor Amihud illiquidityi,t or Turnoveri,t= β0 + β1Level of Monitoringi,t +
β2Log(Pricei,t) + β3Return Volatilityi,t+ β4Log(Trading Volumei,t) + β5Log(Assetsi,t)(1)+
β6AssetIntangibilityi,t+ β7R&D Expenditurei,t+ β8DividendYieldi,t + εi,t;
where Quoted Spreadi,t is the proportionate quoted percentage spread of stock i in year t,
Amihudilliquidityi,t is return per dollar volume, Turnoveri,t is average daily volume per share
outstanding, Level of Monitoring is internal governance (measured by CEO’s age relative to
subordinate managers’ age, CEO age and CEO tenure) for the first regression, internal/external
governance (G-Indexi,t) for the second regression, external governance (measured by number of
block holders and number of analysts following) for the third regression, Pricei,t is the mean
stock price, Return Volatilityi,t is the standard deviation of daily returns, Trading Volumei,t is the
mean daily dollar trading volume, Assetsi,t is the book value of total assets, Intangibilityi,tis the
book value of total intangible assets, DividendYieldi,t is the ratio of dividend paid per share to the
share price, and εi,t is the error term. We calculate t-statistics using White’s (1980) standard
errors and report them in parentheses.
Internal monitoring and liquidity
Table 2 summarizes the results explaining the relationship between liquidity and internal
governance as measured by the difference between CEO’s age and subordinate manager’s ages
(Relative age). The results show that the coefficients on relative age in the quoted spread model,
Amihud illiquidity model are all negative and significant for NASDAQ firms, and the combined
sample of NYSE/AMEX and NASDAQ firms. We obtain qualitatively similar results for the
turnover. Hence, the larger the age difference between the CEO and subordinate managers, the
higher is the firm’s liquidity. Our regression models capture a large fraction of the variation in
liquidity as shown by the high R2 value for the regressions.
Consistent with the finding of prior research, liquidity is significantly and positively
related to log price, firm size, asset intangibility and return volatility, and negatively to trading
volume in both markets. R & D expenses are negatively related to liquidity and this result is
consistent with Chung et al. (2011). High R&D expenditure may increase asymmetric
information problems because payoffs from R&D are difficult to predict.
These results are remarkably robust across our sample of both NYSE/AMEX firms and
NASDAQ firms and with respect to different variable measurement methods. Our empirical
results thus far support the hypothesis that better internal corporate governance is associated with
higher stock market liquidity.
Internal/external monitoring and liquidity
Table 3 summarizes the results explaining the relationship between liquidity and
internal/external governance as measured by the Gompers, Ishii and Metrick (2003) (g-index).
The results show that the coefficients on G-index in the quoted spread model, and Amihud
illiquidity model are all negative and significant for NYSE/AMEX firms, NASDAQ firms, and
the combined sample of NYSE/AMEX and NASDAQ firms. We obtain qualitatively similar
results for the turnover. Our regression models capture a large fraction of the variation in
liquidity, with the R2of greater than 0.65 for the Nasdaq firms. Hence, the higher the G-index,
the higher is the stock market liquidity. The results on control variable are consistent with prior
literature.
External monitoring and liquidity
Table 4 summarizes the results explaining the relationship between liquidity and external
governance as measured by the number of block holders and number of analysts following. The
results show that the coefficients on block holders and number of analysts following in the
quoted spread model, and Amihud illiquidity model are mostly negative and significant for
NYSE/AMEX firms, NASDAQ firms, and the combined sample of NYSE/AMEX and
NASDAQ firms. Results are not significant for the number of block holders for turnover model.
The results on control variable are consistent with prior literature. Our empirical results thus far
support the hypothesis that better external corporate governance is associated with higher stock
market liquidity.
Liquidity and different levels of monitoring
For our final analysis, we run a pooled regression by including all three layers of
monitoring in one regression model. We analyze the incremental effect of different layers of
monitoring on liquidity. Results from this analysis are summarized in table 5. CEO age is
significantly negatively related to liquidity as measured by quoted spread or Amihud’s
illiquidity. Our measure of internal monitoring, relative age difference between CEO and
subordinate managers is significantly positively related to liquidity, even after controlling for the
other measure of corporate governance. This result is robust across different model specifications
and across firms listed on NYSE/AMEX or Nasdaq.

We also find a significantly positive relationship between liquidity and both, the
internal/external governance (G-index) and the external governance (number of block holders)
for NYSE/AMEX firms.
Based on these results we can conclude that better corporate governance is associated
with higher liquidity. We also find that internal governance significantly impacts stock market
liquidity beyond the traditional governance measures.
Acharya, et al. (2011) argues that subordinate managers are important stakeholders in the
firm, who care about its future. Because of their power to withdraw their contributions to the
firm, these stakeholders can force the CEO to act in a more public-spirited and far-sighted way,
even if the CEO acts in his or her own short-term self interest and shareholders are dispersed and
powerless. The authors further states that the Three ingredients go into producing the firm’s cash
flow include the firm’s capital stock; the CEO’s ability to manage the firm, which depends on his
skill and firm-specific knowledge; and the young subordinate manager’s effort, which allows her
to learn and prepare for promotion. Hence, Acharya et al. (2011) model (see also Prendergast
(1993)) suggests that the rewards to learning may be prospective control rents from promotion in
the firm, which, in turn, make employees far more effective in exerting internal governance.
Based on the above argument, we can hypothesize that the relationship between internal
monitoring, as measured by difference between CEO’s age and Subordinate managers’ ages, and
liquidity should be visible for firms that emphasizes internal promotions.
To test the above hypothesis, we analyze a subsample of the firms for which the
information about the internal promotions or external hiring could be extracted. To derive the
internal promotion information, we compare the names of new CEO with the already existing
pool of subordinated managers and if we find a match, that firm is considered to be emphasizing
internal promotions. We also compare the date when there is a change in CEO with the date the
new CEO joins the firm. If the two dates are identical, the firm is classified as the one hiring the
CEO externally.
Table 6 presents the descriptive statistics about the number of CEO changes for a given
firm and how the new CEO is hired. The statistics show that about 82% of the new CEOs are
appointed from the top non-CEO executives in the firm in the previous year. Larger
NYSE/AMEX firms emphasize more on internal promotions than the smaller Nasdaq firms. So,
if the level of internal promotions is the driving force behind the relative age difference and
liquidity relationship, then the relative age-liquidity relationship should be stronger for the
NYSE/AMEX firms but that is not observed in the results summarized in earlier sections.
Liquidity and different levels of monitoring
For our final analysis, we run a pooled regression by including data on internal
promotions and all three layers of monitoring in one regression model. If the level of internal
promotions is the driving force behind the relative age difference and liquidity relationship, then
we should observe a significantly positive coefficient for the internal promotion variable. Results
from this analysis are summarized in table 7. First thing to note is that the relative age difference
between CEO and subordinate managers is significantly positively related to liquidity, even after
controlling for the other measure of corporate governance and level of internal promotions. This
result is robust across different model specifications and across firms listed on NYSE/AMEX or
Nasdaq.
Level of internal promotions is not significant predictor for most of the quoted spreads
and Amihud illiquidity regression models. Level of internal promotions is significantly positively
related to the liquidity for smaller Nasdaq firms. For NYSE/AMEX firms for turnover model we

get counter-intuitive results, we find that level of internal promotions is negatively related to
liquidity.
We also find a significantly positive relationship between liquidity and both, the
internal/external governance (G-index) and the external governance (number of block holders)
for NYSE/AMEX firms.
Based on these results we can conclude that better corporate governance is associated
with higher liquidity. The most robust result across all regression models is that internal
governance significantly positively impacts stock market liquidity beyond the traditional
governance measures. This relationship holds even after controlling for level of internal
promotions.
Robustness tests
We re-analyze the results by deleting the banking and utility firms and firms with stock
price less than $5, we find similar results as reported in the previous sections. However, results
for internal monitoring were weaker for the turnover model.
We reanalyze the model using the maximum likelihood estimation technique and the
results were qualitatively similar to the ones reported in the previous section using the regular
OLS estimation method
Conclusion
Companies with good corporate governance are likely to have liquid secondary markets
for their shares because good governance improves financial and operational transparency, which
ultimatelyreduces information asymmetries between the insiders and outside owners/liquidity
providers. Liquidity providers are therefore likely to post smaller spreads and larger depths for
stocks of these companies.Whether these effects on liquidity are discernable and economically
significant is an empirical question,and our study addresses this question. We also analyze if the
existence of internal monitoring, as defined by Acharya et al. (2011), serves as a self-disciplining
mechanism and improves the stock market liquidity.
Our empirical results show that companies with better corporate governance generally
have greater stock market liquidity as measured by narrower quoted spreads, lower Amihud
illiquidity, and higher turnover. Our results are robust to alternative estimation methods, across
different markets, and different measures of liquidity. Although the results of our study suggest
that good governance could enhance firm value through its effect on stock market liquidity,
whether companies choose to adopt additional governance standards remains a question. As
suggested by Aggarwal et al. (2008), governance standards may be selected bythe controlling
shareholder to maximize his private value of the firm. The controlling shareholder’s decision of
whether to adopt additional governance standards therefore involves weighing the benefits of
greater liquidity and lower cost of equity capital against the cost associated with, for example,
the diminished ability of the controlling shareholder to expropriate firm value. Hence, we look at
the different layers of monitoring to understand if the self-governing mechanism as proposed by
Acharya et al. (2011) impacts liquidity.
Our results document that, all things being equal, firms with larger age difference
between CEO and subordinate managers are more liquid than others. The relationship between
the level of internal monitoring and liquidity holds even after controlling for the level of
internal/external monitoring (governance index) and the level of external monitoring (number of
block holders and number of analysts following). In this perspective, a firm should hire younger
subordinate managers, which in turn, lowers the cost of external and internal/external monitoring
and improves the stock market liquidity.
Based on these results we can conclude that better corporate governance is associated
with higher liquidity. The most robust result across all regression models is that internal
governance significantly positively impacts stock market liquidity beyond the traditional
governance measures. Acharya et al. (2011) assert that the level of internal promotions is the
driving force behind the relative age difference and liquidity relationship. We do not find support
for this assertion rather for NYSE/AMEX firms we find contradicting evidence. Future research
can focus on explaining the channel through which internal governance affects liquidity.
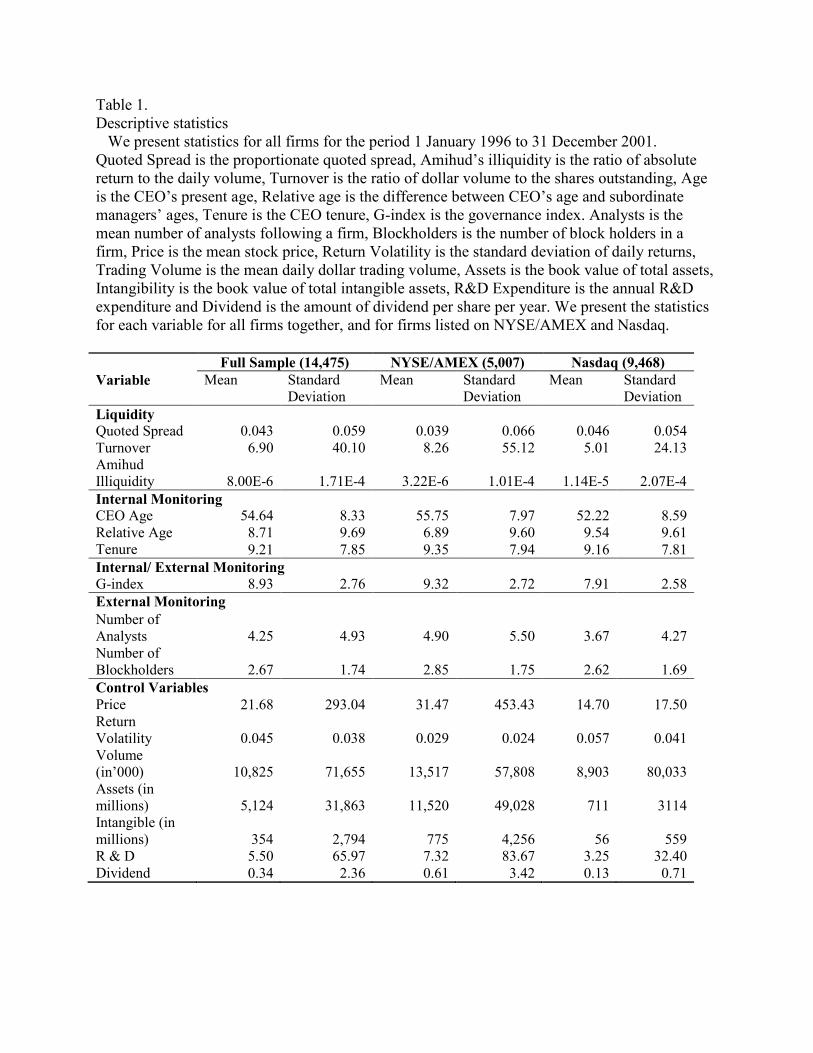
Table 1. Descriptive statistics We present statistics for all firms for the period 1 January 1996 to 31 December 2001. Quoted Spread is the proportionate quoted spread, Amihud’s illiquidity is the ratio of absolute return to the daily volume, Turnover is the ratio of dollar volume to the shares outstanding, Age is the CEO’s present age, Relative age is the difference between CEO’s age and subordinate managers’ ages, Tenure is the CEO tenure, G-index is the governance index. Analysts is the mean number of analysts following a firm, Blockholders is the number of block holders in a firm, Price is the mean stock price, Return Volatility is the standard deviation of daily returns, Trading Volume is the mean daily dollar trading volume, Assets is the book value of total assets, Intangibility is the book value of total intangible assets, R&D Expenditure is the annual R&D expenditure and Dividend is the amount of dividend per share per year. We present the statistics for each variable for all firms together, and for firms listed on NYSE/AMEX and Nasdaq.
Full Sample (14,475) NYSE/AMEX (5,007) Nasdaq (9,468)
Variable Mean Standard Deviation
Mean Standard Deviation
Mean Standard Deviation
Liquidity Quoted Spread 0.043 0.059 0.039 0.066 0.046 0.054 Turnover 6.90 40.10 8.26 55.12 5.01 24.13 Amihud Illiquidity 8.00E-6 1.71E-4 3.22E-6 1.01E-4 1.14E-5 2.07E-4
Internal Monitoring CEO Age 54.64 8.33 55.75 7.97 52.22 8.59 Relative Age 8.71 9.69 6.89 9.60 9.54 9.61 Tenure 9.21 7.85 9.35 7.94 9.16 7.81
Internal/ External Monitoring G-index 8.93 2.76 9.32 2.72 7.91 2.58
External Monitoring Number of Analysts 4.25 4.93 4.90 5.50 3.67 4.27 Number of Blockholders 2.67 1.74 2.85 1.75 2.62 1.69
Control Variables Price 21.68 293.04 31.47 453.43 14.70 17.50 Return Volatility 0.045 0.038 0.029 0.024 0.057 0.041 Volume (in’000) 10,825 71,655 13,517 57,808 8,903 80,033 Assets (in millions) 5,124 31,863 11,520 49,028 711 3114 Intangible (in millions) 354 2,794 775 4,256 56 559 R & D 5.50 65.97 7.32 83.67 3.25 32.40 Dividend 0.34 2.36 0.61 3.42 0.13 0.71
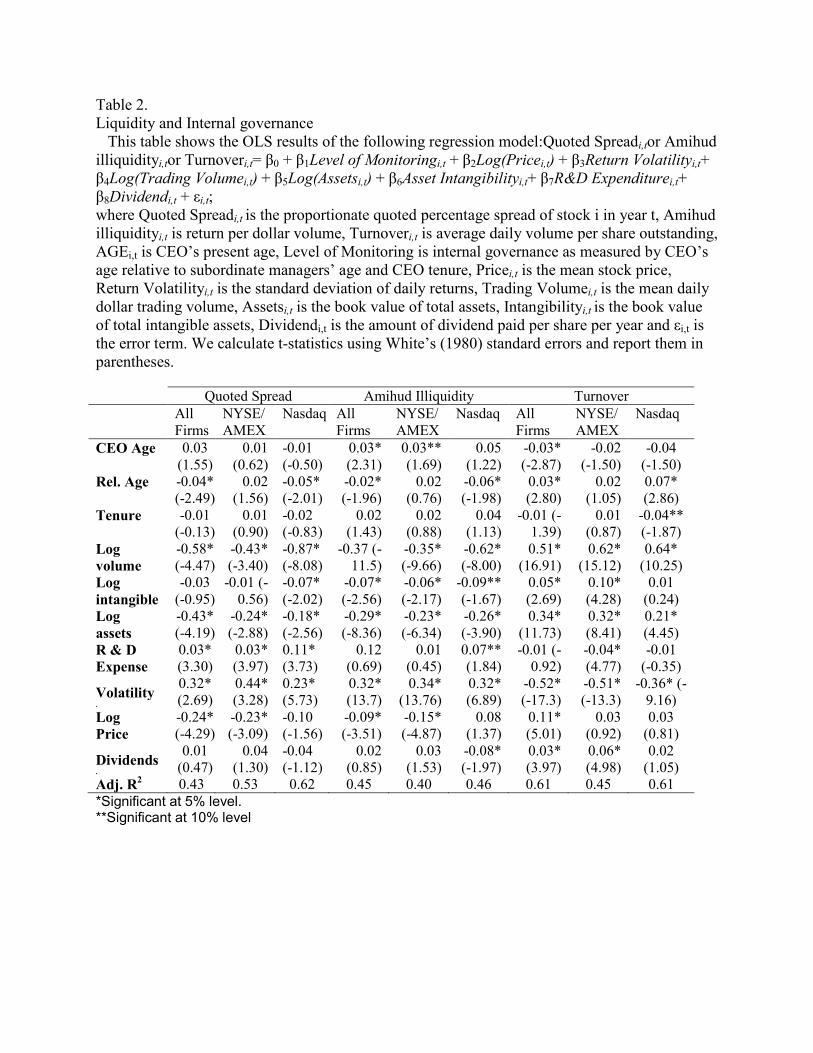
Table 2. Liquidity and Internal governance This table shows the OLS results of the following regression model:Quoted Spreadi,tor Amihud illiquidityi,tor Turnoveri,t= β0 + β1Level of Monitoringi,t + β2Log(Pricei,t) + β3Return Volatilityi,t+ β4Log(Trading Volumei,t) + β5Log(Assetsi,t) + β6Asset Intangibilityi,t+ β7R&D Expenditurei,t+ β8Dividendi,t + εi,t; where Quoted Spreadi,t is the proportionate quoted percentage spread of stock i in year t, Amihud illiquidityi,t is return per dollar volume, Turnoveri,t is average daily volume per share outstanding, AGEi,t is CEO’s present age, Level of Monitoring is internal governance as measured by CEO’s age relative to subordinate managers’ age and CEO tenure, Pricei,t is the mean stock price, Return Volatilityi,t is the standard deviation of daily returns, Trading Volumei,t is the mean daily dollar trading volume, Assetsi,t is the book value of total assets, Intangibilityi,t is the book value of total intangible assets, Dividendi,t is the amount of dividend paid per share per year and εi,t is the error term. We calculate t-statistics using White’s (1980) standard errors and report them in parentheses.
Quoted Spread Amihud Illiquidity Turnover
All Firms
NYSE/ AMEX
Nasdaq All Firms
NYSE/ AMEX
Nasdaq All Firms
NYSE/ AMEX
Nasdaq
CEO Age 0.03 (1.55)
0.01 (0.62)
-0.01 (-0.50)
0.03* (2.31)
0.03** (1.69)
0.05 (1.22)
-0.03* (-2.87)
-0.02 (-1.50)
-0.04 (-1.50)
Rel. Age -0.04* (-2.49)
0.02 (1.56)
-0.05* (-2.01)
-0.02* (-1.96)
0.02 (0.76)
-0.06* (-1.98)
0.03* (2.80)
0.02 (1.05)
0.07* (2.86)
Tenure -0.01 (-0.13)
0.01 (0.90)
-0.02 (-0.83)
0.02 (1.43)
0.02 (0.88)
0.04 (1.13)
-0.01 (-1.39)
0.01 (0.87)
-0.04** (-1.87)
Log
volume
-0.58* (-4.47)
-0.43* (-3.40)
-0.87* (-8.08)
-0.37 (-11.5)
-0.35* (-9.66)
-0.62* (-8.00)
0.51* (16.91)
0.62* (15.12)
0.64* (10.25)
Log
intangible
-0.03 (-0.95)
-0.01 (-0.56)
-0.07* (-2.02)
-0.07* (-2.56)
-0.06* (-2.17)
-0.09** (-1.67)
0.05* (2.69)
0.10* (4.28)
0.01 (0.24)
Log
assets
-0.43* (-4.19)
-0.24* (-2.88)
-0.18* (-2.56)
-0.29* (-8.36)
-0.23* (-6.34)
-0.26* (-3.90)
0.34* (11.73)
0.32* (8.41)
0.21* (4.45)
R & D
Expense
0.03* (3.30)
0.03* (3.97)
0.11* (3.73)
0.12 (0.69)
0.01 (0.45)
0.07** (1.84)
-0.01 (-0.92)
-0.04* (4.77)
-0.01 (-0.35)
Volatility .
0.32* (2.69)
0.44* (3.28)
0.23* (5.73)
0.32* (13.7)
0.34* (13.76)
0.32* (6.89)
-0.52* (-17.3)
-0.51* (-13.3)
-0.36* (-9.16)
Log
Price
-0.24* (-4.29)
-0.23* (-3.09)
-0.10 (-1.56)
-0.09* (-3.51)
-0.15* (-4.87)
0.08 (1.37)
0.11* (5.01)
0.03 (0.92)
0.03 (0.81)
Dividends .
0.01 (0.47)
0.04 (1.30)
-0.04 (-1.12)
0.02 (0.85)
0.03 (1.53)
-0.08* (-1.97)
0.03* (3.97)
0.06* (4.98)
0.02 (1.05)
Adj. R2 0.43 0.53 0.62 0.45 0.40 0.46 0.61 0.45 0.61
*Significant at 5% level. **Significant at 10% level
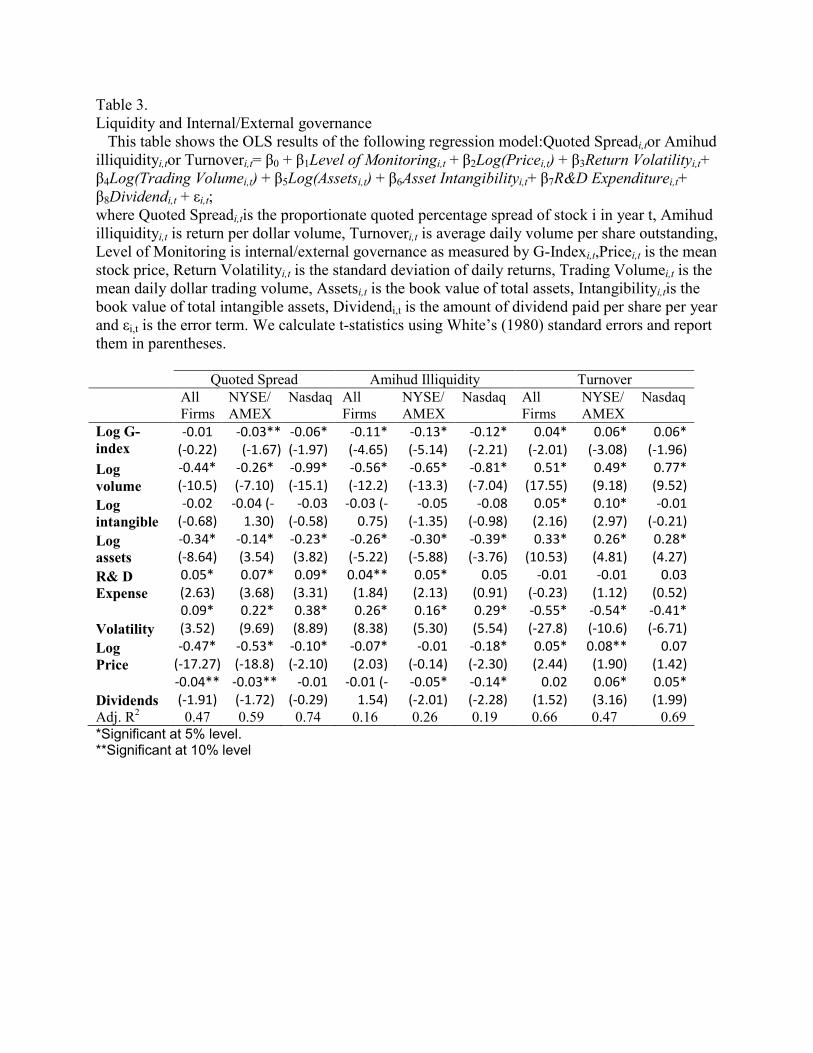
Table 3. Liquidity and Internal/External governance This table shows the OLS results of the following regression model:Quoted Spreadi,tor Amihud illiquidityi,tor Turnoveri,t= β0 + β1Level of Monitoringi,t + β2Log(Pricei,t) + β3Return Volatilityi,t+ β4Log(Trading Volumei,t) + β5Log(Assetsi,t) + β6Asset Intangibilityi,t+ β7R&D Expenditurei,t+ β8Dividendi,t + εi,t; where Quoted Spreadi,tis the proportionate quoted percentage spread of stock i in year t, Amihud illiquidityi,t is return per dollar volume, Turnoveri,t is average daily volume per share outstanding, Level of Monitoring is internal/external governance as measured by G-Indexi,t,Pricei,t is the mean stock price, Return Volatilityi,t is the standard deviation of daily returns, Trading Volumei,t is the mean daily dollar trading volume, Assetsi,t is the book value of total assets, Intangibilityi,tis the book value of total intangible assets, Dividendi,t is the amount of dividend paid per share per year and εi,t is the error term. We calculate t-statistics using White’s (1980) standard errors and report them in parentheses.
Quoted Spread Amihud Illiquidity Turnover
All Firms
NYSE/ AMEX
Nasdaq All Firms
NYSE/ AMEX
Nasdaq All Firms
NYSE/ AMEX
Nasdaq
Log G-
index
-0.01
(-0.22)
-0.03**
(-1.67)
-0.06*
(-1.97)
-0.11*
(-4.65)
-0.13*
(-5.14)
-0.12*
(-2.21)
0.04*
(-2.01)
0.06*
(-3.08)
0.06*
(-1.96)
Log
volume
-0.44*
(-10.5)
-0.26*
(-7.10)
-0.99*
(-15.1)
-0.56*
(-12.2)
-0.65*
(-13.3)
-0.81*
(-7.04)
0.51*
(17.55)
0.49*
(9.18)
0.77*
(9.52)
Log
intangible
-0.02
(-0.68)
-0.04 (-
1.30)
-0.03
(-0.58)
-0.03 (-
0.75)
-0.05
(-1.35)
-0.08
(-0.98)
0.05*
(2.16)
0.10*
(2.97)
-0.01
(-0.21)
Log
assets
-0.34*
(-8.64)
-0.14*
(3.54)
-0.23*
(3.82)
-0.26*
(-5.22)
-0.30*
(-5.88)
-0.39*
(-3.76)
0.33*
(10.53)
0.26*
(4.81)
0.28*
(4.27)
R& D
Expense
0.05*
(2.63)
0.07*
(3.68)
0.09*
(3.31)
0.04**
(1.84)
0.05*
(2.13)
0.05
(0.91)
-0.01
(-0.23)
-0.01
(1.12)
0.03
(0.52)
Volatility
0.09*
(3.52)
0.22*
(9.69)
0.38*
(8.89)
0.26*
(8.38)
0.16*
(5.30)
0.29*
(5.54)
-0.55*
(-27.8)
-0.54*
(-10.6)
-0.41*
(-6.71)
Log
Price
-0.47*
(-17.27)
-0.53*
(-18.8)
-0.10*
(-2.10)
-0.07*
(2.03)
-0.01
(-0.14)
-0.18*
(-2.30)
0.05*
(2.44)
0.08**
(1.90)
0.07
(1.42)
Dividends
-0.04**
(-1.91)
-0.03**
(-1.72)
-0.01
(-0.29)
-0.01 (-
1.54)
-0.05*
(-2.01)
-0.14*
(-2.28)
0.02
(1.52)
0.06*
(3.16)
0.05*
(1.99)
Adj. R2 0.47 0.59 0.74 0.16 0.26 0.19 0.66 0.47 0.69 *Significant at 5% level. **Significant at 10% level
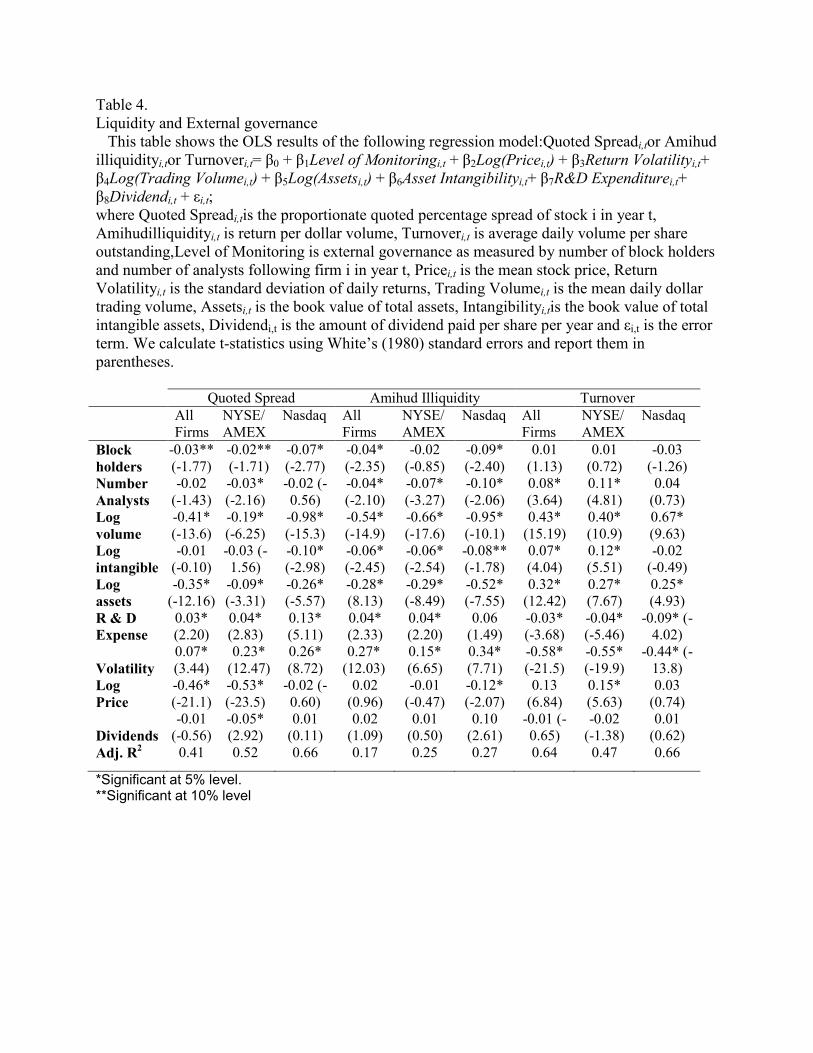
Table 4. Liquidity and External governance This table shows the OLS results of the following regression model:Quoted Spreadi,tor Amihud illiquidityi,tor Turnoveri,t= β0 + β1Level of Monitoringi,t + β2Log(Pricei,t) + β3Return Volatilityi,t+ β4Log(Trading Volumei,t) + β5Log(Assetsi,t) + β6Asset Intangibilityi,t+ β7R&D Expenditurei,t+ β8Dividendi,t + εi,t; where Quoted Spreadi,tis the proportionate quoted percentage spread of stock i in year t, Amihudilliquidityi,t is return per dollar volume, Turnoveri,t is average daily volume per share outstanding,Level of Monitoring is external governance as measured by number of block holders and number of analysts following firm i in year t, Pricei,t is the mean stock price, Return Volatilityi,t is the standard deviation of daily returns, Trading Volumei,t is the mean daily dollar trading volume, Assetsi,t is the book value of total assets, Intangibilityi,tis the book value of total intangible assets, Dividendi,t is the amount of dividend paid per share per year and εi,t is the error term. We calculate t-statistics using White’s (1980) standard errors and report them in parentheses.
Quoted Spread Amihud Illiquidity Turnover
All Firms
NYSE/ AMEX
Nasdaq All Firms
NYSE/ AMEX
Nasdaq All Firms
NYSE/ AMEX
Nasdaq
Block
holders
-0.03** (-1.77)
-0.02** (-1.71)
-0.07* (-2.77)
-0.04* (-2.35)
-0.02 (-0.85)
-0.09* (-2.40)
0.01 (1.13)
0.01 (0.72)
-0.03 (-1.26)
Number
Analysts
-0.02 (-1.43)
-0.03* (-2.16)
-0.02 (-0.56)
-0.04* (-2.10)
-0.07* (-3.27)
-0.10* (-2.06)
0.08* (3.64)
0.11* (4.81)
0.04 (0.73)
Log
volume
-0.41* (-13.6)
-0.19* (-6.25)
-0.98* (-15.3)
-0.54* (-14.9)
-0.66* (-17.6)
-0.95* (-10.1)
0.43* (15.19)
0.40* (10.9)
0.67* (9.63)
Log
intangible
-0.01 (-0.10)
-0.03 (-1.56)
-0.10* (-2.98)
-0.06* (-2.45)
-0.06* (-2.54)
-0.08** (-1.78)
0.07* (4.04)
0.12* (5.51)
-0.02 (-0.49)
Log
assets
-0.35* (-12.16)
-0.09* (-3.31)
-0.26* (-5.57)
-0.28* (8.13)
-0.29* (-8.49)
-0.52* (-7.55)
0.32* (12.42)
0.27* (7.67)
0.25* (4.93)
R & D
Expense
0.03* (2.20)
0.04* (2.83)
0.13* (5.11)
0.04* (2.33)
0.04* (2.20)
0.06 (1.49)
-0.03* (-3.68)
-0.04* (-5.46)
-0.09* (-4.02)
Volatility
0.07* (3.44)
0.23* (12.47)
0.26* (8.72)
0.27* (12.03)
0.15* (6.65)
0.34* (7.71)
-0.58* (-21.5)
-0.55* (-19.9)
-0.44* (-13.8)
Log
Price
-0.46* (-21.1)
-0.53* (-23.5)
-0.02 (-0.60)
0.02 (0.96)
-0.01 (-0.47)
-0.12* (-2.07)
0.13 (6.84)
0.15* (5.63)
0.03 (0.74)
Dividends
-0.01 (-0.56)
-0.05* (2.92)
0.01 (0.11)
0.02 (1.09)
0.01 (0.50)
0.10 (2.61)
-0.01 (-0.65)
-0.02 (-1.38)
0.01 (0.62)
Adj. R2 0.41 0.52 0.66 0.17 0.25 0.27 0.64 0.47 0.66
*Significant at 5% level. **Significant at 10% level
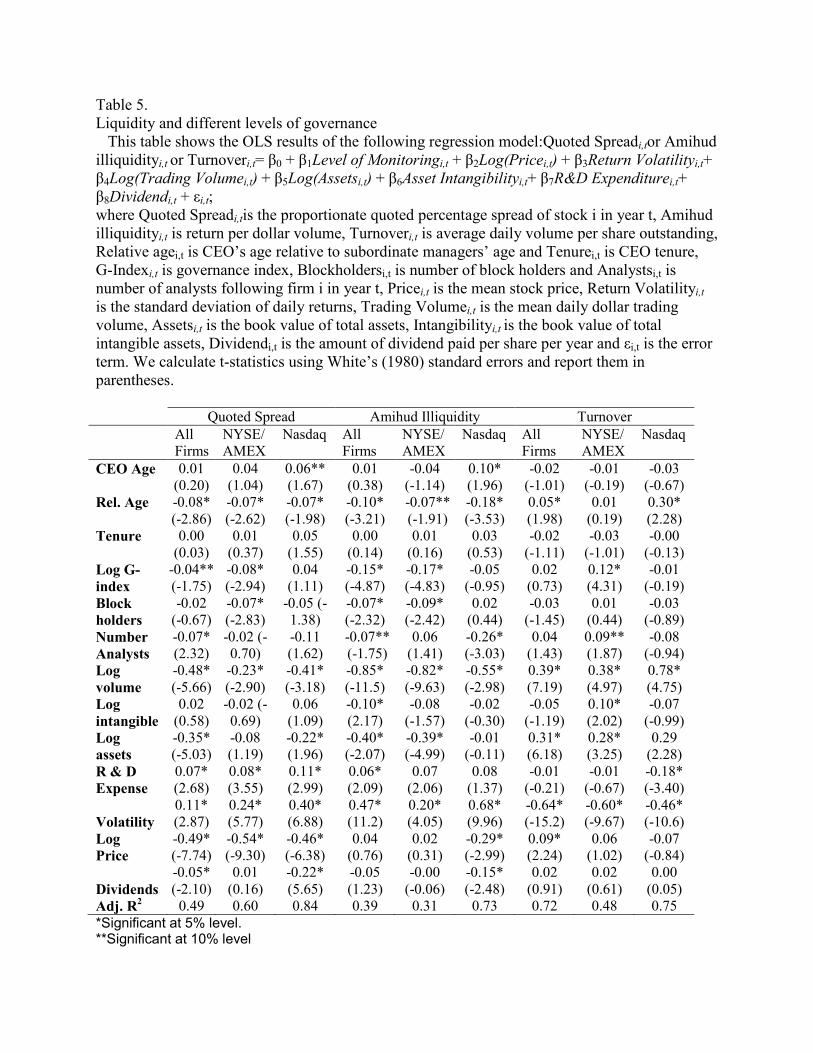
Table 5. Liquidity and different levels of governance This table shows the OLS results of the following regression model:Quoted Spreadi,tor Amihud illiquidityi,t or Turnoveri,t= β0 + β1Level of Monitoringi,t + β2Log(Pricei,t) + β3Return Volatilityi,t+ β4Log(Trading Volumei,t) + β5Log(Assetsi,t) + β6Asset Intangibilityi,t+ β7R&D Expenditurei,t+ β8Dividendi,t + εi,t; where Quoted Spreadi,tis the proportionate quoted percentage spread of stock i in year t, Amihud illiquidityi,t is return per dollar volume, Turnoveri,t is average daily volume per share outstanding, Relative agei,t is CEO’s age relative to subordinate managers’ age and Tenurei,t is CEO tenure, G-Indexi,t is governance index, Blockholdersi,t is number of block holders and Analystsi,t is number of analysts following firm i in year t, Pricei,t is the mean stock price, Return Volatilityi,t is the standard deviation of daily returns, Trading Volumei,t is the mean daily dollar trading volume, Assetsi,t is the book value of total assets, Intangibilityi,t is the book value of total intangible assets, Dividendi,t is the amount of dividend paid per share per year and εi,t is the error term. We calculate t-statistics using White’s (1980) standard errors and report them in parentheses. Quoted Spread Amihud Illiquidity Turnover
All Firms
NYSE/ AMEX
Nasdaq All Firms
NYSE/ AMEX
Nasdaq All Firms
NYSE/ AMEX
Nasdaq
CEO Age 0.01 (0.20)
0.04 (1.04)
0.06** (1.67)
0.01 (0.38)
-0.04 (-1.14)
0.10* (1.96)
-0.02 (-1.01)
-0.01 (-0.19)
-0.03 (-0.67)
Rel. Age -0.08* (-2.86)
-0.07* (-2.62)
-0.07* (-1.98)
-0.10* (-3.21)
-0.07** (-1.91)
-0.18* (-3.53)
0.05* (1.98)
0.01 (0.19)
0.30* (2.28)
Tenure 0.00 (0.03)
0.01 (0.37)
0.05 (1.55)
0.00 (0.14)
0.01 (0.16)
0.03 (0.53)
-0.02 (-1.11)
-0.03 (-1.01)
-0.00 (-0.13)
Log G-
index
-0.04** (-1.75)
-0.08* (-2.94)
0.04 (1.11)
-0.15* (-4.87)
-0.17* (-4.83)
-0.05 (-0.95)
0.02 (0.73)
0.12* (4.31)
-0.01 (-0.19)
Block
holders
-0.02 (-0.67)
-0.07* (-2.83)
-0.05 (-1.38)
-0.07* (-2.32)
-0.09* (-2.42)
0.02 (0.44)
-0.03 (-1.45)
0.01 (0.44)
-0.03 (-0.89)
Number
Analysts
-0.07* (2.32)
-0.02 (-0.70)
-0.11 (1.62)
-0.07** (-1.75)
0.06 (1.41)
-0.26* (-3.03)
0.04 (1.43)
0.09** (1.87)
-0.08 (-0.94)
Log
volume
-0.48* (-5.66)
-0.23* (-2.90)
-0.41* (-3.18)
-0.85* (-11.5)
-0.82* (-9.63)
-0.55* (-2.98)
0.39* (7.19)
0.38* (4.97)
0.78* (4.75)
Log
intangible
0.02 (0.58)
-0.02 (-0.69)
0.06 (1.09)
-0.10* (2.17)
-0.08 (-1.57)
-0.02 (-0.30)
-0.05 (-1.19)
0.10* (2.02)
-0.07 (-0.99)
Log
assets
-0.35* (-5.03)
-0.08 (1.19)
-0.22* (1.96)
-0.40* (-2.07)
-0.39* (-4.99)
-0.01 (-0.11)
0.31* (6.18)
0.28* (3.25)
0.29 (2.28)
R & D
Expense
0.07* (2.68)
0.08* (3.55)
0.11* (2.99)
0.06* (2.09)
0.07 (2.06)
0.08 (1.37)
-0.01 (-0.21)
-0.01 (-0.67)
-0.18* (-3.40)
Volatility
0.11* (2.87)
0.24* (5.77)
0.40* (6.88)
0.47* (11.2)
0.20* (4.05)
0.68* (9.96)
-0.64* (-15.2)
-0.60* (-9.67)
-0.46* (-10.6)
Log
Price
-0.49* (-7.74)
-0.54* (-9.30)
-0.46* (-6.38)
0.04 (0.76)
0.02 (0.31)
-0.29* (-2.99)
0.09* (2.24)
0.06 (1.02)
-0.07 (-0.84)
Dividends
-0.05* (-2.10)
0.01 (0.16)
-0.22* (5.65)
-0.05 (1.23)
-0.00 (-0.06)
-0.15* (-2.48)
0.02 (0.91)
0.02 (0.61)
0.00 (0.05)
Adj. R2 0.49 0.60 0.84 0.39 0.31 0.73 0.72 0.48 0.75
*Significant at 5% level. **Significant at 10% level
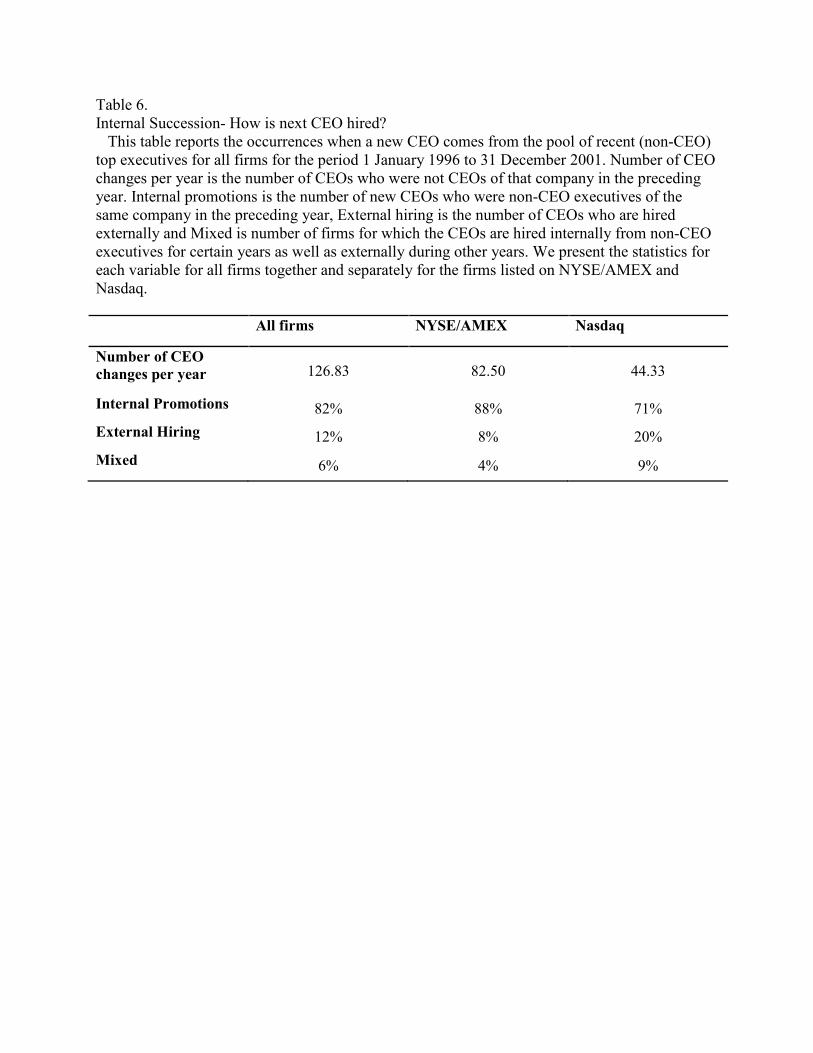
Table 6. Internal Succession- How is next CEO hired? This table reports the occurrences when a new CEO comes from the pool of recent (non-CEO) top executives for all firms for the period 1 January 1996 to 31 December 2001. Number of CEO changes per year is the number of CEOs who were not CEOs of that company in the preceding year. Internal promotions is the number of new CEOs who were non-CEO executives of the same company in the preceding year, External hiring is the number of CEOs who are hired externally and Mixed is number of firms for which the CEOs are hired internally from non-CEO executives for certain years as well as externally during other years. We present the statistics for each variable for all firms together and separately for the firms listed on NYSE/AMEX and Nasdaq.
All firms NYSE/AMEX Nasdaq
Number of CEO
changes per year 126.83 82.50 44.33
Internal Promotions 82% 88% 71%
External Hiring 12% 8% 20%
Mixed 6% 4% 9%
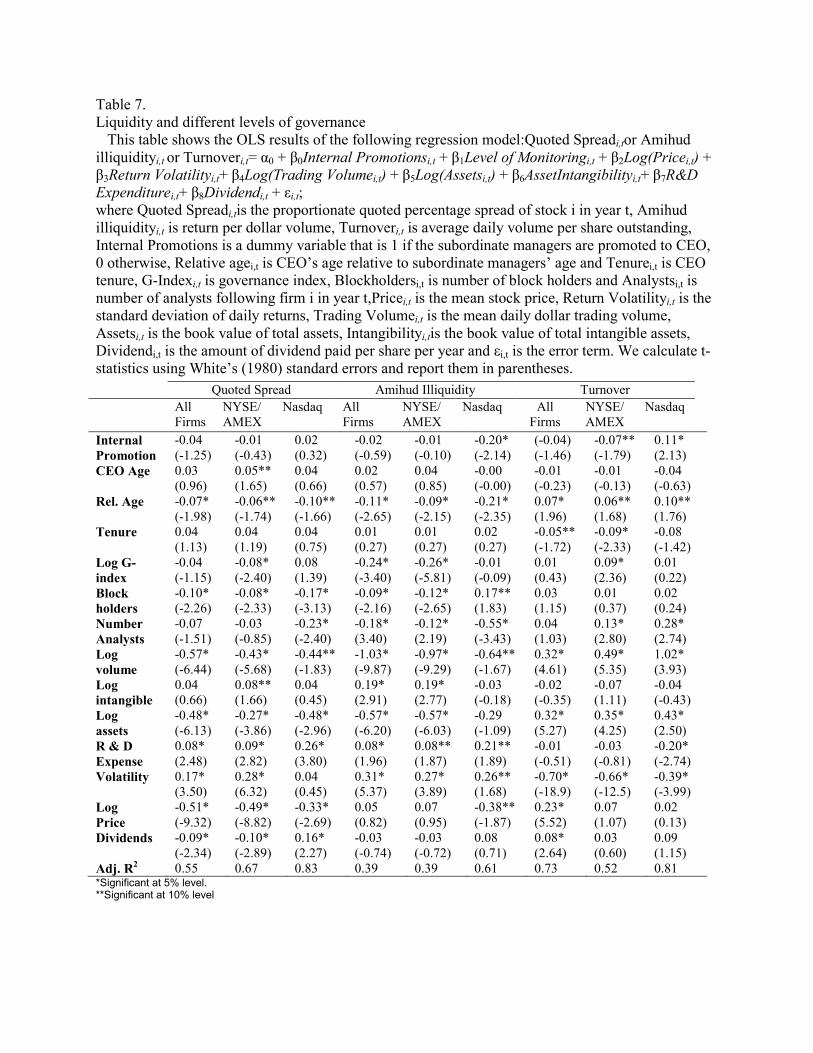
Table 7. Liquidity and different levels of governance This table shows the OLS results of the following regression model:Quoted Spreadi,tor Amihud illiquidityi,t or Turnoveri,t= α0 + β0Internal Promotionsi,t + β1Level of Monitoringi,t + β2Log(Pricei,t) + β3Return Volatilityi,t+ β4Log(Trading Volumei,t) + β5Log(Assetsi,t) + β6AssetIntangibilityi,t+ β7R&D
Expenditurei,t+ β8Dividendi,t + εi,t; where Quoted Spreadi,tis the proportionate quoted percentage spread of stock i in year t, Amihud illiquidityi,t is return per dollar volume, Turnoveri,t is average daily volume per share outstanding, Internal Promotions is a dummy variable that is 1 if the subordinate managers are promoted to CEO, 0 otherwise, Relative agei,t is CEO’s age relative to subordinate managers’ age and Tenurei,t is CEO tenure, G-Indexi,t is governance index, Blockholdersi,t is number of block holders and Analystsi,t is number of analysts following firm i in year t,Pricei,t is the mean stock price, Return Volatilityi,t is the standard deviation of daily returns, Trading Volumei,t is the mean daily dollar trading volume, Assetsi,t is the book value of total assets, Intangibilityi,tis the book value of total intangible assets, Dividendi,t is the amount of dividend paid per share per year and εi,t is the error term. We calculate t-statistics using White’s (1980) standard errors and report them in parentheses.
*Significant at 5% level. **Significant at 10% level
Quoted Spread Amihud Illiquidity Turnover
All Firms
NYSE/ AMEX
Nasdaq All Firms
NYSE/ AMEX
Nasdaq All Firms
NYSE/ AMEX
Nasdaq
Internal
Promotion
-0.04 (-1.25)
-0.01 (-0.43)
0.02 (0.32)
-0.02 (-0.59)
-0.01 (-0.10)
-0.20* (-2.14)
(-0.04) (-1.46)
-0.07** (-1.79)
0.11* (2.13)
CEO Age 0.03 (0.96)
0.05** (1.65)
0.04 (0.66)
0.02 (0.57)
0.04 (0.85)
-0.00 (-0.00)
-0.01 (-0.23)
-0.01 (-0.13)
-0.04 (-0.63)
Rel. Age -0.07* (-1.98)
-0.06** (-1.74)
-0.10** (-1.66)
-0.11* (-2.65)
-0.09* (-2.15)
-0.21* (-2.35)
0.07* (1.96)
0.06** (1.68)
0.10** (1.76)
Tenure 0.04 (1.13)
0.04 (1.19)
0.04 (0.75)
0.01 (0.27)
0.01 (0.27)
0.02 (0.27)
-0.05** (-1.72)
-0.09* (-2.33)
-0.08 (-1.42)
Log G-
index
-0.04 (-1.15)
-0.08* (-2.40)
0.08 (1.39)
-0.24* (-3.40)
-0.26* (-5.81)
-0.01 (-0.09)
0.01 (0.43)
0.09* (2.36)
0.01 (0.22)
Block
holders
-0.10* (-2.26)
-0.08* (-2.33)
-0.17* (-3.13)
-0.09* (-2.16)
-0.12* (-2.65)
0.17** (1.83)
0.03 (1.15)
0.01 (0.37)
0.02 (0.24)
Number
Analysts
-0.07 (-1.51)
-0.03 (-0.85)
-0.23* (-2.40)
-0.18* (3.40)
-0.12* (2.19)
-0.55* (-3.43)
0.04 (1.03)
0.13* (2.80)
0.28* (2.74)
Log
volume
-0.57* (-6.44)
-0.43* (-5.68)
-0.44** (-1.83)
-1.03* (-9.87)
-0.97* (-9.29)
-0.64** (-1.67)
0.32* (4.61)
0.49* (5.35)
1.02* (3.93)
Log
intangible
0.04 (0.66)
0.08** (1.66)
0.04 (0.45)
0.19* (2.91)
0.19* (2.77)
-0.03 (-0.18)
-0.02 (-0.35)
-0.07 (1.11)
-0.04 (-0.43)
Log
assets
-0.48* (-6.13)
-0.27* (-3.86)
-0.48* (-2.96)
-0.57* (-6.20)
-0.57* (-6.03)
-0.29 (-1.09)
0.32* (5.27)
0.35* (4.25)
0.43* (2.50)
R & D
Expense
0.08* (2.48)
0.09* (2.82)
0.26* (3.80)
0.08* (1.96)
0.08** (1.87)
0.21** (1.89)
-0.01 (-0.51)
-0.03 (-0.81)
-0.20* (-2.74)
Volatility
0.17* (3.50)
0.28* (6.32)
0.04 (0.45)
0.31* (5.37)
0.27* (3.89)
0.26** (1.68)
-0.70* (-18.9)
-0.66* (-12.5)
-0.39* (-3.99)
Log
Price
-0.51* (-9.32)
-0.49* (-8.82)
-0.33* (-2.69)
0.05 (0.82)
0.07 (0.95)
-0.38** (-1.87)
0.23* (5.52)
0.07 (1.07)
0.02 (0.13)
Dividends
-0.09* (-2.34)
-0.10* (-2.89)
0.16* (2.27)
-0.03 (-0.74)
-0.03 (-0.72)
0.08 (0.71)
0.08* (2.64)
0.03 (0.60)
0.09 (1.15)
Adj. R2 0.55 0.67 0.83 0.39 0.39 0.61 0.73 0.52 0.81
References
Acharya, V., S. Myers, and R. Rajan, 2011, “The Internal Governance of Firms,” Journal of
Finance, Forthcoming.
Admati, A., Pfleiderer, P., 2009. The ‗‗wall street walk‘‘ and shareholder activism: exit as a
form of voice. Review of Financial Studies 22, 2645–2685.
Amihud, Y., 2002. Illiquidity and stock returns: cross section and time-series effects. Journal of
Financial Markets 5, 31–56.
Bebchuk, L. A., Cohen, A., 2005. The costs of entrenched boards. Journal of Financial
Economics 78,v409-433.
Bebchuk, L. A., A. Cohen, and A. Ferrell. 2005. “What Matters in Corporate Governance?”
Working Paper, Harvard Law School.
Bhide, A., 1993, The Hidden Cost of Stock Market Liquidity, Journal of Financial Economics
34, 31-51.
Chung, K.H, J. Elder, and J.C Kim. 2010. “Corporate governance and liquidity.” Journal of
Financial and Quantitative Analysis, forthcoming.
Clarke, J., Subramanian, A., 2006. Dynamic forecasting behavior by analysts: theory and
evidence. Journal of Financial Economics 80, 81-113.
Coffee, J., 1991, "Liquidity versus Control: The Institutional Investor as Corporate Monitor,"
Columbia Law Review, 91, 1277-1368
Core, J. E., R. W. Holthausen, and D. F. Larcker, 1999, Corporate governance, CEO
compensation, and firm performance, Journal of Financial Economics 51, 371-406.
Cyert, R., S. H. Kang, and P. Kumar, 2002, Corporate governance, takeovers, and top-
management compensation: Theory and evidence, Management Science 48, 453-469.
Diamond, D.W., 1985. Optimal Release of Information By Firms. Journal of Finance 40, 1071-
1094.
Kenyazera. D. 2007. “Corporate Governance, Analyst Following, and Firm Behavior”. Working
paper-New York University
Dumitrescu A. 2010. “Corporate Governance and Market Liquidity”.Working Paper SSRN
working papers.
Edmans, A., Manso, G., 2009. Governance through exit and voice: a theory of multiple
blockholders. Unpublished working paper, University of Pennsylvania—the Wharton
School and MIT Sloan School of Management.
Edmans, A., 2009. Blockholder trading, market efficiency, and managerial myopia. Journal of
Finance, forthcoming.
Faure-Grimaud, A. and Gromb, D., 2004. Public trading and private incentives, Review of
Financial Studies, 17, 985-1014.
Glosten, L., Milgrom, P.R., 1985. Bid, ask, and transaction prices in a specialist market with
heterogeneously informed agents. Journal of Financial Economics 14, 71-100.
Gompers, P., Ishii, J., Metrick, A., 2003. Corporate governance and equity prices. Quarterly
Journal of Economics 118, 107-155.
Harford, J., and K. Lie, 2007, Decoupling CEO wealth and firm performance: The case of
acquiring CEOs, Journal of Finance 62, 917-949.
Hirschman, Albert, 1970, Exit, Voice, and Loyalty: Response to Declines in Firms,
Organizations, and States, Harvard University Press, Cambridge.
Holmstro¨ m, B., Tirole, J., 1993.Market liquidity and performance monitoring. Journal of
Political Economy 101, 678–709.
Khanna, N., Sonti, R., 2004. Value creating stock manipulation: feedback effect of stock prices
on firm value. Journal of Financial Markets 7, 237–270.
Kyle, A. S., 1985, "Continuous Auctions and Insider Trading," Econometrica, 53, 1315-1335.
Kyle, A. S., and Vila J. L., 1991, "Noise Trading and Takeovers," Rand Journal of Economics,
22, 54-71.
Lang, M., Lins, K., Miller, D., 2004. Concentrated control, analyst following and valuation: Do
analysts matter most when investors are protected least? Journal of Accounting
Research42, 589-623
La Porta, R., Lopez-de-Silanes, F., Shleifer, A. and R. Vishny, 2000, Investor Protection and
Corporate Governance, Journal of Financial Economics 58, 3-27.
Landier, A., Sraer D., and Thesmar, D, 2006, Bottom-up corporate governance, Working paper,
New York University.
Lin, X., Zhang, Y., Zhu, N. 2009."Does Bank Ownership Increase Firm Value?Evidence from
China." Journal of International Money and Finance, 28, 720–737.
Lipson, M. L., and Mortal, S., 2009. Liquidity and Capital Structure, Journal of Financial
Markets 12, 611-644.
Maug, E., 1998, Large Shareholders as Monitors: Is There a Trade-Off between Liquidity and
Control?, Journal of Finance 53 (1), 65-98.
McInish, T., and R. Wood. 1992. An Analysis of Intraday Patterns in Bid/Ask Spreads for NYSE
Stocks. Journal of Finance, 47, 753-64.
Morck, R., Shleifer, A., Vishny, R., 1988. Management ownership and market valuation: an
empirical analysis. Journal of Financial Economics 20, 293–315.
Morck, Randall, F. Yang. 2001. "The Mysterious Growing Value of S&P Index Membership."
NBER Working Paper No. 8654.
Noe, T. H., 2002, "Investor Activism and Financial Market Structure," Review of Financial
Studies, 15, 289-318.
Novaes, Walter, and Luigi Zingales, 1999, Capital structure choice under a takeover threat,
University of Chicago working paper.
Shleifer, A., and Vishny, R., 1986, Large shareholders and corporate control. Journal of Political
Economy 94, 461-488.
Shleifer, A. and Vishny, R., 1997. A Survey of Corporate Governance, Journal of Finance 52 (2),
737-82.
Shleifer, A. and Vishny, R., 2003. "Stock Market Driven Acquisitions," Journal of Financial
Economics, 70, December 2003, pp. 295-311.
Stoll, H. 2000. “Friction.” Journal of Finance, 55, 1479-1514.
Subrahmanyam, A., and S. Titman, 2001 Feedback from stock prices to cash flows, Journal of
Finance 56, 2389—2413.
Titman, Sheridan, 1984, The Effect of Capital Structure on a Firm's Liquidation Decision,
Journal of Financial Economics 13, 137-151.
Van Ness, B., R. Van Ness, and R. Warr (2001). “How Well Do Adverse Selection Components
Measure Adverse Selection?” Financial Management, 30, 77-98.
White, H. 1980. “A Heteroskedasticity-Consistent Covariance Estimator and a Direct Test for
Heteroskedasticity.”Econometrica, 48, 817-838.