CoQA: A Conversational Question Answering Challenge - MIT ...
Upload
independentCategory
view
3download
0
1 23
Journal of Nonverbal Behavior ISSN 0191-5886 J Nonverbal BehavDOI 10.1007/s10919-013-0158-9
Conversational Synchronizationin Naturally Occurring Settings: ARecurrence-Based Analysis of GazeDirections and Speech Rhythms of Staff andClients with Intellectual DisabilityEllen Reuzel, Petri J. C. M. Embregts,Anna M. T. Bosman, Ralf Cox,Maroesjka van Nieuwenhuijzen &Andrew Jahoda
1 23
Your article is protected by copyright and all
rights are held exclusively by Springer Science
+Business Media New York. This e-offprint is
for personal use only and shall not be self-
archived in electronic repositories. If you wish
to self-archive your article, please use the
accepted manuscript version for posting on
your own website. You may further deposit
the accepted manuscript version in any
repository, provided it is only made publicly
available 12 months after official publication
or later and provided acknowledgement is
given to the original source of publication
and a link is inserted to the published article
on Springer's website. The link must be
accompanied by the following text: "The final
publication is available at link.springer.com”.
ORI GIN AL PA PER
Conversational Synchronization in Naturally OccurringSettings: A Recurrence-Based Analysis of GazeDirections and Speech Rhythms of Staff and Clientswith Intellectual Disability
Ellen Reuzel • Petri J. C. M. Embregts • Anna M. T. Bosman •
Ralf Cox • Maroesjka van Nieuwenhuijzen • Andrew Jahoda
� Springer Science+Business Media New York 2013
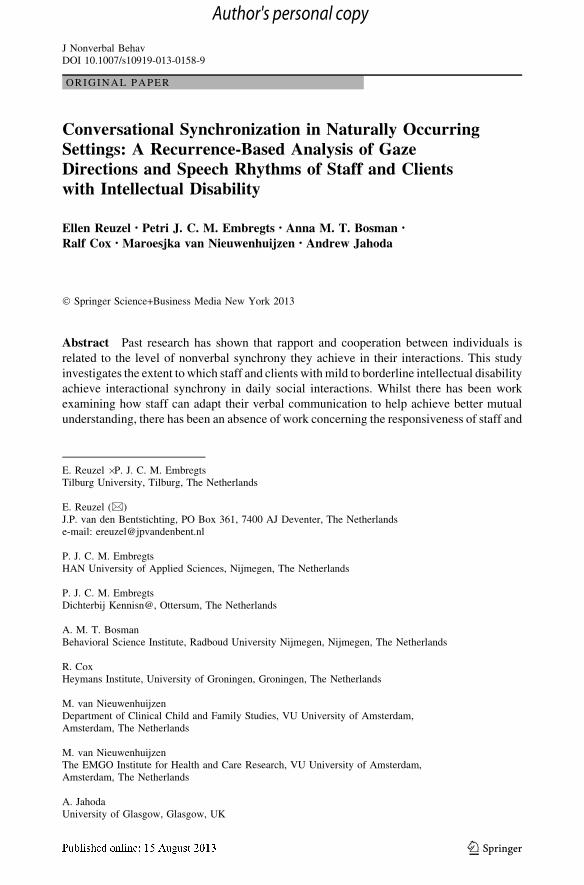
Abstract Past research has shown that rapport and cooperation between individuals is
related to the level of nonverbal synchrony they achieve in their interactions. This study
investigates the extent to which staff and clients with mild to borderline intellectual disability
achieve interactional synchrony in daily social interactions. Whilst there has been work
examining how staff can adapt their verbal communication to help achieve better mutual
understanding, there has been an absence of work concerning the responsiveness of staff and
E. Reuzel � P. J. C. M. EmbregtsTilburg University, Tilburg, The Netherlands
E. Reuzel (&)J.P. van den Bentstichting, PO Box 361, 7400 AJ Deventer, The Netherlandse-mail: [email protected]
P. J. C. M. EmbregtsHAN University of Applied Sciences, Nijmegen, The Netherlands
P. J. C. M. EmbregtsDichterbij Kennisn@, Ottersum, The Netherlands
A. M. T. BosmanBehavioral Science Institute, Radboud University Nijmegen, Nijmegen, The Netherlands
R. CoxHeymans Institute, University of Groningen, Groningen, The Netherlands
M. van NieuwenhuijzenDepartment of Clinical Child and Family Studies, VU University of Amsterdam,Amsterdam, The Netherlands
M. van NieuwenhuijzenThe EMGO Institute for Health and Care Research, VU University of Amsterdam,Amsterdam, The Netherlands
A. JahodaUniversity of Glasgow, Glasgow, UK
123
J Nonverbal BehavDOI 10.1007/s10919-013-0158-9
Author's personal copy
clients regarding their nonverbal behavior. Nineteen staff members video-recorded a social
interaction with one of their clients in which the client had a need for support. The recordings
were analyzed using cross recurrence quantification analysis. In addition, fifteen staff
members as well as clients with an intellectual disability completed a questionnaire on the
quality of the nineteen video-recorded interactions. Analysis of the nonverbal patterns of
interaction showed that the staff–client dyads achieved interactional synchrony, but that this
synchrony is not pervasive to all nonverbal behaviors. The client observers appeared to be
more sensitive to this synchrony or to value it more highly than the staff raters. Staff observers
were sensitive to quantitative measures of talking. The more staff in the interactions talked,
the lower the quality rating of the interaction. The more the clients talked, the more positively
the staff observers rated the interactions. These findings have implications for how colla-
borative relationships between clients and support workers should be understood.
Keywords Staff–client interactions � Collaborative relationship � Intellectual disabilities �Interactional patterns � Social interactions � Nonverbal communication
Introduction
‘Interactions between staff and clients with an intellectual disability (ID) are crucial to how
successful services are in meeting people’s needs’ (Social Exclusion Unit 2005, p. 57).
Successful social interactions also contribute to the empowerment of clients with ID by
encouraging them to play an active part in inter-personal encounters. Finlay et al. (2008,
p. 350) state that: ‘Empowerment is not just about choosing to take this type of support
rather than that, but it is about what happens between people moment by moment, in the
mundane details of everyday interaction’. A number of researchers have examined verbal
interactions between staff and clients. For example, Antaki and Rapley (1996) and Antaki
et al. (2002) found that staff tend to be controlling when interacting with people with an ID.
Recent studies indicated that staff tend to favor the use of directives and questions and may
fail to adjust their language to the client’s level of understanding (Jingree et al. 2006).
Hence, clients seem to be presented with few opportunities to engage as equal partners in
conversational interchanges (Leudar 1981; McConkey et al. 1999).
In contrast to these findings, a recent study by Reuzel et al. (2012) found that inter-
actions between staff and clients had a relatively balanced distribution of power, albeit
each communicative partner tended to use different verbal strategies to influence the
conversation. Staff asked more direct questions and sometimes neglected meaningful
contributions from clients. Clients, on the other hand, provided more extended turns in
response to staff members’ questions, thereby helping to maintain the dialogue. However,
in a notable minority of communicative turns, the clients failed to link with the staff
member’s contribution. This points to the difficulties staff and clients can face when trying
to establish collaborative dialogues on shared topics. Despite the growing body of work in
the field of verbal communication between staff and clients, there is a paucity of research
concerning the underlying nonverbal dynamic processes that occur during communication.
Therefore, the present paper will focus on the nature of nonverbal dynamical interactional
patterns between staff and clients with IDs.
To improve communication, the onus has been on the staff member to adjust their
verbal communication by using simpler language and to listen carefully to what the client
is saying (Bartlett and Bunning 1997; Jahoda et al. 2009). Perhaps the reason why less
J Nonverbal Behav
123
Author's personal copy
emphasis is placed on nonverbal behavioral patterns has been the assumption that even
people with mild intellectual difficulties may have greater difficulty with socio-emotional
understanding. Problems interpreting emotional cues have been suggested as reasons for
higher levels of aggressive behavior displayed by individuals with ID (Zaja and Rojahn
2008). While people with autism have quite specific socio-emotional deficits, Moore
(2001) made clear that this is not necessarily the case for people with intellectual dis-
abilities. He pointed out that a drawback with research in this area is that it has often
examined people’s ability to label static emotional cues. However, the ability to syn-
chronize inter-personal behavior when interacting with others relies on other tacit skills for
dealing with dynamic social cues. This is, therefore, an area that warrants further
investigation.
There have been striking insights into the brain’s sensitivity to social information (for a
review, see Cacioppo et al. 2006) and the way in which people think and act cooperatively
(Hutchins 1995). An essential feature of this so-called joint action is how each person’s
nuanced actions shape the other’s as the joint action unfolds. For example, when two
people talk, they spontaneously converge in terms of pausing and speaking duration,
speaking rate, turn duration, response latency, vocal intensity, and accent. Movements and
postures, likewise appear to be spontaneously coordinated with speech within and across
individuals (see Fowler et al. 2008 for a review). Interpersonal coordination is the degree in
which the behaviors in an interaction are nonrandom, that is, patterned and synchronized in
both time and form (Bernieri and Rosenthal 1991).
In this study, synchronization will be defined as the reciprocity of staff and clients’
nonverbal behavior or in the coordination of taking turns. A variety of theoretical
frameworks predict the resemblance of behaviors between two people engaged in com-
munication, in the form of coordination, mimicry, or alignment. For example, there is
evidence that people coordinate their behavior when they collaborate to solve problems
with mutually understood structure (Sebanz et al. 2006). However, little is known about the
time course of the behavior matching (Louwerse et al. 2012). Therefore, this study
examines the temporal relationship between two specific nonverbal matching behaviors of
the communicative partners, namely gaze direction and speech rhythm. These behaviors
are key elements of dialogue (Goodwin 1981; McNeill 1992; Sacks 1992). The alignment
of speech rhythms and gaze patterns have been examined by a number of researchers
(Cappella and Planalp 1981; de Graag et al. 2012; Giles et al. 1991; Louwerse et al. 2012;
Richardson et al. 2007; Street 1984) and are found to be associated with the quality of the
interactions. We chose speech rhythm and gaze direction as behavioral variables, because
they enabled us to assess the behavior of multiple dyads in a similar way. As far as we
known, no information is available on the level of synchronization of nonverbal behavior
that occurs within the specific context of daily social interactions between staff and clients
with mild to borderline ID.
Investigating the underlying dynamics that occur during the mutual exchange of
information provides important insights into the nature of the interaction. For example, the
coordination of turn taking requires cooperation between staff and clients at a nonverbal
level, in terms of taking initiatives and being responsive to each other. Chapple (1970)
found that during interaction partners signal their readiness to act, and the patterns
observed between interactants represent the compromises they reach, which we refer to as
synchrony. It has also been demonstrated that the cyclicity of vocal activity increases over
the course of face-to-face dialogues (Warner 1992). This means that, as the conversation
progresses, interactants search to find a rhythm that allows them to take turns holding the
floor while still following their own tendency to be talkative. Optimally, interactants reach
J Nonverbal Behav
123
Author's personal copy
a point at which their tendencies to be talkative alternate, resulting in fewer interruptions
and silent pauses. Conversational precision is thus a function of the phase relation between
each speaker’s vocal activity rhythms. Other studies found that the eye movements of two
interactants are coupled and that this coupling reflects the quality of the interaction (de
Graag et al. 2012; Richardson et al. 2007). In addition, eye movements were found to
embody the cognitive processing involved in cooperative conversation and the shared
knowledge among interlocutors (Shockley et al. 2009).
More recent studies stressed the theoretical significance of the manner and extent to
which people synchronize behavior matching during social interaction (Schmidt et al.
2012). Louwerse et al. (2012) found that synchronization is pervasive and uniform within
multiple modality groups and this synchronization is sensitive to social and task variables.
Hove and Risen (2009) stressed the relationship between synchronization and social
affiliation, with each enhancing the other. Rapport building, the smoothness of a social
encounter, and cooperation efficiency are closely linked to the ability to synchronize with a
partner (Delaherche et al. 2012). For interactions to be successful, rapport or engagement
appears to be of crucial importance. Rapport is a phenomenon that emerges during the
interaction between individuals; it is not a personality trait, albeit some people may be
better at inducing rapport than others. It refers to a situation in which people have similar
feelings and experience positive interactions. According to Tickle-Degnen and Rosenthal
(1990), rapport consists of three components: mutual attention, mutual positivity (friend-
liness and caring), and coordination. Behavioral coordination becomes particularly
important when interactants learn to know each other. Behavioral coordination is visible
when people mirror one another in posture or when they are in interactional synchrony
(e.g., Chartrand and Bargh 1999). Miles et al. (2009) found a direct link between levels of
rapport and interpersonal coordination, that is, high levels of rapport were associated with
stable coordinative interaction patterns.
In this study, a nonlinear time-series analysis technique called recurrence analysis was
used to examine the nonverbal patterns of synchronization of staff and client dyads (e.g.,
Church 1993; Eckmann et al. 1987; Marwan et al. 2007; Von Heijne 1987; Zbilut and
Webber 1992; see Dale and Spivey 2005, for a review, and Webber and Zbilut 2005, for
an excellent technical introduction). This technique was originally used for the analysis
of time series of continuous variables of physical or biological systems. Recently,
however, the technique has been successfully applied in the social and behavioral sci-
ences and used to explore patterns of syntactic coordination between children and parents
(Dale and Spivey 2006), eye movement synchronization between speakers and listeners
(Richardson et al. 2007), mother-infant gaze flexibility during reunion in a still-face
procedure (de Graag et al. 2011), and intervention-induced changes in parent–child
conflict conversations (Lichtwarck-Aschoff et al. 2012). This method provides an anal-
ysis of global structural patterns of dialogue, charting how gaze direction and temporal
speech patterns of staff and clients align during interaction. By global we mean drawing
general quantitative measures with minimal dependence on statistical assumptions,
describing the extent to which a series of staff–client interactions involves gaze direction
and temporal speech structures that are more or less attuned to each other. The aim is to
quantify the extent to which nonverbal behavior is coordinated in naturalistic dialogue
(Dale and Spivey 2006). Because knowledge with respect to synchronization of gaze
direction and speech rhythms is scarce, especially within the context of natural face to
face dialogues, we did not know what to expect. We assumed that high levels of speech
synchronization and gaze directions are related to higher levels of rapport, based on
earlier findings in the literature.
J Nonverbal Behav
123
Author's personal copy
We formulated the goal of the current paper in terms of three specific questions con-
cerning nonverbal behavior between staff and clients with ID:
1. What level of attunement and synchronization (i.e., coordination) is achieved in terms
of their gaze directions and speech rhythms?
2. What is the pattern of dominance in the dialogue with respect to interlocutors initiating
nonverbal behaviors such as gaze direction or following the other’s lead?
3. Are key elements of staff and clients’ coded nonverbal behavior (levels of attunement
and dominance) associated with observer ratings of the quality of the interactions?
Method
Participants
Staff
Nineteen staff members (3 men and 16 women), working at the JP van den Bent foundation
in the Netherlands, participated in this study. This is a foundation that provides services to
people with an ID. The role of staff is to support clients with a broad spectrum of daily
living tasks, such as helping with household jobs, planning social and vocational activities,
arranging appointments, healthcare, and relationship difficulties. Staff members discuss
their input with clients and agree on a support action plan, which sets out the nature of
support to be given and how it will be provided. The staff members worked in different
regions and work settings. Most staff members (n = 13) worked in community-based
residential houses, three worked in outreach care for people living in their own homes, and
three worked in crisis care, which is care for people who need immediate housing and care
due to different causes, for example a mental breakdown. Their mean experience of
working in services for people with ID was 7.1 years (Range = 1–27 years).
Clients
Each staff member was asked to select a client with whom they worked frequently, or who
they meet with at least once a week. Clients’ chronological ages ranged from 18 to
39 years (M = 25.1 years; SD = 6.1). Seven of the clients were men and twelve were
women, and they all lived in community care settings and received support from services;
three clients lived alone in their own apartment with outreach care, and seven lived alone
or with a partner with 24 h support available; six clients lived in staffed houses for training
purposes, and three clients lived in staffed houses temporarily (crisis care). The Wechsler
Adult Intelligence Scale (WAIS-3) was used to assess their level of cognitive functioning.
Their scores ranged from mild (8) to borderline intellectual functioning (11). Mild intel-
lectual functioning means having an Intelligent Quotient between 50 and 70, and bor-
derline intellectual functioning means having an IQ between 70 and 85. All clients had
sufficient verbal ability to express their thoughts and feelings.
Observer Raters
Fourteen staff members and 14 clients with ID observed the 19 interactions on video. Staff
and clients worked or lived in crisis care and did not know the staff and clients shown on
J Nonverbal Behav
123
Author's personal copy
the video recordings. The mean age of staff was 32.4 years and ranged from 20 to 52 years.
Eleven staff members were women and three were men. Clients’ ages ranged from 18 to
59 years (M = 26.9 years). Six of the clients were men and eight were women. Their
WAIS scores ranged from mild (6) to borderline intellectual functioning (8). All clients had
good expressive and receptive verbal skills.
Procedure
After obtaining permission from the organization to conduct the research, managers and
psychologists were provided with information about the purpose of the study. Staff and
clients who volunteered for the study received an explanation of its purpose and what was
involved in participating. Staff and clients were informed orally and in writing; informed
consent was obtained.
Participating staff video-recorded a regular conversation, which had already been
scheduled, with a client in his or her home. They were asked to place the portable cam-
corder unobtrusively in a corner of the room, and to keep the situation as normal as
possible. The interactions were required to meet the following criteria: (1) the interaction
was related to the client’s support plan, (2) the topic concerned an aspect of the partici-
pants’ support needs, and (3) these particular interactions occurred on a regular basis, at
least once a week. The average length of the video recordings was 14.6 min (SD = 6.2,
Range = 7.2–29.7 min). No instructions were given to the participants other than to
interact as usual. Ten different types of topics were discussed: (1) establishing or refining a
support action plan (n = 5), (2) planning or evaluating client goals (n = 1), (3) planning
household activities (n = 4), (4) planning other activities like making a weekly schedule or
arranging a visit to the doctor (n = 3), (5) finding suitable leisure opportunities (n = 2),
(6) planning finances (n = 5), (7) evaluating their work situation (n = 2), (8) discussing
problems related to child care (n = 1), (9) coping with (conflicts with) other persons
(n = 6) and (10) finding solutions for problems the clients faced (n = 3). All the topics of
conversation required the clients and staff to listen actively to each other, in order to reach
a shared view about how to tackle the issue being discussed.
Data Preparation
All videotapes were then transferred to ‘The Observer XT’. The Observer XT is a pro-
fessional event-logging software for the collection, analysis, and presentation of obser-
vational data and was developed by Noldus (2009). Next, nonverbal behavior was coded
for staff and clients, namely the gaze direction (is the staff member or the client looking at
the other person or is he/she looking elsewhere?) and speech rhythm (is the staff member
or client talking or is he/she silent?). In order to prepare the data for analysis, four
continuously-scored sequences of nonverbal behaviors were created for each dyad. Spe-
cifically, there were two time series’ for gaze direction and two for speech rhythm,
showing the client’s and staff’s looking and talking behavior over time. Each time series
represented a dichotomous variable. That is, a score of ‘one’ representing staff or client
looking at the other or talking, and the score ‘zero’ representing staff or client looking
elsewhere or being silent. The raw time series was sampled with a sampling rate of 1 Hz.
Choosing a sample rate that is too high will either amplify the effects of noise or inflate the
influence of relatively stable periods. A sample rate that is too low will result in under-
determination of the relevant aspects of the behavior (particularly turn-taking in this
study). The 1-Hz sample rate chosen here was considered to reveal the relevant dynamics
J Nonverbal Behav
123
Author's personal copy
of the conversation, since preliminary analysis established that the average turn durations
of both interlocutors was longer than one second. So, finally, the four time series each had
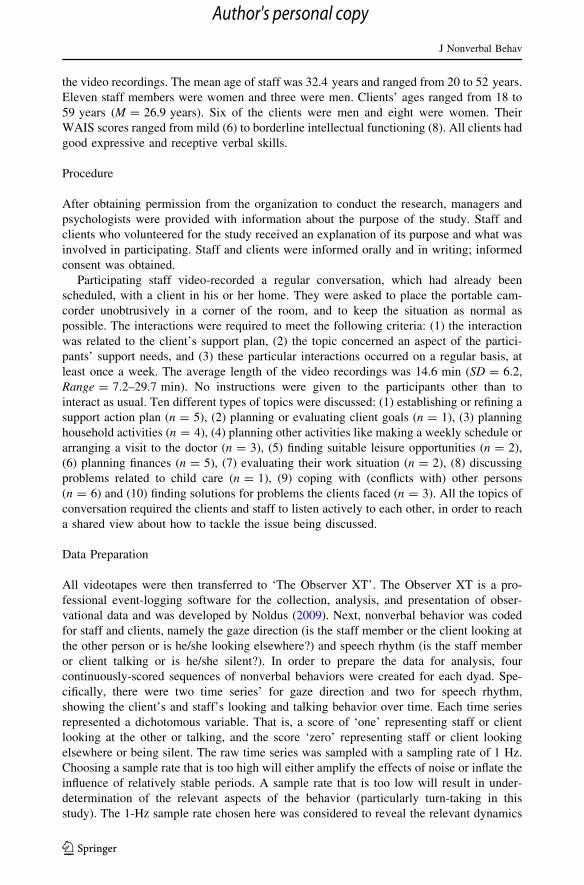
a single value at every interval of one second. Figure 1 presents an example of a time series
of both staff member’s and client’s (1-Hz sampled dichotomized) nonverbal behavior.
These four time series’ were analyzed with traditional linear analyses (distributions, t tests,
and correlations) and a nonlinear analysis, namely, recurrence quantification analysis (RQA)
(cross recurrence based; CRQA). The CRQA will be explained below. To assess inter-
observer reliability initial coding was carried out with four videotapes, encompassing
53.2 min in which the gaze direction and talk/silence sequences of staff and clients were
continuously coded. Inter-observer reliability was computed allowing a 0.5 s overlap. Since
the video recordings were home-made and therefore the quality was variable, the recordings
were displayed in slow motion in order to access an optimal accuracy on the moments where
persons started or stopped talking or looked at the other or looked away. There was an overall
agreement of 76 % for gaze direction and 81 % of the talk/silence sequences.
Next, fourteen staff members and fourteen clients observed the nineteen video-recorded
interactions. After each video fragment they completed a short questionnaire derived from
the Session Rating Scale (SRS) for staff and the Mentally Disabled Session Rating Scale
(MSRS) for clients from Duncan et al. (2004), resulting in four items to evaluate each
dyad:
• The relation: Did staff listen to the client?
• Goals and subject: Did the client want to talk about the items that were discussed?
• Method: Was the way staff discussed the items adequate?
• Overall: What was the overall impression of the interaction?
The questionnaire for clients was adjusted in consultation with four clients who did not
participate in the observations. The language was changed to make the questions more
accessible. After each question, the observer placed a dot on a 10 cm long line; the further
they placed the dot to the right, the more positively the item was evaluated. For clients,
visual means of support were added in the form of emoticons: A happy face was placed on
the right side of the line and a sad face was placed on the left side of the line. Before staff
and clients started the observations proper they practiced using the questionnaire with two
example video fragments that were not included in the study. The researcher explained the
items and made sure all observers understood what was being asked of them. The
researcher had not met any of the observers prior to the research. The questionnaires were
filled in anonymously and in silence, with no obtrusion from the researcher.
Data Analysis
In this section two types of analysis will be presented: the traditional linear analysis and the
RQA.
Time Code ... t-4 t-3 t-2 t-1 t t+1 t+2 t+3 t+4 ...
Staff ... 0 0 1 1 1 1 1 1 0 ...
Client ... 1 1 1 1 0 0 0 0 1 ...
Fig. 1 Example of time series
J Nonverbal Behav
123
Author's personal copy
Traditional Linear Analysis
This type of analysis offers a global overview of the amount and distribution of talking and
looking of both staff and clients during the conversation. That is, this analysis will provide
central tendency measures of the behavior of the interaction patterns. The frequencies of
the different behaviors (gaze direction and talk and silence sequences) for each time series,
the percentage of synchrony (%Sync), and correlations between these measures will be
presented. Percentage synchrony is defined as the amount of time that the interacting
partners spend looking at each other, or when one is talking while the other remains silent,
as a percentage of the total duration of the interaction.
Recurrence Quantification Analysis
Recurrence quantification analysis is used to assess how coordinated the nonverbal
behavior of the staff and clients is as the interaction unfolds. RQA is relative unknown
within the field of social science and an extensive description is provided below. RQA is a
particular type of nonlinear time-series analysis based on the registration of whether a
system’s state at each and every point during an observation recurs, that is, repeatedly
occurs (e.g., Marwan et al. 2007; Webber and Zbilut 2005; Zbilut and Webber 1992). From
these basic recurrences, several measures can be derived that quantify the dynamic
organization of the underlying system. In order to study two interacting systems, cross-
recurrence quantification analysis (CRQA) is performed (e.g., Shockley et al. 2002). In
CRQA, recurrence reflects that the behavioral state of one of the systems (in this study the
behavior of one interlocutor) also occurs in the other system (i.e., the other interlocutor) at
some point in the time series either earlier, concurrently, or later. In the present study
CRQA allows us to analyze attunement, synchrony, and dominance of staff’s and client’s
gaze behavior and speech rhythm from the temporal pattern in the time series. The main
research questions to which this analysis was applied were: (1) What level of attunement
and synchronization (i.e., coordination) is achieved in terms of their gaze directions and
speech rhythms? (2) What is the pattern of dominance in the dialogue in relation to
interlocutors initiating nonverbal behaviors such as gaze direction or following the other’s
lead? (3) Are key elements of staff and clients’ coded nonverbal behavior (levels of
attunement and dominance) associated with observer ratings of the quality of the inter-
actions? In terms of recurrence analysis these questions translate to the quantification of
recurrence (i.e., counting recurrent points), particularly on and around the line of syn-
chrony in the recurrence plot, as will be explained below. For an excellent in-depth treatise
of CRQA in the context of conversation research, similar to the analysis performed here,
we refer to the paper by Dale and Spivey (2006).
To answer the research questions stated above, categorical CRQA was performed on
both the gaze-direction and the speech-rhythm time series of client and staff. This means
that matches between nonverbal behaviors of all instances in the client’s time series and all
instances in the staff’s time series are registered. These matches can graphically be rep-
resented in a two-dimensional grid, the rows of which represent the nonverbal behaviors of
talking or looking of one of the interlocutors and the columns represent those of the other
interlocutor. In each cell of this grid we place a ‘black dot’ when the cell reflects a
recurrence (i.e., matching nonverbal behavior) or ‘white dot’ when there is no recurrence
(i.e., non-matching nonverbal behavior).
In this study we have chosen the following operationalization of ‘recurrence’: With
respect to gaze direction a black dot reflected the combination of both staff and client
J Nonverbal Behav
123
Author's personal copy
looking at each other, whereas a white dot reflected all other combinations (i.e., one or both
looking elsewhere). With respect to speech rhythm a black dot reflects an instance where
only one of the interlocutors was talking, and a white dot reflects an instance where both
were talking or both were silent. The reason for this particular arrangement of matching of
client’s and staff member’s nonverbal behaviors is that it offers a meaningful partitioning
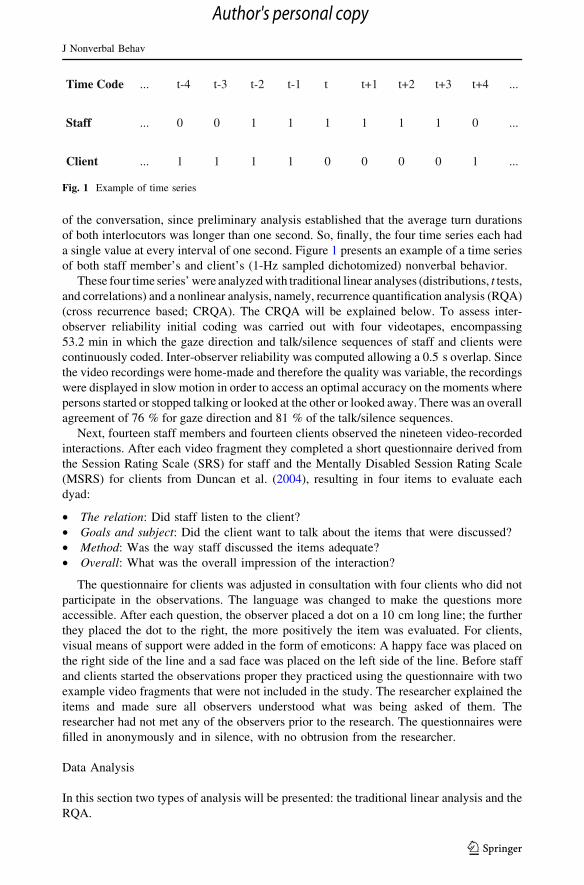
of the interaction, as will become clear. The resulting graph is a cross recurrence plot
(CRP) of two time series (Fig. 2). With the black-and-white coloring the CRP visualizes
the periods where matching nonverbal behaviors are occurring and where behaviors are
non-matching during the conversation.
An important set of points in the CRP is the main diagonal from the left-bottom corner
to the right-top corner (diagonal line in Fig. 2). This diagonal, called the line-of-synchrony
(LOS), reflects simultaneous recurrences, in our case, matches between client’s and staff’s
nonverbal behavior performed at the same point in time. That is, where they stared face-to-
face and (probably) made eye contact or where one was talking while the other was silent
and (probably) was listening. The number of recurrent points (i.e., black dots) on the LOS
divided by the total number of points of the line (which equals the length of the time series)
is equivalent to the percentage of synchrony (%Sync).
The correspondence between the LOS and the central-tendency measure %Sync nicely
demonstrates the fact that the CRP contains much more information than merely an
analysis of matching actions at the same time. It offers a much broader quantification of the
temporal pattern of nonverbal behavior on all timescales during the conversation. We can
inspect the relative number and distribution of matching and non-matching looking or
talking behaviors as the client–staff interaction unfolds over time. In fact, RQA is the
Fig. 2 Example cross recurrence plot. Black areas represent periods of one person talking matched by theother person being silent some time later or earlier, with respect to speech, or periods of one person lookingat the other matched by the other looking back some time earlier or later, with respect to gaze. The whiteareas, on the other hand, represent periods of silence or talking of one matched before or after by silence ortalking of the other (speech) or looking at the other that is not matched as well as both looking away (gaze).In this way the RP represents a raw structure that can capture the distributions of matching and non-matching non-verbal behaviour, together with when these are occurring in the conversations. The diagonalline is the line-of-synchrony (LOS; see text)
J Nonverbal Behav
123
Author's personal copy
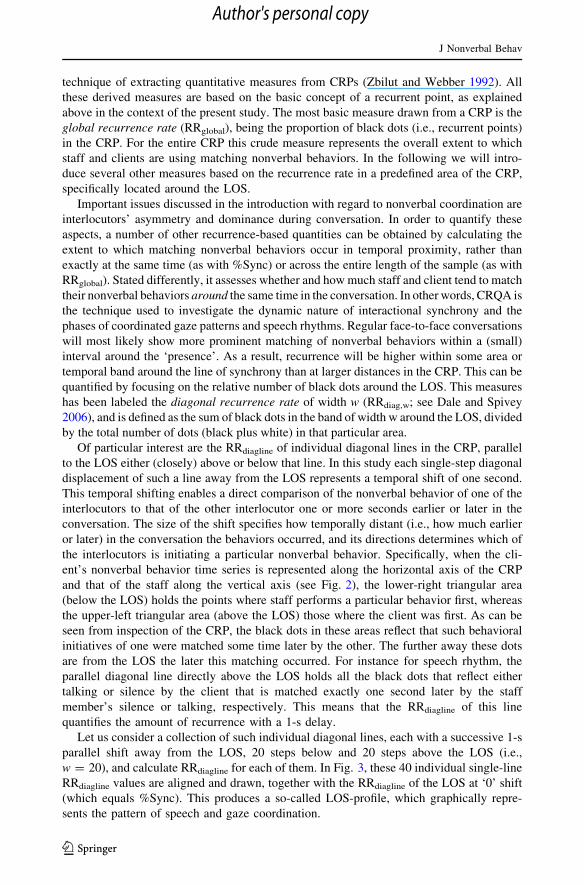
technique of extracting quantitative measures from CRPs (Zbilut and Webber 1992). All
these derived measures are based on the basic concept of a recurrent point, as explained
above in the context of the present study. The most basic measure drawn from a CRP is the
global recurrence rate (RRglobal), being the proportion of black dots (i.e., recurrent points)
in the CRP. For the entire CRP this crude measure represents the overall extent to which
staff and clients are using matching nonverbal behaviors. In the following we will intro-
duce several other measures based on the recurrence rate in a predefined area of the CRP,
specifically located around the LOS.
Important issues discussed in the introduction with regard to nonverbal coordination are
interlocutors’ asymmetry and dominance during conversation. In order to quantify these
aspects, a number of other recurrence-based quantities can be obtained by calculating the
extent to which matching nonverbal behaviors occur in temporal proximity, rather than
exactly at the same time (as with %Sync) or across the entire length of the sample (as with
RRglobal). Stated differently, it assesses whether and how much staff and client tend to match
their nonverbal behaviors around the same time in the conversation. In other words, CRQA is
the technique used to investigate the dynamic nature of interactional synchrony and the
phases of coordinated gaze patterns and speech rhythms. Regular face-to-face conversations
will most likely show more prominent matching of nonverbal behaviors within a (small)
interval around the ‘presence’. As a result, recurrence will be higher within some area or
temporal band around the line of synchrony than at larger distances in the CRP. This can be
quantified by focusing on the relative number of black dots around the LOS. This measures
has been labeled the diagonal recurrence rate of width w (RRdiag,w; see Dale and Spivey
2006), and is defined as the sum of black dots in the band of width w around the LOS, divided
by the total number of dots (black plus white) in that particular area.
Of particular interest are the RRdiagline of individual diagonal lines in the CRP, parallel
to the LOS either (closely) above or below that line. In this study each single-step diagonal
displacement of such a line away from the LOS represents a temporal shift of one second.
This temporal shifting enables a direct comparison of the nonverbal behavior of one of the
interlocutors to that of the other interlocutor one or more seconds earlier or later in the
conversation. The size of the shift specifies how temporally distant (i.e., how much earlier
or later) in the conversation the behaviors occurred, and its directions determines which of
the interlocutors is initiating a particular nonverbal behavior. Specifically, when the cli-
ent’s nonverbal behavior time series is represented along the horizontal axis of the CRP
and that of the staff along the vertical axis (see Fig. 2), the lower-right triangular area
(below the LOS) holds the points where staff performs a particular behavior first, whereas
the upper-left triangular area (above the LOS) those where the client was first. As can be
seen from inspection of the CRP, the black dots in these areas reflect that such behavioral
initiatives of one were matched some time later by the other. The further away these dots
are from the LOS the later this matching occurred. For instance for speech rhythm, the
parallel diagonal line directly above the LOS holds all the black dots that reflect either
talking or silence by the client that is matched exactly one second later by the staff
member’s silence or talking, respectively. This means that the RRdiagline of this line
quantifies the amount of recurrence with a 1-s delay.
Let us consider a collection of such individual diagonal lines, each with a successive 1-s
parallel shift away from the LOS, 20 steps below and 20 steps above the LOS (i.e.,
w = 20), and calculate RRdiagline for each of them. In Fig. 3, these 40 individual single-line
RRdiagline values are aligned and drawn, together with the RRdiagline of the LOS at ‘0’ shift
(which equals %Sync). This produces a so-called LOS-profile, which graphically repre-
sents the pattern of speech and gaze coordination.
J Nonverbal Behav
123
Author's personal copy
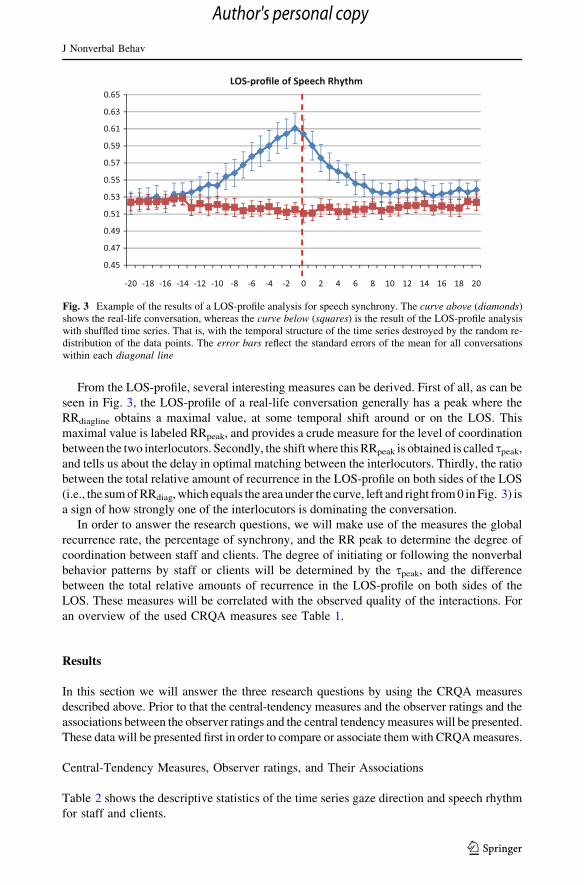
From the LOS-profile, several interesting measures can be derived. First of all, as can be
seen in Fig. 3, the LOS-profile of a real-life conversation generally has a peak where the
RRdiagline obtains a maximal value, at some temporal shift around or on the LOS. This
maximal value is labeled RRpeak, and provides a crude measure for the level of coordination
between the two interlocutors. Secondly, the shift where this RRpeak is obtained is called speak,
and tells us about the delay in optimal matching between the interlocutors. Thirdly, the ratio
between the total relative amount of recurrence in the LOS-profile on both sides of the LOS
(i.e., the sum of RRdiag, which equals the area under the curve, left and right from 0 in Fig. 3) is
a sign of how strongly one of the interlocutors is dominating the conversation.
In order to answer the research questions, we will make use of the measures the global
recurrence rate, the percentage of synchrony, and the RR peak to determine the degree of
coordination between staff and clients. The degree of initiating or following the nonverbal
behavior patterns by staff or clients will be determined by the speak, and the difference
between the total relative amounts of recurrence in the LOS-profile on both sides of the
LOS. These measures will be correlated with the observed quality of the interactions. For
an overview of the used CRQA measures see Table 1.
Results
In this section we will answer the three research questions by using the CRQA measures
described above. Prior to that the central-tendency measures and the observer ratings and the
associations between the observer ratings and the central tendency measures will be presented.
These data will be presented first in order to compare or associate them with CRQA measures.
Central-Tendency Measures, Observer ratings, and Their Associations
Table 2 shows the descriptive statistics of the time series gaze direction and speech rhythm
for staff and clients.
Fig. 3 Example of the results of a LOS-profile analysis for speech synchrony. The curve above (diamonds)shows the real-life conversation, whereas the curve below (squares) is the result of the LOS-profile analysiswith shuffled time series. That is, with the temporal structure of the time series destroyed by the random re-distribution of the data points. The error bars reflect the standard errors of the mean for all conversationswithin each diagonal line
J Nonverbal Behav
123
Author's personal copy
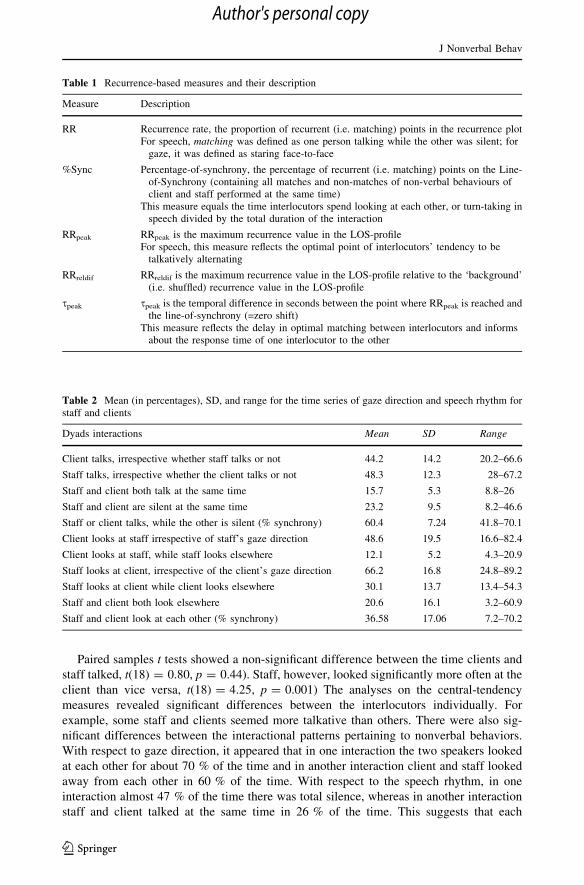
Paired samples t tests showed a non-significant difference between the time clients and
staff talked, t(18) = 0.80, p = 0.44). Staff, however, looked significantly more often at the
client than vice versa, t(18) = 4.25, p = 0.001) The analyses on the central-tendency
measures revealed significant differences between the interlocutors individually. For
example, some staff and clients seemed more talkative than others. There were also sig-
nificant differences between the interactional patterns pertaining to nonverbal behaviors.
With respect to gaze direction, it appeared that in one interaction the two speakers looked
at each other for about 70 % of the time and in another interaction client and staff looked
away from each other in 60 % of the time. With respect to the speech rhythm, in one
interaction almost 47 % of the time there was total silence, whereas in another interaction
staff and client talked at the same time in 26 % of the time. This suggests that each
Table 1 Recurrence-based measures and their description
Measure Description
RR Recurrence rate, the proportion of recurrent (i.e. matching) points in the recurrence plotFor speech, matching was defined as one person talking while the other was silent; for
gaze, it was defined as staring face-to-face
%Sync Percentage-of-synchrony, the percentage of recurrent (i.e. matching) points on the Line-of-Synchrony (containing all matches and non-matches of non-verbal behaviours ofclient and staff performed at the same time)
This measure equals the time interlocutors spend looking at each other, or turn-taking inspeech divided by the total duration of the interaction
RRpeak RRpeak is the maximum recurrence value in the LOS-profileFor speech, this measure reflects the optimal point of interlocutors’ tendency to be
talkatively alternating
RRreldif RRreldif is the maximum recurrence value in the LOS-profile relative to the ‘background’(i.e. shuffled) recurrence value in the LOS-profile
speak speak is the temporal difference in seconds between the point where RRpeak is reached andthe line-of-synchrony (=zero shift)
This measure reflects the delay in optimal matching between interlocutors and informsabout the response time of one interlocutor to the other
Table 2 Mean (in percentages), SD, and range for the time series of gaze direction and speech rhythm forstaff and clients
Dyads interactions Mean SD Range
Client talks, irrespective whether staff talks or not 44.2 14.2 20.2–66.6
Staff talks, irrespective whether the client talks or not 48.3 12.3 28–67.2
Staff and client both talk at the same time 15.7 5.3 8.8–26
Staff and client are silent at the same time 23.2 9.5 8.2–46.6
Staff or client talks, while the other is silent (% synchrony) 60.4 7.24 41.8–70.1
Client looks at staff irrespective of staff’s gaze direction 48.6 19.5 16.6–82.4
Client looks at staff, while staff looks elsewhere 12.1 5.2 4.3–20.9
Staff looks at client, irrespective of the client’s gaze direction 66.2 16.8 24.8–89.2
Staff looks at client while client looks elsewhere 30.1 13.7 13.4–54.3
Staff and client both look elsewhere 20.6 16.1 3.2–60.9
Staff and client look at each other (% synchrony) 36.58 17.06 7.2–70.2
J Nonverbal Behav
123
Author's personal copy
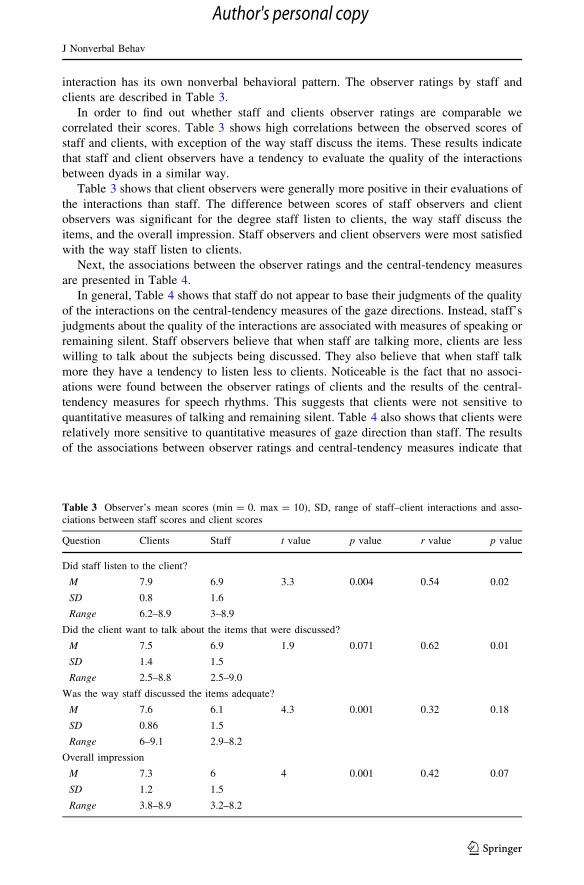
interaction has its own nonverbal behavioral pattern. The observer ratings by staff and
clients are described in Table 3.
In order to find out whether staff and clients observer ratings are comparable we
correlated their scores. Table 3 shows high correlations between the observed scores of
staff and clients, with exception of the way staff discuss the items. These results indicate
that staff and client observers have a tendency to evaluate the quality of the interactions
between dyads in a similar way.
Table 3 shows that client observers were generally more positive in their evaluations of
the interactions than staff. The difference between scores of staff observers and client
observers was significant for the degree staff listen to clients, the way staff discuss the
items, and the overall impression. Staff observers and client observers were most satisfied
with the way staff listen to clients.
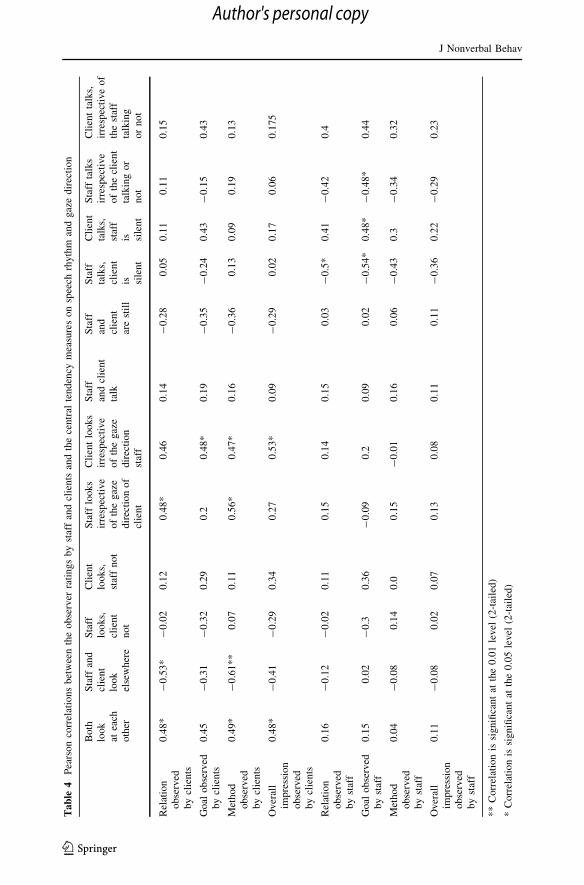
Next, the associations between the observer ratings and the central-tendency measures
are presented in Table 4.
In general, Table 4 shows that staff do not appear to base their judgments of the quality
of the interactions on the central-tendency measures of the gaze directions. Instead, staff’s
judgments about the quality of the interactions are associated with measures of speaking or
remaining silent. Staff observers believe that when staff are talking more, clients are less
willing to talk about the subjects being discussed. They also believe that when staff talk
more they have a tendency to listen less to clients. Noticeable is the fact that no associ-
ations were found between the observer ratings of clients and the results of the central-
tendency measures for speech rhythms. This suggests that clients were not sensitive to
quantitative measures of talking and remaining silent. Table 4 also shows that clients were
relatively more sensitive to quantitative measures of gaze direction than staff. The results
of the associations between observer ratings and central-tendency measures indicate that
Table 3 Observer’s mean scores (min = 0. max = 10), SD, range of staff–client interactions and asso-ciations between staff scores and client scores
Question Clients Staff t value p value r value p value
Did staff listen to the client?
M 7.9 6.9 3.3 0.004 0.54 0.02
SD 0.8 1.6
Range 6.2–8.9 3–8.9
Did the client want to talk about the items that were discussed?
M 7.5 6.9 1.9 0.071 0.62 0.01
SD 1.4 1.5
Range 2.5–8.8 2.5–9.0
Was the way staff discussed the items adequate?
M 7.6 6.1 4.3 0.001 0.32 0.18
SD 0.86 1.5
Range 6–9.1 2.9–8.2
Overall impression
M 7.3 6 4 0.001 0.42 0.07
SD 1.2 1.5
Range 3.8–8.9 3.2–8.2
J Nonverbal Behav
123
Author's personal copy
Ta
ble
4P
ears
on
corr
elat
ion
sb
etw
een
the
ob
serv
erra
ting
sb
yst
aff
and
clie
nts
and
the
cen
tral
ten
den
cym
easu
res
on
spee
chrh
yth
man
dg
aze
dir
ecti
on
Both
look
atea
cho
ther
Sta
ffan
dcl
ien
tlo
ok
else
wher
e
Sta
fflo
ok
s,cl
ient
no
t
Cli
ent
look
s,st
aff
no
t
Sta
fflo
ok
sir
resp
ecti
ve
of
the
gaz
ed
irec
tio
no
fcl
ien
t
Cli
ent
loo
ks
irre
spec
tiv
eo
fth
eg
aze
dir
ecti
on
staf
f
Sta
ffan
dcl
ien
tta
lk
Sta
ffan
dcl
ient
are
stil
l
Sta
ffta
lks,
clie
nt
is sile
nt
Cli
ent
talk
s,st
aff
is sile
nt
Sta
ffta
lks
irre
spec
tiv
eof
the
clie
nt
talk
ing
or
no
t
Cli
ent
talk
s,ir
resp
ecti
ve
of
the
staf
fta
lkin
go
rn
ot
Rel
atio
no
bse
rved
by
clie
nts
0.4
8*
-0
.53
*-
0.0
20
.12
0.4
8*
0.4
60
.14
-0
.28
0.0
50
.11
0.1
10
.15
Go
alo
bse
rved
by
clie
nts
0.4
5-
0.3
1-
0.3
20
.29
0.2
0.4
8*
0.1
9-
0.3
5-
0.2
40
.43
-0
.15
0.4
3
Met
ho
do
bse
rved
by
clie
nts
0.4
9*
-0
.61
**
0.0
70
.11
0.5
6*
0.4
7*
0.1
6-
0.3
60
.13
0.0
90
.19
0.1
3
Ov
eral
lim
pre
ssio
no
bse
rved
by
clie
nts
0.4
8*
-0
.41
-0
.29
0.3
40
.27
0.5
3*
0.0
9-
0.2
90
.02
0.1
70
.06
0.1
75
Rel
atio
no
bse
rved
by
staf
f
0.1
6-
0.1
2-
0.0
20
.11
0.1
50
.14
0.1
50
.03
-0
.5*
0.4
1-
0.4
20
.4
Go
alo
bse
rved
by
staf
f0
.15
0.0
2-
0.3
0.3
6-
0.0
90
.20
.09
0.0
2-
0.5
4*
0.4
8*
-0
.48*
0.4
4
Met
ho
do
bse
rved
by
staf
f
0.0
4-
0.0
80
.14
0.0
0.1
5-
0.0
10
.16
0.0
6-
0.4
30
.3-
0.3
40
.32
Ov
eral
lim
pre
ssio
no
bse
rved
by
staf
f
0.1
1-
0.0
80
.02
0.0
70
.13
0.0
80
.11
0.1
1-
0.3
60
.22
-0
.29
0.2
3
**
Corr
elat
ion
issi
gn
ifica
nt
atth
e0
.01
lev
el(2
-tai
led
)
*C
orr
elat
ion
issi
gn
ifica
nt
atth
e0
.05
lev
el(2
-tai
led
)
J Nonverbal Behav
123
Author's personal copy
clients and staff were sensitive to different aspects of nonverbal behavior. Clients were
more sensitive to making eye contact, whereas staff were slightly more sensitive to the
amount staff and clients talk. These findings will be compared to the results based on the
CRQA, described next.
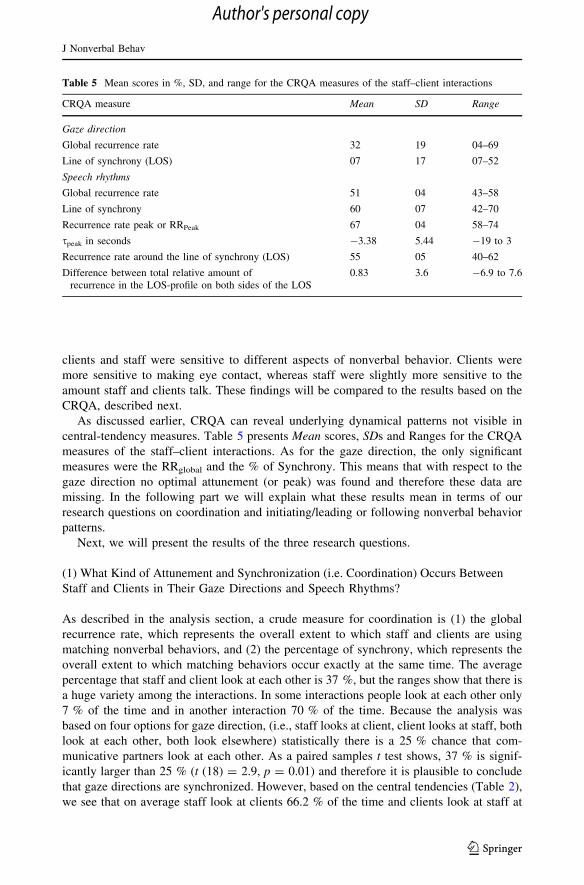
As discussed earlier, CRQA can reveal underlying dynamical patterns not visible in
central-tendency measures. Table 5 presents Mean scores, SDs and Ranges for the CRQA
measures of the staff–client interactions. As for the gaze direction, the only significant
measures were the RRglobal and the % of Synchrony. This means that with respect to the
gaze direction no optimal attunement (or peak) was found and therefore these data are
missing. In the following part we will explain what these results mean in terms of our
research questions on coordination and initiating/leading or following nonverbal behavior
patterns.
Next, we will present the results of the three research questions.
(1) What Kind of Attunement and Synchronization (i.e. Coordination) Occurs Between
Staff and Clients in Their Gaze Directions and Speech Rhythms?
As described in the analysis section, a crude measure for coordination is (1) the global
recurrence rate, which represents the overall extent to which staff and clients are using
matching nonverbal behaviors, and (2) the percentage of synchrony, which represents the
overall extent to which matching behaviors occur exactly at the same time. The average
percentage that staff and client look at each other is 37 %, but the ranges show that there is
a huge variety among the interactions. In some interactions people look at each other only
7 % of the time and in another interaction 70 % of the time. Because the analysis was
based on four options for gaze direction, (i.e., staff looks at client, client looks at staff, both
look at each other, both look elsewhere) statistically there is a 25 % chance that com-
municative partners look at each other. As a paired samples t test shows, 37 % is signif-
icantly larger than 25 % (t (18) = 2.9, p = 0.01) and therefore it is plausible to conclude
that gaze directions are synchronized. However, based on the central tendencies (Table 2),
we see that on average staff look at clients 66.2 % of the time and clients look at staff at
Table 5 Mean scores in %, SD, and range for the CRQA measures of the staff–client interactions
CRQA measure Mean SD Range
Gaze direction
Global recurrence rate 32 19 04–69
Line of synchrony (LOS) 07 17 07–52
Speech rhythms
Global recurrence rate 51 04 43–58
Line of synchrony 60 07 42–70
Recurrence rate peak or RRPeak 67 04 58–74
speak in seconds -3.38 5.44 -19 to 3
Recurrence rate around the line of synchrony (LOS) 55 05 40–62
Difference between total relative amount ofrecurrence in the LOS-profile on both sides of the LOS
0.83 3.6 -6.9 to 7.6
J Nonverbal Behav
123
Author's personal copy
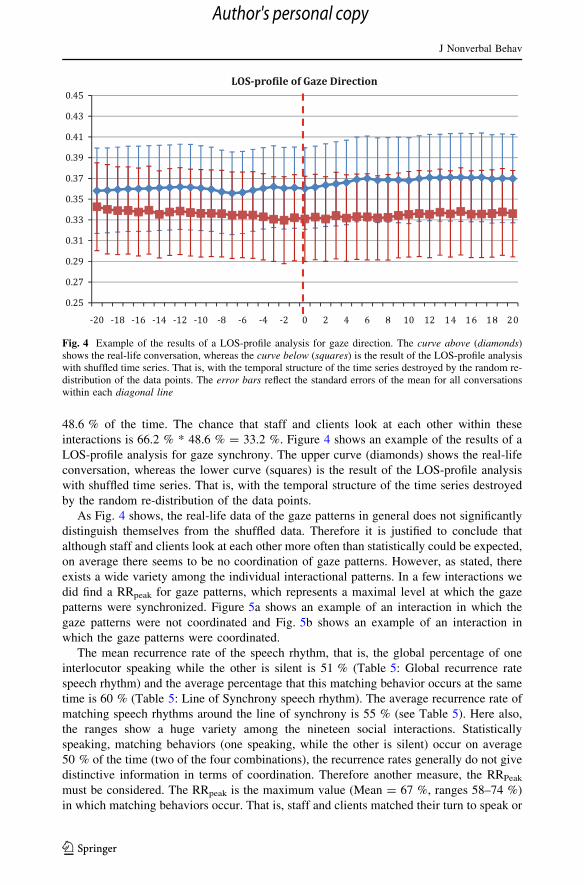
48.6 % of the time. The chance that staff and clients look at each other within these
interactions is 66.2 % * 48.6 % = 33.2 %. Figure 4 shows an example of the results of a
LOS-profile analysis for gaze synchrony. The upper curve (diamonds) shows the real-life
conversation, whereas the lower curve (squares) is the result of the LOS-profile analysis
with shuffled time series. That is, with the temporal structure of the time series destroyed
by the random re-distribution of the data points.
As Fig. 4 shows, the real-life data of the gaze patterns in general does not significantly
distinguish themselves from the shuffled data. Therefore it is justified to conclude that
although staff and clients look at each other more often than statistically could be expected,
on average there seems to be no coordination of gaze patterns. However, as stated, there
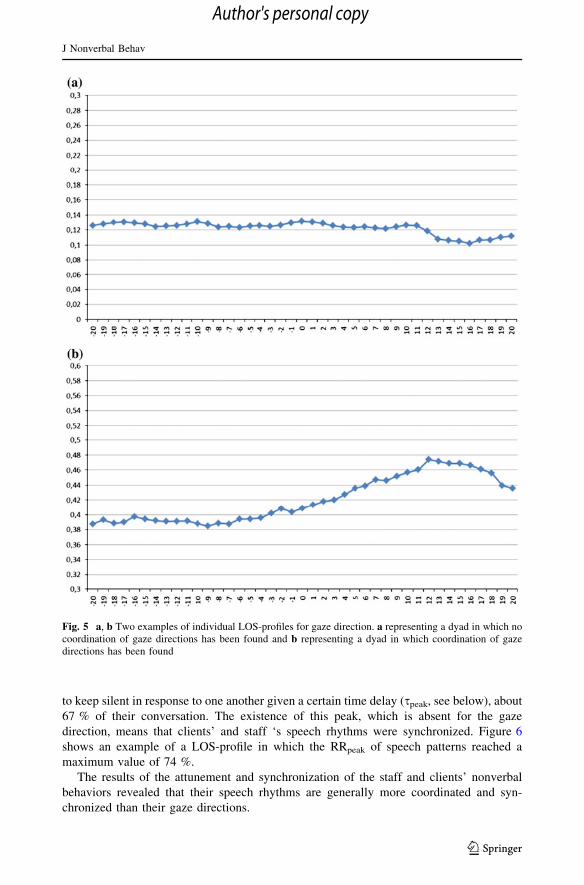
exists a wide variety among the individual interactional patterns. In a few interactions we
did find a RRpeak for gaze patterns, which represents a maximal level at which the gaze
patterns were synchronized. Figure 5a shows an example of an interaction in which the
gaze patterns were not coordinated and Fig. 5b shows an example of an interaction in
which the gaze patterns were coordinated.
The mean recurrence rate of the speech rhythm, that is, the global percentage of one
interlocutor speaking while the other is silent is 51 % (Table 5: Global recurrence rate
speech rhythm) and the average percentage that this matching behavior occurs at the same
time is 60 % (Table 5: Line of Synchrony speech rhythm). The average recurrence rate of
matching speech rhythms around the line of synchrony is 55 % (see Table 5). Here also,
the ranges show a huge variety among the nineteen social interactions. Statistically
speaking, matching behaviors (one speaking, while the other is silent) occur on average
50 % of the time (two of the four combinations), the recurrence rates generally do not give
distinctive information in terms of coordination. Therefore another measure, the RRPeak
must be considered. The RRpeak is the maximum value (Mean = 67 %, ranges 58–74 %)
in which matching behaviors occur. That is, staff and clients matched their turn to speak or
Fig. 4 Example of the results of a LOS-profile analysis for gaze direction. The curve above (diamonds)shows the real-life conversation, whereas the curve below (squares) is the result of the LOS-profile analysiswith shuffled time series. That is, with the temporal structure of the time series destroyed by the random re-distribution of the data points. The error bars reflect the standard errors of the mean for all conversationswithin each diagonal line
J Nonverbal Behav
123
Author's personal copy
to keep silent in response to one another given a certain time delay (speak, see below), about
67 % of their conversation. The existence of this peak, which is absent for the gaze
direction, means that clients’ and staff ‘s speech rhythms were synchronized. Figure 6
shows an example of a LOS-profile in which the RRpeak of speech patterns reached a
maximum value of 74 %.
The results of the attunement and synchronization of the staff and clients’ nonverbal
behaviors revealed that their speech rhythms are generally more coordinated and syn-
chronized than their gaze directions.
Fig. 5 a, b Two examples of individual LOS-profiles for gaze direction. a representing a dyad in which nocoordination of gaze directions has been found and b representing a dyad in which coordination of gazedirections has been found
J Nonverbal Behav
123
Author's personal copy

(2) What Is the Pattern of Dominance in the Dialogue, in Relation to Interlocutors
Initiating Nonverbal Behaviors Such As Gaze Direction or Following the Other’s
Lead?
In this section we will describe two variables that quantify the balance of the interaction in
terms of initiating/leading or following nonverbal behavior of the other. As said, no sig-
nificant results were found for gaze direction. We can, therefore, only present the results
for the speech rhythms. The first variable is the speak, which is the shift where the RRpeak
is obtained, and it tells us about the delay in optimal matching between the interlocutors. In
other words, this variable gives us information on the response time of one interlocutor to
the other. The mean speak is -3.38, which means that staff generally react about 3.5 s later
to the nonverbal behavior of the client than the client does. For example, it might take staff
3.5 s longer to become silent when a client starts talking than a client needs to become
silent when staff starts talking. It appears that in 12 of the 16 interactions (the first three
interactions did not have a peak), staff have a longer response time than clients (speak \ 0),
indicating that in these interactions staff are more dominant and leading the conversation
nonverbally. There is a wide variety in the interactions for speak and one interaction shows
that staff responded to the client with a delay of 19 s.
The second variable is the difference between the total relative amount of recurrence in the
LOS-profile on both sides of the LOS (i.e., the sum of RRdiag, which equals the area under the
curve, left and right from 0 in Fig. 3) and is a sign of how strongly one of the interlocutors is
dominating the conversation. The mean value of the difference between staff and clients
initiating speech rhythm is 0.83 %, which means that interactions are rather balanced in terms
of initiating or following one another’s speech rhythms. The ranges show a wide variety from
-6.9 to 7.6 %, which means that in the most unbalanced interaction in terms of initiating or
following the speech rhythm, staff initiated the speech rhythms 7.6 % more often than the
client. In another interaction the client initiated the speech rhythms 6.9 % more often than
staff. Analysis revealed that in 13 of the 19 interactions staff are dominant, indicating that
staff initiate the speech rhythms more often than clients.
Fig. 6 An example of an individual LOS-profile for speech synchrony
J Nonverbal Behav
123
Author's personal copy
(3) Are Key Elements of Staff and Clients’ Coded Nonverbal Behavior (Levels
of Attunement and Dominance) Associated with Observer Ratings of the Quality
of the Interactions?
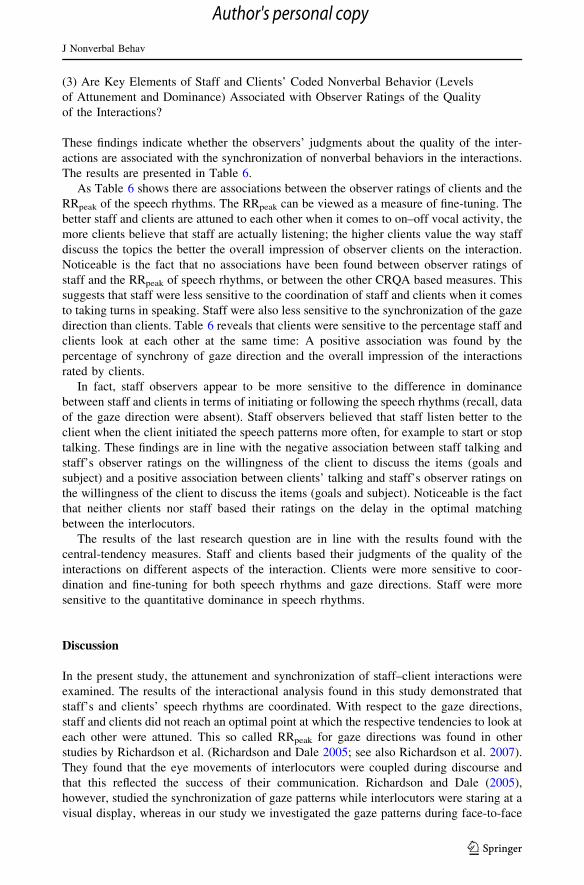
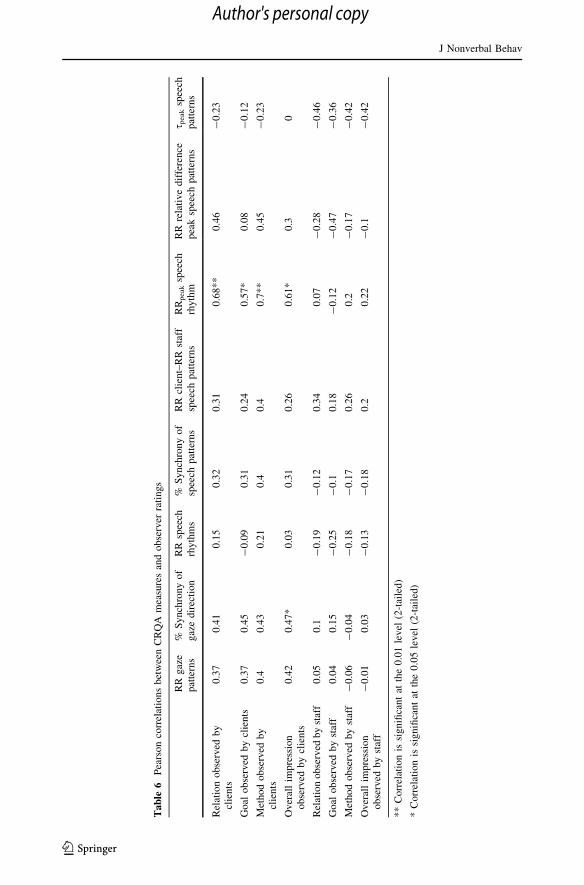
These findings indicate whether the observers’ judgments about the quality of the inter-
actions are associated with the synchronization of nonverbal behaviors in the interactions.
The results are presented in Table 6.
As Table 6 shows there are associations between the observer ratings of clients and the
RRpeak of the speech rhythms. The RRpeak can be viewed as a measure of fine-tuning. The
better staff and clients are attuned to each other when it comes to on–off vocal activity, the
more clients believe that staff are actually listening; the higher clients value the way staff
discuss the topics the better the overall impression of observer clients on the interaction.
Noticeable is the fact that no associations have been found between observer ratings of
staff and the RRpeak of speech rhythms, or between the other CRQA based measures. This
suggests that staff were less sensitive to the coordination of staff and clients when it comes
to taking turns in speaking. Staff were also less sensitive to the synchronization of the gaze
direction than clients. Table 6 reveals that clients were sensitive to the percentage staff and
clients look at each other at the same time: A positive association was found by the
percentage of synchrony of gaze direction and the overall impression of the interactions
rated by clients.
In fact, staff observers appear to be more sensitive to the difference in dominance
between staff and clients in terms of initiating or following the speech rhythms (recall, data
of the gaze direction were absent). Staff observers believed that staff listen better to the
client when the client initiated the speech patterns more often, for example to start or stop
talking. These findings are in line with the negative association between staff talking and
staff’s observer ratings on the willingness of the client to discuss the items (goals and
subject) and a positive association between clients’ talking and staff’s observer ratings on
the willingness of the client to discuss the items (goals and subject). Noticeable is the fact
that neither clients nor staff based their ratings on the delay in the optimal matching
between the interlocutors.
The results of the last research question are in line with the results found with the
central-tendency measures. Staff and clients based their judgments of the quality of the
interactions on different aspects of the interaction. Clients were more sensitive to coor-
dination and fine-tuning for both speech rhythms and gaze directions. Staff were more
sensitive to the quantitative dominance in speech rhythms.
Discussion
In the present study, the attunement and synchronization of staff–client interactions were
examined. The results of the interactional analysis found in this study demonstrated that
staff’s and clients’ speech rhythms are coordinated. With respect to the gaze directions,
staff and clients did not reach an optimal point at which the respective tendencies to look at
each other were attuned. This so called RRpeak for gaze directions was found in other
studies by Richardson et al. (Richardson and Dale 2005; see also Richardson et al. 2007).
They found that the eye movements of interlocutors were coupled during discourse and
that this reflected the success of their communication. Richardson and Dale (2005),
however, studied the synchronization of gaze patterns while interlocutors were staring at a
visual display, whereas in our study we investigated the gaze patterns during face-to-face
J Nonverbal Behav
123
Author's personal copy
Ta
ble
6P
ears
on
corr
elat
ions
bet
wee
nC
RQ
Am
easu
res
and
obse
rver
rati
ngs
RR
gaz
ep
atte
rns
%S
ynch
ron
yo
fgaz
edir
ecti
on
RR
spee
chrh
yth
ms
%S
yn
chro
ny
of
spee
chp
atte
rns
RR
clie
nt–
RR
staf
fsp
eech
pat
tern
sR
Rpeak
spee
chrh
yth
mR
Rre
lati
ve
dif
fere
nce
pea
ksp
eech
pat
tern
ss p
eak
spee
chp
atte
rns
Rel
atio
no
bse
rved
by
clie
nts
0.3
70
.41
0.1
50
.32
0.3
10
.68*
*0
.46
-0
.23
Go
alo
bse
rved
by
clie
nts
0.3
70
.45
-0
.09
0.3
10
.24
0.5
7*
0.0
8-
0.1
2
Met
ho
do
bse
rved
by
clie
nts
0.4
0.4
30
.21
0.4
0.4
0.7
**
0.4
5-
0.2
3
Ov
eral
lim
pre
ssio
no
bse
rved
by
clie
nts
0.4
20
.47*
0.0
30
.31
0.2
60
.61*
0.3
0
Rel
atio
no
bse
rved
by
staf
f0
.05
0.1
-0
.19
-0
.12
0.3
40
.07
-0
.28
-0
.46
Go
alo
bse
rved
by
staf
f0
.04
0.1
5-
0.2
5-
0.1
0.1
8-
0.1
2-
0.4
7-
0.3
6
Met
ho
do
bse
rved
by
staf
f-
0.0
6-
0.0
4-
0.1
8-
0.1
70
.26
0.2
-0
.17
-0
.42
Ov
eral
lim
pre
ssio
no
bse
rved
by
staf
f-
0.0
10
.03
-0
.13
-0
.18
0.2
0.2
2-
0.1
-0
.42
**
Co
rrel
atio
nis
sig
nifi
can
tat
the
0.0
1le
vel
(2-t
aile
d)
*C
orr
elat
ion
issi
gn
ifica
nt
atth
e0
.05
lev
el(2
-tai
led
)
J Nonverbal Behav
123
Author's personal copy
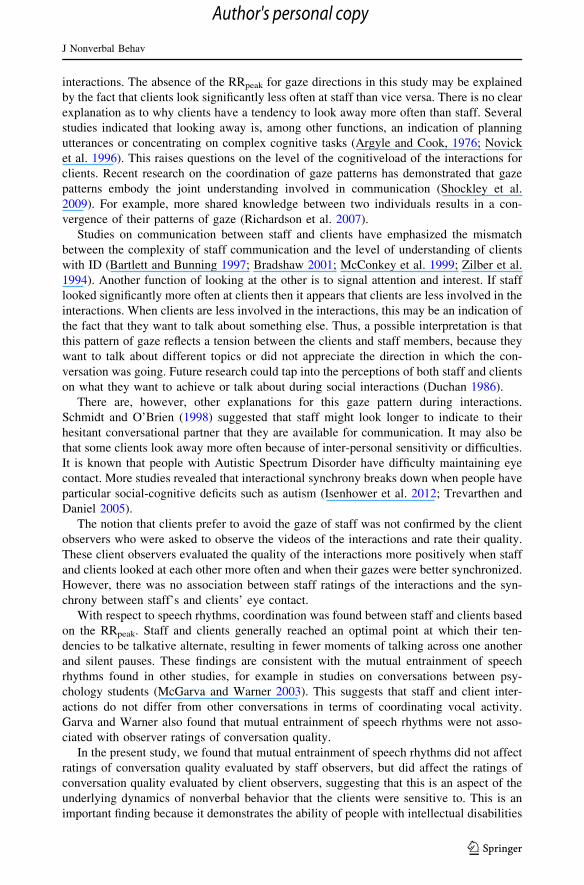
interactions. The absence of the RRpeak for gaze directions in this study may be explained
by the fact that clients look significantly less often at staff than vice versa. There is no clear
explanation as to why clients have a tendency to look away more often than staff. Several
studies indicated that looking away is, among other functions, an indication of planning
utterances or concentrating on complex cognitive tasks (Argyle and Cook, 1976; Novick
et al. 1996). This raises questions on the level of the cognitiveload of the interactions for
clients. Recent research on the coordination of gaze patterns has demonstrated that gaze
patterns embody the joint understanding involved in communication (Shockley et al.
2009). For example, more shared knowledge between two individuals results in a con-
vergence of their patterns of gaze (Richardson et al. 2007).
Studies on communication between staff and clients have emphasized the mismatch
between the complexity of staff communication and the level of understanding of clients
with ID (Bartlett and Bunning 1997; Bradshaw 2001; McConkey et al. 1999; Zilber et al.
1994). Another function of looking at the other is to signal attention and interest. If staff
looked significantly more often at clients then it appears that clients are less involved in the
interactions. When clients are less involved in the interactions, this may be an indication of
the fact that they want to talk about something else. Thus, a possible interpretation is that
this pattern of gaze reflects a tension between the clients and staff members, because they
want to talk about different topics or did not appreciate the direction in which the con-
versation was going. Future research could tap into the perceptions of both staff and clients
on what they want to achieve or talk about during social interactions (Duchan 1986).
There are, however, other explanations for this gaze pattern during interactions.
Schmidt and O’Brien (1998) suggested that staff might look longer to indicate to their
hesitant conversational partner that they are available for communication. It may also be
that some clients look away more often because of inter-personal sensitivity or difficulties.
It is known that people with Autistic Spectrum Disorder have difficulty maintaining eye
contact. More studies revealed that interactional synchrony breaks down when people have
particular social-cognitive deficits such as autism (Isenhower et al. 2012; Trevarthen and
Daniel 2005).
The notion that clients prefer to avoid the gaze of staff was not confirmed by the client
observers who were asked to observe the videos of the interactions and rate their quality.
These client observers evaluated the quality of the interactions more positively when staff
and clients looked at each other more often and when their gazes were better synchronized.
However, there was no association between staff ratings of the interactions and the syn-
chrony between staff’s and clients’ eye contact.
With respect to speech rhythms, coordination was found between staff and clients based
on the RRpeak. Staff and clients generally reached an optimal point at which their ten-
dencies to be talkative alternate, resulting in fewer moments of talking across one another
and silent pauses. These findings are consistent with the mutual entrainment of speech
rhythms found in other studies, for example in studies on conversations between psy-
chology students (McGarva and Warner 2003). This suggests that staff and client inter-
actions do not differ from other conversations in terms of coordinating vocal activity.
Garva and Warner also found that mutual entrainment of speech rhythms were not asso-
ciated with observer ratings of conversation quality.
In the present study, we found that mutual entrainment of speech rhythms did not affect
ratings of conversation quality evaluated by staff observers, but did affect the ratings of
conversation quality evaluated by client observers, suggesting that this is an aspect of the
underlying dynamics of nonverbal behavior that the clients were sensitive to. This is an
important finding because it demonstrates the ability of people with intellectual disabilities
J Nonverbal Behav
123
Author's personal copy
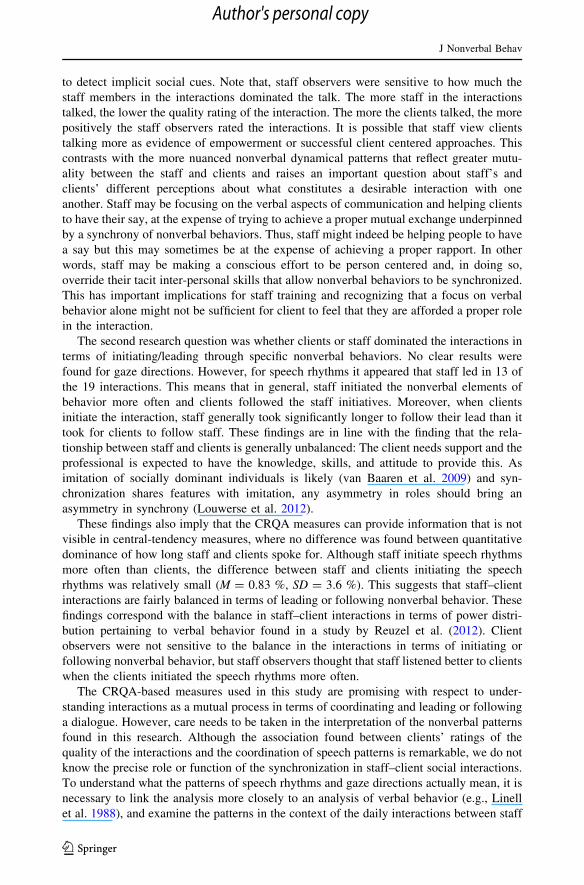
to detect implicit social cues. Note that, staff observers were sensitive to how much the
staff members in the interactions dominated the talk. The more staff in the interactions
talked, the lower the quality rating of the interaction. The more the clients talked, the more
positively the staff observers rated the interactions. It is possible that staff view clients
talking more as evidence of empowerment or successful client centered approaches. This
contrasts with the more nuanced nonverbal dynamical patterns that reflect greater mutu-
ality between the staff and clients and raises an important question about staff’s and
clients’ different perceptions about what constitutes a desirable interaction with one
another. Staff may be focusing on the verbal aspects of communication and helping clients
to have their say, at the expense of trying to achieve a proper mutual exchange underpinned
by a synchrony of nonverbal behaviors. Thus, staff might indeed be helping people to have
a say but this may sometimes be at the expense of achieving a proper rapport. In other
words, staff may be making a conscious effort to be person centered and, in doing so,
override their tacit inter-personal skills that allow nonverbal behaviors to be synchronized.
This has important implications for staff training and recognizing that a focus on verbal
behavior alone might not be sufficient for client to feel that they are afforded a proper role
in the interaction.
The second research question was whether clients or staff dominated the interactions in
terms of initiating/leading through specific nonverbal behaviors. No clear results were
found for gaze directions. However, for speech rhythms it appeared that staff led in 13 of
the 19 interactions. This means that in general, staff initiated the nonverbal elements of
behavior more often and clients followed the staff initiatives. Moreover, when clients
initiate the interaction, staff generally took significantly longer to follow their lead than it
took for clients to follow staff. These findings are in line with the finding that the rela-
tionship between staff and clients is generally unbalanced: The client needs support and the
professional is expected to have the knowledge, skills, and attitude to provide this. As
imitation of socially dominant individuals is likely (van Baaren et al. 2009) and syn-
chronization shares features with imitation, any asymmetry in roles should bring an
asymmetry in synchrony (Louwerse et al. 2012).
These findings also imply that the CRQA measures can provide information that is not
visible in central-tendency measures, where no difference was found between quantitative
dominance of how long staff and clients spoke for. Although staff initiate speech rhythms
more often than clients, the difference between staff and clients initiating the speech
rhythms was relatively small (M = 0.83 %, SD = 3.6 %). This suggests that staff–client
interactions are fairly balanced in terms of leading or following nonverbal behavior. These
findings correspond with the balance in staff–client interactions in terms of power distri-
bution pertaining to verbal behavior found in a study by Reuzel et al. (2012). Client
observers were not sensitive to the balance in the interactions in terms of initiating or
following nonverbal behavior, but staff observers thought that staff listened better to clients
when the clients initiated the speech rhythms more often.
The CRQA-based measures used in this study are promising with respect to under-
standing interactions as a mutual process in terms of coordinating and leading or following
a dialogue. However, care needs to be taken in the interpretation of the nonverbal patterns
found in this research. Although the association found between clients’ ratings of the
quality of the interactions and the coordination of speech patterns is remarkable, we do not
know the precise role or function of the synchronization in staff–client social interactions.
To understand what the patterns of speech rhythms and gaze directions actually mean, it is
necessary to link the analysis more closely to an analysis of verbal behavior (e.g., Linell
et al. 1988), and examine the patterns in the context of the daily interactions between staff
J Nonverbal Behav
123
Author's personal copy
and clients. Therefore, further investigation is needed about what clients and staff find
important about their collaborative relationship.
The results of this study show that staff and clients have a tendency to look at different
aspects of an interaction. In general, staff are sensitive to balance in an interaction in terms
of quantitative measures of talking and initiating or following the speech rhythms. Clients
are sensitive to a finer level of attunement: speech rhythms and the amount of eye contact.
The presence of these underlying dynamics in nonverbal patterns as revealed by CRQA
and the fact that clients are sensitive to it provides valuable information on the relevancy of
nonverbal aspects of an interaction according to clients. This is because better attunement
between staff and clients can ultimately help to achieve mutual understanding and
empower the client in the relationship.
Acknowledgments We thank clients and care staff of J.P. van den Bentstichting in the Netherlands fortheir participation.
References
Antaki, C., & Rapley, M. (1996). ‘Quality of life’ talk: The liberal paradox of psychological testing.Discourse and Society, 7, 293–316. doi:10.1177/0957926596007003002.
Antaki, C., Young, N., & Finlay, M. (2002). Shaping clients’ answers: Departures from neutrality in care-staff interviews with people with a learning disability. Disability and Society, 17, 435–455. doi:0.1080/09687590220140368.
Argyle, M., & Cook, M. (1976). Gaze and mutual gaze. Cambridge: Cambridge University Press.Bartlett, C., & Bunning, K. T. (1997). The importance of communication partnerships: A study to inves-
tigate the communicative exchanges between staff and adults with learning disabilities. British Journalof Learning Disabilities, 25, 148–153. doi:10.1111/j.1468-3156.1997.tb00030.x.
Bernieri, F. J., & Rosenthal, R. (1991). Interpersonal coordination: Behavior matching and interactionalsynchrony. In R. S. Feldman & B. Rime (Eds.), Fundamentals of nonverbal behavior (pp. 401–432).NY: Cambridge University Press.
Bradshaw, J. (2001). Complexity of staff communication and reported level of understanding skills in adultswith intellectual disability. Journal of Intellectual Disability Research, 45, 233–243. doi:10.1046/j.1365-2788.2001.00318.x.
Cacioppo, J. T., Visser, P. S., Pickett, C. L., et al. (2006). Social neuroscience: People thinking aboutthinking people. Cambridge, MA: MIT Press.
Cappella, J. N., & Planalp, S. (1981). Talk and silence sequences in informal conversations iii: Interspeakerinfluence. Human Communication Research, 7(2), 117–132.
Chapple, E. D. (1970). Culture and biological man: Explorations in behavioral anthropology. NY: Holt,Rinehart & Winston.
Chartrand, T. L., & Bargh, J. A. (1999). The chameleon effect: The perception-behavior link and social inter-action. Journal of Personality and Social Psychology, 76, 893–910. doi:10.1037/0022-3514.76.6.893.
Church, K. W. (1993). Char align: A program for aligning parallel texts at the character level. In Pro-ceedings of the 31st annual meeting of the association for computational linguistics (Vol. 31, pp. 1–8).
Dale, R., & Spivey, M. J. (2005). Categorical recurrence analysis of child language. In Proceedings of the27th annual meeting of the cognitive science society (pp. 530–535). Mahwah, NJ: Lawrence Erlbaum.
Dale, R., & Spivey, M. J. (2006). Unraveling the dyad: Using recurrence analysis to explore patterns ofsyntactic coordination between children and caregivers in conversation. Language Learning, 56,391–430. doi:10.1111/j.1467-9922.2006.00372.x.
de Graag, J. A., Cox, R. F. A., Hasselman, F., Jansen, J., & de Weerth, C. (2012). Functioning within arelationship: Mother-infant synchrony and infant sleep. Infant Behavior and Development, 35,252–263. doi:10.1016/j.infbeh.2011.12.006.
Delaherche, E., Chetouani, M., Mahdaoui, A., Saint-Georges, C., Viaux, S., & Cohem, D. (2012). Inter-personal synchrony: A survey of evaluation methods across disciplines. IEEE Transactions onAffective Computing, 3, 349–365. doi:10.1109/T-AFFC.2012.12.
Duchan, J. F. (1986). Language intervention through sense-making and fine tuning. In R. L. Schiefelbusch(Ed.), Language competence, assessment and intervention (pp. 75–84). NY: College Hill Press.
J Nonverbal Behav
123
Author's personal copy
Duncan, B., Miller, S., & Sparks, J. (2004). The heroic client: A revolutionary way to improve effectivenessthrough client directed, outcome informed therapy. San Francisco: Jossey Bass.
Eckmann, J. P., Kamphorst, S. O., & Ruelle, D. (1987). Recurrence plots of dynamical systems. EurophysicsLetters, 5, 973–977. doi:10.1209/0295-5075/4/9/004.
Finlay, W. M. L., Walton, C., & Antaki, C. (2008). Promoting choice and control in residential services forpeople with learning disabilities. Disability and Society, 23, 349–360. doi:10.1080/09687590802038860.
Fowler, C. A., Richardson, M. J., Marsh, K., & Shockley, K. D. (2008). Language use, coordination and theemergence of cooperative action. In A. Fuchs & V. Jirsa (Eds.), Coordination: Neural, behavioral andsocial dynamics (pp. 161–180). Berlin: Springer.
Giles, H., Coupland, J., & Coupland, N. (1991). Accommodation theory: Communication, context, andconsequences. In H. Giles, J. Coupland, & N. Coupland (Eds.), Contexts of accommodation: Devel-opments in applied sociolinguistics (pp. 1–68). Cambridge: Cambridge University Press.
Goodwin, C. (1981). Conversational organization: Interaction between speakers and hearers. NY: Aca-demic Press.
Hove, M. J., & Risen, J. L. (2009). It’s all in the timing: Interpersonal synchrony increases affiliation. SocialCognition, 27, 949–960. doi:10.1521/soco.2009.27.6.949.
Hutchins, E. (1995). Cognition in the wild. Cambridge, MA: MIT Press.Isenhower, R. W., Marsh, K. L., Richardson, M. J., Helt, M., Schmidt, R. C., & Fein, D. (2012). Rhythmic
bimanual coordination is impaired in children with autism spectrum disorder. Research in AutismSpectrum Disorders, 6, 25–31. doi:10.1016/j.rasd.2011.08.005.
Jahoda, A., Dagnan, D., Kroese, B. S., Pert, C., & Trower, P. (2009). Cognitive behavioural therapy: Fromface to face interaction to a broader contextual understanding of change. Journal of IntellectualDisability Research, 53, 759–771. doi:10.1111/j.1365-2788.2009.01189.x.
Jingree, T., Finlay, W. M. L., & Antaki, C. (2006). Empowering words, disempowering actions: An analysisof interactions between staff members and people with learning disabilities in residents’ meetings.Journal of Intellectual Disability Research, 50, 212–226. doi:10.1111/j.1365-2788.2005.00771.x.
Leudar, I. (1981). Strategic communication in mental retardation. In W. I. Fraser & R. Grieve (Eds.),Communication with normal and retarded children (pp. 113–129). Bristol, UK: John Wright and Sons.
Lichtwarck-Aschoff, A., Hasselman, F., Cox, R. F. A., Pepler, A., & Granic, I. (2012). A characteristicdestabilization profile in parent–child interactions associated with treatment efficacy for aggressivechildren. Nonlinear Dynamics, Psychology, and Life Sciences, 16, 353–379. Pubmed: 22695153.
Linell, P., Gustavsson, L., & Juvonen, P. (1988). Interactional dominance in dyadic communication: Apresentation of initiative-response analysis. Linguistics, 26, 415–442. doi:10.1515/ling.1988.26.3.415.
Louwerse, M. M., Dale, R., Bard, E. G., & Jeuniaux, P. (2012). Behavior matching in multimodal com-munication is synchronized. Cognitive Science, 1, 1–24. doi:10.1111/j.1551-6709.2012.01269.
Marwan, N., Romano, M. C., Thiel, M., & Kurths, J. (2007). Recurrence plots for the analysis of complexsystems. Physics Reports, 438(5–6), 237–329. doi:10.1016/j.physrep.2006.11.001.
McConkey, R., Morris, I., & Purcell, M. (1999). Communications between staff and adults with intellectualdisabilities in naturally occurring settings. Journal of Intellectual disabilities Research, 43, 194–205.doi:10.1046/j.1365-2788.1999.00191.x.
McGarva, A. R., & Warner, R. M. (2003). Attraction and social coordination: Mutual entrainment of vocalactivity rhythms. Journal of Psycholinguistic Research, 32, 335–354. doi:0090-6905/03/0500-0335/0.
McNeill, D. (1992). Hand and mind: What gestures reveal about thought. Chicago, IL: University ofChicago Press.
Miles, L. K., Nind, L. K., & Macrae, N. (2009). The rhythm of rapport: Interpersonal synchrony and socialperception. Journal of Experimental Social Psychology, 45, 585–589. doi:10.1016/j.jesp.2009.02.002.
Moore, D. G. (2001). Reassessing emotion recognition performance in people with mental retardation: Areview. American Journal on Mental Retardation, 106, 481–502. doi:10.1352/0895-8017(2001)106\0481:RERPIP[2.0.CO;2.
Noldus. (2009). The observer XT. Wageningen, The Netherlands: Noldus Information Technology.Novick, D., Hansen, B., & Ward, K. (1996). Coordinating turn-taking with gaze, Proceedings of the
International Conference on Spoken Language Processing (ICSLP-96), Philadelphia, PA, October,1996, 3, 1888-91.
Reuzel, E., Embregts, P. J. C. M., Bosman, A. M. T., van Nieuwenhuijzen, M., & Jahoda, A. (2012).Interactional patterns between staff and clients with borderline to mild intellectual disabilities. Thenature of staff client social interactions. Journal of Intellectual Disability Research. doi:10.1111/j.1365-2788.2011.01515.x.
Richardson, D. C., & Dale, R. (2005). Looking to understand: the coupling between speakers’ and listeners’eye movement and it’s relationship to discourse comprehension. Cognitive Science, 29, 1045–1060.doi:10.1207/s15516709cog0000_29.
J Nonverbal Behav
123
Author's personal copy
Richardson, D. C., Dale, R., & Kirkham, N. Z. (2007). The art of conversation is coordination. Psycho-logical Science, 18, 407–413. doi:10.1111/j.1467-9280.2007.01914.x.
Sacks, H. (1992). Lectures on conversation (Vol. II). Cambridge, MA: Blackwell.Schmidt, R. C., Morr, S., Fitzpatrick, P. A., & Richardson, M. J. (2012). Measuring the dynamics of inter-
actional synchrony. Journal of Nonverbal Behavior, 36, 263–279. doi:10.1007/s10919-012-0138-5.Schmidt, R. C., & O’Brien, B. (1998). Modeling interpersonal coordination dynamics: Implications for a
dynamical theory of developing systems. In P. C. Molenaar & K. Newell (Eds.), Dynamic systems anddevelopment: Beyond the metaphor (pp. 221–240). Mahwah, NJ: Erlbaum.
Sebanz, N., Bekkering, H., & Knoblich, G. (2006). Joint action: Bodies and minds moving together. Trendsin Cognitive Sciences, 10(2), 70–76. doi:10.1016/j.tics.2005.12.009.
Shockley, K., Butwill, M., Zbilut, J. P., & Webber, C. L. (2002). Cross recurrence quantification of coupledoscillators. Physics Letters, 305, 59–69. doi:10.1016/S0375-9601(02)01411-1.
Shockley, K., Richardson, D. C., & Dale, R. (2009). Conversation and coordinative structures. Topics inCognitive Science, 1, 305–319. doi:10.1111/j.1756-8765.2009.01021.x.
Social Exclusion Unit. (2005). Improving services, improving lives: Evidence and key themes. Interimreport. London: Office of the Deputy Prime Minister.
Street, R. L. (1984). Speech convergence and speech evaluation in fact finding interviews. Human Com-munication Research, 11, 139–169. doi:10.1111/j.1468-2958.1984.tb00043.x.
Tickle-Degnen, L., & Rosenthal, R. (1990). The nature of rapport and its nonverbal correlates. Psycho-logical Inquiry, 1, 285–293. doi:10.1207/s15327965pli0104_1.
Trevarthen, C., & Daniel, S. (2005). Disorganized rhythm and synchrony: Early signs of autism and Rettsyndrome. Brain and Development, 27, S25–S34. doi:10.1016/j.braindev.2005.03.016.
van Baaren, R., Janssen, L., Chartrand, T., & Dijksterhuis, A. (2009). Where is the love? Social aspects ofmimicry. Philosophical Transactions of the Royal Society B, Biological Sciences, 364, 2381–2389.doi:10.1098/rstb.2009.0057.
Von Heijne, G. (1987). Sequence analysis in molecular biology: Treasure trove or trivial pursuits?. SanDiego, LA: Academic Press.
Warner, R. M. (1992). Sequential analysis of social interaction: Assessing internal versus social determi-nants of behavior. Journal of Personality and Social Psychology, 63, 51–60. doi:10.1037/0022-3514.63.1.51.
Webber, C. L., Jr., & Zbilut, J. P., (2005). Recurrence quantification analysis of nonlinear dynamicalsystems. In M. A. Riley & G. C. Van Orden (Eds.), Tutorials in contemporary nonlinear methods forthe behavioral sciences (pp. 33–101). Retrieved March 1, 2005, from http://www.nsf.gov/sbe/bcs/pac/nmbs/nmbs.jsp.
Zaja, R., & Rojahn, J. (2008). Facial emotion recognition in intellectual disabilities. Current Opinion inPsychiatry, 21, 441–444. doi:10.1097/YCO.0b013e328305e5fd.
Zbilut, J. P., & Webber, C. L., Jr. (1992). Embeddings and delays as derived from quantification ofrecurrence plots. Physics Letters A, 171, 199–203. doi:10.1016/0375-9601(92)90426-M.
Zilber, D., Shaddock, A., Dowse, L., Rawlings, M., Guggenheimer, S., & Browne, F. (1994). Communi-cation patterns in services for people with severe intellectual disabilities: Function, form, andresponsiveness. Australian Journal of Human Communication Disorders, 22, 85–98.
J Nonverbal Behav
123
Author's personal copy
Copyright © 2022 FDOKUMEN