Controlled Polymorphism in Titanyl Phthalocyanine on Mica by Hyperthermal Beams: A Micro-Raman...
7
Controlled Polymorphism in Titanyl Phthalocyanine on Mica by Hyperthermal Beams: A Micro-Raman Analysis Nicola Coppede `,* ,† Marco Castriota, § Enzo Cazzanelli, § Stiven Forti, † Giuseppe Tarabella, † Tullio Toccoli, † Karsten Walzer, ‡ and Salvatore Iannotta | Institute of Photonics and Nanotechnology - CNR Trento DiVision, Via alla Cascata 56/C, PoVo 38123 (TN) Italy, Institut fuer Angewandte Photophysik, George-Ba ¨hr-Strasse 1, 01069 Dresden, Germany, LICRYL-INFM Laboratory-CEMIF.CAL, Department of Physics, UniVersity of Calabria, Via P. Bucci, Cubo 33B, 87036 ArcaVacata di Rende (CS) Italy, and IMEM-CNR, Istituto Materiali per Elettronica e Magnetismo Parco Area delle Scienze, 37/a 43100 Parma, Italy ReceiVed: NoVember 12, 2009; ReVised Manuscript ReceiVed: March 8, 2010 The polymorphism of titanyl phthalocyanine films, grown on atomically flat mica substrates, has been systematically studied by micro-Raman spectroscopy, correlating structure and optical properties. Different growth regimes, using hyperthermal seeded supersonic beams, have been explored as a function of the substrate temperature. Specific signatures in micro-Raman spectra, correlated to different phases, are identified and discussed. We demonstrate the unprecedented ability to grow crystalline films at low temperature, with improved structural order, and we show that different regimes lead to grain dimensions in a range from the nanometric to the micrometric scale. The local micro-Raman analysis, carried out on crystallites with regular shapes, allows discriminating different structural phases of the single crystalline grains. We provide evidence that different growth regimes are achieved and controlled, paving the way to phase selection, which is envisaged as a key feature to improve device performance. Introduction Phthalocyanines are stable oligomer macrocyclic compounds, with distinctive optical properties, including an intense absorp- tion in the visible region and a p type π-conjugated semicon- ductor behavior in the solid state. 1 These characteristics make them attractive for important applications in optoeletronics, 2 photovoltaics, 3 spintronics, 4 and for sensing 5 devices. On this basis, the scientific community is devoting widespread efforts to study their structure and morphology and to control their properties in the solid state. A better control on the growth of phthalocyanine thin films is crucial to improving their transport and optical properties, and many studies are devoted to this topic, approaching different growth techniques for different kinds of phthalocyanine molecules. Among all different metal phthalocyanines, titanyl phthalo- cyanine 6,7 (TiOPc) is of particular interest for optoeletronic and photovoltaic applications, especially because its absorption spectrum in the visible, with a band centered at 860 nm in its stable crystalline phase, extends toward the infrared. As is typical for metal phthalocyanines in general, TiOPc films are characterized by a strong polymorphism. 8 Their peculiar, nonplanar, and polar structure gives rise to several crystalline phases, different from those typical of the planar MPc. The main stable crystal structures of TiOPc have been characterized by means of X-ray diffraction (XRD) by W. Hiller et al. 8 in the early 80s and have been identified as phase I (sometimes also referred to as , monoclinic, with the P2 1 /c space group and number of molecules per unit cell Z ) 4) and phase II (also called R, triclinic, with the P1 space group and Z ) 2), grown as single crystals by CVD. 9 Another polymorph, called phase Y, is sometimes reported and described as a crystal structure similar to phase I, with a different tilting angle of the molecules in the a-b plane, 10 and up to date, only polycrystalline films of phase Y have been grown. The presence of different polymorphic structures makes the development of growth methods particularly important, enabling appropriate control of the crystalline phase, 11 so that device performances can be improved. 12-14 TiOPc films have been grown with different methods: Langmuir-Blodgett (LB) and spin-coating have been used in combination with post-deposition treatments to obtain a selective production of film in phases I, II, and Y. 15 The phase selection was achieved by exposing films to vapors of solvents, such as chlorobenzene or xylene, followed by annealing processes. However, the best results in terms of phase control are achieved by organic molecular beam deposi- tion (OMBD). 16,17 At about 50 °C (on several different substrates, including sapphire and PTFE), only amorphous films can be grown, 16 whereas above 100 °C, the simultaneous presence of amorphous and crystalline regions (phases I and II) is observed. At higher temperatures and on appropriate crystalline substrates (such as sapphire), films grow preferen- tially in phase II. We have previously shown, by morphological and structural studies of TiOPc thin films on disordered substrates, such as quartz, 18 that the kinetic energy, supplied to the molecules by the supersonic expansion, has a remarkable ordering effect. 19,20 In particular, we found that increasing the kinetic energy leads to larger uniform grains with respect to OMBD. A very interesting question that could not be studied on an amorphous substrate is the role played by molecule-surface interactions and the kinetic energy of the impinging molecule, which can * To whom correspondence should be addressed. E-mail: [email protected]. Tel: +39 0461 314848. Fax: +39 0461 314875. † Institute of Photonics and Nanotechnology - CNR Trento Division. ‡ Institut fuer Angewandte Photophysik. § University of Calabria. | IMEM-CNR, Istituto Materiali per Elettronica e Magnetismo Parco Area delle Scienze. J. Phys. Chem. C 2010, 114, 7038–7044 7038 10.1021/jp9107848 2010 American Chemical Society Published on Web 03/31/2010
Transcript of Controlled Polymorphism in Titanyl Phthalocyanine on Mica by Hyperthermal Beams: A Micro-Raman...
Controlled Polymorphism in Titanyl Phthalocyanine on Mica by Hyperthermal Beams: AMicro-Raman Analysis
Nicola Coppede,*,† Marco Castriota,§ Enzo Cazzanelli,§ Stiven Forti,† Giuseppe Tarabella,†
Tullio Toccoli,† Karsten Walzer,‡ and Salvatore Iannotta|
Institute of Photonics and Nanotechnology - CNR Trento DiVision, Via alla Cascata 56/C,PoVo 38123 (TN) Italy, Institut fuer Angewandte Photophysik, George-Bahr-Strasse 1,01069 Dresden, Germany, LICRYL-INFM Laboratory-CEMIF.CAL, Department of Physics, UniVersity ofCalabria, Via P. Bucci, Cubo 33B, 87036 ArcaVacata di Rende (CS) Italy, and IMEM-CNR, Istituto Materialiper Elettronica e Magnetismo Parco Area delle Scienze, 37/a 43100 Parma, Italy
ReceiVed: NoVember 12, 2009; ReVised Manuscript ReceiVed: March 8, 2010
The polymorphism of titanyl phthalocyanine films, grown on atomically flat mica substrates, has beensystematically studied by micro-Raman spectroscopy, correlating structure and optical properties. Differentgrowth regimes, using hyperthermal seeded supersonic beams, have been explored as a function of the substratetemperature. Specific signatures in micro-Raman spectra, correlated to different phases, are identified anddiscussed. We demonstrate the unprecedented ability to grow crystalline films at low temperature, with improvedstructural order, and we show that different regimes lead to grain dimensions in a range from the nanometricto the micrometric scale. The local micro-Raman analysis, carried out on crystallites with regular shapes,allows discriminating different structural phases of the single crystalline grains. We provide evidence thatdifferent growth regimes are achieved and controlled, paving the way to phase selection, which is envisagedas a key feature to improve device performance.
Introduction
Phthalocyanines are stable oligomer macrocyclic compounds,with distinctive optical properties, including an intense absorp-tion in the visible region and a p type π-conjugated semicon-ductor behavior in the solid state.1 These characteristics makethem attractive for important applications in optoeletronics,2
photovoltaics,3 spintronics,4 and for sensing5 devices. On thisbasis, the scientific community is devoting widespread effortsto study their structure and morphology and to control theirproperties in the solid state. A better control on the growth ofphthalocyanine thin films is crucial to improving their transportand optical properties, and many studies are devoted to thistopic, approaching different growth techniques for differentkinds of phthalocyanine molecules.
Among all different metal phthalocyanines, titanyl phthalo-cyanine6,7 (TiOPc) is of particular interest for optoeletronic andphotovoltaic applications, especially because its absorptionspectrum in the visible, with a band centered at 860 nm in itsstable crystalline phase, extends toward the infrared. As istypical for metal phthalocyanines in general, TiOPc films arecharacterized by a strong polymorphism.8 Their peculiar,nonplanar, and polar structure gives rise to several crystallinephases, different from those typical of the planar MPc. The mainstable crystal structures of TiOPc have been characterized bymeans of X-ray diffraction (XRD) by W. Hiller et al.8 in theearly 80s and have been identified as phase I (sometimes alsoreferred to as �, monoclinic, with the P21/c space group and
number of molecules per unit cell Z ) 4) and phase II (alsocalled R, triclinic, with the P1 space group and Z ) 2), grownas single crystals by CVD.9 Another polymorph, called phaseY, is sometimes reported and described as a crystal structuresimilar to phase I, with a different tilting angle of the moleculesin the a-b plane,10 and up to date, only polycrystalline filmsof phase Y have been grown.
The presence of different polymorphic structures makes thedevelopment of growth methods particularly important, enablingappropriate control of the crystalline phase,11 so that deviceperformances can be improved.12-14 TiOPc films have beengrown with different methods: Langmuir-Blodgett (LB) andspin-coating have been used in combination with post-depositiontreatments to obtain a selective production of film in phases I,II, and Y.15 The phase selection was achieved by exposing filmsto vapors of solvents, such as chlorobenzene or xylene, followedby annealing processes. However, the best results in terms ofphase control are achieved by organic molecular beam deposi-tion (OMBD).16,17 At about 50 °C (on several differentsubstrates, including sapphire and PTFE), only amorphous filmscan be grown,16 whereas above 100 °C, the simultaneouspresence of amorphous and crystalline regions (phases I andII) is observed. At higher temperatures and on appropriatecrystalline substrates (such as sapphire), films grow preferen-tially in phase II.
We have previously shown, by morphological and structuralstudies of TiOPc thin films on disordered substrates, such asquartz,18 that the kinetic energy, supplied to the molecules bythe supersonic expansion, has a remarkable ordering effect.19,20
In particular, we found that increasing the kinetic energy leadsto larger uniform grains with respect to OMBD. A veryinteresting question that could not be studied on an amorphoussubstrate is the role played by molecule-surface interactionsand the kinetic energy of the impinging molecule, which can
* To whom correspondence should be addressed. E-mail:[email protected]. Tel: +39 0461 314848. Fax: +39 0461 314875.
† Institute of Photonics and Nanotechnology - CNR Trento Division.‡ Institut fuer Angewandte Photophysik.§ University of Calabria.| IMEM-CNR, Istituto Materiali per Elettronica e Magnetismo Parco Area
delle Scienze.
J. Phys. Chem. C 2010, 114, 7038–70447038
10.1021/jp9107848 2010 American Chemical SocietyPublished on Web 03/31/2010
be better investigated on a crystalline surface. In the presentpaper, we explore the formation of TiOPc crystalline phaseson atomically flat mica. The aim is to clarify the role of thesubstrate surface order on the growth mechanism on a surfacewhere the energies of interaction are similar.
Besides the XRD, TiOPc crystalline phases have beencharacterized by UV-visible spectroscopy,21,22 showing featuresthat can be precisely and unambiguously associated with thedifferent crystalline phases. A few papers report Raman scat-tering studies,23,24 where evidence of the phase dependence ofpeak position and intensity are discussed. In our previouspaper,20 we correlated the UV-visible spectra to the micro-Raman analysis, identifying, for both the spectroscopic tech-niques, well-defined fingerprints of amorphous and crystallinephases. In the present work, dealing with an atomically flat micasubstrate, the presence of the substrate features makes theUV-visible spectroscopy useless, while the XRD becomes quitecumbersome to interpret. We take advantage of the correlations,defined in our previous work, between Raman spectra featuresand amorphous or crystalline phases, to investigate the structuralproperties of the films. Henceforth, as shown in the following,micro-Raman analysis, correlated also to the morphology of thefilms studied by AFM and optical microscopy, allows a preciseidentification of the phase in TiOPc film and grains.
Spanning a wide range of deposition conditions, we showhere that hyperthermal beams give an unprecedented controlon the growth, producing crystalline films with a definedstructure and phase, even at room temperature. This is aremarkable result, which further confirms the perspective of thesupersonic molecular beam deposition (SuMBD) approach asa promising method for the synthesis of controlled organicfunctional films.
Experimental Section
Thin Film Growth. Thin films have been grown by asupersonic beam deposition apparatus, already detailed else-where.25 In brief, it consists of a differentially pumped super-sonic beam, a TOF mass spectrometer, and a depositionchamber. The supersonic beam source is realized by a quartztube, closed at the front end, with a nozzle typically 50-130µm in diameter, placed in a high-vacuum chamber. An inertcarrier gas (helium in this experiment) is supplied in the sourceat a controlled pressure. The organic material is seeded by Jouleheating sublimation into the gas at very low concentrations. Theseeded gas flows through the nozzle into the vacuum chamber,generating a supersonic expansion. By changing the workingparameters (nature and pressure of the carrier gas, sublimationtemperature, nozzle diameter, and temperature) we are able tofinely control the kinetic energy, the momentum, and the degreeof cooling regarding the internal degrees of freedom of themolecules in the beam.26 The source typically operates with aHe carrier gas pressure at 1000-2000 mbar. By skimming thefree jet expansion, it is possible to select the central part ofthe beam via a sharp-edged conical collimator, which separatesthe source chamber from the deposition chamber (base pressure) 10-7 mbar). Finally, the molecular beam is intercepted bythe substrate for the deposition of the film. Alternatively, a thirdchamber, which is connected trough another skimmer along thebeam path, allows the film growth under ultra-high-vacuum(UHV) conditions. The temperature of the substrate may becontrolled from -115 up to 250 °C, with a stability of about (1 °C.
The TiOPc films have been grown in a temperature rangefrom 25 to 220 °C on atomically flat mica (previously
characterized by atomic force microscopy (AFM). A quartzmicrobalance measures the deposition rate, which is fixed forall the samples at 0.5 nm/min. The source operating conditionshave been tuned to keep the same high kinetic energy of 15 eVfor all the films deposited. The in-line time-of-flight massspectrometer (TOF-MS) with laser multiphoton ionization,achieved by the fourth harmonic of a Nd:YAG laser (266 nm),monitors the intensity, purity, and stability of the beam. Theduration of the deposition has been set to produce films of thesame nominal thickness (∼20 nm). We used a TiOPc materialcoming from the same batch (Syntec - Sensient GmbH, Wolfen,Germany) for all experiments. It was purified by repeatedvacuum gradient sublimation cycles, after which the TOF-MSmass spectra did not show any significant residual contamina-tion. Amorphous reference samples were also prepared by ahomemade evaporator operating under high-vacuum conditions(10-7 mbar). We used the same TiOPc powder in a tantalumboat and the same mica substrates, producing samples with athickness up to 1 µm.
Characterization Techniques. A Nanoscope IIIa (DigitalInstruments) AFM was used in tapping mode to study thetopography of the samples.
The Raman measurements were carried out by a microprobesetup (HORIBA-Jobin-Yvon, model Labram) equipped with aCCD detector and a He-Ne laser (632.8 nm emission). Thehighest resolution grating with 1800 grooves/mm was used forthe reported measurements. We could estimate the resultinguncertainty of the peak position to be about 1 cm-1 for thenarrow peaks and about 3 cm-1 for the broader bands, by takinginto account the resolving power of the grating, the pixel sizeof CCD, and the errors in the correction procedure of the driftin the monochromator frequency setting (performed by subtract-ing the apparent position of the laser line, monitored at regulartime intervals).
Two objectives have been used to collect the spectra: a 100×and a 50 × long working distance. The laser power out of the50× objective was about 5 mW, and the diameter of the focusedspot was about 3-4 µm. Therefore, the irradiance for theunfiltered laser beam was of the order of 50 kW/cm2. Whenneutral filters of variable optical density (OD) are used, the laserpower impinging the samples can be reduced to the followingamounts: 50% for the OD 0.3 filter, 25% for the OD 0.6, 10%for the OD 1, and 1% for the OD 2. Proper filters were chosento have a good signal-to-noise-ratio without excessive heating,to have Raman measurements at temperatures not far from RT:typically, the OD 0.6 filter was adopted with the 50× objectiveand the OD 1 filter with the 100× objective. A special X-Ystage for spectral mapping has been used to point out and mapthe interesting zones of the samples.
Results and Discussion
Morphology of TiOPc Thin Films. The films deposited onthe mica substrates present quite different morphologies, as afunction of the substrate temperature, with crystalline graindimensions typically in the range of tens of nanometers up toa temperature of about 100-130 °C.
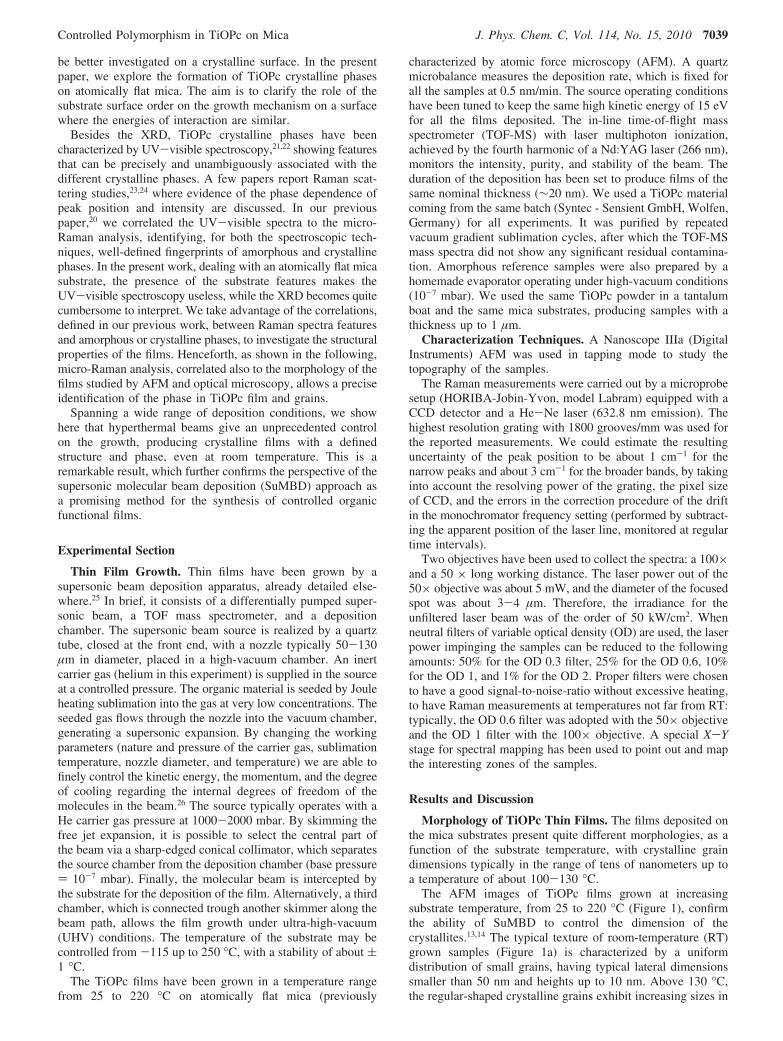
The AFM images of TiOPc films grown at increasingsubstrate temperature, from 25 to 220 °C (Figure 1), confirmthe ability of SuMBD to control the dimension of thecrystallites.13,14 The typical texture of room-temperature (RT)grown samples (Figure 1a) is characterized by a uniformdistribution of small grains, having typical lateral dimensionssmaller than 50 nm and heights up to 10 nm. Above 130 °C,the regular-shaped crystalline grains exhibit increasing sizes in
Controlled Polymorphism in TiOPc on Mica J. Phys. Chem. C, Vol. 114, No. 15, 2010 7039
the micrometer range and can be imaged by the opticalmicroscopy of the Raman apparatus (see Figure 1b-d). Withthis approach, we characterize the single crystalline grain andidentify the structural properties with respect to the geometricalshape of the grain. The film roughness and the height scalesmeasured by tapping mode atomic force microscopy are verydifferent: the min-max height scale is 14 nm for films grownat 25 °C and becomes 60 nm for films grown at 160 °C orhigher. The rms roughness changes from 2 nm for filmsdeposited at 25 °C to 13 nm for films grown at 160 °C.19
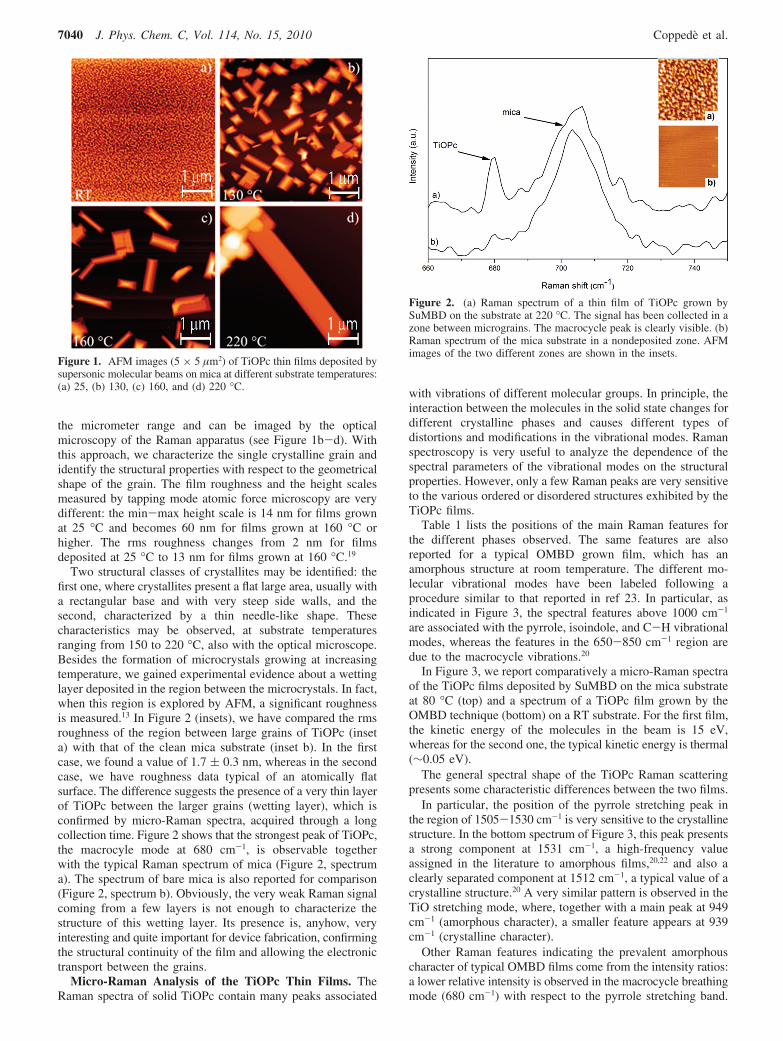
Two structural classes of crystallites may be identified: thefirst one, where crystallites present a flat large area, usually witha rectangular base and with very steep side walls, and thesecond, characterized by a thin needle-like shape. Thesecharacteristics may be observed, at substrate temperaturesranging from 150 to 220 °C, also with the optical microscope.Besides the formation of microcrystals growing at increasingtemperature, we gained experimental evidence about a wettinglayer deposited in the region between the microcrystals. In fact,when this region is explored by AFM, a significant roughnessis measured.13 In Figure 2 (insets), we have compared the rmsroughness of the region between large grains of TiOPc (inseta) with that of the clean mica substrate (inset b). In the firstcase, we found a value of 1.7 ( 0.3 nm, whereas in the secondcase, we have roughness data typical of an atomically flatsurface. The difference suggests the presence of a very thin layerof TiOPc between the larger grains (wetting layer), which isconfirmed by micro-Raman spectra, acquired through a longcollection time. Figure 2 shows that the strongest peak of TiOPc,the macrocyle mode at 680 cm-1, is observable togetherwith the typical Raman spectrum of mica (Figure 2, spectruma). The spectrum of bare mica is also reported for comparison(Figure 2, spectrum b). Obviously, the very weak Raman signalcoming from a few layers is not enough to characterize thestructure of this wetting layer. Its presence is, anyhow, veryinteresting and quite important for device fabrication, confirmingthe structural continuity of the film and allowing the electronictransport between the grains.
Micro-Raman Analysis of the TiOPc Thin Films. TheRaman spectra of solid TiOPc contain many peaks associated
with vibrations of different molecular groups. In principle, theinteraction between the molecules in the solid state changes fordifferent crystalline phases and causes different types ofdistortions and modifications in the vibrational modes. Ramanspectroscopy is very useful to analyze the dependence of thespectral parameters of the vibrational modes on the structuralproperties. However, only a few Raman peaks are very sensitiveto the various ordered or disordered structures exhibited by theTiOPc films.
Table 1 lists the positions of the main Raman features forthe different phases observed. The same features are alsoreported for a typical OMBD grown film, which has anamorphous structure at room temperature. The different mo-lecular vibrational modes have been labeled following aprocedure similar to that reported in ref 23. In particular, asindicated in Figure 3, the spectral features above 1000 cm-1
are associated with the pyrrole, isoindole, and C-H vibrationalmodes, whereas the features in the 650-850 cm-1 region aredue to the macrocycle vibrations.20
In Figure 3, we report comparatively a micro-Raman spectraof the TiOPc films deposited by SuMBD on the mica substrateat 80 °C (top) and a spectrum of a TiOPc film grown by theOMBD technique (bottom) on a RT substrate. For the first film,the kinetic energy of the molecules in the beam is 15 eV,whereas for the second one, the typical kinetic energy is thermal(∼0.05 eV).
The general spectral shape of the TiOPc Raman scatteringpresents some characteristic differences between the two films.
In particular, the position of the pyrrole stretching peak inthe region of 1505-1530 cm-1 is very sensitive to the crystallinestructure. In the bottom spectrum of Figure 3, this peak presentsa strong component at 1531 cm-1, a high-frequency valueassigned in the literature to amorphous films,20,22 and also aclearly separated component at 1512 cm-1, a typical value of acrystalline structure.20 A very similar pattern is observed in theTiO stretching mode, where, together with a main peak at 949cm-1 (amorphous character), a smaller feature appears at 939cm-1 (crystalline character).
Other Raman features indicating the prevalent amorphouscharacter of typical OMBD films come from the intensity ratios:a lower relative intensity is observed in the macrocycle breathingmode (680 cm-1) with respect to the pyrrole stretching band.
Figure 1. AFM images (5 × 5 µm2) of TiOPc thin films deposited bysupersonic molecular beams on mica at different substrate temperatures:(a) 25, (b) 130, (c) 160, and (d) 220 °C.
Figure 2. (a) Raman spectrum of a thin film of TiOPc grown bySuMBD on the substrate at 220 °C. The signal has been collected in azone between micrograins. The macrocycle peak is clearly visible. (b)Raman spectrum of the mica substrate in a nondeposited zone. AFMimages of the two different zones are shown in the insets.
7040 J. Phys. Chem. C, Vol. 114, No. 15, 2010 Coppede et al.
Besides that, the isoindole stretching mode at 1434 cm-1 isweaker than that at higher frequency (1450 cm-1). A thirdrelevant marker is the fwhm (full with at half-maximum) thatis significantly larger for many of the peaks of the amorphousphase. In particular, the peak of the macrocycle breathing mode,being isolated and well-resolved, allows for the best quantitativeevaluation of this parameter.
On the contrary, the SuMBD film spectrum shows all thetypical characteristics of the crystalline structure: the presenceof only the 1512 cm-1 component for the pyrrole stretchingand of only the lower frequency (939 cm-1) component for TiOstretching. Furthermore, the higher intensity ratio between themacrocycle breathing and the pyrrole stretching modes togetherwith a higher intensity of the lower frequency component inthe isoindole stretching is clearly observed.
To study the correlations between the different Ramansignatures and the structural phases, we carried out a detailedanalysis of typical spectra of TiOPc films, measured at differentsubstrate temperatures, taking also into account their typicalmorphological shape.
At RT, the mean size of the grains deposited by SuMBD istypically in the range of nanometric dimensions, whereas
samples with substrate temperatures ranging from 200 to 220°C reveal the presence of micrometric crystallites.
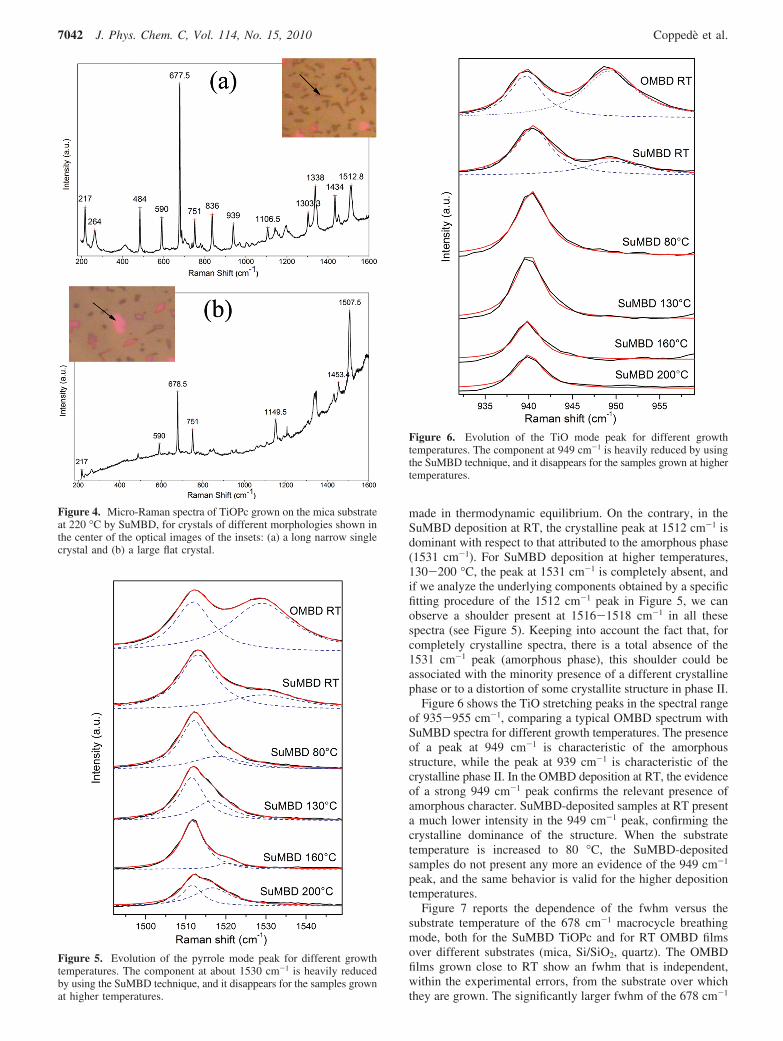
In particular, for the sample grown at 220 °C, the shape ofthe crystallites can be distinguished by using optical microscopy.The distinction between the two crystal classes, resultingfrom the AFM analysis in a previous work,18 can be summarizedas “flat, large, and squared” crystallites against “long andnarrow” crystallites.
Figure 4a,b reports the spectra of the two different kinds ofcrystallites. The narrow and long ones (needle-like) (Figure 4a)present the typical phase II spectral markers: the pyrrolestretching position at 1512 cm-1, a very strong macrocycle peakwith the nearby satellites all having a comparable intensity, andthe higher intensity of the 1434 cm-1 peak among the modesof the isoindole stretching. For the flat and square crystallites,different spectra of a crystalline phase have been found (seeFigure 4b). The observed red shift of the pyrrole stretching modetoward 1506-1509 cm-1 is symptomatic of a different structuralorganization because it is quite different than in the amorphousand phase II structures. In addition, the macrocycle mode hasan intensity comparable to that of the pyrrole stretching one,while the nearby modes have quite different intensities, andfinally, the strongest peak of the isoindole region is the one at1453 cm-1. All this evidence indicates a crystal phase differentfrom phase II. Further studies, possibly including other structuralanalyses, are needed to better characterize this phase.
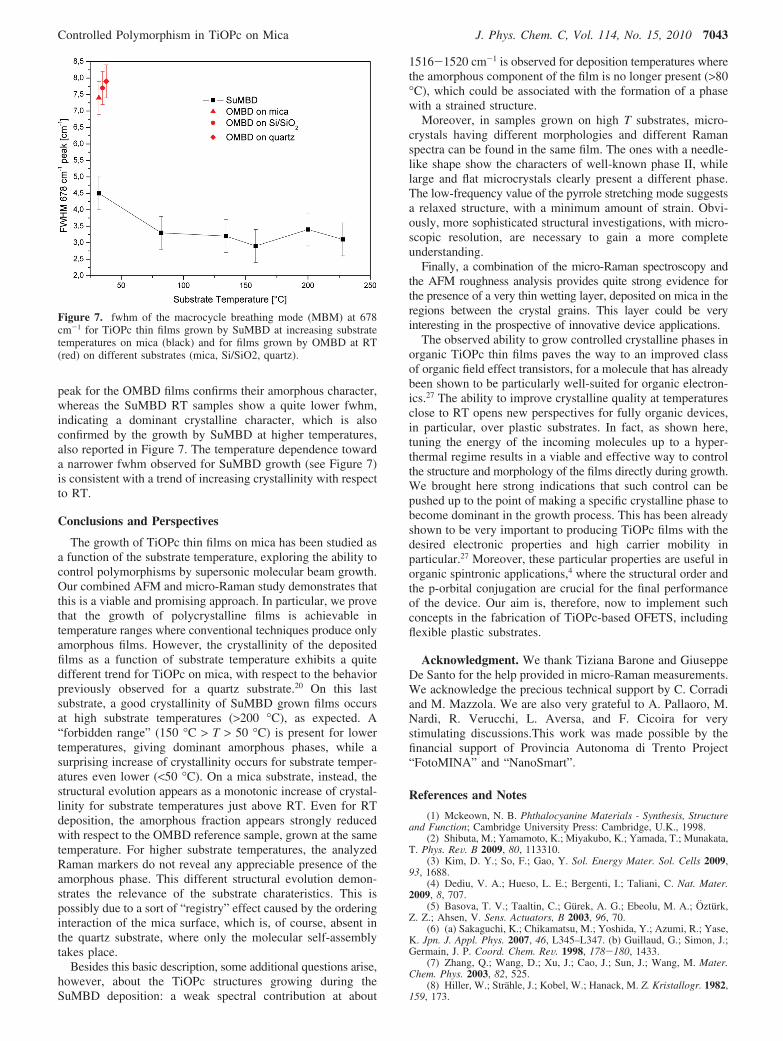
To have a clear and more detailed comparison between thecrystalline phases and to determine the effect of the kineticenergy of the molecules on film growth, we analyze the spectralshape of the pyrrole peak between 1500 and 1550 cm-1 forSuMBD samples, grown at various substrate temperatures,compared with a OMBD samples grown at RT. (Figure 5). Thesamples deposited at RT by OMBD present two clearly distinctcomponents (1531 and 1512 cm-1), indicating a strong presenceof amorphous phases, but also the coexistence of some crystal-line structures. The SuMBD-deposited samples at RT presentalso two peaks, but with a very different intensity ratio betweenthem: a very strong peak at 1512 cm-1, characteristic of thecrystalline structure, and a shoulder, much lower in intensity,at 1530 cm-1, typical of an amorphous structure. The dominantpresence of the amorphous phase for OMBD deposition is inagreement with the literature13,21 and is typical for depositions
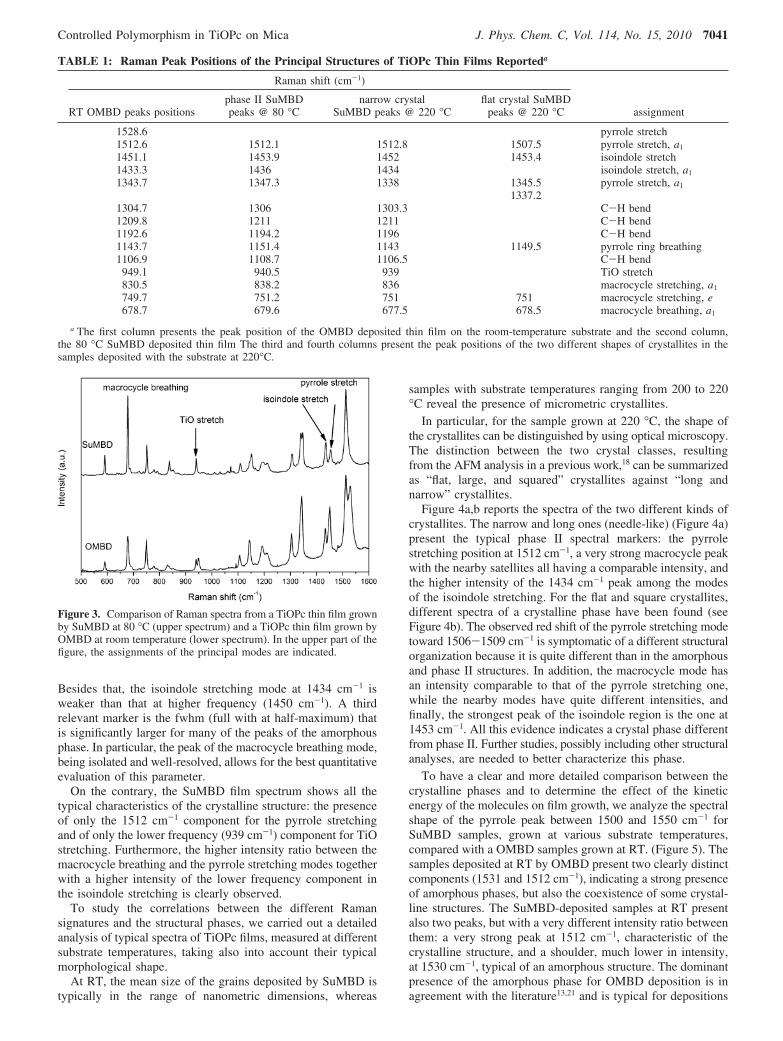
TABLE 1: Raman Peak Positions of the Principal Structures of TiOPc Thin Films Reporteda
Raman shift (cm-1)
RT OMBD peaks positionsphase II SuMBDpeaks @ 80 °C
narrow crystalSuMBD peaks @ 220 °C
flat crystal SuMBDpeaks @ 220 °C assignment
1528.6 pyrrole stretch1512.6 1512.1 1512.8 1507.5 pyrrole stretch, a1
1451.1 1453.9 1452 1453.4 isoindole stretch1433.3 1436 1434 isoindole stretch, a1
1343.7 1347.3 1338 1345.5 pyrrole stretch, a1
1337.21304.7 1306 1303.3 C-H bend1209.8 1211 1211 C-H bend1192.6 1194.2 1196 C-H bend1143.7 1151.4 1143 1149.5 pyrrole ring breathing1106.9 1108.7 1106.5 C-H bend
949.1 940.5 939 TiO stretch830.5 838.2 836 macrocycle stretching, a1
749.7 751.2 751 751 macrocycle stretching, e678.7 679.6 677.5 678.5 macrocycle breathing, a1
a The first column presents the peak position of the OMBD deposited thin film on the room-temperature substrate and the second column,the 80 °C SuMBD deposited thin film The third and fourth columns present the peak positions of the two different shapes of crystallites in thesamples deposited with the substrate at 220°C.
Figure 3. Comparison of Raman spectra from a TiOPc thin film grownby SuMBD at 80 °C (upper spectrum) and a TiOPc thin film grown byOMBD at room temperature (lower spectrum). In the upper part of thefigure, the assignments of the principal modes are indicated.
Controlled Polymorphism in TiOPc on Mica J. Phys. Chem. C, Vol. 114, No. 15, 2010 7041
made in thermodynamic equilibrium. On the contrary, in theSuMBD deposition at RT, the crystalline peak at 1512 cm-1 isdominant with respect to that attributed to the amorphous phase(1531 cm-1). For SuMBD deposition at higher temperatures,130-200 °C, the peak at 1531 cm-1 is completely absent, andif we analyze the underlying components obtained by a specificfitting procedure of the 1512 cm-1 peak in Figure 5, we canobserve a shoulder present at 1516-1518 cm-1 in all thesespectra (see Figure 5). Keeping into account the fact that, forcompletely crystalline spectra, there is a total absence of the1531 cm-1 peak (amorphous phase), this shoulder could beassociated with the minority presence of a different crystallinephase or to a distortion of some crystallite structure in phase II.
Figure 6 shows the TiO stretching peaks in the spectral rangeof 935-955 cm-1, comparing a typical OMBD spectrum withSuMBD spectra for different growth temperatures. The presenceof a peak at 949 cm-1 is characteristic of the amorphousstructure, while the peak at 939 cm-1 is characteristic of thecrystalline phase II. In the OMBD deposition at RT, the evidenceof a strong 949 cm-1 peak confirms the relevant presence ofamorphous character. SuMBD-deposited samples at RT presenta much lower intensity in the 949 cm-1 peak, confirming thecrystalline dominance of the structure. When the substratetemperature is increased to 80 °C, the SuMBD-depositedsamples do not present any more an evidence of the 949 cm-1
peak, and the same behavior is valid for the higher depositiontemperatures.
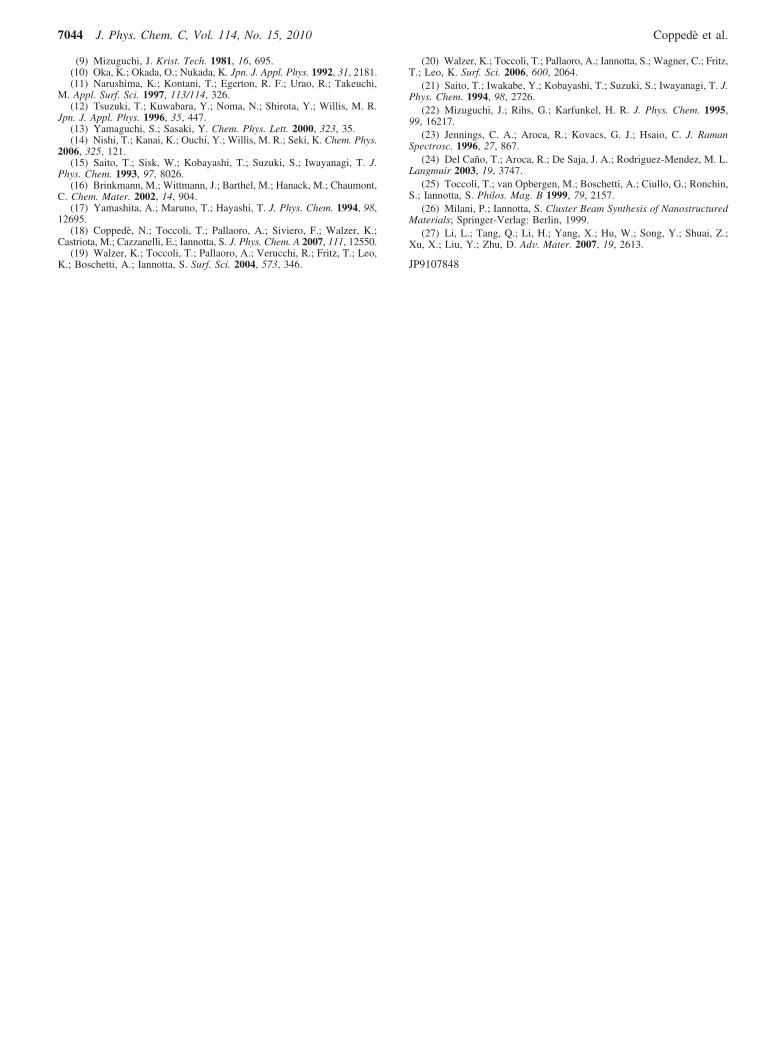
Figure 7 reports the dependence of the fwhm versus thesubstrate temperature of the 678 cm-1 macrocycle breathingmode, both for the SuMBD TiOPc and for RT OMBD filmsover different substrates (mica, Si/SiO2, quartz). The OMBDfilms grown close to RT show an fwhm that is independent,within the experimental errors, from the substrate over whichthey are grown. The significantly larger fwhm of the 678 cm-1
Figure 5. Evolution of the pyrrole mode peak for different growthtemperatures. The component at about 1530 cm-1 is heavily reducedby using the SuMBD technique, and it disappears for the samples grownat higher temperatures.
Figure 4. Micro-Raman spectra of TiOPc grown on the mica substrateat 220 °C by SuMBD, for crystals of different morphologies shown inthe center of the optical images of the insets: (a) a long narrow singlecrystal and (b) a large flat crystal.
Figure 6. Evolution of the TiO mode peak for different growthtemperatures. The component at 949 cm-1 is heavily reduced by usingthe SuMBD technique, and it disappears for the samples grown at highertemperatures.
7042 J. Phys. Chem. C, Vol. 114, No. 15, 2010 Coppede et al.
peak for the OMBD films confirms their amorphous character,whereas the SuMBD RT samples show a quite lower fwhm,indicating a dominant crystalline character, which is alsoconfirmed by the growth by SuMBD at higher temperatures,also reported in Figure 7. The temperature dependence towarda narrower fwhm observed for SuMBD growth (see Figure 7)is consistent with a trend of increasing crystallinity with respectto RT.
Conclusions and Perspectives
The growth of TiOPc thin films on mica has been studied asa function of the substrate temperature, exploring the ability tocontrol polymorphisms by supersonic molecular beam growth.Our combined AFM and micro-Raman study demonstrates thatthis is a viable and promising approach. In particular, we provethat the growth of polycrystalline films is achievable intemperature ranges where conventional techniques produce onlyamorphous films. However, the crystallinity of the depositedfilms as a function of substrate temperature exhibits a quitedifferent trend for TiOPc on mica, with respect to the behaviorpreviously observed for a quartz substrate.20 On this lastsubstrate, a good crystallinity of SuMBD grown films occursat high substrate temperatures (>200 °C), as expected. A“forbidden range” (150 °C > T > 50 °C) is present for lowertemperatures, giving dominant amorphous phases, while asurprising increase of crystallinity occurs for substrate temper-atures even lower (<50 °C). On a mica substrate, instead, thestructural evolution appears as a monotonic increase of crystal-linity for substrate temperatures just above RT. Even for RTdeposition, the amorphous fraction appears strongly reducedwith respect to the OMBD reference sample, grown at the sametemperature. For higher substrate temperatures, the analyzedRaman markers do not reveal any appreciable presence of theamorphous phase. This different structural evolution demon-strates the relevance of the substrate charateristics. This ispossibly due to a sort of “registry” effect caused by the orderinginteraction of the mica surface, which is, of course, absent inthe quartz substrate, where only the molecular self-assemblytakes place.
Besides this basic description, some additional questions arise,however, about the TiOPc structures growing during theSuMBD deposition: a weak spectral contribution at about
1516-1520 cm-1 is observed for deposition temperatures wherethe amorphous component of the film is no longer present (>80°C), which could be associated with the formation of a phasewith a strained structure.
Moreover, in samples grown on high T substrates, micro-crystals having different morphologies and different Ramanspectra can be found in the same film. The ones with a needle-like shape show the characters of well-known phase II, whilelarge and flat microcrystals clearly present a different phase.The low-frequency value of the pyrrole stretching mode suggestsa relaxed structure, with a minimum amount of strain. Obvi-ously, more sophisticated structural investigations, with micro-scopic resolution, are necessary to gain a more completeunderstanding.
Finally, a combination of the micro-Raman spectroscopy andthe AFM roughness analysis provides quite strong evidence forthe presence of a very thin wetting layer, deposited on mica in theregions between the crystal grains. This layer could be veryinteresting in the prospective of innovative device applications.
The observed ability to grow controlled crystalline phases inorganic TiOPc thin films paves the way to an improved classof organic field effect transistors, for a molecule that has alreadybeen shown to be particularly well-suited for organic electron-ics.27 The ability to improve crystalline quality at temperaturesclose to RT opens new perspectives for fully organic devices,in particular, over plastic substrates. In fact, as shown here,tuning the energy of the incoming molecules up to a hyper-thermal regime results in a viable and effective way to controlthe structure and morphology of the films directly during growth.We brought here strong indications that such control can bepushed up to the point of making a specific crystalline phase tobecome dominant in the growth process. This has been alreadyshown to be very important to producing TiOPc films with thedesired electronic properties and high carrier mobility inparticular.27 Moreover, these particular properties are useful inorganic spintronic applications,4 where the structural order andthe p-orbital conjugation are crucial for the final performanceof the device. Our aim is, therefore, now to implement suchconcepts in the fabrication of TiOPc-based OFETS, includingflexible plastic substrates.
Acknowledgment. We thank Tiziana Barone and GiuseppeDe Santo for the help provided in micro-Raman measurements.We acknowledge the precious technical support by C. Corradiand M. Mazzola. We are also very grateful to A. Pallaoro, M.Nardi, R. Verucchi, L. Aversa, and F. Cicoira for verystimulating discussions.This work was made possible by thefinancial support of Provincia Autonoma di Trento Project“FotoMINA” and “NanoSmart”.
References and Notes
(1) Mckeown, N. B. Phthalocyanine Materials - Synthesis, Structureand Function; Cambridge University Press: Cambridge, U.K., 1998.
(2) Shibuta, M.; Yamamoto, K.; Miyakubo, K.; Yamada, T.; Munakata,T. Phys. ReV. B 2009, 80, 113310.
(3) Kim, D. Y.; So, F.; Gao, Y. Sol. Energy Mater. Sol. Cells 2009,93, 1688.
(4) Dediu, V. A.; Hueso, L. E.; Bergenti, I.; Taliani, C. Nat. Mater.2009, 8, 707.
(5) Basova, T. V.; Taaltin, C.; Gurek, A. G.; Ebeolu, M. A.; Ozturk,Z. Z.; Ahsen, V. Sens. Actuators, B 2003, 96, 70.
(6) (a) Sakaguchi, K.; Chikamatsu, M.; Yoshida, Y.; Azumi, R.; Yase,K. Jpn. J. Appl. Phys. 2007, 46, L345–L347. (b) Guillaud, G.; Simon, J.;Germain, J. P. Coord. Chem. ReV. 1998, 178-180, 1433.
(7) Zhang, Q.; Wang, D.; Xu, J.; Cao, J.; Sun, J.; Wang, M. Mater.Chem. Phys. 2003, 82, 525.
(8) Hiller, W.; Strahle, J.; Kobel, W.; Hanack, M. Z. Kristallogr. 1982,159, 173.
Figure 7. fwhm of the macrocycle breathing mode (MBM) at 678cm-1 for TiOPc thin films grown by SuMBD at increasing substratetemperatures on mica (black) and for films grown by OMBD at RT(red) on different substrates (mica, Si/SiO2, quartz).
Controlled Polymorphism in TiOPc on Mica J. Phys. Chem. C, Vol. 114, No. 15, 2010 7043
(9) Mizuguchi, J. Krist. Tech. 1981, 16, 695.(10) Oka, K.; Okada, O.; Nukada, K. Jpn. J. Appl. Phys. 1992, 31, 2181.(11) Narushima, K.; Kontani, T.; Egerton, R. F.; Urao, R.; Takeuchi,
M. Appl. Surf. Sci. 1997, 113/114, 326.(12) Tsuzuki, T.; Kuwabara, Y.; Noma, N.; Shirota, Y.; Willis, M. R.
Jpn. J. Appl. Phys. 1996, 35, 447.(13) Yamaguchi, S.; Sasaki, Y. Chem. Phys. Lett. 2000, 323, 35.(14) Nishi, T.; Kanai, K.; Ouchi, Y.; Willis, M. R.; Seki, K. Chem. Phys.
2006, 325, 121.(15) Saito, T.; Sisk, W.; Kobayashi, T.; Suzuki, S.; Iwayanagi, T. J.
Phys. Chem. 1993, 97, 8026.(16) Brinkmann, M.; Wittmann, J.; Barthel, M.; Hanack, M.; Chaumont,
C. Chem. Mater. 2002, 14, 904.(17) Yamashita, A.; Maruno, T.; Hayashi, T. J. Phys. Chem. 1994, 98,
12695.(18) Coppede, N.; Toccoli, T.; Pallaoro, A.; Siviero, F.; Walzer, K.;
Castriota, M.; Cazzanelli, E.; Iannotta, S. J. Phys. Chem. A 2007, 111, 12550.(19) Walzer, K.; Toccoli, T.; Pallaoro, A.; Verucchi, R.; Fritz, T.; Leo,
K.; Boschetti, A.; Iannotta, S. Surf. Sci. 2004, 573, 346.
(20) Walzer, K.; Toccoli, T.; Pallaoro, A.; Iannotta, S.; Wagner, C.; Fritz,T.; Leo, K. Surf. Sci. 2006, 600, 2064.
(21) Saito, T.; Iwakabe, Y.; Kobayashi, T.; Suzuki, S.; Iwayanagi, T. J.Phys. Chem. 1994, 98, 2726.
(22) Mizuguchi, J.; Rihs, G.; Karfunkel, H. R. J. Phys. Chem. 1995,99, 16217.
(23) Jennings, C. A.; Aroca, R.; Kovacs, G. J.; Hsaio, C. J. RamanSpectrosc. 1996, 27, 867.
(24) Del Cano, T.; Aroca, R.; De Saja, J. A.; Rodriguez-Mendez, M. L.Langmuir 2003, 19, 3747.
(25) Toccoli, T.; van Opbergen, M.; Boschetti, A.; Ciullo, G.; Ronchin,S.; Iannotta, S. Philos. Mag. B 1999, 79, 2157.
(26) Milani, P.; Iannotta, S. Cluster Beam Synthesis of NanostructuredMaterials; Springer-Verlag: Berlin, 1999.
(27) Li, L.; Tang, Q.; Li, H.; Yang, X.; Hu, W.; Song, Y.; Shuai, Z.;Xu, X.; Liu, Y.; Zhu, D. AdV. Mater. 2007, 19, 2613.
JP9107848
7044 J. Phys. Chem. C, Vol. 114, No. 15, 2010 Coppede et al.