Crassostrea gigas in natural oyster banks in southern Brazil
Upload
independentCategory
view
1download
0
Controlled and in situ target strengths of the jumbo squidDosidicus gigas and identification of potential acoustic scatteringsources
Kelly J. Benoit-Birda�
College of Oceanic and Atmospheric Sciences, Oregon State University, 104 COAS Administration Building,Corvallis, Oregon 97331
William F. Gillyb�
Hopkins Marine Station, Department of Biological Sciences, Stanford University, Oceanview Boulevard,Pacific Grove, California 93950
Whitlow W. L. Auc�
Hawaii Institute of Marine Biology, University of Hawaii, P.O. Box 1106, Kailua, Hawaii 96734
Bruce Mated�
Hatfield Marine Science Center, Oregon State University, 2030 SE Marine Science Drive, Newport,Oregon 97365
�Received 26 April 2007; revised 3 December 2007; accepted 12 December 2007�
This study presents the first target strength measurements of Dosidicus gigas, a large squid that isa key predator, a significant prey, and the target of an important fishery. Target strength of live,tethered squid was related to mantle length with values standardized to the length squared of −62.0,−67.4, −67.9, and −67.6 dB at 38, 70, 120, and 200 kHz, respectively. There were relatively smalldifferences in target strength between dorsal and anterior aspects and none between live and freshlydead squid. Potential scattering mechanisms in squid have been long debated. Here, the reproductiveorgans had little effect on squid target strength. These data support the hypothesis that the pen maybe an important source of squid acoustic scattering. The beak, eyes, and arms, probably via thesucker rings, also play a role in acoustic scattering though their effects were small and frequencyspecific. An unexpected source of scattering was the cranium of the squid which provided a targetstrength nearly as high as that of the entire squid though the mechanism remains unclear. Our in situmeasurements of the target strength of free-swimming squid support the use of the values presentedhere in D. gigas assessment studies.© 2008 Acoustical Society of America. �DOI: 10.1121/1.2832327�
PACS number�s�: 43.30.Sf, 43.30.Ft, 43.20.Fn �KF� Pages: 1318–1328
I. INTRODUCTION
Dosidicus gigas, the jumbo or Humboldt squid, rangesin adult size from 35 cm to about 2.5 m in total length andcan weigh up to 50 kg, making it the largest of the nektonicsquids. Individual squid grow extremely rapidly, reachingthese sizes in only 1 to 2 years. They are found in the pro-ductive and relatively shallow waters of the Eastern Pacificfrom 125–140°W, 40°N to 45°S. They typically inhabitfrom surface waters to depths of about 500 m, with pro-nounced diel vertical migrations bringing them shallower atnight �Gilly et al., 2006� but Remotely Operated Vehicle�ROV� sightings have been made deeper than 1000 m �B.Robison, private communication�. D. gigas is an active mi-gratory predator, feeding primarily on myctophids and otherfish, crustaceans, and squid �Markaida and Sosa-Nishizaki,2003�. As adults, they are a food resource for large fish in-
a�Corresponding author. Electronic mail: [email protected]�Electronic mail: [email protected]�Electronic mail: [email protected]�
Electronic mail: [email protected]1318 J. Acoust. Soc. Am. 123 �3�, March 2008 0001-4966/2008/12
cluding tuna and swordfish, and marine mammals such assperm whales and pilot whales. D. gigas has been shown tobe a keystone species, transferring energy between plank-tivorous fish and the largest pelagic predators �Shchetinni-kov, 1988�.
Dosidicus gigas is probably the most abundant nektonicsquid in the Eastern Pacific �Nigmatullin et al., 2001�, and itcurrently supports the world’s largest cephalopod fishery,with landings of 800 000 tonnes in 2004 �FAO data at ftp://ftp.fao.org/fi/stat/summary/a1e.pdf� Approximately 15% ofthis catch comes from the Guaymas Basin in the Gulf ofCalifornia, Mexico �Markaida and Sosa-Nishizaki, 2001�, al-though annual landings can be quite variable �Nevarez-Martinez et al., 2006�.
Total standing biomass of D. gigas across its large rangeis unknown, but annual production in the Gulf of Californiahas been estimated to be 210,000 tons /y �Sanchez-Juarez,1991�. This figure undoubtedly is an underestimate of thecurrent situation, given the fact that commercial fishing hasreached half of this figure, and consumption by residentsperm whales alone may be comparable �D. Gendron, private
communication�.© 2008 Acoustical Society of America3�3�/1318/11/$23.00

Despite the economic importance of the Dosidicus fish-ery and the inherent difficulties in managing a highly vari-able population affected by strong environmental fluctua-tions, extensive migrations, and interactions with otherfisheries �Morales-Bojorquez et al., 2001�, data on behavior,natural history, and biomass of the species remain limited.These factors are critical components to successful manage-ment of any fishery.
Assessment of biomass in squid fisheries has relied oncommercial landing data, trawls, and quantitative hand-fishing �jigging� surveys, each of which has limitations�Boyle and Rodhouse, 2005�. Although acoustic methodshave been widely used in the assessment of fish stocks �Mis-und, 1997�, application of acoustics to study the biology ofsquid has received much less attention, probably because ofthe belief that squid are particularly weak scatterers �Fristrupand Harbison, 2002�. Nonetheless, acoustic methods havebeen successfully employed to observe spawning aggrega-tions �Jefferts et al., 1987; Lipinski and Prowse, 2002�, toassess recruitment by quantifying benthic egg beds �Footeet al., 2006�, and to characterize acoustic features of differentgroups of squid for possible future efforts �see, for example,Boyle and Rodhouse, 2005; Goss et al., 2001�.
The first step for quantitative acoustic assessment of anymarine species is measurement of its target strength distribu-tion, and no such data exist for D. gigas. Our goals in thisstudy were: �1� to obtain controlled measurements of thetarget strength of a wide size range of live D. gigas at fourfrequencies, �2� identify possible sources of scattering in D.gigas, and �3� to confirm the validity of target strength mea-surements in situ with free swimming squid.
II. METHODS
Research was conducted between 16 and 24 March 2007from the 25 m R/V Pacific Storm in Guaymas Basin in theGulf of California, Mexico. Individual squid were capturedwith weighted, luminescent jigs generally between dusk and0100 local time. One squid �the smallest studied� was cap-tured at the surface using a dip net. Squid were typicallymaintained in individual, covered tanks with a continuousinput of fresh seawater overnight before their acoustic prop-erties were measured during daylight hours.
A. Acoustic system
Acoustic characteristics of the squid were measured us-ing a four-frequency, split-beam echosounder system �Sim-rad EK60s�. The 38 kHz echosounder used a 1024 �s pulse,the 70 kHz echosounder used a 512 �s long pulse, while the120 and 200 kHz echosounders used a 256 �s pulse. The38 kHz system had a 12° conical split beam while each ofthe higher frequencies had a 7° conical split beam. The trans-ducers were affixed over the side of the vessel on a rigid polemount so that they were 1 m beneath the water’s surface.The system was calibrated using an indirect procedure incor-porating a 38.1-mm-diam tungsten carbide reference sphereas prescribed by Foote et al. �1987�. In addition, the targetstrength of the sphere was also measured attached to the
mounting line that normally held the squid �described in theJ. Acoust. Soc. Am., Vol. 123, No. 3, March 2008
following� to rule out any possible interference of the mount-ing arrangement. All the mounting lines were also placed inthe water without the sphere or a squid to measure any po-tential backscatter from the experimental setup.
B. Mounting of live squid
An individual squid was removed from its holding tankand placed ventral side down for attachment of the mountinghardware. During this time ��5 min total� the gills werecontinuously irrigated with flowing seawater. The squid didnot struggle, and no anesthesia was necessary. Two locationson either side of the midline of the dorsal mantle surface nearthe anterior edge, and one location through the posterior tipof the gladius, were pierced with a stainless-steel cannula�6 mm o.d.; Floy Tag, Seattle WA�, allowing a small lengthof 6 mm diameter Tygon tubing to be passed through eachhole. A plastic cable tie was passed through the tubing andthen cinched to form a loop, with the soft tubing acting as a“bushing” to minimize tissue damage �Fig. 1�.
For dorsal-aspect measurements, the loops through thesquid were then attached to two loops tied approximately thelength of squid’s mantle apart near the center of a 7.5 mhorizontal length of monofilament. The squid, attached to themonofilament mounting line, was then gently lifted onto acloth stretcher and lowered into the water. Great care wastaken to avoid the introduction of air into the squid’s mantleduring the mounting procedure. The mantle was continu-ously flushed with gently running seawater while on deckand then held compressed by the stretcher until the squid wasreleased in the water by removing the stretcher. The squidwas then observed just below the surface to ensure that itwas actively swimming in the proper orientation, that nolines were tangled, and that no air was observed leaving themantle or around the animal’s appendages. The animals wereall observed to be vigorously alive and their attempts toswim away from the mounting rig resulted in strong mantlecompressions and jetting, likely removing any potential re-sidual air. After observation of the squid near the surface, thehorizontal mounting line was lowered to a depth of between6 and 16 m, depending on currents and other sea conditions.In all cases, the depth was at least twice what was necessaryfor the entire target to be within the 3 dB beamwidth of the
FIG. 1. A mounted squid underwater. A single loop of Tygon® tubing tied toa horizontal length of monofilament is visible at the posterior of the animalat the left of the photo and two loops tied together and then to the monofila-ment is visible at the anterior of the mantle, near the squid’s head in thecenter of the photo.
narrowest transducer and in the far field of all transducers
Benoit-Bird et al.: Target strength of the jumbo squid 1319

when considering the cross-sectional area of the scatteringsurface perpendicular to the incident signal at the wave-lengths used.
As indicated in Fig. 2, the horizontal mounting line washeld taut between two vertical nylon lines spaced 10 m apart.Each vertical line was weighted with a 9 kg lead ball 5 mbelow the attachment point of the mounting line. An addi-tional 7.5 m length of polypropylene line connected the leadweights and provided strain relief. The inboard/outboard po-sition of the lines was adjusted with poles affixed across therail of the vessel. Dorsal-aspect measurements were takenfrom a total of 14 squid that were alive both upon entry intothe water and after removal from the water postexperiment.Measurements were also made from one animal that had re-cently expired. Only live animals were used for the acousticmeasurements presented in the figures and equations.
After measuring the dorsal aspect of the squid, a subsetof the animals were measured from the posterior aspect bysuspending the squid in a head-down vertical orientation. Inthis case, the posterior attachment loop was retained, but theanterior loops were detached from the mounting line, and thecorresponding end of that line was disconnected from itsvertical line, and the end was directly attached to a 5 mlength of monofilament leading to a 5 kg lead ball.
Upon completion of all measurements, we measureddorsal mantle length �DML�, length from the tip of themantle to the end of the outstretched arms �not tentacles�,maximum mantle width, and total mass. After these measure-ments were completed, the squid was euthanized by rapiddecapitation, and sex and maturity stage �Lipinski and Un-derhill, 1995� were visually determined. Effects of maturityand gender on target strength were assessed with a multivari-ate analysis of variance �ANOVA�.
C. Acoustic scattering source assessments
Measurements were made in an attempt to determine the
FIG. 2. The squid was mounted to a horizontal piece of monofilamentstretched apart by two vertical lines lowered by lead balls. The transducerswere mounted 1 m below the water’s surface on a rigid pole over the side.Lateral aspect setup is shown in the main figure. Changes for posterioraspect �head down� measurements are shown in the inset on the lower righton the same scale.
important individual sources of the acoustic scattering from
1320 J. Acoust. Soc. Am., Vol. 123, No. 3, March 2008
squid. In several cases, following the whole-animal measure-ments, the dorsal aspects of the head and body were mea-sured separately. Each portion was suspended from themounting line in a manner similar to that described earlier.Care was taken to avoid the introduction of air into the bodyparts since it could dramatically impact acoustic measure-ments. The dense, cartilaginous posterior of the gladius �theconus� was removed and the body was remeasured. Thebeak, followed by the eyes, arms, and all soft tissue weresuccessively removed from the head with measurements re-peated at each step so that ultimately, only the cartilaginouscranium �braincase� remained.
D. Acoustic measurements
Acoustic measurements were either made while the boatwas anchored in at least 30 m of water or drifting in calmseas. The position of the squid was adjusted so that it wasmaintained within 2° of the center of each of the four trans-ducers as identified in real time via the split beam targetidentification that is part of the Simrad recording software. Aminimum of 100 measurements of target strength were madefrom each squid in each position. Most often, at least 500measurements were made. Analysis of target strength wasonly made for echoes that were within 2.5° of the center ofthe beam along both axes and were at the known depth of thesquid. The average target strength and standard deviation�both calculated from linearized data� were determined foreach squid. The target strengths of scattering from differentparts of the squid were compared using t-tests based on tar-get strengths from individual echoes of the same squid ratherthan from mean values.
For all measurements, targets were extracted usingSonarData’s ECHOVIEW program. The single target detectioncriteria were based on the transmitted pulse length, measure-ments of target strength of the calibration sphere in the squidmounting setup, and through empirical minimization of thestandard deviation of the target strength of individual teth-ered squid when their depth relative to the transducer’s wasknown and surrounding acoustic clutter was at a minimum.The target strength threshold was set to −55 dB. A “pulselength determination level,” the value in decibels below peakvalue considered when determining the pulse length, or en-velope, of a single-target detection, of 12 dB was used. “Nor-malized pulse lengths,” the measured pulse length divided bytransmitted pulse length, were required to be between 0.8and 2.0. The “maximum beam compensation” for correctingfor transducer directivity was set to 12 dB. To confirm allsources of scattering within the measured pulse length werefrom a single target, all samples within this pulse envelopemust have had a standard deviation in angular position ofless than 3° in both the along and athwart ship directions ofthe beam. We confirmed that these settings permitted theintegrated pulse envelope to enclose the entire body of thesquid by observing the standard deviation of the targetstrength measurements; when the pulse envelope was tooshort to encompass the entire squid the variation in estimated
target strength was extremely high.Benoit-Bird et al.: Target strength of the jumbo squid
E. In situ measurements
In situ measurements of targets that were highly likely tobe squid were also made. One night, fishing �jigging� wasconducted by two persons while the vessel was at anchor inapproximately 30 m of water. Over 15 min, 20 squid werecaptured and DML measured for each. Targets that met thecriteria to be analyzed individually during that time periodon the echosounders were extracted and the results comparedwith those made under controlled circumstances. Resultswere also compared with in situ measurements made whilemany �15–20� small commercial fishing boats surroundedour vessel and two to three fishermen per boat continuouslylanded D. gigas. Unfortunately, no length measurementswere made during this second in situ experiment.
III. RESULTS
A. Controlled measurements
The empty squid-holding setup was almost undetectableat all frequencies, and the target strength of the sphere mea-sured in the same arrangement compared well with standardcalibration measurements in terms of both the mean and thedistribution. This provides convincing evidence that the mea-surements of squid target strength described in the followingare not affected by the hardware setup.
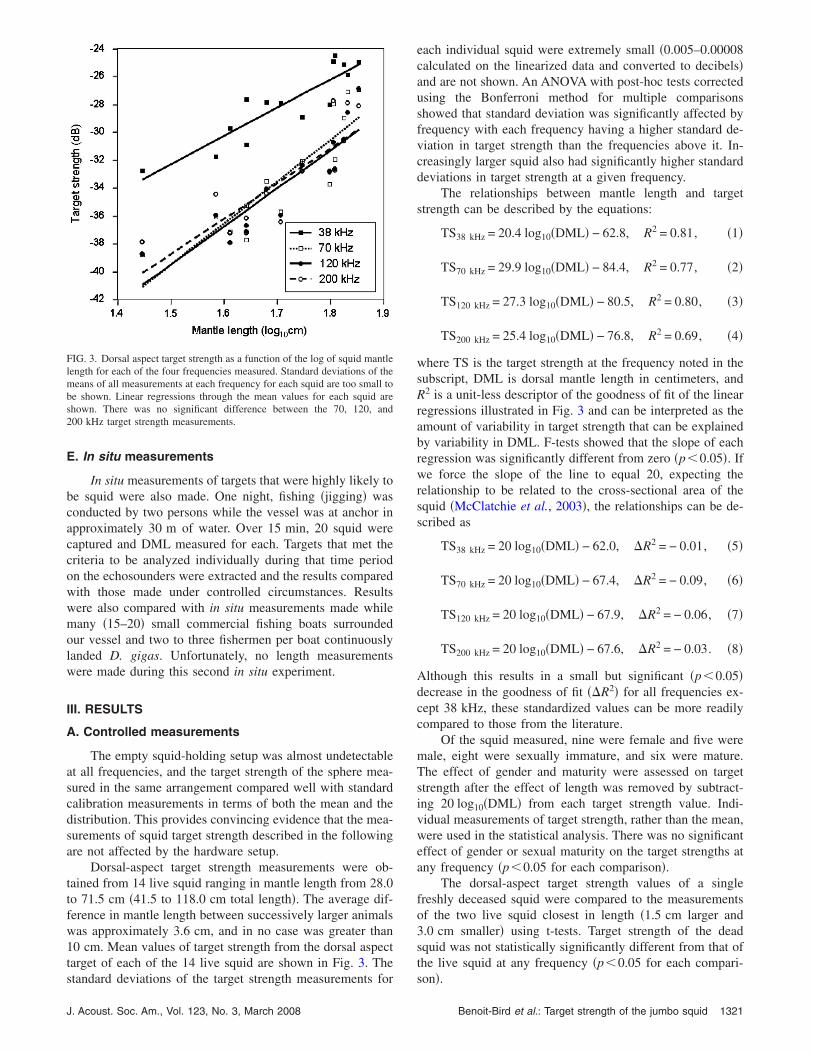
Dorsal-aspect target strength measurements were ob-tained from 14 live squid ranging in mantle length from 28.0to 71.5 cm �41.5 to 118.0 cm total length�. The average dif-ference in mantle length between successively larger animalswas approximately 3.6 cm, and in no case was greater than10 cm. Mean values of target strength from the dorsal aspecttarget of each of the 14 live squid are shown in Fig. 3. The
FIG. 3. Dorsal aspect target strength as a function of the log of squid mantlelength for each of the four frequencies measured. Standard deviations of themeans of all measurements at each frequency for each squid are too small tobe shown. Linear regressions through the mean values for each squid areshown. There was no significant difference between the 70, 120, and200 kHz target strength measurements.
standard deviations of the target strength measurements for
J. Acoust. Soc. Am., Vol. 123, No. 3, March 2008
each individual squid were extremely small �0.005–0.00008calculated on the linearized data and converted to decibels�and are not shown. An ANOVA with post-hoc tests correctedusing the Bonferroni method for multiple comparisonsshowed that standard deviation was significantly affected byfrequency with each frequency having a higher standard de-viation in target strength than the frequencies above it. In-creasingly larger squid also had significantly higher standarddeviations in target strength at a given frequency.
The relationships between mantle length and targetstrength can be described by the equations:
TS38 kHz = 20.4 log10�DML� − 62.8, R2 = 0.81, �1�
TS70 kHz = 29.9 log10�DML� − 84.4, R2 = 0.77, �2�
TS120 kHz = 27.3 log10�DML� − 80.5, R2 = 0.80, �3�
TS200 kHz = 25.4 log10�DML� − 76.8, R2 = 0.69, �4�
where TS is the target strength at the frequency noted in thesubscript, DML is dorsal mantle length in centimeters, andR2 is a unit-less descriptor of the goodness of fit of the linearregressions illustrated in Fig. 3 and can be interpreted as theamount of variability in target strength that can be explainedby variability in DML. F-tests showed that the slope of eachregression was significantly different from zero �p�0.05�. Ifwe force the slope of the line to equal 20, expecting therelationship to be related to the cross-sectional area of thesquid �McClatchie et al., 2003�, the relationships can be de-scribed as
TS38 kHz = 20 log10�DML� − 62.0, �R2 = − 0.01, �5�
TS70 kHz = 20 log10�DML� − 67.4, �R2 = − 0.09, �6�
TS120 kHz = 20 log10�DML� − 67.9, �R2 = − 0.06, �7�
TS200 kHz = 20 log10�DML� − 67.6, �R2 = − 0.03. �8�
Although this results in a small but significant �p�0.05�decrease in the goodness of fit ��R2� for all frequencies ex-cept 38 kHz, these standardized values can be more readilycompared to those from the literature.
Of the squid measured, nine were female and five weremale, eight were sexually immature, and six were mature.The effect of gender and maturity were assessed on targetstrength after the effect of length was removed by subtract-ing 20 log10�DML� from each target strength value. Indi-vidual measurements of target strength, rather than the mean,were used in the statistical analysis. There was no significanteffect of gender or sexual maturity on the target strengths atany frequency �p�0.05 for each comparison�.
The dorsal-aspect target strength values of a singlefreshly deceased squid were compared to the measurementsof the two live squid closest in length �1.5 cm larger and3.0 cm smaller� using t-tests. Target strength of the deadsquid was not statistically significantly different from that ofthe live squid at any frequency �p�0.05 for each compari-
son�.Benoit-Bird et al.: Target strength of the jumbo squid 1321
Posterior end-on measurements of the target strengths offive live squid ranging from 41 to 68 cm in mantle lengthwere measured. Target strengths were compared to the dorsalaspect target strength of the same individuals. The results areshown in the first column of Table I. The posterior-aspecttarget strength measurements were significantly different atall frequencies with slightly higher target strengths from theposterior aspect relative to the dorsal aspect at 38 kHz andlower target strengths from the posterior aspect for all otherfrequencies measured. Although standard deviations ofposterior-aspect target strength at individual frequencieswere small, they were significantly larger than those of dor-sal aspect measurements.
After the measurements were made on the live squid,some were sacrificed and immediately had various parts oftheir bodies measured. A summary of the statistical compari-sons of various target-strength measurements is shown inTable I. Any measurement type in the header that is precededby a minus sign means that this body part was removed fromthe other body part after a measurement had been made, anda comparison measurement was then repeated. In the body ofTable I, a negative value for the observed change in targetstrength means that the target strength corresponding to theupper row of the header was lower than that corresponding tothe lower row, and a positive sign means the opposite. Indi-cated values represent the mean difference �calculated onlinearized data� in target strength for all squid. Any valuesthat were not statistically significant at the p�0.05 level areindicated “ns.”
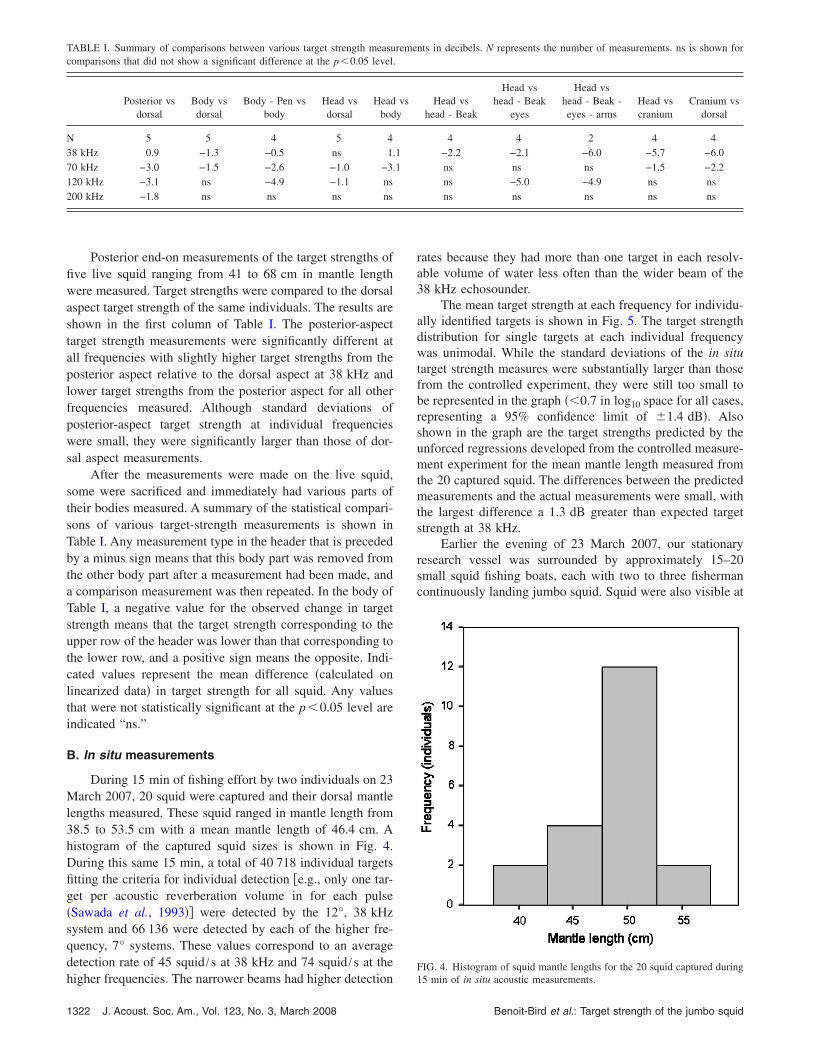
B. In situ measurements
During 15 min of fishing effort by two individuals on 23March 2007, 20 squid were captured and their dorsal mantlelengths measured. These squid ranged in mantle length from38.5 to 53.5 cm with a mean mantle length of 46.4 cm. Ahistogram of the captured squid sizes is shown in Fig. 4.During this same 15 min, a total of 40 718 individual targetsfitting the criteria for individual detection �e.g., only one tar-get per acoustic reverberation volume in for each pulse�Sawada et al., 1993�� were detected by the 12°, 38 kHzsystem and 66 136 were detected by each of the higher fre-quency, 7° systems. These values correspond to an averagedetection rate of 45 squid /s at 38 kHz and 74 squid /s at the
TABLE I. Summary of comparisons between various target strength measucomparisons that did not show a significant difference at the p�0.05 level.
Posterior vsdorsal
Body vsdorsal
Body - Pen vsbody
Head vsdorsal
Headbod
N 5 5 4 5 438 kHz 0.9 −1.3 −0.5 ns 1.70 kHz −3.0 −1.5 −2.6 −1.0 −3.120 kHz −3.1 ns −4.9 −1.1 ns200 kHz −1.8 ns ns ns ns
higher frequencies. The narrower beams had higher detection
1322 J. Acoust. Soc. Am., Vol. 123, No. 3, March 2008
rates because they had more than one target in each resolv-able volume of water less often than the wider beam of the38 kHz echosounder.
The mean target strength at each frequency for individu-ally identified targets is shown in Fig. 5. The target strengthdistribution for single targets at each individual frequencywas unimodal. While the standard deviations of the in situtarget strength measures were substantially larger than thosefrom the controlled experiment, they were still too small tobe represented in the graph ��0.7 in log10 space for all cases,representing a 95% confidence limit of �1.4 dB�. Alsoshown in the graph are the target strengths predicted by theunforced regressions developed from the controlled measure-ment experiment for the mean mantle length measured fromthe 20 captured squid. The differences between the predictedmeasurements and the actual measurements were small, withthe largest difference a 1.3 dB greater than expected targetstrength at 38 kHz.
Earlier the evening of 23 March 2007, our stationaryresearch vessel was surrounded by approximately 15–20small squid fishing boats, each with two to three fishermancontinuously landing jumbo squid. Squid were also visible at
nts in decibels. N represents the number of measurements. ns is shown for
Head vshead - Beak
Head vshead - Beak
eyes
Head vshead - Beak -eyes - arms
Head vscranium
Cranium vsdorsal
4 4 2 4 4−2.2 −2.1 −6.0 −5.7 −6.0ns ns ns −1.5 −2.2ns −5.0 −4.9 ns nsns ns ns ns ns
FIG. 4. Histogram of squid mantle lengths for the 20 squid captured during
reme
vsy
11
15 min of in situ acoustic measurements.
Benoit-Bird et al.: Target strength of the jumbo squid

the surface in high densities. Mean in situ measurements oftarget strength during three, 15 min intervals are shown inFig. 6. In all measurements, the distribution of target strengthwas unimodal with a 95% confidence interval of less than�2 dB, suggesting a single size class of a uniform target�e.g. one species�. Using the unforced regression relation-ships from the controlled measurement experiment �Eqs.�1�–�4��, the approximate mean squid mantle length thatthese measurements would equate to are 35, 45, and 55 cmfor 2100–2115, 2130–2145, and 2200–2215 h local time, re-
FIG. 5. Mean in situ measurements of target strength �closed circles� col-lected between 23:45 and 00:00 local time on 23 March 2007. Fishingefforts during this same time period resulted in the capture of 20 squid witha mean length of 46.4 cm. Using the unforced regressions for target strengthvs length from the controlled measurements, a predicted target strength foreach frequency was calculated for this size squid, shown by the open circles.
FIG. 6. Mean in situ measurements of target strength during three, 15 minintervals on 23 March 2007. During this time, the research vessel was sur-rounded by approximately 15–20 small squid fishing boats, each with two to
three fisherman continuously landing jumbo squid.J. Acoust. Soc. Am., Vol. 123, No. 3, March 2008
spectively. The distribution of target strength measurementsof single targets at each individual frequency was unimodalat all time intervals. However, from 2100 to 2215 h the de-tection rate of individual targets increased by approximatelytenfold from 34 to 361 targets /s on the 7° transducers de-spite the boat being stationary and no changes in the meantarget depth. Echograms of target strength from the begin-ning �2100 h� of the sampling time when target detectionrate was moderate and the end �2213 h� of the sampling timewhen the detection rate was very high are shown in Fig. 7. Itis difficult to determine the number of individual squid de-tected during these time periods, as opposed to the number ofsingle targets because of our stationary position. Animalslikely moved into and out of the beam many times during theobservation period. In addition, the conical shape of thetransducers’ beams means that substantially more area iscovered at 75 m �32-m-diam circle for the 38 kHz sensorand 18 m diameter for the higher frequencies� than at 5 m �2.1–1.2 m diameter, respectively� further complicatingquantitative assessment from this small sample set.
IV. DISCUSSION
We present controlled measurements of individual Do-sidicus gigas covering nearly the full size range of the spe-
FIG. 7. Two echograms collected from the stationary vessel at 120 kHz fortwo, 1.5 min intervals on 23 March 2007. The bottom depth was approxi-mately 74 m. Data are expressed with a range compensation function of40 log r+2�r to show target strength values for individual targets.
cies as sampled by commercial fisheries, as well as in situ
Benoit-Bird et al.: Target strength of the jumbo squid 1323
measurements of free-swimming individuals along with a si-multaneously obtained estimate of size.
A. Controlled measurements
Controlled measurements of D. gigas dorsal aspect tar-get strength show a strong, positive linear relationship withthe log of squid dorsal mantle length. Target strength in-creases slightly more rapidly with squid length at 70, 120,and 200 kHz than at 38 kHz. Target strength at 38 kHz wasalso significantly higher by about 5.5 dB than the targetstrength at the higher frequencies measured. The reasons forthis difference are not apparent. Measurements of a standardsphere do not suggest any instrumental or analysis artifactsand the similarity of the response in free-swimming squid insitu eliminates potential artifacts from squid capture, mount-ing, or air entrapment. The target strengths at 70, 120, and200 kHz were not significantly different from each other.
Relatively few measurements of squid target strengthhave been made at multiple frequencies. Arnaya et al.�1989a� found that two species of squid that they measuredafter thawing dead specimens had a 5–10 dB higher targetstrength at 200 kHz relative to 50 kHz. Similarly, Kang et al.�2005� found a 0.7–2.5 dB higher target strength at 120 kHzrelative to 38 kHz for live specimens of one species alsomeasured by Arnaya et al. �1989a�. While the squid mea-sured in these two studies were much smaller than the D.gigas measured here, there was some overlap in mantlelength. As shown in Fig. 3, the patterns in relative targetstrength we observed were maintained when consideringonly these animals of smaller body size suggesting that thefrequency response of target strength is species specific, notsize specific.
Target strength can be normalized by forcing the slopeof the regression to 20, representing a relationship with thesquare of squid mantle length. The intercepts of these rela-tionships �Eqs. �5�–�8�� can then be compared with normal-ized target strength measurements from other studies, regard-less of animal size. Table II provides such a standardizedcomparison of dorsal-aspect target strengths from studies inthe literature that showed �1� a relationship between targetstrength and mantle length, and �2� a slope of 20° or enoughdata to refit the curve with a 20° slope. Because most squid
TABLE II. Published standardized dorsal aspect target strengths as a functidorsal aspect target strengths obtained in this study.
Source Condition Frequency �kHz� Slope
This study Live 38 20Benoit-Bird and Au, 2001 Anesthetized 200 20Lee et al., 1991 Dead 200 20This study Live 70 20This study Live 200 20This study Live 120 20Kawabata, 2005 Live 38 20Kang et al., 2005 Anesthetized 120 20Kawabata, 2001 Live 38 20Kang et al., 2005 Anesthetized 38 20Sawada et al., 2006 in situ 70 20
in the present study were substantially larger than those in
1324 J. Acoust. Soc. Am., Vol. 123, No. 3, March 2008
previous work, only our smaller individuals overlapped withthe largest squid measured in other studies, if at all. Despitethis, our standardized target strengths were similar to thosemeasured for very small individuals: various mesopelagicspecies �Benoit-Bird and Au, 2001� and Loligo edulis �Leeet al., 1991�. Standardized target strengths for Todarodespacificus were 5–10 dB lower than data reported here �Kanget al., 2005; Kawabata, 2001, 2005�, and Gonatopsis borealisstandardized target strengths were 15–20 dB lower �Sawadaet al., 2006�.
Comparisons of target strength for species with very dif-ferent size distributions are more difficult when the slope ofthe relationship between body size and target strength is notsimply related to the square of length. To compare our resultswith those from published studies of squid dorsal-aspect tar-get strength, the target strength of a 28 cm dorsal mantlelength squid was calculated using the equations from each ofthe studies as well as Eqs. �1�–�4� from this study �Table III�.For most of the published studies, 28 cm was at or veryslightly above the high end of the size distribution measured.For this study, it was the smallest animal measured. Thisminimized extrapolation to allow the best comparison ofdata. The target strengths measured here were relatively lowwhen compared with these studies. The target strength valuesare, however, very similar to the predicted target strengthsfrom those studies that measured target strength in situ. Allof the curves generated from animals that had been previ-ously preserved �usually frozen followed by thawing for themeasurements� had substantially higher predicted targetstrengths than those obtained from live animals either teth-ered or in situ.
Many measurements of squid target strength in the lit-erature have been made on dead animals. A squid we mea-sured shortly after its death �with no evidence of rigor� didnot have significantly different dorsal-aspect target strengthsthan similarly sized live animals, suggesting that targetstrength does not change immediately following death, how-ever it may change as a result of preservation or with greatertime delay. This result also suggests that the target strengthvalues we obtained were not a result of the behavior of thesquid or any alteration of their angle due to swimmingagainst our mounting setup.
the square of mantle length compared with the results of the standardized
tercept Min ML �cm� Max ML �cm� Species
−62.0 28.0 71.5 Dosidicus gigas−62.1 1.2 4.2 Various mesopelagic spp.−65.7 4.4 16.0 Loligo edulis−67.4 28.0 71.5 Dosidicus gigas−67.6 28.0 71.5 Dosidicus gigas−67.9 28.0 71.5 Dosidicus gigas−73.1 18.0 28.4 Todarodes pacificus−73.5 21.0 27.0 Todarodes pacificus−73.7 20.0 28.0 Todarodes pacificus−75.4 21.0 27.0 Todarodes pacificus−81.9 18.0 37.0 Gonatopsis borealis
on of
In
The posterior-aspect target strength of five squid was
Benoit-Bird et al.: Target strength of the jumbo squid
measured. Standard deviations of these measurements weresmall but considerably larger than those for the correspond-ing measurements of dorsal-aspect target strength. Animalsin the anterior aspect measurements had relatively more free-dom of movement than animals being measured from thedorsal aspect. We suspect this led to the more variable targetstrengths, both because the animals presented more angles tothe signal but also because they were harder to keep centeredin the beam. A small but significant increase in targetstrength relative to the dorsal aspect of the same individualswas found at 38 kHz. The scattering mechanism for an in-crease in target strength at 38 kHz is unclear.
We found a 2–3 dB decrease in posterior-aspect targetstrength relative to dorsal aspect at 70, 120, and 200 kHz.This compares well with changes of 3–5 dB between dorsaland tail-on measurements at 200 kHz found by Lee et al.�1991� in Loligo edulis. However, they found that the differ-ence in target strength increased with increasing body size.Their study encompassed a total span in mantle length spanof about 12 cm. Despite covering a mantle length range ofmore than 43 cm, we saw no body-size effect on the differ-ences in target strength as a function of orientation.
B. Potential sources of scattering
Many sources of scattering in squid have been proposedincluding the flesh itself, chitinous pen �gladius� and beak,thickened suckers on the arms �Goss et al., 2001�, internalorgans especially the liver and reproductive organs �Iida etal., 1996; Tang and Sato, 2006�, outstretched fins �Lee et al.,1991�, and even their wake �Selivanovsky and Ezersky,1996�. The fins can be ruled out for the results of the currentstudy because the target strengths of a freshly dead squidwere not different from those of live animals of the same sizeand its fins were not outstretched. The wake can be similarlyruled out. Although the liver and reproductive organs havebeen shown to be the most important contributors to acous-tics scattering in squid at much higher frequencies �Iida etal., 1996; Tang and Sato, 2006�, our data do not suggest this.Despite extreme differences in gonadal size between matureand immature individuals of similar body size, and between
TABLE III. Target strengths of a 28 cm mantle length squid calculated fromvarious species as well as predicted and actual measurements from this stud
Source ConditionFrequency
�kHz� Slope Intercept
Arnaya et al., 1989a Dead/preserved 200 24.7 −64.8Kaiiwara et al., 1990 Dead/preserved ? 19.0 −56.8Arnaya et al., 1989a Dead/preserved 200 42.0 −91.5Arnaya et al., 1989a Dead/preserved 50 23.4 −65.0Arnaya et al., 1989a Dead/preserved 50 47.5 −101.9This study Live 38 20.4 −62.8Kawabata, 1999 in situ 38 40.9 −94.2Lee et al., 1992 in situ 420 33.7 −88.5This study Live 120 25.4 −76.8This study Live 200 27.3 −80.5This study Live 70 29.9 −84.4
males and females, we found no significant differences in
J. Acoust. Soc. Am., Vol. 123, No. 3, March 2008
normalized target strength as a function of gender or sexualmaturity, suggesting that the gonads are of limited impor-tance in determining target strength. The effects of the livercould not be investigated in this study.
In order to elucidate the potential contributors to scatter-ing in squid empirically, we measured the target strengths ofvarious parts of several squid immediately after they werestudied alive and then sacrificed. Our results suggest that it isindeed the inanimate parts of the squid, not behavior, thatcauses the backscattering. The results show that both thebody and the head strongly contributed to the scattering at allfrequencies. At 38 and 70 kHz, the body had a target about1 dB less than the entire squid, while at 120 and 200 kHz,the target strength of the body was not different from that ofthe entire squid. Similarly, the head had a target strength1 dB less than the entire squid at 70 and 120 kHz while thetarget strengths of the head versus the entire squid at theother frequencies were not different. These results show thatthe scattering strength of the entire squid is not a simplelinear summation of individual parts but does indicate theparts of the animal that could contribute to the backscatteringprocess.
In order to maintain the integrity of the body, only aneasily accessible and distinctive part of the pen, the cartilag-enous conus, was removed. This had a significant effect onthe backscatter at all except the highest frequency suggestingthat this dense structure may indeed be an important sourceof scattering. Dosidicus also has a highly muscularized bodyso the difference in the acoustic impedance of the muscle andseawater may also be an important source of backscatter. Thedensity difference between muscle and seawater is at least5% and there is a significant difference in sound speed be-tween the muscle and seawater �Arnaya and Sano, 1990�.
Many parts of the head showed some effects on scatter-ing. We removed parts of the head successively—beak first,followed by eyes, then arms so we cannot look at the effectsof each of these parts on the strength of the reflection but wecan examine their potential contribution to the backscatteringprocess. The beak appeared to affect scattering only weakly
published equations describing the target strength length relationship from
in�cm�
MaxML �cm� Species
Predicted TS28 cm
ML �dB�
Actual TS28 cm
ML �dB�
8.0 30.0 Ommastrephes bartrami −29.0? ? Ommastrephes bartrami −29.35.0 35.0 Todarodes pacificus −30.78.0 30.0 Ommastrephes bartrami −31.25.0 35.0 Todarodes pacificus −33.28.0 71.5 Dosidicus gigas −33.3 −32.88.0 24.0 Todarodes pacificus −35.03.0 17.0 Loligo edulis −39.78.0 71.5 Dosidicus gigas −40.0 −38.98.0 71.5 Dosidicus gigas −41.0 −38.78.0 71.5 Dosidicus gigas −41.1 −37.9
they.
MML
1
11121
222
and only at 38 kHz. The additional removal of the arms had
Benoit-Bird et al.: Target strength of the jumbo squid 1325
a stronger effect, also only at 38 kHz. The arms have numer-ous sucker-cups, each of which has a chitinous ring of teeth,instead of simply being thickened flesh like those of Loligoand Martialia �Goss et al., 2001�. These hardened suckerscould thus be an even stronger source of scattering thanoriginally proposed by Goss et al. �2001�. Removal of thelarge eyes of the squid had the strongest effect of any re-moval but only at 120 kHz. Removal of the eyes had noeffect on the target strength at any of the other frequenciesstudied.
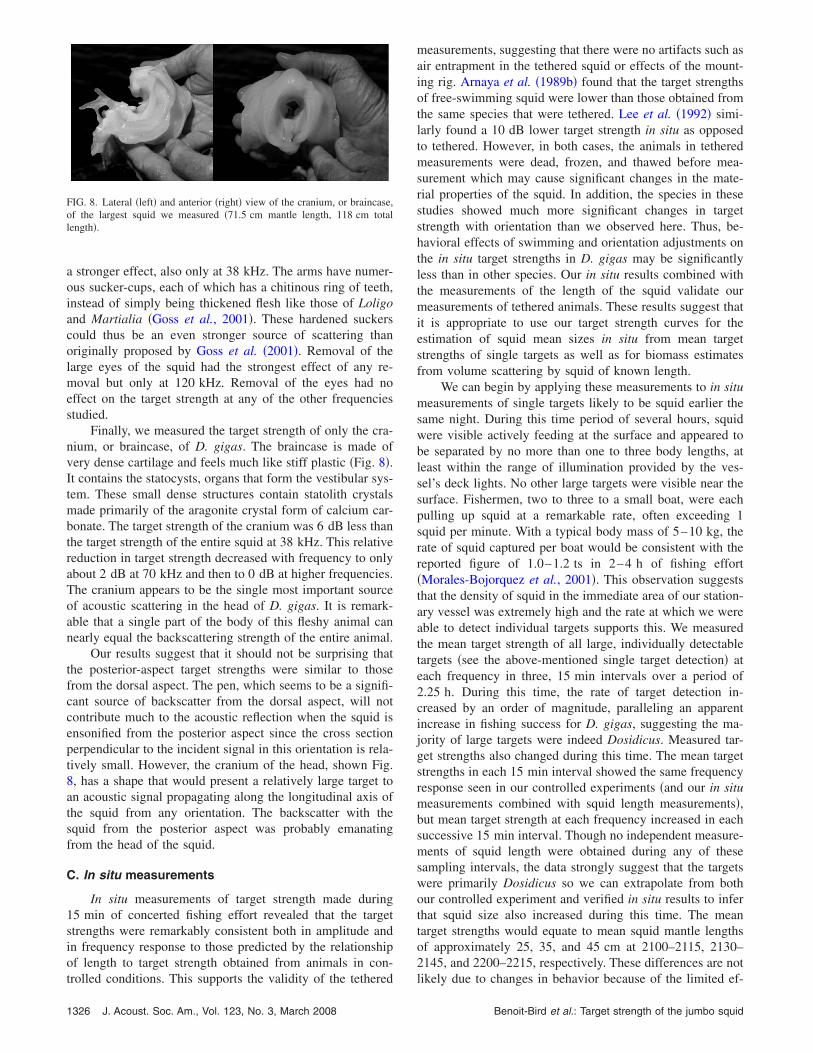
Finally, we measured the target strength of only the cra-nium, or braincase, of D. gigas. The braincase is made ofvery dense cartilage and feels much like stiff plastic �Fig. 8�.It contains the statocysts, organs that form the vestibular sys-tem. These small dense structures contain statolith crystalsmade primarily of the aragonite crystal form of calcium car-bonate. The target strength of the cranium was 6 dB less thanthe target strength of the entire squid at 38 kHz. This relativereduction in target strength decreased with frequency to onlyabout 2 dB at 70 kHz and then to 0 dB at higher frequencies.The cranium appears to be the single most important sourceof acoustic scattering in the head of D. gigas. It is remark-able that a single part of the body of this fleshy animal cannearly equal the backscattering strength of the entire animal.
Our results suggest that it should not be surprising thatthe posterior-aspect target strengths were similar to thosefrom the dorsal aspect. The pen, which seems to be a signifi-cant source of backscatter from the dorsal aspect, will notcontribute much to the acoustic reflection when the squid isensonified from the posterior aspect since the cross sectionperpendicular to the incident signal in this orientation is rela-tively small. However, the cranium of the head, shown Fig.8, has a shape that would present a relatively large target toan acoustic signal propagating along the longitudinal axis ofthe squid from any orientation. The backscatter with thesquid from the posterior aspect was probably emanatingfrom the head of the squid.
C. In situ measurements
In situ measurements of target strength made during15 min of concerted fishing effort revealed that the targetstrengths were remarkably consistent both in amplitude andin frequency response to those predicted by the relationshipof length to target strength obtained from animals in con-
FIG. 8. Lateral �left� and anterior �right� view of the cranium, or braincase,of the largest squid we measured �71.5 cm mantle length, 118 cm totallength�.
trolled conditions. This supports the validity of the tethered
1326 J. Acoust. Soc. Am., Vol. 123, No. 3, March 2008
measurements, suggesting that there were no artifacts such asair entrapment in the tethered squid or effects of the mount-ing rig. Arnaya et al. �1989b� found that the target strengthsof free-swimming squid were lower than those obtained fromthe same species that were tethered. Lee et al. �1992� simi-larly found a 10 dB lower target strength in situ as opposedto tethered. However, in both cases, the animals in tetheredmeasurements were dead, frozen, and thawed before mea-surement which may cause significant changes in the mate-rial properties of the squid. In addition, the species in thesestudies showed much more significant changes in targetstrength with orientation than we observed here. Thus, be-havioral effects of swimming and orientation adjustments onthe in situ target strengths in D. gigas may be significantlyless than in other species. Our in situ results combined withthe measurements of the length of the squid validate ourmeasurements of tethered animals. These results suggest thatit is appropriate to use our target strength curves for theestimation of squid mean sizes in situ from mean targetstrengths of single targets as well as for biomass estimatesfrom volume scattering by squid of known length.
We can begin by applying these measurements to in situmeasurements of single targets likely to be squid earlier thesame night. During this time period of several hours, squidwere visible actively feeding at the surface and appeared tobe separated by no more than one to three body lengths, atleast within the range of illumination provided by the ves-sel’s deck lights. No other large targets were visible near thesurface. Fishermen, two to three to a small boat, were eachpulling up squid at a remarkable rate, often exceeding 1squid per minute. With a typical body mass of 5–10 kg, therate of squid captured per boat would be consistent with thereported figure of 1.0–1.2 ts in 2–4 h of fishing effort�Morales-Bojorquez et al., 2001�. This observation suggeststhat the density of squid in the immediate area of our station-ary vessel was extremely high and the rate at which we wereable to detect individual targets supports this. We measuredthe mean target strength of all large, individually detectabletargets �see the above-mentioned single target detection� ateach frequency in three, 15 min intervals over a period of2.25 h. During this time, the rate of target detection in-creased by an order of magnitude, paralleling an apparentincrease in fishing success for D. gigas, suggesting the ma-jority of large targets were indeed Dosidicus. Measured tar-get strengths also changed during this time. The mean targetstrengths in each 15 min interval showed the same frequencyresponse seen in our controlled experiments �and our in situmeasurements combined with squid length measurements�,but mean target strength at each frequency increased in eachsuccessive 15 min interval. Though no independent measure-ments of squid length were obtained during any of thesesampling intervals, the data strongly suggest that the targetswere primarily Dosidicus so we can extrapolate from bothour controlled experiment and verified in situ results to inferthat squid size also increased during this time. The meantarget strengths would equate to mean squid mantle lengthsof approximately 25, 35, and 45 cm at 2100–2115, 2130–2145, and 2200–2215, respectively. These differences are not
likely due to changes in behavior because of the limited ef-Benoit-Bird et al.: Target strength of the jumbo squid
fects on target strength we observed as a function of orien-tation. However, these differences were accompanied bychanges in aggregation behavior of squid with dense, distinctgroups observed only later in the night. Alternative explana-tions of the limited results include the mixture of other spe-cies. The individual target frequency response and the uni-modal and narrow �e.g., small confidence interval�distribution of target strength do not suggest a large numberof other targets. However, we cannot rule out that the differ-ences in density over time could cause a target strength biasdue to single target detection errors with increasing multipleechoes. Over the sampling period, there were also obviouschanges in swimming tracks of individual squid �see ex-amples in Fig. 7�. This may prove to be the greatest strengthof our ability to observe these squid in situ—the possibilityof observing their behavior in the wild.
V. CONCLUSIONS
This study presents the first target strength measure-ments of Dosidicus gigas, a large squid that is an ecologi-cally significant predator, a key prey resource, and the targetof an economically important fishery. Our results show astrong relationship between squid length and target strengthover a wide range of sizes encompassing all but the largestindividuals of this species. Individual Dosidicus showedlittle variation in target strength at 70 kHz, 120, and 200 kHzbut the target strength at 38 kHz was substantially higher,regardless of squid size �Fig. 5�. We found little change intarget strength when the squid was dorsal versus when it wastilted completely head down. We also found no differencebetween live and freshly dead squid.
The scattering mechanisms in squid have been long de-bated with many possibilities suggested. From our results,we can infer that the reproductive organs, or at least variabil-ity in their size and state, had little effect on squid targetstrength. We empirically tested several hypotheses and foundthat the body and the head are nearly equally importantsources of scattering. Our results support the hypothesis thatthe pen may be an important source of acoustic scattering insquid. We can also support the hypothesis that the beak, eyes,and arms �probably via the sucker rings� play some role inacoustic scattering though their effects were relatively smalland affected scattering only at one of four measured frequen-cies. We found an unexpected source of scattering in thecranium of the squid which provided a target strength nearlyas high as that of the entire squid. Measurements of the ma-terial properties of this structure are not available so themechanism of scattering remains unclear. However, the cra-nium does house the extremely dense statocysts, or balanceorgans, that should be further investigated.
Our in situ measurements of target strength paired withjigged squid samples support the use of the values presentedhere in squid stock assessment studies. The ease of detectionof these squid and their relatively unique frequency responsein target strength suggest acoustic studies of D. gigas arefeasible. With the substantial target strengths measured, de-pending on density, it should be possible to detect individual
squid to the full depth range of most high-frequency scien-J. Acoust. Soc. Am., Vol. 123, No. 3, March 2008
tific echosounders �up to 1000 m for the 38 kHz SimradEK60� and to detect aggregations of squid to those depths aswell. Based on the scattering mechanisms observed in thisand other studies for squid, there is no reason to suspect achange in acoustic properties with this increased depth.Acoustics have been used as an effective sampling methodfor many fish species but only rarely for invertebrates, espe-cially large, commercially exploited species. A fundamentalrequirement for application of acoustics to quantitative as-sessment is knowledge of the target strength distribution ofthe species in question. These results provide that informa-tion.
Even more understanding of the biology of these ani-mals could come from in situ observations of squid in rela-tively shallow water where individual animals can be ob-served and potentially tracked. Individual target tracks areclearly visible in Fig. 7 with many different diving patternsobservable. The results provide an enticing glimpse into thebehavioral dynamics of individual squid and with further in-vestigation, the possibility of understanding the behavior ofpopulations of D. gigas.
ACKNOWLEDGMENTS
We thank Unai Markaida for determinations of sexualmaturity stage. Ashley Booth, Abram Fleishman, Ladd Irv-ine, Dana Shulman, and Chad Waluk provided assistance inthe field. Bonnie Anderson-Becktold, Cyndee Pekar, and Ce-sar Salinas and his students from CIBNOR provided logisti-cal support. Bob Pedro, the captain of the R/V Pacific Storm,and Willi Schlecter, its engineer, provided invaluable assis-tance both in preparation for, and during the cruise. Fundingwas provided by donors to the Oregon State University Ma-rine Mammal Institute. The R/V Pacific Storm was donatedby Scot and Janet Hockema. This work was also supportedby grants from the National Science Foundation �No. OCE0526640� and the David and Lucile Packard Foundation toW.F.G.
Arnaya, I. N., and Sano, N. �1990�. “Studies on acoustic target strength ofsquid V. Effect of swimming on target strength of squid.,” Bull. Fac. Fish.Hokkaido Univ. 41, 18–31.
Arnaya, I. N., Sano, N., and Iida, K. �1989a�. “Studies on acoustic targetstrength of squid. II. Effect of behaviour on averaged dorsal aspect targetstrength,” Bull. Fac. Fish. Hokkaido Univ. 40, 83–99.
Arnaya, I. N., Sano, N., and Iida, K. �1989b�. “Studies on acoustic targetstrength of squid. III. Measurement of the mean target strength of smalllive squid,” Bull. Fac. Fish. Hokkaido Univ. 40, 100–115.
Benoit-Bird, K. J., and Au, W. W. L. �2001�. “Target strength measurementsof animals from the Hawaiian mesopelagic boundary community,” J.Acoust. Soc. Am. 110, 812–819.
Boyle, P., and Rodhouse, P. G. �2005�. “Fishing methods and scientific sam-pling,” in Cephalopods: Ecology and fisheries, edited by P. Boyle, and P.G. Rodhouse �Blackwell, London�, pp. 259–276.
Foote, K. G., Hanlon, R. T., Iampietro, P. J., and Kvitek, R. G. �2006�.“Acoustic detection and quantification of benthic egg beds of the squidLoligo opalescens in Monterey Bay, California,” J. Acoust. Soc. Am. 119,844–856.
Foote, K. G., Vestnes, G., Maclennan, D. N., and Simmonds, E. J. �1987�.“Calibration of acoustic instruments for fish density information: A prac-tical guide,” in International Council for the Exploration of the Sea Coop-erative Research Report No. 144, Copenhagen, Denmark.
Fristrup, K. M., and Harbison, G. R. �2002�. “How do sperm whales catchsquids?,” Marine Mammal Sci. 18, 42–54.
Gilly, W. F., Markaida, U., Baxter, C. H., Block, B. A., Boustany, A.,
Benoit-Bird et al.: Target strength of the jumbo squid 1327
Zeidberg, L., Reisenbichler, K., Robison, B., Bazzino, G., and Salinas, C.�2006�. “Vertical and horizontal migrations by the jumbo squid Dosidicusgigas revealed by electronic tagging,” Mar. Ecol.: Prog. Ser. 324, 1–17.
Goss, C., Middleton, D., and Rodhouse, P. G. �2001�. “Investigations ofsquid stocks using acoustic survey methods,” Fish. Res. 54, 111–121.
Iida, K., Mukai, T., and Hwang, D. �1996�. “Relationship between acousticbackscattering strength and density of zooplankton in the sound scatteringlayer,” ICES J. Mar. Sci. 53, 507–512.
Jefferts, K., Burczynski, J., and Pearcy, W. G. �1987�. “Acoustical assess-ment of squid �Loligo opalecens� off the central Oregon coast,” Can. J.Fish. Aquat. Sci. 44, 1261–1267.
Kang, D., Mukai, T., Iida, K., Hwang, DJ., and Myoung, JG. �2005�. “Theinfluence of tilt angle on the acoustic target strength of the Japanese com-mon squid,” ICES J. Mar. Sci. 62, 779–789.
Kawabata, A. �1999�. “Measurement of the target strength of the Japaneseflying squid, Todarodes pacificus Steenstrup,” Bull. Tohoku Nat. Fish.Res. Inst. 61, 29–40.
Kawabata, A. �2001�. “Measurement of the target strength of live squid,Todarodes pacificus Steenstrup, in controlled body tilt angle,” Bull. To-hoku Natl. Fish. Res. Inst. 64, 61–67.
Kawabata, A. �2005�. “Target strength measurements of suspended live om-mastrephid squid, Todarodes pacificus, and its application in density esti-mations,” Fish. Sci. 71, 63–72.
Lee, K. T., Liao, C. H., Shih, W. H., and Chyn, S. S. �1992�. “Application ofdual-beam acoustic survey techniques to assess the size distribution ofsquid, Loligo edulis,” J. Fish. Soc. Taiwan 19, 25–34.
Lee, K. T., Shih, W. H., Liao, C. H., and Wang, J. P. �1991�. “Studies on thehydroacoustic scattering properties of individual squid, Loligo edulis,” J.Fish. Soc. Taiwan 18, 215–225.
Lipinski, M. R., and Prowse, M. �2002�. “Direct hydroacoustic observationsof chokka squid Loligo vulgaris reynaudii spawning activity in deep wa-ter,” S. Afr. J. Mar. Sci. 24, 387–393.
Lipinski, M. R., and Underhill, L. �1995�. “Sexual maturation in squid:Quantum or continuum?,” S. Afr. J. Mar. Sci. 15, 207–223.
Markaida, U., and Sosa-Nishizaki, O. �2001�. “Reproductive biology ofjumbo squid Dosidicus gigas in the Gulf of California, 1995–1997,” Fish.Res. 54, 63–82.
Markaida, U., and Sosa-Nishizaki, O. �2003�. “Food and feeding habits ofjumbo squid Dosidicus gigas �Cephalopoda: Ommastrephidae� from the
1328 J. Acoust. Soc. Am., Vol. 123, No. 3, March 2008
Gulf of California, Mexico,” J. Mar. Biol. Assoc. U.K. 83, 507–522.McClatchie, S., Macaulay, G., and Coombs, R. F. �2003�. “A requiem for the
use of 20logLength for acoustic target strength with special reference todeep-sea fishes,” ICES J. Mar. Sci. 60, 419–428.
Misund, O. A. �1997�. “Underwater acoustics in marine fisheries and fish-eries research,” Rev. Fish Biol. Fish. 7, 1–34.
Morales-Bojorquez, E., Cisneros-Mata, M. A., Nevarez-Martinez, M. O.,and Hernandez-Herrera, A. �2001�. “Review of the stock assessment andfishery biology of Dosidicus gigas in the Gulf of California, Mexico,”Fish. Res. 54, 83–94.
Nevarez-Martinez, M. O., Mendez-Tenoria, F. J., Cervantes-Valle, C.,Lopez-Martinez, J., and Anguiano-Carrasco, M. L. �2006�. “Growth, mor-tality, recruitment, and yield of the jumbo squid �Dosidicus gigas� offGuaymas, Mexico,” Fish. Res. 79, 38–47.
Nigmatullin, C. M., Nesis, K. N., and Arkhipkin, A. I. �2001�. “A review ofthe biology of the jumbo squid Dosidicus gigas �Cephalopoda: Ommas-trephidae�,” Fish. Res. 54, 9–19.
Sanchez-Juarez, E. �1991�. “Preliminary estimate of the size of the adultpopulation and spawning biomass of jumbo squid Dosidicus gigas in theExclusive Economic zone of the Mexican Pacific,” �Spanish Translation“Estimacion preliminar del tamano de la poblacion adulta e biomasa re-productora de calamar gigante Dosidicus gigas en la Zona EconomicaExclusiva del Pacifico Mexicano, en diciembre de, 1990�, Secretaria dePesca, Instituto Nacional de la Pesca, Informe Tecnico, CRIP, El Sauzal.B.C., Mexico, pp. 1–13.
Sawada, K., Furusawa, M., and Williamson, N. J. �1993�. “Conditions forthe precise measurement of fish target strength in situ,” Fish. Sci. 20,15–21.
Sawada, K., Takahashi, H., Abe, K., and Takao, Y. �2006�. “In situ measure-ment of target strength, tilt angle, and swimming speed of Boreopacificgonate squid �Gonatopsis borealis�,” J. Acoust. Soc. Am. 120, 3107.
Selivanovsky, D., and Ezersky, A. �1996�. “Sound scattering by hydrody-namic wakes of sea animals,” ICES J. Mar. Sci. 53, 377–381.
Shchetinnikov, A. S. �1988�. “Feeding and food relations of abundant squidsin southeastern part of the Pacific Ocean,” Autoreferat Dissertatsii naSoiskani Uchenoj Stepeni Kandidata Biologicheskikh �Nauka, Moscow�.
Tang, Y., and Sato, M. �2006�. “Acoustical imaging of nonbladdered animals
using underwater acoustic camera,” J. Acoust. Soc. Am. 120, 3058.Benoit-Bird et al.: Target strength of the jumbo squid
Copyright © 2022 FDOKUMEN