Control of noise and exhaust emissions from dual fuel engines
26
Control of noise and exhaust emissions from dual fuel engines Salah B. Al-Omari, Mohamed Y. E. Selim, a) and A. A. J. Al-Aseery Mechanical Engineering Department, UAE University, Al-Ain, United Arab Emirates (Received 19 October 2010; accepted 29 April 2011; published online 12 July 2011) An experimental investigation has been carried out to examine the effects of adding water vapor to the intake air of a dual fuel engine on the performance, combustion noise, and emission of CO, HC gases, and smoke opacity. Dual fuel engine is a diesel engine using a small amount (5%) of liquid diesel fuel as a pilot fuel and burns a liquefied petroleum gas as the main fuel. The addition of water vapor to the combustion chamber of a diesel engine has known effects on reducing the dangerous emission of nitrogen oxides. Yet it is not currently clear for the dual fuel engine how much the sacrifice is of engine performance, noise, and other exhaust emissions. Experimental procedures conducted using a Ricardo diesel version variable compression research engine are discussed. Results from testing dual fuel engine with varying the added water vapor to fuel ratios and other design and operating parameters are presented and discussed. The addition of water vapor to the intake air affected the performance, combustion noise, and exhaust emissions. V C 2011 American Institute of Physics. [doi:10.1063/1.3596170] I. INTRODUCTION The use of gaseous fuels, e.g., natural gas, liquefied petroleum gas (LPG), etc. is a promis- ing approach for lowering the dependence on petroleum liquid fuels and to reduce the emis- sions of CO 2 and other pollutants from the diesel engines. For countries having gaseous fuels resources, it is advantageous to utilize gaseous fuels in diesel engines. The advantages of using gaseous fuels in such engines stem from the economical and environmental benefits. Economi- cal benefits are to reduce the dependence on liquid fuels and utilizing alternative gaseous fuels. Environmental benefits include the reduction of CO 2 green house gas, the hydrocarbons, partic- ulate matter, and diesel odor. However, the NO x emission is still very high and needs to be reduced if such engines are to be commercialized. There have been many published works on the use of gaseous fuels in dual fuel engines. Natural gas use in dual fuel engines has been studied from the combustion duration and ignition delay point of view as indicated in Ref. 1 and from performance and emissions point of view as presented in Ref. 2. Combustion, thermal loading and temperature distribution have also been studied for dual fuel engines. 3 Pure methane has also been studied in dual fuel engines from flame spread limits point of view 4 and performance and emissions point of view. 5 LPG has been studied from the point of view of performance and emissions. 5 There have been many methods to control the air pollution problem from diesel engines. The use of exhaust gas recirculation (EGR), adding water to the combustion chamber with any method (in form of liquid or vapor) and adjusting the engine design parameters helped to reduce the problem of NO x . It has been concluded from diesel engines combustion 6,7 that the addition of properly mixed water (or water vapor) in the combustion chamber effectively reduces the NO x emission; however, there was no measurements of ignition delay period of diesel combustion that may lead to increased noise level from such engines. a) Author to whom correspondence should be addressed. Electronic mail: [email protected]. 1941-7012/2011/3(4)/043103/26/$30.00 V C 2011 American Institute of Physics 3, 043103-1 JOURNAL OF RENEWABLE SUSTAINABLE ENERGY 3, 043103 (2011) Downloaded 23 Jul 2011 to 195.229.235.46. Redistribution subject to AIP license or copyright; see http://jrse.aip.org/about/rights_and_permissions
Transcript of Control of noise and exhaust emissions from dual fuel engines
Control of noise and exhaust emissions from dualfuel engines
Salah B. Al-Omari, Mohamed Y. E. Selim,a) and A. A. J. Al-AseeryMechanical Engineering Department, UAE University, Al-Ain, United Arab Emirates
(Received 19 October 2010; accepted 29 April 2011; published online 12 July 2011)
An experimental investigation has been carried out to examine the effects of
adding water vapor to the intake air of a dual fuel engine on the performance,
combustion noise, and emission of CO, HC gases, and smoke opacity. Dual fuel
engine is a diesel engine using a small amount (5%) of liquid diesel fuel as a pilot
fuel and burns a liquefied petroleum gas as the main fuel. The addition of water
vapor to the combustion chamber of a diesel engine has known effects on reducing
the dangerous emission of nitrogen oxides. Yet it is not currently clear for the dual
fuel engine how much the sacrifice is of engine performance, noise, and other
exhaust emissions. Experimental procedures conducted using a Ricardo diesel
version variable compression research engine are discussed. Results from testing
dual fuel engine with varying the added water vapor to fuel ratios and other design
and operating parameters are presented and discussed. The addition of water vapor
to the intake air affected the performance, combustion noise, and exhaust
emissions. VC 2011 American Institute of Physics. [doi:10.1063/1.3596170]
I. INTRODUCTION
The use of gaseous fuels, e.g., natural gas, liquefied petroleum gas (LPG), etc. is a promis-
ing approach for lowering the dependence on petroleum liquid fuels and to reduce the emis-
sions of CO2 and other pollutants from the diesel engines. For countries having gaseous fuels
resources, it is advantageous to utilize gaseous fuels in diesel engines. The advantages of using
gaseous fuels in such engines stem from the economical and environmental benefits. Economi-
cal benefits are to reduce the dependence on liquid fuels and utilizing alternative gaseous fuels.
Environmental benefits include the reduction of CO2 green house gas, the hydrocarbons, partic-
ulate matter, and diesel odor. However, the NOx emission is still very high and needs to be
reduced if such engines are to be commercialized.
There have been many published works on the use of gaseous fuels in dual fuel engines.
Natural gas use in dual fuel engines has been studied from the combustion duration and ignition
delay point of view as indicated in Ref. 1 and from performance and emissions point of view
as presented in Ref. 2. Combustion, thermal loading and temperature distribution have also
been studied for dual fuel engines.3 Pure methane has also been studied in dual fuel engines
from flame spread limits point of view4 and performance and emissions point of view.5 LPG
has been studied from the point of view of performance and emissions.5
There have been many methods to control the air pollution problem from diesel engines.
The use of exhaust gas recirculation (EGR), adding water to the combustion chamber with any
method (in form of liquid or vapor) and adjusting the engine design parameters helped to
reduce the problem of NOx.
It has been concluded from diesel engines combustion6,7 that the addition of properly
mixed water (or water vapor) in the combustion chamber effectively reduces the NOx emission;
however, there was no measurements of ignition delay period of diesel combustion that may
lead to increased noise level from such engines.
a)Author to whom correspondence should be addressed. Electronic mail: [email protected].
1941-7012/2011/3(4)/043103/26/$30.00 VC 2011 American Institute of Physics3, 043103-1
JOURNAL OF RENEWABLE SUSTAINABLE ENERGY 3, 043103 (2011)
Downloaded 23 Jul 2011 to 195.229.235.46. Redistribution subject to AIP license or copyright; see http://jrse.aip.org/about/rights_and_permissions
Four major approaches for introducing water into the combustion zone have been reported.
These include fumigating the water into the engine intake air, direct injection into the engine
through separate injectors, in-line mixing of water and fuel prior to injection (unstabilized emul-
sion), and mixtures of stabilized emulsions treatable as a single-phase drop-in replacement fuel.
The Urbach et al.8 demonstrated that water mist injection into the bell housing of diesel-
fueled turbine engines can lead to promising results. Water mist introduced to the intake of
reciprocating compression ignition engines, particularly two-stroke engines with the intake air
passing through the crankcase, poses significant corrosion potential. Separate water injecting
valves in the engine avoids intake system contact with the mist.9 Several works have evaluated
all or most of the options for introducing water into the combustion process and have primarily
determined that water-in-fuel emulsions, stabilized or unstabilized, are most effective in reduc-
ing NOx, brake specific fuel consumption (BSFC), and result in lower increases of CO and
unburned hydrocarbon (UHC) emissions.10
An emulsion is defined as a mixture of two or more generally insoluble liquids. A permanent
emulsion exists when sufficient droplet sizes have been reached to prevent the separation of the in-
soluble materials. Unstabilized emulsions are generated through the high-speed, high-shearing of
particles, and solids in a liquid. A limiting concern with emulsions is the high capital costs of emul-
sification mixers and pumps, which are used extensively in the food and agriculture industries.
Unstabilized emulsions require high shear to suspend small droplets of water in the fuel.11
An advantage of unstabilized emulsions are reduced fuel costs, due to lack of additives needed,
and reduced emissions from not combusting surfactants or other emulsifying agents12 propose a
complex fueling system including a vortex chamber to provide in-line mixing of water and die-
sel fuel without requiring the addition of an emulsifying agent.
Stabilized emulsions use an emulsifying agent to suspend the water in the fuel and reduce
the energy required for a permanent emulsion.13 Authors of Ref. 13 used a surfactant to create
a permanent, stabilized emulsion that can be treated as a single-phase fuel. A drawback to
water-fuel emulsions is the amount of air bubbles reportedly contained in the emulsion mixture.
They evaluated the effect of water-fuel emulsions on diesel engine performance and emissions
under transient conditions. It has been concluded that air bubbles in the fuel and its variability
contribute to fluctuation in the injection timing and a poorer performance under transient condi-
tions. They13 recommend the removal of bubbles from the water-fuel emulsion.
Research has also been conducted extensively on the use of additives to improve the lubri-
cation, to reduce the corrosive effect of water in the fuel, and to improve the emulsion stability.
Nitrate-containing ignition improvers are recommended to reduce exhaust emissions.14 Lubricity
additives composed of dimer or trimer acides, phosphate esters, and sulfurized castor oils are
recommended by Ref. 15 and catalysts can also be used in situ in the fuel to reduce NOx.15 In
addition to providing lubrication improvement, additives to water–fuel emulsions can be
employed for antifreeze characteristics16 obviously important when significant volume percents
of water are present in a fueling system in freezing climates. The Montagne et al.17 demon-
strated that the surfactants added to diesel fuels can clean up fuel injectors as well as prevent
further injector deposits. They also reported a slight increase in NOx from the combustion of
the surfactants, as the case without adding water to the fuel.
Crookes et al.18 attributed the improved combustion and the reduction in particulate and NOx
emissions to the secondary atomization of the water, often designated as micro-explosions. Micro-
explosions of emulsified fuels has been also extensively examined by Ref. 19 and determined that
there is a minimum percent water content in the emulsion required for micro-explosions to occur,
and that the percent increases with the kinematic viscosity of the fuel. There has been an improve-
ment in brake thermal efficiency of engines that use diesel-water emulsion reported.20
It has been shown above that the NOx and noise can be reduced from diesel engines that
uses single fuel; however, there was no attempt to reduce such problems from dual fuel
engines.21 Dual fuel engine is the diesel engine that uses diesel fuel as a pilot fuel but the main
fuel is normally compressed the natural gas or liquefied petroleum gas.
Therefore, it is the main objective of the present work to examine the effects of adding
water vapor to the intake air of a dual fuel engine on the performance, combustion noise, and
043103-2 Al-Omari, Selim, and Al-Aseery J. Renewable Sustainable Energy 3, 043103 (2011)
Downloaded 23 Jul 2011 to 195.229.235.46. Redistribution subject to AIP license or copyright; see http://jrse.aip.org/about/rights_and_permissions
exhaust emissions of a dual fuel engine running on diesel—LPG. The water has been added in
the present work to the intake air of the engine in the form of vaporized water produced by a
special test rig explained in Sec. II.
II. EXPERIMENTAL TEST RIG AND PROCEDURE
The research engine used in the present study is the research engine Ricardo E6 single cyl-
inder variable compression indirect injection (IDI) diesel engine. Full details of the engine are
given in Table I.
Measurements of gaseous flow rate has been carried out by a Platon Gapmeter type rotame-
ter, while the exhaust gas analysis has been carried out by Heshbon HG520 as analyzer and the
smoke in the exhaust gases has been measured by a Shady X2000 Opacimetro smoke meter.
A. Measurement of combustion pressure and crank angle
A data acquisition system is used to collect the cylinder combustion pressure and crank angle
data. The pressure signal is collected by a high pressure water cooled piezo-electric pressure
transducer made by AVL and its output is fed into a charge amplifier then to a data acquisition
card linked to the personal computer. The crank angle signal is fed into a degree marker shaper
channel and the output is fed into the acquisition card. The acquisition card could collect data at
the rate of 250 kHz. A LabView program has been written to collect the data from the two chan-
nels at a sampling rate of 10 000 points per second and store the pressure and crank angle data
in the computer disk for offline analysis. A computer program is written in MS Excel to find the
maximum combustion pressure and the pressure rise rate data at all cycle points from mid com-
pression stroke to mid expansion stroke. The maximum value of pressure rise rate is then
obtained and recorded. This value will be used to represent the noise level at that operating con-
dition. Experiments have been carried out after running the engine for some time until it reaches
steady state, and oil temperature is at 60 oC 6 5 and cooling water temperature is at 70 oC 6 5.
The addition of water vapor in the intake of the engine has been carried out by vaporizing
liquid water from a water tank that contains three electric heaters (of 2, 2 and 1 kW, respec-
tively). When the amount of water vapor is required to increase, another heater is turned on
and more vapor is generated. The dry bulb and wet bulb temperatures of the intake air have
been measured to get the amount of water vapor added in the form of the air specific humidity.
The variation of specific humidity is accomplished by injecting more water vapor at atmos-
pheric pressure in the intake stream. Saturated water vapor at 1 atm with an enthalpy of
2675 kJ/kg has been generated in the hot water tank. Injecting this vapor in the intake air is
approximated by an adiabatic humidification process in which the steam is injected without
extra heating. Psychrometric chart analysis shows that the process is almost vertical line (fol-
lowing hw¼ 2675 kJ/kg) until air is fully saturated (relative humidity of 100%). So three cases
were considered here: firstly atmospheric condition of 27 �C dry bulb temperature and 27% rel-
ative humidity (specific humidity of 6 g w/kg air), secondly saturated air with 28 �C dry bulb
temperature and 100% relative humidity (specific humidity of 24 g w/kg air). Thirdly a midway
point of about 27.5 �C and 61% relative humidity has been also used (gives specfic humidity of
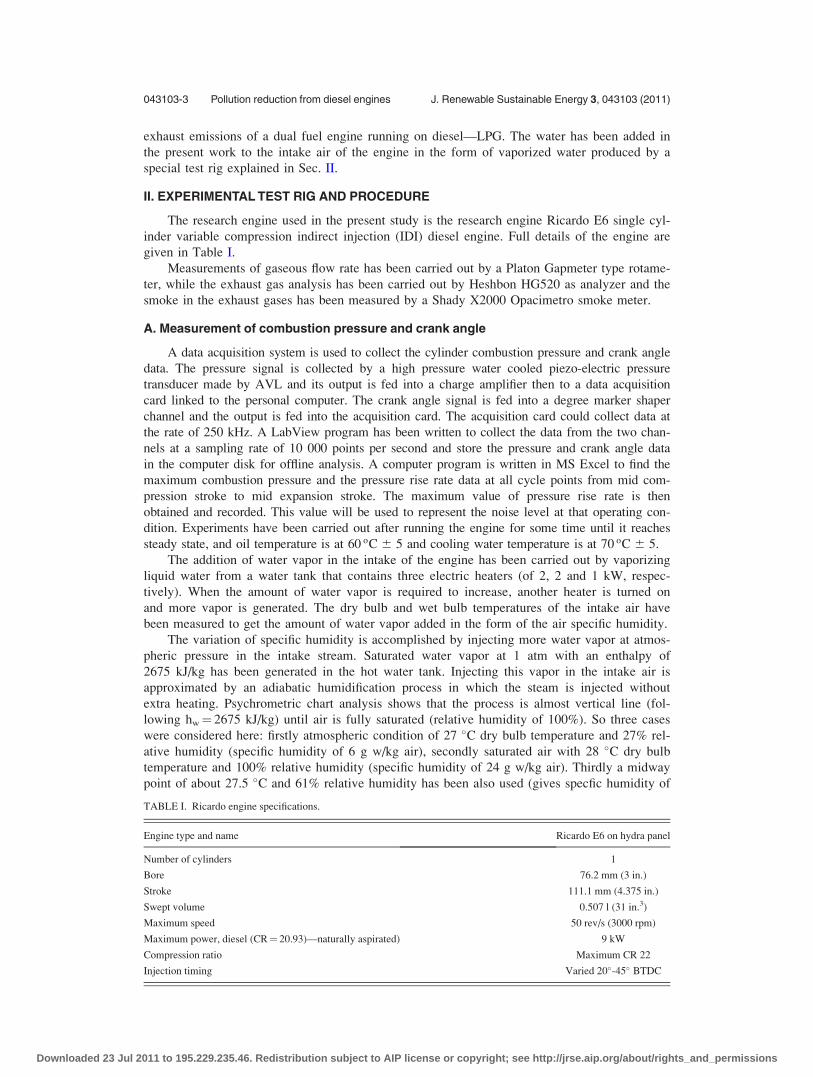
TABLE I. Ricardo engine specifications.
Engine type and name Ricardo E6 on hydra panel
Number of cylinders 1
Bore 76.2 mm (3 in.)
Stroke 111.1 mm (4.375 in.)
Swept volume 0.507 l (31 in.3)
Maximum speed 50 rev/s (3000 rpm)
Maximum power, diesel (CR¼ 20.93)—naturally aspirated) 9 kW
Compression ratio Maximum CR 22
Injection timing Varied 20�-45� BTDC
043103-3 Pollution reduction from diesel engines J. Renewable Sustainable Energy 3, 043103 (2011)
Downloaded 23 Jul 2011 to 195.229.235.46. Redistribution subject to AIP license or copyright; see http://jrse.aip.org/about/rights_and_permissions

14 g w/kg air). Enthalpy of intake air has been increased from 43 kJ/kg at first point, increased
to 64 kJ/kg at mid-point, and 89 kJ/kg at final point. Although the enthalpy of intake air is
increased, but it is expected that, as water vapor mass is increased, during the compression
stroke and as the pressure is increased, more water droplets may be formed. Hence, the liquid
water available in the compressed air will absorb some heat from air resulting in a reduction in
the final compression temperature. Another possibility of reducing the final compression tem-
perature for the air-vapor mixture is the increased specific heats for the water vapor, which
leads to increased specific heats of the air-vapor mixture. This eventually leads to a drop in the
maximum combustion temperature.
B. Experimental procedure
Table II illustrates the operation and design parameters changed during the experiments
and the associated level.
It may be worth mentioning that the air to fuel ratio will be changed when the mass of liq-
uid pilot fuel or gaseous fuel change. The inlet conditions of the engine air were atmospheric
pressure and temperature (1 atm and 27 �C, respectively). The test conditions will be illustrated
with each data figure given below. The vapor conditions have been varied as mentioned above
to achieve the three levels of specific humidity. The range of water/fuel ratio was from 12% to
48%, which was calculated from the equation
m�wm�fuel
¼ m�wm�air
� m�air
m�fuel
The common values of the experimental parameters were as follows: engine speed¼ 20 rps,
injection timing (IT)¼ 35� before top dead center (BTDC), and compression ratio (CR)¼ 22.
C. Uncertainties in some important parameters
The uncertainties calculated in Table III are based on the maximum scattering percentage
around a mean reading (for example, a typical mean reading of the fuel pressure drop across
the orifice meter is 50 mV (this is the reading on the digital pressure meter). It is found that
the reading fluctuates between 46 and 55 mV, so the maximum scatter is 6 4.5 mV from which
we can find the maximum scattering percentage of 9%.
A test of the experimental scattering has been carried out for the torque, maximum pres-
sure, and maximum pressure rise rate in which the same experiment to measure them was
repeated three times in three different days. It was noticed that the repeatability of the experi-
mental results was acceptable and the maximum uncertainties were as given in Table III.
III. RESULTS AND DISCUSSION
A. Effect of water vapor addition on engine performance
Figure 1 shows the experimental results of the brake power output of the engine as a func-
tion of the engine speed and water addition. The compression ratio is kept constant at 22, and
TABLE II. Experimental parameters and associated level.
Engine parameter Level of change Units
Air specific humidity 6, 14, and 24 gm water/kg air
Engine speed 18–30 rev/s
Pilot diesel fuel mass injected 0.14–0.72 kg/h
Engine injection timing for the pilot fuel 20–45 degrees BTDC
Engine compression ratio 14–22 —
Mass of gaseous fuel 1–4.5 kg/h
043103-4 Al-Omari, Selim, and Al-Aseery J. Renewable Sustainable Energy 3, 043103 (2011)
Downloaded 23 Jul 2011 to 195.229.235.46. Redistribution subject to AIP license or copyright; see http://jrse.aip.org/about/rights_and_permissions
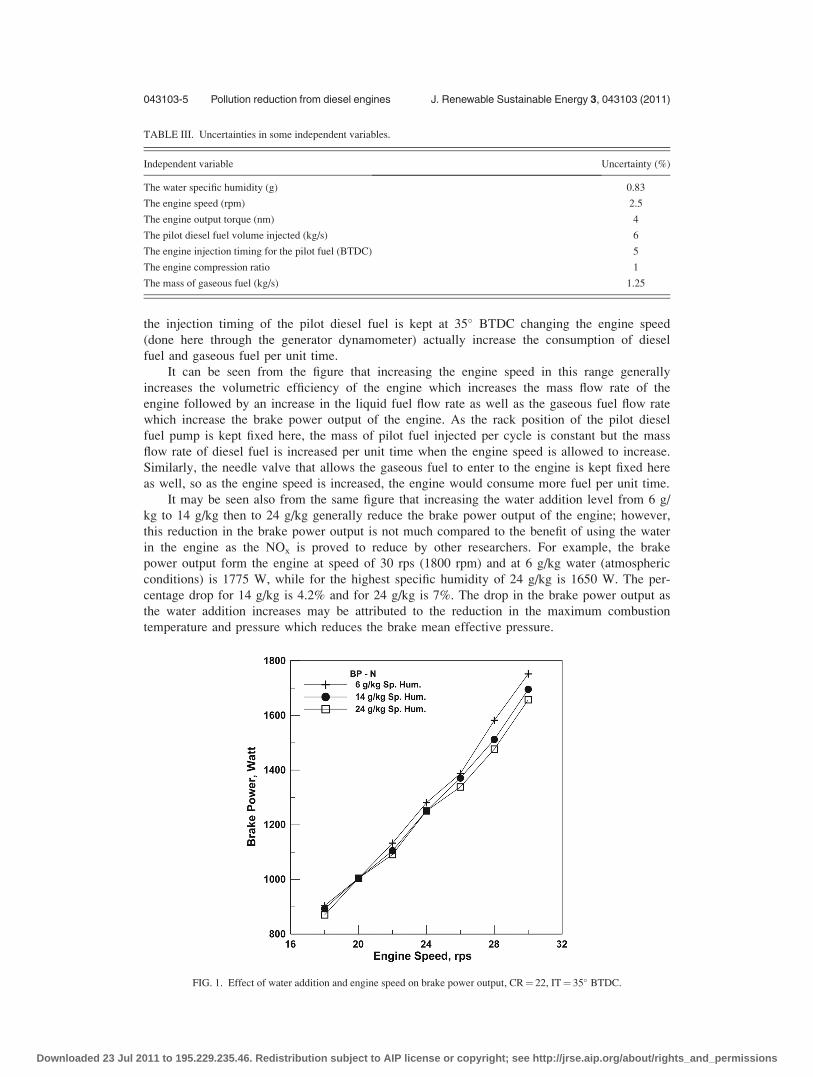
the injection timing of the pilot diesel fuel is kept at 35� BTDC changing the engine speed
(done here through the generator dynamometer) actually increase the consumption of diesel
fuel and gaseous fuel per unit time.
It can be seen from the figure that increasing the engine speed in this range generally
increases the volumetric efficiency of the engine which increases the mass flow rate of the
engine followed by an increase in the liquid fuel flow rate as well as the gaseous fuel flow rate
which increase the brake power output of the engine. As the rack position of the pilot diesel
fuel pump is kept fixed here, the mass of pilot fuel injected per cycle is constant but the mass
flow rate of diesel fuel is increased per unit time when the engine speed is allowed to increase.
Similarly, the needle valve that allows the gaseous fuel to enter to the engine is kept fixed here
as well, so as the engine speed is increased, the engine would consume more fuel per unit time.
It may be seen also from the same figure that increasing the water addition level from 6 g/
kg to 14 g/kg then to 24 g/kg generally reduce the brake power output of the engine; however,
this reduction in the brake power output is not much compared to the benefit of using the water
in the engine as the NOx is proved to reduce by other researchers. For example, the brake
power output form the engine at speed of 30 rps (1800 rpm) and at 6 g/kg water (atmospheric
conditions) is 1775 W, while for the highest specific humidity of 24 g/kg is 1650 W. The per-
centage drop for 14 g/kg is 4.2% and for 24 g/kg is 7%. The drop in the brake power output as
the water addition increases may be attributed to the reduction in the maximum combustion
temperature and pressure which reduces the brake mean effective pressure.
TABLE III. Uncertainties in some independent variables.
Independent variable Uncertainty (%)
The water specific humidity (g) 0.83
The engine speed (rpm) 2.5
The engine output torque (nm) 4
The pilot diesel fuel volume injected (kg/s) 6
The engine injection timing for the pilot fuel (BTDC) 5
The engine compression ratio 1
The mass of gaseous fuel (kg/s) 1.25
FIG. 1. Effect of water addition and engine speed on brake power output, CR¼ 22, IT¼ 35� BTDC.
043103-5 Pollution reduction from diesel engines J. Renewable Sustainable Energy 3, 043103 (2011)
Downloaded 23 Jul 2011 to 195.229.235.46. Redistribution subject to AIP license or copyright; see http://jrse.aip.org/about/rights_and_permissions

Figure 2 shows the effect of the mass of pilot fuel injected on the brake power output for
the different levels of water addition. The following parameters are kept constant: CR¼ 22,
IT¼ 35� BTDC, and mgas¼ 4 kg/h while the mass of pilot fuel is increased. It may be seen
from the figure that increasing the mass of pilot fuel generally increases the brake power output
of the engine for all ratios of water level. This increase is due to the increase of the mass pilot
fuel per unit time which increases the heat released from the injected fuel. However, any
increase in the water addition ratio causes a drop in the brake power output and this drop is
also expected as the mean effective pressure is reduced fuel to the drop in the maximum com-
bustion temperature and pressure. However, it may be seen that the drop in the brake power
output is less for small amounts of pilot fuel and bigger for higher amounts of pilot fuel. It
may be mentioned here that the dual fuel engine generally uses small amount of pilot fuel
which means the drop in the brake power output will be very small and there is no need to go
to higher amount of pilot fuel.
Figure 3 shows the effect of water addition and injection timing on brake power output.
The following parameters are kept constant: CR¼ 22, N¼ 20 rps, mgas¼ 4 kg/h, and mdiesel
¼ 0.28 kg/h while the injection timing for pilot diesel fuel is varied. It may be seen from the
figure that increasing the injection timing advance from 20� to 45� before top dead center gen-
erally reduces the brake power output. Increasing the injection advance causes the combustion
to start earlier, which leads to an increase in the combustion temperature and pressure. From
the pressure–time history, it has been shown that this increase occurs in the compression stroke
which decreases the maximum pressure during the expansion stroke and hence decreases the
mean effective pressure and reduces the net work of the engine and the brake power output. It
may be also seen from the figure that the water addition decreases the brake power output
slightly.
Figure 4 shows the effect of compression ratio and water addition on brake power output
of the dual fuel engine. The following parameters are kept constant: N¼ 20 rps, mgas¼ 4 kg/h,
and mdiesel¼ 0.28 kg/h while the compression ratio is varied. The maximum compression ratio
of 21.07 has been extended to 22 to test the highest possible compression ratios and this
occurred by the extension in the calibration scale of the engine. It can be noticed from the fig-
ure that the increase in the compression ratio from 14 up to 22 generally increases the brake
power output of the engine. Increasing the compression ratio of the engine increases the thermal
efficiency of the ideal cycle which in turn increases the brake power output of the engine.
FIG. 2. Effect of water addition and mass of pilot fuel on brake power output, CR¼ 22, IT¼ 35� BTDC, mgas¼ 4 kg/h.
043103-6 Al-Omari, Selim, and Al-Aseery J. Renewable Sustainable Energy 3, 043103 (2011)
Downloaded 23 Jul 2011 to 195.229.235.46. Redistribution subject to AIP license or copyright; see http://jrse.aip.org/about/rights_and_permissions

It may be noticed that the water addition decreases the brake power output of the engine at
most of the compression ratios except for compression ratio 22. It may be noticed also that for
compression ratio of 22, the brake power output is slightly decreased. This may be due to the
fact of running the dual fuel engine at a high compression ratio of 22 and because of the engine
knocking which tends to reduce the brake power output. It is not recommended, therefore, that
the dual fuel engine uses compression ratio of 22—to avoid the engine knocking. The use of
slightly lower compression ratios, e.g., 20 or 21 would produce a higher brake power output,
and even in the case of using high amount of water in the admitted air (24 g/kg), the engine
FIG. 4. Effect of water addition and compression ratio on brake power output, N¼ 20 rps, mgas¼ 4 kg/h, mdiesel¼ 0.28 kg/h.
FIG. 3. Effect of water addition and injection timing on brake power out, CR¼ 22, N¼ 20 rps, mgas¼ 4 kg/h, mdiesel¼ 0.28 kg/h.
043103-7 Pollution reduction from diesel engines J. Renewable Sustainable Energy 3, 043103 (2011)
Downloaded 23 Jul 2011 to 195.229.235.46. Redistribution subject to AIP license or copyright; see http://jrse.aip.org/about/rights_and_permissions
would give the same power as of compression ratio of 22. This is favorable in addition also to
the knocking-free run of the dual fuel engine.
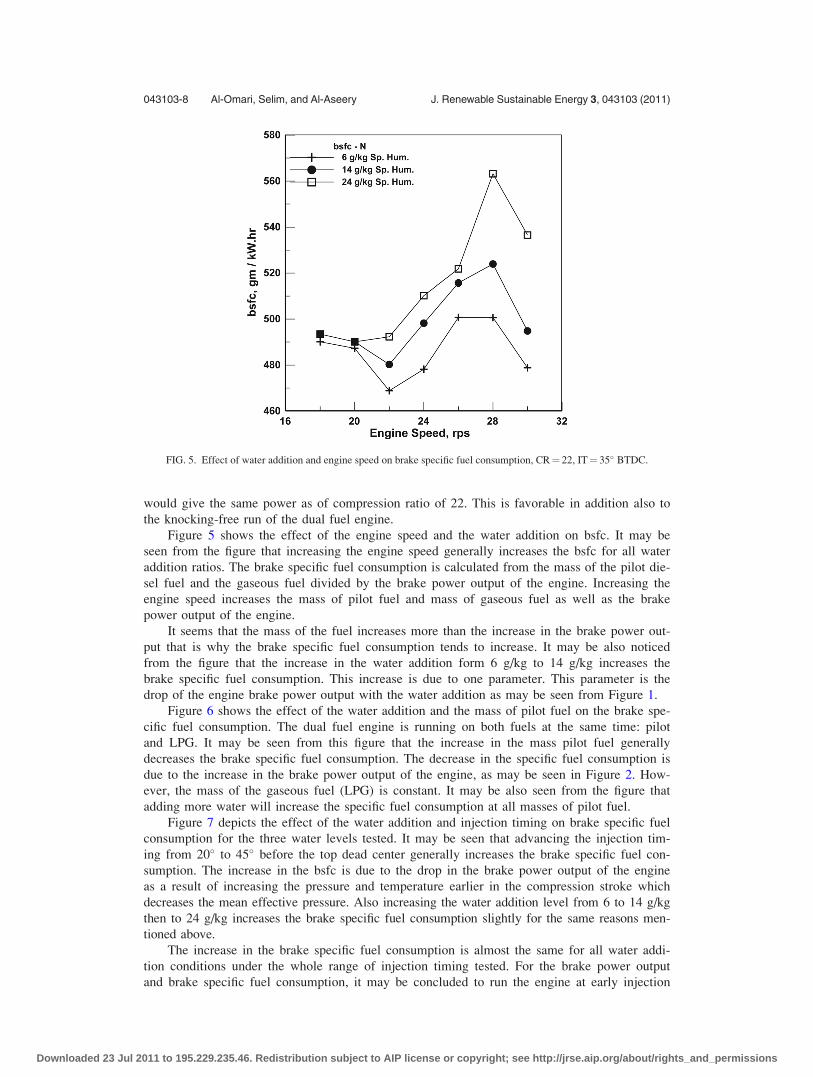
Figure 5 shows the effect of the engine speed and the water addition on bsfc. It may be
seen from the figure that increasing the engine speed generally increases the bsfc for all water
addition ratios. The brake specific fuel consumption is calculated from the mass of the pilot die-
sel fuel and the gaseous fuel divided by the brake power output of the engine. Increasing the
engine speed increases the mass of pilot fuel and mass of gaseous fuel as well as the brake
power output of the engine.
It seems that the mass of the fuel increases more than the increase in the brake power out-
put that is why the brake specific fuel consumption tends to increase. It may be also noticed
from the figure that the increase in the water addition form 6 g/kg to 14 g/kg increases the
brake specific fuel consumption. This increase is due to one parameter. This parameter is the
drop of the engine brake power output with the water addition as may be seen from Figure 1.
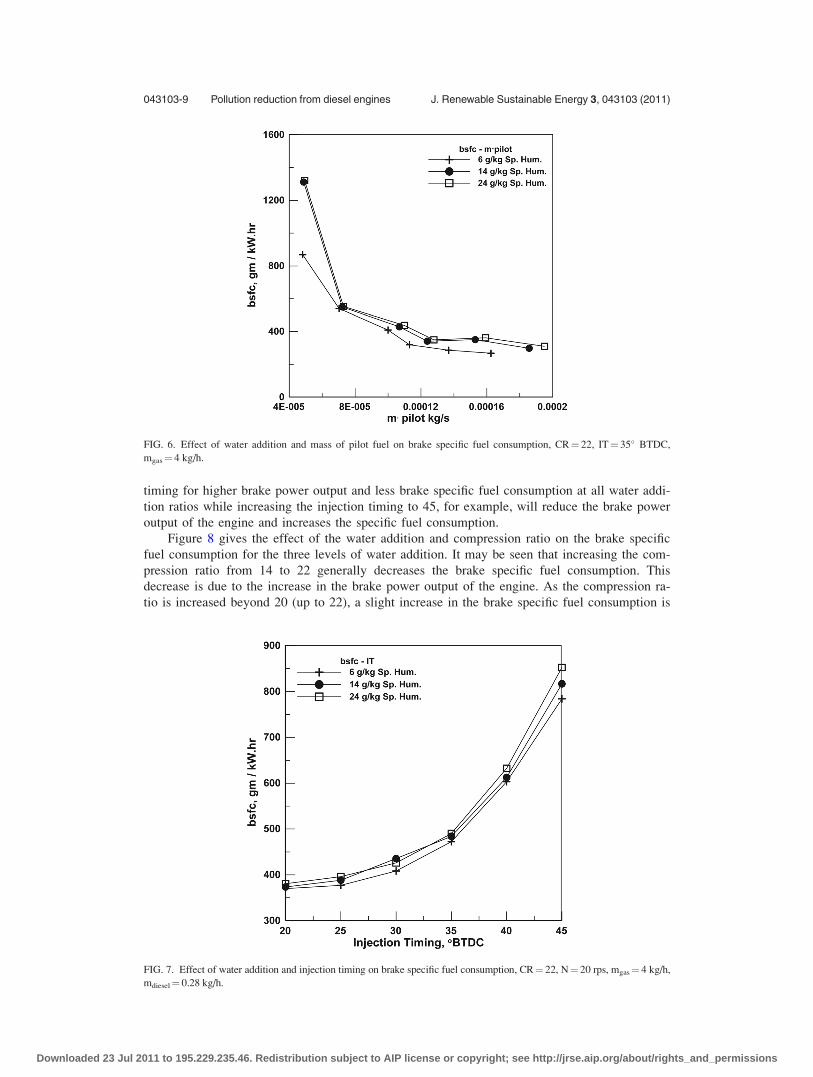
Figure 6 shows the effect of the water addition and the mass of pilot fuel on the brake spe-
cific fuel consumption. The dual fuel engine is running on both fuels at the same time: pilot
and LPG. It may be seen from this figure that the increase in the mass pilot fuel generally
decreases the brake specific fuel consumption. The decrease in the specific fuel consumption is
due to the increase in the brake power output of the engine, as may be seen in Figure 2. How-
ever, the mass of the gaseous fuel (LPG) is constant. It may be also seen from the figure that
adding more water will increase the specific fuel consumption at all masses of pilot fuel.
Figure 7 depicts the effect of the water addition and injection timing on brake specific fuel
consumption for the three water levels tested. It may be seen that advancing the injection tim-
ing from 20� to 45� before the top dead center generally increases the brake specific fuel con-
sumption. The increase in the bsfc is due to the drop in the brake power output of the engine
as a result of increasing the pressure and temperature earlier in the compression stroke which
decreases the mean effective pressure. Also increasing the water addition level from 6 to 14 g/kg
then to 24 g/kg increases the brake specific fuel consumption slightly for the same reasons men-
tioned above.
The increase in the brake specific fuel consumption is almost the same for all water addi-
tion conditions under the whole range of injection timing tested. For the brake power output
and brake specific fuel consumption, it may be concluded to run the engine at early injection
FIG. 5. Effect of water addition and engine speed on brake specific fuel consumption, CR¼ 22, IT¼ 35� BTDC.
043103-8 Al-Omari, Selim, and Al-Aseery J. Renewable Sustainable Energy 3, 043103 (2011)
Downloaded 23 Jul 2011 to 195.229.235.46. Redistribution subject to AIP license or copyright; see http://jrse.aip.org/about/rights_and_permissions
timing for higher brake power output and less brake specific fuel consumption at all water addi-
tion ratios while increasing the injection timing to 45, for example, will reduce the brake power
output of the engine and increases the specific fuel consumption.
Figure 8 gives the effect of the water addition and compression ratio on the brake specific
fuel consumption for the three levels of water addition. It may be seen that increasing the com-
pression ratio from 14 to 22 generally decreases the brake specific fuel consumption. This
decrease is due to the increase in the brake power output of the engine. As the compression ra-
tio is increased beyond 20 (up to 22), a slight increase in the brake specific fuel consumption is
FIG. 6. Effect of water addition and mass of pilot fuel on brake specific fuel consumption, CR¼ 22, IT¼ 35� BTDC,
mgas¼ 4 kg/h.
FIG. 7. Effect of water addition and injection timing on brake specific fuel consumption, CR¼ 22, N¼ 20 rps, mgas¼ 4 kg/h,
mdiesel¼ 0.28 kg/h.
043103-9 Pollution reduction from diesel engines J. Renewable Sustainable Energy 3, 043103 (2011)
Downloaded 23 Jul 2011 to 195.229.235.46. Redistribution subject to AIP license or copyright; see http://jrse.aip.org/about/rights_and_permissions
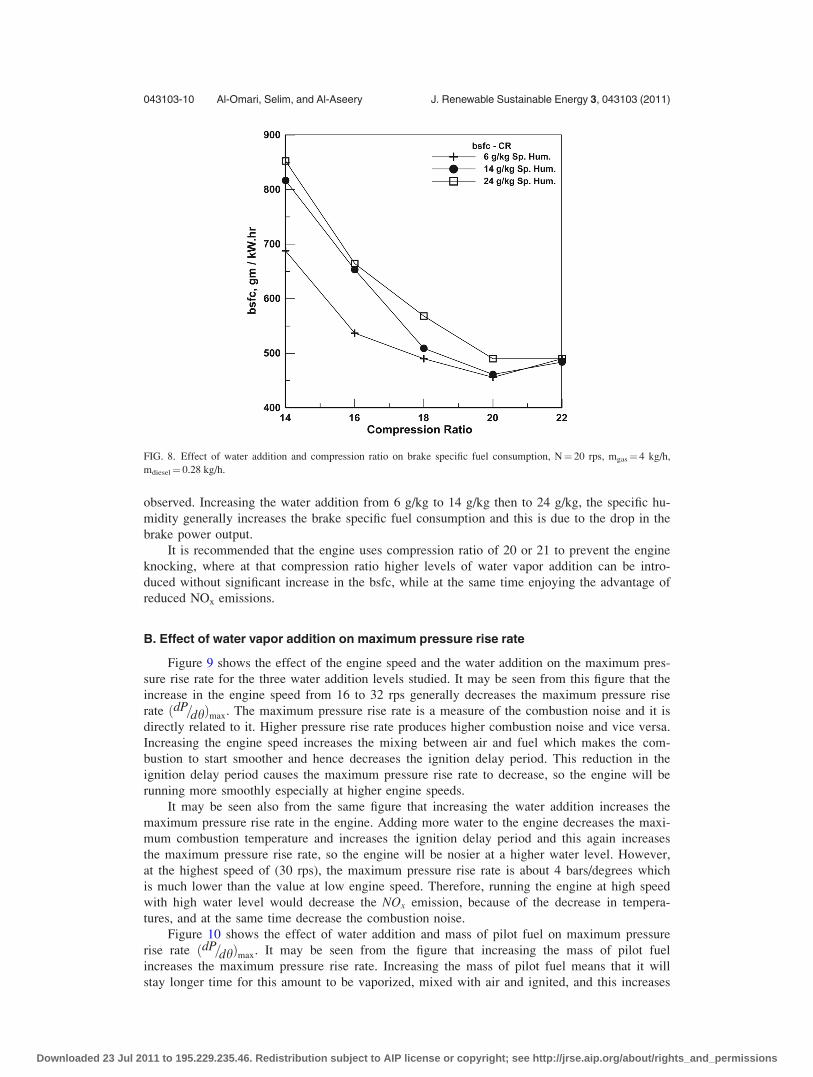
observed. Increasing the water addition from 6 g/kg to 14 g/kg then to 24 g/kg, the specific hu-
midity generally increases the brake specific fuel consumption and this is due to the drop in the
brake power output.
It is recommended that the engine uses compression ratio of 20 or 21 to prevent the engine
knocking, where at that compression ratio higher levels of water vapor addition can be intro-
duced without significant increase in the bsfc, while at the same time enjoying the advantage of
reduced NOx emissions.
B. Effect of water vapor addition on maximum pressure rise rate
Figure 9 shows the effect of the engine speed and the water addition on the maximum pres-
sure rise rate for the three water addition levels studied. It may be seen from this figure that the
increase in the engine speed from 16 to 32 rps generally decreases the maximum pressure rise
rate ðdP=dhÞmax. The maximum pressure rise rate is a measure of the combustion noise and it is
directly related to it. Higher pressure rise rate produces higher combustion noise and vice versa.
Increasing the engine speed increases the mixing between air and fuel which makes the com-
bustion to start smoother and hence decreases the ignition delay period. This reduction in the
ignition delay period causes the maximum pressure rise rate to decrease, so the engine will be
running more smoothly especially at higher engine speeds.
It may be seen also from the same figure that increasing the water addition increases the
maximum pressure rise rate in the engine. Adding more water to the engine decreases the maxi-
mum combustion temperature and increases the ignition delay period and this again increases
the maximum pressure rise rate, so the engine will be nosier at a higher water level. However,
at the highest speed of (30 rps), the maximum pressure rise rate is about 4 bars/degrees which
is much lower than the value at low engine speed. Therefore, running the engine at high speed
with high water level would decrease the NOx emission, because of the decrease in tempera-
tures, and at the same time decrease the combustion noise.
Figure 10 shows the effect of water addition and mass of pilot fuel on maximum pressure
rise rate ðdP=dhÞmax. It may be seen from the figure that increasing the mass of pilot fuel
increases the maximum pressure rise rate. Increasing the mass of pilot fuel means that it will
stay longer time for this amount to be vaporized, mixed with air and ignited, and this increases
FIG. 8. Effect of water addition and compression ratio on brake specific fuel consumption, N¼ 20 rps, mgas¼ 4 kg/h,
mdiesel¼ 0.28 kg/h.
043103-10 Al-Omari, Selim, and Al-Aseery J. Renewable Sustainable Energy 3, 043103 (2011)
Downloaded 23 Jul 2011 to 195.229.235.46. Redistribution subject to AIP license or copyright; see http://jrse.aip.org/about/rights_and_permissions

the ignition delay period. The increase in the ignition delay period causes the maximum pres-
sure rise to increase, and hence the engine will run noisier at high amount of mass of pilot fuel
used.
For the dual fuel engine, it should be noted that the use of mass of pilot fuel should be as
low as possible as the main fuel here is the gaseous fuel and the function of the pilot fuel is
just to ignite it. Therefore, running the engine at small pilot fuel will reduce the maximum pres-
sure rise rate. It may be seen also from the same figure that increasing the water addition level
resulted in an increase in maximum pressure rise rate. The increase in the pressure rise rate is
due to the increase in the ignition delay period as adding more water to the mixture lead to
FIG. 9. Effect of water addition and engine speed on maximum pressure rise rate, CR¼ 22, IT¼ 35� BTDC.
FIG. 10. Effect of water addition and mass of pilot fuel on maximum pressure rise rate, CR¼ 22, IT¼ 35� BTDC, mgas¼ 4 kg/h.
043103-11 Pollution reduction from diesel engines J. Renewable Sustainable Energy 3, 043103 (2011)
Downloaded 23 Jul 2011 to 195.229.235.46. Redistribution subject to AIP license or copyright; see http://jrse.aip.org/about/rights_and_permissions
lower temperatures which in turn increases the ignition delay and produces more pressure rise
rate. However, at very small amount of pilot fuel mass, this increase in pressure rise rate is
very small, i.e., the engine will not be noisy even if we add more water.
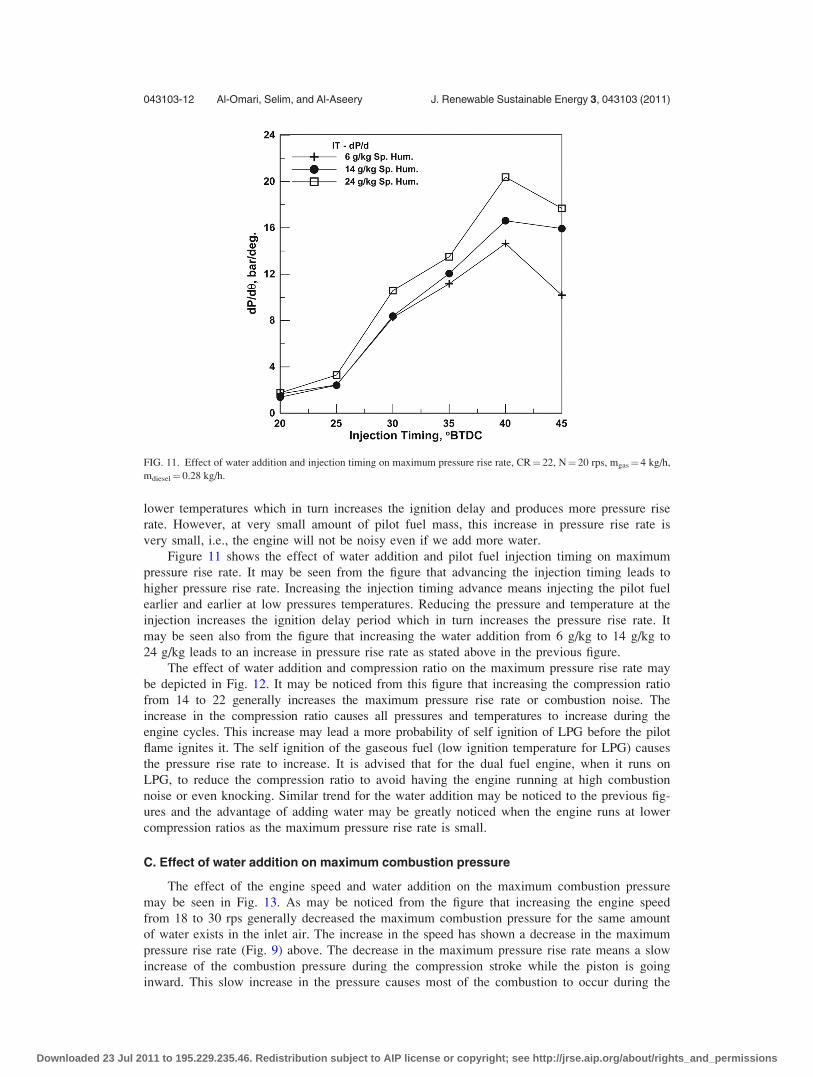
Figure 11 shows the effect of water addition and pilot fuel injection timing on maximum
pressure rise rate. It may be seen from the figure that advancing the injection timing leads to
higher pressure rise rate. Increasing the injection timing advance means injecting the pilot fuel
earlier and earlier at low pressures temperatures. Reducing the pressure and temperature at the
injection increases the ignition delay period which in turn increases the pressure rise rate. It
may be seen also from the figure that increasing the water addition from 6 g/kg to 14 g/kg to
24 g/kg leads to an increase in pressure rise rate as stated above in the previous figure.
The effect of water addition and compression ratio on the maximum pressure rise rate may
be depicted in Fig. 12. It may be noticed from this figure that increasing the compression ratio
from 14 to 22 generally increases the maximum pressure rise rate or combustion noise. The
increase in the compression ratio causes all pressures and temperatures to increase during the
engine cycles. This increase may lead a more probability of self ignition of LPG before the pilot
flame ignites it. The self ignition of the gaseous fuel (low ignition temperature for LPG) causes
the pressure rise rate to increase. It is advised that for the dual fuel engine, when it runs on
LPG, to reduce the compression ratio to avoid having the engine running at high combustion
noise or even knocking. Similar trend for the water addition may be noticed to the previous fig-
ures and the advantage of adding water may be greatly noticed when the engine runs at lower
compression ratios as the maximum pressure rise rate is small.
C. Effect of water addition on maximum combustion pressure
The effect of the engine speed and water addition on the maximum combustion pressure
may be seen in Fig. 13. As may be noticed from the figure that increasing the engine speed
from 18 to 30 rps generally decreased the maximum combustion pressure for the same amount
of water exists in the inlet air. The increase in the speed has shown a decrease in the maximum
pressure rise rate (Fig. 9) above. The decrease in the maximum pressure rise rate means a slow
increase of the combustion pressure during the compression stroke while the piston is going
inward. This slow increase in the pressure causes most of the combustion to occur during the
FIG. 11. Effect of water addition and injection timing on maximum pressure rise rate, CR¼ 22, N¼ 20 rps, mgas¼ 4 kg/h,
mdiesel¼ 0.28 kg/h.
043103-12 Al-Omari, Selim, and Al-Aseery J. Renewable Sustainable Energy 3, 043103 (2011)
Downloaded 23 Jul 2011 to 195.229.235.46. Redistribution subject to AIP license or copyright; see http://jrse.aip.org/about/rights_and_permissions

expansion stroke and reduce the maximum pressure of the cycle as shown in Fig. 13. On the
contrary, a decrease in the engine speed causes the pressure rise rate to increase or the pressure
goes up fast during the compression stroke which causes the maximum pressure to increase.
Similar to previous effects, the increase in the water added in the air from 6 to 14 to 24 g/kg
caused the maximum combustion pressure to increase. This increase is due to the fact that add-
ing more water increased the pressure rise rate (above) and it then increased the maximum
pressure.
FIG. 12. Effect of water addition and compression ratio on maximum pressure rise rate, N¼ 20 rps, mgas¼ 4 kg/h,
mdiesel¼ 0.28 kg/h.
FIG. 13. Effect of water addition and engine speed on maximum combustion pressure.
043103-13 Pollution reduction from diesel engines J. Renewable Sustainable Energy 3, 043103 (2011)
Downloaded 23 Jul 2011 to 195.229.235.46. Redistribution subject to AIP license or copyright; see http://jrse.aip.org/about/rights_and_permissions
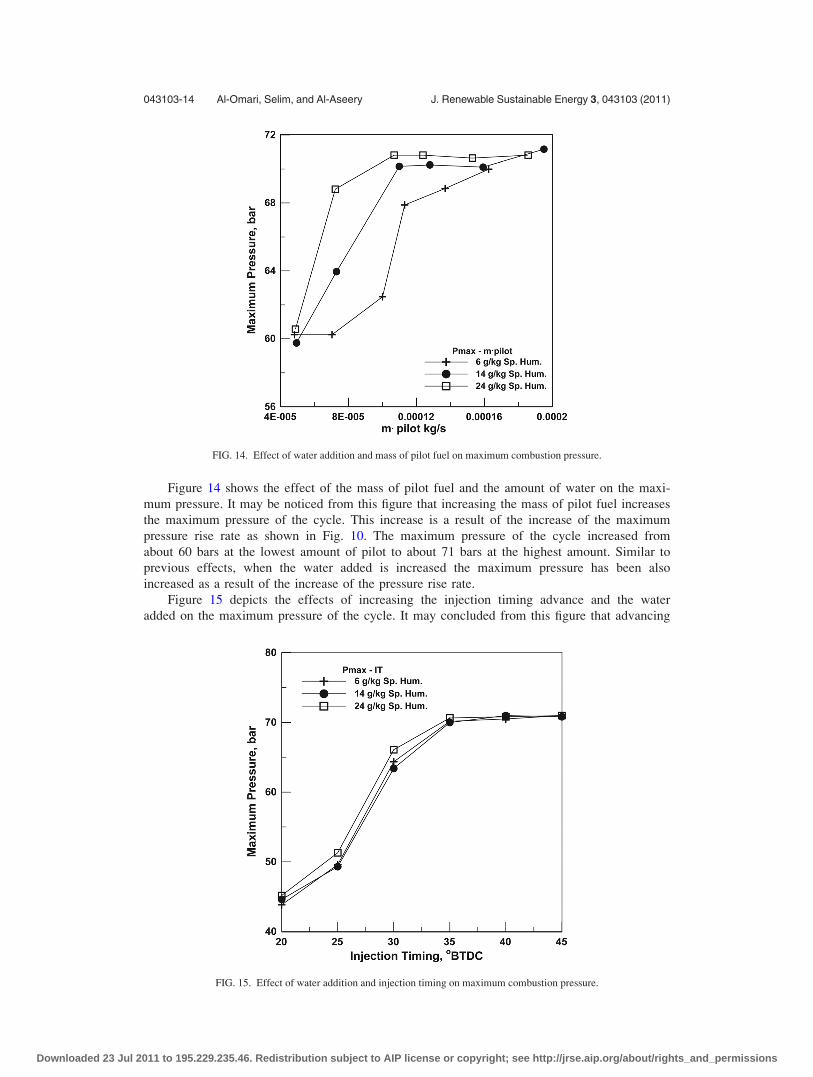
Figure 14 shows the effect of the mass of pilot fuel and the amount of water on the maxi-
mum pressure. It may be noticed from this figure that increasing the mass of pilot fuel increases
the maximum pressure of the cycle. This increase is a result of the increase of the maximum
pressure rise rate as shown in Fig. 10. The maximum pressure of the cycle increased from
about 60 bars at the lowest amount of pilot to about 71 bars at the highest amount. Similar to
previous effects, when the water added is increased the maximum pressure has been also
increased as a result of the increase of the pressure rise rate.
Figure 15 depicts the effects of increasing the injection timing advance and the water
added on the maximum pressure of the cycle. It may concluded from this figure that advancing
FIG. 14. Effect of water addition and mass of pilot fuel on maximum combustion pressure.
FIG. 15. Effect of water addition and injection timing on maximum combustion pressure.
043103-14 Al-Omari, Selim, and Al-Aseery J. Renewable Sustainable Energy 3, 043103 (2011)
Downloaded 23 Jul 2011 to 195.229.235.46. Redistribution subject to AIP license or copyright; see http://jrse.aip.org/about/rights_and_permissions

the injection of the pilot diesel fuel generally increases the maximum pressure of the cycle as
the pressure rise rate becomes higher (Fig. 11). The dual fuel engine becomes noisy when the
injection is advanced and it may be recommended to retard the injection to limit its noise and
prevent high knocking of the engine which may reduce the life of it as well as deteriorating the
performance of the engine. Adding more water in the inlet air slightly increases the maximum
pressure of the cycle as may be seen from the figure.
The effects of increasing the compression ratio and adding more water on the maximum
pressure of the cycle may be shown in Fig. 16. It may be concluded from the figure that
increasing the compression ratio from 14 to 22 generally increases the maximum pressure of
the cycle. This increase is a result if two parameters which lead to the sharp increase from
about 35 to about 70 bars. The first is the increase in the maximum pressure rise rate which
causes the combustion to accelerate and increase the maximum pressure of the cycle. The sec-
ond is the increase in the whole cycle pressures as a result of the increasing the compression ra-
tio. This includes the pressure during the compression stroke before the injection of the pilot
fuel which leads to an increase in the maximum pressure of the cycle. The increase in the water
added also increased the maximum pressure of the cycle as seen in the figure. It is also recom-
mended to reduce the compression ratio of such dual fuel engine to reduce the maximum pres-
sure rise rate or the combustion noise. There has been like sharp increase in the pressure rise
rate and maximum pressure when the engine compression ratio increased from 20 to 22.
D. Effect of water addition on CO emissions
Figure 17 shows the effect of water addition and the engine speed on CO emissions. It
may be seen from this figure that increasing the engine speed increases the CO emission up to
a speed of 28 rps, then starts to fall down and this occurs at all water addition levels. Increasing
the engine speed generally increases the mass of fuel used and this tends to increase the COemission. It may be seen also from the same figure that increasing the water addition level
from 6 to 14 g/kg to 24 g/kg increases the CO on the exhaust gasses as injecting more water in
the inlet air tends to dilute the mixture more with water and this makes the mixture more
diluted and it may give higher level of CO emissions in the exhaust.
Figure 18 shows the effect of water addition and mass of pilot fuel on CO emissions. It
may be seen from the figure that increasing the mass of pilot fuel generally decreases the CO
FIG. 16. Effect of water addition and compression ratio on maximum combustion pressure.
043103-15 Pollution reduction from diesel engines J. Renewable Sustainable Energy 3, 043103 (2011)
Downloaded 23 Jul 2011 to 195.229.235.46. Redistribution subject to AIP license or copyright; see http://jrse.aip.org/about/rights_and_permissions

emissions. This is due to the more complete combustion that occurs at higher mass of pilot fuel
injected, as higher mass of pilot fuel injected gives bigger and bigger flames, and this tends to
burn completely the gaseous fuel that occur in the combustion chamber. However, it may be
also seen that at very high level of mass of pilot fuel, there is an increase in CO emissions and
this may be due to some unburned fuel that comes out of the diffusion flame at higher mass of
pilot fuel. It may be also seen from the same figure that increasing the water level in the inlet
air increases in the CO emissions in the exhaust gasses. This is due to the increased dilution of
the inlet air fuel mixture which gives more amounts of CO emissions in the exhaust gasses.
FIG. 17. Effect of water addition and engine speed on CO emission.
FIG. 18. Effect of water addition and mass of pilot fuel on CO emission.
043103-16 Al-Omari, Selim, and Al-Aseery J. Renewable Sustainable Energy 3, 043103 (2011)
Downloaded 23 Jul 2011 to 195.229.235.46. Redistribution subject to AIP license or copyright; see http://jrse.aip.org/about/rights_and_permissions
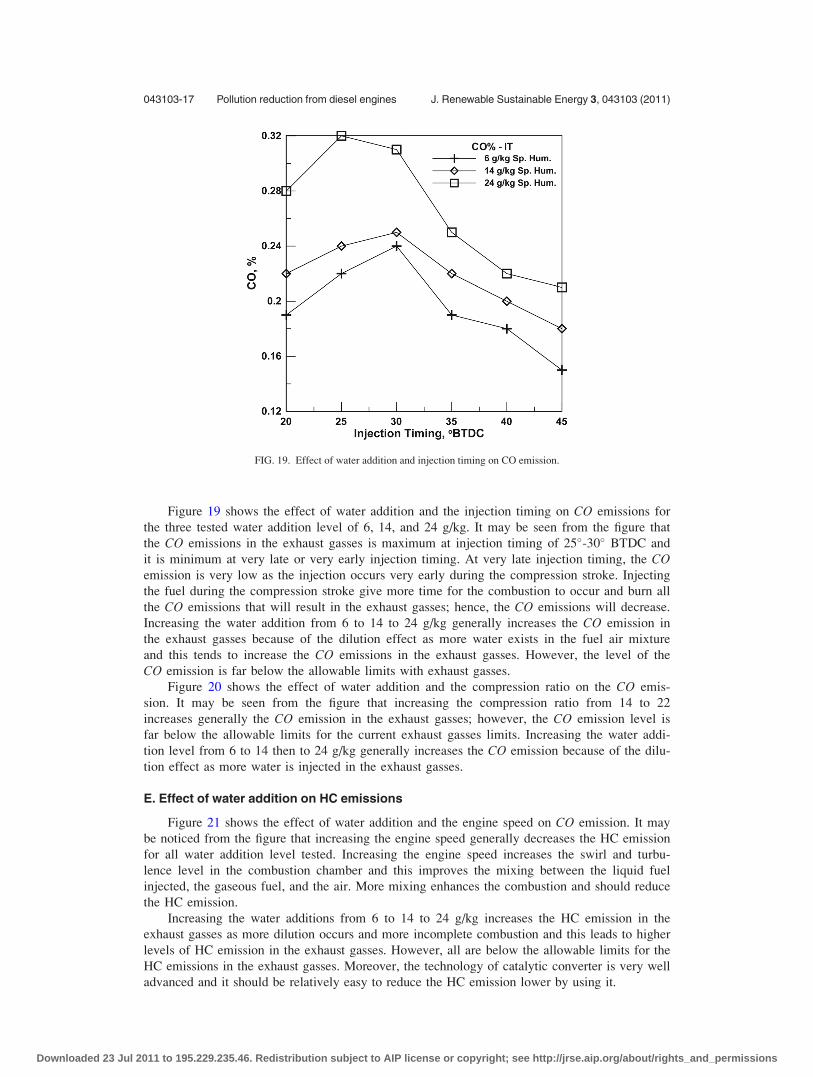
Figure 19 shows the effect of water addition and the injection timing on CO emissions for
the three tested water addition level of 6, 14, and 24 g/kg. It may be seen from the figure that
the CO emissions in the exhaust gasses is maximum at injection timing of 25�-30� BTDC and
it is minimum at very late or very early injection timing. At very late injection timing, the COemission is very low as the injection occurs very early during the compression stroke. Injecting
the fuel during the compression stroke give more time for the combustion to occur and burn all
the CO emissions that will result in the exhaust gasses; hence, the CO emissions will decrease.
Increasing the water addition from 6 to 14 to 24 g/kg generally increases the CO emission in
the exhaust gasses because of the dilution effect as more water exists in the fuel air mixture
and this tends to increase the CO emissions in the exhaust gasses. However, the level of the
CO emission is far below the allowable limits with exhaust gasses.
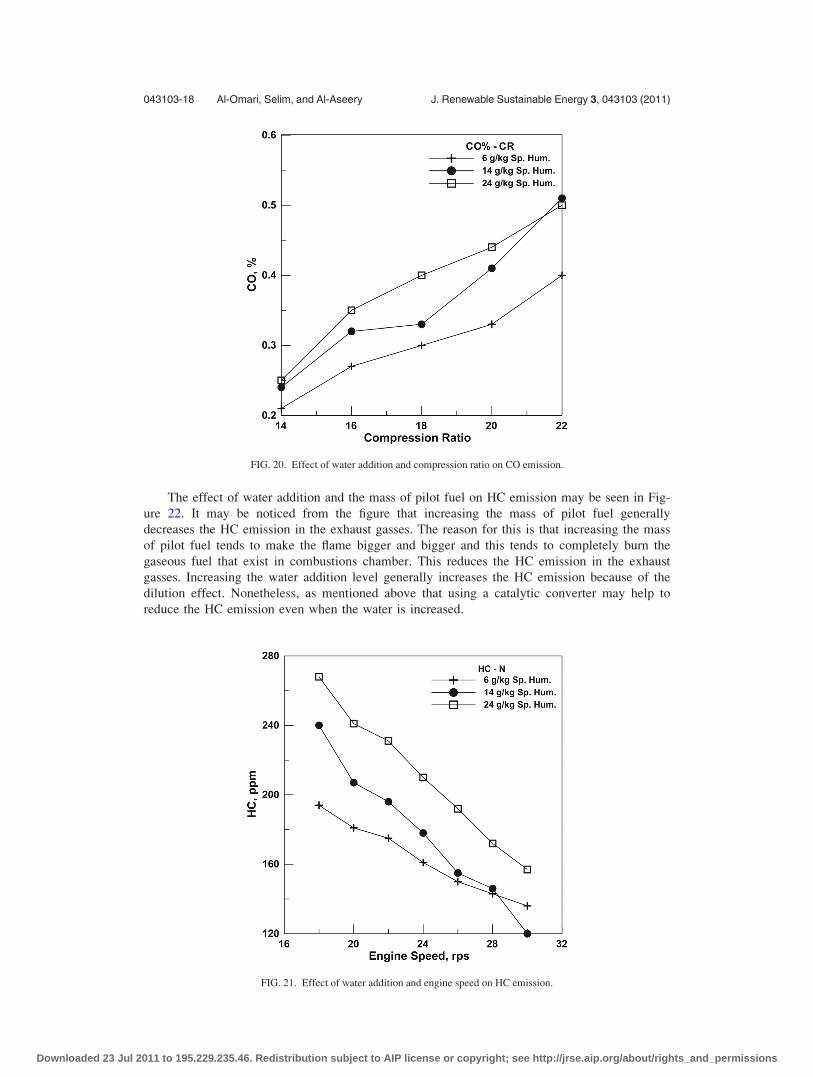
Figure 20 shows the effect of water addition and the compression ratio on the CO emis-
sion. It may be seen from the figure that increasing the compression ratio from 14 to 22
increases generally the CO emission in the exhaust gasses; however, the CO emission level is
far below the allowable limits for the current exhaust gasses limits. Increasing the water addi-
tion level from 6 to 14 then to 24 g/kg generally increases the CO emission because of the dilu-
tion effect as more water is injected in the exhaust gasses.
E. Effect of water addition on HC emissions
Figure 21 shows the effect of water addition and the engine speed on CO emission. It may
be noticed from the figure that increasing the engine speed generally decreases the HC emission
for all water addition level tested. Increasing the engine speed increases the swirl and turbu-
lence level in the combustion chamber and this improves the mixing between the liquid fuel
injected, the gaseous fuel, and the air. More mixing enhances the combustion and should reduce
the HC emission.
Increasing the water additions from 6 to 14 to 24 g/kg increases the HC emission in the
exhaust gasses as more dilution occurs and more incomplete combustion and this leads to higher
levels of HC emission in the exhaust gasses. However, all are below the allowable limits for the
HC emissions in the exhaust gasses. Moreover, the technology of catalytic converter is very well
advanced and it should be relatively easy to reduce the HC emission lower by using it.
FIG. 19. Effect of water addition and injection timing on CO emission.
043103-17 Pollution reduction from diesel engines J. Renewable Sustainable Energy 3, 043103 (2011)
Downloaded 23 Jul 2011 to 195.229.235.46. Redistribution subject to AIP license or copyright; see http://jrse.aip.org/about/rights_and_permissions
The effect of water addition and the mass of pilot fuel on HC emission may be seen in Fig-
ure 22. It may be noticed from the figure that increasing the mass of pilot fuel generally
decreases the HC emission in the exhaust gasses. The reason for this is that increasing the mass
of pilot fuel tends to make the flame bigger and bigger and this tends to completely burn the
gaseous fuel that exist in combustions chamber. This reduces the HC emission in the exhaust
gasses. Increasing the water addition level generally increases the HC emission because of the
dilution effect. Nonetheless, as mentioned above that using a catalytic converter may help to
reduce the HC emission even when the water is increased.
FIG. 20. Effect of water addition and compression ratio on CO emission.
FIG. 21. Effect of water addition and engine speed on HC emission.
043103-18 Al-Omari, Selim, and Al-Aseery J. Renewable Sustainable Energy 3, 043103 (2011)
Downloaded 23 Jul 2011 to 195.229.235.46. Redistribution subject to AIP license or copyright; see http://jrse.aip.org/about/rights_and_permissions
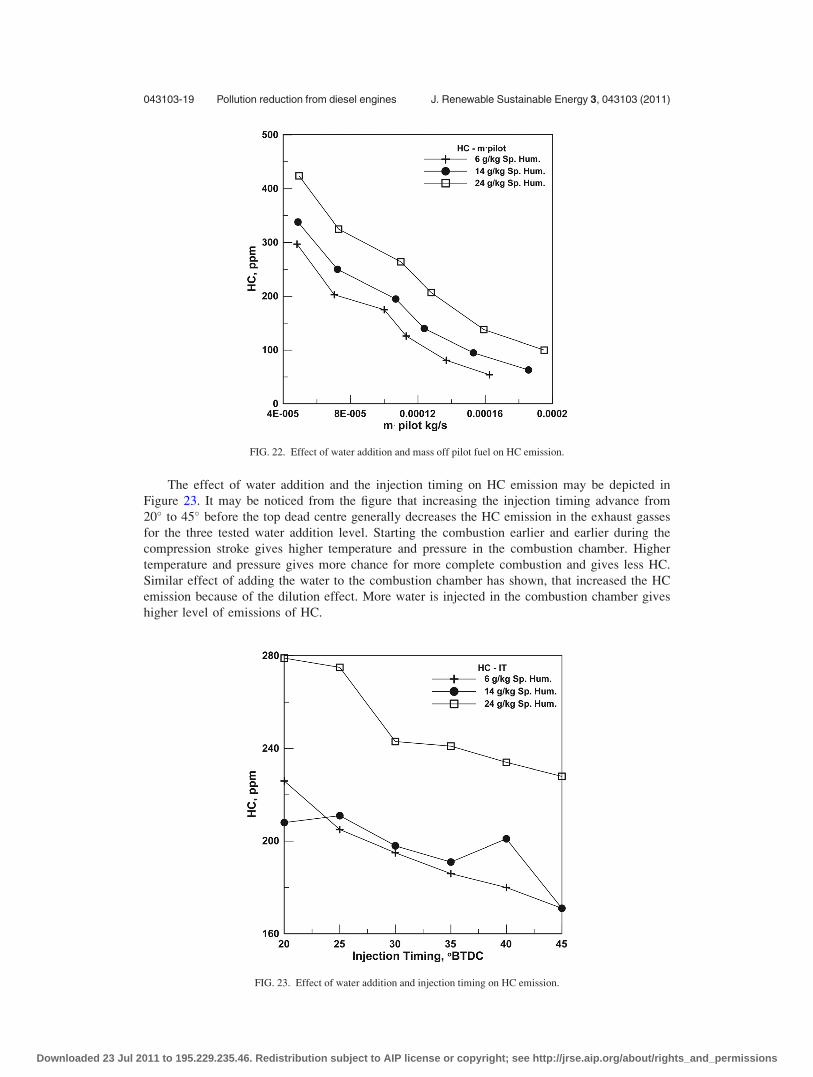
The effect of water addition and the injection timing on HC emission may be depicted in
Figure 23. It may be noticed from the figure that increasing the injection timing advance from
20� to 45� before the top dead centre generally decreases the HC emission in the exhaust gasses
for the three tested water addition level. Starting the combustion earlier and earlier during the
compression stroke gives higher temperature and pressure in the combustion chamber. Higher
temperature and pressure gives more chance for more complete combustion and gives less HC.
Similar effect of adding the water to the combustion chamber has shown, that increased the HC
emission because of the dilution effect. More water is injected in the combustion chamber gives
higher level of emissions of HC.
FIG. 22. Effect of water addition and mass off pilot fuel on HC emission.
FIG. 23. Effect of water addition and injection timing on HC emission.
043103-19 Pollution reduction from diesel engines J. Renewable Sustainable Energy 3, 043103 (2011)
Downloaded 23 Jul 2011 to 195.229.235.46. Redistribution subject to AIP license or copyright; see http://jrse.aip.org/about/rights_and_permissions
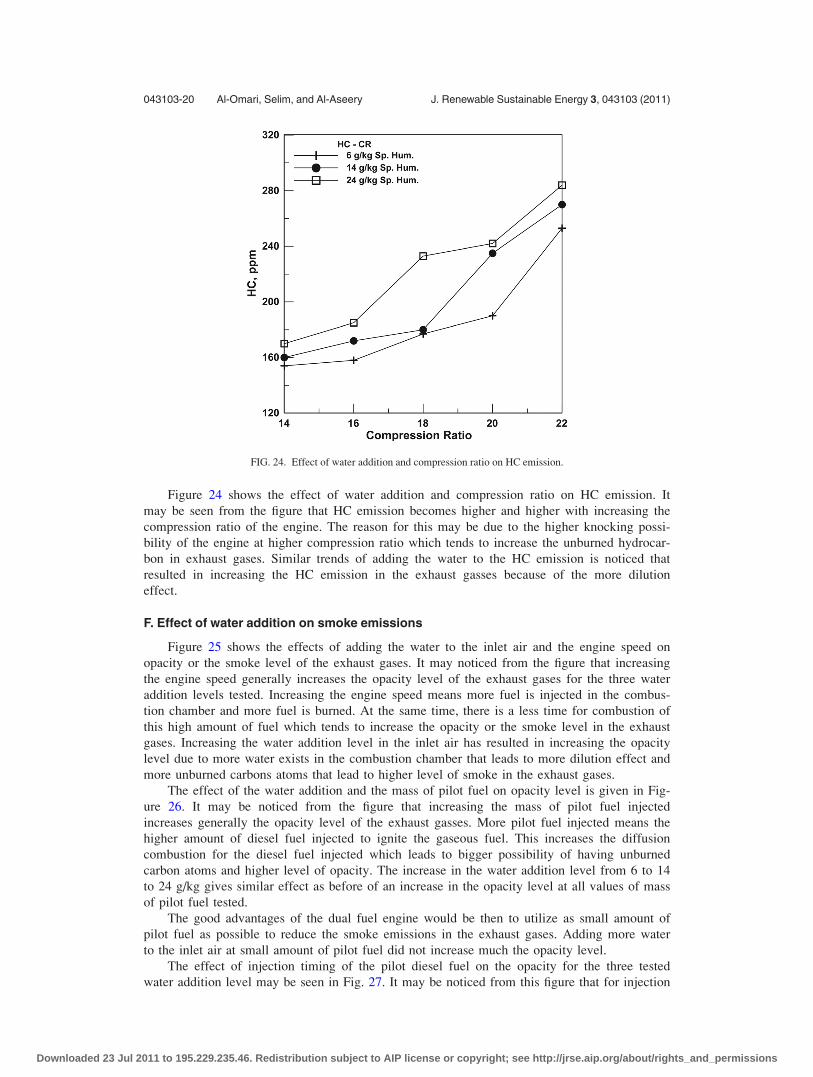
Figure 24 shows the effect of water addition and compression ratio on HC emission. It
may be seen from the figure that HC emission becomes higher and higher with increasing the
compression ratio of the engine. The reason for this may be due to the higher knocking possi-
bility of the engine at higher compression ratio which tends to increase the unburned hydrocar-
bon in exhaust gases. Similar trends of adding the water to the HC emission is noticed that
resulted in increasing the HC emission in the exhaust gasses because of the more dilution
effect.
F. Effect of water addition on smoke emissions
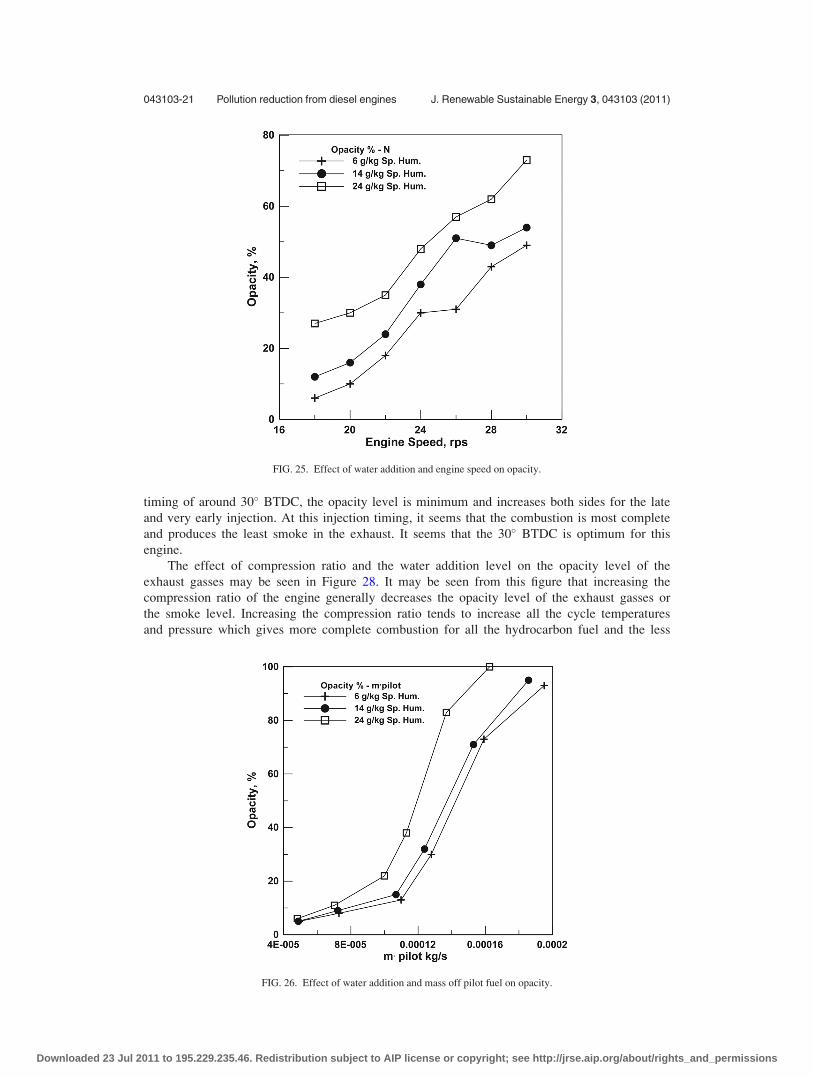
Figure 25 shows the effects of adding the water to the inlet air and the engine speed on
opacity or the smoke level of the exhaust gases. It may noticed from the figure that increasing
the engine speed generally increases the opacity level of the exhaust gases for the three water
addition levels tested. Increasing the engine speed means more fuel is injected in the combus-
tion chamber and more fuel is burned. At the same time, there is a less time for combustion of
this high amount of fuel which tends to increase the opacity or the smoke level in the exhaust
gases. Increasing the water addition level in the inlet air has resulted in increasing the opacity
level due to more water exists in the combustion chamber that leads to more dilution effect and
more unburned carbons atoms that lead to higher level of smoke in the exhaust gases.
The effect of the water addition and the mass of pilot fuel on opacity level is given in Fig-
ure 26. It may be noticed from the figure that increasing the mass of pilot fuel injected
increases generally the opacity level of the exhaust gasses. More pilot fuel injected means the
higher amount of diesel fuel injected to ignite the gaseous fuel. This increases the diffusion
combustion for the diesel fuel injected which leads to bigger possibility of having unburned
carbon atoms and higher level of opacity. The increase in the water addition level from 6 to 14
to 24 g/kg gives similar effect as before of an increase in the opacity level at all values of mass
of pilot fuel tested.
The good advantages of the dual fuel engine would be then to utilize as small amount of
pilot fuel as possible to reduce the smoke emissions in the exhaust gases. Adding more water
to the inlet air at small amount of pilot fuel did not increase much the opacity level.
The effect of injection timing of the pilot diesel fuel on the opacity for the three tested
water addition level may be seen in Fig. 27. It may be noticed from this figure that for injection
FIG. 24. Effect of water addition and compression ratio on HC emission.
043103-20 Al-Omari, Selim, and Al-Aseery J. Renewable Sustainable Energy 3, 043103 (2011)
Downloaded 23 Jul 2011 to 195.229.235.46. Redistribution subject to AIP license or copyright; see http://jrse.aip.org/about/rights_and_permissions
timing of around 30� BTDC, the opacity level is minimum and increases both sides for the late
and very early injection. At this injection timing, it seems that the combustion is most complete
and produces the least smoke in the exhaust. It seems that the 30� BTDC is optimum for this
engine.
The effect of compression ratio and the water addition level on the opacity level of the
exhaust gasses may be seen in Figure 28. It may be seen from this figure that increasing the
compression ratio of the engine generally decreases the opacity level of the exhaust gasses or
the smoke level. Increasing the compression ratio tends to increase all the cycle temperatures
and pressure which gives more complete combustion for all the hydrocarbon fuel and the less
FIG. 25. Effect of water addition and engine speed on opacity.
FIG. 26. Effect of water addition and mass off pilot fuel on opacity.
043103-21 Pollution reduction from diesel engines J. Renewable Sustainable Energy 3, 043103 (2011)
Downloaded 23 Jul 2011 to 195.229.235.46. Redistribution subject to AIP license or copyright; see http://jrse.aip.org/about/rights_and_permissions
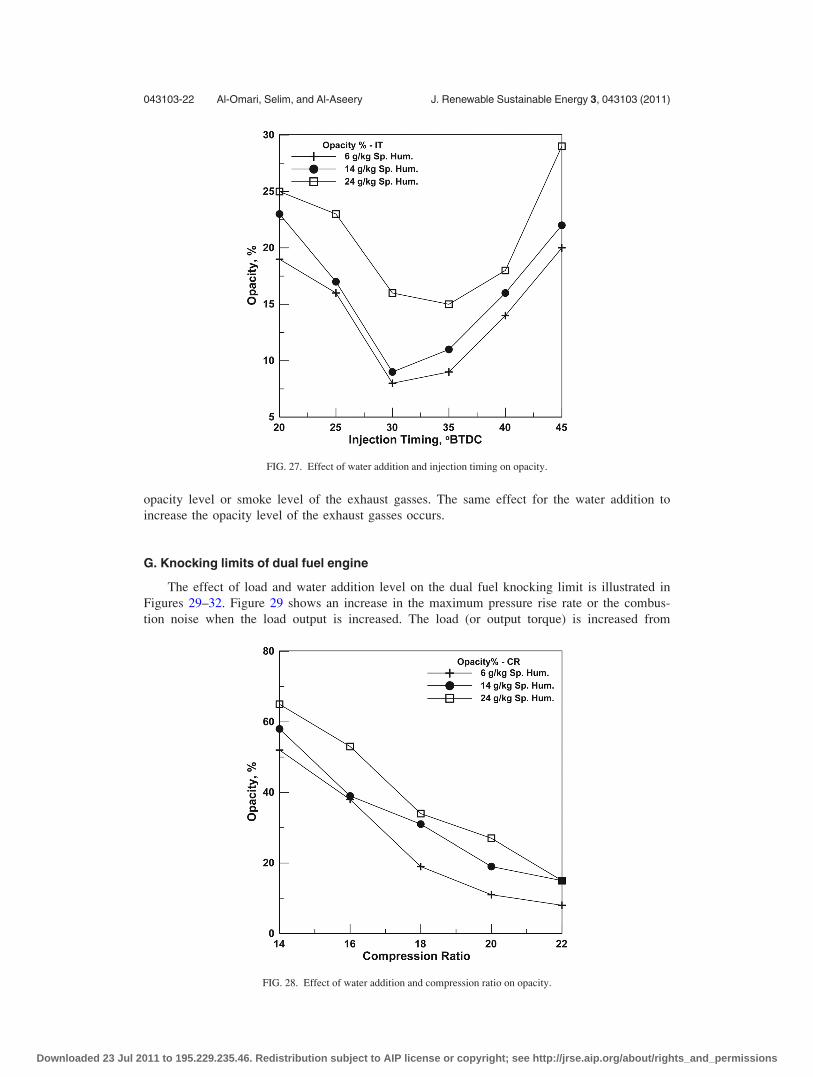
opacity level or smoke level of the exhaust gasses. The same effect for the water addition to
increase the opacity level of the exhaust gasses occurs.
G. Knocking limits of dual fuel engine
The effect of load and water addition level on the dual fuel knocking limit is illustrated in
Figures 29–32. Figure 29 shows an increase in the maximum pressure rise rate or the combus-
tion noise when the load output is increased. The load (or output torque) is increased from
FIG. 27. Effect of water addition and injection timing on opacity.
FIG. 28. Effect of water addition and compression ratio on opacity.
043103-22 Al-Omari, Selim, and Al-Aseery J. Renewable Sustainable Energy 3, 043103 (2011)
Downloaded 23 Jul 2011 to 195.229.235.46. Redistribution subject to AIP license or copyright; see http://jrse.aip.org/about/rights_and_permissions
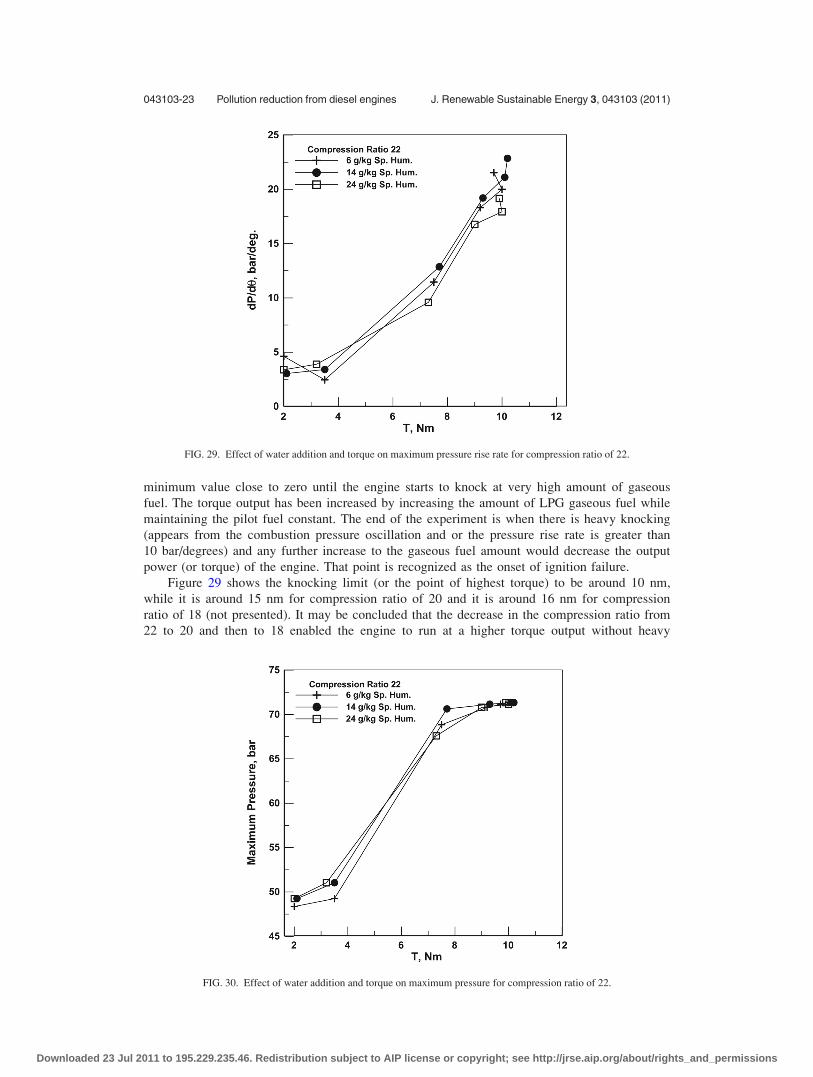
minimum value close to zero until the engine starts to knock at very high amount of gaseous
fuel. The torque output has been increased by increasing the amount of LPG gaseous fuel while
maintaining the pilot fuel constant. The end of the experiment is when there is heavy knocking
(appears from the combustion pressure oscillation and or the pressure rise rate is greater than
10 bar/degrees) and any further increase to the gaseous fuel amount would decrease the output
power (or torque) of the engine. That point is recognized as the onset of ignition failure.
Figure 29 shows the knocking limit (or the point of highest torque) to be around 10 nm,
while it is around 15 nm for compression ratio of 20 and it is around 16 nm for compression
ratio of 18 (not presented). It may be concluded that the decrease in the compression ratio from
22 to 20 and then to 18 enabled the engine to run at a higher torque output without heavy
FIG. 29. Effect of water addition and torque on maximum pressure rise rate for compression ratio of 22.
FIG. 30. Effect of water addition and torque on maximum pressure for compression ratio of 22.
043103-23 Pollution reduction from diesel engines J. Renewable Sustainable Energy 3, 043103 (2011)
Downloaded 23 Jul 2011 to 195.229.235.46. Redistribution subject to AIP license or copyright; see http://jrse.aip.org/about/rights_and_permissions
knocking or ignition failure. The reduction in the compression ratios reduces the cycle pressure
and temperature which reduces the possibility of self-ignition of the LPG gaseous fuel and hav-
ing knocking in the dual fuel engine. It is recommended therefore to reduce the compression ra-
tio of the dual fuel engine, to reduce the knocking possibility, and to reduce the combustion
noise and enables the engine to run at higher output torques.
It may be also noticed that increasing the output torque leads to an increase of the maxi-
mum pressure rise rate. This is a result of the increase in the amount of LPG gaseous fuel
admitted in the intake air which—when burned—produces high pressure rise rate.
Similar trend may be found for the maximum combustion pressure as shown in Fig. 30.
The increase in the maximum pressure with increasing the torque is a result of the increase in
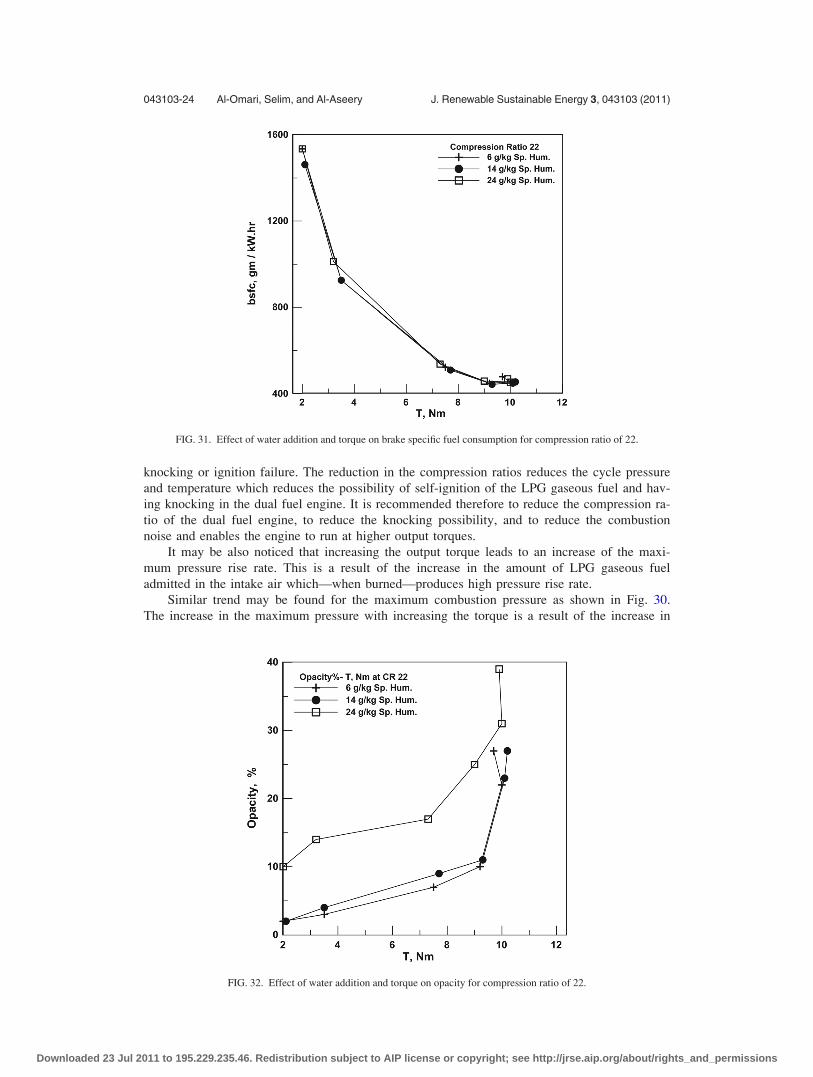
FIG. 31. Effect of water addition and torque on brake specific fuel consumption for compression ratio of 22.
FIG. 32. Effect of water addition and torque on opacity for compression ratio of 22.
043103-24 Al-Omari, Selim, and Al-Aseery J. Renewable Sustainable Energy 3, 043103 (2011)
Downloaded 23 Jul 2011 to 195.229.235.46. Redistribution subject to AIP license or copyright; see http://jrse.aip.org/about/rights_and_permissions
the pressure rise rate shown above in Fig. 29. The same conclusion for the knock limit is also
seen here for the maximum pressure.
Figure 31 shows the effect of output torque on the bsfc for the three tested water addition
level tested. It may be shown in this figure that increasing the output torque results in a
decrease in the bsfc. The increase in the output torque is a result of the increase on the mass of
LPG gaseous fuel which also produces more power output; therefore, it seems that the increase
in the power is more than the increase in the fuel mass and also due to an improvement of the
engine efficiency at high loads.
Figure 32 depicts the effect of output torque, compression ratio, and the water addition
level on the opacity level of the exhaust gases. It could be seen from this figure that the
increase in the output torque has resulted in the increase in the smoke level or opacity level of
the exhaust gases. Even at higher amount of water addition levels, the same trend is noticed.
This increase in the opacity may be due to the increase in the amount of gaseous fuel admitted
with the inlet air. The increase in the gaseous fuel may have resulted in the increase of fuel to
air ratio and this reduces the amount of oxygen available for the complete combustion of the
fuel. This may have resulted in the increase in the opacity level of exhaust gases.
IV. CONCLUSIONS
1. Increasing the mass of pilot fuel generally increases the brake power output of the engine for
all ratios of water level.
2. Increasing the water addition level from 6 g/kg air to 14 g/kg then to 24 g/kg air, what generally
reduce the brake power output of the engine; however, this reduction in the brake power output
is not much compared to the benefit of using the water in the engine to reduce the NOx.
3. The use of slightly lower compression ratios, e.g., 20 would produce higher brake power out-
put, and even in the case of using high amount of water in the admitted air (24 g/kg air), the
engine would give the same power as of compression ratio of 22.
4. Adding more water increases the specific fuel consumption at all masses of pilot fuel.
5. Adding more water increases the maximum pressure rise rate and maximum pressure for all
design and operating conditions tested. However, this can be decreased if the engine speed is
increased, pilot fuel injection timing is retarded, mass of pilot is reduced, and compression ratio
is reduced.
6. Adding more water increases the level of CO, HC, and smoke opacity in the exhaust gases;
however, the level of CO is far below the allowable limits and HC can be reduced with a cata-
lytic converter. The smoke opacity may be reduced by decreasing the mass of pilot fuel.
1W. Korbitz, Renewable Energy 16, 1078 (1999).2J. L. Mauderly, Toxicol. Sci. 62, 6 (2001).3G. S. Springer and D. J. Patterson, Engine Emissions: Pollutant Formation and Measurement (Plenum, New York, 1973).4J. Pitts, An Overview of Diesel Emissions on Air Quality (Plenum Press, New York, 1973).5V. C. Perola, D. Zacarias, A. F. Pires, C. S. Pool, and R. F. Carvlho, Atmos. Environ. 37(21), 3009 (2003).6X. Tauzia, A. Maiboom, and S. R. Shah, Energy 35, 3628 (2010).7O. Armasa, R. Ballesterosa, F. J. Martosb, and J. R. Agudeloc, Fuel 84, 1011 (2005).8H. B. Urbach, D. T. Knauss, J. Emory, B. L. Wallace, J. A. Wasser, M. R. Sexton, and J. Frese, “The reduction of NOxemissions from marine power plants,” in Proceedings of the Air and Waste Management Association’s 90th AnnualMeeting and Exhibition, Toronto, Ontario, Canada, 8-13 June 1997, Paper No. 97-MP5.08.
9S. Yoshihara, M. Okabe, and T. Nakamaura, U.S. patent 5,522,349 (United States Patent Office, June 4, 1996).10G. B. O’Neal, J. O. Storment, and R. W. Waytulonis, “Control of diesel exhaust emissions in underground coal mines—
Single cylinder engine experiments with modified and non-conventional fuels,” in Diesel Combustion and EmissionPart 3, Int. Off-Highway Meeting & Exp., Milwaukee, WI (Society of Automotive Engineers (SAE), USA, 1981), SP-495,pp. 13-23.
11G. Greeves, I. M. Khan, and G. Onion, “Effects of water introduction on diesel engine combustion and emissions,” inProceedings of the 16th Annual Symposium (Internaional) on Combustion (Williams and Wilkins Co., Baltimore, 1976),pp. 321-336.
12A. D. Vita, “Multi-cylinder D. I. diesel engine tests with unstabilized emulsion of water and ethanol in diesel fuel,” SAEPaper 890450, 1989.
13N. Sawa and S. Kajitani, “Physical properties of emulsion fuels (water/oil-type) and its effect on engine performanceunder transient operation,” in International Congress and Exposition, Detroit, MI, SAE Paper 920198, 1992.
14S. D. Schwab, U.S. patent 5,669,938 (US Patent and Trademark Office, September 23, 1997).
043103-25 Pollution reduction from diesel engines J. Renewable Sustainable Energy 3, 043103 (2011)
Downloaded 23 Jul 2011 to 195.229.235.46. Redistribution subject to AIP license or copyright; see http://jrse.aip.org/about/rights_and_permissions

15J. D. Peter-Hoblyn and J. M. Valentine, U.S. patent 5,584,894 (United States Patent and Trademark Office, December 17,1996).
16E. Marelli, U.S. patent 5,445,656 (US Patent and Trademark Office, August 29, 1995).17X. Montagne, D. Herrier, and J.-C. Guibet, J.-C., “Fouling of automotive diesel injectors-test procedure, influence of
composition of diesel oil and additives,” SAE Paper 872118, 1987.18R. J. Crookes, M. A. A. Nazha, and F. Kiannajad, “A comparison of ignition and emissions characteristics for alternative
diesel fuels and emulsions,” in I. Mech. E. Seminar Publications (1990), pp. 47–52.19Yoshimoto, Yasufumi, Tsukarhara, Minoru, Muryama, and Tadashi, Nippon Kikai Gakkai Ronbunshun B Hen 55(519),
3538 (1989).20O. Armas, R. Ballesteros, F. J. Martos, and J. R. Agudelo, Fuel 84(7–8), 1011 (2005).21M. Y. E. Selim, Fuel 84, 961 (2005).
043103-26 Al-Omari, Selim, and Al-Aseery J. Renewable Sustainable Energy 3, 043103 (2011)
Downloaded 23 Jul 2011 to 195.229.235.46. Redistribution subject to AIP license or copyright; see http://jrse.aip.org/about/rights_and_permissions