Evolving blood pressure dynamics for extremely preterm infants

1389
Braz J Med Biol Res 37(9) 2004
Contrast sensitivity in full-term and premature infantsBrazilian Journal of Medical and Biological Research (2004) 37: 1389-1396ISSN 0100-879X
Contrast sensitivity threshold measuredby sweep-visual evoked potentialin term and preterm infants at3 and 10 months of age
Núcleo de Neurociências e Comportamento, Departamento de Psicologia Experimental,Instituto de Psicologia, Universidade de São Paulo, São Paulo, SP, Brasil
A.G.F. Oliveira,M.F. Costa,
J.M. de Souzaand D.F. Ventura
Abstract
Although healthy preterm infants frequently seem to be moreattentive to visual stimuli and to fix on them longer than full-terminfants, no difference in visual acuity has been reported comparedto term infants. We evaluated the contrast sensitivity (CS) func-tion of term (N = 5) and healthy preterm (N = 11) infants at 3 and 10months of life using sweep-visual evoked potentials. Two spatialfrequencies were studied: low (0.2 cycles per degrees, cpd) andmedium (4.0 cpd). The mean contrast sensitivity (expressed inpercentage of contrast) of the preterm infants at 3 months was 55.4for the low spatial frequency (0.2 cpd) and 43.4 for the mediumspatial frequency (4.0 cpd). At 10 months the low spatial CS was52.7 and the medium spatial CS was 9.9. The results for the terminfants at 3 months were 55.1 for the low spatial frequency and 34.5for the medium spatial frequency. At 10 months the equivalentvalues were 54.3 and 14.4, respectively. No difference was foundusing the Mann-Whitney rank sum T-test between term and preterminfants for the low frequency at 3 or 10 months or for the mediumspatial frequency at 3 or 10 months. The development of CS for themedium spatial frequency was equally fast for term and preterminfants. As also observed for visual acuity, CS was equivalentamong term and preterm infants, suggesting that visual experiencedoes not modify the development of the primary visual pathway.An earlier development of synapses in higher cortical visual areasof preterm infants could explain the better use of visual informationobserved behaviorally in these infants.
CorrespondenceA.G.F. Oliveira
Instituto de Psicologia
Av. Professor Mello Moraes, 1721
Bloco A, Sala D-9
05508-900 São Paulo, SP
Brasil
Fax: +55-11-3091-4357
E-mail: [email protected]
This study was supported
financially by grants from FINEP
(No. 66.95.0407.00), FAPESP
(No. 0030/00-98) and CNPq
(No. 523303/95-5). D.F. Ventura wasthe recipient of a CNPq 1A Research
Fellowship. A.G.F. Oliveira was therecipient of a Master’s fellowshipfrom FAPESP (No. 03/10342-4).
Received September 2, 2003
Accepted May 11, 2004
Key words• Contrast sensitivity• Preterm infants• Sweep-visual evoked potential• Visual development• Visual acuity
Introduction
The task of the visual system is to enablethe localization and identification of objectsby the organism. The objects are composedof surfaces and are seen against backgrounds.
Their localization involves discrimination ofluminance, shapes, colors and textures, thatis, it involves the ability to see changes inthese attributes. During the evolutionary pro-cess, human spatial vision has been opti-mized to detect small changes in the stimuli.
1390
Braz J Med Biol Res 37(9) 2004
A.G.F. Oliveira et al.
Evolution and neonatal experience are funda-mental for the development of a visual sys-tem capable of functioning in the environ-ment in which we live (1). Sensitivity tochange or contrast sensitivity is thus one ofthe most important attributes of the visualsystem (2). In clinical practice, vision ismost commonly evaluated in terms of theability to see the smallest object at the highestcontrast. However, this does not take intoaccount the sensitivity to low contrasts. Thespatial luminance contrast sensitivity func-tion (CSF) gives us a more complete repre-sentation of the spatial processing capacityof the visual system than the measurement ofthe visual acuity at maximum contrast. Alter-ations of the CSF related to several patholo-gies have been found not to affect the visualacuity of infants and children (3-6).
The development of contrast sensitivityis poorly understood (7) and the immaturityof the photoreceptors or of the optics of theeye cannot explain the relation between thecapacity of the retina to receive stimuli andcontrast sensitivity (8) in infants. Few stud-ies of contrast sensitivity development ininfants are available and even fewer investi-gations dealing with premature infants havebeen reported.
Visual evoked potentials (VEPs) havebeen widely used to assess visual functionsin infants and children with or without mul-tiple handicaps, with high testability (9,10).A rapid method was developed to obtain VEPspatial vision thresholds. In the sweep VEPmethod pattern reversal gratings are swept inspatial frequency or contrast magnitude whilethe response amplitude is estimated online bydiscrete Fourier analysis and a threshold isobtained by linear interpolation (11). Devel-opment of contrast sensitivity and acuitymeasured by sweep-VEP has been describedin term infants by Norcia et al. (12-14) whofound two phases in the process. Between 4and 9 weeks of age, overall contrast sensitiv-ity increased by a factor of 4-5 at all spatialfrequencies. Beyond 9 weeks, contrast sen-
sitivity at low spatial frequencies remainedconstant, whereas sensitivity increased sys-tematically at higher spatial frequencies (13).In another sweep-VEP study (14) the con-trast sensitivity obtained for 10-week-oldinfants reached adult levels for spatial fre-quencies below 1 cycle per degree (cpd).
Rudduck and Harding (15) used the pat-tern-reversal VEP to evaluate preterm infantswith gestational ages of at least 30 weeks andfull-term infants. They found that the patternVEPs of infants with longer gestation timeshad higher amplitudes and shorter latenciesthan those of infants with shorter gestationtimes, indicating a more complete matura-tional process.
Dobson and Teller (16) discuss the factthat spatial visual acuities assessed behavior-ally are lower than those obtained from VEPsduring the first 6 months of life. They con-sider the fact that different pathways areinvolved in the two techniques and attributethe difference in thresholds, in part, to thefact that the behavioral thresholds require theretrieval of a larger amount of informationthan the electrophysiological measurement.The longer processing pathway could ex-plain losses of signals from high spatialfrequencies due to their demodulation orloss.
Children born prematurely are at risk ofimpairment of visual functions (17-20) evenin the absence of other neurological signs ofimpairment (21,22). Some studies have evalu-ated the spatial resolution of visual stimuliand its development in preterm infants. Kos-Pietro et al. (23) did not find differencesbetween term and preterm infants in visualacuity assessed by the steady-state pattern-reversal VEP. These investigators suggestedthat the visual experience may not be themost relevant factor for visual acuity devel-opment in the preterm infants. Baraldi et al.(24) compared the visual acuity of term andpreterm infants at equal gestational agesusing two visual acuity tests, one performedby forced-choice preferential look (FPL) and
1391
Braz J Med Biol Res 37(9) 2004
Contrast sensitivity in full-term and premature infants
the other by reversal-pattern VEP. Thepreterm infants showed better visual acuityassessed by FPL than the term infants. Nodifference was detected in the VEP test.
The VEP-measured spatial resolution re-flects the visual pathway processing of theinformation up to the level of the primaryvisual area, processed by the retina andgeniculo-striate pathway; it indicates that thevisual pathway is able to resolve the stimulusinformation (11). The responses may reflectpre-cortical and/or cortical activity. Sincethe VEP-measured spatial resolution is closelysimilar in term and preterm infants, the highervisual acuity presented by preterms whenmeasured with behavioral methods could bedue to processing at higher neural levels.Visual acuity corresponds to one point of theCSF, the point at which the highest spatialfrequency threshold is achieved with thehighest luminance contrast. Given that thispoint is higher in preterms, it is relevant tofind out if the CSF of preterms is uniformlyhigher than that of term children or if it isequal for lower and intermediate spatial fre-quencies, diverging only at the higher end.The aim of our study was to answer thisquestion by measuring the contrast sensitiv-ities in term and preterm infants at 3 and 10months of age in order to determine whetherthe longer visual experience of preterm in-fants affects the development of the CSF.
Subjects and Methods
Subjects
The subjects were 16 healthy infants withnormal fundi in the ophthalmologic evalua-tion and without any evidence of systemic orneurological disease after thorough clinicalevaluation and laboratory tests. They werereferred to this study by the University Hos-pital of the University of São Paulo (HU-USP). Informed consent was obtained fromthe parents of all infants. The study wasapproved by the HU-USP Ethics Committee.
The infants were grouped as term infants(N = 5) if their gestational age was above37 complete weeks. Infants born prior to37 weeks of gestation were considered tobe preterm (N = 11) in accordance with theWorld Health Organization (WHO) (25)(Table 1). Infants were tested at 3 and at 10months. Six volunteers with 20/20 Snellenvisual acuity composed the adult controlgroup.
Measurement of visual acuity
Stimuli and apparatus. The electrophysi-ological correlates of contrast sensitivity weremeasured by means of visually evoked po-tentials, using the NuDiva version of thesweep-VEP system (12,26). The stimuli werevertical sine wave gratings of 0.2 and 4.0 cpddisplayed on a high-resolution video monitor(Dotronix Model EM2400-D788), with amean luminance of 159.5 cd/m2 comprisinga visual angle of 33.6 x 25º at the test distanceof 50 cm, used for the infants, and 16.8 x12.5º of visual angle at the distance of 100cm, used for adults. In each session, asequence of ten levels of contrast was pre-
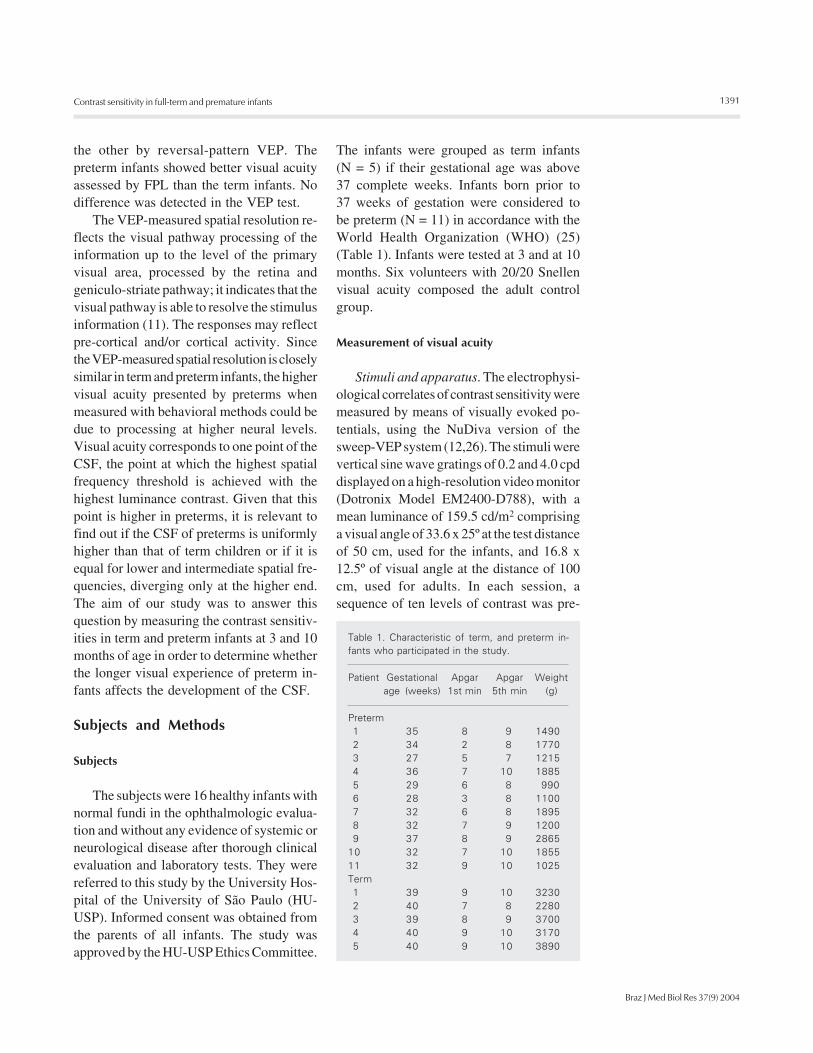
Table 1. Characteristic of term, and preterm in-fants who participated in the study.
Patient Gestational Apgar Apgar Weightage (weeks) 1st min 5th min (g)
Preterm1 35 8 9 14902 34 2 8 17703 27 5 7 12154 36 7 10 18855 29 6 8 9906 28 3 8 11007 32 6 8 18958 32 7 9 12009 37 8 9 2865
10 32 7 10 185511 32 9 10 1025Term1 39 9 10 32302 40 7 8 22803 39 8 9 37004 40 9 10 31705 40 9 10 3890

1392
Braz J Med Biol Res 37(9) 2004
A.G.F. Oliveira et al.
sented at the rate of 1 frame per second, withten pattern reversals at each contrast. Thereversal rate was 6 Hz. VEP recordings wereobtained with EEG electrodes (Grass GoldDisc Electrodes, E6GH, West Warwick, RI,USA) attached to the scalp with electrodecream and cotton pads (Webril II, São Paulo,SP, Brazil). A headband (3M Coban Self-Adherent Wrap 1581, São Paulo, SP, Brazil)was used to keep the electrodes in place. TheEEG was recorded from two bipolar place-ments (O1 and O2), 2-3 cm to the left andright of a common reference electrode (Oz)placed 1 cm above the inion on the midline(26). A ground electrode was placed 2-3 cmabove Oz according to the ISCEV protocol(12). The EEG was amplified with aNeurodata Acquisition System (WestWarwick, RI, USA) (12C-4-23 - gain =10,000; -3dB cutoff at 1 and 100 Hz).
Procedure. When the child was alert andlooking attentively at the video monitor, theexperimenter activated the contrast stimulussequence. The EEG was simultaneously re-corded from the two channels and filtered inreal time (sampling rate = 397 Hz) to isolatethe VEP. The recordings were digitized anda discrete Fourier transform (DFT) wasapplied to measure amplitude and phase overa 1-Hz band centered on the second har-monic of the visual stimulation frequency.The test was performed binocularly in adarkened room. Throughout each trial smalltoys hanging in front of the video monitorwere moved by the experimenter to attractthe child’s attention and to maintain its fixa-tion approximately at the center of the screen.
Analysis. Sweep-VEP correlates of con-trast sensitivity were estimated using anautomated algorithm. This algorithm per-forms a linear fit of the data relating thesweep-VEP second harmonic amplitude tolinear contrast. For each spatial frequencythe threshold contrast is considered to be thevalue of the extrapolation of this function tozero amplitude. A signal-to-noise ratio of 2:1at peak amplitude for individual trials and 3:1
for the average was required. A thresholdwas obtained for each channel. Three to 12repetitions of the sweep-VEP were run untilat least three whose highest contrast peaksmet the signal-to-noise ratio with a constantphase could be chosen for averaging (27).The final contrast sensitivity estimates arereported as percent (%).
Results
Contrast thresholds were obtained for allinfants. The mean (± SD) contrast thresholdof the preterm infants at 3 months was 55.4± 7.8% for the low spatial frequency (0.2cpd) and 43.4 ± 7.4 for the medium spatialfrequency (4.0 cpd). At 10 months the lowspatial contrast threshold was 52.7 ± 5.1%and the medium spatial contrast thresholdwas 9.9 ± 4.1%. The results for the contrastthresholds of the term infants at 3 monthswere 55.1 ± 6.8 for the low frequency and34.5 ± 12.1% for the medium spatial fre-quency. At 10 months the equivalent valueswere 54.3 ± 5.2 and 14.4 ± 3.7% (Figure 1).The adult contrast thresholds to low andmedium spatial frequencies were 24.6 ± 9.1and 1.9 ± 0.7%, respectively. A statisticallysignificant difference was found between allinfant groups and adults for low spatialfrequency (P = 0.008) and for mediumspatial frequency (P ≤ 0.001; Figure 1).
The development of contrast sensitivitywas different for each spatial frequencyevaluated, both for term and preterm infants.Only 5 preterm and 2 term infants wereevaluated at 3 and 10 months. A greaterimprovement in sensitivity was found for themedium spatial frequency (P = 0.004) com-pared to the low spatial frequency (Figure 2).No statistically significant difference wasfound between the term and preterm con-trast thresholds for any situation: low spatialfrequency at 3 months (P = 0.858) and 10months (P = 0.571) and medium spatialfrequency at 3 months (P = 0.390) and at 10months (P = 0.857).

1393
Braz J Med Biol Res 37(9) 2004
Contrast sensitivity in full-term and premature infants
0
20
% C
ontr
ast
40
60
80
0
20
40
60
80
A B
3 Months 10 Months
0.2 cpd 4.0 cpd 0.2 cpd 4.0 cpd
Figure 2. The development ofcontrast sensitivity thresholdsfor low and middle spatial fre-quencies at 3 months (A) and10 months (B) in term andpreterm infants. The middlespatial frequency contrastthreshold developed faster inboth groups (P = 0.004; Mann-Whitney rank sum T-test).Preterm subjects are plottedwith thin lines and term infantsare plotted with thick lines.
TermPreterm
% C
ontr
ast
80
60
40
20
0
0.4 cpd
Term
Preterm
Adult
1231231234
12341234123412341234123412341234123412341234123412341234123412341234123412341234
12341234123412341234123412341234123412341234123412341234123412341234123412341234
1234123412341234123412341234123412341234123412341234123412341234123412341234123412341234
123123123123123
*
0.2 cpd
3 months 10 months Adult 3 months 10 months Adult
60
40
20
0
Figure 1. Contrast thresholdsof term and preterm infants at 3and 10 months of age and ofadults. Data are reported asmeans ± SD. No significant dif-ference was found betweenterm and preterm infants butboth differed significantly fromadults for low spatial frequency(P = 0.008; A) and for mediumspatial frequency (P ≤ 0.001; B;Mann-Whitney rank sum T-test).
A B
Discussion
The measurement of visual developmentof term and preterm infants is importantbecause the visual system of infants of thesame age but with different periods of visualexperience can be compared. This could helpto elucidate aspects of visual developmentthat still remain unknown.
Dubowitz et al. (28) showed that in thefirst weeks of life, probably up to the firstmonth, when the infants are not visuallyattentive, the VEP recordings consist oflong-latency potentials that have been sug-gested to represent the visual activity ofextra-geniculate projections from mesen-cephalic and nonspecific thalamic nuclei,
rather than from the direct and specificretino-geniculo-cortical visual pathways.After this period and coinciding with respon-sive smiling, the VEP consists of a short-latency potential, which has been attributedto activity in the retino-geniculo-striate path-way (28,29). Long-latency responses are alsopresent in children with delayed visual matura-tion and in children with cortical blindness. Theage of the infants that participated in thepresent study and their good attention to visualstimuli indicate that our recordings reflect acortical response. Another aspect indicative ofa cortical response in our VEP recordings is therelatively high temporal rate of stimulation thatwe used. At this rate the thalamic responses,which appear at a simulation frequency of
*

1394
Braz J Med Biol Res 37(9) 2004
A.G.F. Oliveira et al.
about 1 Hz, are excluded (29).We found no difference in the contrast
sensitivity of term and healthy preterm in-fants using the sweep-VEP. This result agreeswith the previously reported lack of differ-ence between term and preterm infants forvisual acuity, measured by the reversal pat-tern VEP response (16). Since we measureddifferences in contrast sensitivity processedby the visual pathway at the level of theprimary visual cortex, our result suggeststhat the primary visual cortex processing ofterm and preterm infants is closely similar.
The longer visual experience of preterminfants did not result in a lower contrastthreshold (or higher contrast sensitivity) inthe early period of life, but it could provide abackground for faster development. How-ever, our measurements at the end of the firstyear of life did not indicate this. The presentresults show that the development of con-trast sensitivity does not differ between termand preterm infants for the spatial frequen-cies that were tested. This has also beenfound for visual acuity (24). The presentresults do not confirm the conclusion byNorcia et al. (14) that 10-week-old infantsreached adult contrast sensitivity thresholdsfor low spatial frequencies. Our data indicatethat the development of contrast sensitivity ismuch slower in both term and preterm in-fants, for low than for middle spatial fre-quencies, with no difference in thresholdsbetween 3 and 10 months for the 0.2 cpdstimulus. At this age, the thresholds for lowspatial frequencies are much higher than foradults, but for the middle frequency testedthere was a large change showing thresholdsapproaching the adult value. This indicates ahigh development age for the CSF in conso-nance with what happens to visual acuity.
It is well known that visual developmentis experience-dependent. These preliminaryresults on contrast sensitivity, in associationwith other studies of spatial resolution (23,24)performed on term and preterm infants,suggest that the longer period of visual expe-
rience of preterm infants does not affect thecapacity of the visual system to resolvespatial stimuli. The experience of preterminfants probably affects the synapses of thecortical visual areas that process visual infor-mation at higher levels and in the visualassociation cortex. According to Diamond(30), the higher cortical areas are morereceptive to environmental richness than othercortical areas, with corresponding effects onbehavior.
Experience during the critical period isnecessary to guarantee the normal develop-ment of the visual pathways and their func-tions and it is well known that interruptionsof sensory experience during this period maylead to impairment of visual function (31).The length of exposure to visual experienceshould affect the development of synapses inthe association cortex in order to enable thesubject to use optimally the inputs of visualinformation. In newborn infants deprived ofpattern vision by cataracts, it has been shownthat visual acuity was not better than at birthat the time of cataract removal, regardless ofthe age of the infants (1 week to 9 months).However, 1 h of visual input was sufficientto improve visual acuity significantly, show-ing that visual acuity depends on patternedvisual input, which promotes rapid visualacuity development (32).
The present results show that the addi-tional experience of preterm infants com-pared to term infants does not improve con-trast sensitivity measured by VEP, excludingthis level of processing as a possible benefi-ciary of this experience, at least within threemonths after the onset of visual experience.Perhaps differences could have appeared atearlier ages. A possibility exists that differ-ences between preterm and term infants canbe found in behavioral measurements ofcontrast sensitivity, as shown for visualacuity by Baraldi et al. (24) and as suggestedby Diamond’s studies (30).
The questions touched upon here are alsorelevant to amblyopia, which is a condition

1395
Braz J Med Biol Res 37(9) 2004
Contrast sensitivity in full-term and premature infants
arising from deprivation of patterned vision,as opposed to the situation of the prematureinfant, who is exposed to patterned stimulifor a longer time than term infants.
The additional visual exposure due toprematurity does not allow the infants to seemuch more, but may improve the processingand use of what they see.
Acknowledgments
We are indebted to Dr. Silvia Maria Abidefrom the University Hospital of the Univer-sity of São Paulo, who referred the infantsto our laboratory.
References
1. Parraga CA, Troscianco T & Tolhurst DJ (2000). The human visualsystem is optimized for processing the spatial information in naturalvisual images. Current Biology, 10: 35-38.
2. Shapley R, Kaplan E & Purpura K (1993). Contrast sensitivity andlight adaptation in photoreceptors or in the retinal network. In:Shapley R & Lam DM-K (Editors), Contrast Sensitivity in Proceed-ings of the Retinal Research Foundation Symposia. Chap. 7. Vol. 5.MIT Press, Cambridge, MA, USA, 103-117.
3. Alexander KR, Xie W & Derlacki DJ (1997). Visual acuity andcontrast sensitivity for individual Sloan letters. Vision Research, 37:813-819.
4. Grandjean P, White RF, Sullivan K, Debes F, Murata K, Otto DA &Weihe P (2001). Impact of contrast sensitivity performance onvisually presented neurobehavioral tests in mercury-exposed chil-dren. Neurotoxicology and Teratology, 23: 141-146.
5. Porciatti V, Ciavarella P, Ghiggi MR, D’Angelo V, Padovano S, GrifaM & Moretti G (1999). Losses of hemifield contrast sensitivity inpatients with pituitary adenoma and normal visual acuity and visualfield. Clinical Neurophysiology, 110: 876-886.
6. Elliott DB & Situ P (1998). Visual acuity versus letter contrastsensitivity in early cataract. Vision Research, 38: 2047-2052.
7. Shannon E, Skoczenski AM & Banks MS (1996). Retinal illumi-nance and contrast sensitivity in human infants. Vision Research,36: 67-76.
8. Allen D, Tyler CW & Norcia AM (1996). Development of gratingacuity and contrast sensitivity in the central and peripheral visualfield of the human infant. Vision Research, 36: 1945-1953.
9. Odom JV & Green M (1984). Visually evoked potential (VEP) acuity:testability in a clinical pediatric population. Acta Ophthalmologica,62: 993-998.
10. Hamer RD, Norcia AM & Tyler CW (1989). The development ofmonocular and binocular VEP acuity. Vision Research, 29: 397-408.
11. Norcia AM & Tyler CW (1985). Infant VEP acuity measurements:analysis of the individual differences and measurement error.Electroencephalography and Clinical Neurophysiology, 61: 359-369.
12. Norcia AM & Tyler CW (1985). Spatial frequency sweep VEP: visualacuity during the first year of life. Vision Research, 25: 1399-1408.
13. Norcia AM, Tyler CW & Hamer RD (1988). High visual contrastsensitivity in the young human infant. Investigative Ophthalmologyand Visual Science, 29: 44-49.
14. Norcia AM, Tyler CW & Hamer RD (1990). Development of contrastsensitivity in the human infant. Vision Research, 30: 1475-1486.
15. Rudduck GA & Harding GFA (1994). Visual electrophysiology to
achromatic and chromatic stimuli in premature and full-term infants.International Journal of Psychophysiology, 16: 209-218.
16. Dobson V & Teller D (1978). Visual acuity in human infants: a reviewand comparison of behavioral and electrophysiological studies.Vision Research, 18: 1469-1483.
17. Mackie RT, McCulloch DL, Saunders KJ, Day RE, Phillips S &Dutton GN (1998). Relation between neurological status, refractiveerror and visual acuity in children: a clinical study. DevelopmentalMedicine and Child Neurology, 40: 31-37.
18. Harvey EM, Dobson V, Luna B & Scher MS (1997). Grating acuity andvisual-field development in children with intraventricular hemor-rhage. Developmental Medicine and Child Neurology, 39: 305-312.
19. Russel-Eggitt I, Harris CM & Kriss A (1998). Delayed visual matura-tion: an update. Developmental Medicine and Child Neurology, 40:130-136.
20. Pike MG, Holmstron G, de Vries LS, Pennock JM, Drew KJ, SonksenPM & Dubowitz LMS (1994). Patterns of visual impairment associ-ated with lesions of the pre-term infant brain. DevelopmentalMedicine and Child Neurology, 36: 849-862.
21. Jongmans M, Mercuri E, Henderson S, Vries L, Sonksen P &Dubowitz L (1996). Visual function of prematurely born childrenwith or without perceptual-motor difficulties. Early Human Develop-ment, 45: 73-82.
22. Morante A, Dubowitz LMS, Levene M & Dubowitz V (1982). Thedevelopment of visual function in normal and abnormal pre-termand full term infants. Developmental Medicine and Child Neurol-ogy, 24: 771-784.
23. Kos-Pietro S, Towle VL, Cakmur R & Spire JP (1997). Maturation ofhuman visual evoked potentials: 27 weeks conceptional age to 2years. Neuropediatrics, 28: 318-323.
24. Baraldi P, Ferrari F, Fonda S & Penne A (1981). Vision in theneonate (full term and premature): preliminary result of the applica-tion of some testing methods. Documenta Ophthalmologica, 51:101-112.
25. WHO (1975). International Classification of Diseases. Vol. 1. WorldHealth Organization, Geneva, Switzerland.
26. Costa MF, Salomão SR, Berezovsky A, Haro FMB & Ventura DF(2004). Relationship between vision and motor impairment inchildren with spastic cerebral palsy: new evidence from electro-physiology. Behavioural Brain Research, 149: 145-150.
27. Harding GFA, Odom JV, Spillers W & Spekreijse H (1996). Standardfor visual evoked potentials 1995. Vision Research, 36: 3567-3572.
28. Dubowitz LM, Mushin J, De Vries L & Arden GB (1986). Visualfunction in the newborn infant: Is it cortically mediated? Lancet, 1:1139-1141.

1396
Braz J Med Biol Res 37(9) 2004
A.G.F. Oliveira et al.
29. Kraemer M & Sjöströn A (1999). Lack of short-latency-potentials inthe VEP reflects immature extra geniculate visual function in de-layed visual maturation (DVM). Documenta Ophthalmologica, 97:198-201.
30. Diamond MC (2001). Response of the brain to enrichment. Anaisda Academia Brasileira de Ciências, 73: 211-220.
31. Hubel H & Wiesel TN (1977). Ferrier Lecture. Functional architec-ture of macaque monkey: an autoradiography study. Proceedingsof the Royal Society of London, B198: 1-59.
32. Maurer D, Lewis TL, Brent HP & Levin AV (1999). Rapid improve-ment in the acuity of infants after visual input. Science, 286: 108-110.
Copyright © 2022 FDOKUMEN