The Value of Performing Power Factor Sweep Measurements ...
19
© OMICRON Page 1 of 19 Technical Paper The Value of Performing Power Factor Sweep Measurements on Bushings – Revision #1 (Oct. 2018) Author Brandon Dupuis | [email protected]
-
Upload
khangminh22 -
Category
Documents
-
view
0 -
download
0
Transcript of The Value of Performing Power Factor Sweep Measurements ...

© OMICRON Page 1 of 19
Technical Paper
The Value of Performing Power Factor Sweep Measurements on Bushings – Revision #1 (Oct. 2018)
Author Brandon Dupuis | [email protected]

© OMICRON 2018 Page 2 of 19
Table of Contents
1 An Introduction to Performing Power Factor Sweep Measurements ..............................................3
2 Who Can Benefit from Performing the Power Factor Sweep Measurements? ...............................3 2.1 The Test Equipment Operator ........................................................................................................3 2.2 The Engineer ..................................................................................................................................4
3 Power Factor Sweep Test Analysis .....................................................................................................4 3.1 Power Factor Voltage Sweep Test (aka Voltage Tip-Up Test).......................................................4 3.2 Power Factor Frequency Sweep Test ............................................................................................5
4 Case Studies ..........................................................................................................................................6 4.1 Case Study #1 - HAEFELY 115kV Bushings (2000) ......................................................................6 4.2 Case Study #2 – Lapp POC Series 2 115kV Bushings (1998) ......................................................7 4.3 Case Study #3 – Westinghouse Electric Type-S 37kV Bushings ..................................................8 4.4 Case Study #4 – Lapp POC 138kV Bushings (1998) .....................................................................9 4.5 Case Study #5 - McGraw Edison 69kV Bushings (1978) ...............................................................9
5 Additional Cases Exhibiting “Typical” Power Factor Sweep Measurements .............................. 10 5.1 Case Study #6 - ABB O+C 115kV Bushings (1992) .................................................................... 10 5.2 Case Study #7 - ABB O+C 142kV Bushings (2010) .................................................................... 10 5.3 Case Study #8 - GE Type-U 16kV Bushings (1964) ................................................................... 11 5.4 Case Study #9 - ABB O+C 72kV Bushings (2012) ...................................................................... 11 5.5 Case Study #10 - ABB O+C 25kV Bushings (1992) .................................................................... 12 5.6 Case Study #11 - ABB O+C 25kV Bushings (1992) .................................................................... 12 5.7 Case Study #12 - ABB O+C 69kV Bushings ............................................................................... 12 5.8 Case Study #13 - ABB O+C 34.5kV Bushings (1998)................................................................. 13 5.9 Case Study #14 - McGraw Edison 69kV Bushings (1979) .......................................................... 13 5.10 Case Study #15 - VTC 69kV Bushings (2009) – Note, only H2 and H3 are sister unit bushings 13 5.11 Case Study #16 - GE Type-U 69kV Bushings (1985) ................................................................. 14 5.12 Case Study #17 - PCORE OIP 24.9kV Bushings (2013) ............................................................ 14
6 Additional Cases Exhibiting “Non-Typical” Power Factor Sweep Measurements ...................... 14 6.1 Case Study #18 - PCORE OIP 25kV Bushings (2017) ............................................................... 15 6.2 Case Study #19 - Westinghouse O+C 44kV Bushings (1988) .................................................... 15 6.3 Case Study #20 - McGraw Edison 69kV Bushings (1978) .......................................................... 15
7 Additional Cases Exhibiting “Bad” Power Factor Measurements ................................................ 16 7.1 Case Study #21 – VTC 69kV Bushings (2009) ........................................................................... 16 7.2 Case Study #22 – GE Type-U 230kV and 150kV Bushings (1983) ............................................ 16 7.3 Case Study #23 – ABB 115kV Bushings (2016) ......................................................................... 17 7.4 Case Study #24 - Lapp POC 72.5kV Bushings (1993), with Emphasis on the X1 and X3 Bushings
8 References .......................................................................................................................................... 18
9 Biography ............................................................................................................................................ 18

© OMICRON 2018 Page 3 of 19
1 An Introduction to Performing Power Factor Sweep Measurements
The Power Factor measurement has long been accepted as an invaluable tool for identifying insulation defects, such as aging, deterioration, moisture ingress, and localized failures, involving the winding and bushing insulation of a power transformer. Historically, Power Factor measurements are performed at one single test-frequency (typically 60Hz) and at one single test-voltage (typically 10kV); however, modern test instruments can perform Power Factor measurements at several different test frequencies, and at several different test-voltages, with minimal additional time and effort. Based on experience, performing Power Factor frequency sweep and voltage sweep measurements, can help identify and confirm,
• Compromised insulation
• User-error
• When the test environment is influencing a Power Factor measurement In other words, the Power Factor sweep measurements help,
1.) To better assess the condition of an insulation system 2.) To determine if the Power Factor measurements are even valid
Unfortunately, the Power Factor measurement is highly sensitive to the test environment (e.g. sensitive to moisture on the surfaces of the bushings during the time of the test), to the test connections, to the test specimen’s earth-ground connection, etc., so a simple tool that allows a user to better detect a “bad” Power Factor measurement, is a useful tool. Although Power Factor sweep measurements can be performed on the “Overall” winding insulation of a power transformer, this paper focuses on applying the sweep measurements to the C1 insulation of bushings. The benefits of performing Power Factor sweep measurements on bushing insulation are discussed and demonstrated using several field case studies. Finally, to be clear, the Power Factor sweep measurements are not the “silver-bullet” or the “holy-grail” of Power Factor testing, but I am confident that they can be beneficial for the maintenance testing industry.
2 Who Can Benefit from Performing the Power Factor Sweep Measurements?
2.1 The Test Equipment Operator
Since the Power Factor measurement is highly sensitive, obtaining the correct (i.e. the valid) Power Factor measurements in the field is challenging. In many cases, a questionable Power Factor measurement is not caused by compromised insulation, but is due to either user-error or the influence of the test environment. Unfortunately, a “bad” measurement is often not identified until the user leaves the job-site, places the transformer back into service, and returns to the office. Often, the user only has a short window of time to test a power transformer, and therefore, there is only “one shot” to obtain the correct measurements. With a Power Factor measurement at one test-voltage and at one test frequency, it is difficult for the user to determine if a Power Factor measurement is even valid; however, invalid measurements often become obvious when the Power Factor sweep measurements are performed and analyzed. Therefore, the test equipment operator should use the Power Factor sweep measurements as a tool to quickly identify and correct “bad” Power Factor measurements, before they leave the job-site with the incorrect test results.
© OMICRON 2018 Page 4 of 19
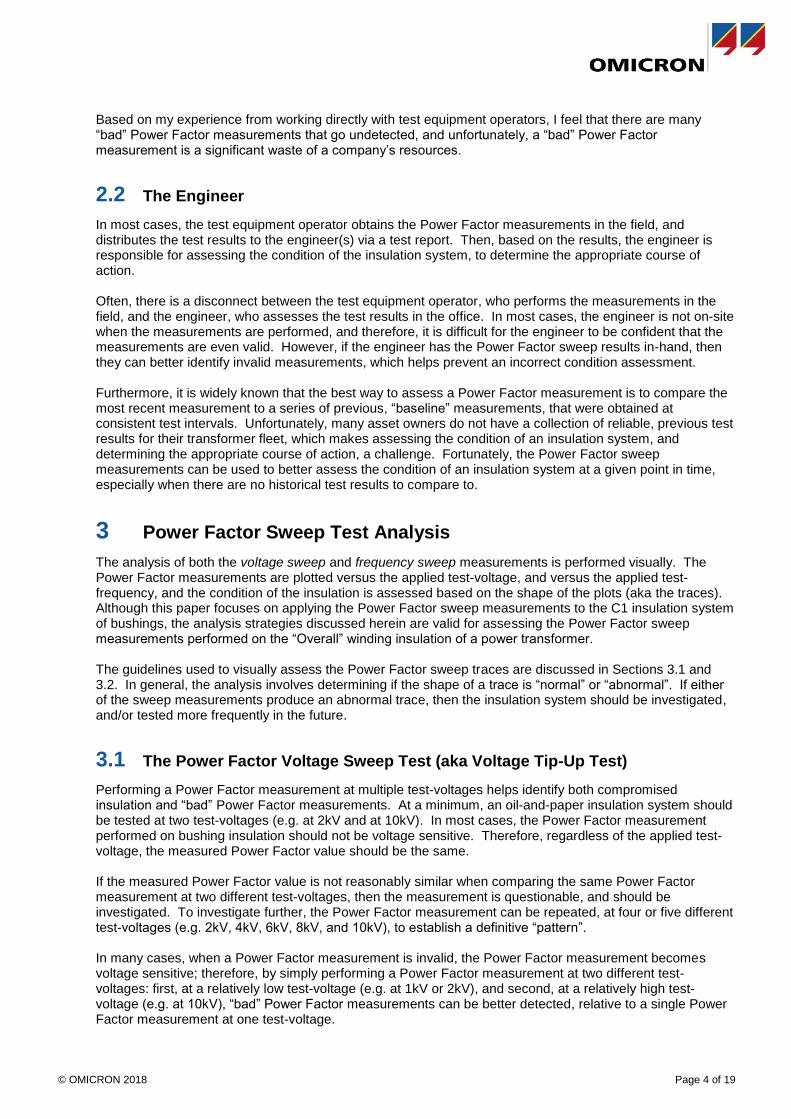
Based on my experience from working directly with test equipment operators, I feel that there are many “bad” Power Factor measurements that go undetected, and unfortunately, a “bad” Power Factor measurement is a significant waste of a company’s resources.
2.2 The Engineer
In most cases, the test equipment operator obtains the Power Factor measurements in the field, and distributes the test results to the engineer(s) via a test report. Then, based on the results, the engineer is responsible for assessing the condition of the insulation system, to determine the appropriate course of action. Often, there is a disconnect between the test equipment operator, who performs the measurements in the field, and the engineer, who assesses the test results in the office. In most cases, the engineer is not on-site when the measurements are performed, and therefore, it is difficult for the engineer to be confident that the measurements are even valid. However, if the engineer has the Power Factor sweep results in-hand, then they can better identify invalid measurements, which helps prevent an incorrect condition assessment. Furthermore, it is widely known that the best way to assess a Power Factor measurement is to compare the most recent measurement to a series of previous, “baseline” measurements, that were obtained at consistent test intervals. Unfortunately, many asset owners do not have a collection of reliable, previous test results for their transformer fleet, which makes assessing the condition of an insulation system, and determining the appropriate course of action, a challenge. Fortunately, the Power Factor sweep measurements can be used to better assess the condition of an insulation system at a given point in time, especially when there are no historical test results to compare to.
3 Power Factor Sweep Test Analysis
The analysis of both the voltage sweep and frequency sweep measurements is performed visually. The Power Factor measurements are plotted versus the applied test-voltage, and versus the applied test-frequency, and the condition of the insulation is assessed based on the shape of the plots (aka the traces). Although this paper focuses on applying the Power Factor sweep measurements to the C1 insulation system of bushings, the analysis strategies discussed herein are valid for assessing the Power Factor sweep measurements performed on the “Overall” winding insulation of a power transformer. The guidelines used to visually assess the Power Factor sweep traces are discussed in Sections 3.1 and 3.2. In general, the analysis involves determining if the shape of a trace is “normal” or “abnormal”. If either of the sweep measurements produce an abnormal trace, then the insulation system should be investigated, and/or tested more frequently in the future.
3.1 The Power Factor Voltage Sweep Test (aka Voltage Tip-Up Test)
Performing a Power Factor measurement at multiple test-voltages helps identify both compromised insulation and “bad” Power Factor measurements. At a minimum, an oil-and-paper insulation system should be tested at two test-voltages (e.g. at 2kV and at 10kV). In most cases, the Power Factor measurement performed on bushing insulation should not be voltage sensitive. Therefore, regardless of the applied test-voltage, the measured Power Factor value should be the same. If the measured Power Factor value is not reasonably similar when comparing the same Power Factor measurement at two different test-voltages, then the measurement is questionable, and should be investigated. To investigate further, the Power Factor measurement can be repeated, at four or five different test-voltages (e.g. 2kV, 4kV, 6kV, 8kV, and 10kV), to establish a definitive “pattern”. In many cases, when a Power Factor measurement is invalid, the Power Factor measurement becomes voltage sensitive; therefore, by simply performing a Power Factor measurement at two different test-voltages: first, at a relatively low test-voltage (e.g. at 1kV or 2kV), and second, at a relatively high test-voltage (e.g. at 10kV), “bad” Power Factor measurements can be better detected, relative to a single Power Factor measurement at one test-voltage.
© OMICRON 2018 Page 5 of 19
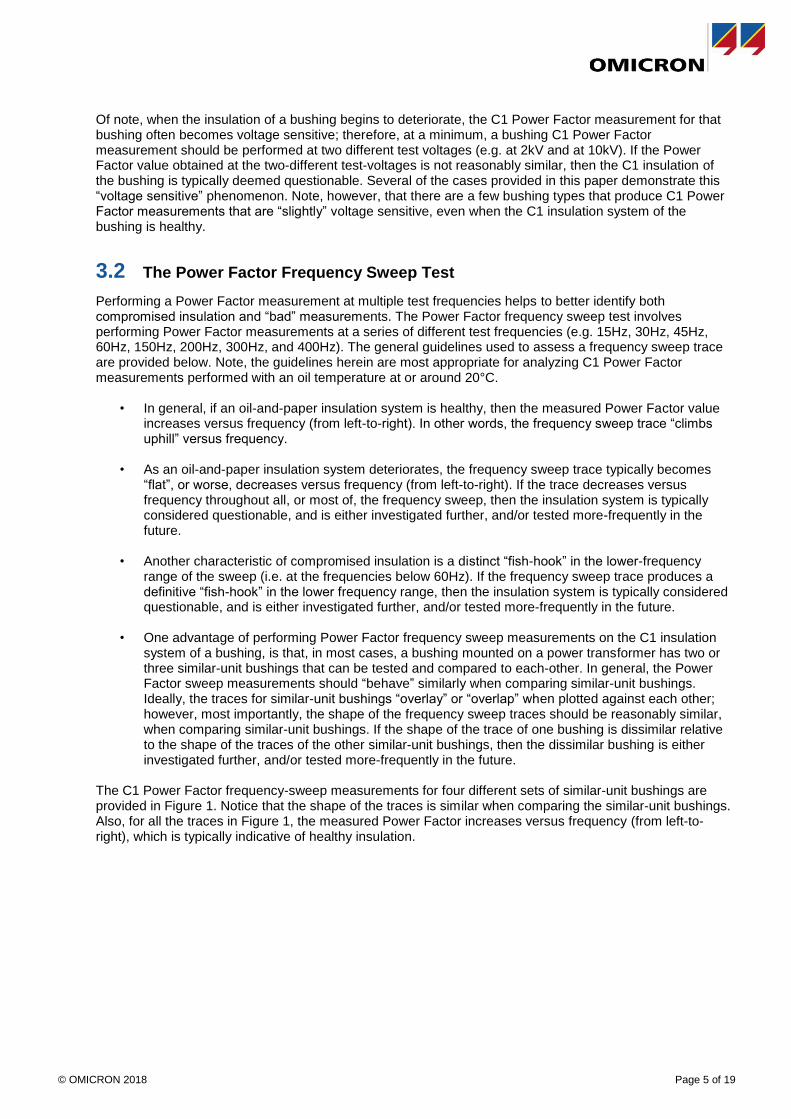
Of note, when the insulation of a bushing begins to deteriorate, the C1 Power Factor measurement for that bushing often becomes voltage sensitive; therefore, at a minimum, a bushing C1 Power Factor measurement should be performed at two different test voltages (e.g. at 2kV and at 10kV). If the Power Factor value obtained at the two-different test-voltages is not reasonably similar, then the C1 insulation of the bushing is typically deemed questionable. Several of the cases provided in this paper demonstrate this “voltage sensitive” phenomenon. Note, however, that there are a few bushing types that produce C1 Power Factor measurements that are “slightly” voltage sensitive, even when the C1 insulation system of the bushing is healthy.
3.2 The Power Factor Frequency Sweep Test
Performing a Power Factor measurement at multiple test frequencies helps to better identify both compromised insulation and “bad” measurements. The Power Factor frequency sweep test involves performing Power Factor measurements at a series of different test frequencies (e.g. 15Hz, 30Hz, 45Hz, 60Hz, 150Hz, 200Hz, 300Hz, and 400Hz). The general guidelines used to assess a frequency sweep trace are provided below. Note, the guidelines herein are most appropriate for analyzing C1 Power Factor measurements performed with an oil temperature at or around 20°C.
• In general, if an oil-and-paper insulation system is healthy, then the measured Power Factor value increases versus frequency (from left-to-right). In other words, the frequency sweep trace “climbs uphill” versus frequency.
• As an oil-and-paper insulation system deteriorates, the frequency sweep trace typically becomes “flat”, or worse, decreases versus frequency (from left-to-right). If the trace decreases versus frequency throughout all, or most of, the frequency sweep, then the insulation system is typically considered questionable, and is either investigated further, and/or tested more-frequently in the future.
• Another characteristic of compromised insulation is a distinct “fish-hook” in the lower-frequency
range of the sweep (i.e. at the frequencies below 60Hz). If the frequency sweep trace produces a definitive “fish-hook” in the lower frequency range, then the insulation system is typically considered questionable, and is either investigated further, and/or tested more-frequently in the future.
• One advantage of performing Power Factor frequency sweep measurements on the C1 insulation system of a bushing, is that, in most cases, a bushing mounted on a power transformer has two or three similar-unit bushings that can be tested and compared to each-other. In general, the Power Factor sweep measurements should “behave” similarly when comparing similar-unit bushings. Ideally, the traces for similar-unit bushings “overlay” or “overlap” when plotted against each other; however, most importantly, the shape of the frequency sweep traces should be reasonably similar, when comparing similar-unit bushings. If the shape of the trace of one bushing is dissimilar relative to the shape of the traces of the other similar-unit bushings, then the dissimilar bushing is either investigated further, and/or tested more-frequently in the future.
The C1 Power Factor frequency-sweep measurements for four different sets of similar-unit bushings are provided in Figure 1. Notice that the shape of the traces is similar when comparing the similar-unit bushings. Also, for all the traces in Figure 1, the measured Power Factor increases versus frequency (from left-to-right), which is typically indicative of healthy insulation.

© OMICRON 2018 Page 6 of 19
Figure 1 – Acceptable C1 Power Factor Frequency Sweep Traces
4 Case Studies
The following case studies demonstrate the value of performing Power Factor sweep tests on the C1 insulation of a bushing. The cases involve Power Factor sweep measurements that helped identify both compromised insulation and “bad” measurements.
4.1 Case Study #1 - HAEFELY 115kV Bushings (2000)
The first case involves the Power Factor measurements that were performed on three Haefely 115kV bushings. The Power Factor measurements are provided in Figure 2.
HAEFELY 115kV Bushings (2000)
2kV Power
Factor 10kV Power
Factor 10kV PF –
2kV PF
Nameplate Power Factor
H1 0.34% 0.34% 0.00% 0.38%
H2 0.32% 0.32% 0.00% 0.37%
H3 0.38% 0.41% 0.03% 0.35%
*Note, the measured capacitance for each bushing compared well to its respective nameplate value
Figure 2 – C1 Power Factor Results for Three Haefely 115kV Bushings

© OMICRON 2018 Page 7 of 19
Based on the results in Figure 2, the 10kV Power Factor for H3 is higher than its nameplate value, whereas the 10kV Power Factor for the other two bushings is below their respective nameplate values. Also, notice that the 2kV and 10kV Power Factor measurements for the H3 bushing are dissimilar. In contrast, the 2kV and 10kV Power Factor measurements for the H1 and H2 bushings are reasonably similar, which further suggests that the H3 measurements are abnormal. When comparing the Power Factor frequency sweep traces amongst similar-unit bushings, the shape of the traces should be reasonably similar. Clearly, the shape of the H3 trace is dissimilar relative to the traces of the other two bushings. Moreover, the H3 trace decreases versus frequency, and has the distinctive “fish-hook” in the lower frequency range, which is typically indicative of compromised insulation. Interestingly, the 10kV Power Factor for H3 is below 1.5-to-2 times its nameplate value, which the industry generally considers to be acceptable [1]; however, the H3 bushing is clearly behaving differently than the other two, similar bushings, which is cause for concern. This case demonstrates that the Power Factor sweep measurements are more sensitive to compromised insulation than the conventional 10kV Power Factor measurement. The H3 bushing should be flagged as the weak link among the three bushings, and if returned to service, should be tested more-frequently to ensure that its insulation does not rapidly fail.
4.2 Case Study #2 – Lapp POC Series 2 115kV Bushings (1998)
The second case involves the Power Factor measurements performed on three Lapp POC Series 2 115kV bushings. The Power Factor measurements are summarized in Figure 3. Note, the Power Factor frequency sweep trace for the H3 bushing is not plotted, since its 10kV Power Factor value is three times its nameplate value, which is already enough to condemn the H3 bushing. In other words, the Power Factor frequency sweep trace for the H3 bushing only confirms “what we already know”. Additionally, the 2kV and 10kV Power Factor values for the H3 bushing differ significantly, which can be used as further evidence to condemn the H3 bushing.
Figure 3 - C1 Power Factor Results for Three Lapp POC Series 2 115kV Bushings Based on the results in Figure 3, the 10kV Power Factor value for H1 is higher than its nameplate value, whereas the 10kV Power Factor value for the H2 bushing is below its nameplate value. Also, the frequency sweep trace for the H1 bushing is clearly dissimilar relative to the frequency sweep trace for the H2 bushing. The H1 trace decreases versus frequency, and has developed the distinctive “fish-hook” in the low-frequency range, which again, is typically indicative of compromised insulation. Although the 10kV Power Factor for H1 is well below 1.5-to-2 times its nameplate value, the H1 bushing is clearly behaving differently than the H2 bushing. As a result, the H1 bushing should be tested more-frequently to ensure that its insulation does not rapidly fail.

© OMICRON 2018 Page 8 of 19
4.3 Case Study #3 – Westinghouse Electric Type-S 37kV Bushings
The third case involves the Power Factor measurements performed on three Westinghouse Electric Type-S 37kV bushings. The Power Factor measurements are summarized in Figure 4.
Figure 4 - C1 Power Factor Results for Three Westinghouse Type-S 37kV Bushings
This case is particularly interesting, because it provides an example of three sister-unit bushings that produced three completely different Power Factor frequency sweep traces. The Power Factor frequency sweep trace for the H1 bushing is a “typical” example of a trace produced by a “healthy” bushing, whereas the Power Factor frequency sweep trace for the H2 bushing is a “typical” example of a trace produced by a questionable bushing; however, the Power Factor frequency sweep trace for the H3 bushing is an example of an “abnormal” or “non-typical” frequency sweep trace, which warrants concern. Although I cannot provide a definitive conclusion to the specific issue, based on experience, there appears to be a bushing insulation failure mode, where the measured Capacitance (pF) value of the bushing is significantly different, relative to its nameplate value, and relative to the other sister-unit bushings. For this type of insulation failure, in addition to the measured Capacitance (pF) value being different than expected, the Power Factor frequency sweep trace becomes more-or-less linear, and exhibits a steep incline, from left-to-right (as demonstrated by the H3 bushing in Figure 4). In addition to this case, it appears that this same phenomenon is demonstrated by Case Study #19 and Case Study #20. Interestingly, in this case, and in Case Study #20, the bushings that tested with a measured Capacitance (pF) value that is significantly different than expected, tested with a relatively low, “normal” 60Hz Power Factor value. Concluding, if the measurements provided in Figure 4 can be verified, then the insulation system of the H3 bushing has failed, and if returned to service, should be tested more-frequently to ensure that its insulation does not rapidly fail.

© OMICRON 2018 Page 9 of 19
4.4 Case Study #4 – Lapp POC 138kV Bushings (1998)
The fourth case involves the Power Factor measurements that were performed on three Lapp POC 138kV bushings. The Power Factor measurements are summarized in Figure 5.
Figure 5 - C1 Power Factor Results for Three Lapp POC 138kV Bushings Based on the results in Figure 5, the Power Factor values for all three bushings are higher than their respective nameplate values. Also, notice that the Power Factor measurement for the H2 bushing is clearly voltage sensitive. Furthermore, notice that the Power Factor frequency sweep traces for the three bushings are erratic and “jagged”. In general, “jagged” Power Factor frequency sweep traces are indicative of “bad” (i.e. invalid) Power Factor measurements. Regardless of whether an insulation system is healthy or compromised, its Power Factor frequency sweep trace should be “smooth”. By only analyzing the 10kV Power Factor measurements, it is not obvious that the Power Factor measurements for the three bushings are invalid; however, with the voltage and frequency sweep test results, it is obvious that the Power Factor measurements are “bad”. In this case, the customer determined that the primary-side bushing terminals were not short-circuited together, when the C1 Power Factor measurements were performed, and therefore, identified the cause of the abnormal Power Factor measurements.
4.5 Case Study #5 - McGraw Edison 69kV Bushings (1978)
The fifth case involves the Power Factor measurements performed on three McGraw Edison 69kV bushings. The Power Factor measurements are summarized in Figure 6.
McGraw Edison 69kV Bushings (1978)
2kV
Power Factor
10kV Power Factor
10kV PF – 2kV PF
Nameplate Power Factor
X1 0.45% 0.62% 0.17% 0.50%
X2 0.53% 0.76% 0.23% 0.50%
X3 0.43% 0.69% 0.26% 0.50%
*Note, the measured capacitance for each bushing compared well to its respective nameplate value
Figure 6 - C1 Power Factor Results for Three McGraw Edison 69kV Bushings
Based on the results in Figure 6, the Power Factor measurements for all three bushings are higher than their respective nameplate values, and the measurements are clearly voltage sensitive. Additionally, the frequency sweep traces for all three bushings are erratic and “jagged”, which again, indicates that the Power Factor measurements are invalid. The invalid measurements were most likely caused by either user-error (i.e. a problem with the test set up) or by the test environment (e.g. moisture on the surfaces of the bushings during the time of the test).

© OMICRON 2018 Page 10 of 19
Again, with both the voltage and frequency sweep measurements on-hand, invalid measurements are easier to identify. The equipment operator can use the sweep measurements to quickly identify and correct “bad” measurements in the field, before the transformer is placed back into service. Also, the engineer can use the sweep measurements to identify invalid Power Factor measurements, especially when they must rely on the data provided within a test report.
5 Additional Cases Exhibiting “Typical” Power Factor Sweep Measurements
The following section includes several cases where the bushings under test exhibited “typical” Power Factor frequency sweep and voltage sweep test results. To avoid redundancy, the following cases are provided without dialogue.
5.1 Case Study #6 - ABB O+C 115kV Bushings (1992)
ABB O+C 115kV Bushings (1992)
2kV Power
Factor 10kV Power
Factor 10kV PF –
2kV PF Nameplate
Power Factor
H1 0.25% 0.25% 0.00% 0.26%
H2 0.24% 0.24% 0.00% 0.24%
H3 0.30% 0.31% 0.01% 0.25%
*Note, the measured capacitance for each bushing compared well to its respective nameplate value
Figure 7 - C1 Power Factor Results for Three ABB O+C 115kV Bushings
5.2 Case Study #7 - ABB O+C 142kV Bushings (2010)
Figure 8 - C1 Power Factor Results for Three ABB O+C 142kV Bushings
© OMICRON 2018 Page 11 of 19
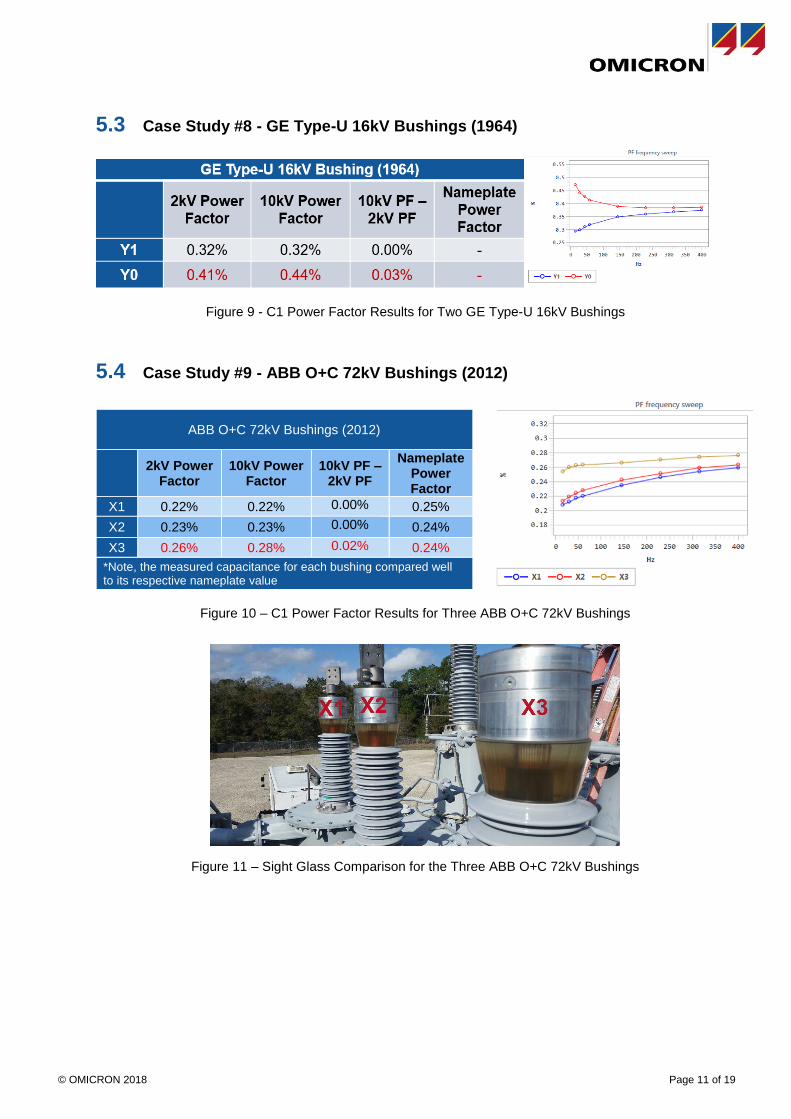
5.3 Case Study #8 - GE Type-U 16kV Bushings (1964)
Figure 9 - C1 Power Factor Results for Two GE Type-U 16kV Bushings
5.4 Case Study #9 - ABB O+C 72kV Bushings (2012)
ABB O+C 72kV Bushings (2012)
2kV Power
Factor 10kV Power
Factor 10kV PF –
2kV PF
Nameplate Power Factor
X1 0.22% 0.22% 0.00% 0.25%
X2 0.23% 0.23% 0.00% 0.24%
X3 0.26% 0.28% 0.02% 0.24%
*Note, the measured capacitance for each bushing compared well to its respective nameplate value
Figure 10 – C1 Power Factor Results for Three ABB O+C 72kV Bushings
Figure 11 – Sight Glass Comparison for the Three ABB O+C 72kV Bushings

© OMICRON 2018 Page 12 of 19
5.5 Case Study #10 - ABB O+C 25kV Bushings (1992)
ABB O+C 25kV Bushings (1992)
2kV
Power Factor
10kV Power Factor
10kV PF – 2kV PF
Nameplate Power Factor
X1 0.29% 0.31% 0.02% 0.31%
X2 0.36% 0.41% 0.05% 0.30%
X3 0.29% 0.31% 0.02% 0.31% *Note, the measured capacitance for each bushing compared well to its respective nameplate value
Figure 12 - C1 Power Factor Results for Three ABB O+C 25kV Bushings
5.6 Case Study #11 - ABB O+C 25kV Bushings (1992)
ABB O+C 25kV Bushings (1992)
2kV Power Factor
10kV Power Factor
10kV PF – 2kV PF
Nameplate Power Factor
X1 0.26% 0.29% 0.03% 0.29%
X2 0.36% 0.41% 0.05% 0.25%
X3 0.24% 0.26% 0.02% 0.28%
X0 0.24% 0.26% 0.02% 0.27%
*Note, the measured capacitance for each bushing compared well to its respective nameplate value
Figure 13 - C1 Power Factor Results for Three ABB O+C 25kV Bushings
5.7 Case Study #12 - ABB O+C 69kV Bushings
ABB O+C 69kV Bushings
2kV Power Factor
10kV Power Factor
10kV PF – 2kV PF
Nameplate Power Factor
H1 0.38% 0.41% 0.03% -
H2 0.29% 0.31% 0.02% -
H3 0.37% 0.43% 0.06% -
*Note, the measured capacitance for each bushing compared well to its respective nameplate value
Figure 14 - C1 Power Factor Results for Three ABB O+C 69kV Bushings

© OMICRON 2018 Page 13 of 19
5.8 Case Study #13 - ABB O+C 34.5kV Bushings (1998)
ABB O+C 34.5kV Bushings (1998)
2kV Power Factor
10kV Power Factor
10kV PF – 2kV PF
Nameplate Power Factor
X1 0.39% 0.42% 0.03% 0.25%
X2 0.42% 0.48% 0.06% 0.25%
X3 0.52% 0.61% 0.09% 0.31%
*Note, the measured capacitance for each bushing compared well to its respective nameplate value
Figure 15 - C1 Power Factor Results for Three ABB O+C 34.5kV Bushings
5.9 Case Study #14 - McGraw Edison 69kV Bushings (1979)
McGraw Edison 69kV Bushings (1979)
2kV Power Factor
10kV Power Factor
10kV PF – 2kV PF
Nameplate Power Factor
H1 0.46% 0.46% 0.00% 0.51%
H2 0.45% 0.45% 0.00% 0.50%
H3 0.73% 0.78% 0.05% 0.50%
*Note, the measured capacitance for each bushing compared well to its respective nameplate value
Figure 16 - C1 Power Factor Results for Three McGraw Edison 69kV Bushings
5.10 Case Study #15 - VTC 69kV Bushings (2009) – Note, only H2 and H3 are sister unit bushings
VTC 69kV Bushings (2009) – Note, only H2 and H3 are similar-unit bushings
2kV Power Factor
10kV Power Factor
10kV PF – 2kV PF
Nameplate Power Factor
H1 0.32% 0.32% 0.00% 0.31%
H2 0.36% 0.37% 0.01% 0.25%
H3 0.27% 0.27% 0.00% 0.25%
*Note, the measured capacitance for each bushing compared well to its respective nameplate value
Figure 17 - C1 Power Factor Results for Three VTC 69kV Bushings

© OMICRON 2018 Page 14 of 19
5.11 Case Study #16 - GE Type-U 69kV Bushings (1985)
GE Type-U 69kV Bushings (1985)
2kV Power Factor
10kV Power Factor
10kV PF – 2kV PF
Nameplate Power Factor
H1 0.45% 0.55% 0.10% 0.28%
H2 0.34% 0.36% 0.02% 0.27%
H3 0.33% 0.35% 0.02% 0.27%
*Note, the measured capacitance for each bushing compared well to its respective nameplate value
Figure 18 - C1 Power Factor Results for Three GE Type-U 69kV Bushings
5.12 Case Study #17 - PCORE OIP 24.9kV Bushings (2013)
Figure 19 - C1 Power Factor Results for Three PCORE OIP 24.9kV Bushings
6 Additional Cases Exhibiting “Non-Typical” Power Factor Sweep Measurements
The following section includes several cases where the bushings under test exhibited “non-typical” Power Factor frequency sweep and voltage sweep test results. To avoid redundancy, the following cases are provided without dialogue.

© OMICRON 2018 Page 15 of 19
6.1 Case Study #18 - PCORE OIP 25kV Bushings (2017)
Figure 20 - C1 Power Factor Results for Four PCORE OIP 25kV Bushings
6.2 Case Study #19 - Westinghouse O+C 44kV Bushings (1988)
Westinghouse O+C 44kV Bushings (1988)
2kV
Power Factor
10kV Power Factor
10kV PF – 2kV PF
Nameplate Power Factor
Measured Capacitance
Nameplate Capacitance
H1 0.29% 0.31% 0.02% 0.23% 267pF 270pF
H2 0.30% 0.32% 0.02% 0.21% 269pF 271pF
H3 0.69% 0.68% -0.01% 0.23% 293pF 271pF
H0 0.22% 0.22% 0.00% 0.23% 269pF 274pF
Figure 21 - C1 Power Factor Results for Three Westinghouse O+C 44kV Bushings
6.3 Case Study #20 - McGraw Edison 69kV Bushings (1978)
McGraw Edison 69kV Bushings (1978)
2kV
Power Factor
10kV Power Factor
10kV PF – 2kV PF
Nameplate Power Factor
Measured Capacitance
Nameplate Capacitance
H1 0.58% 0.59% 0.01% 0.52% 300pF 301pF
H2 0.52% 0.52% 0.00% 0.53% 248pF 298pF
H3 0.50% 0.50% 0.00% 0.51% 284pF 288pF
Figure 22 - C1 Power Factor Results for Three McGraw Edison 69kV Bushings

© OMICRON 2018 Page 16 of 19
7 Additional Cases Exhibiting “Bad” Power Factor Measurements
The following section includes several cases where the bushings under test exhibited “bad” (i.e. invalid) Power Factor measurements. To avoid redundancy, the following cases are provided without dialogue.
7.1 Case Study #21 – VTC 69kV Bushings (2009)
VTC 69kV Bushings (2009)
2kV
Power Factor
10kV Power Factor
10kV PF – 2kV PF
Nameplate Power Factor
H1 0.32% 0.36% 0.04% 0.31%
H2 0.36% 0.44% 0.08% 0.25%
H3 0.27% 0.30% 0.03% 0.25% *Note, the measured capacitance for each bushing compared well to its respective nameplate value
Figure 23 - C1 Power Factor Results for Three VTC 69kV Bushings
7.2 Case Study #22 – GE Type-U 230kV and 150kV Bushings (1983)
GE Type-U 230kV Bushings (1983)
2kV Power
Factor 10kV Power
Factor 10kV PF –
2kV PF
Nameplate Power Factor
H1 0.72% 0.53% -0.19% 0.27%
H2 0.57% 0.48% -0.09% 0.29%
H3 0.48% 0.41% -0.07% 0.28%
*Note, the measured capacitance for each bushing compared well to its respective nameplate value
Figure 24 - C1 Power Factor Results for Three GE Type-U 230kV Bushings
GE Type U 150kV Bushings (1983)
2kV Power Factor
10kV Power Factor
10kV PF – 2kV PF
Nameplate Power Factor
X1 0.32% 0.37% 0.05% 0.30%
X2 0.37% 0.37% 0.00% 0.29%
X3 0.32% 0.35% 0.03% 0.29%
*Note, the measured capacitance for each bushing compared well to its respective nameplate value
Figure 25 - C1 Power Factor Results for Three GE Type U 150kV Bushings

© OMICRON 2018 Page 17 of 19
7.3 Case Study #23 – ABB 115kV Bushings (2016)
Figure 26 - C1 Power Factor Results for Three ABB 115kV Bushings
7.4 Case Study #24 - Lapp POC 72.5kV Bushings (1993), with Emphasis on the X1 and X3 Bushings
Lapp POC 72.5kV Bushings (1993)
2kV
Power Factor
10kV Power Factor
10kV PF – 2kV PF
Nameplate Power Factor
X1 0.38% 0.37% -0.01% 0.19%
X2 1.21% 1.35% 0.14% 0.19%
X3 0.41% 0.43% 0.02% 0.18%
*Note, the measured capacitance for each bushing compared well to its respective nameplate value
Figure 27 - C1 Power Factor Results for Three Lapp POC 72.5kV Bushings
© OMICRON 2018 Page 18 of 19
8 References
[1] IEEE C57.152-2013 "IEEE Guide for Diagnostic Field Testing of Fluid-Filled Power Transformers, Regulators, and
Reactors"
9 Biography
Brandon Dupuis received a B.S. Electrical Engineering from the University of Maine. He joined OMICRON electronics Corp, in 2013, where he presently holds the position of Regional Application Specialist for transformer testing. Brandon’s focus is currently on standard and advanced electrical diagnostics for power transformers and circuit breakers. Presently, Brandon is a well-known OMICRON instructor teaching electrical transformer diagnostic testing theory, application, and test result analysis, which
includes both presentations and hands-on training. Brandon is an active member of the IEEE/PES Transformers Committee.
OMICRON is an international company serving the electrical power
industry with innovative testing and diagnostic solutions. The application of
OMICRON products allows users to assess the condition of the primary
and secondary equipment on their systems with complete confidence.
Services offered in the area of consulting, commissioning, testing,
diagnosis and training make the product range complete.
Customers in more than 140 countries rely on the company's ability to
supply leading edge technology of excellent quality. Service centers on all
continents provide a broad case of knowledge and extraordinary customer
support. All of this together with our strong network of sales partners is
what has made our company a market leader in the electrical power
industry.
For more information, additional literature, and detailed contact information
of our worldwide offices please visit our website.
www.omicronenergy.com