Continuing change in neuroticism during adulthood—structural modelling of a 16-year, 5-wave...
18
Continuing change in neuroticism during adulthood— structural modelling of a 16-year, 5-wave community study Johan Ormel a, b, *, Fru¨hling V. Rijsdijk a a Department of Social Psychiatry, Graduate School Behavior, Cognition & Neurosciences (BCN), University of Groningen, Groningen, The Netherlands b Social, Genetic, and Developmental Psychiatry Research Centre, Institute of Psychiatry, Kings College, London, UK Received 20 July 1998; received in revised form 1 February 1999; accepted 10 April 1999 Abstract During the last two decades an increasing interest can be observed in longitudinal personality data and the development of various models that can measure stability and change in these data. In general, test–retest correlations of neuroticism are generally high, but they tend to fall with increasing test–retest intervals, even in adults older than 30. We tested whether this pattern of longitudinal correlations is consistent with the Trait & State (T&S) model, which asserts that the pattern of longitudinal correlations is caused by (i) a common factor (trait); (ii) carry-over eects; and (iii) innovation eects. The T&S model disentangles the variance in neuroticism into an immutable component (trait variance) and a mutable component that changes over time according to a first order auto-regressive process, and that consists of carry-over variance and innovation variance. Two special cases of this model are the T-model (only common factor) and the S-model (only auto- regression). We fitted these models on neuroticism (N) data obtained from a random population sample of 296 subjects in 1970, 1975, 1976, 1984 and 1986. The T-model could convincingly be rejected, but both the T&S- and the S-model fitted well, showing how dicult it is to disentangle trait vs carry-over sources of dierential stability. Both models, however, yielded very similar innovation (or change) eects. The standardised 1-year auto-regression was 0.967 (S-model) and the proportion of immutable variance 38% on average (T&S model). The extrapolated 30-year test–retest correlations were 0.37 (S-model) and 0.45 (T&S model). In sum, while our results are not incompatible with an immutable component in individual dierences in neuroticism across the adult life span, they did favor the autoregression model. If replicated, our results imply a radical departure from previous research, stressing the need to search for other causes of dierential stability than trait factors. The Personality and Individual Dierences 28 (2000) 461–478 0191-8869/00/$ - see front matter # 2000 Elsevier Science Ltd. All rights reserved. PII: S0191-8869(99)00112-9 www.elsevier.com/locate/paid * Corresponding author. Tel.: +31-50-3612078; fax: +31-50-3619722. E-mail address: [email protected] (J. Ormel)
Transcript of Continuing change in neuroticism during adulthood—structural modelling of a 16-year, 5-wave...

Continuing change in neuroticism during adulthoodÐstructural modelling of a 16-year, 5-wave community study
Johan Ormela, b,*, FruÈ hling V. Rijsdijka
aDepartment of Social Psychiatry, Graduate School Behavior, Cognition & Neurosciences (BCN), University ofGroningen, Groningen, The Netherlands
bSocial, Genetic, and Developmental Psychiatry Research Centre, Institute of Psychiatry, Kings College, London, UK
Received 20 July 1998; received in revised form 1 February 1999; accepted 10 April 1999
Abstract
During the last two decades an increasing interest can be observed in longitudinal personality dataand the development of various models that can measure stability and change in these data. Ingeneral, test±retest correlations of neuroticism are generally high, but they tend to fall with increasingtest±retest intervals, even in adults older than 30. We tested whether this pattern of longitudinalcorrelations is consistent with the Trait & State (T&S) model, which asserts that the pattern oflongitudinal correlations is caused by (i) a common factor (trait); (ii) carry-over e�ects; and (iii)innovation e�ects. The T&S model disentangles the variance in neuroticism into an immutablecomponent (trait variance) and a mutable component that changes over time according to a ®rstorder auto-regressive process, and that consists of carry-over variance and innovation variance. Twospecial cases of this model are the T-model (only common factor) and the S-model (only auto-regression). We ®tted these models on neuroticism (N) data obtained from a random populationsample of 296 subjects in 1970, 1975, 1976, 1984 and 1986. The T-model could convincingly berejected, but both the T&S- and the S-model ®tted well, showing how di�cult it is to disentangle traitvs carry-over sources of di�erential stability. Both models, however, yielded very similar innovation(or change) e�ects. The standardised 1-year auto-regression was 0.967 (S-model) and the proportionof immutable variance 38% on average (T&S model). The extrapolated 30-year test±retest correlationswere 0.37 (S-model) and 0.45 (T&S model). In sum, while our results are not incompatible with animmutable component in individual di�erences in neuroticism across the adult life span, they didfavor the autoregression model. If replicated, our results imply a radical departure from previousresearch, stressing the need to search for other causes of di�erential stability than trait factors. The
Personality and Individual Di�erences 28 (2000) 461±478
0191-8869/00/$ - see front matter # 2000 Elsevier Science Ltd. All rights reserved.PII: S0191-8869(99)00112-9
www.elsevier.com/locate/paid
* Corresponding author. Tel.: +31-50-3612078; fax: +31-50-3619722.E-mail address: [email protected] (J. Ormel)

stability found in two-wave studies may have mistakenly been interpreted as re¯ecting traits. # 2000Elsevier Science Ltd. All rights reserved.
Keywords: Neuroticism; Personality; Development; Structural Equation Modelling; Continuity; Change
1. Introduction
This paper seeks to quantify the absolute and di�erential stability of neuroticism (N ) acrossadulthood and to identify the dynamic process that accounts best for the observed pattern oflongitudinal correlations. Absolute stability refers to the constancy in the quantity or amountof an attribute over time, i.e. the stability of group mean and variance, while di�erentialstability refers to the consistency of individual di�erences over time, i.e. the retention of anindividual's relative placement within the group (Caspi & Bem, 1990). Di�erential stability isoften equated with the term continuity, and usually indexed by a test±retest correlationcoe�cient. Neuroticsm (or Negative A�ectivity) is one of the ®ve major domains of personality(e.g. Costa & McCrae, 1997; McCrae & Costa, 1997). Neuroticism has great bearing formental health (e.g. Watson & Walker, 1996). During the last two decades an increasing interestcan be observed in longitudinal personality data and the development of various models thatcan measure stability and change in these data structures, including latent trait-state models(e.g. Deinzer et al., 1995; Dumenci & Windle, 1996; Eid, Notz, Steyer & Schwenkmezger,1994), auto-regressive latent trait-state models (e.g. Duncan-Jones, Fergusson, Ormel &Horwood, 1990; Kenny & Campbell, 1989; Kenny & Zautra, 1995; Ormel & Schaufeli, 1991).
Our interest in the temporal characteristics of neuroticism during adulthood has threeorigins. Firstly, there is evidence suggesting that neuroticism, as measured with standardpersonality questionnaires like the EPQ or NEO, is a marker of vulnerability to emotionaldisorders. Neuroticism has been shown to predict onset, duration, and outcome of mild andsevere depression. Information on the stability and change, both absolute and di�erential, willbe relevant for understanding the temporal dynamics of vulnerability. Secondly, measures ofneuroticism covary with mental health status over time (e.g. Duncan-Jones et al., 1990),suggesting that current mental health status in¯uences the measurement of neuroticism or thatneuroticism is responsive to some of the environmental determinants of mental health, such asexposure to stressors and e�ective treatment. If true, di�erential change in neuroticism may bemore common compared to other personality domains. Quanti®cation of the change inneuroticism and its determinanst may be helpful in ®nding ways to reduce vulnerability toemotional disorder. Thirdly, meeting our objectives may enhance the knowledge of thedevelopment of a major domain of personality across the adult life course.
What seems most important to know is the amount of di�erential stability (and change) andto what extent this stability is due to a trait factor or to (very) slow, but continuing andcumulating change. In general, studies of individuals across the life course ®nd that intellectualperformance shows the strongest di�erential continuities; personality traits are next; andpolitical attitudes of self-opinions are last (Caspi & Bem, 1990; Conley, 1984). Regardingneuroticism most longitudinal studies (see for review Conley, 1984; Costa & McCrae, 1992;
J. Ormel, F.V. Rijsdijk / Personality and Individual Di�erences 28 (2000) 461±478462

Costa, McCrae & Arenberg, 1980; Ormel, 1983; Watson & Clark, 1984; Watson & Walker,1996) report considerable absolute stability during the adult life course, i.e. no substantial age-related shifts in mean scores during adulthood after age 30 (except perhaps during exposure tosevere neurological disorders in old age). With regard to di�erential stability, or rank order,the studies found that test±retest correlations do fall unmistakably with increasing intervals.This is most clearly seen in the test±retest correlations from 55 studies reviewed by Watson andClark (1984) in their paper on negative a�ectivity. These test±retest correlations suggest thatthere is a steady drop-o� in test±retest correlation with increasing intervals, in particular after5 months and until approximately 5±6 years. Test±retest correlations are high in the ®rst 5months (above 0.80), then drop to 0.50±0.60 during the following 5±6 years, but seem to waxand wane around 0.55 in the years thereafter. The few test±retest correlations spanning morethan 25 years range from 0.40 to 0.60, but all involved small volunteer samples (Costa &McCrae, 1992; Finn, 1986; Watson & Clark, 1984).This pattern of longitudinal correlationsÐdecreasing test±retest correlation with increasing
intervals during intervals of less than 5 years followed by a levelling o� of the decrease withlonger intervalsÐsuggests the workings of two processes: a trait process producing di�erentialstability and a ®rst-order auto-regressive process producing di�erential change.The Trait (or common factor) model (T-model) as illustrated in Fig. 1a asserts that
neuroticism is correlated over time only as a result of one or more underlying traits which are(largely) immutable in adulthood. Random shocks due to biological or psychosocial events andmeasurement error may temporarily increase or decrease neuroticism scores but normalisingforces tend to neutralise the deviations and return neuroticism levels back to their person-characteristic level. The common-factor model implies that the correlation between N at time tand time t + 1 will be more or less stable, independent of the length of interval (assumingstable trait expression over time). The minor drop o� in test±retest correlations for intervalsexceeding 5 years concur with a Trait model; the earlier steady drop o� however does not.The ®rst-order auto-regressive (or simplex) State model (S-model, Fig. 1b) posits that
neuroticism changes continuously at a particular rate with an over-time correlation (carry-overor transmittable component). The innovation (or change) may be brought about by eventscapable of producing a long lasting or permanent change in an individual's characteristicneuroticism level. Events with this capacity may be rare, but seen over the life span mostpersons may experience some of these. The rate of di�erential change depends on the incidenceof such events and their distribution in the population. In this model, all longitudinalcorrelations result from carry-over e�ects (transmission e�ects). This model implies that test±retest correlations decrease steadily as the time interval increases, and with a su�ciently longinterval will drop close to zero. The various test±retest correlations reported in the literaturefor intervals shorter than 5 years concur with a auto-regressive state model.Both models form rather extreme positions. A mixed model, denoted as the Stability-and-
Change model (Duncan-Jones et al., 1990; Ormel & Schaufeli, 1991) and as the auto-regressiveTrait-State-Error model (Kenny & Campbell, 1989; Kenny & Zautra, 1995) in Fig. 1c, seemsmore in accord with the overall pattern of longitudinal correlations reported in the literature.This mixed model (further denoted as the Trait-and-State (T&S) model asserts thatlongitudinal correlation is caused by both common factors and carry-over e�ects. This modelimplies that correlations will fall with time, but the constant in¯uence of the immutable
J. Ormel, F.V. Rijsdijk / Personality and Individual Di�erences 28 (2000) 461±478 463

component will ensure that it never falls close to zero, because it represents variance in aperson's score that does not change over time. The T&S-model disentangles the total variancein neuroticism into an immutable or trait component and a component that changes over timeaccording to a ®rst order auto-regressive process, representing state variance. State variance attime t, in turn, consists of carry-over variance from time t ÿ 1 and innovation variance, changesince time t ÿ 1. The ®nal source of variance represents random variance that does notcorrelate over time (measurement error). Both the Trait and the State model are special casesof the T&S model.It seems reasonable to assume that the immutable component re¯ects the e�ects of
underlying genetic characteristics and (early) childhood experiences (Eysenck & Eysenck, 1975;
Fig. 1. (a) Common pathway (Trait) model; (b) First-order autoregression (State) model; and (c) Trait-State model.
J. Ormel, F.V. Rijsdijk / Personality and Individual Di�erences 28 (2000) 461±478464

Watson & Clark, 1984; Costa & McCrae, 1986). The changing component, on the other hand,arises probably from the e�ects of processes that act over a particular time period. Changeagents in adults are likely to include various transitory social, psychological and biologicalevents. Some of these events may set into motion an accumulation of fortune or misfortune,persistent physiological change resulting perhaps in permanent changes in a person'sneuroticism level. The high absolute stabilitity of neuroticism during adulthood (mean scoresdo not consistently change with ageing) suggests that ageing itself is probably not involved inthe change of individual di�erences, as this would imply a steady increase or decrease of meanscores with ageing.In this paper we will ®rst brie¯y describe the technical details of the T&S model which
allows the testing of the three models outlined above. Each of the models can be subjected toan explicit statistical test using structural equation modelling techniques. Since some evidencesuggests that personality continues to develop and evolve during adolescence and eventhroughout the 20s (Costa & McCrae, 1994; Stein, Newcomb & Bentler, 1994), we performedanalyses both with and without subjects younger than 30 at the ®rst test occasion. Strengths ofthis study are: (i) the use of a random population sample; and (ii) the inclusion of subjects withincomplete data, and the multiwave data covering 16 years in total.
2. Method
2.1. Subjects and design
In the context of a longitudinal study of well-being and demoralisation neuroticism datawere collected on ®ve occasions (in 1970, 1975, 1976, 1984, and 1986) from 296 to 224 adults(Ormel, 1980; Ormel & Wohlfarth, 1991; Sanderman, 1988). The 1970 cross-sectional study onillness behavior (Jessen, 1974) consisted of 1886 persons (a 1:5000 random sample of the Dutchadult population), of whom 1622 (86%) completed the 1970 cross-sectional study. In 1975 weselected at random 383 subjects out of the 1622 for the longitudinal study of well-being anddemoralisation (due to limited resources no more could be included). These 383 wereapproached in 1975 with the request whether they wanted to participate in a longitudinalstudy. Two hundred and ninety-six out of the 383 were willing, and completed the 1975 and1976 interviews (77.1%). In 1984 new funding was obtained and the 296 were againapproached for two more assessments in 1984 and 1986. Two hundred and twenty-four out ofthe 296 completed both assessments (75.6%; Sanderman, 1988).While about one ®fth of all non-response was due to death or emigration, the vast majority
was due to `no time' or `not interested anymore'. Mean age of the 1970 sample was 34.27 years(range: 16±63, SD 11.82). The means and standard deviations for age at each wave arereported for males and females separately in Table 2 and in Table 3 for the total sample.Due to an over sampling from the high neuroticism stratum, subjects with relatively high
scores are somewhat over represented in the longitudinal sample (Ormel, 1983). Therefore, wetested whether exclusion of these over sampled high neuroticism subjects a�ected the estimates.
J. Ormel, F.V. Rijsdijk / Personality and Individual Di�erences 28 (2000) 461±478 465
2.2. Measures
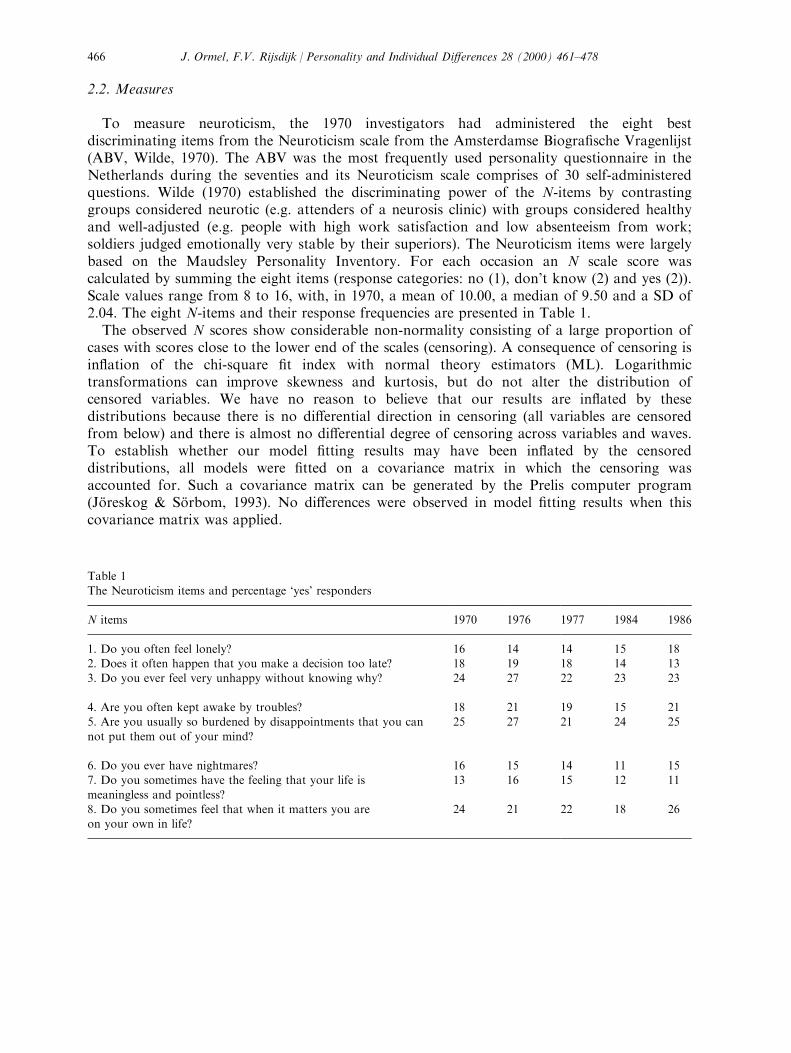
To measure neuroticism, the 1970 investigators had administered the eight bestdiscriminating items from the Neuroticism scale from the Amsterdamse Biogra®sche Vragenlijst(ABV, Wilde, 1970). The ABV was the most frequently used personality questionnaire in theNetherlands during the seventies and its Neuroticism scale comprises of 30 self-administeredquestions. Wilde (1970) established the discriminating power of the N-items by contrastinggroups considered neurotic (e.g. attenders of a neurosis clinic) with groups considered healthyand well-adjusted (e.g. people with high work satisfaction and low absenteeism from work;soldiers judged emotionally very stable by their superiors). The Neuroticism items were largelybased on the Maudsley Personality Inventory. For each occasion an N scale score wascalculated by summing the eight items (response categories: no (1), don't know (2) and yes (2)).Scale values range from 8 to 16, with, in 1970, a mean of 10.00, a median of 9.50 and a SD of2.04. The eight N-items and their response frequencies are presented in Table 1.The observed N scores show considerable non-normality consisting of a large proportion of
cases with scores close to the lower end of the scales (censoring). A consequence of censoring isin¯ation of the chi-square ®t index with normal theory estimators (ML). Logarithmictransformations can improve skewness and kurtosis, but do not alter the distribution ofcensored variables. We have no reason to believe that our results are in¯ated by thesedistributions because there is no di�erential direction in censoring (all variables are censoredfrom below) and there is almost no di�erential degree of censoring across variables and waves.To establish whether our model ®tting results may have been in¯ated by the censoreddistributions, all models were ®tted on a covariance matrix in which the censoring wasaccounted for. Such a covariance matrix can be generated by the Prelis computer program(JoÈ reskog & SoÈ rbom, 1993). No di�erences were observed in model ®tting results when thiscovariance matrix was applied.
Table 1
The Neuroticism items and percentage `yes' responders
N items 1970 1976 1977 1984 1986
1. Do you often feel lonely? 16 14 14 15 182. Does it often happen that you make a decision too late? 18 19 18 14 133. Do you ever feel very unhappy without knowing why? 24 27 22 23 23
4. Are you often kept awake by troubles? 18 21 19 15 215. Are you usually so burdened by disappointments that you can
not put them out of your mind?
25 27 21 24 25
6. Do you ever have nightmares? 16 15 14 11 157. Do you sometimes have the feeling that your life is
meaningless and pointless?
13 16 15 12 11
8. Do you sometimes feel that when it matters you areon your own in life?
24 21 22 18 26
J. Ormel, F.V. Rijsdijk / Personality and Individual Di�erences 28 (2000) 461±478466

2.3. Statistics
Descriptive statistics as well as model ®tting were accomplished by the SEM program Mx(Neale, 1995). Subjects with incomplete data were included in the analyses, as Mx provides anumber of methods of handling incomplete data by using raw maximum likelihood estimation,in which minus twice the log-likelihood (ÿ2�LL) of the data for each observation is calculated.This implies that there is no overall measure of ®t, but there are relative measures of ®t, sincedi�erences in ®t function between sub-models are distributed as w 2. By comparing the ÿ2�LLof our models with the ÿ2�LL of the saturated model, a w 2 ®t index is obtained. The degrees-of-freedom for this test is equal to the di�erence in df of the two models (Neale & Cardon,1992). Because the three proposed models are nested (i.e., all of one model's free parametersare a subset of the other model's free parameters), w 2-di�erence tests can be performed inorder to compare the ®t of competing models.Information about the precision of parameter estimates (and their explained variance) in Mx
were obtained by likelihood-based Con®dence Intervals (CIs) rather than standard errors. Inthis method a parameter is progressively moved away from its maximum likelihood estimate ineither direction (while the other model parameters are optimised) until the di�erence in ®t,distributed as w 2 with one degree of freedom, is signi®cant. For 95% CI the 0.05 level ofsigni®cance is >>3.84 in each direction (Neale & Miller, 1997).Maximum likelihood estimates of the correlations among the longitudinal N scores and their
standard deviations can be obtained by ®tting a saturated model to the raw N data. Because amodel for the means is incorporated when analysing raw data, tests for equality in meansacross time points can be performed as well. In addition, the possibility of simultaneouslyanalysing multiple samples permits tests for equality in means, standard deviations andcorrelations across groups (e.g. males and females). The ®t of models which constrainparameter estimates of means and SD to be equal across time points or groups can becompared to the ®t of models which allow them to vary.
2.4. Description of the general Trait-and-State model
The Trait-and-State (T&S) model for ®ve time points depicted in Fig. 1c assumes that thesubject's N level at each time point is the function of three latent (unobserved) variables: a traitcomponent (T ), a state component (S ), and a residual term (E ), including measurement error,which is not accounted for by T or S. This model assumes that a person's N level remainsstable in the absence of change agents. Conversely, changes in N are indicative of the e�ects ofnon-observed change agents which cause N levels to deviate from the subject's stable andcharacteristic N level. The across time structure of the latent State variable is suggested torepresent an auto-regressive model which re¯ects carry-over e�ects and the e�ects of changeagents to which the subject has been exposed during a particular interval. The relationshipsbetween subsequent states are described by regression coe�cients (B21±B54). The state variance,thus, is composed of variance transmitted from an earlier time point (which in a waycontributes to `stability' during that interval) and innovation variance speci®c to each timepoint (Z ). The Z-factors represent that part of the variance of the latent S variables that is notaccounted for by the preceding state but are part of every subsequent one. Z represents the
J. Ormel, F.V. Rijsdijk / Personality and Individual Di�erences 28 (2000) 461±478 467

component of S that results from exposure to new change agents. The e�ect of the trait factor(T ) on the N scores is assumed to be equal over time in adulthood. To solve the model, it isnecessary to assume that the subject's trait level (T ) is statistically independent of the statecomponent (S ).The standardised auto-regression coe�cients are estimates of the correlation between latent
state variables St and St+1. Correlations between non-adjacent points is given by the productof the auto-regression coe�cients that make up that speci®c interval.We tested whether the correlation between St and St+1 (in both the S and T&S model) is
constant per year and, thus, declines as an exponential function of the standardised 1-yearauto-regression coe�cient (B32), the exponent being the time lap in years. A model in whichB21, B43, and B54 were constrained to be a function of (B32) was compared to a model that didnot impose these constraints (please apply to the authors for more details). In order toconstrain the standardised Bs, the latent State variables were speci®ed to have unit varianceand the paths from latent State variables to observed N scores were estimated. The reportedestimates of the model, thus, include both standardised auto-regressive and innovationestimates and unstandardised estimates for the paths linking the latent T and (or) S variable(s)and E variables to the observed N scores. The squares of the unstandardised parametersprovide estimates of the amount of explained variance at each time point for T, S and E,respectively. The variance accounted for by the auto-regressive and innovation part peroccasion can be calculated ad hoc according to the percentage explained variance (squaredstandardised estimates) given by Mx.
3. Results
3.1. Gender di�erences
There were no signi®cant sex di�erences in mean age and variance in age at any time point(Table 2). For time 1, 2 and 3 (same sample) the t-test for equality in means shows a 2-tailsigni®cance of 0.72 (P> 0.05), meaning that the H0 of equal means is not rejected. For sexdi�erences in age at time 4 and 5 the 2-tail signi®cance is 0.48 and 0.79, respectively. Variancein age was equal for males and females across time points. For time 1, 2 and 3 the F values ofthe equality of variances tests were 1.39, P= 0.24; for time 4 and 5 these were 0.989, P= 0.32and 1.20, P= 0.27.Descriptive statistics for neuroticism (N ) mean scores and correlations are presented in Table
2 for males and females separately. The mean N scores were signi®cantly higher for females atany time point. For time 1±5 the ®t of the saturated model (simultaneously ®tted to the maleand female group) dropped signi®cantly when means were equated across sexes (Dw 2(1)=16.09,23.63, 14.54, 19.73 and 16.88, P< 0.001).Standard deviations of the N scores were equal for males and females at any time point
(Dw 2(5)=4.29, P= 0.51). Nor were sex di�erences observed for the correlation matrices(Dw 2(10)=14.65, P= 0.15). Because of the small sample size the group was therefore pooledacross sexes for further model ®tting analyses.
J. Ormel, F.V. Rijsdijk / Personality and Individual Di�erences 28 (2000) 461±478468

3.2. ML estimates of (co)variances and correlations
Descriptive statistics for N means and correlations between the ®ve time points for the totalsample are presented in Table 3. The standard deviations for the N scores could be set equalacross time points without signi®cant drop in ®t of the saturated model (Dw 2(4)=7.83,P= 0.098). The mean N scores at time 1, 2, and 5 could be set equal, whereas, those at time 3and 4 could not, which indicates a signi®cant drop in mean.When we order the correlations by length of time interval, the same structure as observed in
the literature is seen: correlations are higher for shorter time intervals and lower as length ofintervals increase. There is one di�erence: the steady decline in correlation with increasingintervals continues also with intervals longer than 5±6 years. Even so the correlation betweenthe ®rst and last measurement (interval of nearly 16 years) is still substantial, (r = 0.45).
Table 3Maximum likelihood estimates of the variances (diagonal), covariances (above diagonal) and correlations with 95%
CIs (below diagonal) of the 5-wave Neuroticism scores, mean N scores and mean age per wave for the total sample
1970 1975 1976 1984 1986 Mean N
(SD)
Mean age
(SD)
na
1970 4.138 2.679 2.538 1.945 1.960 10.00 (2.03) 34.27 (11.82) 296
1975 0.665 (0.60±0.72) 3.922 2.964 2.138 2.155 10.06 (1.98) 39.27 (11.82) 2961976 0.619 (0.54±0.68) 0.742 (0.69±0.79) 4.066 2.197 2.346 9.82 (2.02) 40.27 (11.82) 2961984 0.509 (0.41±0.60) 0.574 (0.49±0.65) 0.580 (0.49±0.65) 3.532 2.788 9.74 (1.88) 48.15 (11.76) 2561986 0.451 (0.34±0.55) 0.509 (0.41±0.59) 0.544 (0.45±0.63) 0.694 (0.62±0.75) 4.568 9.98 (2.14) 49.69 (11.71) 224
a n= number of observations.
Table 2Maximum likelihood estimates of the correlations between the 5-wave Neuroticism scores, mean N scores and mean
age per wave (males below and females above diagonal)
1970 1975 1976 1984 1986 Mean N
(SD)
Mean age
(SD)
na
1970 1 0.633 0.654 0.475 0.432 10.50 (2.07) 34.01 (12.31) 139
1975 0.653 1 0.727 0.543 0.422 10.65 (2.00) 39.01 (12.31) 1391976 0.535 0.727 1 0.548 0.475 10.30 (2.13) 40.01 (12.31) 1391984 0.482 0.542 0.564 1 0.643 10.27 (1.90) 47.62 (12.09) 123
1986 0.402 0.532 0.573 0.704 1 10.55 (2.11) 49.48 (12.07) 109Mean N(SD)
9.56 (1.89) 9.54 (1.82) 9.40 (1.81) 9.26 (1.73) 9.47 (2.04)
Mean age
(SD)
34.5 (11.41) 39.5 (11.41) 40.5 (11.41) 48.65 (11.47) 49.89 (11.40)
n 157 157 157 133 115
a n= number of observations.
J. Ormel, F.V. Rijsdijk / Personality and Individual Di�erences 28 (2000) 461±478 469

3.3. No ageing e�ects
Age did not correlate signi®cantly with neuroticism at any time point. At further inspectionwe examined whether the variances of N and their longitudinal covariances varied as afunction of two age groups: old (age >30 in 1970, n = 164, mean age=43.4, SD age=7.48)and young (<age 31 in 1970, n = 132, mean age=23, SD age=3.7), and ®tted a two-groupmodel. Comparison of the ®t statistic obtained when the covariance is constrained to be equalin the two groups to that obtained when they are set free provides a test of heterogeneity. Thiswas accomplished by specifying a two-group (old±young) saturated model in Mx. The means,SD and correlation matrices could be set equal across groups without deterioration in ®t:(Dw 2(5)=6.08, P= 0.298; Dw 2(5)=2.46, P= 0.783 and (Dw 2(10)=14.07, P= 0.170,respectively). Thus, di�erential stability and variance of N appear independent of age duringyoung and middle adulthood.
3.4. Tests for selective attrition
It is important to examine the extent to which sample attrition has introduced non-responsebias. Since the 1970 data of the non-responders in 1976 (n = 87) were not available anymore(analyses carried out in 1980 showed that 1970 N scores did not predict non-response in 1976,Ormel, 1980), testing whether selective dropout at times 4 and 5 had occurred was impossible.Mean N scores of time 1±3 were compared between subjects with missing values on time 5(n = 72) and the subjects who completed the study (n = 224). Mean N scores for the`completers' at time 1, 2 and 3 were 9.92, 10.13 and 9.79; for the `dropouts' these scores were10.26, 9.86 and 9.90. ML tests for equality in means between these subgroups showed thatmean N scores at time 1 and 3 were not signi®cantly di�erent (D2w(1)=1.49 and 1.64,P= 0.222 and P= 0.200), whereas N on occasion 2 was signi®cantly lower for the dropouts(Dw 2(1)=7.32, P= 0.007). Since signi®cant di�erences in mean scores were not consistentacross time points (and in another direction than one would expect) the odds are againstselective dropout of higher neurotic individuals.Additionally, standard deviations and correlations could be equated across groups without
signi®cant decline in ®t of the saturated model simultaneously ®tted to the two groups(Dw 2(6)=1.17, P= 0.978). Neither did we ®nd a signi®cant drop in ®t when age of `dropouts'(mean age=36.1, n = 72) was set equal to age of `stayers' (mean age=33.7, n = 223):(Dw(1)=2.15, P= 0.14. The di�erence in SD of age (dropouts=11.99, stayers=11.70) was alsonot signi®cant: (Dw 2(1)=0.13, P= 0.72).We therefore assume that the following model ®tting results of the covariances across time
are not biased by non-random attrition during the large interval from waves 2 and 3 to waves4 and 5.
3.5. Model ®tting results
We ®rst tested whether the auto-regression between latent State variables is constant peryear and, thus, declines as an exponential function of the standardised 1-year auto-regressioncoe�cient (please apply to the authors for more details). We speci®ed S and T&S models in
J. Ormel, F.V. Rijsdijk / Personality and Individual Di�erences 28 (2000) 461±478470

which the regression coe�cients B21, B43 and B54 were constrained to be equal to thestandardised 1-year auto-regression coe�cient (B32) to the power n, where n is the mean timelap in years. The ®t of these models was not signi®cant worse than that of the unconstrainedones (Dw 2(3)=2.35 and 1.33, P= 0.503 and P= 0.722, respectively) and the auto-regressionconstraints were maintained.Model ®tting results for N are reported in Table 4. The relative ®t of the Trait-, State-, and
T&S-models compared to the saturated model are represented as w 2 in the third column. Thethree models are nested and, thus, can be directly compared. The results suggest that thecovariance pattern of the 5-wave N data can not be explained by a trait factor, as indicated bythe poor ®t of the T-model. The T&S-model ®tted very well, but strictly based on principles ofparsimony the T-factor can be dropped without signi®cant deterioration in ®t (Dw 2(1)=2.4,P= 0.121), resulting in the more simple S-model (see Table 5). The insigni®cance of the T-factor was also shown by the 95% CI lower limit of 0% of its variance in the T&S-model(Table 6). However, the upper limit of the 95% CI suggests that on average 38% of thevariance in N can be explained by the T-factor. We therefore can not fully discard the T&S-model for N.
Table 4Model ®tting results of the Neuroticism scores
Model ÿ2�LL df w 2 df P
Saturated 5066.53 1348 ± ± ±Trait-Statea 5068.71 1355 2.18 7 0.949Trait (one-factor) 5134.95 1357 68.42 9 0.000
State (auto-regression)b 5071.11 1356 4.58 8 0.801
a Trait variance (in the T&S-model) is around 38% (95% CI=0±55%).b Estimated 1-year auto-regression is 0.967. Estimated 16-year AR-coe�cient is 0.60, (95% CI=0.50±0.69).
Extrapolated 30-year AR-coe�cient is 0.37 (95% CI=0.26±0.50).
Table 5Proportion variances (and 95% CIs) explained by the di�erent factors of the State model ®tted on the Neuroticismscores
Variances in %
VInnovation VTransmittable VStatea VError
1970 77 (71±81) ± 77 (71±81) 23 (19±29)
1975 22 (16±28) 54 (47±60) 76 (70±80) 24 (20±30)1976 5 (3±8) 71 (66±76) 76 (71±81) 24 (19±29)1984 30 (22±38) 43 (35±50) 73 (66±78) 27 (22±34)1986 8 (6±11) 71 (66±76) 79 (73±83) 21 (17±27)
a VState=VInnovation+VTransmittable.
J. Ormel, F.V. Rijsdijk / Personality and Individual Di�erences 28 (2000) 461±478 471

In Figs. 2 and 3 parameter estimates of the S- and T&S models are reported. The proportionvariances (%) of the N scores explained by auto-regression, error and trait components (withthe 95% CI) are reported in Tables 5 and 6.The S-model coe�cients may be interpreted as follows:
1. The squares of the standardised estimates of the paths linking the observed N scores to thelatent State factors estimate the amount of variance in N explained by the auto-regressive(State) construct. This e�ect is very large (78% on average) even when the lower bounds ofthe CIs are considered, suggesting an error variance of 24% on average.
2. When the in¯uences of the auto-regressive part are further partitioned it can be seen thattransmittable (carry-over) variance from earlier time points constitute the largest part of thise�ect (except for the ®rst occasion).
3. Carry-over e�ects tend to increase as the time interval between subsequent measurementpoints decreases and vice versa: at occasion 3 and 5, 71% of the variance on N is accounted
Table 6Proportion variances (and 95% CI) explained by the di�erent factors of the Trait-State model ®tted on the
Neuroticism scores
Variances in %
VTrait VInnovation VTransmittable VStatea VError
1970 37 (0±54) 41 (24±80) ± 41 (24±80) 22 (18±28)1975 39 (0±58) 21 (14±29) 17 (3±58) 38 (19±79) 23 (19±29)1976 38 (0±56) 6 (4±10) 34 (15±74) 40 (21±79) 22 (18±28)
1984 43 (0±60) 23 (12±35) 8 (1±48) 31 (14±76) 26 (20±32)1986 32 (0±47) 11 (6±20) 37 (19±74) 48 (33±82) 20 (15±24)
a VState=VInnovation+VTransmittable.
Fig. 2. Path coe�cients of the State model for the neuroticism data.
Note: Variance of latent S= 1 and paths from S to N are estimated. This implies that AR-coe�cients andinnovation e�ects are standardised and that the amount of variance they account for at each point can be calculatedfrom the squared S to N estimates (State variance), e.g. for time 2: AR variance is 2.131 (72% of 1.7262) and
innovation variance is 0.846 (28% of 1.7262). These are 54% and 22% of the total time 2 N variance, respectively(see Table 5).
J. Ormel, F.V. Rijsdijk / Personality and Individual Di�erences 28 (2000) 461±478472
for by variance at the previous time point (intervals 1 and 2 years). This e�ect is stillconsiderable (43%) between occasion 3 and 4 which re¯ects the largest time interval (8years). Note that the correlations between the latent State variables are a function of theone-year AR coe�cient, but the percentage transmittable variances are not, as they dependon the variances of the N score.
4. By the imposed constraints on the B weights, decrease in time interval is re¯ected byincrease of the regression coe�cients. The standardised one-year auto-regression (betweentime 2 and 3) is 0.967. The 16-year auto-regression is the product of the 4 ARcoe�cients=0.60 (with 95% CI 0.50±0.69) or simply 0.96715.42 (based on the mean timelapse the total interval is 15.42 years). As there is no trait factor in the S-model, the 16-yearauto-regression equals the 16-year test±retest correlation attenuated for measurement error.
5. Space for new e�ects (innovation) depends on the proportion of transmittable variance, andthus on the length of the time interval and on the variance in N. Variance in N at time 1 issolely due to innovation e�ects (79%).
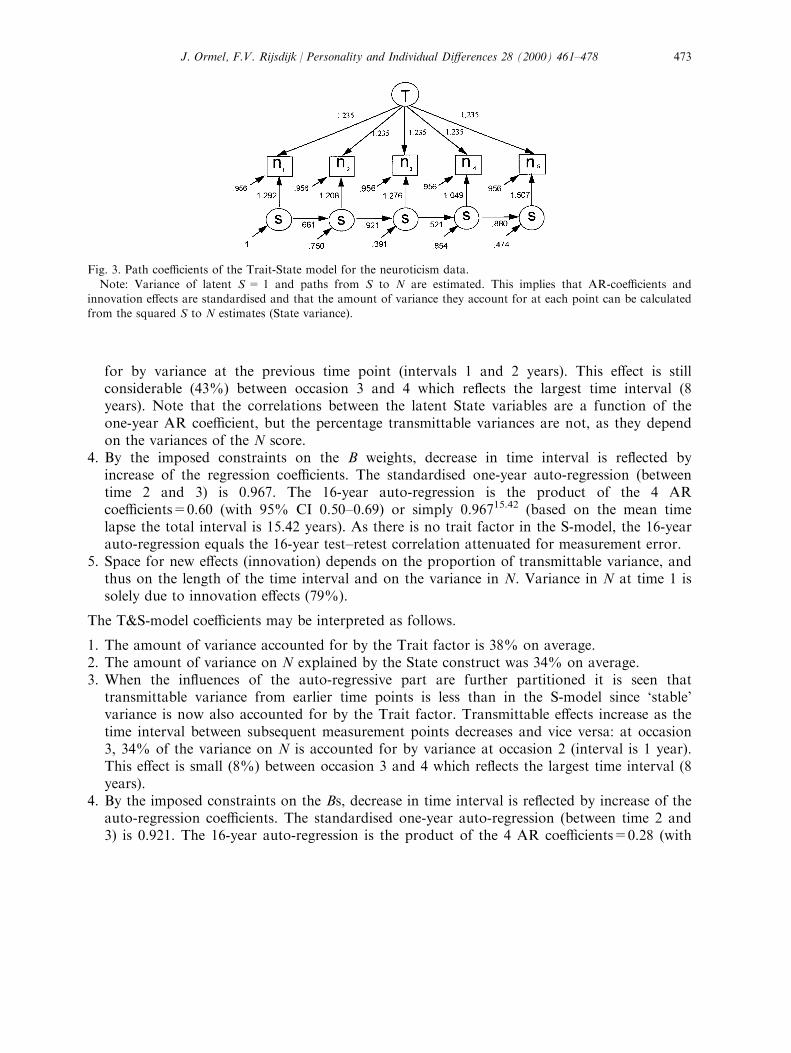
The T&S-model coe�cients may be interpreted as follows.
1. The amount of variance accounted for by the Trait factor is 38% on average.2. The amount of variance on N explained by the State construct was 34% on average.3. When the in¯uences of the auto-regressive part are further partitioned it is seen that
transmittable variance from earlier time points is less than in the S-model since `stable'variance is now also accounted for by the Trait factor. Transmittable e�ects increase as thetime interval between subsequent measurement points decreases and vice versa: at occasion3, 34% of the variance on N is accounted for by variance at occasion 2 (interval is 1 year).This e�ect is small (8%) between occasion 3 and 4 which re¯ects the largest time interval (8years).
4. By the imposed constraints on the Bs, decrease in time interval is re¯ected by increase of theauto-regression coe�cients. The standardised one-year auto-regression (between time 2 and3) is 0.921. The 16-year auto-regression is the product of the 4 AR coe�cients=0.28 (with
Fig. 3. Path coe�cients of the Trait-State model for the neuroticism data.
Note: Variance of latent S= 1 and paths from S to N are estimated. This implies that AR-coe�cients andinnovation e�ects are standardised and that the amount of variance they account for at each point can be calculatedfrom the squared S to N estimates (State variance).
J. Ormel, F.V. Rijsdijk / Personality and Individual Di�erences 28 (2000) 461±478 473

95% CI 0.04±0.66) or simply 0.92115.42. This does not equal the 16-year test±retestcorrelation, as the trait factor itself produces a test±retest correlation of approximately 0.38,irrespective of the time interval.
5. Space for new e�ects depends on the proportion of transmittable variance and thus on thetime interval and variance of N. Variance on N at time 1 is solely due to innovation e�ects(41%).
6. Error variance was estimated to be 23% on average.
In addition, the T-, S- and T&S-model were ®tted on N for the subgroup with measures on alloccasions (n = 224). Results yielded the same pattern as described above. The T-model showedthe worst ®t: w 2(9)=68.43, P< 0.001; the T&S-model: w 2(7)=2.5, P= 0.927; and the S-model: w 2(8)=4.13, P= 0.845. Again, the State model shows a more parsimonious ®t, but theT&S-model cannot be discarded. These results are reassuring because they suggest that lack ofstatistical signi®cance for the Trait factor is not caused by selective dropout of individuals whodi�er in traits that are somehow related to `stability'.In the ®nal series of analyses the three models were ®tted on a subgroup in which all
subjects younger than 30 years at baseline (1970) were excluded. The Trait factor proved to benon-signi®cant for N. The ®t of the T&S-model was w 2(7)=7.84 and that of the S-model:w 2(8)=9.82. Again, we were led to the S-model to give a more parsimonious account of the Ndata for subjects older than 30 years at baseline.
4. Discussion
A Trait (T), a State (S), and a Trait-and-State (T&S) model were ®tted to 5 wavelongitudinal neuroticism (N ) data. The Trait (one-factor)-model could convincingly be rejected.Both the State and the Trait-and-State model both ®tted well. Based purely on reasons ofparsimony the ®rst-order auto-regressive solution should be preferred, implying that thecontribution of the Trait factor could be ®xed at zero without signi®cant loss of ®t. This is alsoillustrated by the zero lower bounds of the 95% con®dence intervals of the Trait variance inthe T&S model. However, when we consider the upper bounds of this interval, 47±60% of thevariance may be due to the Trait factor.The lack of a signi®cant di�erence in ®t between the S- and the T&S model shows that it is
hard to disentangle the di�erent sources of di�erential stability (trait e�ects versus carry-overe�ects) whereas the estimation of di�erential change is very robust across both models. Due tothe extremely high one-year autoregression, the power to detect a signi®cant Trait e�ect ofaround 40% in the population at large appears to be very low (30%) with n = 296 (assumingthat the T&S-model is the true model and that the estimated parameters re¯ect the truepopulation parameters). That is, a sample of 296 individuals would allow us to detect, at the5% signi®cance level, a signi®cant Trait e�ect (when the true value was 40%) in about 30% ofall possible samples of this size and composition. To detect this Trait e�ect with reasonablepower (e.g. 80%), a sample of 1200 individuals would be needed.
J. Ormel, F.V. Rijsdijk / Personality and Individual Di�erences 28 (2000) 461±478474

The ®rst-order auto-regressive (State) model as depicted in Fig. 1b, implies that there iscontinuing change at a very low rate without an immutable trait component. In the Statemodel, all longitudinal correlations result from carry-over e�ects, implying that retestcorrelations decrease steadily as the time interval increases, and with a su�ciently long interval(more than 50 years) will drop to zero. This e�ect is not observed in any long-term follow-upstudy, however. Even across a 30-year interval retest correlations in the range of 0.55±0.60were observed in two studies using volunteer samples (Costa & McCrae, 1992; Finn, 1986).Extrapolation of our 16-year study to 30 years would yield a 30-year test±retest correlation of0.37 (95% CI 0.26±0.50) according to the State model and one of approximately 0.45according to the S&T (the Trait factor contributing around 0.36 and the AR-component 0.08).It may be that volunteer samples are biased towards stable personality.Exclusion of the over sampled high neuroticism subjects did not a�ect the results in a
signi®cant and meaningful way. The w 2 for the S-model and T&S-model ®tted to the remainingsubjects (S-model w 2=4.48, df=8; T&S-model w 2=3.64, df=7) did not di�er in a meaningfulway from those presented for the total sample. The same was found for the estimatedregression coe�cients. Thus, the incapacity to choose between the S- and the T&S-model is notdue to this over representation of high neuroticism persons.It is also unlikely that sample attrition has a�ected the results in a signi®cant and
meaningful way, although attrition was substantial. From the 296 persons in 1970 only 224(76%) were interviewed at all later occasions. Earlier non-response analyses (Ormel, 1980;Sanderman, 1988) found an association of non-response with lower education and a moreexternal locus of control. We clearly demonstrated that the odds are against selective non-response in terms of age and neuroticism. Furthermore, given the characteristics of non-responders, it is problable that non-responders, as a group, have a lower, if any, di�erentialstability of neuroticism than responders.Genetic in¯uences have been shown to account for about 40% of the individual di�erences
on neuroticism in various populations (Heath & Martin, 1990; Heath, Neale, Kessler, Eaves &Kendler, 1992; Tambs, Sundet, Eaves, Solaas & Berg, 1991). Most assume that the stability ofindividual di�erences on neuroticism (and other personality traits) re¯ect these geneticin¯uences. However, the existence of genetic e�ects on neuroticism is not incompatible with apossibly non-existent Trait factor. In fact, as shown by data of genetically related individualssuch as twins, auto-regressive processes can be divided into a genetic and an environmentalcomponent (Boomsma & Molenaar, 1987; Neale & Cardon, 1992). This extended simplexmodel analysing both a genetic and environmental latent construct allows for both di�erentialheritabilities at di�erent time points and di�erent genetic and environmental correlationsbetween time points. Heritable variation at each occasion can be partitioned into geneticin¯uences novel to the occasion and genetic e�ects already operating at the previousmeasurement point. Likewise, the existence of a Trait factor does not necessarily imply theexistence of genetic e�ects.Although the S-model, which conceptualises di�erential stability as due to strong carry-over
e�ects, is not incompatible with signi®cant genetic e�ects, we would like to argue that a T&Smodel of neuroticism, which conceptualises stability as due to both carry-over and immutabletrait e�ects, is still the best informed hypothesis for the time being, unless our ®ndings arereplicated. The considerations include: (1) there is little evidence in support of new genetic
J. Ormel, F.V. Rijsdijk / Personality and Individual Di�erences 28 (2000) 461±478 475

e�ects on neuroticism after age 30 (Viken, Rose, Kaprio & Koskenvuo, 1994), which rendersan exclusive auto-regression process with genetic in¯uences novel to the occasion less plausible;(2) our data do not rule out a Trait factor (the T&S-model does ®t the data well); and (3) thenotion of ongoing and cumulative di�erential change, however slowly it may occur, is a ratherradical departure from previous research. This implication is why replication is critical.
Although speculation is untimely without replication, we want to stress that previouslongitudinal research on adult personality consisted largely of 2-wave studies. The observedtest±retest correlations may have been mistakenly interpreted as re¯ecting trait e�ects. We havedemonstrated that an alternative explanation of a high-stability auto-regressive process ispossible.
It is indeed an intriguing notion that adult neuroticism might not be so much `trait-like', butrather the result of a slow autoregressive process in which change agents have carry-over e�ectsthat a�ect the subsequent course of development.
Whatever model may be the true one, both models agree that there is substantial changevariance in individual di�erences on neuroticism over protracted periods of time. What maycause this di�erential change? It is unlikely that ageing itself is involved, since mean levels ofneuroticism in the population remain more or less stable with ageing. For the very same reasonit is unlikely that general somatic developments e.g. (neurophysiological or endocrinologicalprocesses) are involved. Here it may help to look carefully at the item content of neuroticismmeasures, which does resemble the item content of anxiety and depression measures (Watson &Clark, 1984). The di�erences mainly concern the manner in which the items are phrased. N-items are non-speci®c regarding time frame, while the items of anxiety and depression measurestypically refer to the past week or month. From this perspective neuroticism scales mightre¯ect an individual's mean level of psychological distress over a protracted period. Due toindividual di�erences in exposure to those environments that are capable of bringing aboutlong-term change in people's level of psychological distress, rank-order on neuroticism maycontinue to grow apart. Given this interpretation of N-items and a stress±vulnerabilityperspective, the most plausible hypothesis on the causes of di�erential change in neuroticism isexposure to events which are capable of altering an individual's characteristic distress level fora long time, perhaps even permanently. The low rate of change suggests that events with thiscapacity are rare. Two kinds of events might be capable of doing just that: turning points andsteeling/sensitising events (Ormel & de Jong, 1999; Rutter, 1993). Turning points (e.g. marriageto or divorce from a non-deviant partner; obtaining or losing a steady job) may permanentlychange the balance of exposure to positive and negative events, leading to lasting changes in anindividual's characteristic psychological distress level. Whilst turning points may a�ectneuroticism scores through a lasting change of stress exposure levels, sensitising/steelingexperiences may act via a lasting change of appraisal and coping styles. It should be stressedthat to date these hypotheses have hardly been addressed (Andrews, Page & Neilson, 1993;Ormel & de Jong, 1999; Rutter, 1993).
In sum, while our results are inconclusive with regard to an immutable trait component onneuroticism, they strongly point at slow but cumulative change in individual di�erences. Thedynamics of neuroticism during adulthood may well be less obvious and the role of experiencesmore important than generally assumed.
J. Ormel, F.V. Rijsdijk / Personality and Individual Di�erences 28 (2000) 461±478476

References
Andrews, G., Page, A. C., & Neilson, M. (1993). Sending your teenagers away. Controlled stress decreases neurotic
vulnerability. Archives of General Psychiatry, 50(7), 585±590.Boomsma, D. I., & Molenaar, P. C. (1987). The genetic analysis of repeated measures: I. Simplex models. Behavior
Genetics, 17, 111±123.
Caspi, A., & Bem, D. J. (1990). Personality continuity and change across the life course. In L. A. Pervin, Handbookof personality. Theory and research (pp. 549±575). New York: Guilford Press.
Conley, J. J. (1984). Longitudinal consistency of adult personality: self-reported psychological characteristics across
45 years. Journal of Personality and Social Psychology, 47(6), 1325±1333.Costa Jr, P. T., & McCrae, R. R. (1986). Cross-sectional studies of personality in a national sample: 1.
Development and validation of survey measures. Psychology and Aging, 1, 140±143.Costa Jr, P. T., & McCrae, R. R. (1992). Trait psychology comes of ages. In T. B. Sonderegger, Nebraska sym-
posium on motivation: Psychology and aging (pp. 169±204). Lincoln, NE: University of Nebraska Press.
Costa Jr, P. T., & McCrae, R. R. (1994). Stability and change in personality from adolescence through adulthood.In C. F. Halverson Jr, G. A. Kohnstamm, & R. P. Martin, The developing structure of temperament and personal-
lity from infancy to adulthood (pp. 139±150). Hillsdale NJ: Erlbaum.Costa, P. T., & McCrea, R. R. (1997). Longitudinal stability of adult personality. In R. Hogan, J. Johnson, & S.
Briggs, Handbook of personality psychology. San Diego: Academic Press.
Costa Jr, P. T., McCrae, R. R., & Arenberg, D. (1980). Enduring dispositions in adult males. Journal of Personalityand Social Psychology, 38, 793±800.
Deinzer, R., Steyer, R., Eid, M., Notz, P., Schwenkmezger, P., Ostendorf, F., & Neubauer, A. (1995). Situational
e�ects in trait assessment: the FPI, NEOFFI, and EPI questionnaires. European Journal of Personality, 9, 1±23.Dumenci, L., & Windle, M. (1996). A latent trait-state model of adolescent depression using the Centre for
Epidemiologic Studies-Depression Scale. Multivariate Behavioral Research, 31, 313±330.Duncan-Jones, P., Fergusson, D. M., Ormel, J., & Horwood, L. J. (1990). A model of stability and change in minor
psychiatric symptoms: results from three longitudinal studies. Psychological Medicine, Monograph Supplement, 18,
1±28.Eid, M., Notz, P., Steyer, R., & Schwenkmezger, P. (1994). Validating scales for the assessment of mood level and
variability by latent state-trait analyses. Personality and Individual Di�erences, 16, 63±76.Eysenck, H. J., & Eysenck, S. B. G. (1975). Manual of the Eysenck personality questionnaire. San Diego: EdITS.Finn, S. E. (1986). Stability of personality self-ratings over 30 years: evidence for an age/cohort interaction. Journal
of Personality and Social Psychology, 50(4), 813±818.Heath, A. C., & Martin, N. G. (1990). Psychoticism as a dimension of personality: a multivariate genetic test of
Eysenck and Eysenck's Psychoticism construct. Journal of Personality and Social Psychology, 58, 111±121.
Heath, A. C., Neale, M. C., Kessler, R. C., Eaves, L. J., & Kendler, K. S. (1992). Evidence for genetic in¯uences onpersonality from self-reports and informant ratings. Journal of Personality and Social Psychology, 63(1), 85±96.
Jessen J.L. (1974) Medische consumptie (Medical consumption). Institute of Sociology, University of Groningen, TheNetherlands.
JoÈ reskog K.G., SoÈ rbom D. (1993) Prelis 2, User's Reference Guide, Scienti®c Software International, Inc., 1525 East
53rd Street, Suite 906, Chicago, IL 60615.Kenny, D. A., & Campbell, D. T. (1989). On the measurement of stability in over-time data. Journal of Personality,
57(2), 445±481.Kenny, D. A., & Zautra, A. (1995). Methodological developments. The trait-state-error model for multiwave data.
Journal of Consulting and Clinical Psychology, 63(1), 52±59.
McCrae, R. R., & Costa Jr, P. T. (1997). Personality trait structure as a human universal. American Psychologist,52(5), 509±516.
Neale M.C. (1995) Mx: Statistical modeling. Box 710 MCV, Richmond, VA 23298: Department of Psychiatry.Neale, M. C., & Cardon, L. (1992). Methodology for genetic studies of twins and families, NATO ASI series: beha-
vioral and social sciences. Dordrecht: Kluwer Academic Publishers.
Neale, M. C., & Miller, M. B. (1997). The use of likelihood-based con®dence intervals in genetic models. BehaviorGenetics, 27, 113±120.
J. Ormel, F.V. Rijsdijk / Personality and Individual Di�erences 28 (2000) 461±478 477

Ormel J. (1980) Moeite met leven of een moeilijk leven (Di�culties with life or a di�cult life) PhD thesis, Universityof Groningen. Konstapel b.v., The Netherlands.
Ormel, J. (1983). Neuroticism and well-being inventories: measuring traits or states? Psychological Medicine, 13,165±176.
Ormel, J., & de Jong, A. (1999). On vulnerability to common mental disorders. An evidence-based plea for a devel-
opmental perspective. In M. Tansella, & G. Thornicroft, Common mental disorders in primary care. Essays in hon-our of Professor Sir David Goldberg. London: Routledge.
Ormel, J., & Schaufeli, W. B. (1991). Stability and change in psychological distress and their relationship with self-
esteem and locus of control: a dynamic equilibrium model. Journal of Personality and Social Psychology, 60(2),288±299.
Ormel, J., & Wohlfart, T. D. (1991). How Neuroticism, long-term di�culties, and changes in quality of life a�ect
psychological distress. A longitudinal approach. Journal of Personality and Social Psychology, 60, 744±755.Rutter, M. (1993). Resilience: Some conceptual considerations. Journal of Adolescent Health, 14(8), 626±631.Sanderman R. (1988) Life events, mediating variables and psychological distress: a longitudinal study. PhD thesis,
University of Groningen, The Netherlands.
Stein, J. A., Newcomb, M. D., & Bentler, P. M. (1994). Psychosocial correlates and predictors of AIDS risk beha-viors, abortion, and drug use among a community sample of young adult women. Health Psychology, 13, 308±318.
Tambs, K., Sundet, J. M., Eaves, L., Solaas, M. H., & Berg, K. (1991). Pedigree analyses of Eysenck personalityquestionnaire (EPQ) scores in monozygotic (MZ) twin families. Behavior Genetics, 21(4), 369±382.
Viken, R. J., Rose, R. J., Kaprio, J., & Koskenvuo, M. (1994). A developmental genetic analysis of adult personal-
ity: extraversion and neuroticism from 18 to 59 years of age. Journal of Personality and Social Psychology, 66,722±730.
Watson, D., & Clark, L. A. (1984). Negative a�ectivity: the disposition to experience aversive emotional states.
Psychological Bulletin, 96, 465±490.Watson, D., & Walker, L. M. (1996). The long-term stability and predictive validity of trait measures of a�ect.
Journal of Personality and Social Psychology, 70, 567±577.Wilde, G. J. S. (1970). Neurotische labiliteit gemeten volgens de vragenlijst-methode (Neurotic lability measured by the
questionnaire method). Amsterdam: Van Rossum.
J. Ormel, F.V. Rijsdijk / Personality and Individual Di�erences 28 (2000) 461±478478