Construction - Alaska Department of Labor and Workforce ...
23
Also Inside: New Hires Fourth Quarter 1997 September Employment Stats Solid 1998 Trends Index TRENDS Alaska Department of Labor Tony Knowles, Governor TRENDS ALASKA ECONOMIC DECEMBER 1998 The 1990s A Decade of Stability Construction In the 1990s, the construction industry bade farewell to the construction booms of the past, fed by World War II, the Cold War, and the oil pipeline, and settled into a period of moderate growth.
-
Upload
khangminh22 -
Category
Documents
-
view
1 -
download
0
Transcript of Construction - Alaska Department of Labor and Workforce ...
Also Inside:New Hires Fourth Quarter 1997September Employment Stats Solid1998 Trends Index
TRENDS
Alaska Department of Labor Tony Knowles, Governor
TRENDSALASKA ECONOMIC DECEMBER 1998
The 1990s�A Decadeof Stability
Construction
In the 1990s, theconstruction industrybade farewell to theconstruction booms ofthe past, fed by WorldWar II, the Cold War,and the oil pipeline, andsettled into a period ofmoderate growth.
2 ALASKA ECONOMIC TRENDS DECEMBER 1998
Alaska EconomicTrends is a monthlypublication dealing
with a variety ofeconomic-related
issues in the state.
Alaska EconomicTrends is funded by
the EmploymentSecurity Division and
published by theAlaska Department of
Labor, P.O. Box21149, Juneau,
Alaska 99802-1149.
Printed and distributedby Assets, Inc., a
vocational trainingand employment
program, at a cost of$.82 per copy.
For more information,call the AKDOL
Publications Office at(907) 465-6019 or
email the authors.
Material in thispublication is public
information and, withappropriate credit,
may be reproducedwithout permission.
December1998
Volume 18Number 11ISSN 0160-3345
Tony Knowles, Governor of AlaskaTom Cashen, Commissioner of Labor
Diana Kelm, EditorJoanne Erskine, Associate Editor
Email Trends authors at:
[email protected] Fried is a labor economist with the Research and
Analysis Section, Administrative Services Division, AlaskaDepartment of Labor in Anchorage.
[email protected] Mosher is a labor economist with the Research andAnalysis Section, Administrative Services Division, Alaska
Department of Labor in Juneau.
[email protected] Windisch-Cole is a labor economist with the Research
and Analysis Section, Administrative Services Division,Alaska Department of Labor in Anchorage.
Subscriptions: [email protected]
TRENDSALASKA ECONOMIC
http://www.labor.state.ak.us/research/research.htm
Contents:
A Stable Decade for Construction 3
New Hires: Hiring Improves in 1997 11
Trends 1998 Index of Articles 17
September Employment Statistics Solid 18
ALASKA ECONOMIC TRENDS DECEMBER 1998 3
Once volatile industry settles down in the 1990s
A
A Stable Decade for Construction
Source: Alaska Department of Labor, Research and Analysis Section
whiff of past construction booms is in theair. Many more road detours seem to
plague communities around the state. New hotels,office buildings and other structures are going upwithout much attention, sometimes in the mostunlikely places. New homes and subdivisionsappear to be popping up everywhere. And morefriends, family members and acquaintances areheaded off to the North Slope to work on one ofmany construction projects. So is the state in themidst of a construction boom? The short answer isno. However, construction activity is on theupswing and its spunkiness represents the moststeady and stable decade ever experienced by thisindustry.
The construction industry veers from itspast in the 1990s
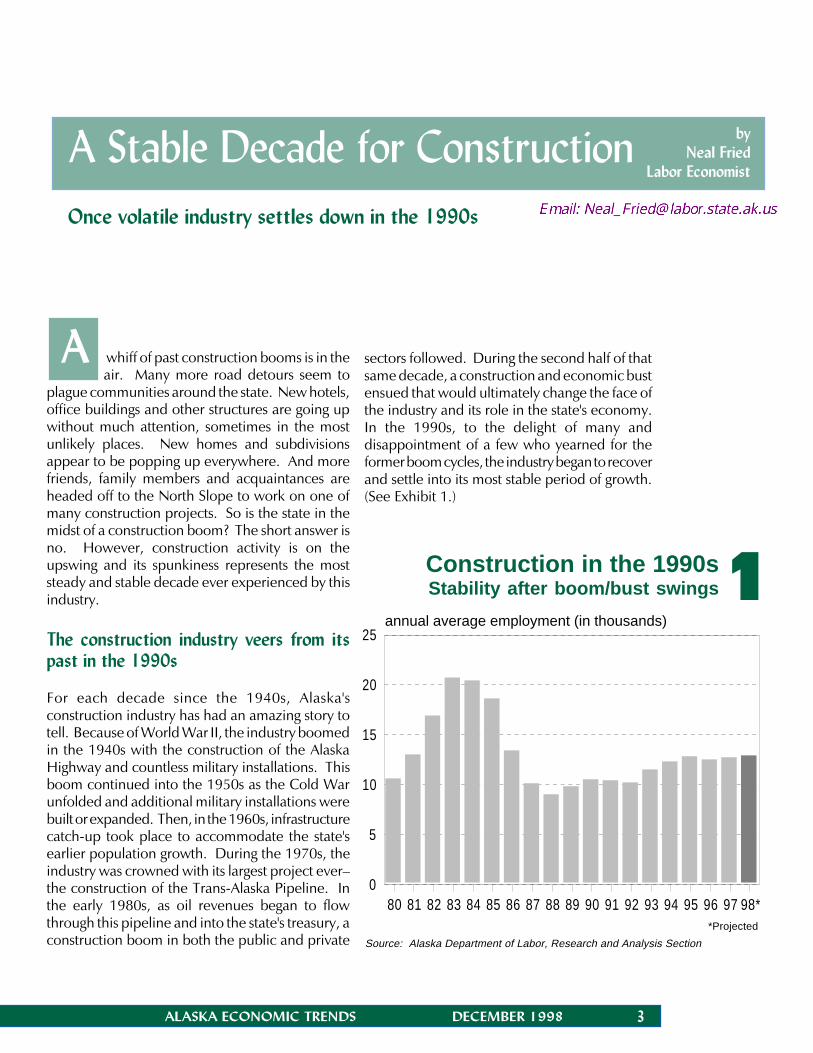
For each decade since the 1940s, Alaska'sconstruction industry has had an amazing story totell. Because of World War II, the industry boomedin the 1940s with the construction of the AlaskaHighway and countless military installations. Thisboom continued into the 1950s as the Cold Warunfolded and additional military installations werebuilt or expanded. Then, in the 1960s, infrastructurecatch-up took place to accommodate the state'searlier population growth. During the 1970s, theindustry was crowned with its largest project ever�the construction of the Trans-Alaska Pipeline. Inthe early 1980s, as oil revenues began to flowthrough this pipeline and into the state's treasury, aconstruction boom in both the public and private
1 Construction in the 1990s Stability after boom/bust swings
byNeal Fried
Labor Economist
*Projected
sectors followed. During the second half of thatsame decade, a construction and economic bustensued that would ultimately change the face ofthe industry and its role in the state's economy.In the 1990s, to the delight of many anddisappointment of a few who yearned for theformer boom cycles, the industry began to recoverand settle into its most stable period of growth.(See Exhibit 1.)
80 81 82 83 84 85 86 87 88 89 90 91 92 93 94 95 96 97 98*0
5
10
15
20
25 annual average employment (in thousands)
4 ALASKA ECONOMIC TRENDS DECEMBER 1998
Construction7%
T ransportation11%
Retai l & Wholesale14%
Services19%
4%
Governm ent31%
M ining9%
M anufacturing5%
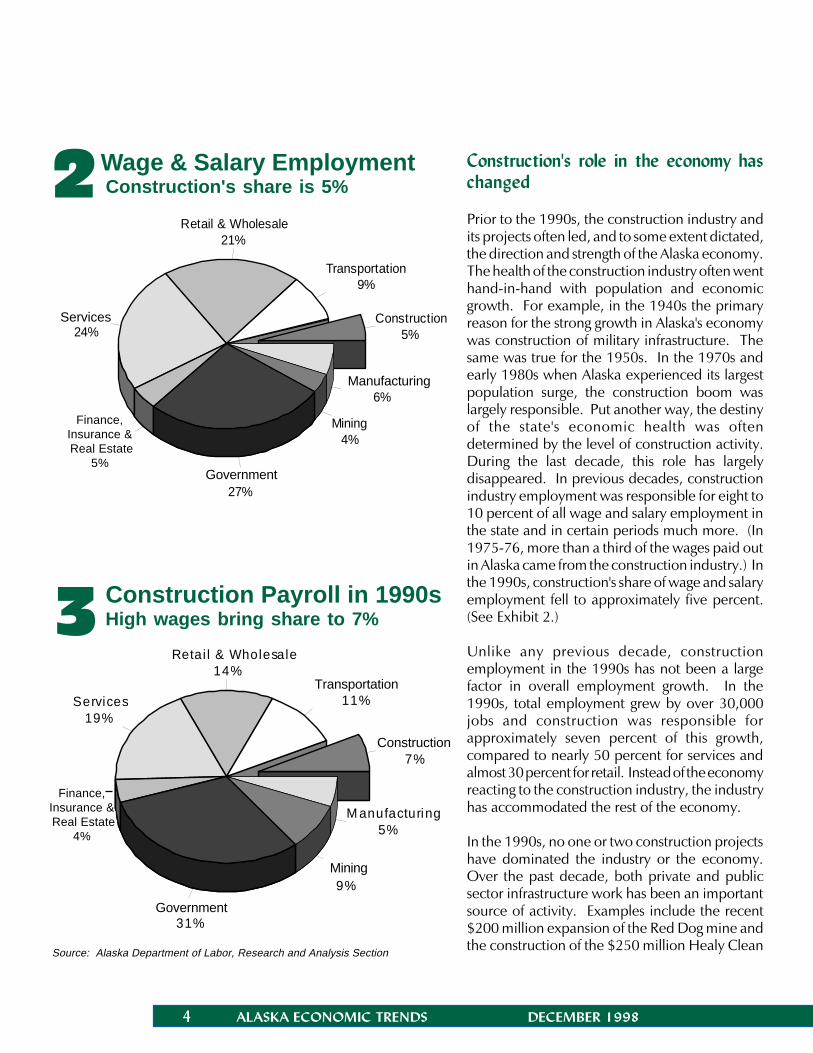
2 Wage & Salary Employment Construction's share is 5%
3 Construction Payroll in 1990sHigh wages bring share to 7%
Construction's role in the economy haschanged
Prior to the 1990s, the construction industry andits projects often led, and to some extent dictated,the direction and strength of the Alaska economy.The health of the construction industry often wenthand-in-hand with population and economicgrowth. For example, in the 1940s the primaryreason for the strong growth in Alaska's economywas construction of military infrastructure. Thesame was true for the 1950s. In the 1970s andearly 1980s when Alaska experienced its largestpopulation surge, the construction boom waslargely responsible. Put another way, the destinyof the state's economic health was oftendetermined by the level of construction activity.During the last decade, this role has largelydisappeared. In previous decades, constructionindustry employment was responsible for eight to10 percent of all wage and salary employment inthe state and in certain periods much more. (In1975-76, more than a third of the wages paid outin Alaska came from the construction industry.) Inthe 1990s, construction's share of wage and salaryemployment fell to approximately five percent.(See Exhibit 2.)
Unlike any previous decade, constructionemployment in the 1990s has not been a largefactor in overall employment growth. In the1990s, total employment grew by over 30,000jobs and construction was responsible forapproximately seven percent of this growth,compared to nearly 50 percent for services andalmost 30 percent for retail. Instead of the economyreacting to the construction industry, the industryhas accommodated the rest of the economy.
In the 1990s, no one or two construction projectshave dominated the industry or the economy.Over the past decade, both private and publicsector infrastructure work has been an importantsource of activity. Examples include the recent$200 million expansion of the Red Dog mine andthe construction of the $250 million Healy Clean
Source: Alaska Department of Labor, Research and Analysis Section
Construction5%
Transportation9%
Retail & Wholesale21%
Serv ices24%
Finance, Ins. & R.E.5%
Gov ernment27%
Mining4%
Manuf acturing6%
Finance,Insurance & Real Estate
5%
Finance,Insurance & Real Estate
4%
Services
Government
Manufacturing
Government
Mining
Construction
Transportation
ALASKA ECONOMIC TRENDS DECEMBER 1998 5
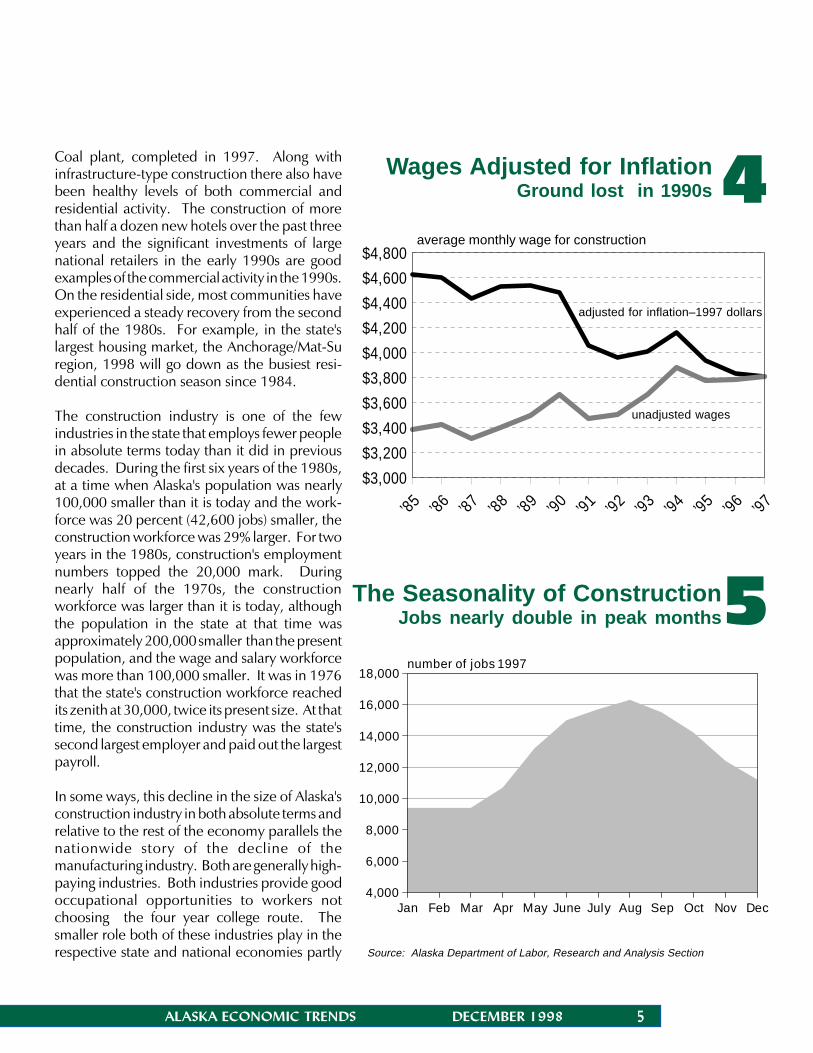
4Wages Adjusted for InflationGround lost in 1990s
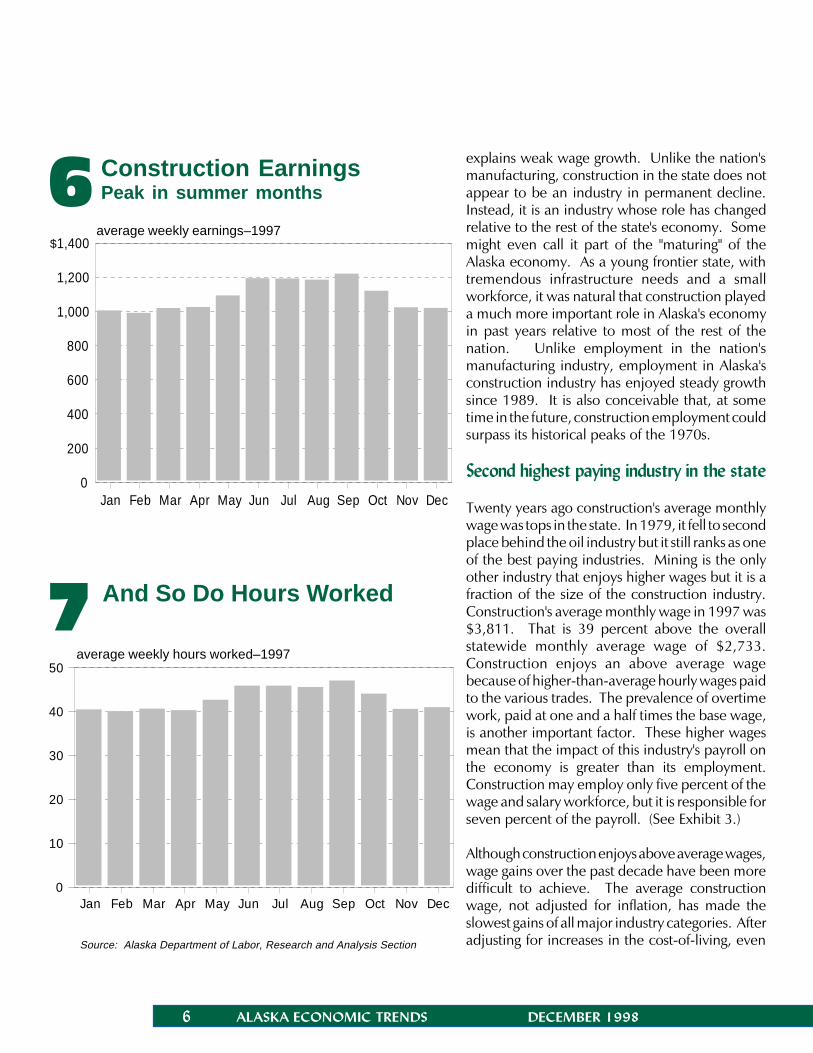
5The Seasonality of ConstructionJobs nearly double in peak months
Coal plant, completed in 1997. Along withinfrastructure-type construction there also havebeen healthy levels of both commercial andresidential activity. The construction of morethan half a dozen new hotels over the past threeyears and the significant investments of largenational retailers in the early 1990s are goodexamples of the commercial activity in the 1990s.On the residential side, most communities haveexperienced a steady recovery from the secondhalf of the 1980s. For example, in the state'slargest housing market, the Anchorage/Mat-Suregion, 1998 will go down as the busiest resi-dential construction season since 1984.
The construction industry is one of the fewindustries in the state that employs fewer peoplein absolute terms today than it did in previousdecades. During the first six years of the 1980s,at a time when Alaska's population was nearly100,000 smaller than it is today and the work-force was 20 percent (42,600 jobs) smaller, theconstruction workforce was 29% larger. For twoyears in the 1980s, construction's employmentnumbers topped the 20,000 mark. Duringnearly half of the 1970s, the constructionworkforce was larger than it is today, althoughthe population in the state at that time wasapproximately 200,000 smaller than the presentpopulation, and the wage and salary workforcewas more than 100,000 smaller. It was in 1976that the state's construction workforce reachedits zenith at 30,000, twice its present size. At thattime, the construction industry was the state'ssecond largest employer and paid out the largestpayroll.
In some ways, this decline in the size of Alaska'sconstruction industry in both absolute terms andrelative to the rest of the economy parallels thenationwide story of the decline of themanufacturing industry. Both are generally high-paying industries. Both industries provide goodoccupational opportunities to workers notchoosing the four year college route. Thesmaller role both of these industries play in therespective state and national economies partly Source: Alaska Department of Labor, Research and Analysis Section
Jan Feb Mar Apr May June July Aug Sep Oct Nov Dec4,000
6,000
8,000
10,000
12,000
14,000
16,000
18,000number of jobs 1997
average monthly wage for construction
’85 ’86 ’87 ’88 ’89 ’90 ’91 ’92 ’93 ’94 ’95 ’96 ’97$3,000
$3,200
$3,400
$3,600
$3,800
$4,000
$4,200
$4,400
$4,600
$4,800
adjusted for inflation–1997 dollars
unadjusted wages
6 ALASKA ECONOMIC TRENDS DECEMBER 1998
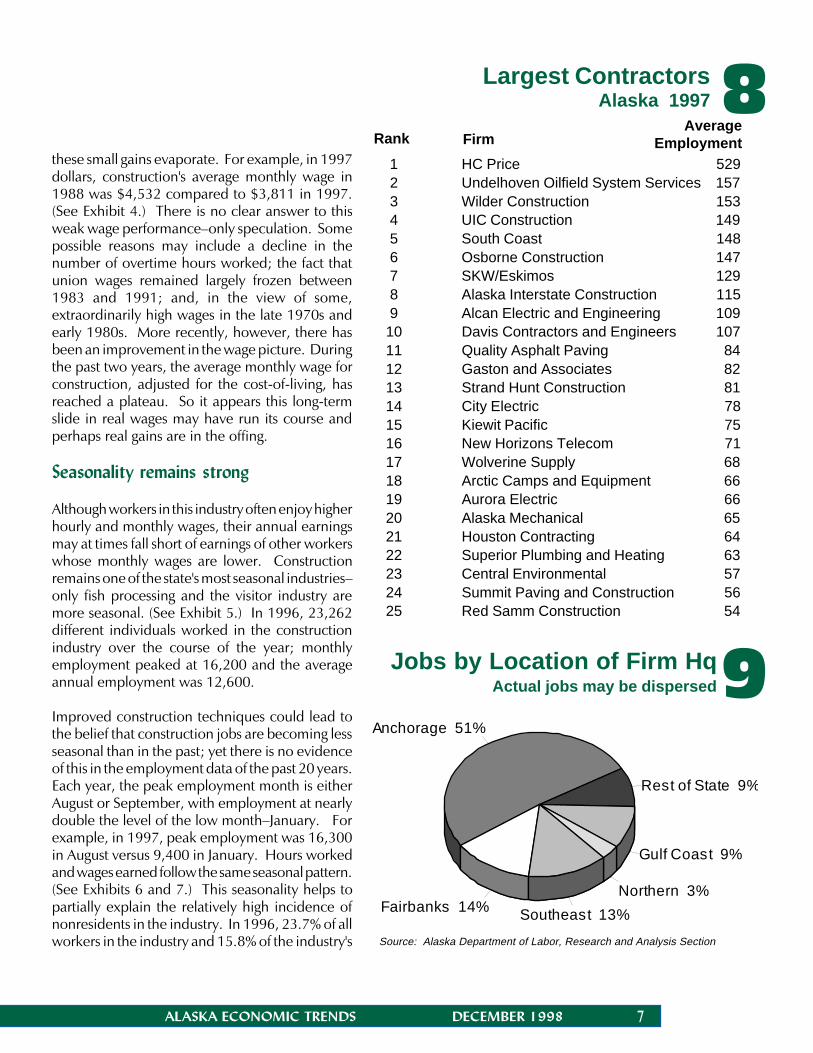
6 Construction EarningsPeak in summer months
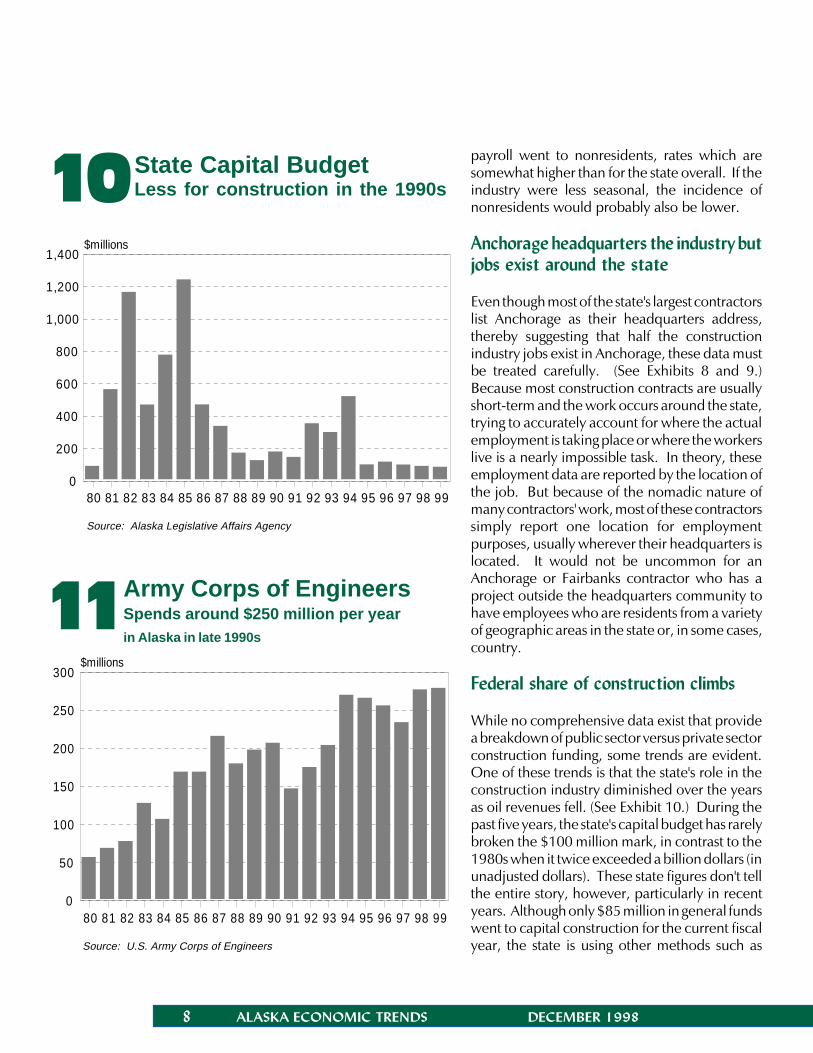
7 And So Do Hours Worked
explains weak wage growth. Unlike the nation'smanufacturing, construction in the state does notappear to be an industry in permanent decline.Instead, it is an industry whose role has changedrelative to the rest of the state's economy. Somemight even call it part of the "maturing" of theAlaska economy. As a young frontier state, withtremendous infrastructure needs and a smallworkforce, it was natural that construction playeda much more important role in Alaska's economyin past years relative to most of the rest of thenation. Unlike employment in the nation'smanufacturing industry, employment in Alaska'sconstruction industry has enjoyed steady growthsince 1989. It is also conceivable that, at sometime in the future, construction employment couldsurpass its historical peaks of the 1970s.
Second highest paying industry in the state
Twenty years ago construction's average monthlywage was tops in the state. In 1979, it fell to secondplace behind the oil industry but it still ranks as oneof the best paying industries. Mining is the onlyother industry that enjoys higher wages but it is afraction of the size of the construction industry.Construction's average monthly wage in 1997 was$3,811. That is 39 percent above the overallstatewide monthly average wage of $2,733.Construction enjoys an above average wagebecause of higher-than-average hourly wages paidto the various trades. The prevalence of overtimework, paid at one and a half times the base wage,is another important factor. These higher wagesmean that the impact of this industry's payroll onthe economy is greater than its employment.Construction may employ only five percent of thewage and salary workforce, but it is responsible forseven percent of the payroll. (See Exhibit 3.)
Although construction enjoys above average wages,wage gains over the past decade have been moredifficult to achieve. The average constructionwage, not adjusted for inflation, has made theslowest gains of all major industry categories. Afteradjusting for increases in the cost-of-living, evenSource: Alaska Department of Labor, Research and Analysis Section
$
Jan Feb Mar Apr May Jun Jul Aug Sep Oct Nov Dec0
200
400
600
800
1,000
1,200
1,400average weekly earnings–1997
Jan Feb Mar Apr May Jun Jul Aug Sep Oct Nov Dec0
10
20
30
40
50average weekly hours worked–1997
ALASKA ECONOMIC TRENDS DECEMBER 1998 7
9Anchorage 51%
Fairbanks 14% Southeast 13%
Northern 3%
Gulf Coast 9%
Rest of State 9%
1 HC Price 529 2 Undelhoven Oilfield System Services 157 3 Wilder Construction 153 4 UIC Construction 149 5 South Coast 148 6 Osborne Construction 147 7 SKW/Eskimos 129 8 Alaska Interstate Construction 115 9 Alcan Electric and Engineering 109 10 Davis Contractors and Engineers 107 11 Quality Asphalt Paving 84 12 Gaston and Associates 82 13 Strand Hunt Construction 81 14 City Electric 78 15 Kiewit Pacific 75 16 New Horizons Telecom 71 17 Wolverine Supply 68 18 Arctic Camps and Equipment 66 19 Aurora Electric 66 20 Alaska Mechanical 65 21 Houston Contracting 64 22 Superior Plumbing and Heating 63 23 Central Environmental 57 24 Summit Paving and Construction 56 25 Red Samm Construction 54
Jobs by Location of Firm HqActual jobs may be dispersed
Largest ContractorsAlaska 1997 8
Rank FirmAverage
Employmentthese small gains evaporate. For example, in 1997dollars, construction's average monthly wage in1988 was $4,532 compared to $3,811 in 1997.(See Exhibit 4.) There is no clear answer to thisweak wage performance�only speculation. Somepossible reasons may include a decline in thenumber of overtime hours worked; the fact thatunion wages remained largely frozen between1983 and 1991; and, in the view of some,extraordinarily high wages in the late 1970s andearly 1980s. More recently, however, there hasbeen an improvement in the wage picture. Duringthe past two years, the average monthly wage forconstruction, adjusted for the cost-of-living, hasreached a plateau. So it appears this long-termslide in real wages may have run its course andperhaps real gains are in the offing.
Seasonality remains strong
Although workers in this industry often enjoy higherhourly and monthly wages, their annual earningsmay at times fall short of earnings of other workerswhose monthly wages are lower. Constructionremains one of the state's most seasonal industries�only fish processing and the visitor industry aremore seasonal. (See Exhibit 5.) In 1996, 23,262different individuals worked in the constructionindustry over the course of the year; monthlyemployment peaked at 16,200 and the averageannual employment was 12,600.
Improved construction techniques could lead tothe belief that construction jobs are becoming lessseasonal than in the past; yet there is no evidenceof this in the employment data of the past 20 years.Each year, the peak employment month is eitherAugust or September, with employment at nearlydouble the level of the low month�January. Forexample, in 1997, peak employment was 16,300in August versus 9,400 in January. Hours workedand wages earned follow the same seasonal pattern.(See Exhibits 6 and 7.) This seasonality helps topartially explain the relatively high incidence ofnonresidents in the industry. In 1996, 23.7% of allworkers in the industry and 15.8% of the industry's Source: Alaska Department of Labor, Research and Analysis Section
8 ALASKA ECONOMIC TRENDS DECEMBER 1998
80 81 82 83 84 85 86 87 88 89 90 91 92 93 94 95 96 97 98 990
200
400
600
800
1,000
1,200
1,400$millions
10State Capital BudgetLess for construction in the 1990s
80 81 82 83 84 85 86 87 88 89 90 91 92 93 94 95 96 97 98 990
50
100
150
200
250
300$millions
11Army Corps of EngineersSpends around $250 million per yearin Alaska in late 1990s
payroll went to nonresidents, rates which aresomewhat higher than for the state overall. If theindustry were less seasonal, the incidence ofnonresidents would probably also be lower.
Anchorage headquarters the industry butjobs exist around the state
Even though most of the state's largest contractorslist Anchorage as their headquarters address,thereby suggesting that half the constructionindustry jobs exist in Anchorage, these data mustbe treated carefully. (See Exhibits 8 and 9.)Because most construction contracts are usuallyshort-term and the work occurs around the state,trying to accurately account for where the actualemployment is taking place or where the workerslive is a nearly impossible task. In theory, theseemployment data are reported by the location ofthe job. But because of the nomadic nature ofmany contractors' work, most of these contractorssimply report one location for employmentpurposes, usually wherever their headquarters islocated. It would not be uncommon for anAnchorage or Fairbanks contractor who has aproject outside the headquarters community tohave employees who are residents from a varietyof geographic areas in the state or, in some cases,country.
Federal share of construction climbs
While no comprehensive data exist that providea breakdown of public sector versus private sectorconstruction funding, some trends are evident.One of these trends is that the state's role in theconstruction industry diminished over the yearsas oil revenues fell. (See Exhibit 10.) During thepast five years, the state's capital budget has rarelybroken the $100 million mark, in contrast to the1980s when it twice exceeded a billion dollars (inunadjusted dollars). These state figures don't tellthe entire story, however, particularly in recentyears. Although only $85 million in general fundswent to capital construction for the current fiscalyear, the state is using other methods such asSource: U.S. Army Corps of Engineers
Source: Alaska Legislative Affairs Agency
ALASKA ECONOMIC TRENDS DECEMBER 1998 9
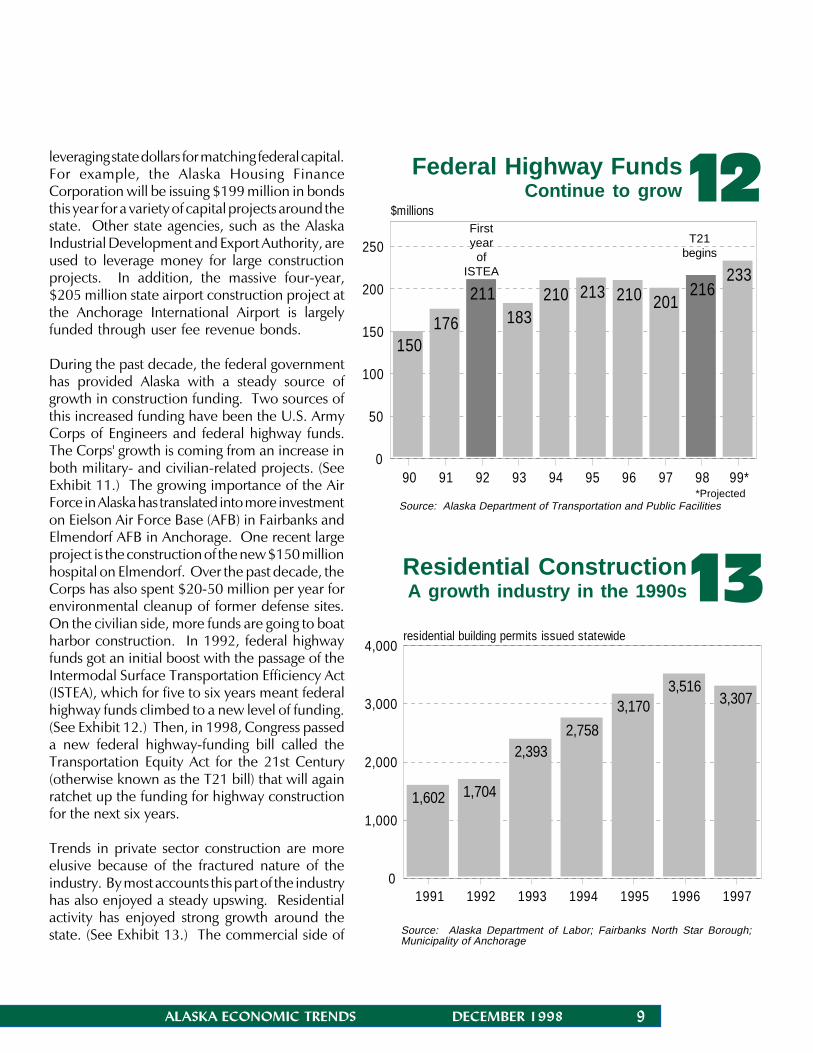
Federal Highway FundsContinue to grow 12
150176
211183
210 213 210 201216
233
90 91 92 93 94 95 96 97 98 99*0
50
100
150
200
250
$millions
1,602 1,704
2,3932,758
3,1703,516
3,307
1991 1992 1993 1994 1995 1996 19970
1,000
2,000
3,000
4,000residential building permits issued statewide
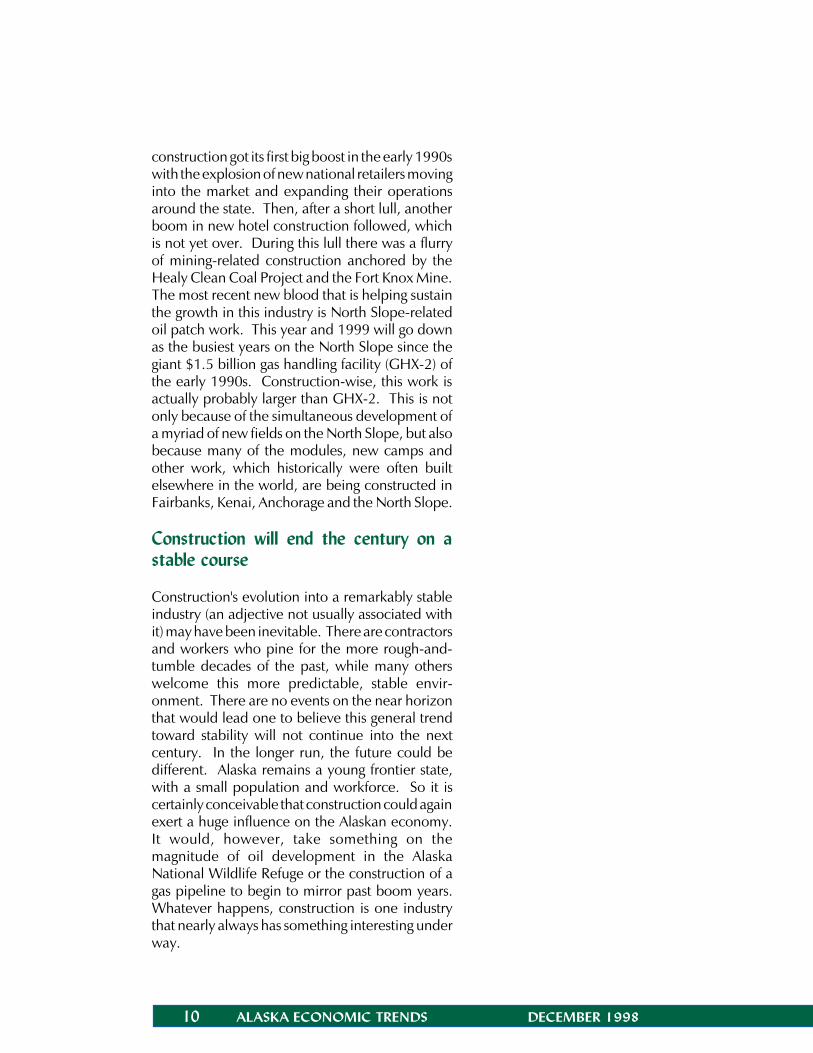
13Residential ConstructionA growth industry in the 1990s
leveraging state dollars for matching federal capital.For example, the Alaska Housing FinanceCorporation will be issuing $199 million in bondsthis year for a variety of capital projects around thestate. Other state agencies, such as the AlaskaIndustrial Development and Export Authority, areused to leverage money for large constructionprojects. In addition, the massive four-year,$205 million state airport construction project atthe Anchorage International Airport is largelyfunded through user fee revenue bonds.
During the past decade, the federal governmenthas provided Alaska with a steady source ofgrowth in construction funding. Two sources ofthis increased funding have been the U.S. ArmyCorps of Engineers and federal highway funds.The Corps' growth is coming from an increase inboth military- and civilian-related projects. (SeeExhibit 11.) The growing importance of the AirForce in Alaska has translated into more investmenton Eielson Air Force Base (AFB) in Fairbanks andElmendorf AFB in Anchorage. One recent largeproject is the construction of the new $150 millionhospital on Elmendorf. Over the past decade, theCorps has also spent $20-50 million per year forenvironmental cleanup of former defense sites.On the civilian side, more funds are going to boatharbor construction. In 1992, federal highwayfunds got an initial boost with the passage of theIntermodal Surface Transportation Efficiency Act(ISTEA), which for five to six years meant federalhighway funds climbed to a new level of funding.(See Exhibit 12.) Then, in 1998, Congress passeda new federal highway-funding bill called theTransportation Equity Act for the 21st Century(otherwise known as the T21 bill) that will againratchet up the funding for highway constructionfor the next six years.
Trends in private sector construction are moreelusive because of the fractured nature of theindustry. By most accounts this part of the industryhas also enjoyed a steady upswing. Residentialactivity has enjoyed strong growth around thestate. (See Exhibit 13.) The commercial side of Source: Alaska Department of Labor; Fairbanks North Star Borough;
Municipality of Anchorage
Firstyear
ofISTEA
T21begins
Source: Alaska Department of Transportation and Public Facilities*Projected
10 ALASKA ECONOMIC TRENDS DECEMBER 1998
construction got its first big boost in the early 1990swith the explosion of new national retailers movinginto the market and expanding their operationsaround the state. Then, after a short lull, anotherboom in new hotel construction followed, whichis not yet over. During this lull there was a flurryof mining-related construction anchored by theHealy Clean Coal Project and the Fort Knox Mine.The most recent new blood that is helping sustainthe growth in this industry is North Slope-relatedoil patch work. This year and 1999 will go downas the busiest years on the North Slope since thegiant $1.5 billion gas handling facility (GHX-2) ofthe early 1990s. Construction-wise, this work isactually probably larger than GHX-2. This is notonly because of the simultaneous development ofa myriad of new fields on the North Slope, but alsobecause many of the modules, new camps andother work, which historically were often builtelsewhere in the world, are being constructed inFairbanks, Kenai, Anchorage and the North Slope.
Construction will end the century on astable course
Construction's evolution into a remarkably stableindustry (an adjective not usually associated withit) may have been inevitable. There are contractorsand workers who pine for the more rough-and-tumble decades of the past, while many otherswelcome this more predictable, stable envir-onment. There are no events on the near horizonthat would lead one to believe this general trendtoward stability will not continue into the nextcentury. In the longer run, the future could bedifferent. Alaska remains a young frontier state,with a small population and workforce. So it iscertainly conceivable that construction could againexert a huge influence on the Alaskan economy.It would, however, take something on themagnitude of oil development in the AlaskaNational Wildlife Refuge or the construction of agas pipeline to begin to mirror past boom years.Whatever happens, construction is one industrythat nearly always has something interesting underway.
ALASKA ECONOMIC TRENDS DECEMBER 1998 11
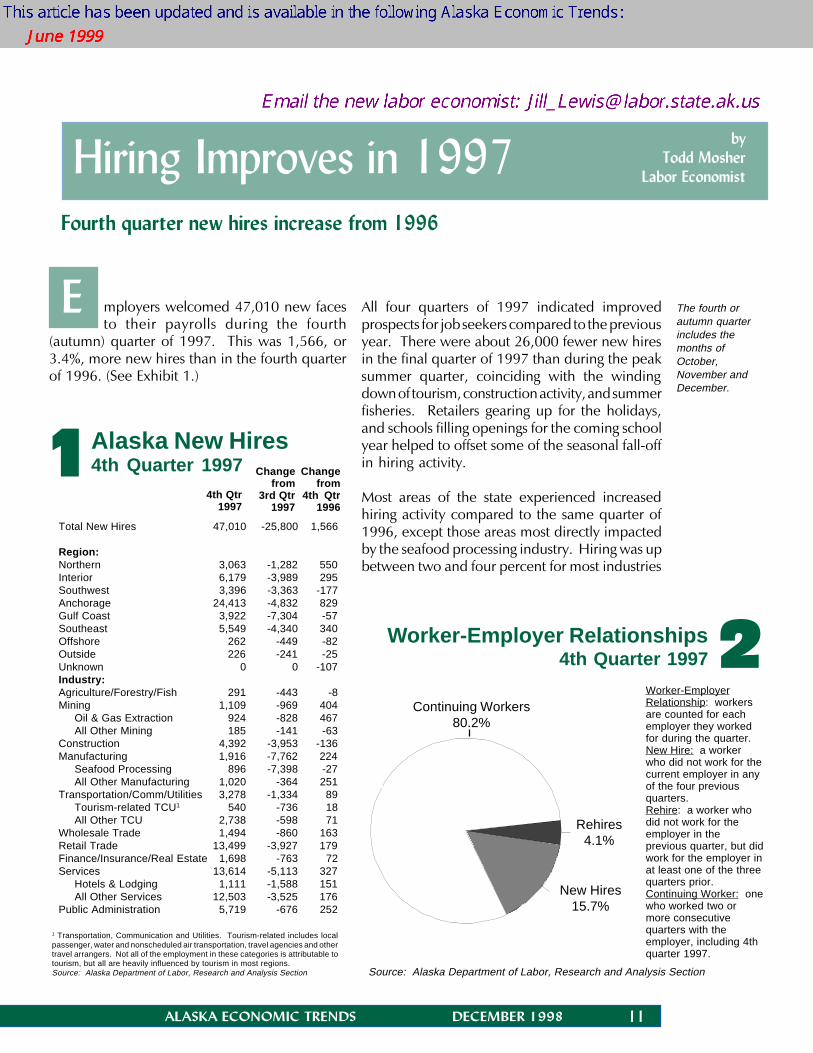
2 Worker-Employer Relationships 4th Quarter 1997
byTodd Mosher
Labor Economist
Fourth quarter new hires increase from 1996
mployers welcomed 47,010 new facesto their payrolls during the fourth
(autumn) quarter of 1997. This was 1,566, or3.4%, more new hires than in the fourth quarterof 1996. (See Exhibit 1.)
All four quarters of 1997 indicated improvedprospects for job seekers compared to the previousyear. There were about 26,000 fewer new hiresin the final quarter of 1997 than during the peaksummer quarter, coinciding with the windingdown of tourism, construction activity, and summerfisheries. Retailers gearing up for the holidays,and schools filling openings for the coming schoolyear helped to offset some of the seasonal fall-offin hiring activity.
Most areas of the state experienced increasedhiring activity compared to the same quarter of1996, except those areas most directly impactedby the seafood processing industry. Hiring was upbetween two and four percent for most industries
E
Hiring Improves in 1997
Source: Alaska Department of Labor, Research and Analysis Section
Total New Hires 47,010 -25,800 1,566
Region:Northern 3,063 -1,282 550Interior 6,179 -3,989 295Southwest 3,396 -3,363 -177Anchorage 24,413 -4,832 829Gulf Coast 3,922 -7,304 -57Southeast 5,549 -4,340 340Offshore 262 -449 -82Outside 226 -241 -25Unknown 0 0 -107Industry:Agriculture/Forestry/Fish 291 -443 -8Mining 1,109 -969 404
Oil & Gas Extraction 924 -828 467All Other Mining 185 -141 -63
Construction 4,392 -3,953 -136Manufacturing 1,916 -7,762 224
Seafood Processing 896 -7,398 -27All Other Manufacturing 1,020 -364 251
Transportation/Comm/Utilities 3,278 -1,334 89Tourism-related TCU1 540 -736 18All Other TCU 2,738 -598 71
Wholesale Trade 1,494 -860 163Retail Trade 13,499 -3,927 179Finance/Insurance/Real Estate 1,698 -763 72Services 13,614 -5,113 327
Hotels & Lodging 1,111 -1,588 151All Other Services 12,503 -3,525 176
Public Administration 5,719 -676 252
Alaska New Hires4th Quarter 1997
1 Transportation, Communication and Utilities. Tourism-related includes localpassenger, water and nonscheduled air transportation, travel agencies and othertravel arrangers. Not all of the employment in these categories is attributable totourism, but all are heavily influenced by tourism in most regions.Source: Alaska Department of Labor, Research and Analysis Section
14th Qtr
1997
Changefrom
3rd Qtr1997
Changefrom
4th Qtr1996
Worker-EmployerRelationship: workersare counted for eachemployer they workedfor during the quarter.New Hire: a workerwho did not work for thecurrent employer in anyof the four previousquarters.Rehire: a worker whodid not work for theemployer in theprevious quarter, but didwork for the employer inat least one of the threequarters prior.Continuing Worker: onewho worked two ormore consecutivequarters with theemployer, including 4thquarter 1997.
Continuing Workers80.2%
Rehires4.1%
New Hires15.7%
The fourth orautumn quarterincludes themonths ofOctober,November andDecember.
12 ALASKA ECONOMIC TRENDS DECEMBER 1998
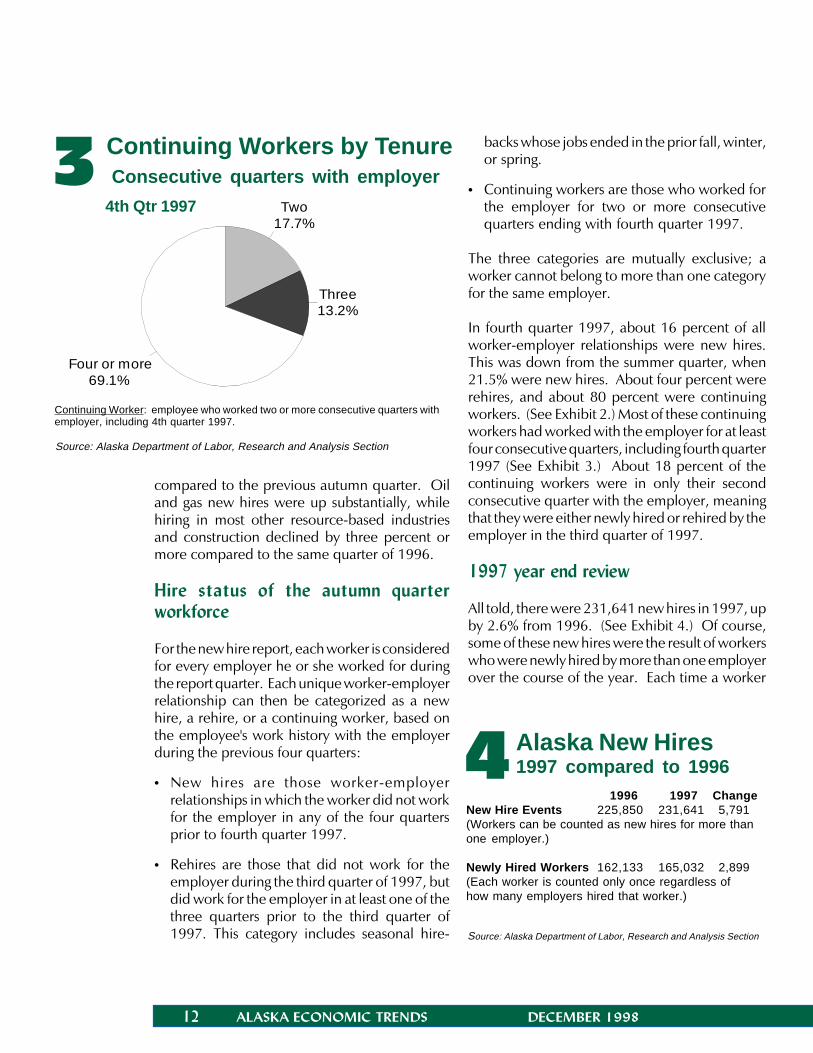
3 Continuing Workers by Tenure Consecutive quarters with employer
4th Qtr 1997
Source: Alaska Department of Labor, Research and Analysis Section
Four or more69.1%
Three13.2%
Two17.7%
Continuing Worker: employee who worked two or more consecutive quarters withemployer, including 4th quarter 1997.
1996 1997 ChangeNew Hire Events 225,850 231,641 5,791(Workers can be counted as new hires for more thanone employer.)
Newly Hired Workers 162,133 165,032 2,899(Each worker is counted only once regardless ofhow many employers hired that worker.)
Alaska New Hires1997 compared to 19964
Source: Alaska Department of Labor, Research and Analysis Section
compared to the previous autumn quarter. Oiland gas new hires were up substantially, whilehiring in most other resource-based industriesand construction declined by three percent ormore compared to the same quarter of 1996.
Hire status of the autumn quarterworkforce
For the new hire report, each worker is consideredfor every employer he or she worked for duringthe report quarter. Each unique worker-employerrelationship can then be categorized as a newhire, a rehire, or a continuing worker, based onthe employee's work history with the employerduring the previous four quarters:
• New hires are those worker-employerrelationships in which the worker did not workfor the employer in any of the four quartersprior to fourth quarter 1997.
• Rehires are those that did not work for theemployer during the third quarter of 1997, butdid work for the employer in at least one of thethree quarters prior to the third quarter of1997. This category includes seasonal hire-
backs whose jobs ended in the prior fall, winter,or spring.
• Continuing workers are those who worked forthe employer for two or more consecutivequarters ending with fourth quarter 1997.
The three categories are mutually exclusive; aworker cannot belong to more than one categoryfor the same employer.
In fourth quarter 1997, about 16 percent of allworker-employer relationships were new hires.This was down from the summer quarter, when21.5% were new hires. About four percent wererehires, and about 80 percent were continuingworkers. (See Exhibit 2.) Most of these continuingworkers had worked with the employer for at leastfour consecutive quarters, including fourth quarter1997 (See Exhibit 3.) About 18 percent of thecontinuing workers were in only their secondconsecutive quarter with the employer, meaningthat they were either newly hired or rehired by theemployer in the third quarter of 1997.
1997 year end review
All told, there were 231,641 new hires in 1997, upby 2.6% from 1996. (See Exhibit 4.) Of course,some of these new hires were the result of workerswho were newly hired by more than one employerover the course of the year. Each time a worker
ALASKA ECONOMIC TRENDS DECEMBER 1998 13
Source: Alaska Department of Labor, Research and Analysis Section
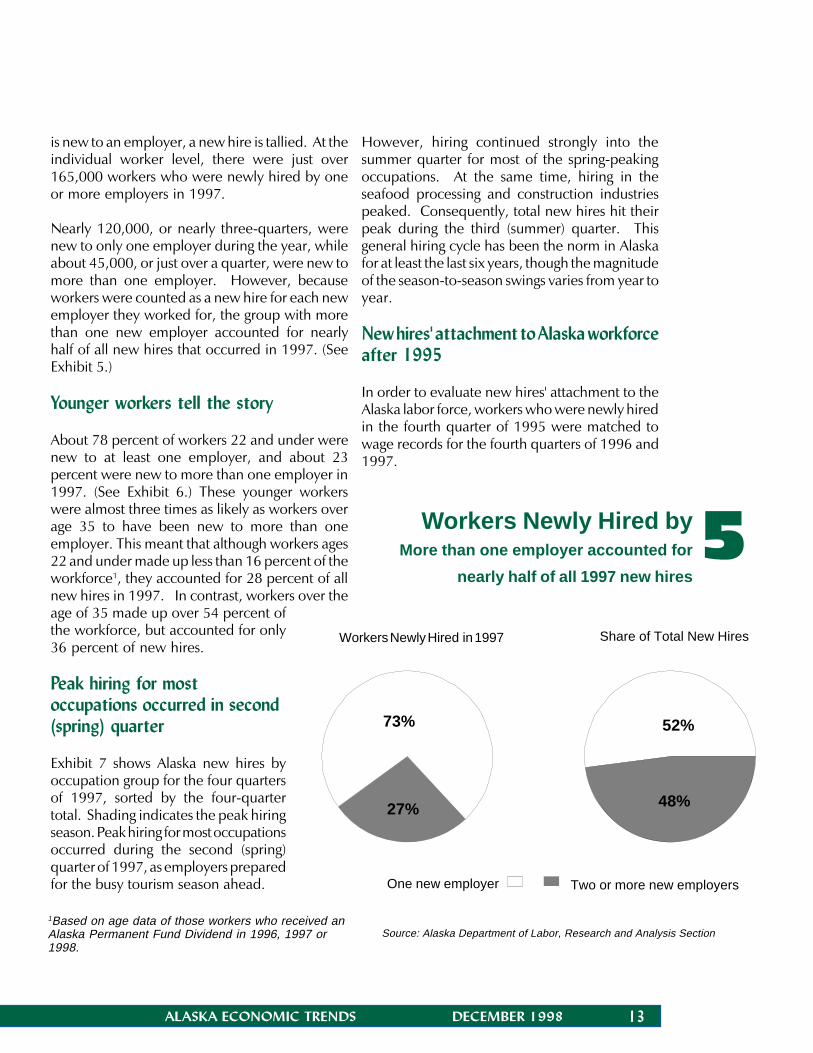
is new to an employer, a new hire is tallied. At theindividual worker level, there were just over165,000 workers who were newly hired by oneor more employers in 1997.
Nearly 120,000, or nearly three-quarters, werenew to only one employer during the year, whileabout 45,000, or just over a quarter, were new tomore than one employer. However, becauseworkers were counted as a new hire for each newemployer they worked for, the group with morethan one new employer accounted for nearlyhalf of all new hires that occurred in 1997. (SeeExhibit 5.)
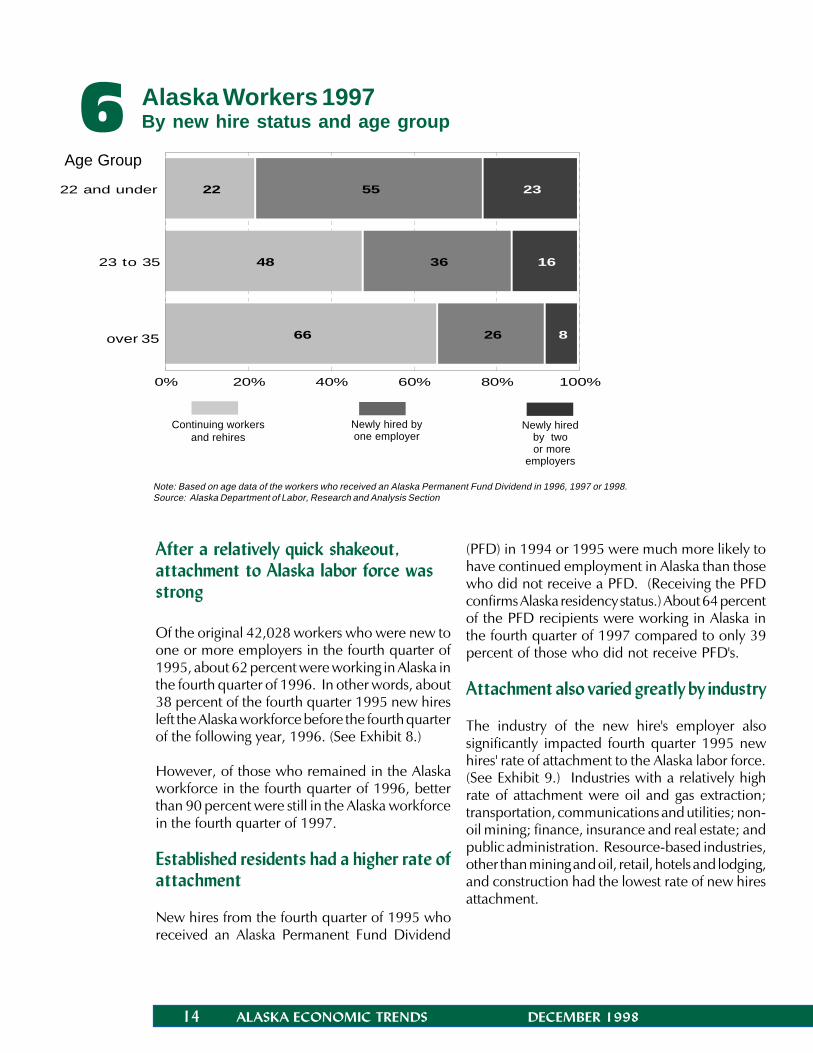
Younger workers tell the story
About 78 percent of workers 22 and under werenew to at least one employer, and about 23percent were new to more than one employer in1997. (See Exhibit 6.) These younger workerswere almost three times as likely as workers overage 35 to have been new to more than oneemployer. This meant that although workers ages22 and under made up less than 16 percent of theworkforce1, they accounted for 28 percent of allnew hires in 1997. In contrast, workers over theage of 35 made up over 54 percent ofthe workforce, but accounted for only36 percent of new hires.
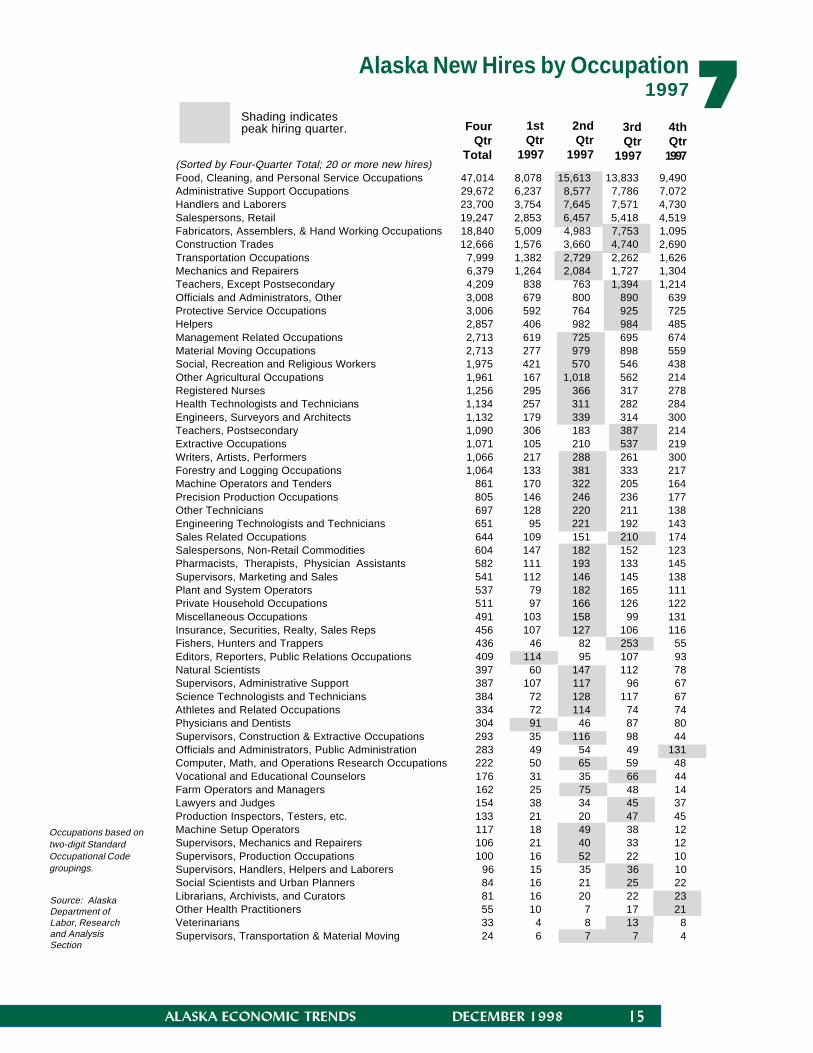
Peak hiring for mostoccupations occurred in second(spring) quarter
Exhibit 7 shows Alaska new hires byoccupation group for the four quartersof 1997, sorted by the four-quartertotal. Shading indicates the peak hiringseason. Peak hiring for most occupationsoccurred during the second (spring)quarter of 1997, as employers preparedfor the busy tourism season ahead.
However, hiring continued strongly into thesummer quarter for most of the spring-peakingoccupations. At the same time, hiring in theseafood processing and construction industriespeaked. Consequently, total new hires hit theirpeak during the third (summer) quarter. Thisgeneral hiring cycle has been the norm in Alaskafor at least the last six years, though the magnitudeof the season-to-season swings varies from year toyear.
New hires' attachment to Alaska workforceafter 1995
In order to evaluate new hires' attachment to theAlaska labor force, workers who were newly hiredin the fourth quarter of 1995 were matched towage records for the fourth quarters of 1996 and1997.
Workers Newly Hired in 1997 Share of Total New Hires
73%
27%
52%
48%
5 Workers Newly Hired byMore than one employer accounted for
nearly half of all 1997 new hires
One new employer Two or more new employers
1Based on age data of those workers who received anAlaska Permanent Fund Dividend in 1996, 1997 or1998.
14 ALASKA ECONOMIC TRENDS DECEMBER 1998
Note: Based on age data of the workers who received an Alaska Permanent Fund Dividend in 1996, 1997 or 1998.Source: Alaska Department of Labor, Research and Analysis Section
Alaska Workers 1997By new hire status and age group
22
48
66
55
36
26
23
16
8
22 and under
23 to 35
ov er 35
0% 20% 40% 60% 80% 100%
Age Group
After a relatively quick shakeout,attachment to Alaska labor force wasstrong
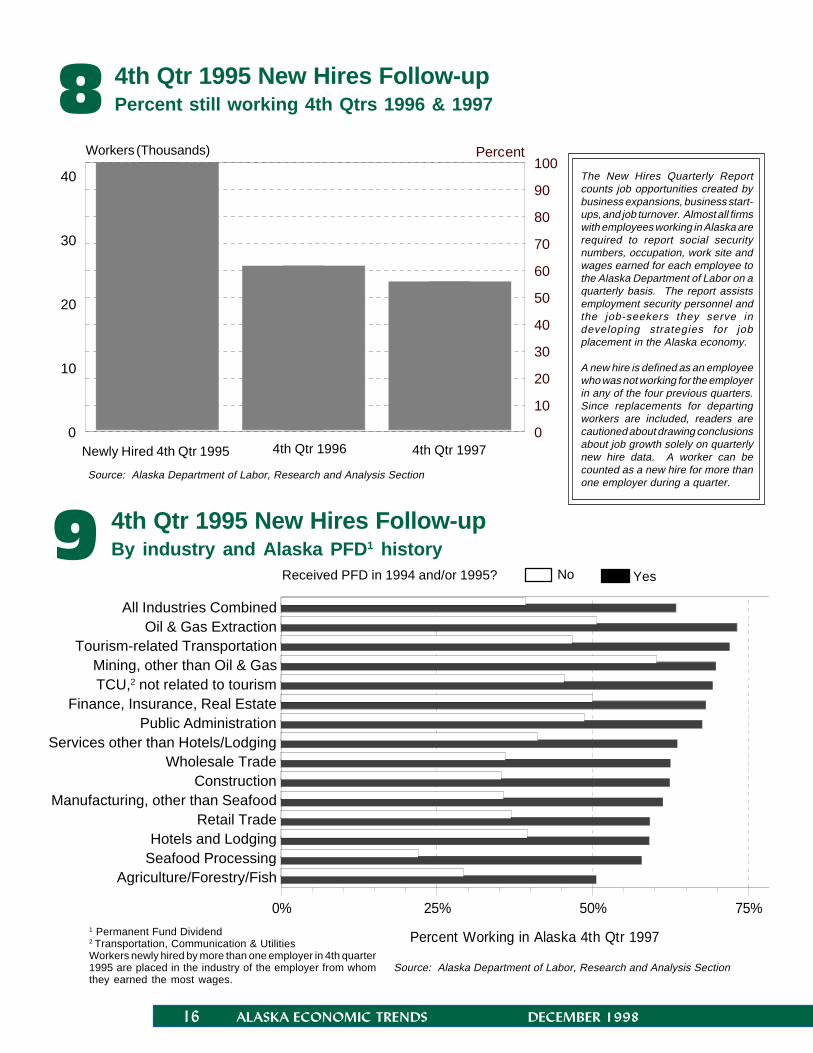
Of the original 42,028 workers who were new toone or more employers in the fourth quarter of1995, about 62 percent were working in Alaska inthe fourth quarter of 1996. In other words, about38 percent of the fourth quarter 1995 new hiresleft the Alaska workforce before the fourth quarterof the following year, 1996. (See Exhibit 8.)
However, of those who remained in the Alaskaworkforce in the fourth quarter of 1996, betterthan 90 percent were still in the Alaska workforcein the fourth quarter of 1997.
Established residents had a higher rate ofattachment
New hires from the fourth quarter of 1995 whoreceived an Alaska Permanent Fund Dividend
(PFD) in 1994 or 1995 were much more likely tohave continued employment in Alaska than thosewho did not receive a PFD. (Receiving the PFDconfirms Alaska residency status.) About 64 percentof the PFD recipients were working in Alaska inthe fourth quarter of 1997 compared to only 39percent of those who did not receive PFD's.
Attachment also varied greatly by industry
The industry of the new hire's employer alsosignificantly impacted fourth quarter 1995 newhires' rate of attachment to the Alaska labor force.(See Exhibit 9.) Industries with a relatively highrate of attachment were oil and gas extraction;transportation, communications and utilities; non-oil mining; finance, insurance and real estate; andpublic administration. Resource-based industries,other than mining and oil, retail, hotels and lodging,and construction had the lowest rate of new hiresattachment.
6
Continuing workersand rehires
Newly hired byone employer
Newly hiredby two
or moreemployers
over 35
ALASKA ECONOMIC TRENDS DECEMBER 1998 15
P o p p u
7Alaska New Hires by Occupation1997
Source: AlaskaDepartment ofLabor, Researchand AnalysisSection
FourQtr
Total
1stQtr
1997
2ndQtr
1997
3rdQtr
1997
4thQtr
1997
Occupations based ontwo-digit StandardOccupational Codegroupings.
Shading indicatespeak hiring quarter.
(Sorted by Four-Quarter Total; 20 or more new hires)Food, Cleaning, and Personal Service Occupations 47,014 8,078 15,613 13,833 9,490Administrative Support Occupations 29,672 6,237 8,577 7,786 7,072Handlers and Laborers 23,700 3,754 7,645 7,571 4,730Salespersons, Retail 19,247 2,853 6,457 5,418 4,519Fabricators, Assemblers, & Hand Working Occupations 18,840 5,009 4,983 7,753 1,095Construction Trades 12,666 1,576 3,660 4,740 2,690Transportation Occupations 7,999 1,382 2,729 2,262 1,626Mechanics and Repairers 6,379 1,264 2,084 1,727 1,304Teachers, Except Postsecondary 4,209 838 763 1,394 1,214Officials and Administrators, Other 3,008 679 800 890 639Protective Service Occupations 3,006 592 764 925 725Helpers 2,857 406 982 984 485Management Related Occupations 2,713 619 725 695 674Material Moving Occupations 2,713 277 979 898 559Social, Recreation and Religious Workers 1,975 421 570 546 438Other Agricultural Occupations 1,961 167 1,018 562 214Registered Nurses 1,256 295 366 317 278Health Technologists and Technicians 1,134 257 311 282 284Engineers, Surveyors and Architects 1,132 179 339 314 300Teachers, Postsecondary 1,090 306 183 387 214Extractive Occupations 1,071 105 210 537 219Writers, Artists, Performers 1,066 217 288 261 300Forestry and Logging Occupations 1,064 133 381 333 217Machine Operators and Tenders 861 170 322 205 164Precision Production Occupations 805 146 246 236 177Other Technicians 697 128 220 211 138Engineering Technologists and Technicians 651 95 221 192 143Sales Related Occupations 644 109 151 210 174Salespersons, Non-Retail Commodities 604 147 182 152 123Pharmacists, Therapists, Physician Assistants 582 111 193 133 145Supervisors, Marketing and Sales 541 112 146 145 138Plant and System Operators 537 79 182 165 111Private Household Occupations 511 97 166 126 122Miscellaneous Occupations 491 103 158 99 131Insurance, Securities, Realty, Sales Reps 456 107 127 106 116Fishers, Hunters and Trappers 436 46 82 253 55Editors, Reporters, Public Relations Occupations 409 114 95 107 93Natural Scientists 397 60 147 112 78Supervisors, Administrative Support 387 107 117 96 67Science Technologists and Technicians 384 72 128 117 67Athletes and Related Occupations 334 72 114 74 74Physicians and Dentists 304 91 46 87 80Supervisors, Construction & Extractive Occupations 293 35 116 98 44Officials and Administrators, Public Administration 283 49 54 49 131Computer, Math, and Operations Research Occupations 222 50 65 59 48Vocational and Educational Counselors 176 31 35 66 44Farm Operators and Managers 162 25 75 48 14Lawyers and Judges 154 38 34 45 37Production Inspectors, Testers, etc. 133 21 20 47 45Machine Setup Operators 117 18 49 38 12Supervisors, Mechanics and Repairers 106 21 40 33 12Supervisors, Production Occupations 100 16 52 22 10Supervisors, Handlers, Helpers and Laborers 96 15 35 36 10Social Scientists and Urban Planners 84 16 21 25 22Librarians, Archivists, and Curators 81 16 20 22 23Other Health Practitioners 55 10 7 17 21Veterinarians 33 4 8 13 8Supervisors, Transportation & Material Moving 24 6 7 7 4
16 ALASKA ECONOMIC TRENDS DECEMBER 1998
8 4th Qtr 1995 New Hires Follow-upPercent still working 4th Qtrs 1996 & 1997
0
10
20
30
40
Thousands
0
10
20
30
40
50
60
70
80
90
100Percent
Newly Hired 4th Qtr 1995 4th Qtr 1996 4th Qtr 1997
9
0% 25% 50% 75%
Percent Working in Alaska 4th Qtr 1997
All Industries CombinedOil & Gas Extraction
Tourism-related TransportationMining, other than Oil & GasTCU,2 not related to tourism
Finance, Insurance, Real EstatePublic Administration
Services other than Hotels/LodgingWholesale Trade
ConstructionManufacturing, other than Seafood
Retail TradeHotels and Lodging
Seafood ProcessingAgriculture/Forestry/Fish
4th Qtr 1995 New Hires Follow-upBy industry and Alaska PFD 1 history
1 Permanent Fund Dividend2 Transportation, Communication & UtilitiesWorkers newly hired by more than one employer in 4th quarter1995 are placed in the industry of the employer from whomthey earned the most wages.
Source: Alaska Department of Labor, Research and Analysis Section
Received PFD in 1994 and/or 1995? No Yes
Source: Alaska Department of Labor, Research and Analysis Section
The New Hires Quarterly Reportcounts job opportunities created bybusiness expansions, business start-ups, and job turnover. Almost all firmswith employees working in Alaska arerequired to report social securitynumbers, occupation, work site andwages earned for each employee tothe Alaska Department of Labor on aquarterly basis. The report assistsemployment security personnel andthe job-seekers they serve indeveloping strategies for jobplacement in the Alaska economy.
A new hire is defined as an employeewho was not working for the employerin any of the four previous quarters.Since replacements for departingworkers are included, readers arecautioned about drawing conclusionsabout job growth solely on quarterlynew hire data. A worker can becounted as a new hire for more thanone employer during a quarter.
Workers (Thousands)
ALASKA ECONOMIC TRENDS DECEMBER 1998 17
Trends 1998 Index of ArticlesJanuary• Sitka: Coping with Structural Change
• Case Study of a Layoff–Work Life after Sitka’s Pulp Mill Closure
• Alaska Employment SceneRecovering Oil
February• Public School Education–A Big Industry
• Alaska Employment SceneA Decade of Employment Growth
March• Alaska’s Resident Workforce Increases
• Spring Quarter New Hires Up by 1.3% in 1997
• Alaska Employment SceneUnemployment Below 8% for FifthYear in a Row
April• Annual Benchmark Revision for 1997 Completed
• Job Growth Rebounds in 1997
• Alaska Employment SceneA Good New Year–Despite Export Woes
May• Nearly 10,000 New Jobs by 2000
• Momentum Keeps Anchorage’s Economy Rolling
• Private Sector Growth Brightens Forecast
for Fairbanks
• Southeast Rides the Waves
• Alaska Employment SceneFish Fry
June• Measuring Alaska’s Cost of Living
• Alaska Employment Scene1998 Off to a Surprisingly Strong Start
July• The Nome Census Area–One Hundred Years Later
• Alaska Employment SceneConstruction Generates Employment Surge
August• The Trends 100: Alaska’s Largest Private
Employers–1997• Alaska Employment Scene
Alaska’s Economy Heats Up
September-October• Population Projections–A Probe into the Future
• Summer New Hires Rebound–1997Up from previous summer quarter
• Alaska Employment SceneJob Market is Hot–July shows usualeconomic peaks
November• The Alaska Employment Service Makes
Connections• Occupational Fatalities Decline–Water vehicle
deaths drop; air taxi deaths climb• Alaska Employment Scene
Record Low for Unemployment–Record high for Permanent Fund Dividend
December• Construction in the 1990s–A Stable
Decade for Construction• New Hires: Hiring Improves in 1997
• Alaska Employment SceneSeptember Employment Statistics Solid
18 ALASKA ECONOMIC TRENDS DECEMBER 1998
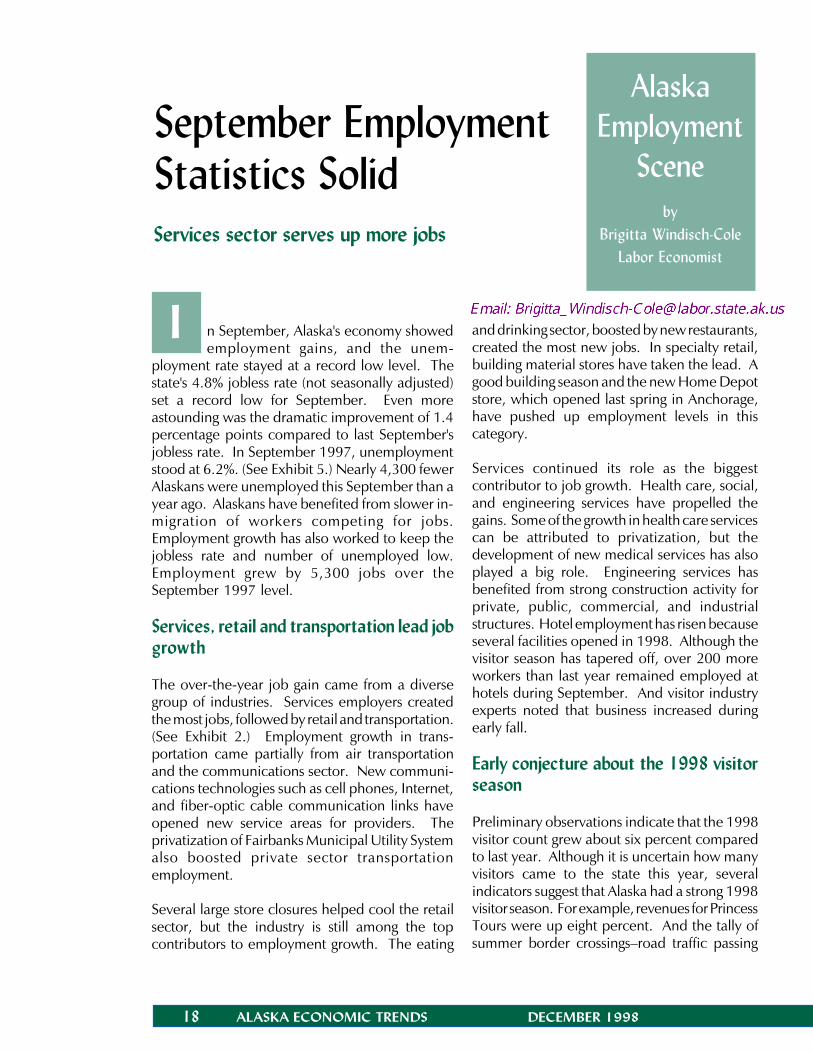
September EmploymentStatistics Solid
AlaskaEmployment
Sceneby
Brigitta Windisch-ColeLabor Economist
n September, Alaska's economy showedemployment gains, and the unem-
ployment rate stayed at a record low level. Thestate's 4.8% jobless rate (not seasonally adjusted)set a record low for September. Even moreastounding was the dramatic improvement of 1.4percentage points compared to last September'sjobless rate. In September 1997, unemploymentstood at 6.2%. (See Exhibit 5.) Nearly 4,300 fewerAlaskans were unemployed this September than ayear ago. Alaskans have benefited from slower in-migration of workers competing for jobs.Employment growth has also worked to keep thejobless rate and number of unemployed low.Employment grew by 5,300 jobs over theSeptember 1997 level.
Services, retail and transportation lead jobgrowth
The over-the-year job gain came from a diversegroup of industries. Services employers createdthe most jobs, followed by retail and transportation.(See Exhibit 2.) Employment growth in trans-portation came partially from air transportationand the communications sector. New communi-cations technologies such as cell phones, Internet,and fiber-optic cable communication links haveopened new service areas for providers. Theprivatization of Fairbanks Municipal Utility Systemalso boosted private sector transportationemployment.
Several large store closures helped cool the retailsector, but the industry is still among the topcontributors to employment growth. The eating
and drinking sector, boosted by new restaurants,created the most new jobs. In specialty retail,building material stores have taken the lead. Agood building season and the new Home Depotstore, which opened last spring in Anchorage,have pushed up employment levels in thiscategory.
Services continued its role as the biggestcontributor to job growth. Health care, social,and engineering services have propelled thegains. Some of the growth in health care servicescan be attributed to privatization, but thedevelopment of new medical services has alsoplayed a big role. Engineering services hasbenefited from strong construction activity forprivate, public, commercial, and industrialstructures. Hotel employment has risen becauseseveral facilities opened in 1998. Although thevisitor season has tapered off, over 200 moreworkers than last year remained employed athotels during September. And visitor industryexperts noted that business increased duringearly fall.
Early conjecture about the 1998 visitorseason
Preliminary observations indicate that the 1998visitor count grew about six percent comparedto last year. Although it is uncertain how manyvisitors came to the state this year, severalindicators suggest that Alaska had a strong 1998visitor season. For example, revenues for PrincessTours were up eight percent. And the tally ofsummer border crossings�road traffic passing
Services sector serves up more jobs
I
ALASKA ECONOMIC TRENDS DECEMBER 1998 19
P o p u
Source: Municipality of Anchorage, Treasury Division, and AnchorageIndicators 1997
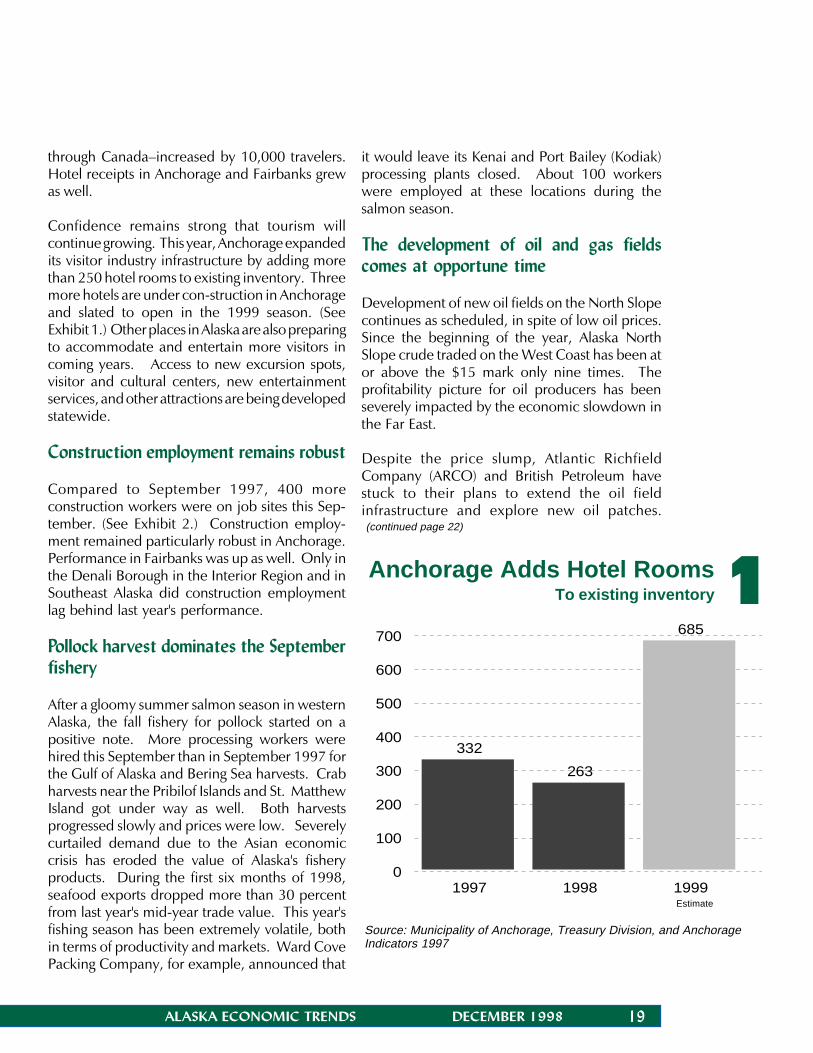
Anchorage Adds Hotel RoomsTo existing inventory 1
through Canada�increased by 10,000 travelers.Hotel receipts in Anchorage and Fairbanks grewas well.
Confidence remains strong that tourism willcontinue growing. This year, Anchorage expandedits visitor industry infrastructure by adding morethan 250 hotel rooms to existing inventory. Threemore hotels are under con-struction in Anchorageand slated to open in the 1999 season. (SeeExhibit 1.) Other places in Alaska are also preparingto accommodate and entertain more visitors incoming years. Access to new excursion spots,visitor and cultural centers, new entertainmentservices, and other attractions are being developedstatewide.
Construction employment remains robust
Compared to September 1997, 400 moreconstruction workers were on job sites this Sep-tember. (See Exhibit 2.) Construction employ-ment remained particularly robust in Anchorage.Performance in Fairbanks was up as well. Only inthe Denali Borough in the Interior Region and inSoutheast Alaska did construction employmentlag behind last year's performance.
Pollock harvest dominates the Septemberfishery
After a gloomy summer salmon season in westernAlaska, the fall fishery for pollock started on apositive note. More processing workers werehired this September than in September 1997 forthe Gulf of Alaska and Bering Sea harvests. Crabharvests near the Pribilof Islands and St. MatthewIsland got under way as well. Both harvestsprogressed slowly and prices were low. Severelycurtailed demand due to the Asian economiccrisis has eroded the value of Alaska's fisheryproducts. During the first six months of 1998,seafood exports dropped more than 30 percentfrom last year's mid-year trade value. This year'sfishing season has been extremely volatile, bothin terms of productivity and markets. Ward CovePacking Company, for example, announced that
it would leave its Kenai and Port Bailey (Kodiak)processing plants closed. About 100 workerswere employed at these locations during thesalmon season.
The development of oil and gas fieldscomes at opportune time
Development of new oil fields on the North Slopecontinues as scheduled, in spite of low oil prices.Since the beginning of the year, Alaska NorthSlope crude traded on the West Coast has been ator above the $15 mark only nine times. Theprofitability picture for oil producers has beenseverely impacted by the economic slowdown inthe Far East.
Despite the price slump, Atlantic RichfieldCompany (ARCO) and British Petroleum havestuck to their plans to extend the oil fieldinfrastructure and explore new oil patches.
332
263
685
1997 1998 19990
100
200
300
400
500
600
700
Estimate
(continued page 22)
20 ALASKA ECONOMIC TRENDS DECEMBER 1998
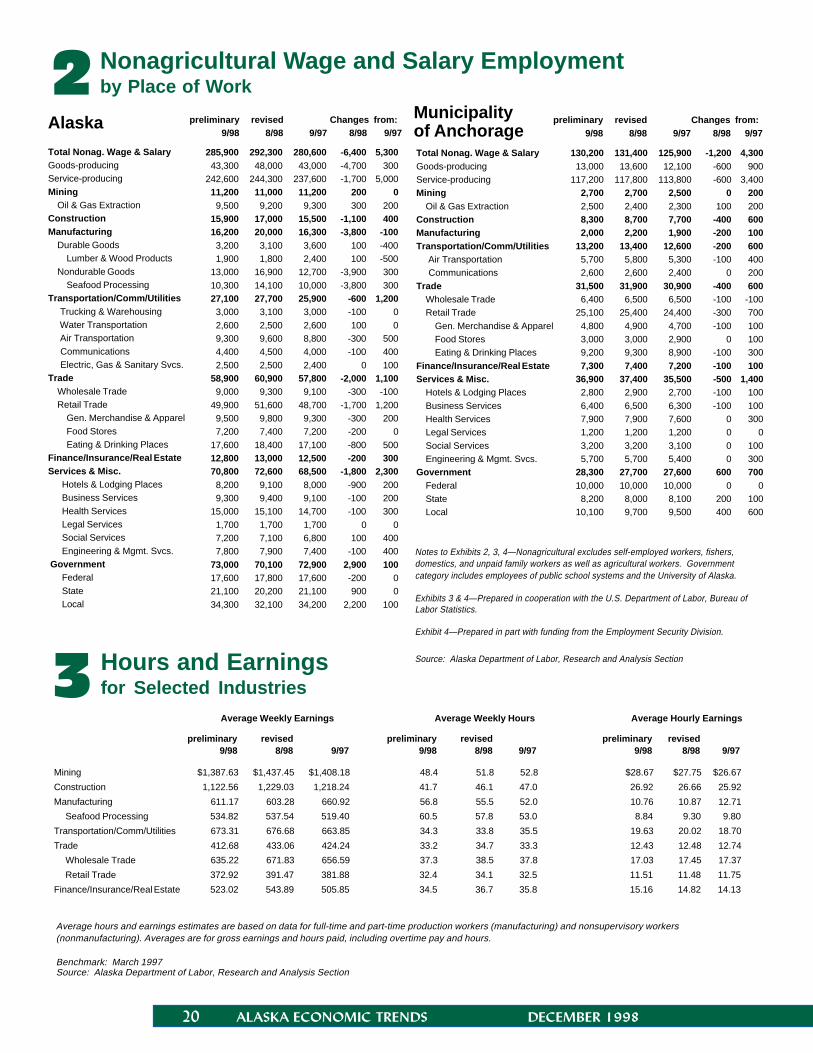
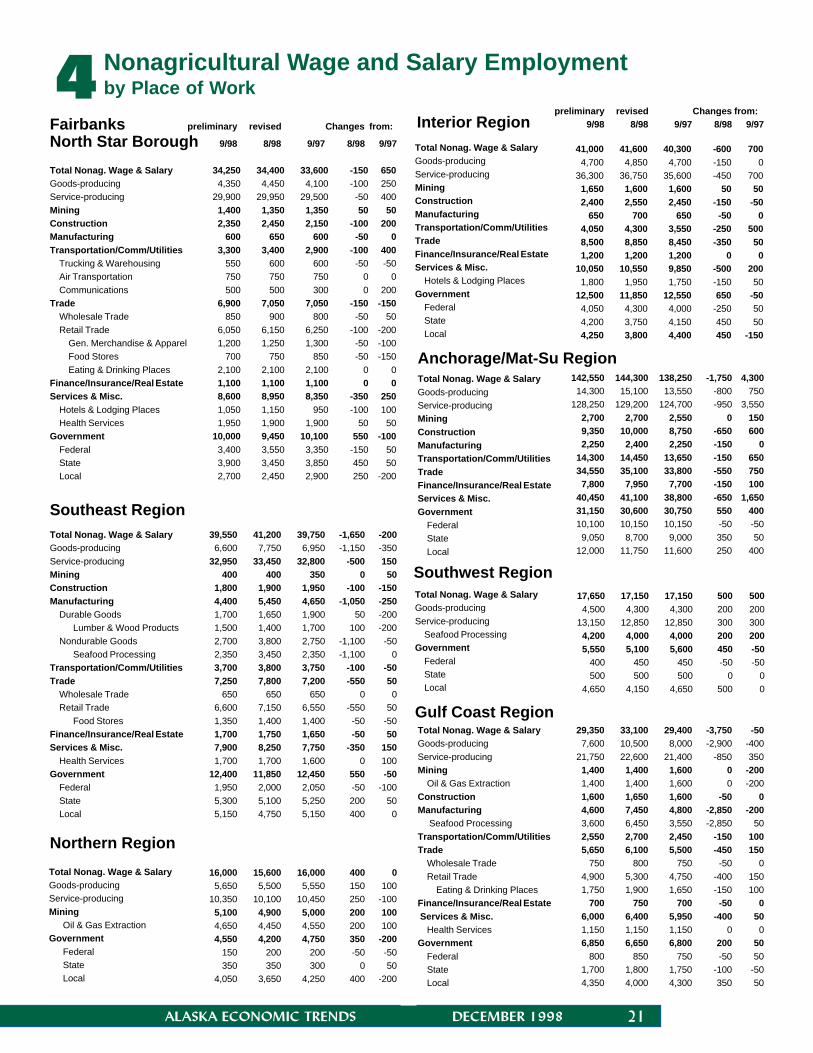
Nonagricultural Wage and Salary Employmentby Place of Work2
preliminary revised Changes from:9/98 8/98 9/97 8/98 9/97
Municipalityof AnchorageAlaska
Hours and Earningsfor Selected Industries3
Average Weekly Earnings Average Weekly Hours Average Hourly Earnings
preliminary revised preliminary revised preliminary revised9/98 8/98 9/97 9/98 8/98 9/97 9/98 8/98 9/97
Mining
Construction
Manufacturing
Seafood Processing
Transportation/Comm/Utilities
Trade
Wholesale Trade
Retail Trade
Finance/Insurance/Real Estate
Notes to Exhibits 2, 3, 4—Nonagricultural excludes self-employed workers, fishers,domestics, and unpaid family workers as well as agricultural workers. Governmentcategory includes employees of public school systems and the University of Alaska.
Exhibits 3 & 4—Prepared in cooperation with the U.S. Department of Labor, Bureau ofLabor Statistics.
Exhibit 4—Prepared in part with funding from the Employment Security Division.
Source: Alaska Department of Labor, Research and Analysis Section
Average hours and earnings estimates are based on data for full-time and part-time production workers (manufacturing) and nonsupervisory workers(nonmanufacturing). Averages are for gross earnings and hours paid, including overtime pay and hours.
Benchmark: March 1997Source: Alaska Department of Labor, Research and Analysis Section
preliminary revised Changes from:9/98 8/98 9/97 8/98 9/97
Total Nonag. Wage & SalaryGoods-producingService-producingMining
Oil & Gas ExtractionConstructionManufacturing
Durable GoodsLumber & Wood Products
Nondurable GoodsSeafood Processing
Transportation/Comm/Utilities Trucking & Warehousing Water Transportation Air Transportation Communications Electric, Gas & Sanitary Svcs.Trade
Wholesale TradeRetail Trade
Gen. Merchandise & ApparelFood StoresEating & Drinking Places
Finance/Insurance/Real EstateServices & Misc.
Hotels & Lodging PlacesBusiness ServicesHealth ServicesLegal ServicesSocial ServicesEngineering & Mgmt. Svcs.
GovernmentFederalStateLocal
285,900 292,300 280,600 -6,400 5,30043,300 48,000 43,000 -4,700 300
242,600 244,300 237,600 -1,700 5,00011,200 11,000 11,200 200 09,500 9,200 9,300 300 200
15,900 17,000 15,500 -1,100 40016,200 20,000 16,300 -3,800 -1003,200 3,100 3,600 100 -4001,900 1,800 2,400 100 -500
13,000 16,900 12,700 -3,900 30010,300 14,100 10,000 -3,800 30027,100 27,700 25,900 -600 1,2003,000 3,100 3,000 -100 02,600 2,500 2,600 100 09,300 9,600 8,800 -300 5004,400 4,500 4,000 -100 4002,500 2,500 2,400 0 100
58,900 60,900 57,800 -2,000 1,1009,000 9,300 9,100 -300 -100
49,900 51,600 48,700 -1,700 1,2009,500 9,800 9,300 -300 2007,200 7,400 7,200 -200 0
17,600 18,400 17,100 -800 50012,800 13,000 12,500 -200 30070,800 72,600 68,500 -1,800 2,3008,200 9,100 8,000 -900 2009,300 9,400 9,100 -100 200
15,000 15,100 14,700 -100 3001,700 1,700 1,700 0 07,200 7,100 6,800 100 4007,800 7,900 7,400 -100 400
73,000 70,100 72,900 2,900 10017,600 17,800 17,600 -200 021,100 20,200 21,100 900 034,300 32,100 34,200 2,200 100
Total Nonag. Wage & SalaryGoods-producingService-producingMining
Oil & Gas ExtractionConstructionManufacturingTransportation/Comm/Utilities Air Transportation CommunicationsTrade
Wholesale TradeRetail Trade
Gen. Merchandise & ApparelFood StoresEating & Drinking Places
Finance/Insurance/Real EstateServices & Misc.
Hotels & Lodging PlacesBusiness ServicesHealth ServicesLegal ServicesSocial ServicesEngineering & Mgmt. Svcs.
GovernmentFederalStateLocal
130,200 131,400 125,900 -1,200 4,30013,000 13,600 12,100 -600 900
117,200 117,800 113,800 -600 3,4002,700 2,700 2,500 0 2002,500 2,400 2,300 100 2008,300 8,700 7,700 -400 6002,000 2,200 1,900 -200 100
13,200 13,400 12,600 -200 6005,700 5,800 5,300 -100 4002,600 2,600 2,400 0 200
31,500 31,900 30,900 -400 6006,400 6,500 6,500 -100 -100
25,100 25,400 24,400 -300 7004,800 4,900 4,700 -100 1003,000 3,000 2,900 0 1009,200 9,300 8,900 -100 3007,300 7,400 7,200 -100 100
36,900 37,400 35,500 -500 1,4002,800 2,900 2,700 -100 1006,400 6,500 6,300 -100 1007,900 7,900 7,600 0 3001,200 1,200 1,200 0 03,200 3,200 3,100 0 1005,700 5,700 5,400 0 300
28,300 27,700 27,600 600 70010,000 10,000 10,000 0 08,200 8,000 8,100 200 100
10,100 9,700 9,500 400 600
$1,387.63 $1,437.45 $1,408.18 48.4 51.8 52.8 $28.67 $27.75 $26.67
1,122.56 1,229.03 1,218.24 41.7 46.1 47.0 26.92 26.66 25.92
611.17 603.28 660.92 56.8 55.5 52.0 10.76 10.87 12.71
534.82 537.54 519.40 60.5 57.8 53.0 8.84 9.30 9.80
673.31 676.68 663.85 34.3 33.8 35.5 19.63 20.02 18.70
412.68 433.06 424.24 33.2 34.7 33.3 12.43 12.48 12.74
635.22 671.83 656.59 37.3 38.5 37.8 17.03 17.45 17.37
372.92 391.47 381.88 32.4 34.1 32.5 11.51 11.48 11.75
523.02 543.89 505.85 34.5 36.7 35.8 15.16 14.82 14.13
ALASKA ECONOMIC TRENDS DECEMBER 1998 21
4
Northern Region
Gulf Coast Region
Anchorage/Mat-Su Region
Fairbanks preliminary revised Changes from:
North Star Borough 9/98 8/98 9/97 8/98 9/97
Southeast Region
Southwest Region
Nonagricultural Wage and Salary Employmentby Place of Work
preliminary revised Changes from:Interior Region 9/98 8/98 9/97 8/98 9/97
Total Nonag. Wage & SalaryGoods-producingService-producingMiningConstructionManufacturingTransportation/Comm/Utilities
Trucking & WarehousingAir TransportationCommunications
TradeWholesale TradeRetail Trade
Gen. Merchandise & ApparelFood StoresEating & Drinking Places
Finance/Insurance/Real EstateServices & Misc.
Hotels & Lodging PlacesHealth Services
GovernmentFederalStateLocal
Total Nonag. Wage & SalaryGoods-producingService-producingMiningConstructionManufacturing
Durable GoodsLumber & Wood Products
Nondurable GoodsSeafood Processing
Transportation/Comm/UtilitiesTrade
Wholesale TradeRetail Trade
Food StoresFinance/Insurance/Real EstateServices & Misc.
Health ServicesGovernment
FederalStateLocal
Total Nonag. Wage & SalaryGoods-producingService-producingMining
Oil & Gas ExtractionGovernment
FederalStateLocal
Total Nonag. Wage & SalaryGoods-producingService-producingMiningConstructionManufacturingTransportation/Comm/UtilitiesTradeFinance/Insurance/Real EstateServices & Misc.
Hotels & Lodging PlacesGovernment
FederalStateLocal
Total Nonag. Wage & SalaryGoods-producingService-producingMiningConstructionManufacturingTransportation/Comm/UtilitiesTradeFinance/Insurance/Real EstateServices & Misc.Government
FederalStateLocal
Total Nonag. Wage & SalaryGoods-producingService-producing
Seafood ProcessingGovernment
FederalStateLocal
Total Nonag. Wage & SalaryGoods-producingService-producingMining
Oil & Gas ExtractionConstructionManufacturing Seafood ProcessingTransportation/Comm/UtilitiesTrade
Wholesale TradeRetail Trade
Eating & Drinking PlacesFinance/Insurance/Real Estate Services & Misc.
Health ServicesGovernment
FederalStateLocal
29,350 33,100 29,400 -3,750 -507,600 10,500 8,000 -2,900 -400
21,750 22,600 21,400 -850 3501,400 1,400 1,600 0 -2001,400 1,400 1,600 0 -2001,600 1,650 1,600 -50 04,600 7,450 4,800 -2,850 -2003,600 6,450 3,550 -2,850 502,550 2,700 2,450 -150 1005,650 6,100 5,500 -450 150
750 800 750 -50 04,900 5,300 4,750 -400 1501,750 1,900 1,650 -150 100
700 750 700 -50 06,000 6,400 5,950 -400 501,150 1,150 1,150 0 06,850 6,650 6,800 200 50
800 850 750 -50 501,700 1,800 1,750 -100 -504,350 4,000 4,300 350 50
17,650 17,150 17,150 500 5004,500 4,300 4,300 200 200
13,150 12,850 12,850 300 3004,200 4,000 4,000 200 2005,550 5,100 5,600 450 -50
400 450 450 -50 -50500 500 500 0 0
4,650 4,150 4,650 500 0
34,250 34,400 33,600 -150 6504,350 4,450 4,100 -100 250
29,900 29,950 29,500 -50 4001,400 1,350 1,350 50 502,350 2,450 2,150 -100 200
600 650 600 -50 03,300 3,400 2,900 -100 400
550 600 600 -50 -50750 750 750 0 0500 500 300 0 200
6,900 7,050 7,050 -150 -150850 900 800 -50 50
6,050 6,150 6,250 -100 -2001,200 1,250 1,300 -50 -100
700 750 850 -50 -1502,100 2,100 2,100 0 01,100 1,100 1,100 0 08,600 8,950 8,350 -350 2501,050 1,150 950 -100 1001,950 1,900 1,900 50 50
10,000 9,450 10,100 550 -1003,400 3,550 3,350 -150 503,900 3,450 3,850 450 502,700 2,450 2,900 250 -200
41,000 41,600 40,300 -600 7004,700 4,850 4,700 -150 0
36,300 36,750 35,600 -450 7001,650 1,600 1,600 50 502,400 2,550 2,450 -150 -50
650 700 650 -50 04,050 4,300 3,550 -250 5008,500 8,850 8,450 -350 501,200 1,200 1,200 0 0
10,050 10,550 9,850 -500 2001,800 1,950 1,750 -150 50
12,500 11,850 12,550 650 -504,050 4,300 4,000 -250 504,200 3,750 4,150 450 504,250 3,800 4,400 450 -150
16,000 15,600 16,000 400 05,650 5,500 5,550 150 100
10,350 10,100 10,450 250 -1005,100 4,900 5,000 200 1004,650 4,450 4,550 200 1004,550 4,200 4,750 350 -200
150 200 200 -50 -50350 350 300 0 50
4,050 3,650 4,250 400 -200
39,550 41,200 39,750 -1,650 -2006,600 7,750 6,950 -1,150 -350
32,950 33,450 32,800 -500 150400 400 350 0 50
1,800 1,900 1,950 -100 -1504,400 5,450 4,650 -1,050 -2501,700 1,650 1,900 50 -2001,500 1,400 1,700 100 -2002,700 3,800 2,750 -1,100 -502,350 3,450 2,350 -1,100 03,700 3,800 3,750 -100 -507,250 7,800 7,200 -550 50
650 650 650 0 06,600 7,150 6,550 -550 501,350 1,400 1,400 -50 -501,700 1,750 1,650 -50 507,900 8,250 7,750 -350 1501,700 1,700 1,600 0 100
12,400 11,850 12,450 550 -501,950 2,000 2,050 -50 -1005,300 5,100 5,250 200 505,150 4,750 5,150 400 0
142,550 144,300 138,250 -1,750 4,30014,300 15,100 13,550 -800 750
128,250 129,200 124,700 -950 3,5502,700 2,700 2,550 0 1509,350 10,000 8,750 -650 6002,250 2,400 2,250 -150 0
14,300 14,450 13,650 -150 65034,550 35,100 33,800 -550 7507,800 7,950 7,700 -150 100
40,450 41,100 38,800 -650 1,65031,150 30,600 30,750 550 40010,100 10,150 10,150 -50 -509,050 8,700 9,000 350 50
12,000 11,750 11,600 250 400
22 ALASKA ECONOMIC TRENDS DECEMBER 1998
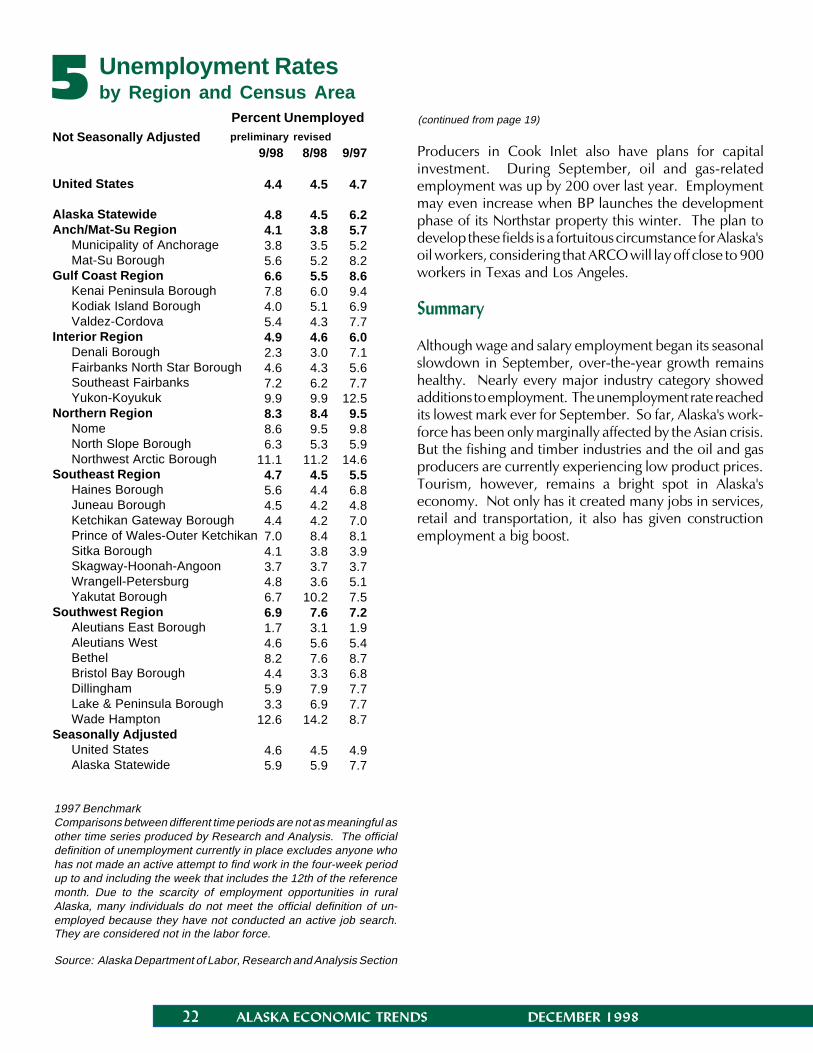
5 Unemployment Ratesby Region and Census Area
Percent Unemployedpreliminary revised
1997 BenchmarkComparisons between different time periods are not as meaningful asother time series produced by Research and Analysis. The officialdefinition of unemployment currently in place excludes anyone whohas not made an active attempt to find work in the four-week periodup to and including the week that includes the 12th of the referencemonth. Due to the scarcity of employment opportunities in ruralAlaska, many individuals do not meet the official definition of un-employed because they have not conducted an active job search.They are considered not in the labor force.
Source: Alaska Department of Labor, Research and Analysis Section
Producers in Cook Inlet also have plans for capitalinvestment. During September, oil and gas-relatedemployment was up by 200 over last year. Employmentmay even increase when BP launches the developmentphase of its Northstar property this winter. The plan todevelop these fields is a fortuitous circumstance for Alaska'soil workers, considering that ARCO will lay off close to 900workers in Texas and Los Angeles.
Summary
Although wage and salary employment began its seasonalslowdown in September, over-the-year growth remainshealthy. Nearly every major industry category showedadditions to employment. The unemployment rate reachedits lowest mark ever for September. So far, Alaska's work-force has been only marginally affected by the Asian crisis.But the fishing and timber industries and the oil and gasproducers are currently experiencing low product prices.Tourism, however, remains a bright spot in Alaska'seconomy. Not only has it created many jobs in services,retail and transportation, it also has given constructionemployment a big boost.
Not Seasonally Adjusted
United States
Alaska StatewideAnch/Mat-Su Region
Municipality of AnchorageMat-Su Borough
Gulf Coast RegionKenai Peninsula BoroughKodiak Island BoroughValdez-Cordova
Interior RegionDenali BoroughFairbanks North Star BoroughSoutheast FairbanksYukon-Koyukuk
Northern RegionNomeNorth Slope BoroughNorthwest Arctic Borough
Southeast RegionHaines BoroughJuneau BoroughKetchikan Gateway BoroughPrince of Wales-Outer KetchikanSitka BoroughSkagway-Hoonah-AngoonWrangell-PetersburgYakutat Borough
Southwest RegionAleutians East BoroughAleutians WestBethelBristol Bay BoroughDillinghamLake & Peninsula BoroughWade Hampton
Seasonally AdjustedUnited StatesAlaska Statewide
9/98 8/98 9/97
4.4 4.5 4.7
4.8 4.5 6.24.1 3.8 5.73.8 3.5 5.25.6 5.2 8.26.6 5.5 8.67.8 6.0 9.44.0 5.1 6.95.4 4.3 7.74.9 4.6 6.02.3 3.0 7.1 4.6 4.3 5.67.2 6.2 7.79.9 9.9 12.58.3 8.4 9.58.6 9.5 9.86.3 5.3 5.9
11.1 11.2 14.64.7 4.5 5.55.6 4.4 6.84.5 4.2 4.84.4 4.2 7.07.0 8.4 8.14.1 3.8 3.9 3.7 3.7 3.74.8 3.6 5.16.7 10.2 7.56.9 7.6 7.21.7 3.1 1.94.6 5.6 5.48.2 7.6 8.74.4 3.3 6.85.9 7.9 7.73.3 6.9 7.7
12.6 14.2 8.7
4.6 4.5 4.95.9 5.9 7.7
(continued from page 19)
ALASKA ECONOMIC TRENDS DECEMBER 1998 23
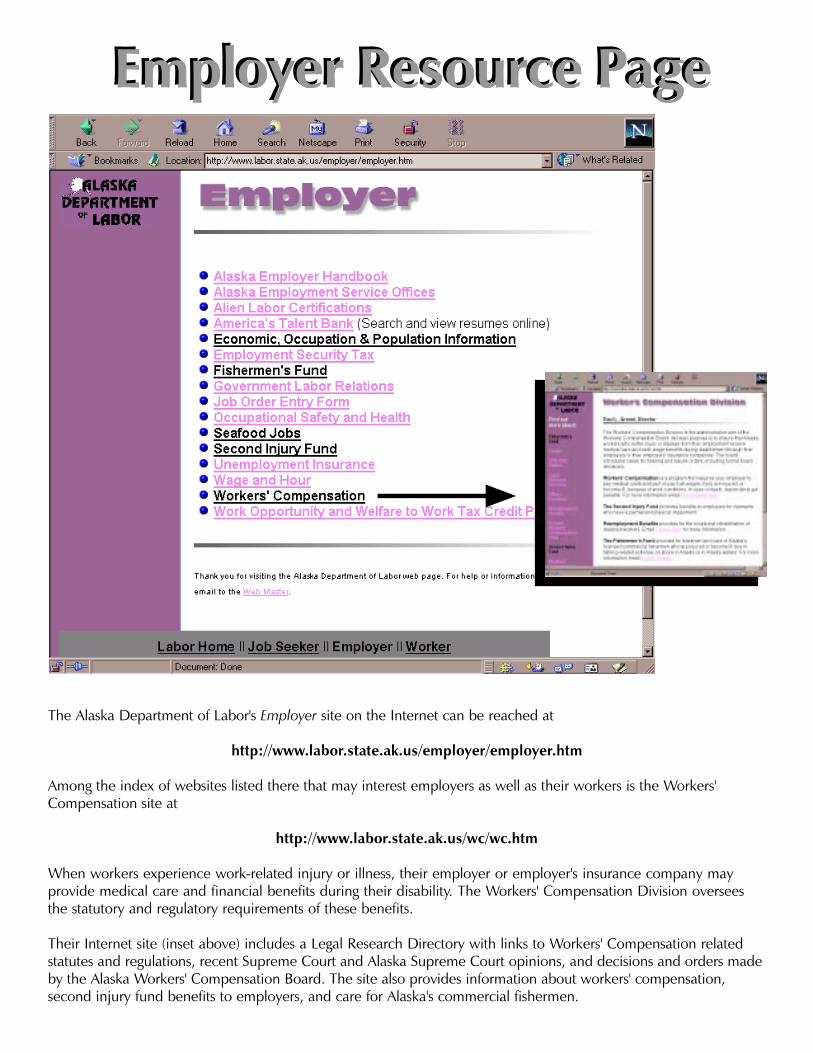
Employer Resource PageEmployer Resource PageEmployer Resource Page
The Alaska Department of Labor's Employer site on the Internet can be reached at
http://www.labor.state.ak.us/employer/employer.htm
Among the index of websites listed there that may interest employers as well as their workers is the Workers'Compensation site at
http://www.labor.state.ak.us/wc/wc.htm
When workers experience work-related injury or illness, their employer or employer's insurance company mayprovide medical care and financial benefits during their disability. The Workers' Compensation Division overseesthe statutory and regulatory requirements of these benefits.
Their Internet site (inset above) includes a Legal Research Directory with links to Workers' Compensation relatedstatutes and regulations, recent Supreme Court and Alaska Supreme Court opinions, and decisions and orders madeby the Alaska Workers' Compensation Board. The site also provides information about workers' compensation,second injury fund benefits to employers, and care for Alaska's commercial fishermen.