Consequences of Rural Biomass Extraction for Bird Communities in an Indian Tropical Dry Forest and...
30
Consequences of Rural Biomass Extraction for Bird Communities in an Indian Tropical Dry Forest and the Role of Vegetation Structure Raman Kumar and Ghazala Shahabuddin Abstract: There is limited information on the ecological effects of anthropo- genic disturbance caused by extractive activities such as grazing and fire- wood collection. A study was carried out in Sariska Tiger Reserve in India, to investigate the effects of disturbance on forest bird communities. Vegetation structural parameters including canopy cover, tree basal area and average height of trees were significantly lower in disturbed sites in comparison to undisturbed sites. However, other attributes of tree structure and the features of the understorey and herbaceous layer were unaffected by the disturbance regime. There was no significant difference in the number of recorded species and bird abundance between ‘disturbed’ (extracted) and ‘undisturbed’ (non- extracted) sites. However, bird species diversity was significantly lower in disturbed sites. Bird species composition also differed significantly between disturbed and undisturbed sites and was associated with disturbance indica- tors. Bird species composition was also significantly related to six different structural variables. Abundance of twelve of forty-eight (25%) bird species (that were abundant enough to be analysed), showed significant associations with disturbance indicators as well as one or more of structural variables. Of these, four bird species showed selection for disturbed habitats while eight se- lected undisturbed habitats over disturbed. Most of the bird species choosing Raman Kumar, 36 Curzon Road, Dehradun, Uttaranchal 248001, India. Ghazala Shahabuddin, Research Associate, Wildlife Conservation Society-India Programme, 26-2 Aga Abbas Ali Road (Apt. 403), Bangalore, Karnataka 560 042, India. Fellow, Environmental Studies Group, Council for Social Development, 53, Lodi Estate, New Delhi 110 003, India. Address for Correspondence Ghazala Shahabuddin, Fellow, Environmental Studies Group, Council for Social Development, 53, Lodi Estate, New Delhi 110 003, India. E-mail: [email protected] Conservation and Society, Pages 562–591 Volume 4, No. 4, December 2006 Copyright: © Kumar and Shahabuddin 2006. This is an open access article distributed under the terms of the Creative Commons Attribution License, which permits unrestricted use and distribution of the article, provided the original work is cited.
-
Upload
independent -
Category
Documents
-
view
0 -
download
0
Transcript of Consequences of Rural Biomass Extraction for Bird Communities in an Indian Tropical Dry Forest and...

Consequences of Rural Biomass Extraction for Bird Communities in an Indian Tropical Dry Forest and
the Role of Vegetation Structure
Raman Kumar and Ghazala Shahabuddin Abstract: There is limited information on the ecological effects of anthropo-genic disturbance caused by extractive activities such as grazing and fire-wood collection. A study was carried out in Sariska Tiger Reserve in India, to investigate the effects of disturbance on forest bird communities. Vegetation structural parameters including canopy cover, tree basal area and average height of trees were significantly lower in disturbed sites in comparison to undisturbed sites. However, other attributes of tree structure and the features of the understorey and herbaceous layer were unaffected by the disturbance regime. There was no significant difference in the number of recorded species and bird abundance between ‘disturbed’ (extracted) and ‘undisturbed’ (non-extracted) sites. However, bird species diversity was significantly lower in disturbed sites. Bird species composition also differed significantly between disturbed and undisturbed sites and was associated with disturbance indica-tors. Bird species composition was also significantly related to six different structural variables. Abundance of twelve of forty-eight (25%) bird species (that were abundant enough to be analysed), showed significant associations with disturbance indicators as well as one or more of structural variables. Of these, four bird species showed selection for disturbed habitats while eight se-lected undisturbed habitats over disturbed. Most of the bird species choosing Raman Kumar, 36 Curzon Road, Dehradun, Uttaranchal 248001, India. Ghazala Shahabuddin, Research Associate, Wildlife Conservation Society-India Programme, 26-2 Aga Abbas Ali Road (Apt. 403), Bangalore, Karnataka 560 042, India. Fellow, Environmental Studies Group, Council for Social Development, 53, Lodi Estate, New Delhi 110 003, India. Address for Correspondence Ghazala Shahabuddin, Fellow, Environmental Studies Group, Council for Social Development, 53, Lodi Estate, New Delhi 110 003, India. E-mail: [email protected]
Conservation and Society, Pages 562–591 Volume 4, No. 4, December 2006 Copyright: © Kumar and Shahabuddin 2006. This is an open access article distributed under the terms of the Creative Commons Attribution License, which permits unrestricted use and distribution of the article, provided the original work is cited.
Consequences of rural biomass extraction for bird communities / 563
undisturbed over disturbed habitats were insectivores. Both the disturbance index and the vegetation structure had significant effects on bird composition even when the other was controlled for. Our study indicates that forest re-source extraction can have significant effects on bird species composition of tropical dry forests through alteration of vegetation structure. Keywords: avifaunal diversity, bird species composition, biomass extraction, forest degradation, indicator species
INTRODUCTION IN TROPICAL COUNTRIES, forests are used extensively by the rural people for numerous subsistence needs, even inside wildlife reserves that have been pri-oritised for biodiversity conservation (Kothari et al. 1989; van Schaik et al. 1997). In fact, biomass extraction, in the form of grazing, fuelwood collection and non-timber forest product collection, may be the most widespread pres-sure on forests in developing countries, where rural populations depend sig-nificantly on them for their livelihoods (Hegde and Enters 2000). Ecological sustainability of biomass extraction is a controversial issue since biologists believe that extractive use compromises the aim of biodiversity conservation inside protected areas (van Schaik et al. 1997). There is some evidence that the sustained use of forests for biomass extraction may cause significant changes in forest structure and plant composition (e.g. Daniels et al. 1995; Murali et al. 1996; Shankar et al. 1998; Tilman and Lehman 2001; Kumar and Shahabuddin 2005), which, in turn, have the potential to influence diversity and composition of forest fauna (Du Plessis 1995; Bawa and Seidler 1998; Terborgh 1998; Shahabuddin and Prasad 2004). Birds are one of the forest taxa that have been found sensitive to changes in habitat caused by hu-man use such as logging, conversion to plantations and shifting cultivation and the accompanying changes in vegetation structure and composition (Blankespoor 1991; Raman et al. 1998; Thiollay 1999; Duguay et al. 2001; Lohr et al. 2002; Raman 2002). Yet, many conservationists feel that local-level use is unlikely to cause ecological damage due to the inherent adaptation of ecosystem-dependent people to their environment, sustainable harvesting and traditional conservation practices (e.g. Nabhan 1997; Johari 2003). The controversy on forest use sustainability is manifested in prominent debates in the conservation literature such as on the relative effectiveness of extractive reserves and strictly protected areas in South America (see Schwartzman et al. 2000 and responses) or that on the role of Integrated Conservation and Devel-opment Programmes (see Adams and Hulme 2001 and responses). Despite the global debate on use-based conservation, the actual knowledge of the ecological impacts of subsistence-level forest resource extraction is ex-tremely limited. Most studies of ecological change due to human use have fo-cused on more intense forms of disturbance such as logging and conversion to agriculture or monocultural plantations (Raman et al. 1998; Thiollay 1999).

/ Kumar and Shahabuddin 564
Studies on human impact in the tropical dry forest ecosystem are even fewer, despite the fact that this biome comprises a little less than half of all tropical forests (Sagar and Singh 2004; Sanchez-Azofeifa et al. 2005). In fact, con-cerns of conservation in dry forest have been largely overshadowed by rain-forest issues during the last few decades. Tropical dry forest generally represents the first frontier of economic development in most countries and is therefore subject to far more intensive use by people (Janzen 1988; Sanchez-Azofeifa et al. 2005). It is also a highly endangered ecosystem globally that has virtually disappeared due to land-use change (Sanchez-Azofeifa et al. 2005). There is, therefore, an urgent need to document effects of extractive human uses on the species and communities of the tropical dry zone so that considerations of biodiversity can be incorporated into conservation planning. Sariska Tiger Reserve is one of the conservation areas in northern India where biomass extraction from forests is a contested issue between biologists and advocates of community-based conservation (Johnsingh et al. 1997; Jo-hari 2003). While biologists and forest managers believe that biomass extrac-tion has led to significant biodiversity decline in this Reserve (Johnsingh et al. 1997; Government of Rajasthan 2002; Kumar and Shahabuddin 2005), other conservationists feel that local human use has had negligible impacts upon floral and faunal components of the ecosystem (Shrotiya, undated). In the cur-rent study, we quantify effects of anthropogenic disturbance on biodiversity conservation values of Sariska Tiger Reserve, using bird species and commu-nities as indicators, which can help impart direction to future management planning in this Reserve and other dry forest ecosystems in the tropics. Specifically, the three questions that we address in the present study are: (1) does anthropogenic disturbance caused by biomass extraction affect the diver-sity and composition of avifaunal communities of a tropical dry forest and if so, in what ways?, (2) what are the disturbance-induced changes in forest vegetation structure through which the changes in avifaunal community (if any) are mediated? and (3) are there residual effects of anthropogenic distur-bance on bird communities over and above those caused through accompany-ing changes in vegetation structure? Effects on the bird community are studied with respect to diversity and species composition while changes in vegetation structure are studied with respect to attributes of trees, understorey vegetation (comprising shrubs and saplings) and the herbaceous ground layer.
MATERIALS AND METHODS Study Site Sariska Tiger Reserve (henceforth referred to as Sariska), a protected area lo-cated in the Indian state of Rajasthan in north-western India, was one of the important areas for conservation of the endangered tiger (Panthera tigris) in India until its recorded local extinction in late 2004 (Mazoomdar 2005).
Consequences of rural biomass extraction for bird communities / 565
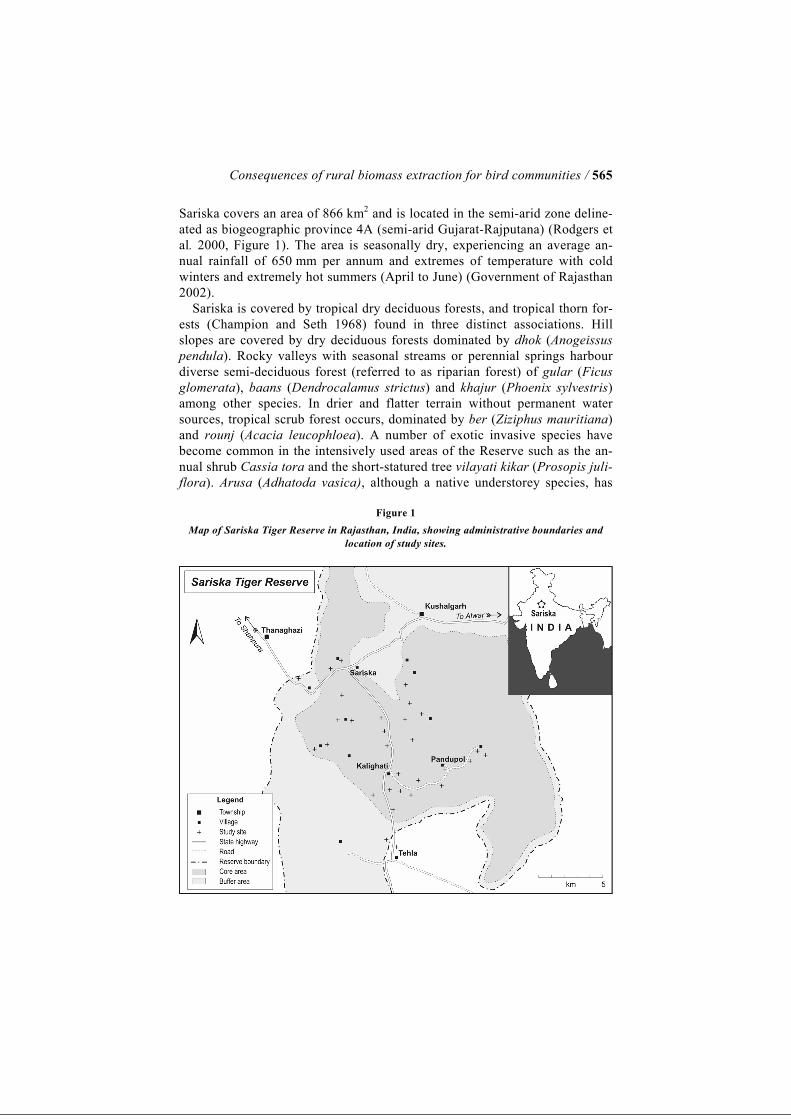
Sariska covers an area of 866 km2 and is located in the semi-arid zone deline-ated as biogeographic province 4A (semi-arid Gujarat-Rajputana) (Rodgers et al. 2000, Figure 1). The area is seasonally dry, experiencing an average an-nual rainfall of 650 mm per annum and extremes of temperature with cold winters and extremely hot summers (April to June) (Government of Rajasthan 2002). Sariska is covered by tropical dry deciduous forests, and tropical thorn for-ests (Champion and Seth 1968) found in three distinct associations. Hill slopes are covered by dry deciduous forests dominated by dhok (Anogeissus pendula). Rocky valleys with seasonal streams or perennial springs harbour diverse semi-deciduous forest (referred to as riparian forest) of gular (Ficus glomerata), baans (Dendrocalamus strictus) and khajur (Phoenix sylvestris) among other species. In drier and flatter terrain without permanent water sources, tropical scrub forest occurs, dominated by ber (Ziziphus mauritiana) and rounj (Acacia leucophloea). A number of exotic invasive species have become common in the intensively used areas of the Reserve such as the an-nual shrub Cassia tora and the short-statured tree vilayati kikar (Prosopis juli-flora). Arusa (Adhatoda vasica), although a native understorey species, has
Figure 1 Map of Sariska Tiger Reserve in Rajasthan, India, showing administrative boundaries and
location of study sites.
/ Kumar and Shahabuddin 566
become very common in disturbed and overgrazed areas, and appears to sup-press grass and other native herbaceous species. More detailed descriptions of vegetation in Sariska can be found in Parmar (1985). Sariska formed part of the game preserve of the Maharajah of Alwar, who closed off this area to public access, during the early twentieth century. Be-fore 1900, it is likely that this area formed village common lands. After Indian independence, when the Alwar principality was annulled, Sariska Wildlife Sanctuary was notified comprising an area of 195 km2 in 1955. Inside the sanctuary, there was extensive and unplanned felling between 1955 and 1968 after which commercial felling ceased according to working plan prescrip-tions (Johari 2003). In 1979, Sariska was declared a Project Tiger Reserve, which now officially has an area of 866 km2. In 1982, a notification was is-sued by the Rajasthan State Government specifying intention to declare ap-proximately 400-km2 area of the Reserve (designated Core Area I) as a National Park. The final notification in this regard is still pending. It is important to note that Sariska has been subject to varying degrees of biomass extraction including timber extraction, grazing and collection of non-wood forest produce since recorded history. However, during the last 25 years since its declaration as a Tiger Reserve (1982), most of the Reserve has been strictly protected from anthropogenic disturbance enforced by patrolling and frequent compounding of cattle. While some areas, mainly close to villages and on the periphery, continue to undergo grazing and other biomass extrac-tion to varying extents, there has been no timber extraction since 1982. Our study therefore focuses on the impacts of relatively recent (approximately 23 years) anthropogenic disturbance caused only by biomass extraction activities, and not past logging, in Sariska Tiger Reserve. In some sense, the current study can also be used as a way to gauge the effect of 23 years of effective protection on forest avifauna. Our study focused on Core Area I of the Reserve which has eleven small hamlets located in it. Most of the resident people here are livestock herders by occupation. Their primary source of income is the production of milk, for which they graze their livestock inside the Reserve. Several villages outside the Reserve boundaries also depend on it for fodder and grazing. Mostly goats and buffaloes are grazed but some people also keep sheep and cows. Apart from grazing, people commonly lop leaves and branches from trees and shrubs for stall-feeding their livestock. People also collect deadwood and tree branches from the Sariska forests to meet their fuelwood requirements (per-sonal observation). Trees are felled occasionally for firewood. A number of fruits and other plant parts are locally used as food. Demarcation of Study Sites We quantitatively compared the diversity and composition of avifauna and forest vegetation structure between areas facing high pressure of biomass ex-
Consequences of rural biomass extraction for bird communities / 567
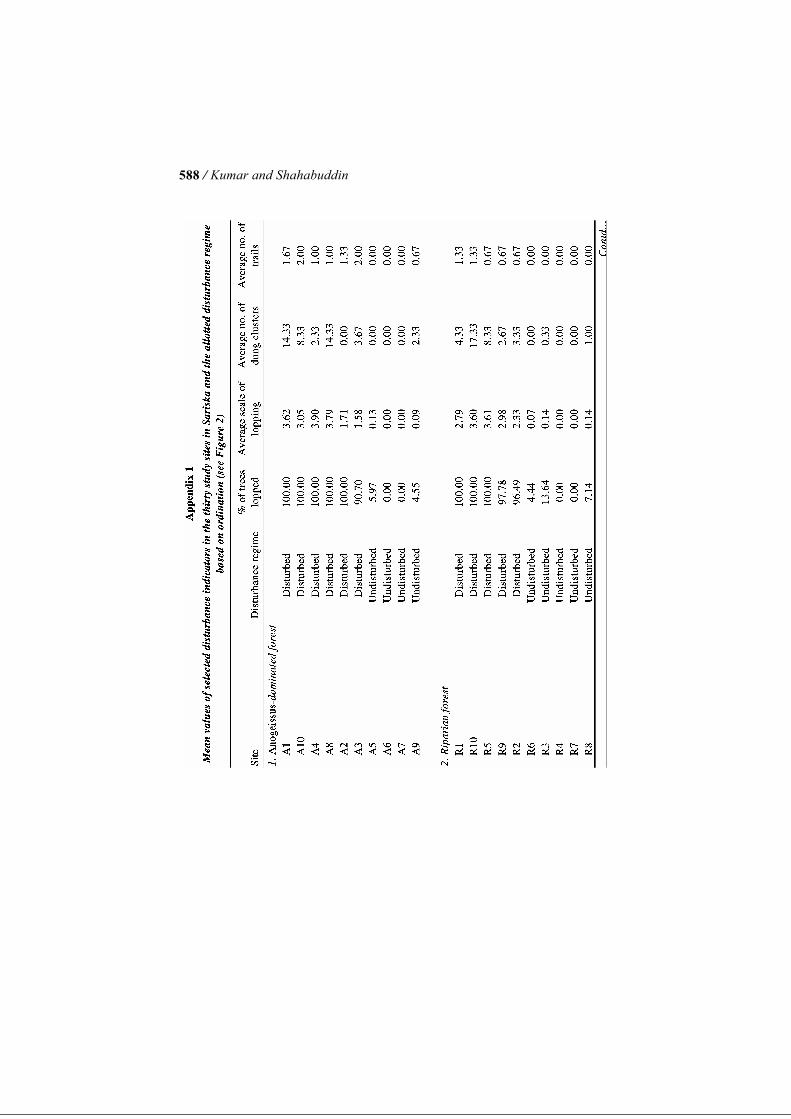
traction and those that are better protected and currently facing little or no an-thropogenic pressure (henceforth referred to as ‘disturbed’ and ‘undisturbed sites’, respectively). The selection of sites was based on detailed discussions with park staff, village people and tourist guides in addition to our visual as-sessment of patterns of human use over six months during a previous pilot project (Shahabuddin and Verma 2003). Once the sites were selected, quanti-tative descriptors of anthropogenic disturbance were measured at each of the thirty sites, for the purpose of grouping them into two distinct levels of dis-turbance (see section on Data Analysis below). We emphasise that the terms ‘disturbed’ and ‘undisturbed’ are used here purely for convenience and only imply differential intensities of biomass extraction rather than a watertight distinction between ‘use’ and ‘no use’ zones. For quantifying disturbance indicators, a randomly oriented, 500-m long line transect was established at each site. Three circular plots, each of 10 m radius, were established along this transect: one each at the start, centre and the end of the transect, with an inter-point distance of 150–300 m. Thus, a to-tal of ninety circular plots were marked inside the Reserve equally distributed over thirty study sites. The thirty sites, in turn, were equally distributed over the three most widespread vegetation types found in the Reserve—Anogeissus-dominated slope forest, scrub forest and riparian forest, in an ef-fort to include as much variability in vegetation across the Reserve as possi-ble. Consequently, each vegetation type was represented by ten sites (or thirty circular plots), overall. Studying Anthropogenic Disturbance Variables Four distinct indicators of disturbance due to biomass extraction were re-corded for each circular plot: proportion of trees showing signs of lopping, average scale of lopping of trees, number of human trails traversing the plot and number of piles of livestock dung. These variables were chosen to reflect the intensity of use of the site for grazing, fodder collection and fuelwood extraction by local people. While ex-tent and degree of lopping of trees reflects the frequency of fodder and fuel-wood collection, livestock dung indicates the degree of usage by livestock including goats, buffaloes and cows. In each circular plot, we enumerated all trees having girth at breast height (GBH) >20 cm (or diameter at breast height [DBH] of 6.4 cm). The propor-tion of trees showing signs of lopping was recorded. Lopping score for each tree was additionally measured on a scale of 0–4, as follows—0: no lopping; 1: rudimentary signs of lopping; 2: up to half of the main branches lopped; 3: more than half of main branches lopped and 4: tree reduced to a stump. Scale of lopping was calculated as the total lopping score divided by the total num-ber of trees present. In each circular plot, the total number of dung pats of livestock was also recorded as an indicator of usage of the habitat by live-

/ Kumar and Shahabuddin 568
stock. The number of distinct foot trails running through each 10-m-radius circular plot was also counted. Each of these four variables indicating distur-bance was then averaged over a site’s three circular plots to give a single value for each site (see Appendix 1). For analytical purposes, a disturbance index was created by relativising each of the four disturbance indicators by their respective maximum values and then adding all four values for a given site. We emphasise here that each of the measured disturbance indicators represent the combined effect of various anthropogenic activities on the forest including biomass extraction activities such as grazing, fodder collection, wood cutting, collection of fruit, trampling and simply physical disturbance, since these different forms of human use cannot be separated from one an-other. Quantifying Vegetation Structure We studied vegetation structure of tree layer, understorey and ground vegeta-tion in terms of fourteen distinct variables at all of the same plots that had been studied for disturbance indicators. Within each 10-m-radius circular plot, we assessed canopy cover as presence/absence of overhead vegetation at every 1 m interval along two mutually perpendicular diameters with the help of an improvised densitometer. Thus, we had a total of forty points, out of which the number of points where overhead vegetation was recorded gave us the quantitative proportion of canopy cover for that plot. Tree density was quantified as the total number of trees occurring inside the plot, that had GBH >20 cm. We measured GBH of individual trees using a tape measure, which was used to calculate the tree basal area for the plot. Height of trees was cal-culated with the help of tape measure and hypsometer, and averaged over the total number of trees inside the plot as average height of trees. In addition, tree height diversity was calculated as a Shannon Diversity Index for the height class distribution. The shrub layer or understorey was studied using a 5-m-radius circular plot nested within the 10-m-radius circular plots used for enumerating tree layer. ‘Shrubs’ in this paper, for the sake of convenience, refers to all plants occur-ring inside the plot with height >1 m and GBH<20 cm. This category there-fore included tree saplings, shrubs and even annuals that crossed the 1-m height limit. Assuming their crown cross-sections to be roughly elliptical, ob-servations of crown diameter were taken along the major and minor axes of such individuals. From this we calculated the approximate area occupied by each shrub. The percentage area covered by shrubs was calculated using the total area covered by shrubs in the 5-m radius plot to the total plot area. C. tora is a common annual weed that has spread over a large proportion of for-est habitat, and formed a significant component of the understorey vegetation during the season of sampling. Therefore, along with the total shrub area, we listed the area occupied by C. tora as a separate entity. The height of each in-
Consequences of rural biomass extraction for bird communities / 569
dividual/clump was totalled and averaged over the total number of individuals to get average shrub height for the 5-m-radius circular plot. The structure of ground vegetation (plants with height <1 m) was studied by randomly placing a square quadrat of dimensions 0.5 × 0.5 m2 twenty times within each of the 10-m circular plots. This quadrat consisted of a wooden frame with a grid formed by wires placed at an interval of 10 cm both horizontally and vertically. The wire grid thus had sixteen intersection points. The category of vegetation existing at each of the intersecting points was re-corded as grass, bare ground or herbs (non-graminaceous plants including forbs, seedlings and saplings). These values were totalled for the twenty repli-cates and yielded, for each plot, an estimate of the proportion of ground area covered by each of the three chosen categories. Each of the fourteen measured variables relating to vegetation structure was averaged across the three circular plots in each site. It was this average value for each of the thirty study sites that was utilised in all subsequent analyses. Bird Counts We used fixed-radius point counts, located at each of the thirty sites, for col-lecting data on bird species abundance, diversity and composition (Bibby et al. 1992; Raman 2003). At each of the thirty sites, point counts were centred on the same circular plots as were used for sampling vegetation structural characteristics (see above). We sampled each of the sites four times during the course of the study, i.e. from March to May 2005. This period covers the well-demarcated spring–summer season in the Reserve. Thus, a total of 360 point counts were undertaken during the course of the study. On a given day, we recorded all the birds occurring within a 30 m radius of a particular site for 10 minutes, after a 2-minute waiting period. Birds were identified based on their descriptions in field guides by Ali and Ripley (1983) and Grimmett et al. (1998). We did not record birds observed to be flying over the 30 m radius of the study point or soaring overhead. However, flying birds were recorded if they were flushed out from within 30 m radius of the study point by the ob-server or observed to be flying into or out of the transect area during the 10-minute duration of the count. Calling birds were recorded if the observer was sure that they were calling from within the fixed radius of 30 m. We started counts half-an-hour after sunrise and continued for 2 hours after that, usually between 0730 and 0930 hours, each morning. We sampled two to three sites (six to nine points) on each sampling day. The order of the two sites taken on a particular day was permuted for the following sampling round to take into account the possible diurnal variation in detection of bird species. All bird counts were undertaken by same pair of observers throughout the pe-riod of the study. At each of the thirty sites, we calculated abundance of each bird species by totalling all the records over the four temporal and three spatial replicates at

/ Kumar and Shahabuddin 570
the given site. This calculation thus represents frequency of observation rather than net densities of each bird species in a given site and is only an indicator of habitat utilisation. The cumulative number of species recorded at a given site over the three spatial and four temporal replicates was used as a surrogate of species richness while species diversity was quantified using Shannon–Wiener’s Diversity Index. The cumulative number of individual birds re-corded over the three spatial and four temporal replicates at a given site was used as an indicator of bird abundance. Data Analysis A principal components analysis (PCA) was carried out with the four meas-ured disturbance indicators to separate the sites into two clusters, one that rep-resented high degree of use and extraction and the other that represented relatively low level of biomass extraction. For the PCA, each of the distur-bance indicators was first relativised on a scale of zero to one, following Jongman et al. (1995) so that no single variable was given more weight in comparison to the others. Bird abundance (of all species), number of species recorded and diversity were compared between disturbed and undisturbed sites using non-parametric Kruskal–Wallis test for difference in means (Sokal and Rohlf 1994). Being based on ranked data, the Kruskal–Wallis test does not require the assump-tions of homogeneity of variances within groups and normality of data points, assumptions that are often difficult to meet in the case of community data (McCune and Grace 2002). To test if bird species composition differed significantly between disturbed and undisturbed sites, multi-response permutation procedure (MRPP) was used (McCune and Grace 2002). This statistical test, based on randomisation, has been specially designed to assess similarity in species composition among two or more groups of sites. It tests the hypothesis that two groups of sites differ more from each other in terms of species composition than expected by chance and yields a probability value alone (McCune and Grace 2002). MRPP is based on calculation of similarity indices calculated between pairs of sites. The similarity index used in this case was Sorensen’s similarity index that utilises relative abundances, rather than presence–absence data to assess simi-larities (Krebs 1999). Bird species composition was also related to each dis-turbance indicator using simple Mantel’s test (see below). To see which species, if any, specifically responded to disturbance regimes, frequencies of sightings of each species across thirty sites, were subjected to indicator species analysis, a randomisation-based technique used to describe the value of different species for indicating environmental conditions (Du-frene and Legendre 1997; McCune and Grace 2002). Being based on concepts of abundance and frequency, it combines both ‘fidelity’ and ‘exclusivity’ of a species to a group of sites. In the present case, it was ideal for assessing ad-
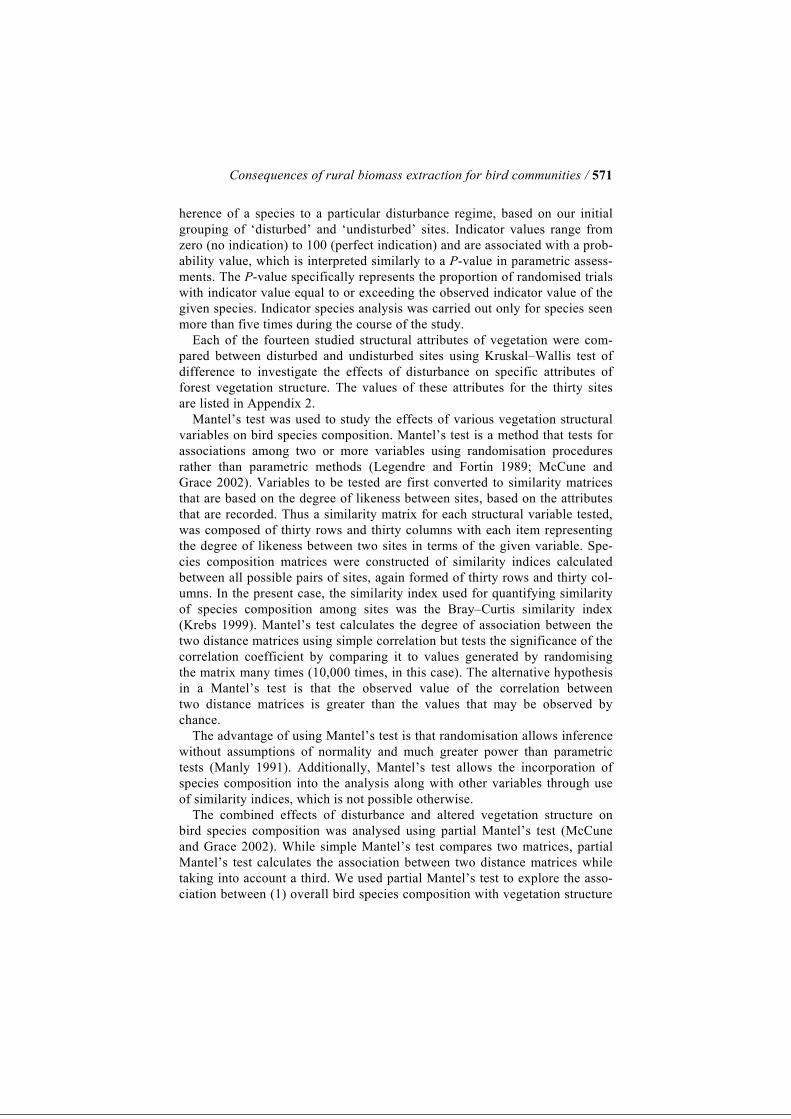
Consequences of rural biomass extraction for bird communities / 571
herence of a species to a particular disturbance regime, based on our initial grouping of ‘disturbed’ and ‘undisturbed’ sites. Indicator values range from zero (no indication) to 100 (perfect indication) and are associated with a prob-ability value, which is interpreted similarly to a P-value in parametric assess-ments. The P-value specifically represents the proportion of randomised trials with indicator value equal to or exceeding the observed indicator value of the given species. Indicator species analysis was carried out only for species seen more than five times during the course of the study. Each of the fourteen studied structural attributes of vegetation were com-pared between disturbed and undisturbed sites using Kruskal–Wallis test of difference to investigate the effects of disturbance on specific attributes of forest vegetation structure. The values of these attributes for the thirty sites are listed in Appendix 2. Mantel’s test was used to study the effects of various vegetation structural variables on bird species composition. Mantel’s test is a method that tests for associations among two or more variables using randomisation procedures rather than parametric methods (Legendre and Fortin 1989; McCune and Grace 2002). Variables to be tested are first converted to similarity matrices that are based on the degree of likeness between sites, based on the attributes that are recorded. Thus a similarity matrix for each structural variable tested, was composed of thirty rows and thirty columns with each item representing the degree of likeness between two sites in terms of the given variable. Spe-cies composition matrices were constructed of similarity indices calculated between all possible pairs of sites, again formed of thirty rows and thirty col-umns. In the present case, the similarity index used for quantifying similarity of species composition among sites was the Bray–Curtis similarity index (Krebs 1999). Mantel’s test calculates the degree of association between the two distance matrices using simple correlation but tests the significance of the correlation coefficient by comparing it to values generated by randomising the matrix many times (10,000 times, in this case). The alternative hypothesis in a Mantel’s test is that the observed value of the correlation between two distance matrices is greater than the values that may be observed by chance. The advantage of using Mantel’s test is that randomisation allows inference without assumptions of normality and much greater power than parametric tests (Manly 1991). Additionally, Mantel’s test allows the incorporation of species composition into the analysis along with other variables through use of similarity indices, which is not possible otherwise. The combined effects of disturbance and altered vegetation structure on bird species composition was analysed using partial Mantel’s test (McCune and Grace 2002). While simple Mantel’s test compares two matrices, partial Mantel’s test calculates the association between two distance matrices while taking into account a third. We used partial Mantel’s test to explore the asso-ciation between (1) overall bird species composition with vegetation structure
/ Kumar and Shahabuddin 572
while accounting for disturbance index; and (2) overall bird species composi-tion with disturbance index while accounting for vegetation structure. To study the overall effect of vegetation structure and disturbance on indi-vidual species, their respective abundances were also correlated with the cal-culated disturbance index as well as each of the relevant vegetation structural variables (those showing significant alteration in disturbed sites) using simple parametric correlations. To assess the effectiveness of this approach for find-ing indicator species (see Martin and Possingham 2005), the analysed bird species were classified into two groups based on the published literature: those that prefer open forest, agricultural fields and other human-modified habitats, and those that are known to prefer densely wooded habitat. Percent-ages of species in each category that conformed to the expectation were calcu-lated and compared. PCA, Mantel’s test, MRPP and indicator species analysis were carried out using PC-ORD, a statistical software specifically designed for analysing eco-logical community data (McCune and Mefford 1999). The Kruskal–Wallis test and simple correlations were done with the help of S-PLUS statistical software. Table 1 lists all of the analytical techniques used in this paper.
Table 1 List of analytical techniques used in the study of bird communities in Sariska Tiger Reserve
Sl. no. Aim of the test Statistical test used A Determination of disturbance gradient/clusters (i) Clustering sites on the basis of disturbance variables PCA
B Bird community vs disturbance (i) Effects of disturbance on bird abundance, richness
and diversity Kruskal–Wallis test
(ii) Effects of disturbance on bird species composition MRPP (iii) Individual bird species’ responses to disturbance Indicator species analysis C Vegetation structure vs. disturbance (i) Effects of disturbance on vegetation structural variables Kruskal–Wallis tests D Bird community vs vegetation structure (i) Effects of vegetation structure on bird species composition Bivariate Mantel’s tests (ii) Individual bird species’ responses to vegetation structure Simple correlations E Combined model: bird community on vegetation structure
and disturbance (i) Dependence of bird species composition on disturbance
and vegetation structure, taken together Partial Mantel’s tests
Abbreviations: MRPP, multi-response permutation procedure; PCA, principal components analysis.
Consequences of rural biomass extraction for bird communities / 573
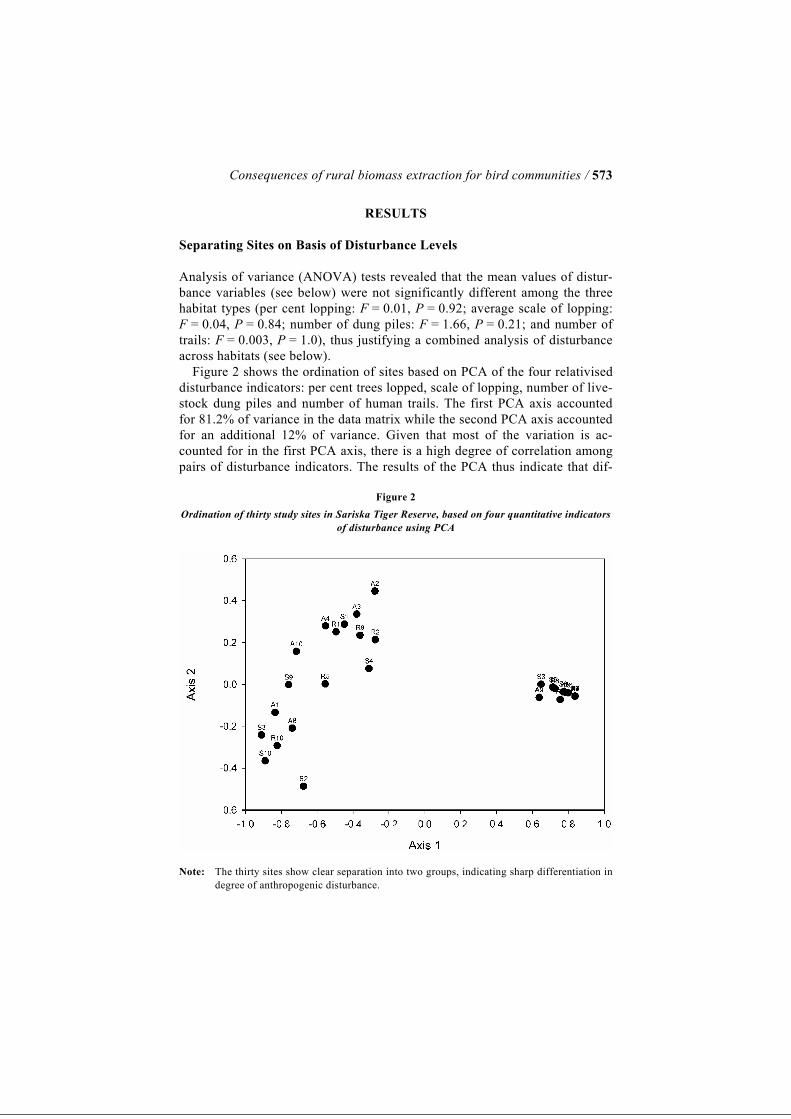
RESULTS Separating Sites on Basis of Disturbance Levels Analysis of variance (ANOVA) tests revealed that the mean values of distur-bance variables (see below) were not significantly different among the three habitat types (per cent lopping: F = 0.01, P = 0.92; average scale of lopping: F = 0.04, P = 0.84; number of dung piles: F = 1.66, P = 0.21; and number of trails: F = 0.003, P = 1.0), thus justifying a combined analysis of disturbance across habitats (see below). Figure 2 shows the ordination of sites based on PCA of the four relativised disturbance indicators: per cent trees lopped, scale of lopping, number of live-stock dung piles and number of human trails. The first PCA axis accounted for 81.2% of variance in the data matrix while the second PCA axis accounted for an additional 12% of variance. Given that most of the variation is ac-counted for in the first PCA axis, there is a high degree of correlation among pairs of disturbance indicators. The results of the PCA thus indicate that dif-
Figure 2 Ordination of thirty study sites in Sariska Tiger Reserve, based on four quantitative indicators
of disturbance using PCA
Note: The thirty sites show clear separation into two groups, indicating sharp differentiation in degree of anthropogenic disturbance.

/ Kumar and Shahabuddin 574
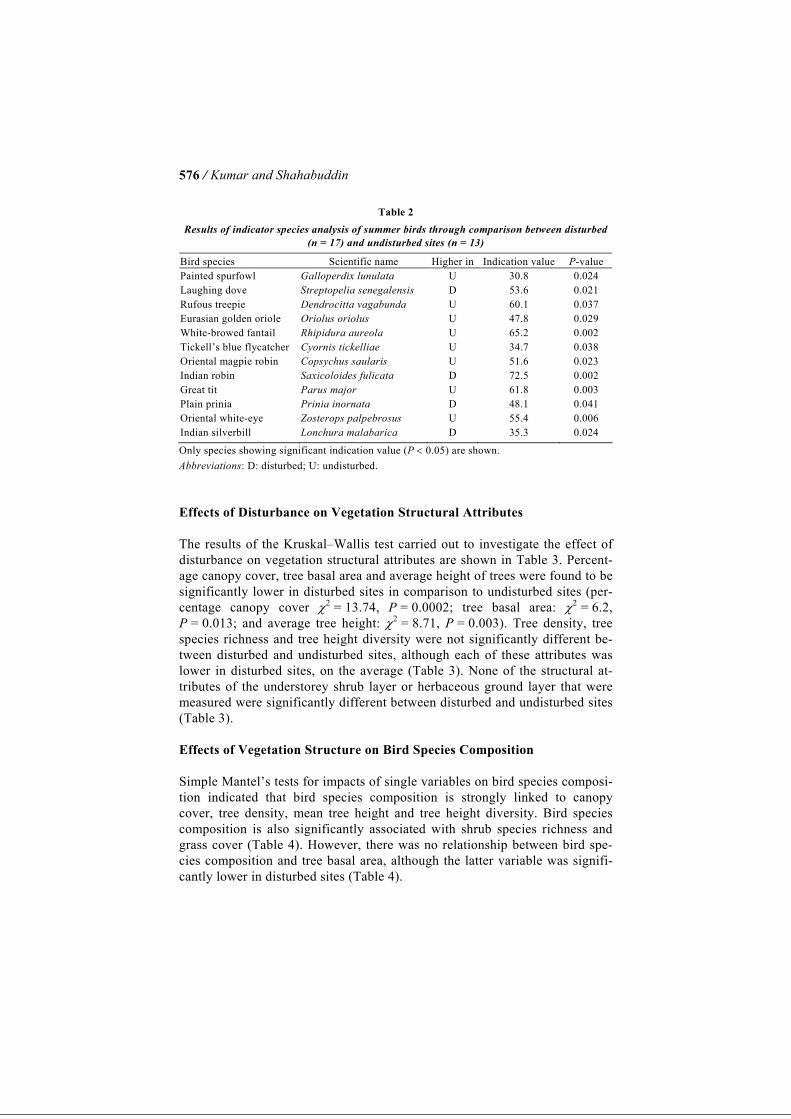
ferent elements of anthropogenic disturbance, such as leaf collection, fire-wood collection and grazing, tend to occur together, which is borne out by ob-servations. Each of the disturbance indicators shows a high degree of correlation with the first PCA axis and appears to contribute in similar meas-ure to it (per cent lopping: Pearson’s correlation coefficient R = −0.98, P = 0.001; average scale of lopping: R = −0.9540, P = 0.001; number of dung piles: R = −0.80, P = 0.001; and number of trails: R = −0.88; P = 0.001). The plotting of the sites along the two PCA axes shows that sites are clus-tered into two distinct groups along Axis 1. Consequently, this classification of sites into two groups (17 sites in disturbed habitats and 13 in undisturbed habitats) was then used for all further analysis in comparisons of disturbed and undisturbed sites (refer to Appendix 1). Effects of Disturbance on Bird Community Attributes and Species Composition Figure 3a–c, respectively, show comparisons of bird abundance, number of species recorded and diversity of birds between disturbed and undisturbed sites in Sariska. The Kruskal–Wallis test indicates that disturbed and undis-turbed sites do not differ significantly in terms of net bird abundance (χ2 = 0.21, P = 0.65) or total number of species recorded (χ2 = 1.24, P = 0.27), although in both cases the disturbed sites show lower mean values than undisturbed sites. However, bird diversity index as measured by Shan-non–Wiener’s Diversity Index was significantly higher in undisturbed sites in comparison to disturbed sites (χ2 = 3.95, P = 0.05). MRPP using the bird species-site matrix indicates that bird species compo-sition differs significantly between disturbed and undisturbed sites in Sariska (P = 0.0005). Simple Mantel’s test also indicated significant association be-tween bird species composition and three of the four disturbance indicators (per cent trees lopped: R = 0.22, P = 0.0009; scale of lopping: R = 0.20, P = 0.002; number of dung clusters: R = 0.15, P = 0.06; and number of trails: R = 0.16, P = 0.01) (Table 4). Of the 75 species recorded during transect counts, forty-eight were abun-dant enough to be analysed having been observed more than five times. Of these forty-eight, twelve species (25%) showed significant selection for either disturbed or undisturbed habitat at a significance level of 5% (Table 2). Four species, i.e. plain prinia, Indian robin, laughing dove and Indian silverbill showed significant indication for disturbed habitats. On the other hand, eight species showed significant selection for undisturbed sites such as great tit, painted spurfowl, Tickell’s blue flycatcher, rufous treepie, oriental magpie robin and Eurasian golden oriole. The remaining species did not show signifi-cant selection for any disturbance regime. Indicator values of the species showing significant selection ranged from 30.8 in painted spurfowl to 72.5 in Indian robin (refer to Table 2).

Consequences of rural biomass extraction for bird communities / 575
Figure 3 Bird community characteristics in disturbed and undisturbed sites with respect to (a) abundance,
(b) species richness and (c) diversity
Note: Differences in bird community characteristics between disturbed and undisturbed sites in
Sariska Tiger Reserve in terms of (a) bird abundance (number of individuals recorded over the three spatial and temporal replicates in each site); (b) cumulative number of species recorded over the three spatial and temporal replicates in each site and (c) diver-sity as measured by Shannon–Wiener’s Diversity Index. Bars show mean values with standard error bars.
/ Kumar and Shahabuddin 576
Table 2 Results of indicator species analysis of summer birds through comparison between disturbed
(n = 17) and undisturbed sites (n = 13)
Bird species Scientific name Higher in Indication value P-value Painted spurfowl Galloperdix lunulata U 30.8 0.024 Laughing dove Streptopelia senegalensis D 53.6 0.021 Rufous treepie Dendrocitta vagabunda U 60.1 0.037 Eurasian golden oriole Oriolus oriolus U 47.8 0.029 White-browed fantail Rhipidura aureola U 65.2 0.002 Tickell’s blue flycatcher Cyornis tickelliae U 34.7 0.038 Oriental magpie robin Copsychus saularis U 51.6 0.023 Indian robin Saxicoloides fulicata D 72.5 0.002 Great tit Parus major U 61.8 0.003 Plain prinia Prinia inornata D 48.1 0.041 Oriental white-eye Zosterops palpebrosus U 55.4 0.006 Indian silverbill Lonchura malabarica D 35.3 0.024
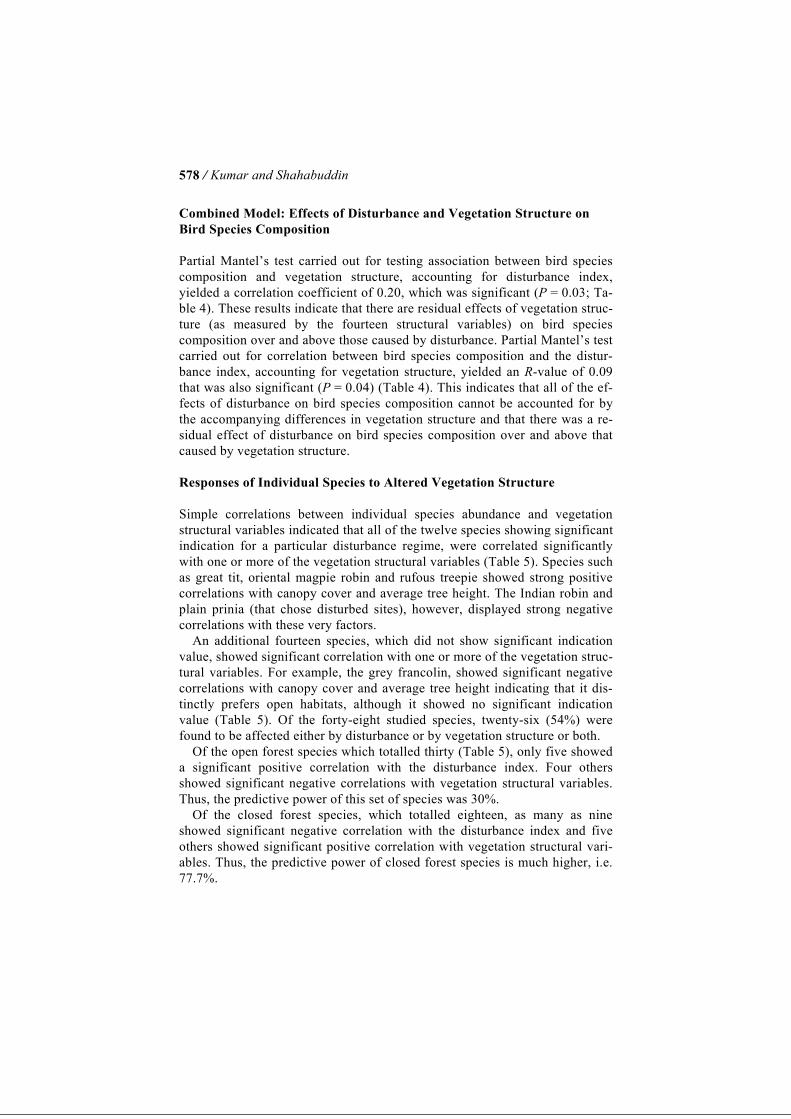
Only species showing significant indication value (P < 0.05) are shown. Abbreviations: D: disturbed; U: undisturbed. Effects of Disturbance on Vegetation Structural Attributes The results of the Kruskal–Wallis test carried out to investigate the effect of disturbance on vegetation structural attributes are shown in Table 3. Percent-age canopy cover, tree basal area and average height of trees were found to be significantly lower in disturbed sites in comparison to undisturbed sites (per-centage canopy cover χ2 = 13.74, P = 0.0002; tree basal area: χ2 = 6.2, P = 0.013; and average tree height: χ2 = 8.71, P = 0.003). Tree density, tree species richness and tree height diversity were not significantly different be-tween disturbed and undisturbed sites, although each of these attributes was lower in disturbed sites, on the average (Table 3). None of the structural at-tributes of the understorey shrub layer or herbaceous ground layer that were measured were significantly different between disturbed and undisturbed sites (Table 3). Effects of Vegetation Structure on Bird Species Composition Simple Mantel’s tests for impacts of single variables on bird species composi-tion indicated that bird species composition is strongly linked to canopy cover, tree density, mean tree height and tree height diversity. Bird species composition is also significantly associated with shrub species richness and grass cover (Table 4). However, there was no relationship between bird spe-cies composition and tree basal area, although the latter variable was signifi-cantly lower in disturbed sites (Table 4).
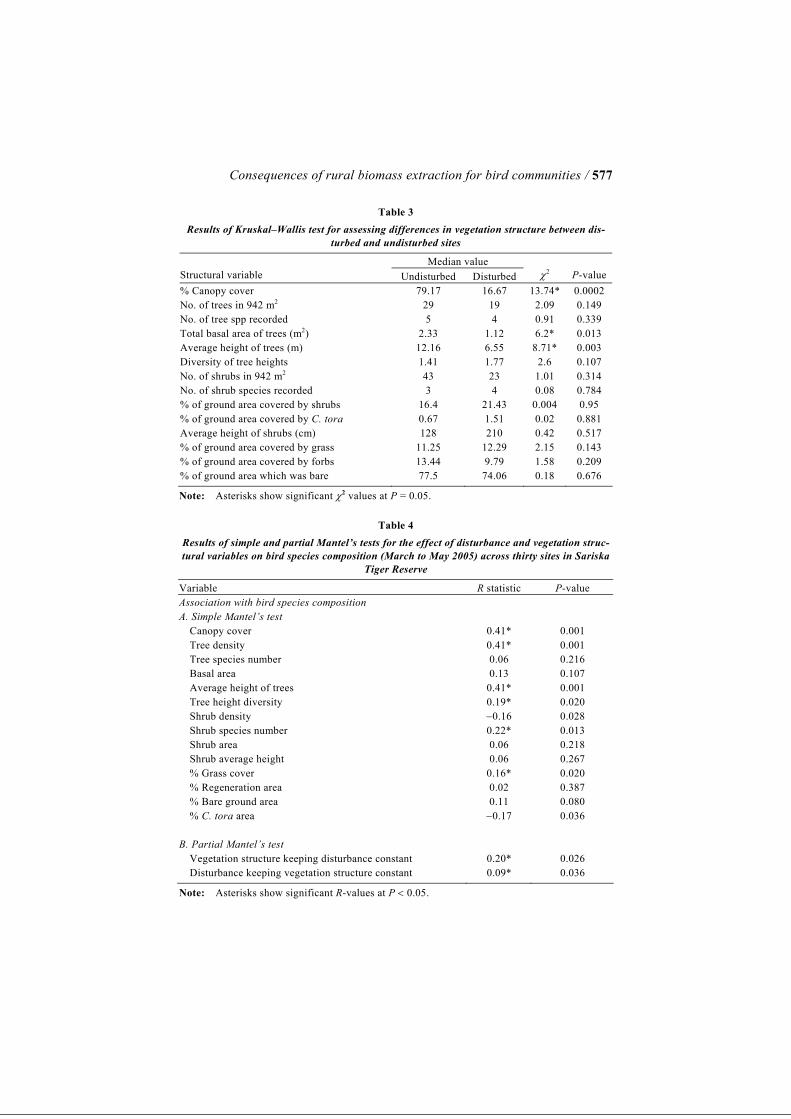
Consequences of rural biomass extraction for bird communities / 577
Table 3 Results of Kruskal–Wallis test for assessing differences in vegetation structure between dis-
turbed and undisturbed sites
Median value Structural variable Undisturbed Disturbed
χ2
P-value
% Canopy cover 79.17 16.67 13.74* 0.0002 No. of trees in 942 m2 29 19 2.09 0.149 No. of tree spp recorded 5 4 0.91 0.339 Total basal area of trees (m2) 2.33 1.12 6.2* 0.013 Average height of trees (m) 12.16 6.55 8.71* 0.003 Diversity of tree heights 1.41 1.77 2.6 0.107 No. of shrubs in 942 m2 43 23 1.01 0.314 No. of shrub species recorded 3 4 0.08 0.784 % of ground area covered by shrubs 16.4 21.43 0.004 0.95 % of ground area covered by C. tora 0.67 1.51 0.02 0.881 Average height of shrubs (cm) 128 210 0.42 0.517 % of ground area covered by grass 11.25 12.29 2.15 0.143 % of ground area covered by forbs 13.44 9.79 1.58 0.209 % of ground area which was bare 77.5 74.06 0.18 0.676
Note: Asterisks show significant χ2 values at P = 0.05.
Table 4 Results of simple and partial Mantel’s tests for the effect of disturbance and vegetation struc-tural variables on bird species composition (March to May 2005) across thirty sites in Sariska
Tiger Reserve
Variable R statistic P-value Association with bird species composition A. Simple Mantel’s test Canopy cover 0.41* 0.001 Tree density 0.41* 0.001 Tree species number 0.06 0.216 Basal area 0.13 0.107 Average height of trees 0.41* 0.001 Tree height diversity 0.19* 0.020 Shrub density −0.16 0.028 Shrub species number 0.22* 0.013 Shrub area 0.06 0.218 Shrub average height 0.06 0.267 % Grass cover 0.16* 0.020 % Regeneration area 0.02 0.387 % Bare ground area 0.11 0.080 % C. tora area −0.17 0.036 B. Partial Mantel’s test Vegetation structure keeping disturbance constant 0.20* 0.026 Disturbance keeping vegetation structure constant 0.09* 0.036
Note: Asterisks show significant R-values at P < 0.05.
/ Kumar and Shahabuddin 578
Combined Model: Effects of Disturbance and Vegetation Structure on Bird Species Composition Partial Mantel’s test carried out for testing association between bird species composition and vegetation structure, accounting for disturbance index, yielded a correlation coefficient of 0.20, which was significant (P = 0.03; Ta-ble 4). These results indicate that there are residual effects of vegetation struc-ture (as measured by the fourteen structural variables) on bird species composition over and above those caused by disturbance. Partial Mantel’s test carried out for correlation between bird species composition and the distur-bance index, accounting for vegetation structure, yielded an R-value of 0.09 that was also significant (P = 0.04) (Table 4). This indicates that all of the ef-fects of disturbance on bird species composition cannot be accounted for by the accompanying differences in vegetation structure and that there was a re-sidual effect of disturbance on bird species composition over and above that caused by vegetation structure. Responses of Individual Species to Altered Vegetation Structure Simple correlations between individual species abundance and vegetation structural variables indicated that all of the twelve species showing significant indication for a particular disturbance regime, were correlated significantly with one or more of the vegetation structural variables (Table 5). Species such as great tit, oriental magpie robin and rufous treepie showed strong positive correlations with canopy cover and average tree height. The Indian robin and plain prinia (that chose disturbed sites), however, displayed strong negative correlations with these very factors. An additional fourteen species, which did not show significant indication value, showed significant correlation with one or more of the vegetation struc-tural variables. For example, the grey francolin, showed significant negative correlations with canopy cover and average tree height indicating that it dis-tinctly prefers open habitats, although it showed no significant indication value (Table 5). Of the forty-eight studied species, twenty-six (54%) were found to be affected either by disturbance or by vegetation structure or both. Of the open forest species which totalled thirty (Table 5), only five showed a significant positive correlation with the disturbance index. Four others showed significant negative correlations with vegetation structural variables. Thus, the predictive power of this set of species was 30%. Of the closed forest species, which totalled eighteen, as many as nine showed significant negative correlation with the disturbance index and five others showed significant positive correlation with vegetation structural vari-ables. Thus, the predictive power of closed forest species is much higher, i.e. 77.7%.

Consequences of rural biomass extraction for bird communities / 579
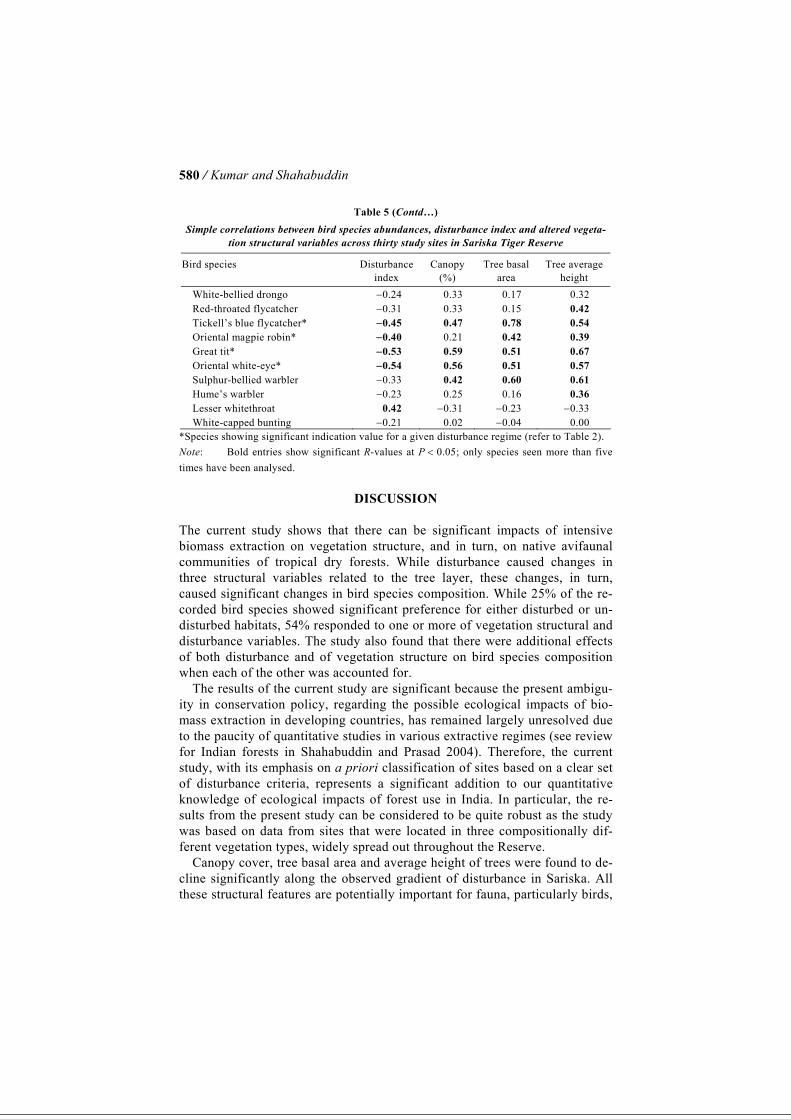
Table 5 Simple correlations between bird species abundances, disturbance index and altered vegeta-
tion structural variables across thirty study sites in Sariska Tiger Reserve
Bird species Disturbance index
Canopy (%)
Tree basal area
Tree average height
Species preferring open forest/cultivation Grey francolin 0.32 −0.49 −0.25 −0.52 Indian peafowl 0.01 −0.20 −0.05 −0.16 White-throated kingfisher −0.02 0.00 0.07 0.33 Green bee-eater 0.15 −0.12 −0.05 0.22 Laughing dove* 0.55 −0.72 −0.28 −0.59 Spotted dove −0.14 −0.16 −0.14 −0.12 Eurasian collared dove 0.29 −0.11 −0.10 −0.01 Common babbler 0.21 −0.34 −0.13 −0.30 Red-wattled lapwing 0.18 −0.10 −0.02 −0.04 Indian cormorant −0.07 0.13 0.07 0.24 Bay-backed shrike 0.01 −0.17 −0.13 −0.16 Long-tailed shrike −0.01 −0.27 −0.14 −0.23 House crow 0.05 0.07 −0.15 0.02 Black drongo −0.36 0.33 −0.13 0.19 Common woodshrike −0.17 0.06 0.06 −0.02 Indian robin* 0.58 −0.67 −0.33 −0.56 Black redstart −0.11 −0.06 0.30 0.09 Brahminy starling 0.37 −0.54 −0.23 −0.36 Common myna 0.22 −0.33 −0.12 −0.01 Red-vented bulbul −0.15 −0.11 0.14 −0.15 Grey-breasted prinia −0.35 0.31 0.23 0.39 Ashy prinia 0.34 −0.41 −0.17 −0.40 Plain prinia* 0.42 −0.50 −0.25 −0.51 Common tailorbird −0.29 0.27 0.20 0.42 Large grey babbler 0.17 −0.03 −0.12 −0.17 Jungle babbler −0.19 0.06 0.12 0.18 Purple sunbird −0.02 −0.15 −0.13 −0.09 Chestnut-shouldered petronia 0.28 −0.31 −0.28 −0.46 Indian silverbill* 0.51 −0.37 −0.15 −0.37 Crested bunting 0.28 −0.36 −0.10 −0.08
Closed forest species Painted spurfowl* −0.41 0.38 0.70 0.44 Black-rumped flameback 0.06 −0.20 −0.12 −0.03 Rose-ringed parakeet −0.26 0.27 0.18 0.48 Yellow-footed green pigeon −0.07 0.17 0.18 0.32 Rufous treepie* −0.41 0.47 0.24 0.39 Eurasian golden oriole* −0.39 0.38 0.30 0.35 Small minivet −0.17 0.19 0.44 0.23 White-browed fantail * −0.54 0.46 0.16 0.53
Contd…
/ Kumar and Shahabuddin 580
Table 5 (Contd…) Simple correlations between bird species abundances, disturbance index and altered vegeta-
tion structural variables across thirty study sites in Sariska Tiger Reserve
Bird species Disturbance index
Canopy (%)
Tree basal area
Tree average height
White-bellied drongo −0.24 0.33 0.17 0.32 Red-throated flycatcher −0.31 0.33 0.15 0.42 Tickell’s blue flycatcher* −0.45 0.47 0.78 0.54 Oriental magpie robin* −0.40 0.21 0.42 0.39 Great tit* −0.53 0.59 0.51 0.67 Oriental white-eye* −0.54 0.56 0.51 0.57 Sulphur-bellied warbler −0.33 0.42 0.60 0.61 Hume’s warbler −0.23 0.25 0.16 0.36 Lesser whitethroat 0.42 −0.31 −0.23 −0.33 White-capped bunting −0.21 0.02 −0.04 0.00
*Species showing significant indication value for a given disturbance regime (refer to Table 2). Note: Bold entries show significant R-values at P < 0.05; only species seen more than five times have been analysed.
DISCUSSION The current study shows that there can be significant impacts of intensive biomass extraction on vegetation structure, and in turn, on native avifaunal communities of tropical dry forests. While disturbance caused changes in three structural variables related to the tree layer, these changes, in turn, caused significant changes in bird species composition. While 25% of the re-corded bird species showed significant preference for either disturbed or un-disturbed habitats, 54% responded to one or more of vegetation structural and disturbance variables. The study also found that there were additional effects of both disturbance and of vegetation structure on bird species composition when each of the other was accounted for. The results of the current study are significant because the present ambigu-ity in conservation policy, regarding the possible ecological impacts of bio-mass extraction in developing countries, has remained largely unresolved due to the paucity of quantitative studies in various extractive regimes (see review for Indian forests in Shahabuddin and Prasad 2004). Therefore, the current study, with its emphasis on a priori classification of sites based on a clear set of disturbance criteria, represents a significant addition to our quantitative knowledge of ecological impacts of forest use in India. In particular, the re-sults from the present study can be considered to be quite robust as the study was based on data from sites that were located in three compositionally dif-ferent vegetation types, widely spread out throughout the Reserve. Canopy cover, tree basal area and average height of trees were found to de-cline significantly along the observed gradient of disturbance in Sariska. All these structural features are potentially important for fauna, particularly birds,

Consequences of rural biomass extraction for bird communities / 581
in any forest ecosystem. Similar trends were seen in tree density, shrub den-sity and tree height diversity, although the differences were not statistically significant (Table 3). Our study agrees with Sekercioglu (2002), who also re-ported reduction of canopy cover with disturbance. Reduction in stem density of woody plants has been recorded as a result of anthropogenic disturbance in other tropical forest areas (Bhuyan et al. 2003; Sagar et al. 2003). However, it is interesting to note that understorey and ground vegetation characteristics do not show significant differences between disturbed and undisturbed sites, be-ing extremely sparse throughout the Reserve. The causes, for overall low rates of regeneration of both grass and of tree species all over the Reserve, are not immediately apparent and could be related to historical use of the area for biomass extraction (see Introduction). For instance, it is possible that the ef-fects of long-term human use in some form are still present across all sites, including those representing extreme ends of the studied disturbance gradient (see also Kumar and Shahabuddin 2005). In the present study, bird species composition was found to respond strongly both to elements of disturbance as well as to disturbance-altered vegetation structure. Bird–habitat relationships similar to those found in the present study have been found in numerous instances across the tropical and temperate zones (Thiollay 1999; Raman and Sukumar 2002; Skowno and Bond 2003). Reduction in canopy cover, reduction in density of trees and re-duction in heights of trees, as seen in the present study, have the potential to affect the nesting and foraging of bird species because this taxon exhibits great selectivity of habitat with respect to forest structure (MacArthur and MacArthur 1961; MacArthur 1964; Cody 1985; Wiens 1989). In particular, reduction in canopy cover, woody debris and numbers of snags produces dra-matic effects on breeding bird communities (Du Plessis 1995; Beese and Bry-ant 1999; Lohr et al. 2002). In Denmark, densities of old trees and extent of size–class variation affected bird community composition (Poulsen 2002). In southern Indian rainforests and plantations, bird community structure was re-lated to woody plant and cane densities (Raman and Sukumar 2002). The adverse effects of changed vegetation structure on insectivorous birds are of special conservation concern. In our study, this group comprised of species such as the great tit, white-browed fantail flycatcher, oriental white-eye and Tickell’s blue flycatcher. Insectivorous birds have been found to be particularly sensitive to forest alteration, fragmentation and degradation in a number of other sites in the tropics (Johns 1991; Canaday 1997; Lohr et al. 2002; Raman and Sukumar 2002; Sekercioglu et al. 2002), although in some cases, opening up of the canopy due to selective logging can actually increase the abundance of some groups of insectivores that forage mainly at forest edges (Owiunji and Plumptre 1998). Insectivorous birds possibly require very specific canopy architecture and microclimatic conditions that are available only in the natural patch mosaic present in forests and that are altered by ac-tivities such as logging, conversion to plantations, clearcutting, shifting culti-
/ Kumar and Shahabuddin 582
vation and intensive biomass extraction. Studies on availability of arthropod prey for insectivorous birds are also required to understand the exact role of changed vegetation structure in altering insect life. Insectivorous–frugivorous birds such as painted spurfowl were also found to be at risk of local extinction in the face of further habitat degradation in Sariska. This is a species that keeps to well-wooded rocky riparian tracts in Sariska. The likely reason for the reduced abundance of such species in ex-tracted sites could be that some of the fruit-bearing trees in Sariska (e.g. F. glomerata and Z. mauritiana) that are dominants in their vegetation type, are also preferred fodder species for livestock and are intensively extracted (per-sonal observation). Removal of tree biomass has been seen to reduce density of fruiting and flowering trees (personal observation) and therefore adversely affects food availability for such species. On the other hand, the yellow-legged green pigeon, although primarily frugivorous, is not affected by forest degradation as it appears to have very large home ranges and thus is able to track fruit resources over very long distances, possibly outside the Reserve as well. While vegetation disturbance adversely affects several bird species, some species show higher densities in extracted areas than in protected sites. This accounts for the finding that while bird species composition changes signifi-cantly due to disturbance, species richness and bird abundance are not signifi-cantly affected. This also implies that disturbance may result in greater landscape-level bird diversity (than if there were no human use at all) due to creation of habitat patches that can support different assemblages of birds. However it is to be noted, that in the context of Sariska, the species that tend to be encouraged by disturbance, such as laughing dove and Indian robin, are those that can survive in the larger human-modified landscapes including sites such as urban parks and gardens (personal observation, see Table 2). On the other hand, the species found to be adversely affected by disturbance, such as the painted spurfowl, white-browed fantail and the Tickell’s blue flycatcher, are at risk of becoming locally extinct due to their preference for well-wooded habitat, a habitat that is already highly restricted in extent in Sariska and the Aravallis (Shahabuddin and Verma 2003). Changes in species composition of trees and shrubs caused by anthropo-genic disturbance, as was seen in scrub forest in Sariska (Kumar and Sha-habuddin 2005), could also play a role in determining faunal bird composition as has been found in rainforest ecosystems (Raman 2002; Raman and Suku-mar 2002). However, this factor could not be explored in the current study due to the fact that there was not enough data on bird species for undertaking a habitat-wise analysis. Indications are that changes in tree composition can affect bird communities to some extent (Kumar and Shahabuddin 2005), but whether the effects of plant composition are mediated by accompanying changes in vegetation structure, remains to be explored.

Consequences of rural biomass extraction for bird communities / 583
In the present study, not all of the variation in bird communities along the disturbance gradient could be ascribed to accompanying changes in vegetation structure, as indicated by Mantel’s tests. Such residual effects could possibly be related to other unquantified factors related to physical disturbance by peo-ple who visit these sites for fodder collection and grazing or other unstudied factors. Similarly, there are probably other unstudied elements of disturbance-altered vegetation structure that bird species are responding to as there were additional residual effects of vegetation structure on bird species composition after disturbance was accounted for (Table 4). The above analysis addition-ally, did not account for possible interaction effects between disturbance and vegetation structure. There are likely to be additional synergistic effects of physical disturbance and vegetation structure that require more study. Knowledge of Sariska’s avifauna suggests that our results on bird commu-nities could be conservative. A number of raptorial bird species such as the crested serpent eagle, brown fish owl and Eurasian sparrowhawk were not re-corded during point counts, due to their naturally low densities, although they have been observed in the Reserve. These species were found to be restricted to tall riparian forest, which, in turn, are limited to riparian tracts along peren-nial springs and are therefore highly vulnerable to local extinction from this area (Shahabuddin and Verma 2003, personal observation). Additionally, thirty-one species among the recorded seventy-five, possibly did not show significant selection for a particular disturbance regime possibly because they were recorded too infrequently (which reduces the chances of their showing significant indication value: McCune and Mefford 1999) or because they pre-ferred one vegetation type over others. For example, the grey francolin oc-curred only in plain scrub forest. This could be the reason why, despite not showing selection for a particular disturbance regime, abundance of this spe-cies, was significantly associated with one or more of the vegetation structural variables (Table 5). However, habitat-wise analysis for species could not be done due to paucity of observations when the data were disaggregated on the basis of vegetation type. We thus believe that long-term observations utilising a greater variety of sampling techniques, greater temporal replication and habitat-wise analysis will reveal many more species that are vulnerable to habitat change. The finding that biomass extraction can cause significant changes in vege-tation structure and faunal composition has important implications for conser-vation planning. The study shows that even subsistence-level biomass extraction may lead to significant changes in vegetation structure that may cause a proportion of vulnerable species to disappear. The results therefore indicate the need for certain inviolate areas where the entire range of faunal diversity can be conserved. However, along with strict nature protection, there is an urgent need to develop alternatives to the biomass-based household and livelihood needs of people living in and around protected areas. For instance, tree plantations for specific biomass needs can be developed on wastelands
/ Kumar and Shahabuddin 584
and village commons, if available. Also, grazing-dependent livelihoods can partially be substituted by alternatives such as nature-based tourism, which do not involve biomass use. It is necessary to formulate long-term sustainable use strategies for the for-est resources that cannot be substituted in the near future. Formulation of such strategies would necessarily involve quantification of extraction levels that can be maintained without compromising biodiversity conservation goals in-side the Reserve, based on well-replicated experimental studies utilising indi-cator species of flora and fauna. The bird species found to be selecting specific disturbance regimes in the current study can be used as effective indi-cator species for such quantitative assessments in Sariska Tiger Reserve.
ACKNOWLEDGEMENTS We are grateful for the financial support received primarily from Wildlife Conservation Society-India Programme and the Centre for Wildlife Studies (Bangalore), partially from Wildlife Protection Society of India (Delhi) and Oriental Bird Club (London) from 2003–2005. We thank Mangu Singh for as-sistance in fieldwork, the Rajasthan Forest Department for permission to work in the Sariska Tiger Reserve, and Tejbir Singh, R.P. Kapoor, Daulat S. Shak-tawat, Arun Sen, Priya Ranjan, S.K. Jain and R.G. Soni of the Department of Forests, Rajasthan for extending their cooperation during this study. We are also grateful to T.R. Shankar Raman and Barry Noon for advice on statistical analysis and to Rajah Jayapal for useful comments on an earlier version of this paper.
REFERENCES Adams, W.M. and D. Hulme. 2001. If community conservation is the answer in Africa, what is
the question? Oryx 35:193–200. Ali, S. 1996. The Book of Indian Birds. Bombay Natural History Society, Bombay and Oxford
University Press, India. Ali, S. and D. Ripley. 1983. A Pictorial Guide to the Birds of the Indian Subcontinent. Bombay
Natural History Society, Bombay and Oxford University Press, India. Bawa, K.S. and R. Seidler. 1998. Natural forest management and conservation of biodiversity in
tropical forests. Conservation Biology 12(1):46–55. Beese, W.J. and A.A. Bryant. 1999. Effect of alternative silvicultural systems on vegetation and
bird communities in coastal montane forests of British Columbia, Canada. Forest Ecology & Management 115:231–242.
Bhuyan, P., M.L. Khan and R.S. Tripathi. 2003. Tree diversity and population structure in undis-turbed and human-impacted stands of tropical wet evergreen forest in Arunachal Pradesh, Eastern Himalayas, India. Biodiversity and Conservation 12:1753–1773.
Bibby, C.J., N.D. Burgess and D.A. Hill. 1992. Bird Census Techniques. Academic Press, Lon-don, UK.
Blankespoor, G.W. 1991. Slash-and-burn shifting agriculture and bird communities in Liberia, West Africa. Biological Conservation 57:41–71.
Consequences of rural biomass extraction for bird communities / 585
Canaday, C. 1997. Loss of insectivorous birds along a gradient of human impact in Amazonia. Biological Conservation 77:63–77.
Champion, H.G. and S.K. Seth. 1968. A Revised Survey of the Forest Types of India. Govern-ment of India.
Cody, M.L. (ed.). 1985. Habitat Selection in Birds. Academic Press, FL, USA. Daniels, R.J.R., M. Gadgil and N.V. Joshi. 1995. Impact of human extraction on tropical humid
forests in the Western Ghats in Uttara Kannada, South India. Journal of Applied Ecology 32:866–874.
Dufrene, M. and P. Legendre. 1997. Species assemblages and indicator species: The need for a flexible asymmetrical approach. Ecological Monographs 67:345–366.
Du Plessis, M.A. 1995. The effects of fuelwood removal on the diversity of some cavity-using birds and mammals in south Africa. Biological Conservation 74:77–82.
Duguay, J.P., P.H. Wood and J.V. Nichols. 2001. Songbird abundance and avian nest survival rates in forests fragmented by different silvicultural treatments. Conservation Biology 15(5):1405–1415.
Government of Rajasthan. 2002. Management Plan, Sariska Tiger Reserve 2002–2012. Alwar, Rajasthan, India.
Grimmett, R., C. Inskipp and T. Inskipp. 1998. Birds of the Indian Subcontinent. Oxford Univer-sity Press, Delhi, India.
Hegde, R. and T. Enters. 2000. Forest products and household economy: A case study from Mudumalai Wildlife Sanctuary, Southern India. Environmental Conservation 27(3):250–259.
Janzen, D.H. 1988. Management of habitat fragments in a tropical dry forest: Growth. Annals of the Missouri Botanical Garden 75(1):105–116.
Johari, R. 2003. Of Sanctions and Sanctuary-Making: The Cultural Politics of Nature in Sariska Tiger Reserve, Rajasthan, India, 1850–2000. Unpublished MS thesis. York University. Can-ada.
Johns, A.D. 1991. Responses of Amazonian rain forest birds to habitat modification. Journal of Tropical Ecology 7:417–437.
Johnsingh, A.J.T., K. Sankar and S. Mukherjee. 1997. Saving prime tiger habitat in Sariska Tiger Reserve. Cat News 27:3.
Jongman, R.H.G., C.J.F. ter Braak and O.F.R. van Tongeren. 1995. Data Analysis in Community and Landscape Ecology. Cambridge University Press, Cambridge, UK.
Kothari, A., P. Pande, S. Singh and D. Variava. 1989. Management of National Parks and Sanc-tuaries in India: A Status Report. Indian Institute of Public Administration, Delhi, India.
Krebs, C.A. 1999. Ecological Methodology. 2nd edn. Addison-Wesley, Longman. Kumar, R. and G. Shahabuddin. 2005. Effects of biomass extraction on vegetation structure, di-
versity and composition of an Indian tropical dry forest. Environmental Conservation 32(3):1–12.
Legendre, P. and M. Fortin. 1989. Spatial pattern and ecological analysis. Vegetation 80:107–138.
Lohr, S.M., S.A. Gauthreaux and J.C. Kilgo. 2002. Importance of coarse woody debris to avian communities in Loblolly pine forests. Conservation Biology 16(3):767–777.
MacArthur, R.H. 1964. Environmental factors affecting bird species diversity. American Natu-ralist 98:387–397.
MacArthur, R.H. and J. MacArthur 1961. On bird species diversity. Ecology 42:594–598. Manly, B.F.J. 1991. Randomization and Monte Carlo Methods in Biology. Chapman & Hall,
London, UK. Martin, T.G. and H.P. Possingham. 2005. Predicting the impact of livestock grazing on birds us-
ing foraging height data. Journal of Applied Ecology 42:400–408. Mazoomdar, J. 2005. No evidence of tigers in Sariska—WWF-India. Indian Express; February
15:1.
/ Kumar and Shahabuddin 586
McCune, B. and J.B. Grace. 2002. Analysis of Ecological Communities. MjM Software Design, OR, USA.
McCune, B. and M.J. Mefford. 1999. Multivariate Analysis of Ecological Data. Vol. 4. MjM Software Design, Glenden Beach, OR, USA.
Murali, K.S., U. Shankar, R. Uma Shaanker, K.N. Ganeshaiah and K.S. Bawa. 1996. Extraction of non-timber forest products in the forests of Biligiri Rangan Hills, India. 2. Impact of NTFP extraction on regeneration, population structure and species composition. Economic Botany 50(3):252–269.
Nabhan, G.P. 1997. Cultures of Habitat, On Nature, Culture and Habitat. p. 338. Counterpoint, Washington DC.
Owiunji, I. and A.J. Plumptre. 1998. Bird communities in logged and unlogged compartments in Budongo forest, Uganda. Forest Ecology & Management 108:115—126.
Parmar, P.J. 1985. A contribution to the flora of Sariska Tiger Reserve, Alwar district, Rajast-han. Bulletin of the Botanical Survey of India 27(1–4):29–40.
Poulsen, B.O. 2002. Avian richness and abundance in temperate Danish forests: Tree variables important to birds and their conservation. Biodiversity and Conservation 11(9):1551–1566.
Raman, T.R.S. 2002. Effects of fragmentation and plantations on tropical rainforest birds in the southern Western Ghats. OBC Bulletin 36:31–32.
Raman, T.R.S. 2003.Assessment of census techniques for interspecific comparisons of tropical rainforest bird densities: A field evaluation in the Western Ghats. Ibis 145:9–21.
Raman, T.R.S. and R. Sukumar. 2002. Responses of tropical rainforest birds to abandoned plan-tation edges and logged forest in the Western Ghats, India. Animal Conservation 5:201–216.
Raman, T.R.S., G.S. Rawat and A.J.T. Johnsingh. 1998. Recovery of tropical rainforest avifauna in relation to vegetation succession following shifting cultivation in Mizoram, north-east In-dia. Journal of Applied Ecology 35:214–231.
Rodgers, W.A., H.S. Panwar and V.B. Mathur. 2000. Wildlife Protected Area Network in India: A Review. Wildlife Institute of India, Dehradun, India.
Sagar, R., A.S. Raghubanshi and J.S. Singh. 2003. Tree species composition, dispersion & diver-sity along a disturbance gradient in a dry tropical forest region of India. Forest Ecology & Management 186:61–71.
Sagar, R. and J.S. Singh. 2004. Local plant species depletion in a tropical dry forest. Environ-mental Conservation 31(1):55–62.
Sanchez-Azofeifa, G.A., M. Kalacska, H Quesada, J.C. Calvo-Alarado, J.M. Nassar and J.P. Rodriguez. 2005. Need for integrated research for a sustainable future in tropical dry forests. Conservation Biology 19(2):285–286.
Schwartzman, S., A. Moreira and D. Nepstad. 2000. Rethinking tropical forest conservation: Per-ils in Parks. Conservation Biology 14(5):1351–1357.
Sekercioglu, C.H. 2002. Effects of forestry practices on vegetation structure and bird community of Kibale National Park, Uganda. Biological Conservation 107:229–240.
Sekercioglu, C.H., P.R. Ehrlich, G.C. Daily, D. Aygen, D. Goehring and R.F. Sandi. 2002. Dis-appearance of insectivorous birds from tropical forest fragments. Proceedings of the Na-tional Academy of Sciences 99(1):263–267.
Shahabuddin, G. and S. Prasad. 2004. Assessing ecological sustainability of non-timber forest produce extraction: The Indian scenario. Conservation and Society 2(2):235–250.
Shahabuddin, G. and A. Verma. 2003. Effects of Forest Resource Extraction on Biodiversity Conservation Values: Towards a Sustainable Forest Management Strategy in Sariska Tiger Reserve, Rajasthan (Phase I). Technical Report. Centre for Wildlife Studies, Bangalore, In-dia and Wildlife Protection Society of India, Delhi, India.
Shankar, U., K.S. Murali, R.U. Shaanker, K.N. Ganeshaiah and K.S. Bawa. 1998. Extraction of non-timber forest products in the forests of Biligiri Rangan Hills, India. 4. Impact on floris-tic diversity and population structure in a thorn scrub forest. Economic Botany 52(3):302—303.

Consequences of rural biomass extraction for bird communities / 587
Shrotiya, M. Undated. Dialogue on Sariska. Tarun Bharat Sangh, Alwar, India. Skowno, A.L. and W.J. Bond. 2003. Bird community composition in an actively managed sa-
vanna reserve, importance of vegetation structure and vegetation composition. Biodiversity and Conservation 12:2279–2294.
Sokal, R.R. and J.F. Rohlf. 1994. Biometry. 2nd edn. W.H. Freeman and Company, NY, USA. Terborgh, J. 1998. Wildlife in Managed Tropical Forests: A Neotropical Perspective. In: Tropi-
cal Forests: Management and Ecology (eds. A.E. Lugo and C. Lowe), pp. 331–342. Springer-Verlag, NY, USA.
Thiollay, J. 1999. Responses of an avian community to rain forest degradation. Biodiversity and Conservation 8(4):513–534.
Tilman, D. and C. Lehman. 2001. Human-caused environmental change: Impacts on plant diver-sity and evolution. Proceedings of the National Academy of Sciences 98(10):5433–5440.
van Schaik, C.P., J. Terborgh and B. Dugelby. 1997. The Silent Crisis: The State of Rain Forest Nature Preserves. In: Last Stand: Protected Areas and the Defense of Tropical Biodiversity (eds. R. Kramer, C. van Schaik and J. Johnson), pp. 64–89. Oxford University Press, NY, USA.
Wiens, J.A. 1989. The Ecology of Bird Communities. Vol. I. Foundations and Patterns. Cam-bridge University Press, Cambridge, UK.
/ Kumar and Shahabuddin 588
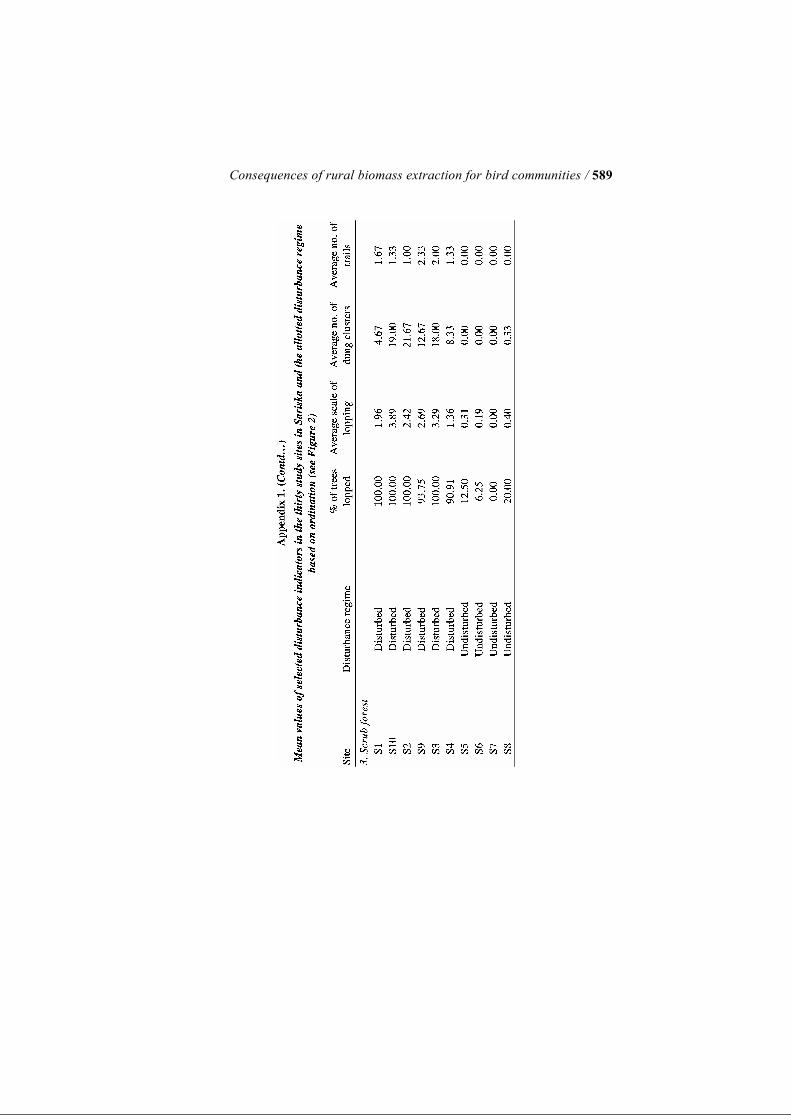
Consequences of rural biomass extraction for bird communities / 589
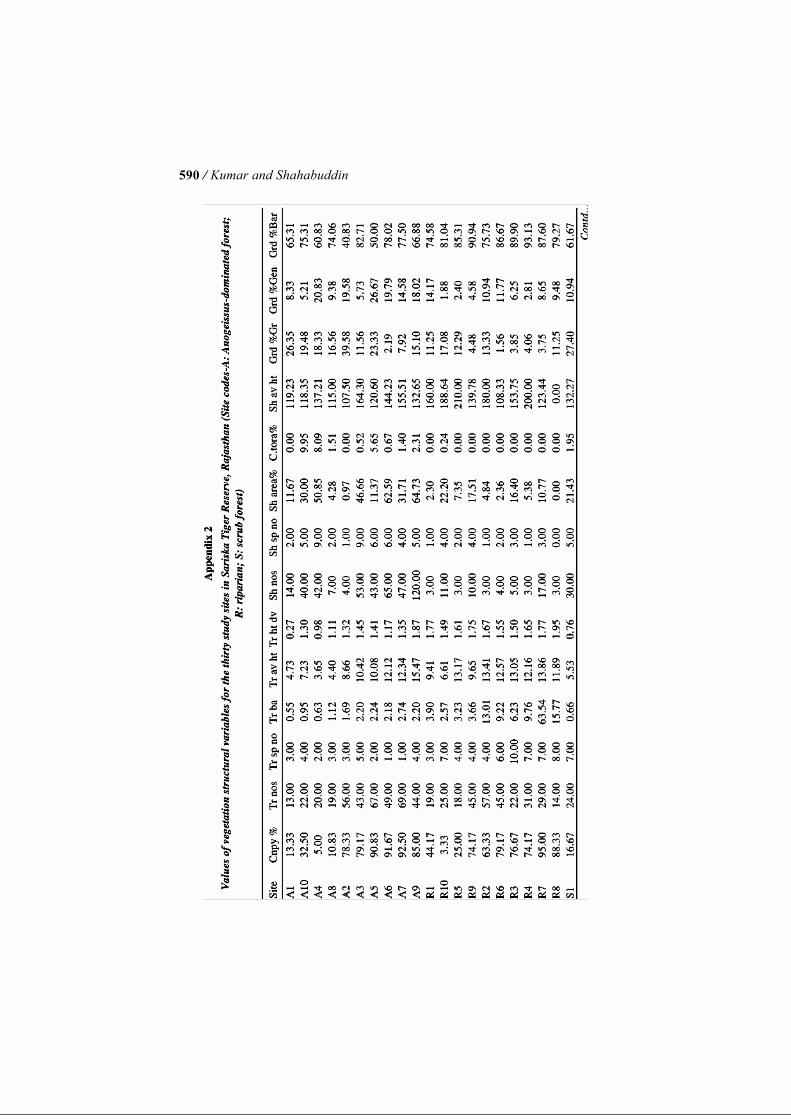
/ Kumar and Shahabuddin 590
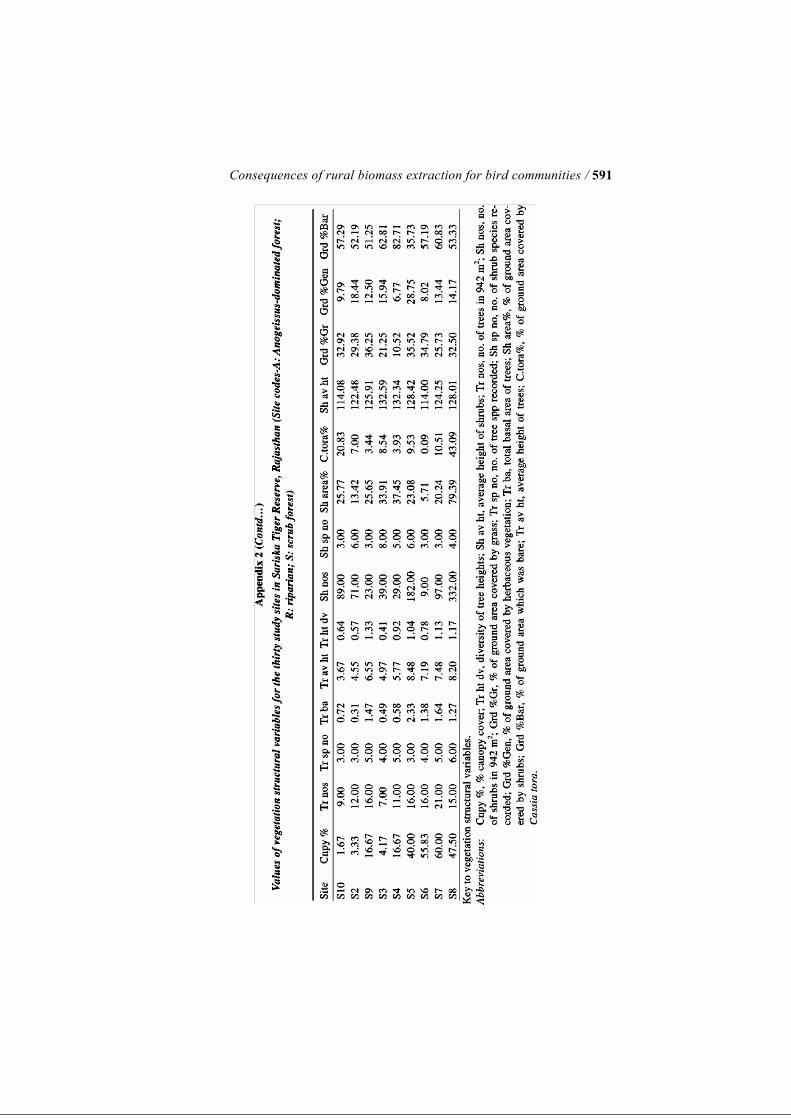
Consequences of rural biomass extraction for bird communities / 591