CONNECTICUT SPECIAL EDUCATION PARENT SURVEY
18
CONNECTICUT SPECIAL EDUCATION PARENT SURVEY DATA BRIEF Simsbury Nexus District 2014-2015 PREPARED BY: GLEN MARTIN ASSOCIATES 41 STATE STREET, SUITE 604-02 ALBANY, NY 12207
-
Upload
khangminh22 -
Category
Documents
-
view
0 -
download
0
Transcript of CONNECTICUT SPECIAL EDUCATION PARENT SURVEY

CONNECTICUT SPECIAL EDUCATION PARENT SURVEY
DATA BRIEF
Simsbury Nexus District
2014-2015
PREPARED BY: GLEN MARTIN ASSOCIATES 41 STATE STREET, SUITE 604-02
ALBANY, NY 12207

~ 1 ~
INTRODUCTION
The Connecticut Special Education Parent Survey is the continuation of an ongoing collaborative effort between the Bureau of Special Education and the Connecticut Parent Work Group to collect information on family satisfaction and parents’ involvement in their child’s special education program.1 The 2014-15 survey was sent to 18,634 parents of children receiving special education services, ages 3 through 21, across 56 school districts.2 A total of 3,965 surveys were returned, representing a response rate of 21.3%. The survey is in its tenth year, with the 2014-15 school year marking the first year of a new three-year survey cohort cycle. The survey continues to serve as the chief instrument for collecting parent involvement data for Indicator 8 of the state’s IDEA Part B State Performance Plan (SPP).3 PURPOSE OF THIS REPORT The purpose of this report is to provide survey results for the Simsbury Nexus District in an easy-to-use format.4 The intent is to highlight potential areas of strength for your district and areas that may need improvement. Your district’s survey results, especially when used in conjunction with other data at your disposal, can provide insightful information for use in decision-making and improvement planning. A few tips for reviewing your survey data include the following:
Use the survey delivery and response statistics to set the context of your data.
Review the “total agreement” by survey item to get a general sense of how well your district is doing in each of the six topic areas of the survey.
Contrast “total agreement” with “high-level agreement” in order to identify survey items where the total percentage may include a sizable lukewarm response (i.e., slightly agree).
Examine parents’ comments for areas of satisfaction, areas of concern, and suggested improvement steps.
Consider how your district’s results compare to the overall statewide results.
TABL E OF CO NTENTS
Section I: Survey Delivery and Response Page 2
Section II: Survey Results Page 3
Section III: Parent Comments Page 6
Appendix A: Simsbury Survey Findings Page 9
A.1: Simsbury Survey Response Table Page 10
A.2: Simsbury Box-and-Whiskers Charts Page 12
Appendix B: Statewide Results Page 14
B.1: Response Rate by District Page 15
B.2: Statewide Survey Response Table Page 16
1 The Parent Work Group is a statewide stakeholder group that examines parent involvement data as an indicator of parent satisfaction for annual reporting to the Office of Special Education Programs. 2 In the majority (n=45) of districts, surveys were sent to all parents of children receiving services. However, in 11 districts, a simple random sample of students was selected. (See Appendix B.1 for more information.) 3 SPP Indicator 8 measures the percent of parents with a child receiving special education services who report that schools facilitated parent involvement as a means of improving services and results for children with disabilities. Survey item 10 is the primary measure for this indicator. 4 The 2014-15 Connecticut Special Education Parent Survey Statewide Report will be available on the Department website in early 2016.

~ 2 ~
SECTION I: SURVEY DELIVERY AND RESPONSE
In August 2015, the 2014-15 Connecticut Special Education Parent Survey was distributed to parents of children with an Individualized Education Program (IEP) or Services Plan. Parents were mailed a survey packet, with some parents also receiving an email about the survey. All materials were available in English and Spanish, and the survey could be completed on paper or online. The survey deadline was September 18, 2015. The following graphics provide survey delivery and response statistics for the Simsbury Nexus District.
DELIVERY METHOD
Mail 612 Mail Non-Deliverable Rate 1.5% (n=9)
Email 84.8% (n=519) Email Non-Deliverable Rate 5.4% (n=28)
RESPONSE RATE
54.3% Online
45.7% Paper
CHILD DEMOGRAPHICS
Survey Respondents (n=175) Surveys Sent (n=612)
Note: The disabilities displayed are those that are 5% or greater in the survey respondent group or the survey sent group.
28.6%
31%
69%
Female
Male
30%
70%
13%
43%
19%
19%
6%
3-5 years
6-12 years
13-14 years
15-17 years
18-21 years
13%
42%
17%
22%
7%
6%
8%
82%
1%
3%
Black or African American
Hispanic/Latino of any Race
White
Two or More Races
Other
9%
8%
78%
1%
4%
13% Free & Reduced Price Lunch 18%
3% English Learner 2%
29%
23%
15%
14%
6%
Specific Learning Disabilities
Autism
Speech or Language Impaired
OHI - ADD/ADHD
Other Health Impairment (OHI)
32%
17%
14%
14%
8%
175 completed

~ 3 ~
SECTION II: SURVEY RESULTS
The 2014-15 survey included 38 items that asked parents to rate on a 6-point scale from “strongly disagree” to “strongly agree” their experiences with their child’s special education program over the past 12 months.5 The following tables include bar charts that illustrate parents’ “high level of agreement” (i.e., strongly agree and moderately agree), as well as a column with the percentage to express “total agreement” (i.e., plus slightly agree). Only the agreement response options are included to allow for a quick visual comparison across survey items; however, all response options for the Simsbury Nexus District are included in Appendix A.1.
HIGH LEVEL OF AGREEMENT TOTAL
AGREEMENT
Satisfaction with My Child’s Program
1. I am satisfied with my child’s overall special education program. [n=174]
87.4%
2. I have the opportunity to talk to my child's teachers on a regular basis to discuss my questions and concerns. [n=173]
92.5%
3. My child is accepted within the school community. [n=172]
90.7%
4. My child’s Individualized Education Program (IEP) is meeting his or her educational needs. [n=175]
86.3%
5. All special education services identified in my child’s IEP have been provided. [n=172]
87.2%
6. Staff is appropriately trained and able to provide my child’s specific program and services. [n=171]
87.1%
7. Special education teachers make accommodations and modifications as indicated on my child's IEP. [n=170]
93.5%
8. General education teachers make accommodations and modifications as indicated on my child's IEP. [n=170]
83.5%
9. General education and special education teachers work together to assure that my child's IEP is being implemented. [n=171]
88.3%
Participation in My Child’s Program 10. In my child's school, administrators and teachers encourage
parent involvement in order to improve services and results for children with disabilities. [n=173]
87.9%
11. At meetings to develop my child’s Individualized Education Program (IEP), I feel encouraged to give input and express my concerns. [n=172]
91.9%
12. I understand what is discussed at meetings to develop my child’s IEP. [n=171]
94.7%
13. My concerns and recommendations are documented in the development of my child's IEP. [n=171]
89.5%
KEY: Strongly Agree Moderately Agree
5 Parents were given the option of selecting “don’t know” on 11 survey items (4-9, 21, 25, 28, 29 and 34). This should be considered when comparing agreement levels across items.
41.4% 78.7%
53.2% 77.5%
55.2% 77.9%
34.3% 73.7%
45.9% 75.6%
48.0% 73.1%
52.9% 82.4%
42.4% 67.1%
45.0% 69.6%
43.9% 69.9%
56.4% 83.1%
64.9% 86.0%
52.0% 78.4%

~ 4 ~
HIGH LEVEL OF AGREEMENT TOTAL
AGREEMENT
Participation in My Child’s Program (Continued)
14. My child's evaluation report is written in terms I understand. [n=167]
94.0%
15. Planning and Placement Team (PPT) meetings for my child have been scheduled at times and places that met my needs. [n=171]
91.2%
16. At my child’s PPT, the school district proposed programs and services to meet my child’s individual needs. [n=173]
86.7%
17. When we implement my child’s IEP, I am encouraged to be an equal partner with my child's teachers and other service providers. [n=169]
85.8%
18. I have received a copy of my child’s IEP within 10 school days after the PPT. [n=170]
94.1%
19. If necessary, a translator was provided at the PPT meetings. [n=90]
86.7%
20. The translation services provided at the PPT meetings were useful and accurate. [n=84]
84.5%
21. The school district proposed the regular classroom for my child as the first placement option. [n=170]
85.3%
My Child’s Participation
22. My child has been sent home from school, but not suspended, due to behavioral difficulties. [n=145]
10.3%
23. My child has the opportunity to participate in school-sponsored activities such as field trips, assemblies and social events (dances, sports events). [n=168]
95.8%
24. My child has the opportunity to participate in extracurricular school activities such as sports or clubs with children without disabilities. [n=165]
87.9%
25. My child’s school provides supports, such as extra staff, that are necessary for my child to participate in extracurricular school activities (for example, clubs and sports). [n=159]
55.3%
Parent Training and Support
26. In the past year, I have attended parent training or information sessions (provided by my district, other districts or agencies) that addressed the needs of parents and of children with disabilities. [n=154]
31.8%
27. I am involved in a support network for parents of students with disabilities available through my school district or other sources. [n=150]
28.0%
28. There are opportunities for parent training or information sessions regarding special education provided by my child’s school district. [n=162]
27.2%
29. A support network for parents of students with disabilities is available to me through my school district or other sources. [n=160]
30.6%
KEY: Strongly Agree Moderately Agree
61.1% 86.8%
64.3% 85.4%
46.8% 72.8%
46.7% 73.4%
74.7% 90.0%
64.4% 76.7%
64.3% 77.4%
67.6% 81.8%
6.2%
83.9% 92.9%
71.5% 81.8%
36.5% 47.2%
24.0%
16.0%
16.7%
21.3%

~ 5 ~
HIGH LEVEL OF AGREEMENT TOTAL
AGREEMENT
My Child’s Skills
30. My child is learning skills that will enable him/her to be as independent as possible. [n=169]
86.4%
31. My child is learning skills that will lead to a high school diploma, further education, or a job. [n=164]
87.2%
Transition Planning
32. I am satisfied with the school district's transition activities that took place when my child left Birth to Three. [n=25]
100.0%
33. I am satisfied with the way secondary transition services were implemented for my child. [n=40]
75.0%
34. When appropriate, outside agencies have been invited to participate in secondary transition planning. [n=38]
50.0%
35. The PPT introduced planning for my child's transition to adulthood. [n=44]
63.6%
36. The school district actively encourages my child to attend and participate in PPT meetings. [n=41]
90.2%
37. The PPT discussed an appropriate course of study at the high school for my child. [n=43]
81.4%
38. The PPT developed individualized goals for my child related to employment/postsecondary education, independent living and community participation, if appropriate. [n=43]
65.1%
Note: Respondents were instructed only to answer item 32 if their child had transitioned from the Birth to Three System to Preschool within the past three years, and only to answer items 33-38 if their child was 15 years of age or older at their last PPT meeting.
Due to limited space on the bar graphs, the data label for “strongly agree” is not included if it is less than 15%.
KEY: Strongly Agree Moderately Agree
47.3% 72.2%
52.4% 77.4%
60.0% 96.0%
30.0% 47.5%
26.3% 34.2%
27.3% 50.0%
63.4% 85.4%
32.6% 65.1%
39.5%
~ 6 ~
SECTION III: PARENT COMMENTS
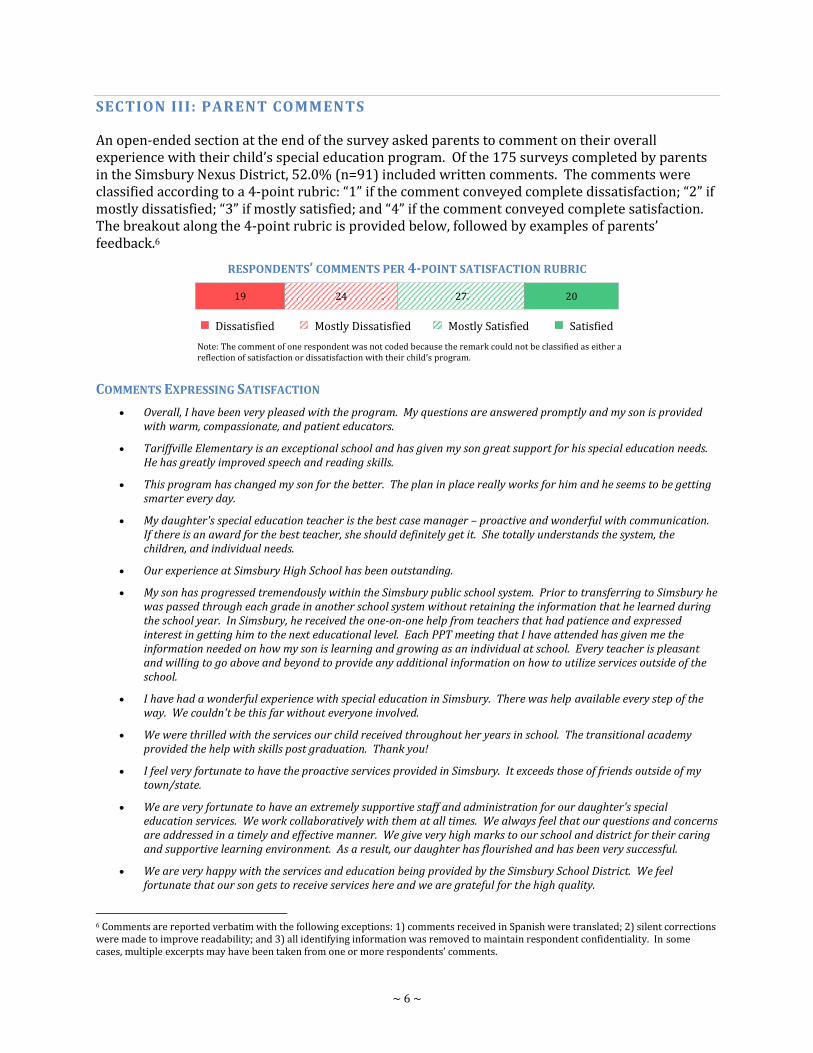
An open-ended section at the end of the survey asked parents to comment on their overall experience with their child’s special education program. Of the 175 surveys completed by parents in the Simsbury Nexus District, 52.0% (n=91) included written comments. The comments were classified according to a 4-point rubric: “1” if the comment conveyed complete dissatisfaction; “2” if mostly dissatisfied; “3” if mostly satisfied; and “4” if the comment conveyed complete satisfaction. The breakout along the 4-point rubric is provided below, followed by examples of parents’ feedback.6
RESPONDENTS’ COMMENTS PER 4-POINT SATISFACTION RUBRIC
Dissatisfied Mostly Dissatisfied Mostly Satisfied Satisfied
Note: The comment of one respondent was not coded because the remark could not be classified as either a reflection of satisfaction or dissatisfaction with their child’s program.
COMMENTS EXPRESSING SATISFACTION
Overall, I have been very pleased with the program. My questions are answered promptly and my son is provided with warm, compassionate, and patient educators.
Tariffville Elementary is an exceptional school and has given my son great support for his special education needs. He has greatly improved speech and reading skills.
This program has changed my son for the better. The plan in place really works for him and he seems to be getting smarter every day.
My daughter's special education teacher is the best case manager – proactive and wonderful with communication. If there is an award for the best teacher, she should definitely get it. She totally understands the system, the children, and individual needs.
Our experience at Simsbury High School has been outstanding.
My son has progressed tremendously within the Simsbury public school system. Prior to transferring to Simsbury he was passed through each grade in another school system without retaining the information that he learned during the school year. In Simsbury, he received the one-on-one help from teachers that had patience and expressed interest in getting him to the next educational level. Each PPT meeting that I have attended has given me the information needed on how my son is learning and growing as an individual at school. Every teacher is pleasant and willing to go above and beyond to provide any additional information on how to utilize services outside of the school.
I have had a wonderful experience with special education in Simsbury. There was help available every step of the way. We couldn't be this far without everyone involved.
We were thrilled with the services our child received throughout her years in school. The transitional academy provided the help with skills post graduation. Thank you!
I feel very fortunate to have the proactive services provided in Simsbury. It exceeds those of friends outside of my town/state.
We are very fortunate to have an extremely supportive staff and administration for our daughter's special education services. We work collaboratively with them at all times. We always feel that our questions and concerns are addressed in a timely and effective manner. We give very high marks to our school and district for their caring and supportive learning environment. As a result, our daughter has flourished and has been very successful.
We are very happy with the services and education being provided by the Simsbury School District. We feel fortunate that our son gets to receive services here and we are grateful for the high quality.
6 Comments are reported verbatim with the following exceptions: 1) comments received in Spanish were translated; 2) silent corrections were made to improve readability; and 3) all identifying information was removed to maintain respondent confidentiality. In some cases, multiple excerpts may have been taken from one or more respondents’ comments.
19 24 27 20

~ 7 ~
Overall, we are pleased with our child's progress and the efforts made on his behalf. While we believe a larger presence of trained paraprofessionals would have improved his experience in the growth of his academic abilities, his social growth and experience has exceeded our expectations. We believe his teachers make the best use of the resources available to them, and have provided important leadership for us as we educate ourselves in the planning and transition process.
The school staff are excellent and strongly support our child. Their recommendations have helped him, and the progress is significant. They have been available if we have any questions or concerns outside of the PPT. It is obvious that they want what is best for our child. When he began to have difficulty behaviorally, they quickly gathered all parties, and we openly discussed all options and recommendations. They provided recommendations for outside help when he needed it (not just one, but several, so we could find the right fit). Our son loves them!
My son is in the Ready Set Go program which is offered for children on the Autism Spectrum. Working with staff who have expertise in my son's challenges and difficulties has been something we have been incredibly grateful for. We know that there are many schools that do not offer this expertise so we do not take this for granted. We feel that there is a "team" mentality between us and the school/special education staff. We know that no situation is perfect and both we and the school will need to compromise at times. It is my hope and prayer that this will continue so that my son will continue to grow as a student and as a person and be surrounded by people who understand, accept and support him.
COMMENTS EXPRESSING DISSATISFACTION
Responsiveness from special education services has been slow. They don't always answer all of the questions posed to them. For the current school year, I did not learn my child's full schedule until the day before school started.
We understand there are time constraints to schedule PPT meetings, however, one hour is not a realistic time frame to discuss results, propose new goals, find solutions for concerns, etc. Especially when meeting for a triennial, even after reviewing test results in advance. All testing results, reports, and progress reports should be sent to parents at least three days previous to the meeting.
Some individuals working with our child are tireless, but many seem to want us to solve problems that are clearly identified in the IEP. We also find that we have to constantly remind the staff to recognize our child's accomplishments, rather than simply trying to discipline away the behavioral challenges. We don't really feel like our child is an equal member of the school community at times. Services are provided but he's not really "part" of the school.
I feel transitional support from home to school are lacking – wish there was a paraprofessional available for transport. I also wish there were more opportunities to network with other parents. I feel rather isolated from his typical class and the same from his special education class.
There needs to be more follow-through from the regular team teachers regarding the accommodations available to our child. We have had to repeatedly remind teachers of the available accommodations after they have either marked down assignments or reprimanded our child for failure to complete something in a timely way or failed a test after notes had not been provided. This lack of awareness results in raised frustration by both our child and the teacher and creates work for his special education coordinator when they have to both hear from me and then have to translate the issue to the teacher.
There have been no discussions about transition goals to adulthood.
When PPTs would take place, more often than not, team members would be missing, and therefore, goals would not be created with a collaborative effort. Often, 24-hours prior written notice was not provided. IEPs were not sent within the allotted 10 days. It was difficult to reach the PPT chair to discuss changes, even after a formal rejection, which needs to be addressed within 7 days.
There is a disconnect with PPTs and real world application. My daughter is always progressing and completing IEP goals and her GPA is stellar where you would think she is ready for a complete general education program. In reality, she is not prepared. Her SAT scores are the reality of her abilities, which are not college material. Where are the other plans, skills, or information that would prepare her for any/all other options? We are stuck.
I am still shocked at how hard we had to advocate for so long – and at how many external expert evaluations we had to obtain in order to get the school to agree to provide services for our daughter.
My initial experience was terrible in getting my daughter the help she needed for her learning disabilities. I had to hire an attorney to fight. Once my daughter was in the correct program she began to excel. Now I feel like the school system wants to transition her out of special services without an adequate plan.

~ 8 ~
In general, the emphasis seems to be on helping my son be like the other kids rather than embracing and welcoming his unique differences. I would prefer to see a greater emphasis on the individual than on conformance.
I feel like my child is pushed forward every year and falls more behind every year in reading and math.
My son is in high school. The transition from middle school to high school is severely lacking. He did not/does not have the tools he needs to be successful even though they are clearly stated in his IEP.
Each year my child has been assigned a different special education teacher, due to job changes etc. My son has not benefited from continuity. In the past years, it has been up to me as a parent to ask the special education teacher to see if there are modifications that can be made in his classes to help him learn/test better. These have all been done when I have noticed that his scores were failing and did not reflect the amount of study effort he was putting in. In essence, once I noticed he was starting to fail, I had to prompt the teachers via the special education teacher to put modifications in place. It just seems that there should be a way to document this from year to year, so it would not be such a surprise or ordeal.
PPTs are painfully uncomfortable. It feels like you can cut the tension in the room with a knife and the school system personnel are often defensive when asked questions. I feel badly for all parents who have to go through this.

~ 9 ~
APPENDIX A SIMSBURY SURVEY FINDINGS
A.1 SURVEY RESPONSE TABLE
A.2 BOX-AND-WHISKER CHARTS

~ 10 ~ Appendix A.1
APPENDIX A.1: SIMSBURY SURVEY RESPONSE TABLE
n DISAGREE AGREE
Don’t Know
TOTALS HIGH LEVEL AGREE
Strongly Moderately Slightly Slightly Moderately Strongly DISAGREE AGREE
1. I am satisfied with my child’s overall special education program. 174 4.0% 6.3% 2.3% 8.6% 37.4% 41.4% ± 12.6% 87.4% 78.7%
2. I have the opportunity to talk to my child's teachers on a regular basis to discuss my questions and concerns.
173 0.6% 2.3% 4.6% 15.0% 24.3% 53.2% ± 7.5% 92.5% 77.5%
3. My child is accepted within the school community. 172 0.6% 1.7% 7.0% 12.8% 22.7% 55.2% ± 9.3% 90.7% 77.9%
4. My child’s Individualized Education Program (IEP) is meeting his or her educational needs.
175 5.1% 4.0% 4.6% 12.6% 39.4% 34.3% 0.0% 13.7% 86.3% 73.7%
5. All special education services identified in my child’s IEP have been provided. 172 1.2% 5.2% 4.7% 11.6% 29.7% 45.9% 1.7% 11.0% 87.2% 75.6%
6. Staff is appropriately trained and able to provide my child’s specific program and services.
171 2.3% 4.1% 2.9% 14.0% 25.1% 48.0% 3.5% 9.4% 87.1% 73.1%
7. Special education teachers make accommodations and modifications as indicated on my child's IEP.
170 1.8% 0.6% 0.0% 11.2% 29.4% 52.9% 4.1% 2.4% 93.5% 82.4%
8. General education teachers make accommodations and modifications as indicated on my child's IEP.
170 3.5% 2.9% 4.1% 16.5% 24.7% 42.4% 5.9% 10.6% 83.5% 67.1%
9. General education and special education teachers work together to assure that my child's IEP is being implemented.
171 2.9% 2.9% 2.3% 18.7% 24.6% 45.0% 3.5% 8.2% 88.3% 69.6%
10. In my child's school, administrators and teachers encourage parent involvement in order to improve services and results for children with disabilities.
173 2.9% 1.7% 7.5% 17.9% 26.0% 43.9% ± 12.1% 87.9% 69.9%
11. At meetings to develop my child’s Individualized Education Program (IEP), I feel encouraged to give input and express my concerns.
172 2.3% 1.7% 4.1% 8.7% 26.7% 56.4% ± 8.1% 91.9% 83.1%
12. I understand what is discussed at meetings to develop my child’s IEP. 171 1.2% 2.9% 1.2% 8.8% 21.1% 64.9% ± 5.3% 94.7% 86.0%
13. My concerns and recommendations are documented in the development of my child's IEP.
171 2.9% 1.2% 6.4% 11.1% 26.3% 52.0% ± 10.5% 89.5% 78.4%
14. My child's evaluation report is written in terms I understand. 167 1.2% 1.2% 3.6% 7.2% 25.7% 61.1% ± 6.0% 94.0% 86.8%
15. Planning and Placement Team (PPT) meetings for my child have been scheduled at times and places that met my needs.
171 2.3% 4.7% 1.8% 5.8% 21.1% 64.3% ± 8.8% 91.2% 85.4%
16. At my child’s PPT, the school district proposed programs and services to meet my child’s individual needs.
173 1.7% 5.2% 6.4% 13.9% 26.0% 46.8% ± 13.3% 86.7% 72.8%
17. When we implement my child’s IEP, I am encouraged to be an equal partner with my child's teachers and other service providers.
169 3.0% 3.6% 7.7% 12.4% 26.6% 46.7% ± 14.2% 85.8% 73.4%
18. I have received a copy of my child’s IEP within 10 school days after the PPT. 170 2.4% 2.4% 1.2% 4.1% 15.3% 74.7% ± 5.9% 94.1% 90.0%
19. If necessary, a translator was provided at the PPT meetings. 90 12.2% 1.1% 0.0% 10.0% 12.2% 64.4% ± 13.3% 86.7% 76.7%
20. The translation services provided at the PPT meetings were useful and accurate.
84 14.3% 1.2% 0.0% 7.1% 13.1% 64.3% ± 15.5% 84.5% 77.4%
21. The school district proposed the regular classroom for my child as the first placement option.
170 4.7% 2.4% 1.2% 3.5% 14.1% 67.6% 6.5% 8.2% 85.3% 81.8%
Table is continued on the next page.

~ 11 ~ Appendix A.1
APPENDIX A.1: SIMSBURY SURVEY RESPONSE TABLE (CO NTINUED)
n DISAGREE AGREE
Don’t Know
TOTALS HIGH LEVEL AGREE
Strongly Moderately Slightly Slightly Moderately Strongly DISAGREE AGREE
22. My child has been sent home from school, but not suspended, due to behavioral difficulties.
145 84.1% 4.8% 0.7% 4.1% 0.7% 5.5% ± 89.7% 10.3% 6.2%
23. My child has the opportunity to participate in school-sponsored activities such as field trips, assemblies and social events (dances, sports events).
168 1.8% 1.8% 0.6% 3.0% 8.9% 83.9% ± 4.2% 95.8% 92.9%
24. My child has the opportunity to participate in extracurricular school activities such as sports or clubs with children without disabilities.
165 6.1% 2.4% 3.6% 6.1% 10.3% 71.5% ± 12.1% 87.9% 81.8%
25. My child’s school provides supports, such as extra staff, that are necessary for my child to participate in extracurricular school activities (for example, clubs and sports).
159 10.7% 3.8% 3.8% 8.2% 10.7% 36.5% 26.4% 18.2% 55.3% 47.2%
26. In the past year, I have attended parent training or information sessions (provided by my district, other districts, or agencies) that addressed the needs of parents and of children with disabilities.
154 51.9% 7.8% 8.4% 7.8% 12.3% 11.7% ± 68.2% 31.8% 24.0%
27. I am involved in a support network for parents of students with disabilities available through my school district or other sources.
150 56.7% 6.7% 8.7% 12.0% 7.3% 8.7% ± 72.0% 28.0% 16.0%
28. There are opportunities for parent training or information sessions regarding special education provided by my child’s school district.
162 20.4% 6.2% 9.9% 10.5% 7.4% 9.3% 36.4% 36.4% 27.2% 16.7%
29. A support network for parents of students with disabilities is available to me through my school district or other sources.
160 13.8% 4.4% 10.0% 9.4% 9.4% 11.9% 41.3% 28.1% 30.6% 21.3%
30. My child is learning skills that will enable him/her to be as independent as possible.
169 4.7% 4.7% 4.1% 14.2% 24.9% 47.3% ± 13.6% 86.4% 72.2%
31. My child is learning skills that will lead to a high school diploma, further education, or a job.
164 5.5% 4.9% 2.4% 9.8% 25.0% 52.4% ± 12.8% 87.2% 77.4%
Only complete the following question if your child has transitioned from the early intervention Birth to Three System to Preschool in the past 3 years.
32. I am satisfied with the school district's transition activities that took place when my child left Birth to Three.
25 0.0% 0.0% 0.0% 4.0% 36.0% 60.0% ± 0.0% 100.0% 96.0%
Only complete the following questions if your child was 15 years of age or older at his/her last PPT meeting.
33. I am satisfied with the way secondary transition services were implemented for my child.
40 10.0% 5.0% 10.0% 27.5% 17.5% 30.0% ± 25.0% 75.0% 47.5%
34. When appropriate, outside agencies have been invited to participate in secondary transition planning.
38 7.9% 5.3% 10.5% 15.8% 7.9% 26.3% 26.3% 23.7% 50.0% 34.2%
35. The PPT introduced planning for my child's transition to adulthood. 44 13.6% 9.1% 13.6% 13.6% 22.7% 27.3% ± 36.4% 63.6% 50.0%
36. The school district actively encourages my child to attend and participate in PPT meetings.
41 9.8% 0.0% 0.0% 4.9% 22.0% 63.4% ± 9.8% 90.2% 85.4%
37. The PPT discussed an appropriate course of study at the high school for my child.
43 9.3% 4.7% 4.7% 16.3% 32.6% 32.6% ± 18.6% 81.4% 65.1%
38. The PPT developed individualized goals for my child related to employment/postsecondary education, independent living and community participation, if appropriate.
43 20.9% 0.0% 14.0% 25.6% 27.9% 11.6% ± 34.9% 65.1% 39.5%
Note: High level agree = “moderately agree” + “strongly agree.” ± Not a response option for this survey item.

~ 12 ~ Appendix A.2
APPENDIX A.2: SIMSBURY BOX-AND-WHISKER CHARTS
The following box-and-whisker charts provide a visual snapshot (by survey item) of your district’s mean score relative to the mean score of all other districts participating in the survey.7 The mean district score represents the average parent response scaled from 1=“strongly disagree” to 6=“strongly agree.”8 An illustration of how to interpret your box-and-whisker charts is provided in the following diagram. A box for each survey item contains the middle 50% of districts and the median (middle) district score is represented by a black line within the box.9 The “whiskers” on the box represent the minimum and maximum mean scores across all districts and your individual district is represented by a round dot ( ). Thus, if your mean district score was inside the box, it would be considered an average rating; if your mean district score was in the lower “whisker,” it would be considered a below average rating; and if your mean district score was in the upper “whisker,” it would be considered an above average rating. Mean district scores were not calculated when five or fewer respondents in the district answered an item. If this was true of your district, a round dot ( ) will be missing for those items.10
How to Interpret Your Box-and-Whisker Chart
Contains the middle 50% of mean district scores on Question 1.
Represents the mean score for your district on Question 1.
Result: The mean score for your district is below the mean score of the “middle” scoring district but is within the middle 50% of all mean district scores for this question.
Note: The mean district score represents the average response scaled from 1=“strongly disagree” to 6=“strongly agree.”
7 Survey responses from 11 districts were excluded due to the CSDE standard (n=20) for confidential reporting of district-level data. 8 The response option of “don’t know” was not included in the calculation of the mean score, as there is no intuitive ordering for this response. 9 Survey item 22 is negatively keyed (i.e., strongly agree is equivalent to a high level of dissatisfaction); therefore, this item was excluded from the analysis to maintain a consistent interpretation of mean scores. 10 A substantial number of districts had five or fewer respondents on the transition planning items. As a result, 15 districts were excluded from calculations for survey item 32 and seven districts were excluded from calculations for survey items 33-38.
1
2
3
4
5
6
Q1
Mea
n D
istr
ict
Sco
re
Survey Item
Mean score of middle scoring district
Mean score of highest scoring district
Mean score of lowest scoring district

~ 13 ~ Appendix A.2
APPENDIX A.2: SIMSBURY BOX-AND-WHISKER CHARTS (CO NTINUED)
SATISFACTION WITH MY CHILD’S PROGRAM
PARTICIPATION IN DEVELOPING AND IMPLEMENTING MY CHILD’S PROGRAM
MY CHILD’S PARTICIPATION PARENT TRAINING AND SUPPORT
MY CHILD’S SKILLS TRANSITION PLANNING
1
2
3
4
5
6
Q1 Q2 Q3 Q4 Q5 Q6 Q7 Q8 Q9
Mea
n D
istr
ict
Sco
re
1
2
3
4
5
6
Q10 Q11 Q12 Q13 Q14 Q15 Q16 Q17 Q18 Q19 Q20 Q21
Mea
n D
istr
ict
Sco
re
1
2
3
4
5
6
Q23 Q24 Q25
Mea
n D
istr
ict
Sco
re
Q26 Q27 Q28 Q29
1
2
3
4
5
6
Q30 Q31
Mea
n D
istr
ict
Sco
re
Q32 Q33 Q34 Q35 Q36 Q37 Q38

~ 14 ~
APPENDIX B STATEWIDE RESULTS
B.1 RESPONSE RATE BY DISTRICT
B.2 STATEWIDE SURVEY RESPONSE TABLE

~ 15 ~ Appendix B.1
APPENDIX B.1: RESPONSE RATE BY DIS TRICT
Nexus District Surveys
Sent Surveys
Received Response
Rate
Nexus District
Surveys Sent
Surveys Received
Response Rate
Eastford 27 16 59.3% Region 17 340 80 23.5%
Rocky Hill 272 103 37.9% East Lyme 366 85 23.2%
Region 15 538 203 37.7% Bethel 338 78 23.1%
Region 13 286 106 37.1% East Windsor 231 48 20.8%
Marlborough 56 19 33.9% Region 7 116 23 19.8%
New Hartford 59 20 33.9% Madison 384 74 19.3%
Sherman 74 24 32.4% Andover 21 4 19.0%
Litchfield 123 39 31.7% Naugatuck* 530 96 18.1%
New Canaan 417 127 30.5% Stamford* 1,044 189 18.1%
Region 8 222 67 30.2% Windsor 633 113 17.9%
Southington* 627 189 30.1% Preston 113 18 15.9%
Sterling 80 24 30.0% Plymouth 253 40 15.8%
Newtown 471 140 29.7% Meriden* 950 143 15.1%
Barkhamsted 45 13 28.9% East Hampton 178 26 14.6%
Simsbury 612 175 28.6% Norfolk 21 3 14.3%
Bolton 95 27 28.4% Montville 336 46 13.7%
West Hartford* 821 231 28.1% Cromwell 242 33 13.6%
Region 14 180 50 27.8% Enfield* 613 79 12.9%
Hebron 126 34 27.0% West Haven* 736 95 12.9%
Bozrah 38 10 26.3% Putnam 196 25 12.8%
East Haddam 179 47 26.3% Colebrook 24 3 12.5%
Wallingford* 568 146 25.7% Plainfield 308 37 12.0%
Glastonbury* 508 130 25.6% Norwich* 694 78 11.2%
New Fairfield 261 66 25.3% Voluntown 65 7 10.8%
Region 16 340 86 25.3% Hartford* 1,481 152 10.3%
Granby 218 55 25.2% USD 1 184 18 9.8%
Region 18 184 46 25.0% USD 2 85 2 2.4%
Thomaston 157 39 24.8% Total 18,634 3,965 21.3%
Wethersfield 568 138 24.3%
Note: Districts are sorted in descending order based on their response rate. A (*) indicates that in this district, a simple random sample of parents of children with an IEP or Services Plan were selected to receive the survey. A confidence level of 95% and a margin of error of 2% were used to determine the sample size.

~ 16 ~ Appendix B.2
APPENDIX B.2: STATEWIDE SURVEY RESPONSE TABLE
n DISAGREE AGREE
Don’t Know
TOTALS HIGH LEVEL AGREE
Strongly Moderately Slightly Slightly Moderately Strongly DISAGREE AGREE
1. I am satisfied with my child’s overall special education program. 3,928 5.8% 3.6% 3.1% 9.3% 32.6% 45.6% ± 12.5% 87.5% 78.2%
2. I have the opportunity to talk to my child's teachers on a regular basis to discuss my questions and concerns. 3,921 2.2% 1.9% 2.7% 8.9% 24.6% 59.8% ± 6.7% 93.3% 84.4%
3. My child is accepted within the school community. 3,908 2.5% 2.5% 3.3% 8.0% 23.8% 60.0% ± 8.3% 91.7% 83.8%
4. My child’s Individualized Education Program (IEP) is meeting his or her educational needs.
3,948 5.9% 4.0% 4.1% 10.4% 30.3% 44.8% 0.6% 13.9% 85.5% 75.1%
5. All special education services identified in my child’s IEP have been provided. 3,904 4.1% 3.4% 3.6% 8.0% 26.2% 53.2% 1.5% 11.1% 87.4% 79.4%
6. Staff is appropriately trained and able to provide my child’s specific program and services. 3,902 4.9% 3.6% 3.6% 8.6% 25.1% 52.1% 2.1% 12.1% 85.8% 77.2%
7. Special education teachers make accommodations and modifications as indicated on my child's IEP. 3,895 2.5% 2.4% 2.6% 8.1% 23.3% 58.5% 2.5% 7.6% 89.9% 81.8%
8. General education teachers make accommodations and modifications as indicated on my child's IEP. 3,865 4.0% 3.3% 4.2% 11.8% 24.6% 46.8% 5.2% 11.6% 83.2% 71.4%
9. General education and special education teachers work together to assure that my child's IEP is being implemented. 3,864 3.6% 3.2% 3.8% 10.9% 23.5% 50.1% 4.9% 10.6% 84.5% 73.6%
10. In my child's school, administrators and teachers encourage parent involvement in order to improve services and results for children with disabilities.
3,940 4.5% 2.9% 4.5% 13.3% 23.5% 51.3% ± 11.9% 88.1% 74.8%
11. At meetings to develop my child’s Individualized Education Program (IEP), I feel encouraged to give input and express my concerns. 3,920 3.1% 2.7% 2.8% 7.4% 19.3% 64.8% ± 8.5% 91.5% 84.1%
12. I understand what is discussed at meetings to develop my child’s IEP. 3,914 1.3% 1.1% 2.3% 5.7% 22.8% 66.8% ± 4.6% 95.4% 89.6%
13. My concerns and recommendations are documented in the development of my child's IEP. 3,892 3.7% 2.7% 3.6% 8.5% 24.0% 57.5% ± 10.0% 90.0% 81.5%
14. My child's evaluation report is written in terms I understand. 3,892 2.2% 2.4% 3.3% 9.6% 25.8% 56.7% ± 7.9% 92.1% 82.5%
15. Planning and Placement Team (PPT) meetings for my child have been scheduled at times and places that met my needs. 3,913 2.4% 2.0% 3.3% 6.6% 20.8% 64.9% ± 7.8% 92.2% 85.7%
16. At my child’s PPT, the school district proposed programs and services to meet my child’s individual needs.
3,935 4.3% 4.1% 4.3% 11.4% 25.8% 50.2% ± 12.6% 87.4% 76.0%
17. When we implement my child’s IEP, I am encouraged to be an equal partner with my child's teachers and other service providers.
3,901 3.5% 3.0% 4.6% 10.9% 23.4% 54.6% ± 11.2% 88.8% 77.9%
18. I have received a copy of my child’s IEP within 10 school days after the PPT. 3,897 2.3% 1.5% 1.8% 4.1% 14.0% 76.3% ± 5.6% 94.4% 90.3%
19. If necessary, a translator was provided at the PPT meetings. 2,339 10.2% 0.8% 2.0% 7.8% 12.6% 66.6% ± 13.0% 87.0% 79.2%
20. The translation services provided at the PPT meetings were useful and accurate. 2,192 10.8% 0.8% 2.3% 8.9% 14.6% 62.6% ± 13.8% 86.2% 77.2%
21. The school district proposed the regular classroom for my child as the first placement option.
3,830 5.6% 2.0% 2.0% 4.3% 15.0% 63.1% 8.1% 9.5% 82.3% 78.1%
Table is continued on the next page.

~ 17 ~ Appendix B.2
APPENDIX B.2: STATEWIDE SURVEY RESPONSE TABLE (CO NTINUED)
n DISAGREE AGREE
Don’t Know
TOTALS HIGH LEVEL AGREE
Strongly Moderately Slightly Slightly Moderately Strongly DISAGREE AGREE
22. My child has been sent home from school, but not suspended, due to behavioral difficulties.
3,312 75.2% 5.0% 1.8% 3.2% 4.5% 10.3% ± 81.9% 18.1% 14.9%
23. My child has the opportunity to participate in school-sponsored activities such as field trips, assemblies and social events (dances, sports events).
3,882 2.4% 1.1% 1.2% 3.5% 10.3% 81.5% ± 4.7% 95.3% 91.8%
24. My child has the opportunity to participate in extracurricular school activities such as sports or clubs with children without disabilities.
3,780 6.0% 1.7% 2.7% 5.0% 11.0% 73.6% ± 10.4% 89.6% 84.6%
25. My child’s school provides supports, such as extra staff, that are necessary for my child to participate in extracurricular school activities (for example, clubs and sports).
3,609 9.5% 2.5% 3.5% 6.8% 12.6% 40.1% 25.0% 15.5% 59.5% 52.7%
26. In the past year, I have attended parent training or information sessions (provided by my district, other districts, or agencies) that addressed the needs of parents and of children with disabilities.
3,502 46.1% 6.9% 7.3% 9.4% 10.3% 20.1% ± 60.3% 39.7% 30.3%
27. I am involved in a support network for parents of students with disabilities available through my school district or other sources.
3,421 52.6% 7.3% 7.9% 9.2% 8.7% 14.2% ± 67.8% 32.2% 23.0%
28. There are opportunities for parent training or information sessions regarding special education provided by my child’s school district.
3,753 17.6% 4.6% 5.8% 9.5% 11.9% 18.4% 32.2% 28.0% 39.8% 30.3%
29. A support network for parents of students with disabilities is available to me through my school district or other sources.
3,700 14.7% 4.4% 5.2% 8.7% 10.5% 20.2% 36.2% 24.4% 39.4% 30.7%
30. My child is learning skills that will enable him/her to be as independent as possible.
3,834 4.8% 4.2% 4.4% 10.4% 25.2% 51.0% ± 13.4% 86.6% 76.2%
31. My child is learning skills that will lead to a high school diploma, further education, or a job.
3,735 5.7% 3.2% 4.0% 10.7% 22.5% 53.8% ± 12.9% 87.1% 76.4%
Only complete the following question if your child has transitioned from the early intervention Birth to Three System to Preschool in the past 3 years.
32. I am satisfied with the school district's transition activities that took place when my child left Birth to Three.
543 8.3% 1.8% 2.4% 6.8% 15.3% 65.4% ± 12.5% 87.5% 80.7%
Only complete the following questions if your child was 15 years of age or older at his/her last PPT meeting.
33. I am satisfied with the way secondary transition services were implemented for my child.
917 10.3% 5.3% 6.4% 12.0% 26.8% 39.1% ± 22.0% 78.0% 66.0%
34. When appropriate, outside agencies have been invited to participate in secondary transition planning.
848 13.0% 4.1% 5.5% 9.3% 13.1% 28.1% 26.9% 22.6% 50.5% 41.2%
35. The PPT introduced planning for my child's transition to adulthood. 893 13.5% 6.6% 7.1% 11.8% 25.3% 35.7% ± 27.2% 72.8% 61.0%
36. The school district actively encourages my child to attend and participate in PPT meetings.
911 5.9% 1.4% 2.6% 7.5% 18.4% 64.1% ± 10.0% 90.0% 82.5%
37. The PPT discussed an appropriate course of study at the high school for my child.
907 7.8% 4.3% 4.6% 9.7% 25.0% 48.5% ± 16.8% 83.2% 73.5%
38. The PPT developed individualized goals for my child related to employment/postsecondary education, independent living and community participation, if appropriate.
887 15.2% 5.2% 6.1% 14.1% 23.3% 36.1% ± 26.5% 73.5% 59.4%
Note: High level agree = “moderately agree” + “strongly agree.” ± Not a response option for this survey item.