
CONJONCTURE IN FRANCE 2013
12
CONJONCTURE IN FRANCE June 2013 © Insee 2013 Institut national de la statistique et des études économiques Chief manager : Jean-Luc Tavernier Head Office : 18 boulevard Adolphe Pinard - 75 675 PARIS Cedex 14 Phone : 01.41.17.50.50 / Fax : 01.41.17.66.66 Website : http://www.insee.fr
-
Upload
independent -
Category
Documents
-
view
2 -
download
0
Transcript of CONJONCTURE IN FRANCE 2013

CONJONCTURE
IN FRANCE
June 2013© Insee 2013
Institut national de la statistique et des études économiquesChief manager : Jean-Luc TavernierHead Office : 18 boulevard Adolphe Pinard - 75 675 PARIS Cedex 14Phone : 01.41.17.50.50 / Fax : 01.41.17.66.66Website : http://www.insee.fr

! Editorial directorJean-Luc Tavernier
! Chief editorsCédric AudenisJean-François OuvrardVincent Alhenc-GelasHélène Soual
! ContributorsBrou AdjéCyprien BechlerJean-Baptiste BernardGrégoire BoreyJocelyn BoussardGuillaume ChanteloupGuillaume CléaudVéronique CordeyJulie DjiriguianJustine DurandJean-François EudelineNicolas JégouNoémie JessClovis KerdrainNicolas LagardeMatthieu LequienAllaoui MirghaneAlexis MontautÉlodie PereiraAurélien PoissonnierBruno QuilleNathan RemilaSophie RenaudCatherine RenneMarie ReySébastien RiouDorian RoucherMarie SalaGabriel SklenardFrédéric TalletAnna TestasSophie VillaumeAdrien Zakhartchouk
! Editorial and pagesettig secretariatCatherine Fresson-MartinezMoussa BlaibelJacqueline CourbetDenise Maury-Duprey
! SecretariatNathalie Champion
! TranslationHancock HuttonISSN 1152-9776
Printed from supplied documents byJOUVE - PARIS
Completed on June 13, 2013
The issues of Conjoncture in France along with aglossary of economic outlook terminology areavailable as soon as they are published on theINSEE web server, in the "INSEE conjoncture"section of the website www.insee.fr

SLIGHTLY BRIGHTER
GENERAL OUTLOOK . . . . . . . . . . . . . . . . . . . . . . . . . . . . . . . . . . . . . . . . . . . . . . . . . . . . . . . 7
FRENCH DEVELOPMENTS
• Review of the previous forecast . . . . . . . . . . . . . . . . . . . . . . . . . . . . . . . . . . . . . . . . . . . . . . 43
• Output . . . . . . . . . . . . . . . . . . . . . . . . . . . . . . . . . . . . . . . . . . . . . . . . . . . . . . . . . . . . . . . 45
• France’s international environment . . . . . . . . . . . . . . . . . . . . . . . . . . . . . . . . . . . . . . . . . . . 48
• Foreign trade. . . . . . . . . . . . . . . . . . . . . . . . . . . . . . . . . . . . . . . . . . . . . . . . . . . . . . . . . . . 51
• Employment . . . . . . . . . . . . . . . . . . . . . . . . . . . . . . . . . . . . . . . . . . . . . . . . . . . . . . . . . . . 54
• Unemployment . . . . . . . . . . . . . . . . . . . . . . . . . . . . . . . . . . . . . . . . . . . . . . . . . . . . . . . . . 58
• Consumer prices . . . . . . . . . . . . . . . . . . . . . . . . . . . . . . . . . . . . . . . . . . . . . . . . . . . . . . . . 60
• Wages . . . . . . . . . . . . . . . . . . . . . . . . . . . . . . . . . . . . . . . . . . . . . . . . . . . . . . . . . . . . . . . 63
• Household income. . . . . . . . . . . . . . . . . . . . . . . . . . . . . . . . . . . . . . . . . . . . . . . . . . . . . . . 65
• Household consumption and investment . . . . . . . . . . . . . . . . . . . . . . . . . . . . . . . . . . . . . . . 69
• Entreprises’ earnings . . . . . . . . . . . . . . . . . . . . . . . . . . . . . . . . . . . . . . . . . . . . . . . . . . . . . 74
• Corporate investment and inventory . . . . . . . . . . . . . . . . . . . . . . . . . . . . . . . . . . . . . . . . . . 76
INTERNATIONAL DEVELOPMENTS
• Oil and raw materials . . . . . . . . . . . . . . . . . . . . . . . . . . . . . . . . . . . . . . . . . . . . . . . . . . . . 81
• Financial markets. . . . . . . . . . . . . . . . . . . . . . . . . . . . . . . . . . . . . . . . . . . . . . . . . . . . . . . . 84
• Eurozone. . . . . . . . . . . . . . . . . . . . . . . . . . . . . . . . . . . . . . . . . . . . . . . . . . . . . . . . . . . . . . 87
• Germany. . . . . . . . . . . . . . . . . . . . . . . . . . . . . . . . . . . . . . . . . . . . . . . . . . . . . . . . . . . . . . 91
• Italy . . . . . . . . . . . . . . . . . . . . . . . . . . . . . . . . . . . . . . . . . . . . . . . . . . . . . . . . . . . . . . . . . 92
• Spain . . . . . . . . . . . . . . . . . . . . . . . . . . . . . . . . . . . . . . . . . . . . . . . . . . . . . . . . . . . . . . . . 93
• United Kingdom . . . . . . . . . . . . . . . . . . . . . . . . . . . . . . . . . . . . . . . . . . . . . . . . . . . . . . . . 94
• United States . . . . . . . . . . . . . . . . . . . . . . . . . . . . . . . . . . . . . . . . . . . . . . . . . . . . . . . . . . . 95
• Japan . . . . . . . . . . . . . . . . . . . . . . . . . . . . . . . . . . . . . . . . . . . . . . . . . . . . . . . . . . . . . . . . 98
• Emerging economies . . . . . . . . . . . . . . . . . . . . . . . . . . . . . . . . . . . . . . . . . . . . . . . . . . . . . 99
FOCUS
• Understanding the upturn in the savings ratio in 2013. . . . . . . . . . . . . . . . . . . . . . . . . . . . . . . . . . . . . . . . . . . . . . . . .72
• Fiscal consolidation and its impact on economic activity in the Eurozone in 2013 . . . . . . . . . . . . . . . . . . . . . . . . . . . . . 89
• Wealth effects and the fiscal shock explain the low savings ratio in the United States . . . . . . . . . . . . . . . . . . . . . . . . . . . 96
SPECIAL ANALYSIS
• How to explain the recent shift in balance-of-trade trends in Europe ? . . . . . . . . . . . . . . . . . . 19
COUNTRIES ACCOUNTS . . . . . . . . . . . . . . . . . . . . . . . . . . . . . . . . . . . . . . . . . . . . . . . . .102STATISTICAL FRENCH APPENDIX . . . . . . . . . . . . . . . . . . . . . . . . . . . . . . . . . . . . . . . . . .106

Slightly brighter
In Q1 2013, activity was disappointing on thewhole in the emerging economies, while in the
advanced economies, the expected upturn (+0.4%after 0.0%) did occur. World demand for Frenchproducts fell back, however, for the secondconsecutive quarter, notably due to the sharp fall inGerman imports.
In Q2 2013, the business tendency surveys aredelivering a relatively contrasted message, with adecrease in the business climate in the BRICs andthe United States on the one hand, and animprovement in Japan and, to a lesser extent, in theEurozone, on the other.
World demand for French products is likely to pickup over the forecasting period, thanks to an upturnin Eurozone imports (+0.6% on average over thelast three quarters of 2013, after -1.1% in Q1). Theupturn in French exports should remain moderate,notably because the Euro has appreciated sincemid-2012.
In France, domestic demand is set to remainsluggish throughout 2013, but the upturn inexports and rebuilding of stocks in manufacturingshould allow an upturn in activity in Q2 (+0.2%,after -0.2%). Activity should then be stable in H22013 (0.0% in Q3 then +0.1% in Q4). All in all,GDP should slip back by 0.1% in 2013, after 0.0%in 2012. However, year on year, activity should beon a better trend at the end of 2013 than one yearearlier (+0.1% after -0.3%), thanks to thestabi l isat ion of manufacturing production(+0.3%, after -4.2%).
The slide in investment should gradually becomeless pronounced. In building, housing starts haverisen again in recent months and as activitystabilises, the fall in investment by businesses inmanufactured goods should ease over theforecasting period.
Household purchasing power is likely to continue tobe hit by the worsening labour market. The rise inproductivity gains is likely to lead to largemarket-sector job losses (35,000 per quarter onaverage). The fall in total employment should beless pronounced, however, on account of the largeincrease in non-market subsidised employment. Theunemployment rate should continue to increase, butless rapidly, and should stand at just over 11%(including Overseas Departments) at the end of2013, up 0.6 points year on year.
Despite sluggish earned income, householdpurchasing power should level out in 2013 (+0.2%after -0.9%), under the combined effects of the fall ininflation and the slower rise in the tax burden. Thisimprovement is likely to work through only partiallyinto household consumption, which is likely to slipagain in 2013 (-0.1% after -0.4% en 2012). Unlikein 2012, consumption smoothing behaviour shouldbe limited and precautionary saving is likely tocontinue increasing, with the savings ratio no longerfalling in 2013 (+0.3 points after -0.5 points).
There are a number of uncertainties associated withthis scenario.
On the one hand, the business climate in servicesaccording to the business tendency surveys isweaker than suggested by analysis of the variousdemand items that guided the forecast: activity inthis sector could therefore be slower than expected.There could also be an upturn in oil prices, after themarked fall in recent months, as prospects fordemand are slightly more dynamic than foreseeablesupply.
On the other hand, the upturn in construction couldbe stronger than expected, and the upturn thatseems to be beginning in Europe could buoy upgrowth in outlets for French exports more than wasforecast, if it should gain in magnitude.
General outlook
June 2013 7

8 Conjoncture in France
General outlook
Activity rebounded in the advanced economies in Q1 2013
A disappointing start to theyear in the emerging economies
In Q1 2013, activity in the emerging economies was less dynamic than had beensuggested by the improvement in business tendency surveys. It even slowed downin China (+1.6% after +2.0%) and imports of all emerging economies were thusmuch less dynamic (See Graph 1).
Upturn in activity in theadvanced economies
World trade did continue to progress, however, at the same rate as at the end of2012 (see Graph 1) as imports fell less in the advanced economies. In the latter,activity picked up at the start of 2013 (+0.4% after 0.0%).
In the United States, growthdespite fiscal tightening
In particular, there was a clear acceleration in the United States (+0.6% after+0.1%). On the one hand, the destocking trend that held activity back at the endof 2012 was reversed in Q1 2013. On the other, household consumption wasparticularly dynamic (+0.8%), despite tax rises coming into force and causingpurchasing power to fall.
Rise of the Japanese economy Activity also progressed clearly in Japan in Q1 2013 (+1.0% after +0.3%). Afterfalling for several quarters, exports showed an upturn (+3.8% after -2.9%),buoyed by the sharp depreciation of the Yen.
The fall in activity continued in the Eurozone
Sixth quarterly fall in GDP inthe Eurozone
In the Eurozone, however, the fall in activity continued in Q1 2013, although at aslower rate than in the previous quarter (-0.2% after -0.6%). In the manufacturingsector activity fell, although only to a limited extent (-0.2% after -2.2%).
Germany catches cold In Germany, despite the marked improvement in the outlook at the start of theyear according to the surveys, the upturn in activity was weak in Q1 2013 (+0.1%after -0.7%). As in the previous quarter, the German economy was hit by the fall inits exports, an astonishing trend given the progression in world trade. With thebad weather conditions at the start of the year, activity also fell significantly inconstruction (-2.1%). Consequently, German imports fell again sharply (-2.1%after -1.3%), weighing down on the exports of the country’s partners, especially inEurope.
Marked fall in activity in Spainand Italy
In Spain and Italy, the fall in activity remained considerable (-0.5% in Spain and-0.6% in Italy). In both these countries, domestic demand and exports continuedto fall. In Spain, however, investment in capital goods levelled out (+0.1%).
1 - World trade and imports
Sources: Centraal Plan Bureau, INSEE calculations

In France, second consecutive quarterly fall in activity
In France, demand remainedsluggish
Activity also fell back in France in Q1 2013 (-0.2% as in the previous quarter). Hitby weak demand in the Eurozone and by disappointing performances outside theEurozone, exports fell (-0.5% after -0.7%). In this context, businesses again cuttheir investments (-0.8% after -0.7%), as did households (-1.3% after -0.8%) andhousehold consumption stagnated (-0.1% after 0.0%). Although householdenergy expenditure did leap upwards (+5.0% after -0.4%) on account of theharsher temperatures than usual in Q1 2013, that in manufactured goods fell(-0.9% after -0.1%) as did market services excluding trade (-0.1% after +0.2%).
Fall in manufacturing activityand slowdown in services
On the supply side, manufacturing production continued to slip back in Q1 2013(-0.3% after -2.2%) and activity stagnated in services, hit by sluggish industrialactivity and household demand. Activity in construction fell again at aconsiderable rate (-0.8% after -0.9%): in building, the low level of housing startsobserved in 2012 continued to have effects, while activity in public works was hitby harsh temperatures at the start of the year. Energy production progressed,however, buoyed by high household heating expenditure.
World activity should remain robust over the forecastingperiod
Dynamism without excess inthe emerging economies
Through to the end of 2013, activity should continue to progress in the emergingeconomies at a rate comparable to that at the start of the year. In China, inparticular, the recent slowdown in the business climate in the manufacturingsector (see Graph 2) indicates that the Chinese economy should remain at asignificantly lower rate than prior to the crisis.
The business climate picks upin Japan and the Eurozone
In the United States, the business climate in manufacturing has slippedsignificantly from its peak in March 2013 (see Graph 2). It does remain close tothe expansion threshold, however. In Japan, the progression in the businessclimate has been spectacular since the beginning of the year. The improvement isless clear-cut in the Eurozone, where the business climate in manufacturingremains below the expansion threshold. However, it is still considerably higherthan the low point reached in summer 2012.
Contrasted situations betweenthe advanced economies
Activity should therefore remain highly contrasted. In the United States, activityshould grow at a comparable rate to that observed for over two years (+0.4% inQ2 2013, then +0.5% per quarter in H2 2013). The Japanese economy shouldhave plenty of momentum all year long (+0.6% per quarter). In the Eurozone, thetrend in activity should remain less positive, however, although it should stopshrinking in Q2 2013 (0.1% after -0.2%) and should progress slightly in H2
June 2013 9
General outlook
2 - Business climate in manufacturing industry
Source: Markit

(+0.1% in Q3 2013 then +0.2% in Q4). With continuing growth in activity,imports of the advanced countries, which were weak at the start of the year,should accelerate.
Expansion confirmed in the United States and Japan in 2013
The Japanese economy fullsail ahead
The Japanese economy accelerated clearly in Q1 2012 (+1.0% after +0.3%)and the greater dynamism should be confirmed over the rest of 2013, thanks topowerful support: exports are likely to benefit from the sharp fall in the value of theYen since the end of 2012, while the new stimulus measures passed in February2013 should gradually come into force. Driven by improved expectations asregards activity, corporate investment is set to accelerate over the forecastingperiod. Over the year as a whole, activity in Japan should progress only by 1.6%,however, held back by the overhang at the end of 2012.
Tighter US fiscal policy shouldonly hold activity back slightly
Conversely, American fiscal policy has tightened significantly in 2013, whichshould contribute to slowing down activity somewhat: it is likely to progress by1.8% in 2013, after 2.2% in 2012. Public consumption, in particular, whichslowed down sharply at the end of 2012 and start of 2013, is unlikely to pick upbefore the end of the year. Household consumption, however, should not slowdown, despite the sudden slowdown in household purchasing power (+0.5%after +1.7% in 2012) caused by the rises in the tax burden on 1st January 2013.There are likely to be all the conditions for the savings ratio to remain close to thelow point reached since the start of 2013: precautionary savings are likely to becut back with the fall in unemployment, while the increase in asset prices shouldgenerate wealth effects. The upturn in investment in construction should also beconfirmed over the forecasting period.
Improvement in the Eurozone by the end of 2013
The German winter shouldcome to an end
Compared to the start of the year, the slow upturn in Eurozone activity through tothe end of 2013 should show an improvement in each of the four majoreconomies. The improvement should be much clearer in Germany, however,where activity should progress by 0.6% in Q2 2013 and then maintain asustained rate in H2 2013. German household consumption should continue toprogress (0.3% per quarter) while the factors that held activity back in late 2012and early 2013 should fade out. In particular, after two unexpectedly weakquarters, German exports should return to a growth rate that is more in line withthat in world trade. Consequently, German imports should rebound.
10 Conjoncture in France
General outlook
3 - Fall in financial tensions confirmed in the Eurozone
Source: DG ECFIN
Spain and Italy on the road torecovery
In Italy and Spain, the slide in activity should ease over the year. On the one hand,the rebound in German demand and dynamic trade outside the Eurozone shouldboost exports. On the other, after a long adjustment phase, investment bybusinesses in capital goods should begin to pick up, especially if the fall in interestrates observed since summer 2012 (see Graph 3) should be accompanied byeasing of lending terms in these countries. Finally, fiscal consolidation efforts arelikely to continue in 2013, although slightly less intensely than in 2012, with theresult that household consumption should fall less by the end of the year.
Rebound in French exports
Demand for French productsset to pick up
Demand for French products fell back in Q1 2013, due to weak demand in theEurozone. It should accelerate clearly from Q2 2013, thanks to the rebound inGerman imports, the gradual stabilisation of the Spanish and Italian economiesand strong activity outside the Eurozone. French exports should therefore pick up,progressing by 1.3% in Q2 2013 then by 0.6% per quarter in H2.
Activity in France likely to remain sluggish through to end2013
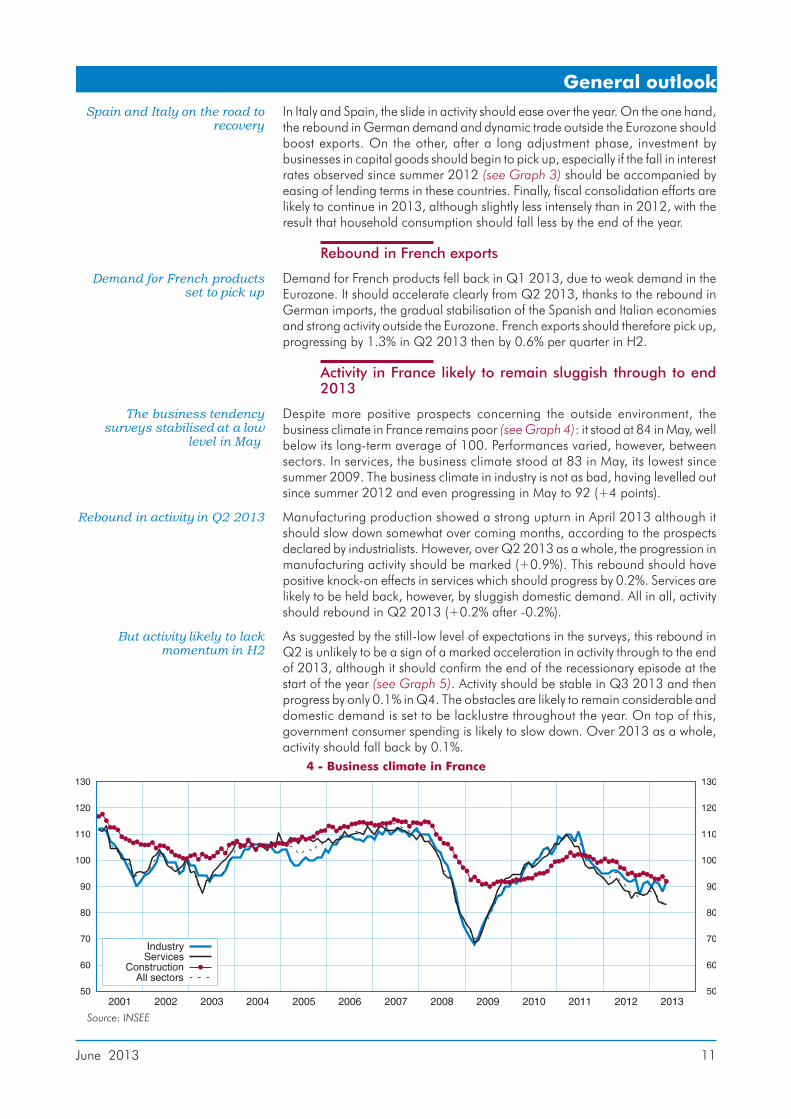
The business tendencysurveys stabilised at a low
level in May
Despite more positive prospects concerning the outside environment, thebusiness climate in France remains poor (see Graph 4): it stood at 84 in May, wellbelow its long-term average of 100. Performances varied, however, betweensectors. In services, the business climate stood at 83 in May, its lowest sincesummer 2009. The business climate in industry is not as bad, having levelled outsince summer 2012 and even progressing in May to 92 (+4 points).
Rebound in activity in Q2 2013 Manufacturing production showed a strong upturn in April 2013 although itshould slow down somewhat over coming months, according to the prospectsdeclared by industrialists. However, over Q2 2013 as a whole, the progression inmanufacturing activity should be marked (+0.9%). This rebound should havepositive knock-on effects in services which should progress by 0.2%. Services arelikely to be held back, however, by sluggish domestic demand. All in all, activityshould rebound in Q2 2013 (+0.2% after -0.2%).
But activity likely to lackmomentum in H2
As suggested by the still-low level of expectations in the surveys, this rebound inQ2 is unlikely to be a sign of a marked acceleration in activity through to the endof 2013, although it should confirm the end of the recessionary episode at thestart of the year (see Graph 5). Activity should be stable in Q3 2013 and thenprogress by only 0.1% in Q4. The obstacles are likely to remain considerable anddomestic demand is set to be lacklustre throughout the year. On top of this,government consumer spending is likely to slow down. Over 2013 as a whole,activity should fall back by 0.1%.
June 2013 11
General outlook
4 - Business climate in France
Source: INSEE

The labour market continues to worsen
Market-sector employmentdown sharply in 2013
The fall in market-sector employment was limited in Q1 2013 (-8,000):temporary work picked up, but employment in industry excluding temporary workfell back. With the weakness in activity, the labour market situation shouldcontinue to deteriorate through to the end of 2013, although the fall inmarket-sector employment should be attenuated by the first effects of the TaxCredit for Competitiveness and Employment (CICE). All in all, 38,000 jobs arelikely to be lost in H1 2013 in the market sector, then 76,000 in H2.
Unemployment rate to exceed11% at the end of 2013
Over the year as a whole, the fall in total employment should be significantlysmaller than that in market-sector employment, due to the sharp increase in thenumber of beneficiaries of subsidised jobs, in particular as the "Emplois d’avenir"programme gets up to speed. The rise in unemployment should thereforecontinue at a less sustained rate than in 2012: from an estimated 10.4% of theactive population in Q1 2013 (10.8% including Overseas Departments), itshould increase by 0.3 points by the end of the year.
Purchasing power set to level out in 2013
Clear fall in inflation The high unemployment level and weak production capacities should continue toweigh down on prices. Also, with the price of Brent stabilising at around $104,energy prices should progress little. Headline inflation should therefore remainbelow 1.0% over the forecasting period (0.8% in December 2013, as in May2013). As an annual average, the slowdown in consumer prices should be clear:they should increase by 0.8% in 2013, after +1.9% in 2012.
The slowdown in wages set tocontinue
Nominal wages should be slowed down by the deterioration in the job marketand the fall in inflation. Their year-on-year progression should therefore stand at1.2% at the end of 2013, against 1.7% at the end of 2012. However, the fall ininflation should only work through gradually into wages, with the result that realwages should pick up slightly. Year on year, their progression should neverthelessbe limited (+0.3% end 2013).
The tax burden set to beslightly less dynamic in 2013
The new measures provided by the Finance Bill for 2013 induce a rise in thecontributions and taxes paid by households, representing about 1.1 points ofincome in 2013, a comparable level to 2012. The effective burden shouldnonetheless slow down significantly in 2013 as the spontaneous trend, excludingnew measures, is likely to be affected by the weakness of income in 2012.
12 Conjoncture in France
General outlook
5 - Recovery in manufacturing industry
Source: INSEE

Purchasing power to level outin 2013
Despite the new slowdown in earned income in current Euros in 2013, the fall inpurchasing power should halt in 2013. Thanks to the fall in inflation and a lessdynamic tax burden, purchasing power should pick up slightly (+0.2% after-0.9%).
Household consumption sluggish
Rise in the savings ratio in2013
The fall in household consumption in 2012 (-0.4%) was smaller than that inpurchasing power (-0.9%): the household savings ratio slipped by 0.5 points.This behaviour was expected because households tend to smooth out anyupward or downward jolts in their income, particularly any taxation shocks. Thissmoothing is only temporary, however, and households do end up adjusting theirexpenditure level to the level of their purchasing power. The sharp slide inpurchasing power in 2012 should therefore have a downward impact onhousehold spending in 2013. The deterioration in the labour market should alsolead to a further rise in precautionary saving, with the savings ratio thereforepicking up slightly in 2013 (+ 0.3 points).
Stability in consumer spending Consumer spending should therefore stagnate (-0.1%). The quarterly profileshould be marked by the jolts in energy spending, which is set to be dynamicagain in Q2 due to the harsh temperatures recorded in April and in May. It shouldthen return to its usual level in the summer.
The fall in investment should continue
Stabilisation insight in building The low level of individual and collective housing starts in 2012 slowed downactivity in building on a lasting basis. The fall should be even clearer in Q2 andQ3, although it should stop in Q4 2013. The upturn in starts since the beginningof 2013 should gradually work through into the level of investment in newconstruction. Home improvement and maintenance expenditure could receive atemporary boost from people bringing work forward before the VAT rate rises on1st January 2014.
Further drop in corporateinvestment
Investment by non-financial enterprises should continue to fall over theforecasting period. The context is likely to remain unconducive to any expansionof production capacities: activity prospects are poor and capacity utilisation rateslow. The investment rate for non-financial enterprises should stand at 18.8% oftheir added value in Q4 2013, significantly lower than the peak of 19.9%reached at the end of 2011.
Uncertainties
Uncertainties: weaker activityin services...
The business tendency surveys are poor in services, suggesting in principle thatthere should be a less positive trend in activity than that used in the forecast,notably in Q2 2013. Prospects for final demand (consumption and investment)are low, but in this Conjoncture in France we are expecting the upturn inmanufacturing industry to have its usual knock-on effects on services. In the lightof the business tendency surveys, there is a risk that the actual upturn might turnout to be less strong than expected.
..., the rebound in demand forFrench products, ...
The forecast supposes that activity in Europe will pick up only very gradually,notably in Italy and Spain. The upturn could be quicker if investment expenditurerises more rapidly than expected to meet dynamic foreign demand. Theimprovement in activity prospects could also lead to a fall in the householdsavings ratio in these two countries.
... and oil prices The forecast is based on the hypothesis of oil prices stabilising at around $104 abarrel of Brent. Prospects for supply and demand could lead to the Brent pricerising by the end of 2013, however, if the OPEC countries should choose to holdtheir supplies down at a time when world demand for oil should increase thanks torobust activity in Japan, the United States and the emerging economies.!
June 2013 13
General outlook

14 Conjoncture in France
General outlook
6 - Fan chart for Conjoncture in France
How to read it: the fan chart plots 90% of the likely scenarios around the baseline forecast (red line). The first and darkest band covers the likeliestscenarios around the baseline, which have a combined probability of 10%. The second band, which is a shade lighter, comprises two sub-bands justabove and just below the central band. It contains the next most likely scenarios, raising the total probability of the first two bands to 20%. We can repeatthe process, moving from the centre outwards and from the darkest band to the lightest, up to a 90% probability (see INSEE Conjoncture in France forJune 2008, pages 15 to 18). It can therefore be estimated that the first result published by the quarterly accounts for Q2 2013 has a 50% chance ofbeing between 0.0% (lower limit of the fifth band from the bottom) and 0.4% (upper limit of the fifth band from the top). Likewise, it has a 90% chance ofbeing between -0.2% and +0.7%. In Q3 2013, the 90% confidence intervals is [-0.6% ; +0.5%].
Source: INSEE

June 2013 15
General outlook
2011 2012 20132011 2012 2013
Q1 Q2 Q3 Q4 Q1 Q2 Q3 Q4 Q1 Q2 Q3 Q4
International environment
Advanced economy GDP 0.2 0.3 0.6 0.3 0.5 0.1 0.3 0.0 0.4 0.4 0.4 0.4 1.7 1.3 1.1
Eurozone GDP 0.7 0.2 0.1 -0.3 -0.1 -0.2 -0.1 -0.6 -0.2 0.1 0.1 0.2 1.5 -0.5 -0.6
Barrel of Brent oil (in dollars) 105 117 112 109 118 109 109 110 112 103 104 104 111 112 106
Euro-dollar exchange rate 1.37 1.44 1.41 1.35 1.31 1.28 1.25 1.30 1.32 1.30 1.30 1.30 1.39 1.29 1.31
World demandfor French products 1.9 -0.1 1.0 -0.5 0.3 0.4 0.2 -0.5 -0.3 1.0 1.0 1.1 6.2 0.6 1.0
France - supply and use
GDP 1.1 0.0 0.2 0.1 0.0 -0.2 0.1 -0.2 -0.2 0.2 0.0 0.1 2.0 0.0 -0.1
Imports 4.3 -1.9 0.2 -1.7 0.9 0.2 0.1 -1.3 0.1 1.0 0.6 0.6 5.3 -0.9 0.4
Household consumption 0.3 -0.9 0.2 -0.3 0.2 -0.4 0.0 0.0 -0.1 0.1 0.0 0.1 0.5 -0.4 -0.1
Public and NPISH consumption 0.0 0.1 0.2 0.2 0.6 0.5 0.3 0.3 0.3 0.3 0.2 0.2 0.5 1.5 1.2
Total GFCF 1.4 0.1 0.0 1.1 -1.4 -0.2 -0.7 -0.8 -0.9 -0.5 -0.6 -0.1 3.0 -1.2 -2.6
of which: NFEs 1.7 -0.9 -0.7 1.8 -1.8 -0.2 -0.9 -0.7 -0.8 -0.4 -0.6 -0.1 3.1 -1.9 -2.4
Households -0.2 1.0 0.7 0.3 -0.7 -0.2 -0.3 -0.8 -1.3 -1.6 -1.1 -0.2 2.3 -0.4 -3.9
Exports 1.8 1.2 0.2 1.7 0.1 0.9 0.5 -0.7 -0.5 1.3 0.6 0.6 5.6 2.5 0.8
Contributions (in point)Domestic demandexcluding change in inventories (**) 0.5 -0.5 0.2 0.1 0.0 -0.2 0.0 -0.1 -0.1 0.0 0.0 0.1 1.0 -0.1 -0.2
Change in inventories (**) 1.4 -0.3 0.0 -0.9 0.2 -0.2 0.0 -0.3 0.1 0.1 0.0 0.0 1.1 -0.8 0.0
Net foreign trade -0.8 0.9 0.0 0.9 -0.2 0.2 0.1 0.2 -0.2 0.1 0.0 0.0 0.0 1.0 0.1
France - situationof households
Total employment 49 46 -17 4 30 -4 -46 -31 -5 -10 -5 8 83 -51 -12
Non-agricultural market sectoremployment 41 39 -23 -1 9 -19 -41 -41 -8 -29 -42 -34 56 -92 -113
Unemployment rateMetropolitan France 9,1 9,1 9,2 9,3 9,5 9,8 9,9 10,1 10,4 10,5 10,6 10,7 9,3 10,1 10,7
Unemployment rateFrance 9,5 9,5 9,6 9,8 9,9 10,2 10,3 10,5 10,8 10,9 11,0 11,1 9,8 10,5 11,1
Consumer price index (*) 2,0 2,1 2,2 2,5 2,3 1,9 1,9 1,3 1,0 0,8 0,8 0,8 2,1 2,0 0,9
Core inflation (*) 0,7 1,2 1,1 1,7 1,7 1,5 1,2 0,7 0,7 0,4 0,5 0,5 1,1 1,3 0,5
Household purchasing power 0,0 0,4 -0,4 -0,3 -0,5 0,2 -0,1 -0,9 0,9 0,2 -0,2 -0,5 0,7 -0,9 0,2
Key figures: France and its international environmentseasonally adjusted / working-day adjusted data (except for prices), quarterly or annual averages, as a %
Forecast(*) Year on year on the last month of the quarter(**) Inventory changes include acquisitions net of sales of valuable
Howtoread it: thevolumesarecalculatedat thepreviousyear’s chain-linkedprices, seasonallyandworking-dayadjusted,quarterlyandannualaverages,asa%.
Source: INSEE
![Curious cases of flagellation in France [electronic resource]](https://static.fdokumen.com/doc/165x107/63227405887d24588e043de9/curious-cases-of-flagellation-in-france-electronic-resource.jpg)

![L'AMÉNAGEMENT DU TERRITOIRE EN ALLEMAGNE ET EN FRANCE [Spatial planning in Germany and France]](https://static.fdokumen.com/doc/165x107/63249b605f71497ea904e1c9/lamenagement-du-territoire-en-allemagne-et-en-france-spatial-planning-in-germany.jpg)