
Faith-Based Organisations and Conflict Resolution in Nigeria
Upload
khangminh22Category
view
1download
0
CONFLICT IDENTIFICATION AND RESOLUTION
FOR SOFTWARE ATTRIBUTE REQUIREMENTS
by
Hoh In
--------
A Dissertation Presented to the
FACULTY OF THE GRADUATE SCHOOL
UNIVERSITY OF SOUTHERN CALIFORNIA
In Partial Fulfillment of the
Requirements for the Degree
DOCTOR OF PHILOSOPHY
(Computer Science)
December 1998
Copyright 1998 Hoh In

ii
DEDICATION
To the Lord, Jesus
To my wife and children, Kyunghee, Joseph, and David In
To my parents, HyunJoo In & Kwon Jing

iii
ACKNOWLEDGEMENTS
I would like to thank Dr. Barry Boehm for being an excellent mentor. He
encouraged me to continue my research, and was patient with me as I learned research and
communication skills in the U.S.A. He is a wonderful advisor for graduate students
because of his research potential, kindness, and generosity. His diligence and brilliance
motivates me still to keep digging.
I would like to thank Dr. Ellis Horowitz and Dr. Omar El Sawy for guiding me
from the beginning of my research, cultivating me to be an independent researcher, as well
as for participating in the dissertation committee despite their busy schedules.
I would like to thank about 30 USC/CSE (University of Southern California /
Center for Software Engineering) industry and government affiliates for providing me
useful and valuable comments, suggestions, and survey data as well as financial support.
The affiliates are: Aerospace Corporation, Air Force Cost Analysis Agency, AT&T,
Bellcore, DISA, Electronic Data Systems Corporation, E-Systems, Hughes Aircraft
Company, Interactive Development Environments, Institute for Defense Analysis, Jet
Propulsion Laboratory, Litton Data Systems, Lockheed Martin Corporation, Loral Federal
Systems, Motorola Inc., Northrop Grumman Corporation, Rational Software Corporation,
Rockwell International, Science Applications International Corporation, Software
Engineering Institute (CMU), Software Productivity Consortium, Sun Microsystems, Inc.,
Texas Instruments, TRW, U.S. Air Force Rome Laboratory, U.S. Army Research
Laboratory, and Xerox Corporation.
I would like to thank my colleagues Dr. Ahmed Abd-Allah, Dr, Brad Clark, Dr.
Cristina Gacek, Dr. Ming June Lee, Dr. Dan Port, Chris Abts, Jongmoon Baik, Sunita
Chulani, Simei Du, Alexander Egyed, Joo Haeng Lee, June Sup Lee, and Jung-Won Park
for sharing with me the joys and sorrows of the Ph.D. student life.

iv
ABSTRACT
A critical success factor in requirements engineering involves determining and
resolving conflicts among candidate system requirements proposed by multiple
stakeholders. Many software projects have failed due to requirements conflicts among the
stakeholders.
The WinWin system developed at USC provides an approach for resolving
requirements conflicts among the stakeholders. The WinWin system provides a framework
for negotiation between the stakeholders to identify and resolve these conflicts. However,
such systems do not scale well for large software projects containing many requirements.
Based on an analysis of the options for addressing this problem, I have focused
on semiautomated tools and techniques for identifying and resolving conflicts among
software quality attributes. I have developed two prototype support tools, QARCC and S-
COST, which expand the capabilities of the WinWin system. QARCC focuses on software
architecture strategies for achieving quality attribute objectives. S-COST focuses on
tradeoffs among software cost, functionality, and other quality attributes. I have also
developed portions of underlying theories and models which serve as the basis for the
prototype tools.
Finally, I evaluated the theories, models, and tools with the results of WinWin
negotiations, such as the CS577 15-project samples.

v
TABLE OF CONTENTS
PART I: OVERVIEW..........................................................................................................1
1.0 Introduction.................................................................................................................21.1 Motivation ...................................................................................................................................2
1.2 Problem Statement ......................................................................................................................3
1.3 Capability Needs .........................................................................................................................5
1.4 Outline of the Dissertation ..........................................................................................................6
2.0 Related Work...............................................................................................................72.1 Conflict Resolution Techniques in Requirements Engineering ..................................................7
2.2 Research Focus (CIS: Cooperative, domain Independent, Semi-Automated) ..........................13
2.3 Comparison of Conflict Resolution Techniques .......................................................................15
3.0 Context: WinWin and Conflict Resolution ...............................................................183.1 WinWin .....................................................................................................................................18
3.1.1 Theory W........................................................................................................................183.1.2 WinWin Spiral Model ....................................................................................................193.1.3 WinWin Negotiation Model ...........................................................................................21
3.2 Scalability Problem in WinWin: Need for Semi-Automated Assistance..................................22
4.0 Solution Focus ..........................................................................................................254.1 Focus for Conflict Identification ...............................................................................................25
4.1.1 Rationale for Focus on Taxonomy Elements..................................................................264.1.2 Rationale for Focus on Quality Attribute Taxonomy Elements .....................................294.1.3 Rationale for Focus on Quality Attribute Strategies ......................................................314.1.4 Rationale for Focus on Architecture Strategies..............................................................32
4.2 Focus for Conflict Resolution ...................................................................................................33
PART II: CONTRIBUTION.............................................................................................35
5.0 Conflict Identification Theories and Models for Quality Attributes.........................365.1 Overview of the Conflict Identification Models .......................................................................36
5.2 The Profile Analysis for Stakeholder/Quality Attribute Relationships.....................................40
5.3 Quality Attribute Strategies.......................................................................................................43
5.4 Architecture Strategies for Achieving Quality Attributes.........................................................475.4.1 Formalization of the “Architecture Strategies” ..............................................................485.4.2 Architecture Strategies and their Quality Attribute Tradeoffs .......................................505.4.3 Elaboration of Architecture Strategies ...........................................................................51

vi
6.0 Conflict Resolution Theories and Models for Quality Attributes.............................556.1 Option Creation Through Added Dimensions. .........................................................................55
6.1.1 WinWin Conflict Resolution as the Problem Space View Model ..................................556.1.2 Conflict Resolution Process by Option Creation through Added Dimensions ..............586.1.3 Determining the WinWin Value .....................................................................................64
6.2 Relation to S-COST Resolution Strategies ...............................................................................67
6.3 The Formalism of the “S-COST Resolution Strategies”...........................................................69
6.4 Stakeholder/ S-COST Resolution Strategies Relationships......................................................72
7.0 The Support Tools: QARCC and S-COST ...............................................................767.1 Overview of the Support Tools .................................................................................................76
7.2 A Top-level Support Tool: QARCC..........................................................................................777.2.1 Context ...........................................................................................................................777.2.2 Concept of Operation .....................................................................................................777.2.3 Experiment Results ........................................................................................................81
7.2.3.1 Experiment Scenario........................................................................................817.2.3.2 Results..............................................................................................................83
7.2.4 Lessons Learned.............................................................................................................84
7.3 A More Detailed Support Tool: S-COST..................................................................................857.3.1 Context ...........................................................................................................................857.3.2 Concept of Operation .....................................................................................................857.3.3 Experiment Results ........................................................................................................87
7.3.3.1 Overview of Experiment Scenario...................................................................877.3.3.2 Scenario for Option Generation.......................................................................897.3.3.3 Scenario for Option Negotiation......................................................................917.3.3.4 Results..............................................................................................................927.3.3.5 Tool Extension: Option Summary ...................................................................92
7.3.4 Lessons Learned.............................................................................................................94
8.0 Results of the Analysis of the Experimental Data and Survey .................................968.1 Results of the Analysis of the WinWin Data of CS577a ..........................................................96
8.1.1 Analysis of Conflict Identification and the Resolution Process.....................................998.1.1.1 Analysis of Quality Issues ...............................................................................998.1.1.2 Analysis of Quality-Conflict Issues...............................................................101
8.1.2 Analysis of the Stakeholders’ Roles and their Relationships to Artifacts....................1078.1.3 Analysis of the Effectiveness of QARCC and S-COST...............................................1148.1.4 Lessons Learned...........................................................................................................120
8.2 Survey Results of the Relative Criticality of Attribute Conflicts............................................121
9.0 Summary of Key Contributions ..............................................................................126
10.0 Future Extensions ...................................................................................................12810.1 Extensions to the Models for Conflict Identification and Resolution.....................................128
10.1.1 Elaboration of Situation-Specific Architecture Strategies ...........................................12810.1.2 Elaboration of Situation-Specific S-COST Option Strategies .....................................128
10.2 Extensions to the Tools and General Approaches...................................................................12910.2.1 Generalization of the QARCC Capabilities .................................................................12910.2.2 Generalization of the S-COST Capabilities .................................................................130

vii
10.3 Extensions to the Theories for Conflict Identification and Resolution...................................13310.3.1 Refinements in Determining the WinWin Value ..........................................................133
PART III: REFERENCES AND APPENDICES..........................................................135
11.0 References...............................................................................................................136
12.0 Appendix A: Quality Attributes .............................................................................14312.1 Dependability ..........................................................................................................................143
12.1.1 Reliability/Accuracy.....................................................................................................14412.1.2 Correctness...................................................................................................................14512.1.3 Survivability/Availability .............................................................................................14612.1.4 Integrity ........................................................................................................................14812.1.5 Verifiability...................................................................................................................148
12.2 Interoperability........................................................................................................................149
12.3 Usability ..................................................................................................................................151
12.4 Performance (Efficiency) ........................................................................................................153
12.5 Adaptability.............................................................................................................................15412.5.1 Verifiability (see section 12.1.5 Verifiability) ..............................................................15412.5.2 Flexibility .....................................................................................................................15412.5.3 Expandability ...............................................................................................................15512.5.4 Maintainability/Debuggability .....................................................................................156
12.6 Development Cost and Schedule.............................................................................................156
12.7 Reusability ..............................................................................................................................157
13.0 Appendix B: Quality Attribute Strategies (QAS) ...................................................160
14.0 Appendix C: Architecture Strategies (AS) .............................................................16714.1 List of Architecture Strategies ................................................................................................167
14.2 Examples of Elaboration of Architecture Strategies...............................................................171

LIST OF FIGURES
viii
Figure 1: Classification of Conflict Resolution Techniques.........................................................................7Figure 2: Scalability vs. the Degree of Automation ...................................................................................16Figure 3: The WinWin Spiral Model..........................................................................................................20Figure 4: The WinWin Negotiation Model.................................................................................................21Figure 5: Overall Focus for Semi-automated Assistance ...........................................................................26Figure 6: Example of the WinWin Domain Taxonomy..............................................................................29Figure 7: Hierarchical Structure among Quality Attributes .......................................................................34Figure 8. Knowledge Base Structure of Conflict Identification Models....................................................37Figure 9. Mapping of Common Stakeholders’ Primary Concerns onto Quality Attributes.......................39Figure 10. Structure of Architecture Strategies for Quality Attributes ........................................................48Figure 11. Three Examples of Architecture Strategies ................................................................................49Figure 12. Quality Attribute Tradeoff Analysis ...........................................................................................50Figure 13. A Conflict Identification Algorithm with an Example ...............................................................52Figure 14. Performance/Dependability trades via Monitoring & Control strategy......................................54Figure 15. Conflict Resolution Through Added Dimensions ......................................................................56Figure 16. Conflict Situation in the Problem Space View Model ................................................................57Figure 17. An Example of Cost Conflict Resolution Through Added Dimensions.....................................59Figure 18. Overview of Conflict Resolution Process...................................................................................61Figure 19. Beginning of Theory: Conditions Enabling Higher-Dimension Win-Win Solutions .................63Figure 20. An Algorithm of Conflict Resolution by Option Creation Through Added Dimensions...........65Figure 21. Determining the WinWin Value..................................................................................................66Figure 22. Stakeholder / Option_Strategy Relationships .............................................................................73Figure 23. Overview of the Support Tools: QARCC & S-COST ................................................................76Figure 24. The QARCC Concept of Operation............................................................................................78Figure 25. An Example of the Initial Implementation of QARCC ..............................................................80Figure 26. The S-COST Concept of Operation............................................................................................86Figure 27. Visualization Window for Option Generation ............................................................................89Figure 28. Aids for Applying Cost-Resolution Strategy..............................................................................90Figure 29. Visualization Window for Option Negotiation ...........................................................................91Figure 30. Visualization Window for Option Summary...............................................................................93Figure 31. Results of the Win Condition Analysis for the Stakeholders’ Role in Quality Requiremnets .107Figure 32. Mapping of the Common Stakeholders’ Primary Concerns onto Quality Attributes...............108Figure 33. Results of the Analysis of Issues, Options, and Agreements for the Stakeholders’ Role.........109Figure 34. Analysis Graph of Quality Artifacts .........................................................................................111Figure 35. Analysis Graph of all Artifacts .................................................................................................113Figure 36. Survey Results of the S-COST future work..............................................................................132Figure 37. Determining the WinWin Value with Uncertainty Factors .......................................................134

LIST OF TABLES
ix
Table 1: Grouping of Conflict Resolution Techniques ...............................................................................10Table 2: Summary of Evaluating Conflict Resolution Techniques.............................................................15Table 3: Rationale I: Analysis From Win Condition Body To Taxonomy Elements .................................28Table 4: Rationale II: Focusing on Taxonomy Elements............................................................................30Table 5. Overview of the Proposed Theories, Models, and Their Support Tools.......................................35Table 6. Stakeholder Roles / Quality Attribute Concerns Relationship .....................................................41Table 7. Profile Analysis Results................................................................................................................42Table 8. Quality Attribute Product and Process Strategies: General ..........................................................45Table 9. Quality Attribute Strategies and Relations: Architecture Strategies.............................................46Table 10. Architecture Strategies..................................................................................................................54Table 11. Cost-Resolution Option Strategies ...............................................................................................70Table 12. Stakeholder Roles / Option Strategy Concerns Relationship .......................................................75Table 13. Conflicts Identified by QARCC ...................................................................................................83Table 14. Library Project Topics ..................................................................................................................97Table 15. Examples of Library Multimedia Problem Statements ................................................................98Table 16. Analysis Result of the Analysis of the WinWin Artifacts ..........................................................100Table 17. Analysis Results of the Analysis of the Quality-Conflict Issues................................................101Table 18. Negotiation Patterns for Quality-Conflict Issues Having One Option .......................................103Table 19. Negotiation Patterns for Quality-Conflict Issues Having Multiple Options...............................105Table 20. Results of the WinWin Artifacts.................................................................................................106Table 21. Results of the Analysis of the Quality Artifacts .........................................................................111Table 22. Results of the Analysis of all Artifacts .......................................................................................112Table 23. Potential Quality-Conflict Issues Identified by QARCC............................................................115Table 24. The Average Number of Quality-Conflict Issues per Student Team ..........................................116Table 25. Frequency Analysis of Quality Attribute Strategies ...................................................................117Table 26. Frequency Analysis of Quality Attribute Strategies ...................................................................119Table 27. Current Status and the Extension of the Models ........................................................................129Table 28. Current Status and the Extension of the Support Systems .........................................................131Table 29. Current Status and the Extension of the Theory.........................................................................133

1
Part I: Overview
This section presents a high-level introduction to the field of conflict resolution
in requirements engineering as well as a concise description of the problem stated in the
dissertation. The overall strategy for solving the problem will also be presented.

2
1.0 Introduction
1.1 Motivation
Many software projects have failed because they contained a poor set of
quality-attribute requirements (such as Dependability, Interoperability, Usability,
Performance, Adaptability, Reusability, and Cost & Schedule), even though they may have
had good a set of functional and interface requirements.
An important step in achieving successful software requirements is to achieve
the right balance of quality attribute requirements. Some counterexamples which illustrate
the importance of achieving this step include [Boehm-In, 1996a]:
• The New Jersey Department of Motor Vehicles’ licensing system. This project
chose a fourth generation language to satisfy software affordability and
timeliness objectives. However, the project failed due to performance scalability
problems.
• The initial design of the ARPANet Interface Message Process software. This
project focused on performance at the expense of evolvability by designing an
extremely tight inner loop.
• The National Library of Medicine MEDLARS II system. The project was
initially developed with a plethora of layers and recursions for portability and
evolvability, but it was scrapped due to performance problems.
To achieve this step, many requirements engineering techniques (e.g., tools, design
methods, and process models for specifying, validating, and verifying requirements) are

3
necessary and important. However, a number of leaders in the field consider that a more
important technique is requirements negotiation. For example, several recent keynote
speakers in ICSE (International Conference of Software Engineering) addressed this
importance of requirements negotiation as follows:
• “How the requirements were negotiated is far more important than how the
requirements were specified” (Tom De Marco, ICSE 96)
• “Negotiation is the best way to avoid “Death March” projects” (Ed Yourdon,
ICSE 97)
• “Problems with reaching agreement were more critical to my projects’ success
than such factors as tools, process maturity, and design methods” (Mark
Weiser, ICSE 97)
A key problem of negotiating quality-attribute requirements is identifying and resolving
conflicts among desired quality attributes among multiple stakeholders because most
conflicts of quality-attribute requirements come from different concerns, priorities, and
responsibilities of multiple stakeholders (e.g., users, customers, and developers).
1.2 Problem Statement
This dissertation will address the problem of identifying and resolving
conflicts among quality-attribute requirements from multiple stakeholders. It will also
examine what the effective models and support systems are for the task of the conflict

4
identification and resolution. A concise statement of the problem I propose to examine
reads as follows,
What are effective models and support systems for identifying and
resolving the quality conflicts among a large number of
requirements resulting from different perspectives of multiple
stakeholders?
In spite of scoping the central problem of conflict identification and resolution, there are
several formidable subproblems,
• What are effective theories and models for identifying quality conflicts among a
large number of requirements?
• What are effective theories and models for resolving quality conflicts among
requirements proposed by multiple stakeholders having their own interests,
priorities, and responsibilities?
• What are effective support systems (i.e., tools or aids) for identifying and
resolving quality conflicts among requirements?
There are several benefits which can be gained through such theories, models, and support
systems. First, time and money can be saved by resolving quality conflicts and risks in
early phases of the project life cycle. Second, the tradeoffs among various quality
attributes can be better understood so that stakeholders can better understand their options
in defining a software product. Third, due to the complexity involved in conflict resolution
and the shortage of expertise to deal with this complexity, such support tools for quality-
5
attribute conflict identification and resolution are needed to capture the expertise and make
it broadly available.
1.3 Capability Needs
Three major capabilities are necessary to identify and resolve conflicts
between the quality attribute requirements:
• Capabilities to surface and negotiate conflicts and risks among requirements.
The USC-CSE WinWin system [Boehm et al., 1994; 1995] provides an effective
framework.
• Capabilities to identify conflicts among quality-attribute requirements.
COCOMO (COnstructive COst MOdel) provides the capability of identifying
conflicts between development affordability & timeliness (i.e., cost & schedule)
requirements with functional and some other quality-attribute requirements.
QARCC (Quality Attribute Risk and Conflict Consultant), a proposed prototype
model and support system, provides the capability of identifying conflicts of
other qualities (e.g., assurance, interoperability, usability, performance,
evolvability, portability, and reusability).
• Capabilities to generate, visualize, and negotiate potential resolution options. S-
COST (Software Cost Option Strategy Tool), another proposed prototype model
and support system, provides these capabilities to resolve cost conflicts

6
1.4 Outline of the Dissertation
The rest of this dissertation is organized as follows. Section 2 summarizes the
related work on conflict resolution techniques in requirements engineering. Section 3
provides an overview of the WinWin system, and section 4 presents overall strategies for
identifying and resolving conflicts. Section 5 presents basic models for conflict
identification, and section 6 presents basic models for conflict resolution. Section 7
presents the support tools based on the models presented in sections 5 and 6. One is
QARCC for conflict identification in section 7.2 and another is S-COST for conflict
resolution in section 7.3. The experimental results and survey results of these tools are
presented in section 8. Key contributions are discussed in section 9, and future work is
discussed in section 10. Several appendices provide definitions of the terms used in this
thesis (e.g., quality attributes, quality attribute strategies, and architecture strategies).

7
2.0 Related Work
2.1 Conflict Resolution Techniques in Requirements Engineering
There are many kinds of conflict resolution techniques. These techniques can
be classified by their respective application areas (e.g., politics, economics, military, law,
or computer science). The conflict resolution technique of interest in this dissertation is
requirements engineering and concurrent engineering of software-intensive systems.
Conflict resolution techniques for these application areas can be broken down by their
degree of cooperation, domain dependence, and automation (Figure 1).
Domain
Automation
Cooperation
Domain-dependent
Domain-independent
Fully-automated
General tool support
Semi-automated
Non-cooperative
Cooperative
Group C
Group A
Group D
Group BResearch Focus
Figure 1. Classification of Conflict Resolution Techniques
Manual
Group E
Dependence
Group F

8
The degree of cooperation is a measure used by many theories and formalized
models for different conflict resolution techniques. This attribute encompasses non-
cooperative theories such as zero-sum game theory as well as very cooperative ones such
as Theory W [Boehm-Ross, 1989]. Most conflict resolution techniques involve
cooperation, whether they are implicitly or explicitly stated, and they can be categorized
accordingly.
The degree of domain dependency is also important in various conflict
resolution techniques. This attribute can range from specific knowledge for applying a
domain (i.e., domain dependent) to common knowledge for applying multiple domains
(i.e., domain independent). Domain independent models provided a general framework of
conflict resolution, which could be applied to any domain. Some domain independent
models (e.g., [Easterbrook, 1991]) tended to provide such a general framework, but were
designed to fill a specific need. WinWin ([Boehm et al., 1994; 1995]) allowed only 4
relation types and 4 artifact types based on the WinWin negotiation model, but
PERSUADER ([Sycara, 1991]) didn’t restrict any particular relation types and artifact
types. Sycara proposed only general semantic nodes and links for labor management
contract negotiations. Because models based on specific knowledge of a domain tended to
focus on a specific application domain, they resulted in general applicability problems
between different domains.
The degree of automation is a characteristic relevant to support tools for the
various conflict resolution techniques. These tools can be fully automated, partially
automated (i.e., semi-automated), general, or manual. Fully automated tools and systems
9
often deduced new relations from the existing relations in knowledge base using artificial
intelligence techniques (e.g., reasoning, planning). Semi-automated systems, on the other
hand, used simple and limited relations to provide simple service (e.g., dependency
tracing, change propagation management). General tools did not use formal
representation, but they provided the ability to store and retrieve free-text artifacts from a
database. Manual tools did not provide any computerized aids.
The degree of automation is closely related to the degree of the interaction
between human agents and intelligent agents. In fully-automated systems, intelligent
agents solve most problems and the interaction between human agents and intelligent
agents are not always necessary. In semi-automated systems, interaction is always
necessary because intelligent agents often propose potential solutions and then human
agents filter them out. The degree of interaction in general tools is similar to that in semi-
automated tools, but intelligent agents provide simple services (e.g., storing and retrieving
data) rather than higher decision services (e.g., potential solutions and advice). In manual
tools, human agents solve all problems without the help of intelligent agents.
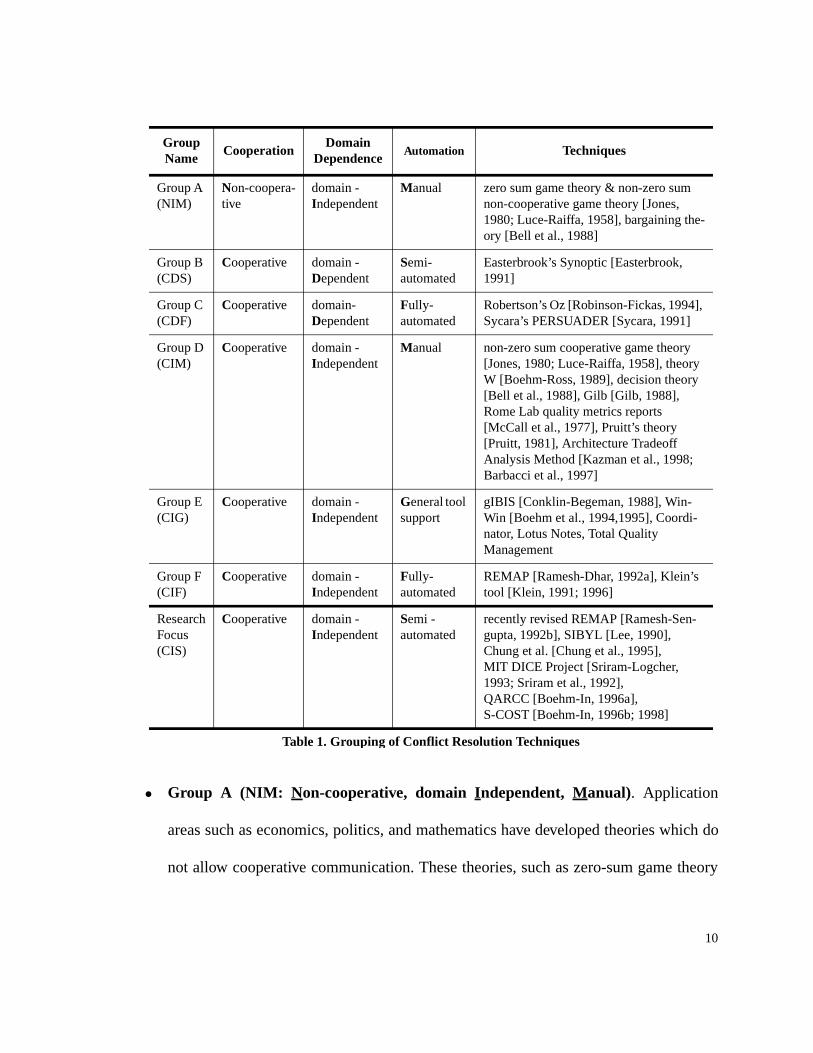
Table 1 shows the conflict resolution techniques grouped by their
aforementioned attributes.
10
• Group A (NIM: N on-cooperative, domain Independent, Manual). Application
areas such as economics, politics, and mathematics have developed theories which do
not allow cooperative communication. These theories, such as zero-sum game theory
Group Name
CooperationDomain
DependenceAutomation Techniques
Group A (NIM)
Non-coopera-tive
domain - Independent
Manual zero sum game theory & non-zero sum non-cooperative game theory [Jones, 1980; Luce-Raiffa, 1958], bargaining the-ory [Bell et al., 1988]
Group B(CDS)
Cooperative domain - Dependent
Semi- automated
Easterbrook’s Synoptic [Easterbrook, 1991]
Group C(CDF)
Cooperative domain-Dependent
Fully- automated
Robertson’s Oz [Robinson-Fickas, 1994], Sycara’s PERSUADER [Sycara, 1991]
Group D(CIM)
Cooperative domain - Independent
Manual non-zero sum cooperative game theory [Jones, 1980; Luce-Raiffa, 1958], theory W [Boehm-Ross, 1989], decision theory [Bell et al., 1988], Gilb [Gilb, 1988], Rome Lab quality metrics reports [McCall et al., 1977], Pruitt’s theory [Pruitt, 1981], Architecture Tradeoff Analysis Method [Kazman et al., 1998; Barbacci et al., 1997]
Group E (CIG)
Cooperative domain - Independent
General tool support
gIBIS [Conklin-Begeman, 1988], Win-Win [Boehm et al., 1994,1995], Coordi-nator, Lotus Notes, Total Quality Management
Group F(CIF)
Cooperative domain - Independent
Fully- automated
REMAP [Ramesh-Dhar, 1992a], Klein’s tool [Klein, 1991; 1996]
Research Focus(CIS)
Cooperative domain - Independent
Semi - automated
recently revised REMAP [Ramesh-Sen-gupta, 1992b], SIBYL [Lee, 1990], Chung et al. [Chung et al., 1995],MIT DICE Project [Sriram-Logcher, 1993; Sriram et al., 1992],QARCC [Boehm-In, 1996a], S-COST [Boehm-In, 1996b; 1998]
Table 1. Grouping of Conflict Resolution Techniques

11
[Jones, 1980, Luce-Raiffa, 1958] and bargaining theory [Bell et al., 1988], have very
limited uses in requirements engineering because everyone can lose if just one
stakeholder loses. Other non-cooperative theories in this group will not be explored
further. For example, building a product quickly and cheaply with very low assurance
may be a win for the customer and the developer, but a lose for the user. However,
everyone could be a loser eventually because the product could brake down so
frequently that nobody could use the product.
• Group B (CDS: Cooperative, domain Dependent, Semi-automated). Because of
the scalability problem in the fully automated approach (due to the amount of effort
required to formalize domains), Easterbrook’s Synoptic [Easterbrook, 1991] has
recently proposed to develop a semi-automated tool (Initially, he proposed a fully
automated tool). However, theories in this group still have the problem of general
applicability.
• Group C (CDF: Cooperative, domain Dependent, Fully automated). Many current
research projects such as Robertson’s Oz [Robinson-Fickas, 1994] and Sycara’s
PERSUADER [Sycara, 1991] focus on automated tools using domain dependent
knowledge. These research projects may eventually produce detailed methods for
conflict resolution, but they may face scalability problems due to the amount of effort
required to formalize domains as well as the problem of general applicability due to
the narrow domain focus.

12
• Group D (CIM: C ooperative, domain Independent, Manual). Theory W highlights
the importance of cooperation in the software development process. It provides a
formal framework of “Make everyone winners”. The quality metrics reports from
Rome Laboratory [McCall et al., 1977] and Gilb [Gilb, 1988] provide checklists of
quality attributes as well as capabilities and frameworks for specifying and assessing
desired attribute levels. However, these theories lack support tools beyond simple data
management, so that they cannot scale up in large projects. Other theories in this group
will not be explored further.
• Group E (CIG: Cooperative, domain Independent, General). Theories in this
group (e.g., gIBIS [Conklin-Begeman, 1988], WinWin [Boehm et al., 1994; 1995],
Coordinator, Lotus Notes, Total Quality Management) are no better than Group C or
Group F. In fact, they are perhaps worse due to the overhead associated with
unscalable human process. WinWin exercises indicate that conflict resolution
techniques require at the minimum semi-automated tools to be useful.
• Group F (CIF: C ooperative, domain Independent, Fully-automated). REMAP
[Ramesh-Dhar, 1992a] provided fully-automated mechanisms for maintaining change
propagation by reasoning with the dependencies among primitives, but could not
identify conflicts of design descriptions among the primitives automatically. The
overhead of capturing, representing, and reasoning human knowledge makes systems
in this group unscalable (e.g., REMAP [Ramesh-Dhar, 1992a]). REMAP [Ramesh-
Dhar, 1992a] was changed recently to a semi-automated system (in [Ramesh-
Sengupta, 1992b]) due to the above overhead.
13
2.2 Research Focus (CIS: Cooperative, domain Independent, Semi-
Automated)
Research in this group includes SIBYL [Lee, 1990], recently revised REMAP
[Ramesh-Sengupta, 1992b], and Chung et al.’s tool [Chung et al., 1995].
SIBYL [Lee, 1990] aims at helping users represent and manage the qualitative
aspects of the decision making process -- such as Alternatives being considered, Goals to
satisfy, and Arguments evaluating alternatives with respect to the Goals -- by providing a
representation language called “Decision Representation language (DRL)”. SIBYL
provides major types of services such as management of dependency, plausibility,
viewpoints, and precedents. The difference between SIBYL and our approach comes from
the conflict resolution frameworks and types of services based on the frameworks.
Decision Problems and Claims in DRL correspond to Issues in our approach, Alternatives
correspond to Options, and Goals correspond to Win Conditions. Note that Agreements,
which corresponds to requirements that all stakeholders agree, are not represented
explicitly in SIBYL. It is important to make Agreements explicit because Agreements
serve as an indicator of negotiation status as well as a negotiated result. Another general
difference is the number of relation types. SIBYL provides 16 DRL relations whereas ours
provide 4 relations. Even though those 16 relations for detailed-level formal descriptions
provides more automation services, the 16 relations make it difficult to learn, apply, and
manage for users. In WinWin usages, even 4 different relations (e.g., involves, addresses,
adopts, and covers) are confusing to learn, apply, and manage because of difficulties of
memorizing relation names. Thus, we determined a uniform naming scheme for relations

14
such as LinkToWinCondition, LinkToIssue, LinkToOption, and LinkToAgreements.
Practically, 16 relation types are too much for most users to handle.
Recently-revised REMAP [Ramesh-Sengupta, 1992b] aims to manage conflict
in design and management of large systems, as does our model. The REMAP model
provides primitives to represent various issues and alternatives by extending Issue Based
Information Systems (IBIS). Also, a general difference between REMAP and our model is
in the conflict resolution frameworks. Requirements in REMAP correspond to Win
Conditions in our negotiation framework, Issue corresponds to Issues, Position and
Argument correspond to Options, and Decision corresponds to Agreements. However
REMAP provides Assumption, Constraints, CE artifact, and their complex relations to
elaborate Argument and Decision. Thus, REMAP provides 8 different artifact types and
18 relation types. Again, 8 different artifact types and 18 relation types are difficult to
learn, apply, and manage.
Chung et al. [Chung et al., 1995] proposed a tool based on Non-Functional
Requirements (NFRs) to achieve conflicting goals by decomposing the goals, analyzing
design tradeoffs, rationalizing design decisions, and evaluating goal achievement. They
studied ways of systematically supporting evolution of the software system using an
historical record of the treatments of NFRs. Their frameworks are quite different from
SIBYL, REMAP, and ours. They focused on requirements traceability with more
emphasis on incorporating changes in NFRs -- systematically detecting defects and
supporting the process of corresponding changes in design and implementation -- rather
than the way of conflict resolution among different stakeholders. Thus, there is no

15
consideration of stakeholders who have different priorities and interests. Also, there is no
representation for Issues and Agreements explicitly. They primarily deal with the change
management using means-ends (alternatives-goals) linkages when the goals are changed.
Their tool is good for tracing determined design problems in terms of NFRs, but less good
for negotiating system design issues. Another drawback of their tool is that the
representation (e.g., alternatives-goals linkages) is difficult to scale up when dealing with
multiple attribute goals and stakeholders.
2.3 Comparison of Conflict Resolution Techniques
Table 2 shows analysis results of evaluating conflict resolution techniques
based on scalability, general applicability, and accuracy of results.
Figure 2 maps scalability against the degree of automation. The scalability is
low in fully automated and manual systems, medium in general systems, and high in semi-
Group Name
ScalabilityGeneral
Applicability Accuracy of Results
Group A Low High High if human has expert knowledge
Group B High Low Medium, but High after humans filter initial results
Group C Low Low High if the captured system knowledge is accurate and complete
Group D Low High High if human has expert knowledge
Group E Medium High High if human has expert knowledge
Group F Low High High if the captured system knowledge is accurate and complete
Research Focus
High High Medium, but High after humans filter initial results
Table 2. Summary of Evaluating Conflict Resolution Techniques

16
automated systems because the total workload is high in fully automated and manual
systems, medium in general systems, and low in semi-automated systems. The total
workload is determined by the combination of human-processing workload and computer-
processing workload. Computer-processing workload includes interpreting, reasoning,
and generating facts and rules in the system’s knowledge base. Semi-automated systems
have the best scalability because human-processing workload increases sharply from
semi-automated to manual systems and computer-processing workload increases sharply
from semi-automated to fully automated systems.
General applicability is related to the degree of domain dependency. Systems
based on domain independent knowledge are more general and applicable to various
domains, while systems based on domain dependent knowledge are not generally
applicable since they are more narrowly focused.
ManualGeneral semi-
automatedfully-automated
Figure 2. Scalability vs. the Degree of Automation
Scalability Workload
High
Low
Degree of Automation
Total workload
Human-processingworkload
Computer-processingworkload
Scalability
High
Low
tool support

17
The accuracy of results depends on the degree of automation. If project
personnel are experts in an application domain, high accuracy can be achieved even with
manual systems which have no computerized aids. Fully automated systems provide high
accuracy (i.e., good) in the results when the formalized knowledge and reasoning
algorithms are accurate. Semi-automated systems provide medium (i.e., reasonable)
accuracy of initial drafts suggested by the systems, but they provide high accuracy (i.e.,
good) in the results, where project personnel first filter the initial drafts suggested by the
systems.
Many AI researchers have focused on fully-automated systems (e.g., systems
in Group C or Group F) which provide low scalability. As a result, some researchers (e.g.,
REMAP [Ramesh-Sengupta, 1992b]) have changed their focus to semi-automated systems
which are in our current Research Focus. Initially, our research was focused on systems in
Group E to implement a theory developed in Group D in order to scale up conflict
negotiation process with general tool support. However, we changed our research focus to
investigate the systems that are cooperative, domain independent, and semi-automated
after experiments indicated that the scalability of systems in Group E was not satisfiable
for very large projects.
18
3.0 Context: WinWin and Conflict Resolution
Section 3.1 explains the USC-CSE WinWin system. The system provides a
general framework for identifying and resolving software-requirement conflicts by
drafting and negotiating artifacts such as win conditions, issues, options, and agreements.
Experience with the WinWin system shows that as the number of win conditions
increases, the stakeholders have more difficulty in identifying potential conflicts among
them. Section 3.2 addresses this scalability problem in detail.
3.1 WinWin
WinWin is a groupware support system for determining software requirements
as negotiated win conditions. WinWin is based on the WinWin Spiral Model (section
3.1.2) which uses Theory W (section 3.1.1) to generate objectives, constraints, and
alternatives. WinWin assists the stakeholders in identifying and resolving conflicts using
the WinWin Negotiation Model (section 3.1.3).
3.1.1 Theory W
The goal of Theory W [Boehm-Ross, 1989] is to “make everyone a winner.” At
first glance, this goal appears unattainable. Most situations tend to be zero-sum or win-
lose. For example, building a product quickly with little or no documentation may be a
low- cost, short-term win for the software developer and the customer, but the maintainer
and the user will lose because the lack of documentation makes the product unusable and
difficult to maintain. Another example is adding marginally useful software bells and

19
whistles to a product on a cost-plus contract. This may be a win for the developer and the
users whose whims have been satisfied, but the customer will lose due to increased cost.
It is important to avoid win-lose software situations, as they generally evolve
into lose-lose situations. An unusable system will not be a win for the developer or
customer. An unfinished, out-of-money system with many bells and whistles will not be a
win for the developer or user.
Even worse are software development projects which begin in a lose-lose state.
Setting unrealistic schedule expectations, staffing with incompatible people, poor
planning, or trying to catch up on an already late schedule by adding more people will
generally make losers out of all the participants.
Fortunately, win-win situations do exist, and they can often be created by
careful attention to the interests and expectations of the people involved in the software
development project. For example, providing a profit-sharing arrangement for a software
subcontractor provides the subcontractor with a motivation for developing a high quality,
widely sold product, which can increase the overall profit for both the subcontractor and
the original contractor.
3.1.2 WinWin Spiral Model
Figure 3 illustrates the Theory W extensions to the Spiral Model [Boehm et al.,
1995] that form the conceptual basis for WinWin. The additional two sectors in each spiral
cycle, “identify next-level stakeholders” and “identify stakeholders’ win conditions” along
with the “reconcile win conditions” portion of the third sector provide the collaborative

20
foundation for the model. They also provide the ability to answer the question, “Where do
the next-level objectives and constraints come from and how does one know they are the
correct ones?”, which was missing from the original Spiral Model. In addition, the refined
Spiral Model explicitly addresses the need for concurrent analysis, risk resolution,
definition, and elaboration of both the software product and the software process, based on
the Spiral Model extensions described in [Boehm et al., 1994].
1. Identify next-level stakeholders
2. Identify stakeholders’ win conditions
5. Define next level of product and process
6. Validate product and process definitions
7. Review, commitment
3. Reconcile win conditions. Establish next level objectives, constraints, alternatives.
4. Evaluate product and process alternatives. Resolve Risks.
Figure 3. The WinWin Spiral Model
21
3.1.3 WinWin Negotiation Model
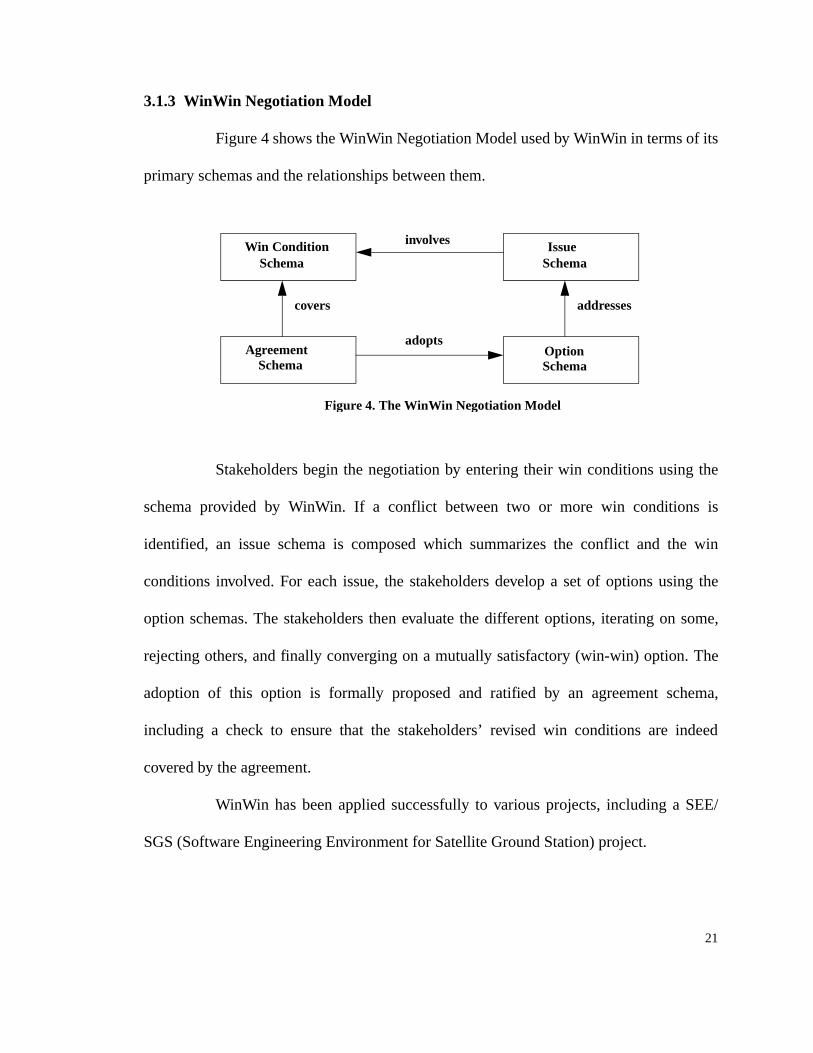
Figure 4 shows the WinWin Negotiation Model used by WinWin in terms of its
primary schemas and the relationships between them.
Stakeholders begin the negotiation by entering their win conditions using the
schema provided by WinWin. If a conflict between two or more win conditions is
identified, an issue schema is composed which summarizes the conflict and the win
conditions involved. For each issue, the stakeholders develop a set of options using the
option schemas. The stakeholders then evaluate the different options, iterating on some,
rejecting others, and finally converging on a mutually satisfactory (win-win) option. The
adoption of this option is formally proposed and ratified by an agreement schema,
including a check to ensure that the stakeholders’ revised win conditions are indeed
covered by the agreement.
WinWin has been applied successfully to various projects, including a SEE/
SGS (Software Engineering Environment for Satellite Ground Station) project.
Figure 4. The WinWin Negotiation Model
Win Condition Schema
Agreement Schema
Option Schema
Issue Schema
covers
adopts
addresses
involves

22
3.2 Scalability Problem in WinWin: Need for Semi-Automated
Assistance
The results of the SEE/SGS project, however, indicated that general tool
support like WinWin had some difficulties encountered in conflict identification and
resolution when the number of win conditions increased. Specific difficulties in conflict
identification included:
• Complicated conflict identification process. In large systems having several
dozen or more win conditions, it becomes increasingly more difficult to
compare win conditions to identify a conflict. For example, the SEE/SGS
project consisted of 21 win conditions, which could require up to 21 factorial
(21!) comparisons to identify all conflicts among them.
• Ambiguous relationships between quality attributes. It is not enough to say,
“there is a conflict between performance and evolvability.” Specific
explanations are necessary to understand why they conflicted with each other.
• Lack of knowledge about quality conflicts. Users and customers who lack
knowledge of computer systems have no idea of whether what they want is
feasible or not. A knowledge-based system would help these people address
feasibility issues.
In the context of WinWin, conflict resolution is the process of developing options and
negotiating the best one to reach an agreement. Specific difficulties in conflict resolution
include:

23
• Difficulties in coordinating multiple stakeholders’ interests and priorities.
Users feel that full functionality and ease of use are the most important
attributes. Customers usually focus more on the cost and schedule. Developers
are usually concerned with low project risk and easy maintenance. Finding a
middle ground among these requirements is difficult.
• Complicated dependencies and tradeoff analyses between quality attributes.
Every decision to improve some quality-attribute requirements may impact on
cost and schedule. Some decisions may not be compatible with others.
• Exponentially increasing option space. In order to resolve a cost conflict (e.g.,
budget overrun), complicated issues (e.g., Which functions should be reduced,
How much to get the project back on track, Which functions can be degraded in
terms of their quality attributes, and How much of the quality should be
degraded) should be considered.
Two alternative approaches for the conflict identification and resolution were considered.
These include:
• Fully manual approach. As indicated above, this approach requires a great deal
of effort to compare a large number of win conditions and is not practical.
• Fully automated approach. This approach also requires a great deal of effort to
formalize the knowledge about win conditions and agreements. Moreover, this
approach is not generally applicable across different domains and will require a
great deal of effort to reuse. The ambiguity of interpreting win conditions is
another difficulty.

24
Due to these difficulties, we have concluded that the semi-automated approach is
necessary to scale up WinWin in large domains. The next section will present the rationale
for focusing the research onto the semi-automated approach.

25
4.0 Solution Focus
The research focus for the semi-automated assistance of quality conflict
identification is explained in section 4.1, and the focus for the semi-automated assistance
of quality conflict resolution is explained in section 4.2.
4.1 Focus for Conflict Identification
The rationales for the solution focus (Figure 5) to implement semi-automated
assistance of conflict identification are:
1. Instead of analyzing the win condition bodies using formal methods or natural
language processing techniques, let stakeholders associate the win conditions with a
WinWin Domain Taxonomy tree using relation links.
2. Instead of identifying all kinds of conflicts (e.g., conflicts among infrastructure,
functional domain, quality-attribute requirements) in the taxonomy tree, just focus on
quality attribute conflicts because the knowledge for identifying quality attribute
conflicts is generally stable and it can be applied across multiple domains.
3. Instead of just saying, “A conflict between portability and performance is identified”,
build conflict identification models (e.g., quality attribute product and process
strategies) to identify the sources of conflicts and insights on how to resolve the
conflicts.
4. Instead of collecting, organizing, and summarizing the Quality Attribute Strategies
based on non-architecture concepts, focus on Architecture Strategies to reduce the gap
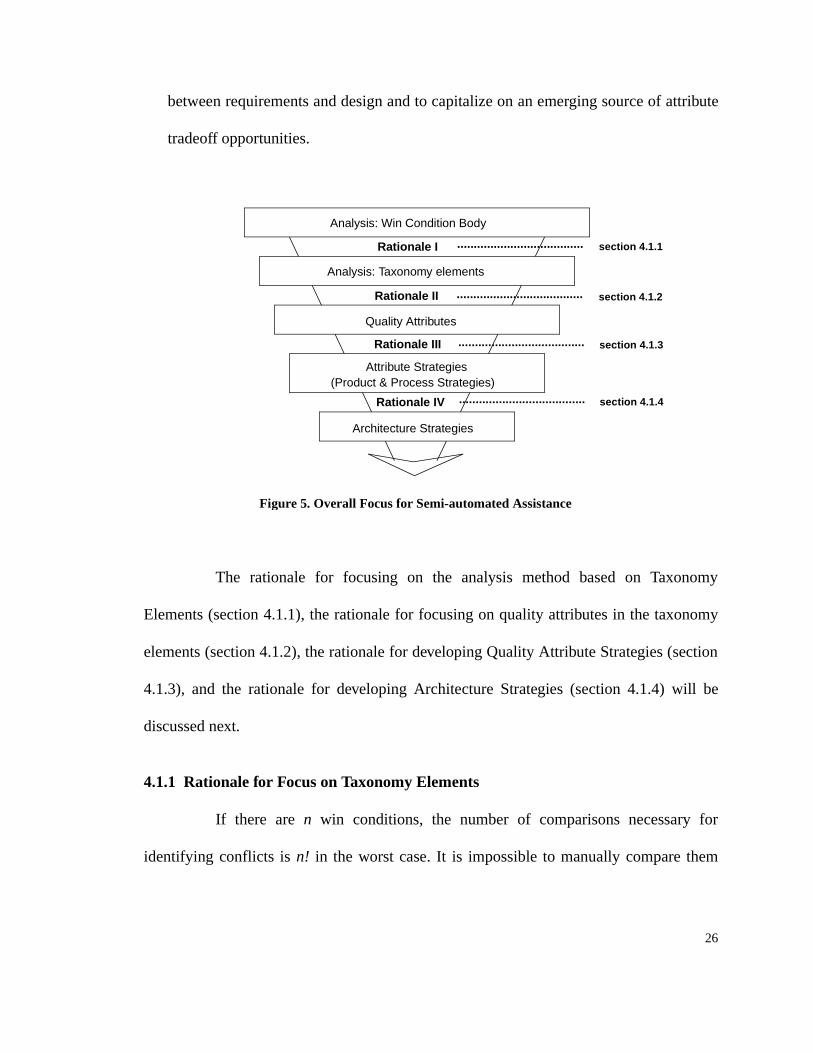
26
between requirements and design and to capitalize on an emerging source of attribute
tradeoff opportunities.
The rationale for focusing on the analysis method based on Taxonomy
Elements (section 4.1.1), the rationale for focusing on quality attributes in the taxonomy
elements (section 4.1.2), the rationale for developing Quality Attribute Strategies (section
4.1.3), and the rationale for developing Architecture Strategies (section 4.1.4) will be
discussed next.
4.1.1 Rationale for Focus on Taxonomy Elements
If there are n win conditions, the number of comparisons necessary for
identifying conflicts is n! in the worst case. It is impossible to manually compare them
Analysis: Win Condition Body
Analysis: Taxonomy elements
Quality Attributes
Architecture Strategies
Rationale I
Rationale II
Rationale III
Rationale IV
Attribute Strategies(Product & Process Strategies)
Figure 5. Overall Focus for Semi-automated Assistance
...................................... section 4.1.1
...................................... section 4.1.2
...................................... section 4.1.3
...................................... section 4.1.4

27
one-by-one if n is large. Grouping the win conditions appropriately is required. The
taxonomy in WinWin can be used for this purpose.
Each win condition can map into one or more associated WinWin Domain
Taxonomy elements in a tree structure. The conflict identification can be carried out by
comparing one taxonomy element (i.e, the associated group of win conditions) with
another rather than by comparing one win condition with another. It can reduce the
number of comparisons (i.e., comparison complexity) from n! to m! where m is the
number of Taxonomy elements (i.e., the number of the groups of win conditions). It is also
very useful to reduce the complexity in both manual-approaches and fully-automated
approaches. However, the semi-automated approach has some merits (summarized in table
3) according to criteria such as workload, scalability, accuracy of computer analysis,
granularity, and technology availability.
The analysis based on win condition bodies is more accurate than the analysis
based on the Taxonomy because the knowledge was formalized at a very detailed level
(low granularity). However, the drawbacks of this analysis are low scalability and high
workload. The analysis based on win condition bodies through natural language
processing is not our focus because the technology is not currently mature enough. The
analysis based on the Taxonomy has a lower associated workload and more scalability, but
the drawbacks are low accuracy and a high level of granularity (i.e., abstract level of
advice). However, the analysis based on the Taxonomy is better overall, in that the system
identifies conflicts initially, then human users take a look at a more detailed-level. This
balance provides a good combination of scalability and accuracy.

28
Criteria Analysis based on win condition BodyAnalysis based on
Taxonomy
Methods Human reads through and understands win condition bodies from beginning to end; Let human identify conflicts by the comparison of other win condition bodies.
Human formalizes win condition Bodies by a formal language; Let computer identify conflicts by AI reasoning techniques.
Computer perform natural language processing on win condition bodies and formalize them automatically; Let computer identify conflicts by AI reasoning techniques.
Attach win conditions into the Taxonomy tree; Let computer suggest potential conflicts to human based on the knowledge base. Then, the human determines whether the potential conflicts are significant or not; If significant, draft the issus which may be customized. Otherwise, cancel the issues.
Workload for human
High: due to the high numbers of comparisons and formalization overhead
High: due to a lot of efforts to translate bodies into formal language.
Low: due to work saving from automation of translation (when accurate)
Low: due to work saving from the linkage and filtering approach
Scalability Low: due to the human-processing overhead.
Low: if search space by rules and facts is increased exponentially
Low to Medium: depend on simplicity of domain, constraints on natural language.
High: due to the best combination between human-processing and computer-processing overhead
Accuracy of Computer Analysis
High: depend on the human expertise.
High: depend on the captured knowledge base and reasoning methods
Low to Medium: depend on simplicity of domain, constraints on natural language.
Medium: depend on the correctness and accuracy of linkage information
Granularity Very Specific level Specific level Specific level Abstract level
Technology Availability
High: Human experts are available
High: Most AI reasoning and plan technologies are available
Low: the art-of-state of Natural Language process is premature to understand common knowledge
High: tracing relationships among win condition and retrieving the matching resolution cases are easy technology to implement
Table 3. Rationale I: Analysis From Win Condition Body To Taxonomy Elements

29
4.1.2 Rationale for Focus on Quality Attribute Taxonomy Elements
Taxonomy Elements (Figure 6) can be divided into three areas such as
Infrastructure area, Domain area, and Attribute area.
We can build the knowledge base for identifying the conflicts among taxonomy
elements in all three areas, but it is difficult to satisfy the results of semi-automated
assistance. The reasons are shown in table 4. The symbols -- or ++ mean very high or very
low, -/+ means ‘depends on situation’.
SEE Elements
ProductEngineering tools
Product life cycle
Reqs.SpecDesign (Arch)
spec ToolsReuse Generation
Refine
Composition
DS Architecture
Architecture
Dev. Process
Support
Design Analysis
Simulation
Tradeoff Analysis
& Simulation
SEE Infrastructure
SEE
Integration tool:tool addition
Object Management
ConsistencyDomainModelingSEE Usage Support
Testing
Tools
SemanticModeling
has Attributes
has
part-of
part-of
has
Interface support
support
SEE-GEN:Product -Generator
Cost
Schedule
is-a
Assurance
Interoperability
product
ProcessSpecific
specific
Usability
Process Risk
User Network
API CM Performance
Evolvability&
Reusability
ProcessMgmt. Tools
Figure 6. Example of the WinWin Domain Taxonomy
Portability
Product Risk
Infrastructurearea
Domain area
Attribute area

30
The knowledge of the infrastructure area has high generality, low stability, and
very low precision in the results because the knowledge of infrastructure is updated
frequently, but it may have good generality for a popular infrastructure.
The knowledge of the domain area has i) low generality because domains are
different from application to application, ii) high stability because (most) domains are not
changed very often, and only small parts need to be maintained/updated, and iii)
‘situation-dependent’ precision in the results because of the difficulties which arise from
the generality problem.
The knowledge of the attribute area has i) very high generality because a
number of quality attribute studies have been carried out and the knowledge itself is
general, ii) high stability because the knowledge itself is not often changed, and iii)
‘situation-dependent’ precision in the results because of the way in which detailed
information is captured and how the ambiguous relationships among quality attributes are
dealt with.
This dissertation therefore focuses on the area of quality, because it has the best
prospects for supporting the development of a useful knowledge assistance tool due to the
very high generality and high stability.
Infrastructure area Domain area Attribute area
Generality + - ++
Stability - + ++
Precision of results - - - / + - / +
Table 4. Rationale II: Focusing on Taxonomy Elements

31
4.1.3 Rationale for Focus on Quality Attribute Strategies
The complex relationships among quality attributes make it often difficult to
identify conflicts among quality requirements. The purpose of Quality Attribute Strategies
is to provide concise descriptions of the ambiguous relationships among the quality
attributes.
Many researchers (e.g., [Boehm et al., 73], [McCall et al., 1977], [Lipow et al.,
1977], [Bowen et al., 1985], [Deutsch-Willis, 1988], [Dyson, 1991], [Schulmeyer-
McManus, 1992]) studied the relationship between quality attributes using only positive
and negative relations. Gillies [Gillies, 1992] tried to elaborate the relationship by adding
more relations between quality attributes. However, the positive/negative relationships are
insufficient to clarify the ambiguous relationship among quality attributes and to provide
the description language for the relationship. Kazman and Bass [Kazman-Bass, 1994b]
explored the relationship among quality attributes using design operations called “unit
operations”. They provided a useful first-order conflict analysis of the interaction between
quality attributes, even though their method of deriving architectures from requirements is
somewhat oversimplified. Our research focus, Quality Attribute Strategy, used this
concept and extended it with semi-formalized structure to provide a useful description
language for using tradeoff analysis.
Without a rationale based on Quality Attribute Strategies or their equivalent, it
is not helpful to say “Portability and Performance requirements may conflict with each
other.” In order to be helpful, the description based on the Quality Attribute Strategies
should be “Portability and Performance requirements may conflict with each other in the

32
sense that a layered architecture can be used to improve Portability, but it may degrade
system Performance due to the overhead of passing data and control across several
layers.”
Another benefit of the description based on the Quality Attribute Strategies is
that it provides insights for resolving quality conflicts by providing the reasons for the
quality conflicts. For example, the Quality Attribute Strategy for the conflict between
Portability and Performance requirements explains the causes of conflict such as i) layered
software architecture needs overhead to pass data/control from layer to layer; ii) use of
platform- or feature-specific instructions may increase the performance, but may have
porting problems with other platforms or systems; and iii) the independence of the
software environment (e.g., JAVA applications) can provide flexibility to port one system
to another at the expense of better performance in the software environment (e.g., Motif
applications in Unix are generally faster than JAVA applications).
4.1.4 Rationale for Focus on Architecture Strategies
There already exist many strategies developed for improving a quality attribute
(i.e., a part of Quality Attribute Strategies); see, for example, [Boehm et al., 73], [McCall
et al., 1977], and [Kazman-Bass, 1994b]. However these analyses tend to have very simple
relationships among quality attributes (e.g., using + or - to indicate conflict or
reinforcement) which is too simple to identify quality conflicts.
Software architecture is becoming an emerging and promising technique for
reducing the gaps between requirements and design by providing a language having mid-

33
level granularity between requirements and design. The rationale is that analyzing the
components, connectors, and constraints of software architecture provides a deeper
understanding of software-attribute tradeoffs.
4.2 Focus for Conflict Resolution
The quality attributes can be organized into a hierarchical tree. A number of
organizing principles for such trees have been developed in [Boehm et al., 73; Bowen et
al., 1985; Chung et al., 1995; Deutsch-Willis, 1988; Dyson, 1991; Gillies, 1992; Kahn-
Keller, 1990; Lipow et al., 1977; McCall et al., 1977; Vincent et al., 1988; Schulmeyer-
McManus, 1992]. For stakeholder win-win negotiation support, we have developed an
organizing principle based on the primary quality attribute concerns of stakeholders
[Boehm-In 1996a]. In this tree, Dependability, Interoperability, Usability, Performance,
Adaptability (i.e., Evolvability and Portability), Cost and Schedule, and Reusability are
considered as the top-level quality attributes. Each higher-level quality attribute has more
detailed-level quality attributes associated with it. For example, Reliability/Accuracy,
Correctness, Availability/survivability, Integrity, Security/privacy, and Safety are
associated with Dependability, a top-level quality.
This structure forms the foundation for the Quality Attribute Risk and Conflict
Consultant (QARCC) tool and its architecture-strategy analyses to be presented in section
5.0.

34
Dependability Interoperability Usability Performance (Evolvability & Cost &Schedule
Reliability/Accuracy
Availability/Survivability
Safety
Correctness
Integrity
Security/Privacy
InterfaceCompatibility
MissionOrientation
Comprehen-siveness
Controllability
Architecture Balance
ElementPerformance
Verifiability
Modifiability
ExpendabilityFlexibility
Maintainability/Debuggability
DevelopmentAffordability
DevelopmentTimeliness
Reusability
Reusable SW Assets
Key DevelopmentPersonnel
Scalability
Figure 7. Hierarchical Structure among Quality Attributes
Portability)
contributes-to
DevelopmentAdaptability

35
Part II: Contribution
In the following sections, I present my proposed theories, models, and their
support systems for identifying quality conflicts among requirements and resolve cost
conflicts by creating and negotiating conflict resolution options.
Applied Domain
Theories and Models Their Support System
Conflict Identification
Quality conflicts
• Hierarchy of Quality Attributes (section 5.1)
• Stakeholder/Quality Attribute Relationship Model (section 5.1)
• Quality Attribute Strategies: Produce and Process Strategies (section 5.2 & section 5.3)
• Architecture Strategies and their formalism (section 5.4)
QARCC(Quality Attribute Risk and Conflict Consultant)(section 7.2)
Conflict Resolution
Cost conflicts
• Theories for option creation through added dimensions (section 6.1)
• S-COST Resolution Option Strategies and their formalism (section 6.2 & section 6.3)
• Stakeholder/Option Strategies Relationship Model (section 6.4)
S-COST(Software Cost Option Strategy Tool)(section 7.3)
Table 5. Overview of the Proposed Theories, Models, and Their Support Tools

36
5.0 Conflict Identification Theories and Models for Quality Attributes
5.1 Overview of the Conflict Identification Models
The context and information available for analyzing quality-attribute conflicts
early in the life cycle come primarily from the prioritized requirements, as expressed by
different system stakeholders’ win condition schemas. The win condition schemas are
associated with the quality attribute taxonomy by the owners of the artifacts.
Each stakeholder has different concerns about quality attributes. For example,
Maintainers are primarily concerned with Evolvability and Portability, and only
marginally concerned with Development Affordability (i.e., Development Cost) and
Reusability, which tend to be primary concerns of Customers and Developers. As
indicated in the left-hand side of the knowledge base structure of Conflict Identification
Models (Figure 8), the structure of these first-order stakeholders concerns’ forms a part of
the Conflict Identification Models. This structure is capable of associating quality attribute
conflicts with the appropriate stakeholders, in order to flag potential concerns for the
stakeholders and to provide them with advice for resolving the concerns.
A quality attribute hierarchy is another part of the Conflict Identification
Models. It is similar to those in [Basili-Rombach, 1987], [Boehm et al., 1973], and
[McCall et al., 1977]. Its major difference is that the highest level of the hierarchy is
connected to stakeholders’ primary concerns for quality attributes.

37
The other major component of the models, shown in the right-hand side of
Figure 8, is a set of relationships between software architecture & process strategies and
their typical effects on quality attributes. For example, a layered architecture has a positive
influence on Portability due to its ability to hide platform dependencies of a layer, whereas
it has a negative influence on Performance because in-line machine dependent code may
be more efficient. Thus, using a layered architecture strategy to achieve Portability will
frequently cause a conflict with Performance objectives.
The following bullets describe the major components:
• Stakeholder Roles: The most frequent roles are User, Customer, Developer,
Maintainer, Interfacer, and General Public. Others could be Product Line Managers,
Testers, or Subcontractors. Complex systems may have more than one individual
comprising a role such as Users and Customers.
• First-Order Stakeholder Concerns and Primary Quality Attributes: The primary
attribute win conditions for each stakeholder’s role have been determined from
Stakeholder Roles
Figure 8. Knowledge Base Structure of Conflict Identification Models
PrimaryQualityAttributes
DetailedQualityAttributes
QualityAttributeStrategies- architecture- process
Strategy-AttributeRelations
Attributeelaboration
First-order
stakeholderconcerns
positively/negativelyinfluences
contributes-todirectly-concerns
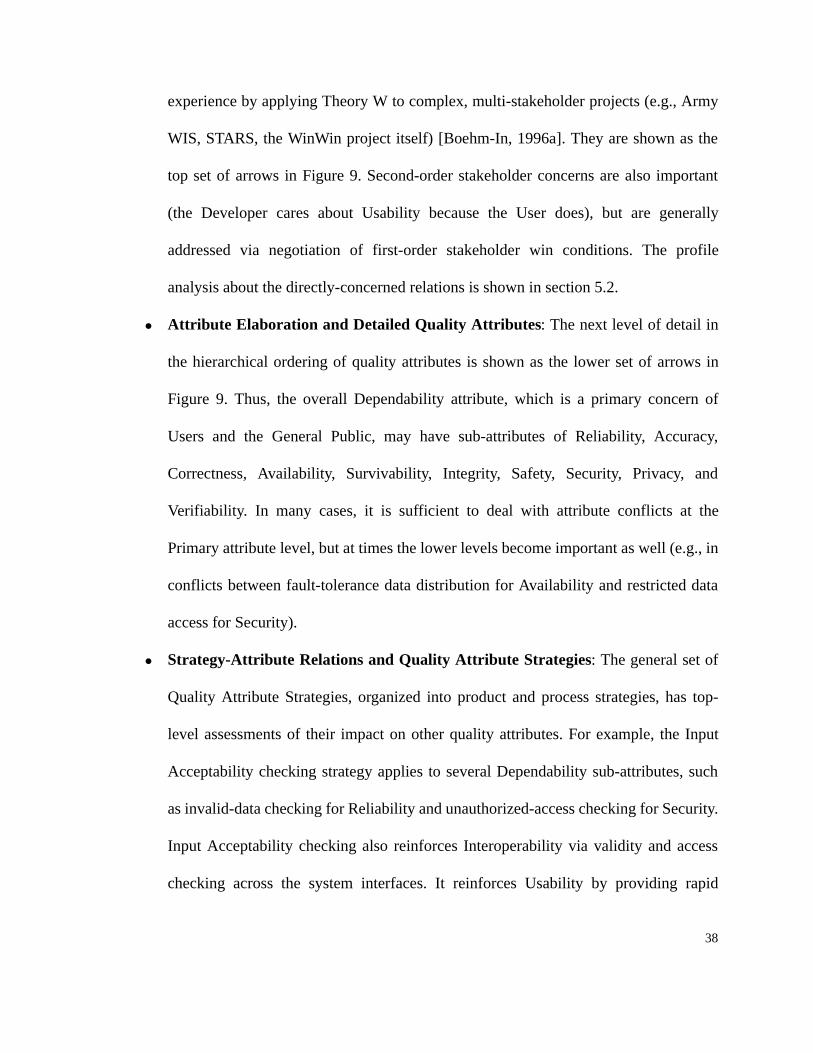
38
experience by applying Theory W to complex, multi-stakeholder projects (e.g., Army
WIS, STARS, the WinWin project itself) [Boehm-In, 1996a]. They are shown as the
top set of arrows in Figure 9. Second-order stakeholder concerns are also important
(the Developer cares about Usability because the User does), but are generally
addressed via negotiation of first-order stakeholder win conditions. The profile
analysis about the directly-concerned relations is shown in section 5.2.
• Attribute Elaboration and Detailed Quality Attributes : The next level of detail in
the hierarchical ordering of quality attributes is shown as the lower set of arrows in
Figure 9. Thus, the overall Dependability attribute, which is a primary concern of
Users and the General Public, may have sub-attributes of Reliability, Accuracy,
Correctness, Availability, Survivability, Integrity, Safety, Security, Privacy, and
Verifiability. In many cases, it is sufficient to deal with attribute conflicts at the
Primary attribute level, but at times the lower levels become important as well (e.g., in
conflicts between fault-tolerance data distribution for Availability and restricted data
access for Security).
• Strategy-Attribute Relations and Quality Attribute Strategies: The general set of
Quality Attribute Strategies, organized into product and process strategies, has top-
level assessments of their impact on other quality attributes. For example, the Input
Acceptability checking strategy applies to several Dependability sub-attributes, such
as invalid-data checking for Reliability and unauthorized-access checking for Security.
Input Acceptability checking also reinforces Interoperability via validity and access
checking across the system interfaces. It reinforces Usability by providing rapid
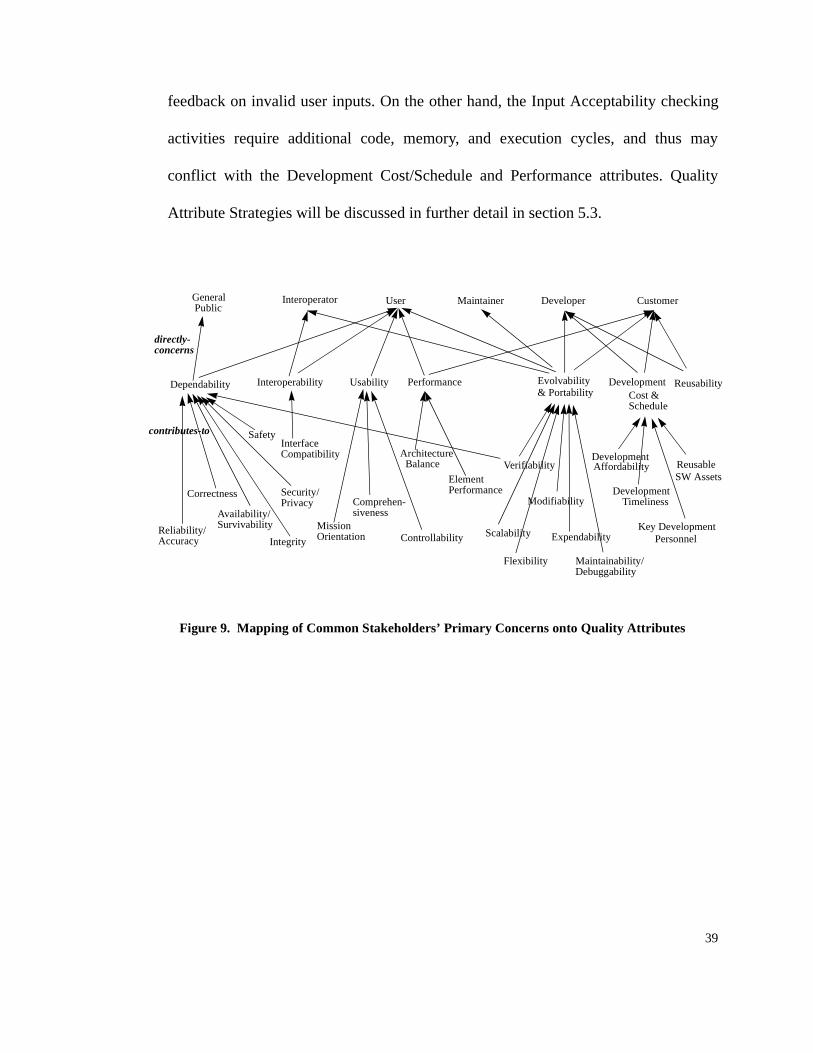
39
feedback on invalid user inputs. On the other hand, the Input Acceptability checking
activities require additional code, memory, and execution cycles, and thus may
conflict with the Development Cost/Schedule and Performance attributes. Quality
Attribute Strategies will be discussed in further detail in section 5.3.
General Public
Interoperator User Maintainer Developer Customer
Dependability Interoperability Usability Performance Evolvability Cost &Schedule
Reliability/Accuracy
Availability/Survivability
Safety
Correctness
Integrity
Security/Privacy
InterfaceCompatibility
MissionOrientation
Comprehen-siveness
Controllability
Architecture Balance
ElementPerformance
Verifiability
Modifiability
Expendability
Flexibility Maintainability/Debuggability
DevelopmentAffordability
DevelopmentTimeliness
Reusability
Reusable SW Assets
Key DevelopmentPersonnel
Scalability
Figure 9. Mapping of Common Stakeholders’ Primary Concerns onto Quality Attributes
& Portability
contributes-to
directly-concerns
Development

40
5.2 The Profile Analysis for Stakeholder/Quality Attribute
Relationships
Stakeholders may have different concerns and interests regarding quality
attributes. For example, Customers may be much more concerned with Cost rather than
with Schedule, or vice versa. Users may be much more concerned with Performance than
with Dependability, or vice versa. Overall, however, Customers’ primary concerns tend to
focus on such attributes as Cost and Schedule, while Users tend to be more directly
concerned about such attributes as Performance and Dependability.
Table 6 shows the relationship between stakeholders, their roles &
responsibilities, and the quality attributes with which they are concerned. Each
stakeholder has roles and primary responsibilities. This information can be used to infer
the primary and secondary quality attribute concerns of each stakeholder. A primary
quality attribute concern reflects those stakeholder's primary responsibilities. A secondary
quality attribute concern does not reflect those stakeholder’s primary responsibilities, but
it may indirectly cause problems in achieving the primary quality attribute concerns. For
example, Interoperability is a primary concern for the Interoperator because the
Interoperator’s roles and primary responsibilities are avoiding current and future interface
problems between the system and interoperating systems. However, Dependability and
Performance are secondary concerns to the interoperator because these concerns are not
necessarily related to stakeholder's primary roles and responsibilities (even though
improving Dependability and Performance can complicate interface problems).

41
In the WinWin experiment results of SEE/SGS (Software Engineering
Environment / Satellite Ground System), the profile analysis for the relationships between
the stakeholders (i.e., User, Developer, and Customer) and the quality attributes (i.e.,
Interoperability, Usability, Evolvability & Portability, Development Cost & Schedule, and
Reusability) is shown in Table 7. The profile was organized into the stakeholders’ roles,
the concerned quality attributes, their priorities, and the related win conditions.
Stakeholder Roles and Primary Responsibilities
Quality Attribute Concerns
Primary Secondary
General Public Avoid adverse system side-effects: safety, security / privacy.
Dependability Evolvability & Portability
Interoperator Avoid current and future interface problems between system and interoperating system
Interoperability, Evolvability & Portability
Dependability, Performance
User Execute cost-effective operational missions
Dependability, Interoperability, Usability, Performance, Evolvability & Portability
Development Schedule
Maintainer Avoid low utility due to obsolescence; Cost-effective product support after development
Evolvability & Portability Dependability
Developer Avoid nonverifiable, inflexible, nonreusable product; Avoid the delay of product delivery and cost overrun.
Evolvability & Portability, Development Cost & Schedule, Reusability
Dependability, Interoperability, Usability, Performance
Customer Avoid overrun budget and schedule; Avoid low utilization of the system
Development Cost & Schedule, Performance, Evolvability & Portability, Reusability
Dependability, Interoperability, Usability
Table 6. Stakeholder Roles / Quality Attribute Concerns Relationship

42
In this project, the product was a tailored extension of a commercial SEE to
support a family of SGS software systems. The customers would eventually use the SEE,
so all stakeholders would be concerned about tool interoperability in the SEE. Also, the
role of the SEE developer included the role of the maintainer as well. There were no win
conditions about Dependability and Performance, given that these are less critical for
SEE’s.
Thus, the proposed default set of relationships shown in Figure 9 is mostly the
same, but somewhat different from those in Table 7, given the somewhat different usage
of a SEE.
Stakeholders
Quality Attribute
User Customer Developer
# of artifacts Primary Concerns
# of artifacts
Primary Concerns
# of artifacts
Primary Concerns
Dependability 0 Yes 0 0
Interoperability 1 High* Yes 2 High 2 High
Usability (Functionality) 5 High; 2 Medium
Yes 0 0
Performance 0 Yes 0 Yes 0
Evolvability & Portability 1 Medium Yes 3 High Yes 1 High Yes
Cost & Schedule 0 4 High Yes 0 Yes
Reusability 0 0 Yes 1 High Yes
Table 7. Profile Analysis Results
* The priority of win condition

43
We concluded that the proposed default set of relationships shown in Figure 9
cannot be guaranteed to be applicable to all types of projects without changes. However,
the proposed default set of relationships is still useful because it will assist the
stakeholders in recognizing their default roles and responsibilities. The complexity of the
conflict identification and resolution process can be reduced by not sending the unrelated
and/or uninteresting quality-attribute conflict messages to the stakeholders who do not
want to receive them. For the flexibility of the relationships between the stakeholders and
the quality attributes, however, the model and/or the support system based on the
relationships should have the capability to change the default set of the relationships from
project to project.
5.3 Quality Attribute Strategies
A Quality Attribute Strategy is a design strategy for improving one or more
quality attribute(s) in software systems. The general set of Quality Attribute Strategies
(Table 8) is organized into the product and the process strategies. These strategies were
compiled from the major existing studies of software quality metrics and methods:
[Boehm et al., 73; Bowen et al., 1985; Chung et al., 1995; Deutsch-Willis, 1988; Dyson,
1991; Gilb, 1988; Gillies, 1992; Kahn-Keller, 1990; Kazman-Bass, 1994b; Lipow et al.,
1977; McCall et al., 1977; Vincent et al., 1988; Schulmeyer-McManus, 1992]. For
example, the product strategies for improving Dependability include Input Acceptability
Checking, Program and Data Redundancy, Backup and Recovery, Monitoring and

44
Control, and Accuracy Optimization. The Process strategies for improving Dependability
include Formal Specification and Verification, Failure Modes and Effects Analysis, and
various Test strategies.
However, due to the side effects of improving a particular quality attribute, the
Quality Attribute Strategies may have negative effects on some quality attributes.
For example, Input Acceptability Checking strategy applies to several
Dependability sub-attributes, such as invalid data checking for Reliability and
unauthorized-access checking for Security. Input Acceptability Checking also reinforces
Interoperability via validity and access checking across the system interfaces. It reinforces
Usability by providing rapid feedbacks on invalid user inputs. On the other hand, the
activities for Input Acceptability Checking require additional code, memory, and execution
cycles. Therefore, it may have a negative effect on Development Cost/Schedule and the
Performance.
Table 9 shows the summary of some Quality Attribute Strategies to improve
each quality attribute, including top-level assessments of their effect on other quality
attributes. The complete set of the strategies will be formulated and analyzed in the
Appendices.

45
Product Strategies Process Strategies
Dependability Accuracy Optimization, Backup/Recovery, Diagnostics, Error-reducing User Input/output, Fault-tolerance Functions, Input Acceptability Checking, Integrity Functions, Intrusion Detection & Handling, Layering, Modularity, Monitoring & Control, Redundancy
Failure Modes & Effects Analysis, Fault Tree Analysis, Formal Specification & Verification, Inspections, Penetration, Regression Test, Requirements/Design V & V, Stress Testing, Test Plans & Tools
Interoperability Generality, Integrity Functions, Interface Specification, Layering, Modularity, Self-containedness
Interface Change Control, Interface Definition Tools, Interoperator Involvement, Specification Verification
Usability Error-reducing User Input/output, Help/explanation, Modularity, Navigation, Parametrization, UI Consistency, UI Flexibility, Undo, User-programmability, User-tailoring
Prototyping, Usage Monitoring & Analysis, User Engineering, User Interface Tools, User Involvement
Performance Descoping, Domain Architecture-driven, Optimization (Code/ Algorithm), Platform-feature Exploitation
Benchmarking, Modeling, Performance Analysis, Prototyping, Simulation, Tuning, User Involvement
Adaptability (Evolvability / Portability)
Generality, Input Assertion/type Checking, Layering, Modularity, Parameterization, Self-containedness, Understandability, User-programmability, User-tailorability, Verifiability
Benchmarking, Maintainers & User Involvement, Portability Vector Specification, Prototyping, Requirement Growth Vector Specification & Verification
Development Cost / Schedule
Descoping, Domain Architecture-driven, Modularity, Reuse
Design To Cost/schedule, Early Error Elimination Tools And Techniques, Personnel/Management, Process Automation, Reuse-oriented Processes, User & Customer Involvement
Reusability Domain Architecture-driven, Portability Functions
Domain Architecting, Reuser Involvement, Reuse Vector Specification & Verification
All of Above Descoping, Domain Architecture-driven, Reuse (For Attributes Possessed By Reusable Assets)
Analysis, Continuous Process Improvement, Incentivization, Inspections, Personnel/Management Focus, Planning Focus, Requirement/design V&V, Review Emphases, Tool Focus, Total Quality Management
Table 8. Quality Attribute Product and Process Strategies: General
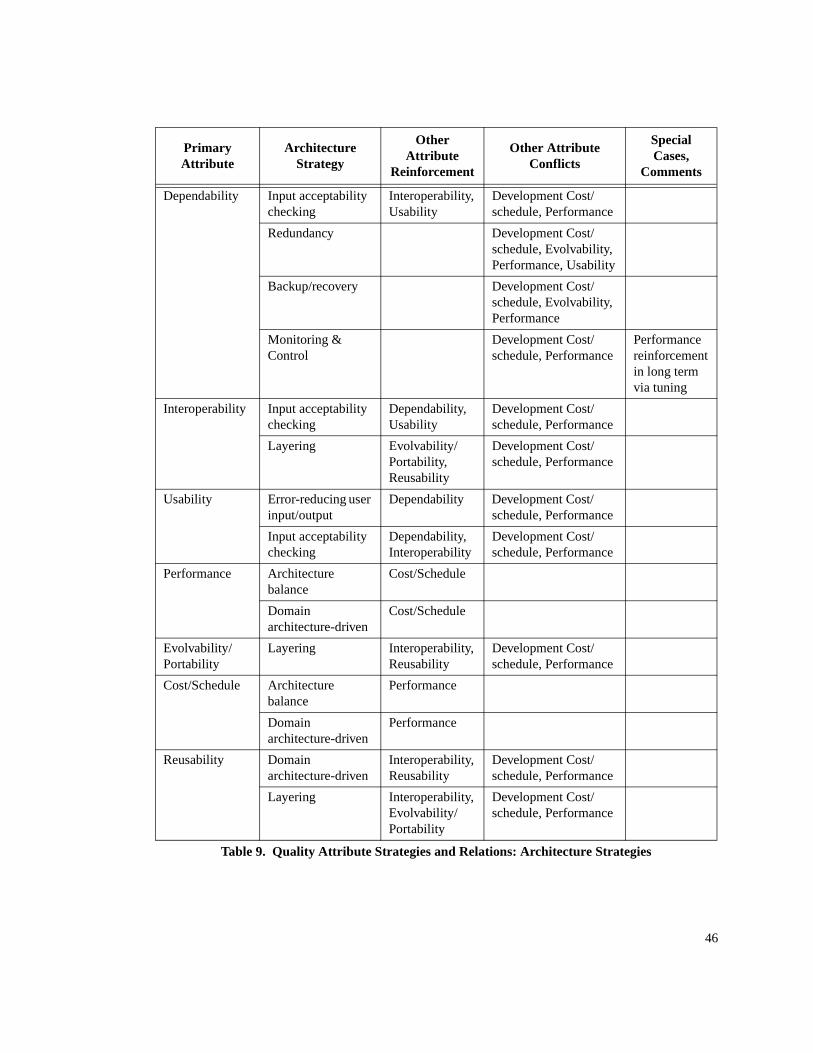
46
Primary Attribute
Architecture Strategy
Other Attribute
Reinforcement
Other Attribute Conflicts
Special Cases,
Comments
Dependability Input acceptability checking
Interoperability, Usability
Development Cost/schedule, Performance
Redundancy Development Cost/schedule, Evolvability, Performance, Usability
Backup/recovery Development Cost/schedule, Evolvability, Performance
Monitoring & Control
Development Cost/schedule, Performance
Performance reinforcement in long term via tuning
Interoperability Input acceptability checking
Dependability, Usability
Development Cost/schedule, Performance
Layering Evolvability/Portability, Reusability
Development Cost/schedule, Performance
Usability Error-reducing user input/output
Dependability Development Cost/schedule, Performance
Input acceptability checking
Dependability, Interoperability
Development Cost/schedule, Performance
Performance Architecture balance
Cost/Schedule
Domain architecture-driven
Cost/Schedule
Evolvability/Portability
Layering Interoperability, Reusability
Development Cost/schedule, Performance
Cost/Schedule Architecture balance
Performance
Domain architecture-driven
Performance
Reusability Domain architecture-driven
Interoperability, Reusability
Development Cost/schedule, Performance
Layering Interoperability, Evolvability/Portability
Development Cost/schedule, Performance
Table 9. Quality Attribute Strategies and Relations: Architecture Strategies

47
Using the positive and negative relationships between the Quality Attribute
Strategies and the quality attributes, the potential conflicts between Cost/Schedule (or
Performance) and other quality attributes (e.g., Dependability, Interoperability, and
Usability) could be deduced.
5.4 Architecture Strategies for Achieving Quality Attributes
An Architecture Strategy is a strategy for improving one (or more) quality
attribute(s) of a software system by imposing a particular set of software architecture
constraints. In the context of this dissertation, these terms are defined as follows:
• Strategy: a careful plan or method [Webster, 1993]
• Quality attributes of software: Dependability, Interoperability, Usability, Performance,
Evolvability, Portability, Reusability, Development Affordability and Timeliness (i.e.,
Development Cost/Schedule)
• Software architecture constraints: constraints among a software system’s components
(e.g., program or data elements) and connectors (e.g., interfaces among the
components)
In other words, an Architecture Strategy is a Quality Attribute Strategy which
imposes software architecture constraints. An Architecture Strategy provides a formal
structure for components, connectors, and their constraints. The formal structure helps
people understand software attribute tradeoffs more fully.

48
5.4.1 Formalization of the “Architecture Strategies”
The formal structure (Figure 10) of Architecture Strategies is composed of i) a
definition for each elementary strategy, ii) preconditions to check whether or not the
environments or situations are candidates for applying the strategies, iii) postconditions to
describe the results or actions after applying the strategies, and iv) effects on quality
attributes with rationale.
Three examples of Architecture Strategies are shown in Figure 11. For
example, the preconditions for Input Acceptability Check are sets of candidate inputs and
acceptability criteria. The postconditions for the strategy are: “if valid, pass the input into
the function; otherwise, indicate ‘Invalid Input’ and exit”. The effect on Dependability is
positive, while the effects on Performance, Development Cost/Schedule, and Evolvability
are negative.
<definition> ::= [ <diagram>] Definition: <string> <preconditions> ::= [ Precondition: <string> ]<postconditions> ::= [ Postcondition: <string> ]<effects> ::= [ { - <quality-attributes>: { ‘(’ (+ / -) [, <rationale-string>] ‘)’ } } ]
<quality-attributes> ::= { <quality-attribute> [, <quality-attribute>] }<quality-attribute> ::= Dependability | Interoperability | Usability | Performance |
Evolvability & Portability | Cost & Schedule | Reusability
Figure 10. Structure of Architecture Strategies for Quality Attributes

49
Example 1. Input Acceptability Check:
Definition: An architectural composition that precedes a function by an acceptability check of its inputsPreconditions:
Candidate inputs, acceptability criteriaPostconditions:
If valid, pass input into the function, otherwise, indicate “Invalid Input” and exit.Effects on quality attributes:
- Dependability: (+, unacceptable inputs filtered out)- Performance (-, input-check requires resources)- Development Cost, Schedule: (-, more to specify, develop, verify)- Evolvability: (-, more to modify)
Example 2. Layering
Definition: A hierarchical architectural composition in which each layer can communicate only with the adjacent upwards or downwards layer
Preconditions: Interface and protocol between a layer and an adjacent layer, request to pass data and/or control from layer to
layerPostconditions:
Data and/or control passed from layer to layer, or notification of interface/protocol violationEffects on quality attributes:
- Evolvability, Interoperability, Portability, Reusability: (+, hide sources of variation inside interface layers)- Performance (-, need more interfaces, and data and/or control transfers, via protocol)- Development Cost, Schedule: (-, more to specify, develop, verify)
Example 3. Monitoring & Control
Definition: An architectural composition that monitors the performance of function, controls the configuration or environment to stabilize the function (e.g., to avoid buffer overflows), and/or reports the result for subsequent performance analysis.
Preconditions: Monitoring instrumentation, control limits and algorithms.
Postconditions: If the function is stable, checks the performance and reports it, otherwise stabilizes the function by controlling
the configuration or environment. May also report predicted future undesirable states.Effects on quality attributes:
- Dependability: (+, avoids undesirable states)- Performance: (-, needs additional processing in short term; +, improves performance in long term via system
tuning- Timeliness, affordability: (-, more to specify, develop, verify)
Input Input AcceptabilityCheck
Function Output
Invalid Input
Layer II
Layer I
Layer III
Function
Monitoring
Input Output
Performanceanalysis
performance control
Figure 11. Three Examples of Architecture Strategies

50
5.4.2 Architecture Strategies and their Quality Attribute Tradeoffs
Based on the structure for the Architecture Strategies, Figure 12 shows an
example of how to identify potential quality conflicts, help stakeholders understand why
they conflict with each other, and support quality attribute tradeoff analysis for providing
better ideas to resolve these conflicts.
Associating a win condition with a quality attribute (say Q1) triggers a search
of the Architecture Strategies which have the positive and/or negative effects on Q1. For
example, the Portability attribute whose win condition is “portable to Windows” have
positive effects on the portability layers and separation of data generation and
presentation Attribute Strategies, but have negative effects on the use of fast platform-
dependent user interface features Attribute Strategy.
portability performance usability
portability layers separation of data generation
Use platform-dependent
user interface,
P N
N
P
P
P
efficiency features
and presentation
P
Customer wants the system to be portable to Windows
User wants touse Motif as GUIbecause of having experience
Win ConditionLevel
Quality
Level
AttributeStrategy
??
P : Positive EffectN : Negative Effect
*
Level
Attribute
Figure 12. Quality Attribute Tradeoff Analysis

51
The Architecture Strategies (e.g., use of fast platform-dependent user interface
features) which are found to have negative effects on the associated quality attribute (e.g.,
portability) are used to identify potential conflicts with the other quality attributes (e.g.,
performance and usability) on which the searched Architecture Strategies have positive
effects, or vice versa.
Stakeholders understand why portability and performance may conflict with
each other and their tradeoff relationships because the use of fast platform-dependent user
interface features can improve performance, but it may degrade portability.
Figure 13 shows a generalized algorithm for qualify conflict identification with
the example shown in Figure 12.
Note that the algorithm shown in Figure 13 can identify potential attribute win
conditions which did not exist in the current knowledge base, but are necessary. The
algorithm used the information of the taxonomy links between win conditions and quality
attribute taxonomy elements. If the conflict identified by positive-negative or negative-
positive relationships contains a quality attribute which has no taxonomy link to a win
condition, then the message of missing the win condition for the quality attribute is sent to
directly-concerned stakeholders.
5.4.3 Elaboration of Architecture Strategies
In order to resolve the identified conflict by the algorithm, however, situation-
specific information is necessary for the more detailed tradeoff analysis. For the
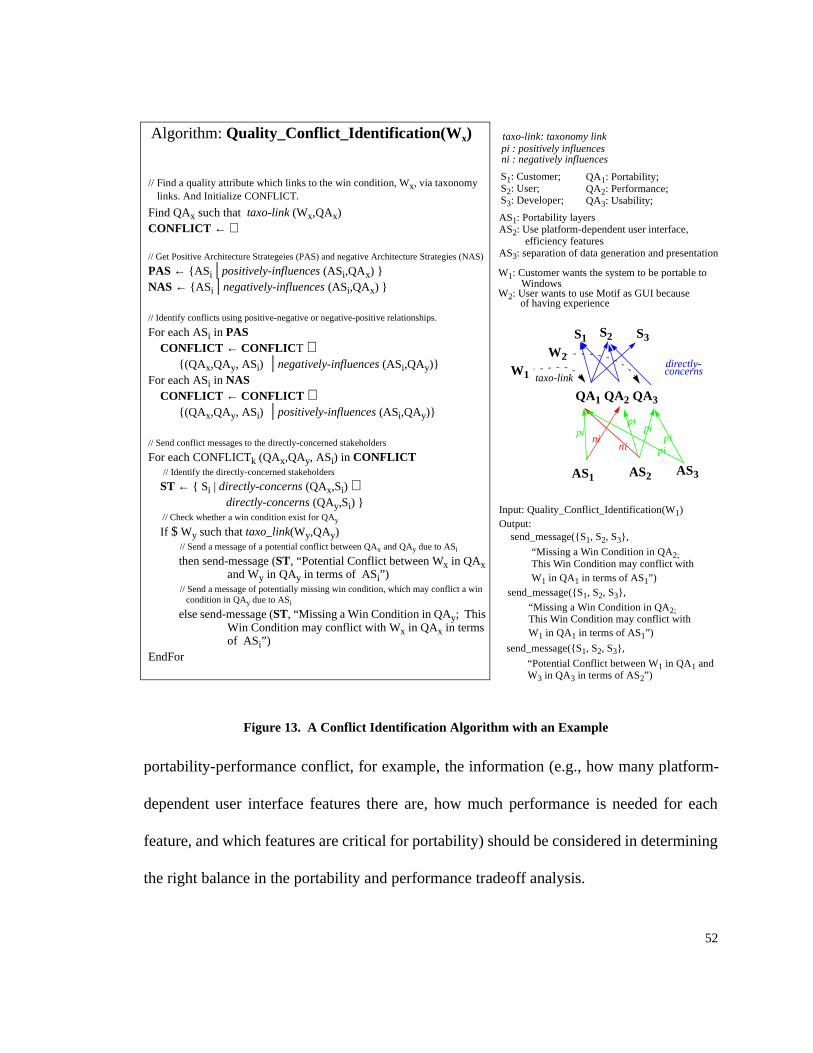
52
portability-performance conflict, for example, the information (e.g., how many platform-
dependent user interface features there are, how much performance is needed for each
feature, and which features are critical for portability) should be considered in determining
the right balance in the portability and performance tradeoff analysis.
Algorithm: Quality_Conflict_Identification(W x)
// Find a quality attribute which links to the win condition, Wx, via taxonomy links. And Initialize CONFLICT.
Find QAx such that taxo-link (Wx,QAx)CONFLICT ← ∅
// Get Positive Architecture Strategeies (PAS) and negative Architecture Strategies (NAS)
PAS ← {ASi | positively-influences (ASi,QAx) }NAS ← {ASi | negatively-influences (ASi,QAx) }
// Identify conflicts using positive-negative or negative-positive relationships.
For each ASi in PASCONFLICT ← CONFLIC T ∪
{(QA x,QAy, ASi) | negatively-influences (ASi,QAy)}For each ASi in NAS
CONFLICT ← CONFLICT ∪{(QA x,QAy, ASi) | positively-influences (ASi,QAy)}
// Send conflict messages to the directly-concerned stakeholders
For each CONFLICTk (QAx,QAy, ASi) in CONFLICT// Identify the directly-concerned stakeholders
ST ← { Si | directly-concerns (QAx,Si) ∨ directly-concerns (QAy,Si) }
// Check whether a win condition exist for QAy
If $ Wy such that taxo_link(Wy,QAy)// Send a message of a potential conflict between QAx and QAy due to ASi
then send-message (ST, “Potential Conflict between Wx in QAx and Wy in QAy in terms of ASi”)
// Send a message of potentially missing win condition, which may conflict a win condition in QAy due to ASi
else send-message (ST, “Missing a Win Condition in QAy; This Win Condition may conflict with Wx in QAx in terms of ASi”)
EndFor
S1
QA1 QA2 QA3
AS1
directly-
pini
pi
W1 taxo-link
W2
S2 S3
concerns
AS2 AS3
nipi
pi
pi
Input: Quality_Conflict_Identification(W1)Output:
send_message({S1, S2, S3},
“Missing a Win Condition in QA2; This Win Condition may conflict with
pi : positively influencesni : negatively influences
S1: Customer; QA1: Portability; S2: User; S3: Developer;
QA2: Performance; QA3: Usability;
AS1: Portability layersAS2: Use platform-dependent user interface,
efficiency featuresAS3: separation of data generation and presentation
W1: Customer wants the system to be portable toWindows
W2: User wants to use Motif as GUI becauseof having experience
taxo-link: taxonomy link
Figure 13. A Conflict Identification Algorithm with an Example
send_message({S1, S2, S3},
“Potential Conflict between W1 in QA1 andW3 in QA3 in terms of AS2”)
W1 in QA1 in terms of AS1”)send_message({S1, S2, S3},
“Missing a Win Condition in QA2; This Win Condition may conflict with W1 in QA1 in terms of AS1”)
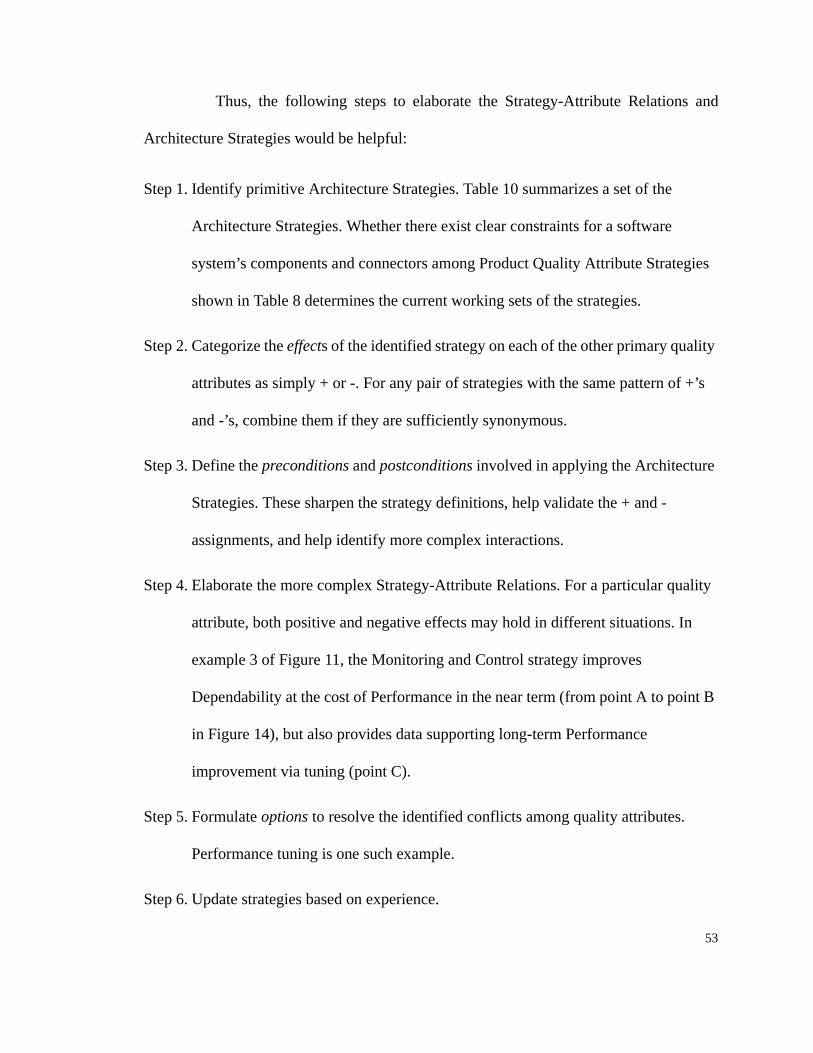
53
Thus, the following steps to elaborate the Strategy-Attribute Relations and
Architecture Strategies would be helpful:
Step 1. Identify primitive Architecture Strategies. Table 10 summarizes a set of the
Architecture Strategies. Whether there exist clear constraints for a software
system’s components and connectors among Product Quality Attribute Strategies
shown in Table 8 determines the current working sets of the strategies.
Step 2. Categorize the effects of the identified strategy on each of the other primary quality
attributes as simply + or -. For any pair of strategies with the same pattern of +’s
and -’s, combine them if they are sufficiently synonymous.
Step 3. Define the preconditions and postconditions involved in applying the Architecture
Strategies. These sharpen the strategy definitions, help validate the + and -
assignments, and help identify more complex interactions.
Step 4. Elaborate the more complex Strategy-Attribute Relations. For a particular quality
attribute, both positive and negative effects may hold in different situations. In
example 3 of Figure 11, the Monitoring and Control strategy improves
Dependability at the cost of Performance in the near term (from point A to point B
in Figure 14), but also provides data supporting long-term Performance
improvement via tuning (point C).
Step 5. Formulate options to resolve the identified conflicts among quality attributes.
Performance tuning is one such example.
Step 6. Update strategies based on experience.

54
Architecture Strategies
Dependability Assurance Monitoring & Control, Diagnostics, Fault-tolerance Functions, Input Acceptability Checking, Intrusion detection & handling, Redundancy
Interoperability Layering
Usability Error-reducing User Input/output
Performance Architecture Balance, Performance Monitoring & Control, Pipelining
Adaptability (Evolvability / Portability)
Change-source Hiding, Input Assertion/type Checking, Layering
Reusability Domain Architecture-driven
Table 10. Architecture Strategies
Dependability
Performance
MinimalMonitoring & Control (M&C)
M&C data also used to find and fixperformance bottlenecks
Figure 14. Performance/Dependability trades via Monitoring & Control strategy
ExtensiveM&C
A
BC
In the near term
In the long term

55
6.0 Conflict Resolution Theories and Models for Quality Attributes
6.1 Option Creation Through Added Dimensions.
6.1.1 WinWin Conflict Resolution as the Problem Space View Model
Lee [Lee, 1996] developed a formal model for the WinWin requirements
engineering process called the “Problem Space View”, which defines a win condition as a
constraint on the space R of all requirements specifications r. Each point r in R consists of
a set of functional, infrastructure, and quality attribute specifications. In the model, a
conflict is defined as a set of win conditions whose win regions have an empty intersection
(the bottom space in Figure 15). She addressed that the conflict could be resolved by
expanding stakeholders’ win condition area (called “satisfactory area”). However, she
didn’t address the way of expanding their win conditions.
Based on the formal model, I propose a theory for resolving conflicts by option
creation through added dimensions. The conflict in the n dimension space (the bottom
space in Figure 15) can be resolved in the space of the n+1st dimension (the top space in
Figure 15) by expanding stakeholders’ win conditions due to the added dimension (called
“option strategy”).

56
An example of a conflict situation in n dimension space is shown in Figure 16.
The User’s win condition, W(U)1, consists of more than 15 functions, but the Customer’s
win condition, W(C)1, is that the development cost should be less than $4M. The
Developer’s win condition, W(D)1, is a reasonable expectation of work and reward (i.e.,
not too much work and not too little income) as estimated by a cost estimation model such
as COCOMO [Boehm, 1981]. For the example, we assume for simplicity that each
function costs $300K to develop. Figure 16 shows that there is no WinWin area to satisfy
all stakeholders’ constraints because the cost for implementing the 15 functions is
estimated to be $4.5M.
Add n+1 st
dimension
no User, Developer,Customer win regions([Lee, 1996])
space for n dimension
WinWin regioncreated
WUWC
WD
W’U W’
C
W’D
Figure 15. Conflict Resolution Through Added Dimensions

57
The following steps, which were used in solving the decision problem with
constraints in [Boehm, 1981], represent the cost conflict situation more specifically:
1. Define objective:
• Find the WinWin region (i.e., region which satisfies all constraint win
conditions)
2. Define decision variables:
• x1: cost;
• x2: # of functions
3. Define constraints according to each win condition:
• g1(x1, x2): x1 <= $4M
• g2(x1, x2): x2 >= 15
• g3(x1, x2): x1 <= 300K * x2 (= our assumption for simplicity)
W(C)1: <=$4M# of Functions
Cost
W(U)1:
W(D)1:
$4M
15
>= 15 func.
Cost Estimation
: WinWin Area
Figure 16. Conflict Situation in the Problem Space View Model

58
4. Identify the WinWin region (the satisfactory area for all stakeholders):
• No WinWin region (i.e., conflict)
5. Identify the WinWin point (the most satisfactory point for all stakeholders among the
WinWin region) if the WinWin region exists.
6.1.2 Conflict Resolution Process by Option Creation through Added Dimensions
Figure 17 shows an example of resolving the cost conflict situation presented
in section 6.1.1. The cost conflict situation shown in Figure 16 can be represented in the
bottom space in Figure 17. The cost conflict can be resolved by creating an option, reuse
existing software assets which perform some of the 15 functions, which is generated by an
added dimension, “reuse of software assets (%)”. The reuse of software assets can reduce
development cost without reducing the number of functions the User wants to implement.
This conflict resolution situation is shown in upper space in Figure 17. One of the
assumptions for simplicity is that complete reuse saves the total development cost. Thus,
reusing 3 functions (20% of 15 functions) saves $900K and reduces the cost to an
affordable $3.6M.

59
Using the steps to represent cost conflict shown in section 6.1.1, the conflict
resolution process by option creation through added dimension also can be represented
more specifically by the following steps:
1. Define objective:
• Find the WinWin region
2. Define decision variables:
• x1: cost
• x2: # of functions
W(C)1: <=$4M
Cost
W(U)1:
W(D)1:
15
>= 15 func.
reasonable
Figure 17. An Example of Cost Conflict Resolution Through Added Dimensions
cost estimation
WinWinregion
no winregion
3 functions
# of reused functions (%)
W(U)1
W(D)1
W(C)1
$4M
# of functions
# of functions
Cost
$4.5M
$3.6M $4M(20%)

60
3. Define constraints:
• g1(x1, x2): x1 <= $4M
• g2(x1, x2): x2 >= 15
• g3(x1, x2): x1 <= $300K * x2
4. If there is no WinWin area (i.e., conflict), add an additional dimension, for example,
x3(= # functions covered by reuse of software assets).
• g1(x1, x2, x3): x1 <= $4M
• g2(x1, x2, x3): x2 >= 15
• g3’(x1, x2, x3): x1 <= $300K * (x2 - x3)
5. Identify the WinWin region (the satisfactory area for all stakeholders):
• x1 <= $4M; x2 <= 15; 2 <= x3 <= 3 (the blank area in Figure 17)
6. Identify the WinWin value (the most satisfactory point for all stakeholders among the
WinWin region) if the WinWin region exists.
• This step will be discussed in section 6.1.3.
Step 4 above (i.e., option creation process) can be elaborated upon in Figure
18. The input of the option creation process is a set of constraints (e.g., g1, g2, and g3
shown in step 3) from win conditions, which have conflicts with each other. In other
words, there is no requirements (i.e., no win-win region) which satisfy the set of
constraints. If possible, the option creation process outputs a set of adjusted constraints
(e.g., g1, g2, and g3’ shown in step 4) as a conflict resolution option after all potential

61
dimensions are applied into the conflicting set of constraints in order to create win-win
region. Otherwise, an empty set is produced, which means that there exists no set of
constraints for a win-win region.
The proposed dimensions depend on types of conflicts. Typically, there are
proposed dimensions for a specific type of conflict. For example, reducing/deferring
functionality, reducing/deferring quality, relaxing schedule constraints, improving
personnel capability, improving tools and platform, reusing software assets, and
increasing budget are typical means of resolving cost conflicts. It is worth while to
formalize the dimensions (i.e., cost-resolution options), map them into a knowledge base,
and make them available across multiple projects. These potential dimensions for cost
Consider an additional dimension to resolve the conflict
Apply the dimension(Create alternatives or options)
return the options
yes
Figure 18. Overview of Conflict Resolution Process
Can the optionsresolve the conflict?
no
Is there an additionaldimension to be considered?
yes
no
Start
return an empty set, ∅,as WinWin Solutionas no WinWin Solution

62
conflict resolution were formalized (section 6.2 and section 6.3). Also, a generalized tool
based on the knowledge base of the formalized dimensions was developed (section 7.3).
A condition for applying the conflict resolution process shown in Figure 18 is
that there exists “no win-win region” (i.e., conflict) which satisfies all stakeholders’
constraints in terms of win conditions. Lee [Lee, 1996] proposed the formal notation for
the win-win region.
Using the above formal notation and theory, the conditions for applying the
conflict resolution process to enable higher-dimension win-win solutions are developed
(Figure 19).
Condition-1, that the conflict cannot be resolved in existing n-dimension
space, is a signal to consider using an additional dimension to resolve the conflict.
Condition-2 investigates an additional dimension which can increase stakeholder’s utility.
If there is no such additional dimension, an empty set (i.e., no win-win solution) is
returned as shown in Figure 18. In a USC-UCLA football game, for example, there is no
consolation prize which makes loss of the game preferable. If there is such an additional
dimension, Condition-3 can be considered to reduce win region gap by the utility added in
the higher dimension. Simultaneously, Condition-4 should be considered to avoid
reducing win regions for other stakeholders by the utility added in the higher dimension.
Ws = { x1,...,xn | US(x1,...,xn) > 0 } (which is adapted from [Lee 1996])
such that x1,...,xn : constraints (i.e., n-dimension),S : stakeholders,US(x1,...,xn) : stakeholder S’s utility (must be > 0 for win)

63
A more formalized algorithm of option creation through added dimension is
shown in Figure 20. However, the algorithm is only applicable to following problems: i)
how to determine the added dimensions for option creation, ii) how to get a set of
constraints adjusted by a dimension value, iii) how to deal with concurrent process
Condition-1: No win-win solution in existing n-dimensional space
x1,...,xn: US(x1,...,xn) > 0, for all stakeholders, S
Condition-2: An additional dimension exists which provides added utility to
stakeholders.
S, xd : US(x1, ..., xn, xd) > US(x1,...,xn)
Condition-3: The utility added in the higher dimension has the potential to bridge
the win-region gap.
S0, x1,...,xn, xd :US0(x1, ..., xn, xd) > 0
US(x1,...,xn) > 0, S ≠ S0
Condition-4: The extra dimension does not adversely reduce win regions for other
stakeholders.
S0, x1, ..., xn, xd, S’ :US0(x1, ..., xn, xd) > 0
US’ (x1, ..., xn, xd) < 0
∃
∃
∃
∃
Figure 19. Beginning of Theory: Conditions Enabling Higher-Dimension Win-Win Solutions

64
(synchronization problem), and iv) what to do if all potential dimensions could not resolve
the conflict.
6.1.3 Determining the WinWin Value
One of the problems in the conflict resolution process is how to determine a
particular recommended WinWin value among the WinWin region. Unlike determining an
optimal value in the classic decision problems [Boehm, 1981], each stakeholder may have
different objective functions of their own, which make it difficult to determine a single
agreeable WinWin value (i.e., the optimal value in [Boehm, 1981]) for all the
stakeholders. For example, suppose that the stakeholders’ objective functions shown in
Figure 21 are the following:
• For User: To maximize the number of functions within the WinWin region
• For Customer: To minimize the development cost within the WinWin region
• For Developer: To maximize the development cost (i.e., income for Developer) and to
minimize the number of functions (i.e., little work for Developer) concurrently.

65
Algorithm: WinWin_Option_Creation (CONST)
// Determine a set of dimensions which help conflict be resolved by relaxation of some constraints in CONSTDIM ← {dj | dj is a potential dimension to release some constraints in CONST}
// Consider each dimension in DIMFor each DIMi in DIM
// Picp up a set of representive values in the considered dimension and save it into DV.DV ← {DV j | DVj is a representive value of DIMi}
// Consider each representive value in DVFor each DVj in DV
// Adjust a set of constraints with the representive value, DVj, and save it AdjustedCONST.AdjustedCONST ← Adjust_Constraints (DVj, CONST)
// Determine requirements which satisfy the adjusted constraints. Save them into AdjustedWWR If there is no such requirements (i.e., conflicts), the AdjustedWWR becomes a empty set, ∅.
AdjustedWWR ← {r k | a requirement, rk, satisfies AdjustedCONST}
// If there are requirements (i.e., WinWin option), then return the requirements as WinWin option and exit.If AdjustedWWR ≠ ∅ then
return AdjustedWWREndFor
EndFor
// return an empty set (i.e., there is no WinWin option among inputed constraints, CONST).return ∅
// return a set of constraints adjusted from a set of constraints, CONST, in a value of added dimension, DVj
SubAlgorithm: Adjust_Constraints (DVj, CONST)
ReturnedCONST ← ∅For each CONSTi in CONST
// If a constraint, CONSTi, is affected by a dimension value, DVj, adjust the constraint with the value and add it into ReturnedCONST. For example, a constraint which was shown in the step 3 on page 59, g3(X1,X2): X1 <= $300K * X2, was adjusted into g3’(X 1,X2): X1 <= $300K * X2 - $25K * X3 shown in step 4 on page 59, such that X1 = development cost ($), X2 = # of functions, and X3 = reuse of software (%).
If DV j is a value of the dependent variable for CONSTiAdjustedCONST ← Adjust CONSTi by DVjReturnedCONST ← ReturnedCONST ∪ {AdjustedCONST}
// If a constraint, CONSTi, is not affected by a dimension value, DVj, add the constraint into ReturnedCONST without any change.
elseReturnedCONST ← ReturnedCONST ∪ {CONSTi}
EndForreturn ReturnedCONST
Figure 20. An Algorithm of Conflict Resolution by Option Creation Through Added Dimensions

66
The potential WinWin value is point A for the User, point B for the Customer,
and point C for the developer. It is difficult to determine a WinWin value which satisfies
all stakeholders concurrently.
From the viewpoint of risk management, the potential optimal value is
somewhere in the middle within the WinWin region rather than the edge of the WinWin
region for the following reasons:
• The point A has a risk of cost overrun because of uncertainties of cost estimation.
• The point B has a risk of not using the software for users due to low capabilities of the
software, and
• The point C has a risk of losing the contract for the next project if another vendor
offers lower cost or more functionality
Another approach to determine the optimal WinWin value is the addition of
more constraints, so that the WinWin region is reduced, and risk management techniques
are applied to sharpen the WinWin region.
W(C)1
Cost
OFcustomer
OFdeveloper
OFuser
W(D)1
W(U)1
B C
A
Figure 21. Determining the WinWin Value
# of functions
WinWin Area
* OF: Objective Function; A,B,C: Optimal values for each stakeholder
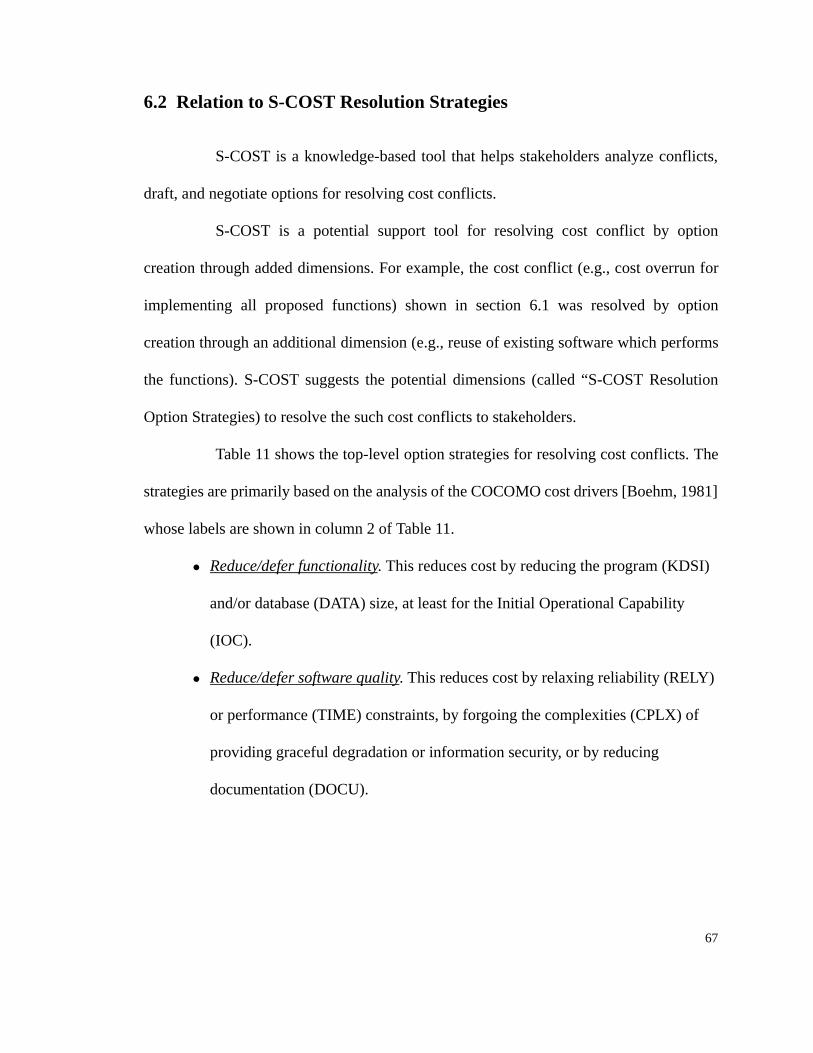
67
6.2 Relation to S-COST Resolution Strategies
S-COST is a knowledge-based tool that helps stakeholders analyze conflicts,
draft, and negotiate options for resolving cost conflicts.
S-COST is a potential support tool for resolving cost conflict by option
creation through added dimensions. For example, the cost conflict (e.g., cost overrun for
implementing all proposed functions) shown in section 6.1 was resolved by option
creation through an additional dimension (e.g., reuse of existing software which performs
the functions). S-COST suggests the potential dimensions (called “S-COST Resolution
Option Strategies) to resolve the such cost conflicts to stakeholders.
Table 11 shows the top-level option strategies for resolving cost conflicts. The
strategies are primarily based on the analysis of the COCOMO cost drivers [Boehm, 1981]
whose labels are shown in column 2 of Table 11.
• Reduce/defer functionality. This reduces cost by reducing the program (KDSI)
and/or database (DATA) size, at least for the Initial Operational Capability
(IOC).
• Reduce/defer software quality. This reduces cost by relaxing reliability (RELY)
or performance (TIME) constraints, by forgoing the complexities (CPLX) of
providing graceful degradation or information security, or by reducing
documentation (DOCU).

68
• Improve tools, techniques or platform. This involves the use of a platform that
is more powerful (TIME, STOR) or stable (VIRT); or via better software tools
(TOOL).
• Relax the delivery schedule constraint (SCED).
• Improve personnel capabilities. This involves the use of more capable teams of
analysts and programmers (ACAP, PCAP); stronger applications, platform, or
language experience (AEXP, VEXP, LEXP), or equivalent but lower-cost
personnel ($K/MM).
• Reuse software assets. This involves the reuse or adoption of more software
assets (ADSI), with lower levels of design, code, or integration modification
(DM, CM, IM).
• Improve coordination of multiple project stakeholders as a team. This involves
synchronizing the project stakeholders by reconciliation of different objectives
and culture and having experience in operating as a team (TEAM).
• Architecture and risk resolution. This reduces rework cost through risk
assessment and control, and architecture thoroughness which includes
verification of architectural specifications (RESL).
• Improve process maturity level. This reduces cost through SEI (Software
Engineering Institute)’s CMM (Capability Maturity Model) (PMAT).
Exercising this option involves choosing alternative suppliers, as process
maturity cannot be increased instantaneously.
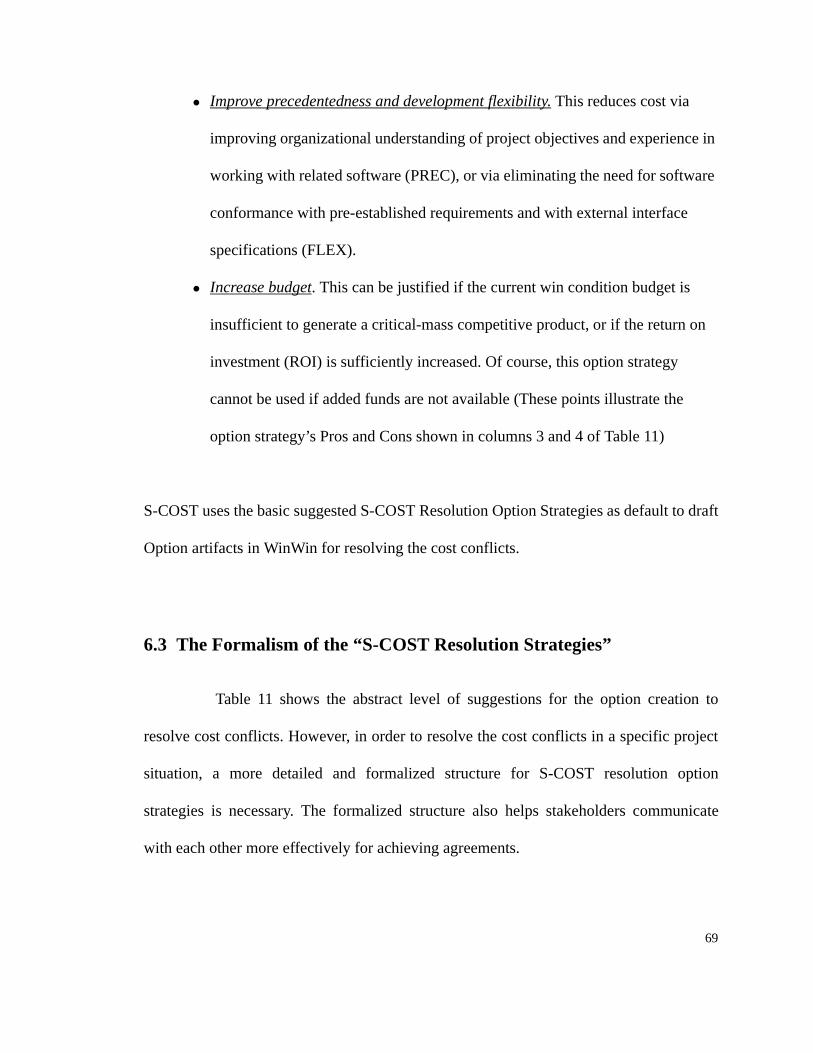
69
• Improve precedentedness and development flexibility. This reduces cost via
improving organizational understanding of project objectives and experience in
working with related software (PREC), or via eliminating the need for software
conformance with pre-established requirements and with external interface
specifications (FLEX).
• Increase budget. This can be justified if the current win condition budget is
insufficient to generate a critical-mass competitive product, or if the return on
investment (ROI) is sufficiently increased. Of course, this option strategy
cannot be used if added funds are not available (These points illustrate the
option strategy’s Pros and Cons shown in columns 3 and 4 of Table 11)
S-COST uses the basic suggested S-COST Resolution Option Strategies as default to draft
Option artifacts in WinWin for resolving the cost conflicts.
6.3 The Formalism of the “S-COST Resolution Strategies”
Table 11 shows the abstract level of suggestions for the option creation to
resolve cost conflicts. However, in order to resolve the cost conflicts in a specific project
situation, a more detailed and formalized structure for S-COST resolution option
strategies is necessary. The formalized structure also helps stakeholders communicate
with each other more effectively for achieving agreements.

70
OptionStrategies
COCOMOParameter
Pros Cons
Reduce/deferfunctionality
KDSI, DATA • Reduce cost, IOC, and sched-ule
• Smaller product to maintain
• Capabilities unavailable to stake-holders
• Need to pay later if deferred
Reduce/deferquality
RELY, CPLX, TIME, DOCU
• Reduce cost, schedule, and complexity
• Stakeholders lose quality capabil-ities
Improve tools, techniques, platform
TIME, STOR, VIRT, TOOL, SITE
• Reduce s/w cost and schedule• Improve maintainability and
other qualities
• Increase tool, training, platform costs
• Reducing tool, platform experi-ence would increase s/w cost
Relax schedule constraint
SCED • Reduce cost if schedule was tight
• Defer stakeholders use of product capabilities
Improve personnel capabilities
ACAP, PCAP,AEXP, VEXP, LEXP, $K/PM
• Reduce cost and schedule• Improve quality
• Projects losing better people will suffer
• Potential staffing difficulties and delays
• Increased cost/person-month unless low-cost outsourcing
Reuse software assets
ADSI, DM, CM, IM
• Reduce cost and schedule• May gain quality
• Stakeholders may lose quality capabilities
• Risk of overestimating reuse
Improve coordination of teambuilding
TEAM • Reduce cost and schedule by removing the inter-personnel overhead
• Uncontrollable for some situa-tions
Architecture and risk resolution
RESL • Reduce cost and schedule by avoiding rework
• Additional overhead for risk man-agement is necessary.
Improve process maturity level
PMAT • Reduce cost and schedule by removing the efforts for fixing errors
• Improve quality
• Additional overhead for applying CMM is necessary
Improve precedentedness and development flexibility
PREC, FLEX • Reduce cost and schedule by familiarity and flexibility of software development
• Uncontrollable for some situa-tions
Increase budget Revised win condition
• May enable product to reach competitive critical mass
• May increase ROI
• Added funds may not be available
Table 11. Cost-Resolution Option Strategies

71
The proposed formal structure based on the COCOMO cost drivers is
following:
Each stakeholder suggests how much the COCOMO cost drivers for the
Option Strategies should be changed (e.g., COCOMO cost driver, the value before and
after the Strategies are applied). Given the information from stakeholders, S-COST
produces the pros and cons of the Strategies using the knowledge base for the Option
Strategies and the reduced cost and schedule using COCOMO. The knowledge base for
suggesting the pros and cons of the Strategies has default knowledge, but it can be refined
and situated from project to project.
In order to reduce the difference between the estimated development cost and
the target development cost, several different strategies can be composed until the target
cost is reached. For example, the following strategies can be composed to reduce $1.66M
of the difference in an experimental project, STRIKEWARE, which will be explained in
detail in section 7.3.3.
• Defer_functionality (SS/WB_Query/Display_(new), KDSI, 14000 SLOC, 8000
SLOC, “Reduce cost, IOC, and schedule; Smaller product to maintain”,
“Capability unavailable to stakeholders; Need to pay later if deferred”, $438K,
0.46M)
Option-Strategy-Name (Module-Name,COCOMO cost driver,the value before the strategy is applied,the value after the strategy is applied,pros of the strategy,cons of the strategy,the reduced cost,

72
• Defer_functionality (MDIF Priority Upgrades, KDSI, 26000 SLOC, 17000
SLOC, “Reduce cost, IOC, and schedule; Smaller product to maintain”,
“Capability unavailable to stakeholders; Need to pay later if deferred”, $664K,
0.72M)
• Increase_budget (STRIKEWARE project, Budget, $5000K, $5379K, “May
enable product to reach competitive critical mass; May increase ROI”, “Added
funds may not be available”, -$379K, -0.42M)
6.4 Stakeholder/ S-COST Resolution Strategies Relationships
Like the Stakeholder/Quality Attribute relationship shown in Figure 9,
understanding Stakeholder/Option_Strategy relationship is useful reducing the complexity
of option negotiation.
For example, reducing reliability or performance may be acceptable options
for some stakeholders but not for others. S-COST uses the Stakeholder/ Option_Strategy
relationships in Figure 22 to notify the appropriate stakeholders of options which may
have first-order consequences for them. For example, “Increase budget” can potentially
affect any of the stakeholders by providing them with more capability, but the directly-
concerned stakeholder is the Customer, who must find a way to justify and obtain the
budget increase.

73
Like Stakeholders’ Roles & Responsibilities / Quality Attribute Concerns
relationship shown in Table 6, S-COST also provides the Stakeholders’ Roles &
Responsibilities / Option Strategy Concerns relationship shown in Table 12 to rationalize
the primary concerns on the S-COST Option Strategies. For example, one of the User’s
primary concerns on the S-COST Option Strategies is Reduce/defer functionality and
quality because the User’s roles and primary responsibilities are to execute cost-effective
operational missions of the system. Relax schedule constraints, however, can be
considered as a secondary concern because the strategy affects the delivery due date of the
system to the User.
The primary concerns of a stakeholder are directly related to the stakeholder’s
roles and responsibilities. However, the secondary concerns are indirectly related to the
stakeholder’s roles and responsibilities. For example, Relax schedule constraints and
Increase budget can be primary concerns for a Customer because the Customer’s primary
roles and responsibilities are avoiding overruns in the budget and schedule, but Improve
Figure 22. Stakeholder / Option_Strategy Relationships
General Public
Interoperator User MaintainerDeveloper Customer
directly-concerns
Reduce/deferfunctionality,
Improve Reusesoftwareassets
Relaxschedule
Improvepersonnelcapabilitiesquality constraints
tools,platform
Stakeholder:
Cost-ReductionOption Strategies:
Increasebudget

74
personnel capabilities, Improve tools and platforms, and Reuse software assets can be
secondary concerns because the Customer does not take responsibilities for the problems
(e.g, Is a programmer having high capability available, Are tools or platforms available to
reduce development cost, or Are there reusable software assets?) even though these
strategies could reduce budget and schedule indirectly.
There are no primary concerns for an Interoperator because the Interoperator’s
roles and responsibilities, avoiding current and future interface problems between system
and interoperating system, are not directly related to the proposed cost resolution option
strategies. However, the reduced quality by applying Reduce/defer quality strategy could
make the interface problems more difficult. So the Reduce/defer quality strategy could be
a secondary concern for the Interoperator.
However, the primary and secondary concerns are not absolute for all projects.
There are some variations from project to project. Nevertheless, there are benefits for
identifying the relationship between Stakeholders’ Roles and Option Strategies. One of
the benefits is to remind the stakeholders of their roles and responsibilities when they draft
and negotiate cost resolution options. Another is to be able to negotiate more effective by
identifying which concerns apply to which stakeholders.

75
Stakeholder Roles and Primary Responsibilities
Cost Option Concerns
Primary Secondary
General Public Avoid adverse system side-effects: safety, security / privacy.
Reduce/defer quality Reduce/defer functionality; Reuse software assets
Interoperator Avoid current and future interface problems between system and interoperating system
Reduce/defer quality
User Execute cost-effective operational missions
Reduce/defer functionality; Reduce/defer quality
Relax schedule constraints
Maintainer Avoid low utility due to obsolescence; Cost-effective product support after development
Improve tools, platform; Reuse software assets
Reduce/defer quality; Relax schedule constraints
Developer Avoid cost overrun for software development due to poor personnel capability and poor tool support; Avoid duplicated effort to the same function.
Reduce/defer functionality; Improve personnel capabilities; Improve tools, platform; Reuse software assets
Reduce/defer quality; Relax schedule constraints; Increase budget
Customer Avoid overrun budget and schedule
Relax schedule constraints; Increase budget
Reduce/defer functionality; Reduce/defer quality; Improve personnel capabilities; Improve tools, platform; Reuse software assets
Table 12. Stakeholder Roles / Option Strategy Concerns Relationship

76
7.0 The Support Tools: QARCC and S-COST
7.1 Overview of the Support Tools
QARCC (Quality Attribute Risk and Conflict Consultant) is proposed as an aid
for the identification of quality conflicts based on the models shown in section 5.0. S-
COST (Software Cost Option Strategy Tool) is also proposed as an aid for resolving cost
conflicts based on the models shown in section 6.0.
Figure 23 shows how these support tools can assist stakeholders in drafting
Issues (by QARCC), Options (by S-COST: option generation phase), and Agreements (by
S-COST: option negotiation phase) in the WinWin Negotiation Model shown in Figure 4.
Issues Win Conditions
Agreements Options
QARCC
S-COST :
S-COST:
Figure 23. Overview of the Support Tools: QARCC & S-COST
Option Generation Phase
Option NegotationPhase

77
7.2 A Top-level Support Tool: QARCC
7.2.1 Context
QARCC is a knowledge-based tool that assists stakeholders (e.g., users,
developers, and customers) in the analysis of software requirements and the identification
of quality conflicts among them.
QARCC operates in the context of the USC-CSE WinWin system, a groupware
support system for determining software and system requirements as negotiated win
conditions.
For each win condition of quality attributes surfaced by WinWin, QARCC
identifies the architecture and process strategies for achieving the desired quality attribute
based on the left-hand side of the knowledge base (Figure 8). For each strategy, it uses
another part of its knowledge base to identify potential conflicts with other quality
attributes that could arise if the strategy was employed. It then provides suggestions to
stakeholders on these potential quality attribute conflicts.
7.2.2 Concept of Operation
Figure 24 shows the QARCC concept of operation for identifying potential
quality-attribute conflicts, flagging them for affected stakeholders, and suggesting options
for their resolution.

78
QARCC is triggered by a stakeholder entering a new win condition with a
quality-attribute taxonomy element (e.g., Portability in screen 1 of Figure 25). For this
desired attribute, QARCC first considers its product and process strategies as given in
Table 8 (e.g., Layering to achieve Portability). It then examines these strategies to search
for potential conflicts with other attributes.
QARCC determines these potential conflicts from the portion of its knowledge
base summarized in Table 9. For example, Layering produces likely conflicts with Cost/
Schedule and Performance. These are shown in the Potential Conflict List in screen 2 of
Figure 25 (In the initial implementation, QARCC, Cost and Schedule were combined into
Development Affordability, and Performance was called Efficiency).
QARCC then uses the relationships shown in Figure 9 to identify the
stakeholders affected by these potential conflicts (Developer and Customer for Cost &
Stakeholders enterwin condition withquality-attributetaxonomy element.
Identify AttributeStrategies forwin condition.
For each attribute strategyidentified, determine likelynegative effects on otherattributes.
For each affected attribute,do directly-concerned stakeholdershave win conditions?
Send message to stakeholderindicating potential conflictwith affected win condition.Provide options of generatingan Issue and candidate resolution Options.
Send message to directly-concernedstakeholders indicating potential conflict.Provide options of generating new
Yes
No
win conditions.
Figure 24. The QARCC Concept of Operation
QARCC

79
Schedule; User and Customer for Performance). For these stakeholders, QARCC pops up
the Conflict Advisor Note window (screen 2) which shows a message to directly-
concerned stakeholders indicating a list of potential conflicts with the new win condition
in list form (Potential Conflict List shown in screen2). The list also enumerates the
existing win conditions having one of the conflicted attributes in its Taxonomy Elements
slot. If there are no existing win conditions for a conflicted attribute, a “Missing win
condition” message is shown. For example, Development Cost has two existing win
conditions, hohin-winc-5 and hohin-winc-9, whereas Dependability and Usability do not
have any.
For existing affected win conditions, the stakeholder can select them with the
mouse and then click on the Create Issue button to have QARCC draft an Issue artifact
(screen 3). If no affected win conditions exist, the stakeholder can click on the Create
WinC button to have QARCC draft a win condition artifact (screen 4).
An example of the draft material produced by QARCC is shown in the Other’s
Comments field of screen 3, which cautions the stakeholders that Affordability strategies
such as reuse will conflict with the Portability win condition if the reused software is not
portable.
By clicking the Options button at the bottom of screen 3, the stakeholder can
have QARCC draft a set of candidate resolution Options (left window in screen 5).
QARCC suggests six Options from its knowledge base: i) “Reduce or defer product
functions”; ii) “Find, incorporate some relevant reusable software”; iii) “Find, engage
expert performers”; iv) “Use design-to-cost process; Identify lower priority features to
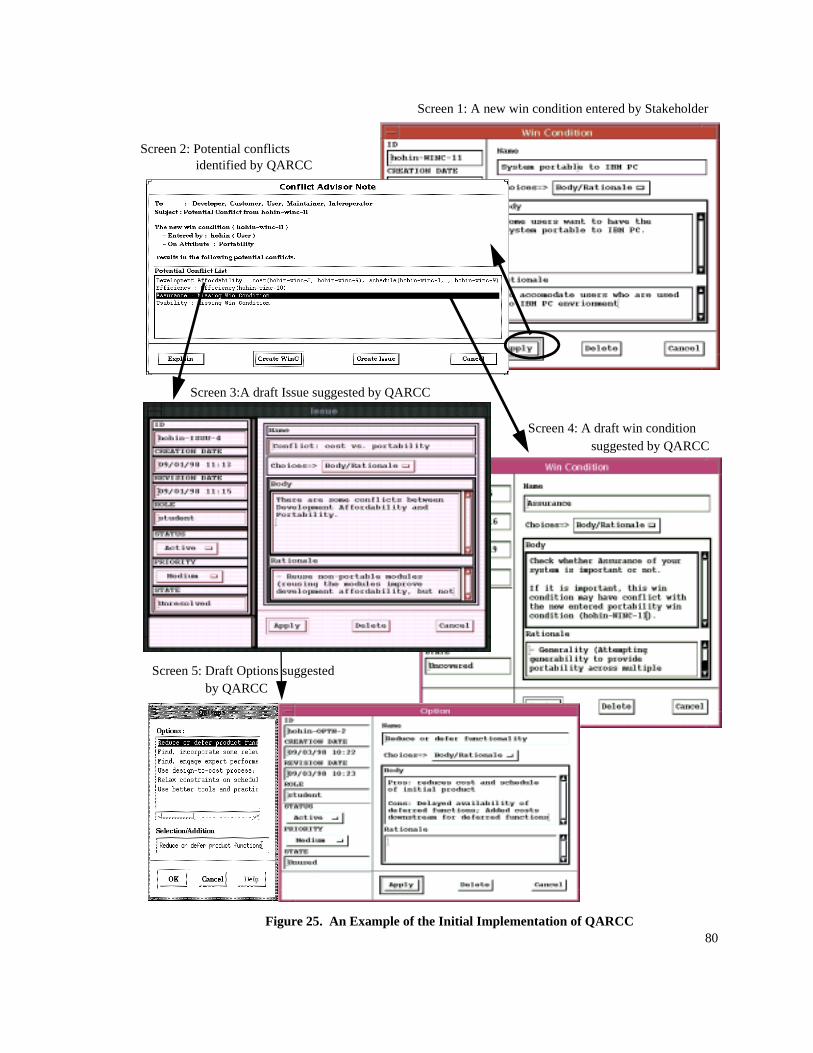
80
Screen 1: A new win condition entered by Stakeholder
Screen 2: Potential conflicts
Screen 3:A draft Issue suggested by QARCC
Screen 5: Draft Options suggested by QARCC
Screen 4: A draft win condition suggested by QARCC
Figure 25. An Example of the Initial Implementation of QARCC
d
identified by QARCC

81
defer if necessary”; v) “Relax constraints on schedule, performance, hardware, and other
attributes”; and vi) “Use better tools and practices” to resolve the conflict between Cost/
Schedule and Portability. As the Options are generalized, stakeholders can tailor them to
their needs. QARCC also drafts pros and cons for the Options (right window in screen 5),
helping the stakeholders to evaluate the Options and to converge on a mutually
satisfactory (i.e., win-win) Option, which is adopted by an Agreement.
7.2.3 Experiment Results
7.2.3.1 Experiment Scenario
QARCC has been applied to several hypothetical projects, primarily in the area
of Satellite Ground Stations. The experiment described here involved applying QARCC
retroactively to the win conditions for a representative Software Engineering Environment
(SEE) to support a Satellite Ground Station (SGS) product line.
The representative Developer was a workstation vendor’s CASE division, the
representative User was a large Aerospace Ground Systems Division, and the
representative Customer was the hypothetical U.S. Space Systems and Operations
Command.
The multi-stakeholder WinWin exercise generated 21 win conditions,
including the following:
• SGS domain extensions to general SEE (SEE-GEN)
• SGS workload modeling, information flow simulation (SIMU)
• SGS-domain test simulators, test/debug tools (TEST)

82
• SGS workstation usage scenario generation (USAGE)
• SGS-domain data reduction and reporting (DR&R)
• Initial operational capability (IOC) cost below $7M and within 25 months
• Interoperable SEE functions and tools
• Low development risk; Low maintenance cost; easy to modify
• Commercializable middleware and commercially supported SEE to improve
Evolvability
• Broadly applicable across product line to improve Evolvability
The main objective of the WinWin exercise was to determine the ability of WinWin to
support renegotiation of a new win-win equilibrium solution once a new win condition
was added to the base of 21 in-equilibrium win conditions. The new win condition,
“Support the development of multi-mission satellite ground stations,” caused a cost and
schedule conflict with the previous equilibrium negotiated. After determining that
WinWin could successfully support such a renegotiation [Boehm et al., 1995], we decided
to apply QARCC to the body of win conditions to see how many potential conflicts it
would identify.
First, we wanted to see if QARCC would identify the two conflicts used in the
renegotiation process. These were conflicts of Cost/Schedule with Evolvability and
Interoperability, which were used by the stakeholders to reject an option to recover cost
and schedule by reusing some legacy software which was deficient in Evolvability and
Interoperability. Second, we wanted to see if QARCC would surface other potential
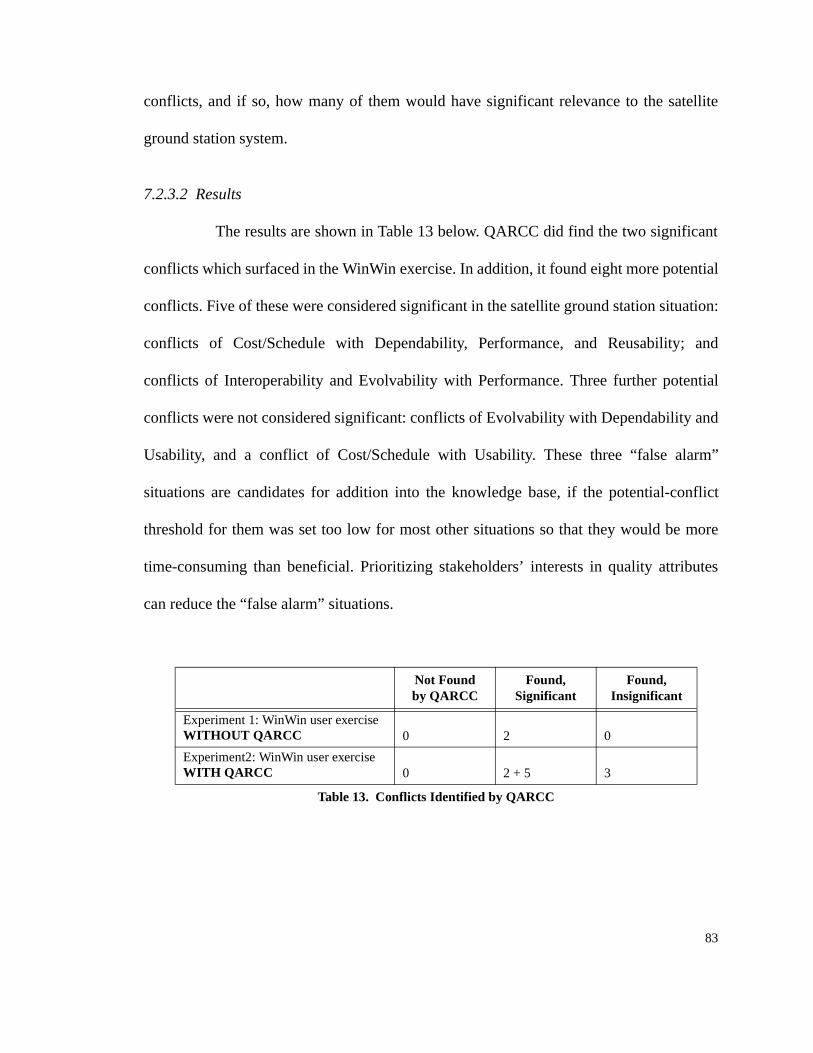
83
conflicts, and if so, how many of them would have significant relevance to the satellite
ground station system.
7.2.3.2 Results
The results are shown in Table 13 below. QARCC did find the two significant
conflicts which surfaced in the WinWin exercise. In addition, it found eight more potential
conflicts. Five of these were considered significant in the satellite ground station situation:
conflicts of Cost/Schedule with Dependability, Performance, and Reusability; and
conflicts of Interoperability and Evolvability with Performance. Three further potential
conflicts were not considered significant: conflicts of Evolvability with Dependability and
Usability, and a conflict of Cost/Schedule with Usability. These three “false alarm”
situations are candidates for addition into the knowledge base, if the potential-conflict
threshold for them was set too low for most other situations so that they would be more
time-consuming than beneficial. Prioritizing stakeholders’ interests in quality attributes
can reduce the “false alarm” situations.
Not Foundby QARCC
Found, Significant
Found, Insignificant
Experiment 1: WinWin user exerciseWITHOUT QARCC 0 2 0
Experiment2: WinWin user exerciseWITH QARCC 0 2 + 5 3
Table 13. Conflicts Identified by QARCC

84
7.2.4 Lessons Learned
The primary conclusions from the initial QARCC experiment were:
• QARCC can help users, developers, customers, and other stakeholders to
identify conflicts among their software quality requirements, and to identify
additional potentially important quality requirements. In the experiment,
QARCC found both of the quality conflicts previously identified, plus five
others considered significant.
• QARCC needs further refinement to avoid overloading users with insignificant
quality conflict suggestions. In the experiment, QARCC found three potential
conflicts which were considered insignificant.
Two additional conclusions are derived from feedback based on demonstrations of
QARCC to about 30 USC-CSE’s industry and government Affiliates. There was a strong
consensus that QARCC provided a useful framework for stakeholders to systematically
identify software quality attribute conflicts, and that the semi-automated approach
provided a good way to balance human skills and computer tools in addressing quality
tradeoff issues.

85
7.3 A More Detailed Support Tool: S-COST
7.3.1 Context
S-COST is a knowledge-based tool that helps stakeholders (e.g., users,
developers, and customers) analyze cost conflicts, and to draft and negotiate options for
resolving cost conflicts. S-COST operates in the context of WinWin, QARCC, and
COCOMO (COnstructive COst MOdel).
S-COST extends WinWin and complements QARCC by using an additional
software cost knowledge base related to another component of WinWin: COCOMO. S-
COST uses the COCOMO cost drivers (i.e., the parameters for adjusting the COCOMO
model), cost estimates, and related experience to sharpen QARCC’s identification of cost-
conflict Issues. It also suggests in-depth cost-conflict resolution options, and provides
option visualization and negotiation aids to help stakeholders resolve the cost-conflict
Issues.
7.3.2 Concept of Operation
The S-COST concept of operation is shown in Figure 26. Using the WinWin
system, stakeholders enter their new win conditions. These may involve functions, quality
attribute goals or constraints. As shown in screen 1 of Figure 25, win condition schemas
have attributes such as Priority and domain Taxonomy Elements. For win conditions with
quality attribute and cost/schedule Taxonomy Elements, QARCC examines its
architectural and process strategies (Table 8) to search for potential conflicts. For example,
Layering the architecture to meet the Portability win condition in screen 1 of Figure 25
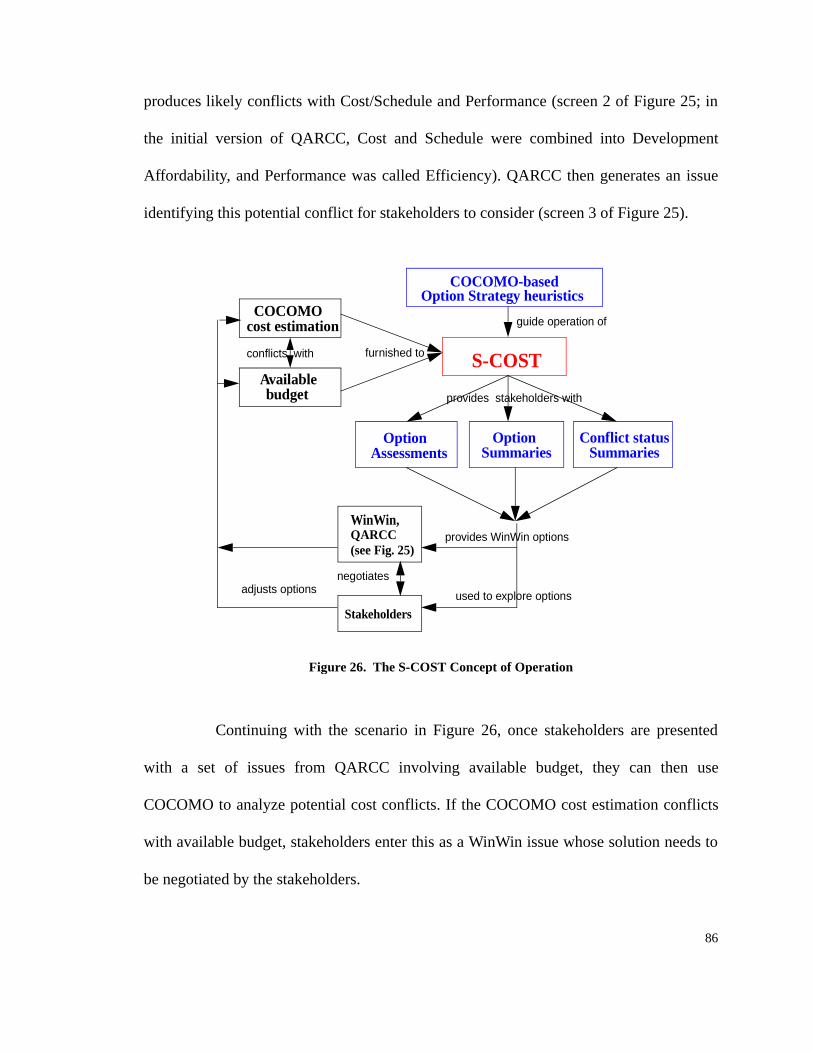
86
produces likely conflicts with Cost/Schedule and Performance (screen 2 of Figure 25; in
the initial version of QARCC, Cost and Schedule were combined into Development
Affordability, and Performance was called Efficiency). QARCC then generates an issue
identifying this potential conflict for stakeholders to consider (screen 3 of Figure 25).
Continuing with the scenario in Figure 26, once stakeholders are presented
with a set of issues from QARCC involving available budget, they can then use
COCOMO to analyze potential cost conflicts. If the COCOMO cost estimation conflicts
with available budget, stakeholders enter this as a WinWin issue whose solution needs to
be negotiated by the stakeholders.
COCOMO-basedOption Strategy heuristics
S-COST
OptionAssessments
OptionSummaries
Conflict statusSummaries
Stakeholders
COCOMOcost estimation
Availablebudget
conflicts with furnished to
provides stakeholders with
adjusts options
guide operation of
WinWin,QARCC
negotiates
provides WinWin options
used to explore options
Figure 26. The S-COST Concept of Operation
(see Fig. 25)

87
As indicated in Figure 26, S-COST guided operation of COCOMO-based
Option Strategy heuristics provides stakeholders with:
• Option Assessments: suggesting potential options for resolving cost issues,
• Option Summaries: providing a summary of which-option-strategy-can-reduce-
how-much,
• Conflict status Summaries: providing a summary of other stakeholders’ options
to negotiate.
Based on the above capabilities, each stakeholder explores options to resolve
cost conflicts and draft some WinWin options. Stakeholders negotiate their draft options
in WinWin. After the stakeholders converge on a mutually satisfactory (win-win)
combination of options, they draft a WinWin agreement schema, and follow WinWin’s
procedures for voting on and adopting the agreement.
7.3.3 Experiment Results
7.3.3.1 Overview of Experiment Scenario
The S-COST visualization and negotiation aids will be illustrated with respect
to a satellite data processing scenario. In the scenario, the user, customer, and developer of
a system called Strikeware have negotiated a $5 million, 16-month upgrade to add
Satellite Surveillance data services to a Mission Data Integration Facility (MDIF). The
Strikeware user has determined that it will be important to add weather data services to the
MDIF upgrade. A COCOMO estimate of the resulting added software indicates a $6.66 M

88
cost and 17.6 month schedule, but the customer is strongly constrained to keep to the
original $5M cost and 16 month schedule.
S-COST has several capabilities to help the stakeholders determine cost
reduction options, visualize their impact on the problem situation, and negotiate a new
win-win solution. For example, the Visualization window for option generation in Figure
27 shows the cost reduction target of $5M as a * mark. It uses data on the priorities of the
stakeholders’ functional module win conditions, and the corresponding COCOMO
estimates of the module’s cost contribution, to produce a display of module cost
contributions by priority.
Using this display, the stakeholders could simply agree to drop or defer the
lowest-priority modules until the cost target is reached. But there may be better options,
such as splitting a module into higher and lower priority modules via the Operations
button; or adjusting other cost drivers such as personnel capability and experience,
improved tools, or software reuse via the Resolution Strategies button. Or, if justified and
feasible, the customer could increase the budget, raising the target cost in the Target Cost
field (Figure 27).

89
7.3.3.2 Scenario for Option Generation
The S-COST Visualization window in Figure 27 has a number of option
strategies and display aids for stakeholders. Some selected features are highlighted below.
After Function Elements (FEs) in the FE window (right top) are imported from
COCOMO modules, they are sorted by the priority using “Sort-by-Priority”, one of the
Operations buttons, based on the user-determined FEs. COCOMO-estimated cost and
schedule appear in the left window, Status Area, along with User’s Id & Role, Priority of
Option, and target cost & schedule. The Operations button is available to enable
stakeholders to split, merge, insert, delete, and sort FE(s), as well as select_all,
unselect_all, import, and export from/to COCOMO.
Figure 27. Visualization Window for Option Generation
*

90
The Strategies button brings up a menu containing the cost resolution
strategies described in Table 11. Each strategy has parameters which can be defined or
adjusted once the strategy has been selected. Figure 28 shows an example of applying a
“Reduce/defer functionality” Strategy option. Option Strategies are prepared to defer 6
KDSI of Query/Display (New) functionality and 9KDSI of MDIF Priority Upgrades
functionality. The Pros & Cons area shows the potential positive and negative aspects of
the option. If the stakeholder establishes this as an Option to be addressed in the WinWin
system, the Pros & Cons will be included in the Option schema.
Figure 28. Aids for Applying Cost-Resolution Strategy
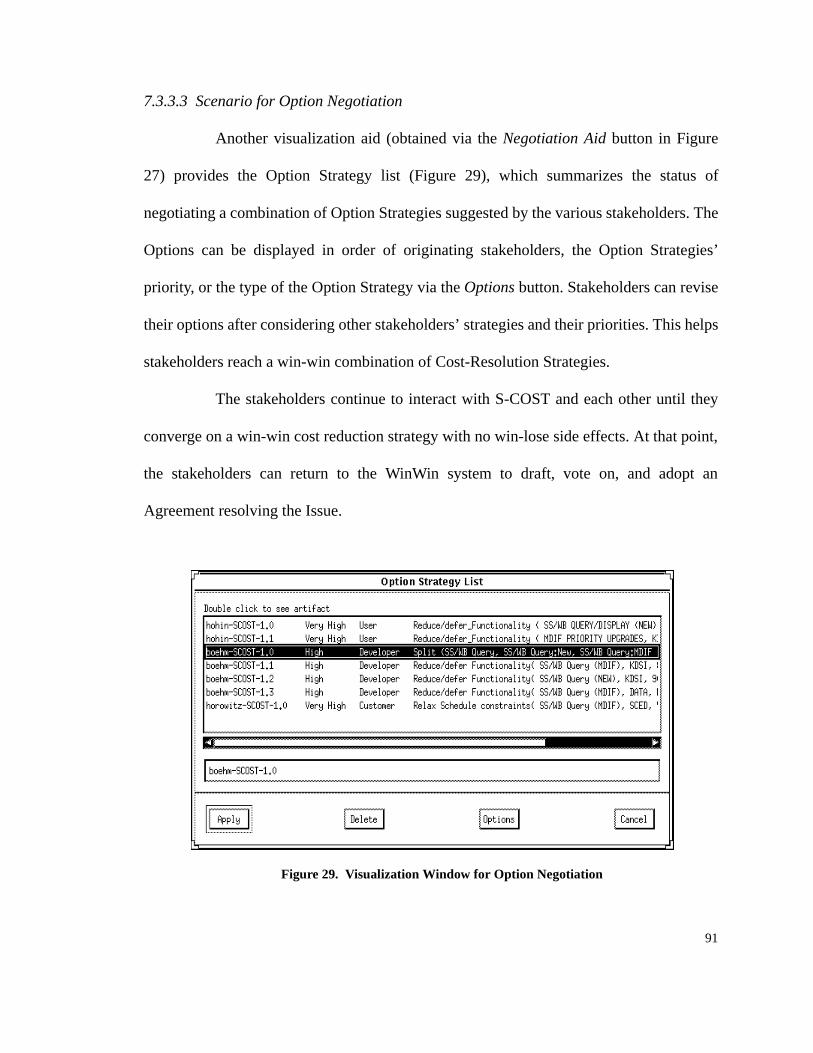
91
7.3.3.3 Scenario for Option Negotiation
Another visualization aid (obtained via the Negotiation Aid button in Figure
27) provides the Option Strategy list (Figure 29), which summarizes the status of
negotiating a combination of Option Strategies suggested by the various stakeholders. The
Options can be displayed in order of originating stakeholders, the Option Strategies’
priority, or the type of the Option Strategy via the Options button. Stakeholders can revise
their options after considering other stakeholders’ strategies and their priorities. This helps
stakeholders reach a win-win combination of Cost-Resolution Strategies.
The stakeholders continue to interact with S-COST and each other until they
converge on a win-win cost reduction strategy with no win-lose side effects. At that point,
the stakeholders can return to the WinWin system to draft, vote on, and adopt an
Agreement resolving the Issue.
Figure 29. Visualization Window for Option Negotiation

92
7.3.3.4 Results
We have done a comparative analysis of the options surfaced by stakeholders
in the initial WinWin Strikeware exercise and the options generated and analyzed by S-
COST. S-COST provides a more thorough set of candidate cost-resolution options and
analysis of their pros and cons. On the other hand, S-COST could not generate situation-
specific options, such as the User deciding to break up the Query/Display module into
higher and lower priority submodules.
7.3.3.5 Tool Extension: Option Summary
One of the feedback from USC/CSE affiliates after S-COST demos is that
some advice on “Which option strategy can reduce how much” (called “Option
Summary”) would be useful in the process of option generation.
Initially, the “option summary” feature was developed for the project having
only one module as shown in Figure 30. The multiple-module version will be developed
as a future work.
In the option summary window (Figure 30), the values of the three COCOMO
cost drivers (named “Current Status”, “Improvement In Principle”, and “More Realistic
Improvement”) are shown with comments to provide a summary of which-option-
strategy-can-reduce-how-much. For example, reduce/defer documentation (DOCU) can
reduce documentation by 11% (shown in the parenthesis of the Improvement-In-Principle
column) by changing NM (i.e., Nominal) shown in the Current-Status column to VL (i.e.,
Very Low) shown in the Improvement-In-Principle column, but a more realistic solution is

93
NM (shown in the More-Realistic-Improvement column) because “reducing
documentation can cause increased maintenance cost” (shown in Comments column).
Because Current Status in Execution Time Constraint (TIME) and Main
Storage Constraint (STOR) had the same value as Improvement-In-Principle, no
improvement was available because the Current Status had the lowest value.
Required Development Schedule (SCED) has the same lowest value (i.e., the
value of Improvement-In-Principle) from Nominal (NM) to Very High (VH). In Figure 30,
Figure 30. Visualization Window for Option Summary

94
Nominal is shown as the value of Improvement-In-Principle due to the limitation of
column space.
The value of Program size (e.g., KDSI and ADSI) was not shown in the
columns of Improvement-In-Principle and More-Realistic-Improvement because the
advice is useless without domain and/or environment knowledge.
The “option summary” feature gives stakeholders a general indication of
which option strategies are most effective to resolve cost conflicts.
7.3.4 Lessons Learned
Based on the strengths and limitations of these automated approaches, we
conclude that S-COST’s resulting semi-automated approach is stronger than a heavily
manual approach or a heavily automated approach
The option Summary feature is also based on a semi-automated approach. It
does not tell stakeholders which strategies they should apply automatically. In order to get
the right answer when using the heavily automated approach, complicated inputs such as
domain knowledge, environment factors, and personal priority are necessary. With the
semi-automated approach, however, additional inputs are not required. This makes the
relative effectiveness of each strategy more clear to the users. The USC/CSE’s industry
and government affiliates showed very positive feedback during demos of the Option
Summary feature.
Another feedback from USC/CSE affiliates was regarding the use of S-COST
as a standalone tool rather than a dependent tool of WinWin. An example of the S-COST

95
standalone use is a training tool for COCOMO. Novice software engineers may not
understand which “improvements in principle” are realistic. However, S-COST provides
guidance on realistic cost-resolution option strategies so that the novices can apply
COCOMO more effectively.

96
8.0 Results of the Analysis of the Experimental Data and Survey
8.1 Results of the Analysis of the WinWin Data of CS577a
The University of Southern California / Center for Software Engineering
(USC/CSE) developed 15 multimedia digital library software systems with input from the
USC library staff (as customers and users) and graduate students enrolled in CSCI 577a, a
software engineering class (as developers), during the 1996-97 semester [Egyed-Boehm,
1997].
The library projects dealt with diverse data, including medieval manuscripts,
technical reports, corporate business information, and stereoscopic slides. Each project
had its desired capabilities, and unique constraints. The 86 graduate students in the class,
broken up into 15 teams (5 or 6 students per team), formulated operational concepts,
requirements specifications, architectures, prototypes, life cycle plans, and integrating
rationale for the proposed capabilities of 15 USC's Library Information Systems during
the 11-week semester. Table 14 shows the topic list of the 15 systems.
Altogether, 12 project topics were chosen for this experiment, six of which
were continued during the following semester. The medieval manuscripts team could not
be evaluated because their electronic data were missing. Teams 3 and 4, 5 and 9, and 7 and
10 played a special role because they worked on the same problem sets. See Table 15 for
more detail on a sample of these projects.

97
Having real customers with real problems forced the students to deal with a
number of real world characteristics (e.g., fuzzy requirements, availability of resources,
personnel turnover, and conflicts).
Before the application systems were developed, the WinWin system was used
to determine the negotiated requirements. The WinWin repository provided not only the
artifact data but also the negotiation process data. This section summarizes the results of
the data analysis as a means to understand the conflict identification and resolution
process. The data analysis for the conflict identification and resolution process can be
Team Topic Continued
1 Stereoscopic Slides
2 Latin American Pamphlets Yes
3 EDGAR Corporate Data
4 EDGAR Corporate Data Yes
5 Hancock Image Archives
6 ITV Material
7 Technical Reports
8 CNTV Moving Image Archives Yes
9 Hancock Image Archives Yes
10 Technical Reports Yes
11 Maps
12 Searchable Archives for Images
13 Korean-American Museum
14 Planning Documents
15 Medieval Manuscripts Yes
Table 14. Library Project Topics

98
classified into three concerns: (i) analysis of conflict identification and the resolution
process; (ii) analysis of the roles & relationships between stakeholders and artifacts; and
(iii) analysis of the effectiveness of QARCC and S-COST.
Problem # and Topic
Author and Title
Problem Statement
Problem #2: Hancock Image Archives
Jean Crampon, Hancock Library of Biology and Oceanography
There is a substantial collection of photographs, slides, and films in some of the Library's archival collections. As an example of the type of materials available, I would like to suggest using the archival collections of the Hancock Library of Biology and Oceanography to see if better access could be designed. Material from this collection is used by both scholars on campus and worldwide. Most of the Hancock materials are still under copyright, but the copyright is owned by USC in most cases.
Problem #9: EDGAR Corporate Data
Caroline Sisneros, Crocker Business Library
Increasingly the government is using the WWW as a tool for dissemination of information. Two much-used sites are the Edgar Database of Corporate Information (http://www.sec.gov/edgarhp.htm) and the Bureau of the Census (http://www.census.gov). Part of the problem is that some of the information (particularly that at the EDGAR site) in only available as ASCII files. For information that is textual in nature, while the files can be cleaned up, formatting of statistical tables is often lost in downloading, e-mailing, or transferring to statistical programs. And while this information is useful for the typical library researcher, who usually have a very distinct information need, the investment in what it would take to put this information is a usable format is often too much trouble.
Problem Set #13: CNTV Moving Image Archives
Sandra Joy Lee, Moving Image Archives, School of Cinema/TV
The USC Moving Image Archives houses USC student film and video productions dating from the1930s to current productions in the School of Cinema-Television. Moving image materials in multiple formats, specialized viewing equipment, limited storage space, and complex access needs create challenges that may be solved with new computer technologies. Fifteen movie clips (.mov format), each approximately 45 minutes in length, over 100 digital film stills (.gif format), and textual descriptions of the films will be made available to students wishing to explore this project.
Table 15. Examples of Library Multimedia Problem Statements

99
8.1.1 Analysis of Conflict Identification and the Resolution Process
[Egyed-Boehm, 1997] analyzed the general requirement negotiation patterns
for the multimedia library systems. They tested certain hypotheses to identify the general
negotiation patterns, which were based on the following information: (i) the WinWin
artifacts, the system log data (e.g., system login time and date, (ii) the project duration in
terms of days), and (iii) people data (e.g., team grading, industry experience, and English
proficiency). They did not, however, analyze the quality-conflict negotiation patterns.
8.1.1.1 Analysis of Quality Issues
The following quality-issue hypotheses, adopted from the general hypotheses
in [Egyed-Boehm, 1997], were tested by the WinWin artifact data of the multimedia
library systems to analyze the quality-conflict negotiation process.
Hypothesis 1: Most quality-attribute win conditions will be noncontroversial.
Since a win condition is seen as the goal space in which a stakeholder
expresses his/her desires of the proposed application system and an issue is seen as a
conflict between two or more contradictory goals, less than half (i.e., 45%) of all goals
(e.g., functional, quality, and infrastructure goals) caused conflicts (Table 16).
However, the quality win conditions were involved in somewhat more
conflicts (49%) than the general win conditions (45%), including functional and
infrastructure win conditions. The difference is not large, but it suggests that quality
attributes are somewhat more likely to require negotiation.

100
Hypothesis 2: Most quality issues will be straightforward to resolve.
The number of options per issue is, in many cases, an indication of the
complexity of the issue. Of all issues, 66 % had only one option. Only 31% of all general
issues had multiple (i.e., more than one) options. Among the issues having multiple
options, 50% of them had only two options. Thus, most issues were quite straightforward
to resolve.
The quality issues were also quite straightforward to resolve. Of the quality
issues, 66% had only one option. Only 30% of the quality issues had multiple options.
Among the issues having no option, 75% were unresolved issues (i.e., issues
which did not have any further consideration into options or agreements). 25% were
“short-cut” issues (i.e., issues which were directly resolved by agreements without
drafting options).
Condition Number of Artifacts
Win Conditions involved in issues 232/513 (45%)
Quality Win Conditions involved in issues 118/240 (49%)
The Number of issues having NO option 4/176 (2 %)
The Number of issues having ONE option 117/176 (66 %)
The Number of issues having MULTIPLE options 55/176 (31 %)
The Number of Quality issues having NO option 4/102 (4 %)
The Number of Quality issues having ONE option 67/102 (66 %)
The Number of Quality issues having MULTIPLE options 31/102 (30 %)
Table 16. Analysis Result of the Analysis of the WinWin Artifacts
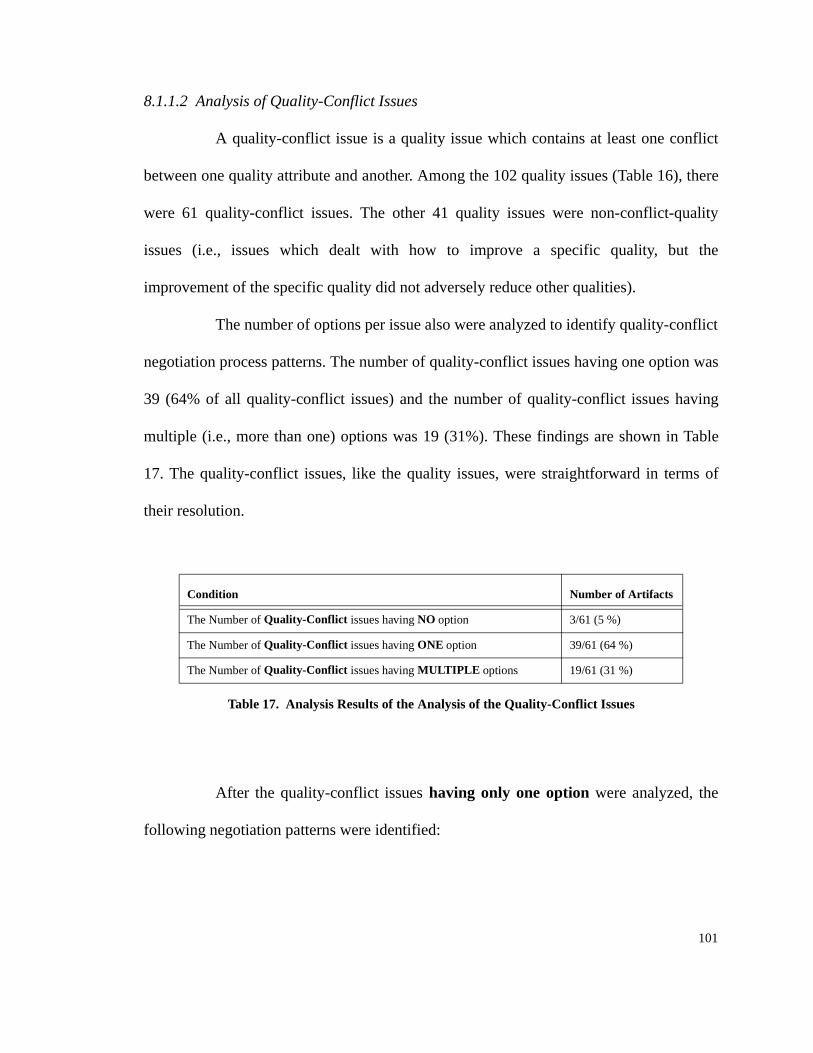
101
8.1.1.2 Analysis of Quality-Conflict Issues
A quality-conflict issue is a quality issue which contains at least one conflict
between one quality attribute and another. Among the 102 quality issues (Table 16), there
were 61 quality-conflict issues. The other 41 quality issues were non-conflict-quality
issues (i.e., issues which dealt with how to improve a specific quality, but the
improvement of the specific quality did not adversely reduce other qualities).
The number of options per issue also were analyzed to identify quality-conflict
negotiation process patterns. The number of quality-conflict issues having one option was
39 (64% of all quality-conflict issues) and the number of quality-conflict issues having
multiple (i.e., more than one) options was 19 (31%). These findings are shown in Table
17. The quality-conflict issues, like the quality issues, were straightforward in terms of
their resolution.
After the quality-conflict issues having only one option were analyzed, the
following negotiation patterns were identified:
Condition Number of Artifacts
The Number of Quality-Conflict issues having NO option 3/61 (5 %)
The Number of Quality-Conflict issues having ONE option 39/61 (64 %)
The Number of Quality-Conflict issues having MULTIPLE options 19/61 (31 %)
Table 17. Analysis Results of the Analysis of the Quality-Conflict Issues

102
• Directly Accepting: A quality-conflict issue is resolved by directly accepting its
only option to an agreement without semantically changing the option.
• Adapting: A quality-conflict issue is resolved by adapting its only option to an
agreement with semantically changing the option.
• Decomposing: A quality-conflict issue is resolved by decomposing its only
option to multiple (i.e., more than one) agreements.
• Contradictorily Accepting: A quality-conflict issue is resolved by accepting its
only option to an agreement, but the agreement is semantically opposite to the
option.
After the quality-conflict issues having multiple options were analyzed, the following
negotiation patterns were identified:
• Electing: A quality-conflict issue is resolved by electing the best option(s)
among the multiple proposed options for the issue.
• Merging: A quality-conflict issue is resolved by merging the multiple proposed
options into an agreement.
• Accepting all: A quality-conflict issue is resolved by accepting all options for
the issue via multiple agreements.

103
Hypothesis 3 [Negotiation Pattern Analysis I]: Among the quality-conflict issues
having only one option, the number of the quality-conflict issues resolved by directly
accepting options will be greater than the number of the issues resolved by adapting
options.
The negotiation patterns for the quality-conflict issues having one option are
shown in Table 18. The number of the issues resolved by the Directly Accepting pattern
(59% of all quality-conflict issues) is greater than the number of the issues resolved by the
Adapting pattern (36%).
This difference appears strong, but due to the small sample size is not
statistically significant. The hypothesis (t = 1.090 with 14 degrees of freedom; two-tailed
P value = 0.2940) is rejected because the mean difference (= -0.6000) between the two
patterns is considered not significant with 95% confidence interval (= -1.788 to 0.5882).
In general, the differences found for the other hypotheses are strongly suggestive, but not
statistically significant due to the small sample size and the variability across applications
and team styles.
Negotiation Patterns for Quality-Conflict Issues Having One option Number of Artifacts
Accepting an option directly to an agreement without changing the option semantically
23 / 39 (59 %)
Adapting an option to an agreement with changing the option semantically 14 / 39 (36 %)
Decomposing an option to multiple agreements 1 / 39 (3 %)
Accepting an option contradictorily to an agreement 1 / 39 (3 %)
Table 18. Negotiation Patterns for Quality-Conflict Issues Having One Option

104
Each team, however, has different preferred patterns. For example, more than
75% of the quality-conflict issues resolved by Directly Accepting patterns were done by
Teams 2, 3, 5, and 7, whereas 75% of the quality-conflict issues resolved by Adapting
patterns were done by teams 1, 10, and 15.
Both Decomposing and Contradictorily Accepting patterns were rare (3%). A
Contradictorily Accepting pattern (i.e., an option and its agreement are semantically
contradictory to each other) looks odd, but it reduced negotiation efforts by simply
drafting a contradictory option rather than by drafting two options, which are
contradictory to each other, and electing the opposite option among the two options. For
example, a tradeoff issue between the use of high-resolution images and its process time
was resolved by contradictorily accepting a high-resolution-image-usage-and-slow-
process-time agreement from a low-resolution-image-usage-and-fast-process-time option.
Hypothesis 4 [Negotiation Pattern Analysis II]: Among the quality-conflict issues
having multiple options, the number of the quality-conflict issues resolved by electing
the best option(s) will be greater than the number of the issues resolved by merging
the multiple options or accepting all the multiple options.
The negotiation patterns for the quality-conflict issues having multiple options
are shown in Table 19. The number of the issues having the Electing-the-best pattern
(42%) is greater than the number of the issues having the Merging pattern (26%) or the
Accepting-All pattern (32%).

105
Among the eight issues having the Electing-the-best pattern, seven were
resolved to an agreement by electing only one option as the best, and the remaining one
issue was resolved to two agreements by electing two options as the best. All issues
having Merging patterns were resolved to an agreement and all issues having Accepting-
All patterns were resolved to multiple agreements.
Of the issues, 63% having the Electing-the-best pattern and 60% of the issues
having the Accepting-All pattern were accepted without semantically changing the
options. Of course, all issues having the Merging pattern were accepted with changing the
options.
The negotiation patterns of quality-conflict issues having multiple options
depend on how to draft the resolution options. The Merging and Accepting-All pattern had
“Non-Exclusive-Or” options (i.e., all of the options can be accepted at the same time). For
example, “make server interoperable” and “make clients interoperable” can be accepted
all at the same time. The Electing pattern, however, had “Exclusive-Or” options (i.e., only
one options can be accepted among the proposed options because of their compatibility).
Negotiation Patterns for Quality-Conflict Issues Having Multiple Options Number of Artifacts
Electing the best option(s) among the proposed multiple options 8 / 19 (42 %)
Merging the multiple options into an agreement 5 / 19 (26 %)
Accepting all the multiple options into multiple agreements 6 / 19 (32 %)
Table 19. Negotiation Patterns for Quality-Conflict Issues Having Multiple Options

106
For example, “less fast and high resolution” and “faster and low resolution” can not be
accepted all at the same time. Only one of them can be accepted.
Hypothesis 5: Most of the quality-conflict issues will be resolved without comments.
Eighty percent of all issues and 84% of the quality-conflict issues were
resolved without comments.
The comments on quality-conflict issues were used (i) to add, estimate, and
elaborate on some constraints (60% of quality-conflict issues); (ii) to express “agree/
disagree” (20%); (iii) to clarify ambiguity (10%); or (iv) to explore potential options
(10%).
Hypothesis 6: Most of the quality-conflict resolution options will be adapted to
agreements without comments
Ninety percent of all options and 97% of the quality-conflict options were
resolved without comments (Table 20). All comments for the quality-conflict options were
used to supplement and elaborate on the options.
Artifact Type Total With Comments Without Comments
All issues 176 36 (20 %) 140 (80 %)
Quality-Conflict issues 61 10 (16 %) 51 (84 %)
All options 250 26 (10 %) 224 (90 %)
Quality-Conflict options 74 2 (3%) 72 (97 %)
Table 20. Results of the WinWin Artifacts

107
8.1.2 Analysis of the Stakeholders’ Roles and their Relationships to Artifacts
The stakeholders did not participate equally throughout the conflict resolution
process. The users and customers participated more strongly at the early stages of the
process, whereas the developers and the customers were more involved later. The
following hypotheses elaborate the stakeholders’ roles and their relationships to the
WinWin artifacts.
Hypothesis 7: The primary-concerned relationship between stakeholders and
quality attributes shown in Figure 9 will hold for the digital library student projects
The proposed default set of relationships shown in Figure 9 were slightly
different from the relationships shown in the multimedia library application systems
(Figure 31).
0
20
40
60
80
100
Win
Con
ditio
n (%
)
Quality Attributes
US ER 41 78 70 43 22 8 13
CUS T OMER 51 22 26 39 70 71 88
DEVELOP ER 8 0 4 17 9 20 0
Dependability
Interoperability
Us abilityP erforma
nceAdaptabili
tyCos t/S ch
eduleR eus abilit
y
Figure 31. Results of the Win Condition Analysis for the Stakeholders’ Role in Quality Requiremnets

108
With a 19% threshold, a new diagram of the primary-concerned relationships
between stakeholders and quality attributes can be developed (Figure 32).
The difference shown in Figure 32 indicates that the customers are interested in
all quality attributes, including Dependability, Interoperability, and Usability, which were
missed in Figure 9. Another difference is that the developers did not sufficiently draft
quality-attribute related win conditions. The developers’ concerns about Evolvability/
portability and Reusability were not strong. This was probably because the student teams
would not be around to evolve or reuse the software. However, the developers raised many
issues related to quality attributes (more than 50% for all quality attributes).
Results of the analysis of issues, options, and agreements for the stakeholders’
role are shown in Figure 33. Unlike win conditions, developer raised more quality issues
and agreements than other stakeholders. User’s activity for issues, options, and
agreements was significantly reduced.
General Public
Interoperator User Maintainer Developer Customer
Dependability Interoperability Usability Performance Evolvability Cost &Schedule
Reusability
Figure 32. Mapping of the Common Stakeholders’ Primary Concerns onto Quality Attributes
& Portability
directly-concerns
Development
the relation shown in figure 9 the new relation not shown in figure 9
the deleted relation the relation with rating over 70%

109
0
20
40
60
80
100
Issu
es (%
)
U S E R 8 0 1 9 2 9 0 2 3 3
CU S T OM E R 8 5 0 2 3 1 8 5 0 3 6 0
D E V E LOP E R 8 5 5 0 5 8 5 4 5 0 6 2 6 7
D ependabi l i ty
Interoper abil i ty
U s abi l i tyP er for m
anceA daptab
i l i tyCos t/S c
heduleR eus abi l
i ty
0
10
20
30
40
50
60
Opt
ions
(%
)
US ER 33 0 32 22 20 20 0
CUS T OMER 27 0 37 44 60 37 0
DEVELOPER 40 0 32 34 20 43 0
Dependabili
ty
Interoperab
i li tyUsabi li ty
Per formanc
e
Adaptabi li t
y
Cost/S ched
uleReusabi li ty
0
20
40
60
80
100
Agr
eem
ents
(%
)
US ER 10 0 21 31 13 8 40
CUS T OMER 35 17 17 23 38 46 40
DEVELOPER 55 83 62 46 50 46 20
Dependabil
i ty
Interopera
bi li tyUsabi li ty
Per forman
ce
Adaptabi li t
y
Cost/S che
duleReusabi li ty
Figure 33. Results of the Analysis of Issues, Options, and Agreements for the Stakeholders’ Role

110
Hypothesis 8: In quality requirements, users would be more active in identifying
win conditions, but less active in identifying issues, options, and agreements.
Among the quality-attribute artifacts users drafted, the number of win
conditions was greater than the combined number of issues, options, and agreements
(Table 21 and Figure 34). Users concentrated on drafting on their desires (i.e., win
conditions) rather than drafting issues, options, or agreements.
Hypothesis 9: In quality requirements, customers would be more active in
identifying win conditions, but less active in identifying issues, options, and
agreements.
Among the quality-attribute artifacts customers drafted, the number of win
conditions (46% of all quality artifacts) was much greater than the number of issues
(13%), the number of options (18%), or the number of agreements (24%).
Hypothesis 10: In quality requirements, developers would be more active in
identifying issues and agreements, but less active in identifying win conditions and
options.
Among the quality-attribute artifacts developers drafted, the number of issues
and agreements was much greater than the number of win conditions and the number of
options. Developers were more interested in identifying conflicts (i.e., issues) and
commitments for their resolution (i.e., agreements).

111
Figure 34 is a graph based on the number of quality-attribute artifacts shown in
Table 21. Users and customers were more active in identifying win conditions (about 50%
of their activities), but less active in identifying issues, options, and agreements (less than
20% of their attributes except for developers’ drafting agreements). However, developers
were more active in identifying issues and agreements (more than 30% of their activities),
but less active in identifying issues and options (less than 20%).
Win Conditions Issues Options Agreements TOTAL
User 94 (55%) 16 (10%) 28 (17%) 30 (18%) 168 (100%)
Customer 117 (46%) 34 (13%) 45 (18%) 61 (23%) 257 (100%)
Developer 26 (11%) 80 (33%) 44 (18%) 96 (38%) 246 (100%)
Table 21. Results of the Analysis of the Quality Artifacts
Win
Condit
ion
Issue
Option
Agree
men
t
Use
r
Cus
tom
er
Dev
elop
er0
50
100
150 User
Customer
Developer
Figure 34. Analysis Graph of Quality Artifacts

112
Figure 35 is a graph based on the number of all artifacts (Table 22) including
infrastructure, domain, and quality-attribute requirements. Like the analysis of the quality-
attribute artifacts, users and customers were more active in identifying win conditions
(more or less 50% of their activities), but less active in identifying issues, options, and
agreements (less than 20% for issues and options, but about 30% for agreements). Users
and customers were more active in identifying agreements of all artifacts (about 30%)
than in identifying agreements of the quality-attribute artifacts (about 20%).
Developers showed more focus on identifying agreements of all artifacts
(about 40%), but showed indiscriminately less focus on identifying win conditions, issues,
and options (about 20%). In the quality-attribute analysis, issues were 33%. This implies
that developers played an more important role to identify the quality-attribute issues rather
than other issues.
Win Conditions Issues Options Agreements TOTAL
User 203 (52%) 29 (7%) 61 (15%) 101 (26%) 394 (100%)
Customer 226 (42%) 52 (10%) 93 (17%) 168 (31%) 539 (100%)
Developer 84 (18%) 95 (20%) 96 (21%) 192 (41%) 467 (100%)
Table 22. Results of the Analysis of all Artifacts

113
win co
nditio
ns
issue
s
optio
ns
agre
emen
ts
user
customer
developer
0
100
200
300
usercustomerdeveloper
Figure 35. Analysis Graph of all Artifacts
114
8.1.3 Analysis of the Effectiveness of QARCC and S-COST
Hypothesis 11 [Effectiveness of the QARCC model and tool]: The number of
quality-conflict issues raised by QARCC is much greater than the number of quality-
conflict issues raised by the students.
The quality-conflict issues which QARCC could potentially identify, based on
its knowledge base of Quality Attribute Strategies, are shown in Table 23. This means that
QARCC could help the students identify, at most, 70 issues per team. The students
without QARCC identified only four issues per team by summing up the average number
of quality-conflict issues per team, as shown in Table 24.
However, all 70 potential issues suggested by QARCC are not significant. The
students need to filter out insignificant suggestions by QARCC. To estimate the minimum
number of significant suggestions by QARCC, the frequency of Quality Attribute
Strategies in the quality-conflict issues raised by the students was analyzed (Table 25). We
can assume that the significant issues can be identified by at least one team. Then, at least
six significant issues could be identified using non-compound Quality Attribute Strategies
(e.g., QAS ID# shown in Appendix B: 2, 7, 10, 17, 18 and 26), and several issues based on
compound Quality Attribute Strategies can be identified by QARCC.

115
D I U R A C P
D 22 2, 8, 22
1a, 2, 6, 9, 12, 13, 15, 16, 22, 24, 27, 30, 31
a. The ID number of Quality Attribute Strategies in Appendix B (Quality Attribute Strategies)
2, 6, 8, 9, 12, 16, 22, 30
I 4, 10, 13, 14, 15, 19, 21, 24, 26
10, 14, 20, 21
U 5, 8 5, 11, 17, 24, 25, 27, 28, 29 8, 25
R 4, 13, 14, 19, 24, 26 14
A 4, 10, 13, 14, 16, 19, 21, 23, 24, 26
10, 14, 18, 20, 21
C 1, 3, 16, 18, 20
P
Table 23. Potential Quality-Conflict Issues Identified by QARCC
For Usabili ty8: Error-reducing user input/output,
Input acceptability checking, Input assertion/type checking, -A, -P
11:Help/explanation, -C17:Navigation, -C24:UI consistency, -C25:UI flexibility, -C, -P27:Undo, -C28: User-programmability, -C29:User-tailorability, -C
For Reusability4: Change-source Hiding, -C13:Interface specification, -C14:Layering, -C, -P19:Parameterization, -C24:UI consistency, -C26:Understandability, -C
For Dependabili ty
1a:Accuracy optimization, -C2: Backup/recovery, -A, -C, -P6: Diagnostics, -C, -P8: Error-reducing user input/output,
Input acceptability checking, Input assertion/type checking, -A, -P
9: Fault-tolerance functions, -C, -P12:Integrity functions, -C, -P13:Interface specification, -C15:Modularity, -C16:Monitoring & Control, -C, -P22:Redundancy, -A, -C, -I, -P24:UI consistency, -C27:Undo, -C30:Verifiability, -C, -P31:Visibility, -C
For Interoperability4: Change-source Hiding, -C10:Generality, -C, -P13:Interface specification, -C14:Layering, -C, -P15:Modularity, -C19:Parametrization, -C21:Portability, -C, -P24:UI consistency, -C25:Understandability, -C
For Adaptaili ty (Evolvabili ty /Portability)4: Change-source Hiding, -C5: Descoping, -U10:Generality, -C, -P13:Interface specification, -C14:Layering, -C, -P16:Modularity, -C19:Parameterization, -C21:Portability, -C, -P23:Self-containedness, -C24:UI consistency, -C26:Understandability, -C
For Cost / Schedule5: Descoping, -U
For Performance1: Accuracy optimization, -C3: Buy faster hardware, -C16:Monitoring & Control, -C18:Optimization, -C, -A20:Platform-feature exploitation, -C,
-A, -I
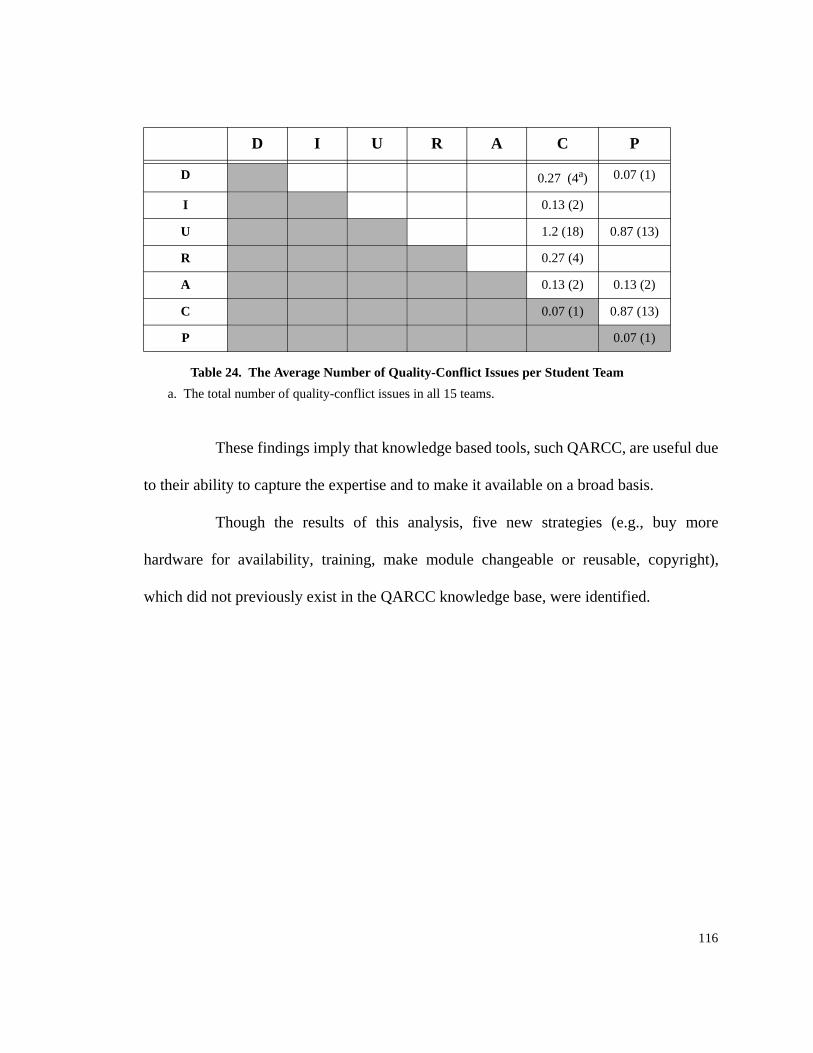
116
These findings imply that knowledge based tools, such QARCC, are useful due
to their ability to capture the expertise and to make it available on a broad basis.
Though the results of this analysis, five new strategies (e.g., buy more
hardware for availability, training, make module changeable or reusable, copyright),
which did not previously exist in the QARCC knowledge base, were identified.
D I U R A C P
D 0.27 (4a)
a. The total number of quality-conflict issues in all 15 teams.
0.07 (1)
I 0.13 (2)
U 1.2 (18) 0.87 (13)
R 0.27 (4)
A 0.13 (2) 0.13 (2)
C 0.07 (1) 0.87 (13)
P 0.07 (1)
Table 24. The Average Number of Quality-Conflict Issues per Student Team

117
It should be noted, however, that about 80% of the issues identified by the
students also can be identified by QARCC.
Quality Attribute StrategyStrategy Frequency in
all 15 teamsTotal
Identified Strategies by QARCC
Backup/Recover 2
48(79 %)
Generality 2
Help/Explanation 2
Descoping 28
Buy faster hardware 10
Platform-feature exploitation 1
Compound Strategies 3
New Strategies (Not Identified by QARCC)
Buy more hardware for avail-ability
1
9(15 %)Training (System Usage) 3
Make modules more change-able
1
Make modules more reusable 3
Copyright 1
Missing, Contaminated, or ambiguous cases
4 4(6%)
Total 61 61 (100 %)
Table 25. Frequency Analysis of Quality Attribute Strategies
118
Hypothesis 12 [Effectiveness of the S-COST model and tool]: The number of cost-
conflict-resolution options in the S-COST knowledge base is much greater than the
number of cost-conflict-resolution options the students raised.
Among 61 quality-conflict issues, 31 were cost-conflict issues (e.g., budget or
schedule overrun issues). S-COST could help the students to resolve these 31 cost-conflict
issues by suggesting potential cost-conflict-resolution options.
The number of the options which S-COST could potentially suggest is 11 per
team, as seen in Table 11. However, the average number of options the students drafted in
a project is approximately two (31 strategies / 15 teams).
Again, all 11 strategies may not be applied because of the significance of the
strategies. For example, the Relax schedule constraint may be not allowed due to the
limitation of the class schedule (i.e., the class should finish by the end of the semester).
We can assume that a strategy drafted by at least one team is significant. Then,
at least five significant options could be drafted using non-compound Cost-Resolution
Option Strategies (e.g., ID#: 1, 2, 3, 6, 11 shown in Table 26) and several options could be
drafted using the compound strategies.
Of the options drafted by the students, 97% can be drafted by S-COST. This
implies that the S-COST Cost-Resolution Option Strategies covered the option space well.
Only one strategy (i.e., Buy information) that the students identified was missing.
Note that 71% of the options were based on the Reduce/Defer functionality
strategy. This implies that the students who had situations where there was a high degree
of functionality combined with a tight class schedule and a small supporting budget didn’t

119
have any other options except of the Reduce/Defer functionality option. Another
implication is that the librarians could not provide more options (e.g., buy new tools or
reuse COTS components) because they didn’t have any budgets for the projects. On the
other hand, discussion between the students and the librarians may not be recorded into
WinWin due to input barriers (e.g., availability of computer facilities during the
discussion, unwillingness of the librarians’ computer use because of their unfamiliarity),
although the conclusion usually is.
Cost-Resolution Option Strategy
Strategy Frequency in all 15 teams
Total
Identified Strategies by S-COST
Reduce/Defer functionality 22
30(97 %)
Reduce/Defer quality 1
Improve tools, techniques, and platform
2
Reuse software assets 3
Increase budget 1
Composition 1
New Strategies (Not Identified by S-COST)
Buy Information 1 1(3 %)
Total 31 31 (100 %)
Table 26. Frequency Analysis of Quality Attribute Strategies
S-COST Cost-Resolution Option Strategies
1: Reduce/defer functionality2: Reduce/defer software quality3: Improve tools, techniques or platforms4: Relax the delivery schedule constraint5: Improve personnel capabilities6: Reuse software assets
7: Improve coordination of multiple project stakeholders as a team
8: Architecture and risk resolution9: Improve process maturity level10: Improve precedentedness and development flexibility11: Increase budget

120
8.1.4 Lessons Learned
The primary conclusions from the analysis of the WinWin data of CS577a
were:
• The negotiation process for the quality-attribute conflict resolution is not much
different from that for the general conflict resolution (e.g., issues were
straightforward to resolve).
• The differences found for hypotheses are strongly suggestive, but not
statistically significant due to the small sample size and the variability across
applications and team styles.
• The primary-concerned relationship between stakeholders’ roles and quality
attributes in the digital library student projects is slightly different from that of
the SEE/SGS (Software Engineering Environment / Satellite Ground System)
project which is one of hypothetical, but representative projects. For example,
the relationship from developers to reusability was eliminated in the student
projects because the reusability of codes the students made was not of concern
in the class, as is the cased with commercial companies.
• The data analysis showed the possibility that QARCC and S-COST help
stakeholders consider additional issues and options. The students drafted issues
using 6 quality attribute strategies among 41 strategies and drafted options
using 5 cost-resolution option strategies among 12 strategies. On the other hand,
the students suggested 5 quality attribute strategies out of 41 strategies to
identify quality-attribute conflicts and suggested 1 option strategy out of 12

121
strategies to resolve the cost conflicts. They are considered to add into the
knowledge base of QARCC and S-COST.
8.2 Survey Results of the Relative Criticality of Attribute Conflicts
This survey was performed to investigate the relative criticality of the conflicts
among software quality attributes such as Dependability, Interoperability, Usability,
Performance, Evolvability & Portability (i.e., Adaptability), Cost & Schedule, and
Reusability. Each quality attribute can be considered as top-level quality attributes which
has associated with more detailed-level quality attributes. For example, Dependability, a
top-level quality, could have association with Reliability/Accuracy, Correctness,
Availability/Survivability, Integrity, Security/Privacy, and Safety, more detailed-level
quality attributes.
The survey form is shown in the next page. The participators in this survey are
Art Davis (NG - Northrop Grumman), Steven Moore (RES - Raytheon Electronic
Systems), Allan Willey (Motorola), Yeondae Chung (SERI - System Engineering
Research Institute, Korea), Mary Hesselgrave (Bell Labs/Lucent), Fred Cummins (EDS -
Electronic Data System), Gary Thomas (RES - Raytheon Electronic Systems). They
ranked the relative criticality of the attribute conflicts on a scale of 0 (generally
insignificant) to 10 (generally critical).

122
INSTRUCTION: Rank the relative criticality of the following attribute conflicts on a scale of 0 (generally insignificant) to 10 (generally critical). Try to consider your organization’s overall range of software applications.
Your Organization: ______________________________________________ Type of your application: _______________________________________Your Name, email, and Phone # :_________________________________
Do you have any special comments? Which situations or cases are top-level critical conflicts among quality attributes?(e.g., __Dependability_ vs ___performance___ : critical for security protection, real-time fault tolerance)
_______________ vs __________________ :
_______________ vs __________________ :
_______________ vs __________________ :
_______________ vs __________________ :
cc: If you have more, please use the back side of this sheet.
Depend-ability
Interopera-bility
Usability Perfor-mance
Evolvabil-ity/Porta-
bility
Cost/Schedule
Reusability
Dependability
Interoperability
Usability
Performance
Evolvability/Portability
Cost/schedule
Reusability

123
The survey results are in the following:
The bar chart of the average of the criticality of quality attributes is shown in
the following figure:
NG RES Motorola SERI Bell Lab EDS RES AVG STDI-D 2 5 8 1 2 8 6 4.6 2.9
U-D 4 5 8 7 1 2 5 4.6 2.5U-I 3 7 9 8 0 5 6 5.4 3.1
R-D 5 8 7 6 2 2 7 5.3 2.4R-I 4 10 7 8 0 2 6 5.3 3.5
R-U 4 10 5 7 4 4 7 5.9 2.3A-D 6 4 2 5 7 3 6 4.7 1.8A-I 3 8 8 9 0 2 7 5.3 3.5
A-U 5 7 8 8 2 3 6 5.6 2.4A-R 2 10 7 8 0 1 8 5.1 4.0C-D 8 5 9 8 8 8 8 7.7 1.3C-I 5 5 5 5 6 8 8 6.0 1.4
C-U 5 4 5 6 3 6 9 5.4 1.9C-R 3 10 7 8 8 10 9 7.9 2.4C-A 5 10 7 5 7 8 9 7.3 1.9P-D 8 10 5 6 8 7 7 7.3 1.6P-I 3 10 5 9 7 10 10 7.7 2.8
P-U 4 8 5 8 0 4 9 5.4 3.2P-R 3 8 7 8 8 8 8 7.1 1.9P-A 7 5 3 7 7 6 8 6.1 1.7P-C 8 10 7 9 9 10 10 9.0 1.2
AVERAGE 4.6 7.6 6.4 7.0 4.2 5.6 7.6STD 1.9 2.3 1.9 1.9 3.4 3.0 1.4
0.01.02.03.04.05.06.07.08.09.0
Ave
rage
I-D U-I R-I A-D A-U C-D C-U C-A P-I P-R P-C
Type of quality-attribute conflicts
Average of the criticality of quality-attribute conflicts

124
Another view of the criticality is the following:
Higher average point means more significant conflicts among quality
attributes. The initial analysis results are in the following:
• Most Significant Conflict (over 9): P-C
• Significant Conflicts (over 7): A-P, I-P, A-C, P-C, E-C, P-R, C-R
• Less Significant Conflicts (over 5): I-U, U-P, I-E, U-E, P-E, I-C, U-C, A-R, I-R,
U-R, E-R
• Insignificant Conflicts (below 5): A-I, A-U, A-E
Higher Standard Deviation (STD) means less converging on the significance of
the quality conflicts among the participators. Thus, the quality conflicts which have lower
STD could have a meaning in most situations.
D I U R A C PD � � �
I � � � � �
U � � � �
R � �
A � �
C �
P
( � : Average rating 9 on scale of 10; �: Average rating 7-8; �: Average rating 5-7)(D: Dependability; I: Interoperability, U: Usability; P: Performance; A: Adaptability; C: Cost/Schedule; R: Reusability)

125
• Lowest STD of the Conflict (below 1.2): P-C
• Lower STD of the Conflicts (below 2.0): A-P, A-E, P-E, U-C, A-C, E-C, P-R
• Higher STD of the Conflicts (over 3.0): I-U, U-P, I-E, I-R, E-R
The primary conclusion from the survey results of the relative criticality of
attribute conflicts were:
• The conflict between Performance and Cost/Schedule was the most important
conflict based on average and STD information.
• The conflicts not involved in Cost/Schedule and Performance were less
important (i.e., low rating).
• Compared with the average number of quality-attribute conflict issues in the
digital library projects (Table 24), the table of the criticality showed that the
conflicts between Usability and Cost/Schedule and between Usability and
Performance were less important. However, both indicated that the conflict
between Performance and Cost/Schedule was one of most important conflicts.

126
9.0 Summary of Key Contributions
• Models for identifying quality conflicts and resolving cost conflicts were developed,
assisting stakeholders to systematically analyze relationships among quality attributes,
identify the potential quality conflicts, create possible resolution options, and
negotiate the drafted options. In particular,
- The Stakeholder/Quality Attribute relationship model and the Stakeholder/
Option Strategy relation model were developed to reduce the complexity of the
conflict identification and resolution process by sending conflict messages only
to the interested stakeholders. Draft forms were developed for aid in negotiating
the identified conflicts.
- Quality Attribute Strategies were developed which refined the relationships
among quality attributes.
- Architecture Strategies were developed and formalized to provide advice about
quality conflict identification and resolution using software architecture concepts
and terms
- S-COST Resolution Option Strategies were developed and formalized to resolve
cost conflicts by option creation through added dimensions.
• Prototype support systems for identifying quality conflicts by QARCC and resolving
cost conflicts by S-COST have been developed to scale up the conflict identification
and resolution process in the WinWin system and to supplement stakeholders’
expertise in conflict identification and resolution. In particular,

127
- QARCC has been developed as the support system for quality conflict
identification.
- S-COST has been developed as the support system for cost conflict resolution
(i.e., option generation and option negotiation). It can also operate as a
COCOMO II adjunct independently of WinWin.
• Analyses of alternative approaches to automated conflict detection and resolution
were performed, providing insights on which types of approaches were more tractable
(model-based, domain-based, keyword-based, semiautomated) and which were less
tractable (domain-independent, natural language-based, fully automated, fully
manual).
• Some initial theories for identifying quality conflicts and resolving cost conflicts (i.e.,
create resolution options and negotiate them for agreements) were developed and then
have enabled us to draw some insights on what conflicts there are and how conflicts
can be resolved. In particular,
- An example for creating options through added dimension was developed, which
provides an initial theoretical base for the S-COST Resolution Option Strategy
model.

128
10.0 Future Extensions
There are many useful extensions which should be made in our models. They
can be broken down into three categories: those that are related to the underlying models
for the conflict identification and resolution (in section 10.1), those that are related to the
support tools for the conflict identification and resolution (in section 10.2), those that are
related to the theories (in section 10.3).
10.1 Extensions to the Models for Conflict Identification and Resolution
Table 27 shows the current status and the extension of the models for conflict
identification and resolution.
10.1.1 Elaboration of Situation-Specific Architecture Strategies
The steps to further define Strategy-Attribute relations and Architecture
Strategies was proposed in section 5.4. Based on these steps, I plan to develop situation-
specific set of Architecture Strategies.
10.1.2 Elaboration of Situation-Specific S-COST Option Strategies
The Stakeholder / Cost_Resolution_Strategies shown in Figure 22 and
Stakeholder_Roles / Option_Strategy_Concern relationship shown in Table 12 can be
refined and customized according to a specific domain.

129
10.2 Extensions to the Tools and General Approaches
Table 28 shows the current status and the extension of the models for the
conflict identification and resolution
10.2.1 Generalization of the QARCC Capabilities
The current QARCC system does not allow the QARCC users to insert, delete,
and change elements of its knowledge bases (e.g., Quality Attribute Strategies, Strategy-
Attribute Relations). The next version of QARCC (called, “QARCC-3”) can have these
What I’ve done What I plan to do
QARCC knowledge-base structure has been developed• Stakeholder/Quality Attribute Relationship
model and its profile analysis• Hierarchy of Quality Attributes• Quality Attribute Strategies (Product and
Process strategies)• Some Architecture Strategies and their
formalism
Elaborate situation-specific Architecture Strategies (section 10.1.1)• Apply the elaboration steps shown in
section 5.4.2 into several domains
Validate the generality of the Stakeholder/Quality Attribute Relationship by analyzing the profiles of more projects such as 15 WinWin exercises in cs577a class
S-COST knowledge-base structure has been developed• Stakeholder/Option Strategy Relation model• S-COST Resolution Option Strategies and their
formalism
Elaborate situation-specific S-COST Resolution Option Strategies (section 10.1.2)• Customize the relations between
Stakeholders and the S-COST Resolution Option Strategies into a specific domain
• Customize Stakeholder Roles / Option Strategy Concern relationship
Perform the profile analysis of S-COST like that of QARCC.
Table 27. Current Status and the Extension of the Models

130
capabilities. However, consistency problems could arise due to the manual alteration of
the knowledge base. The balance of the generality and maturity of knowledge bases can be
determined from experiment results.
10.2.2 Generalization of the S-COST Capabilities
The S-COST capabilities can be generalized by allowing S-COST users to
insert, delete, and change its knowledge bases (e.g., S-COST Strategies, Stakeholder/
Option Strategies Relationship). In the USC-CSE annual research reviews, such
modifications were suggested by the affiliates to generalize the knowledge base.

131
What I’ve done What I plan to do
The following basic QARCC (QARCC 1.0) capabilities have been implemented:• Operation on the context of the initial WinWin system
(tooltalk version)• Identifying the potential quality conflicts among win
conditions (Its focus is to identify the top-level 7 quality attributes).
• Drafting win condition and Issues artifacts in QARCC (QARCC provide the advice about the potential conflicts in the artifacts)
The following more upgraded QARCC(QARCC 3.0) capabilities will be implemented:• All capabilities of QARCC 2.0• Generalization of the capabilities
(section 10.2.1)- Insert, change, and delete of quality
attributes from stakeholders - Insert, change, and delete of Quality
Attribute Strategies and Architecture Strategies with its structured knowledge field-out form
- Conflict Identification by group-to-group of win condition and other artifacts
The following upgraded QARCC (QARCC 2.0) capabilities have been implemented:• Operation on the context of WinWin 1.0 (RPC version)• All capabilities of QARCC 1.0• New UI (which enable stakeholders to navigate the win
conditions associated with the conflicted quality attributes)
• Selection of the interesting quality attributes for each stakeholder
• Sending the potential conflict messages to the interested stakeholders
The following basic S-COST (S-COST 1.0) capabilities have been implemented:• Drafting Option based on the S-COST Resolution Option
Strategies• Visualization of the option generation• Visualization of the option negotiation• Import and export COCOMO files
Extending S-COST to provide schedule improvement advice via CORADMO (COnstructive Rapid Application Development MOdel)
Tightly integrating S-COST with WinWin and COCOMO (i.e., automatically transfer data between S-COST and WinWin or COCOMO)
Extending better visualization aids (e.g., fancy 3D graphic)
The following basic S-COST (S-COST 2.0) capabilities have been implemented:• Implementation of the Option Summary algorithm and
systemThe following upgraded S-COST (S-COST 3.0) capabilities have been implemented:• Implementation of the Stakeholder/Option Strategy
Relation model• Generalization of the capabilities (section 10.2.2)
- Insert, change, delete, save, load, import and export of the S-COST Resolution Option Strategies with its structured knowledge field-out form
- Insert, change, and delete of Stakeholders
Table 28. Current Status and the Extension of the Support Systems

132
The survey results of research plans by 30 USC/CSE affiliate industries are
shown in Figure 36.
LV L N H V HV L
L
N
H
V H
D IF F IC U L T Y
I M P O R T A N C E
A : S ch ed u le T radeo ff A n a ly s is cap ab il ity*
B : S itu a tio n -sp ec if ic S tra teg ies
C : U ti li ty F u n c tio n s: u n d o , red o , co p y, cu t, p aste , sn apsh o t
D : T ig h tly - in teg ra tio n w ith W in W in an d C O C O M O
E : B ette r v isu a liza tio n a id s ( fan cy g rap h ic )
F : S u p p o rt fo r o th er co st estim atio n to o ls
A
BCD
GFE
G : A d v ice fo r a b est se t o f o p tio n s tra teg ies
Figure 36. Survey Results of the S-COST future work
* N o te that C O R A D M O (C O nstructive R ap id A pp lica tion D evelopm en t M O del) m akes the capab ility no t so d iff icu lt.

133
10.3 Extensions to the Theories for Conflict Identification and
Resolution
Table 29 shows the current status and the extension of the theories for the
conflict identification and resolution.
10.3.1 Refinements in Determining the WinWin Value
As the constraints from win conditions are not guaranteed to be unchangeable
in any circumstance, the solid lines shown in Figure 37 are extended into the uncertainty
band. The WinWin value can be determined in the Safe WinWin area (i.e., the WinWin
area which does not contain the uncertainty band). The safe WinWin area can be called the
risk free area from a risk management perspective. A risk-avoidance algorithm (e.g.,
which risks are considered to be significant in the WinWin area, how they can be avoided,
and which value is safest in the WinWin area) is important future work.
What I’ve done What I plan to do
An example for option creation through added dimensions has been developed• The conflict resolution process (for n dimen-
sion conflicts) has been proposed.• Algorithm to determine the existence of the
WinWin solution.
Refine a general algorithm to resolve cost conflict by option creation through added dimensions.
Refine the algorithm for determining the WinWin value. The criteria for determining the value are the following (section 10.3.1):• Risk management factors• Uncertainty factors
Validate the theories through the experiment exercises of their models and support systems. If the theories are not useful, refine or discard them.
Table 29. Current Status and the Extension of the Theory

134
W(C)1
Cost
OFcustomer
OFdeveloper
OFuser
W(D)1
W(U)1
B C
A
Figure 37. Determining the WinWin Value with Uncertainty Factors
# of functions
Safe WinWin Area
* OF: Objective Function; A,B,C: Optimal values for each stakeholder
Uncertainty Area

135
Part III: References and Appendices
A list of references used for this thesis is given, as well as appendices describing
Quality Attributes and Quality Attribute Strategies.

136
11.0 References
[Barbacci et al., 1997] Barbacci, M., Carriere, J., Kazman, R., Klein, M., Lipson, H.,
Longstaff, T., and Weinstock, C., “Steps in an Architecture Tradeoff Analysis Method:
Quality Attribute Models and Analysis” CMU/SEI Technical Report, CMU/SEI-97-TR-29
ADA188100, Software Engineering Institute, Carnegie Mellon University, Pittsburgh, PA,
1997.
[Basili-Rombach, 1987] Basili, V. and Rombach, H., “Tailoring the software process to
project goals and environments,” Proceedings of the 9th International Conference on
Software Engineering (ICSE-9), IEEE Computer Society Press, March, 1987, pp. 345-
357.
[Bell et al., 1988] Bell, E. D., Raiffa, H., and Tversky, A., Decision making: Descriptive,
normative, and prescriptive interactions, Cambridge University Press, 1988.
[Boehm et al., 1973] Boehm, B., Brown, J., Kaspar, H., Lipow, M., MacLeod, G., and
Merritt, M. Characteristics of Software Quality, TRW Series of Software Technology,
TRW Systems and Energy, Inc., 1973. Also published by North Holland, 1978.
[Boehm, 1974] Boehm, B., “Some Steps Toward Formal and Automated Aids to Software
Requirements Analysis and Design,” Proceedings of IFIP 74, August, 1974, pp. 192-197.
[Boehm, 1981] Boehm, B., Software Engineering Economics, Prentice-Hall, 1981.
[Boehm-Ross, 1989] Boehm, B. and Ross, R., “Theory W Software Project Management:
Principles and Examples,” IEEE Trans. on Software Engr., July 1989, pp. 902-916.
[Boehm et al., 1994] Boehm, B., Bose, P., Horowitz, E., and Lee, M., “Software
Requirements As Negotiated Win Conditions,” Proceedings of the First International

137
Conference on Requirements Engineering (ICRE94), IEEE Computer Society Press,
Colorado Springs Colorado, April, 1994, pp. 74-83.
[Boehm et al., 1995] Boehm, B., Bose, P., Horowitz, E., and Lee, M.,“Software
Requirements Negotiation and Renegotiation Aids: A Theory-W Based Spiral Approach,”
Proceedings of the 17th International Conference on Software Engineering (ICSE-17),
IEEE Computer Society Press, Seattle, April, 1995.
[Boehm-In, 1996a] Boehm, B. and In, H., “Identifying Quality-Requirement Conflicts,”
IEEE Software, IEEE Comp. Soc. Press, March, 1996, pp. 25-35.
[Boehm-In, 1996b] Boehm, B. and In, H., “Software Cost Option Strategy Tool (S-
COST),” COMPSAC96 (The Twentiesth Annual International Computer Software and
Applications Conference), IEEE Comp. Soc. Press, Seoul, Korea, August, 1996, pp. 15-
20.
[Boehm-In, 1998] Boehm, B. and In, H., “Conflict Analysis and Negotiation Aids for
Cost-Quality Requirements,” Software Quality Professional (SQP), American Society for
Quality (ASQ), September, 1998 (to be published).
[Bowen et al., 1985] Bowen, T.P., Wigle, G.B., and Tsai, J.T., Specification of Software
Quality Attributes: Software Quality Evaluation Guidebook, Beoing Aerospace Company
Technical Report RADC-TR-85-37, Vol I, II, III, to Rome Air Development Center Air
Force Systems Command, Griffiss Air Force Base, NY, 1985.
[Chung et al., 1995] Chung, L., Nixon, B., and Yu, E., “Using Non-Functional
Requirements to Systematically Support Change,” Proceedings of the Second
International Conference on Requirements Engineering, IEEE Computer Society Press,
March, 1995, pp.132-139.

138
[Conklin-Begeman, 1988] Conklin, J. and Begeman, M., “gIBIS: A Hypertext Tool for
Exploratory Plicy Discussion”, ACM Transactions on Office Information Systems, Vol. 6,
1988, pp. 303-331.
[Deutsch-Willis, 1988] Deutsch, M.S., Willis, R.R., Software Quality Engineering: A
Total Technical and Management Approach, Prentice-Hall Series in Software Engineering
edited by Jensen, R.W., Prentice-Hall, Inc., 1988.
[Dwivedi-Sobolewski, 1991] Dwivedi, Suren N. and Sobolewski, Michael, “Concurrent
Engineering - An Introduction,” Proceedings of the 5th International Conference on CAD/
CAM Probotics and Factories of the Future ‘90, Vol. 1: Concurrent Engineering, 3-16,
New YorK: Springer-Verlag, 1991.
[Dyson, 1991] Dyson, K.A., Quality Evaluation System (QUES): Software Quality
Framework as Implemented in QUES, Software Productivity Solutions, Inc. Technical
Report RL-TR-91-407, Vol I and II to Rome Laboratory Air Force Systems Command,
Griffiss Air Force Base, NY, 1991.
[Easterbrook, 1991] Easterbrook, S., “Handling conflict between domain descriptions
with computer-supported negotiation”, Knowledge Acquisition, March, 1991, pp. 255-289
[Egyed-Boehm, 1997] Egyed, A. and Boehm, B., “Analysis of System Requirement
Negotiation Behavior Patterns,” Proceeding of INCOSE-7, August 1997, pp. 269-276
[Gamma et al., 1995] Gamma, E., Helm, R., Johnson, R., and Vlissides, J., Design
Patterns: Elements of Reusable Object-Oriented Software, Addison-Wesley Pub. Co.,
1995.
[Gilb, 1988] Gilb, T., Principles of Software Engineering Management, Addison-Wesley
Pub. Co., 1988.

139
[Gillies, 1992] Gillies, A.C., Software Quality: Theory and management, International
Thomson Computer Press, 1992.
[IEEE, 1991] IEEE, IEEE Standard Glossary of Software Engineering Terminology, IEEE
Std 610.12-1990, February 1991.
[Jones, 1980] Jones, A.J., Game Theory: mathematical models of conflict, Ellis Horwood
Series, published by Ellis Horweed Limited, distributed by John Wiley & Sons, 1980.
[Kahn-Keller, 1990] Kahn, L. and Keller, S., The Assistant for Specifying the Quality
Software (ASQS), Dynamics Research Corporation Technical Report RADC-TR-90-195,
Vol I and II, to Rome Air Development Center Air Force Systems Command, Griffiss Air
Force Base, NY, 1990.
[Kunz-Rittel, 1970] Kunz, W. and Rittel, H., Issues as elements of information systems,
Working Paper No. 131, Institute of Urban and Regional Development, Univ. of
California, Berkeley, Calif., 1970. (See also Rittel, H., APIS: A Concept for an
argumentative planning information system, Working Paper No. 324, Institute of Urban
and Regional Development, Univ. of California, Berkeley, Calif., 1980.)
[Kazman et al., 1994a] Kazman, R., Bass, L., Abowd, G., and Webb, M., “SAAM: A
Method for Analyzing the Properties of Software Architectures,” Proceedings of the 16th
International Conference on Software Engineering (ICSE-16), IEEE Computer Society
Press, Sorrento, Italy, May, 1994, pp. 81-90.
[Kazman et al., 1996] Kazman, R., Abowd, G., Bass, L., and Clements, P., “Scenario-
Based Analysis of Software Architecture,” IEEE Software 13, 6, IEEE Computer Society
Press, November, 1996, pp. 47-55.
[Kazman et al., 1998] Kazman, R., Klein, M., Barbacci, M., Longstaff, T., Lipson, H., and
Carriere, J., “The Architecture Tradeoff Analysis Method”, CMU/SEI Technical Report,

140
CMU/SEI-98-TR-008 and ESC-TR-98-008, Software Engineering Institute, Carnegie
Mellon University, Pittsburgh, PA, July, 1998.
[Kazman-Bass, 1994b] Kazman, R. and Bass, L. “Toward Deriving Software
Architectures From Quality Attributes,” CMU/SEI-94-TR-10, Pittsburgh, PA: Software
Engineering Institute, Carnegie Mellon University, August, 1994.
[Klein, 1991] Klein, M., “Supporting Conflict Resolution in Cooperative Design
Systems”, IEEE Transactions on Systems, Man, and Cybernetics, Vol. 21, No. 6, pp1379-
1390, Nov/Dec 1991.
[Klein, 1996] Klein, M., “Core services for coordination in concurrent engineering”,
Computers in Industry, Vol. 29, pp105-115, 1996.
[Laprie, 1992] Laprie, J.C. (Ed.), “Dependability: Basic Concepts and Terminology”, IFIP
WG 10.4 Dependable Computing and Fault Tolerance, Springer-Verlag, Vienna, 1992.
[Lee, 1990] Lee, J., “SIBYL: A Qualitative Decision Management System”, In Artificial
Intelligence at MIT: Expanding Frontiers, Edited by P. Winston and S. Shellard, MIT
Press, Cambridge, 1990.
[Lee, 1996] Lee, M., “Foundation of the WinWin Requirements Negotiation System”,
Ph.D. Dissertation, USC, CA, 1996.
[Lipow et al., 1977] Lipow, M., White, B.B., and Boehm, B., Software Quality Assurance:
An Acquisition Guidebook, TRW Software Series Technology Report TRW-SS-77-07,
TRW Systems and Energy, Inc., 1977.
[Luce-Raiffa, 1958] Luce, R.D. and Raiffa, H., Games and Decisions: Introduction and
Critical Survey, John Wiley & Sons, Inc., 1958.
141
[McCall et al., 1977] McCall, J., Richards, P., and Walters, G., “Factors in Software
Quality,” General Electric Command & Information Systems Technical Report 77CIS02
to Rome Air Development Center, Sunnyvale, CA, 1977.
[Murine, 1994] Murine, G.E., Framework Implementation Guidebook, Calspan-UB
Research Center, Technical Report RL-TR-94-146, Rome Laboratory Air Force Systems
Command, Griffiss Air Force Base, NY, 1994.
[Pulli-Heikkinen, 1993] Pulli, Petri J. and Heikkinen, Marko P., “Concurrent Engineering
for Real-time systems”, IEEE Software, Vol. 10, pp 39 - 44, Nov., 1993.
[Pruitt, 1981] Pruitt, D., Negotiation Behavior, Academic Press, 1981
[Ramesh-Dhar, 1992a] Ramesh, B. and Dhar, V., “Supporting Systems Development by
Capturing Deliberations During Requirements Engineering”, IEEE TOSE, Vol. 18 No.6,
1992, pp. 498-519.
[Ramesh-Sengupta, 1992b] Ramesh, B. and Sengupta, K., “Managing Cognitive and
Mixed-motive Conflicts in Concurrent Engineering”, Concurrent Engineering, Vol. 18,
No. 6, 1992, pp 498-519.
[Reddy et al., 1993] Reddy, Y.V. Raman; Srinivas, Kanakanahalli; Jagannathan, V.; and
Karinthi, Raghu, “Computer support for concurrent engineering”, IEEE Software, Vol. 26,
pp 12 - 15, Jan., 1993.
[Robinson-Fickas, 1994] Robinson, W.N., and Fickas, S., “Automated Support for
Requirements Negotiation”, AAAI-94 Workshop on Models of Conflict Management in
Cooperative Problem Solving, 1994, pp. 90-96.
[Schulmeyer-McManus, 1992] Schulmeyer, G.G. and McManus, J.I., Handbook of
Software Quality Assurance, 2nd Edition, Van Nostrand Reinhold, NY, 1992.

142
[Sriram et al., 1992] Sriram, D., Logcher, R., Groleau, N., and Cherneff, J., “DICE: An
Object-Oriented Programming Environment for Cooperative Engineering Design”,
Artificial Intelligence in Engineering Design, Vol. III, Tong, C. and Sriram, D., eds.,
Academic Press, pp. 303-366, 1992
[Sriram-Logcher, 1993] Sriram, D. and Logcher, R., “The MIT Dice Project”, Computer,
pp 64-65, January 1993.
[Sycara, 1991] Sycara, K., “Problem Restructuring in Negotiations”, Management
Science, Vol. 37, No. 10, 1991
[Vincent et al., 1988] Vincent, J., Waters, A., and Sinclair, J., Software Quality Assurance,
Vol I and II, Prentice-Hall, Inc., 1988.
[Webster, 1993] Webster, Dictionary, 1993.

143
12.0 Appendix A: Quality Attributes 1
12.1 Dependability
Dependability is defined as “that property of a computer system such that
reliance can justifiably be placed on the service it delivers” [Laprie, 1992]. Depending on
the intended application of the system dependability is usually expressed as a number of
inter-dependent properties such as reliability, maintainability and safety. It refers to a
broad notion of what has historically been referred to as “fault tolerance”, “reliability”, or
“robustness”.
1. Main References: [Bowen et al., 1985], [Boehm et al., 1973], [Dyson, 1991], [Lipow et al.,1977], [McCall et al., 1977], [Murine, 1994], [Schulmeyer-McManus, 1992], [Deutsch-Wil-lis, 1988], [IEEE, 1991]
Dependability Interoperability Usability Performance Cost &Schedule
Reliability/Accuracy
Availability/Survivability
Safety
Correctness
Integrity
Security/Privacy
InterfaceCompatibility
MissionOrientation
Comprehen-siveness
Controllability
Architecture Balance
ElementPerformance
Verifiability
Modifiability
Expandability
Flexibility Maintainability/Debuggability
DevelopmentAffordability
DevelopmentTimeliness
Reusability
Reusable SW Assets
Key DevelopmentPersonnel
Scalability
Adaptability
contributes-to

144
12.1.1 Reliability/Accuracy
Reliability is defined by the ability of a system or component to perform its
required functions under stated conditions for a specified period of time [IEEE, 1991].
• Accuracy: (1) A qualitative assessment of correctness, or freedom from error; (2) A
quantitative measure of the magnitude of error [IEEE, 1991].
- Accuracy checklist (AC.1) [Bowen et al., 1985; Dyson, 1991; Murine, 1994]
Is-there (accuracy rqmts, for all applicable functions)
Is-there (quantitative accuracy rqmts for input/output variables of each applicable function)
Is-there (quantitative accuracy rqmts for the constants of each applicable function)
Support (enough precision of existing math library routines for accuracy objectives)
• Anomaly Management: Anything observed in the documentation or operation of
software that deviates from expectations based on previously verified software products
or reference documents [IEEE, 1991].
- Error tolerance/control (AM.1) [Bowen et al., 1985; Dyson, 1991; Murine, 1994]
#1 (instances of centrally controlled concurrent processing) / # (instances of concurrent processing)
# (recognized error conditions required recovery or repair) / # (error conditions)
- Improper input data (AM.2)
Is-there (error tolerances for all external input data (e.g., range of numerical values, legal combinations of alphanumeric values))
- Computational failures (AM.3)
Is-there (rqmts for detection of recovery from all computational failures)
- Hardware faults (AM.4)
Is-there (rqmts to recover from all detected hardware faults (e.g., power failure, clock interrupt))
- Device errors (AM.5)
Is-there (rqmts to recover from all I/O device errors)
- Communication errors (AM.6)
Is-there (rqmts to recover from all communication transmission errors)
- Node/communication failures (AM.7)
Is-there (rqmts to recover from all failures to communicate with other nodes or other systems)
1. “The number of”

145
• Simplicity: The degree to which a system or component has a design and
implementation that is straightforward and easy to understand [IEEE, 1991].
- Design structure (SI.1(10)) [Bowen et al., 1985; Dyson, 1991; Murine, 1994]
Is-there (diagrams identify all formats in a standard fashion)
Is-there (rqmt for programming standard)
- Structured language or preprocessor (SI.2(1))
Is-there (rqmt to use a structured language or preprocessor to implement the software)
- Data and control flow complexity (SI.3(1))
- Coding simplicity (SI.4(14))
Is-there (rqmt for a programming standard)
- Specificity (SI.5(3))
- Halsteed’s level of difficulty measure (SI.6(1))
12.1.2 Correctness
Correctness is defined by: (1) The degree to which a system or component is
free from faults in its specification, design, and implementation; (2) The degree to which
software, documentation, or other items meet specified requirements; (3) The degree to
which software, documentation, or other items meet user needs and expectations, whether
specified or not [IEEE, 1991].
• Completeness: Those characteristics of software which provide full implementation of
the functions required [Bowen et al., 1985; Schulmeyer-McManus, 1992].
- Completeness checklist (CP.1(11)) [Bowen et al., 1985; Dyson, 1991; Murine, 1994]
Clearly-define (I/O, processing)
# (documented data reference with source, meaning and format) / # (data reference)
All-referred (all defined functions (i.e., documented with source, meaning, format))
Allocate (all defined functions, configuration items (i.e., CSCI’s, HWCI’s))
Define (all referenced functions (i.e., documented with I/O, processing rqmts))
Describe (processing flows (algorithms) and all decision points (condition stmts) in the flows for all functions)
146
• Consistency: The degree of uniformity, standardization, and freedom from
contradiction among the documents or parts of a system or component [IEEE, 1991].
- Procedure consistency (CS.1(5)) [Bowen et al., 1985; Dyson, 1991; Murine, 1994]
Is-there (rqmt to standardize all design representations (e.g., control flow, data flow))
Is-there (rqmt to standardize the calling sequence protocol between software units)
Is-there (rqmt to standardize the external I/O protocol and format for all software units)
Is-there (rqmt to standardize error handling for all software units)
Use (a single, unique name for all references to the same function)
- Data consistency (CS.2(6))
Is-there (rqmt to standardize all data representation in the design)
Is-there (rqmt to standardize the naming of all data)
Is-there (rqmt to standardize the definition and use of global variables)
Is-there (rqmt to establish consistency and concurrence of multiple copies of the same software or database version)
Is-there (rqmt to verify consistency and concurrence of multiple copies of the same software or database version)
Use (a single, unique name for all references to the same data)
• Traceability: (1) The degree to which a relationship can be established between two or
more products of the development process, especially products having a predecessor-
successor or master-subordinate relationship to one another; for example, the degree to
which the requirements and design of a given software component match; (2) The
degree to which each element in a software development product established its reason
for existing; for example, the degree to which each element in a bubble chart references
the requirement that it satisfied [IEEE, 1991].
- Cross reference (TC.1(2))
12.1.3 Survivability/Availability
The concern with survivability is that software continue to perform (e.g., in a
degraded mode) even when a portion of the system has failed.
• Anomaly Management (See section 12.1.1)

147
• Autonomy: Those characteristics of software which determine its non-dependency on
interfaces and functions [Bowen et al., 1985; Dyson, 1991].
- Interface complexity (AU.1(14)) [Bowen et al., 1985; Dyson, 1991; Murine, 1994]
Partitioned (all processes and functions to be logically complete and self-contained to minimize interface complexity)
- Self-sufficiency (AU.2(2))
Is-there (rqmt for each operational CPU/system to have a separate power source)
Is-there (rqmt for the executive software to perform testing of its own operation and of the communication links, memory devices, and peripheral devices)
• Distributedness: Those characteristics of software which determine the degree to which
software functions are geographically or logically separated within the system [Bowen
et al., 1985; Dyson, 1991].
- Design structure (DI.1(9)) [Bowen et al., 1985; Dyson, 1991; Murine, 1994]
Provide (graphic portrayal (e.g., figures, diagrams, tables) to identify all s/w functions and functional interfaces)
Provide (graphic portrayal to identify all different types of system-level information and the information flow within the system)
Is-there (rqmt for the organization and distribution of information within the system (e.g., information distributed across nodes or among storage devices))
Is-there (rqmt for file/library accessibility from each node)
Is-there (rqmt for providing alternate processing sources within the system (e.g., multiple processors, alternate node))
Is-there (rqmt to distribute all mission-critical functions over redundant elements or nodes)
Is-there (rqmt to distribute control functions across different nodes/elements so as to ensure system operation under anomalous conditions)
Is-there (rqmt for implementing functions across several physical structures (i.e., function and physical structure are not necessarily the same))
• Modularity: The degree to which a system or computer program is composed of
discrete components such that a change to one component has minimal impact on other
components [IEEE, 1991].
- Modular implementation (MO.1(1)) [Bowen et al., 1985; Dyson, 1991; Murine, 1994]
Is-there (rqmt to develop all software functions and software elements according to structured design techniques (e.g., top-down design))
- Modular design (MO.2(8))
Is-there (rqmt regarding the relationships among software entities (e.g., rqmts to minimize content, common and external coupling among software entities))

148
Is-there (rqmt regarding the relationships between the elements within software entities (e.g., all software entities are required to reflect an average cohesion value of 0.6 or greater))
• Reconfigurability: Those characteristics of software which provide for continuity of
system operation when one or more processors, storage units, or communication links
fails [Bowen et al., 1985; Dyson, 1991].
- Restructure checklist (RE.1(4)) [Bowen et al., 1985; Dyson, 1991; Murine, 1994]
Is-there (rqmt to ensure communication paths to all remaining nodes/communication links in the event of a failure of one node/link)
Is-there (rqmt for maintaining the integrity of all data values following the occurrence of anomalous conditions)
Is-there (rqmt to enable all disconnected nodes to rejoin the network after recovery, such that the processing functions of the system are not interrupted)
Is-there (rqmt to replicate all critical data in the system at two or more distinct nodes)
12.1.4 Integrity
Integrity is defined by the degree to which a system or component prevents
unauthorized access to, or modification of, computer programs or data [IEEE, 1991].
• System Accessibility: Those characteristics of software which provide for control and
audit of access to the software and data [Bowen et al., 1985].
- Access control (SS.1(4)) [Bowen et al., 1985; Dyson, 1991; Murine, 1994]
Is-there (rqmt to control user input/output access in the system (e.g., login name and password))
Is-there (rqmt to control data access in the system)
Is-there (rqmt to control the scope of task operations during execution (e.g., privileged cmds))
Is-there (rqmt to control access to the network)
- Access audit (SS.2(4))
Is-there (rqmt to record and report all access to the system (e.g., record terminal and processor linkage, data file access, and jobs run information))
Is-there (rqmt to immediately indicate and identify all access violations)
Is-there (rqmt to isolate I/O functions from computational functions)
12.1.5 Verifiability
Verifiability deals with software design characteristics affecting the effort to
verify software operation and performance [Bowen et al., 1985; Dyson, 1991].

149
• Simplicity (see section 12.1.1 Reliability)
• Modularity (see section 12.1.3 Survivability/Availability)
• Self-Descriptiveness: Those characteristics of software which provide explanation of
the implementation of functions [Bowen et al., 1985; Schulmeyer-McManus, 1992].
- Quality of comments (SD.1(1)) [Bowen et al., 1985; Dyson, 1991; Murine, 1994]
- Effectiveness of comments (SD.2(8))
Standardize (each unit prologue with unit’s function, author, version number, version date, inputs, outputs, algorithms, assumptions and limitations)
Standardize (the identification and placement of comments in the unit)
- Descriptiveness of language (SD.3(6))
Standardize (format for the structure of units)
• Visibility: Those characteristics of software which provide status monitoring of the
development and operation [Bowen et al., 1985; Dyson, 1991].
- Unit testing (VS.1 (2)) [Bowen et al., 1985; Dyson, 1991; Murine, 1994]
- Integration testing (VS.2 (1))
- CSCI testing (VS.3 (3))
12.2 Interoperability
Interoperability is defined by the ability of two or more systems or components
to exchange information and to use the information that has been exchanged [IEEE, 1991].
• Modularity (see section 12.1.3 Survivability/Availability)
• Commonality: Those characteristics of software which provide for the use of interface
standards for protocols, routines, and data representations [Bowen et al., 1985; Dyson,
1991].

150
- Communications commonality (CL.1 (14)) [Bowen et al., 1985; Dyson, 1991; Murine, 1994]
Is-there (rqmt for communication with other systems)
Is-there (rqmt for a protocol standard to control all network communication)
Standardize (network processing control using the network protocol standard)
Standardize (user session control using the network protocol standard)
Standardize (communication routing using the network protocol standard)
Standardize (uniform message handling (e.g., synchronization, message decoding) using the network protocol standard)
1 / # (input functions from other systems)
1 / # (output functions from other systems)
- Data commonality (CL.2 (8))
Is-there (rqmts for a standard to establish common representations of data for uniform communication with other system)
1/ #(functions performed data translations)
Is-there (rqmts to receive all input data from other systems in common formats)
1 / (1 + #(different formats used for input data from other systems))
Is-there (rqmts to output all data to other systems in common formats)
1 / (1 + #(different formats used for output data from other systems))
- Common vocabulary (CL.3 (1))
Is-there (a common technical vocabulary with equivalent definitions for this system and all interoperating systems)
• Functional Overlap: Those characteristics of software which provide common
functions to both systems [Bowen et al., 1985; Dyson, 1991].
- Function overlap checklist (FO.1 (4)) [Bowen et al., 1985; Dyson, 1991; Murine, 1994]
1 - ( #(duplicated functions in interoperating system) / #(functions) )
• Independence: Those characteristics of software which determine its non-dependency
on software environment (computing system, operating system, utilities, input-output
routines, libraries) [Bowen et al., 1985; Dyson, 1991].
- Software independence function system (ID.1 (3)) [Bowen et al., 1985; Dyson, 1991; Murine, 1994]
Is-there (rqmts to use a standard subset of the implementation language)
Establish (a standard subset of the implementation language for coding)
- Machine independence (ID.2 (4))
Support (same version and dialect of the implementation language on other machines)

151
• System/Interface Compatibility: Those characteristics of software which provide the
hardware, software, and communication compatibility of two systems [Bowen et al.,
1985; Dyson, 1991].
- Communication compatibility (SY.1 (4)) [Bowen et al., 1985; Dyson, 1991; Murine, 1994]
Is-there (rqmts for the I/O transmission rates of this system to be the same as the interoperating system)
Is-there (rqmts for this system to use the same communication protocol as the interoperating system)
Is-there (rqmts for common interpretation of the content in all messages sent from and received by this system and by the interoperating system)
Is-there (rqmts for this system to use the same structure and sequence for message contents as the interoperating system)
- Data compatibility (SY.2 (3))
Is-there (rqmts for this system to use the same data format as the interoperating system)
Is-there (rqmts for this system to establish the same data base structure as the interoperating system)
Is-there (rqmts for this system to provide the same data base access techniques as the interoperating system)
- Hardware compatibility (SY.3 (6))
Is-there (rqmts for this system to use the same word length as the interoperating system)
Is-there (rqmts for this system to use the same interrupt structure as the interoperating system)
Is-there (rqmts for this system to use the same instruction set as the interoperating system)
- Software compatibility (SY.4 (3))
Is-there (rqmts for this system to use the same source code language as the interoperating system)
Is-there (rqmts for this system to use the same supporting software as the interoperating system)
- Document for other system (SY.5 (1))
Is-there (documentation for interoperability rqmts with the interoperating systems)
12.3 Usability
Usability is defined by the ease with which a user can learn to operate, prepare
inputs for, and interpret outputs of a system or component [IEEE, 1991].
• Operability (Mission orientation, Controllability): Those characteristics of software
which determine operations and procedures concerned with operation of software
[Schulmeyer-McManus, 1992] and which provide useful inputs and outputs which can
be assimilated [Bowen et al., 1985].

152
- Operability checklist (OP.1 (16)) [Bowen et al., 1985; Dyson, 1991; Murine, 1994]
Is-there (error reporting)
Is-there (specification of response for errors)
Is-there (interrupt capability by operator (e.g., stop, save and enter data, continue processing))
1/ (1 + #(operations performed by the operator for a typical mission/job))
Is-there (rqmts to specify the procedures for setting up a mission/job and completing it)
Is-there (rqmts to maintain a hard copy log of all operator interactions with the system)
Is-there (rqmts to provide simple and consistent operator messages and require simple and consistent operator responses)
Is-there (rqmts to report all access violations to the operator)
Is-there (rqmts specifying the appropriate responses for all access violation)
Is-there (rqmts to provide the operator/user the capability to obtain specific system (or network) resource status information and to reallocation resources)
Is-there (rqmts to provide the operator/user the capability to manipulate data regardless of the data’s location in the system)
Is-there (rqmts to make system implementation details transparent to the user (e.g., the user can access a file without knowing its location in the system)
- User input communicativeness (OP.2 (6))
#(input parameters with default values) / #(input parameters)
Is-there (rqmts to enable the user to review and modify all input data prior to execution)
Is-there (rqmts to terminate all user-input data by explicitly defined logical end of input)
Is-there (rqmts to provide the user options for input media (e.g., terminal, tape drive))
- User output communicativeness (OP.3 (8))
Is-there (rqmts to provide the user with output control (e.g., output media, output format, amount of output))
Is-there (rqmts for all outputs to the user to have unique, descriptive labels for identifying data)
Is-there (rqmts for all error messages to clearly identify the nature of the error to the user)
Is-there (rqmts to provide the user with options for output media)
Is-there (rqmts to establish a standard (common) user command language for network information and data access)
• Training (Comprehensiveness): Those characteristics of software which provide
transition from current operation and provide initial familiarization [Bowen et al., 1985;
Schulmeyer-McManus, 1992].
- Training checklist (TN.1 (4)) [Bowen et al., 1985; Dyson, 1991; Murine, 1994]
Is-there (rqmts to provide lesson plans and training materials for operators, and users, and maintainers of the system)
Is-there (rqmts to provide realistic simulation exercises for the system)
Is-there (rqmts to provide “help” information and diagnostic information for the operator, end user, and maintainer of the system)
Is-there (rqmts to provide selectable levels of aid and guidance for system users of different degrees of expertise)

153
12.4 Performance (Efficiency)
Performance is defined by the degree to which a system or component
accomplishes its designated functions within given constraints, such as speed, accuracy, or
memory usage [IEEE, 1991]. Efficiency is defined by the degree to which a system or
component performs its designated functions with minimum consumption of resources
[IEEE, 1991].
• Communication Efficiency (of Element Performance): Those characteristics of
software which provide for minimum utilization of communication resources in
performing functions [Bowen et al., 1985; Dyson, 1991].
- Communication effectiveness measure (EC.1 (1)) [Bowen et al., 1985; Dyson, 1991; Murine, 1994]
Is-there (performance rqmts and limitations for system communication efficiency)
• Processing Efficiency (of Element Performance): Those characteristics of software
which provide for minimum utilization of processing resources in performing functions
[Bowen et al., 1985; Dyson, 1991].
- Processing effectiveness measure (EP.1 (6)) [Bowen et al., 1985; Dyson, 1991; Murine, 1994]
Is-there (rqmt for processing efficiency (e.g., flow time for process, execution time))
Is-there (rqmt to use an optimizing compiler or to code in assembly language to optimize processing efficiency)
Is-there (rqmt for no overlays in memory management of the system)
- Data usage effectiveness measure (EP.2 (7))
Is-there (rqmt for efficiently storing data)
Is-there (variable initialization when the variable is declared)
• Storage Efficiency (of Element Performance): Those characteristics of software which
provide for minimum utilization of storage resources in performing functions [Bowen
et al., 1985; Dyson, 1991].
154
- Storage effectiveness measure (ES.1 (8)) [Bowen et al., 1985; Dyson, 1991; Murine, 1994]
Is-there (rqmt for storing data to efficiently utilize primary and secondary storage)
Is-there (virtual storage)
Is-there (dynamic reallocation of physical memory space during execution)
Is-there (rqmt to use an optimizing compiler or to code in assembly language to optimize storage efficiency)
12.5 Adaptability
Adaptability is defined by the ease with which a system or component can be
modified for use in applications or environments other than those for which it was
specifically designed [IEEE, 1991].
• Simplicity (see section 12.1.1 Reliability/Accuracy)
• Modularity (see section 12.1.3 Survivability/Availability)
• Self-Descriptiveness (see section 12.1.5 Verifiability)
12.5.1 Verifiability (see section 12.1.5 Verifiability)
12.5.2 Flexibility
Flexibility is defined by the easy with which a system or component can be
modified for use in applications or environments other than those for which it was
specifically designed [IEEE, 1991].
• Generality: (1) The degree to which a system or component performs a broad range of
functions [IEEE, 1991]. (2) Those attributes of the software that provide breadth to the
functions performed [Schulmeyer-McManus, 1992].
- Unit references (GE.1 (1)) [Bowen et al., 1985; Dyson, 1991; Murine, 1994]
- Unit implementation (GE.2 (4))

155
12.5.3 Expandability
Expandability is defined by the easy with which a system or component can be
modified to increase its storage or functional capability [IEEE, 1991].
• Generality (see section 12.5.2 Flexibility)
• Augmentability: Those characteristics of software which provide for expansion of
capability for functions and data [Bowen et al., 1985; Dyson, 1991].
- Data storage expansion (AT.1 (3)) [Bowen et al., 1985; Dyson, 1991; Murine, 1994]
Is-there (rqmt for spare memory storage capacity)
Is-there (rqmt for spare auxiliary storage capacity)
- Computation extensibility (AT.2 (3))
Is-there (rqmt for spare processing capacity (time))
- Channel extensibility (AT.3 (2))
Is-there (rqmt for spare I/O channel capacity (time))
Is-there (rqmt for spare communication channel capacity (time))
- Design extensibility (AT.4 (3))
Is-there (rqmt for interface compatibility among all the processors, communication links, memory devices, and peripherals)
Document (the results of any previous engineering studies such as tradeoff studies, feasibility studies, risk analyses, and requirements definitions)
Document (new or emerging software-related disciplines which may affect the scope of the software requirements or the software implementation techniques)
• Virtuality: Those characteristics of software which present a system that does not
require user knowledge of the physical, logical, or topological characteristics [Bowen et
al., 1985; Dyson, 1991].
- System data independence (VR.1 (1)) [Bowen et al., 1985; Dyson, 1991; Murine, 1994]
Is-there (rqmt to make system implementation details transparent to the user (e.g., the user can create a file without specifying its location in the system/network))

156
12.5.4 Maintainability/Debuggability
Maintainability is defined by: (1) The easy with which a software system or
component can be modified to correct faults, improve performance or other attributes, or
adapt to a changed environment; (2) The easy with which a hardware system or
component can be retained in, or restored to, a state in which it can perform its required
functions [IEEE, 1991].
• Visibility (see section 12.1.5 Verifiability)
• Consistency: The degree of uniformity, standardization, and freedom from
contradiction among the documents or parts of a system or component [IEEE, 1991].
- Procedure consistency (CS.1 (5)) [Bowen et al., 1985; Dyson, 1991; Murine, 1994]
Standardize (the calling sequence protocol between software units)
Standardize (all design representation (e.g., representations for control flow, data flow))
Standardize (external I/O protocol, format)
Standardize (error handling)
Is-there (a single, unique name to the same functions referred)
- Data consistency (CS.2 (6))
Standardize (all data representation in the design)
Standardize (definition and use of global variables)
Is-there (rqmts to establish consistency and concurrency of multiple copies of the same software or data base version)
Is-there (rqmts to verify consistency and concurrency of multiple copies of the same software or data base version)
Is-there (a single, unique name to the same data referred)
12.6 Development Cost and Schedule
The cost and schedule for developing the software including design, coding,
and testing.

157
12.7 Reusability
Reusability is the degree to which a software module or other work product can
be used in more than one computer program or software system [IEEE, 1991].
• Simplicity (see section 12.1.1 Reliability/Accuracy)
• Modularity (see section 12.1.3 Survivability/Availability)
• Self-Descriptiveness (see section 12.1.5 Verifiability)
• Independence (see section 12.2 Interoperability)
• Generality (see section 12.5.2 Flexibility)
• Application Independence: Those characteristics of software which provide full
implementation of the function required [Bowen et al., 1985].
- Database management implementation independence (AP.1 (1)) [Bowen et al., 1985; Dyson, 1991;
Murine, 1994]
Is-there (rqmts to limit specific references to the data base management scheme)
- Data structure (AP.2 (4))
Standardize (commenting all global data within a software unit to show where data is derived, the data’s compositions, and how the data is used)
Standardize (commenting all parameter input/output and local variables within a software unit which includes requirements identifying the data’s composition and use)
- Architecture standardization (AP.3 (2))
Is-there (rqmts to localize specific references to computer architecture (e.g., specific device references localized to the executive rather than the application software))
- Microcode independence (AP.4 (1))
Is-there (rqmts to avoid or to limit the use of microcode instruction statements)
- Functional independence (AP.5 (3))
Is-there (rqmts to develop functional processing algorithms such that they are not unique to this system’s application)

158
• Document Accessibility: Those characteristics of software which provide for easy
access to software and selective use of its components [Bowen et al., 1985; Dyson,
1991].
- Access to document (DO.1 (1)) [Bowen et al., 1985; Dyson, 1991; Murine, 1994]
Access (current versions of all software documentation)
- Well-structural document (DO.2 (8))
Specify (all documentation, clearly and simply such that procedures, functions, algorithms can be easily understood)
Specify (control and data flow with graphic portrayal, clearly)
Is-there (indexing scheme for all documents)
Is-there (separated volumes or separations within a single volume based on system functions)
Is-there (comprehensive descriptions of all system/software functions)
• Functional Scope: Those characteristics of software which provide commonality of
functions among applications [Bowen et al., 1985; Dyson, 1991].
- Functional specificity (FS.1(2)) [Bowen et al., 1985; Dyson, 1991; Murine, 1994]
- Functional commonality (FS.2(6))
Is-there (rqmts to construct functions in such a way to facilitate their use in other similar system applications)
Document (specific use and limitations of the data)
Document (input/output formats)
Document (outputs as to the specific use and interpretation of the data)
- Functional selective usability (FS.3(3))
Is-there (rqmts to provide the user options for computation and output (e.g., selection of type of coordinate system, output media, format))
Is-there (rqmts to enable modification of the resources allocated to functions (e.g., changing the amount of memory work space for a function))
• System Clarity: Those characteristics of software which provide for clear description of
program structure in a non-complex and understandable manner [Bowen et al., 1985;
Dyson, 1991].
- Interface complexity (ST.1 (6)) [Bowen et al., 1985; Dyson, 1991; Murine, 1994]
- Program flow complexity (ST.2 (5))
- Application functional complexity (ST.3 (6))
Is-there (rqmts to isolate I/O functions from computational function)

159
- Communication complexity (ST.4 (5))
- Structure clarity (ST.5 (4))

160
13.0 Appendix B: Quality Attribute Strategies (QAS)
QAS 1. Accuracy EngineeringDefinition:
- Adjust and balance the accuracy of inputs and outputs of each component in the system based on required and desired accuracy criteria.
Preconditions: - Required and desired accuracy level, measure of accuracy, criteria for the optimum state of accuracy
Postconditions (Suggestions for achieving relevant quality attributes or their results): - Get efficient and accurate outputs of the system with reasonable resources.
Effects on quality attributes: - Dependability: (+, more accurate with available resources) - Performance (+, more efficient by removing heavy processing for unnecessary component accuracy in the
system viewpoint) - Cost, Schedule: (-, more to specify, develop, and verify)
QAS 2. Backup/Recovery (see appendix 14.0)
QAS 3. Buy Faster Hardware (see appendix 14.0)
QAS 4. Change-source Hiding (see appendix 14.0)
QAS 5. DescopingDefinition:
- Reduce or defer the number of components or their quality.Preconditions:
- Prioritize the components or quality based on their importance. - Identify dependencies of the components
Postconditions (Suggestions for achieving relevant quality attributes or their results): - Capabilities unavailable to stakeholders - Need to pay later if deferred
Effects on quality attributes: - Adaptability: (+, easy to maintain unless adaptability features descoped) - Usability: (-, capabilities unavailable to users) - Cost, Schedule: (+, reduce development cost and schedule; -, increase maintenance cost)
QAS 6. Diagnostics (see appendix 14.0)
QAS 7. Domain architecture-driven (see appendix 14.0)
QAS 8. Error-reducing user input/output, Input Checking, Input assertion/type checking (see appendix 14.0)
QAS 9. Fault-tolerance functions (see appendix 14.0)
QAS 10. GeneralityDefinition:
- Units of software are general if they provide a service for more than one function, that is, if two or more software components request them.
Preconditions: - A primitive function that can have many uses, general unit interface.
Postconditions: - Use object managers wherever possible - Avoid mixing input, processing, and output in one unit. - Parameterize limits on input data structure size and data item values
Effects on quality attributes: - Adaptability, Interoperability (+, more flexible to be modifiable, portable, or interoperable)
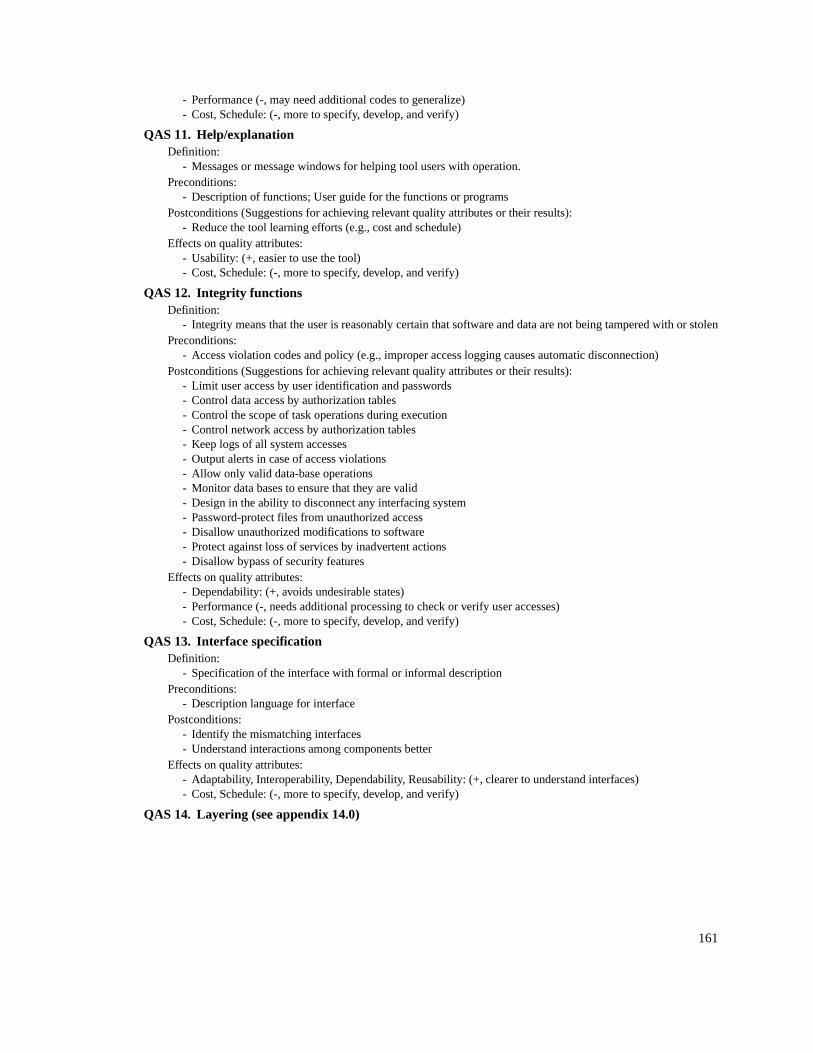
161
- Performance (-, may need additional codes to generalize) - Cost, Schedule: (-, more to specify, develop, and verify)
QAS 11. Help/explanationDefinition:
- Messages or message windows for helping tool users with operation.Preconditions:
- Description of functions; User guide for the functions or programsPostconditions (Suggestions for achieving relevant quality attributes or their results):
- Reduce the tool learning efforts (e.g., cost and schedule)Effects on quality attributes:
- Usability: (+, easier to use the tool) - Cost, Schedule: (-, more to specify, develop, and verify)
QAS 12. Integrity functionsDefinition:
- Integrity means that the user is reasonably certain that software and data are not being tampered with or stolenPreconditions:
- Access violation codes and policy (e.g., improper access logging causes automatic disconnection)Postconditions (Suggestions for achieving relevant quality attributes or their results):
- Limit user access by user identification and passwords - Control data access by authorization tables - Control the scope of task operations during execution - Control network access by authorization tables - Keep logs of all system accesses - Output alerts in case of access violations - Allow only valid data-base operations - Monitor data bases to ensure that they are valid - Design in the ability to disconnect any interfacing system - Password-protect files from unauthorized access - Disallow unauthorized modifications to software - Protect against loss of services by inadvertent actions - Disallow bypass of security features
Effects on quality attributes: - Dependability: (+, avoids undesirable states) - Performance (-, needs additional processing to check or verify user accesses) - Cost, Schedule: (-, more to specify, develop, and verify)
QAS 13. Interface specificationDefinition:
- Specification of the interface with formal or informal descriptionPreconditions:
- Description language for interfacePostconditions:
- Identify the mismatching interfaces - Understand interactions among components better
Effects on quality attributes: - Adaptability, Interoperability, Dependability, Reusability: (+, clearer to understand interfaces) - Cost, Schedule: (-, more to specify, develop, and verify)
QAS 14. Layering (see appendix 14.0)

162
QAS 15. Modularity
Definition: - Software is modular if it is designed and implemented with all of the modern techniques that lead to an orderly,
cohesive component structure with optimum coupling.Preconditions:
- Definition of optimum coupling; compatible design unitsPostconditions (Suggestions for achieving relevant quality attributes or their results):
- Maximize the cohesion of units - Minimize the complexity and volume in unit coupling - Separate each unit into a specification, declaration, and execution part. - Use a structured design and testing technique. - Make a design unit have a single processing objective.
Effects on quality attributes: - Dependability, Adaptability, Interoperability: (+, easy to trace and understand components) - Cost, Schedule: (-, more to specify, develop, and verify)
QAS 16. Monitoring & Control (see appendix 14.0)
QAS 17. NavigationDefinition:
- The system has a capability of browsing from one place to anotherPreconditions:
- Navigation method, algorithm, or graphic representationPostconditions (Suggestions for achieving relevant quality attributes or their results):
- Navigate the system through “Zoom In/ Zoom Out”; Effects on quality attributes:
- Usability (+, Users can get an easy access of what they want) - Cost, Schedule: (-, more to specify, develop, and verify)
QAS 18. OptimizationDefinition:
- Optimization of used memory, size of program, execution timePreconditions:
- Optimization algorithm for memory, disk space, and execution time.Postconditions:
- Use optimization compiler - Tradeoffs may exist among components (e.g., disk space vs. execution time)
Effects on quality attributes: - Adaptability: (-, difficult to change codes with sustaining the optimum state) - Performance (+, fast due to optimization of memory, disk space, and execution time) - Cost, Schedule: (-, more to specify, develop, and verify)
QAS 19. Parametrization (see appendix 14.0)
QAS 20. Platform-feature exploitationDefinition:
- Take advantage of features of the platformPreconditions:
- Feature list; conditions for applying the useful features into your application
GET LIST(X)CALCULATE Y = AVE(x)OUTPUT Y
AVE
GET X CALCULATE OUTPUT
x1,..xn AVE(X) printer
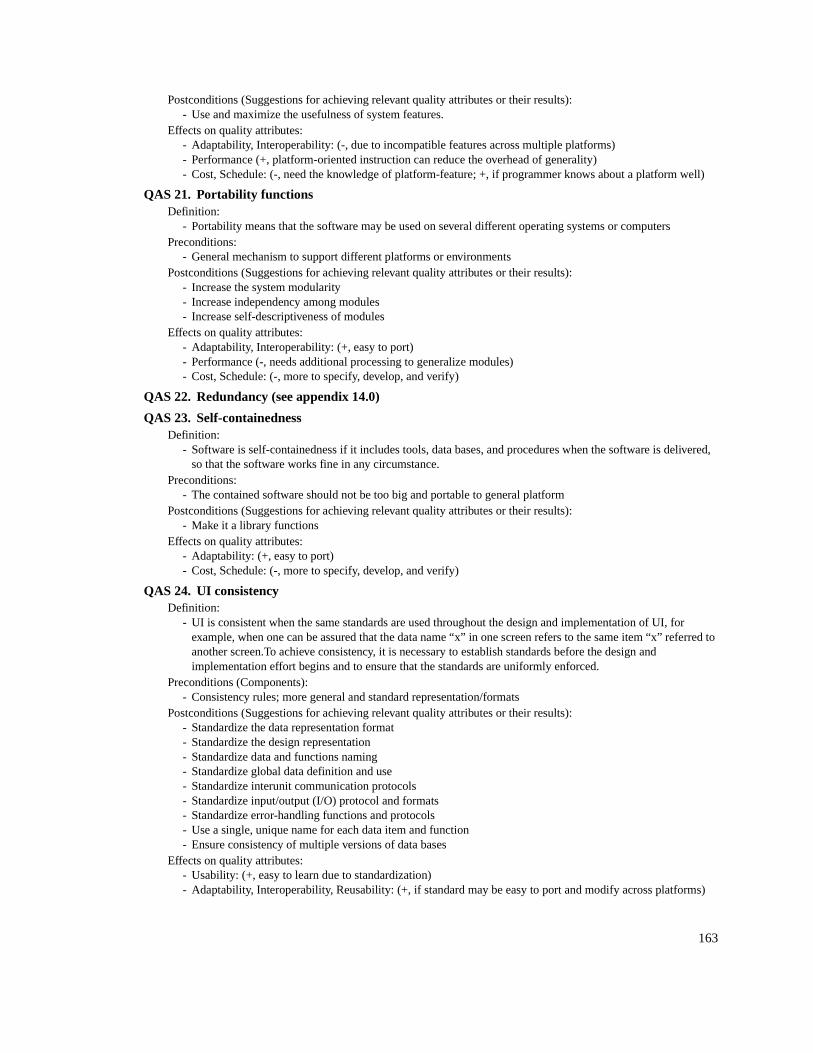
163
Postconditions (Suggestions for achieving relevant quality attributes or their results): - Use and maximize the usefulness of system features.
Effects on quality attributes: - Adaptability, Interoperability: (-, due to incompatible features across multiple platforms) - Performance (+, platform-oriented instruction can reduce the overhead of generality) - Cost, Schedule: (-, need the knowledge of platform-feature; +, if programmer knows about a platform well)
QAS 21. Portability functionsDefinition:
- Portability means that the software may be used on several different operating systems or computersPreconditions:
- General mechanism to support different platforms or environmentsPostconditions (Suggestions for achieving relevant quality attributes or their results):
- Increase the system modularity - Increase independency among modules - Increase self-descriptiveness of modules
Effects on quality attributes: - Adaptability, Interoperability: (+, easy to port) - Performance (-, needs additional processing to generalize modules) - Cost, Schedule: (-, more to specify, develop, and verify)
QAS 22. Redundancy (see appendix 14.0)
QAS 23. Self-containednessDefinition:
- Software is self-containedness if it includes tools, data bases, and procedures when the software is delivered, so that the software works fine in any circumstance.
Preconditions: - The contained software should not be too big and portable to general platform
Postconditions (Suggestions for achieving relevant quality attributes or their results): - Make it a library functions
Effects on quality attributes: - Adaptability: (+, easy to port) - Cost, Schedule: (-, more to specify, develop, and verify)
QAS 24. UI consistencyDefinition:
- UI is consistent when the same standards are used throughout the design and implementation of UI, for example, when one can be assured that the data name “x” in one screen refers to the same item “x” referred to another screen.To achieve consistency, it is necessary to establish standards before the design and implementation effort begins and to ensure that the standards are uniformly enforced.
Preconditions (Components): - Consistency rules; more general and standard representation/formats
Postconditions (Suggestions for achieving relevant quality attributes or their results): - Standardize the data representation format - Standardize the design representation - Standardize data and functions naming - Standardize global data definition and use - Standardize interunit communication protocols - Standardize input/output (I/O) protocol and formats - Standardize error-handling functions and protocols - Use a single, unique name for each data item and function - Ensure consistency of multiple versions of data bases
Effects on quality attributes: - Usability: (+, easy to learn due to standardization) - Adaptability, Interoperability, Reusability: (+, if standard may be easy to port and modify across platforms)

164
- Dependability: (+, easy to reduce errors due to standardization) - Cost, Schedule: (-, more to specify, develop, and verify)
QAS 25. UI flexibilityDefinition:
- UI flexibility means that the software is readily adaptable, via a user interface or change of data, to a wide range of different environments without immediately resorting to expendability-type changes.
Preconditions: - Support the commonality and consistency across difference platforms
Postconditions (Suggestions for achieving relevant quality attributes or their results): - Make program organization general enough. - Separate common modules with unique ones for different platforms and environments
Effects on quality attributes: - Usability: (+, support various user needs) - Performance (-, needs additional processing to support the variety of UI) - Cost, Schedule: (-, more to specify, develop, and verify)
QAS 26. Understandability (Self-descriptiveness)Definition:
- Software is understandable if a reader of the design or source code can easily understand how a function has been implemented, that is, if the software is a self-documented description of itself.
Preconditions: - comments included in the code with their effectiveness
Postconditions: - Document the results of decisions in design representations - Identify external interfaces in design representations - Establish standards for writing unit prologues, commenting, and structuring code - Follow established unit standards - Establish and follow standards for global data commenting - Provide comments for all decision points and transfers of control - Use a higher order language (HOL) wherever possible - Provide comments for all nonstandard HOL statements - Provide comments for all data item attributes(e.g., range and accuracy) - Provide comments on the ranges of values and defaults for all unit inputs - Logically block and indent code - Do not overload the meanings of keywords in the programming language - Describe the purpose or intent of the code in code comments - Describe the properties of data items in the names of the data item
Effects on quality attributes: - Adaptability, Interoperability, Reusability: (+, easy to understand; fast to modify) - Performance (depend on) - Cost, Schedule: (-, more to specify, develop, and verify)
QAS 27. UndoDefinition:
- Back to the original state as if a command wasn’t executedPreconditions:
- The results of the command should be recoverablePostconditions (Suggestions for achieving relevant quality attributes or their results):
- Use log or status filesEffects on quality attributes:
- Dependability: (+, avoids undesirable states) - Usability: (+, avoid unnecessary actions to go back to the original state) - Cost, Schedule: (-, more to specify, develop, and verify)
QAS 28. User-programmability
165
Definition: - The system has capabilities for interpreting or compiling programs to customize user interfaces or functions.
Preconditions: - Clear, simple, but general enough to program the capabilities - Primitive instruction/command set
Postconditions (Suggestions for achieving relevant quality attributes or their results): - Decide which capabilities the users may want - Error checking / Debugger would be helpful
Effects on quality attributes: - Usability: (+, support user flexibility) - Performance (depend on) - Cost, Schedule: (-, more to specify, develop, and verify)
QAS 29. User-tailorabilityDefinition:
- The system has capabilities for determining User’s preferences (e.g., font, color, view, window size and position) and environments (e.g., directory, default file, environment variables).
Preconditions: - Preferences and environments preserved in this application
Postconditions (Suggestions for achieving relevant quality attributes or their results): - Make the system more general by choosing the options from the users. - Provide a default set.
Effects on quality attributes: - Usability: (+, support user preferences) - Cost, Schedule: (-, more to specify, develop, and verify)
QAS 30. VerifiabilityDefinition:
- Verifiability means that it is simple to certify that the software is correct.Preconditions:
- Automatic self-testing; a library of standard test programs.Postconditions (Suggestions for achieving relevant quality attributes or their results):
- Certify that the software is correct (by black-box and/or white-box tests, or theory proving techniques)Effects on quality attributes:
- Dependability: (+, avoids undesirable states) - Performance (-, needs additional processing) - Cost, Schedule: (-, more to specify, develop, and verify)
QAS 31. VisibilityDefinition:
- Software is visible if there is insight into its progress as regards coding and testing. Insight is gained through objective evidence of the correct functioning of the software during execution, primarily through the thoroughness of testing and the success of the test results.
- Visibility is equally applicable to both initial development and maintenance changes. It is added to the software by embedding self-testing in the code and through completeness of software testing procedures.
Preconditions (Components, Conditions for being applicable): - Testing objective, criteria, drivers, and evaluation; The software should be testable and its result interpretable.
Postconditions (Detailed actions for achieving the above strategy): - Provide tests for all software performance requirements - Design test scenarios to maximize the number of units tested - Document inputs and outputs for performance test cases - Provide tests for all unit-to-unit interface - Provide tests for all parameters in each unit interface - Provide test for all execution paths in each unit - Add monitors to detect intermittent errors and marginal performance - Add built-in test software to isolate defective components

166
Effects on quality attributes: - Dependability: (+, avoids undesirable states) - Cost, Schedule: (-, more to specify, develop, and verify)

167
14.0 Appendix C: Architecture Strategies (AS)
14.1 List of Architecture Strategies
AS 1. Backup/RecoveryDefinition:
- Additional resources or duplicate copies of data on different storage media for emergency purposes. Preconditions:
- Backup file list and backup policy (e.g., backup frequency)Postconditions (Type of Backup/Recovery):
- Full Backup/Recovery: Back up or recover all selected files. - Differential Backup/Recovery: Back up or recover selected files that have been changed. This is used when
only the latest version of a file is required. - Incremental Backup/Recovery: Back up or recover selected files that have been changed, but if a file has been
changed for the second or subsequent time since the last full backup, the file doesn't replace the already-backed-up file, rather it is appended to the backup medium. This is used when each revision of a file must be maintained.
- Delta Backup/Recovery: Similar to an incremental backup/recover, but back up or recover only the actual data in the selected files that has changed, not the files themselves.
Effects on quality attributes: - Dependability: (+, avoid loss of important data or resources by backup/recovery) - Performance, Adaptability: (-, need additional processing resources for backup) - Cost, Schedule: (-, more to specify, develop, and verify)
AS 2. Buy Faster HardwareDefinition:
- The hardware which has fast CPU time, disk access time, instruction execution time, bandwidthPreconditions:
- Cost effectiveness; good ROI (Return On Investment)Postconditions:
- Faster CPU, faster disk access, faster bandwidthEffects on quality attributes:
- Performance (+, can execute an instruction faster than ever) - Cost, Schedule: (-, hardware cost)
AS 3. Change-source HidingDefinition:
- A technique that sources of change are hidden within modulePreconditions:
- Identify sources of changePostconditions (Suggestions for achieving relevant quality attributes or their results):
- Sources of change hidden within moduleEffects on quality attributes:
- Adaptability, Interoperability, Reusability: (+, the change does not affect module interface) - Cost, Schedule: (-, more to specify, develop, and verify; +: less rework)

168
AS 4. Diagnostics
Definition: - An architectural composition diagnosing that the function is running well
Preconditions: - Diagnostics criteria and algorithms
Postconditions: - Diagnose what’s wrong and report it.
Effects on quality attributes: - Dependability: (+, avoids undesirable states) - Performance: (-, needs additional processing) - Cost, Schedule: (-, more to specify, develop, and verify; +, less debugging, rework)
AS 5. Error-reducing user input/output, Input Checking, Input assertion/type checking
Definition: - An architectural composition that precedes a function by an acceptability check of its inputs
Preconditions: - Candidate inputs, acceptability criteria
Postconditions: - If valid, pass input into the Function, otherwise, indicate “Invalid Input” and exit.
Domain Independent Effects on quality attributes1: - Dependability: (+, unacceptable inputs filtered out) - Usability: (+, fast revision for the invalid input) - Adaptability: (-, more efforts to extend the functions) - Performance: (-, needs more execution time)
AS 6. Fault-tolerance functionsDefinition:
- It is defined as the ability of a system to respond gracefully to an unexpected hardware or software failure. There are many levels of fault tolerance, the lowest being the ability to continue operation in the event of a power failure. Many fault-tolerant computer systems mirror all operations -- that is, every operation is
performed on two or more duplicate systems, so if one fails the other can take over2.Preconditions:
- fault detection algorithmsPostconditions (Suggestions for achieving relevant quality attributes or their results):
- Recover a failed system due to hardware or software errors such as power failure, hardware component failure (e.g., clock interrupts, I/O device errors), arithmetic faults, and network or communication errors
- Prevent invalid input errors (e.g, wrong range of input, different input type) before the errors cause whole
1. The detailed analysis of conditions under which these will be problems is available in appendix 14.2.2. PC Webopaedia Definition and Links, 1997, http://www.pcwebopedia.com
Function
Diagnostics function
Input Output
Diagnosticsresults or reports
Input Input AcceptabilityCheck
Function Output
Invalid Input

169
system clash. - Use alternatives or redundant resources (e.g., another hardware or software components) when errors occur - Avoid the propagation of failures resulting from errors
Effects on quality attributes: - Dependability: (+, avoids undesirable states) - Performance (-, need additional processing to avoid failures) - Cost, Schedule: (-, more to specify, develop, and verify)
AS 7. Layering
Definition: - A hierarchical architectural composition in which each layer can communicate only with the adjacent upwards
or downwards layerPreconditions:
- Interface and protocol between a layer and an adjacent layer, request to pass data and/or control from layer to layer
Postconditions: - Data and/or control passed from layer to layer, or notification of interface/protocol violation
Effects on quality attributes1: - Adaptability, Interoperability, Reusability: (+, hide sources of variation inside interface layers) - Performance (-, need more interfaces, and data and/or control transfers, via protocol) - Cost, Schedule: (-, more to specify, develop, and verify)
AS 8. Monitoring & Control for Performance (or for Assurance)
Definition: - An architectural composition that 1) monitors the performance (or dependability) of a function, 2) controls
configuration or environment to stabilize the function (e.g., to avoid buffer overflows), and 3) reports results of subsequent performance (or dependability) analysis.
Preconditions: - Monitoring instrumentation, control limits and algorithms.
Postconditions: - If the function is stable, check the performance and report it. Otherwise, it stabilizes the function by
controlling the configuration or environment.Effects on quality attributes:
- Dependability: (+, avoids undesirable states) - Performance: (-, needs additional processing in short term; +, improves performance in long term via system
tuning) - Cost, Schedule: (-, more to specify, develop, and verify)
AS 9. ParametrizationDefinition:
1. The detailed analysis of conditions under which these will be problems is available in appendix 14.2.
Layer II
Layer I
Layer III
Function
Monitoring & Control
Input Output
Performanceanalysis
performance control

170
- A parameter-driven program solves a problem that is partially or entirely described by the values (i.e., parameters) that are entered at the time the program is loaded.
Preconditions: - Well-defined parameters for good interfaces
Postconditions (Suggestions for achieving relevant quality attributes or their results): - Parameter-driven software is widely used when a program or an object is called for and loaded by another
program or object rather than by the user. Effects on quality attributes:
- Adaptability, Interoperability, Reusability: (+, provide good interfaces) - Cost, Schedule: (-, more to specify, develop, and verify)
AS 10. Redundancy
Definition: - An architectural composition that replicates components or data
Preconditions: - Redundant components or data - Redundant policy (e.g., disk array policy for duplicating data across disks) - The amount of redundancy in a system
Postconditions (Suggestions for achieving relevant quality attributes or their results): - Increase parallelism by dividing a single function among several components in diagram (a) - Increase redundancy by performing the same operation across several components in diagram (b) - Tradeoffs between Performance and Dependability
Effects on quality attributes: - Dependability: (+, the failure of a single duplicated component may not cause the entire operation to fail in
diagram (a); -, the failure of any of the parallel components may cause the entire operation to fail in diagram (b))
- Performance: (+, may increase throughput by parallelism in diagram (b)) - Adaptability (-, needs additional efforts to modify) - Cost, Schedule: (-, more to specify, develop, and verify)
X (P)
X (P’)
X (P)
X (P)
P
P’
X(P) X(PP’)
(a) Redundancy for Dependability (b) Redundancy for Performance (by dividing (by duplicating and executing a function into multiple components and
executing them simultaneously)the same function)

171
14.2 Examples of Elaboration of Architecture Strategies
Example 1.Layering
Definition: - A hierarchical architectural composition in which each layer can communicate only with the adjacent upwards
or downwards layerPreconditions:
- Interface and protocol between a layer and an adjacent layer - Request to pass data and/or control from layer to layer
Postconditions: - Data and/or control passed from layer to layer - Notification of interface/protocol violation
Effects on quality attributes: - Evolvability, Interoperability, Portability, Reusability: (+, hide sources of variation inside interface layers) - Performance (-, need more interfaces, and data and/or control transfers, via protocol)
--> However, it is possible that passing data and/or control may not reduce performance in case of transferring the pointer of data buffer rather than data itself.
--> If each layer is implemented at different sites or processors (i.e., the data transfer via network is needed), the data volume is the key factor to determine Performance.
* (Data transfer time from one layer to its adjacent layer) ∝ (frequency of data transfer) * (the number of transaction per each data transfer) * (transfer time per each transaction per data per routing) * (data size) * (number of routing per each transaction per data)
* Performance ∝ (the number of layer which is affected by data transfer) * (data transfer time from one layer to adjacent layer) = ∑ (layeri)(data transfer timei)
* The transfer-time delay (due to network bottleneck) is propagated from the bottom layer to top layer because of the constraints of the layer definition (i.e., each layer can communicate only with the adjacent upwards or downwards layer). Thus, the performance of overall layer system can be reduced abruptly (i.e., the delay time of overall system = (the number of layers) * ∑ (the delay time in a layer)
- Cost, Schedule: (-, more to specify, develop, and verify; +, reduce rework)--> I am not sure that the effort of making layers can be captured by SLOC. It is easy to separate a function into
two functions by adding just one line, which is a function-call specification. Layering is a matter of control according to the constraint of the layer definition.
Layer II
Layer I
Layer III

172
Example 2.Error-reducing user input/output, Input Checking, Input assertion/type checking
Definition: - An architectural composition that precedes a function by an acceptability check of its inputs
Preconditions: - Candidate inputs, acceptability criteria
Postconditions: - If valid, pass input into the function, otherwise, indicate “Invalid Input” and exit.
Domain Independent Effects on quality attributes:
++, Dependability (-> Reliability -> Anomaly_Management -> Improper input data)1: unacceptable inputs filtered out
++, Survivability (-> Reliability -> Anomaly_Management -> Improper input data): unacceptable inputs filtered out
+, Dependability (-> Reliability -> Anomaly_Management -> computation failures): unacceptable inputs filtered out
-, Adaptability (-> Expandability -> Augmentability -> Computation extensibility): more efforts to extend the functions.
--, Performance (-> Effectiveness Processing -> Processing effectiveness measure): needs more execution timeDomain Dependent Effects on quality attributes:
if (Candidate inputs = “integers or characters string”) and (acceptable criteria = “the input is valid type and in right range”) then, (++, Dependability -> Accuracy -> Accuracy_checklist) (++, Dependability -> Reliability -> Anomaly_Management -> Improper input data) (-, if validation checking algorithm is dependent on machine platform, Interoperability -> Hardware_compatibility -> word_length; instruction_set) if (Candidate inputs = “ID”) and (acceptable criteria = “the input is valid type and the input is in current DB) then, (++, Dependability -> Reliability -> Anomaly_Management -> Improper input data) (-, if the size of DB is large or DB is distributed across network, Performance -> Effectiveness_Processing -> Processing_effectiveness_measure) if (Candidate inputs = “natural language”) and (acceptable criteria = “valid grammar and semantics”) then, (++, Dependability -> Reliability -> Anomaly_Management -> Improper input data) (--, Performance -> Effectiveness_Processing -> Processing_effectiveness_measure) - (--, Cost_Schedule)
1. It means that this strategy affects on “Improper input data” under “Anomaly Management” under “12.1.1 Reliability/Accuracy” under “12.1 Dependability” in chapter 12.
Input Input AcceptabilityCheck
Function Output
Invalid Input
Copyright © 2022 FDOKUMEN