Condition Assessment of Timber Bridges. 1. Evaluation of a Micro-Drilling Resistance Tool
12
Condition Assessment of Timber Bridges 1. Evaluation of a Micro-Drilling Resistance Tool Brian K. Brashaw Robert J. Vatalaro James P. Wacker Robert J. Ross United States Department of Agriculture Forest Service Forest Products Laboratory General Technical Report FPL–GTR–159 In cooperation with the United States Department of Transportation Federal Highway Administration
Transcript of Condition Assessment of Timber Bridges. 1. Evaluation of a Micro-Drilling Resistance Tool

Condition Assessment of Timber Bridges1. Evaluation of a Micro-Drilling Resistance ToolBrian K. BrashawRobert J. VatalaroJames P. WackerRobert J. Ross
United StatesDepartment ofAgriculture
Forest Service
ForestProductsLaboratory
GeneralTechnicalReportFPL–GTR–159
In cooperationwith the
United StatesDepartment ofTransportation
FederalHighwayAdministration

Report Documentation Page Form ApprovedOMB No. 0704-0188
Public reporting burden for the collection of information is estimated to average 1 hour per response, including the time for reviewing instructions, searching existing data sources, gathering andmaintaining the data needed, and completing and reviewing the collection of information. Send comments regarding this burden estimate or any other aspect of this collection of information,including suggestions for reducing this burden, to Washington Headquarters Services, Directorate for Information Operations and Reports, 1215 Jefferson Davis Highway, Suite 1204, ArlingtonVA 22202-4302. Respondents should be aware that notwithstanding any other provision of law, no person shall be subject to a penalty for failing to comply with a collection of information if itdoes not display a currently valid OMB control number.
1. REPORT DATE APR 2005
2. REPORT TYPE N/A
3. DATES COVERED -
4. TITLE AND SUBTITLE Condition Assessment of Timber Bridges. 1. Evaluation of aMicro-Drilling Resistance Tool
5a. CONTRACT NUMBER
5b. GRANT NUMBER
5c. PROGRAM ELEMENT NUMBER
6. AUTHOR(S) 5d. PROJECT NUMBER
5e. TASK NUMBER
5f. WORK UNIT NUMBER
7. PERFORMING ORGANIZATION NAME(S) AND ADDRESS(ES) USDA Forest Service Forest Products Lab One Gifford Pinchot DriveMadison WI, 53726-2398
8. PERFORMING ORGANIZATIONREPORT NUMBER
9. SPONSORING/MONITORING AGENCY NAME(S) AND ADDRESS(ES) 10. SPONSOR/MONITOR’S ACRONYM(S)
11. SPONSOR/MONITOR’S REPORT NUMBER(S)
12. DISTRIBUTION/AVAILABILITY STATEMENT Approved for public release, distribution unlimited
13. SUPPLEMENTARY NOTES
14. ABSTRACT
15. SUBJECT TERMS
16. SECURITY CLASSIFICATION OF: 17. LIMITATION OF ABSTRACT
UU
18. NUMBEROF PAGES
11
19a. NAME OFRESPONSIBLE PERSON
a. REPORT unclassified
b. ABSTRACT unclassified
c. THIS PAGE unclassified
Standard Form 298 (Rev. 8-98) Prescribed by ANSI Std Z39-18

AbstractThe research presented in this report was conducted to eval-uate the accuracy and reliability of a commercially avail-able micro-drilling resistance device, the IML RESI F300-S (Instrument Mechanic Labor, Inc., Kennesaw, Georgia), in locating deteriorated areas in timber bridge members. The device records drilling resistance as a function of drilling depth, which allows the operator to assess the location of deterioration in the member cross section. Bridge compo-nents containing different levels of natural decay were used as test specimens in this study. The IML RESI F300-S was first used to assess decay in the timber bridge specimens. The specimens were then sawn along their length into slabs to expose their interior condition. The interior faces of these slabs were inspected visually and with a stress-wave probe to confirm if deterioration was present. On the basis of these tests, we conclude that this micro-drilling device accurately determines if deterioration is present at the point at which the test is performed.
Keywords: timber, bridges, inspection, drilling resistance, nondestructive evaluation
April 2005
Brashaw, Brian K.; Vatalaro, Robert J.; Wacker, James P.; Ross, Robert J. 2005. Condition Assessment of Timber Bridges: 1. Evaluation of a Micro-Drilling Resistance Tool. Gen. Tech. Rep. FPL-GTR-159. Madison, WI: U.S. Department of Agriculture, Forest Service, Forest Products Labora-tory. 8 p.
A limited number of free copies of this publication are available to the pub-lic from the Forest Products Laboratory, One Gifford Pinchot Drive, Madi-son, WI 53726–2398. This publication is also available online at www.fpl.fs.fed.us. Laboratory publications are sent to hundreds of libraries in the United States and elsewhere.
The Forest Products Laboratory is maintained in cooperation with the Uni-versity of Wisconsin.
The use of trade or firm names in this publication is for reader information and does not imply endorsement by the U.S. Department of Agriculture of any product or service.
The United States Department of Agriculture (USDA) prohibits discrimination in all its programs and activities on the basis of race, color, national origin, sex, religion, age, disability, political beliefs, sexual ori-entation, or marital or familial status. (Not all prohibited bases apply to all programs.) Persons with disabilities who require alternative means for com-munication of program information (Braille, large print, audiotape, etc.) should contact the USDA’s TARGET Center at (202) 720–2600 (voice and TDD). To file a complaint of discrimination, write USDA, Director, Office of Civil Rights, Room 326-W, Whitten Building, 1400 Independence Av-enue, SW, Washington, DC 20250–9410, or call (202) 720–5964 (voice and TDD). USDA is an equal opportunity provider and employer.

IntroductionWood deterioration is one of the most common damage mechanisms in timber bridge structures and often inflicts damage internally. This may occur without visible signs appearing on the surface until a member’s load-bearing capacity has been largely destroyed. Determining an appropriate load rating for an existing timber bridge and making rational rehabilitation, repair, or replacement decisions can be achieved only when a reliable and accurate assessment of its existing condition is made. Knowledge of the condition of the bridge can lead to savings in repair and replacement costs by minimizing labor and materials and extending its life.
In timber bridge structures, the degradation of a load-bearing (in-service) member may be caused by any one of several organisms that derive their nourishment or shelter from the wood substrate in which they live. For example, several types of fungi attack wood. The hyphae of these fungi secrete enzymes that depolymerize the chemical components of wood, thereby reducing the density, strength, and hardness of a member. This results in a significant reduction in load-carrying capacity, which in turn may result in the member’s failure.
We recently prepared a comprehensive manual on the inspection of wood structural elements, Wood and Timber Condition Assessment Manual (Ross and others 2004). This manual was prepared at the request of the American Forest and Paper Association to assist field engineers and other inspection professionals. It includes chapters on visual inspection techniques, ultrasound or stress-wave-based inspection tools, and probing-type techniques. A chapter on post-fire inspection and assessment is included in addition to a sample inspection report and summaries from several inspections. Detailed descriptions of the various available tools, guidelines on their use, and interpretation of data obtained from them are included.
As a consequence of our experience with various types of inspection methods and equipment, the Federal Highway Administration asked us to conduct a rigorous evaluation of the performance of several commercially available tools used to assess the condition of in-service wood. The results of that effort are summarized in a comprehensive report available through the University of Minnesota- Duluth (Brashaw and others 2004). We prepared the follow-ing condensed report as a field guide for engineers from the information generated in the 2004 study. This report focuses solely on our evaluation of a widely used micro-drilling device.
ObjectiveThe objective of this study was to evaluate a micro-drilling device, the IML RESI F300-S (Instrument Mechanic Labor, Inc., Kennesaw, Georgia), to determine if it was an accurate and reliable inspection tool for detecting internal deterioration in timber bridge components. This was accomplished by testing several timber bridge components obtained from various in-service structures.
MaterialsThe primary materials used for this project were bridge timbers containing different levels of natural decay. These timbers were obtained from several sources and had been removed from service for various reasons. Timber bridge girders, pilings, decking material, and railing components were obtained from the Chequamegon–Nicolet National Forest in northern Wisconsin. The materials had been remaining after construction of new bridges or had been removed from service.
Condition Assessment of Timber Bridges1. Evaluation of a Micro-Drilling Resistance Tool
Brian K. Brashaw, Program DirectorRobert J. Vatalaro, Principal Research Shop ForemanNatural Resources Research Institute, University of Minnesota, Duluth
James P. Wacker, Research General Engineer Robert J. Ross, Project LeaderForest Products Laboratory, Madison, Wisconsin

Figure 1—Stages of this study
In addition, timber bridge girders, decking, and railing components were obtained from the Oliver Bridge, a combination motor-vehicle-and-railroad timber and steel bridge between Duluth, Minnesota, and Superior, Wisconsin. This bridge was being rebuilt by the owner, the Duluth and Missabe National Railroad. Additional materials were obtained from Michigan Technological University, Duluth Timber Recycling Company (Duluth, Minnesota), and Minnesota Power. Thirty-six timber specimens were evaluated with the IML RESI F300-S; 26 were sawn timbers and 10 were round timber piles. The sawn timbers varied in size from 3 by 12 in. (76 by 305 mm) to 20 by 20 in. (508 by 508 mm) and were up to 99 in. (251 cm) long. The round timber piles were 9 to 18.75 in. (229 to 476 mm) in diameter and up to 143 in. (363 cm) long. Thirty (83%) of the timber specimens were Douglas-fir species. Other species included western redcedar (four specimens) and northern white pine (two specimens). Nearly all timber specimens were creosote treated.
Figure 2—IML RESI F300-S in use.
MethodsThis study was accomplished in several stages (Fig. 1). Several types of data were collected on the timber specimens in their original (unsawn) condition. First, the timber specimens were tested to determine moisture content and wood species. Second, the bridge timbers were visually inspected to locate deteriorated areas. Last, micro- drilling resistance measurements were collected from each of the timber bridge specimens.
After the timber specimens were sawn along their length into slabs that exposed their interior condition, additional data were collected. The sawn components obtained from the specimens were inspected visually and with a probe to assess the extent and locations of decay or other degradation. We also documented the sawn components with photographs.
Data from each timber bridge specimen were analyzed to determine the effectiveness of the resistance drill for locating degraded or decayed material. Graphs of the data were prepared and used to develop indices of decay. These two data sets were then compared to determine the effectiveness of the resistance drill to detect deterioration. Each specimen’s resistance chart was captured electronically by the equipment and was accompanied by a photograph of the specimen after being cut apart. This photograph shows the representative quality of the specimen regarding its level of decay.
2
General Technical Report FPL-GTR-159
Figure 3—Typical micro-drilling locations used for each timber bridge specimen.
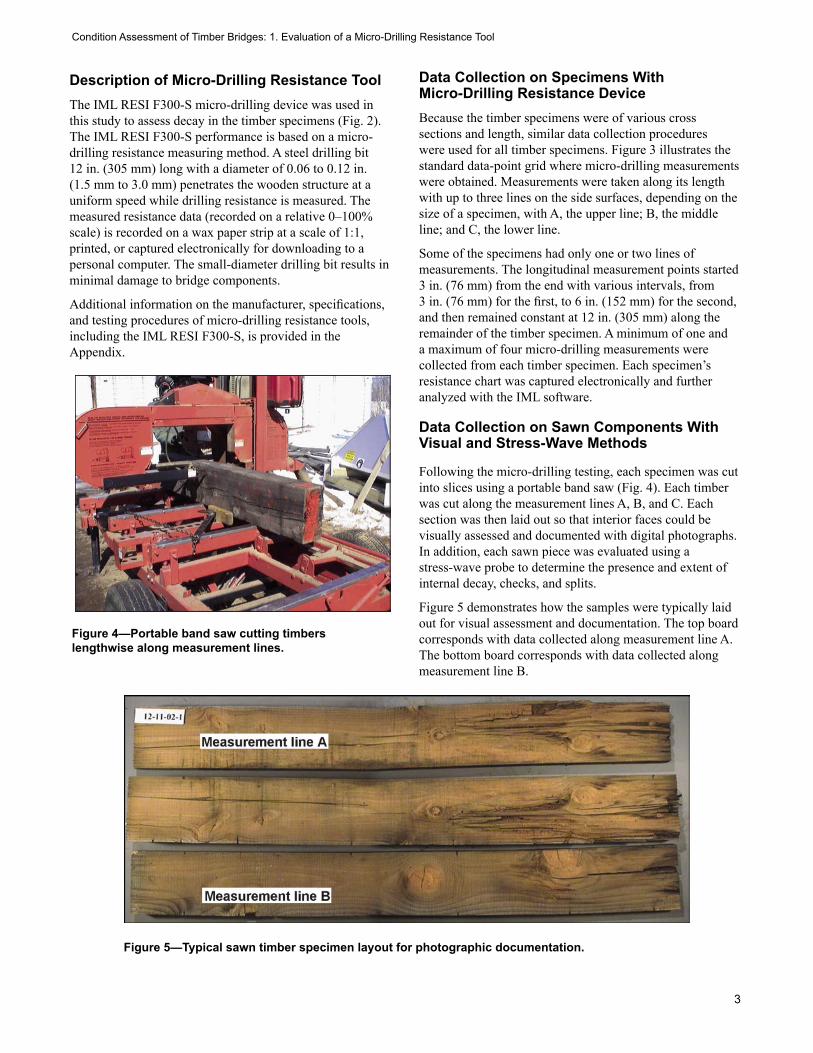
Description of Micro-Drilling Resistance Tool The IML RESI F300-S micro-drilling device was used in this study to assess decay in the timber specimens (Fig. 2). The IML RESI F300-S performance is based on a micro-drilling resistance measuring method. A steel drilling bit 12 in. (305 mm) long with a diameter of 0.06 to 0.12 in. (1.5 mm to 3.0 mm) penetrates the wooden structure at a uniform speed while drilling resistance is measured. The measured resistance data (recorded on a relative 0–100% scale) is recorded on a wax paper strip at a scale of 1:1, printed, or captured electronically for downloading to a personal computer. The small-diameter drilling bit results in minimal damage to bridge components.
Additional information on the manufacturer, specifications, and testing procedures of micro-drilling resistance tools, including the IML RESI F300-S, is provided in the Appendix.
Data Collection on Specimens With Micro-Drilling Resistance DeviceBecause the timber specimens were of various cross sections and length, similar data collection procedures were used for all timber specimens. Figure 3 illustrates the standard data-point grid where micro-drilling measurements were obtained. Measurements were taken along its length with up to three lines on the side surfaces, depending on the size of a specimen, with A, the upper line; B, the middle line; and C, the lower line.
Some of the specimens had only one or two lines of measurements. The longitudinal measurement points started 3 in. (76 mm) from the end with various intervals, from 3 in. (76 mm) for the first, to 6 in. (152 mm) for the second, and then remained constant at 12 in. (305 mm) along the remainder of the timber specimen. A minimum of one and a maximum of four micro-drilling measurements were collected from each timber specimen. Each specimen’s resistance chart was captured electronically and further analyzed with the IML software.
Data Collection on Sawn Components With Visual and Stress-Wave Methods
Following the micro-drilling testing, each specimen was cut into slices using a portable band saw (Fig. 4). Each timber was cut along the measurement lines A, B, and C. Each section was then laid out so that interior faces could be visually assessed and documented with digital photographs. In addition, each sawn piece was evaluated using a stress-wave probe to determine the presence and extent of internal decay, checks, and splits.
Figure 5 demonstrates how the samples were typically laid out for visual assessment and documentation. The top board corresponds with data collected along measurement line A. The bottom board corresponds with data collected along measurement line B.
3
Figure 5—Typical sawn timber specimen layout for photographic documentation.
Condition Assessment of Timber Bridges: 1. Evaluation of a Micro-Drilling Resistance Tool
Figure 4—Portable band saw cutting timbers lengthwise along measurement lines.

Results and DiscussionEach specimen’s resistance chart was captured electronically by the equipment and was accompanied by photographs of the cut-open specimen. Test results for all 36 specimens tested with the IML RESI F300-S micro-drilling device are reported in Brashaw and others (2004). Results are presented from three representative specimens, one each having severe, localized, and no deterioration.
Figure 6 illustrates typical results obtained from a test specimen that was severely deteriorated. Resistance plot data collected at the 4-in. (10.2-cm) drilling location along measurement line B shows severe deterioration for the first 6.5-in. (16.5-cm) drilling depth and has been marked with red bars at the top and bottom. Figure 7 illustrates typical results obtained from a test specimen that was moderately deteriorated. Resistance plot data collected at the 12-in. (30.5-cm) drilling location along measurement line B shows the effects of an internal check at nearly 6-in. (16.5-cm) drilling depth and has been marked with red bars at the top and bottom. Also, resistance plot data collected at the 24-in. (61-cm) drilling location along measurement line B shows moderate deterioration from 6.5-in. (16.5-cm) to 9.5-in. (24.1-cm) drilling depth and has been marked with red bars at the top and bottom. In contrast, Figure 8 illustrates typical results obtained from a test specimen that was sound wood, with no deterioration. An overall analysis of data from all 36 timber specimens led to the development indices of decay for the test specimens, as follows:
These indices are applicable only to Douglas-fir species, which represent nearly 85% of the specimens tested. Stress-wave testing results from this study will be reported in a companion report (Brashaw and others 2005).
Summary and ConclusionsThirty-six timber bridge specimens containing different levels of natural decay were evaluated with a commercially available micro-drilling device to detect internal decay or defects. The specimens were then sawn along their lengths into slabs to expose their interior condition. The interior faces of these slabs were inspected visually and with a stress-wave probe to confirm the presence of deterioration. Data from each timber bridge specimen were analyzed to determine the effectiveness of the resistance drill for locating degraded or decayed material. Graphs of the data were prepared and used to develop indices of decay. The sawn components obtained from the specimens were
inspected visually and with a probe to assess the extent and locations of the decay or other degradation. These two data sets were then compared to determine the effectiveness of the resistance drill to detect deterioration.
Based on our tests, we offer the following comments about the accuracy of using the IML RESI F300-S for locating deterioration in bridge timbers: 1. The tool is accurate at determining the presence of decay in timber bridge specimens. However, these data are limited to the drilling location.
2. The tool can precisely locate an internal defect (decay pocket, check, or split) within the member’s cross section. This can be advantageous for condition assessment and load rating purposes.
3. Decay indices were developed for Douglas-fir timbers as follows: sound, >25% resistance; moderate decay, 10–25%; and advanced or severe decay, 0–10%.
One drawback is that multiple, time-consuming drilling would be required to map the area and extent of the decay in the other plane. Another possible drawback is the potential to spread the decay to sound areas within a timber or to sound timbers by multiple use of a contaminated drill bit. Routine cleaning of drill bits, or replacement with a new one, would greatly reduce this potential drawback.
It is crucial to use this or any nondestructive testing tool or device as part of a comprehensive condition assessment. Such an assessment should incorporate an in-depth visual inspection, knowledge of prior use of the structure, and a working knowledge of fundamental engineering properties of structural wood products. This technique, when used in concert with visual and ultrasound techniques, would provide a very accurate description of the condition of timbers.
Literature CitedBrashaw, B.K.; Vatalaro, R.J.; Erickson, J.R.; Forsman, J.W.; Ross, R.J. 2004. Final Report: A Study of Technologies to Locate Decayed Timber Bridge Members. Project No. 187-6456, NRRI/TR-2004-06. Duluth, MN: UM-Duluth, Natural Resources Research Institute.
Brashaw, B.K.; Vatalaro, R.J.; Ross, R.J.; Wacker, J.P. 2005. Condition Assessment of Timber Bridges: 2. Evaluation of Several Commercially Available Stress Wave/Ultrasonic Tools. Gen. Tech. Rep. FPL-GTR-160. Madison, WI: USDA Forest Service, Forest Products Laboratory.
Ross, R.J.; Brashaw, B.K.; Wang, X.; White, R.H.; Pellerin, R.F. 2004. Wood and Timber Condition Assessment Manual Madison, WI: Forest Products Society. 74 p.
4
Drilling resistance Deterioration index 25–100% Sound wood 10–25% Moderate 0–10% Severe
General Technical Report FPL-GTR-159
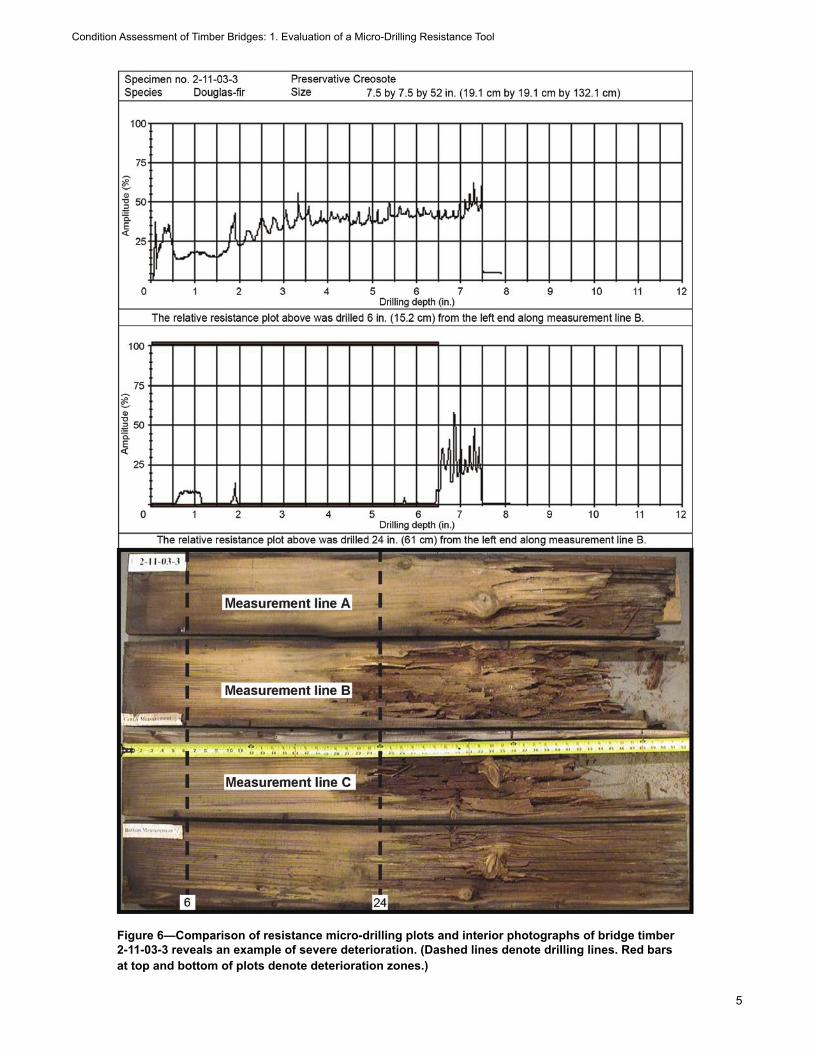
Figure 6—Comparison of resistance micro-drilling plots and interior photographs of bridge timber 2-11-03-3 reveals an example of severe deterioration. (Dashed lines denote drilling lines. Red bars at top and bottom of plots denote deterioration zones.)
5
Condition Assessment of Timber Bridges: 1. Evaluation of a Micro-Drilling Resistance Tool

Figure 7—Comparison of resistance micro-drilling plots and interior photographs of bridge timber 1-14-03-2 reveals an example of deteriorated zones and sound wood zones. (Dashed lines denote drilling lines. Red bars at top and bottom of plots denote deterioration zones.)
6
General Technical Report FPL-GTR-159

Figure 8—Comparison of resistance micro-drilling plots and interior photographs of bridge timber 03-05-03-4 reveals an example of sound wood. (Dashed lines denote drilling lines.).
7
Condition Assessment of Timber Bridges: 1. Evaluation of a Micro-Drilling Resistance Tool

Appendix–Additional Information on the IML RESI F300-S Micro-Drilling Resistance Tool
ManufacturerInstrument Mechanic Labor (IML), Inc.
Specifications Power requirements: 7.2-V rechargeable batteryResolution: 0.004 in. (0.1 mm )Dimension: 4 by 12 by 16 in. (102 by 305 by 406 mm)Weight: 8.5 lb (3.86 kg) (instrument only)Drilling depth: 11.2 in. (28.4 cm)Advance speed: 0-55 cm/min (0-22 in./min)
General Procedures 1. Insert the battery pack into the main drill unit.
2. Adjuct the sensitivity range on the rear of the instrument by firmly pressing and turning the setting wheel. Use #1 for softwoods and #2 for hardwoods.
3. Install the wax paper strip. Open the cover and take the paper strip and bend it to match the curve of the slot. Slide the paper in and lift the stylus to enable the paper to slide forward. Push the paper all the way forward and close the cover.
4. Hold the unit tight against the specimen to be examined and switch on the drill, making sure to hold the unit tight against the specimen. When the drill bit goes all the way through or reaches maximum depth, stop and reverse the drill and back the bit out.
5. Mark sample identification on the paper and continue measurements along the specimen.
Comments on Ease of Use • The operator can learn to use this equipment in less than one day. The operator’s manual and manufacturer’s web site provides good information on use of the equipment and interpretation of the testing results.
• The unit can be purchased with a module that allows downloading to F Tools Pro software, an excellent tool for manipulating the drilling data and producing data that are easy to understand and interpret.
• The data are easily interpreted and provide real-time ability to evaluate the complete cross section at the drilling location.
• The unit is portable but heavy. A shoulder strap aids in carrying the drill.
Other Suppliers of Micro-Drilling Resistance Drilling Tools United StatesTree Solutions, Seattle, Washington
EuropeSIBTEC Scientific, DmP (Digital microProbe) (United Kingdom)Resistograph™, Frank Rinn, Heidelberg, Germany.
8
General Technical Report FPL-GTR-159