
Flow cytometric assay for in vivo genotoxic effects of pesticides in Green frogs (Rana clamitans)
Upload
independentCategory
view
2download
0
Computer Methods and Programs in Biomedicine (2004) 75, 201—211
Computer program for determining fluorescenceresonance energy transfer efficiency from flowcytometric data on a cell-by-cell basis
Gergely Szentesi a, Gábor Horvátha, Imre Bori a, György Vámosib,János Szöllosi a,b, Rezso Gáspára, Sándor Damjanovicha,b, Attila Jeneia,László Mátyusa,*
a Department of Biophysics and Cell Biology, Research Center for Molecular Medicine, Medical andHealth Science Center, University of Debrecen, Debrecen H-4012, Hungaryb Cell Biophysics Research Group of the Hungarian Academy of Sciences, Hungary
Received 27 September 2003 ; received in revised form 9 February 2004; accepted 10 February 2004
KEYWORDSFlow cytometry;Fluorescence resonanceenergy transfer;Gating algorithm;Computer program
Summary The determination of fluorescence resonance energy transfer (FRET) withflow cytometry (FCET) is one of the most efficient tools to study the proximity re-lationships of cell membrane components in cell populations on a cell-by-cell basis.Because of the high amount of data and the relatively tedious calculations, this proce-dure should be assisted by powerful data processing software. The currently availableprograms are not able to fulfill this requirement. We developed a Windows-based pro-gram to calculate fluorescence resonance energy transfer efficiency values from listmode flow cytometry standard (FCS) files. This program displays the measured data instandard plots by generating one- and two-parameter histograms on linear or logarith-mic scales. A graphical gating tool allows the user to select the desired cell populationaccording to any combination of the parameter values. The program performs severalstatistical calculations, including mean, S.D., percent of the gated data. We have im-plemented two types of data sheet for FRET calculations to aid and guide the userduring the analysis: one with population-mean-based autofluorescence correction andthe other with spectrum-based cell-by-cell autofluorescence correction. In this paper,we describe the gating algorithms, the file opening procedure and the rules of gating.The structure of the program and a short description of the graphical user-interface(GUI) are also presented in this article.© 2004 Elsevier Ireland Ltd. All rights reserved.
1. Introduction
Characterization and identification of cell popula-tions has always been a primary interest of cell bi-
*Corresponding author. Tel.: +36-52-412-623;fax: +36-52-412-623.
E-mail address: [email protected] (L. Matyus).
ologists. Traditionally, some kind of microscopy wasused to discriminate different cell types or other-wise characterize a new cell population [1]. Thesemeasurements however are time-consuming there-fore the accuracy of the determined parameter isusually limited by the low number of cells observedand the consequently high statistical error. Fluores-cence activated cell sorting and analysis (FACS) or
0169-2607/$ — see front matter © 2004 Elsevier Ireland Ltd. All rights reserved.doi:10.1016/j.cmpb.2004.02.004

202 G. Szentesi et al.
flow cytometry is a solution for high-speed quanti-tative analysis of cell populations on a cell-by-cellbasis. In such an instrument cells flow through anozzle or flow cell and are illuminated with fo-cused laser light. For each cell, optical signals,light-scatter and fluorescence arising from specificlabels are detected and subsequently digitized. Thecentral dogma of flow cytometry states that the in-tensity of the detected optical parameter is propor-tional to the respective cellular parameter [2,3].
The success of flow cytometry has led to itseveryday application in research and medical di-agnosis. Several companies made this instrumentcommercially available. Naturally these instru-ments are equipped with software packages thatsatisfy the needs of the general user; however, spe-cial biological problems require unique approachesto data collection and data analysis. One exampleis the study of the spatial distribution of the cellmembrane components [4—10]. Fluorescence res-onance energy transfer (FRET) is a spectroscopicmethod to detect the distance relationship of flu-orescently labeled molecules [11—14]. Since inthe case of many cell types autofluorescence is anon-negligible factor, the calculation algorithm ofenergy transfer efficiency becomes even more diffi-cult. To overcome this constraint a refined method,autofluorescence corrected fluorescence resonanceenergy transfer (AFRET) was introduced [15]. Thecombination of FRET or AFRET methods with flowcytometry, the flow cytometric fluorescence reso-nance energy transfer (FCET) and autofluorescencecorrected flow cytometric fluorescence resonanceenergy transfer (AFCET) methods are among themost efficient techniques to study the proximity ofcomponents in the cell membrane. By calculatingthe efficiency of energy transfer from the measuredparameters we can determine the proximity rela-tionships of the fluorescently labeled membranecomponents. Because of the high amount of dataand the relatively time-consuming calculations,this procedure should be assisted by powerful dataprocessing software. The currently available pro-grams were not designed to fulfill this requirement.
We developed a program to calculate fluores-cence resonance energy transfer efficiency values–— on Windows 9x and Windows XP operating system–— which is able to handle list mode flow cytometrystandard (FCS) files, versions 1.0 and 2.0, irre-spectively, of data resolution or operating system.This program generates standard plots of one- andtwo-parameter histograms on linear or logarithmicscales. A graphical gating tool–—based on a newlydeveloped efficient algorithm–—restricts the calcu-lation of energy transfer values to the selected cellpopulation. The program performs several statisti-
cal calculations, including mean, S.D., percent ofthe gated data. Histograms and dot-plots can besaved as slideshow-ready image files.
2. Computational methods and theory
2.1. Basic theory of fluorescence resonanceenergy transfer
Fluorescence resonance energy transfer (FRET) isa very sensitive indicator of molecular proximities.This is a radiationless energy transmission process,which can occur if the excited donor and acceptordyes are in 1—10 nm-distance range. The transferprocess is based on dipole—dipole coupling betweenthe electronic systems of both molecules, whichrequires the appropriate spatial orientation of thedyes and an overlap between the emission spectrumof the donor and the excitation spectrum of the ac-ceptor. The rate of energy transfer is proportionalto the inverse of the six power of the separationdistance. If energy transfer occurs, the quantumyield of the donor molecules will be smaller dueto the additional pathway for relaxation and thefluorescence intensity of the donor molecules de-creases. On the other hand, in the presence of theexcited donor molecules the amount of acceptormolecules in the excited state is increased due toenergy transfer, which is called sensitized emission[11,12,14].
2.2. Determination of FCET efficiency
Energy transfer-related signals can be measuredby detecting the acceptor emission intensity withexcitation at the donor absorption maximum wave-length. In an ideal FRET arrangement the accep-tor molecules cannot be excited directly at thedonor-exciting wavelength and donor emission doesnot overlap with the spectral range of the detec-tion of acceptor fluorescence. In most practicalcases the absorption and the emission spectra ofthe donor and acceptor dyes are overlapping, andemission signals cannot be separated by optical fil-ters, so the measured signals are mixtures of donorand acceptor emission. To determine the individualcontribution of donor and acceptor to these signalssingly labeled samples can be used. The followingthree intensities should be detected from eachsample: I1(λexD, λemD), I2(λexD, λemA), I3(λexA, λemA)where λexD, λexA are the donor and acceptor ex-citation wavelengths, λemD, λemA are the emissionwavelengths of the donor and acceptor. From theintensities measured with the donor labeled sample
Computer program for determining fluorescence resonance energy transfer efficiency 203
we can determine the S1 and S3 correction factors,
S1 = I2I1
, S3 = I3I1
. (1)
Cells labeled only with acceptors can be used todetermine the S2 and S4 factors,
S2 = I2I3
, S4 = I1I3
, (2)
The unlabeled sample is used for the backgroundcorrections. With the knowledge of these threeparameters, the fluorescence intensities measuredfrom a double-labeled (transfer) cell in the threechannels are:
I1 = ID(1 − E) + IAS4 + S4S2
IDEα,
I2 = ID(1 − E)S1 + IAS2 + IDEα,
I3 = ID(1 − E)S3 + IA + S3S1
IDEα. (3)
The detected donor fluorescence intensity of adouble-labeled cell is smaller than it would be inthe absence of the acceptor (ID), due to energytransfer. The I2 signal is the sum of (i) the frac-tion of the quenched donor emission ‘‘spilling over’’to the second detection channel, (ii) the fractionof the directly excited acceptor emission and (iii)the sensitized emission due to energy transfer. Thethird intensity contains three additive terms, (i)the fraction of the decreased (by energy transfer)donor emission detected in the acceptor channel,(ii) the directly excited acceptor fluorescence (IA)and (iii) sensitized acceptor emission. In most prac-tical cases the value of S4 is zero, and the combi-nation of the three equations above leads to
C = E1 − E
= 1α
[I2 − S2I3
(1 − (S3/S1)S2)I1− S1
]. (4)
The value of energy transfer efficiency can becalculated as
E = C1 + C
(5)
The α factor is the detection sensitivity of fluores-cence from an excited acceptor molecule with re-spect to the sensitivity, to detect an excited donormolecule, which can be determined experimentallyaccording to the following equation:
α = MABDLDεDρD
MDBALAεAρA. (6)
The MD and MA values can be determined from I1,I2 intensities of the donor-only and acceptor-onlylabeled samples, respectively, calculating the mean
values. The mean number of binding sites per celloccupied by donor and acceptor labeled antibodies,the dye-to-protein labeling ratio of the antibodiesand the molar absorption coefficients measured atthe exciting wavelength of the donor are denotedby BD, BA, LD, LA , εD, εA, respectively.
For a given pair of dyes, using the same opticalsystem, the S factors are not subject to change dueto biological variance of the individual cells. Thus,the factors can be determined and calculated withgreat precision for a given system, similarly to thenumerical value of α [16].
2.3. Correction algorithm forautofluorescence
Since individual cells have different autofluores-cence intensities, subtraction of themean autofluo-rescence intensity of unlabeled cells from the mea-sured intensity of each cell of the labeled samplescan contort the intensity values and can distort theresults. In the conventional FCET technique threefluorescence intensities were measured to deter-mine the energy transfer efficiency. To improve theapplicability of this method at low signal-to-noiseratio, a fourth fluorescence intensity has to be in-troduced. Using the red-shifted donor—acceptorpair Cy3 and Cy5, the autofluorescence of the cellscan be measured in a separate channel in an emis-sion band below the fluorescence maxima of thetwo dyes.
The following four intensities can be detectedfrom each sample: I1(λexD, λemAut), I2(λexD,λemD), I3(λexD, λemA) and I4(λexA, λemA) whereλexD = 488 nm, λexA = 635 nm are the excitationwavelengths of the donor and acceptor dyes,λemD = 585 nm, λemA > 670 nm are the emis-sion wavelengths of the donor and acceptor andλemAut = 530 nm is the autofluorescence wave-length of the cells on a Becton Dickinson FACSCal-ibur flow cytometer (Becton Dickinson, San Jose,CA).
I1 = A + ID(1 − E)S5 + IAS6 + IDEαS6S2
,
I2 = AB2 + ID(1 − E) + IAS4 + IDEαS4S2
,
I3 = AB4 + ID(1 − E)S1 + IAS2 + IDEα,
I4 = AB4 + ID(1 − E)S3 + IA + IDEα1S2
εDλexAεAλexD
εDλexDεAλexA
(7)
Each of the four equations describes the compo-sition of the four measured fluorescence intensitiesin general, when each fluorescence componenthas a contribution to the measured intensity in

204 G. Szentesi et al.
each channel. The background fluorescence inten-sity measured in channel 1, the unquenched donorfluorescence intensity in channel 2, the directlyexcited acceptor fluorescence intensity in channel4, and the energy transfer efficiency are denotedby A, ID, IA, and E, respectively. S1—S6 and B2—B4factors characterize the spectral overlap betweenthe channels. The expression εDλexA
εAλexD/εDλexD
εAλexAis the ratio of the molar absorption coefficientsof donor and acceptor molecules at the indicatedwavelengths. S1, S3 and S5 are determined by usingsamples labeled only with donor (Cy3) according tothe following equations:
S1 = I3I2
, S3 = I4I2
, S5 = I1I2
(8)
S2, S4 and S6 are determined by using samples la-beled only with acceptor (Cy5) according to the fol-lowing equations:
S2 = I3I4
, S4 = I2I4
, S6 = I1I4
(9)
B2, B3 and B4 are determined by using unlabeledsamples according to the following equations:
B2 = I2I1
, B3 = I3I1
, B4 = I4I1
(10)
The α parameter describes the relative detectionefficiency and quantum yield of the donor and ac-ceptor dyes, which can be determined experimen-tally the same way as before:
α = MABDLDεDρD
MDBALAεAρA(11)
The used filter and dichroic mirror setup in our sys-tem (FACSCalibur) results zero values for S3, S4 andS6, in addition the ratio εDλexA
εAλexD/εDλexD
εAλexAis also
zero, which simplifies the four fluorescence inten-sity equations and their solution.
C = E1 − E
= 1α
[I1(B2S1 + B4S2 − B3) + I2(B3S5 − S1 − B4S2S5) + I3(1 − B2S5) + I4S2(B2S5 − 1)
I2 − I1B2
](12)
From the equation above the single-cell FRET effi-ciency can be expressed as [15]:
E = C1 + C
(13)
3. Description of the program
3.1. Structure of the program
The program was developed in Borland Delphi Stu-dio (Borland Software Corporation, Scotts Walley,
CA, USA). We have chosen this developer packagebecause it supports Object Oriented Programmingand contains several precompiled components, in-cluding TChart, and TStringGrid that are utilizedin our program [17]. On the other hand, it has aneasy-to-use developer interface, which providesseveral tools (object inspector, property editor) toaid designing the program GUI.
The program consists of three main parts. Thefirst is the main window (Fig. 1) for opening FCSfiles to set and display the user defined plots andgates on a tabbed page control and to calculatesome statistics automatically, including the percentof the gated cells, the mean value and S.D. of thedisplayed parameters. The results are displayed ina string grid placed under the graph on the tabbedpages. At the bottom of the window a status bar isvisible containing some information about the fileunder study. From the main window the user canadjust the plots and their options, save the plot set-tings as a text file and graphs as windows metafiles.The FRET and AFRET sheets are the second andthird parts of the program, respectively, that canbe opened from this window too. These two sheetsare implemented to aid and guide the user duringthe course of the calculations. Both of them are ca-pable of storing the parameters of the calculationsand results in binary format.
3.2. Gating
3.2.1. Creating gatesA gate is a set of rules of the measured parametersthat determines a subpopulation of the cells. Theprogram includes four different color gates sup-ported by powerful graphical tools to select cellpopulations. In order to make a gate on a dot-plot,the desired color has to be selected by clickingon the appropriate button on the toolbar. Then by
double-clicking in the plot window the first corner(vertex) of the gate polygon is displayed. By click-ing on the graph the next corner of the polygon canbe positioned. When the last vertex is placed, aright-mouse-button click closes the gate. To makea gate on a histogram one has to double-click inthe plot window after the desired color gate wasselected. This generates a colored interval maskalong the X-axis. The upper or lower limits ofthe interval can be changed by single left-clicks.The limits are moved relative to the mid-point ofthe interval. A simple right-click closes the gate.

Computer program for determining fluorescence resonance energy transfer efficiency 205
Fig. 1 The program main window: from this part of thesoftware, almost every necessary function can be ac-cessed to obtain and display the flow cytometric datain histogram or dot-plot. From the ‘‘File’’ menu amongothers the ‘‘Open data file’’ command can be called toload FCS files. The ‘‘View’’ menu contains the ‘‘Show filecontents’’ item, which contains the TEXT information im-plemented in the loaded file, and the ‘‘Show gains’’ itemshows the gains obtained from the data file separately.In the ‘‘Plots’’ menu in the ‘‘Set Plots’’ dialog windowboth types of graphs can be generated. The plots areexhibited on a tab-page control. Each page has a smallear containing the ID of the plot, including the name ofthe plotted parameter(s) and the preferred gate color.The number of the visible points on the dot-plots rela-tive to the total number of the cells and the bin numberused for generating histograms can be changed underthe ‘‘Plots’’ menu ‘‘Options’’ item. The ‘‘Actions’’ menucontains the ‘‘Refresh’’ item to apply the changes of thegating and the analysis settings. This menu also containsgate removing tools including the ‘‘Delete active gate’’item to remove the active gate from the visible plot and‘‘Delete all gates’’ to remove all gates from the visibleplot. The most important functions (load and save pa-rameters, gate color, create sheet, refresh, etc.) haveshortcuts and linked buttons on the toolbar for faster andeasier access. Under the plot a string grid is displayedcontaining the name of the gated subpopulations and thestatistics applied to them. The name of subpopulationsis generated automatically, which begins with the nameof the gating parameter and includes the first letter ofthe color of the population and the name of gate. At thebottom of the window a status bar can be seen contain-ing the path of the loaded FCS file, and the cell number.
In both cases the gates become ‘‘active’’ afterrefreshing.
Setting a one-parameter gate on a histogram se-lects cells with their respective parameter valuebetween the lower and upper limits of the gate.Cells in a polygon-restricted area are selected bytwo-parameter gating on a dot-plot. Whereby it ispossible to define four different color gates on eachgraph the following rules have to be considered:
• Intersection of selected populations is createdby gates of identical color defined on differentcharts.
• Union of populations is created when using gatesof identical color on the same chart.
Applying these rules several subpopulation can bedefined even in the case of a simple gate configura-tion. For example (as shown in Fig. 2) two charts,
Fig. 2 Gating rules: red-gated cells are displayed onthe red histogram. Applying a new green gate on thehistogram, the green-gated cells will be displayed in the‘‘all’’ dot-plot, and the green-gated subpopulation of thered population in the histogram, according to the gatingrules. The red-gated green population is not visible in thedot-plot, because the multi-color gated subpopulationscannot be visualized.

206 G. Szentesi et al.
one ‘‘all’’ (total population) dot-plot and one redhistogram are defined. On the red histogram thered-gated cells are displayed, because the red gateis on the dot-plot. If one creates a new green gateon the histogram, the green-gated cells will be vis-ible on the all dot-plot, and the green-gated sub-population of the red population on the histogram,but the red-gated green population is not visible onthe dot-plot. Multi-color gated subpopulations can-not be visualized on the charts, but it is possible tocalculate statistics on them.
3.2.2. Gating algorithmCounting gated cells on a histogram is very simple,because those cells are selected whose propertyis in the acceptance range. However, enumerat-ing cells gated on a dot-plot is more difficult. Inthis case the cells enclosed by a user defined (userdrawn) polygon have to be selected. To determinewhether a cell is inside or outside of the polygonwe have to accomplish the following examination:let the coordinates of the point representing thecell in the reference frame be x and y. The pointsof the polygon are labeled with x[i] and y[i] and ivaries from 0 to n − 1, where n is the number ofthe polygon tips. If the number of polygon sides tothe left hand from the point is odd, the point isinside, otherwise it is outside the enclosed area.Mathematically this means that if the followingtwo expressions: 0 ≤ (y − y[i])/(y[j] − y[i]) ≤ 1and (�x/�y)ry ≥ rx are true, where j = i + 1,ry = y − y[i], and rx = x − x[i], the studied poly-gon side is to the left of the point, accordingto the program source based on the ‘‘contains’’method of polygon class of the Java language (J2EE,Java.awt.polygon.contains).
We defined an integer variable called hits tocount sides that are to the left of the point. Bycalculating hits for all the remaining sides, if thevalue of hits variable is odd then the point is insidethe polygon.
3.3. Handling FCS files
3.3.1. Structure of the FCS filesFlow cytometric standard files can be divided intofour main parts. The files begin with FCS charactersfollowed by the descriptor of the file version (x.0).The first part (HEADER) contains pointer numberspointing to the beginning of the second (TEXT), tothe third data flow (DATA) and to optional ANAL-YSIS and/or to other source dependent parts. TheASCII TEXT contains information about the struc-ture of the file, including byte order, data type (bi-nary, ASCII, single or double precision float), nameof the acquisition software and the total number of
measured cells. This part of the TEXT is followed bythe description of the measured parameters, whichcontains the name of the parameter, the channelnumber, the bit resolution, the gain and the gainscale applied during the measurement. The contentof the TEXT is separated by delimiter charactersthat depend on the software used for data acquisi-tion. The third part of the file is the dataflow con-taining the measured parameters on a cell-by-cellbasis. This structure of the file is well defined, butflexible enough to store the high amount of param-eters and data measured on different type flow cy-tometers. For detailed information about FCS filessee [18,19].
3.3.2. The FCS file-reading procedureThis procedure is able to read unsigned binary in-teger data from list-mode FCS1.0 and 2.0 files. Thefirst part of the procedure prepares the program toprocess the new data file (to clear the data con-tainer dynamic array and to free the plots that werecreated during the last analysis) and to read the FCSfile. After opening the file the OpenFile procedurecalls the GetFileID function, which provides a Stringvariable containing the first three letters of theopened file. If the String variable contains the ‘FCS’word, the procedure continues with the GetFiles-Pointers procedure to read the file pointers from theHEADER showing the beginning of the TEXT, DATAand optional ANALYSIS parts of the file, else the pro-cedure jumps to the ‘‘else’’ condition and showsan error message. Going on with the ‘‘if’’ arm, thenext part of the procedure reads the TEXT part andwrites its content to a StringGrid (inherited fromTStringGrid).
After getting the pointers pointing at the be-ginning and the end of the TEXT part, the filepointer is shifted to the beginning of it and theprocedure starts to read bytes from the file untilit arrives at the end of the TEXT. The charactersare added to the ‘‘s’’, temporary string variable.If the character that was read from the file equalsthe delimiter character, i.e. the first character ofthe TEXT part, the ‘‘s’’ string is copied into thenext column (WriteSToCell) of the actual row ofthe grid or a new row is added (NewRow) to thegrid.
Then the program collects the parameters andtheir properties including the name, gain (GetPar-NameGain), resolution (GetParResolution), datatype and byte order (GetDataTypeByteOrder) ofthe parameters, respectively, from the FCS file.Then the procedure reads the data from the DATApart, considering the properties of the parameters.Finally, the procedure closes the file and restoresthe original screen cursor.
Computer program for determining fluorescence resonance energy transfer efficiency 207
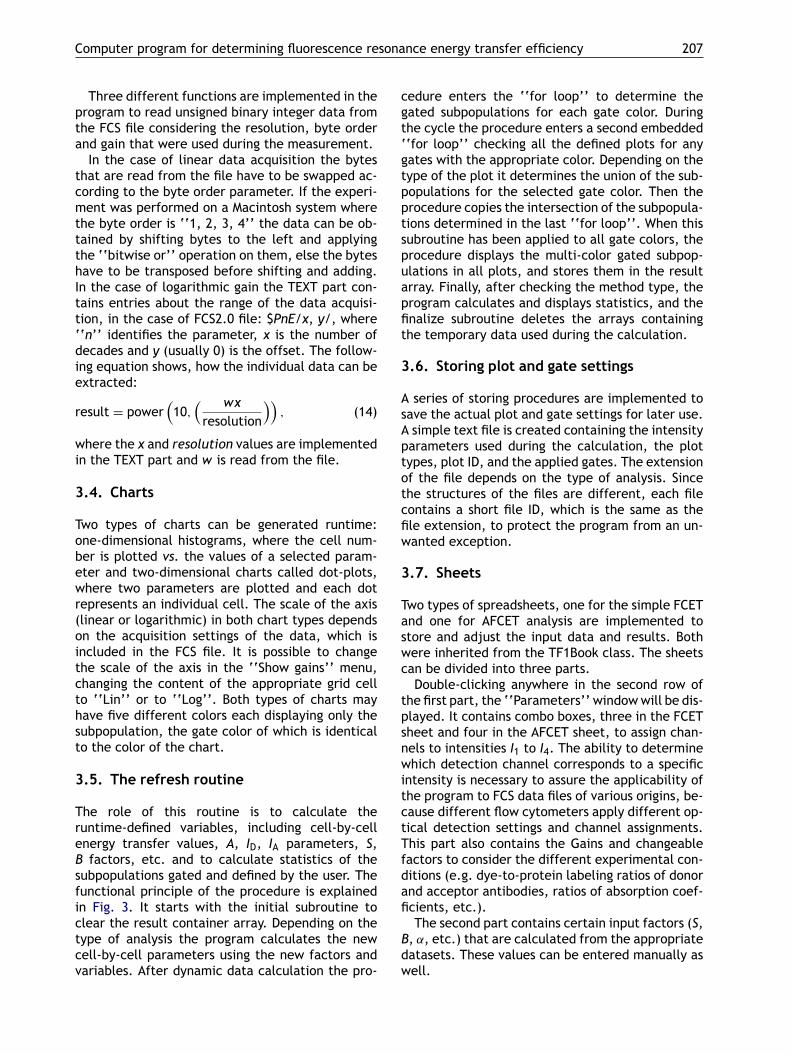
Three different functions are implemented in theprogram to read unsigned binary integer data fromthe FCS file considering the resolution, byte orderand gain that were used during the measurement.
In the case of linear data acquisition the bytesthat are read from the file have to be swapped ac-cording to the byte order parameter. If the experi-ment was performed on a Macintosh system wherethe byte order is ‘‘1, 2, 3, 4’’ the data can be ob-tained by shifting bytes to the left and applyingthe ‘‘bitwise or’’ operation on them, else the byteshave to be transposed before shifting and adding.In the case of logarithmic gain the TEXT part con-tains entries about the range of the data acquisi-tion, in the case of FCS2.0 file: $PnE/x, y/, where‘‘n’’ identifies the parameter, x is the number ofdecades and y (usually 0) is the offset. The follow-ing equation shows, how the individual data can beextracted:
result = power(10,
( wxresolution
)), (14)
where the x and resolution values are implementedin the TEXT part and w is read from the file.
3.4. Charts
Two types of charts can be generated runtime:one-dimensional histograms, where the cell num-ber is plotted vs. the values of a selected param-eter and two-dimensional charts called dot-plots,where two parameters are plotted and each dotrepresents an individual cell. The scale of the axis(linear or logarithmic) in both chart types dependson the acquisition settings of the data, which isincluded in the FCS file. It is possible to changethe scale of the axis in the ‘‘Show gains’’ menu,changing the content of the appropriate grid cellto ‘‘Lin’’ or to ‘‘Log’’. Both types of charts mayhave five different colors each displaying only thesubpopulation, the gate color of which is identicalto the color of the chart.
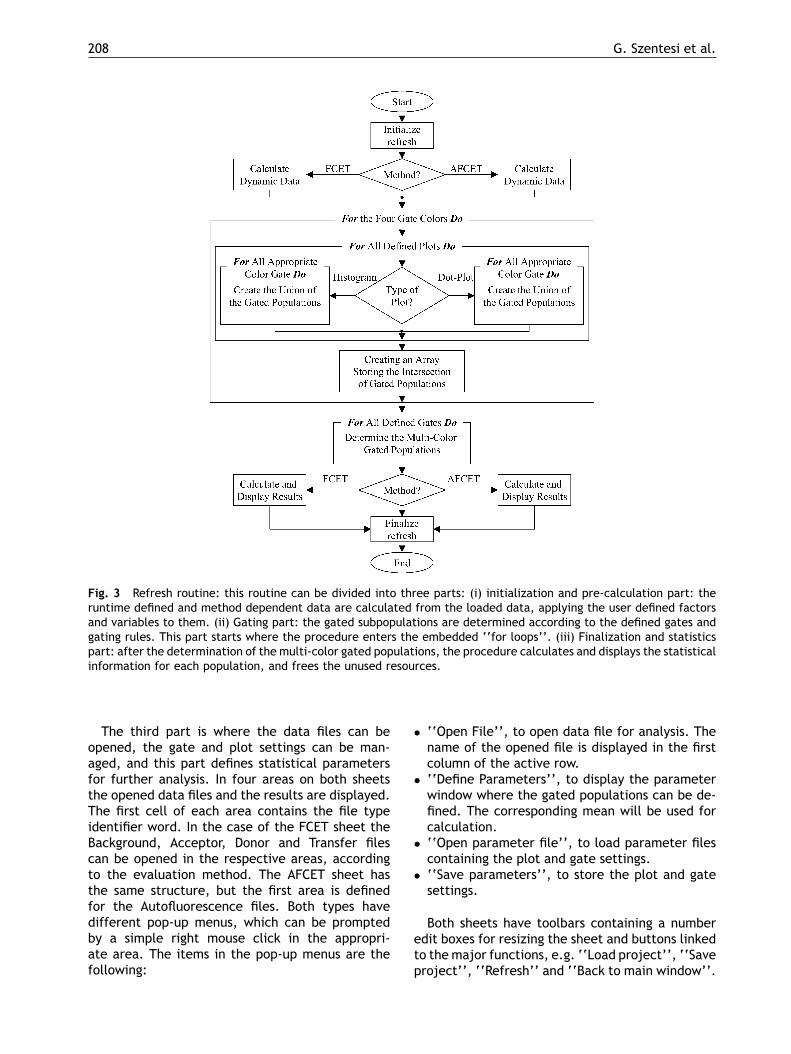
3.5. The refresh routine
The role of this routine is to calculate theruntime-defined variables, including cell-by-cellenergy transfer values, A, ID, IA parameters, S,B factors, etc. and to calculate statistics of thesubpopulations gated and defined by the user. Thefunctional principle of the procedure is explainedin Fig. 3. It starts with the initial subroutine toclear the result container array. Depending on thetype of analysis the program calculates the newcell-by-cell parameters using the new factors andvariables. After dynamic data calculation the pro-
cedure enters the ‘‘for loop’’ to determine thegated subpopulations for each gate color. Duringthe cycle the procedure enters a second embedded‘‘for loop’’ checking all the defined plots for anygates with the appropriate color. Depending on thetype of the plot it determines the union of the sub-populations for the selected gate color. Then theprocedure copies the intersection of the subpopula-tions determined in the last ‘‘for loop’’. When thissubroutine has been applied to all gate colors, theprocedure displays the multi-color gated subpop-ulations in all plots, and stores them in the resultarray. Finally, after checking the method type, theprogram calculates and displays statistics, and thefinalize subroutine deletes the arrays containingthe temporary data used during the calculation.
3.6. Storing plot and gate settings
A series of storing procedures are implemented tosave the actual plot and gate settings for later use.A simple text file is created containing the intensityparameters used during the calculation, the plottypes, plot ID, and the applied gates. The extensionof the file depends on the type of analysis. Sincethe structures of the files are different, each filecontains a short file ID, which is the same as thefile extension, to protect the program from an un-wanted exception.
3.7. Sheets
Two types of spreadsheets, one for the simple FCETand one for AFCET analysis are implemented tostore and adjust the input data and results. Bothwere inherited from the TF1Book class. The sheetscan be divided into three parts.
Double-clicking anywhere in the second row ofthe first part, the ‘‘Parameters’’ windowwill be dis-played. It contains combo boxes, three in the FCETsheet and four in the AFCET sheet, to assign chan-nels to intensities I1 to I4. The ability to determinewhich detection channel corresponds to a specificintensity is necessary to assure the applicability ofthe program to FCS data files of various origins, be-cause different flow cytometers apply different op-tical detection settings and channel assignments.This part also contains the Gains and changeablefactors to consider the different experimental con-ditions (e.g. dye-to-protein labeling ratios of donorand acceptor antibodies, ratios of absorption coef-ficients, etc.).
The second part contains certain input factors (S,B, α, etc.) that are calculated from the appropriatedatasets. These values can be entered manually aswell.
208 G. Szentesi et al.
Fig. 3 Refresh routine: this routine can be divided into three parts: (i) initialization and pre-calculation part: theruntime defined and method dependent data are calculated from the loaded data, applying the user defined factorsand variables to them. (ii) Gating part: the gated subpopulations are determined according to the defined gates andgating rules. This part starts where the procedure enters the embedded ‘‘for loops’’. (iii) Finalization and statisticspart: after the determination of the multi-color gated populations, the procedure calculates and displays the statisticalinformation for each population, and frees the unused resources.
The third part is where the data files can beopened, the gate and plot settings can be man-aged, and this part defines statistical parametersfor further analysis. In four areas on both sheetsthe opened data files and the results are displayed.The first cell of each area contains the file typeidentifier word. In the case of the FCET sheet theBackground, Acceptor, Donor and Transfer filescan be opened in the respective areas, accordingto the evaluation method. The AFCET sheet hasthe same structure, but the first area is definedfor the Autofluorescence files. Both types havedifferent pop-up menus, which can be promptedby a simple right mouse click in the appropri-ate area. The items in the pop-up menus are thefollowing:
• ‘‘Open File’’, to open data file for analysis. Thename of the opened file is displayed in the firstcolumn of the active row.
• ‘‘Define Parameters’’, to display the parameterwindow where the gated populations can be de-fined. The corresponding mean will be used forcalculation.
• ‘‘Open parameter file’’, to load parameter filescontaining the plot and gate settings.
• ‘‘Save parameters’’, to store the plot and gatesettings.
Both sheets have toolbars containing a numberedit boxes for resizing the sheet and buttons linkedto the major functions, e.g. ‘‘Load project’’, ‘‘Saveproject’’, ‘‘Refresh’’ and ‘‘Back to main window’’.

Computer program for determining fluorescence resonance energy transfer efficiency 209
4. Sample run
We have performed the following experimentsto demonstrate the differences between themean energy transfer efficiency values calcu-lated with different methods implemented in oursoftware.
Two epitopes of ErbB2 receptors were labeledon the N87 gastric tumor cell line with 4D5- and2C4-Fabs. The Fab fragments of antibodies were la-beled with Cy3 (donor) and Cy5 (acceptor) dyes.We measured the fluorescence intensities in the ap-propriate channels on a Becton Dickinson FACSCal-ibur flow cytometer (Becton Dickinson, San Jose,CA).
Fig. 4. shows fluorescence intensity distributions,measured in the donor channel, of differently la-beled samples. The blue, green and red curves be-long to the unlabeled (background), donor-only andboth donor and acceptor labeled samples, respec-tively.
In the case of E(quenching) calculation, whichdetermines an average FRET efficiency for thewhole cell population, one has to determine theaverage fluorescence intensity of the donor andacceptor labeled sample mean(Idon,acc), measuredin the donor channel, and the average fluores-cence intensity of the donor only labeled sample
Fig. 4 Fluorescence intensity distributions from N87gastric tumor cells: two epitopes of ErbB2 receptors werelabeled on the N87 gastric tumor cell line with 4D5-and 2C4-Fabs. The Fab fragments of antibodies wereconjugated with Cy3 (donor) and Cy5 (acceptor) dyes.The blue, green and red curves represent the fluores-cence intensity distribution of unlabeled (background),donor-only and both donor and acceptor labeled samples,respectively. The fluorescence intensities were measuredin the donor (Cy3) channel (FL2). The average fluores-cence intensity of the doubly labeled sample is smallerdue to energy transfer and that of the unlabeled samplehas a significantly smaller but not zero average intensitydue to autofluorescence.
mean(Idon), measured in the same channel. Thefollowing formula was used for the calculation ofE(quenching):
E(quenching) = 1 − mean(Idon,acc)
mean(Idon)(15)
This calculation can be performed with any com-mercially available program that is able to handlethe FCS files. However, in the case of cell-by-cellbased calculation of energy transfer efficiency val-ues we get a cell-by-cell distribution of E valuesrather than a single population mean, and the meanE value can be evaluated by applying the appropri-ate statistic.
According to our results using the E(quenching)calculation method, the E value (0.145) is signifi-cantly different from those of the other two calcula-tions (mean(EFRET) = 0.282;mean(EAFRET) = 0.253).The explanation for this difference is that theE(quenching) value is calculated from the meanintensities.
The differences between the E values calculatedwith the FCET and AFCET methods are not so signif-icant, but the coefficient of variance of the AFCEThistogram is smaller (see Fig. 5, blue histogram)because of the cell-by-cell autofluorescence cor-rection. In case the studied membrane componentshave a low expression level, the fluorescence signalcan be comparable to the autofluorescence signal,and the cell-by-cell correction for autofluorescencecan generate more realistic FRET distributions withless variance.
Fig. 5 Energy transfer histograms: the distributions ofenergy transfer efficiency values are displayed on thegraph. Values were calculated with AFCET (red curve)and FCET (blue curve) methods on a cell-by-cell basis.The coefficient of variance of the AFCET histogram issmaller than the variance of the FCET histogram, becausethe correction for autofluorescence was carried out on acell-by-cell basis in the former case.

210 G. Szentesi et al.
5. Hardware and software specifications
The minimum system requirements are the follow-ing:
• Windows95 or newer versions of Windows oper-ating system.
• IBM compatible PC with Pentium 166MHz.• 64MB RAM.• Desktop area 800 pixels × 600 pixels• 16 bit Color Palette.• Mouse or compatible pointing device.
We have tested the program on Windows9X, Win-dowsNT, Windows2000 and WindowsXP operatingsystems.
6. Mode of availability
We have developed a windows-based flow cytome-try data-evaluation program for calculating energytransfer in cell populations on a cell-by-cell basis.Although cell surface receptor distributions havebeen studied by several groups, the wide-spreadapplication of the FCET method has been greatlyhindered by the lack of a commercially availabledata-analysis program. We would like to pro-mote this technique in research (and clinical di-agnostics) and offer this software as freeware. Itcan be downloaded from the following website:http://www.biophys.dote.hu/research.htm. Theinstall shield wizard creates a directory includingsample files, and a complete help file containing atutorial to aid the first time user.
About half a dozen laboratories in Europe and theUnited States use our program on a regular basis.We are in daily contact with the researchers, andaccording to their reflections bugs and errors in thesoftware are continuously being fixed.
The current version of the program is able to han-dle the FCS1.0 and 2.0 version files. A new versionof the FC standard (FCS3.0) has already appeared,however it is not prevalent yet. If the new file for-mat becomes more wide-spread it will be supportedby the later versions of the program.
Acknowledgements
This work was supported in part by grants from theHungarian Academy of Sciences OTKA TS040773,T042618, T043061, T043087, T043509, F034487,by grants from the Ministry of Health and WelfareETT 013/2001, 117/2001, 222/2003, 524/2003,
602/2003, and by the British-Hungarian AcademicResearch Program GB-1/2003.
References
[1] P. Nagy, G. Vámosi, A. Bodnár, S.J. Lockett, J. Szöllosi,Intensity-based energy transfer measurements in digitalimaging microscopy, Eur. Biophys. J. 27 (1998) 377—389.
[2] H.M. Shapiro, Multistation multiparameter flow cytometry:a critical review and rationale, Cytometry 3 (1983) 227—243.
[3] H.M. Shapiro, N.G. Perlmutter, P.G. Stein, A flow cytometerdesigned for fluorescence calibration, Cytometry 33 (1998)280—287.
[4] C. Berney, G. Danuser, FRET or No FRET: a quantitativecomparison, Biophys. J. 84 (2003) 3992—4010.
[5] G. Panyi, M. Bagdány, A. Bodnár, G. Vámosi, G. Szentesi,A. Jenei, L. Mátyus, S. Varga, T.A. Waldmann, R. Gáspár, S.Damjanovich, Colocalization and nonrandom distributionof Kv1.3 potassium channels and CD3 molecules in theplasma membrane of human T lymphocytes, Proc. Natl.Acad. Sci. U.S.A. 100 (2003) 2592—2597.
[6] G. Vereb, J. Szöllosi, J. Matkó, P. Nagy, T. Farkas, L. Vigh,L. Mátyus, T.A. Waldmann, S. Damjanovich, Dynamic, yetstructured: The cell membrane three decades after theSinger-Nicolson model, Proc. Natl. Acad. Sci. U.S.A. 100(2003) 8053—8058.
[7] A.K. Kenworthy, N. Petranova, M. Edidin, High-resolutionFRET microscopy of cholera toxin B-subunit and GPI- an-chored proteins in cell plasma membranes, Mol. Biol. Cell.11 (2000) 1645—1655.
[8] T.M. Jovin, D.J. Arndt-Jovin, FRET microscopy: digitalimaging of fluorescence resonance energy transfer. Appli-cations in cell biology, in E. Kohen, J.G. Hirschberg (Eds.),Cell Structure and Function by Microspectrofluorimetry,Academic Press, San Diego, CA, 1989, pp. 99—115.
[9] S. Damjanovich, R.J. Gáspár, C. Pieri, Dynamic receptorsuperstructures at the plasma membrane, Q. Rev. Biophys.30 (1997) 67—106.
[10] S. Damjanovich, L. Bene, J. Matkó, A. Alileche, C.K. Gold-man, S. Sharrow, T.A. Waldmann, Preassembly of inter-leukin 2 (IL-2) receptor subunits on resting Kit 225 K6T cells and their modulation by IL-2, IL-7, and IL-15: afluorescence resonance energy transfer study, Proc. Natl.Acad. Sci. U.S.A. 94 (1997) 13134—13139.
[11] L. Stryer, Fluorescence energy transfer as a spectroscopicruler, Annu. Rev. Biochem. 47 (1978) 819—846.
[12] L. Mátyus, Fluorescence resonance energy transfer mea-surements on cell surfaces. A spectroscopic tool for de-termining protein interactions, J. Photochem. Photobiol.B: Biol. 12 (1992) 323—337.
[13] J. Szöllosi, S. Damjanovich, L. Mátyus, Application of fluo-rescence resonance energy transfer in the clinical labora-tory: routine and research, Cytometry 34 (1998) 159—179.
[14] J. Szölloosi, P. Nagy, Z. Sebestyén, S. Damjanovich, J.W.Park, L. Mátyus, Applications of fluorescence resonanceenergy transfer for mapping biological membranes, J.Biotechnol. 82 (2002) 251—266.
[15] Z. Sebestyén, P. Nagy, G. Horváth, G. Vámosi, R. Debets,J.W. Gratama, D.R. Alexander, J. Szöllosi, Long wave-length fluorophores and cell-by-cell correction for autoflu-orescence significantly improves the accuracy of flow cy-tometric energy transfer measurements on a dual-laserbenchtop flow cytometer, Cytometry 48 (2002) 124—135.

Computer program for determining fluorescence resonance energy transfer efficiency 211
[16] L. Trón, J. Szöllosi, S. Damjanovich, S.H. Helliwell,J.D. Arndt, T.M. Jovin, Flow cytometric measurementof fluorescence resonance energy transfer on cell sur-faces. Quantitative evaluation of the transfer efficiencyon a cell-by-cell basis, Biophys. J. 45 (1984) 939—946.
[17] M. Cantu, Mastering Delphi 3, Sybex Inc., 1997.
[18] Data file standard for flow cytometry. Data file StandardsCommittee of the Society for Analytical Cytology, Cytom-etry 11 (1990) 323—332.
[19] L.C. Seamer, C.B. Bagwell, L. Barden, D. Redelman, G.C.Salzman, J.C. Wood, R.F. Murphy, Proposed new data filestandard for flow cytometry, version FCS 3.0, Cytometry28 (1997) 118—122.
Copyright © 2022 FDOKUMEN