Computer Graphics Hardware and Display Devices
44
STNY BRK STATE UNIVERSITY OF NEW YORK Department of Computer Science Center for Visual Computing CSE528 Lectures CSE528 Computer Graphics: Theory, Algorithms, and Applications Hong Qin Department of Computer Science Stony Brook University (SUNY at Stony Brook) Stony Brook, New York 11794-2424 Tel: (631)632-8450; Fax: (631)632-8334 [email protected] http://www.cs.stonybrook.edu/~qin
-
Upload
khangminh22 -
Category
Documents
-
view
3 -
download
0
Transcript of Computer Graphics Hardware and Display Devices

STNY BRKSTATE UNIVERSITY OF NEW YORK
Department of Computer Science
Center for Visual Computing
CSE528 Lectures
CSE528 Computer Graphics: Theory, Algorithms, and
Applications
Hong Qin
Department of Computer Science
Stony Brook University (SUNY at Stony Brook)
Stony Brook, New York 11794-2424
Tel: (631)632-8450; Fax: (631)632-8334
http://www.cs.stonybrook.edu/~qin

STNY BRKSTATE UNIVERSITY OF NEW YORK
Department of Computer Science
Center for Visual Computing
CSE528 Lectures
Graphics Hardware and Display Devices

STNY BRKSTATE UNIVERSITY OF NEW YORK
Department of Computer Science
Center for Visual Computing
CSE528 Lectures
Graphics Hardware
• Many graphics algorithms can be implemented
efficiently and inexpensively in hardware
• Facilitates interactive graphics applications,
including certain domains of scientific
visualization
• Topics today:– Raster devices
– Video controllers & raster-scan display processors
– Important rasterization and rendering algorithms
– Pixels and images

STNY BRKSTATE UNIVERSITY OF NEW YORK
Department of Computer Science
Center for Visual Computing
CSE528 Lectures
Raster Devices• Computer monitors (CRT, LCD, etc.), TVs
• These are raster devices because they display images on
a raster, which is a regular n-D grid
• Each point on the grid is
called a pixel, which stands
for _______________
• Raster dimension given in pixels: 25 x 10 in this
example
• In a monochrome display, each pixel is black or white
• In a color display, each pixel has an RGB triple
STNY BRKSTATE UNIVERSITY OF NEW YORK
Department of Computer Science
Center for Visual Computing
CSE528 Lectures
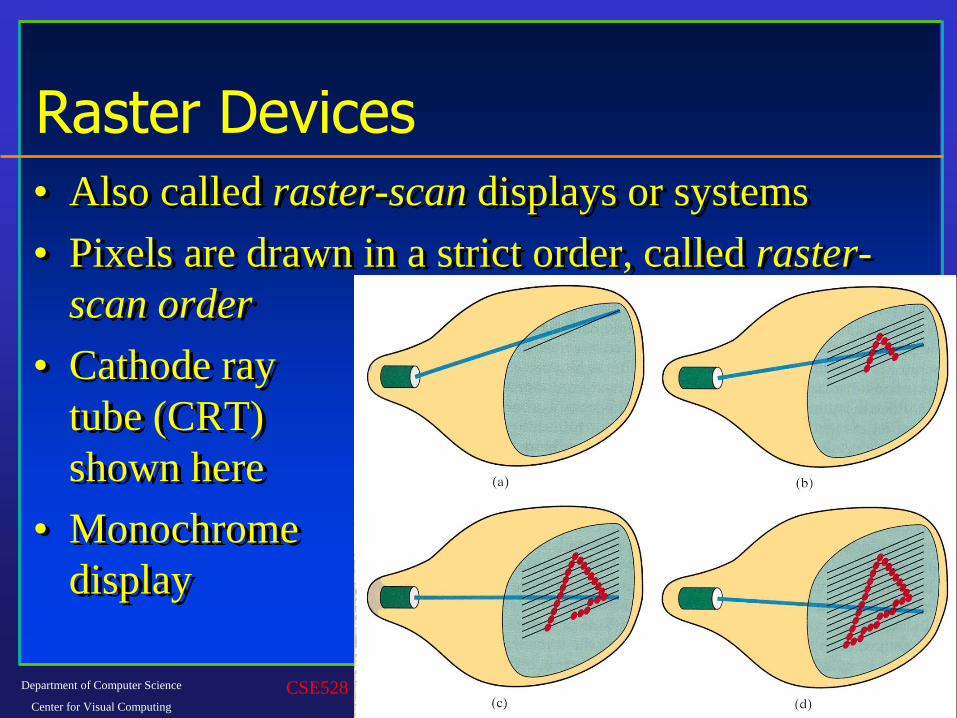
Raster Devices
• Also called raster-scan displays or systems
• Pixels are drawn in a strict order, called raster-
scan order
• Cathode ray
tube (CRT)
shown here
• Monochrome
display

STNY BRKSTATE UNIVERSITY OF NEW YORK
Department of Computer Science
Center for Visual Computing
CSE528 Lectures
Color Display Technology – CRT
• Cathode ray tube - used in TVs and computer
monitors (the large, clunky type)
• A color CRT has three
electron guns: one for
red, one for green,
and one for blue
• The beams scan
screen in horizontal
scanlines
• Metal mask steers beams

STNY BRKSTATE UNIVERSITY OF NEW YORK
Department of Computer Science
Center for Visual Computing
CSE528 Lectures
Color Display Technology – CRT
• Each screen pixel consists of a phosphor triple:
one glowing red, one green, and one blue
• A phosphor is a circular spot of phosphorescent
material that glows when electrons
strike it
• Red phosphors glow red
• RGB triad together form
a single pixel on screen

STNY BRKSTATE UNIVERSITY OF NEW YORK
Department of Computer Science
Center for Visual Computing
CSE528 Lectures
Color Display Technology – CRT
• Glowing phosphor triples blend together to form
color encoded in RGB triple
• Amount of energy that electron guns deliver to
each phosphor depends on
RGB value of image
pixel displayed there
• RGB values between
0 and 1 are mapped to
voltages for the guns

STNY BRKSTATE UNIVERSITY OF NEW YORK
Department of Computer Science
Center for Visual Computing
CSE528 Lectures
Color Display Technology – CRT
• True or false: A color image in a CRT is
generated by blending the three colored beams of
light that are fired from the back of the monitor
and blended on the front surface of the screen.

STNY BRKSTATE UNIVERSITY OF NEW YORK
Department of Computer Science
Center for Visual Computing
CSE528 Lectures
Color Display Technology – CRT• The phosphors glow only for about 10-60 microseconds
• Image refreshed 30-60 times per second
• This rate is called the refresh rate and is given in Hz
• So if we redraw the image once every 1/60th of a
second, but the image lasts only a few millionths of a
second, what about the gap?
• 1/60th second is approximately 16667 microseconds
• (16667 - 10) microseconds = “long” delay between
refreshes
• So why is there no visible flicker?

STNY BRKSTATE UNIVERSITY OF NEW YORK
Department of Computer Science
Center for Visual Computing
CSE528 Lectures
Raster Devices: Display Resolution
• The raster is not 100% perfect – points of light
corresponding to pixels can overlap slightly
• Same is true of raster printing technologies, like
laser and injket printers
• Pixels are more like circles than squares in reality
• Raster devices are also limited by resolution
– Computer monitors 1600 x 1200 and higher
– Laser printers 300 dpi, 600 dpi, 1200 dpi and higher
– TV resolution? HDTV?

STNY BRKSTATE UNIVERSITY OF NEW YORK
Department of Computer Science
Center for Visual Computing
CSE528 Lectures
Raster Devices: Color Depth• Horizontal lines of pixels are called scanlines
• TV: 640 HDTV: 720 or 1080
• Monochrome monitor has 1 bits per pixel (bpp)
• Grayscale has 8 bpp (usually)
• Color monitors most often have 24 bpp: 8 bits each for
red, green and blue color channels
• How many different levels of gray can we represent with 8
bits per pixel?
• How many different colors can 24-bit color represent?

STNY BRKSTATE UNIVERSITY OF NEW YORK
Department of Computer Science
Center for Visual Computing
CSE528 Lectures
Image Resolution
• Image resolution very important in graphics
rendering, why?
• When might we want to use a low resolution
image?
res = 3002 pixels res = 1502 pixels res = 752 pixels res =372 pixels

STNY BRKSTATE UNIVERSITY OF NEW YORK
Department of Computer Science
Center for Visual Computing
CSE528 Lectures
How Many Bits Do We Need?
• Number of bits per pixel often called bit depth
• How many bits should
we use in practice?
#1: 8-bit original image
#2: lower 4 bits dropped
#3: (image #1 - image #2)
#4: image #3 enhanced
1 2
3 4

STNY BRKSTATE UNIVERSITY OF NEW YORK
Department of Computer Science
Center for Visual Computing
CSE528 Lectures
Bit Depth
• Suppose we want to display 256 gray levels, but
we have only 1-bit color.
• What colors can we display?
• How do we accommodate grayscale images?
• How do we accommodate color images?
• Suppose we want to display 16.7 million colors
on our color monitor, but we have only 8-bit
color. What can we do?

STNY BRKSTATE UNIVERSITY OF NEW YORK
Department of Computer Science
Center for Visual Computing
CSE528 Lectures
Dithering• Dithering is a way to use a mixture of colors to trick
eye into seeing colors that cannot be actually
represented by display device
• We can approximate gray by using a combination of
black and white:
• The relative densities
of black and white
determine the “gray”
value
• Also called halftoning (vb. to halftone)

STNY BRKSTATE UNIVERSITY OF NEW YORK
Department of Computer Science
Center for Visual Computing
CSE528 Lectures
Interfacing to Hardware
• A lot goes on “under the hood” in the graphics and
display hardware
• Graphics hardware: converts geometry into pixels
• Display hardware: displays pixels
• Simplified hierarchy

STNY BRKSTATE UNIVERSITY OF NEW YORK
Department of Computer Science
Center for Visual Computing
Graphics Pipelines
• Graphics processes generally execute sequentially
• Typical ‘pipeline’ model
• There are two ‘graphics’ pipelines
– The Geometry or 3D pipeline
– The Imaging or 2D pipeline

STNY BRKSTATE UNIVERSITY OF NEW YORK
Department of Computer Science
Center for Visual Computing
CSE528 Lectures
Rasterization• We looked at raster devices and some different kinds of
geometric objects we might wish to draw on the screen
• Process of converting geometry into pixels is called
rasterization or scan-conversion
• Each triangle in our model is transformed (rotated, etc.)
and projected by the transformation and projection
matrices
• Next we clip each triangle to the image plane
• Each triangle is entirely inside, entirely outside,
partially visible w.r.t the image plane

STNY BRKSTATE UNIVERSITY OF NEW YORK
Department of Computer Science
Center for Visual Computing
CSE528 Lectures
Rasterization
• We will take an object-order approach
• Question: In contrast, ray-tracing is what-order?
• We process each triangle one by one
• After we transform and clip it, we rasterize it –
we figure how what pixels on screen we need to
update to draw the triangle on screen

STNY BRKSTATE UNIVERSITY OF NEW YORK
Department of Computer Science
Center for Visual Computing
CSE528 Lectures
Rasterization
• We will process the triangle in scan-line order:
left-to-right starting at top left corner, moving
right and down

STNY BRKSTATE UNIVERSITY OF NEW YORK
Department of Computer Science
Center for Visual Computing
CSE528 Lectures
Rasterization
• We sort the vertices by their y values and find
the vertex with the maximal y value; call this
vertex v0

STNY BRKSTATE UNIVERSITY OF NEW YORK
Department of Computer Science
Center for Visual Computing
CSE528 Lectures
Rasterization
• This sorting allows us to identify the other two
vertices, v1 and v2

STNY BRKSTATE UNIVERSITY OF NEW YORK
Department of Computer Science
Center for Visual Computing
CSE528 Lectures
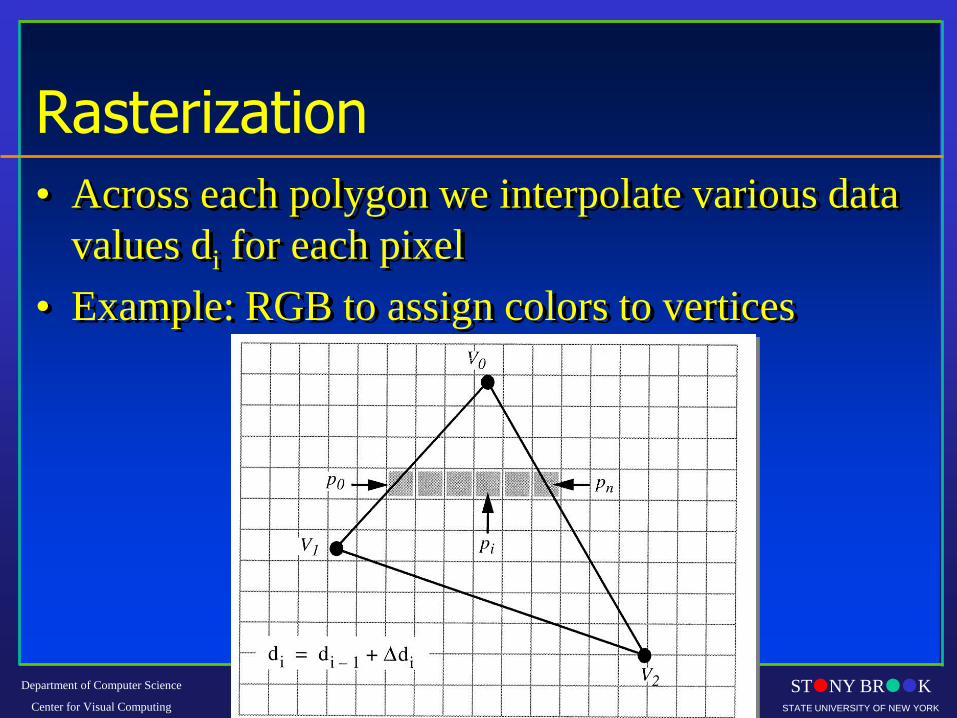
Rasterization
• Using the slopes of the edges we can compute
each row of pixels to process, called a span of
pixels
STNY BRKSTATE UNIVERSITY OF NEW YORK
Department of Computer Science
Center for Visual Computing
CSE528 Lectures
Rasterization
• Across each polygon we interpolate various data
values di for each pixel
• Example: RGB to assign colors to vertices

STNY BRKSTATE UNIVERSITY OF NEW YORK
Department of Computer Science
Center for Visual Computing
CSE528 Lectures
Rasterization
• But where do we get the RGB values?
• We will have to look at shading and illumination
• Now we will see how the theory is put into
practice
• We will look at three ways of implementing the
illumination equations:
– Flat surface rendering
– Gouraud surface rendering
– Phong surface rendering

STNY BRKSTATE UNIVERSITY OF NEW YORK
Department of Computer Science
Center for Visual Computing
CSE528 Lectures
Graphics Primitives
• Vertex: position, normal, color – how many values
total?
• Polygon: series of connected vertices

STNY BRKSTATE UNIVERSITY OF NEW YORK
Department of Computer Science
Center for Visual Computing
CSE528 Lectures
Graphics Primitives

STNY BRKSTATE UNIVERSITY OF NEW YORK
Department of Computer Science
Center for Visual Computing
CSE528 Lectures
Graphics Primitives
• Normal vectors: why for vertices?
• If our polygonal object came from curved surface,
vertex normals will not be same as polygonal
normals

STNY BRKSTATE UNIVERSITY OF NEW YORK
Department of Computer Science
Center for Visual Computing
Geometry Pipeline
Animation/Interaction : time
Modeling: shapes
Shading: reflection and lighting
Transformation: viewing
Hidden Surface EliminationImaging
Pipeline

STNY BRKSTATE UNIVERSITY OF NEW YORK
Department of Computer Science
Center for Visual Computing
Imaging Pipeline
Rasterization and Sampling
Texture Mapping
Image Composition
Intensity and Color Quantization
Geometry
Framebuffer/Display
Pipeline

STNY BRKSTATE UNIVERSITY OF NEW YORK
Department of Computer Science
Center for Visual Computing
33
An Example through the Pipeline…The scene we are trying to represent:
Images courtesy of Picture Inc.
STNY BRKSTATE UNIVERSITY OF NEW YORK
Department of Computer Science
Center for Visual Computing
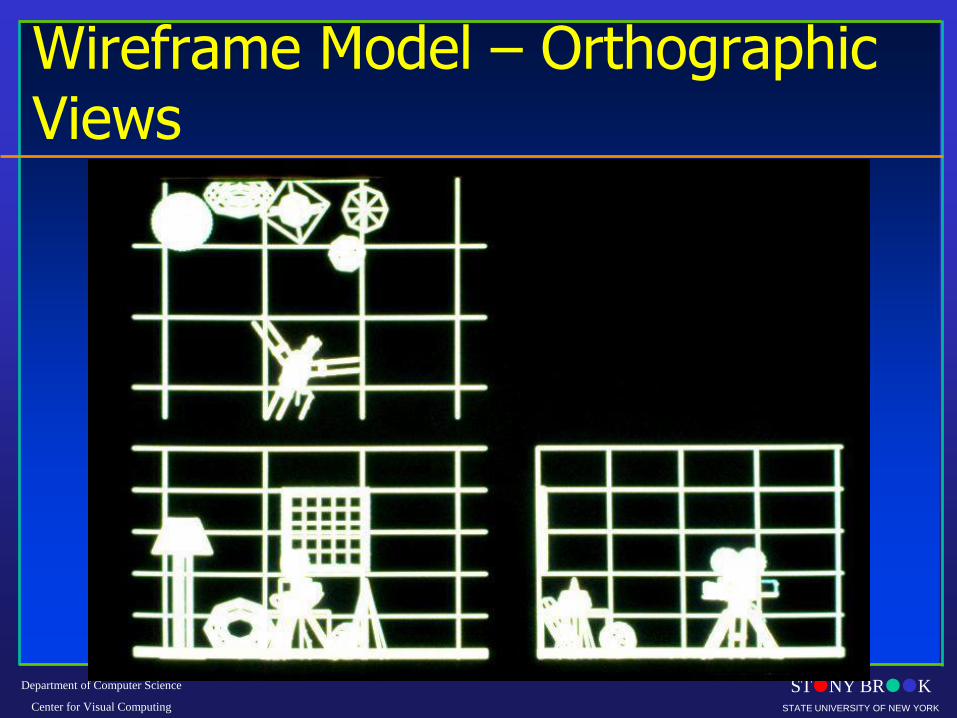
Wireframe Model – Orthographic Views

STNY BRKSTATE UNIVERSITY OF NEW YORK
Department of Computer Science
Center for Visual Computing
Perspective View

STNY BRKSTATE UNIVERSITY OF NEW YORK
Department of Computer Science
Center for Visual Computing
Depth Cue

STNY BRKSTATE UNIVERSITY OF NEW YORK
Department of Computer Science
Center for Visual Computing
Hidden Line Removal – Add Color

STNY BRKSTATE UNIVERSITY OF NEW YORK
Department of Computer Science
Center for Visual Computing
Constant Shading - Ambient

STNY BRKSTATE UNIVERSITY OF NEW YORK
Department of Computer Science
Center for Visual Computing
Faceted Shading - Flat

STNY BRKSTATE UNIVERSITY OF NEW YORK
Department of Computer Science
Center for Visual Computing
Gouraud Shading, No Specular Highlights

STNY BRKSTATE UNIVERSITY OF NEW YORK
Department of Computer Science
Center for Visual Computing
41
Specular Highlights

STNY BRKSTATE UNIVERSITY OF NEW YORK
Department of Computer Science
Center for Visual Computing
42
Phong Shading

STNY BRKSTATE UNIVERSITY OF NEW YORK
Department of Computer Science
Center for Visual Computing
43
Texture Mapping

STNY BRKSTATE UNIVERSITY OF NEW YORK
Department of Computer Science
Center for Visual Computing
Texture Mapping

STNY BRKSTATE UNIVERSITY OF NEW YORK
Department of Computer Science
Center for Visual Computing
45
Reflections, Shadows & Bump mapping