Osteopenia, decreased bone formation and impaired osteoblast development in Sox4 heterozygous mice
Upload
helmholtz-muenchenCategory
view
4download
0
Vol. 164, No. 2, 1969 October 31, 1969
BIOCHEMICAL AND BIOPHYSICAL RESEARCH COMMUNICATIONS Pages 728-735
COMPUTER-ASSISTED IMAGING CYTOMETRY OF NUCLEAR CHROMATIN REVEALS BONE TUMOR VIRUS INFECTION AND NEOPLASTIC TRANSFORMATION OF ADHERENT OSTEOBLAST-LIKE CELLS
J. Schmidt, M. Aubelel, U. Jiittingl, K. Rodenackerl, A. Luz2, V. Erfle, and G. Burger1
GSF-Abteilung fii Molekulare Zellpathologie, Institut fi.ir Strahlenschutz~, and
Institut fiir Pathologie2, D-8042 Neuherberg, Federal Republic of Germany
Received July 28, 1989
Summary: Established osteoblast-like (OB) cells infected with the bone tumor-inducing C-type retrovirus OA MuLV remained nontumorigenic over 104 cell culture passages. DNA histograms revealed a new cell population with a stem line peak at 5c. A second OA MuLV-infected OB cell line underwent neoplastic transformation with increasing passage level. These cells showed diffuse aneuploidy. Stepwise linear discriminant analysis of the chromatin structure of control, OA MuLV- infected, and FBR osteosarcoma virus-transformed cell lines resulted in various levels of discrimination ranging between 79.6% for control cells versus nontumorigenic OA MuLV-infected cells, and 96.6% for nontumorigenic OA MuLV-infected cells versus FBR osteosarcoma virus- transformed cells. OA MuLV-infected tumorigenic cells and FBR osteosarcoma virus-transformed cells were discriminated at a 93.6% level.
Murine leukemia viruses (MuLV) isolated from benign and malignant bone tumors (1,2) lack
transforming oncogenic sequences (v-one) (3). They induce no cytopathogenic effects in vitro, yet
they significantly affect proliferation and phenotypic differentiation of periosteal and osteoblast-like
cells (4,5), markedly interfere with the developmental pattern of osteogenic tissue in vitro (6), and
induce osteopetrosis and osteomas in mice after a latency period of approximately 12 months
(2,7). These findings suggest the generation of critical genomic alterations by retroviral integration
into the genome of infected skeletal cells. The identification of structural changes in the chromatin of single infected cells or in the DNA histograms of defined cell populations could serve as a
diagnostic tool as well as a prognostic marker for tumor development.
The present study describes cytometric parameters for the discrimination of cells at different stages
of neoplastic transformation. The nuclei of control, infected, and virus-transformed osteoblast-like
MC3T3-El cells were subjected to imaging cytometry and computer-assisted discrimination on a multidimensional feature base (8,9). The results show a clear distinction between control cells and
virus-infected cells, and particularly between different types of neoplastically transformed cells.
MATERIALS AND METHODS
Cell culture. Cells of the clonal osteogenic cell line MC3T3-El were cultured as described (7). Cell morphology was studied in subconfluent cultures after fixation with ethanol and staining with Giemsa solution. For imaging cytometry the cells were seeded into tissue culture chamber slides and cultured for 24 hours. Thereafter, the cells were further incubated in medium without
0006-291X/89 $1.50
728

Vol. 164, No. 2, 1989 BIOCHEMICAL AND BIOPHYSICAL RESEARCH COMMUNICATIONS
serum for 12 hours. Then the cells were washed with PBS, fixed in ethanol (30 min, 20°C) and stained by a modification of the Feulgen procedure. Briefly, the cells were subjected to acid hydrolysis (5 N HCl, 22’C, 30 rnin), stained with Schiff s reagent (Merck, Darmstadt, FRG) (60 min), washed in SO2-solution (0.38%) and distilled water, and air-dried. Fresh human peripheral blood leucocytes, fixed and stained as above, were used as external DNA standard.
Virus infection. MC3T3-El cells were cloned by end point dilution and clonal sublines were infected with OA MuLV (1) as described (5). Hundred percent-infected cell lines were named MC3T3-El-OA, and the passage level was determined as #l. OA MuLV-infected and control cells cultured in parallel in a 3T3 scheme were used for further analyses between the 60th and 81st cell culture passage. In order to obtain a virus-transformed control cell line, MC3T3-El cells were infected with the v-fos oncogene-bearing FBR osteosarcoma virus (FBR MSV) (10). A transformed phenotype was selected, named MC3T3-El-FBR, and cultured further.
Tumorigenicity of the cell lines. MC3T3-El control cells, MC3T3-El-OA cells and MC3T3-El-FBR cells were injected subcutaneously (2x10⁶ cells/inoculum) into newborn syngeneic mice. After the appearance of palpable tumors or at the end of the 3-month observation period the mice were killed. Tumour tissue was excised and processed for histological analysis.
Scanning conditions. One hundred nuclei per specimen were scanned in transmission at 100x magnification using an optical narrow band filter at 546 nm wavelength in a Zeiss AXIOMAT-microscope, equipped with a high resolution TlVK9Bl-TV camera (Bosch, Stuttgart, FRG). Processing of digitized images was carried out using a VAX 1 l/750 (DEC, Maynard, MA, USA), interfaced with an AP-120B array processor (Floating Point Systems, Portland, OR, USA). The pixel size of the digitized images was 0.25 pm2, the nominal grey value resolution was covered by 256 channels. The true physical resolution was described by means of measured modulation transfer functions which were generally 3-4 times lower than the digitized resolution (11).
Feature extraction. In a first step of feature extraction the areas of interest (Fig. 1A) were defined by visually controlled automatic threshold segmentation of the whole microscopical field (Fig. 1B). The entire nuclei and backgrounds, the border (BI) and central zones (CI) of nuclei, and the distinction of densely stained (N) and lightly stained (P) chromatin regions representing hetero-
m Feature calculations on the nuclei of MC3T3-El osteoblast-like cells. A, scanning image of an MC3T3-El nucleus; B, automatic segmentation of the nucleus shown in a; C, segmentation of dark particles representing heterochromatin; D, segmentation of bright particles representing euchromatin; E, Robert’s gradient of the nucleus; F, Laplacian transfoxmation of the nucleus.
729

Vol. 164, No. 2, 1989 BIOCHEMICAL AN0 BIOPHYSICAL RESEARCH COMMUNICATIONS
and euchromatin (Figs. lC,D) were identified. A limited number relevant for discrimination, was calculated. It included: area (A), perimeter (P), mean and standard deviation (SD) of the extinctions of the nucleus (Ml, M2), mean and SD of grey values of the background (BGMl, BGM2), mean and SD of grey values of the inside border zone (BIMl, BIM2), mean and SD of grey values of the bright particles (PMl, PM2), and mean and SD of grey values of the dark particles (NMl, NM2). A second set of features, derived from transformed images (linear and nonlinear image filtering) yielded a more texture-oriented quantification of the nuclei. They included: gradient (G) (Fig. 1E) and Laplace (L) (Fig. 1F) or median filtering (M). Subtraction of M from the original images resulted in the flat texture image (F). Applying these operations we obtained the following additional features: mean value (Ml), standard deviation (M2), skewness @43), and kurtosis (M4) of the transformed image. The first and higher moments of the grey value distribution were calculated for the gradient (GMl-4), for Laplacian (LMl-4), and for flat texture filtered image (FMl-4) inside the nucleus. From the computation of the latter, frequently occuring features emerged, such as area of bright particles (FPA), mean of the dark particles (FNMl), SD of the dark particles (FNM2) and number of dark particles (FNANZ). Further, we used the following combinations: ratio between the optical density of bright and dark particles (RFMl), mean grey value of the center zone @Ml), relative area of dark particles (FNAA), mean of areas of bright particles @PAN), and the difference between the means of extinction of dark and bright particles (FDMl). The integrated optical density (I.O.D.) was calculated by the equation:
I.O.D. = (Ml - BGMl) x A.
Statistical analysis. Ten parallel slides were prepared from each cell line and 100 nuclei were randomly selected from each slide. Single cell classifications were performed by means of linear discriminant analysis (8), for a four-class-case, and for the different two-class-cases by the BMDP computer program (Statistical Software Inc., Los Angeles, CA, USA).
RESULTS
Cell morphology. At confluency MC3T3-El cells exhibited a pronounced epithelial-like,
round, polygonal morphology. Due to post-confluence inhibition of cell division, the cells stopped
growing and maintained the monolayer-appearance after reaching confluency (Fig. 2A). Several
MC3T3-El cell lines, cultured in parallel, were infected with OA MuLV and cultured further seperately. With increasing cell passage numbers the infected cell lines acquired different
morphological appearances. Two of the infected lines were selected on the basis of differences in
w Microphotographs of MC3T3-El cells showing the morphological appearance of Sday- old cell cultures. (Giemsa stain, x250). A, control MC3T3-El cells; B, MC3T3-El-OAnt cells. Same cells as shown in a, but infected with OA MuLV; C, MC3T3-El-OAt cells. Same cells as shown in a, but infected with OA MuLV and exhibiting a tumorigenic phenotype; D, MC3T3-El- FBR cells. Same cells as shown in a, but transformed by the murine osteosarcoma virus FBR MSV.
730

Vol. 164, No. 2, 1989 BIOCHEMICAL AND BIOPHYSICAL RESEARCH COMMUNICATIONS
the extent to which these morphological changes were expressed. Partial loss of contact inhibition,
concom-mittant with the appearance of more elongated, spindle-like cells were observed in one
infected cell line which was thereafter named MC3T3-El-OAnt (Fig. 2B). A second OA MuLV-
infected cell line developed the same characteristic changes, however, to a much greater extent (Fig. 2C). This cell line was named MC3T3-OAt. The MC3T3-El-FBR cell line revealed
characteristics of virus-transformed cells (5). They were for the most part elongated, spindle-
shaped and grew in compact, multilayered areas of the culture dish. Rounded cells were frequently
observed in the criss-cross growing areas (Fig. 2D). The proliferation rates of control cells,
MC3T3-El-OAnt and MC3T3-El-OAt cells, and MC3T3-El-FBR cells were 25.8 h, 13.5 h, 12.7
h, and 10.4 h, respectively. Tumorigenicity. Tumour growth of MC3T3-El-OAnt cells was not observed until the 104th
passage in 5 1 injected mice during a 92- 119 day observation period. At passage level 4, MC3T3-
OAt cells were non-tumorigenic (O/5). At passage level 23 one out of six injected mice (l/6)
DNCI - CONTENT
Fi re 3 DNA distributions of MC3T3-El osteoblast-like cells after infection +. an neoplastlc transformation. A, MC3T3-El control cells; B, MC3T3-El-OAnt cells; C, MC3T3-El-OAt cells; D, MC3T3-El-FBR cells; solid line, histograms of approxi- mately 1000 osteoblast-like cells; broken line, histograms of approximately 250 human leukocytes, used as DNA standard.
731
Vol. 164, No. 2, 1989 BIOCHEMICAL AND BIOPHYSICAL RESEARCH COMMUNICATIONS
developed subcutaneous sarcomas 21,days after injection. A second mouse developed sarcoma 28 days after injection, and the four mice left in this experimental group developed sarcomas 92 days after injection. At passage level 31, 100% of MC3T3-El-OAt-injected mice (4/4) developed sarcomas 22 days after injection. MC3T3-El-FBR cells formed sarcomas in all injected mice (4/4) between 22 and 63 days after injection. Control cells were non-tumorigenic.
DNA histograms. MC3T3-El control cells showed a prominent bipartite GO/G1 peak between 2c and 4c indicating the presence of more than one stem line. The corresponding G2/M component was identified between 6c and 7c, and a considerable number of S-phase cells was distributed in between (Fig.3A). MC3T3-El-OAnt cells showed one peak similar to that observed in non-infected cells at 3c, together with its corresponding G2/M component at 6c, and an additional DNA peak at the position of approximately 5c. The G2/M component plotted in the higher-ploidy range (Fig.3B). MC3T3-El-OAt cells showed diffuse hyperploidy and aneuploidy without a distinct stem line. The DNA content ranged from approximately 6c to beyond 12c (Fig.3C). A similar pattern of DNA distribution around the 4c and 5.5~ position (Fig.3D). with distinct stem lines was observed in MC3T3-El-FBR cells. Human peripheral blood lymphocytes generated a single narrow 2c peak characteristic of human diploid cells.
N
2.7 +
-90 l
0.0 +
-.90 l
-1.0 .
-2.7 l
-3.6 l
4.3 l CC a c 1
. . . . . . . . *...............~.......*.......~..........~......*.....*......~~~*.*...........*.......*.......~.. -6.J -4.5 -2.7 -. 90 -90 2.7 b.3
-S.b -3.b -1.8 0.0 1.8 3.6
CANONICAL VARIABLE 1
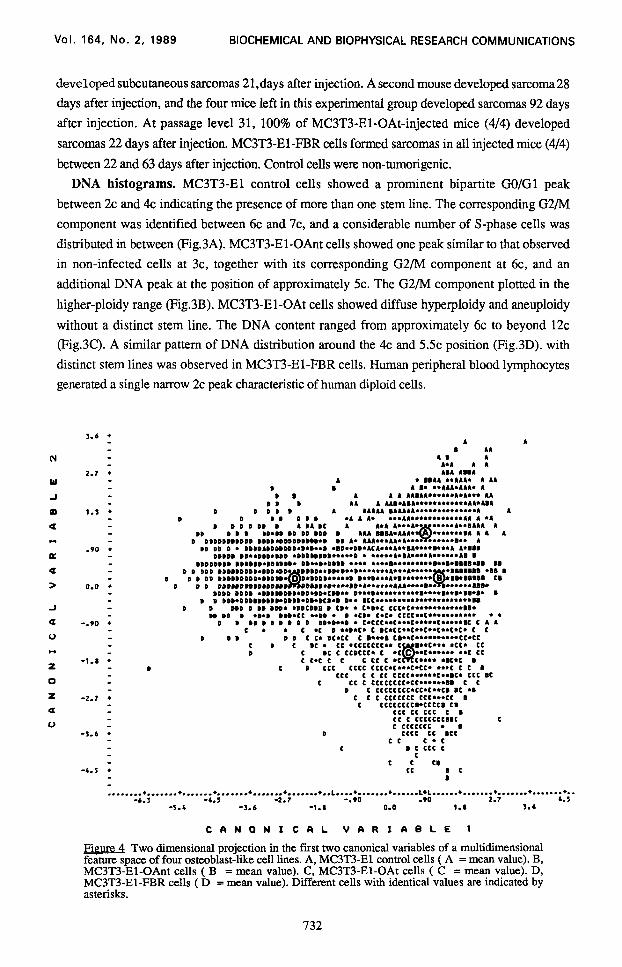
Figure Two dimensional projection in the first two canonical variables of a multidimensional feature space of four osteoblast-like cell lines. A, MC3T3-El control cells ( A = mean value). B, MC3T3-El-OAnt cells ( B = mean value). C, MC3T3-El-OAt cells ( C = mean value). D, MC3T3-El-FBR cells ( D = mean value). Different cells with identical values are indicated by asterisks.
732

Vol. 164, No. 2, 1989 BIOCHEMICAL AND BIOPHYSICAL RESEARCH COMMUNICATIONS
Two-class-case discximinant analysis of different osteoblast-like cell lines Table 1
MC3TSEl-OAnt MCYSEl-OAt MC3T3-El-FBR
MC3T3-El 79.6% 94.4% 94.8% A, FDMl, P DMl, BIM2, FNAA, M2, GM3,RFMl
MC3T3-El-O& 82.5% 96.6% FNAA, BIM2, FNANZ LMl, P, GM4
MC3T3-El-OAt 93.6% P, FDM 1 ,FPAN
The figures represent the degree of correct assignation (o/o); the 3 most potent features used for the individual two-class-case discrimination are listed; p= <O.OOl.
Discriminant analysis. Four-class-case: A stepwise linear discriminant analysis was
performed of the four different cell lines and a scatter plot was generated in the plane of two
canonical variables (Fig. 4). The means were plotted as A, B, C and D representing the four cell
lines. The distance between the means and the deviations within the four-class-cases indicated the
degree of discrimination of the four cell lines. These calculations resulted in the correct assignation
of 78.5% of all cells. The order of the most powerful features used to generate this assignation
was i) M2, ii) A, and iii) FDMl, i.e. the contrast of heterochromatin versus euchromatin.
Two-class-cases: The 4 cell lines were discriminated by the six possible two-class-cases. The
correct classification rates and the 3 most potent features are listed in Table 1. The lowest degree of
discrimination was observed between control and MC3T3-El-OAnt cells (79.6%), followed by the
discrimination of non-tumorigenic and the tumorigenic phenotypes of OA MuLV-infected cells
(82.5%). FBR MSV-trans-formed cells were discriminated from control cells by 94.8%, from
MC3T3-El-OAnt cells by 96.6%, and from MC3T3-El-OAt cells by 93.6% (Table 1).
DNA distributions between 8c and 12c of MC3T3-OAnt and MC3T3-OAt cells were subjected to a
more specific analysis. Although these two cell populations revealed similar DNA distributions (Fig. 4B,C), they were discriminated at the 76.1% level.
DISCUSSION
Cells of the immortalized osteoblast-like cell line MC3T3-El were infected with the bone tumor-
inducing OA MuLV and different cell lines were separately cultured further. Whereas one infected
cell line, MC3T3-El-OAt, gradually underwent neoplastic transformation between the 23rd and
38th cell culture passage, the MC3T3-El-OAnt cell line remained non-tumorigenic until the 104th passage. These two cell lines were investigated in comparison with FBR osteosarcoma virus-
transformed and noninfected control cells. Multiple cytometric features were determined, and the data analysed using an image analysis system.
The DNA distributions of the control cell line showed a distinct stem line with a bipartite DNA peak at about 3c for the GO/G1 cells. The presence of more than one corresponding G2/M peak
indicates towards the presence of 2 cell populations in the control cell line which show only small differences in their DNA content. Non-tumorigenic, OA MuLV-infected cells showed 2 distinct
733

Vol. 164, No. 2, 1989 BIOCHEMICAL AND BIOPHYSICAL RESEARCH COMMUNICATIONS
stem lines of 3c and 5c together with corresponding G2/M peaks. It is worth to note that the evolution of the second stem line did not reflect infected versus non-infected cells, since all cells of the two OA MuLV-infected cell lines were infected. A considerable number of cells had DNA contents of 6c to 12c indicating the induction of aneuploidy by MuLV infection. Yet, the great majority of the cells appear to have stable DNA contents irrespective of the presence of 2 distinct stem lines. MC3T3-El-OAt cells showed diffuse hyperploidy and aneuploidy. Although MC3T3-El-OAt and MC3T3-El-FBR cells were very similar in doubling time and tumorigenicity they were clearly distinguishable in the above system. The different modes of transformation were reflected in the present study by obvious differences in their DNA distribution. The neoplastic characteristics of FBR MSV-transformed cells result from the transforming effect of the v-fos oncogene (12). In contrast, OA MuLV does not carry a viral oncogene (3), and it is assumed that MC3T3-El-OAt cells underwent spontaneous neoplastic transformation independent from virus infection as described for primary cell cultures (13-1.5) and established cell lines (16-20). OA MuLV infection of osteoblast precursor cells is followed by significantly increased cell growth, indicating the induction of proliferation as a result of retroviral integration (4). This effect appears to be under host control in vivo as well as in primary cell cultures, yet, it may be sufficient for the induction of neoplastic transformation of immortalized rodent cells. Our data allowed the discrimination not only of MuLV-infected cells from non-infected controls but also of spontaneously transformed cells from oncovirus-transformed cells. In this context it is interesting to note that the most potent features for optimal discrimination of two given cell lines were different in each two-class-case analysis. Based on the findings that DNA content and numerous morphological parameters in the nuclei are affected following viral infection, spontaneous, and/or oncoviral transformation, this analysis may provide an experimental basis for elucidating the tumorigenic potential of virus-infected cells and the state of neoplastic transformation, as well as determining hallmarks of neoplastic progression, particularly in bone neoplasia.
REFERENCES
1. Schmidt, .I., Erfle, V., Pedersen, F.S., Rohmer, H., Schetters, H., Marquart, K.-H., and Luz, A. (1984) J. Gen. Virol. 65,2237-2248.
2. Erfle, V., Schmidt, J., Strauss, P.G., Hehlmann, R., and Luz, A. (1986) Leukemia Res. 10, 905913.
3. Leib-Mosch. Ch., Schmidt, J., Etzerodt, M., Pedersen, F.S., Hehlmann, R., and Erfle, V. (1986) Viroiogy i50,96-105.
4. Schmidt. J.. Casser-Bette. M.. Murray, A.B., Luz, A., and Erfle, V. (1987) Am. J. Pathol. 129, 503-510.
_
5. Schmidt, J., Casser-Bette, M., Rodan, G.A., Baumgartner-Decker, C., and Erfle, V. (1987) in Current Advances in Skeletogenesis (Hurwitz, S., and Sela, S.J. Eds.) pp. 73-91, Plenum Press, New York.
6. Livne, E., Schmidt, J., Closs, E.I., Silbermann, M., and Erfle, V. (1988) Calcif. Tissue Int. 44, 25-35.
7. Schmidt, J., Luz, A., and Erfle, V. (1988) Leukemia Res. 12,393-403. 8. Burger, G., and Jiitting, U. (1985) in Pattern Recognition in Practice II (Gelema, ES., and
Kanal, L.N. Eds.), pp. 509-517, North Holand Publications, Amsterdam, New York, Oxford.
734
Vol. 164, No. 2, 1969 BIOCHEMICAL AND BIOPHYSICAL RESEARCH COMMUNICATIONS
9. Rodenacker, K. (1987) in Clinical Cytometry and Histometry (Burger, G., and Ploem, J.S., and Goerttler, K., Eds,), pp. 91-96, Academic Press, London.
10. Finkel, M.P., Reilly, C.A., and Biskis, B.O. (1975) Front. Radiat. Ther. Oncol. 10, 28-39. 11. Gais, P., and Burger G. (1988) in Morphometrie in der Zyto- und Histopathologie (Burger,
G., Oberholzer, M., and Goessner W., Eds.), pp. 282-294, Springer Verlag, Berlin. 12. Verma, I.M., and Graham, W.R. (1987) Adv. Cancer Res. 49, 29-52. 13. Engelholm, S.A., Vindelov, L.L., Spang-Thomsen, M., Bruenner, N, Nielsen, M.H., and
Hansen, H.H. (1985) Eur. J. Cancer Clin. Oncol. 21,815824. 14. Kraemer, P.M., Ray, F.A., Bartholdi, E.F., and Cram, L.S. (1987) Cancer Genet.
Cytogenet. 27, 273-287. 15. Thomassen, D.G., Nettesheim, P., Gray, T.E., and Barret, J.C. (1985) Cancer Res. 45,
1516-1524. 16. Thomassen, D.G., and DeMars, R. (1982) Cancer Res. 42, 4054-4063. 17. Mordan, L.J., Martner, J.E., and Bertram, J.E. (1983) Cancer Res. 43,4062-4067. 18. Grisham,J.W., Smith, G.J., Lee, L.W., Bentley, K.S., and Fatteh, M.V. (1988b) Cancer
Res. 48, 5977-5983. 19. Greig, R.G., Koestler, T.P., Trainer, D.L., Corwin, S.P., Miles, L., Kline, T., Sweet, R.,
Yokoyama, S., and Poste, G. (1985) Proc. Natl. Acad. Sci. USA 82,3698-3701. 20. Gavilondo, J., Fernandez, A., Castillo, R., and Lage, A. (1982) Neoplasma 29, 269-279.
735
Copyright © 2022 FDOKUMEN