Computational analysis of fluorescence induction curves in intact spinach leaves treated at...
6
BioSystems 103 (2011) 158–163 Contents lists available at ScienceDirect BioSystems journal homepage: www.elsevier.com/locate/biosystems Computational analysis of fluorescence induction curves in intact spinach leaves treated at different pH Teena Tongra a , Pooja Mehta a , Sonal Mathur a , Divya Agrawal a , Sudhakar Bharti a , Dmitry A. Los b , Suleyman I. Allakhverdiev b,c , Anjana Jajoo a,∗ a School of Life Science, Devi Ahilya University, Indore 452 017, M.P., India b Institute of Plant Physiology, Russian Academy of Sciences, Botanicheskaya Street 35, Moscow 127276, Russia c Institute of Basic Biological Problems, Russian Academy of Sciences, Pushchino, Moscow Region 142290, Russia article info Article history: Received 23 March 2010 Received in revised form 23 July 2010 Accepted 27 July 2010 Keywords: Fluorescence induction kinetics pH Spinacia oleracea Energy flux models abstract Effects of change in pH have been investigated on spinach leaf discs by measuring fluorescence induction kinetics using plant efficiency analyzer (PEA). On the basis of computational analysis of the results, we have reported that acidic pH causes a significant inhibition of the donor and the acceptor side of PS II. Energy flux models have been presented using the software Biolyzer HP 3. Effects of pH were investigated on the antenna size heterogeneity of PS II and a relative change in the proportions of , , and centers was observed. © 2010 Elsevier Ireland Ltd. All rights reserved. 1. Introduction Photosystem II (PS II) is an integral membrane protein complex embedded in the grana of the thylakoid membrane. PS II is unique as it is capable of oxidizing water to molecular oxygen along with the generation of reducing equivalents. The reaction centre consists of D1 and D2 proteins which contain primary electron donor P680, secondary electron donor which is redox active tyrosine residues Y Z and Y D , the intermediary electron acceptor pheophytin and two plastoquinone electron acceptor Q A and Q B along with associated non-heme iron. On the luminal side of PS II three extrinsic proteins with molecular mass of 33, 23 and 17 kDa bind and regulate the activity of oxygen evolving complex (see Ke, 2000). The effects of pH on many physiological processes in plants are well established. Significant work has been done to explore the effects of pH on the photosynthetic process. At lower pH the life- time of P680 + is longer entailing a greater probability of charge recombination (Lavergne and Rappaport, 1998). A low luminal pH slows down the reoxidation of plastoquinol (Hope et al., 1994). In Abbreviations: ABS, absorbance; Chl, chlorophyll; CS, cross-section; DCMU, 3-(3,4-dichlorophenyl)-1,1-dimethylurea; Fm, maximal Chl a fluorescence; Fo, min- imal Chl a fluorescence; Fv, variable fluorescence; LHC, light harvesting complex; OEC, oxygen evolving complex; PEA, plant efficiency analyzer; PS II, Photosystem II; PQ, plastoquinone; Q A , primary plastoquinone; QB, secondary plastoquinone; RC, reaction center; TR, trapping. ∗ Corresponding author. Tel.: +91 731 2477166; fax: +91 731 4263453. E-mail address: [email protected] (A. Jajoo). vitro, the oxygen evolving complex loses Ca 2+ at pH < 6.0, inhibit- ing water splitting and rendering the PS II reaction centre (Kramer et al., 2003). Recently, in isolated thylakoid membranes, we have shown pH dependent regulation of distribution of excitation energy between the PS II and PS I (Singh-Rawal et al., 2010). Acidification of the luminal pH induces qE through the protonation of PSII proteins and activation of xanthophylls synthesis by xanthophylls cycle. Together, binding of protons and xanthophylls to specific sites in the PSII antenna causes a conformational change that switches a PSII unit into a quenched state (Muller et al., 2001). Decrease in lumen pH also activates violaxanthin deepoxidase which is an enzyme of the xanthophyll cycle that catalyzes the conversion of violaxanthin to zeaxanthin via antheraxanthin (Bergantino et al., 2003). None of the above stated work investigated the effect of pH on chlorophyll a fluorescence induction kinetics in spinach leaves. PS II is heterogeneous with respect to its antenna size and local- ization. The antenna size heterogeneity refers to the occurrence of distinct PSII populations with different light-harvesting chlorophyll (Chl) antenna sizes. By using kinetic analysis of fluorescence induc- tion curve of DCMU-poisoned chloroplast, PSII was resolved into three components, i.e., PS II , PS II and PS II (Hsu and Lee, 1991) The dominant form, PSII , is localized in the grana partition regions (Anderson and Melis, 1983) and is responsible for the majority of the water oxidation activity and plastoquinone reduction. These centers possess a Chl a core complex, an accessory Chl a–b light harvesting inner antenna (LHC II-inner), and a peripheral antenna (LHC II-peripheral) containing a combined total of about 210–250 Chl a and Chl b molecules (Morrissey et al., 1989). These have a 0303-2647/$ – see front matter © 2010 Elsevier Ireland Ltd. All rights reserved. doi:10.1016/j.biosystems.2010.07.019
-
Upload
independent -
Category
Documents
-
view
1 -
download
0
Transcript of Computational analysis of fluorescence induction curves in intact spinach leaves treated at...
Ct
TDa
b
c
a
ARRA
KFpSE
1
eatosYpnwa
wetrs
3iOIr
0d
BioSystems 103 (2011) 158–163
Contents lists available at ScienceDirect
BioSystems
journa l homepage: www.e lsev ier .com/ locate /b iosystems
omputational analysis of fluorescence induction curves in intact spinach leavesreated at different pH
eena Tongraa, Pooja Mehtaa, Sonal Mathura, Divya Agrawala, Sudhakar Bharti a,mitry A. Losb, Suleyman I. Allakhverdievb,c, Anjana Jajooa,∗
School of Life Science, Devi Ahilya University, Indore 452 017, M.P., IndiaInstitute of Plant Physiology, Russian Academy of Sciences, Botanicheskaya Street 35, Moscow 127276, RussiaInstitute of Basic Biological Problems, Russian Academy of Sciences, Pushchino, Moscow Region 142290, Russia
r t i c l e i n f o
rticle history:eceived 23 March 2010
a b s t r a c t
Effects of change in pH have been investigated on spinach leaf discs by measuring fluorescence inductionkinetics using plant efficiency analyzer (PEA). On the basis of computational analysis of the results, we
eceived in revised form 23 July 2010ccepted 27 July 2010
eywords:luorescence induction kineticsH
have reported that acidic pH causes a significant inhibition of the donor and the acceptor side of PS II.Energy flux models have been presented using the software Biolyzer HP 3. Effects of pH were investigatedon the antenna size heterogeneity of PS II and a relative change in the proportions of �, �, and � centerswas observed.
© 2010 Elsevier Ireland Ltd. All rights reserved.
pinacia oleraceanergy flux models
. Introduction
Photosystem II (PS II) is an integral membrane protein complexmbedded in the grana of the thylakoid membrane. PS II is uniques it is capable of oxidizing water to molecular oxygen along withhe generation of reducing equivalents. The reaction centre consistsf D1 and D2 proteins which contain primary electron donor P680,econdary electron donor which is redox active tyrosine residuesZ and YD, the intermediary electron acceptor pheophytin and twolastoquinone electron acceptor QA and QB along with associatedon-heme iron. On the luminal side of PS II three extrinsic proteinsith molecular mass of 33, 23 and 17 kDa bind and regulate the
ctivity of oxygen evolving complex (see Ke, 2000).The effects of pH on many physiological processes in plants are
ell established. Significant work has been done to explore the
ffects of pH on the photosynthetic process. At lower pH the life-ime of P680+ is longer entailing a greater probability of chargeecombination (Lavergne and Rappaport, 1998). A low luminal pHlows down the reoxidation of plastoquinol (Hope et al., 1994). InAbbreviations: ABS, absorbance; Chl, chlorophyll; CS, cross-section; DCMU,-(3,4-dichlorophenyl)-1,1-dimethylurea; Fm, maximal Chl a fluorescence; Fo, min-
mal Chl a fluorescence; Fv, variable fluorescence; LHC, light harvesting complex;EC, oxygen evolving complex; PEA, plant efficiency analyzer; PS II, Photosystem
I; PQ, plastoquinone; QA, primary plastoquinone; QB, secondary plastoquinone; RC,eaction center; TR, trapping.∗ Corresponding author. Tel.: +91 731 2477166; fax: +91 731 4263453.
E-mail address: [email protected] (A. Jajoo).
303-2647/$ – see front matter © 2010 Elsevier Ireland Ltd. All rights reserved.oi:10.1016/j.biosystems.2010.07.019
vitro, the oxygen evolving complex loses Ca2+ at pH < 6.0, inhibit-ing water splitting and rendering the PS II reaction centre (Krameret al., 2003). Recently, in isolated thylakoid membranes, we haveshown pH dependent regulation of distribution of excitation energybetween the PS II and PS I (Singh-Rawal et al., 2010). Acidification ofthe luminal pH induces qE through the protonation of PSII proteinsand activation of xanthophylls synthesis by xanthophylls cycle.Together, binding of protons and xanthophylls to specific sites inthe PSII antenna causes a conformational change that switchesa PSII unit into a quenched state (Muller et al., 2001). Decreasein lumen pH also activates violaxanthin deepoxidase which is anenzyme of the xanthophyll cycle that catalyzes the conversion ofviolaxanthin to zeaxanthin via antheraxanthin (Bergantino et al.,2003). None of the above stated work investigated the effect of pHon chlorophyll a fluorescence induction kinetics in spinach leaves.
PS II is heterogeneous with respect to its antenna size and local-ization. The antenna size heterogeneity refers to the occurrence ofdistinct PSII populations with different light-harvesting chlorophyll(Chl) antenna sizes. By using kinetic analysis of fluorescence induc-tion curve of DCMU-poisoned chloroplast, PSII was resolved intothree components, i.e., PS II �, PS II � and PS II � (Hsu and Lee, 1991)The dominant form, PSII �, is localized in the grana partition regions(Anderson and Melis, 1983) and is responsible for the majority of
the water oxidation activity and plastoquinone reduction. Thesecenters possess a Chl a core complex, an accessory Chl a–b lightharvesting inner antenna (LHC II-inner), and a peripheral antenna(LHC II-peripheral) containing a combined total of about 210–250Chl a and Chl b molecules (Morrissey et al., 1989). These have a
stems
hpvPmibirDpp1a
skaaKcflwftorrcacft2
ksOtbaspdecaao
2
2
wfai
2
aTpufl
maximum concentration of QA QB with plastoquinol pool max-imally reduced. The phase P also reflects a balance between lightincident at the PS II side and the rate of utilization of the chem-ical (potential) energy and the rate of heat dissipation (Zhu et al.,2005). When they are treated with buffers of different pH a decrease
T. Tongra et al. / BioSy
igher absorption cross-section area due to association with theeripheral Chla/b LHCs. PSII� are characterized by a large light har-esting antenna and possibility of excited states transfer betweenSII units that is reflected in a sigmoidal fluorescence rise wheneasured with DCMU. On the other hand PSII� are mainly located
n stromal region of thylakoid membranes and are characterizedy about 2.5 times smaller light harvesting antenna of PSII� and
mpossibility of the excited states transfer between PS IIs that iseflected in an exponential fluorescence rise when measured withCMU. Smaller antenna size has been ascribed to the absence oferipheral LHC II in PSII. The intrinsic trapping and fluorescenceroperty of � and � centers are considered to be similar (Melis,991). The antenna size of PSII � is the smallest amongst all and islso called unpredictable centers because of their varied behavior.
Chlorophyll a fluorescence induction kinetics is a useful, highlyensitive and non-invasive parameter to study electron transferinetics between the various components of PS II. When dark-dapted oxygenic photosynthetic cells are illuminated, chlorophyllfluorescence shows complex induction kinetics (FI) termed as theautsky Curve (Strasser et al., 2004; Zhu et al., 2005). In fluores-ence induction curve, termed OJIP curve, the initial chlorophylluorescence at level O (Fo) reflects the minimal fluorescence yieldhen all the molecules of QA are in the oxidized state. The transition
rom phase O to J is controlled by photochemical charge separa-ion leading to the reduction of QA to QA
− while the appearancef phases I and P are limited by dark reaction. Level P (Fm) cor-esponds to the situation in which all molecules of QA are in theeduced state. Thus, the polyphasic rise of chlorophyll a fluores-ence transient from Fo to Fm is called OJIP transient (Strasser etl., 1995). Chl a fluorescence induction curves (OJIP) enables cal-ulation of several phenomenological and biophysical expressionsor quantifying the energy fluxes and energy ratios through Pho-osystem II (Strasser et al., 2010; Mehta et al., 2010; Mathur et al.,010).
The effects of different pH on Chl a fluorescence inductioninetics has been studied in spinach leaf discs. In the presenttudy, a computational analysis of the information obtained fromJIP curves has been performed. It is evident from the results
hat a single measurement of fluorescence induction kinetics cane exploited to derive vast information regarding the structurend function of PS II. Such information can allow us to quicklycreen various genotypes on the basis of their performance. Severalarameters like Fv/Fm, ABS/RC, performance index, etc. have beenerived from OJIP curves. For direct visualization and comparison,nergy pipeline model and radar plot have been constructed usingomputer software. Effects of pH were evident on the OEC and thecceptor side of PS II. Antenna size heterogeneity of PS II is alsoffected by change in pH as shown by the change in the proportionsf PS II �, � and � fractions under different pH conditions.
. Material and methods
.1. Plant material: Spinach (Spinacea oleracia) leaf disc
Fresh spinach leaves were brought from the market and cut in to small discshich were transferred to the Petri plates containing 50 mM buffer solution of dif-
erent pH. For pH 8.0 and 7.5 (HEPES–NaOH), pH 6.5 and 5.5 (MES–NaOH) and pH 5.0nd 4.5 (sodium acetate–acetic acid) buffers were used. Leaf discs were incubatedn dark for 4 h.
.2. Chlorophyll a fluorescence induction kinetics
Chlorophyll a fluorescence (O-J-I-P) transients were recorded at room temper-ture with a Plant Efficiency Analyser (PEA, Hansatech King’s Lynn, Norfolk, UK).he actinic light intensity reaching to the leaf surface was 3500 �mole/m2/s. Energyipeline models were prepared to visualize treatment effects on O-J-I-P kinetics,sing Biolyzer HP 3 software (for calculating JIP test parameter that quantify energyow through PS II) by Bioenergetics Laboratory, University of Geneva, Switzerland).
103 (2011) 158–163 159
2.3. Measurement of antenna size heterogeneity
For calculation of antenna size heterogeneity DCMU poisoning method of Hsuet al. (1989) was used. Spinach leaf discs were put in darkness for ∼1 h before theDCMU treatment. The leaf discs were immersed in DCMU solution (the DCMU con-centration was 200 �M, and the solution contained 1% ethanol, which was used todissolve the DCMU). The duration of the treatment was ∼16 h, and it was carried outin complete darkness. Following the treatment, the leaf discs were removed fromthe DCMU solution (in darkness), wiped and left in the air for ∼1 h to avoid possibleeffects of anaerobiosis.
3. Results and discussion
3.1. Analysis of OJIP transient showing pH-induced changes
Chlorophyll a fluorescence transient was measured to evalu-ate the effect of pH treatment on the photochemical efficiency ofPS II. The OJIP transient depicts the rate of reduction kinetics ofvarious components of PS II. When dark adapted spinach leaf isilluminated with the saturating light intensity of 3500 �mole/m2/sthen it exhibits a polyphasic rise in fluorescence (OJIP). Each let-ter reflects distinct inflection in the induction curve as shown in(Fig. 1A). The level O represents all the open reaction centers at theonset of illumination with no reduction of QA (fluorescence inten-sity lasts for 10 �s). The rise of transient from O to J indicates the netphotochemical reduction of QA (the stable primary electron accep-tor of PS II) to QA
− (lasts for 2 ms). The phase from J to I was dueto all reduced states of closed RCs such as QA
− QB−, QA QB
2− andQA
− QB H2 (lasts for 2–30 ms). The level P (300 ms) coincides with− 2
Fig. 1. (A) Fluorescence induction curves (in log time scale) in spinach leaf discstreated with different pH in dark for 4 h. (B) Fluorescence induction curves in spinachleaf discs treated with DCMU (200 �M) and different pH in dark for 4 h.
160 T. Tongra et al. / BioSystems 103 (2011) 158–163
Fv
itconwtflsaTFi(itot(a1dbavadsitlPdtcicbawomtccn
Fig. 3. Changes in relative variable fluorescence [rF (t)], defined as (F(t) − F )/
of PS II and is used as a sensitive indicator of plant photosyn-thetic performance (Maxwell and Johnson, 2000). The ratio Fv/Fm
decreases with decrease in pH which reflects the disintegration ofminor antenna subunits from PS II. There may be reduction in the
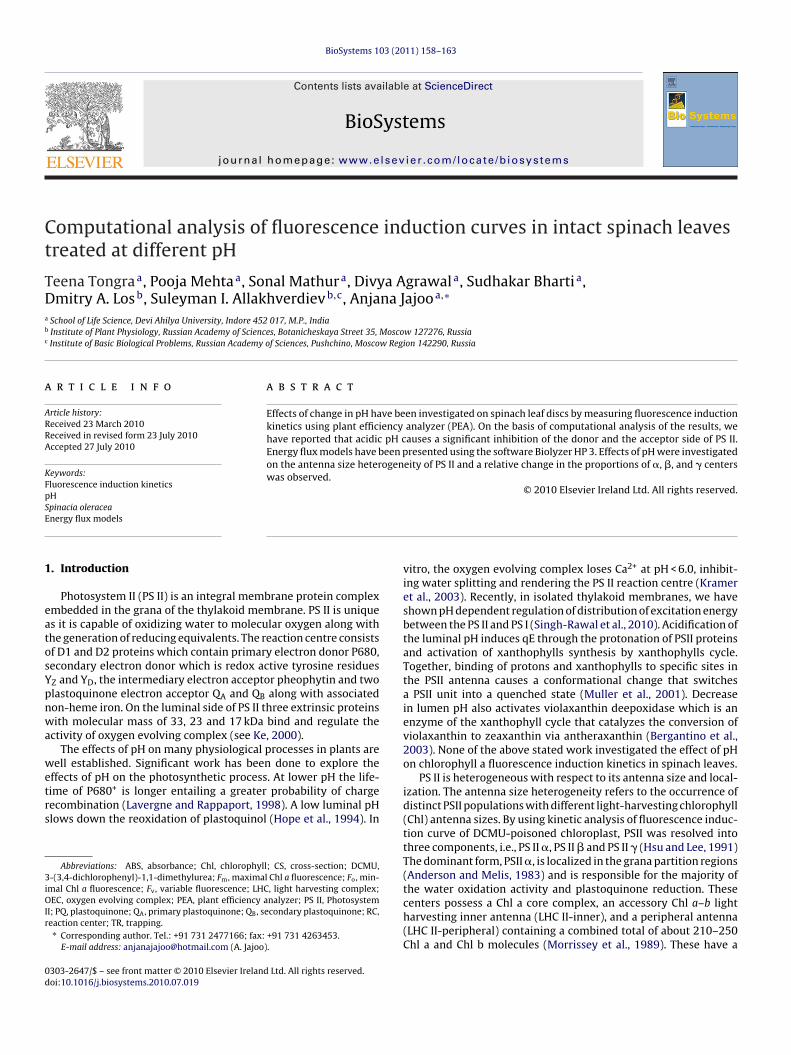
ig. 2. Normalised fluorescence induction curves (Fig. 1A) at J step. It helps us toisualize K step, if originated.
n the fluorescence intensity is observed with increasing acidifica-ion from pH 8.0 to 4.5 as shown in Fig. 1A. There is only a slighthange in the value of Fo while Fm is dramatically decreased. Inrder to differentiate whether pH-induced changes are more pro-ounced at the donor or at the acceptor side of PS II, experimentsere carried out in the presence of DCMU (Fig. 1B). DCMU is known
o block the electron flow at the acceptor side of PS II. It blocks theow of electron between QA to QB. It displaces QB from its bindingite at the D1 protein (Velthuys, 1981). DCMU is not redox activend prevents the reoxidation of QA
− by forward electron transport.his leads to disappearance of J and I steps from OJIP transient andm is reached after ∼2 ms (= J step) (Toth et al., 2005) as shownn Fig. 1B. The value of Fo increases while that of Fm decreasesdata not shown) with decrease in pH. Increase in the value of Fo
s accompanied by two main reasons—firstly, In presence of DCMUhe further flow of electron beyond QA
− is restricted as a resultf which electron density increases at QA
− which ultimately leadso primary photochemistry of charge recombination with P680+
primary electron donor); secondly the OEC of PS II is inactivatedt pH below 6.0 where Ca++ dissociates from OEC (Kramer et al.,999). When electron donation from water splitting side is slowedown, then excitation energy trapped by PS II may be dissipatedy fast internal charge recombination and the combined effect ofll leads to increased Fo (minimal fluorescence). Decrease in thealue of Fm (maximum fluorescence) in the presence of DCMU isttributed to two main reasons—firstly DCMU prevents the reoxi-ation of QA
− by PQ pool and hence PQ pool remains in the oxidizedtate which ultimately quenches the fluorescence; secondly low pHnduces accumulation of P680+ and activates qE, a process that actso dissipate excitation energy (Kramer et al., 1999). Quenching atow pH seems to depend on the redox balance of the donor side ofS II. In case of DCMU treated sample maximum fluorescence (Fm)ecreases which is same as that observed after pH treatment, whilehe minimal fluorescence (Fo) increases which indicates donor sideomponents of PS II are affected. Inactivation of OEC at lower pH isndicated by origin of K-step at pH 5.0 and 4.5 (Fig. 2). When fluores-ence transients were normalized at the I step, a clear K-step coulde observed at low pH, but not at pH higher than 5.0. Relative vari-ble fluorescence (rFv(t)), which is defined as (F(t) − Fo)/(Fm − Fo),here Fo, Fm, and F(t) are the minimal and maximal measured flu-
rescence intensity at time t respectively (Lazar et al., 2001), was
easured (Fig. 3). A gradual loss of connectivity was observed inhe FR with decreasing pH. As the pH was decreased, the sigmoidalomponent of the curve decreased suggesting a decrease in theonnectivity between antenna molecules and an increase in theumber of inactive centers.
v o
(Fm − Fo), in response to pH treatment. The curves have been obtained fromDCMU-treated induction curves (Fig. 1B) to measure connectivity between antennamolecules. The curves start from 10 �s (Fo) and finish at 10 ms.
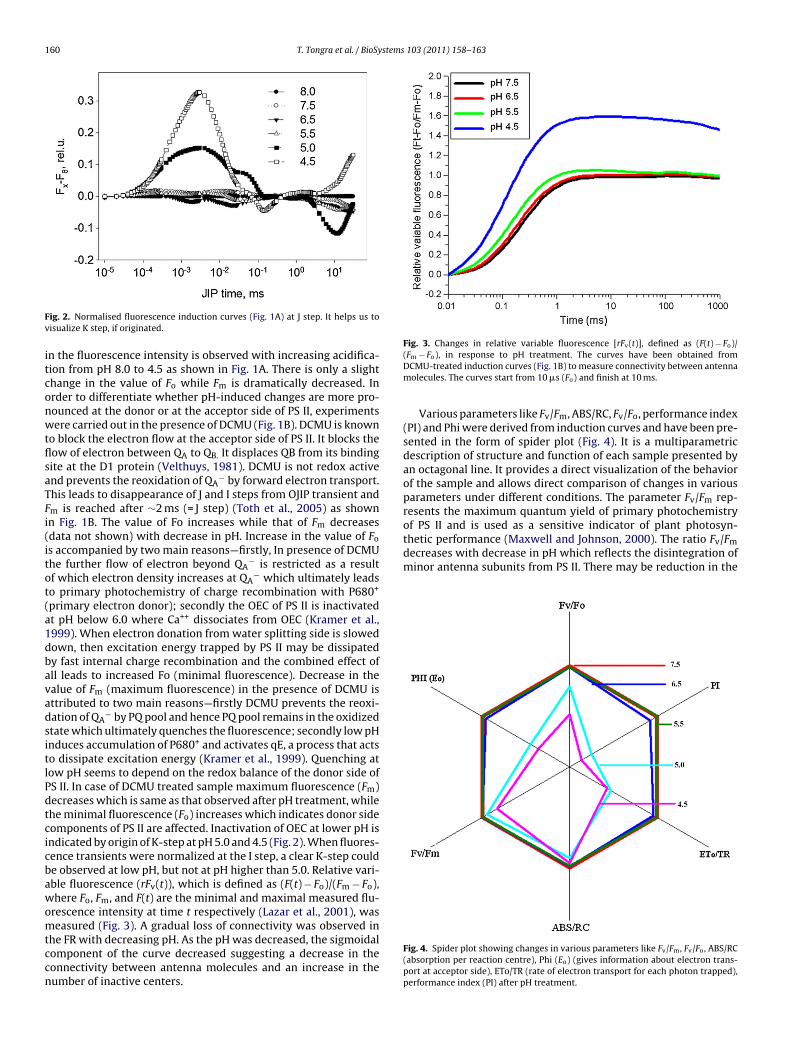
Various parameters like Fv/Fm, ABS/RC, Fv/Fo, performance index(PI) and Phi were derived from induction curves and have been pre-sented in the form of spider plot (Fig. 4). It is a multiparametricdescription of structure and function of each sample presented byan octagonal line. It provides a direct visualization of the behaviorof the sample and allows direct comparison of changes in variousparameters under different conditions. The parameter Fv/Fm rep-resents the maximum quantum yield of primary photochemistry
Fig. 4. Spider plot showing changes in various parameters like Fv/Fm, Fv/Fo, ABS/RC(absorption per reaction centre), Phi (Eo) (gives information about electron trans-port at acceptor side), ETo/TR (rate of electron transport for each photon trapped),performance index (PI) after pH treatment.
stems
poitrpspmIpoItorat
P
p
[
ca
FD
T. Tongra et al. / BioSy
rimary charge separation due to low pH. It also suggests that thereccurs increased charge recombination of the radical pair of the RCn response to slower movement of electron from the donor side tohe acceptor side of PS II (Briantais et al., 1996). Decrease in ABS/RCatio reflects a decrease in the number of active reaction centerer chlorophyll concentration. The parameter Fv/Fo represents thetructural integrity of antenna size of PS II. With the decrease inH from 8.0 to 4.5, the ratio Fv/Fo decreases indicating that thereay be some structural disorganization in the antenna size of PS
I which was confirmed by the leaf model presented later in thisaper. The ratio ETo/TR decreases with low pH probably becausef increase in the number of inactive centers. The PI (Performancendex) is a performance expression combining the three most func-ional components in the photosynthetic activity. (1) Concentrationr density of RC in Chl bed as RC/ABS. (2) The performance of lighteaction (primary photochemistry, charge separation, stabilizationnd recombination). (3) The performance of dark reaction (abilityo feed an electron in ETC between PS II and PS I).
IABS =(
RCABS
) [˚Po
(1 −˚Po)
][ o
(1 − o)
]
where˚Po corresponds to the efficiency by which an absorbedhoton will be trapped by PS II RC.
Maximum quantum yield of primary photochemistry =˚Po
(Fm − Fo)/Fm] = Fv/Fm
Therefore, PI abs = (RC/ABS) [Fv/Fm/(1 −Fv/Fm)] [ o/(1 − o)] o
orresponds to the efficiency by which a trapped photon can moven electron in to ETC further than QA
− (Strasser et al., 2004, 2000).
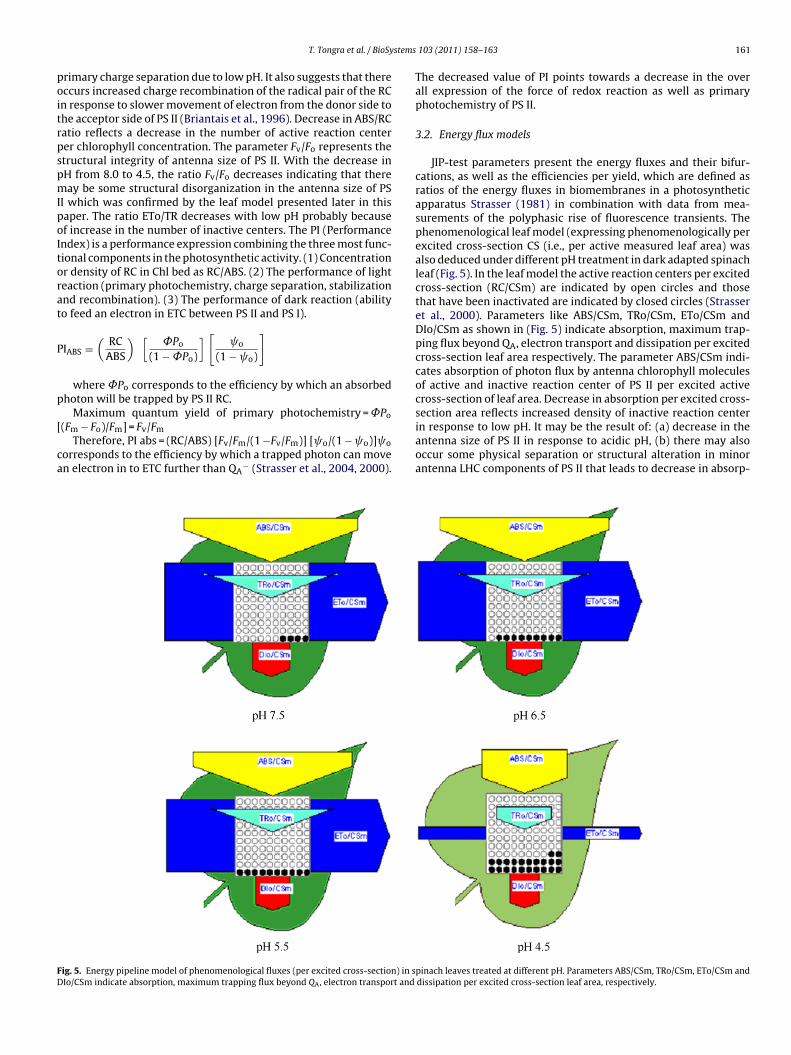
ig. 5. Energy pipeline model of phenomenological fluxes (per excited cross-section) in sIo/CSm indicate absorption, maximum trapping flux beyond QA, electron transport and
103 (2011) 158–163 161
The decreased value of PI points towards a decrease in the overall expression of the force of redox reaction as well as primaryphotochemistry of PS II.
3.2. Energy flux models
JIP-test parameters present the energy fluxes and their bifur-cations, as well as the efficiencies per yield, which are defined asratios of the energy fluxes in biomembranes in a photosyntheticapparatus Strasser (1981) in combination with data from mea-surements of the polyphasic rise of fluorescence transients. Thephenomenological leaf model (expressing phenomenologically perexcited cross-section CS (i.e., per active measured leaf area) wasalso deduced under different pH treatment in dark adapted spinachleaf (Fig. 5). In the leaf model the active reaction centers per excitedcross-section (RC/CSm) are indicated by open circles and thosethat have been inactivated are indicated by closed circles (Strasseret al., 2000). Parameters like ABS/CSm, TRo/CSm, ETo/CSm andDIo/CSm as shown in (Fig. 5) indicate absorption, maximum trap-ping flux beyond QA, electron transport and dissipation per excitedcross-section leaf area respectively. The parameter ABS/CSm indi-cates absorption of photon flux by antenna chlorophyll moleculesof active and inactive reaction center of PS II per excited activecross-section of leaf area. Decrease in absorption per excited cross-
section area reflects increased density of inactive reaction centerin response to low pH. It may be the result of: (a) decrease in theantenna size of PS II in response to acidic pH, (b) there may alsooccur some physical separation or structural alteration in minorantenna LHC components of PS II that leads to decrease in absorp-pinach leaves treated at different pH. Parameters ABS/CSm, TRo/CSm, ETo/CSm anddissipation per excited cross-section leaf area, respectively.

162 T. Tongra et al. / BioSystems 103 (2011) 158–163
F ity of Pw
troraTsttuieeIptsb
ig. 6. Analysis of complementary area growth curve showing antenna heterogeneith changing pH.
ion by chlorophyll molecules. This all suggests that acidificationeflects inactivation of donor side of PS II especially due to dis-rganization of the antenna molecules. The donor side of PS II isedox dependent and so decrease in the absorption of energy byntenna will affect the primary redox photochemistry. The ratioRo/CSm indicates maximum trapping flux per excited active cross-ection leaf area resulting in the reduction of QA to QA
−. Maximumrapping flux reduces with the decreasing pH which indicates thathe active reaction centers are converted in to inactive RC thatltimately reduces the efficiency of trapping. The ratio ETo/CSm
ndicates electron transport chain at the onset of illumination perxcited cross-section leaf area. At low pH (pH 4.5) activity of thelectron transport chain decreases which indicates a decline in PS
I activity. The ratio DIo/CSm indicates dissipation of energy fluxer excited cross-section leaf area. Decrease in this ratio depictshat less excitation energy is trapped by RC and less energy is dis-ipated. All these results suggest that donor and the acceptor sideoth are affected by low pH.S II as exhibited by changes in the percentages of three types of �, � and � centers
3.3. Effects of pH on antenna size heterogeneity of Photosystem II
The antenna size heterogeneity deals with the relative amountsof �, � and � centers. It is usually studied in plants with QA-reoxidation inhibited by a herbicide. By using a herbicide (inthis study DCMU) the linear flow of electron is inhibited causingrapid antenna reorganization (e.g. state transition or Violaxan-thin/Zeaxanthing conversion) and allowing us to measure antennadynamics (Nedbal et al., 1999; Lazar et al., 2001). Three components(�, � and �) of PS II antenna were ascribed to different populationsof PSII units that differ in antenna size. As explained in Strasser et al.(2000), the kinetics of QA-accumulation was obtained by the cal-culation of the kinetics of complementary area [B =
∫(Fm − Ft)dt],
where B is the double normalized (between 0 and 1) kinetics ofcomplementary area. The B kinetics of the first light pulse was fit-ted with three exponentials that corresponds to �, � and � typecenters. The curves shown in Fig. 6 give us information about thelifetime and proportion of �, � and � in high temperature treated

stems
lft(ttdcbapWptftai
4
nkcapsP
A
wF0R
R
A
B
B
H
T. Tongra et al. / BioSy
eaves. In control leaves at pH 7.5 (Fig. 6A), the lifetime (�) of theastest � component was ∼0.37 ms and it represented ∼82% ofhe total amplitude, the � component was about 3.8-fold slower�∼ 1.44 ms) and it was responsible for ∼16% of the total ampli-ude and the � component being slowest was (�∼ 9.14 ms) ∼2% ofhe total amplitude. Subsequent change in pH from 7.5 to 5.5 led to aecrease in the proportion of � centers while the number of � and �enters showed an increase. Decrease in pH has decreased the num-er of active (�) centers and increased the number of inactive (�nd �) centers. The proportion of �, � and � centers were 82:16:2 atH 7.5, 78:20:2 at pH 6.5, 54:26:20 at pH 5.5 and 47:29:24 at pH 4.5.hen leaf disc treated with pH 4.5 was floated for 4 h in buffer of
H 7.5, the recovery of the respective fraction took place suggestinghat under stress, a transient change in the different antenna sizeractions of PS II takes place, probably as an adaptive mechanismo face the stress. The � and � centers seemed to have increasedt the cost of � centers and thus these components probably arenterconvertable depending on the environmental conditions.
. Conclusion
The work presented here demonstrates the biophysical phe-omics which is based on the chlorophyll fluorescence inductioninetics measurement along with the JIP test parameters. By usingomputer derivations from a single measurement of chlorophyllfluorescence induction kinetics, we have reported that acidic
H causes a significant inhibition of the donor and the acceptoride of PS II, and a change in the antenna size heterogeneity ofS II.
cknowledgements
UGC research fellowship to TT is thankfully acknowledged. Thisork was financially supported, in part, by grants from the Russian
oundation for Basic Research (08-04-00241; 09-04-91219-CT; 09-4-01074) from the Molecular and Cell Biology Programs of theussian Academy of Sciences (to DAL).
eferences
nderson, J.M., Melis, A., 1983. Localization of different photosystems in separateregions of chloroplast membranes. Proc. Natl. Acad. Sci. U.S.A. 80, 745–749.
ergantino, E., Segalla, A., Brunetta, A., Teardo, E., Rigoni, F., Mario, G., Szabo, I., 2003.Light and pH-dependent structural changes in the PsbS subunit of photosystemII. Proc. Natl. Acad. Sci. U.S.A. 100, 15265–15270.
riantais, J.M., Dacosta, J.G., Ducruet, J.M., Moya, I., 1996. Heat stress induces in leavesan increase of the minimum level of chlorophyll fluorescence Fo: a time-resolvedanalysis. Photosynth. Res. 48, 189–196.
ope, A.B., Valente, P., Mathews, D.W., 1994. Effects of pH on the kinetics of redoxreaction in and around the cytochrome bf complex in an isolated system. Pho-tosynth. Res. 42, 111–120.
103 (2011) 158–163 163
Hsu, B.D., Lee, J.Y., 1991. A study on the fluorescence induction curve from DCMU-poisoned chloroplast. Biochim. Biophys. Acta 1056, 285–292.
Hsu, B.D., Lee, Y.S., Jang, Y.R., 1989. A method for analysis of fluorescence inductioncurve from DCMU-poisoned chloroplasts. Biochim. Biophys. Acta 975, 44–49.
Ke, B., 2000. Advances in Photosynthesis. Photochemistry and Photophysics, vol. 10.Kluwer Academic Publishers, Dordrechet, pp. 199–214.
Kramer, D.M., Sacksteder, C.A., Cruz, J.A., 1999. How acid is the lumen? Photosynth.Res. 60, 151–163.
Kramer, D.M., Cruz, J.A., Kanazawa, A., 2003. Balancing the central roles of the thy-lakoid proton gradient. Trends Plant Sci. 8, 27–32.
Lavergne, J., Rappaport, F., 1998. Stabilization of charge separation and photochem-ical misses in photosystem II. Biochemistry 37, 7899–7906.
Lazar, D., Tomek, P., Ilík, P., Naus, J., 2001. Determination of the antenna het-erogeneity of PSII by direct simultaneous fitting of several fluorescence risecurves measured with DCMU at different light intensities. Photosynth. Res. 68,247–257.
Mathur, S., Jajoo, A., Mehta, P., Bharti, S., 2010. Analysis of elevated temperature-induced inhibition of photosystem II using chlorophyll a fluorescence inductionkinetics in wheat leaves (Triticum aestivum). Plant Biol., doi:10.111/j.1438-8677.2009.00319×.
Maxwell, K., Johnson, G.N., 2000. Chlorophyll fluorescence—a practical guide. J. Exp.Bot. 51 (345), 659–668.
Mehta, P., Jajoo, A., Mathur, S., Bharti, S., 2010. Chlorophyll a fluorescence studyrevealing effects of high salt stress on Photosystem II in wheat leaves. PlantPhysiol. Biochem. 48, 16–20.
Melis, A., 1991. Dynamics of photosynthetic membrane composition and function.Biochim. Biophys. Acta 1058, 87–106.
Morrissey, P.J., Glick, R.E., Melis, A., 1989. Supramolecular assembly and function ofsubunits associated with the chlorophyll ab light-harvesting complex II (LHC II)in soybean chloroplasts. Plant Cell Physiol. 30, 335–344.
Muller, P., Li, X.P., Niyogi, K.K., 2001. Non-photochemical quenching. A response toexcess light energy. Plant Cell Physiol. 125, 1558–1566.
Nedbal, L., Trtilek, M., Kaftan, D., 1999. Flash fluorescence induction: a novel methodto study regulation of photosystem II. J. Photochem. Photobiol. B 48, 154–157.
Singh-Rawal, P., Jajoo, A., Mathur, S., Mehta, P., Bharti, S., 2010. Evidence that pHcan drive state transitions in isolated thylakoid membranes from spinach. Pho-tochem. Photobiol. Sci. 9, 830–837.
Strasser, R.J., 1981. The grouping model of plant photosynthesis: heterogeneity ofphotosynthetic units in thylakoids. Structure and molecular organization of thephotosynthetic apparatus. In: Akoyunoglou, G. (Ed.), Photosynthesis III. BalabanInternational Science Services, Philadelphia, pp. 727–737.
Strasser, R.J., Srivastava, A., Govindjee, 1995. Polyphasic chlorophyll a fluorescencetransient in plants and cyanobacteria. Photochem. Photobiol. 61, 32–42.
Strasser, R.J., Srivastava, A., Tsimilli, M.M., 2000. The fluorescence transient as a toolto characterize and screen photosynthetic samples. In: Probing Photosynthesis:Mechanism, Regulation and Adaptation. Taylor and Francis, UK, pp. 445–483.
Strasser, R.J., Srivastava, A., Tsimilli, M.M., 2004. Analysis of the chlorophyll a flu-orescence transient. In: Papageorgiou, G.C., Govindjee (Eds.), Chlorophyll aFluorescence: A Signature of Photosynthesis, Advances in Photosynthesis andRespiration. Springer, Dordrechet, pp. 321–362.
Strasser, R.J., Tsimilli-Michael, M., Qiang, S., Golstev, V., 2010. Simultaneous in vivorecording of prompt and delayed fluorescence and 820-nm reflection changesduring drying and after rehydration of the resurrection plant Haberlea rhodopen-sis. Biochim. Biophys. Acta, doi:10.1016/j.bbabio.2010.03.008.
Toth, S.Z., Schansker, G., Strasser, R.J., 2005. In intact leaves the maximum fluores-cence level (FM) is independent of the redox state of the plastoquinone pool: aDCMU inhibition study. Biochim. Biophys. Acta 1708, 275–282.
Velthuys, B.R., 1981. Electron-dependent competition between plastoquinone andinhibitors for binding to Photosystem II. FEBS Lett. 126, 277–281.
Zhu, X.G., Govindjee, Baker, N.R., Sturler, E.D., Ort, D.R., Long, S.P., 2005. Chlorophylla fluorescence induction kinetics in leaves predicted from a model describingeach discrete step of excitation energy and electron transfer associated withPhotosystem II. Planta 223, 114–133.