Comprehensive Strategy for Recovery from the Great Hanshin ...
351
March 2010 CITY OF KOBE Comprehensive Strategy for Recovery from the Great Hanshin-Awaji Earthquake Do Do Kobe City Recovery Plan Comprehensive Assessment Comprehensive Assessment Kobe City Recovery Plan Promotion Program New Vision (post-Recovery plan) 1995 1999 2000 2003 2005 Occurrence of the Earthquake
-
Upload
khangminh22 -
Category
Documents
-
view
1 -
download
0
Transcript of Comprehensive Strategy for Recovery from the Great Hanshin ...
March 2010
CITY OF KOBE
Comprehensive Strategy for Recovery
from the Great Hanshin-Awaji Earthquake
Comprehensive Strategy for R
ecovery from the G
reat Hanshin-Aw
aji EarthquakeCITY O
F KOBE
March 2010
Do
Do
Kobe City Recovery Plan
ComprehensiveAssessment
ComprehensiveAssessment
Kobe City Recovery PlanPromotion Program
New Vision (post-Recovery plan)
1995
1999
2000
2003
2005
Occurrence of the Earthquake
Rains New
Note
http://www.city.kobe.lg.jp/safety/hanshinawaji/revival/promote/img/English.pdf

Preface
Following the Great Hanshin-Awaji Earthquake (referred to in this book as
the Kobe Earthquake), the City of Kobe received assistance from abroad as well
as from all over the country, and I would like to express my sincere appreciation
for the many concerned people and their heartwarming support.
Now that fifteen years has passed, I would like to reaffirm my
determination to never allow our experiences of the disaster to fade away. I also
re-acknowledge that, as a disaster-stricken city that learned a big lesson from the
earthquake, it is our responsibility to make the utmost effort for disaster
prevention and mitigation and keep passing on our experiences and the lessons
learned to future generations. As the years go by however, the memory of the
disaster is fading gradually but steadily.
We cannot stop natural disasters from occurring. What we can do though is
try to prepare for disasters, mitigate the damage as much as possible, and achieve
quick relief and recovery even if we have been hit by them. In this context,
sharing our experiences and the lessons we learned with the next generation and
preparing for future disasters is more important than anything else.
The City of Kobe has been conveying at home and abroad the experiences
and lessons learned from the various incidents and many efforts following the
Kobe Earthquake so they can be utilized for preparation efforts as well as relief
and recovery measures following natural disasters that will continue to occur
worldwide.
As we commemorate the fifteenth anniversary of the Kobe Earthquake, we
have created an English-language book on the experiences and lessons learned
following the disaster. This reflects our wish to convey our experiences and
lessons learned to more people throughout the world and help those countries in
which earthquake disasters are expected to occur in the future to build a system
for quick and effective post-disaster recovery.
This book, full of lessons learned following the Kobe Earthquake, not only
includes an overview of the earthquake in our area and the formulation and
implementation of recovery plans but also introduces various issues concerning
community development for recovery through collaboration between local
residents and the government.
I hope that this book will be used for years to come and our experiences and
the lessons learned will be passed on beyond time and borders, contributing to the
creation of safe and secure communities in many countries.
Tatsuo Yada
Mayor of Kobe
Contents
Preface
Introduction ……………………………………………………………………………………… 5
Part I The Kobe Earthquake-Overview- Chapter 1 Mechanism & Causal Factors ……………………………………………………… 19
Chapter 2 Damage & Casualties ……………………………………………………………… 31
Chapter 3 Emergency Response ……………………………………………………………… 55
Part II Recovery Plan-Formulation & Implementation- Chapter 1 Formulation of Recovery Plan …………………………………………………… 85
Chapter 2 Implementation of Recovery Plan ………………………………………………… 99
Part III Recovery Projects Chapter 1 Infrastructure Reconstruction ……………………………………………………… 115
Chapter 2 Housing Reconstruction/Restoration ……………………………………………… 133
Chapter 3 City Planning & Urban Renewal ………………………………………………… 149
Chapter 4 Economic Vitalization ……………………………………………………………… 177
Chapter 5 Life Recovery ……………………………………………………………………… 225
Chapter 6 Creating a Safe City ………………………………………………………………… 279
Part IV Collaborative Community Development for Recovery Chapter 1 Concrete Development of Social Capital ………………………………………… 321
Chapter 2 Examples of Specific Projects …………………………………………………… 339


1996;Wangan Route on


PART I
The Kobe Earthquake
- Overview -
1. Mechanism & Causal Factors 2. Damage & Casualties 3. Emergency Response


CHAPTER 1
Mechanism & Causal Factors

20
1 Earthquakes near Japan and the “Ring of Fire”
Japan is located along the northwestern Pacific Rim and the so called the “Ring of Fire” where many volcanoes are active and very strong earthquakes are frequently encountered as shown in Figure 1 (e.g. the USGS website). As shown in the figure, the earth’s crust can be divided into segments, so called plates or slabs, and there are boundaries where the plates are spreading (i.e., a plate is breaking apart, spreading, and forming two or more new plates) or two or more plates are subducting (i.e., two or more plates are colliding). The reason for such a large concentration of volcanic activity and earthquakes is active colliding at the plate boundaries. Movement of the plates and changes in the earth’s crust caused by such movements are known as Plate Tectonics. Near the islands of Japan, there is a slow but steady northwestward movement of the Pacific Plate against the Eurasian Plate and westward movement against North American Plate.
Figure 2 shows more details of the plate movements near Japan. The Pacific Plate and the Philippine Plate are subducting under the Eurasian Plate and the North America Plate or the Okhotsk Plate. The dotted line in the figure indicates that there is still some argument as to whether the northern part of Japan is located on an independent Okhotsk Plate or on the south end of North American Plate.
Figure 1. Plate Tectonics & the “Ring of Fire” (modified from http://vulcan.wr.usgs.gov./Glossary/PlateTectonics/Maps/map_plate_tectonics_world.html)
Figure 2. Plate movements near Japan (modifiedfrom Japan White Paper on Disaster Prevention)
21
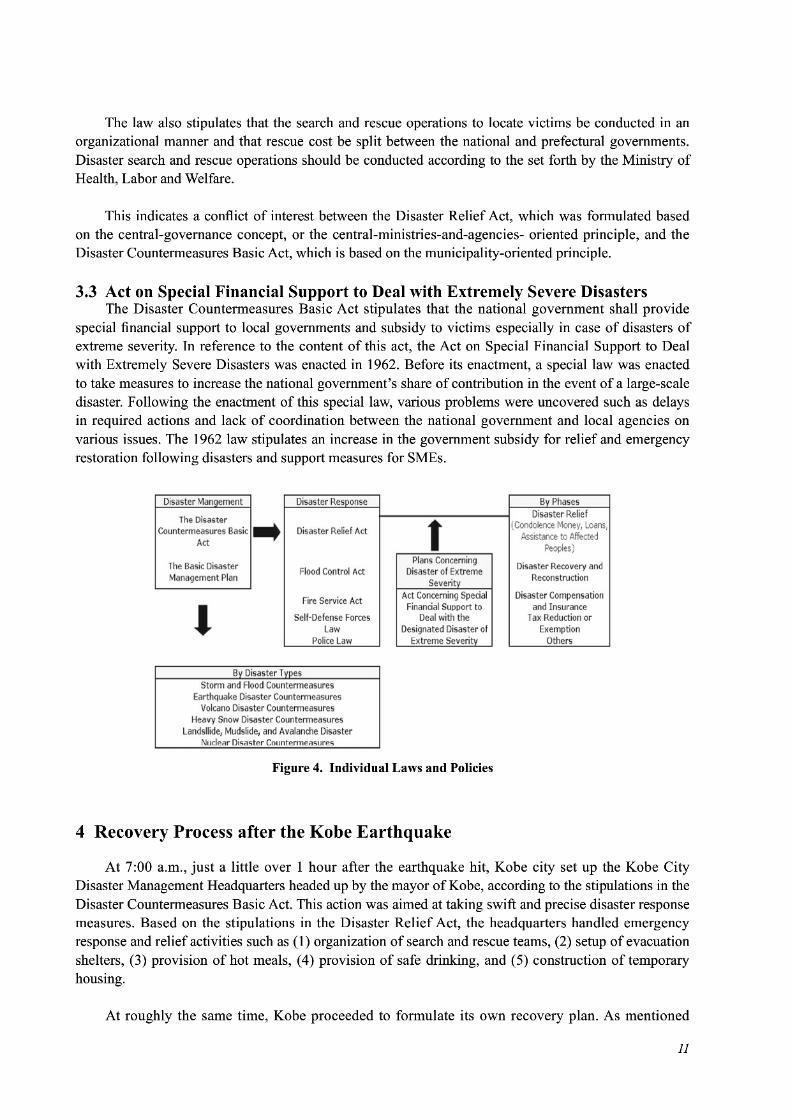
Such plate movements generate forces in the plates or slabs that eventually lead to failure or fault rupture at the interface of the colliding plate slabs or within those slabs. These fault ruptures are the sources of earthquakes, which can be divided into 3 types depending on the location of the fault rupture. A schematic of the location of such fault ruptures is shown in Figure 3. There are three different types of earthquakes: the inland intraplate earthquake, the interplate earthquake, and the earthquake occurring within the subduction slab. The Kobe Earthquake was an inland intraplate earthquake, and this type of earthquake often results in a short duration of shaking with only little dissipation of energy from the source. Interplate earthquakes usually result in a long duration of shaking that reaches the inland area with some time delay following fault rupture. This type of earthquake also often results in a tsunami when the rupture occurs deep in the sea. Earthquakes occurring with the subduction slab result in shaking and damage that is more widely spread over the inland as the location of the rupture is very deep, sometimes as deep as 100 km, within the earth’s crust.
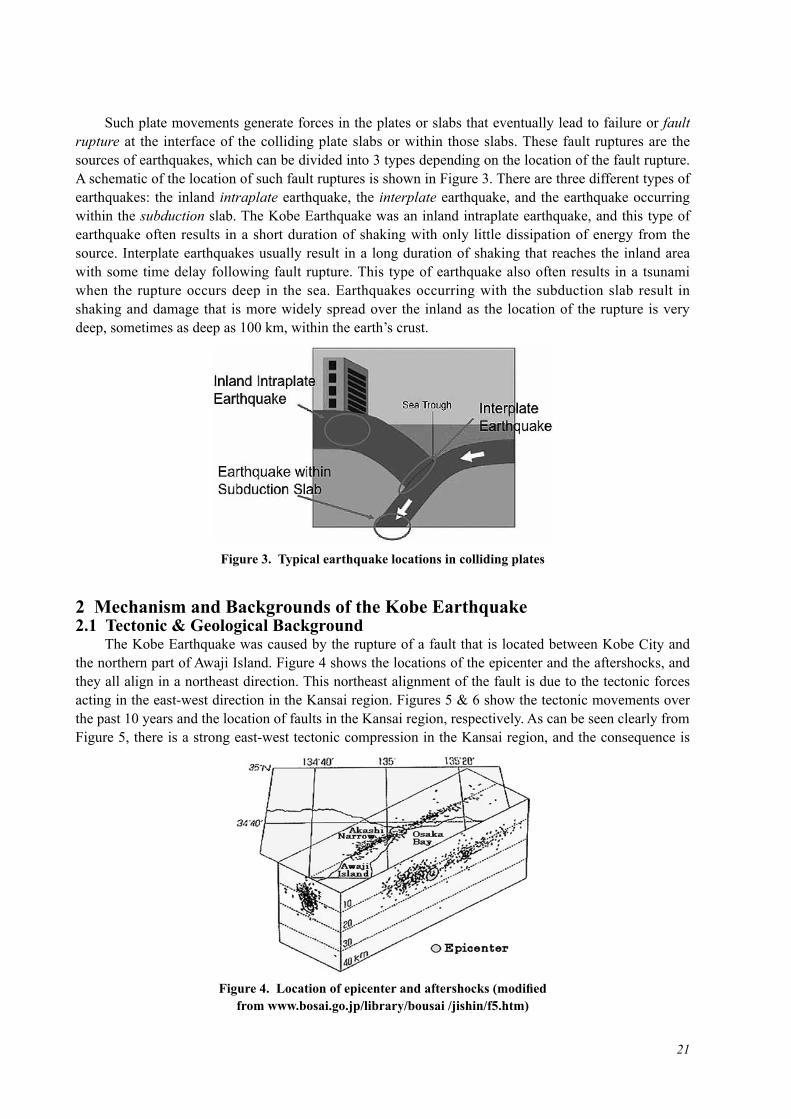
2 Mechanism and Backgrounds of the Kobe Earthquake2.1 Tectonic & Geological Background The Kobe Earthquake was caused by the rupture of a fault that is located between Kobe City and the northern part of Awaji Island. Figure 4 shows the locations of the epicenter and the aftershocks, and they all align in a northeast direction. This northeast alignment of the fault is due to the tectonic forces acting in the east-west direction in the Kansai region. Figures 5 & 6 show the tectonic movements over the past 10 years and the location of faults in the Kansai region, respectively. As can be seen clearly from Figure 5, there is a strong east-west tectonic compression in the Kansai region, and the consequence is
Figure 3. Typical earthquake locations in colliding plates
Figure 4. Location of epicenter and aftershocks (modifiedfrom www.bosai.go.jp/library/bousai /jishin/f5.htm)

22
that many active faults run in directions inclining about 45 degrees from the angle of compression as shown in Figure 6.
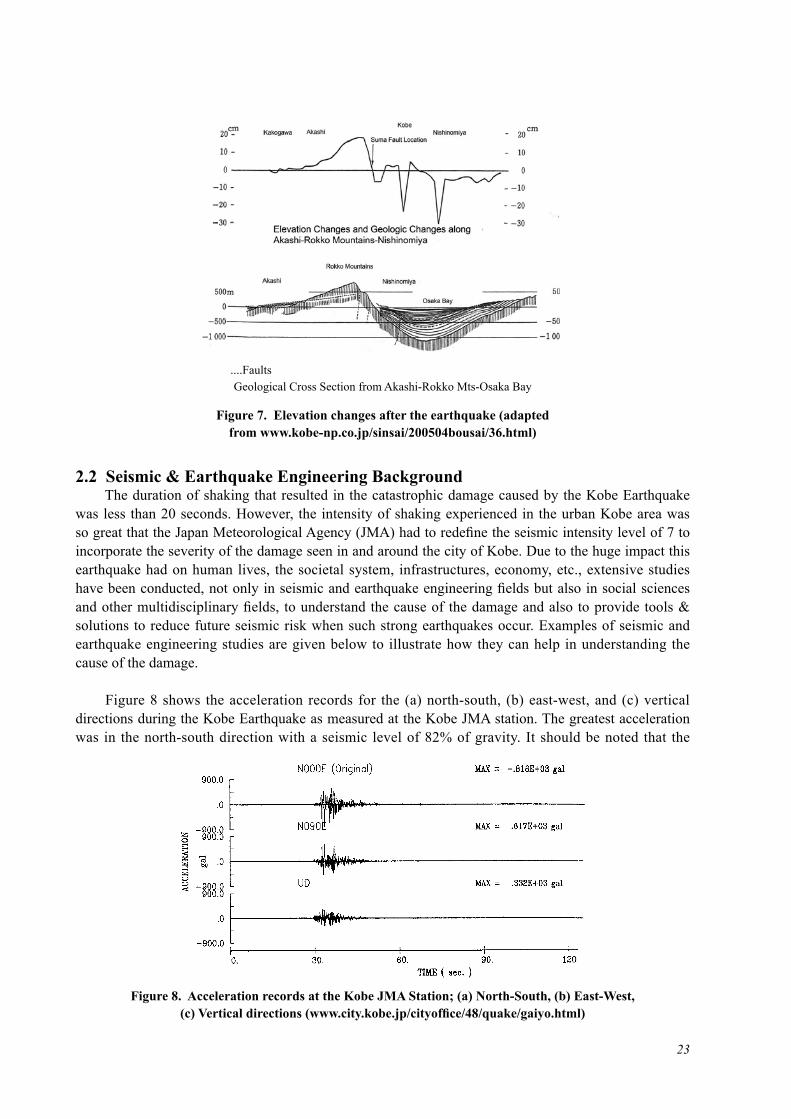
These fault activities have resulted in the production of many of the current geomorphological features in the Kansai region such as the Rokko Mountains and Osaka Bay. For example, earthquakes due to fault rupture at the south foot of the Rokko Mountains have constantly raised the elevation of the hanging wall (i.e., the Rokko Mountains) because of the right lateral shifting nature of this reverse fault. The footwall side (i.e., the Osaka Bay side) however has constantly settled every time an earthquake occurs along this fault. Clear evidence of such geomorphological changes during the Kobe Earthquake was obtained through a detailed ground elevation survey conducted westward along the coast from Osaka as shown in Figure 7. The maximum elevation raise, which was 18 cm, was observed at Shioya which is at the west end of the Rokko Mountains, while the coastal areas near the city of Nishinomiya have settled. More details of the geological features of this fault that had significant effects on the damage pattern during the Kobe Earthquake will be described later based on extensive geological & geophysical profiling data collected after the earthquake.
Figure 5. Tectonic movements over the past 10 years(from mekira.gsi.go.jp/project/f3_10_5/ja/index.html)
Figure 6. Location of faults in the Kansai region (view from southeast;from www.hp1039.jishin.go.jp/eqchr/eqchrfrm.htm)
23
2.2 Seismic & Earthquake Engineering Background The duration of shaking that resulted in the catastrophic damage caused by the Kobe Earthquake was less than 20 seconds. However, the intensity of shaking experienced in the urban Kobe area was so great that the Japan Meteorological Agency (JMA) had to redefine the seismic intensity level of 7 to incorporate the severity of the damage seen in and around the city of Kobe. Due to the huge impact this earthquake had on human lives, the societal system, infrastructures, economy, etc., extensive studies have been conducted, not only in seismic and earthquake engineering fields but also in social sciences and other multidisciplinary fields, to understand the cause of the damage and also to provide tools & solutions to reduce future seismic risk when such strong earthquakes occur. Examples of seismic and earthquake engineering studies are given below to illustrate how they can help in understanding the cause of the damage.
Figure 8 shows the acceleration records for the (a) north-south, (b) east-west, and (c) vertical directions during the Kobe Earthquake as measured at the Kobe JMA station. The greatest acceleration was in the north-south direction with a seismic level of 82% of gravity. It should be noted that the
....Faults Geological Cross Section from Akashi-Rokko Mts-Osaka Bay
Figure 7. Elevation changes after the earthquake (adaptedfrom www.kobe-np.co.jp/sinsai/200504bousai/36.html)
Figure 8. Acceleration records at the Kobe JMA Station; (a) North-South, (b) East-West,(c) Vertical directions (www.city.kobe.jp/cityoffice/48/quake/gaiyo.html)
24
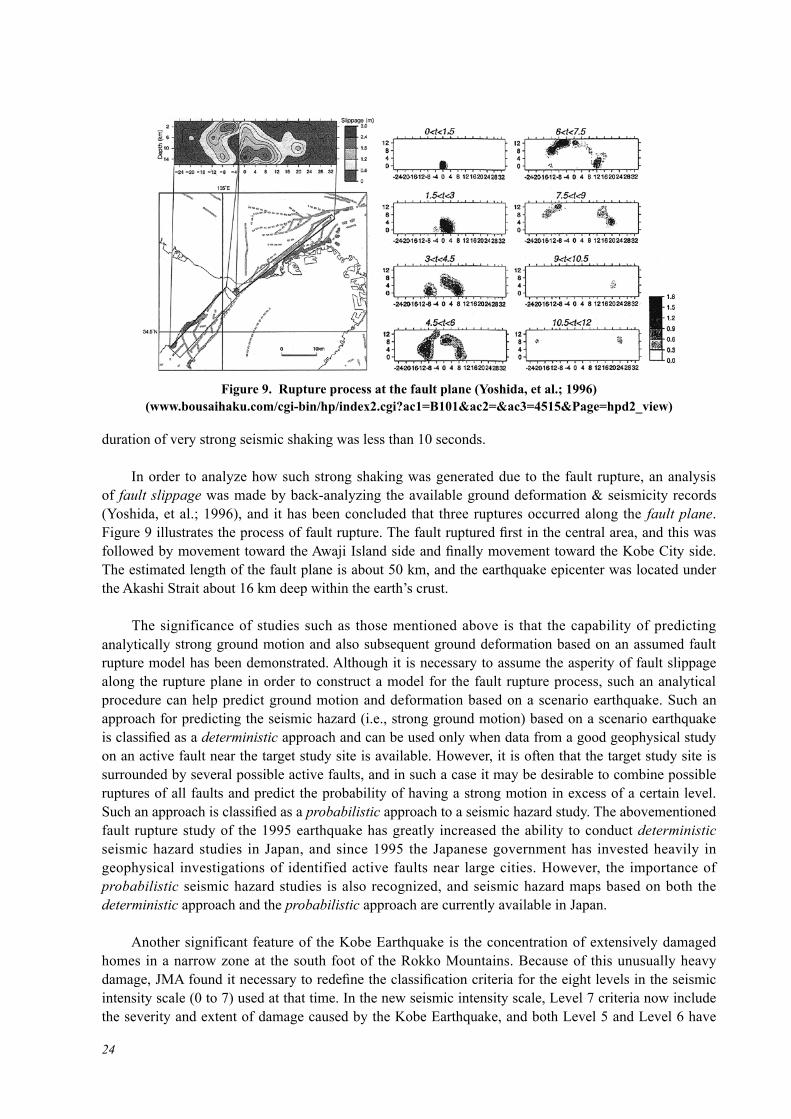
duration of very strong seismic shaking was less than 10 seconds.
In order to analyze how such strong shaking was generated due to the fault rupture, an analysis of fault slippage was made by back-analyzing the available ground deformation & seismicity records (Yoshida, et al.; 1996), and it has been concluded that three ruptures occurred along the fault plane. Figure 9 illustrates the process of fault rupture. The fault ruptured first in the central area, and this was followed by movement toward the Awaji Island side and finally movement toward the Kobe City side. The estimated length of the fault plane is about 50 km, and the earthquake epicenter was located under the Akashi Strait about 16 km deep within the earth’s crust.
The significance of studies such as those mentioned above is that the capability of predicting analytically strong ground motion and also subsequent ground deformation based on an assumed fault rupture model has been demonstrated. Although it is necessary to assume the asperity of fault slippage along the rupture plane in order to construct a model for the fault rupture process, such an analytical procedure can help predict ground motion and deformation based on a scenario earthquake. Such an approach for predicting the seismic hazard (i.e., strong ground motion) based on a scenario earthquake is classified as a deterministic approach and can be used only when data from a good geophysical study on an active fault near the target study site is available. However, it is often that the target study site is surrounded by several possible active faults, and in such a case it may be desirable to combine possible ruptures of all faults and predict the probability of having a strong motion in excess of a certain level. Such an approach is classified as a probabilistic approach to a seismic hazard study. The abovementioned fault rupture study of the 1995 earthquake has greatly increased the ability to conduct deterministic seismic hazard studies in Japan, and since 1995 the Japanese government has invested heavily in geophysical investigations of identified active faults near large cities. However, the importance of probabilistic seismic hazard studies is also recognized, and seismic hazard maps based on both the deterministic approach and the probabilistic approach are currently available in Japan.
Another significant feature of the Kobe Earthquake is the concentration of extensively damaged homes in a narrow zone at the south foot of the Rokko Mountains. Because of this unusually heavy damage, JMA found it necessary to redefine the classification criteria for the eight levels in the seismic intensity scale (0 to 7) used at that time. In the new seismic intensity scale, Level 7 criteria now include the severity and extent of damage caused by the Kobe Earthquake, and both Level 5 and Level 6 have
Figure 9. Rupture process at the fault plane (Yoshida, et al.; 1996)(www.bousaihaku.com/cgi-bin/hp/index2.cgi?ac1=B101&ac2=&ac3=4515&Page=hpd2_view)

25
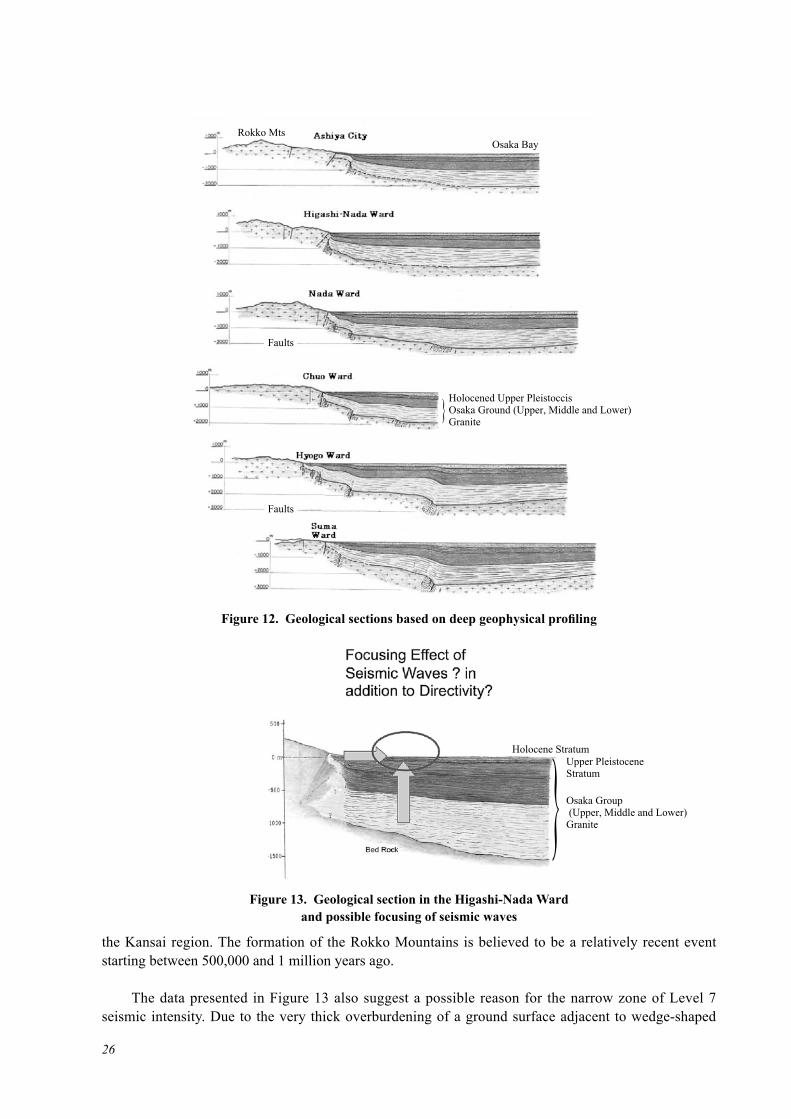
been split into two separate levels (upper and lower) giving the new scale ten levels to more accurately classify seismic intensity. Based on the newly defined Level 7 criteria, JMA identified the zone of extensive damage caused by intensive seismic activity as shown in Figure 10. This Level 7 intensity zone corresponds approximately to those areas where more than 30% of houses completely collapsed. In order to identify the reason for such a narrow zone of Level 7 intensity, extensive geophysical investigations have been carried out over these areas. Figure 11 shows the locations of deep cross-sectional geophysical profiling, and Figure 12 shows the numerous geological cross sections obtained from the Ashiya area to the Suma Ward area. From these cross sections, it is clear that the earthquake fault runs through the area along the foot of the Rokko Mountains and the urban areas of Kobe are covered by thick layers of both Pleistocene and Holocene deposits.
Figure 13 shows an enlarged view of a geological section in Higashinada Ward, and it clearly depicts fault movement in excess of 1000 m at the foot of mountain slope. Such extensive fault movement is indicative of an accumulation of past earthquake activity, and as noted earlier the Rokko Mountains were formed by the accumulation of reverse fault movement through the tectonic forces in
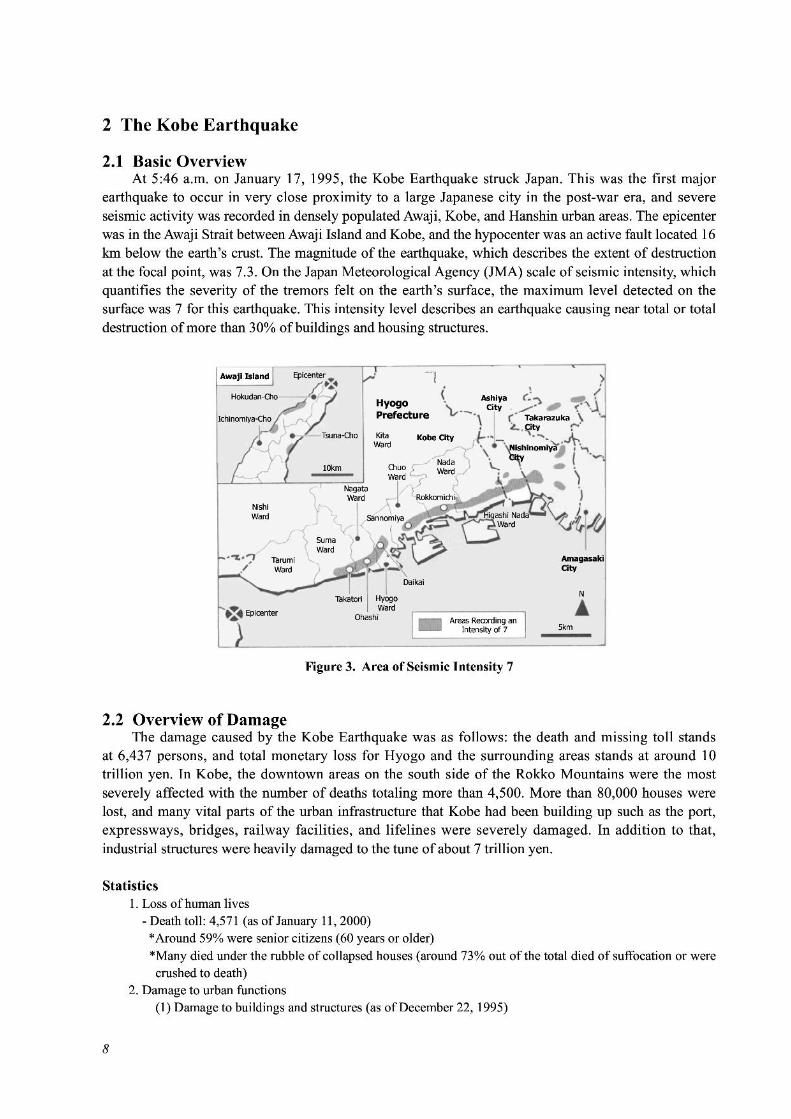
Figure 10. Zone of JMA seismic intensity 7
Figure 11. Locations of deep geophysical profiling
FaultsCity BoundaryWard Bounday
Tarumi
Takatori OhashiDaikai
Suma
Nagata
Hyogo
Chuo
Higashinada
Nagata
Hyogo
Chuo
Nada
Higashinada
TakarazukaItami
NishinomiyaNishinomiya
AmagasakiAmagasaki
AshiyaAshiya
0 1 2km
Fault seen at groundHidden FaultProbable Hidden FaultLine of Geological Profiling
26
the Kansai region. The formation of the Rokko Mountains is believed to be a relatively recent event starting between 500,000 and 1 million years ago.
The data presented in Figure 13 also suggest a possible reason for the narrow zone of Level 7 seismic intensity. Due to the very thick overburdening of a ground surface adjacent to wedge-shaped
Figure 13. Geological section in the Higashi-Nada Wardand possible focusing of seismic waves
Figure 12. Geological sections based on deep geophysical profiling
Rokko Mts
FaultsFaults
Holocened Upper PleistoccisOsaka Ground (Upper, Middle and Lower)Granite
}
FaultsFaults
Osaka Bay
Osaka Group (Upper, Middle and Lower)Granite}
Holocene StratumUpper PleistoceneStratum
27
bedrock, the seismic waves propagated upon fault rupture possibly focused on the ground surface, and this resulted in the unusual concentration of heavily damaged areas in such a narrow zone.
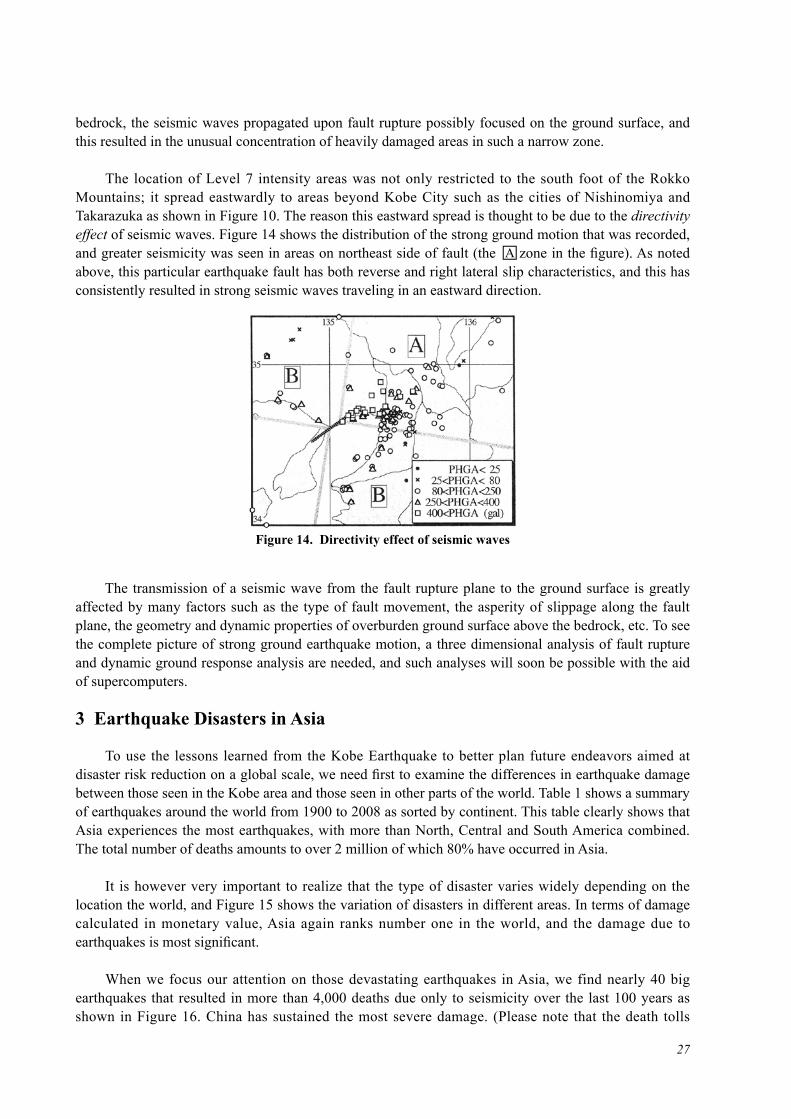
The location of Level 7 intensity areas was not only restricted to the south foot of the Rokko Mountains; it spread eastwardly to areas beyond Kobe City such as the cities of Nishinomiya and Takarazuka as shown in Figure 10. The reason this eastward spread is thought to be due to the directivity effect of seismic waves. Figure 14 shows the distribution of the strong ground motion that was recorded, and greater seismicity was seen in areas on northeast side of fault (the □A zone in the figure). As noted above, this particular earthquake fault has both reverse and right lateral slip characteristics, and this has consistently resulted in strong seismic waves traveling in an eastward direction.
The transmission of a seismic wave from the fault rupture plane to the ground surface is greatly affected by many factors such as the type of fault movement, the asperity of slippage along the fault plane, the geometry and dynamic properties of overburden ground surface above the bedrock, etc. To see the complete picture of strong ground earthquake motion, a three dimensional analysis of fault rupture and dynamic ground response analysis are needed, and such analyses will soon be possible with the aid of supercomputers.
3 Earthquake Disasters in Asia
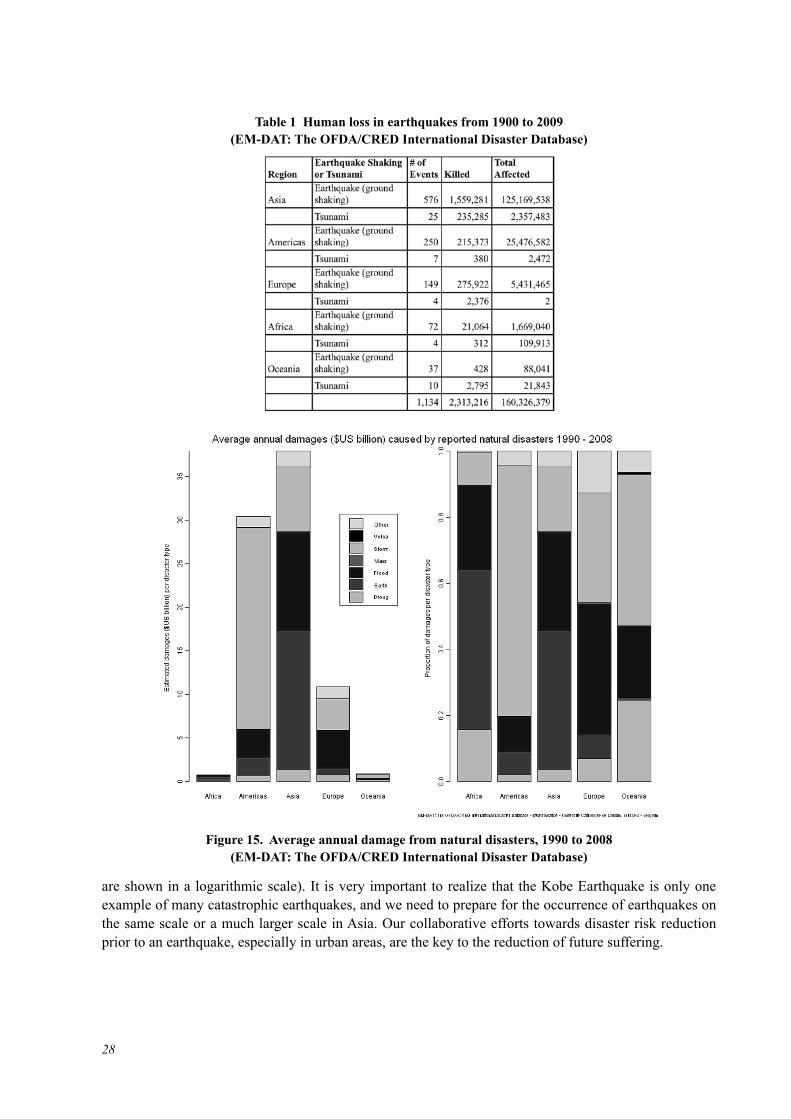
To use the lessons learned from the Kobe Earthquake to better plan future endeavors aimed at disaster risk reduction on a global scale, we need first to examine the differences in earthquake damage between those seen in the Kobe area and those seen in other parts of the world. Table 1 shows a summary of earthquakes around the world from 1900 to 2008 as sorted by continent. This table clearly shows that Asia experiences the most earthquakes, with more than North, Central and South America combined. The total number of deaths amounts to over 2 million of which 80% have occurred in Asia.
It is however very important to realize that the type of disaster varies widely depending on the location the world, and Figure 15 shows the variation of disasters in different areas. In terms of damage calculated in monetary value, Asia again ranks number one in the world, and the damage due to earthquakes is most significant.
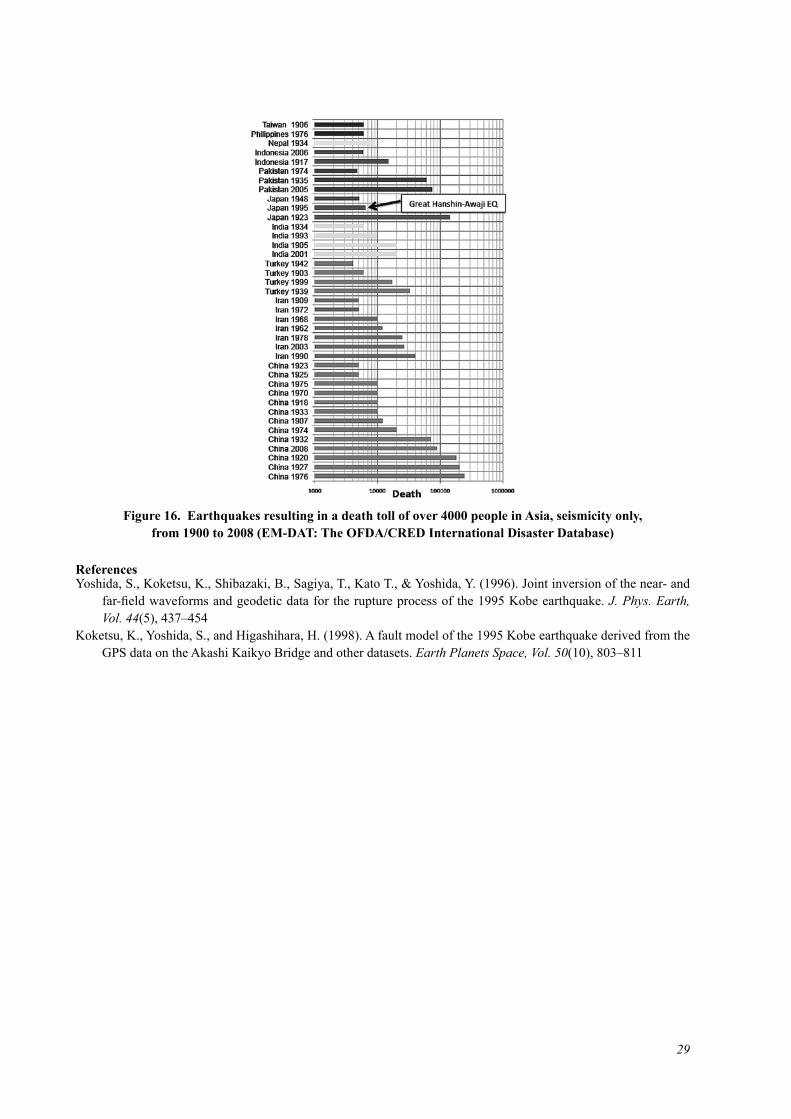
When we focus our attention on those devastating earthquakes in Asia, we find nearly 40 big earthquakes that resulted in more than 4,000 deaths due only to seismicity over the last 100 years as shown in Figure 16. China has sustained the most severe damage. (Please note that the death tolls
Figure 14. Directivity effect of seismic waves
28
are shown in a logarithmic scale). It is very important to realize that the Kobe Earthquake is only one example of many catastrophic earthquakes, and we need to prepare for the occurrence of earthquakes on the same scale or a much larger scale in Asia. Our collaborative efforts towards disaster risk reduction prior to an earthquake, especially in urban areas, are the key to the reduction of future suffering.
Table 1 Human loss in earthquakes from 1900 to 2009(EM-DAT: The OFDA/CRED International Disaster Database)
Figure 15. Average annual damage from natural disasters, 1990 to 2008(EM-DAT: The OFDA/CRED International Disaster Database)
29
ReferencesYoshida, S., Koketsu, K., Shibazaki, B., Sagiya, T., Kato T., & Yoshida, Y. (1996). Joint inversion of the near- and
far-field waveforms and geodetic data for the rupture process of the 1995 Kobe earthquake. J. Phys. Earth, Vol. 44(5), 437–454
Koketsu, K., Yoshida, S., and Higashihara, H. (1998). A fault model of the 1995 Kobe earthquake derived from the GPS data on the Akashi Kaikyo Bridge and other datasets. Earth Planets Space, Vol. 50(10), 803–811
Figure 16. Earthquakes resulting in a death toll of over 4000 people in Asia, seismicity only, from 1900 to 2008 (EM-DAT: The OFDA/CRED International Disaster Database)
CHAPTER 2
Damage & Casualties

32
1 Casualties
The breakdown of the casualties due to the earthquake is as follows: 6,434 confirmed dead; 3 still missing; and 43,792 injured as shown in Table 1.
Table 1. CasualtiesUnit: persons Entire Disaster Area Hyogo Prefecture City of KobeDead 6,434 6,402 4,571Missing 3 3 2Injured 43,792 40,092 14,678
Note. The 4,571 fatalities in Kobe include 7 suicides. The data for the entire disaster area are from the Fire and Disaster Management Agency’s final estimates as of May 19, 2006. The numbers for Hyogo Prefecture are the data compiled by the Hyogo Prefectural Government as of December 27, 2006, and the data for the city of Kobe as of January 1, 2007 were compiled by the Kobe City Government.
Excluding deaths not directly caused by the earthquake (e.g., suicide and neglect), the characteristics of the fatalities are as follows:
Regarding fatalities by age as shown in Figure 1, the elderly made up a large percentage of the fatalities. Those 60 and over accounted for 59% of the total death toll.
As shown in Figure 2 on causes of death, people that died from suffocation or being crushed accounted for 73% of the total. This indicates that many people died when houses instantly collapsed due to the strong quake. Also, people that were burned to death or died due to burns in the 51 separate fires that broke out after the earthquake accounted for 12%.
Figure 1. Fatalities by age

33
Of the 2,222 who died by 6 a.m. on the day of the earthquake, 81.8% died from suffocation.
Figure 2. Cause of death in Kobe
Figure 3. Cause of death for those who died by 6 a.m. in Hyogo Prefecture on January 17 Note. (Based on the autopsies by Hyogo Prefectural medical examiners and the doctors from the Japanese Society of Legal Medicine) adapted from Hanshin-Awaji Daishinsai Shi: 1995 Hyogoken-Nambu Jishin [Record of the Great Hanshin-Awaji Earthquake: The 1995 South Hyogo Prefecture Earthquake] (p.132), by Asahi Shimbun Osaka Head Office “Record of the Great Hanshin Awaji Earthquake” Editorial Committee (Ed.), 1996, Tokyo: Asahi Shimbun.
34
2 Material Damage
The characteristics of the material damage caused by the earthquake are as follows.
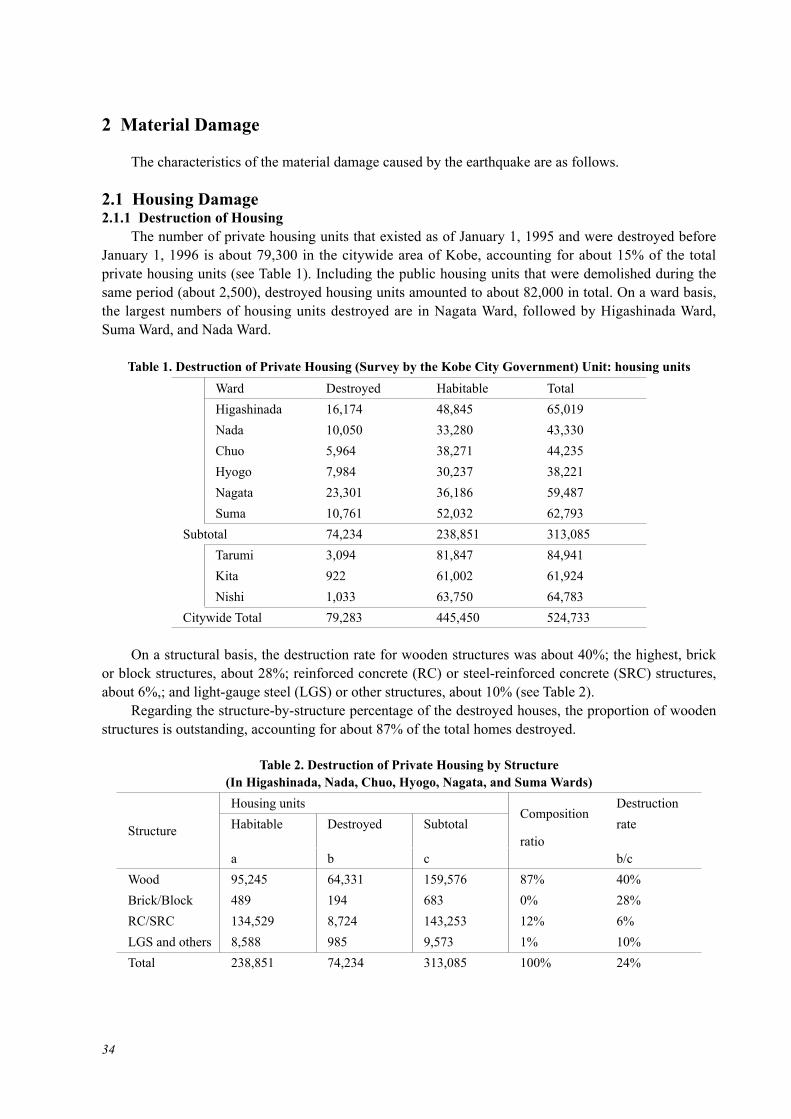
2.1 Housing Damage2.1.1 Destruction of Housing The number of private housing units that existed as of January 1, 1995 and were destroyed before January 1, 1996 is about 79,300 in the citywide area of Kobe, accounting for about 15% of the total private housing units (see Table 1). Including the public housing units that were demolished during the same period (about 2,500), destroyed housing units amounted to about 82,000 in total. On a ward basis, the largest numbers of housing units destroyed are in Nagata Ward, followed by Higashinada Ward, Suma Ward, and Nada Ward.
Table 1. Destruction of Private Housing (Survey by the Kobe City Government) Unit: housing units Ward Destroyed Habitable TotalHigashinada 16,174 48,845 65,019Nada 10,050 33,280 43,330Chuo 5,964 38,271 44,235Hyogo 7,984 30,237 38,221Nagata 23,301 36,186 59,487Suma 10,761 52,032 62,793
Subtotal 74,234 238,851 313,085Tarumi 3,094 81,847 84,941Kita 922 61,002 61,924Nishi 1,033 63,750 64,783
Citywide Total 79,283 445,450 524,733
On a structural basis, the destruction rate for wooden structures was about 40%; the highest, brick or block structures, about 28%; reinforced concrete (RC) or steel-reinforced concrete (SRC) structures, about 6%,; and light-gauge steel (LGS) or other structures, about 10% (see Table 2). Regarding the structure-by-structure percentage of the destroyed houses, the proportion of wooden structures is outstanding, accounting for about 87% of the total homes destroyed.
Table 2. Destruction of Private Housing by Structure (In Higashinada, Nada, Chuo, Hyogo, Nagata, and Suma Wards)
Structure
Housing unitsComposition
DestructionHabitable Destroyed Subtotal rate
ratioa b c b/c
Wood 95,245 64,331 159,576 87% 40%Brick/Block 489 194 683 0% 28%RC/SRC 134,529 8,724 143,253 12% 6%LGS and others 8,588 985 9,573 1% 10%Total 238,851 74,234 313,085 100% 24%

35
2.1.2 Distribution of Housing Damage Regarding housing damage by block, the rate of habitable housing following the earthquake fell below 70% in many blocks in the lowland areas of Higashinada, Nada, Hyogo, Nagata, and Suma Wards. On the other hand, the blocks that suffered little damage with habitable housing rates of more than 90% were concentrated in the mountain areas of each ward. As to the Chuo Ward, although extensive building damage occurred, it is not reflected in the statistics on housing damage since the number of housing units in this area was small before the earthquake.
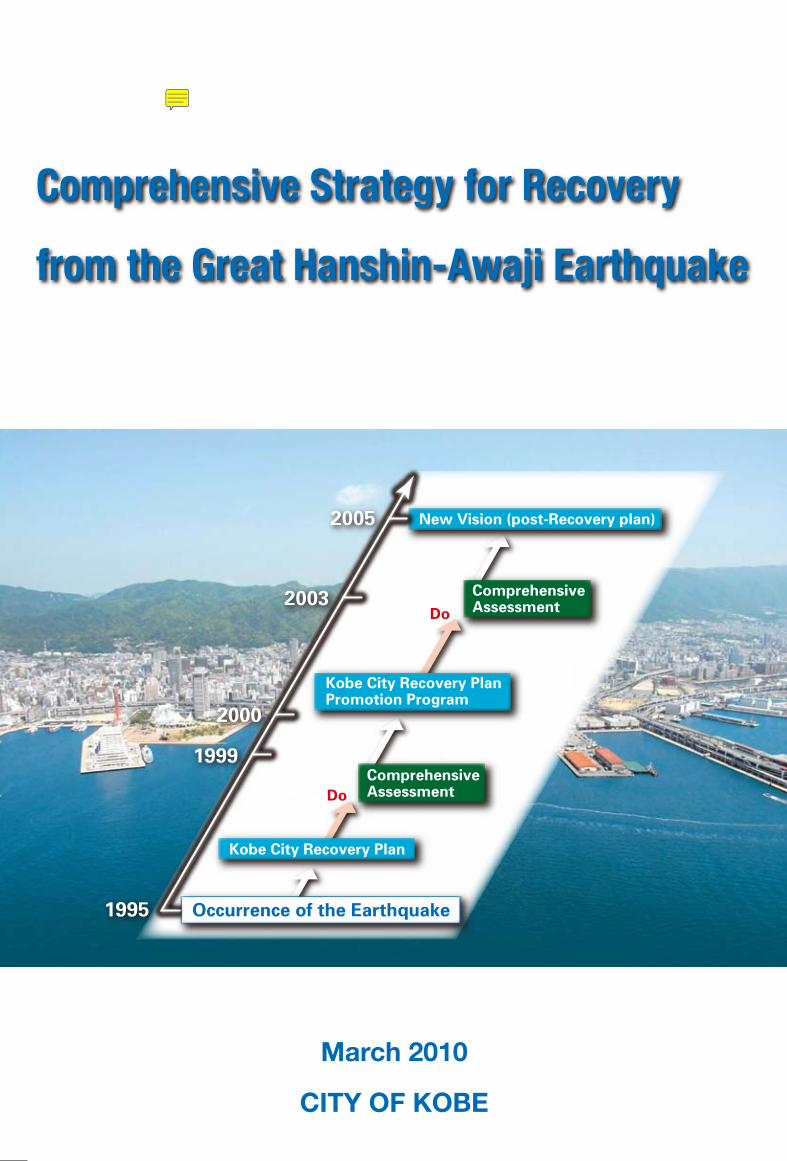
2.1.3 Relation between Construction Year and Damage Regarding wooden and steel structures, the percentage of buildings that collapsed completely and were destroyed is significantly lower for those buildings that were constructed after the late 1960’s than for those constructed before then. The results show that buildings constructed more than 30 years ago suffered the more severe damage (see Figure 2).
As well, RC structures show a declining trend in the percentage of total destruction for those buildings constructed after 1970, and the percentage was nearly zero for those buildings constructed after 1979. This is probably due to the amendment of the Building Standards Law, which resulted in the 1981 revision of the seismic design code.
Figure 1. Distribution of Housing Damage
3
Figure 1. Distribution of Housing Damage
Relation between Construction Year and Damage
Regarding wooden and steel structures, the percentage of buildings that collapsed
completely and were destroyed is significantly lower for those buildings that were
constructed after the late 1960’s than for those constructed before then. The results show that
buildings constructed more than 30 years ago suffered the more severe damage (see Figure
2).
As well, RC structures show a declining trend in the percentage of total destruction for
those buildings constructed after 1970, and the percentage was nearly zero for those buildings
constructed after 1979. This is probably due to the amendment of the Building Standards Law,
which resulted in the 1981 revision of the seismic design code.
Ward boundary Habitable housing rate
Habitable housing rate = (No. of houses at time of earthquake – No. of lost houses) No. of houses at time of earthquake 100
Block with less than 20 houses
Figure 2. Relation between construction year and damage

36
2.1.4 Surveys on Damaged Buildings The emergent seismic risk evaluation of damaged buildings was carried out by the architectural personnel of the city government. They evaluated the safety level of the damaged buildings by appearance. Red stickers were put on those buildings evaluated as “dangerous” to indicate that they were unusable; yellow stickers were put on those evaluated as “caution needed” to indicate that only minimum access would be allowed; and green stickers were put on those evaluated as “usable.”
Tax officials of the city government separately conducted surveys to certify the extent of building damage in order to issue certificates for the provision of public support to the victims under the Disaster Relief Act.
The main purpose of issuing the certificates was to quickly allocate the 179.3 billion yen of relief money raised from home and abroad to as many victims as possible. Therefore, the city government carried out somewhat generous assessment of damaged buildings within five days with help from tax officials of other ordinance-designated cities.
Later on, various support measures, such as tax deduction, exemption from private school tuition fees, low-interest rates for housing reconstruction loans, full financial support for demolition costs, were made available to the victims depending on the damage certified, and the city government received a flood of applications for reassessment of damaged buildings. It took more than half a year to complete the reassessment work.
An urgent and detailed survey of damaged buildings was conducted for two months by the Kansai Branch of the City Planning Institute of Japan and the Committee on Urban Planning and Design of the Architectural Institute of Japan (Kinki Branch), to ensure the results would be reflected in future architecture administration policy.
Since these surveys were conducted for different purposes and some of them were implemented in the chaotic aftermath of the earthquake, the numerical results differ between them. As official data on housing damage, the figures shown in Table 2 are used in various reports.
In conclusion, the examination of human casualties and housing damage mentioned above and the burned areas where fire covered several hectares showed that the areas to which city projects, such as land readjustment projects for war damage restoration and urban redevelopment and restructuring projects, had not been applied were severely damaged. Also, those areas had many old buildings constructed before 1986, when the seismic design code was strengthened under the Building Standards Law.
Those detached and row houses constructed before 1986 were made of wood and covered with heavy tiles to prevent roofs from blowing off during to typhoons. They also had wide openings to allow ventilation in order to alleviate the summer heat. Although they were designed to suit the Japanese climate, these top-heavy structures with minimal bracing had the problem of lacking earthquake resistance. When the Building Standards Law was revised in 1986, the seismic design code was strengthened to solve these problems. However, many buildings constructed before 1986 were not fully reinforced, resulting in considerable damage. In other words, damage was severe in those areas where economically-disadvantaged elderly people lived in old wooden structures with few wide roads and parks to prevent fire spread. The earthquake unfortunately struck an urban area that was under the process of restructuring.

37
2.2 Damage to Urban Utilities and Initial Response2.2.1 Characteristics of Urban Utilities and Their Roles in City Areas (general) The term “lifeline” as used in relation to urban infrastructure generally refers to facilities such as expressways, railways, subways, waterworks/sewage works, gas/power supply, and communication. Although it may include public halls and the like, this article defines urban utilities as a lifeline in its broader sense.
Lifelines are indispensable for citizens’ living in cities and for urban activities and play key roles in increasing urban convenience and making the urban areas more attractive. A lifeline cannot be beneficial unless it serves particular functions for their users. They can be characterized as follows:
• Waterworks, gas, and electric power are supply lifelines. Services are provided by supplying respective resources, from natural sources of water, water purification plants, gas manufacturing plants, pressure regulators, power plants and substations through pipelines, overhead cables, etc.
• Sewage works and communication are treatment/processing lifelines, and demand for them occurs at homes and elsewhere. Collected via pipelines or cables, they are treated at sewage plants or processed at communication centers. The sewage is converted to clean water and processed signals are transmitted.
• Roads, expressways, and railways are traffic lifelines. They exhibit their functions by providing means of transportation such as trains and buses operating between different places connected via road or rail.
During and following the Kobe Earthquake, many lifelines failed to function, resulting in great hardships to the lives of citizens and industrial activities in urban areas. Described below are outlines of lifeline networks and actual damage in the disaster-stricken areas.
2.2.2 Damage to Roads and Initial Responses Roads are roughly classified into expressways and general roads. In the disaster-stricken area, the Hanshin Expressway runs east-west as a major traffic line linking Kobe, Osaka, and other cities. Two trunk roads run alongside it: National Routes 2 and 43. Joining these major roads, many other general roads serve traffic demands from residential streets.
2.2.2.1 Facts regarding damage • Roads were damaged in the form of surface cracking and elevation, fall of elevated bridges, collapse
of landfills, landslides, obstruction of traffic by collapsed buildings, electric poles and the like, soil and sand eruption due to ground liquefaction, and destruction of underground lifelines. The damage to lifelines is described in a separate section.
• These events interfere with traffic: the roads no longer function due to traffic congestion. • Although wide roads can check the spread of fire, narrow alleys did not serve as fire checks. • The Hanshin Expressway suffered broad-range damage including collapse of some sections,
destruction of bridges, buckling of bridge piers, and destruction of underground bases. Collapsed sites were dismantled and reconstructed. Sites with minor buckling were repaired by height adjustments using jacks, while bridge piers were reinforced with steel plates, etc.
2.2.2.2 Immediate measures • All roads were closed by the administration, which implemented emergency inspections to reveal the
extent of damage. For roads with minor damage permitting restoration of traffic with small repairs, the restrictions were lifted after emergency repair work. In the handling of severely damaged roads, however, first priority was given to the dismantling and removal of the affected facilities, provision of

38
detours, and regulations concerning passage. These measures were taken in advance of full recovery. • To meet the traffic demands for emergency repair work on damaged roads, emphasis was placed on
securing safe passage for traffic on major roads running east-west. National Route 43 was allocated to priority traffic for recovery-related vehicles, which were required to hold permits to use the route. Only National Route 2 was available for general traffic (in those days, the Yamate Main Line did not extend beyond Ashiya).
• Regarding road surface problems, immediate measures for vehicle passage were taken to remove cracks and elevations in some priority areas.
• Seriously damaged elevated bridges were dismantled and rebuilt. • Roads cannot function well until obstructing collapsed buildings are removed. Such buildings were
removed from major roads as soon as possible after the earthquake. On the majority of residential streets, however, vehicle traffic was hampered. Even on some major roads, repair work was postponed if the damage involved sidewalks only.
• Concerning landslides, collapse of landfills and the like, immediate measures were taken to prevent further collapse. Subsequent restoration work included anti-collapse measures using protective structures such as drains, slope protection frames, and piles.
2.2.2.3 Functional failures and inconvenience in daily life • Many roads became impassable due to collapsed buildings, fallen electric poles and cables, and
destroyed bridges. Traffic was also affected by road surface cracks, undulation, and soil and sand eruption due to ground liquefaction. For these sites, recovery work took place while implementing regulations, such as road closure, one-way traffic, and lane restrictions for considerable periods.
• Traffic jams interfered with the operation of emergency vehicles such as fire services, police, and self-defense forces, as well as other vehicles. Amid this confusion, buses, taxis, tec. were unable to serve as a means of public transportation.
• Breakage of water pipes, gas conduits, etc. buried under the roads interfered with their functions as lifelines.
• In those days, only two major general roads crossed Kobe City from east to west: National Routes 2 and 43. Since the Hanshin Expressway became paralyzed, Route 43 was allocated for recovery/restoration vehicles exclusively (passage was permitted only for vehicles bearing official permits) and Route 2 for general vehicles. Although unavoidable, this also contributed to intensifying traffic jams.
• The roads closed to traffic due to damage delayed the recovery of other lifeline facilities and also had a major impact on the transportation of foodstuff and other daily commodities. Initially, this was a major hindrance to the maintenance of citizens’ lives. The operation of emergency vehicles such as fire trucks and ambulances was also influenced.
2.2.3 Railways2.2.3.1 Overview of railway networks in the Keihanshin District Many railways operate in the Keihanshin District, in which the cities of Kyoto, Osaka, and Kobe are located. They include West Japan Railway (JR-West) and five major private railway companies: Kinki Nippon Railway, Nankai Electric Railway, Keihan Electric Railway, and Hankyu and Hanshin Electric Railway. Smaller railways such as the Kita-Osaka Kyuko Railway, Senboku Rapid Railway, Kobe Rapid Transit Railway, Kobe Electric Railway, and Sanyo Electric Railway, as well as the subways in Kyoto, Osaka, and Kobe are in operation. In a 50-km radius around Osaka Station, the number of persons transported by railway was 5,311,275 thousand as of 1993, 40% of whom were accounted for by JR-West operations. In the Kinki District, office and school commuter passes are issued to about 4.22 million persons/day, of whom 1.72 million use trains bound for Osaka City.

39
2.2.3.2 Facts regarding damage Railway damage extended from the city of Akashi (Hyogo Prefecture) to the city of Takatsuki (Osaka Prefecture) between the Suma Ward in the city of Kobe and the city of Nishinomiya, in particular, and JR-West’s Tokaido Main Line, the Sanyo Main Line, and the Hankyu and Hanshin Electric Railways. Major damage occurred to landfills in the vicinity of JR Shin-Nagata Station, Kobe Rapid Transit Railway’s Daikai Station (a tunnel constructed by open-cut excavation), the elevated bridge between Motomachi and Sannomiya Stations, the elevated bridge near JR Rokkomichi Station, the elevated bridge between Hanshin Electric Railway’s Mikage and Nishinada Stations, the landfills between JR Sumiyoshi and Settsu Motoyama Stations, JR Ashiya Station’s terminal facilities, the elevated bridge between Hankyu’s Nishinomiya Kitaguchi and Shukugawa Stations, the elevated bridge near Hankyu’s Itami Station, and the Sanyo Shinkansen elevated bridge near Hankyu’s Kotoen Station. The most severely damaged railway structures were bridges. A total of 32 collapsed: eight on the Sanyo Shinkansen line and 24 on local railways and the Kobe New Transit System, with many other elevated concrete bridges damaged.
Regarding tunnel damage, Kobe Rapid Transit Railway’s Daikai Station was largely destroyed, but mountain tunnels were generally only slightly damaged, although lining cracking and detachment occurred in some of them.
Damage to electric circuit equipment included electric poles and signals, which were associated with damage to civil engineering structures such as the collapse of elevated bridges.
As for damage to car depots, Hanshin Electric Railway’s Ishiyagawa Depot collapsed, with 41 cars totally destroyed. Other affected sites included JR-West’s Takatori Factory, Kobe New Transit’s Port Island Depot, and Hokushinkyuko Railway’s Tanigami Depot.
2.2.3.3 Suspension of operations On the day of the earthquake, all railway lines suspended their operations because of damage to railway facilities, and a great many passengers were influenced. Although operational suspension initially extended to a distance of about 640km in total, recovery was achieved for about half of the affected territories two days later. The total number of passengers carried between Osaka and Kobe by JR, Hankyu and Hanshin is 0.45 million per day, and all railway operations there were stopped on January 17. Starting on the day after the earthquake, train operations were resumed for sites confirmed to be safe one after another. Although the total operating distance was steadily extended, it took longer to achieve complete restoration in the central area of Kobe City. During this period, passengers were mainly transported by bus as an alternative to the railways; many bus stops were crowded with long lines of people waiting for buses.
2.2.4 Power Supply2.2.4.1 Power supply facilities and emergency response In the disaster-stricken area, the Kobe Branch of the Kansai Electric Power Co., Inc. is responsible for power supply to the eastern district of Hyogo Prefecture and part of Osaka Prefecture, supplying about 18.6 billion kWh of electricity per year to about 2.02 million customers. Within the area covered by the Kobe Branch, the company operates three thermal power plants and one hydropower plant, as well as 12 substations with an output capacity of 154 kV or more. However, a fair percentage of the power is generated at nuclear power stations in Fukui Prefecture, hydropower plants in Toyama Prefecture, and thermal power plants in Wakayama Prefecture and is supplied to cities via high-voltage cables. About 93% of the transmission equipment is comprised of steel pylons. Almost all of the distribution equipment consists of concrete poles, although the underground facility conversion rate was slightly higher in this

40
area than in other areas.
2.2.4.2 Facts regarding damage Upon onset of the earthquake, about 2.6 million customers experienced power failures. The affected equipment was immediately separated from the power supply system, and changeover transmission was begun for intact sites one after another. About two hours later, the number of customers without power supply had decreased to about one million. Although it took considerable time to restore service because of road conditions, collapse of buildings, and confirmation that certain buildings were uninhabited, emergency transmission was completed six days later on January 23.
Regarding damage to power stations, although atomic power stations and hydropower plants remained intact, damage occurred to 10 out of 21 other power generation sites along Osaka Bay. At onset of the earthquake, 12 units automatically terminated their operation, resulting in a power generation failure of 1.76 million kW. As for substations, damage occurred to 50 out of 861 facilities, with major failures including breakage of transformers and circuit breakers. Power transmission was affected by damage to steel pylons, cables, and/or insulators of 11 overhead cables and the cables and/or pipelines of 102 underground lines.
Power distribution was affected by damage to 649 high-voltage circuits, of which 551 were under the control of the Sannomiya Sales Office, with the affected rate being 100%. Overhead cables were broken due to the collapse of concrete poles, and there were also many secondary failures caused by the collapse of buildings. Underground cables in pipelines (particularly asbestos-cement pipes) buried in ground that liquefied were, as expected, severely damaged. About 86% of the damaged manholes and handholes of underground duct lines and about 78% of the damaged pipelines were present in these places.
2.2.5 Communication2.2.5.1 Configuration of communication service system The communication service system comprises a communication center building equipped with switchboards and communication cables that link the center and customers. There are two types of communication cables: overhead cables and underground facilities. Overhead cables, along with power supply lines etc., are carried by concrete poles. Underground facilities include pipelines, manholes and telephone tunnels. The communication pipelines protect buried cables, with manholes and handholes provided to enable smooth maintenance work.
2.2.5.2 Damage to the communication service system Damage to the communication service system occurred in both overhead cables and underground facilities. Overhead cables were broken due to collapse or sinking of concrete poles, destruction of buildings, etc. Such damage occurred mainly to the lead-in cables of buildings.
Regarding underground facilities, both manholes and pipelines were damaged in places where liquefaction occurred, but communication cables themselves were not damaged; there was only slight damage to the extent of suspension of services. As expected, pipelines using old conventional materials were severely damaged, whereas recently set pipelines remained nearly intact thanks to adequate seismic measures.
As for switchboards, there was only very mild damage, which was not serious enough to cause functional failure.
41
2.2.5.3 Influence of functional failures Demand for communication in the city of Kobe can be classified into three types: that produced in the city of Kobe and transmitted to other areas of Hyogo Prefecture, the rest of Japan or outside Japan; that coming into the city of Kobe from other parts of Hyogo Prefecture, the rest of Japan or outside Japan; and that originating in and transmitted to the city of Kobe. Communication traffic is usually centralized to a base station (communication center building), which can fail to process the data in the event of excessive centralization, causing suspension of communication. This condition is known as network congestion. Immediately following the earthquake, such explosive communication activity occurred in the city of Kobe that it soon resulted in network congestion that interfered with telephone calls.
Since communication failure also occurred due to cable breakage, satellite telephones were temporarily provided. Public telephones were more likely to connect than household landlines, and many people formed lines in front of telephone booths awaiting their turn.
2.2.5.4 Emergency response On the day of the earthquake, an immediate action team of 150 was organized to check communication cables, electric poles, and other facilities. As recovery work on electric poles was postponed awaiting road repairs and special coordination of common ducts with other operators, priority was given to the recovery of services: 2,800 units of toll-free special public phones, including temporary facsimile machines, were installed in a short time following the onset of the earthquake. On January 18, two portable earth stations for satellite communication developed in the summer of 1994 were also installed. A recovery team entered the most severely damaged district on the night of January 17, and normal function of the switchboards was restored by the morning of January 18.
These activities were followed by further efforts to restore communication cables, and full services were almost recovered by January 31. In February and March, still more recovery teams from all over Japan became engaged in full-scale repair work to restore communication services.
2.2.6 Gas2.2.6.1 Flow of gas supply services Osaka Gas supplies gas to 5.7 million customers in six prefectures in the Kinki District. In terms of the number of customers, 95% is supplied for domestic use. In terms of the volume of gas sold, 63% is for industrial or commercial purposes. Although gas had been synthesized before, recently, liquefied natural gas (LNG) transported by oil tankers from the Middle and Near East is gasified and supplied to cities.
Imported LNG is received at the Osaka Gas Himeji and Senboku LNG Terminals. Once stored in tanks, it is supplied according to demand through high-pressure and medium-pressure gas pipes and gasholders via pressure regulators. The medium-pressure gas is further depressurized by regulators and fed to individual households. A schematic diagram of gas supply transportation is shown in Figure 1.
Currently used gas pipelines consist of welded steel pipes, ductile cast-iron pipes, or polyethylene pipes.

42
Category by pressure
Operating pressure
Materials used Major applications
High pressure 1.0-4.0 MPa Steel pipes (welded) Long-distance gas transportationGas supply to power stations
Medium pressure A
0.3-1.0 MPa Steel pipes (welded) Medium-distance gas transportationGas supply to large customers such as hospitals and factories
Medium pressure B
0.1-0.3 MPa Steel pipes (welded)Ductile cast-iron pipes
Low pressure 0.01-0.025 MPa Steel pipes (welded, mechanically joined)Ductile cast-iron pipesPolyethylene pipes
Gas supply to domestic, small-medium businesses, and industrial customers
2.2.6.2 Facts regarding damage Located in seaside areas, Osaka Gas’ LNG terminals suffered minor but measurable damage due to ground liquefaction. However, their primary equipment was not affected; operations were continued, with occasional interruption. No damage occurred to gasholders, although a maximum acceleration of 833 gal was recorded at the Fukiai Supply Station. All the other 12 gasholders at the Nishinomiya, Kobe, Akashi, Kita-Kobe, Kanzakigawa, and Senri Supply Stations remained intact.
Regarding gas pipelines, no damage occurred in high-pressure lines. Although medium-pressure lines were damaged, with 106 failures in total, the damage was limited to pipes of old materials and to the districts where ground liquefaction was prevalent, while no leakage of gas was observed in their welded-steel pipes. Hence, the medium-pressure lines can be said to have resisted the quake well. On the other hand, low-pressure lines were seriously damaged at a total of 26,459 places in the pipes. The affected pipes were mostly tap steel pipes in domestic service lines. No damage occurred to the currently most commonly used polyethylene gas pipes.
2.2.6.3 Initial response and influence on daily life On the day of the earthquake, many low-pressure terminal lines and domestic service lines were broken and leakage of gas occurred. Gas supply to 0.86 million customers was stopped to prevent secondary disasters. For this reason, gas became unavailable as a source for room heating and hot water supply; the resulting inconveniences included the inability to take a bath.
2.2.7 Waterworks2.2.7.1 Characteristics of the city of Kobe’s waterworks services The waterworks services for the city of Kobe can be characterized as follows. The city of Kobe’s waterworks system depends on the Lake Biwa/Yodo River water system via the
Figure 1. Flow of gas manufacture and supply
LNG
tanks
LNG
tankers
High-pressure gas
pipes ( 1 MPa )
Medium-pressure gas
pipes ( 0.1-1 MPa)
Low-pressure
gas pipes (<0.1
Reg
ulat
ors
Reg
ulat
ors Spherical
gasholders Microcomputer-controlled meters
Customers
43
Hanshin Water Supply Authority for 75% of its water supply, with two transmission tunnels serving as essential lifelines. The Kita Ward also receives its water from Sengari Dam controlled by the ward and Aono Dam controlled by Hyogo Prefecture, while the Nishi Ward also receives its water from Dondo Dam controlled by Hyogo Prefecture.
To ensure that water is supplied at constant pressure for the altitudes between 0 and 300 meters above sea level, service areas are divided at 30-meter intervals in the north-south direction into lowland, midland, highland and special highland serving sections. In the east-west direction, the service areas are divided at intervals of three to five kilometers. Each section has its own service reservoir.Telemeter control
Many service reservoirs and pumping stations are monitored and controlled remotely from the Central Monitoring Room in the Okuhirano Water Purification Plant.Highly purified water from the Hanshin Water Supply Authority
The city of Kobe purchases ozonized water from the Hanshin Water Supply Authority. The high degree purification treatment is effective in degrading odorous mold components and suppressing the generation of trihalomethanes.
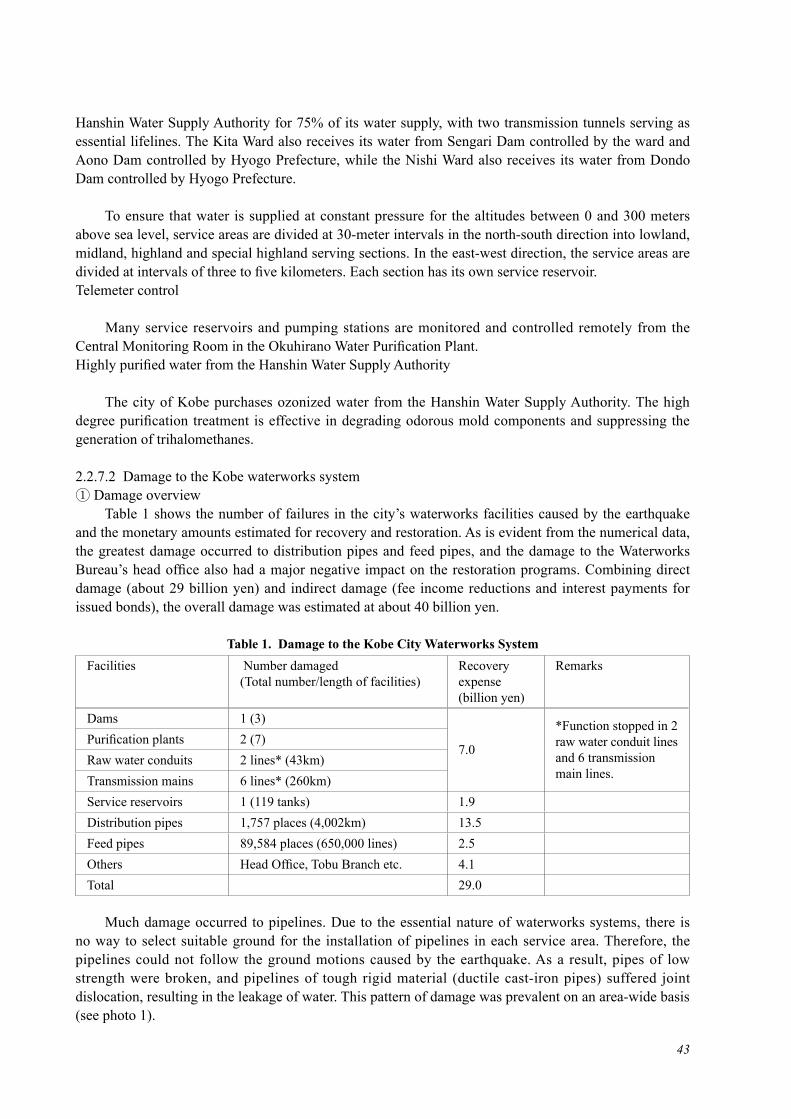
2.2.7.2 Damage to the Kobe waterworks system① Damage overview Table 1 shows the number of failures in the city’s waterworks facilities caused by the earthquake and the monetary amounts estimated for recovery and restoration. As is evident from the numerical data, the greatest damage occurred to distribution pipes and feed pipes, and the damage to the Waterworks Bureau’s head office also had a major negative impact on the restoration programs. Combining direct damage (about 29 billion yen) and indirect damage (fee income reductions and interest payments for issued bonds), the overall damage was estimated at about 40 billion yen.
Table 1. Damage to the Kobe City Waterworks SystemFacilities Number damaged
(Total number/length of facilities)Recovery expense (billion yen)
Remarks
Dams 1 (3)
7.0
*Function stopped in 2 raw water conduit lines and 6 transmission main lines.
Purification plants 2 (7)Raw water conduits 2 lines* (43km)Transmission mains 6 lines* (260km)Service reservoirs 1 (119 tanks) 1.9Distribution pipes 1,757 places (4,002km) 13.5Feed pipes 89,584 places (650,000 lines) 2.5Others Head Office, Tobu Branch etc. 4.1Total 29.0
Much damage occurred to pipelines. Due to the essential nature of waterworks systems, there is no way to select suitable ground for the installation of pipelines in each service area. Therefore, the pipelines could not follow the ground motions caused by the earthquake. As a result, pipes of low strength were broken, and pipelines of tough rigid material (ductile cast-iron pipes) suffered joint dislocation, resulting in the leakage of water. This pattern of damage was prevalent on an area-wide basis (see photo 1).

44
Another noteworthy aspect of the damage was destruction of the Waterworks Bureau’s head office, which made it difficult to access the drawings and other technical materials kept there, obstructing the smooth implementation of recovery and restoration work. Interior views of the sixth floor of the head office soon after the earthquake are shown in photo 2. This was not anticipated at all, and taught us a lesson regarding the securing of a backup system including water transmission management.② Analysis of damage to distribution pipes There were 1,757 confirmed failures in distribution pipes, about 60% of which occurred at pipe joints. These occurred mainly in places of large ground displacement, such as in seashore areas, along rivers, and in the vicinities of faults. Analysis by type of piping showed that ductile iron pipes (DIP) were most damaged in terms of the number of failures, but the damage rate was higher for old conventional cast iron pipes (CIP). With these facts in mind, it is necessary to implement seismic reinforcement (renewal) of distribution pipelines, by prioritizing places where major ground displacement is likely to occur.
<Legend>DIP (A, K, T): Types of joints for ductile iron pipes, all without anti-dislocation functionCIP: Non-ductile cast iron pipes
Photo 1. Damage to Waterworks Bureau Head Office
Photo 2. Water Pipeline Failures
Figure 2. Serving pipe damage analysis
Number of failures Damage rate (km)
0 200 400 600 800 1000
PVC
CIP
DIP(A,K,T)
Steel Pipe
0 0.5 1 1.5
Pipe BodyJoint
45
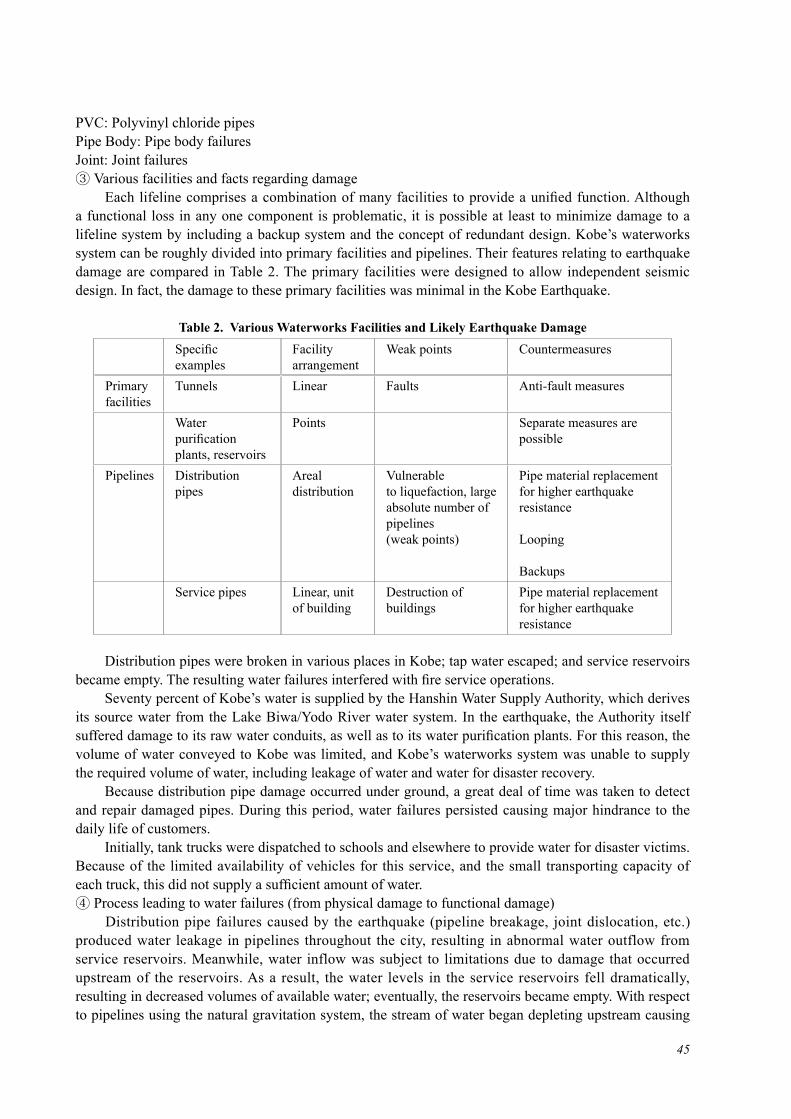
PVC: Polyvinyl chloride pipesPipe Body: Pipe body failuresJoint: Joint failures③ Various facilities and facts regarding damage Each lifeline comprises a combination of many facilities to provide a unified function. Although a functional loss in any one component is problematic, it is possible at least to minimize damage to a lifeline system by including a backup system and the concept of redundant design. Kobe’s waterworks system can be roughly divided into primary facilities and pipelines. Their features relating to earthquake damage are compared in Table 2. The primary facilities were designed to allow independent seismic design. In fact, the damage to these primary facilities was minimal in the Kobe Earthquake.
Table 2. Various Waterworks Facilities and Likely Earthquake DamageSpecific examples
Facility arrangement
Weak points Countermeasures
Primary facilities
Tunnels Linear Faults Anti-fault measures
Water purification plants, reservoirs
Points Separate measures are possible
Pipelines Distribution pipes
Areal distribution
Vulnerable to liquefaction, large absolute number of pipelines (weak points)
Pipe material replacement for higher earthquake resistance
Looping
BackupsService pipes Linear, unit
of buildingDestruction of buildings
Pipe material replacement for higher earthquake resistance
Distribution pipes were broken in various places in Kobe; tap water escaped; and service reservoirs became empty. The resulting water failures interfered with fire service operations. Seventy percent of Kobe’s water is supplied by the Hanshin Water Supply Authority, which derives its source water from the Lake Biwa/Yodo River water system. In the earthquake, the Authority itself suffered damage to its raw water conduits, as well as to its water purification plants. For this reason, the volume of water conveyed to Kobe was limited, and Kobe’s waterworks system was unable to supply the required volume of water, including leakage of water and water for disaster recovery. Because distribution pipe damage occurred under ground, a great deal of time was taken to detect and repair damaged pipes. During this period, water failures persisted causing major hindrance to the daily life of customers. Initially, tank trucks were dispatched to schools and elsewhere to provide water for disaster victims. Because of the limited availability of vehicles for this service, and the small transporting capacity of each truck, this did not supply a sufficient amount of water.④ Process leading to water failures (from physical damage to functional damage) Distribution pipe failures caused by the earthquake (pipeline breakage, joint dislocation, etc.) produced water leakage in pipelines throughout the city, resulting in abnormal water outflow from service reservoirs. Meanwhile, water inflow was subject to limitations due to damage that occurred upstream of the reservoirs. As a result, the water levels in the service reservoirs fell dramatically, resulting in decreased volumes of available water; eventually, the reservoirs became empty. With respect to pipelines using the natural gravitation system, the stream of water began depleting upstream causing
46
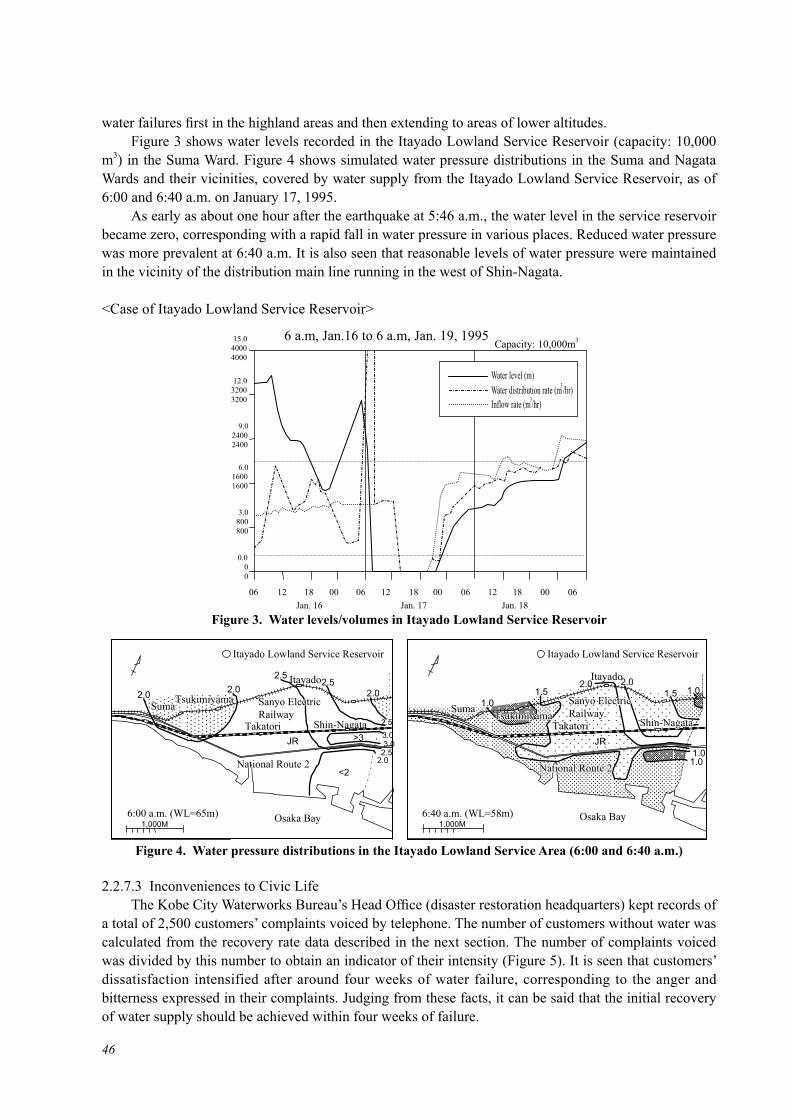
water failures first in the highland areas and then extending to areas of lower altitudes. Figure 3 shows water levels recorded in the Itayado Lowland Service Reservoir (capacity: 10,000 m3) in the Suma Ward. Figure 4 shows simulated water pressure distributions in the Suma and Nagata Wards and their vicinities, covered by water supply from the Itayado Lowland Service Reservoir, as of 6:00 and 6:40 a.m. on January 17, 1995. As early as about one hour after the earthquake at 5:46 a.m., the water level in the service reservoir became zero, corresponding with a rapid fall in water pressure in various places. Reduced water pressure was more prevalent at 6:40 a.m. It is also seen that reasonable levels of water pressure were maintained in the vicinity of the distribution main line running in the west of Shin-Nagata.
<Case of Itayado Lowland Service Reservoir>
2.2.7.3 Inconveniences to Civic Life The Kobe City Waterworks Bureau’s Head Office (disaster restoration headquarters) kept records of a total of 2,500 customers’ complaints voiced by telephone. The number of customers without water was calculated from the recovery rate data described in the next section. The number of complaints voiced was divided by this number to obtain an indicator of their intensity (Figure 5). It is seen that customers’ dissatisfaction intensified after around four weeks of water failure, corresponding to the anger and bitterness expressed in their complaints. Judging from these facts, it can be said that the initial recovery of water supply should be achieved within four weeks of failure.
Figure 3. Water levels/volumes in Itayado Lowland Service Reservoir Jan. 16 Jan. 17 Jan. 18
06 12 18 00 06 12 18 00 06 12 18 00 06
0.0 0 0
3.0 800 800
6.0 1600 1600
9.0 2400 2400
12.0 3200 3200
15.0 4000 4000
6 a.m, Jan.16 to 6 a.m, Jan. 19, 1995Capacity: 10,000m3
Inflow rate (m3/hr)
Water level (m) Water distribution rate (m3/hr)
Figure 4. Water pressure distributions in the Itayado Lowland Service Area (6:00 and 6:40 a.m.)
2.5
3.0
2.52.5
2.02.0 2.0
>3 3.0JR
2.52.0
<2
1,000M
1.01.0
1.01.52.0 2.0
1.51.0
JR
1,000M
Itayado Lowland Service Reservoir Itayado Lowland Service Reservoir
SumaSumaTsukimiyamaTsukimiyama
SumaSumaTsukimiyamaTsukimiyama
Itayado Itayado
Sanyo Electric RailwaySanyo Electric Railway
Takatori
Sanyo Electric RailwaySanyo Electric Railway
TakatoriShin-Nagata Shin-NagataShin-Nagata
National Route 2National Route 2 National Route 2National Route 2
Osaka Bay Osaka Bay6:00 a.m. (WL=65m) 6:40 a.m. (WL=58m)

47
Table 3. Changes over time in customers’ inquiries/complaintsCustomers’ voices (telephone inquiries)Week 1 (Jan. 18-24)
Week 2 (Jan. 25-31)
Weeks 3 + 4(Feb. 1-14)
Week 5 and after(Feb. 15-)
- Prospects for recovery?
- Tank trucks? (where and when)
- Tap water? (when available)- Want to have water tanks installed at evacuation centers (increase volume and frequency)
- Why no detailed information?
- Water supply is insufficient
- No more patience
- Drawing of water is painstaking and exhausting
Want to know Irritation Anxiety and impatience Anger and bitterness
2.2.8 Sewage Works2.2.8.1 Roles of sewage works and damage The roles of sewage works are diverse, including amelioration of living environments, assurance of water quality for public water resources, prevention of flooding, and utilization of sewer resources (sludge, gases, etc.). In Kobe, there are seven sewage treatment plants, 23 pumping stations, 3,300 km of sanitary sewage piping, and 480 km of storm drains. In the disaster, five sewage treatment plants and six pumping stations were functionally affected. Closed conduits were severely damaged in the central area of the city; 1,270 km of sewer piping was checked, and about 63 km was renewed. For storm drains, 377 km was inspected, of which about 10 km was repaired.
The greatest damage occurred to the Higashinada Sewage Treatment Plant, which is located adjacent to a canal; collapse of revetments etc. caused operational failures.
2.2.8.2 Inconveniences in daily living and countermeasures A major inconvenience from sewage system damage is the unavailability of toilets. The availability of toilets pertains to the maintenance of personal health and involves very delicate issues, including personal privacy, thus posing a compelling problem.
Figure 5. Complaints per unit population without water
Num
ber o
f cal
ls p
er 1
00,0
00 p
eopl
e w
ithou
t wat
erN
umbe
r of c
alls
per
100
,000
peo
ple
with
out w
ater
Number of complaints per unit population without water
Complaints concerning water failure
Complaints concerning water leakage

48
Toilets that can be used in the event of disasters include temporary toilets, manhole toilets, and hole-and-cover-only toilets. It is hoped that these items will always be on hand and in a state that allows for quick setup in preparation for disasters.
Even in the areas covered by the Higashinada Sewage Treatment Plant, utilization of the sewage system was not prohibited. Raw sewage was continually accepted while utilizing the adjacent canal as a simplified treatment plant.
2.2.9 Physical Damage to Lifelines and Influence on Citizens’ Daily Lives Immediately after the earthquake, the overall traffic volume on major roads decreased to less than 30% of the previous level which must have hindered the smooth transportation of rescue materials and interfered with citizens’ daily lives. Likewise, paralyzed railway networks hampered the movement of persons and goods, posing a major problem with office and school commutation and other urban activities.
From the viewpoint of lifeline system operators, the damage to their facilities can be divided into direct physical damage and resulting functional damage. An important feature of the physical damage was that some failures were visible on the ground, and others were invisible because they were buried under the ground. Failures in underground facilities were difficult to discover and repair; this was the major cause of the prolonged restoration period.
Table 4. Physical and functional damage to major lifelinesPhysical damage Functional damageUnderground Above-ground
Waterworks Pipeline breakage (1,757 confirmed failures in distribution pipes and feeder pipes/tunnels)
1 service reservoir damaged
Water failure for 0.72 million housing units in Kobe
Gas Pipeline breakage: medium-pressure (106 failures)/ low-pressure(26,375 failures)
Minor damage Supply stopped for 0.857 million housing units
Communica-tion (NTT)
Cable failures Damage/destruction of steel pylons
Office building (Kobe Branch)
Calls interrupted for 3 to 4days (due to network congestion)/3,500 public phones became out of service
Power supply Underground power transmission lines
Substations/overhead power transmission lines
Power failure in about 2.60 million housing units
Generally, underground pipelines are prevalently used in waterworks, gas supply facilities, and sewage works. The pipelines themselves were damaged; joints were dislocated; and pipes were broken by the forces of the ground, so that the lifeline systems ceased to function. Further, difficulty in locating the failures prolonged the recovery period. Meanwhile, above-the-ground facilities such as retention structures (serving reservoirs, gasholders, etc.), electric poles, and boards and panels (switchboards, distribution boards, control panels) allowed visual confirmation of the damage. Countermeasures were implemented quickly, so relatively accurate prospects for restoration were obtained.
Functional interruptions of waterworks, gas, electricity, telephone, and other lifelines seriously
49
impacted citizens’ lives. Paradoxically, these events reminded us of the fact that comfortable urban life relies upon the normal functions of these utilities. The power supply and communication services restored normal operations in a relatively short time, whereas the waterworks, gas, and sewage works suffered prolonged disturbance of operations because of major damage to underground pipelines and difficulty with the location of failures.
Regarding sewage treatment, the Higashinada Sewage Treatment Plant ceased to operate, and a number of pipelines were known to be broken. However, the use of the sewage system was not prohibited, so individual households were able to continue to flush their toilets using swimming pool water and so on.
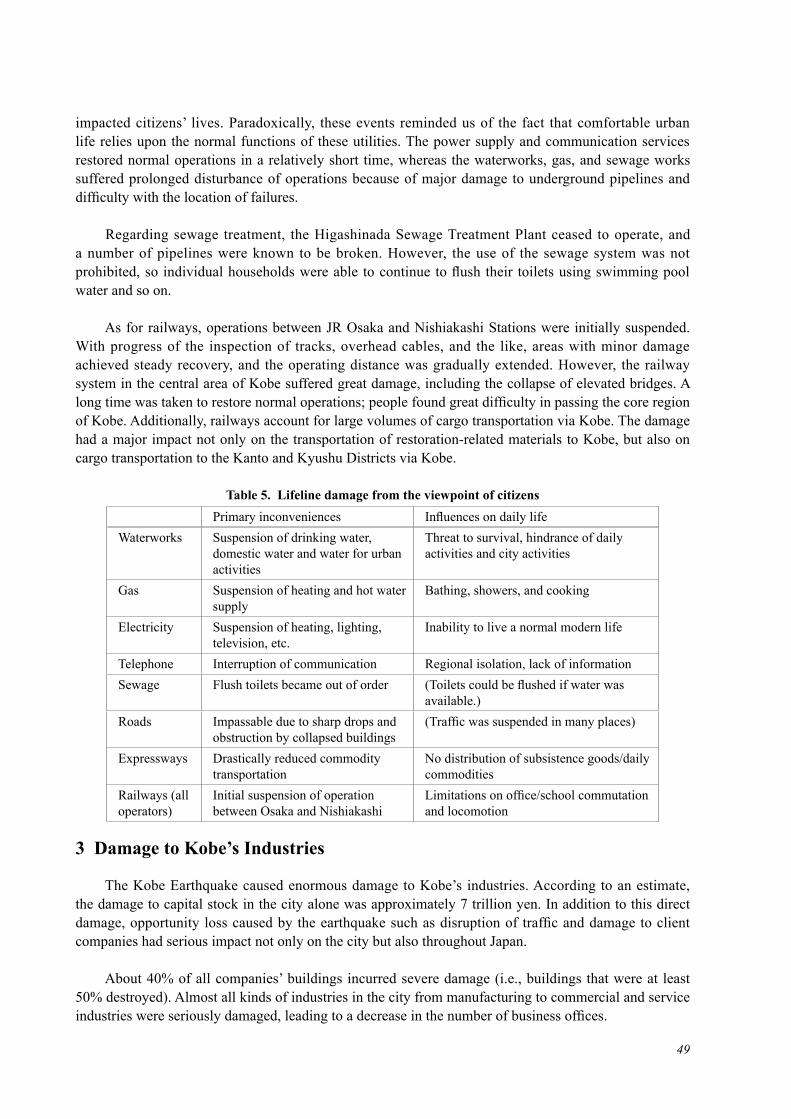
As for railways, operations between JR Osaka and Nishiakashi Stations were initially suspended. With progress of the inspection of tracks, overhead cables, and the like, areas with minor damage achieved steady recovery, and the operating distance was gradually extended. However, the railway system in the central area of Kobe suffered great damage, including the collapse of elevated bridges. A long time was taken to restore normal operations; people found great difficulty in passing the core region of Kobe. Additionally, railways account for large volumes of cargo transportation via Kobe. The damage had a major impact not only on the transportation of restoration-related materials to Kobe, but also on cargo transportation to the Kanto and Kyushu Districts via Kobe.
Table 5. Lifeline damage from the viewpoint of citizensPrimary inconveniences Influences on daily life
Waterworks Suspension of drinking water, domestic water and water for urban activities
Threat to survival, hindrance of daily activities and city activities
Gas Suspension of heating and hot water supply
Bathing, showers, and cooking
Electricity Suspension of heating, lighting, television, etc.
Inability to live a normal modern life
Telephone Interruption of communication Regional isolation, lack of informationSewage Flush toilets became out of order (Toilets could be flushed if water was
available.)Roads Impassable due to sharp drops and
obstruction by collapsed buildings(Traffic was suspended in many places)
Expressways Drastically reduced commodity transportation
No distribution of subsistence goods/dailycommodities
Railways (all operators)
Initial suspension of operation between Osaka and Nishiakashi
Limitations on office/school commutationand locomotion
3 Damage to Kobe’s Industries
The Kobe Earthquake caused enormous damage to Kobe’s industries. According to an estimate, the damage to capital stock in the city alone was approximately 7 trillion yen. In addition to this direct damage, opportunity loss caused by the earthquake such as disruption of traffic and damage to client companies had serious impact not only on the city but also throughout Japan.
About 40% of all companies’ buildings incurred severe damage (i.e., buildings that were at least 50% destroyed). Almost all kinds of industries in the city from manufacturing to commercial and service industries were seriously damaged, leading to a decrease in the number of business offices.

50
3.1 Damage to Large Companies Large companies in such areas as steel making and ship building had grown in the urban waterfront area in Kobe, and many of their key buildings such as head offices collapsed, suspending production lines and business. One large manufacturing company’s total damage cost was said to be ten billion yen or even greater. Some of these large companies relocated some of their business functions to other regions or reduced the size of their business. For example, Kobe Steel, Ltd. relocated its high blast furnace and processing division to Kawasaki City. Kawasaki Heavy Industries, Ltd. relocated its commercial ship construction division to Sakaide City, and Sumitomo Rubber Industries, Ltd. and Nippon Flour Mills Company, Ltd. closed their plants in Kobe. From the risk management perspective, it was an inevitable but an agonizing decision for such large companies to do that.
3.2 Damage to Small and Medium-Sized Companies In the machinery and metal processing industry that had a high degree of technology and mobility as subcontractors for such heavy industries as steel making, shipbuilding, machinery, and electronics, 95% of the 418 companies that belonged to the Society of Machinery and Metal Corporations in 1994 were damaged by the earthquake. Fortunately, the damage throughout the industry was reduced as many companies moved their production bases to an industrial complex in a suburb area from urban port area or relocated them to an industrial compound within the urban area.
As was mentioned above, the hybrid rubber shoe industry developed mainly in the Suma and Nagata Wards of Kobe. The collapse of buildings was worst in the eastern part of the city, such as the Higashi Nada and Nada Wards, while the Suma and Nagata Wards were struck mainly by fire. The number of houses that were totally burned down in the Nagata Ward was 4,749, accounting for 68% of the total in the city.
During World War II, the area of the Nagata and Suma Wards was reduced to ashes, and it was redeveloped under the town rezoning project conducted right after the war. Several decades have passed since then, and wooden houses, which were already obsolete, were packed together along very narrow roads where fire engines could not go through. That area was located in near proximity to the hybrid rubber shoe factories that were agglomerated in the urban local industrial zone, causing an enormous loss by fire.
Within about an area of 2 square kilometers centering on the southern part of the Nagata Ward, as many as 1,600 companies were concentrated including manufacturers and contractors. Raw materials for hybrid rubber shoes were made out of petroleum materials such as vinyl, and glues to put the shoe
Photo 1. Damage to the hybrid rubber shoe industry

51
sole together contained thinner. These combustible materials were stored or left uncontrolled on a daily basis. It is believed, therefore, the fire spread quickly across the area. Any concurrent breakout of large fires was not anticipated, and to make the matter worse, there had been little precipitation in Kobe in the weeks before the earthquake, and the river level was already lower than normal. Therefore, when firefighters arrived at the site, they could not extinguish the fires because there was no water.
The hybrid rubber shoe industry suffered catastrophic damage as about 80% of the factories collapsed or were partially or totally burned down. The total amount of damage was estimated to be 300 billion yen.
The Japanese sake manufacturing industry developed along the coastal area of Kobe, and it suffered huge damage just as large steel making works located in the same area due to the soft ground condition. More than 50% of Japanese sake breweries partially or totally collapsed. If the destruction of production equipment such as tanks inside the buildings was included in the damage, all sake breweries were afflicted by the earthquake. As they had already been refurbished or reconstructed in modern architectural styles from their traditional wooden structures, the scale of damage was not as serious as that in the hybrid rubber shoe companies. One third of all shopping malls and about half of the markets in the city were affected by the collapse of arcades and fire.
Facilities for large groups of people such as tourist facilities, hotel accommodations, and convention facilities suffered huge damage as did agricultural facilities, fishery facilities at fishing ports, and farm
Photo 2. Damage to sake brewaries
Photo 4. Damage to tourist facilitiesPhoto 3. Collapsed arcade

52
land.
3.3 Industrial Impact Caused by Damage to Social Overhead Capital Right after the earthquake, both domestic and international media reporters competed for news coverage on Kobe. Headline news of both TV and in newspapers was an update on the earthquake for several days even in the Kanto region where Tokyo is located. The news coverage was useful to convey information on the damage caused by the earthquake effectively to the capital city, Tokyo. However, at the same time, the TV coverage, in particular, focused too much on sensational aspects of the damage in a dramatic manner, misleading the general public to believe that the entire city of Kobe had been destroyed.
There were harmful and insensitive false rumors saying that there were pyromaniacs in Kobe and that theft rings were rampant in Kobe, creating the false image of Kobe as a scary place. There were less afflicted areas, and there were many people and companies trying to be cheerful and work hard despite the psychologically hard time. However, people rarely thought about visiting Kobe, and many reservations for hotel rooms and ryokan accommodations were cancelled, resulting in great damage to the tourism industry for some time.
The damage to roadways was also serious. Kobe is a very convenient place with both ground and ocean transportation, but the traffic network system was paralyzed for a long period of time due to the earthquake. More specifically, elevated highways such as the Hanshin Highway Kobe Route and Coastal Route remained collapsed until September 1996 and July 1995, respectively. Other roads sagged; crossover bridges and other structural objects had fallen; and traffic was disrupted due to the collapse of buildings. The access to ocean cities (artificial islands) was hindered due to the damage to bridges. For example, Kobe Bridge, Rokko Ohashi, Port Liner, and Rokko Liner were not back in full service until July 1996, September 1995, July 1995, and August 1995, respectively. Railroads such as JR, Hankyu Railway, and Hanshin Railway that connect urban centers were also not back in full service until April 1995, June 1995, and June 1995, respectively. Main roads at Kobe Port were blocked, and container berths and piers became inoperable, indicating that port and harbor facilities were seriously damaged as well. This damage made the distribution system in Kobe dysfunctional, causing enormous impact on the wholesalers of apparel and the pearl export business.
Photo 5. Damage to elevated highways

53
It is not an exaggeration to say that Kobe’s economic activities were temporarily suspended right after the earthquake. In particular, once any damage to buildings and equipment occurred, small and medium-sized enterprises were easily at risk. Despite various supportive measures, they were forced into a very harsh condition. For the two years of 1995 and 1996, 336 companies that had their head offices in Kobe went bankrupt, out of which 26% or 87 companies went out of business for reasons directly related to the earthquake. Out of these 87 companies, 77% were small and medium-sized companies with less than 10 employees.
Photo 6. Damage to container berths and piers

CHAPTER 3
Emergency Response

56
1 Rescue Operations
There is no official statistical data on the number of people who were trapped under collapsed buildings in the earthquake. Given the number of collapsed buildings, however, it is estimated that the number of trapped people exceeded 35,000.
According to the Hyogo Prefectural Police Headquarters (1996), 3,185 were rescued alive by the police on the day of the earthquake, January 17, in the entire disaster area (2,109 in the city of Kobe), and, including the number rescued after January 21, the number reached 3,495.
Professional and volunteer firefighters were also engaged in rescue operations while conducting firefighting, emergency transportation, and first aid at the same time.
Since the Japan Ground Self-Defense Force Middle Army based in Itami was able to dispatch squads to neighboring cities, rescue operations by the self-defense forces started in Itami, Nishinomiya, and other neighboring municipalities in the morning on the day of the earthquake. Meanwhile, regarding the operation in Kobe, the third Artillery Regiment based in Himeji, which is about 100 km away from Kobe, was supposed to be dispatched. Since the self-defense forces were supposed to be sent out only after the governor of the prefecture requests the dispatch under the Self-Defense Forces Act, the third Artillery Regiment was not dispatched until after 10 a.m., when the governor made a request for its dispatch. Caught in a traffic jam additionally, it was delayed in arrival. In spite of insufficient rescue tools, it made an all-out effort to rescue the victims.
Afterward, the 7th Infantry Regiment based in Fukuchiyama and other squads were also sent out for rescue operations in Kobe.
These public organizations such as the police and firefighters not only had limited man power but also had to conduct other different operations including maintenance of security, traffic control, firefighting, and emergency transportation, along with rescue operations.
Therefore, it is said that only about 20% of the trapped people that were rescued were actually rescued by the public bodies (police, firefighters, and self-defense forces). While public sectors had difficulty rescuing trapped victims, the remaining 80% were rescued by citizens who neither had special rescue tools nor had been trained. Some used jacks for automobiles; some obtained crowbars, saws, and ropes from somewhere; and others used their bare hands to rescue trapped people.
Here are some tragic stories about the activities of citizens. When neighbors tried to rescue a man caught between a post and a beam of a collapsed house, a fire that broke out nearby approached the house. The neighbors watched helplessly as the man told them to escape and thanked them for their effort. He became enveloped in flames still in the state of consciousness in front of his wife. Another sad story concerns a girl who was rescued after being trapped for nine hours. She cheerfully expressed her gratitude to her rescuers but died several hours later.
A lot of similar tragedies occurred in the disaster areas, and it seems that many more human lives could have been saved if there had been a system to rescue trapped people more promptly.
At that time, the general public knew very little about crush syndrome, and triage was not a topic of discussion. However, following the report that an evacuee who stayed in a car died from so called economy-class syndrome following the Niigata Chuetsu Earthquake, the general public became aware of

57
the necessity to address this issue, and the government has been improving measures in this area.
Meanwhile, a report on postmortem examinations says that more than 2,000 people died from suffocation within just 15 minutes after the occurrence of the earthquake, and efforts of rescuing people more promptly seems to have little meaning. However, as Figure 1 shows, the survival rate among the rescued people decreased with time. From the result, we should recognize that earlier rescue will save more lives and thus should reinforce the rescue system.
From the earthquake situation mentioned above, it is clear that prompt rescue operations by a large number of rescuers are needed at the time of a large scale disaster. To achieve this, early dispatch of squads by the self-defense forces who have a multitude of rear-echelon support troops is indispensable, along with the necessity to reinforce rescue activities by citizens, rather than depending on the police and firefighters alone.
Figure 1. Proportion of Survivors to the Rescued
Note. From the presentation material created by Nakayama, H., member of Kobe Technical Experts Co-operative Association for the Prevention against Disasters (K-TEC)
4
Jan. 17
Persons
Jan. 18 Jan. 19 Jan. 20 Jan. 21
RescuedSurvivors among the rescued Survival rate
been improving measures in this area.
Meanwhile, a report on postmortem examinations says that more than 2,000 people
died from suffocation within just 15 minutes after the occurrence of the earthquake, and
efforts of rescuing people more promptly seems to have little meaning. However, as Figure 1
shows, the survival rate among the rescued people decreased with time. From the result, we
should recognize that earlier rescue will save more lives and thus should reinforce the rescue
system.
Figure 1. Proportion of Survivors to the Rescued
Note. From the presentation material created by Nakayama, H., member of Kobe
Technical Experts Co-operative Association for the Prevention against Disasters
(K-TEC)
From the earthquake situation mentioned above, it is clear that prompt rescue
operations by a large number of rescuers are needed at the time of a large scale disaster. To
achieve this, early dispatch of squads by the self-defense forces who have a multitude of
rear-echelon support troops is indispensable, along with the necessity to reinforce rescue
activities by citizens, rather than depending on the police and firefighters alone.
In the 1999 Chi-chi Taiwan Earthquake and the 2008 Sichuan Earthquake, armies
quickly mobilized to rescue victims.
Moreover, the fact that neighbors rescued 80% of the trapped people in the Kobe
Photo 1. Rescue Activity by Citizens
Note. From Hodo Shashin Zen Kiroku Hanshin Daishinsai Zen Kiroku [Press Photos: Complete Record of the Great Hanshin-Awaji Earthquake] (p. 38 ), by Asahi Shimbun (Ed.), 1995, Tokyo: Author.
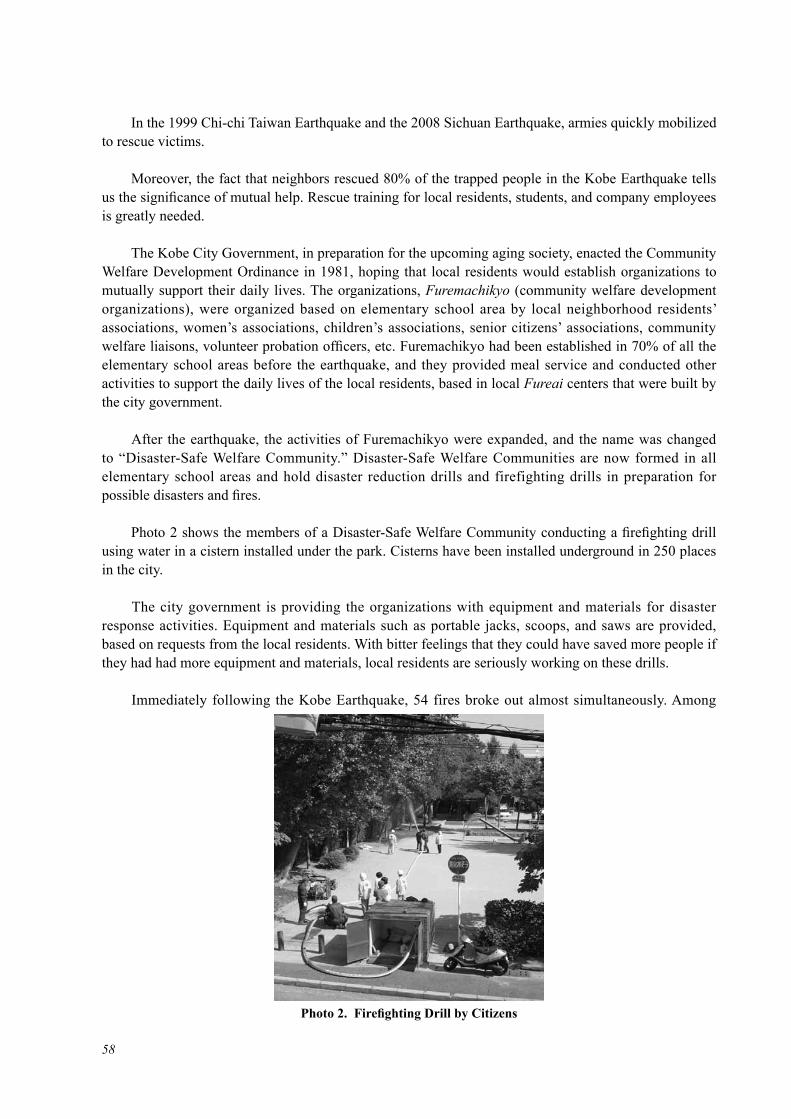
58
In the 1999 Chi-chi Taiwan Earthquake and the 2008 Sichuan Earthquake, armies quickly mobilized to rescue victims.
Moreover, the fact that neighbors rescued 80% of the trapped people in the Kobe Earthquake tells us the significance of mutual help. Rescue training for local residents, students, and company employees is greatly needed.
The Kobe City Government, in preparation for the upcoming aging society, enacted the Community Welfare Development Ordinance in 1981, hoping that local residents would establish organizations to mutually support their daily lives. The organizations, Furemachikyo (community welfare development organizations), were organized based on elementary school area by local neighborhood residents’ associations, women’s associations, children’s associations, senior citizens’ associations, community welfare liaisons, volunteer probation officers, etc. Furemachikyo had been established in 70% of all the elementary school areas before the earthquake, and they provided meal service and conducted other activities to support the daily lives of the local residents, based in local Fureai centers that were built by the city government.
After the earthquake, the activities of Furemachikyo were expanded, and the name was changed to “Disaster-Safe Welfare Community.” Disaster-Safe Welfare Communities are now formed in all elementary school areas and hold disaster reduction drills and firefighting drills in preparation for possible disasters and fires.
Photo 2 shows the members of a Disaster-Safe Welfare Community conducting a firefighting drill using water in a cistern installed under the park. Cisterns have been installed underground in 250 places in the city.
The city government is providing the organizations with equipment and materials for disaster response activities. Equipment and materials such as portable jacks, scoops, and saws are provided, based on requests from the local residents. With bitter feelings that they could have saved more people if they had had more equipment and materials, local residents are seriously working on these drills.
Immediately following the Kobe Earthquake, 54 fires broke out almost simultaneously. Among
Photo 2. Firefighting Drill by Citizens

59
them, 51 cases were building fires. Fires continued to occur, and when those caused by factors other than immediate earthquake damage are added, the total number becomes 157 (as of January 27). Among them, 103 occurred on the day of the earthquake, burning 79.9 ha. The total burned area caused by fires that occurred within ten days after the earthquake (by January 27) amounted to 81.9 ha.
In 22 cases, the burned area exceeded 5,000m2, and the largest fire burned down 142,945m2, 20 times the area burned by the largest fire in the past fifty years.
The cause of the fire is unknown in more than 60% of the cases since the buildings were almost totally destroyed. However, it is known that about 20% of the fires were electricity-related fires. This is partly because the earthquake occurred in winter, when many people were using electric heaters. There was also a case in which the heater for a fish aquarium caught fire.
It was impossible for the city government to secure an adequate firefighting system for such a large scale disaster with numerous simultaneous fires. Moreover, the following factors hampered firefighting operations and frustrated firefighters: (a) water supply facilities didn’t function well because water was cut off due to the rapture of water pipes, (b) collapsed elevated highways and severely damaged buildings blocked their access to the fire sites, and (c) traffic congestion delayed their arrival to the sites.
There was also a case in which even though firefighting teams came from other municipalities for support, they could not work well because the fittings of hoses they brought were not identical to those of the hoses owned by the Kobe City Fire Bureau. In another case, a citizen’s automobile that was being driven around the affected areas for safety confirmation accidentally cut off a fire-fighting hose, disturbing the firefighting operation.
In order to resolve these issues, municipalities are trying to unify the type of hose fittings nationwide. Also, hoses that can withstand a high load are being developed.
Following the earthquake, residents in one community ran around immediately to caution others in the community against fire and conducted firefighting operations themselves with fire extinguishers, succeeding in putting out some fires in the initial stage. In another community, residents cooperated with local companies in extinguishing 40 fires during the early stage and prevented disastrous consequences.
In these communities, residents had already been engaged in activities for community development with a spirit of mutual help and an idea to protect their community by themselves.
ReferenceHyogo Prefectural Police Headquarters (Ed.) (1996), Hanshin-awaji daishinsai keisatsu katudo no kiroku: Toshi
chokkagata jishin tono tatakai [Record of police activities during the great hanshin-awaji earthquake: The fight against an urban earthquake disaster]. Kobe: Author.
2 Local Evacuation Shelters
2.1 Establishment of Local Evacuation Shelters According to the Disaster Relief Act (enacted in 1947), the governor of each prefecture on consignment from the national government (and in case of Hyogo Prefecture, the mayor of each municipality entrusted by the prefectural government) is able to establish local evacuation shelters in order to protect people who suffered damage from a disaster or are at risk.
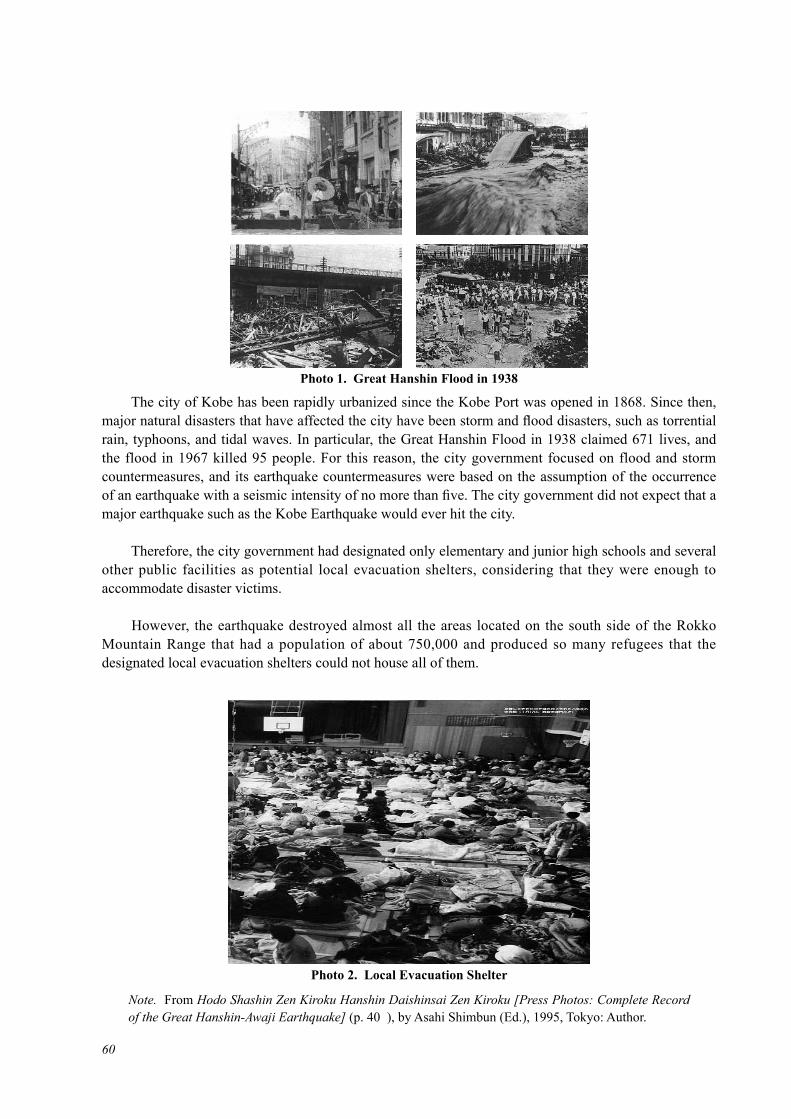
60
The city of Kobe has been rapidly urbanized since the Kobe Port was opened in 1868. Since then, major natural disasters that have affected the city have been storm and flood disasters, such as torrential rain, typhoons, and tidal waves. In particular, the Great Hanshin Flood in 1938 claimed 671 lives, and the flood in 1967 killed 95 people. For this reason, the city government focused on flood and storm countermeasures, and its earthquake countermeasures were based on the assumption of the occurrence of an earthquake with a seismic intensity of no more than five. The city government did not expect that a major earthquake such as the Kobe Earthquake would ever hit the city.
Therefore, the city government had designated only elementary and junior high schools and several other public facilities as potential local evacuation shelters, considering that they were enough to accommodate disaster victims.
However, the earthquake destroyed almost all the areas located on the south side of the Rokko Mountain Range that had a population of about 750,000 and produced so many refugees that the designated local evacuation shelters could not house all of them.
Photo 1. Great Hanshin Flood in 1938
Photo 2. Local Evacuation Shelter
Note. From Hodo Shashin Zen Kiroku Hanshin Daishinsai Zen Kiroku [Press Photos: Complete Record of the Great Hanshin-Awaji Earthquake] (p. 40 ), by Asahi Shimbun (Ed.), 1995, Tokyo: Author.
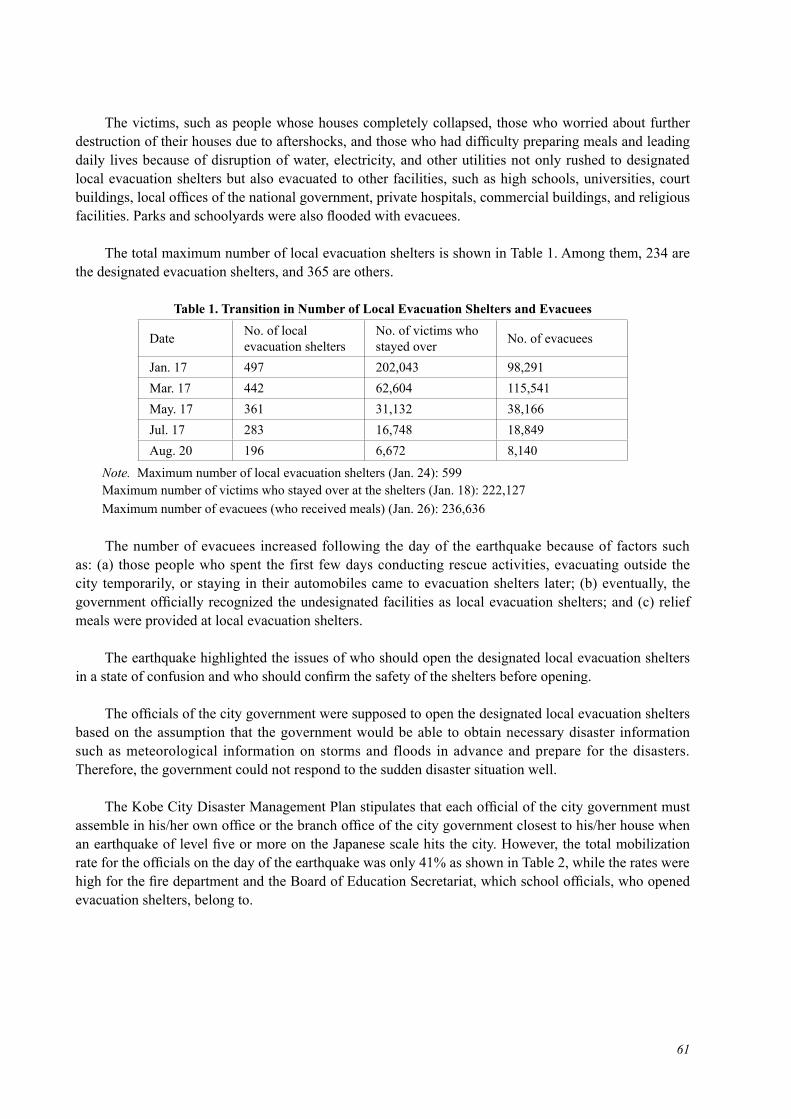
61
The victims, such as people whose houses completely collapsed, those who worried about further destruction of their houses due to aftershocks, and those who had difficulty preparing meals and leading daily lives because of disruption of water, electricity, and other utilities not only rushed to designated local evacuation shelters but also evacuated to other facilities, such as high schools, universities, court buildings, local offices of the national government, private hospitals, commercial buildings, and religious facilities. Parks and schoolyards were also flooded with evacuees.
The total maximum number of local evacuation shelters is shown in Table 1. Among them, 234 are the designated evacuation shelters, and 365 are others.
Table 1. Transition in Number of Local Evacuation Shelters and Evacuees
Date No. of local evacuation shelters
No. of victims who stayed over No. of evacuees
Jan. 17 497 202,043 98,291Mar. 17 442 62,604 115,541May. 17 361 31,132 38,166Jul. 17 283 16,748 18,849Aug. 20 196 6,672 8,140
Note. Maximum number of local evacuation shelters (Jan. 24): 599Maximum number of victims who stayed over at the shelters (Jan. 18): 222,127Maximum number of evacuees (who received meals) (Jan. 26): 236,636
The number of evacuees increased following the day of the earthquake because of factors such as: (a) those people who spent the first few days conducting rescue activities, evacuating outside the city temporarily, or staying in their automobiles came to evacuation shelters later; (b) eventually, the government officially recognized the undesignated facilities as local evacuation shelters; and (c) relief meals were provided at local evacuation shelters.
The earthquake highlighted the issues of who should open the designated local evacuation shelters in a state of confusion and who should confirm the safety of the shelters before opening.
The officials of the city government were supposed to open the designated local evacuation shelters based on the assumption that the government would be able to obtain necessary disaster information such as meteorological information on storms and floods in advance and prepare for the disasters. Therefore, the government could not respond to the sudden disaster situation well.
The Kobe City Disaster Management Plan stipulates that each official of the city government must assemble in his/her own office or the branch office of the city government closest to his/her house when an earthquake of level five or more on the Japanese scale hits the city. However, the total mobilization rate for the officials on the day of the earthquake was only 41% as shown in Table 2, while the rates were high for the fire department and the Board of Education Secretariat, which school officials, who opened evacuation shelters, belong to.
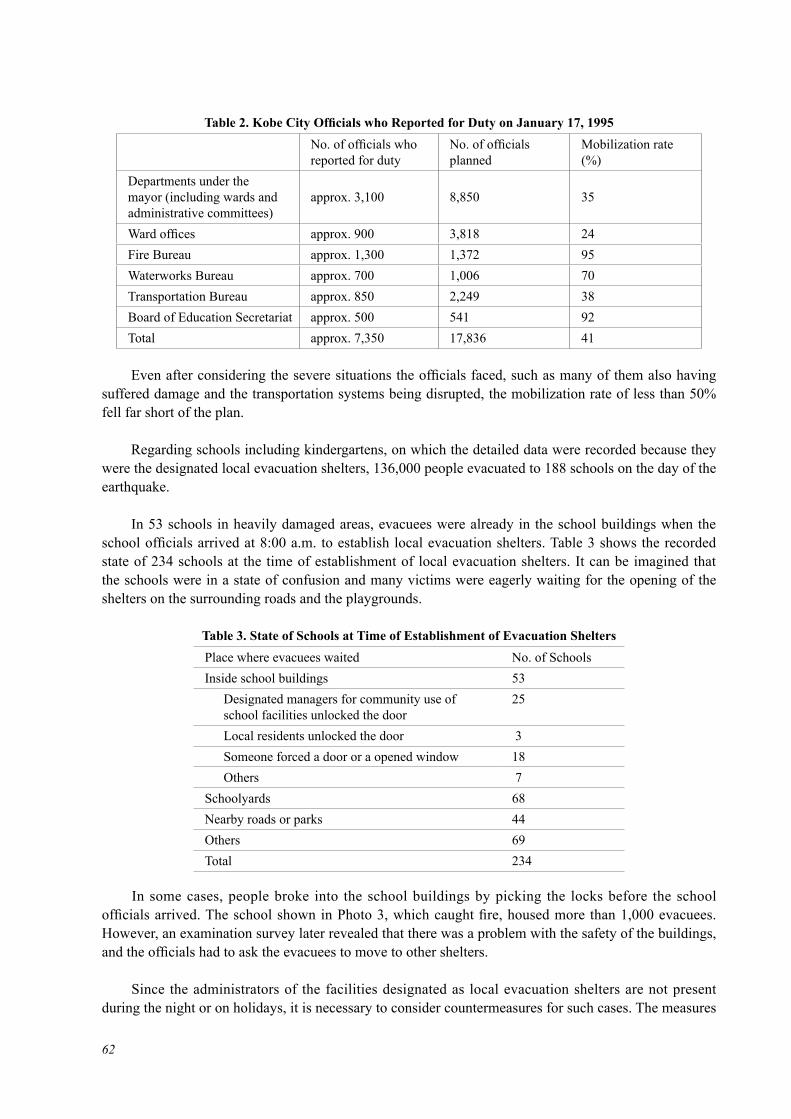
62
Table 2. Kobe City Officials who Reported for Duty on January 17, 1995No. of officials who reported for duty
No. of officials planned
Mobilization rate(%)
Departments under the mayor (including wards and administrative committees)
approx. 3,100 8,850 35
Ward offices approx. 900 3,818 24Fire Bureau approx. 1,300 1,372 95Waterworks Bureau approx. 700 1,006 70Transportation Bureau approx. 850 2,249 38Board of Education Secretariat approx. 500 541 92Total approx. 7,350 17,836 41
Even after considering the severe situations the officials faced, such as many of them also having suffered damage and the transportation systems being disrupted, the mobilization rate of less than 50% fell far short of the plan.
Regarding schools including kindergartens, on which the detailed data were recorded because they were the designated local evacuation shelters, 136,000 people evacuated to 188 schools on the day of the earthquake.
In 53 schools in heavily damaged areas, evacuees were already in the school buildings when the school officials arrived at 8:00 a.m. to establish local evacuation shelters. Table 3 shows the recorded state of 234 schools at the time of establishment of local evacuation shelters. It can be imagined that the schools were in a state of confusion and many victims were eagerly waiting for the opening of the shelters on the surrounding roads and the playgrounds.
Table 3. State of Schools at Time of Establishment of Evacuation SheltersPlace where evacuees waited No. of SchoolsInside school buildings 53
Designated managers for community use of school facilities unlocked the door
25
Local residents unlocked the door 3Someone forced a door or a opened window 18Others 7
Schoolyards 68Nearby roads or parks 44Others 69Total 234
In some cases, people broke into the school buildings by picking the locks before the school officials arrived. The school shown in Photo 3, which caught fire, housed more than 1,000 evacuees. However, an examination survey later revealed that there was a problem with the safety of the buildings, and the officials had to ask the evacuees to move to other shelters.
Since the administrators of the facilities designated as local evacuation shelters are not present during the night or on holidays, it is necessary to consider countermeasures for such cases. The measures
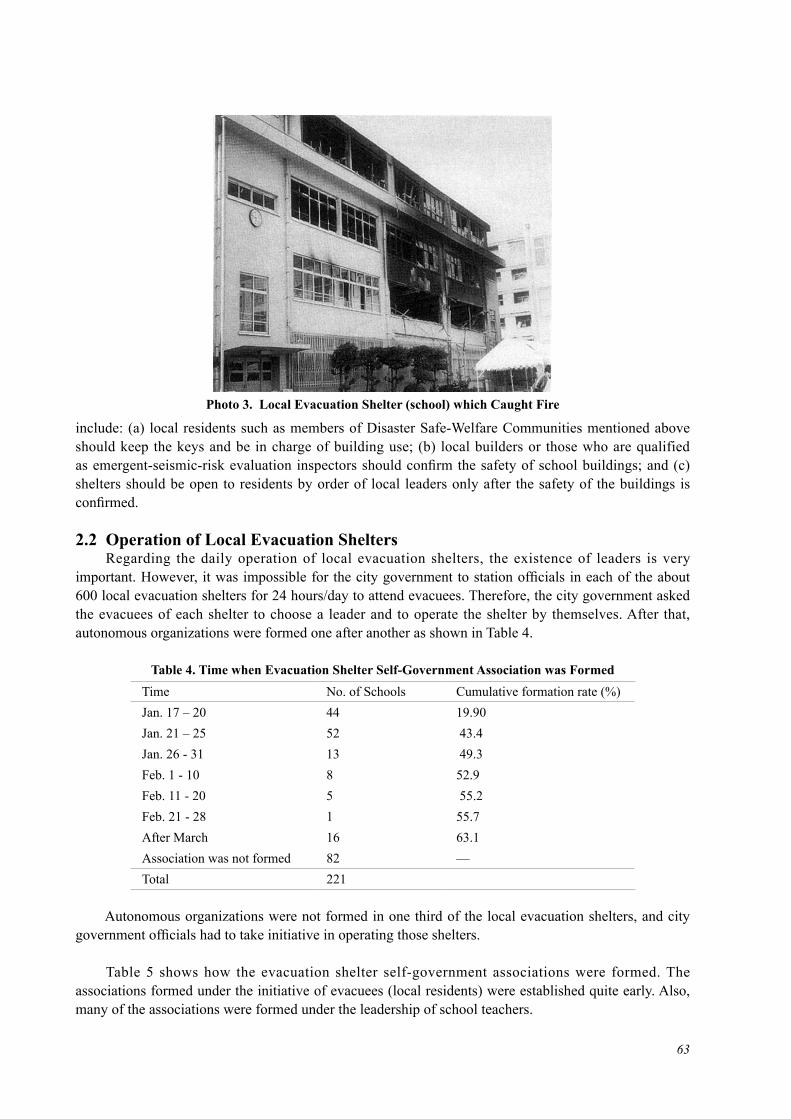
63
include: (a) local residents such as members of Disaster Safe-Welfare Communities mentioned above should keep the keys and be in charge of building use; (b) local builders or those who are qualified as emergent-seismic-risk evaluation inspectors should confirm the safety of school buildings; and (c) shelters should be open to residents by order of local leaders only after the safety of the buildings is confirmed.
2.2 Operation of Local Evacuation Shelters Regarding the daily operation of local evacuation shelters, the existence of leaders is very important. However, it was impossible for the city government to station officials in each of the about 600 local evacuation shelters for 24 hours/day to attend evacuees. Therefore, the city government asked the evacuees of each shelter to choose a leader and to operate the shelter by themselves. After that, autonomous organizations were formed one after another as shown in Table 4.
Table 4. Time when Evacuation Shelter Self-Government Association was FormedTime No. of Schools Cumulative formation rate (%)Jan. 17 – 20 44 19.90Jan. 21 – 25 52 43.4Jan. 26 - 31 13 49.3Feb. 1 - 10 8 52.9Feb. 11 - 20 5 55.2Feb. 21 - 28 1 55.7After March 16 63.1Association was not formed 82 —Total 221
Autonomous organizations were not formed in one third of the local evacuation shelters, and city government officials had to take initiative in operating those shelters.
Table 5 shows how the evacuation shelter self-government associations were formed. The associations formed under the initiative of evacuees (local residents) were established quite early. Also, many of the associations were formed under the leadership of school teachers.
Photo 3. Local Evacuation Shelter (school) which Caught Fire

64
Table 5. How Evacuation Shelter Self-Government Associations were FormedAssociation formed by No. of SchoolsInitiative of evacuees 36Leadership of school staff 80Leadership of city officials 3Leadership of volunteers 5Others 15Total 139
Since not all the leaders of the self-government associations were evacuees (local residents), the manner of operation varied among local evacuation shelters. The operation manners are classified broadly into the following four types: (a) local resident-led operation type, (b) school staff-led operation type, (c) volunteer-led operation type, and (d) government-led operation type (in those shelters where associations were not formed).
Regarding the local resident-led operation type, the self-government associations were formed earlier than other types. The leaders knew well about the local community, and the evacuees took a reserved attitude toward them to a certain degree. Even when the leaders provided a limited number of rice balls and blankets for children and the elderly preferentially, few evacuees complained about it. However, the city government officials wanted to provide relief goods fairly and equally as much as possible, and therefore the leaders sometimes could not provide relief goods until an amount sufficient to cover all the evacuees was prepared.
When operating local evacuation shelters, it is important for leaders to allow for the independence of evacuees. In the shelters led by local residents, the leaders were engaged in the operation with this idea in mind, and it led to early closure of the evacuation shelters.
As for the school staff-led operation type, evacuees did not complain much to teachers out of respect for them. However, the operation work imposed a heavy burden on teachers. Since they have a strong sense of responsibility, some of them collapsed from fatigue.
Teachers also had to keep providing education to students and put more emphasis on mental care for children who lost families and friends. Although having understood it was better to avoid depending on them too much, the city government expected them to play a leading role in operating the shelters partly because other municipalities sent teachers to support them.
Regarding volunteers, a total of 1.3 million volunteers worked in the disaster areas: the year 1995 is called the first year of volunteerism in Japan.
Although volunteers were engaged in activities such as sorting, transport, and distribution of relief goods in the early stages, they gradually took the initiative in operating evacuation shelters in some areas. Mainly student volunteers worked for the long-term operation activities, and a total of 600,000 students were engaged in operating evacuation shelters from their opening to around March, when they graduated or the new school term began.
At the time of the earthquake, the city government had to accept volunteers without any knowhow or manual as to how to treat them or what duties it should assign to them. Also, volunteers were disorganized at first. Gradually, however, volunteers got together to decide leaders, individual duties and
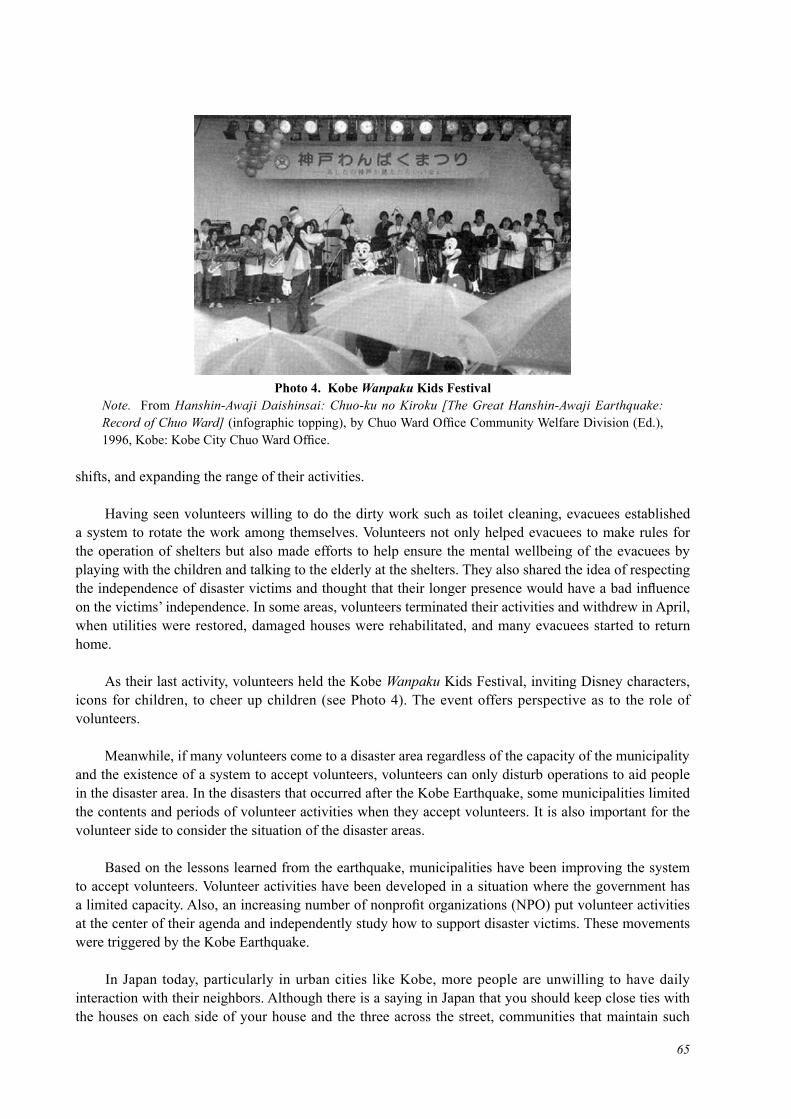
65
shifts, and expanding the range of their activities.
Having seen volunteers willing to do the dirty work such as toilet cleaning, evacuees established a system to rotate the work among themselves. Volunteers not only helped evacuees to make rules for the operation of shelters but also made efforts to help ensure the mental wellbeing of the evacuees by playing with the children and talking to the elderly at the shelters. They also shared the idea of respecting the independence of disaster victims and thought that their longer presence would have a bad influence on the victims’ independence. In some areas, volunteers terminated their activities and withdrew in April, when utilities were restored, damaged houses were rehabilitated, and many evacuees started to return home.
As their last activity, volunteers held the Kobe Wanpaku Kids Festival, inviting Disney characters, icons for children, to cheer up children (see Photo 4). The event offers perspective as to the role of volunteers.
Meanwhile, if many volunteers come to a disaster area regardless of the capacity of the municipality and the existence of a system to accept volunteers, volunteers can only disturb operations to aid people in the disaster area. In the disasters that occurred after the Kobe Earthquake, some municipalities limited the contents and periods of volunteer activities when they accept volunteers. It is also important for the volunteer side to consider the situation of the disaster areas.
Based on the lessons learned from the earthquake, municipalities have been improving the system to accept volunteers. Volunteer activities have been developed in a situation where the government has a limited capacity. Also, an increasing number of nonprofit organizations (NPO) put volunteer activities at the center of their agenda and independently study how to support disaster victims. These movements were triggered by the Kobe Earthquake.
In Japan today, particularly in urban cities like Kobe, more people are unwilling to have daily interaction with their neighbors. Although there is a saying in Japan that you should keep close ties with the houses on each side of your house and the three across the street, communities that maintain such
Photo 4. Kobe Wanpaku Kids FestivalNote. From Hanshin-Awaji Daishinsai: Chuo-ku no Kiroku [The Great Hanshin-Awaji Earthquake: Record of Chuo Ward] (infographic topping), by Chuo Ward Office Community Welfare Division (Ed.), 1996, Kobe: Kobe City Chuo Ward Office.

66
traditional mutual-help relations among neighbors, like exchanging dishes for dinner or borrowing or lending seasonings each other, are decreasing. Urban areas, where people are able to lead a life without interaction with others if they have money, have changed into a society where people value individualism and regard interaction with others as burdensome as well as one that just interferes with their life.
Such change might easily have negative effects on the operation of evacuation shelters in the event of an earthquake. The manner of operation differed significantly between the shelters which were located in communities that maintained mutual-help relations among residents or which had many evacuees who tried to be independent in tough evacuation life with a spirit of self-support and the shelters which were not in those communities or did not have such evacuees.
2.3 Issues Concerning the Operation of Local Evacuation Shelters Under the Disaster Relief Act, local evacuation shelters are open to disaster victims for up to seven days in principle and the extension of the operation period requires approval from the Minister of Health, Labor, and Welfare. Following the earthquake, local evacuation shelters in Kobe were operated for seven months, up to August 20, 1995, until utilities were restored, temporary housing was constructed, and damaged houses were repaired.
In the long-term operation, issues over the shelters changed with time. In order to address changing issues, it is important to find the cause of the problems as soon as possible, assess the situation, and review the previous ways, based on the PDCA (plan-do-check-act) cycle. In the early period, evacuees were satisfied with merely being alive and did not make great demands. They requested only minimum relief supplies, such as water and rice balls for meals, and a blanket to warm themselves since it was winter and many evacuees rushed to evacuation shelters only in pajamas. However, even such minimal supplies could not be provided to the evacuees in many shelters because roads were severely damaged and vehicles carrying relief supplies from all over the country were caught in traffic jams. As necessities of life became available and the minimal needs were met, the evacuees appreciated provision of them for free.
Figure 1. Local Evacuation Shelter Newsletter Published by Children
South Hyogo Prefecture EarthquakeOnoe Elementary School Evacuation Shelter Newsletter No.3 1995.1.22
Information
We, elementary and junior-high school students, have started to publish this newsletter, in place of teachers. We will try hard to write good and useful articles. When we ask you for an interview, please cooperate with us.
The layout of the schoolyard has been changed as shown in the right figure. The garbage dump is in front of the west gate.・Please do not throw away the garbage in any place other than the garbage dump. Two temporary toilets were set up on the north side of the pool.・Please keep the toilets clean. Please park your car in the designated parking space to secure passages for relief supply vehicles.
West gate
Waste dumpGarbage dumpGarbage dump
PoolParking spaceTemporary
toilet
South exit Central exit North gate
North entranceSchool building
Main entrance
Relief suppliesFrom Hokkaido Pref. – hardtack and dry milkFrom Yamanashi Pref. – hardtackFrom Ehime Pref. – sanitary goodsFrom Oita Pref. – emergency foodFrom Miyagi Pref. – paper platesFrom China – canned food
From Kagawa Pref. – emergency foodFrom Wakayama Pref. – Umeboshi and other picklesFrom Wakayama Pref. – juice and teaFrom Saitama Pref. - hardtackFrom Tokyo – hardtack, retort-pouched “mild chicken” curries and coffeeFrom Kyoto Pref. – rice balls and water
We received many other relief supplies. Let’s share them with appreciation.
Edited by: Mio Ishizuka, Yuka Nagauchi, Yukari Fukui and Yukiyo Yoshida

67
Regarding relief meals, at first the evacuees were satisfied with the meals provided, bread for breakfast and lunch and cold boxed meals for dinner, since the meals satisfied their hunger without charge. As evacuation life was prolonged however, evacuees requested improvement in the quality of supplied meals. Accordingly, the city government increased their expenditure for meals per person/day by about 40% (from 850 yen to 1,200 yen) to improve the quality of meals. At the same time, the government worked on improving the shelters with such efforts as installing simple kitchens so that evacuees could improve their diet by their own effort. Under these situations, citizens, who were also affected, and volunteers came to the shelters and set up food stalls, providing hot meals to evacuees. These meals offered more spiritual comfort rather than dietary satisfaction to the evacuees.
Besides dietary satisfaction, how to find comfort in tough evacuation life is important for evacuees. In a limited and restricted dreary space, sometimes the existence of children changed the atmosphere of evacuation shelters and their laughter healed evacuees’ minds. In one evacuation shelter, children created the rules of the shelter and put them in their own newsletter to disseminate them to the evacuees. Although some of them lost families and teachers, children endured in the harsh evacuation environment, engaged themselves in operation activities such as cleanup of toilets and tried to do anything they could do.
The ultimate issue among the many daily troubles was the toilet issue. Toilet facilities in schools did not have the capacity for use by so many people, several hundreds to over 3,500 people, for 24 hours/day. In addition, the toilets did not flush since water services were cut off by the earthquake. Therefore, the toilets were soon flooded with human waste. Some evacuees defecated on sheets of newspaper, while others defecated in a hole which they dug in a far corner of the schoolyard. Some elderly people avoided water to reduce the number of times they needed to go to the toilet, resulting in their getting sick. Since cleaning tools were not available, the human waste was removed by hand. As mentioned before, evacuees cleaned the toilets by themselves. Although 2,800 temporary toilets were installed in the local evacuation shelters, it was necessary to level human waste with a fire hook for continued use. The problem was solved after water supply was restored, but based on this lesson, manholes for temporary toilets that can be directly connected to sewers are being installed in parks and other places. Issues of toilets were not limited to evacuation shelters. In mid-to-high-rise commercial buildings and apartments, electricity stopped and water was not sent to the roof tanks. Since tap water was also unavailable, toilets could not be flushed, and the buildings were filled with the odor of human waste. This revealed a vulnerability of urban cities.
After the earthquake, underground water tanks and private electric generators are being improved in major facilities. General households have also started to take self-defense measures such as saving the bathwater.
There are many issues to consider when it comes to accommodating persons with special needs in local evacuation shelters. Following the earthquake, in a messy situation, there is no record remaining as to how persons with special needs were guided to evacuation shelters. Care for them was left to the goodwill of local residents. In a limited shelter space, it was not possible to prepare special rooms for them. Manuals for treating people with special needs were not prepared before the earthquake. Since the city officials were too busy dealing with other work such as recovering bodies and treating the injured to take care of persons with special needs following the earthquake, a study on how to deal with them in a disaster and practical training is being conducted.
Support for the disabled differs according to type of their disability. Now, many people are starting to realize the significance of maintaining close ties among residents and value the spirit of self-help
68
and mutual-help. Not only residents are starting to conduct drills for evacuation guidance but also the disabled are participating in local drills, based on the idea that in emergencies people cannot do what they usually do not.
In addition, a thorough discussion is required for the definition of people vulnerable to disasters and support for them. It is often considered that people vulnerable to disasters are equal to the persons with special needs. For example however, families with small children, pregnant women, and mothers with nursing infants have lots of difficulties living in evacuation shelters even if they themselves were healthy. Also, those who suffer visceral diseases, the elderly, and those who do not fit in communal living are regarded as vulnerable people, and special care for them is needed. Following the earthquake however, there was no room to provide special care for them. In order to solve this issue, designation of local evacuation shelters should be implemented not just from the viewpoint of securing the capacity necessary to accommodate disaster victims but also in consideration for those people with special needs. In light of this, we see that it is necessary to designate more facilities such as private facilities as well as high schools and universities as local evacuation shelters and to consider support for people with special needs in emergencies throughout the community.
In addition to the above issues, there were a lot of problems and challenges related to local evacuation shelters, such as issues concerning hygiene, infectious diseases, and privacy. With evacuee’s efforts for independence and a lot of support however, evacuees gradually moved to temporary housing or returned to their repaired houses, and all the local evacuation shelters were closed by August 20.
At that time, about 6,500 people still remained in the shelters because they had no other place to live. They moved to accommodations prepared in several places and tried to be independent by resolving individual issues one by one. It was more than two years later that the accommodations closed.
3 Temporary Housing
3.1 Process of Constructing Temporary Housing Under the Disaster Relief Law, the governor of each prefecture, on consignment from the national government, should construct houses or rent existing houses as temporary housing to provide housing for those who are disaster victims that lost their homes and who are unable to secure houses by themselves (in Hyogo Prefecture, the construction of temporary housing was entrusted to the mayor of each municipality by the prefectural government before the earthquake). In this disaster, the government decided to take a flexible stance on the provision of temporary housing regardless of financial ability, in order to prevent social anxiety.
By law, the construction of temporary housing should have been the responsibility of the national government, and the practical affairs should have been managed by the Kobe City Government. However, since the earthquake hit a wide range of areas, including the southern parts of Hyogo Prefecture and Awaji Island, it was decided that the Hyogo Prefectural Government, which best grasped the situation in the entire disaster area, would serve as the implementing body for the construction in place of the city government. Accordingly, the prefectural government took charge of the criteria for tenant selection as well as the designing and construction order of the temporary housing units, and the Kobe City Government engaged in affairs regarding site selection, site planning, tenant selection, and subsequent management of the housing (regarding the housing units constructed after the eighth order, the city government also took charge of the designing and construction of about three-fourths of the housing units since the prefectural government could not handle all the work).

69
Table 1 shows the process of temporary housing construction. About 29,000 housing units were constructed in 256 sites in Kobe. In addition, in order to provide temporary housing for the victims as soon as possible, about 3,000 housing units were constructed in neighboring cities for the citizens of Kobe.
Table 1. Construction Situation of Temporary Housing
Order date 1BR and Kitchen 2BR and Kitchen Community-type Cumulative No. of houses
Jan. 19 - 1,013 units - 1,013 unitsJan. 25 - 5,546 - 6,559Feb. 1 - 3,578 - 10,137Feb. 9 - 4,556 - 14,693Feb. 25 - 1,607 812 units 17,112Mar. 3 - 2,355 - 19,467Mar. 27 - 595 302 20,364May. 31 5,270 units 625 386 25,645Jun. 27 1,649 380 504 29,178Total in city 6,919 20,255 2,004 29,178
Note. In city: 29,178 units; outside city: 3,000 units
The number of housing units constructed corresponds to only about 40% of the total number of fully collapsed or burned houses in the city area (about 82,000). As for the remaining 60%, victims secured a place to live by moving to rental housing or reconstructing or repairing their houses.
Based on the city’s past disaster experiences, the Mayor promptly directed the construction of temporary housing on the day of the earthquake, and the officials began to select the construction sites while requesting building constructors to prepare for the construction. The city government initially ordered the construction of 1,031 units (after the initial order was placed by the city government, all the order works were taken over by the prefectural government due to the above mentioned reason). The number of necessary housing units was so huge that it was impossible to commence construction of all the units within 20 days after the disaster, the period stipulated by law. The last order (the 10th order) was placed at the end of June. The problem was how to secure about 210 ha. (70 m2/unit × 30,000 units) of sites necessary for constructing some 30,000 temporary houses.
The city government understood that temporary houses should be constructed in the existing urban areas where many disaster victims had lived. However, construction in private land was limited, and there were no large public open areas. The city government only secured part of public land such as parks.
Although the schoolyards could be used as sites for temporary housing, the city government decided not to construct temporary housing in the schoolyards based on the Mayor’s policy to avoid depriving children, who suffered mental damage from the disaster, of the only healing place left. Despite the fact that many victims requested the construction of temporary housing in the devastated urban areas, the city government made the tough decision to avoid using schoolyards. However, given that it took 5 years for the all the tenants to move out of the temporary housing, this matter taught us the importance of looking ahead. Consequently, half of the housing units were constructed in the form of large scale housing complexes in the new towns located on the west and north sides of Mt. Rokko that the city

70
government had been developing.
Even so, temporary housing units were still insufficient, and in consideration of the victims’ feeling that they wanted to stay near their familiar area, the city government prepared land for about 2,500 housing units on Port Island, reclaimed land where infrastructures such as roads and water, sewage, and electricity supplies were still under construction.
In this way, the Kobe City Government could secure the land for temporary housing just because it had reserved land for urban development projects. From the viewpoint of crisis management, it is necessary to reserve space in urban areas.
Regarding the size and cost of a temporary housing unit, the Disaster Relief Law stipulates that the standard size of a temporary housing unit should be about 30 m2 and its construction cost should be up to about 2.5 million yen. As it was necessary to supply a large amount of housing units as soon as possible, housing units, with a floor area of about 26 m2, comprising of two bedrooms, toilet, bath, and kitchen, were constructed as shown in Figure 2.
However, the law only stipulates the construction of housing and does not cover the construction of facilities that would support the victims’ daily lives, such as paved roads, street lightings, wheelchair ramps, community centers, neighborhood stores, and clinics. Therefore, those facilities were constructed one by one with a fund established by the prefectural government and the city government, and at the same time, the city government asked some entities to open stores and clinics in the temporary housing
Figure 1. Location of Temporary Housing in the City Area
Photo 1. Panelized Temporary Housing Complexes in New Town
Figure 2. Room Layout of Standard Type Temporary Housing Unit with 2BR and Kitchen
6-matJapanese
room
4.5-matJapanese
room
ClosetCloset
6-matJapanese
room
4.5-matJapanese
room
ClosetCloset
19 housing unit or less 20~ 49 housing unit 50~ 99 housing unit100~ 499 housing unit500 housing unit or more

71
sites with no regard to profits.
In the later stage of the construction, the city government conducted a survey concerning the family composition and the needs of the applicants, and different types of temporary housing units were constructed reflecting the outcome of that survey. One of these types of units is a single room and a kitchen for one person. Community-type housing for ordinary households as well as for the elderly and the disabled was also constructed in order to provide as many housing units as possible in the existing urban areas. This is a two-storied, dormitory-type housing unit with a communal lavatory, bathroom, and kitchen as shown in Figure 3. These community-type temporary houses were popular among the tenants because tenants could avoid the feeling of loneliness by living communally with others. Also, the housing was appropriate for the life support advisers (LSA) to do their activities, such as consultations, safety confirmation, and emergency care for the victims.
In this way, the city government worked to realize the construction of different types of temporary housing units that met the needs of the victims while gaining agreement of the prefectural and national
Figure 3. Layout of Community-Type Temporary Housing
4.5-matJapanese
room
4.5-matJapanese
room
6-matJapanese
room
6-matJapanese
room
4.5-matJapanese
room
Closet
Closet Closet Closet Closet
Closet Closet Closet
ClosetCloset
Closet Closet
4.5-matJapanese
room
6-matJapanese
room
Handrail
Handrail
Handrail
Down pipe
Down pipe
Down pipe
Down pipe
Down pipe
Propane tank yard
Propane tank yard
RampRamp
6-matJapanese
room
Undressing room
Bathroom
Lavatory for the disabled
Washbasin for the disabledSink for the disabled
Communal kitchen
Wash machine space
Space for wash machine for the disabled4.5-mat
Japaneseroom
4.5-matJapanese
room
6-matJapanese
room
6-matJapanese
room
4.5-matJapanese
room
Closet
Closet Closet Closet Closet
Closet Closet Closet
ClosetCloset
Closet Closet
4.5-matJapanese
room
6-matJapanese
room
Handrail
Handrail
Handrail
Down pipe
Down pipe
Down pipe
Down pipe
Down pipe
Propane tank yard
Propane tank yard
RampRamp
6-matJapanese
room
Undressing room
Bathroom
Lavatory for the disabled
Washbasin for the disabledSink for the disabled
Communal kitchen
Wash machine space
Space for wash machine for the disabled
Photo 2. Communal Toilet and Shower Facility (left) and Communal Kitchen (right)

72
governments. After the closure of the temporary housing sites, some housing units were sent as relief supplies to the disaster-stricken areas in Turkey and Taiwan hit by earthquakes in 1999.
It is said that following the Sichuan Earthquake, 650,000 temporary housing units were built within three months. The temporary housing units built in China were the community-type with a communal kitchen, lavatory, and shower room, as shown in Photo 2, and therefore were easy to construct at low cost in the short term. Since this type of housing unit also has the advantage that the residents see each other daily and can easily create a community, the option of community-type temporary housing should be considered in the future.
3.2 Process of Tenant Selection There was a debate on how to select the tenants. Under the prefectural government’s policy of selecting the tenants by lot for fairness and extricating the elderly and the disabled from the harsh environment of local evacuation shelters as soon as possible, the tenant selections were held by lot with priority given to the elderly and disabled. This method however caused mismatches: while single elderly people could promptly move into the units with 2 bedrooms and a kitchen in the convenient existing urban areas, which were constructed at an early date, those households with children had to move into housing located far from the urban areas or large families had to live in the units with one bedroom and a kitchen. Long commutes and heavy traffic expenses became a big burden for the victims who had low incomes, hampering the recovery of their lives. This triggered controversy over the tenant selection method with the priority categories. In the subsequent tenant selections for the disaster restoration public housing, the city government made proposals to avoid such mismatches. However, the same method was taken, resulting in some public housing complexes in the convenient urban areas being occupied by mostly single elderly people. This has created inactive communities with an unbalanced population structure, and the city government is still struggling with this issue.
In case of the natural disasters that occurred after the Kobe Earthquake, the disaster-hit municipalities constructed temporary housing units and selected tenants in consideration of the characteristics of the areas, based on learned from Kobe Earthquake, although the situations differed from Kobe’s case since the necessary number of temporary housing units was smaller and the land for them was secured more easily.
3.3 Life in Temporary Housing Life for the victims in temporary housing, which lasted up to five years, and support activities by the city government, neighboring residents, and volunteers can be described as follows.
Since tenant selection was conducted by lot, the victims had to leave their friends and neighbors and move to the temporary housing in an unfamiliar area. Although many people still had a fear of additional earthquakes, stayed indoors, and were reluctant to communicate with neighbors, the city government asked the residents in each temporary housing site to establish a self-government organization similar to those formed in local evacuation shelters to create a community for mutual help.
The city government could not force the residents to form these organizations, but it was capable of improving facilities. Under such circumstances, some victims engaged in improvement of evacuation life got in touch with others of the same mind and formed the Earthquake-Victims Network to improve the lives of the victims. The Network sometimes made proposals and requests to the government as a representative who understood the feeling of the victims. Moreover, the members put their efforts into improvement of the victims’ lives in the temporary housing.
73
The city government considered it necessary to provide a place for the residents in the temporary housing facilities to get to know each other and enjoy their lives and installed community centers in the temporary housing sites where the residents go to talk, have tea together, and enjoy karaoke. The members of the Earthquake-Victims Network helped the residents plan distinctive activities according to the characteristics of the individual temporary housing sites as well as to form the management councils to operate the centers. They also encouraged the residents to go outside and interact with others through such activities as calling for the residents to plant flowers in open spaces and clean up the neighborhood, trying to create communities in the temporary housing sites. The city government was often supported by such voluntary groups.
Another example of support by civic groups is support by the neighborhood residents’ associations located near the temporary housing sites. They accepted the victims in temporary housing as local residents and took care of the elderly victims and those who need help. Many volunteers who came from all over the country also helped to cheer up the victims who led rather dismal lives. Some volunteers brought rice, vegetables, and fruits to the temporary housing sites and sold them at low prices. Other volunteers held local performing arts events. One volunteer group invited the residents to a hot spring resort.
Meanwhile, there were many challenges and difficulties in the victims’ daily lives in the temporary housing. For one thing, it was difficult to ensure privacy as well as living rules and manners among the residents. The units were separated only by thin board walls, and therefore the residents could hear their neighbors’ conversations and the sound of their televisions. The city government especially had trouble dealing with complaints about those who got drunk and raised their voices late at night. Although keeping pets in the temporary housing was prohibited, the city government tolerated pets unless they disturbed the neighbors because they were a comfort to the victims.
Another issue was measures to combat the summer heat and the winter cold. Since the temporary housing was covered with a sheet of tin roofing, the inside of the rooms became intolerably hot because of the scorching sun. In response to requests from the residents, the city government installed air conditioners. Some residents then demanded that the government pay the electricity costs for running the air conditioners, confusing city officials.
How to care for the mental and physical conditions of the victims was also a challenge. While sociable people found some amusement, some residents who secluded themselves in their houses or who lost their family or job became addicted to drinking and reluctant to have meals, resulting in ruing their health. The city government had public health nurses and LSAs visit the victims. However, there was a limit to intervening in the victims’ private lives. Single men in their fifties and sixties, in particular, got severely depressed, leading to disordered lives that often troubled people around them. During the period between the life in the temporary housing and soon after moving into disaster-restored public housing, 132 people died alone, which is referred to as “neglected death.” When one person died alone in temporary housing and the dead body was not found until ten months later because the person did not have daily interaction with neighbors, the city government was severely criticized by the media for failing to prevent solitary deaths, and city officials found themselves at a loss as to how to support the victims in the future.
Under such situations however, local residents living near the temporary housing and the Earthquake-Victims Network helped the government. They worked on prevention of neglected death by visiting the residents in the temporary housing units periodically and encouraging those who lost jobs to work again.

74
Although life in temporary housing was such a tough one, as disaster-restoration public housing was constructed, the temporary housing sites started to close one by one. Eventually, the last one closed on December 20, 1999.
Since the city government did not have the authority to decide on the planning or construction of the temporary housing, the tenant selection, or the housing management, it had to implement all substantive efforts while discussing with and gaining agreement from the national and prefectural governments. This sometimes caused the city government to fail to put into action ideas that reflected the needs of the victims and address problems quickly. If the temporary housing system had given more authority to municipalities, the lowest level of government and closer to the victims, than national and prefectural governments, more rapid and meticulous support probably could have been offered. It is hoped that measures against disasters will be more victim-oriented in the future, based on the lessons learned from the Kobe Earthquake.
4 Health and Medical Care
4.1 Background The Kobe Earthquake, which no one could have anticipated, devastated Kobe and another 24 cities and towns in an instant, causing unprecedented damage: approximately 6,000 died; 90,000 buildings completely collapsed; 100,000 buildings partially collapsed; 7,000 buildings burned to the ground; 300 buildings were partially destroyed by fire; 420,000 households were evacuated; and 65 ha. of land was burned. Immediately after the occurrence of the earthquake, the Kobe City Government set up the Kobe City Disaster Management Headquarters and discussed countermeasures with the national government and the Hyogo Prefectural Government. Under the Kobe City Disaster Management Headquarters, the Health Bureau (see Figure 1) was to appoint the Director General as the head of the Health Department and to be in charge of the following affairs (see Figure 2). ・ Medical and midwifery care based on the Disaster Relief Act ・ Formation of relief squads, establishment of first-aid stations, and implementation of other medical
and midwifery activities ・ Control of epidemics in earthquake-hit areas ・ Burial of bodies ・ Disposal of dead animal bodies (hygienic measures, designation of sites for burial) In ordinary times, the Health Bureau, through public health care activities, conducts the following
Figure 1. Organizational chart of Health Bureau (As of FY 1995)
General Affairs Section
Regional Health Care Section
Cemetery Section
Dental Clinic for Mentally and Physically Disabled Persons
Health Promotion Section
Health Prevention SectionMeat Hygiene Inspection Center
h Bu
reau Public Health Section
Hospital Management Department
Animal Management Center
Hea
lth
Environmental Health Research Center
Food Sanitation Inspection Center
Public Health Centers of each of 9 wards Kitasuma Branch
Eugenic Protection Consultation Office Higashinada Branch Cli i f G l H i l
Kobe City Medical Center General Hospital
Kobe City Medical Center West Hospital
Clinic of General Hospital
General Hospital Isolation Ward
Kobe City Junior College of Nursing
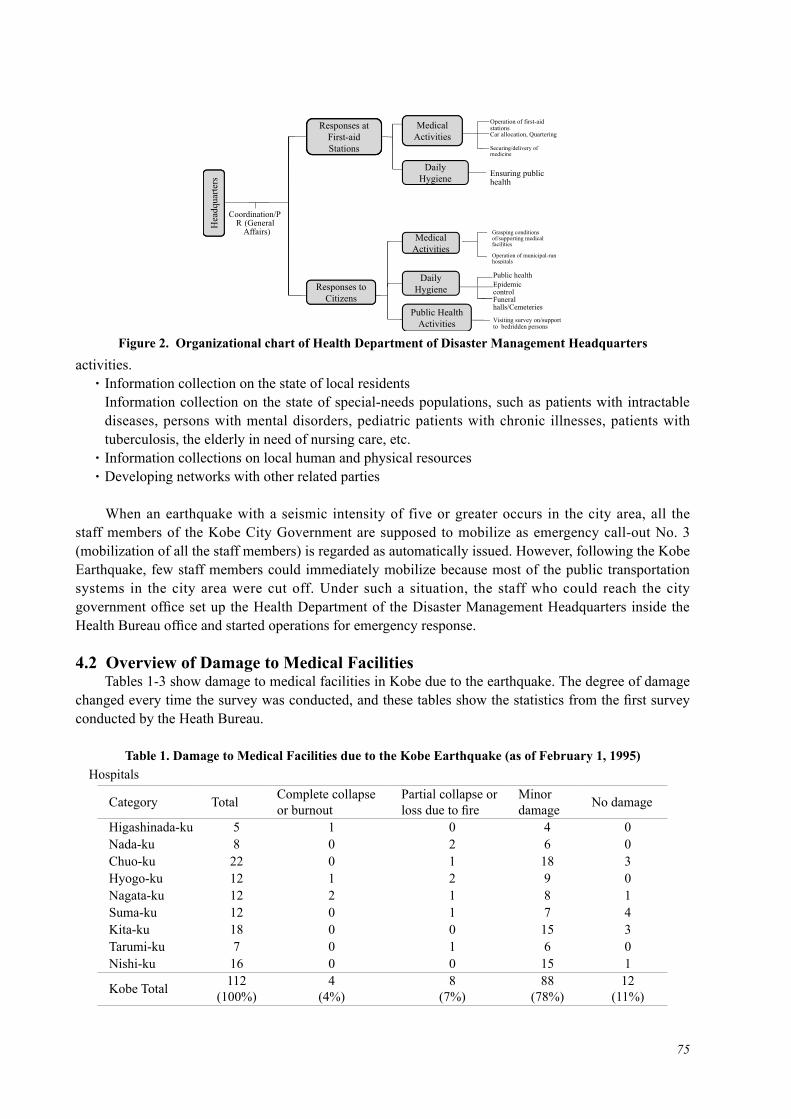
75
activities. ・ Information collection on the state of local residents Information collection on the state of special-needs populations, such as patients with intractable
diseases, persons with mental disorders, pediatric patients with chronic illnesses, patients with tuberculosis, the elderly in need of nursing care, etc.
・ Information collections on local human and physical resources ・ Developing networks with other related parties
When an earthquake with a seismic intensity of five or greater occurs in the city area, all the staff members of the Kobe City Government are supposed to mobilize as emergency call-out No. 3 (mobilization of all the staff members) is regarded as automatically issued. However, following the Kobe Earthquake, few staff members could immediately mobilize because most of the public transportation systems in the city area were cut off. Under such a situation, the staff who could reach the city government office set up the Health Department of the Disaster Management Headquarters inside the Health Bureau office and started operations for emergency response.
4.2 Overview of Damage to Medical Facilities Tables 1-3 show damage to medical facilities in Kobe due to the earthquake. The degree of damage changed every time the survey was conducted, and these tables show the statistics from the first survey conducted by the Heath Bureau.
Table 1. Damage to Medical Facilities due to the Kobe Earthquake (as of February 1, 1995) Hospitals
Category Total Complete collapse or burnout
Partial collapse or loss due to fire
Minor damage No damage
Higashinada-ku 5 1 0 4 0Nada-ku 8 0 2 6 0Chuo-ku 22 0 1 18 3Hyogo-ku 12 1 2 9 0Nagata-ku 12 2 1 8 1Suma-ku 12 0 1 7 4Kita-ku 18 0 0 15 3Tarumi-ku 7 0 1 6 0Nishi-ku 16 0 0 15 1
Kobe Total 112 (100%)
4(4%)
8(7%)
88(78%)
12(11%)
Figure 2. Organizational chart of Health Department of Disaster Management Headquarters
Responses at First-aid Stations
Medical Activities
Operation of first-aid stationsCar allocation, Quartering
Securing/delivery of medicine
Daily Hygiene
medicine
Ensuring public health
Coordination/PR (General
Medical Activities
(Affairs)
Operation of municipal-run hospitals
Grasping conditions of/supporting medical facilities
Daily Hygiene
hospitals
F l
Public healthEpidemic control
Public Health Activities
Funeral halls/Cemeteries
Visiting survey on/support to bedridden persons
Responses to Citizens
ters
Ht
Hea
dqua
r
76
Table 2. Damage to Medical Facilities due to the Kobe Earthquake (as of February 14, 1995) General Clinics
Category Total Complete collapse or burnout
Partial collapse or loss due to fire
Minor or no damage Unknown
Higashinada-ku 187 20 20 131 16Nada-ku 157 24 26 96 11Chuo-ku 266 22 25 140 79Hyogo-ku 162 16 19 92 35Nagata-ku 151 33 26 89 3Suma-ku 115 6 11 84 14Kita-ku 105 1 1 100 3Tarumi-ku 139 0 9 119 11Nishi-ku 81 0 0 75 6
Kobe Total 1,363 (100%)
122(9%)
137(10%)
926(68%)
178(13%)
Table 3. Damage to Medical Facilities due to the Kobe Earthquake (as of February 13, 1995) Dental Clinics
Category Total Serious damage (complete collapse or burnout, etc.)
Minor damage Unknown
Higashinada-ku 103 26 19 58Nada-ku 74 15 9 50Chuo-ku 182 50 54 78Hyogo-ku 79 23 22 34Nagata-ku 81 50 25 6Suma-ku 74 20 31 23Kita-ku 76 1 20 55Tarumi-ku 90 3 37 50Nishi-ku 48 0 12 36
Kobe Total 807 (100%)
188(23%)
229(28%)
390(49%)
4.3 Overview of Response4.3.1 Overview of Medical Care Provision System4.3.1.1 Relief Activities Since medical institutions within the city were damage and could not provide sufficient medical services for citizens, the Health Bureau performed medical relief activities such as “first-aid treatment to those who lost access to medical care” as stipulated in the Disaster Relief Act.
On the day of the earthquake, the public health centers formed individual relief squads to perform relief activities at earthquake-hit sites and local evacuation shelters according to the Health Bureau Disaster Management Plan. The relief squads formed by each public health center visited local evacuation shelters and other sites to provide first-aid treatment as well as to grasp the medical needs of the victims and the number of relief squad workers that would be required. Each public health center passed this information on to the headquarters. The headquarters analyzed all the information collected from the public health centers, determined the policy for relief activities, and performed the necessary actions, including the dispatch of relief squads.
4.3.1.2 Establishment and Maintenance of Relief System In the early stages when the number of relief squad workers was small, relief squads performed first-aid treatment by visiting local evacuation shelters. However, as the number of workers increased,
77
relief squads began setting up first-aid stations in local evacuation shelters, starting with the shelters with most evacuees. At this point, the basic policy of relief activities was established: (a) first-aid stations were set up in local evacuation shelters with more than 1,000 evacuees, (b) the staff of the first-aid stations visited neighboring smaller shelters, and (c) public health centers dispatched relief squads separately to shelters that the system of “fixed point (shelters with first-aid stations) and satellites (neighboring small shelters)” could not cover. Also, medical services in the first-aid stations were made available 24 hours/day as much as possible to alleviate worries about care in the event of nighttime emergencies.
On January 26, 1995, just ten days after the earthquake, a relief system of 116 permanent first-aid stations (33 of them were available 24 hours/day) and 31 relief squads was established. After that, efforts were made to maintain the system to ensure the continuous operation of the first-aid stations.
4.3.1.3 Termination of Relief System: Shift to Local Medical System First-aid stations are supposed to provide first-aid treatment when local medical institutions have suffered damage and are unable to provide sufficient medical services. As medical institutions were recovering, achieving a smooth transition from the relief system to the local medical system became an issue.
There was also concern that the first-aid stations, which provided medical care free of charge, could retard recovery of local medical institutions. Actually, it was noted that people became reluctant to visit medical institutions even though their local hospitals and clinics had recovered. Meanwhile, although the majority of patients treated at the first-aid stations in the early stages were those with severe problems requiring surgery and those with minor problems such as colds, a rise in the number of patients with chronic diseases soon became notable. This proved difficult for the first-aid stations, which did not have the ability to conduct the necessary tests to treat chronic diseases, and therefore treatment by personal doctors or other medical institutions was required. Smoothly and safely transferring all these patients back into the local medical system became a big challenge.
While maintaining its basic policy of responding to the needs of evacuees adequately, the Health Bureau coordinated extensively with local evacuation shelters, the local medical association, and relief squads and decided to reduce relief activities gradually and carry out the shift to the local medical system beginning on March 1. It also started to focus on public health care activities including health consultations.
Later on, the numbers of evacuees and medical treatment cases continued to decrease due to the move of evacuees into temporary housing and rise in the temperature. Meanwhile, the recovery of medical institutions was further promoted. In early March, it was decided that earthquake victims should be exempt from the required health insurance copayment so that they could receive medical services free of charge at medical institutions. Since the conditions were met for termination of the first-aid station services, as mentioned above, it was determined to terminate the operation of the first-aid stations at the end of March. Each public health center thoroughly discussed measures for continued medical care after closure of the first-aid stations with the administrators of the local evacuation shelters, the relief squads, and the medical association in the responsible ward and tried to make a smooth transition to the local medical system by securing visiting services by the member doctors of the local medical association and the permanent presence of nurses as well as reinforcing visiting consultations by public health nurses and other staff. Consequently, the relief system was completely finished at the end of April 1995, although the actual termination date varied by ward.

78
4.3.1.4 Treatment during Relief Activities It was difficult for the available medical staff to complete medical records in early stages. Therefore, described here is the transition of treated diseases as far as can be identified from the available medical records.
Overall, traumatic injuries and respiratory diseases were notable just after the earthquake. As the number of traumatic injuries decreased, respiratory diseases such as colds and flu accounted for a large percentage of the total diseases. Although there was fear of an influenza at that time, this fortunately did not occur.
As temperatures rose, the number of patients with respiratory diseases decreased, and instead patients with chronic diseases including cardiovascular diseases and those with neuropsychiatric disorders accounted for the majority of patients.
Regarding neuropsychiatric disorders, some evacuees complained of insomnia just after the earthquake due to the abrupt change in their environment from normal life to evacuation life or due to fear of aftershocks. Later on however, these cases were not seen often in the medical records. This is probably because psychiatric first-aid stations, which were established in six severely affected wards, started to provide mental health care from January 22, 1995. Under the situation where psychiatric hospitals and clinics were damaged, the psychiatric first-aid stations mainly responded to patients with a history of psychiatric disorders who redeveloped symptoms due to the change in their environment. However, even after psychiatric hospitals and clinics reopened, the psychiatric first-aid stations continued their activities to provide mental health care to those who had accumulated stress due to evacuation life without privacy, those who felt uncertain about their future, or those who suffered from posttraumatic stress disorder (PTSD). At the same time, psychiatrists were on staff in the general first-aid stations because the number of people who complained of mental distress increased in evacuations shelters. The prolonged evacuation was probably responsible for the increase in the number of patients with mental distress, accounting for about ten percent of the total number in mid-April.
Chronic diseases such as high blood pressure and cardiac disorders showed a notable increase as time passed. Following the decrease in acute diseases such as traumatic and respiratory diseases, the number of chronic diseases started to increase in mid-March, accounting for the largest share of the total treated diseases after mid-April. Since treatment of chronic diseases was beyond the ability of the first-aid stations, which could only provide first-aid treatment, patients with chronic diseases needed to consult with medical professionals at hospitals equipped with sufficient testing functions or their personal doctors.
4.3.1.5 Dentistry① Establishment of Dental First-Aid Stations Forced to live in local evacuation shelters due to disruption of lifeline services, the earthquake victims experienced both mental and physical fatigue and loss of appetite. In addition, little consideration was given to supplied meals in regard to nutritional value, temperature, texture, etc. Consequently, oral health problems became a big issue. Loss of dentures due to the earthquake or tooth pain from cavities and gum disease caused difficulty in eating meals, which led to nutritional deficiency and decreased physical strength. This sometimes caused the patients, especially the elderly, to suffer from severe diseases, such as infections. Responding to a severe shortage of dental services, the Health Bureau promptly decided to set up dental first-aid stations. On January 22, 1995, the Oral Health Care Center of the Hyogo Dental Association started to provide dental services as a dental first-aid station. Also, the then Higashinada
79
Branch Clinic of Kobe City Medical Center General Hospital started dental services on January 23. Since the recovery rate of dental clinics in the city exceeded 60 percent in mid-February, the dental relief activities were significantly reduced in March and were terminated at the end of that month, along with the termination of the relief system for general medical treatment.② Arrangement of Dental Relief Squads for Local Evacuation Shelters Since some people such as the bedridden were unable to visit the dental first-aid stations and there was a tendency for dental patients not to consult with doctors until their symptoms worsened, it was necessary to meet the hidden demand for dental treatment by dispatching the dental staff to local evacuation shelters to visit room by room. Therefore, dental relief squads visited local evacuation shelters to provide dental services.
4.3.1.6 Psychiatric First-aid Stations① Necessity of Psychiatric First-Aid Stations It has long been thought that psychiatric care is the last medical service to be provided in a time of disaster. Just after the earthquake however, the public health centers were consulted by administrators of local evacuation shelter concerning evacuees who appeared to be suffering from mental disorders or by patients with mental disorders who were unable to collect their medications before they were forced to evacuate their homes or who could not go to their hospitals to receive medicine due to disruption of transportation services. In order to (a) secure continuous treatment services for patients with mental disorders, (b) respond to sudden development or exacerbation of symptoms in patients staying in local evacuation shelters, and (c) provide mental health care services such as consultation with physicians from visiting local evacuation shelters, psychiatric first-aid stations were established in the public health centers of six severely affected wards.② Visits to Local Evacuation Shelters and Continuous Presence at Local Evacuation Shelters As of February 8, 1995, some psychiatric hospitals and clinics restarted their service in temporary facilities and transportation gradually recovered, which enabled more patients to visit their hospitals and clinics. Therefore, the percentage of patients who could not receive treatment due to the earthquake gradually became smaller. Meanwhile, the prolonged evacuation affected the mental health of the evacuees. Many evacuees accumulated stress due to group living without privacy and complained insomnia, frustration, etc. due to worries about their future. It was also necessary to address the problems of victims suffering from PTSD and volunteers who suffered burnout. Accordingly, the psychiatric relief activities gradually focused on mental health care rather than medical treatment for the patients with mental disorders. Since psychiatric staff was dispatched from other municipalities to support the first-aid stations in the public health centers, the psychiatric first-aid stations reinforced visit activities of relief squads to local evacuation shelters or had some staff members stationed in local evacuation shelters to respond to emergency cases during nighttime.③ Shift from Relief System to Local Medical System After local psychiatric hospitals and clinics reopened, patients, including those who received mental treatment for the first time at the first-aid stations, were referred to those local hospitals and clinics as much as possible. Consequently, the mental relief activities by the staff stationed in local evacuation shelters and by the relief squads were reduced or terminated, although the psychiatric first-aid stations in the public health centers remained open for some time. The activities of the staff stationed in local evacuation shelters were handed over to the psychiatric first-aid stations in the public health centers. Eventually, the psychiatric first-aid stations terminated their operations on April 30, 1995.

80
4.3.2 Overview of Public Health Care Activities4.3.2.1 Coordination and Support of Relief Activities Emergency medical services were extensive just after the earthquake. While the public health centers prioritized and made utmost efforts for the coordination and support of relief activities, they also performed activities to help prevent and promptly detect the occurrence of various diseases.
In visiting health consultation activities at local evacuation shelters, the staff of the public health centers helped to prevent the spread of infectious diseases such as flu and provided medical treatment guidance and health education for patients with chronic diseases and those with special needs. In the community, the staff visited bedridden people and elderly people living alone to confirm their safety and provided health guidance. For those who lived in temporary housing, the staff visited residences one by one for health guidance and provided comprehensive health consultation services. The public health centers made efforts to fully grasp the situation of every health problem as early as possible to implement appropriate countermeasures in order to improve and maintain the health of the earthquake victims.
4.3.2.2 Public Health Care Activities at Local Evacuation Shelters Public health care activities in early stages mainly focused on relief activities for the victims. The staff members were busy with examining the health conditions of the evacuees, responding to those who needed medical care and conducting measures against infectious diseases including influenza. Also, the abrupt environmental change caused evacuees various health problems: psychological trauma, grief, strain, anxiety, frustration, irregular living conditions, insufficient exercises, etc. Accordingly, in order to maintain the health of the evacuees and to support their lives, the public health centers arranged for (a) visiting health consultations, (b) measures against infectious diseases, (c) living guidance (d) medical treatment guidance for patients with chronic diseases, (e) health education, (f) information services, (g) nursing and care guidance, (h) coordination with related organizations, and (i) cooperation and coordination with public health nurses and nurses dispatched from other municipalities.
4.3.2.3 Public Health Care Activities in Communities Life during disruption of lifelines brought tremendous anxieties to families who cared the bedridden, persons with physical disorders, and infants at home. Around the end of January, when relief activities calmed down, the staff started to confirm the safety of special-needs population, such as patients with tuberculosis, patients with intractable diseases, and elderly persons living alone, based on the information public health nurses had collected before the earthquake, and began to visit them to identify concrete measures to support them.
4.3.2.4 Public Health Care Activities for Victims in Temporary Housing It was important to provide health services according to the living situations of the victims who moved from local evacuation shelters back to their homes or to temporary housing. There was a possibility that the victims would develop physical or mental disorders associated with yet another rapid change in their living environment. It was expected that demand for public health, medical care, and welfare services would be higher especially among the victims in temporary housing, which was preferentially allocated to the elderly and persons with disabilities. The number of persons that would newly require assistance was also expected to increase. Therefore, in order to grasp the conditions of special-needs populations in temporary housing, offer them appropriate assistance, and support their independence in daily life, the public health centers performed activities such as (a) survey on the health conditions of residents in public housing by visiting all the residences, (b) provision of public health information and coordination of public health, medical, and welfare services, (c) public health guidance for residents, (d) visiting persons in need of guidance, (e) health consultations for residents, (f)

81
promotion and support of the voluntary public health care activities organized by local residents.
It was necessary to help the communities support the elderly, who tended to be isolated in an unfamiliar environment or due to poor interpersonal relationships. At temporary housing with more than 100 residences, temporary-housing community centers were installed. In these centers, the public health centers held consultations, lectures, and festivals on public health to encourage residents to interact with each other and build a sense of unity.
4.3.3 Key Points for Health and Medical Care during Disasters ・ In case of large-scale disasters, medical institutions may also suffer damage and be unable to
provide sufficient medical services. Relief activities in terms of “first-aid treatment to those who lost access to medical care” are needed.
・ It is important to establish and maintain the relief system as well as to identify the appropriate time for shifting to the local medical system.
・ As conditions change every second, it is necessary to carry out activities while predicting possible future situations. Also, information exchange, close cooperation, and joint activities among related parties in the field of medical health, public health, and welfare are necessary in order to address victims’ complex health problems.
・ It is necessary to pay close attention to the privacy and human rights of the victims when conducting activities.
4.3.4 Evaluation There were worries about the occurrence of food poisoning and an infectious disease epidemic following this unprecedented large-scale disaster. However, such situations were prevented by the efforts of related parties and with the support of other various people. This point should never be forgotten.
The Health Bureau implemented various public health and medical measures to maintain the health of the earthquake victims through a trial and error process. Now that the system of health and medical care has significantly changed, it is clear that the procedures in some of the activities conducted during a disaster need to be revised while many are still useful.
It is necessary to continuously revise manuals and update the system of health and medical activities during disasters accordingly.
4.3.5 Conclusion Public health and medical activities during disasters are performed based on ordinary activities. It is important to keep this point in mind and pay attention to changes in daily public health and medical activities. Also, in order to collect information useful for relief activities in times of disaster, a close relationship with relative organizations through various activities such as liaison committees and confirm the individual roles of each organization.
Health and medical activities have changed significantly over the years since the earthquake. Although many of the activities performed at that time are still useful in current situations, some need to be reconsidered. Therefore, activities and training for disasters need to be carried out on a regular basis.
ReferencesKobe City Health Bureau (1995). Hanshin-Awaji Daishinsai: Kobeshi Saigaitaisaku Honbu Eiseibu no Kiroku
[The great hanshin-awaji earthquake: Records of the health department of the kobe city disaster management headquarters]. Kobe: Author.

82
Kobe City Public Health and Welfare Bureau Review Committee of Manual For Public Health Care Activities During Disasters (Ed.) (2005), Kobeshi Saigaiji Hoken Katudo Manual (Hokenshi Katudo Hen) [Kobe city manual for public health care activities during disasters (for public health nurses)]. Kobe: Kobe City Public Health and Welfare Bureau.
Nonomura, K. (2008, April). Hisai Eno Sonae: Haken Eno Sonae [Preparedness against disasters: Preparedness for dispatch]. The Japanese Journal for Public Health Nurses, 64, 340-345.
Nonomura, K. (2008, August). Hanshin-Awaji Daishinsai no Keiken kara [From the experiences of the great hanshin-awaji earthquake]. Monthly Community Health, 39, 46-51.
PART II
Recovery Plan
- Formulation & Implementation -
1. Formulation of Recovery Plan 2. Implementation of Recovery Plan


CHAPTER 1
Formulation of Recovery Plan

86
1 Difference between Relief and Recovery
In English, words such as restoration, reconstruction and recovery are often used interchangeably in the context of large-scale disasters, but there is a clear distinction between the Japanese word for the recovery stage, fukko, and that for the restoration stage, fukkyu. Both words are made up of two Chinese characters, and the first character means “to return to the former state.” The second character determines the difference between the two words. The second character in the word fukkyu means either “old” or “former” serving to emphasize the idea of restoring something back to its previous level. On the other hand, the second character in the first word means “to create something.” Therefore, the word fukko has the implied meaning of both “recovery” and “creating something new.”
A clear distinction between these two Japanese words is necessary because it is stipulated in the “Act on National Treasury Share of Expenses for Recovery Projects for Public Civil Engineering Facilities Damaged Due to Disasters” that the range of the national government’s support should be in principle in “restoring to the original state.” However, whether recovery can be accomplished by merely restoring everything to the original state depends on the disaster. If a scale of a disaster is small and damage is due to mainly poor design or external forces, it is sufficient just to restore the damaged objects to their original state. On the other hand, if the scale is huge, things cannot be done in that simple manner.
The word “disaster” implies damage affecting a society when a natural or man-made hazard severely affects that society, but the effects of damage vary, depending on the vulnerability of the society in question. A bigger hazard usually results in greater negative impact on the various vulnerabilities in that society. As a result, damage can become wide-scale and complex. In this case, it is difficult to attain recovery simply by restoring a damaged building or a damaged infrastructure back to its former state. The whole community needs to be reborn as a disaster-resistant community to achieve recovery.
The Kobe City Recovery Plan clearly defined the goal of community recovery as “not only to restore the city to its former state but also to further develop it into a safer, more comfortable, more vital, and more attractive place by making the best of what Kobe experienced and learned from the recent big earthquake.” It has also stipulated that it is “important to proceed with reconstruction so that it contributes to the promotion of the “Urban Resort City.”
Whether the national government should provide support up to the relief level or the recovery level is an essential issue which has not been clarified yet. During the recovery process in Kobe, some projects which exceeded the relief level and should have been classified as “recovery projects” were flexibly implemented to a certain extent.
2 Legal Basis for Recovery Plan in Japan
Until the Kobe Earthquake, there were stipulations of support for relief from disasters as described above, but no laws or regulations concerning recovery existed (Hayashi, 2001). The Disaster Countermeasures Basic Act enacted in 1961 is the basis for the current disaster management system in Japan; however, this law does not include any concept of recovery from disaster, and the word “recovery plan” never appears in the document. After the earthquake, many cities and prefectures have formulated plans for recovery following a big earthquake, but they did this as their own administrative plans without any legal basis.
Around February 1995 when Kobe and other cities in the affected area started formulating recovery plans, the issue of recovery was discussed at the national level to determine the positioning of recovery
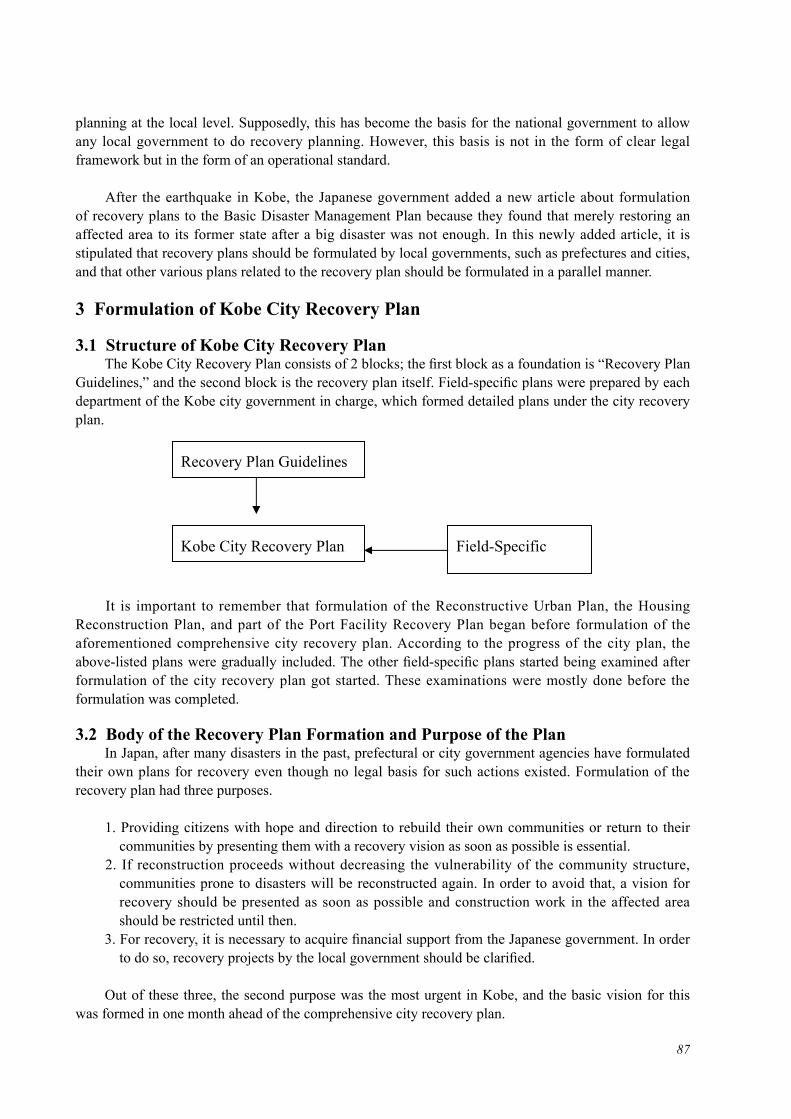
87
planning at the local level. Supposedly, this has become the basis for the national government to allow any local government to do recovery planning. However, this basis is not in the form of clear legal framework but in the form of an operational standard.
After the earthquake in Kobe, the Japanese government added a new article about formulation of recovery plans to the Basic Disaster Management Plan because they found that merely restoring an affected area to its former state after a big disaster was not enough. In this newly added article, it is stipulated that recovery plans should be formulated by local governments, such as prefectures and cities, and that other various plans related to the recovery plan should be formulated in a parallel manner.
3 Formulation of Kobe City Recovery Plan
3.1 Structure of Kobe City Recovery Plan The Kobe City Recovery Plan consists of 2 blocks; the first block as a foundation is “Recovery Plan Guidelines,” and the second block is the recovery plan itself. Field-specific plans were prepared by each department of the Kobe city government in charge, which formed detailed plans under the city recovery plan.
It is important to remember that formulation of the Reconstructive Urban Plan, the Housing Reconstruction Plan, and part of the Port Facility Recovery Plan began before formulation of the aforementioned comprehensive city recovery plan. According to the progress of the city plan, the above-listed plans were gradually included. The other field-specific plans started being examined after formulation of the city recovery plan got started. These examinations were mostly done before the formulation was completed.
3.2 Body of the Recovery Plan Formation and Purpose of the Plan In Japan, after many disasters in the past, prefectural or city government agencies have formulated their own plans for recovery even though no legal basis for such actions existed. Formulation of the recovery plan had three purposes.
1. Providing citizens with hope and direction to rebuild their own communities or return to their communities by presenting them with a recovery vision as soon as possible is essential.
2. If reconstruction proceeds without decreasing the vulnerability of the community structure, communities prone to disasters will be reconstructed again. In order to avoid that, a vision for recovery should be presented as soon as possible and construction work in the affected area should be restricted until then.
3. For recovery, it is necessary to acquire financial support from the Japanese government. In order to do so, recovery projects by the local government should be clarified.
Out of these three, the second purpose was the most urgent in Kobe, and the basic vision for this was formed in one month ahead of the comprehensive city recovery plan.
3
an operational standard.
After the earthquake in Kobe, the Japanese government added a new article about
formulation of recovery plans to the Basic Disaster Management Plan because they found
that merely restoring an affected area to its former state after a big disaster was not enough.
In this newly added article, it is stipulated that recovery plans should be formulated by
local governments, such as prefectures and cities, and that other various plans related to the
recovery plan should be formulated in a parallel manner.
3 Formulation of Kobe City Recovery Plan
3.1 Structure of Kobe City Recovery Plan
The Kobe City Recovery Plan consists of 2 blocks; the first block as a foundation is
“Recovery Plan Guidelines,” and the second block is the recovery plan itself. Field-specific
plans were prepared by each department of the Kobe city government in charge, which
formed detailed plans under the city recovery plan.
It is important to remember that formulation of the Reconstructive Urban Plan, the
Housing Reconstruction Plan, and part of the Port Facility Recovery Plan began before
formulation of the aforementioned comprehensive city recovery plan. According to the
progress of the city plan, the above-listed plans were gradually included. The other
field-specific plans started being examined after formulation of the city recovery plan got
started. These examinations were mostly done before the formulation was completed.
Recovery Plan Guidelines
Kobe City Recovery Plan Field-Specific
88
There is a clear distinction between the Kobe City Recovery Plan and previous recovery plans in Japan. In the past, many recovery plans formulated in this country addressed only physical recovery aspects such as infrastructure, housing and urban reconstruction. However, the Kobe plan covered not only physical recovery aspects but also a wide range of activities aimed at Kobe citizens’ life recovery.
The groups responsible for previous plans were all local governments. Any recovery plan after the Kobe Earthquake was in principle formulated by cities and towns. The Hyogo Prefectural Government compiled its municipalities’ plans to formulate the Hyogo Prefecture Recovery Plan. Among the 10 affected cities and 10 towns in Hyogo, Kobe is the only ordinance-designated city, so Kobe has more self-governing capacity. Therefore, Kobe could uniquely make recovery plans for nearly all situations.
In the Basic Disaster Management Plan formulated after the earthquake, the contents of recovery plans were stipulated by the national government for the first time. The plan clearly states that local governments should formulate recovery plans: “local governments, with giving consideration to damage in affected areas, local characteristics, and intention of related public facilities management organizations, shall consider whether they will aim at restoring the affected areas to the former state at the earliest possible time or at making a planned recovery including solving mid- and long-term issues such as disaster-resistant community development before preparing their basic vision for disaster relief and recovery. If required, the recovery plan shall be formulated according to the aforementioned vision.” It is notable that the clear distinction between restoration and recovery is described in the above basic plan and local governments should choose in the early phase that whether to aim at restoring the affected area to the former state or to choose the road to recovery, which means reconstructing the area to create a safer community. In case of reconstruction following a large-scale disaster, simply restoring the affected area to the former state is usually impossible, and in most cases, the affected areas need to aim at recovery. In this context, the description in the Basic Disaster Management Plan is epoch-making in light of the past attitude of the national government, which in the past stuck to a restoration-only policy.
3.3 The Outline of the Formulation Process of the Recovery Plan On January 26, 1995, nine days after the earthquake hit Kobe, “the Secretariat of the Earthquake Recovery Headquarters,” an organization to promote recovery was set up. This bureau started formulating the recovery plan right away. The deadline for completion of the plan was set as the end of June 1995. In order to do the formulation work effectively within this short period, a 2-stage plan was adopted; “the Kobe City Recovery Plan Guidelines” was formulated in the 1st stage, and then the recovery plan itself was formulated in the 2nd stage.
The Kobe City Committee for Recovery Planning, which consisted of 1 administrative officer from the Kobe city government (an executive director from the Earthquake Recovery Headquarters) and 27 academic experts, was set up to formulate the guidelines. The committee members were selected from a wide range of specialties including economics, law, social welfare, social psychology, disaster management, engineering, and ecology. The initial meeting of this committee was held on February 7, 1995. Later on, the members of the committee were divided into 3 subcommittees: (a) Urban Infrastructure Subcommittee, (b) Citizens’ Affairs Subcommittee, and (c) Safe City Standards Subcommittee. Meetings either at the committee level or the subcommittee level were then held a total of 14 times within a short period of time. On March 27, 1995, the result was finally announced as the “Kobe City Recovery Plan Guidelines.”
Following the formulation of the guidelines, in order to formulate a more concrete recovery plan, the Kobe City Council for Recovery Planning was formed, which consisted of experts involved in the committee, 13 newly added experts, members from the Kobe City Assembly, civil organizations,

89
the economic circle and the labor circle, representatives from prefectural and national governmental organizations: 100 members in total. The 1st meeting of the council was held on April 22, 1995. Based on the discussion, 3 subcommittees, “Citizens’ affairs,” “Urban revitalization,” and “Safe city,” were set up and subcommittee meetings were also held in between the council meetings to determine the contents of the recovery plan.
Each bureau of the Kobe city government that was in charge of each field of recovery started proceeding with their recovery planning in accordance with the Kobe City Recovery Plan’s formulation. Specifically, the Urban Planning Bureau and Housing Bureau started studying recovery planning and announced the “Basic Vision for Urgent Development of the Disaster-Hit Urban Areas and Housing” on January 30. Through this vision, the target areas for recovery were clearly indicated, and this allowed the city government to impose building restrictions in the areas where it would be problematic if the former physical downtown areas were reconstructed in an unplanned manner. Before any unplanned reconstruction got started, it was urgently needed to impose laws and regulations for building restrictions. In addition to that, in order to cope with the massive amount of rubble, the city government had to bring the Kobe Port redevelopment plan forward to be able to use the surface water of the sea for reclaiming with the rubble from destroyed structures for redevelopment, and the port planning project was revised on January 30, 1995. In this way, as some recovery plans in individual fields were examined ahead of the city recovery plan, the recovery plans for individual fields such as “Urban planning,” “Provision of housing,” “Recovery of Kobe Port,” “Vision of culture,” “Welfare,” “Recovery of Dowa district,” “Economic recovery,” “Disaster management council,” “Sand erosion control,” “Fire fighting,” “Waterworks,” “High-speed railways (City subway),” and “Education rebirth” were discussed and piled up before and after the city’s recovery planning. All results were taken into consideration when the city recovery plan was formulated. The areas not mentioned above were simply not documented, but all areas in need were discussed and examined. For example, in the field of sewage systems, the city government examined “disaster-resistant sewage systems” in parallel with the city’s recovery planning; at the same time, the city reviewed the long-term sewage system development plan, and its review was completed by January 1996, six months after the city recovery plan was formulated.
Regarding the Kobe City Recovery Plan, the chairperson of the Kobe City Council for Recovery Planning submitted the final report to the mayor of Kobe on June 26, 1995. Based on the report, the Kobe city government finalized and approved the city recovery plan on June 30, around 5 months after formulation of the plan was started.
3.4 Outline of Kobe City Recovery Plan3.4.1 Framework of the Guidelines The framework of the guidelines formed in the 1st phase was as follows. 1. The number one priority went to Kobe’s recovery and regeneration as an advanced disaster-
resistant model city based on the experience and lessons learned from the earthquake. 2. The target for recovery was 10 years ahead, 2005. 3. Recovery goals were set as “security,” “vitality,” “appeal,” and “working together,” and projects
and measures were undertaken to meet each goal. 4. A vision of safe and secure city development (safe city standards) was incorporated in the
original guidelines for disaster-resistant community development. 5. The city government analyzed the structure of Kobe, and proposed a distinct recovery plan for
each area.

90
3.4.2 Structure of the Guidelines Basic principles Basic principles of recovery Goals of community development Safe and secure city development vision (safe city standards) Recovery plan by goal Recover “citizens’ life” Recover “urban industry” Recover “appeal of Kobe” Strengthen “disaster-response capacity” Promote “collaborative community development” Urban reconstruction plan 1. Urban structure Structure of urban space Port development Transportation network development Lifeline network development 2. Disaster-preventive city infrastructure/disaster-preventive living zone Disaster-preventive city infrastructure Disaster-preventive living zone
3.4.3 Basic Principles of Recovery “City,” “Nature,” and “Human” were considered the basic principles of recovery. 1. Urban Convenience Well-Balanced with Safety Redundancy The recent earthquake revealed a vulnerable aspect of city life with its many modern
conveniences. To address this issue, Kobe will aim at creating a city not only with its conveniences but also with more space and redundancy from the safety aspect.
2. Awareness of Both Benefits and Hazards of Nature Surrounded by the sea and mountains, Kobe enjoys many benefits from its natural
environment, but at the same time the city has been through a series of natural disasters. Therefore, the city needs to consider both the benefits and the hazards of nature when planning city development. The government must consider the city’s capacity to create a city that ensures sustainable development.
3. Human-to-Human Contact and Interchange Even immediately after the earthquake, citizens stayed calm and helped each other to
overcome any difficulty they faced. At the same time, the earthquake generated such a big circle of volunteer support that even the term “First Year of Volunteerism” was created.
In 1999, when the city was still in the middle of the recovery process, a comprehensive assessment was conducted. Through this the city government learned the keywords citizens used for recovery, and the following words were emphasized: “self-sustainability and solidarity,” “collaboration,” “human-to-human ties,” “importance of activities in normalcy,” and “importance of human beings.” In a city-wide workshop held in July 2003, four years after the 1st comprehensive assessment, 232 out of the 801 participating citizens responded to the question “What does recovery from the quake mean to you?” with the answer “We found out that ties to community and to our own family, mutual help, and volunteerism are important.” In this way, citizens lost many things due to the earthquake, but they found an irreplaceably precious asset: the importance of people’s kindness. Therefore, citizens have engraved the importance of human life in their minds and enhanced their human-to-human contact and interaction.

91
3.4.4 Goals of the Community Development for Recovery The earthquake damage affected all aspects of civic life. Therefore, the comprehensive goals of recovery were set to include all areas of civic life including food, clothing, and shelter. 1. Security: Create a community where people can live, work, learn, relax, and get together with a
sense of safety and security 2. Vitality: Create a community full of vitality and creativity 3. Appeal: Create a community with its own unique features and appeal 4. Working Together: Create a community with shared roles and collaboration of citizens,
government, and businesses
3.4.5 Safe and Secure City Development Vision In the recovery plan guidelines, the Safe and Secure City Development Vision (Safe City Standards) should be (a) Kobe’s administrative guidelines to proceed with safe and secure city development and (b) the action guidelines for citizens and business sectors to achieve safe and secure city development together with Kobe. The following 5 points were emphasized. 1. Flexible response to various disasters 2. Coordination between normalcy and disaster period 3. Utilization of water and greenery 4. Formation of self-sustainable living zones and mutual coordination 5. Sharing roles among citizens, businesses, and city government Based on the above viewpoints, three phases are considered to be the framework of safe standards. 1. Secure safety and security in residential areas (disaster-preventive living zone) 2. Secure basic framework for a safe city (disaster-preventive urban infrastructure) 3. Secure a system to enhance disaster management capacity (disaster management)
3.4.6 Basic Themes of Recovery Based on the above points indicated in the recovery plan guidelines, the city government proceeded with formulating the recovery plan itself; in that process, the following 11 items were set as the basic themes of recovery. 1. Conduct early relief work for citizens’ lives and urban infrastructure towards full-fledged
recovery 2. Create a disaster-resistant city by making the best use of lessens learned from the earthquake 3. Construct a welfare society where all citizens can live in a safe and secure manner 4. Revive Kobe’s culture rich in diversity and openness
11
comprehensive goals of recovery were set to include all areas of civic life including food,
clothing, and shelter.
1. Security: Create a community where people can live, work, learn, relax, and get
together with a sense of safety and security
2. Vitality: Create a community full of vitality and creativity
3. Appeal: Create a community with its own unique features and appeal
4. Working Together: Create a community with shared roles and collaboration of
citizens, government, and businesses
3.4.5 Safe and Secure City Development Vision
In the recovery plan guidelines, the Safe and Secure City Development Vision (Safe
City Standards) should be (a) Kobe’s administrative guidelines to proceed with safe and
secure city development and (b) the action guidelines for citizens and business sectors to
achieve safe and secure city development together with Kobe.
The following 5 points were emphasized.
1. Flexible response to various disasters
2. Coordination between normalcy and disaster period
3. Utilization of water and greenery
Working Together
Security
Appeal
Vitality

92
5. Create an eco-friendly self-sustainable city 6. Revive Kobe to be a major international city leading the world in 21st century 7. Early recovery and reconstruction of Kobe Port as to function as a major hub in Asia 8. Realize an information network society 9. Promote community development through collaboration 10. Promote volunteer activities and partnerships in wider areas 11. Provide disaster-prevention and recovery education to contribute to a better world
3.5 Factors in the Formulation Process of Kobe City Recovery Plan The following important points were indicated by analyzing and studying each factor in the formulation process.
3.5.1 Organization for Plan Formulation “Kobe City Earthquake Recovery Headquarters” consisted of all the relevant bureaus of the city government; however, the way to proceed with their work was that the secretariat of the headquarters, consisting of a few members, coordinated with the related bureaus to formulate the plan. In addition to the members, the members of the organization who were revising the Kobe City Master Plan worked on the same floor of the city office building so these 10 members also assisted in formulating the recovery plan. However, the total number of members involved in the planning was only 17. The alternative way of planning is to gather all the relevant bureaus to form a cross-boundary organization; however, if it is intended to formulate a cross-cutting plan in a large-scale administrative body, the aforementioned small-size group is more appropriate.
3.5.2 Deadline and Time Span of its Formulation Some argued that recovery requires a long time so it is better to spend more for recovery planning. Is that really so? In the recovery process, the government must not only address long-term recovery issues but must also implement both relief and recovery activities at the same time. Moreover, some of the relief activities conducted in the relief phase have a great impact on recovery. Once things start moving, it is unbelievably difficult to change direction. Therefore, steering recovery in the right direction in the very early stages is a key factor for successful completion of all the recovery activities including those in the relief phase.
It is clear that it takes time to disseminate a recovery plan and to get citizens to participate in the process, although there is a necessity to formulate the recovery plan without delay. This is even more difficult in the case of a large-scale disaster where many citizens need to stay in evacuation shelters. The dilemma between planning in a short time and acquiring citizens’ understanding and participation is a common problem when formulating any recovery plan. One example of a way to solve this problem can be found in the process used to formulate the Reconstructive Urban Planning in Kobe. The planning was done quite swiftly in order to avoid reconstructing vulnerable city structures; however, at that time, the city only formulated the framework of the recovery plan. The specific contents of the community recovery plan were then formulated by gaining a consensus with citizens by various measures such as dispatching a community development expert. In this way, citizens could realize their community recovery plan prepared by themselves.
Before describing how the deadline for the city recovery plan was decided, it is important to know the objectives of formulating the recovery plan: (a) to steer the direction of recovery in the form of a plan and (b) to put together all the recovery projects. The deadline is related to (b), which means this corresponded to the date by which the recovery projects should be formed. Therefore, the deadline was

93
set as the end of June 1995. Recovery projects require a massive amount of money, making funds from the national government essential. In order to acquire funds from the government, these projects should be budgeted as national government projects. The deadline, the end of June, was set in accordance with the national budget working schedule.
The implementation period for recovery projects under the plan was set at 10 years, since it was treated the same as the mid-term plan under the Kobe City Master Plan. In the reconstruction committee at the national level, various proposals were raised under the premise that local governments shall prepare 10-year recovery plans. Recovery plans contain a wide range of issues such as life recovery and economic recovery, and it takes time to solve such issues. In fact, according to the consecutive reports covering the results of study in the recovery period following the Kobe Earthquake, 10 years has passed since the number of citizens saying the local economy is no longer affected by the earthquake exceeded 50%. In this manner, it is appropriate to choose 10 years as the implementation period for a plan covering a wide range of issues.
3.5.3 The Formulation Procedure For recovery in Kobe, two-stage planning was adopted. At first, the Kobe City Committee for Recovery Planning, consisting mainly of experts, formed the guidelines at the end of March 1995. After that, as of March, the Kobe City Council for Recovery Planning consisting of 100 members was set up; they used the guidelines as the table of contents to form the contents of the recovery plan according to the direction indicated by the guidelines. By using that methodology, the city could determine the direction of recovery from a higher-level and comprehensive viewpoint.
It turned out to be a good idea to adopt two-stage planning, because those bureaus that were in turmoil since they were struggling with emergency relief work right after the earthquake could catch up with the recovery plan formulation in the end. This means that those bureaus in charge of lifeline- and infrastructure-related matters directly related to civic life such as waterworks, sewage systems, roads, and railways were busy with emergency relief work and could not secure enough manpower to examine their part in the recovery plan in the early stage. However, while the committee proceeded with examining the high-level direction for the guidelines in the initial stage, these bureaus could secure the required manpower for the recovery plan and could even catch up with where the other bureaus were in terms of the formulation work.
3.5.4 Considering the Recovery Plan from High-Level Viewpoints with Expertise In the phase of formulating the guidelines, a wide range of experts discussed future direction during meetings of the Kobe City Committee for Recovery Planning. In the committee, only one member, Executive Director from the Earthquake Recovery Headquarters, was from the administrative side; the rest of them, 27 in total, were all academic experts. In terms of a recovery plan, it is of great significance to indicate direction. In order to do so, it is important to have realistic and down-to-earth discussions away from where minor interests are conflicting. It should also be considered that a large-scale disaster can destroy all aspects of civil life. This means that a wide range of expertise is required to tackle it. In this context, recovery can be considered an “integrated science.” Therefore, in the early stage of the recovery process, it is indispensable that high-level experts with various backgrounds as well as experts with good knowledge of locality have discussions on this issue.
By taking the above into consideration, around half of the committee were members to review and examine the Kobe City Master Plan, which was done right before the earthquake; the rest were experts who newly joined the committee.

94
3.5.5 Stakeholders’ Participation A recovery plan needs to cover a vast range of fields in the case of recovering from a large-scale disaster. The fields include not only infrastructure but all aspects of civic life such as housing, community development, economy, culture, and disaster management. To achieve recovery, the stakeholders are the key to making it successful. They are citizens, business owners, retailers, labor circles, city assembly members, and higher administrative bodies such as prefectural and national governments.
After the guidelines were formulated, Kobe requested various representatives of the stakeholders to participate in the Kobe City Council for Recovery Planning for putting together the city recovery plan. In total, 100 members gathered to examine the plan. The breakdown of members included (a) 40 academic experts, (b) 1 city assembly member from each of the 6 factions, (c) 43 representatives of various private organizations including residents, economic circles, and labor circles, (d) 8 officers from national and prefectural government-related organizations, and (e) 3 Kobe Vice Mayors. Officers from the Kobe city government also attended each meeting held by the council.
Aside from examination of the city recovery plan, each field set up an individual committee to go through their field in the recovery plan. They had intensive discussions on each area of expertise, and the results were then brought back to the council. In this way, the stakeholders’ opinions and comments were consolidated in the planning. Money-wise, the most important stakeholders for acquiring the required recovery funding should be national governmental organizations, which play a key role in budgeting recovery expenses. In terms of these stakeholders, the representatives from these organizations were included in the 100 members of the council; at the same time, in accordance with a unique Japanese vertically-segmented administrative system, each ministry and agency and its related bureau in Kobe’s city government had very intensive discussions to cope with the budget issues.
3.5.6 Citizens’ Participation There were several forms of citizens’ participation in the formulation of the recovery plan. Many of the 100 members of the council were representatives from citizens and business sectors. The city government also asked for suggestions from 1000 city advisors and members of ward-based community development conferences involved in activities in each ward of Kobe (which means representatives of citizens at the ward level from various fields participated in the process). Moreover, the government also sought suggestions from citizens on the whole via various communication measures such as mail, fax, and e-mail. As a result, the number of suggestions received from citizens was 345 in total. The breakdown was as follows: 247 by mail, 60 by fax, and 38 by e-mail. In terms of the plan formulation in the each field, the government asked opinions of the relevant people and made efforts to reflect their opinions in the city recovery plan as much as possible. Time for plan formulation was limited, but the city made the utmost effort to complete a comprehensive plan in the time available.
Additionally, one of the individual fields’ projects called the Reconstructive Urban Planning Project formed its framework swiftly within 2 months; however, in terms of community development planning, local community development organizations played a major role in discussing community development together with experts dispatched from administrative bodies or the Kobe city government. In this way, citizens themselves formulated the community development proposals taking an ample amount of time.
3.5.7 Indication of Focal Points In the Kobe City Recovery Plan, around 1000 projects were listed. However, some of the members of the council raised the concern that it was not clear which projects should be focused on. Some also pointed out that it was important to seek for synergy among the listed projects by combining certain ones in an effective way. Since they found it better to show the focal points of recovery, 17 projects were
95
selected as symbol projects.
There are of course other ways to show priorities of each project. For example, in the Unified New Orleans Plan, the priority level of each project was evaluated on a three-grade scale. However, in Japan, recovery projects are usually finalized by intensive discussion between local governments and national ministries and agencies, and it is difficult for local governments to prioritize a vast number of projects and announce the results accordingly in a timely manner. In fact, in the case of Kobe, the national government made a move to put together focal recovery projects as “Special Projects” in the middle of the recovery planning, and Kobe started to gather information accordingly; however, this move didn’t last long. The reason for this is not yet fully understood, but it is assumed that it was difficult for the related ministries and agencies to coordinate, demonstrating the difficulty in clarifying the focal points among a vast number of projects within a short time. Kobe used the expression Symbolic Projects because the city tried to show the relative importance among the projects and tried to soften the wording of some difficult expressions. The following is a list of the Symbolic Projects. 1. Reconstruction plan for citizen housing 2. Creation of a safe and comfortable city area Reconstructive land readjustment projects and urban redevelopment projects 3. Creation of communities with welfare services for the 21st century Various measures in light of the transition to an aging society with a declining birthrate 4. Security networks 5. A plan for a new city center in eastern Kobe (HAT Kobe) 6. Development of Kobe Business Start-up Zone Realized as Kobe Medical Industry Development Zone on Port Island 7. China/Asia exchange zone Specifically developed as “Exchange with Shanghai/Chang Jiang” 8. Rebuilding of Kobe Port as a major hub for Asia for the 21st century 9. Promotion of international and modern culture in Kobe Developed as Kobe Biennale and Design City Kobe Project 10. Creation of multiple transportation networks 11. Development of a base for next-generation telecommunication research (promoting the KIMEC
plan) 12. Development of a local disaster prevention base Improving seismic resistance of schools and public buildings 13. Creation of a city with water and greenery 14. Development of a city center symbolic zone connected to the sea Comprehensive development of Kobe center axis 15. Development of lifeline utility systems that stand strong against disasters 16. Inheritance of the experience of disasters (disaster subculture) 17. Promotion of the construction of Museum of Disaster Science and a Complex of 20th Century
Museums
3.5.8 Potential Factor 1: Planning Capability The aforementioned parts are all visible in the recovery process, and analysis can be done accordingly. Aside from that, there are other important potential factors. One of them is planning capability.
When the nerve centers of a megacity with a population of 1.5 million were destroyed and recovery issues were spread out in a wide range, high planning capacity was required in order to understand the

96
extent of the damage, to put many issues in order, and to formulate a recovery plan swiftly. For the Kobe City Recovery Plan, work to revise the Kobe City Master Plan, which was ongoing until just before the earthquake, made an enormous contribution to the formulation work. The initial version of the Master Plan was formulated from 1965; the second version was formulated in 1976; and the third was done in 1986. Three years prior to the earthquake, Kobe started preparation for formulating the 4th Kobe City Master Plan; most of the formulation work was done before the earthquake and Kobe was ready to announce the 4th version to the public. Thanks to the accumulative efforts for the plan, the up-to-date situations and issues Kobe faced at that time were fully reviewed, and the future direction that Kobe should take was then examined. The results were shared among all officers in the Kobe city government. In addition to that, the following factors were found to be effective for planning: (a) personnel engaged in the planning was secured, (b) close partnership among the secretariat and each bureau was nurtured, (c) half of the council members were people involved in the Master Plan formulation and understood the situation in Kobe precisely, and (d) citizens were already participating, indicating their interest in Kobe’s future vision. Thus, the experience of revising the master plan was a very important step for nurturing the capability to formulate the recovery plan. As mayor Sasayama emphasized in an interview, past recovery experiences including recovery from following World War II were very useful, and past recovery experiences (recovery from the war and large-scale water disasters in the past) have become an important factor in planning capability.
3.5.9 Potential Factor 2: Leadership and Passion Another important factor is passion, especially the leader’s passion and leadership ability. In the committee to formulate the Kobe City Recovery Plan, many members managed to come to the meeting site to have dedicated discussions, although few means of transportation were available. In the kick-off meeting of the Kobe City Committee for Recovery Planning, the first agenda item was only to show the basic data on damage from the earthquake. With no scenario available, the meeting proceeded as the committee members tried to find their way in the dark. In the process of discussion, the basic vision of Kobe’s recovery was examined. In the series of meetings, many new approaches for recovery were proposed and actualized.
This passion is tested a lot when the leader is in the middle of the recovery process. To clarify this, two symbolic examples can be compared. In New Orleans, the mayor took the lead to formulate the “Bring New Orleans Back” Plan right after Hurricane Katrina hit, but when the interim report was announced to the public, the plan met with so much opposition from citizens that the mayor abandoned the plan. As a result, recovery planning was in confusion and delayed; in the end, nearly 2 years had passed since the disaster when the recovery plan was formally finalized (Orshansky, Johnson, Horne & Nee, 2008). On the other hand, Kobe was tangled with a hastily formulated Recovery Plan; however, then mayor Sasayama, proceeded without any hesitation. It was his firm belief that anything required to ensure security and safety in the community should be done. It is of course the city government did not push forward against any opposition, but the city hastily decided the framework of the plan which should be done urgently, and individual community plans were left to citizens’ proposals as indicated before.
3.5.10 Potential Factor 3: Relations of Mutual Trust There is one more important potential factor: relations of mutual trust. These relations emerged in various occasions. One of the cases was the relation of trust among administrative organizations.
In the case of the recovery in Kobe, many of the financial resources relied on the national government’s budget allocation. Therefore, recovery projects, aside from any relief work for the damaged infrastructure stipulated in “Act on National Treasury Share of Expenses for Recovery Projects for Public Civil Engineering Facilities Damaged Due to Disasters,” proceeded on the basis of the
97
existing subsidized project implementation methodology, modified for the recovery projects following the earthquake. For these projects, a series of negotiations were made with national ministries and agencies; once all involved parties came to an agreement, these projects could be implemented.
As to trust from between citizens or between citizens and administration, the Reconstructive Urban Planning Project in Kobe is a good example. There was great friction between citizens and the administration in the beginning; however, Kobe held community explanatory sessions several hundred times, and both sides made efforts to make the situation better. The result was increased mutual trust. Whether mutual trust among the people involved in recovery is firmly built up or not has a great impact on the swift formulation of a recovery plan and its implementation afterwards. In the end, the aforementioned relations are the result of accumulative mutual trust in communities prior to the earthquake.
4 Evaluation
The analysis described above was that for the recovery plan formulation process. Kobe could succeed in completing the formulation plan by the deadline, although a massive amount of work was completed within such a short period. This was due largely to the passions of all the people involved in the planning process. These passions were supported and sustained by people’s planning capabilities as well as relationships of mutual trust.
If you need to formulate a recovery plan following a large-scale earthquake, how would you go about it? Based on the above, two points stand out based on the lessons learned from the experience in Kobe after the earthquake.
As mentioned, formulation of the city recovery plan was preceded by some recovery plans formulated for specific fields and prepared by specific bureaus. One thing to note is that the preceding work done by bureaus should be incorporated into the total plan as soon as possible. In order to do so, it is effective to determine the organization for the recovery process in advance, like the one indicated in the Tokyo Local Disaster Prevention Plan revised after the Kobe Earthquake. If the city government has a determined organization, the recovery headquarters can be formed on the day of the disaster or the following day, and all the recovery issues can be examined in a coordinated way from the initial stage.
It is also necessary to devise a way to optimize the participation of citizens. Kobe made the utmost effort to absorb citizens’ opinions as much as possible under very chaotic circumstances. However, there were limitations. Formulation of a recovery plan requires speed, and this is an unavoidable dilemma faced by any formulating body. However, it is still necessary to make the utmost effort to increase opportunities to absorb citizens’ opinions as much as possible. There were technical issues at the time of the earthquake; however, technology has further developed, and nowadays there are various methods available using ICT technology so that there is now a well-established infrastructural basis for more active citizens’ participation. For example, in the case of UNOP formulation in New Orleans, a multi-point video conference was held via the internet in order for evacuees scattered nationwide to join the formulation process (Orshansky, Johnson, Horne & Nee, 2008). In this way, if a method using new technologies is established in advance, it is possible to formulate the recovery system more swiftly to formulate a plan.
5 Conclusion
The aforementioned explanation is a summary of the formulation process of the recovery plan

98
initiated in the chaotic situation right after the earthquake. There are many ways to evaluate this; however, the most important factors among the above 10 listed factors should be planning capability, leadership, and relations of mutual trust. These factors are also the result of accumulated daily efforts, not something you can acquire suddenly. This is associated with coordination between normalcy and disaster period, which was raised as one of the important points for safe and secure city development, and this factor also actively contributes to recovery planning. After a disaster occurs, it is difficult for people to do more than what they usually do in normal times. The driving force and resources of capability to cope with emergencies are the accumulation of people’s usual activities such as knowing and studying the structure of their own communities, history, and challenges. In addition, if the government and citizens build up reliable relationships and intergovernmental communications are well maintained in administrative bodies in normal time, these factors will lead to relations of mutual trust in the case of an emergency. Finally, leadership ability and passion held by each leader in each field and each phase will become the driving force to bring about the final goal: the completion of recovery.
The experience in the formulation of the Kobe City Recovery Plan revealed many factors applicable for swift and smooth recovery planning in other cities after future disasters.
ReferencesHayashi, H. (2001). Long-term Recovery Process and Their Planning from Devastating Earthquake Disasters.
Journal of Geography, 110(6). Olshansky, R. B., Johnson, L. A., Horne, J., Nee, B. (2008). Planning for the rebuilding of New Orleans. Journal of
the American Planning Association, 74(3)

CHAPTER 2
Implementation of Recovery Plan

100
1 Management of Recovery Plan
The formulated action plan will be meaningful only when the visions described in the plan are actualized. Therefore, to proceed steadily with recovery in the affected areas, it is important to continually evaluate the recovery progress and to review and revise the measures in order to make the plan more feasible.
Based on this management concept, Kobe assessed the recovery progress and reviewed and then revised the plan based on the results. At the same time, the city set up a council of citizens, the business sector and experts from various fields to manage the recovery process and progress of the Kobe City Recovery Plan.
1.1 PDCA Cycle In reality, it is difficult to foresee the economic situation 10 years after a disaster when planning a recovery process under the situation where the social situation is changing drastically. Moreover, in the recovery process for a large-scale disaster, issues to be tackled are changing as time goes by. Starting from emergency response to search and rescue and then relief followed by full-fledged recovery, the focal point shifts from recovery in structural aspects to enrichment in nonstructural aspects.
To flexibly handle the change in issues due to the impact of socioeconomic situations, the progress of recovery or citizens’ awareness, the Kobe city government decided to adopt the PDCA management principle when implementing the Kobe City Recovery Plan. The PDCA management cycle is one tool used to help implement projects smoothly. This cycle adopts the following concepts for project implementation and management: plan it; do it; check it; act upon the results; and repeat these 4 processes continuously.
Based on the PDCA cycle concept, Kobe monitored the progress of each recovery project and reviewed and revised the plan when required. In fiscal year 1999, the last year of the first half (5 years) of the recovery plan, the city conducted a Comprehensive Recovery Assessment. This was to assess what had been done in the recovery process to date by checking the progress of each project and examining effective measures for the next 5 years in the areas of daily-life recovery, safe and secure city development, housing and urban reconstruction, and economic/port recovery. By taking the proposals
Figure 1. Progress of the implementation of the Kobe City Recovery Plan
Implementation of Recovery Plan
3
Progress of the implementation of the Kobe City Recovery Plan
Occurrence of the Kobe Earthquake19951995
19991999
20002000
20032003
20052005 New New Vision (Vision (postpost--Recovery plan)Recovery plan)
(Do)
(plan)
(Do)
Kobe City Recovery PlanPromotion Program
Decided on in October 2000Target year: 2005
The 10th yearThe 10th yearComprehensive assessmentComprehensive assessment
(check)
Kobe City Recovery PlanDecided on in June 1995
Target year: 2005
The 5th yearThe 5th yearComprehensive assessmentComprehensive assessment
(check)
(Act/plan)
(Act/plan)
1.2 System and Organization for Management
The Kobe city government set up the “Kobe City Recovery Promotion Council” in
1996 to examine comprehensive progress control, necessary measures, issues concerning
implementation of the recovery plan, and smooth and effective management. The objectives
of this council were (1) to fully understand the progress of the recovery plan, (2) to clarify the
remaining issues, (3) to examine potential measures to solve the issues, and (4) to submit
proposals to the mayor of Kobe. For the council, members were selected based on the idea
that opinions from a wide range of fields should be absorbed; as a result, 19 academic experts
and 14 representatives divided among private organizations and citizens in light of promoting
collaboration with citizens (33 in total) were selected. For 18 months after the council was set
up, the members discussed a wide range of topics to prepare proposals for the mayor.
As time went by after the earthquake, many members voiced opinions that they should
handle not only urgent issues for recovery but future-oriented issues in light of the coming of
the 21st century and long-term structural issues Kobe had long before the earthquake. To cope
with this, the council was disbanded at their 6th meeting. In its place, the “Kobe City
Recovery and Rejuvenation Promotion Council” was established in June 1998 to handle

101
based on the results into consideration, Kobe formulated the Kobe City Recovery Plan Promotion Program where the recovery measures to be dealt with in the latter term of the recovery process were indicated.
In fiscal year 2003, one year before the final year of recovery plan implementation, a second comprehensive assessment of recovery based on civic life, urban activities, housing and community development, and safe and secure city was conducted to examine Kobe Now (the current situation in Kobe) which had been rebuilt through the recovery process. The results were presented to the mayor of Kobe.
On the basis of the results, in fiscal year 2005, after the recovery plan implementation period was over, “New Vision (mid-term plan)” was formulated (target year: 2010). This aims at finding solutions for issues raised in the recovery process and at being the guidelines for future Kobe development through utilizing the experiences and lessons learned from the earthquake and the recovery process. In this way, after recovery plan implementation, the remaining recovery issues continued to be tackled within the framework of the city government’s general measures and policies.
1.2 System and Organization for Management The Kobe city government set up the Kobe City Recovery Promotion Council in 1996 to examine comprehensive progress control, necessary measures, issues concerning implementation of the recovery plan, and smooth and effective management. The objectives of this council were (1) to fully understand the progress of the recovery plan, (2) to clarify the remaining issues, (3) to examine potential measures to solve the issues, and (4) to submit proposals to the mayor of Kobe. For the council, members were selected based on the idea that opinions from a wide range of fields should be absorbed; as a result, 19 academic experts and 14 representatives divided among private organizations and citizens in light of promoting collaboration with citizens (33 in total) were selected. For 18 months after the council was set up, the members discussed a wide range of topics to prepare proposals for the mayor.
As time went by after the earthquake, many members voiced opinions that they should handle not only urgent issues for recovery but future-oriented issues in light of the coming of the 21st century and long-term structural issues Kobe had long before the earthquake. To cope with this, the council was disbanded at their 6th meeting. In its place, the Kobe City Recovery and Rejuvenation Promotion Council was established in June 1998 to handle long-term issues as well as recovery issues. Similar to the previous council, the city government chose the members from among academic experts, representatives of private organizations, and citizens.
As mentioned before, the Kobe City Recovery and Rejuvenation Promotion Council conducted comprehensive recovery assessments in fiscal year 1999 and 2003. The purpose of these assessments was to absorb opinions from various citizens to achieve a so-called grassroots assessment. The measures taken were workshops for Kobe citizens, questionnaires for 10,000 citizens, interviews with concerned people, and so on. Especially, the workshop methodology was found to be an effective measure to get opinions and proposals from all the participants. This methodology does not take a unilateral knowledge transmission style like a lecture but takes a meeting style featuring bilateral learning and creative thinking; this means that in the workshop participants actively engaged in discussions voluntarily to learn from each other and create something together through group synergy.
In the 2nd comprehensive recovery assessment, the council solicited public comments to absorb citizens’ opinions for their interim report and proposal to the mayor. By taking all opinions into consideration, the council finalized the proposal.

102
1.3 Evaluation Index for Recovery1.3.1 Background In the comprehensive recovery assessment conducted by the Hyogo prefectural government, it was indicated that there were no numerical targets in their recovery plan, and strong desire to reach the targets was beginning to wane. There were other observations that it was difficult to monitor the recovery plan with policy evaluation methodology to assess the outcomes, because there were no numerical targets in the plan.
One reason clear numerical targets could not be set in the recovery plan is that, although it is rather easy to quantify the progress of structural development, there were no established evaluation methods for nonstructural measures, let alone benchmarks. Under the circumstances, the Kobe city government received the proposal from the Kobe City Recovery and Rejuvenation Council saying that Kobe should create an easy-to-understand index with citizens to share community development targets with them and to evaluate the achievements with them for implementing the “Kobe City Recovery Plan Promotion Program” (formulated in October 2000) through the collaboration between citizens and the government. This triggered the city government to adopt the administrative evaluation methodology to formulate the outcome index to measure the recovery targets and achievements. Kobe is probably the first administrative body to use the above index to monitor the progress of a recovery plan. The outcome index was named Citizen-Happiness Index.
1.3.2 Contents The Citizen-Happiness Index covers 16 prioritized measures called the 16-point Plan of Action under the “Kobe City Recovery Plan Promotion Program.” The index consists of 45 individual indices with following characteristics.
① Represented the targets to reached through partnerships and the comprehensive results of the partnerships
② Could be represented numerically③ Could be compared with the index of other cities④ Represented changes in the daily lives of the citizens⑤ Reflected the citizens’ awareness of the creation of communities as well as the needs of the
citizens
Figure 2. Example of the citizens' happiness indexKobe City strives to be a city where volunteers, non-profit organizations (NPOs), and non-governmental organizations (NGOs) play an active role.
Implementation of Recovery Plan
6
Example of the citizens’ happiness index
●● Kobe City strives to be a city where volunteers, non-profit organizations (NPOs), and non-governmental organizations (NGOs) play an active role.
IndexValue at the
determination(Time)
Target value to be reached through
partnerships(Time)
14.5%(FY2001)
20%(FY2005)
Proportion of the population who are involved in volunteer
activities, NPOs or NGOs
Number of organizations that participate in the campaign called “Volunteers for the
creation of a beautiful city full of trees and flowers”
Individuals: 2,202Organizations: 1,088
(End of FY2000)
Individuals: 2,900Organizations: 1,700
(FY2005)
Organizations: 700 (FY2005)
Number of individuals and organizations that are
registered at the Volunteer Information Center or the
Volunteer Center in each ward
Organizations: 588 (End of FY2001)
1.3.3 Creation and Utilization of Citizen-Happiness Index
Citizens, stakeholders and the city government officers cooperated to select the
individual indices. The selection processes were (a) index draft creation workshop by citizens
(127 participants) and workshop with experts and academic experts (47 participants), (b)
questionnaire survey for citizens to evaluate the index draft (637 replies), and then (c)
citizens’ workshop to narrow down the draft index to produce the draft bill (41 participants).
In this way, the creation procedure itself is a form of cooperation: discussing matters to make
decisions on an equal level between citizens and the government.
As for how to set the target value to be reached through partnerships, the following
methods were adopted. If there were goal values for the above target values in the various
Kobe plans or national plans, these values were adopted for the index as well; if not, the
pre-earthquake values were adopted in case the values were related to the earthquake
recovery, while values based on trend estimation from historic data development were
adopted in some cases. In addition, the indices and the target values were reviewed and
revised according to changes in social and economic conditions.
The progress of each individual index in the Citizen-Happiness Index was uploaded
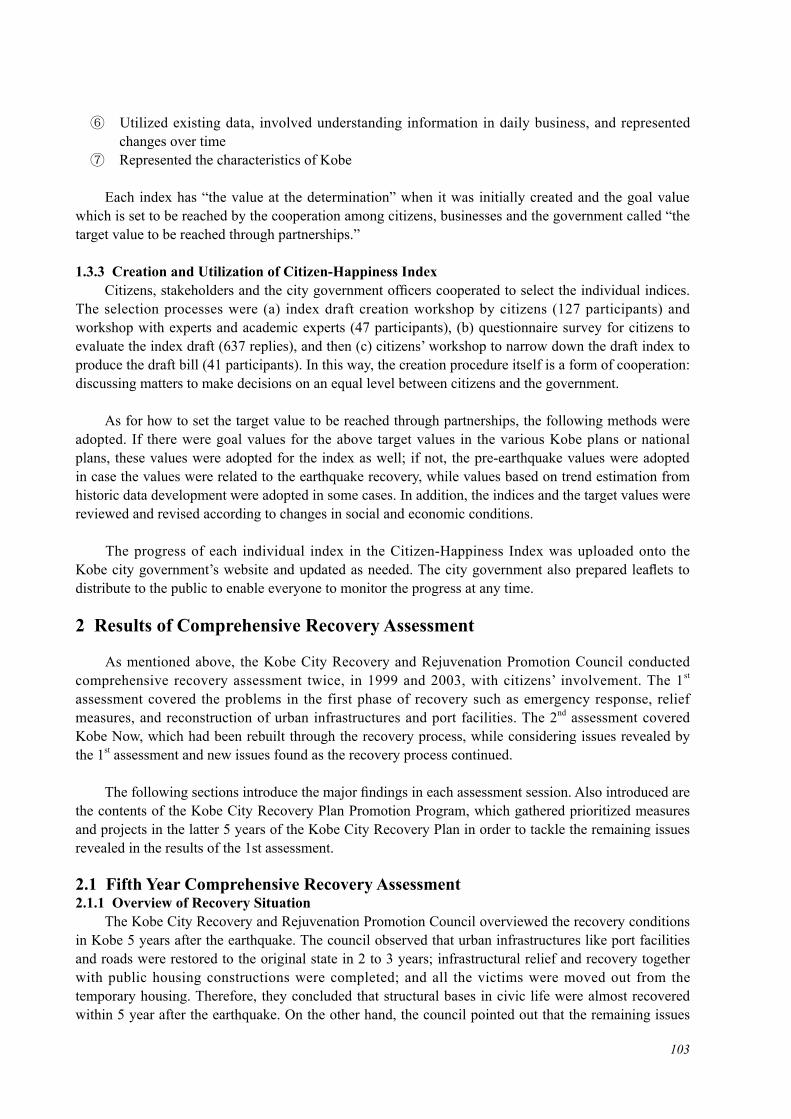
103
⑥ Utilized existing data, involved understanding information in daily business, and represented changes over time
⑦ Represented the characteristics of Kobe
Each index has “the value at the determination” when it was initially created and the goal value which is set to be reached by the cooperation among citizens, businesses and the government called “the target value to be reached through partnerships.”
1.3.3 Creation and Utilization of Citizen-Happiness Index Citizens, stakeholders and the city government officers cooperated to select the individual indices. The selection processes were (a) index draft creation workshop by citizens (127 participants) and workshop with experts and academic experts (47 participants), (b) questionnaire survey for citizens to evaluate the index draft (637 replies), and then (c) citizens’ workshop to narrow down the draft index to produce the draft bill (41 participants). In this way, the creation procedure itself is a form of cooperation: discussing matters to make decisions on an equal level between citizens and the government.
As for how to set the target value to be reached through partnerships, the following methods were adopted. If there were goal values for the above target values in the various Kobe plans or national plans, these values were adopted for the index as well; if not, the pre-earthquake values were adopted in case the values were related to the earthquake recovery, while values based on trend estimation from historic data development were adopted in some cases. In addition, the indices and the target values were reviewed and revised according to changes in social and economic conditions.
The progress of each individual index in the Citizen-Happiness Index was uploaded onto the Kobe city government’s website and updated as needed. The city government also prepared leaflets to distribute to the public to enable everyone to monitor the progress at any time.
2 Results of Comprehensive Recovery Assessment
As mentioned above, the Kobe City Recovery and Rejuvenation Promotion Council conducted comprehensive recovery assessment twice, in 1999 and 2003, with citizens’ involvement. The 1st assessment covered the problems in the first phase of recovery such as emergency response, relief measures, and reconstruction of urban infrastructures and port facilities. The 2nd assessment covered Kobe Now, which had been rebuilt through the recovery process, while considering issues revealed by the 1st assessment and new issues found as the recovery process continued.
The following sections introduce the major findings in each assessment session. Also introduced are the contents of the Kobe City Recovery Plan Promotion Program, which gathered prioritized measures and projects in the latter 5 years of the Kobe City Recovery Plan in order to tackle the remaining issues revealed in the results of the 1st assessment.
2.1 Fifth Year Comprehensive Recovery Assessment2.1.1 Overview of Recovery Situation The Kobe City Recovery and Rejuvenation Promotion Council overviewed the recovery conditions in Kobe 5 years after the earthquake. The council observed that urban infrastructures like port facilities and roads were restored to the original state in 2 to 3 years; infrastructural relief and recovery together with public housing constructions were completed; and all the victims were moved out from the temporary housing. Therefore, they concluded that structural bases in civic life were almost recovered within 5 year after the earthquake. On the other hand, the council pointed out that the remaining issues

104
for the latter half of the recovery plan should be (1) citizens’ life recovery, (2) economic recovery, and (3) safe and secure housing and community development.
The citizens’ efforts for the recovery at that time were highly evaluated, because even under the severe economic conditions and with their anxieties in life, each of the citizens had a strong spirit focused on complete recovery on their own and made the utmost effort to do so, starting from calm attitudes and mutual help right after the earthquake through the early resuming of their businesses to their community development activities.
2.1.2 Seven Critical Elements of Life Recovery Life recovery has a very large scope and is ambiguous. Therefore, the assessment of life recovery as one of the recovery projects started with clarifying the definition. Twelve workshops were conducted in Kobe to find out the following: (1) what does life recovery mean to earthquake victims? and (2) what are the factors that citizens feel are helpful to the promotion of life recovery? In the workshops, a total of 269 victims and supporters participated and filled out 1,623 opinion cards. After sorting and categorizing these cards, it was clarified that a real sense of life recovery consists of 7 elements.
The following are the 7 elements in descending order based on the number of opinions submitted: (a) housing, (b) social ties, (c) community rebuilding, (d) physical and mental health, (e) preparedness, (f) economy, livelihood, and economic and financial situations, and (g) relationship to government.
In terms of housing, many homes were lost in the earthquake, and victims indicated the importance of efforts to provide housing, a daily necessity for life recovery.
All of the city's residents identified social ties as an important component in life recovery. When a disaster strikes, existing personal relationships are dissolved, and people are forced to create new personal relationships from scratch. This change in personal relationships is a major source of stress. Victims were reminded of the importance of social ties as they continued to face unfamiliar living situations.
Although the public infrastructure was restored within about two to three years after the earthquake, the overall recovery of communities seemed to still be a work in progress.
Physical and mental health are important preconditions for moving forward in life, and even five years after the earthquake, victims were still feeling a heavy toll on their mental health.
Those who lived through the earthquake developed an interest in earthquake preparedness as a result of their desire to avoid the recurrence of such a horrible experience.
In the fifth year after the earthquake, the prolonged stagnation of economic recovery and the wave of economic recession nationwide put additional pressure on victims who were already experiencing financial hardship as a result of the earthquake.
As for citizens’ relationship to government, services often failed to meet the victims' expectations. This forced them to learn how to interact with their government.
2.1.3 Self-Governance and Community Solidarity Out of the 7 critical elements of life recovery, 2 elements, housing and social ties, covered more than 50%. Especially notable was the fact that the percentage related to social ties stuck out in

105
comparison with the other elements.
Focusing on this fact, academic experts and experts in administration verified the cause and effect relationships and other factors in terms of social ties. As a result, the opinions of creating New Kobe through these cause and effect relationships were divided into 3 types: self-sustainable individuals, mutual help (coexistence/ solidarity), and establishment of attitude in daily social ties.
An individual takes actions by him/herself first. This means you do first and don’t wait for somebody do something for you. Another aspect is the sense of a main player in community development. Self-sustainability often starts with self help.
Even though self-governance and self-sustainability is important, a single individual has limited capability. To compensate for the limited capability of each individual and enhance mutual benefits of all individuals, coexistence and solidarity are the answers. What is important to recognize is that there are many people who have lost their assets in various ways and have difficulties making ends meet in case of earthquake disasters.
However, mutual help has its limits, and it does not mean an individual can get any kind of help. Regardless of the situation, individuals should not feel that they are special and that others should do everything for them.
In the 5th year comprehensive assessment, the key social ties for individual life recovery were integrated into 2 values and norms: self-governance and community solidarity.
This self-governance and community solidarity was shown in a multidisciplinary way beyond the field of life recovery. Specifically speaking, community development promotion with self-governance and community solidarity was shown in the field of safe and secure city, housing and community development with self-governance and community solidarity in the field of housing and urban reconstruction, and self-sustainable recovery and community economy in economic and port recovery.
Figure 3. Stories Told in the 1999 Grassroots Workshop on Social Ties
Implementation of Recovery Plan
10
kind of help. Regardless of the situation, individuals should not feel that they are special and
that others should do everything for them.
In the 5th year comprehensive assessment, the key social ties for individual life
recovery were integrated into 2 values and norms: self-governance and community solidarity.
How to balance rights among individual, minority, majority, & organization? Started volunteer
work
Started community activities
Individual Initiatives
Grass-root community development/manage-ment activated
Awareness of the importance of grass-root community development/mangmnt
Self-governance
Local Autonomy
Citizen as Stakeholder in Community Development/Management
Started with Self-Help
Self-Governance
Tolerance for those who are not active in community building
Compassion
Not everyone is strong
Over dependence on others’ help
Be thankful for helpers
But, others’ help is limited
Do not take others’ help for granted
Take responsibility for one’s self
CommunitySolidarity
Utilization of community plaza
Management Know-how
Neighborhood Association Activities
Community activities form social support networks
Roles, Current Problems, & Future of Township Management Organizations
Lack of communication among new residents
Issues associated with voluntary activity promotion
Public morals deteriorated
Improve Public Morals
Extreme self-centeredness cannot be tolerated
Local Community Relationship Initiatives in Everyday Life
Stories Told in the 1999 Grassroots Workshop on Social TiesCreate
New Kobe (Jul. to Aug. 1999)
This self-governance and community solidarity was shown in a multidisciplinary way
beyond the field of life recovery. Specifically speaking, community development promotion
with self-governance and community solidarity was shown in the field of safe and secure city,
housing and community development with self-governance and community solidarity in the
field of housing and urban reconstruction, and self-governing recovery and community
economy in economic and port recovery.
2.2 Formulation of Kobe City Recovery Plan Promotion Program
In order to deal with the remaining issues for the latter half of the recovery plan, which
were revealed by the comprehensive recovery assessment conducted in 1999, Kobe
formulated the Kobe City Recovery Plan Promotion Program in 2000. Formulation was based
on the correlation diagram for measures and policies created according to the results of the
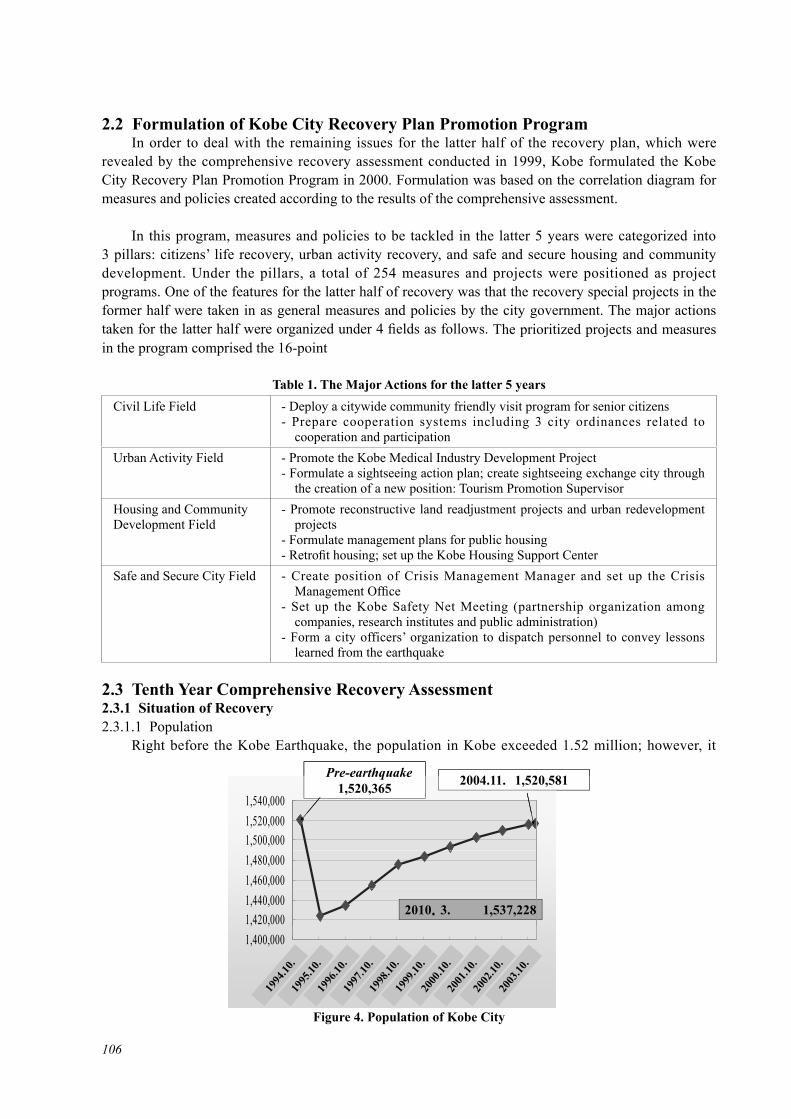
106
2.2 Formulation of Kobe City Recovery Plan Promotion Program In order to deal with the remaining issues for the latter half of the recovery plan, which were revealed by the comprehensive recovery assessment conducted in 1999, Kobe formulated the Kobe City Recovery Plan Promotion Program in 2000. Formulation was based on the correlation diagram for measures and policies created according to the results of the comprehensive assessment.
In this program, measures and policies to be tackled in the latter 5 years were categorized into 3 pillars: citizens’ life recovery, urban activity recovery, and safe and secure housing and community development. Under the pillars, a total of 254 measures and projects were positioned as project programs. One of the features for the latter half of recovery was that the recovery special projects in the former half were taken in as general measures and policies by the city government. The major actions taken for the latter half were organized under 4 fields as follows. The prioritized projects and measures in the program comprised the 16-point
Table 1. The Major Actions for the latter 5 yearsCivil Life Field - Deploy a citywide community friendly visit program for senior citizens
- Prepare cooperation systems including 3 city ordinances related to cooperation and participation
Urban Activity Field - Promote the Kobe Medical Industry Development Project- Formulate a sightseeing action plan; create sightseeing exchange city through
the creation of a new position: Tourism Promotion SupervisorHousing and Community Development Field
- Promote reconstructive land readjustment projects and urban redevelopment projects
- Formulate management plans for public housing - Retrofit housing; set up the Kobe Housing Support Center
Safe and Secure City Field - Create position of Crisis Management Manager and set up the Crisis Management Office
- Set up the Kobe Safety Net Meeting (partnership organization among companies, research institutes and public administration)
- Form a city officers’ organization to dispatch personnel to convey lessons learned from the earthquake
2.3 Tenth Year Comprehensive Recovery Assessment2.3.1 Situation of Recovery2.3.1.1 Population Right before the Kobe Earthquake, the population in Kobe exceeded 1.52 million; however, it
Figure 4. Population of Kobe City
Pre-earthquake• Population of Kobe City1,540,000
2004.11. 1,520,581Pre earthquake1,520,365
1,500,0001,520,000
1,460,0001,480,000
1,420,0001,440,000
2010 3. 1,537,228
1,400,000, ,

107
dropped sharply to 1.42 million due to the earthquake, according to the national census conducted on October 1, 1995. After that, in accordance with the progress of recovery, the population gradually recovered; in November 2004 right before the 10th anniversary, it finally exceeded the number recorded just before the earthquake. The population then continued to increase.
2.3.1.2 Recovery of Civic Life According to the results of a questionnaire on economic and financial situations sent to 10,000 Kobe citizens in 2003, 48.0% answered that their situations had gotten worse since the earthquake; 39.3% answered that situations were the same as before; and 6.7% of the respondents said the situations had improved.
Among these answers, what should be focused on was why respondents said the situations had gotten worse. Only 15.1% said the reason was the effects of the earthquake; 57.6% said it was due to the effects of economic conditions such as recession; and 22.4% said it was because of personal reasons such as sickness or retirement. The results show that, even for those who felt their economic and financial conditions had gotten worse since the earthquake, the effect of nation-wide issues such as recession or personal reasons was greater than that of the earthquake, which was unique to Kobe.
Through the results of the question regarding the comparison of economic and financial situations and the one regarding the reason, the percentage of the respondents whose economic and financial conditions got worse due to the effects of the earthquake was calculated to be 7.2% of the total respondents.
2.3.1.3 Economic Recovery Although business houses in Kobe made the utmost effort to recovery from the earthquake, they kept facing tough situations for economic recovery. Even today, production volume and sales turnover have reached only 80% of those in the pre-earthquake period; as a result, it is said that Kobe’s economy has been stuck at 80% recovery, while structural aspects and population have virtually recovered.
Due to the extremely severe damage caused by the earthquake, even at the timing of the 10th anniversary, there were remaining effects on Kobe’s economy, but the current economic conditions are generated based on the accumulative effects not only from the earthquake but from the national economic climate and industrial structural reasons.
Figure 5. Questionnaire survey targeted at 10,000 citizens
Implementation of Recovery Plan
13
According to the results of a questionnaire on economic and financial situations sent to
10,000 Kobe citizens in 2003, 48.0% answered that their situations had gotten worse since
the earthquake; 39.3% answered that situations were the same as before; and 6.7% of the
respondents said the situations had improved.
Among these answers, what should be focused on was why respondents said the
situations had gotten worse. Only 15.1% said the reason was the effects of the earthquake”;
57.6% said it was due to the effects of economic conditions such as recession; and 22.4% said
it was because of personal reasons such as sickness or retirement. The results show that, even
for those who felt their economic and financial conditions had gotten worse since the
earthquake, the effect of nation-wide issues such as recession or personal reasons was greater
than that of the earthquake, which was unique to Kobe.
Through the results of the question regarding the comparison of economic and financial
situations and the one regarding the reason, the percentage of the respondents whose
economic and financial conditions got worse due to the effects of the earthquake was
calculated to be 7.2% of the total respondents.
Questionnaire survey targeted at 10,000 citizens
• Effects of the earthquake The same
39.3%On the decline
48.0%
Don’t know6.1%
Improved6.7%
What is the living standard of your household like compared with that before the Great Hanshin-Awaji Earthquake occurred (on January 17, 1995)?
(Question to those who answered “On the decline” to the above question)What is the main reason for the decline in the living standard of your household?
4.9
15.1
22.4
57.6
0% 20% 40% 60% 80%
その他
震災による影響
病気や退職など個人的な影響
不況など景気による影響Effects of the recession
Other reasons
Personal reasons such as illness and retirement
Effects of the earthquake
2.3.1.3 Economic Recovery

108
Questionnaire circulated by the Hanshin-Awaji Economic Revitalization Organization (June 2003) - 76.1% of responding business houses said their business conditions had not recovered (sales
turnover decreased) to those in the pre-earthquake period. - 59.7% said this was due to effects of the earthquake. - 4.1% said the biggest reason was effects of the earthquake; 72.3% blamed the effects of current
economic trends; and 22.1% cited the effects of industrial structural changes.
2.3.1.4 Housing Reconstruction and Community Recovery About 82,000 housing structures were lost due to the earthquake, but construction on just under 220,000 houses was started during the post-earthquake period. As a result, the townscape in Kobe has changed drastically.
Housing structures have changed in quality. The number of tenements and wooden communal houses has decreased and that of apartment buildings (non-wooden communal houses) has increased. Both the percentages of households that are over the minimum housing standards and over the reference housing standards have risen. From these facts, the overall housing standards have increased to a large extent.
The following map shows the building renewal condition by area. In the pre-earthquake period, more than 75% of the housing and building structures were built before 1981 when the new building codes in which new earthquake-resistant standards were adopted; however, in 2003, the number of areas where a higher portion of structures built after 1981 increased significantly.
2.3.2 Comprehensive Recovery Assessment of Kobe Now, Remaining Issues, and New Challenges In the comprehensive assessment conducted in 2003, the city government examined to what extent Kobe Now and the earthquake experience were correlated. This was based on the results of the 10,000 questionnaires, economic-related data, etc. Through the examination, it was found that the correlation between Kobe Now and the earthquake was gradually waning under the prolonged recession and socioeconomic changes in the post-earthquake period.
Figure 6. Proportion of construction built before the new earthquake resistance standards were established

109
Kobe Now (from the 2003 Comprehensive Recovery Assessment) - Measures should be continuously taken to tackle those issues still being effected by the earthquake. - At the point when 8 years had passed since the earthquake, the national and structural issues had
bigger effects than the earthquake itself. - Some achievements from new efforts and projects in recovery were observed. - New challenges emerged as time passed following the earthquake.
In the comprehensive assessment, the direction of these efforts and projects was grouped by administrative field; among them the following were raised as major remaining issues. 1. As for civic life, set up a permanent local friendly visitation program and take care of mental
health issues. 2. As for urban activities, continue the disaster recovery loan system and extend the Kobe Enterprise
Zone Ordinance. 3. As for housing and community development, finalize the urban development projects for
reconstruction in earthquake stricken areas. 4. As for a safe and secure city, increase seismic-resistant capacities for public facilities and housing
structures.
2.3.3 Lessons Learned from the Earthquake and the Recovery Process The earthquake not only caused severe damage in Kobe but also had great impact on people’s sense of value, their way of life, and their attitude. It is important to confirm what was learned from the earthquake and the recovery process to be utilized for community development in light of considering the future direction of Kobe.
In the comprehensive recovery assessment, the lessons were divided into two categories: those lessons learned from the earthquake and those lessons learned from the recovery process. These lessons were reconfirmed as lessons looking towards the 10th anniversary of the earthquake.
2.3.3.1 Lessons Learned from the Earthquake – Disaster Management Includes a Disaster Reduction Concept
According to the Kobe City Recovery and Rejuvenation Promotion Council, all the lessons learned from the earthquake can be integrated into one phrase: the concept of disaster reduction should be included in disaster management.
In the earthquake, many urban infrastructures like housing and port facilities were destroyed, and it was found that those structures that were supposed to protect human lives or their assets were not perfectly safe or secure. From that fact, the lessons have shown that consideration of disaster management should be taken on the assumption that a disaster will occur. Thus, they said it was important that the concept of disaster reduction, protecting what should be protected such as life while minimizing damage, should be included in future disaster countermeasures.
Based on the above idea, enhancement of the capacity of safe and secure city development while utilizing the lessons learned from disasters through the total disaster management process, starting from preventive measures such as damage prevention and damage mitigation to the post-disaster countermeasures like emergency response and relief and recovery is required.

110
Specifically, the following 3 lessons were indicated.
- The earthquake reminded people of the severity of nature. Natural disasters will definitely occur in the future.
- Local community protects people’s lives. Things should start from the place closest to the people. - Actions people do not take in their daily lives cannot be undertaken in a disaster situation.
Community development activities should be continuously ongoing in normal times.
When the Kobe Earthquake hit, citizens’ houses became lethal weapons, and many victims were crushed to death. In this context, it was important for individuals or households to increase seismic-resistance capacity and safety of their own homes, which are closest to them. At the same time, the importance of local communities and regular community development activities was recognized because many of the victims trapped under the debris of destroyed houses were rescued by their neighbors.
These are perfect examples of protect one’s life by oneself; protect local safety by local community. Based on this lesson, the concept of disaster-safe welfare community has been established by almost all elementary school districts in Kobe. These disaster-safe welfare communities have various functions: members walk around in their community to find hazardous spots and safety resources, and members together with children, PTA members, and other voluntary organizations collaborate together to prepare community hazard maps. Moreover, some junior high school students have organized disaster reduction junior teams, and some women have formed citizen fire extinguishing teams. In this way, new efforts and actions have been taken to deepen people’s social ties and to expand areas of peoples’ activities and community involvement.
2.3.3.2 Lessons Learned from the Recovery Process – from Self-Governance and Community Solidarity Following the earthquake, citizens recognized the importance of human-to-human ties, and this was recognized again during the recovery process. Each individual is self-sustainable by one’s own responsibility, and one’s presence should be positioned as a local community member; this recognition was enhanced during the recovery process. However, each individual’s capability has its limit, and each individual needs to give help and consideration to others. This also creates an opportunity to generate human-to-human solidarity.
In the recovery process, unique individuals got together, and these social ties generated a new type of uniqueness. In this way, it was revealed that human-to-human solidarity generates self-governance.
Thus, self-governance and community solidarity are not unilateral factors but are enhanced by each other due to synergistic effects. As the lesson learned from the recovery process and that should be utilized in the future, that should be creation of a civic society where self-sustainable citizens are unified through solidarity.
Specifically, the following 5 lessons were emphasized.
- The meaning of recovery changes as time goes by. - Recovery should be tackled flexibly through interrelated recovery fields. - Community development is accomplished or enhanced by individual self-governing activities. - Community development can be advanced by daily collaboration and individual participation. - Recovery means moving towards a new system.
During the recovery process, while the issues were changing with time, citizens, businesses, and the city government provided their own wisdom to learn from each other to try to find solutions for the

111
challenges they still faced. After the earthquake, things started from scratch. Under that circumstances, the city government firmly believes that Kobe proposed and created various new systems. In terms of administrative policies, the best examples are community friendly visit programs and Kobe enterprise zone. In addition to that, new civic activities have emerged; one example is that citizens in a community bear costs to provide social services to solve its local problems. Regarding the creation of the future Kobe, it is essential to utilize the lessons learned: the importance of proposing and creating new systems and attitudes to implement them.
2.3.3.3 Basic Attitude towards Creation of the Future Kobe by Utilizing Lessons – Collaborative Community Development
In Kobe, since the earthquake changed people’s sense of value and way of life, the attitude of self-governance and community solidarity was enhanced, which led to new efforts and actions in the recovery process. The point is that these efforts and actions have been advanced by people’s power and community’s power. It is considered that collaborative and participatory community development has contributed a lot to this achievement.
Comprehensive recovery assessment shows why collaborative community development has been advanced in Kobe. According to the assessment, it was notable that not only individual power (human capital) but also the existence of social organizations (so-called social capital), whose features are the ability to enhance collaboration and networking, produced the driving force for advancement. The assessment also pointed out the following important issue for the future: collaborative community development made great achievements to handle individual issues during the recovery period; in light of moving on to the second stage, in order to implement this idea in a sustainable and comprehensive manner, social capital should be nurtured to eventually create a horizontal and highly-open network globally as well as locally.
3 Conclusion
As mentioned above, the following is the main feature of management of the Kobe City Recovery Plan: ever-changing issues were observed calmly, and the PDCA cycle was then adopted to control the progress by collaboration with citizens in order to cope with issues flexibly. This shows that citizens, businesses, and the city government got together to share wisdom and learn from each other how to implement the plan into the recovery process where the issues and challenges were changing day by day after the earthquake.
For the assessment of recovery, the city government adopted administrative evaluation methodology to create the Citizen-Happiness Index as outcome index. In the process of creating the index, even from the examination phase for each index, the city government solicited citizens’ opinions and proposals; as a result, citizens and the city government could create the index through partnerships. These activities themselves have led to nurturing the citizens’ awareness towards their own recovery and the progress of further efforts and activities; therefore, this seems to be one of the opportunities for victims and the government to work together to reach common goals.
The proposals from the 5th and 10th year comprehensive recovery assessments show that the following are important to proceed with recovery: self-governance and community solidarity, collaborative community development, and social capital. Based on this, Kobe formulated the New Vision (mid-term plan) in 2005. In the plan, Kobe aims at proceeding with collaboration and participation among private, academic, industrial, and administrative sectors to become a new city model ahead of the times. In this way, it is necessary to pass on the concepts of self-governance and community solidarity, collaboration and participation, and social capital to the next generation and forwards, since their importance was made clear during the recovery process.

PART III
Recovery Projects
1. Infrastructure Reconstruction 2. Housing Reconstruction/Restoration 3. City Planning & Urban Renewal 4. Economic Vitalization 5. Life Recovery 6. Creating a Safe City


CHAPTER 1
Infrastructure Reconstruction
116
1 Outline of Recovery of Various Lifeline Utilities
Initial measures to recover lifeline utilities were taken by respective administrators (operators). An outline for each lifeline is given below. Following the initial responses, projects for full restoration and installation of improved facilities were implemented on the basis of revised standards of seismic retrofitting in respective specialties. Human resource frameworks, including outside aid, were also established.
1.1 Electricity Quick changeover of power transmission systems led to early restoration of power supply in several hours in cases where cables had not been broken. Even with cable breakage, power supply was resumed for all customer households within a week.
1.2 Communication The “Disaster Emergency Message Dial 171” system was created to prevent network congestion resulting from the great number of telephone calls to the disaster-hit area.
1.3 Water Earthquake-resistant facilities were installed, and frameworks of mutual outside aid were formed based on agreements with other large cities and municipalities in Hyogo Prefecture. Provision of outside aid in the event of disasters was formalized.
1.4 Sewage Sewage treatment plants were connected to form a citywide network enabling mutual utilization of their facilities.
1.5 Gas Many failures occurred in tap steel pipes. Their replacement with polyethylene pipes was promoted.The time courses of recovery of lifelines are shown below.
Table 1. Dates of Recovery of Various LifelinesUtility (operator) Date recovery work was completedElectricity (Kansai Electric Power) January 23, 1995Communication (NTT) January 31, 1995Gas (Osaka Gas) April 11, 1995Water (Kobe City Waterworks Bureau) April 17, 1995Sewage (Kobe City Sewage Bureau) April 20, 1995
Described below are specific considerations made in implementing full restoration projects for individual urban utilities.
2 Common Viewpoints Regarding Lifeline Recovery and Restoration
Lifeline operations generally comprise management of hardware facilities such as civil engineering structures, electrical equipment, and machines. For civil engineering structures, in particular, there are many items common to all lifeline utilities, including bridges, embankments, retaining walls, and concrete. Accordingly, the Japan Society of Civil Engineers made recommendations in May 1995 and July 1996 that two levels of earthquake ground motions be taken into account in constructing civil

117
engineering structures.
① Earthquake ground motions that will occur once or twice in the service-life period of the structure (L1)
② Earthquake ground motions that are much less likely to occur in the service-life period but do occur at greater levels, such as in the case of large interplate earthquakes and inland earthquakes (L2)
Based on these recommendations, the Specifications for Highway Bridges as well as the Guidelines for Anti-seismic Methods for Waterworks and Sewage were amended to include stricter requirements for further enhancement of the earthquake resistance of relevant structures.
In the case of the Kobe Earthquake, many problems arose in the initial response systems. For example, many of the people engaged in lifeline operations were disaster victims, the building that would otherwise serve as the disaster recovery headquarters suffered damage with the loss of technical and other documents, and backups for computers and the like were lacking. These facts served to emphasize the importance of preparedness for earthquakes in the future. With these lessons in mind, many lifeline operators implemented internal projects to improve their manuals.
Another fact of note was that the individual operators were able to achieve disaster recovery with a great amount of outside aid. Know-how was found to be necessary in order to be successful in accepting such outside aid and dispatching aid teams; rules were established after the earthquake.
Earthquake damage to power supply, communication, waterworks systems and the like, can be lessened by promoting system looping and backups, as well as by enhancing the earthquake resistance of facilities themselves. Emphasis should be placed on well-planned facility arrangement to minimize functional deterioration due to physical damage.
Underground structures are strongly linked to community development, including street plans. It is necessary to cooperate with other local governments, and to plan facility arrangements in harmony with projects for creating disaster-resistant communities.
If common utility tunnels and the like are available, it may be a wise approach to make the best use of their benefits.
3 Power supply
After completion of emergency transmission on January 23, full-scale recovery and restoration of power supply systems was implemented. The programs were focused on ① application of existing standards to damaged facilities in need of early recovery, ② quick implementation of seismic reinforcement whenever found necessary, and ③ harmonization with regional restoration plans.
Regarding the software aspects of recovery activities, the following tasks for “quick recovery” were proposed.
① Reconsideration of initial response systems: secure information exchange with national and local governments.
② Mobilization of materials, equipment, and personnel: establish a system for accepting outside aid from other companies.
118
③ Safety at the time power supply is resumed: raise public awareness of policy on safety measures in regions with damaged housing and other buildings.
④ Disaster prevention training and education at ordinary times: implement training sessions taking into account other lifelines and suspension of road traffic.
4 Communication
4.1 Keynote for restoration Nippon Telegraph and Telephone West Corporation (NTT West) formulated a 5-year restoration plan for their communication systems affected by the earthquake, focusing on the following three themes.
4.1.1 Conversion of conventional access networks into fiber-optics access networks With the coming multimedia era in mind, NTT West decided to facilitate multimedia infrastructuring separately for business and residential areas in Kobe, the first area in Japan to implement such a project, along with restoration activities for other cities affected by the disaster.
4.1.2 Promotion of Underground Disaster-Resistant Communication Networks Bearing in mind that facilities buried under the ground were less damaged than those above ground, conversion to underground facilities was actively promoted.
4.1.3 Decentralization of Communication Centers Emergency responses were affected to some extent by the fact that the employees themselves were affected by the disaster. To cope with this problem, switch points in metropolitan areas have been diversified to two centers (A and B) equipped with spare switchboards. In the event of a disaster, the switchboards for communication for important subscribers (police, fire services, administration, schools, etc.) in the affected center are changed to spare switchboards in the other center to minimize damage.
Additionally, pay phones have been allocated to the two centers (A and B) to diversify risks, and the reliability of subscriber circuits is secured by looping telephone tunnels using fiber-optic cables.
4.2 Disaster-Prevention Measures in the Future Communication systems were unavoidably damaged by the earthquake. Some problems arose, including service interruptions and the long time taken to ascertain the actual damage to access systems. However, the network as a whole remained functional thanks to the fact that the communication buildings were sufficiently robust to resist the earthquake ground motions, that equipment fixation and other anti-earthquake means served their purpose, that redundant design features, such as looping of trunk transmission lines, functioned well, and that remote operations of equipment were successful.
However, network congestion lasted for a long time, and information needed by evacuees did not spread via existing media. Hence, the following measures were adopted.
4.2.1 Measures to Prevent Network Congestion To prevent a rush of telephone calls, the major cause of network congestion, a voice mail system like Disaster Emergency Message Dial 171 should be introduced. Additionally, the call queue method, in which connection is secured after a waiting time following interruption, time-limited calls, and the like can be combined to mitigate network congestion.

119
4.2.2 Multiphase Utilization of Communication Satellite Systems Communication satellite systems are quite resistant to disasters. In the present disaster, special pay phones based on “a portable satellite communication system” were installed. Backup circuits will be developed by a broad range of approaches using communication satellites.
4.2.3 Free Access to Pay Phones Pay phones serve as a useful means of communication in disaster-hit areas. In the case of the Kobe earthquake however, sweeping power failures interfered with the use of prepaid telephone cards, with only coins being effective in using pay phones. To avoid similar situations in the case of power failure in disaster-hit areas, telephone calls will be made free of charge by commands from switchboards.
4.2.4 Support for Information Distribution in Disaster-Hit Areas Information distribution in disaster-hit areas cannot be secured by telephone alone; a “Disaster-Hit Area Information Network” meeting the needs in this modern multimedia era, including the Internet, will be introduced in cooperation with local governments. To ensure the best use of the new network, persons skilled in the art of multimedia will work on supporting information distribution in disaster-hit areas.
5 Gas
5.1 Recovery of Gas Supply Services Since gas is explosive and flammable, disaster recovery work cannot be carried out unless its supply is suspended. Gas is supplied to each plotted service area called a “sector (block).” Before starting recovery work, gas supply is stopped on a sector basis. After completion of the work for all damaged pipes in the sector, gas is again sent into the repaired or replaced pipes. Additionally, gas supply is automatically shut down by a microcomputer-controlled meter installed in each household at the time of an earthquake. After confirming the absence of gas leakage in each housing unit, the microcomputer-controlled meter is restarted to resume gas supply.
In the Kobe disaster, a total of more than 220 recovery sectors were distributed among five blocks where gas supply was stopped. Based on data concerning the Kushiro-oki earthquake, a recovery period of 4 to 5 days per sector had been assumed. In some sectors however, it took more than one week to achieve recovery. The major cause was the amount of time taken to remove the water that filled the piping (underground water, sewage, and public water). More than one ton of water was removed at some sites. In Kobe, the recovery project was completed on April 11. This work was carried out with the cooperation of 155 operators affiliated to the Japan Gas Association (JGA) and about 3,700 employees.
Figure 1. Gas Service Recovery Curve(Source: Osaka Gas Website : Records of Disaster Restoration Activities)
Unit: 1000 customers
Num
ber o
f cus
tom
ers w
ith re
sum
ed su
pply
Rec
over
y ra
te
(%)

120
5.2 Proposals for Restoration Planning Osaka Gas Co., Ltd. established the Hyogo Restoration Headquarters to facilitate implementation of restoration programs for the Hyogo District. The company also launched the Earthquake Disaster Restoration Promotion Office for company-wide disaster restoration and specified the following basic concepts.
① Disaster-resistant systems ② Ability to respond to a broad range of disasters ③ Harmonization of routine work and non-routine work ④ Considerations for environmental improvement ⑤ Promotion of energy conservation ⑥ Considerations for the elderly and the physically handicapped
Accordingly, specific measures were proposed for restoration in four fields. ① Disaster-Prevention Base Centers
Bearing in mind the fact that welded steel pipes were only slightly damaged, it is proposed that medium-pressure straight distribution be adopted for disaster-prevention base centers and hospitals. The supply system should be reformed to enable onsite switching for supply of substitutes such as liquefied natural gas, compressed natural gas, and propane/air mixtures. Introduction of cogeneration, an energy supply system of high overall efficiency, should be promoted to achieve high anti-disaster quality.
② Community Development A gas supply system that is highly resistant to disasters will be constructed making the best use of medium-pressure lines in harmony with community development programs. Meanwhile, for low-pressure lines in the disaster-stricken districts, replacement with polyethylene pipes should be promoted, and tap steel pipes are to be replaced schematically. To increase energy efficiency, cogeneration, district heating, and cooling, utilization of unexploited energy resources and the like should be promoted.
③ Housing Restoration For low-pressure underground pipelines, polyethylene pipes and expansion joints should be used. In the event of a disaster, domestic supply should be automatically stopped by microcomputer-controlled meters installed at individual customers’ addresses to prevent fires.
④ Disaster-Resistant Lifelines To speed restoration work, steel pipes, ductile pipes, and polyethylene pipes are preferred. With the permission of the administrators of the roads, shallow installation should be promoted to reduce excavation volume during restoration work. The city gas infrastructure should be schematically arranged in view of administrative plans for disaster-resistant roads and the availability of common trunk line tunnels and common ducts with power supply lines, so as to create a robust network in harmony with community development in disaster restoration programs.
5.3 Future Anti-Earthquake Measures The Agency for Natural Resources and Energy, Ministry of International Trade and Industry, established the Committee for Anti-Earthquake Measures for Gas Facilities; meetings were held to discuss optimal emergency measures, recovery measures, and support measures.
① Decision-Making Criteria for Supply Interruption If a spectral-intensity (SI) value of 60 kine or more is recorded, or if continued distribution becomes difficult due to a major change in the output from a manufacturing plant or gasholder, a major pressure change in a primary pressure regulator, or the like, gas supply should be interrupted
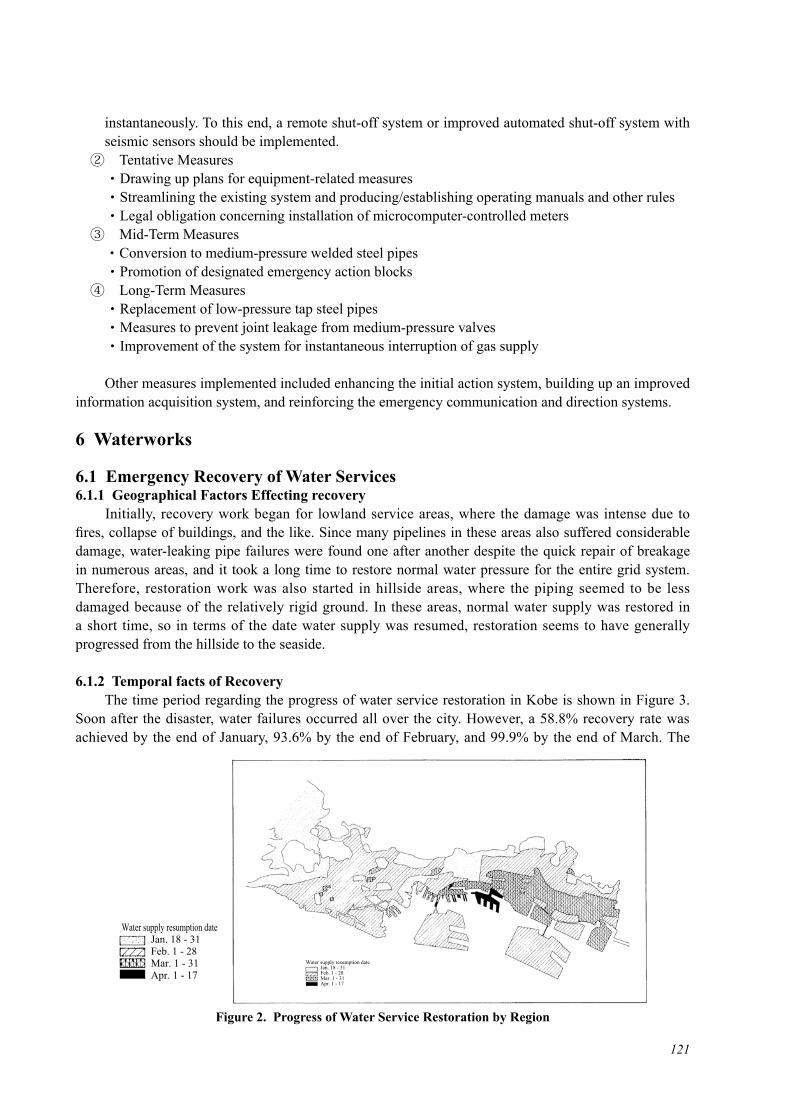
121
instantaneously. To this end, a remote shut-off system or improved automated shut-off system with seismic sensors should be implemented.
② Tentative Measures ・ Drawing up plans for equipment-related measures ・ Streamlining the existing system and producing/establishing operating manuals and other rules ・ Legal obligation concerning installation of microcomputer-controlled meters
③ Mid-Term Measures ・ Conversion to medium-pressure welded steel pipes ・ Promotion of designated emergency action blocks
④ Long-Term Measures ・ Replacement of low-pressure tap steel pipes ・ Measures to prevent joint leakage from medium-pressure valves ・ Improvement of the system for instantaneous interruption of gas supply
Other measures implemented included enhancing the initial action system, building up an improved information acquisition system, and reinforcing the emergency communication and direction systems.
6 Waterworks
6.1 Emergency Recovery of Water Services6.1.1 Geographical Factors Effecting recovery Initially, recovery work began for lowland service areas, where the damage was intense due to fires, collapse of buildings, and the like. Since many pipelines in these areas also suffered considerable damage, water-leaking pipe failures were found one after another despite the quick repair of breakage in numerous areas, and it took a long time to restore normal water pressure for the entire grid system. Therefore, restoration work was also started in hillside areas, where the piping seemed to be less damaged because of the relatively rigid ground. In these areas, normal water supply was restored in a short time, so in terms of the date water supply was resumed, restoration seems to have generally progressed from the hillside to the seaside.
6.1.2 Temporal facts of Recovery The time period regarding the progress of water service restoration in Kobe is shown in Figure 3. Soon after the disaster, water failures occurred all over the city. However, a 58.8% recovery rate was achieved by the end of January, 93.6% by the end of February, and 99.9% by the end of March. The
Figure 2. Progress of Water Service Restoration by Region
Water supply resumption date Jan. 18 - 31 Feb. 1 - 28 Mar. 1 - 31 Apr. 1 - 17
Water supply resumption date Jan. 18 - 31 Feb. 1 - 28 Mar. 1 - 31 Apr. 1 - 17

122
initial temporal recovery program was completed on April 17.
6.1.3 How to Restore Water Service① Stop water supply from service reservoir, and inject water little by little to exert water pressure.
If leakage occurs, the pressure falls.② Locate the failure, cut the pipe, and repair. Exert water pressure again.③ Confirm recovery from the failure by the absence of falling water pressure.
Recovery work for water supply services occurs gradually by repeating the steps ① , ② and ③ for each site. Since the number of sites in need of repair cannot be known initially, there is no way to start other than making an estimation. This situation can lead to the spread of incorrect information, and if restoration is not achieved as scheduled, optimistic prospects will be criticized.
It is hoped that a system for easy estimation of the number of failures from the magnitude of the earthquake, ground conditions, and the like will be brought into practical use.
6.2 Contributory Teachings in Relation to Waterworks Damage/Restoration The following issues were revealed in consideration of the damage to the Kobe waterworks system and restoration programs.
① Citywide Damage to Kobe Before the earthquake, Kobe’s Waterworks Bureau did not assume citywide damage when formulating anti-earthquake measures for its services; the traditional system was such that non-afflicted operating sites provide water to afflicted sites. In the disaster, it was difficult to understand the damage to the waterworks system, so the future for restoration could not be forecast. Restoration workers felt that their work was endless.
② Prolonged Recovery As recovery is prolonged, demands increase dramatically not only for drinking water but also for domestic water, and it becomes quite difficult to secure a sufficient supply of domestic water. Additionally, households unable to achieve restoration of water supply become increasingly dissatisfied, which in turn made it difficult for the administration to cope with the situation.
③ Limitations of Emergency Water Supply The volume of domestic water required increases with the number of days after the onset of the disaster, and water supply by tank trucks is unavoidably limited. It is necessary to make an early shift to water supply through pipelines (no limitations on volume and time).
④ Damage to Buildings otherwise Serving as Restoration Base Sites The buildings that would otherwise serve as restoration base sites (main offices and other
Figure 3. Water Service Restoration Curves (actual and ideal)
Figure 2. Progress of Water Service Restoration by Region
Figure 3. Water Service Restoration Curves (actual and ideal)
6.1.3 How to Restore Water Service
Stop water supply from serving reservoir, and inject water little by little to exert water pressure. If leakage occurs, the pressure falls. Locate the failure, cut the pipe, and repair. Exert water pressure again. Confirm recovery from the failure by the absence of falling water pressure.
Recovery work for water supply services occurs gradually by repeating the steps ,
17 24 31 7 14 21 28 7 14 21 280
102030405060708090
100(%)
B
A1995 Kobe
Jan. Feb. 1995 March
Wat
er s
uppl
y re
cove
ry ra
te

123
buildings) were damaged so that documents necessary for restoration work became inaccessible, which in turn hampered the formulation of restoration plans and other programs.
⑤ Validity of Existing Systems Various systems already available to Kobe, including the telemetric control system, emergency shut-off valve system, and water quality monitoring system, proved to be effective in reporting the situations at various sites by transmitting electronic data and allowing a comprehensive understanding of the situations at the monitoring center and elsewhere.
⑥ Traffic Jams Due to its geographic location, Kobe suffered terrible traffic jams during the initial phase of restoration. Marine transport was also utilized to convey materials and provide emergency water supply. Restoration programs should be implemented making the best use of the city’s distinct features, including the geography, roads to surrounding cities, and connection with rivers and the sea.
⑦ Timing of the Disaster If the disaster had occurred in the summer, a greater volume of water would have been required to maintain good hygiene, and there would also have been concerns about the occurrence of infectious diseases and the like. Since the disaster occurred in the winter, the inconvenience of not being able to take a bath was bearable to some extent.
⑧ Making the Best Use of Outside Aid Many offers for outside aid for emergency water supply and repair of damaged waterworks facilities were received, but the disaster-hit city of Kobe was unable to control the outside aid activities. A dedicated department is required to make the appropriate judgment on the state of the disaster-stricken city and enable outside aid teams to work effectively. After the disaster, mutual outside aid agreements were concluded among some large cities to establish an “outside aid secretary” system. For Kobe, the cities of Osaka and Hiroshima serve as secretaries, which allocate and lead outside aid teams in consultation with Kobe.
6.3 Waterworks Restoration Plans6.3.1 Formulating Seismic Retrofitting Plan In March 1995, when recovery from the disaster remained incomplete, the “Restoration Planning Committee” consisting of people of knowledge and experience in waterworks and water services was organized. After extensive discussions, the “Kobe City Seismic Design Guidelines for Water Supply Facilities” were drawn up in June, and the “Kobe City Basic Plan for Seismic Design of Water Supply Facilities” was formulated in July.
Since then, the waterworks restoration programs have been implemented on the basis of the basic plan. They are focused on the following three major projects.
① Emergency Water Retention System (securing fresh water in emergencies)② Seismic Retrofitting of Distribution Pipes (reducing water failures due to pipe breakage)③ Large-Capacity Transmission Main (securing a new source of water and route of water
transmission)
The emergency water retention system is configured with emergency shut-off valve systems and earthquake-resistant cisterns installed in the serving reservoirs. This project is to retain fresh water in the event of an emergency at 47 sites in Kobe. As of the end of fiscal 2009, the emergency water retention system was in operation at 42 service reservoirs (see Figure 4).
The project for seismic retrofitting of distribution pipes was designed to create a seismically safe

124
Figure 4. Emergency Water Retention System Figure 5. Seismic Retrofitting of Distribution Pipes
Emergency water retention system
Okuhirano Monitoring Center
Monitoring controller
Seismometer Normal distribution (fire extinguishing water)
Seismometer
1. Earthquake motions are sensed.
2. Radio wave directions are given to substations (serving reservoirs)
Telemetric substations
Base serving reservoirsWater tank replenishment basesTentative supply bases
3. Emergency shut-off valve is closed.
4. Drinking water is secured.
Normal distribution (fire extinguishing water)
Toward creating a water distribution pipeline system that is more resistant to earthquakes
Illustrative concept of seismic retrofitting by grid pipeline system
Making the best use of the experience with the disaster, old distribution pipes will be replaced with pipes of higher quake resistance. Taking into account emergency water supply activities in the event of disasters, a 500-meter grid pipeline network with access routes to disaster prevention base centers will be created.
Figure 6. Route of the Large-Capacity Transmission Main
Figure 7. Time Period and Specific Measures Regarding Water Service Recovery
Okuhirano Water Purification Plant
Nunobiki
Oji
IshiyagawaSumiyoshigawa Motoyama
Okuhirano Water Purification Plant
Nunobiki
Oji
IshiyagawaSumiyoshigawa Motoyama
Days after onset of the quake Until 3 days ~10 days ~21 days ~28 days
Water service recovery rate (%)
Emergency supply (tanks/road faucets)
Normal supply (individual customers)
Specific measures
Transported water supply bases (spot supply also implemented)
Serving reservoirs with emergency shut-off valve systemLarge-capacity cisterns etc.
Large-capacity transmission main (water retention function)
Disaster prevention bases (quake-resistant water tanks)
Tentative faucets
[Emergency retention systems]
Disaster prevention shelter bases
500-meter mesh grids (trunk lines)
200-meter mesh grids (branch lines)
Normal supply to individual customers using tentative piping
Storage at home, buildings etc.
Major effect expected Effective Supplementary role
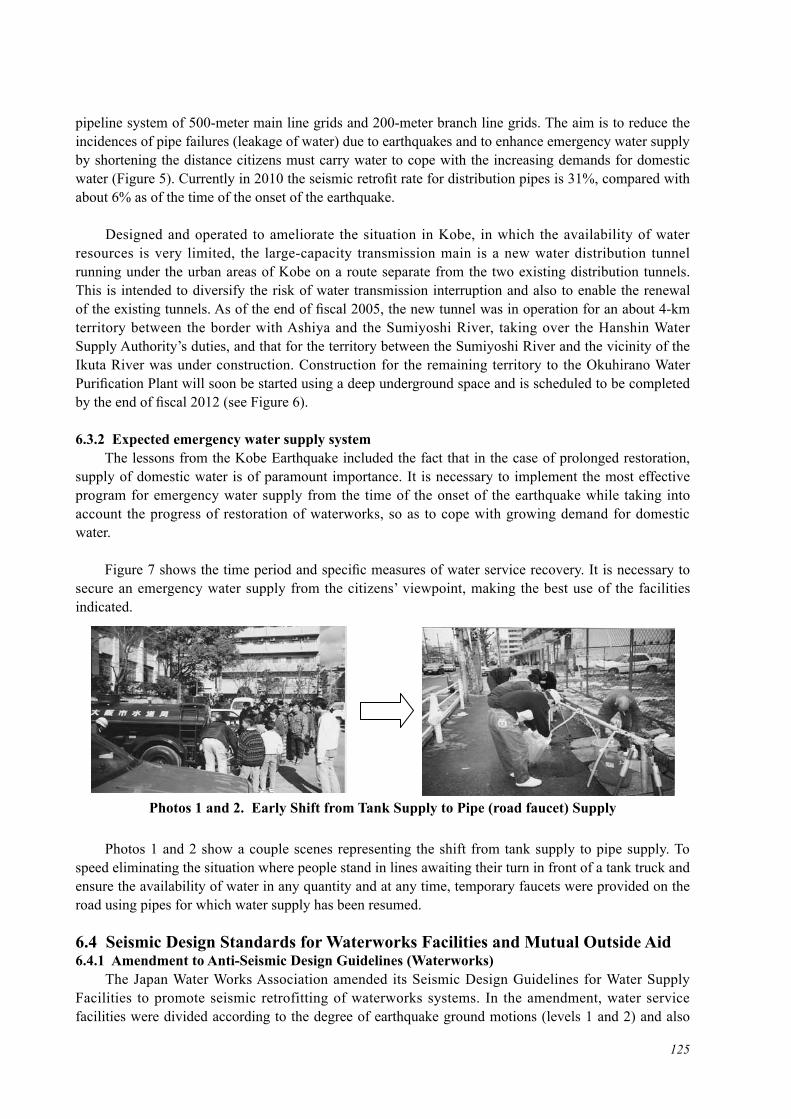
125
pipeline system of 500-meter main line grids and 200-meter branch line grids. The aim is to reduce the incidences of pipe failures (leakage of water) due to earthquakes and to enhance emergency water supply by shortening the distance citizens must carry water to cope with the increasing demands for domestic water (Figure 5). Currently in 2010 the seismic retrofit rate for distribution pipes is 31%, compared with about 6% as of the time of the onset of the earthquake.
Designed and operated to ameliorate the situation in Kobe, in which the availability of water resources is very limited, the large-capacity transmission main is a new water distribution tunnel running under the urban areas of Kobe on a route separate from the two existing distribution tunnels. This is intended to diversify the risk of water transmission interruption and also to enable the renewal of the existing tunnels. As of the end of fiscal 2005, the new tunnel was in operation for an about 4-km territory between the border with Ashiya and the Sumiyoshi River, taking over the Hanshin Water Supply Authority’s duties, and that for the territory between the Sumiyoshi River and the vicinity of the Ikuta River was under construction. Construction for the remaining territory to the Okuhirano Water Purification Plant will soon be started using a deep underground space and is scheduled to be completed by the end of fiscal 2012 (see Figure 6).
6.3.2 Expected emergency water supply system The lessons from the Kobe Earthquake included the fact that in the case of prolonged restoration, supply of domestic water is of paramount importance. It is necessary to implement the most effective program for emergency water supply from the time of the onset of the earthquake while taking into account the progress of restoration of waterworks, so as to cope with growing demand for domestic water.
Figure 7 shows the time period and specific measures of water service recovery. It is necessary to secure an emergency water supply from the citizens’ viewpoint, making the best use of the facilities indicated.
Photos 1 and 2 show a couple scenes representing the shift from tank supply to pipe supply. To speed eliminating the situation where people stand in lines awaiting their turn in front of a tank truck and ensure the availability of water in any quantity and at any time, temporary faucets were provided on the road using pipes for which water supply has been resumed.
6.4 Seismic Design Standards for Waterworks Facilities and Mutual Outside Aid6.4.1 Amendment to Anti-Seismic Design Guidelines (Waterworks) The Japan Water Works Association amended its Seismic Design Guidelines for Water Supply Facilities to promote seismic retrofitting of waterworks systems. In the amendment, water service facilities were divided according to the degree of earthquake ground motions (levels 1 and 2) and also
Photos 1 and 2. Early Shift from Tank Supply to Pipe (road faucet) Supply
Photos 1 and 2. Early Shift from Tank Supply to Pipe (road faucet) Supply
6.4 Seismic Design Standards for Waterworks Facilities and Mutual Outside Aid 6.4.1 Amendment to Anti-Seismic Design Guidelines (Waterworks)
The Japan Water Works Association amended its Seismic Design Guidelines for Water Supply Facilities to promote seismic retrofitting of waterworks systems. In the amendment, water service facilities were divided according to the degree of earthquake ground motions (levels 1 and 2) and also according to the importance of the facility (ranks A and B) to enable appropriate design with a selected combination. A flexible concept was introduced to ensure not only that individual facilities would have sufficient anti-quake performance but also that the waterworks system as a whole would be robust in the event of an earthquake. Newly adopted design features include backup systems and redundancy.
As the guidelines have been applied to all water facilities designed after the disaster, the number of facilities taking into account seismic resistance has been increasing steadily nationwide. 6.4.2 Concluding Mutual Outside Aid Agreements (Nationwide Rules for Outside Aid)
If we want to achieve seismic retrofitting of a waterworks system, facility retrofitting alone is insufficient, and it is necessary to establish an outside personal aid system available in the event of an earthquake. Kobe has outside aid agreements with other large cities; Kobe and the secretary cities Osaka and Hiroshima make mutual visits for the purpose of joint drills. The Hyogo Branch of the Japan Water Works Association also has mutual outside aid agreements with other cities and towns. So far it has dispatched an outside aid team several times and provided actual outside aid on site.
Furthermore, comprehensive mutual outside aid agreements for disaster restoration, including waterworks, have been concluded with neighboring cities to enable personal
126
according to the importance of the facility (ranks A and B) to enable appropriate design with a selected combination. A flexible concept was introduced to ensure not only that individual facilities would have sufficient anti-quake performance but also that the waterworks system as a whole would be robust in the event of an earthquake. Newly adopted design features include backup systems and redundancy.
As the guidelines have been applied to all water facilities designed after the disaster, the number of facilities taking into account seismic resistance has been increasing steadily nationwide.
6.4.2 Concluding Mutual Outside Aid Agreements (Nationwide Rules for Outside Aid) If we want to achieve seismic retrofitting of a waterworks system, facility retrofitting alone is insufficient, and it is necessary to establish an outside personal aid system available in the event of an earthquake. Kobe has outside aid agreements with other large cities; Kobe and the secretary cities Osaka and Hiroshima make mutual visits for the purpose of joint drills. The Hyogo Group of the Japan Water Works Association also has mutual outside aid agreements with other cities and towns. So far it has dispatched an outside aid team several times and provided actual outside aid on site.
Furthermore, comprehensive mutual outside aid agreements for disaster restoration, including waterworks, have been concluded with neighboring cities to enable personal backups in emergencies.
6.5 Summary of the Waterworks Restoration Efforts The influence of the earthquake damage to the public water supply system on citizens’ daily lives has been discussed. In a modern urbanized society, the roles of lifelines in our daily activities are of paramount importance. In recent years, the availability of drinking water from commercial distributors has been increasing, making the waterworks services no longer the only means of public water supply. On the other hand however, waterworks as an essential means of supplying domestic water has no substitute. In this sense, the routine act of taking a bath in one’s own home can be described as allowing disaster victims to realize the unusually complex situation of disaster recovery, i.e., restoration of waterworks, gas, and power supply systems.
In addition to conventional infrastructures such as waterworks, gas, and power supply systems, the number of kinds of lifelines has recently been increasing with the emergence of new infrastructures, including the Internet and cellular phones. This has led to the current situation in which inconveniences are likely due to functional failures in lifeline facilities.
In all cases, lifelines cannot be valuable unless they continue to function normally. Individual lifeline operators must implement appropriate maintenance and management of their facilities in a highly flexible system configuration to ensure that their services are sustained while maintaining system flexibility.
7 Sewage
In the field of sewage works, networking is being promoted in which treatment plants maintain close communication with each other to ensure mutual backup operations. Other efforts include installation of simple toilets using manholes at disaster prevention base centers.
7.1 How to Restore Sewage Systems Since sewers are installed underground and also since they do not always have constant flow as in public water pipelines and gas conduits, special tools and skills are required in locating failed portions. Representative procedures for checking the pipes are as follows.

127
① Primary Surveys (visual inspection) Covering the entire city area, sewer overflow, road depressions and the like are checked. This can be facilitated by utilizing bicycles and motorcycles.
② Simple Camera Surveys In primary surveys, the use of simple camera systems can be quite effective. An extendable pole equipped with a light and a camera at the tip enables inspecting a distance of about 10 meters of sewer piping installed up to about 5 meters below the ground level on the screen at hand.
③ Secondary Surveys (TV camera surveys and manhole surveys) For sections where pipeline damage is anticipated, each span of piping is checked for inside failures through a self-moving compact camera. It should be noted, however, this work involves a vast amount of time and labor.
④ Disaster Assessments and Disaster Recovery Disaster assessments are performed to obtain accurate data on damage (monetary value) as the basis for calculation of disaster restoration expenses granted by the national government. Although the assessment work is undertaken by national governmental officers, it is necessary to submit confirmatory dossiers, including camera survey records and photographs that can be helpful in assessing the damage. Another important requirement is to generate an equipment design specifications list, a painstaking task.
7.2 Accepting Outside Aid for Disaster Restoration In implementing disaster restoration programs, it is necessary to accept outside aid from other cities for damage surveys and repair work. There are some things that cannot be done by the disaster-stricken city, and others can be done by everyone. It is necessary to facilitate smooth implementation of the project as a whole by assigning the right roles to the appropriate teams.
7.3 Lessons Learned from Experience with Outside Aid ① Sewage Ledger Backups
Sewage damage surveys cannot be conducted without ledgers; it is necessary to maintain backups for data, systems, and the like. Following the earthquake, data owned by a contract maintenance company were utilized after being output using Nagoya’s system.
② Preparation of Disaster Survey Manual Kobe suffered a heavy rainfall disaster in 1967. Since then, and before the earthquake, however, it had not seen major damage to its sewage system. Hence, Kobe had not implemented a restoration program for damaged sewers with national grants. For this reason, the city had difficulty, with trial-and-error efforts, in implementing disaster surveys and making damage assessments in the present disaster. In preparation for large disasters that will possibly occur in the future, it is necessary to formulate a disaster restoration manual.
③ Outside Aid It is important that outside aid for disaster restoration from other cities be accepted without reserve. To this end, it is necessary to predetermine acceptance conditions and other particulars.
7.4 Sewage Restoration Plan Based on the lessons from the earthquake, sewage restoration is ongoing. The following are points of note.
① Treatment Plant Networking Major treatment plants in the city are connected through main pipelines in deep underground spaces to ensure that even if any plant experiences functional deterioration, other plants can take over the task of sewage treatment. At other times, throughputs can be made uniform among the

128
treatment plants according to the volume of sludge produced. ② Seismic Retrofitting of Facilities (treatment plants, pumping stations, sewers)
Of the treatment plants, pumping stations, and other facilities under the control of the Kobe City Waterworks Bureau, the Higashinada Sewage Treatment Plant was the most severely damaged. Its retrofits included the renewal of the revetment. For the other facilities, existing structures will be replaced with new ones of anti-seismic design at the time of scheduled reconstruction. Regarding pipelines, vinyl chloride pipes and plastic pipes are currently prevalent materials. Although they can become snaked due to ground liquefaction and the like, their installation to replace conventional pipes in view of surrounding ground conditions is being promoted.
③ Temporary Toilets for Use in Disasters Sewers have been installed at 60 sites in the city, including elementary and junior high schools, to accommodate 300 temporary toilet units for use in the event of disasters. The units are stored in warehouses and elsewhere; relevant people are trained during normal times in preparation for disasters.
④ Retention of Rainwater The abovementioned toilets cannot be flushed without water; swimming pool water and rainwater are retained at the 60 sites.
⑤ The Seseragi Project After the disaster, the Seseragi Project was started for Matsumoto-Dori in Hyogo Ward, where 80% of the houses were destroyed to the extent of 50% or more by fire, in response to the local residents’ request for securing water for fire extinguishing activities. The effluent from the Suzurandai Sewage Treatment Plant is treated to higher degrees of purity and released into the Seseragi artificial stream.
⑥ Making the Best Use of Treatment Plants as Disaster Prevention Base Centers Sewage treatment plants have cover lids, and their above-the-ground portions serve as parks and sport facilities. In the event of disasters however, they can be utilized as helicopter ports and relay bases for transportation of emergency materials.
⑦ Others Other ongoing efforts include attempts to draw seawater into main sewer lines and use it for fire fighting, installation of rainwater retention facilities to enable the use of rainwater for fire fighting, and provision of rainfall radar data (Internet, cellular phones). These are intended to create a sewage works system that can be actually helpful in coping with disasters.
8 Roads
8.1 General Roads For non-elevated general roads, restoration work was begun at sites where repair of underground facilities and removal of collapsed buildings and debris had been completed. For bridges connecting the mainland and reclaimed land, restoration work took place while securing detours.
At the time of the earthquake, Port Island had no access route other than the Kobe Ohashi Bridge; the importance of securing more than one route was largely recognized (Minatojima Tunnel was under construction).
In implementing restoration projects, emphasis was placed on creating “people-friendly roads” by including barrier-free features such as wide sidewalks and elimination of road level differences. Environmentally friendly paving work methods, including noise prevention and water permeability, were adopted.

129
Road plans in harmony with local community development were made. Extremely narrow roads and dead-end roads were eliminated. Substitute road networks were built.
Table 2. Progress of Traffic Recovery General RoadsName of Road Territory Completion Date RemarksNational Route 2 Iwaya Overpass February 19, 1996
Hamate Bypass May 2, 1996
8.2 Expressways A demand emerged for the development of a high-standard road network that can supplement the Hanshin Expressway as the core road. Accordingly, improvements were promoted for the Sanyo Expressway, the Akashi Kaikyo Bridge and related roads, as well as the extension of the Shin-Kobe Tunnel.
Table 3. Progress of Traffic Recovery for ExpresswaysName of Road Territory Completion Date RemarksMeishin Expressway November 20, 1995 totally re-openedHanshin Expressway Wangan Line Hamate Bypass April 10, 1995 totally re-opened
Hanshin Expressway Kobe Line
Maya - Kyobashi February 19, 1996Kyobashi - Tsukimiyama August 31Maya - Fukae September 10Fukae - Nishinomiya September 20 totally re-opened
Harbor HighwayRokko - Takaha September 28, 1995Takaha - Maya November 1Maya - Port Island August 24, 1996 totally re-opened
8.3 Revision of Design Standards etc. In the disaster, road bridges were seriously damaged. The Ministry of Construction established a countermeasure committee on January 20 and soon began discussing the issue. Specifications for the restoration work for dismantled road bridges were formulated. The Specifications for Highway Bridges were then amended to include considerations for near field earthquakes like the Kobe Earthquake.
Hanshin Expressway Public Corporation implemented the following measures to enhance the earthquake resistance of road facilities.
① Reinforcement of Bridge Piers To increase their toughness, bridge piers were reinforced by steel plate winding and epoxy resin injection, with concrete encasing for base portions.
② Anti-Seismic Measures for Upper Structures Equipment to prevent collapse of bridges was improved or replaced with seismic isolation bearings.
③ Countermeasures against Ground Liquefaction were Implemented. ④ Immediate Measures in the Event of an Earthquake
In emergencies such as large earthquakes, necessary measures are taken according to the level of emergency (precaution, emergency, contingency). Emphasis is placed on traffic control, including passage regulations, and facility security, and information is quickly disclosed to the

130
relevant sectors.
9 Railways
9.1 Facts of Recovery Top priority was given to recovering pre-disaster functions; civil engineering structures such as bridges were restored by around-the-clock work. Recovery dates by territory are shown in the table below. It is evident that railways cannot work unless their operations are resumed all along the line.
Kobe Rapid Transit Railway’s Daikai Station was severely damaged. Restoration took a long time; reconstruction work for the station building was implemented while maintaining train operations. Normal station services were resumed after a year.
The subsequent station retrofits were focused on universal design features, including elevators and widened platforms.
Table 4. Progress of Recovery of Railway OperationsOperator Territory Date completed RemarksJR Kobe Line Nada - Sumiyoshi April 1, 1995JR Shinkansen Shinosaka - Himeji April 8Hankyu Kobe Line
Shukugawa - Nishinomiya Kitaguchi
June 12, 1995
Hanshin Electric Railway
Nishinada - Mikage June 26, 1995
Kobe Municipal Subway
Itayado - Shin-Kobe February 18, 1995
Port Liner July 31, 1995Kobe Rapid Transit
January 17, 1996 Daikai Stationtotally crushed
Sanyo Electric Railway
August 13, 1995
Figure 8. Example of a Seismic Retrofit for a Reinforced Concrete Bridge Pier
Epoxy resin injection
Steel plate bonding Concrete encasing

131
9.2 Responding to the New Seismic Design Standards Responding to two proposals by the Japan Society of Civil Engineers, seismic performance requirements for railway structures, particularly banking fills, were investigated in view of L1 and L2 earthquake ground motions. Design specifications, including dynamic analyses based on the new requirements, became prevalent. Bearing in mind that the earthquake resistance of basic railway structures such as banking fills is important, methods for evaluating soft ground and liquefaction-vulnerable ground were investigated.
10 Other Issues concerning Restoration of Urban Utilities
10.1 Mutual Relationships of Different Lifelines Lifelines rely on each other; one influencing the others. Urban activities, in particular, are profoundly associated with lifelines. Table 5 shows the relationships between waterworks and other lifelines observed in the Kobe Earthquake Disaster.
Table 5. Relationships between Waterworks and Other LifelinesLifeline Event Impacts on Waterworks Impacts of
Waterworks Electric power Power failures Water transmission stopped, water
purification stopped, telephones and facsimiles became unavailable
Telephone Wire breakage, network congestion
Delay in information acquisition, lack of awareness of directions
Gas Delay in recovery work
Entry of water into piping (recovery of waterworks)
Sewage Risk of contamination (no actual cases in the present disaster)
Reclaimed water
No sewage for reclaiming
Functional restoration by backup systems
Traffic (roads) Road closure, traffic jams
Delay in emergency water supply and recovery work
Traffic (railways)
Early recovery Normalization of citizens’ lives and increase in volume of emergency water supply
Garbage treatment
Incinerator shutdown
Shortage of coolant water
10.2 Comparison of Restorations of Water and Gas Services Because both water and gas services suffered damage to their pipelines, they shared some common features in terms of disaster restoration. Meanwhile, they had distinct features related to their characteristics as lifeline utilities.
・ Common features: In implementing repair work, priority was given to underground facilities (pipelines) over above-the-ground facilities. Failures were difficult to identify and locate.
・ Distinct features: Gas pipes were full of underground water, sewage, and tap water, which had to be removed before starting repair work. For waterworks, pipes were connected and purged with water to clean the inside. Provided that the water supplied passed water quality testing, the services were restarted.

132
10.3 Provision of Outside Aid in Subsequent Disasters The Kobe City Waterworks Bureau has dispatched outside aid teams to provide onsite aid for restoration from disasters that occurred after the earthquake. Specifically, they were engaged in emergency water supply and restoration work in the public water source contamination accident in the city of Sasayama on June 11, 2002, the well water failure accident in the town of Hikami in November, and the flood damage due to torrential downpours related to Typhoon No. 23 in the cities of Sumoto and Toyooka in 2004. An outside aid team was also dispatched to provide emergency water supply and restoration work after the Niigata Chuetsu Earthquake of 2004.
On these occasions, the Kobe City Waterworks Bureau endeavored to lessen the burden on each disaster-stricken operator and prevent the citizens from suffering deterioration of daily activities through outside aid activities, including:
・ advice from the viewpoint of the disaster-stricken city, ・ actual actions (establishment of anti-disaster measure headquarters, onsite surveys, emergency water
supply, recovery plans), and ・ negotiations with the national government, Hyogo Prefectural government, and other organizations.
For emergency water supply, 20-liter polyethylene containers were no longer used. Instead, 6-liter and 10-liter containers were used. These smaller containers were adopted for storage in preparation for disasters and are now used in disaster-prevention drills in Kobe.
10.4 International Cooperation The West Coast of the United States faces Japan over the Pacific Ocean, where earthquakes occur frequently because the Pacific Plate is subducting under the North American Continent. Major earthquakes recorded in the past include the Great San Francisco Earthquake of 1906, San Fernando Earthquake of 1971, Loma Prieta Earthquake of 1989 (South of San Francisco), and Northridge Earthquake of 1994 (Northern Los Angeles), in which damage to waterworks facilities occurred to various degrees.
Since 1999, the American Water Works Association (AWWA) and the Japan Water Works Association have been cooperating with each other to hold joint workshops on anti-earthquake measures every two years, where they have exchanged information on the actual effects of their anti-seismic activities.
Although the AWWA initially focused on primary facilities in implementing seismic retrofits for the waterworks system, it has recently been emphasizing seismic measures for distribution pipes. With financial support from the Federal Emergency Management Agency, the AWWA proposed a new design approach for pipelines that meets the emerging requirements.

CHAPTER 2
Housing Reconstruction/Restoration

134
1 Basic Concept
1.1 Housing Reconstruction Processes and Overview Damage to housing caused by the Kobe Earthquake amounted to approximately 82,000 units destroyed. The reason for such an enormous loss was that a large number of houses in the disaster-hit areas were inadequate in terms of earthquake resistance and/or fireproof performance. This was well demonstrated by the fact that the greatest damage in inner urban areas was to dilapidated densely spaced wooden dwellings.
A great many human lives were lost as a result of the destruction and burning of buildings, which should secure human life and property, and the loss of housing deprived residents of the basis for their daily living activities and of their valuables, including memories of their and their families’ life stories. These facts strongly emphasize the vitally important fact that housing should be designed and built to provide security for its occupants in order that they may live safely with a sense of ease.
Housing damage from the earthquake extended to wooden detached houses, joint housing units, and row houses but also to old reinforced concrete condominiums and rental apartments. Some victims who suffered only partial damage (50% destruction or less) to their homes managed to recover from earthquake following repairs, whereas many of those who lost their homes continued to strive to restore their own housing, while living in temporary housing after moving out of evacuation shelters.
In the course of housing reconstruction, victims faced many barriers that hampered their efforts specific to circumstances regarding detached houses, wooden joint housing/row houses, condominiums, and rental apartments. A broad range of support measures was provided for such housing reconstruction by the public and private sectors, as well as volunteers. As a result, some people were able to reconstruct their previous housing, while others were unable to do so and were obliged to move outside the city of Kobe. There were also a significant number that had to choose a different type of dwelling from
Figure 1. Housing Reconstruction Process
Southern Hyogo Prefecture Earthquake (vibration) + soil q ( )
conditions
Quality of existing housing (quake-resistance)
<Housing type> <Damage suffered>
Not everybody moved to the evacuation centers
<Public assistance, other assistance>
<New housing>
Detached houses(privately owned)
Total
half
Demolition using
public funds
Reconstruction efforts Detached house
rebuilding
Ev
Temporary r(privately owned)
partial
Communal buildingsTotal・half
Repairs
Demolition using Demolition using public funds
Repairs
Reconstruction efforts
Communal building reconstruction
vacuation center
residence (includinCo u bu d gs
partial
TotalCommunal buildings(privately rented), Repairs
RepairsRepairs
reconstruction
Privately rented houses
ng temporary housin
half
partial
public housing,company housing,rented detachedhouses, etc.
Repairs by the
housing managerRepairs
by the housing manager
Purchase of detached houses or communal
apartments
Post-quake public
ng and refuges outs
Total
half
partial
Tenement houses(rented)
Move out of Kobe
Repairs Back to
Kobe
housing
M f K b
side Kobe)
No damage
Move out of Kobe
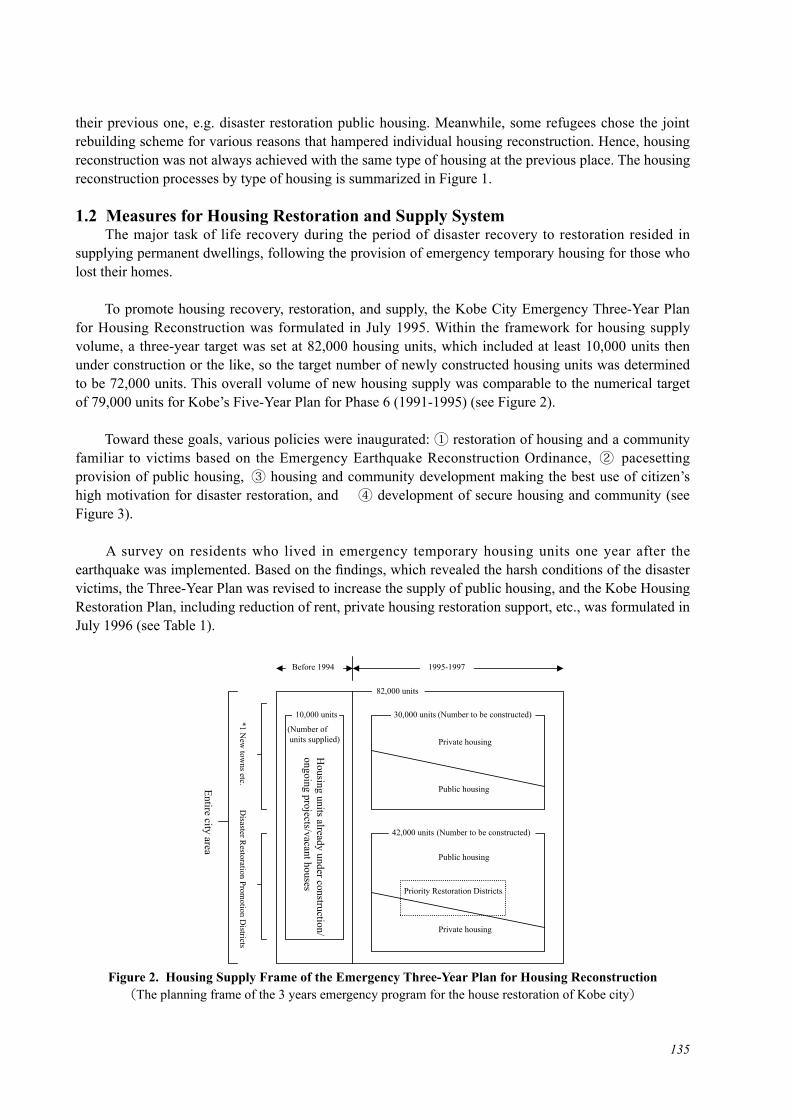
135
their previous one, e.g. disaster restoration public housing. Meanwhile, some refugees chose the joint rebuilding scheme for various reasons that hampered individual housing reconstruction. Hence, housing reconstruction was not always achieved with the same type of housing at the previous place. The housing reconstruction processes by type of housing is summarized in Figure 1.
1.2 Measures for Housing Restoration and Supply System The major task of life recovery during the period of disaster recovery to restoration resided in supplying permanent dwellings, following the provision of emergency temporary housing for those who lost their homes.
To promote housing recovery, restoration, and supply, the Kobe City Emergency Three-Year Plan for Housing Reconstruction was formulated in July 1995. Within the framework for housing supply volume, a three-year target was set at 82,000 housing units, which included at least 10,000 units then under construction or the like, so the target number of newly constructed housing units was determined to be 72,000 units. This overall volume of new housing supply was comparable to the numerical target of 79,000 units for Kobe’s Five-Year Plan for Phase 6 (1991-1995) (see Figure 2).
Toward these goals, various policies were inaugurated: ① restoration of housing and a community familiar to victims based on the Emergency Earthquake Reconstruction Ordinance, ② pacesetting provision of public housing, ③ housing and community development making the best use of citizen’s high motivation for disaster restoration, and ④ development of secure housing and community (see Figure 3).
A survey on residents who lived in emergency temporary housing units one year after the earthquake was implemented. Based on the findings, which revealed the harsh conditions of the disaster victims, the Three-Year Plan was revised to increase the supply of public housing, and the Kobe Housing Restoration Plan, including reduction of rent, private housing restoration support, etc., was formulated in July 1996 (see Table 1).
Figure 2. Housing Supply Frame of the Emergency Three-Year Plan for Housing Reconstruction(The planning frame of the 3 years emergency program for the house restoration of Kobe city)
Priority Restoration Districts
Before 1994
Entire city area
1995-1997
10,000 units
(Number of units supplied)
30,000 units
82,000 units
42,000 units
Private housing
Public housing
Public housing
Private housing
*1 New
towns etc.
Housing units already under construction/
ongoing projects/vacant houses
Disaster R
estoration Promotion D
istricts
(Number to be constructed)
(Number to be constructed)

136
Table 1. Kobe City Emergency Three-Year Plan for Housing Reconstruction(Revision of the planning frame of the 3 years emergency program for the housing restoration of Kobe City)
(Before revision) (After revision)Public housing 10,000 Public housing 16,000
City of Kobe 7,500 City of Kobe 10,500Hyogo Prefecture 2,500 Hyogo Prefecture 5,500
Specially designated high-quality rental housing
10,500 Specially designated high-quality rental housing
6,900
City of Kobe 7,500 City of Kobe 5,700Hyogo Prefecture 3,000 Hyogo Prefecture 1,200
Re-development housing 4,000 ⇒ Re-development housing 4,000Public corporation housing 15,900 Public corporation housing 13,500
Urban Development Corporation
12,900 Urban Development Corporation*1
10,500
Kobe City Housing Supply Corporation
2,000 Kobe City Housing Supply Corporation
2,000
Hyogo Prefectural Housing Corporation
1,000 Hyogo Prefectural Housing Corporation
1,000
Private housing units(with public grants)
31,600(4,600)
Private housing units(with public grants)
31,600(4,600)
Total 72,000 Total 72,000*1 Those units rented by the city of Kobe as public housing units are not included or counted as public
housing units.
Figure 3. Outline of the Emergency Three-Year Plan for Housing Reconstruction(The Outline of the 3 years emergency program for the house restoration of Kobe city)
<Basic Goals>
Quick reconstruction of the fundam
entals of citizens’ daily life through housing/com
munity developm
ent
Housing/com
munity developm
ent w
ith both recovery and restoration in m
ind
<Basic Policies> <Specific Measures for Achieving the Goals>
(1) Housing and community development by cooperative housing projects
(2) Early provision of a large number of housing units
(3) Housing improvement in harmony with community development programs
(4) Measures for those having great difficulty in finding housing: the elderly, handicapped, and others
(5) Development of safe housing/ community
(1) Restoration of housing and community familiar to victims based on the Emergency Earthquake Reconstruction Ordinance ① Housing/community development in Disaster Restoration Promotion Districts ② Housing/community development in Priority Restoration Districts
(2) Pacesetting provision of public housing ① Construction of disaster restoration public housing, etc. ② Provision of specially designated high-quality rental houses for disaster restoration ③ Provision of redevelopment housing units ④ Supply by the Housing and Urban Development Corporation and Kobe City Housing Supply Corporation
(3) Housing and community development making the best use of citizen’s high motivation regarding disaster restoration ① Promotion of housing/community development by residents • Dispatch of specialists by the Kobe Housing and Machizukuri Center • Holding the Kobe Housing Exposition • Display of model houses for mixed land use areas with high density. ② Promotion of housing/community development for each district and town area • Making the best use of the Kobe City Inner Row Housing Urban Area Improvement Guidance System (the inner row house system) • Active implementation of Iki-iki Shitamachi Suishin Council activities etc. ③ Support for private housing restoration • Support for reconstruction of affected condominiums • Promotion of a special loan system and establishment of a Comprehensive Housing Consultation Center • Support by the Kobe Earthquake Recovery Fund
(4) Development of secure housing/community ① Measures for people having great difficulty in finding housing: the elderly or handicapped • Priority tenant selection for the elderly, handicapped and other persons having difficulty in finding housing etc. ② Promotion of secure housing systems for the elderly, handicapped, and others • Promotion of housing projects for the elderly • Enhancement of cooperation with welfare facilities and focus on community balance ③ Development of disaster-resistant, human/eco-friendly housing/communities • Formulation and dissemination of Kobe Housing Design Standards • Creation of safe and comfortable residential areas etc.
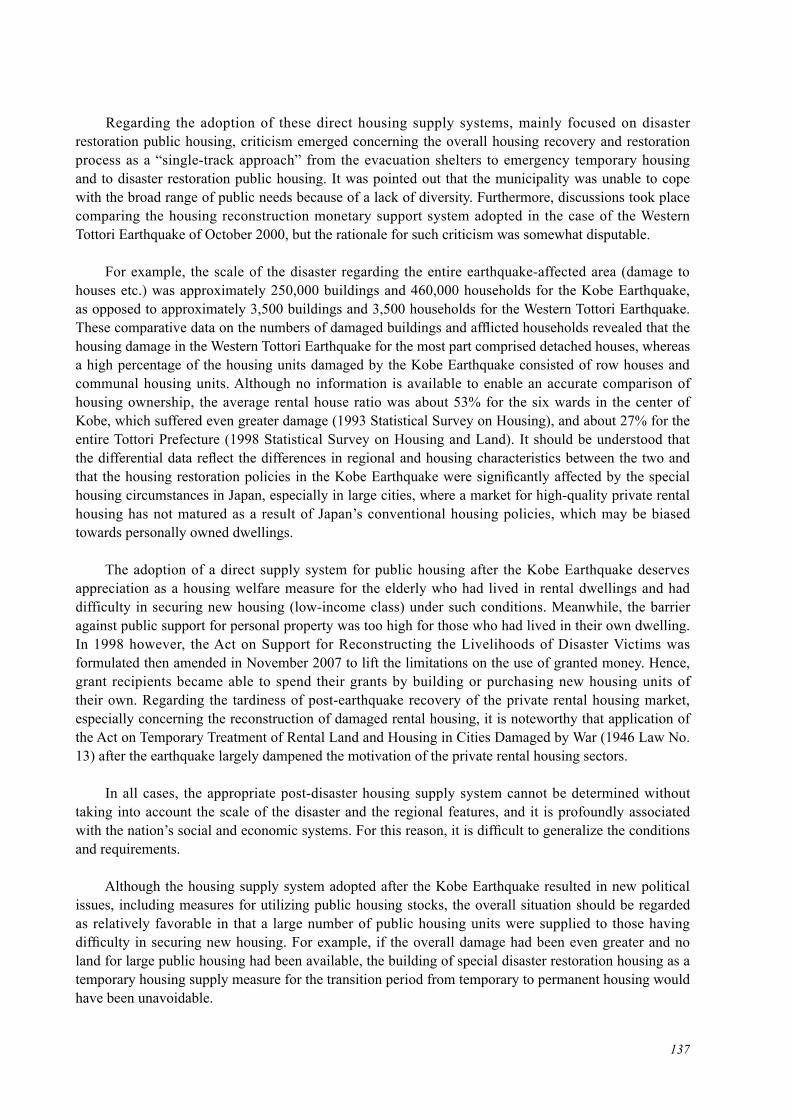
137
Regarding the adoption of these direct housing supply systems, mainly focused on disaster restoration public housing, criticism emerged concerning the overall housing recovery and restoration process as a “single-track approach” from the evacuation shelters to emergency temporary housing and to disaster restoration public housing. It was pointed out that the municipality was unable to cope with the broad range of public needs because of a lack of diversity. Furthermore, discussions took place comparing the housing reconstruction monetary support system adopted in the case of the Western Tottori Earthquake of October 2000, but the rationale for such criticism was somewhat disputable.
For example, the scale of the disaster regarding the entire earthquake-affected area (damage to houses etc.) was approximately 250,000 buildings and 460,000 households for the Kobe Earthquake, as opposed to approximately 3,500 buildings and 3,500 households for the Western Tottori Earthquake. These comparative data on the numbers of damaged buildings and afflicted households revealed that the housing damage in the Western Tottori Earthquake for the most part comprised detached houses, whereas a high percentage of the housing units damaged by the Kobe Earthquake consisted of row houses and communal housing units. Although no information is available to enable an accurate comparison of housing ownership, the average rental house ratio was about 53% for the six wards in the center of Kobe, which suffered even greater damage (1993 Statistical Survey on Housing), and about 27% for the entire Tottori Prefecture (1998 Statistical Survey on Housing and Land). It should be understood that the differential data reflect the differences in regional and housing characteristics between the two and that the housing restoration policies in the Kobe Earthquake were significantly affected by the special housing circumstances in Japan, especially in large cities, where a market for high-quality private rental housing has not matured as a result of Japan’s conventional housing policies, which may be biased towards personally owned dwellings.
The adoption of a direct supply system for public housing after the Kobe Earthquake deserves appreciation as a housing welfare measure for the elderly who had lived in rental dwellings and had difficulty in securing new housing (low-income class) under such conditions. Meanwhile, the barrier against public support for personal property was too high for those who had lived in their own dwelling. In 1998 however, the Act on Support for Reconstructing the Livelihoods of Disaster Victims was formulated then amended in November 2007 to lift the limitations on the use of granted money. Hence, grant recipients became able to spend their grants by building or purchasing new housing units of their own. Regarding the tardiness of post-earthquake recovery of the private rental housing market, especially concerning the reconstruction of damaged rental housing, it is noteworthy that application of the Act on Temporary Treatment of Rental Land and Housing in Cities Damaged by War (1946 Law No. 13) after the earthquake largely dampened the motivation of the private rental housing sectors.
In all cases, the appropriate post-disaster housing supply system cannot be determined without taking into account the scale of the disaster and the regional features, and it is profoundly associated with the nation’s social and economic systems. For this reason, it is difficult to generalize the conditions and requirements.
Although the housing supply system adopted after the Kobe Earthquake resulted in new political issues, including measures for utilizing public housing stocks, the overall situation should be regarded as relatively favorable in that a large number of public housing units were supplied to those having difficulty in securing new housing. For example, if the overall damage had been even greater and no land for large public housing had been available, the building of special disaster restoration housing as a temporary housing supply measure for the transition period from temporary to permanent housing would have been unavoidable.

138
In relation to making a decision regarding post-earthquake housing supply policy, emphasis should be placed on the necessity for the establishment of continuous housing support measures bridging emergency recovery to full-scale restoration.
In the Kobe Earthquake, a large number of affected buildings went into debris disposal even when they were only partially (destruction of 50% or less) damaged directly by the earthquake or by fire; this is said to have led to a housing demand that was more than actually required, or greater expenditures for housing reconstruction inflicted on individual sufferers. The Disaster Relief Act currently in force provides rigorous requirements for first-aid action criteria, including limited application to privately owned houses (in case of rental dwelling: death of the landlord, total destruction, etc.) lived in by welfare recipients etc. with a ceiling amount of 295,000 yen/unit. Here, the issue of public support for personal properties posed a major problem that hampered the applicability of first-aid repair.
At this stage, it seems to be a more realistic approach to establish a method of appropriate allocation of expenses, including those for restoration of the original condition (repairs, reconditioning, etc.), with systematic and technical unity with emergent risk evaluations, by adopting the housing reconstruction monetary support method as appropriate.
1.3 Problems with Public Housing Supply and New Efforts In the process of housing restoration after the earthquake, a large number of public housing units, including disaster restoration public housing, were supplied, resulting in the provision of adequate housing for the disaster-hit area as a whole. However, it should be noted that a number of problems and challenges emerged in the context of housing and community development. At a relatively early stage following the earthquake, there were issues that included uneven availability of land for housing construction that produced demand-supply imbalances in some districts, concerns regarding deterioration in the quality of planning and design due to the mass supply of small-scale housing units, and the necessity of regional integration with surrounding areas.
At the same time however, new efforts emerged that led to revision of the framework of conventional stereotypical policies for public housing. In particular, the Public Housing Law was amended after the earthquake (May 1996) to open the way to housing supply in more diverse forms. Accordingly, a system was launched to enable the leasing of public housing units by Kobe from the Urban Renaissance Agency, and housing restoration measures making the best use of the new system were implemented, marking the first case of this kind in Japan.
For example, the city of Kobe promoted the leasing of private rental housing, in which the housing units were leased by the municipal government and supplied as public housing units. Under the system, a monetary subsidy was granted to both housing builders and the tenants (rent reduction); 1,554 units in 79 housing complexes were supplied under this system. Additionally, a new city housing system was launched in which the horyu-sho (reserve floor areas) generated in the premises of jointly rebuilt private dwellings were purchased by the city of Kobe and leased as city housing units; 127 units in 4 housing complexes (housing to accommodate former residents by the Urban Residential Area Comprehensive Improvement Project) were supplied. A system in which some units of each joint housing complex were purchased by the Urban Development Corporation and leased as public housing units was also implemented; 225 units in 4 housing complexes (184 units in 3 complexes operated by the city and 41 units in one housing complex operated by Hyogo Prefecture) were supplied.
Although these housing units accounted for only a small percentage of all public housing units supplied, such new efforts were appreciated, particularly as an approach to public housing supply in

139
densely built-up urban areas where the availability of land for new construction was limited and also as a milestone concerning the combination of public housing supply and community development for restoration of a vibrant community, including disaster restoration.
Another noteworthy feature of the post-earthquake public housing policy resides in enhanced measures for the elderly. In addition to the existing Silver Housing System (housing system for the elderly) that had been available from before the earthquake, efforts in combination with, or as support for, welfare measures began, including promotion of the inclusion of barrier-free features in all housing units, installation of automatic emergency reporting systems, and dispatch of supporters for elderly households (Life Support Advisors etc.). Furthermore, introduction of collective housing, a new way of living with common spaces to allow elderly residents to live a cooperative life, into public housing together with the group tenant selection system, and condominiums that allow residents to keep pets, although all in the pilot stage, can be viewed as pioneering approaches to housing development and the creation of good living environments beyond the existing frameworks.
2 Concrete measures
2.1 Introduction Prior to formulating the Kobe City Recovery Plan to present its vision of restoration following the Kobe Earthquake, the city of Kobe enacted the Kobe Emergency Earthquake Reconstruction Ordinance by which the initiatives for the reconstruction of housing and the community were published in February 1995. In response to this, the Kobe City Emergency Three-Year Plan for Housing Reconstruction was formulated with a focus on early recovery from housing loss in the earthquake in July 1995, which was later revised an renamed the Kobe Housing Restoration Plan in June 1996. In accordance with individual projects, a broad range of measures for housing reconstruction were implemented.
2.1.1 Kobe Emergency Earthquake Reconstruction Ordinance2.1.1.1 Objective The stated objective was to develop a vibrant urban area with resistance against disasters and to provide housing of good quality during the recovery period by facilitating improvement of the urban area and urgent provision of housing within the framework of the disaster reconstruction project.
2.1.1.2 The Reconstruction Concept The mayor of the city of Kobe, citizens and project participants are to work in cooperation to create communities that are robust in relation to natural disasters during the rehabilitation of the urban area, bearing in mind the lessons learned from the Kobe Earthquake.
2.1.1.3 Outline① Designation of Disaster Restoration Promotion Districts (approx. 5,887 ha)Of the seriously affected urban districts, those in need of promoting the creation of communities that are robust in relation to natural disasters are designated as Disaster Restoration Promotion Districts in conformity with the disaster reconstruction project. In these districts, various financing and grant systems are implemented to encourage individual owners to rebuild their affected dwellings into housing units of good quality. Community development based on area clearing programs is also stimulated making the best use of community development support systems, including dispatch of specialists, in order to promote improvements to narrow streets and rebuilding efforts in joint/cooperative housing projects.② Designation of Priority Restoration Districts (25 districts, approx. 1,260 ha)Of the Disaster Restoration Promotion Districts, intensively affected areas requiring urgent

140
and comprehensive reconstruction of the urban functions and housing and provision of urban infrastructure facilities were zoned as Priority Restoration Districts. In these districts, community development is supported proactively, by making use of legally specified projects such as land readjustment projects and urban re-development projects, as well as other various projects, systems and incentive approaches, including an urban residential area comprehensive improvement project and a densely built-up area improvement promotion project.
2.1.2 Kobe Emergency Three-Year Plan for Housing Reconstruction (July 1995)2.1.2.1 Basic Concept This plan was positioned as a guide to reach numerical targets regarding housing unit supply and major policies for its promotion in accordance with The Plan for Reconstruction of Urban Areas and Housing proposed in the Kobe Emergency Earthquake Reconstruction Ordinance. Its objective was to promote the early recovery of housing stock and the development of safe and vibrant housing and communities that are highly resistant to natural disasters.
2.1.2.2 Particulars① Numerical targets for housing supply are set in accordance with the roles of individual citizens
and institute a wide variety of new systems and measures to achieve the goals.② Scheduled time span: April 1995 - March 1998③ Target number of housing units supplied: 82,000 units (construction begun: 10,000 units; new
construction: 72,000 units)
2.1.3 Kobe Housing Restoration Plan (July 1996) After the Kobe City Emergency Three-Year Plan for Housing Reconstruction was formulated, censuses on residents urgently provided temporary housing units and other data showed that many victimized households consisted of either the elderly or low-income workers and that they generally wanted to move into public housing units and the like. With this situation in mind, the city of Kobe reconsidered the Three-Year Plan and formulated the Kobe Housing Restoration Plan.
2.1.3.1 Reconsideration of Supply Plans for Public Housing Units etc.① Based on the results of censuses and surveys, including those on temporary housing residents
and those conducted at the time of centralized tenant selection, the supply plans for public housing units etc. were reconsidered (see page 136).
② With the expectation of demand for public housing units reaching 26,100, the number of new public housing units to be supplied was increased by 6,000 from the initial 10,000 to 16,000 units; 26,100 units in total, including utilization of empty houses and supply of housing already under construction to be supplied by the end of March 1998 (see Table 1).
* In formulating the new plan, frequent meetings with the Headquarters for Restoration from the Kobe Earthquake in the Prime Minister’s Office were necessary.
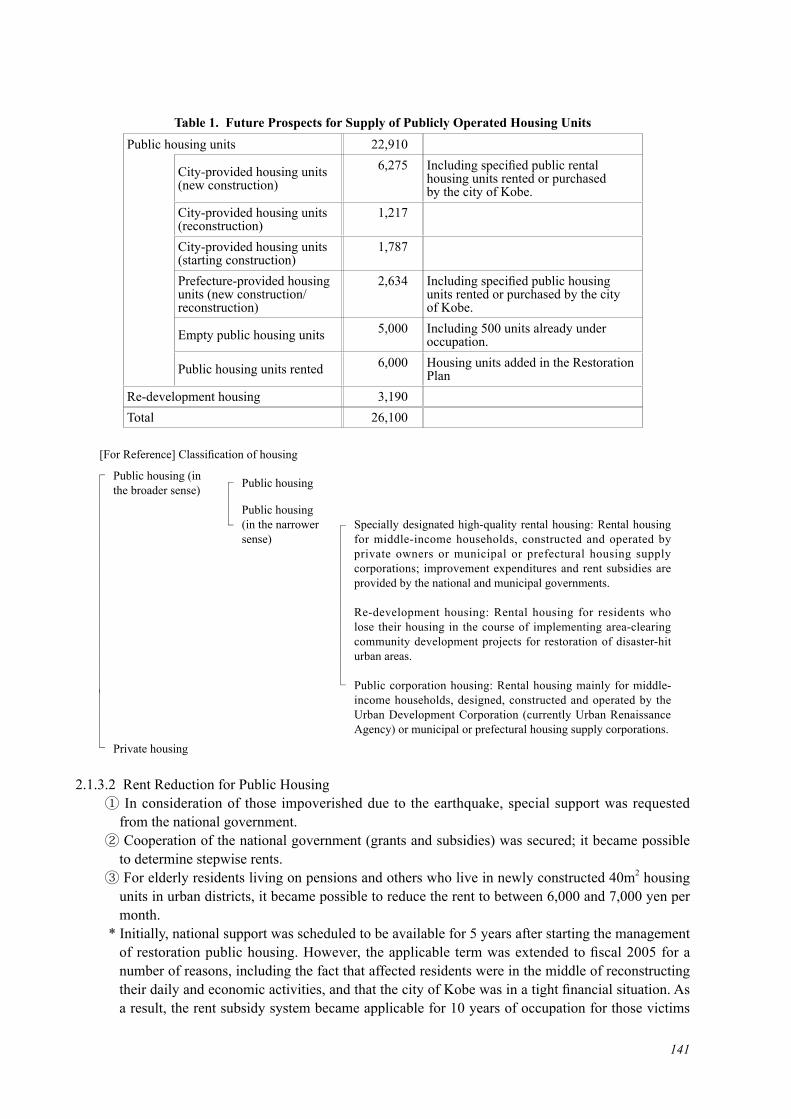
141
Table 1. Future Prospects for Supply of Publicly Operated Housing UnitsPublic housing units 22,910
City-provided housing units (new construction)
6,275 Including specified public rental housing units rented or purchased by the city of Kobe.
City-provided housing units (reconstruction)
1,217
City-provided housing units (starting construction)
1,787
Prefecture-provided housing units (new construction/ reconstruction)
2,634 Including specified public housing units rented or purchased by the city of Kobe.
Empty public housing units 5,000 Including 500 units already under occupation.
Public housing units rented 6,000 Housing units added in the Restoration Plan
Re-development housing 3,190Total 26,100
[For Reference] Classification of housing
┌│││││││││││││││││││││││││└
Public housing (in the broader sense) ┌
│││└
Public housing
Public housing (in the narrower sense)
┌││││││││││││││└
Specially designated high-quality rental housing: Rental housing for middle-income households, constructed and operated by private owners or municipal or prefectural housing supply corporations; improvement expenditures and rent subsidies are provided by the national and municipal governments.
Re-development housing: Rental housing for residents who lose their housing in the course of implementing area-clearing community development projects for restoration of disaster-hit urban areas.
Public corporation housing: Rental housing mainly for middle-income households, designed, constructed and operated by the Urban Development Corporation (currently Urban Renaissance Agency) or municipal or prefectural housing supply corporations.
Private housing
2.1.3.2 Rent Reduction for Public Housing① In consideration of those impoverished due to the earthquake, special support was requested
from the national government.② Cooperation of the national government (grants and subsidies) was secured; it became possible
to determine stepwise rents.③ For elderly residents living on pensions and others who live in newly constructed 40m2 housing
units in urban districts, it became possible to reduce the rent to between 6,000 and 7,000 yen per month.
* Initially, national support was scheduled to be available for 5 years after starting the management of restoration public housing. However, the applicable term was extended to fiscal 2005 for a number of reasons, including the fact that affected residents were in the middle of reconstructing their daily and economic activities, and that the city of Kobe was in a tight financial situation. As a result, the rent subsidy system became applicable for 10 years of occupation for those victims
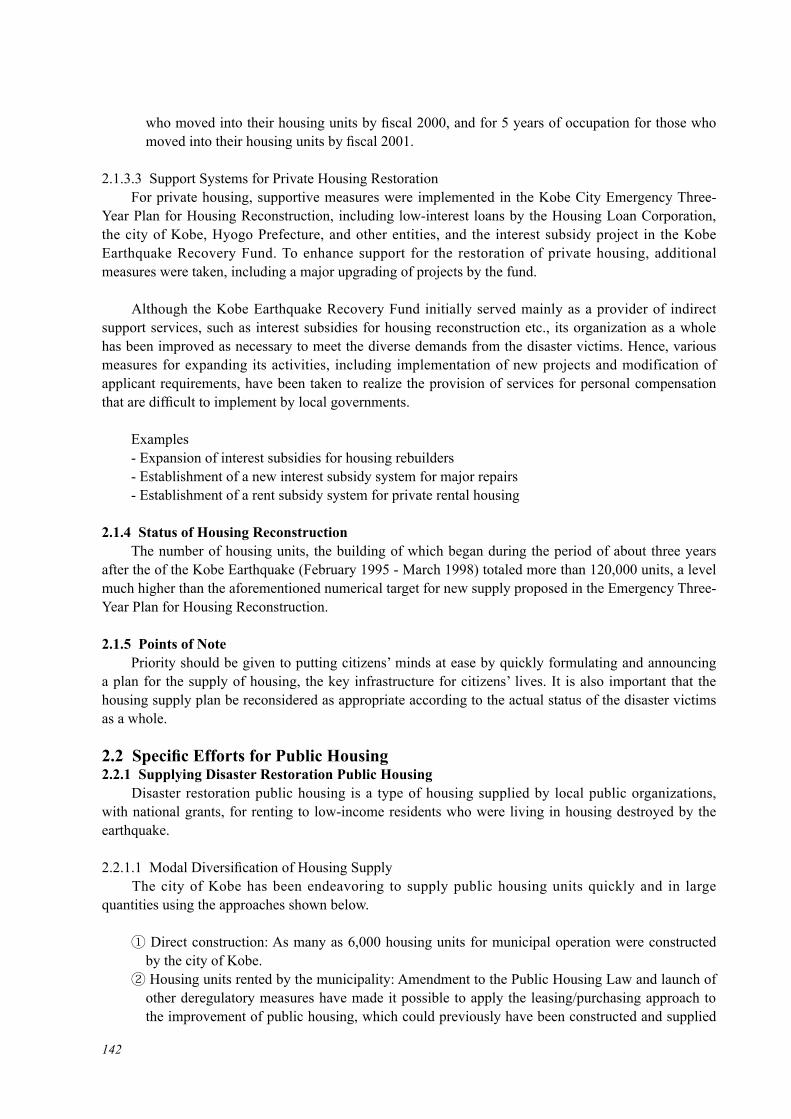
142
who moved into their housing units by fiscal 2000, and for 5 years of occupation for those who moved into their housing units by fiscal 2001.
2.1.3.3 Support Systems for Private Housing Restoration For private housing, supportive measures were implemented in the Kobe City Emergency Three-Year Plan for Housing Reconstruction, including low-interest loans by the Housing Loan Corporation, the city of Kobe, Hyogo Prefecture, and other entities, and the interest subsidy project in the Kobe Earthquake Recovery Fund. To enhance support for the restoration of private housing, additional measures were taken, including a major upgrading of projects by the fund.
Although the Kobe Earthquake Recovery Fund initially served mainly as a provider of indirect support services, such as interest subsidies for housing reconstruction etc., its organization as a whole has been improved as necessary to meet the diverse demands from the disaster victims. Hence, various measures for expanding its activities, including implementation of new projects and modification of applicant requirements, have been taken to realize the provision of services for personal compensation that are difficult to implement by local governments.
Examples- Expansion of interest subsidies for housing rebuilders- Establishment of a new interest subsidy system for major repairs- Establishment of a rent subsidy system for private rental housing
2.1.4 Status of Housing Reconstruction The number of housing units, the building of which began during the period of about three years after the of the Kobe Earthquake (February 1995 - March 1998) totaled more than 120,000 units, a level much higher than the aforementioned numerical target for new supply proposed in the Emergency Three-Year Plan for Housing Reconstruction.
2.1.5 Points of Note Priority should be given to putting citizens’ minds at ease by quickly formulating and announcing a plan for the supply of housing, the key infrastructure for citizens’ lives. It is also important that the housing supply plan be reconsidered as appropriate according to the actual status of the disaster victims as a whole.
2.2 Specific Efforts for Public Housing2.2.1 Supplying Disaster Restoration Public Housing Disaster restoration public housing is a type of housing supplied by local public organizations, with national grants, for renting to low-income residents who were living in housing destroyed by the earthquake.
2.2.1.1 Modal Diversification of Housing Supply The city of Kobe has been endeavoring to supply public housing units quickly and in large quantities using the approaches shown below.
① Direct construction: As many as 6,000 housing units for municipal operation were constructed by the city of Kobe.
② Housing units rented by the municipality: Amendment to the Public Housing Law and launch of other deregulatory measures have made it possible to apply the leasing/purchasing approach to the improvement of public housing, which could previously have been constructed and supplied

143
only directly by local public organizations. As a supplement to direct construction, the city of Kobe rented 6,000 housing units from the Urban Renaissance Agency and private sectors.
③ Others: Other public housing units supplied by the city of Kobe included housing units for residents who lost their previous housing due to land readjustment, urban re-development, comprehensive urban residential area improvement, and other projects.
2.2.1.2 Efforts for Cutting Construction Costs① Housing specification and standardization Standard housing design, component specification and standardization, etc. were introduced by the Disaster Restoration Public Housing Supply Association (consisting of the national government, Hyogo Prefectural Government, municipal (city and town) governments, and industrial associations concerned).② Consideration regarding mode of contract ordering A performance specification contract was adopted by way of trial, mainly for major housing complexes.
2.2.1.3 Considerations for the Elderly and Others① Design features: Inclusion of barrier-free features based in the Kobe Housing Design Standard
(KODES) manual etc.② Housing supply by type: Many victimized households consisted of either single or elderly adults;
small housing units befitting their lifestyles (e.g., making two dwelling units into one). Types S (40m2), M (50m2), L (60m2), and O (70m2) were supplied in a 2:4:3:1 ratio.③ Supply of housing for the elderly: Disaster restoration public housing units for the elderly
included barrier-free features and emergency communication equipment, with life support advisors (LSAs) allocated to provide a range of visits for elderly residents.④ Supply of collective housing: To allow residents to live a cooperative life, a new way of living
with common spaces for kitchens, dining rooms, and the like was proposed [applied to 218 units in 7 housing complexes in Kobe (87 units supplied by the city of Kobe and 131 units supplied by Hyogo Prefecture)].⑤ Housing units that allow residents to keep pets: For the sake of the mental health of the disaster
victims, a pilot program was implemented to allow residents of city-provided housing to keep companion animals, an otherwise prohibited act [168 units supplied in Kobe as a whole (69 units supplied by Kobe and 99 units supplied by Hyogo Prefecture)].
2.2.1.4 Considerations Regarding Tenant Selection① Consolidation of application for rental housing: Considering convenience for disaster victims,
the application procedure for public housing units provided by Hyogo Prefecture, the city of Kobe, Urban Renaissance Agency, and Kobe City Housing Supply Corporation was consolidated.② Temporary Housing Household Priority Category: A priority category was established to secure
a given occupancy rate for those in the priority category (60-80%).③ Socially Vulnerable Household Priority Category: A priority category was established for
socially vulnerable households, with priority ranking determined according to age and severity of disorder.④ Group tenant selection: Considerations were given to maintaining the valuable human
relationships formed in temporary housing.⑤ Community Development Priority Category: A priority category was established to make
housing complexes vibrant by a “social-mix approach” in which the transfer of young households, as well as the elderly, was promoted.
144
2.2.2 Supply of Public Housing2.2.2.1 Specially Designated High-Quality Rental Housing① A measure for victims in the middle-income class② Deregulation for certification criteria and construction standards, increase of grants for
construction expenditures, expansion of the amount of interest subsidy, etc.
2.2.2.2 Public Corporation Housing ① Contributions of the Urban Development Corporation (currently Urban Renaissance Agency,
UR) - Housing Corporation Specified Sold Housing for Rent Management by Private Sector System
[including ‘Toku-yu-chin’ (Disaster Reconstruction Specified Excellent Rented Housing Supply Promotion System) and ‘Min-kari-chin’ (privately leased rented housing system)]
- Construction of housing for previous residents (urban residential area comprehensive improvement support project)
- Supply of public housing units (construction of public housing units to be purchased or rented)② The role of municipal and prefectural housing supply corporations - Construction of housing for sale - Reconstruction of condominiums/apartments - Construction of specially designated high-quality rental housing
2.2.3 Points of Note Since there was an urgent need to supply a large number of disaster restoration public housing units in a short time, a broad range of efficient approaches to housing supply were adopted. Emphasis should be placed on providing housing in consideration of the fact that small households of the elderly made up most of the disaster victims.
2.3 Support for Reconstruction of Private Housing In facilitating the reconstruction of private housing, some issues arose, including financial shortages for home owners (particularly elderly owners and owners having double loans), complicated property rights of landowners and regulations by the Building Standards Law, and a lack of expert knowledge regarding housing reconstruction. To help solve these problems, support was provided in a wide variety of approaches and combined as appropriate.
2.3.1 Financial Support for Housing Loans① Kobe City Special Housing Loans for Recovery from the Disaster Reduction of interest [4.1% → 3.7% (currently 2.8%)], permission for double loans etc.② Housing Loan Corporation Housing Loans for Disaster-hit Regions Reduction of interest [4.35% → 4.15% (currently 1.5%)], elimination of site area restrictions etc.③ Housing Reconstruction Loans for Hyogo Prefecture Residents Reduction of interest [3.85% → 3.6% (currently 1.5%)]④ Establishment of the Kobe City Real Estate Disposition Type Special Loans System - Reverse mortgage type loans A financing system available for the elderly to allow them to borrow money for living expenses
on the security of their own real properties (land and buildings); the secured real properties to be disposed of for a lump sum repayment of the debt upon their death (financing limit: \15,000,000 and not more than 70% of the appraised value of the land etc.)

145
2.3.2 Kobe Earthquake Reconstruction Fund Programs 2.3.2.1 Support for Housing Reconstruction etc. (interest subsidies)
① Housing Support for Victims (construction and purchasing) An interest subsidy provided for victims who newly built or purchased a home (5 years, interest subsidy rate: 2.5% for Housing Loan Corporation loans, 1.925% for private
sector loans)② Support for Purchase and Construction of Disaster Restoration Housing An interest subsidy provided for victims who built or purchased a home within an area specified
in an area-clearing community development project (5 to 10 years, interest subsidy rate: initially 2.5%, reduced to 1% in the 6th year and beyond, for
Housing Loan Corporation loans; initially 1.925%, reduced to 0.5% in the 6th year and beyond, for private sector loans)③ Support for Reconstruction of Condominiums An interest subsidy provided for condominium owners who wished to reconstruct their disaster-
stricken condominiums and for victims who purchased a condominium whose reconstruction had been undertaken by a municipal or prefectural housing supply corporation or the like
(10 years, interest subsidy rate: the same as the above)④ Large-Scale Repairs An interest subsidy provided for victims who took out a loan for major repairs of their housing (5 years, interest subsidy rate: 2.5% for Housing Loan Corporation loans etc.; 1.65% for loans
from Hyogo Prefecture or the city of Kobe; and 1.925% for loans from the private sector)⑤ Support for Repair of Common Spaces of Disaster-stricken Condominiums An interest subsidy provided for condominium management associations etc. that repaired
common spaces of their disaster-hit condominiums (10 years, interest subsidy rate: initially 2.5%, reduced to 1% in the 6th year and beyond)
2.3.2.2 Support Systems for Joint/Cooperative Housing Reconstruction Projects In densely built-up areas with many old deteriorated homes/housing complexes, individual reconstruction projects often encounter difficult issues related to non-fulfillment of the lot frontage requirements of the Building Standards Law, such as small housing sites, narrow road widths, and lack of road contact as well as complicated property ownership issues. Hence, support was provided for housing reconstruction in some adjoining sites within the framework of joint or cooperative housing projects.
① Interest Subsidies to Help Joint Housing Projects for Private Houses Interest subsidies provided for disaster victims who built or purchased joint or cooperative
housing units on small or irregular lots (Interest subsidy period 10 years, interest subsidy rate: initially 2.5%, reduced to 1% in 6th year
and beyond, for Housing Loan Corporation loans; initially 1.925%, reduced to 0.5% in the 6th year and beyond, for private sector loans)② Monetary Support for Small-Scale Joint Reconstruction Projects etc. Expenses were partially subsidized for small-scale projects for joint housing reconstruction,
cooperative housing reconstruction, and condominium reconstruction not covered by national grant systems (Improvement Project to Provide Better Buildings etc.) because of the non-fulfillment of requirements concerning lot size etc.
(Applicable items: investigation/design/planning fees, land improvement expenditures, common facility improvement expenditures; subsidy rate: 2/3)

146
2.3.2.3 Monetary Support for Private Rental Housing① Rent Subsidy System for Private Housing Units For residents of private rental housing who lost their previous housing in the Kobe Earthquake,
the rents were partially assumed to lessen the financial burden.
2.3.2.4 Support Systems for Housing Reconstruction by the Elderly① Support System for Projects to Help Housing Reconstruction by the Elderly Monetary support provided for disaster victims of 65 years or older who constructed, purchased,
or repaired their housing with their own savings because of their age-related disqualification for loans and who fulfilled specified requirements (subsidy rate 5%, maximum of ¥570,000)② Interest Subsidies for Elderly Residents Receiving Special Loans (Real Property Disposition
Type) Interest subsidies provided for elderly victims who took a special loan for the elderly on the
condition of the disposal of their real properties and who met a given set of requirements for housing reconstruction (interest subsidy rate 3%, 10 years)③ Support System for Construction Projects for Collective Housing etc. for Disaster Victims Collective housing represents a new way of living with a focus on human relationships in
the community as the keynote for daily life. For disaster victims and housing builders who constructed collective housing and the like, expenditures for improvements of common dwelling spaces (spaces necessary for cooperative daily activities, including shared living rooms, shared dining rooms, and shared kitchens) are partially assumed.
(Investigation and design fees: ¥200,000/unit; building expenses for cooperative residential space: ¥950,000/unit; fittings/fixtures expenses for cooperative residential space: ¥200,000)
2.3.2.5 Measures against Double Housing Loans① Special Measures for Housing Loan Repayment Monetary support provided on the condition of given requirements (partial grants for repayment
of existing debts or interest subsidies for new debts) for disaster victims who built or purchased new housing or repaired their housing by means of housing loans provided for the victims while repaying their existing housing loans
[20% of existing unredeemed debt or 3% of outstanding new debt loan, whichever is lower (maximum of ¥3,000,000)]
2.3.2.6 Housing Reconstruction Consultation etc.① Support System for Comprehensive Housing Consultation Center Establishment and Operation
Projects Support provided for the establishment and operation of a comprehensive consultation center for
housing reconstruction etc.② Support System for Disaster Restoration Community Development Support Project Dispatch of community development advisers and consultants (who have expert knowledge
concerning community development and coordinate the interests of people and other tasks) etc.
2.3.3 Reconstruction of Condominiums/Apartments2.3.3.1 Making the Best Use of the Improvement Project to Provide Better Buildings To promote environmental improvements in urban districts and the supply of good urban housing, monetary support was provided for design fees and expenditures for common facilities (pathways, plazas, meeting centers, parking lots, etc.) involved in improvement projects to provide better buildings that contribute to the securing of vacant lots, joint land-use, construction of multistory housing and the like.

147
2.3.4 Information disclosure and physical human support2.3.4.1 Kobe Housing Exposition (June 1995 - March 1998) Advocating the themes of anti-disaster housing development and schematized housing development in joint/cooperative housing projects, a comprehensive information center for private housing unit reconstruction [comprehensive consultation on housing (architecture, laws, loans, tax affairs, etc.), consultation on effective land use, display of model houses, etc.] was operated with the cooperation of local contractors, house builders, and construction companies.
2.3.4.2 Kobe Housing and Machizukuri Center (a Kobe Earthquake Recovery Fund program)① Specialists were dispatched, including consultants and academic experts in joint/cooperative
housing projects, reconstruction of condominiums/apartments, community development, etc.② Support was provided to form residents’ consensus in the early stage of each project, drawing up
basic plans, project design, etc.
2.3.4.3 Comprehensive Housing Consultation Center (operated jointly with Hyogo Prefecture) (a Kobe Earthquake Recovery Fund program)
Various forms of consultation and information regarding loans, interest subsidies, taxation, legal affairs, architectural technology, and other issues concerning housing reconstruction were provided.
2.3.5 Support by Deregulation In urban areas where housing lots, mainly narrow ones, were densely, there were a great many housing sites where housing reconstruction was difficult because sites were fully occupied by buildings, roads were very narrow, or there was little or no road contact. In this situation, the restrictions of the Building Standards Law concerning floor area ratio, building-to-land ratio, lot frontage requirements, and the like were eased for such housing lots, provided that they met newly specified requirements for building setbacks from roads etc.
2.3.6 Points of Note To resolve various problems encountered by private housing owners in reconstructing their housing, including financial shortage and a lack of expert knowledge, emphasis should be placed not only on economic support, such as loans and grants, but also on providing a wide variety of other supportive services, including disclosure of useful data and information, consultation services in cooperation with private firms and the like, and legal deregulation for promoting housing reconstruction.
2.4 Evaluation2.4.1 Efforts for Public Housing
① If a large number of disaster restoration public housing units were newly built, responsibility for their management would have to be extended over several decades following the earthquake. Considering the long-term management costs for public housing units and the balance of housing availability in Kobe, emphasis should be placed on leasing private rental housing units for a given period, rather than on new construction by the city of Kobe.② If it is difficult to secure a sufficient supply of disaster restoration public housing units by means
of leasing private rental housing by the city, it is necessary to provide rent subsidies for private rental housing for a given period. Another key to securing the supply is to enhance the support for interest subsidies and the like to promote the new construction of private rental housing units.③ In the transition from urgently supplied temporary housing to public housing, many victims were
obliged to move away from their previous addresses to places throughout Kobe, and valuable human relationships in the previous community were lost. Hence, adequate consideration must be given to the previous community for such victims upon moving to public housing units.
148
④ Since elderly victims rank high in priority selection for transfer to public housing units, the aging of residents of disaster restoration public housing units is an unavoidable concern. For this reason, it is essential to establish a visiting and observing system for single elderly residents as early as possible. Tenant selection should also consider the community mix to combine elderly residents and child-caring households or young households.
2.4.2 Support for Reconstruction of Private Housing① The comprehensive housing consultation system must be upgraded to deal with a broad range of
issues concerning housing reconstruction presented by citizens.② Considering the fact that it took a very long time for some disaster-hit condominiums to be
reconstructed, dispatch of specialists, financial aid, and other forms of support must be enhanced.
2.5 Conclusion① Regarding public housing units, it is important that the right housing units befitting the attributes
and specific needs of victims be supplied by a variety of approaches as early as possible. Additionally, focus must be placed on taking into account the ages and household compositions of victims whose homes were destroyed as well as the human relationships they had in their previous communities.② As for reconstruction of private housing, a broad range of supportive measures must be
implemented on an integrated basis in order to cope with the diverse problems faced by their owners in housing reconstruction.③ Emergency measures must be formulated in advance based on good human relationships in local
communities during normal times as well as housing consultation systems and the like.

CHAPTER 3
City Planning & Urban Renewal

150
1 Basic Concept
1.1 Disaster Status and Recovery Processes1.1.1 Location and Characteristics of the Disaster-Affected Urban Area Seriously damaged by the Kobe Earthquake, the central urban area of Kobe faces Osaka Bay and extends along the bay. This area comprises hillside housing complexes lying to the south of the Rokko Mountains and alluvial fans made by small- to medium-sized rivers. Looking at the disaster-affected area by city ward, damage where the ratio of the number of building damaged to the extent of 50% or greater destruction (including fire damage) to the total number of buildings existing before the earthquake exceeded 50% occurred in some areas. Those areas of greater damage were mostly in the western inner area in Nagata and Hyogo Wards, the eastern inner area around Rokkomichi Station in Nada Ward, and the eastern area of Higashinada Ward (see Figure 1).
Analysis of the distribution of these seriously affected areas shows that they are mostly the areas that survived World War II and were excluded from subsequent urban improvement programs, resulting in the deterioration of buildings and delays in city renewal, which can be said to be the cause of the intensified earthquake damage (see Figure 2).
Another fact of note is that these areas had been said, from before the earthquake, to involve “inner city” issues, including community population reductions and aging, as well as decreased regional vibrancy. As such, the areas were targeted for community development measures by the city of Kobe, such as in the City Redevelopment Policy (1985), which is based on the Urban Renewal Act, and the Kobe City Basic Plan for Comprehensive Inner City Improvement (1989). In this sense, the earthquake disaster can be described as a megalopolis disaster that occurred just when the city was facing a new task regarding inner-city development, following completion of the war damage restoration and subsequent urban infrastructure improvements during the age of high economic growth.
Figure 1. The State of Damage in Kobe (ratio of destroyed* buildings to total buildings)* buildings damaged to the extent of 50% or greater destruction including fire damage
Disaster Restoration Promotion Districts
Ratio of destroyed buildings: 0-40%Ratio of destroyed buildings: 41-60%Ratio of destroyed buildings: 61-80%Ratio of destroyed buildings: 81-100%

151
1.1.2 Recovery Process and City Planning/Housing The efforts for recovery and restoration by the disaster-affected local governments after the earthquake involved various and extensive aspects with all of them entangled with each other. The time period of disaster recovery and restoration can be broadly divided into five phases. Described below are contributory activities conducted in the respective phases in relation to disaster-restoration community development, including city planning, housing policies, and building administration.
1.1.2.1 Emergency Response Phase (from just after the earthquake to 1 month later) The first phase was an immediate response phase for 1 month from just after the onset of the earthquake. There was extreme confusion in all fields and levels of administration, but the initial responses began with activities for saving the lives of victims and measures for preventing secondary disasters. Contributory efforts begun in this period include measures for refugees, including the securing of places of refuge, restoration of lifeline facilities, and traffic networks, elimination and disposal of building debris, emergent seismic risk evaluations for communal and other buildings, construction of housing units as emergency dwellings (temporary housing), and issuance of damage certification.
Concurrently with these emergency measures, the city of Kobe first established the Headquarters for Reconstruction following the Kobe Earthquake Disaster on January 26 and launched its Basic Policy for Emergency Improvements of Earthquake Disaster Restoration Urban Area Housing on January 31. On February 1, building restrictions based on Article 84 of the Building Standard Law were inaugurated for damaged urban areas, mainly those later designated as city planning project zones.
It is assumed that by February 1 the basic policy and main particulars for disaster- restoration community development projects in Kobe, including city planning projects, Emergency Three-Year Plan for Housing Reconstruction, and the Emergency Earthquake Reconstruction Ordinance, had been almost completed. Unfortunately however, the media did not accurately report the relevant announcements given in those days amid the confusion immediately following the earthquake.
1.1.2.2 Emergency Restoration Phase (from 1 month to 3 months after the earthquake) This phase was characterized by temporary recovery, in which measures started in the previous phase, such as emergent seismic risk evaluations, provision of housing units as emergency dwellings, and issuance of damage certification. At the same time, this period was also characterized by the inauguration of full-scale efforts for disaster restoration; hence, it can be viewed as a preparatory phase for restoration planning. In the city of Kobe, the Emergency Earthquake Reconstruction Ordinance
Figure 2. Areas Afflicted by World War II and Subsequent Land Readjustment
War-afflicted areasLand readjustment project districtsUrban redevelopment project districts

152
was promulgated and went into effect on February 16, and Disaster Restoration Promotion Districts (approx. 5,887 ha in total) were designated on the basis of this ordinance. Regarding the reconstructive city plan, the Special Act for Disaster Afflicted Urban Areas was promulgated and enforced on February 26; a basic framework for the restoration planning was determined with a focus on legal systems. On March 17, city planning decisions were made for land readjustment projects (6 districts, 125 ha) and urban redevelopment projects (2 districts, 26 ha). On the same day, the improvement plan for the Urban Residential Area Comprehensive Improvement Project (8 districts, 824 ha) was approved by the Minister of Construction, and Priority Restoration Districts (24 districts, 1,225 ha) were designated. With regard to the city planning decisions concerning land readjustment projects and urban redevelopment projects, various disputes arose, including opposition from local residents.
While these administrative procedures for reconstructive city planning were being made, the Kobe City Recovery Plan Guidelines were published on March 27, marking a milestone for formulating extensive programs toward recovery of the city as a whole.
1.1.2.3 Full-Scale Recovery Phase 1 (from 3 months to 6 months after the earthquake) This is a disaster-restoration community development initiation period in which systems for disaster-restoration community development began to gain firm footings. In this phase, a city planning decision was made to designate five sites for regional development in Sannomiya District on April 28, and disaster recovery plans toward full-scale reconstruction were drawn up, including the formulation of the Kobe City Recovery Plan (June 30) and the Kobe City Emergency Three-Year Plan for Housing Reconstruction (July 7). Additionally, a broad range of recovery support measures for housing reconstruction and community development were inaugurated, including the Kobe Housing Exposition, the Kobe Housing and Machizukuri Center, the Kobe Earthquake Recovery Fund, measures for reconstruction of existing non-conforming buildings, and aid for reconstruction of communal/cooperative housing and condominiums.
1.1.2.4 Full-Scale Recovery Phase 2 (from 6 months to 1 year after the earthquake) A firm footing was acquired for temporary recovery measures, including completion of emergency housing (August 11) and the start of centralized tenant selection for disaster restoration public housing units and registration of applicants (October 31). Self-reconstruction activities for housing and other facilities, as well as efforts for disaster-restoration community development by local community councils, mainly in reconstructive city planning project areas, became evident. Other activities started in this period include public notification of the first project plan for the earthquake disaster rehabilitation land readjustment project for Takatori Higashi District 1 (November 30) and city planning concerning a land readjustment project etc. for the New Eastern City Center District, expected to be the leading project for disaster restoration (December 27). Meanwhile, various issues, including welfare, the environment, culture, and the economy, emerged with growing concern in the context of expediting livelihood restoration and development of housing and community toward full-scale reconstruction.
1.1.2.5 Full-Scale Recovery Phase 3 (from 1 year after the earthquake) Reconstructive city planning projects went into full-scale operation. City planning decisions were made for various districts, including the earthquake disaster rehabilitation land readjustment project for the Rokkomichi Station Nishi District and Matsumoto District (March 26) and the urban redevelopment project for the Rokkomichi Station Minami District 1 (March 28). On June 22, a commemorative ceremony was held for the start of the project for the New Eastern City Center District. Other housing improvement measures taken in this period included the expansion of disaster restoration public housing supply and rent reduction, in preparation for shifting to permanent housing (June 30), and enhancement of support for private housing by establishing a rent subsidy system (July 24). Meanwhile, new demands
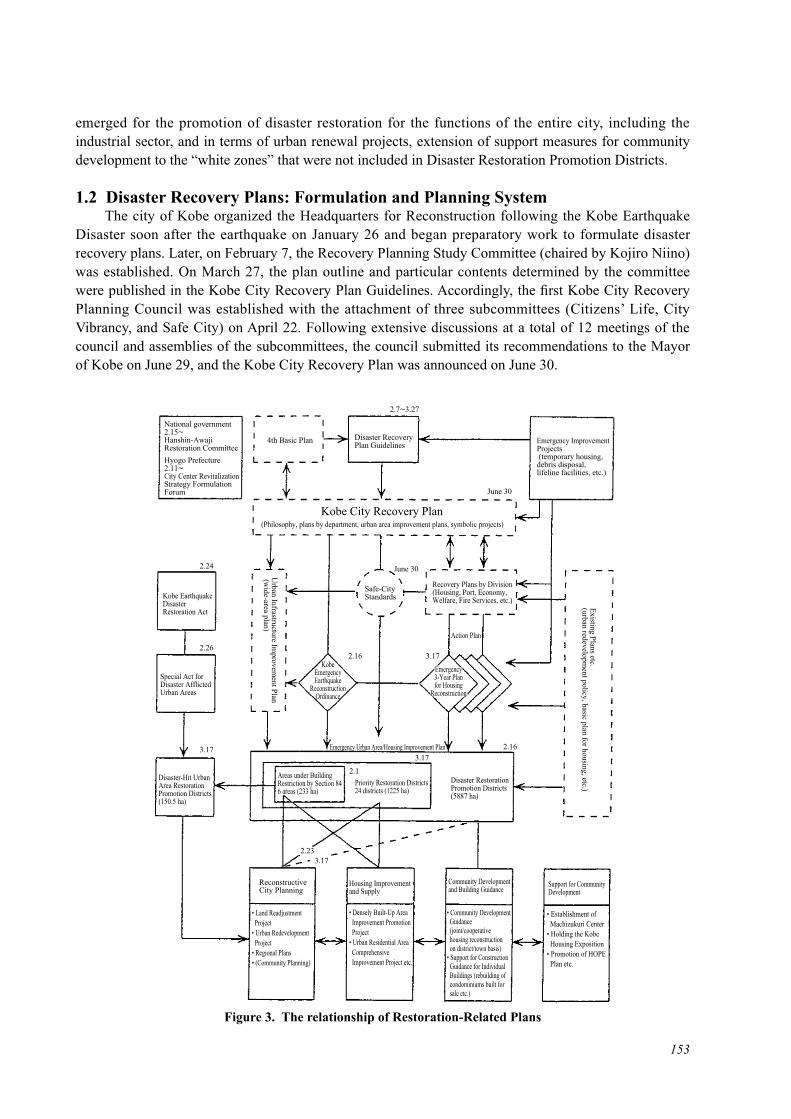
153
emerged for the promotion of disaster restoration for the functions of the entire city, including the industrial sector, and in terms of urban renewal projects, extension of support measures for community development to the “white zones” that were not included in Disaster Restoration Promotion Districts.
1.2 Disaster Recovery Plans: Formulation and Planning System The city of Kobe organized the Headquarters for Reconstruction following the Kobe Earthquake Disaster soon after the earthquake on January 26 and began preparatory work to formulate disaster recovery plans. Later, on February 7, the Recovery Planning Study Committee (chaired by Kojiro Niino) was established. On March 27, the plan outline and particular contents determined by the committee were published in the Kobe City Recovery Plan Guidelines. Accordingly, the first Kobe City Recovery Planning Council was established with the attachment of three subcommittees (Citizens’ Life, City Vibrancy, and Safe City) on April 22. Following extensive discussions at a total of 12 meetings of the council and assemblies of the subcommittees, the council submitted its recommendations to the Mayor of Kobe on June 29, and the Kobe City Recovery Plan was announced on June 30.
Figure 3. The relationship of Restoration-Related Plans
National government2.15~Hanshin-Awaji Restoration Committee
4th Basic Plan
2.7~3.27
June 30
June 30
Safe-City StandardsKobe Earthquake
Disaster Restoration Act
Special Act for Disaster Afflicted Urban Areas
Disaster-Hit Urban Area Restoration Promotion Districts (150.5 ha)
Reconstructive City Planning
• Land Readjustment Project• Urban Redevelopment Project• Regional Plans• (Community Planning)
Housing Improvement and Supply
• Densely Built-Up Area Improvement Promotion Project• Urban Residential Area Comprehensive Improvement Project etc.
Community Development and Building Guidance
• Community Development Guidance (joint/cooperative housing reconstruction on district/town basis)• Support for Construction Guidance for Individual Buildings (rebuilding of condominiums built for sale etc.)
Support for Community Development
• Establishment of Machizukuri Center• Holding the Kobe Housing Exposition• Promotion of HOPE Plan etc.
Emergency Urban Area/Housing Improvement Plan
Existing Plans etc. (urban redevelopm
ent policy, basic plan for housing, etc.)
KobeEmergencyEarthquake
ReconstructionOrdinance
Emergency3-Year Planfor Housing
Reconstruction
Emergency3-Year Planfor Housing
Reconstruction
Action Plan
Recovery Plans by Division (Housing, Port, Economy, Welfare, Fire Services, etc.)
2.24
Urban Infrastructure Im
provement Plan
(wide-area plan)
2.26
3.17
2.16
2.1
2.233.17
Areas under BuildingRestriction by Section 846 areas (233 ha)
Priority Restoration Districts24 districts (1225 ha)
Disaster Restoration Promotion Districts (5887 ha)
3.17
3.172.16
Kobe City Recovery Plan(Philosophy, plans by department, urban area improvement plans, symbolic projects)
Disaster Recovery Plan Guidelines Emergency Improvement
Projects (temporary housing, debris disposal, lifeline facilities, etc.)
Hyogo Prefecture2.11~City Center Revitalization Strategy Formulation Forum
154
The plan consisted of six parts: ① Basic Concept for Recovery, ② Recovery Plans by Goal, ③Creation of a Safe City, ④ Urban Area Recovery Plans, ⑤ Symbolic Projects, and ⑥ Preparation for Implementation. Great consideration was given to the 4th Kobe City Basic Plan and the Ward Plan, which had been drawn up just before the earthquake, when compiling this plan.
Regarding the Urban Area Recovery Plans, based on the reconstructive city plan then underway in advance as an emergency measure, a fundamental viewpoint regarding community development in the Disaster Restoration Promotion Districts (specified by the Emergency Earthquake Reconstruction Ordinance) was presented; regional recovery plans were drawn up for the three areas (central urban area, eastern urban area, and western urban area). Hence, judging from the background of their formulation, the disaster recovery plans were not necessarily superior to the reconstructive city plan; rather, they should be viewed as covering broader areas and longer time spans.
The administrative actions taken after the earthquake were broadly divided into 4 groups: ①implementation of emergency measures, including the recovery of lifeline supplies, such as city water, electricity, and gas, construction of emergency temporary housing, and disposal of building debris; ②formulation of urban area/housing emergency improvement plans (Disaster Restoration City Plan, the Emergency Earthquake Reconstruction Ordinance, and Emergency Three-Year Plan for Housing Reconstruction); ③ formulation of an overall recovery (basic) plan; and ④ formulation of action plans by each department and bureau. In the early recovery phase, these administrative actions were not always consistent in terms of time sequence, because they were carried out concurrently and also because priority was given to projects requiring coordination with the national and Hyogo Prefectural governments and those very urgently needed (see Figure 3).
1.3 Emergency Earthquake Reconstruction Ordinance and Regional Framework for Urban Renewal
Amid the social confusion after the earthquake, the city of Kobe launched various measures for disaster-restoration community development, including city planning projects and the Emergency Earthquake Reconstruction Ordinance, in a relatively short period. In particular, the Emergency Earthquake Reconstruction Ordinance, formulated just a month after the earthquake, provided the basic framework for the urban area restoration activities that followed. This ordinance included a double zoning policy to designate Disaster Restoration Promotion Districts for urban area restoration and Priority Restoration Districts for promotion of both housing supply and urban area improvements and was operated as a time-limited ordinance that would be in force for only three years after the day of promulgation. Based on this zoning, notices of building work etc. became mandatory and disclosure of information on future community development projects, provision of advice on building disaster prevention, and guidance concerning joint housing were specified as new measures. For the Priority Restoration Districts, in particular, the ordinance allowed administrative guidance for building projects in conformity with the goals of community improvement.
Simultaneously with the formulation of the abovementioned ordinance, Disaster Restoration Promotion Districts were designated, apart from the disaster-affected urban areas, as those in need of the creation of disaster-resistant communities in harmony with the disaster restoration projects etc. Specifically, the designated districts were between Suma and Higashinada Wards and consisted of Category-1 Urban Areas (approx. 4,780 ha), zoned on the basis of the Urban Renewal Act, and the Port of Kobe District (approx. 1,107 ha, excluding Port Island and Rokko Island), covering approximately 5,887 ha in total. Areas where buildings were severely damaged or lost by fire over a large area and where city function restoration, housing supply, urban infrastructure improvements, and other urban area improvements should be promoted promptly and extensively to facilitate the development of disaster-

155
resistant communities were designated as Priority Restoration Districts within the Disaster Restoration Promotion Districts. These districts were designated with fixed goals of regional improvement by the Mayor of the city of Kobe and can be described as corresponding to Category-2 Urban Areas based on the Urban Renewal Act. In the city of Kobe, Priority Restoration Districts (24 locations, 1,225 ha) were designated on March 17, on which day the relevant city planning decision was made and the project plan for the urban residential area comprehensive improvement project was approved by the Minister of Construction. As such, the Priority Restoration Districts consisted of ① areas covered by city planning projects, ② areas around the districts in ① where the damage was so great that unified improvements were required, ③ areas where local residents’ activities such as community councils had been available since before the quake, and ④ areas positioned as improvement bases, including city sub-centers, in existing schemes such as redevelopment policies that had been implemented since before the earthquake. In these districts, housing supply and housing environmental improvements were promoted under the Urban Residential Area Comprehensive Improvement Project and other voluntary projects without legal basis, such as Densely Built-up Area Improvement Promotion Projects. The system allowed additional designations for Priority Restoration Districts within the Disaster Restoration Promotion Districts whenever necessary to afford newly emerging initiatives for community development.
It seems that designation of these districts in the regional zoning scheme was significantly influenced by political discretion and measures on the before-mentioned inner city issues and urban area improvement measures. This can also be realized from, for example, the zoning method for the Disaster Restoration Promotion Districts and Priority Restoration Districts, which correspond to Category-1 and Category-2 Urban Areas in the redevelopment policy, respectively, and from the designation criteria for the Priority Restoration Districts including city planning project areas (not only ① areas where many buildings were lost by fire and those where many buildings had damage resulting in 50% or greater destruction but also ② areas where projects for developing restoration centers, including city sub-centers, had been underway before the earthquake and ③ areas where activities by local residents, such as community councils, had been available before the earthquake).
Through such district zoning, the regional framework, which was later subject to the reconstructive city plan, was established: “black zones” (the city planning project districts specified in the land
Figure 4. Designated Areas under the Kobe Emergency Earthquake Reconstruction Ordinance
24. Shin-Nagata24. Shin-Nagata
Disaster Restoration Promotion Districts
Priority Restoration Districts
1. Mori-Minami
2. Fukae
3. JR Sumiyoshi Station area
4. Rokkomichi area5. Toga area
6. Shinzaike-Minami
7. Kawahara-Nishi8. Midoro
9. Sannomiya area
10. New Eastern City Center10. New Eastern City Center
11. Shinkaichi area12. Nishide-Higashide-Higashikawasaki
13. Matsumoto area
14. Canal Town Hyogo15. Hamayama
16. Nagata and Daikai Stations area17. Misuga
18. Northern Shiriike
19. Mano
20. Shin-Nagata area
21. Omichi area
22. Shinyo
23. Rokko

156
readjustment projects and urban renewal projects), “gray zones” (Priority Restoration Districts excluding the city planning project districts), and white zones (see Figure 4).
1.4 Urban Renewal Projects1.4.1 City Planning Projects Related to Earthquake Restoration Regarding city planning projects related to disaster restoration in Kobe, seven districts, five for land readjustment projects and two for urban redevelopment, were designated for advance implementation in the context of a key project for public-led urban restoration.
These were earthquake reconstructive city planning project districts, which were later called black zones. The city planning decision for the Kobe was made based on the following time course: a draft was approved on February 23 (news bulletin entitled “Shinsai News” distributed to all households); public notices and inspections were started on February 28 (until March 13); the plan was approved at the March 14 meeting of the Kobe City Recovery Planning Council and at the March 16 meeting of the Hyogo Prefecture City Planning Council; the decision was made by the Governor of Hyogo Prefecture on March 17. Toward such decision making, the city of Kobe is said to have begun studies concerning city plans or government-led construction measures for reconstruction of the disaster-hit urban areas based on its internal surveys on actual damage due to the disaster, which were started soon after the earthquake. It is said that extensive discussions by the national government (Ministry of Construction) and Hyogo Prefectural government commenced about one week after the earthquake. In these working-level conferences, project schemes for specified districts and their operation were reportedly discussed first. At that stage, the framework of the current restoration city planning, to which existing laws such as the City Planning Act and the Building Standard Law were applied in a flexible manner at the discretion of the administrative authority, was more or less already established.
Behind these quick actions were the facts that the national government and experts urged Kobe to implement effective measures as early as possible, in view of past cases of restoration following grave disasters, including the Great Sakata Fire (1976); that the administrative personnel in charge of care for the disaster victims had a strong sense of mission; and that they judged it essential to secure national grants. These swift emergency responses by the government, however, faced opposition from some residents who felt a gap between the anxiety about their immediate livelihood restoration and the government’s community restoration plan, a sense of unacceptability concerning the plan, and distrust of the consensus formation procedures, all of which led to a number of disputes in various fields. In the process of making the city planning decision under such circumstances, Kobe adopted a two-stage decision scheme for land readjustment projects; the 1st stage concerned zoning (areas where projects were to be implemented and areas to be designated as disaster-hit urban renewal promotion districts), and the 2nd stage concerned planning decision making for core city facilities (city streets and neighboring parks). Regarding urban redevelopment projects, some of the plans were revised in the process of implementation based on suggestions and proposals by community councils.
Following the initial city planning decisions, the Special Act for Disaster Afflicted Urban Areas was applied (for city planning decision making for designated Disaster Restoration Promotion Districts) to the small-scale land readjustment projects (mini-land readjustment projects) under the Land Readjustment Act in two districts in Kobe [Minatogawa 1- and 2-chome district in Hyogo Ward (approx. 1.5 ha) and Kamimaecho 2-chome Kita district in Nada Ward (approx. 0.5 ha)]. Hence, these two districts enjoyed preferential earthquake disaster measures, including easing requirements regarding building scale and city facilities, as well as national grants. In urban areas densely occupied by wooden houses, considered poor infrastructures, narrow housing sites and bad lot frontage were prevalent, no effective project schemes existed within the existing systems. Despite the unfavorable situation, it

157
deserves special mention that residential street improvements by land exchange and amalgamation and self-reconstruction of housing were implemented
Apart from these city planning projects positioned as emergency disaster restoration programs, ongoing projects that had already been underway before the earthquake and scheduled projects being planned were also later implemented one after another as disaster restoration-related projects with due revision of their contents. In particular, the large-scale land development project for the Kobe New Eastern City Center District (land readjustment project, 75 ha) has been attracting attention as the leading project in the waterfront development initiative for a seaside area adjoining an existing urban area. In a symbolic project for the Kobe City Recovery Plan, comprehensive improvements were implemented in an approximately 120-hectare area including land use conversion of idle factory sites in the bay area owned by Kobe Steel, Ltd. and Kawasaki Steel Corporation (approx. 75 ha) and the surrounding areas; this project played a leading role in urban area reconstruction as it provided land for various urban functions, including disaster restoration public housing and other public housing, as well as for use by industries.
Other disaster restoration-related city planning activities included regional planning for the Sannomiya District (5 sites, 70.6 ha), and street improvement projects for city roads (10 routes in 13 districts, including the Yamate Kansen Morikita District).
1.4.2 Housing-Related Urban Renewal Projects Project schemes for urban renewal in the so-called gray zone included residential area development based on the Residential Areas Improvement Act, as well as optional projects not covered by legal systems, i.e., Urban Residential Area Comprehensive Improvement Projects and Densely Built-up Residential Area Improvement Promotion Projects.
In the Kobe, projects for residential area development were implemented only for the ongoing projects begun before the quake in four districts (5.48 ha in total): ① Toga (0.82 ha), ② Bancho-4 (1.27 ha), ③ Bancho-5 (3.14 ha), and ④ Higashikawasaki 7-chome (0.25 ha).
On the other hand, in the above two optional projects, residential area restoration was promoted using a wide variety of approaches combined as appropriate, including grants for joint housing programs, lot procurement, construction, and rent subsidies for public and semi-public housing, and improvement of related public facilities.
For the Urban Residential Area Comprehensive Improvement Project, the renewal plans (8 districts, 824 ha) were approved by the Minister of Construction on March 17. It should be noted that these project districts include those designated before the earthquake and that newly designated districts include areas of reconstructive city planning projects (black zones). Such districts are designated in duplicate for the purpose of promoting both construction and supply of housing as a part of project promotion (rental dwellings for previous tenants). The subject eight districts were: ① Rokko (296.7 ha), ② areas around the New Eastern City Center (168.1 ha), ③ areas around Kobe Station (58.0 ha), ④ areas around Matsumoto (22.4 ha), ⑤ the area south of Hyogo Station (35.6 ha), ⑥ Misuga (29.1 ha), ⑦ Shinyo (8.2 ha), and ⑧ Shin-Nagata (224.0 ha). Three of them ( ③ , ⑤ , and ⑦ ) were those designated before the earthquake.
In Kobe, there are nine districts (508.9 ha in total) designated as Densely Built-Up Residential Area Improvement Promotion Project Districts: ① Fukae (49.1 ha), ② Harada-Iwaya (86.9 ha), ③Miyamoto-Azuma (98.9 ha), ④ Nishide-Higashide- Higashikawasaki (22.6 ha), ⑤ Hamayama (25.0
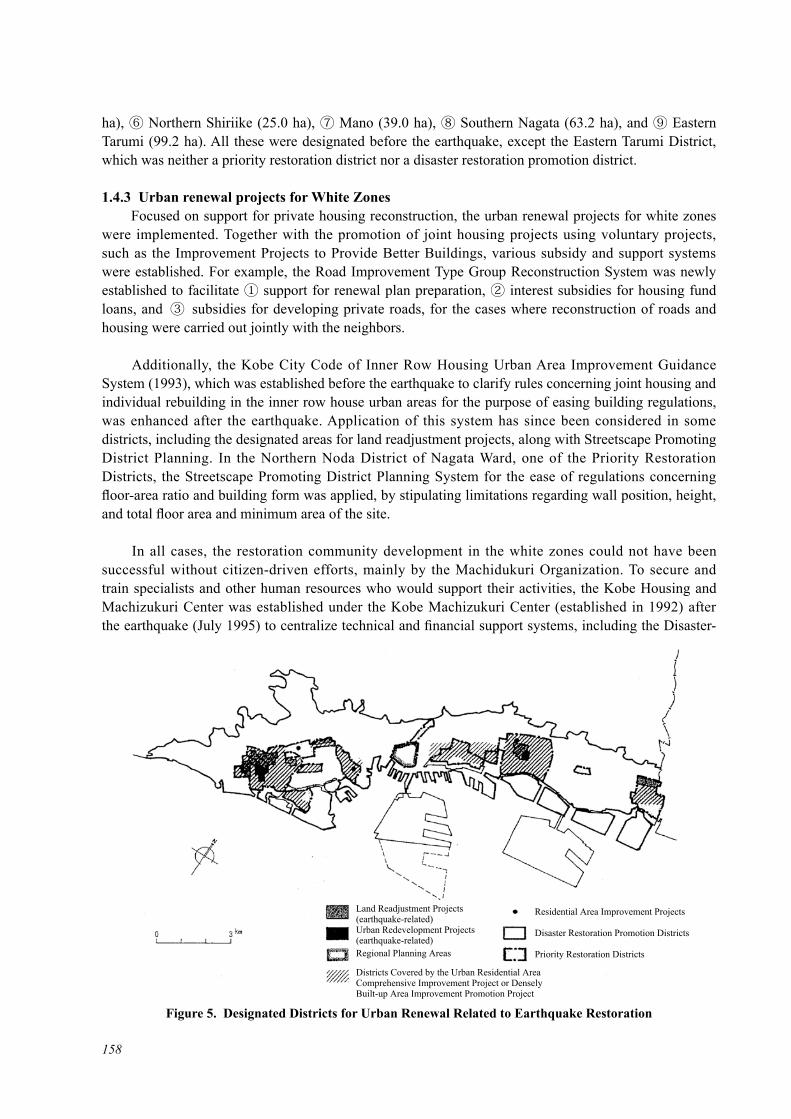
158
ha), ⑥ Northern Shiriike (25.0 ha), ⑦ Mano (39.0 ha), ⑧ Southern Nagata (63.2 ha), and ⑨ Eastern Tarumi (99.2 ha). All these were designated before the earthquake, except the Eastern Tarumi District, which was neither a priority restoration district nor a disaster restoration promotion district.
1.4.3 Urban renewal projects for White Zones Focused on support for private housing reconstruction, the urban renewal projects for white zones were implemented. Together with the promotion of joint housing projects using voluntary projects, such as the Improvement Projects to Provide Better Buildings, various subsidy and support systems were established. For example, the Road Improvement Type Group Reconstruction System was newly established to facilitate ① support for renewal plan preparation, ② interest subsidies for housing fund loans, and ③ subsidies for developing private roads, for the cases where reconstruction of roads and housing were carried out jointly with the neighbors.
Additionally, the Kobe City Code of Inner Row Housing Urban Area Improvement Guidance System (1993), which was established before the earthquake to clarify rules concerning joint housing and individual rebuilding in the inner row house urban areas for the purpose of easing building regulations, was enhanced after the earthquake. Application of this system has since been considered in some districts, including the designated areas for land readjustment projects, along with Streetscape Promoting District Planning. In the Northern Noda District of Nagata Ward, one of the Priority Restoration Districts, the Streetscape Promoting District Planning System for the ease of regulations concerning floor-area ratio and building form was applied, by stipulating limitations regarding wall position, height, and total floor area and minimum area of the site.
In all cases, the restoration community development in the white zones could not have been successful without citizen-driven efforts, mainly by the Machidukuri Organization. To secure and train specialists and other human resources who would support their activities, the Kobe Housing and Machizukuri Center was established under the Kobe Machizukuri Center (established in 1992) after the earthquake (July 1995) to centralize technical and financial support systems, including the Disaster-
Figure 5. Designated Districts for Urban Renewal Related to Earthquake Restoration
Land Readjustment Projects (earthquake-related)Urban Redevelopment Projects (earthquake-related)Regional Planning Areas
Districts Covered by the Urban Residential Area Comprehensive Improvement Project or Densely Built-up Area Improvement Promotion Project
Residential Area Improvement Projects
Disaster Restoration Promotion Districts
Priority Restoration Districts

159
Restoration Community Development Support Project.
1.5 Recovery Status and Challenges Concerning Disaster-Restoration Community Development
Three years after the earthquake, the population of Kobe as a whole began to return to the pre-earthquake level, and there was steady progress in housing recovery in terms of overall supply of housing units; the number of housing units constructed exceeded the number of those destroyed. However, looking into individual districts in the disaster-affected areas, some districts had enjoyed a steady reconstruction progress, and others had not; regional gaps emerged over time in the progression of disaster recovery and restoration. For example, when studying the recovery status of each district in relation to the destroyed (damage resulting in 50% or greater destruction) building ratio and the degree of recovery (number of filed applications for building certification/number of destroyed buildings) and comparing those values with the average values for urban areas, a tendency for slower progress of reconstruction was conspicuous in the western areas compared with the eastern urban areas, and the degrees of recovery were also low for areas covered by the reconstructive city planning projects currently underway (see Figure 6).
In summary, while the efforts for disaster-restoration community development were gradually getting underway, many problems remained unsolved with respect to urban renewal. Described below are some issues concerning planning systems for disaster-restoration community development.
The first issue concerned the lack or delay of a basic policy or plan for restoration for the disaster-affected urban area as a whole. Individual project plans, mainly for the areas with extremely severe damage, were promptly drawn up soon after the earthquake. While the city planning decision made two months after the earthquake was appreciated as an emergency measure, some people criticized the municipal actions for their lack of legal justification concerning the white zones, which are located outside the project areas. In Kobe, designated zoning has been carried out based on the Emergency Earthquake Reconstruction Ordinance, but the Priority Restoration Districts cover only 20% of the entire afflicted urban area (Disaster Restoration Promotion Districts). In order to further promote urban restoration, efforts for restoration in such white zones, especially densely built-up areas, are vital. To this end, there were urgent demands to establish an Urban Area Joint Revitalization System based on small-scale improvement community development with a focus on safety (disaster prevention), security (welfare), and amenity (landscape) in densely built-up urban areas and for its implementation.
It is also anticipated that, rather than carrying out stereotypical community development for the white zones, appropriate support measures will be taken, while having a clear understanding of regional circumstances such as the status of recovery progression and community development, and required infrastructure, by preparing “disaster restoration records”.
The second issue concerned how to implement large area programs, including trunk roads and large parks. Regarding the planning for city facilities, such as roads and parks within city planning project areas, there were discussions concerning their relevance to surrounding urban areas and their position in the entire urban structure (consistency between overall plan and segmented plans). The Kobe City Disaster Restoration Plan formulated half a year after the earthquake included proposals of disaster restoration measures for urban renewal as well as for urban core structure and wide-area plans (e.g., improvement of disaster-prevention green belts and disaster-prevention centers as disaster-resistant city infrastructures). However, as far as the Act on Special Measures Concerning Reconstruction of Urban Districts Damaged by Disaster and other existing reconstructive city planning systems are concerned, new projects for such wide-area facilities are not regarded as emergency improvement projects. It is
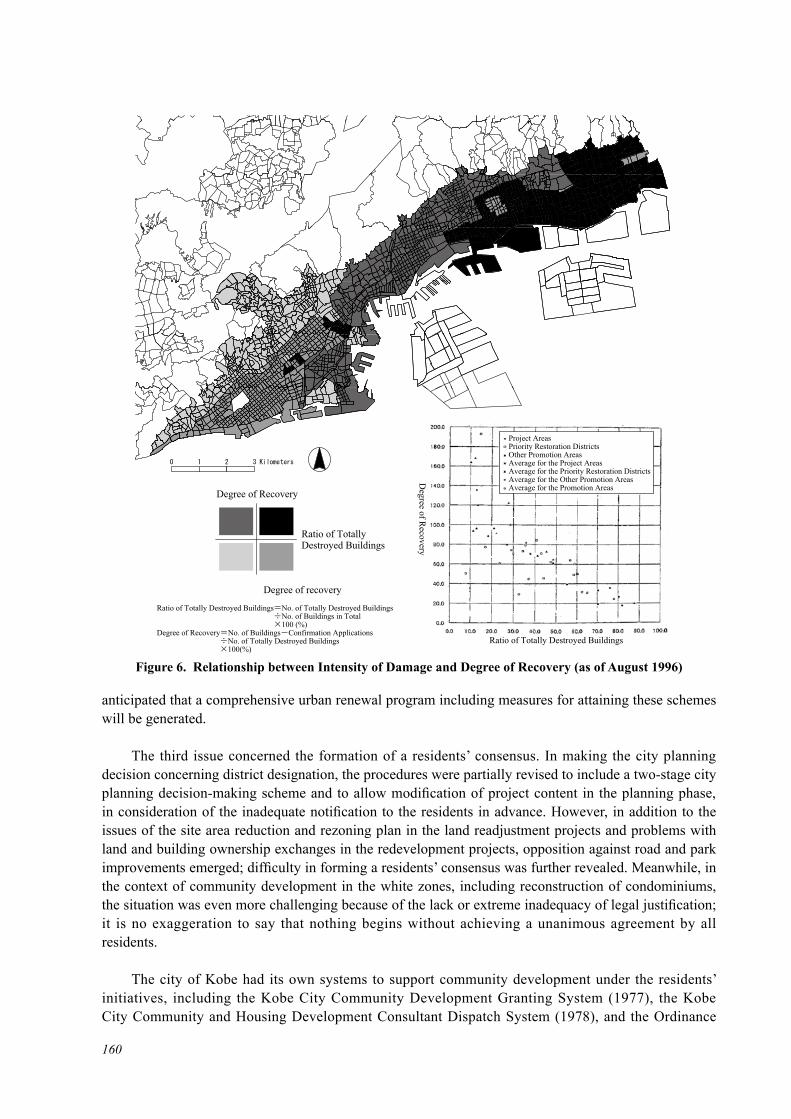
160
anticipated that a comprehensive urban renewal program including measures for attaining these schemes will be generated.
The third issue concerned the formation of a residents’ consensus. In making the city planning decision concerning district designation, the procedures were partially revised to include a two-stage city planning decision-making scheme and to allow modification of project content in the planning phase, in consideration of the inadequate notification to the residents in advance. However, in addition to the issues of the site area reduction and rezoning plan in the land readjustment projects and problems with land and building ownership exchanges in the redevelopment projects, opposition against road and park improvements emerged; difficulty in forming a residents’ consensus was further revealed. Meanwhile, in the context of community development in the white zones, including reconstruction of condominiums, the situation was even more challenging because of the lack or extreme inadequacy of legal justification; it is no exaggeration to say that nothing begins without achieving a unanimous agreement by all residents.
The city of Kobe had its own systems to support community development under the residents’ initiatives, including the Kobe City Community Development Granting System (1977), the Kobe City Community and Housing Development Consultant Dispatch System (1978), and the Ordinance
Figure 6. Relationship between Intensity of Damage and Degree of Recovery (as of August 1996)
Degree of recovery
Ratio of Totally Destroyed Buildings=No. of Totally Destroyed Buildings ÷No. of Buildings in Total ×100 (%)Degree of Recovery=No. of Buildings-Confirmation Applications ÷No. of Totally Destroyed Buildings ×100(%)
Ratio of Totally Destroyed Buildings
Degree of Recovery
Degree of R
ecovery
Ratio of Totally Destroyed Buildings
Project AreasPriority Restoration DistrictsOther Promotion AreasAverage for the Project AreasAverage for the Priority Restoration DistrictsAverage for the Other Promotion AreasAverage for the Promotion Areas

161
Concerning the City of Kobe Regional Planning and Community Development Agreements (1981, the Community Planning Ordinance), which had been in force before the earthquake. In particular, the Community Planning Ordinance included not only procedural aspects and delegatory provisions following establishment of a district planning system under the City Planning Act but also a proposal of a scheme for community development by the Machizukuri Organization as an independent system for the promotion of community development under the residents’ initiatives and a community development agreement system with relevant technical and financial support systems.
After the earthquake, activities under the initiatives of the Machizukuri Organization, including those in the city planning project areas, became increasingly evident, playing major roles in harmonizing residents’ opinions on community development and drawing up community development proposals. Securing specialists and other human resources also posed a major task. In forming residents’ consensus concerning coordination for individual residents’ rights and other issues prior to project implementation, the Machizukuri Organization scheme alone is subject to some limitations. To solve these and other problems, including condominium reconstruction and revision of the Act on Unit Ownership of Buildings, it is necessary to design a system for the participation of residents and formation of their consensus throughout the community development planning-implementation- management process.
2 Community Development Conference & Kobe City Community Development Ordinance
2.1 Procedure for Implementing the Post-Disaster Restoration Project The Kobe Earthquake occurred at 5:46 a.m. on January 17 in 1995. The center of the earthquake was directly below the metropolitan area (14 km in depth), and the earthquake registered 7.3 on the Richter scale. The earthquake hit the existing urban area of Kobe extending to more than 20 km, and buildings on the ground collapsed in an instant. While fires occurred simultaneously in various places, water-supply facilities for fire fighting were damaged by the earthquake, and fire fighting activities could not be carried out fully. The fires continued for 29 hours and the burned area in Kobe totaled 820,000 m2. The damage from the Kobe Earthquake is shown in Table 1.
Table 1. Damage from the Kobe EarthquakeTotal Area* Kobe** Proportion
Dead 6,434 persons 4,571 persons 71%(Sources)
*) Data released by the Ministry of Internal Affairs and Communications and Hyogo Prefecture in May 2006
**) Data released by Kobe in January 2006
Injured 43,792 persons 14,678 persons 34%
Bui
ldin
gs
Complete destruction
104,906 buildings 67,421 buildings 64%
Partial destruction
144,274 buildings 55,145 buildings 38%
Burned completely by fire
7,036 buildings 6,965 buildings 99%
Burned partially by fire
96 buildings 80 buildings 90%
A natural disaster causing damage on the scale had never been anticipated. A route to restoration therefore could not be drawn up just after the earthquake. In the end, an unprecedented method of two-stage city planning was selected to implement the restoration project.
In the first stage, the administration designated the areas to be reconstructed and determined the method of implementing projects and main facilities designed for city planning. A large-scale disaster-

162
stricken area with an area of 5 ha was designated. The urban infrastructure, such as roads and parks, in the designated area was vulnerable before the earthquake, and the area of land where buildings were damaged accounted for more than 65% of all the area of the designated site. As for the procedure for determining the city planning, a draft was open to the public, and opinions were accepted for two weeks from February 28. The City Planning Council deliberated the planning on March 16 and reported to the Governor of Hyogo Prefecture on the same day that the planning was appropriate. The details of the land readjustment project and the redevelopment project in the city planning are shown in Table 2. Figure 1 shows the locations of the project areas. On March 17, when the project was announced, five areas were specified for the land readjustment project. Subsequently, the project areas were further divided into eleven to implement the project.
Table 2. Land Readjustment Project and Redevelopment Project
Areas for Land Readjustment Project Areas for RedevelopmentProject
Area name Moriminami Rokkomichieki-Nishi Matsumoto Misuga Shinnagata,
TakatoriRokkomichieki-
MinamiShinnagataeki-
MinimiArea (ha) 16.7 19.7 8.9 10.1 69.2 5.9 20.0
Damage rate 66 68 81 88 86 65 83
In reality, residents in the disaster-stricken area were angry with the determination of city planning at the first stage, only two months after the occurrence of the earthquake. The second stage began with the opposition of the residents.
After a short while, the residents and administration noticed that opposition would result in nothing, and the two parties began to talk. Afterward, the Community Development Conference was established with the participation of residents in the disaster-stricken area. This led to community development initiated by residents. Activities involved in community development were based on the Community Development Conference and Community Development Proposals, which are provided for by the Community Development Ordinance.
Fourteen years have passed since the occurrence of the earthquake, and most projects for restoration
Figure 1. Locations of Areas for Land Readjustment and Redevelopment

163
after the disaster have achieved their objectives. In the disaster area, urban infrastructure has been reconstructed, housing has also been reconstructed, and the residents can live safely and without anxiety.
Restoration following the earthquake was carried out through partnerships between the administration and residents in the disaster area. The activities of the Community Development Conference involved in the Land Readjustment Project were instrumental in the process of the activities of the Community Development Conference led by the initiative of the residents.
2.2 Kobe City Community Development Ordinance During the fourteen years since the earthquake, the post-disaster restoration project has been implemented smoothly through partnerships between residents and administration in various places. In the process, the Community Development Conference has played a leading role, and the Kobe City Community Development Ordinance has supported the activities, functioning as a catalyst.
The Kobe City Community Development Ordinance was established in 1981, fourteen years before the occurrence of the earthquake. This ordinance stipulates procedures for community development and the responsibility of the mayor, based on experience in community development with the participation of residents in Kobe from 1960’s to 1970’s.
In the beginning, residents who want to settle issues, such as those concerning the living environment and improvement in joint-use facilities including roads and parks, gather and establish a Community Development Conference. The conference draws up a draft community development plan, presents the draft to residents in the community, accepts opinions from the residents to amend the draft, and finally completes a Community Development Design. The conference submits the Community Development Design to the mayor as a Community Development Proposal. The city of Kobe, which accepts the proposal, and the residents strive to achieve community development through mutual understanding of each role and partnership. In addition, the Community Development Conference concludes agreement with the mayor regarding regulation on constructions, which cannot be covered by the district planning of the City Planning Law, and rules on daily lives. This agreement is referred to as the Community Development Agreement and is independent for each community. This agreement is utilized for careful community development.
The Kobe City Community Development Ordinance was established first in Japan as an advanced ordinance for community development led by residents’ initiative.
Based on this Community Development Ordinance, 29 Community Development Conferences were established in the city before the occurrence of the earthquake. Each conference had developed activities according to the characteristics of each community. The Community Development Ordinance has served
Figure 2. Procedure for Residents’ Participation, based on the Kobe City Community Development Ordinance
Original ideas for community development
Community Development Conference
Community Development
Proposal
Community Development Agreement
District Planning
Rule establishing system
Structure construction
Structure construction system

164
as guideline procedures for community development and activities led by residents’ initiative since its establishment.
2.3 Examples of Activities of the Community Development Conference to Promote the Land Readjustment Project
Long before the occurrence of the earthquake, Kobe held extensive talks with residents who opposed the Land Readjustment Project determined by Kobe to obtain their understanding and completed the project.
This example is a model for the Kobe City Community Development Conference. The location is the Itayado District in Kobe’s Suma Ward. In the 1960’s, a traffic jam occurred on the road running through the railroad crossing near Itayado Station. Automobiles chose community roads to make a detour, and the living environment and commercial environment in the community were significantly impaired. In response to this situation, the Land Readjustment Project was put into effect as part of city planning in 1970. The measure of this project to improve the situation was to construct an underground railroad near the station. When the project plan was announced in 1971, some residents and those who were engaged in commerce raised their voices in opposition.
In April 1972, the Itayado District Urban Study Conference was established, consisting of city officials and experts. This conference formulated guidelines for community development with the participation of residents. Based on these guidelines, the Itayado District City Planning Conference was established in October 1972, consisting of 31 community residents and six city officials. Four committees were established. These committees consisted of community residents alone and studied housing and welfare, commerce, subways, and roads. A total of 477 residents participated in the committees. At the committee meetings, the residents discussed matters close to them, and opinions were advanced regarding a road network and the design of replotting in the project. City officials and experts were invited, if necessary, to present their opinions to the residents. The opinions of the residents were reflected in the formulation of the project plan by Kobe, the constructor. In addition, the residents were able to deepen their understanding through explanations by the constructor regarding the contents and procedure of the project, the state of progress concerning tentative replotting, and the state of the construction. These explanations were given at the conference, where the residents could discuss them. Participation of the residents in the conference resulted in an increase in the residents’ awareness of community development and the project itself. Communication among the residents improved as well, which contributed to the progress of the project.
Likewise, a Community Development Conference was established in Higashinada Ward in 1975 and in Hyogo Ward in 1977 in relation to the Land Readjustment Project by Kobe. Opportunities for discussion with community residents and land owners were afforded, which accelerated the progress of the project. These examples served as models for the Community Development Conference stipulated by the Community Development Ordinance.
2.4 Procedure for Community Development with Participation of Residents in the Post-Disaster Restoration Project
2.4.1 Three Pillars for Residents’ Participation toward the Second Stage Restoration after the Kobe Earthquake began with emergency evacuation to elementary and junior high schools and other public facilities because most houses were destroyed or burnt down in the disaster area. In the first stage of the restoration project, the administration designated the disaster area and determined the method of the restoration project on March 17, two months after the earthquake. At this stage, the administration afforded no opportunities for discussion with residents. The residents fiercely

165
opposed this one-sided determination. Unless the conflict between the administration and residents in the disaster area was settled, concrete project plans could not be made in the second stage.
Following the examples of the past projects, the administration requested residents to participate in the restoration project. Kobe sought a policy to convert the relationship with the residents from conflict to dialogue by proposing tree pillars: (a) the establishment of an onsite consultation office, (b) the establishment of the Community Development Conference, and (c) the dispatch of consultants and experts.
The most important pillar was (b) the establishment of the Community Development Conference, which would provide opportunities for discussion between the administration and residents. This implied that the administration requested residents to create an organization. The establishment was, however, extremely difficult because those residents who had lost houses and stores gave priority to the reconstruction of their houses and stores at the original location, and it was also extremely difficult for those residents without experience in community development to understand the significance of considering community development by themselves.
First, an onsite consultation office was established near the location of the planned project. In the beginning, residents protested and complained about the one-sided action of the administration. As time passed, the residents calmed down, and discussion between residents and the officials began.
Nothing is produced if the administration and the residents are opposed to each other. Individual requests from residents cannot be fulfilled. It is desirable to collect and summarize opinions in the community and to submit them as a proposal. The administration does not make a restoration plan one-sidedly. The residents draw the future image of the community by themselves. To achieve this, the Community Development Conference is established, and residents voluntarily participate in the conference to hold discussions. If it is difficult to draw the future image by the residents alone, consultants and experts in laws and on land can be dispatched to the conference. The residents can select
Figure 3. Policy of Kobe for the Restoration Project with the Participation of Residents

166
the experts by themselves. Opinions on the restoration project are exchanged between residents and the administration to narrow the gap between them. By deepening mutual understanding, the restoration project can be implemented through partnership.
As a result of exchanging opinions, the residents accepted the establishment of the Community Development Conference as a window for negotiation between residents and the administration. The residents understood the idea that their requests and opinions would be collected and summarized by the Community Development Conference, that the community development after the disaster would progress through partnership between residents and the administration, and that the administration would sincerely respond to the proposals because the proposals would reflect the general opinion of residents. The residents began to move toward the establishment of the conference.
The accelerators for the residents’ understanding were 29 examples of community development led by residents’ initiative before the earthquake and the Kobe City Community Development Ordinance. In this ordinance, the system and procedure for community development are stated concretely, and the mayor’s responsibility is stipulated as well. In particular, the residents accepted the explanation that the ordinance ensured the residents a system by which community development would be promoted through equal relationships between the administration and residents and that the ordinance indicated the direction and objective of residents’ participation.
2.4.2 Establishment of the Community Development Conference After learning from the examples of other communities, the residents confirmed the following in the preparatory conference for the establishment of the Community Development Conference: (a) to draw up articles and to elect officers, (b) to devise a method for easy residents’ participation in the conference because the conference would be an organization designed for the residents to consider community development, and (c) to give the conference not the role of a subordinate organization of the administration but the role of a window of negotiation with the administration to reflect the residents’ opinions in the project.
As a step toward the second stage, the Community Development Conference was thus established with the primary role of a window through which the administration, the constructor of the project, and residents would hold discussions. Table 3 shows the state of establishment of the conference. Taking into consideration the level of the disaster and the unity of communities, the areas for the Land Readjustment
Photo 1. General Assembly to Establish the Community Development Conference (Takatori-Higashi II Area)

167
Project were divided into eleven to form the Land Readjustment Project areas. Community activities developed before the earthquake were highly respected, including activities by the residents’ associations and stores’ associations in shopping areas.
Time required for the establishment was proportionate to the area of the project and the number of conferences. However, in areas where residents’ awareness of community development was high before the earthquake and areas where able leaders appeared, the residents were united easily and the conference was established in a comparatively short period.
Table 3. Establishment of Community Development Conferences in Land Readjustment Project Areas
Project area Area(ha)
Number ofConferences
Date ofEstablishmentof Conference
Project area Area(ha)
Number of Conferences
Date ofEstablishmentof Conference
Moriminami I 6.7 1 1996 12 8 Misuga-Higashi 5.6 1 1995 6 18Moriminami II 4.6 1 1997 1 19 Misuga-Nishi 4.5 1 1995 4 23Moriminami III 5.4 1 1995 4 8 Shinnagataeki-Kita 59.6 21 1996 6 13Rokkomichieki-Kita 16.1 8 1995 11 5 Takatori-Higashi I 8.5 1 1995 7 2Rokkomichieki-Nishi 3.6 1 1995 5 14 Takatori-Higashi II 19.7 10 1996 2 25Matsumoto 8.9 1 1995 5 7
Note: If several conferences were established in an area, the latest establishment date is shown.
2.5 Role of the Community Development Conference as a leading actor for community development led by residents’ initiative
2.5.1 Change from Residents’ Participation to Residents’ Taking Initiative The establishment of the Community Development Conference was the first step towards the second stage of city planning. The Conference, however, was required to take a direction quite different from the direction taken previously. In the past, city planning projects were carried out by the administration; the administration determined the area and the project method and formulated the project plan. Residents’ participation in the project was that land owners and residents voiced opinions to request amendment of the draft project plan and improvement in the procedure of the project. In the restoration project after Kobe Earthquake disaster, the procedure was quite different. Although the constructor and the area and method were determined in the first stage of city planning, the details of readjustment project were not determined. Residents participated in the second stage, and their participation was not to evaluate the draft plan and request improvement but to draw up a draft of the restoration plan by themselves and to reach a consensus among residents. To achieve this, the residents were able to request that the administration to dispatch consultants and experts to the conference. The residents needed to analyze the causes of the expansion of the disaster, to collect opinions on a future desirable community, to make a draft proposal, to hear opinions on the draft, to amend the draft, and to complete the draft as a proposal.
In short, the traditional Community Development Conference with the participation of residents needed to be changed into a Community Development Conference led by residents’ initiatives.
2.5.2 Functions of Community Development Conference Led by Residents’ Initiatives Article 4-(1) of the Community Development Ordinance provides that the conference need to be recognized as an organization established by the majority of residents in the community. Article 4-(2) of the ordinance provides that the conference consist of residents who have experience in community development and those with equivalent capacity. Accordingly, the conference can be defined as the sole organization or institution in the community, consisting of residents, people engaged in commerce and
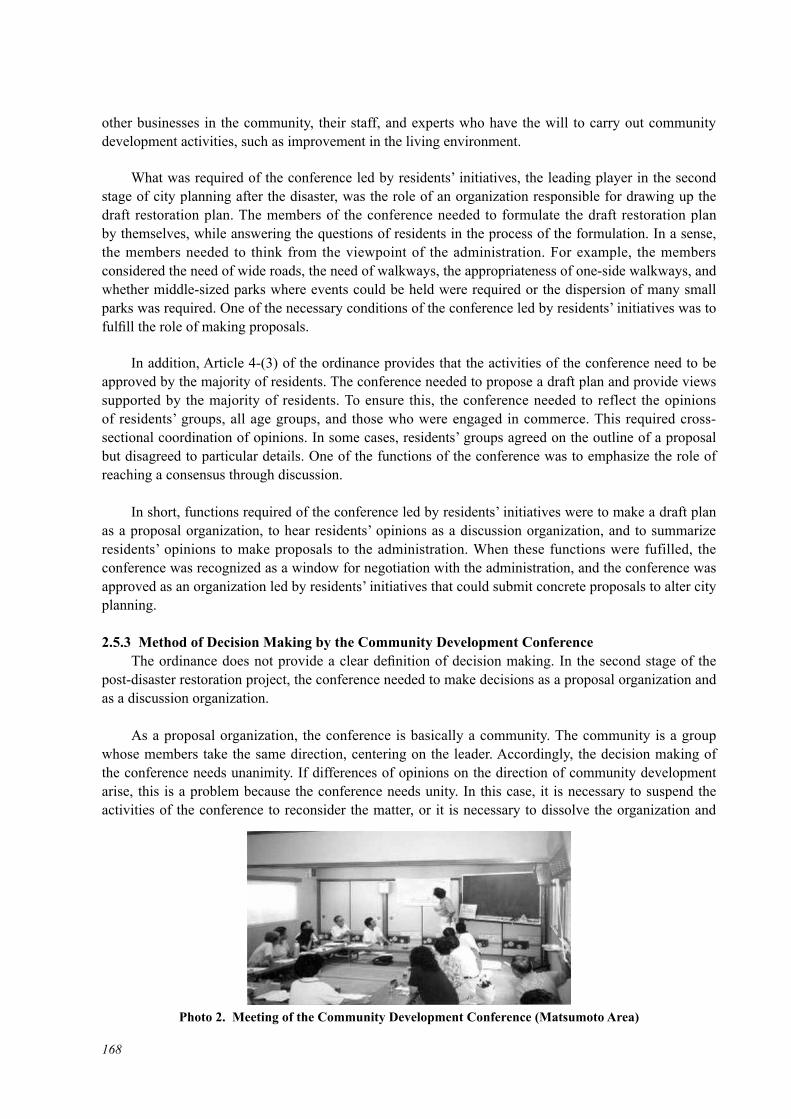
168
other businesses in the community, their staff, and experts who have the will to carry out community development activities, such as improvement in the living environment.
What was required of the conference led by residents’ initiatives, the leading player in the second stage of city planning after the disaster, was the role of an organization responsible for drawing up the draft restoration plan. The members of the conference needed to formulate the draft restoration plan by themselves, while answering the questions of residents in the process of the formulation. In a sense, the members needed to think from the viewpoint of the administration. For example, the members considered the need of wide roads, the need of walkways, the appropriateness of one-side walkways, and whether middle-sized parks where events could be held were required or the dispersion of many small parks was required. One of the necessary conditions of the conference led by residents’ initiatives was to fulfill the role of making proposals.
In addition, Article 4-(3) of the ordinance provides that the activities of the conference need to be approved by the majority of residents. The conference needed to propose a draft plan and provide views supported by the majority of residents. To ensure this, the conference needed to reflect the opinions of residents’ groups, all age groups, and those who were engaged in commerce. This required cross-sectional coordination of opinions. In some cases, residents’ groups agreed on the outline of a proposal but disagreed to particular details. One of the functions of the conference was to emphasize the role of reaching a consensus through discussion.
In short, functions required of the conference led by residents’ initiatives were to make a draft plan as a proposal organization, to hear residents’ opinions as a discussion organization, and to summarize residents’ opinions to make proposals to the administration. When these functions were fufilled, the conference was recognized as a window for negotiation with the administration, and the conference was approved as an organization led by residents’ initiatives that could submit concrete proposals to alter city planning.
2.5.3 Method of Decision Making by the Community Development Conference The ordinance does not provide a clear definition of decision making. In the second stage of the post-disaster restoration project, the conference needed to make decisions as a proposal organization and as a discussion organization.
As a proposal organization, the conference is basically a community. The community is a group whose members take the same direction, centering on the leader. Accordingly, the decision making of the conference needs unanimity. If differences of opinions on the direction of community development arise, this is a problem because the conference needs unity. In this case, it is necessary to suspend the activities of the conference to reconsider the matter, or it is necessary to dissolve the organization and
Photo 2. Meeting of the Community Development Conference (Matsumoto Area)

169
organize a new conference by members who take the same direction to restart. In the Moriminami area, opinions differed according to location, and as a result, the conference was divided along these lines. The conference was required to take one direction through coordinating opinions under the leadership of the leader.
As a discussion organization, a general assembly is considered to be a decision-making body in general. The ordinance, however, has no provisions concerning the general assembly. On the contrary, Article 4-(2) provides that the members of the conference be not limited to those who are registered as residents of the community or owners of land in the community. Those who live or work in the community or experts who do not live in the community but wish to participate in community development may be members.
Consequently, a quorum of the general assembly cannot be defined. In other words, the general assembly of the Community Development Conference is an opportunity for people involved in disaster areas to gather and hold discussions at an informed place. The decision of the general assembly is made by the approval or disapproval of the participants (including letters of attorney). Since the ordinance provides that the activities of the conference need the approval of the majority of residents, the standard for decision making is not more than half but approximately two thirds or more (a special majority or an absolute majority).
2.6 Significance and Effects of Community Development Proposals2.6.1 Significance of Community Development Proposals in Community Development Led by
Residents’ Initiatives In the process of the community development led by residents’ initiatives, it was important to set an objective so that the residents could strive to achieve the objective: the spiritual support for residents. Concretely, the objective was to create the Community Development Design to be proposed to the Mayor of Kobe.
Article 7 of the ordinance provides that the conference may submit a design that reflects the general opinion of the residents of a community as Community Development Proposals to the mayor. On the other hand, Article 8 of the ordinance provides that the mayor be obliged to make a sincere effort to take into consideration the Community Development Proposals when he/she formulates and implements policies for promoting community development to ensure an excellent living environment. This article clearly states mayor’s obligation to strive hard to consider the accepted proposal. It is natural for residents to strive hard to realize community development since they would take the initiative and for the mayor to strive hard in dealing with matters under the administrative authority. These two articles are lofty provisions for community development through partnerships between residents and the administration.
2.6.2 Community Development Proposals as Drafts for City Planning in the Second Stage City planning in the second stage is for residents to draft a readjustment plan after considering the future image of their community.
In this draft plan, the layout of roads and parks necessary for the community is drawn up to restore the disaster area. More precisely, the size and layout of auxiliary trunk roads, which are essential for the daily lives of residents, walkways and neighboring parks, and block parks are decided. In a sense, city planning in the second stage produces effect as if the administration entrusted part of its authority to residents. Accordingly, not simple ideas but rational ideas at the administrative level were required of the officials of the conference, including those leaders who lacked experience in community development.

170
The officials needed to make a draft plan at a level exceeding residents’ level and submit a high-level proposal after coordinating opinions among residents.
Since the coordination of opinions with the administration was also required, the ability of dispatched experts was tested as well. The experts needed to devise the layout of joint-use facilities to ensure a safe and anxiety-free living environment. At the same time, the experts needed to consider the size and layout of the public facilities from the viewpoint of the managers of these facilities. In one case, an expert was dismissed by residents because they were not satisfied with his proposal. In the conference, draft proposals were revised many times to coordinate interests among residents’ groups, while some residents strived hard to persuade other residents to reach a consensus. Although the desires for early restoration and restoration of the original city increased day by day, it took considerable time to summarize residents’ opinions into a proposal.
In coordination to make a draft of the community development plan, the new construction of parks and the alteration of the location of existing parks took considerable time. In general, it is necessary to secure the area of parks at the rate of 3% of the total area. If the area of parks that existed before the earthquake is small, securing space for parks in some places is required. Even though the need of parks was approved in the outline because the parks serve for residents’ relaxation and for disaster prevention, problems as to where to locate them arose in discussion on particular items. In the Shinnagataeki-Kita area, it was decided in the first stage that a neighboring park with an area of 1 ha would be created. To realize this, all the housing lots needed to be moved. Many residents of the town opposed this. To maintain the town, the conference studied a draft in which the location of a park would extend into an adjacent town. However, residents of the adjacent town were not willing to accept this idea. As a result of thorough discussion, all the residents of the town accepted the original plan, with distress, because it was fair that all of them would move. In the Rokkomichieki-Kita area, the residents reached a compromise that the area of a park would be reduced from 1 ha to 8,000 m2. In area two of Takatori-Higashi, the location of a park was altered after implementation of the project began; a vacant lot was newly produced because an elementary school was closed due to merger with another elementary school.
If the ideas and opinions of the residents were summarized into a Community Development Design and the design was approved at the general assembly of the Community Development Conference, the design was submitted to the mayor as a Community Development Proposal. Table 4 shows the date of establishment of the Conference, the date of submitting a Community Development Proposal, the period between the establishment and the submission, and the number of explanatory meetings held during the period. It took approximately four to eight months from establishment to submission, which
Photo 3. Submission of a Community Development Proposal by a Community Development Conference (Takatori-Higashi II)

171
is considerable time. During this period, numerous general assembly meetings, committee meetings, and steering committee meetings were held. On the whole, the meetings were held once or twice a week, but some were held daily when necessary.
Table 4. Activities of the Conference from Establishment to Submission of the (1st)Community Development Proposal
Project Area Areaha
Number ofConferences
Date ofEstablishment
Date ofSubmission
Period: Years and/or Months
Number ofExplanatory
MeetingsMoriminami I 6.7 1 1996 12 8 1997 3 10 4
*69Moriminami II 4.6 1 1997 1 19 1997 9 5 8Moriminami III 5.4 1 1995 4 8 1999 3 9 3 11Rokkomichieki-Kita 16.1 8 1995 11 5 1996 4 10 5 84Rokkomichieki-Nishi 3.6 1 1995 5 14 1995 11 24 6 36Matsumoto 8.9 1 1995 5 7 1995 12 18 7 64Misuga-Higashi 5.6 1 1995 6 18 1996 4 16 8 67Misuga-Nishi 4.5 1 1995 4 23 1996 9 13 1 4 45Shinnagataeki-Kita 59.6 21 1996 6 13 1996 10 30 5 361Takatori-Higashi I 8.5 1 1995 7 2 1995 9 12 2 95Takatori-Higashi II 19.7 10 1996 2 25 1996 10 25 8 90
Note: If several conferences were established in an area, the latest establishment date is shown.* Total number of meetings up to the date the Conference of Moriminami III submitted its proposal
2.6.3 Alteration of City Planning in the Second Stage The administration, which accepted the Community Development Proposals (Table 5), respected and took into consideration the proposals of residents. Under their administrative authority, the administration altered the city planning, if necessary, to reflect the contents of the proposals in the project plan and carried out procedures for approval of the project. Subsequently, the full-scale restoration project after the disaster was launched.
Table 5. Alterations of City Planning in the Second StageProject Area Alteration of City Planning in the 2nd StageMoriminami I
Disuse of a road, (18 m); addition of roads (9 m), (11 m), (13 m); extension of a road (13 m); reduction of a square in front of a station (3,000 m2 → 2,700 m2)Moriminami II
Moriminami IIIRokkomichieki-Kita Reduction of a neighboring park (10,000 m2 → 8,000 m2)
Addition of a block park (1,000 m2)Rokkomichieki-Nishi Addition of a block park (1,910 m2)Matsumoto Addition of block parks (2,500 m2, 1,000 m2)
Addition of six block roadsMisuga-Nishi Addition of block parks (1,500 m2, 1,000 m2)Shinnagataeki-Kita Extension of a road (20 m), widening of a road (22 m → 27 m), addition of a road (17
m), addition of block parks (2,500 m2, 1,000 m2)Takatori-Higashi I -Takatori-Higashi II Relocation of a neighboring park (10,000 m2)
Addition of block parks (2,500 m2, 500 m2)
In fact, unconformity arose in the city. The reason for this was that the time of submitting proposals
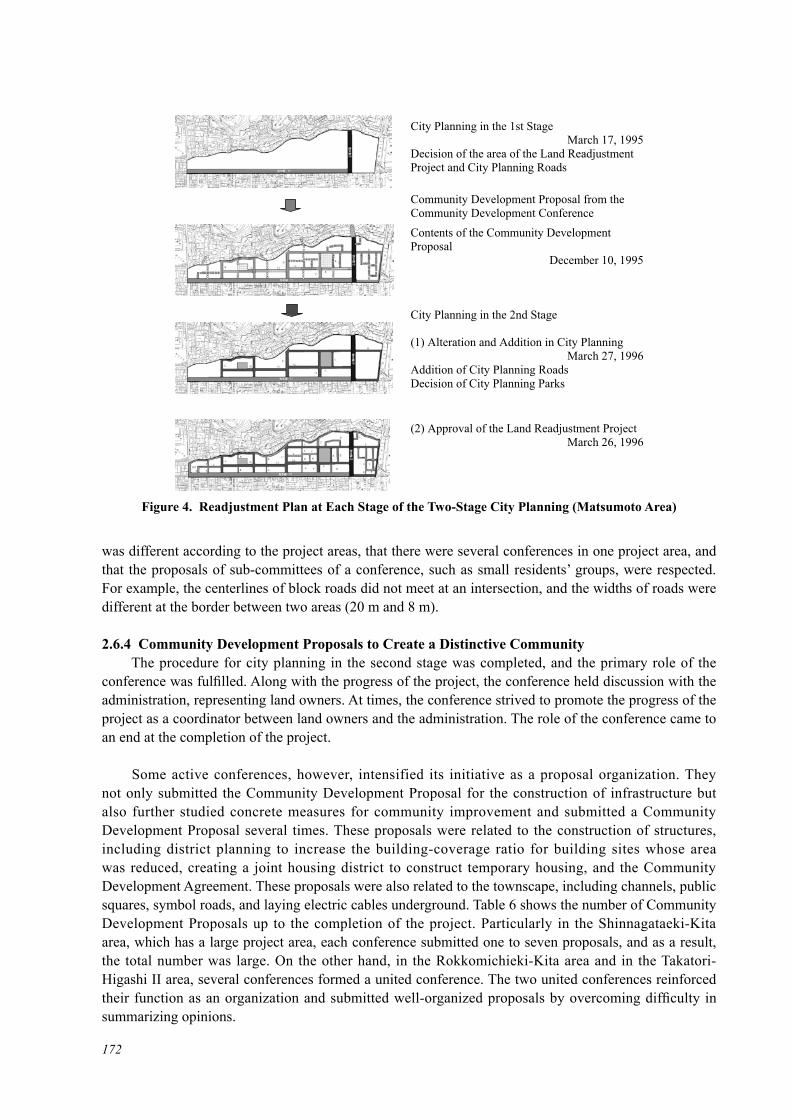
172
was different according to the project areas, that there were several conferences in one project area, and that the proposals of sub-committees of a conference, such as small residents’ groups, were respected. For example, the centerlines of block roads did not meet at an intersection, and the widths of roads were different at the border between two areas (20 m and 8 m).
2.6.4 Community Development Proposals to Create a Distinctive Community The procedure for city planning in the second stage was completed, and the primary role of the conference was fulfilled. Along with the progress of the project, the conference held discussion with the administration, representing land owners. At times, the conference strived to promote the progress of the project as a coordinator between land owners and the administration. The role of the conference came to an end at the completion of the project.
Some active conferences, however, intensified its initiative as a proposal organization. They not only submitted the Community Development Proposal for the construction of infrastructure but also further studied concrete measures for community improvement and submitted a Community Development Proposal several times. These proposals were related to the construction of structures, including district planning to increase the building-coverage ratio for building sites whose area was reduced, creating a joint housing district to construct temporary housing, and the Community Development Agreement. These proposals were also related to the townscape, including channels, public squares, symbol roads, and laying electric cables underground. Table 6 shows the number of Community Development Proposals up to the completion of the project. Particularly in the Shinnagataeki-Kita area, which has a large project area, each conference submitted one to seven proposals, and as a result, the total number was large. On the other hand, in the Rokkomichieki-Kita area and in the Takatori-Higashi II area, several conferences formed a united conference. The two united conferences reinforced their function as an organization and submitted well-organized proposals by overcoming difficulty in summarizing opinions.
Figure 4. Readjustment Plan at Each Stage of the Two-Stage City Planning (Matsumoto Area)
City Planning in the 1st Stage March 17, 1995
Decision of the area of the Land Readjustment Project and City Planning Roads
Community Development Proposal from the Community Development Conference Contents of the Community Development Proposal
December 10, 1995
City Planning in the 2nd Stage (1) Alteration and Addition in City Planning
March 27, 1996Addition of City Planning Roads Decision of City Planning Parks
(2) Approval of the Land Readjustment ProjectMarch 26, 1996

173
All the proposals contributed to the restoration of the distinctive communities in accordance with their characteristics, topography, and history.
Table 6. Number of Proposals from Each Community Development Conference
Project Area Number of Proposals Project Area Number of
Proposals Project Area Number of Proposals
Moriminami I 6 Rokkomichieki-Nishi 3 Shinnagataeki-Kita 69*Moriminami II 4 Matsumoto 5 Takatori-Higashi I -Moriminami III 2 Misuga-Higashi 2 Takatori-Higashi II 7 (1)Rokkomichieki-Kita 11 (4) Misuga-Nishi 1
The figures in parentheses show the number of proposals from a united conference.* The project in the Shinnagataeki-Kita area is ongoing, and the figure shows the total up to the end of March 2008.
2.6.5 Residents’ Responsibility for Community Development Proposals A Community Development Proposal outlines the future image of a community, reflecting the general opinion of residents. This proposal, however, is not only the enumeration of residents’ requests to the administration. The important point is that this proposal needed to be accompanied by the efforts, duties, and responsibilities of residents. Residents are the mainstays of community development.
As an example, one of the causes of large-scale fire disaster after the earthquake was the malfunction of water-use facilities for firefighting. In outlining the future image of the disaster sites, residents wished that there had been water at that time. As a result, the excavation of a channel was proposed in three areas. The administration accepted the proposal and addressed an issue of securing water for the channels. The administration surveyed water sources and secured water derived from wastewater treated with advanced technology (Matsumoto), springs around a tunnel (Shinnagataeki-Kita), and well water (Rokkomichieki-Kita). The administration secured the flowing routes (land for roads) of the water as well. On the other hand, moss grows in the channels if the water receives sunlight. The city and the conference concluded an agreement on the management of the channels. Based on the agreement, the residents clean the channels to remove the moss at regular intervals. This is an example of displaying the spirit of the partnership involved in the Community Development Proposals.
Residents wanted to create a community where they could live safely and without anxieties. To realize such a community through the post-disaster restoration project, the proportion of the area of infrastructure, such as roads and parks, needed to increase. Precisely, the proportion needed to be
Photo 4. Completed Channel in the Matsumoto Area Photo 5. Twice-Monthly Cleaning
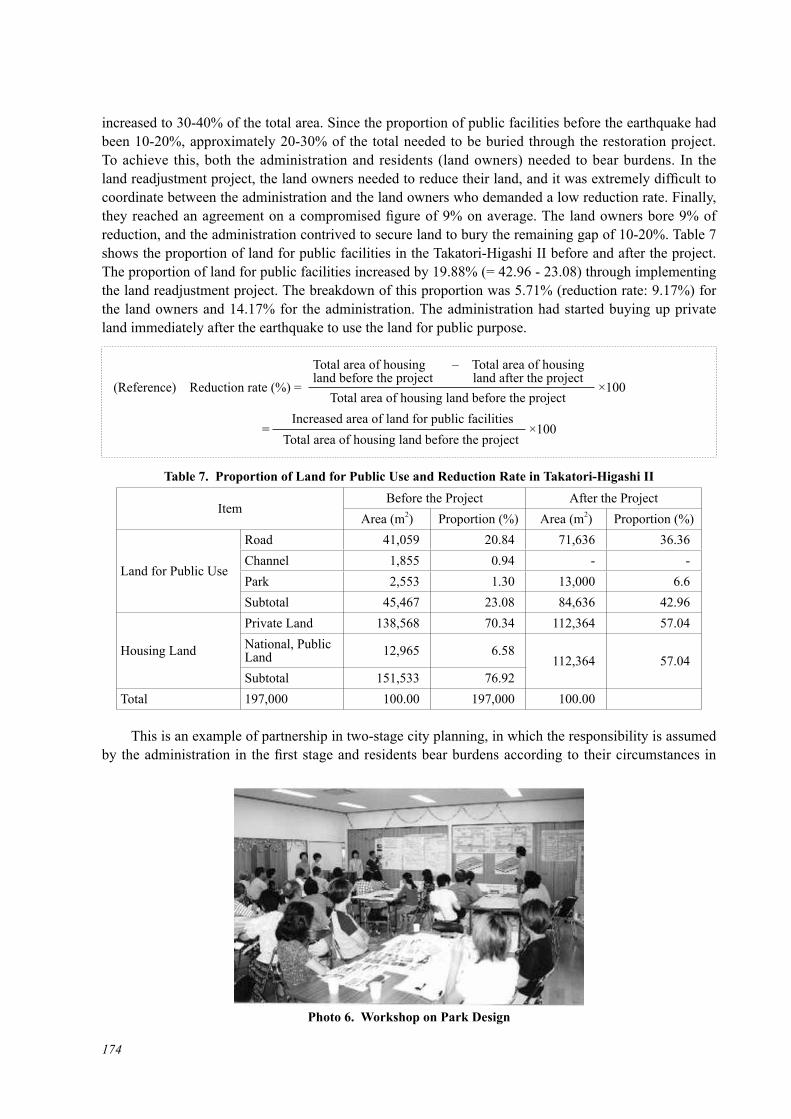
174
increased to 30-40% of the total area. Since the proportion of public facilities before the earthquake had been 10-20%, approximately 20-30% of the total needed to be buried through the restoration project. To achieve this, both the administration and residents (land owners) needed to bear burdens. In the land readjustment project, the land owners needed to reduce their land, and it was extremely difficult to coordinate between the administration and the land owners who demanded a low reduction rate. Finally, they reached an agreement on a compromised figure of 9% on average. The land owners bore 9% of reduction, and the administration contrived to secure land to bury the remaining gap of 10-20%. Table 7 shows the proportion of land for public facilities in the Takatori-Higashi II before and after the project. The proportion of land for public facilities increased by 19.88% (= 42.96 - 23.08) through implementing the land readjustment project. The breakdown of this proportion was 5.71% (reduction rate: 9.17%) for the land owners and 14.17% for the administration. The administration had started buying up private land immediately after the earthquake to use the land for public purpose.
Table 7. Proportion of Land for Public Use and Reduction Rate in Takatori-Higashi II
ItemBefore the Project After the Project
Area (m2) Proportion (%) Area (m2) Proportion (%)
Land for Public Use
Road 41,059 20.84 71,636 36.36Channel 1,855 0.94 - -Park 2,553 1.30 13,000 6.6Subtotal 45,467 23.08 84,636 42.96
Housing Land
Private Land 138,568 70.34 112,364 57.04National, Public Land 12,965 6.58
112,364 57.04Subtotal 151,533 76.92
Total 197,000 100.00 197,000 100.00
This is an example of partnership in two-stage city planning, in which the responsibility is assumed by the administration in the first stage and residents bear burdens according to their circumstances in
Total area of housing – Total area of housing land before the project land after the project(Reference) Reduction rate (%) = ×100 Total area of housing land before the project
Increased area of land for public facilities = ×100
Total area of housing land before the project
Photo 6. Workshop on Park Design

175
exchange for submitting their requests in the second stage.
In designing parks, the residents held workshops, in which opinions were asked for from all age groups, including children who used the parks in their daily lives and elderly people. In the workshops, the use of the parks as emergency evacuation sites was studied as well. The result of these workshops was taken into consideration in the design of the parks. Residents not only use the parks but also clean the parks and take care of plants and flowers in the parks. These activities are based on the management agreement concluded between residents and the administration. This is also a result of the partnership project.
2.7 Conclusion – Value of the Kobe City Community Development Ordinance At present, the post-disaster restoration project is nearly completed. The study of this project clarifies four major factors necessary for smooth project implementation. The first factor is a sense of mission, effort, and teamwork by the leaders of the Community Development Conference who seriously wished to restore their own communities. The second factor is the wisdom and ardent activities of consultants and experts in various fields who have supported the leaders. The third factor is the attitude of the national government, the prefectural government, and the municipal government. These three levels of government had a sense of mission in not reproducing densely built-up areas, which induced the large-scale disaster. They improved systems and auxiliary systems and applied them flexibly. The fourth factor is the Kobe City Community Development Ordinance, which was established and utilized before the earthquake. The leaders of the Community Development Conference, the consultants and experts, and the government were linked together through this ordinance. In addition, this ordinance served as a catalyst for the residents to display their initiative in the post-disaster restoration project.
In the second stage of two-stage city planning for the restoration, the residents’ independent activities were essential. Concretely, the Community Development Conference led by residents’ initiatives submitted Community Development Proposals. In addition, requirements for the establishment of the conferences and the limits of the activities of the conferences are not strictly stipulated. This enabled the conferences to create various forms and to develop unique activities. This also removed uniformity from conferences and created a position other than a subordinate of the administration. Since the ordinance states the system for the Community Development Proposals and the responsibility of the mayor, the residents were able to understand their own duties and responsibility. Thus, the ordinance provided a system in which the residents were able to display their initiative.
The leaders of the conference did not need to understand the ordinance precisely to utilize the ordinance. They simply needed to follow the procedure concerning the Community Development Conference and the Community Development Proposals. Through this process, the function of a catalyst for the ordinance was performed, and the conference was able to cooperate with the administration, and the spirit of community development led by residents’ initiatives was enlivened.
Since the Community Development Ordinance was formulated comprehensively, placing importance on community/individual spirit, the concept of the ordinance worked nicely with the procedure of two-stage city planning after the earthquake disaster.
In conclusion, since the Kobe City Community Development Ordinance was established before the earthquake, the residents, experts, and administration were able to hold discussions on equal footing and to understand each other. The ordinance complemented the activities of the Community Development Conference and promoted community development led by residents’ initiatives based on partnerships among residents, experts, and the administration.
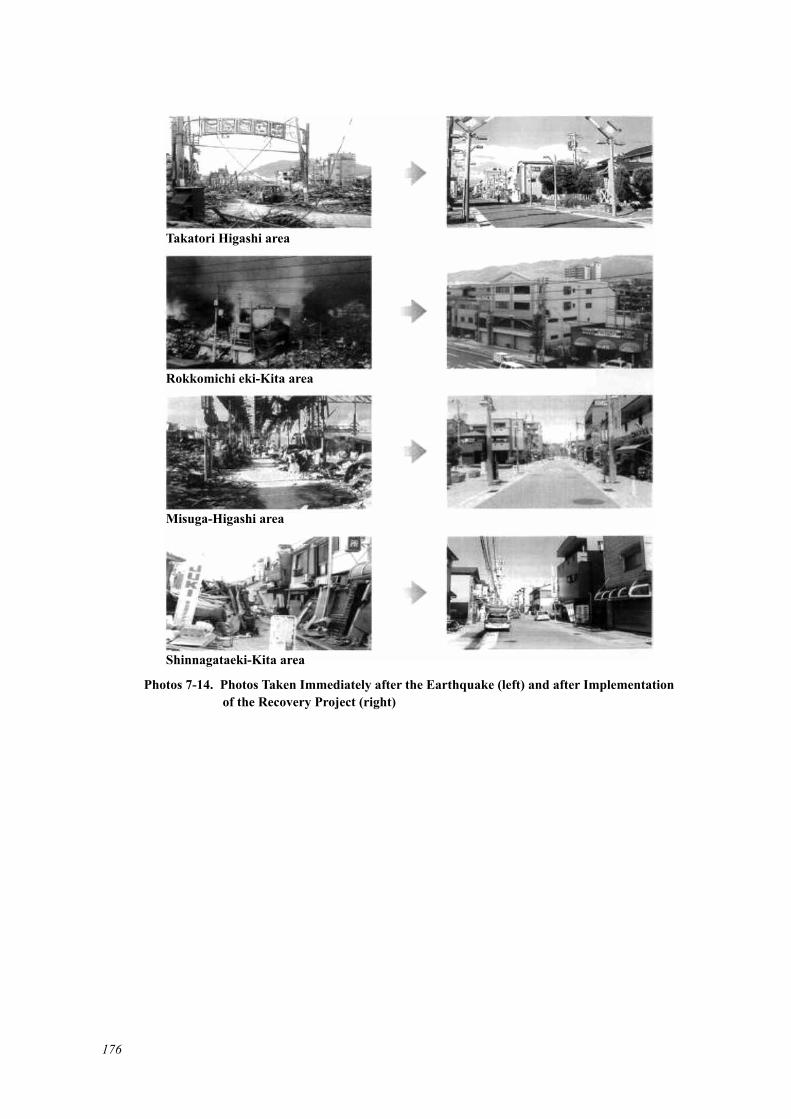
176
Takatori Higashi area
Rokkomichi eki-Kita area
Misuga-Higashi area
Shinnagataeki-Kita area
Photos 7-14. Photos Taken Immediately after the Earthquake (left) and after Implementation of the Recovery Project (right)

CHAPTER 4
Economic Vitalization
178
1 Economic Vitalization
1.1 Industrial Recovery and Job Creation1.1.1 Basic Viewpoint for Recovery of Industry/Employment1.1.1.1 Current Situation of Recovery from the Kobe Earthquake The economic blow caused by the earthquake is estimated to be around 2 trillion 540 billion yen, on a stock basis, including buildings, facilities, and equipment, and around 2 trillion 600 billion yen on a flow basis in terms of opportunity loss in economic activities: over 5 trillion yen in total (estimates by Industrial Recovery Council). It was also pointed out in an Economic White Paper that this kind of damage amounted to 2% of the nominal GDP of Japan, and another analysis just recently completed indicates that the scale of demand by reconstruction efforts might surpass the previous estimate. However, the argument based on the logics of just tallying the damage amount, whether it be spatial or temporal, is not appropriate when we think about the recovery of the earthquake-hit area that was exposed to localized and instantaneous damage. Accumulative loss where the loss of stock would propagate, like a ripple effect, to both sides of interrelated supply and demand has had a negative impact on industry and the economy in the earthquake-hit area.
Figures 1 and 2 show the population (Fig.1) and gross production (Fig. 2), respectively, after earthquake in the area concerned. Figure 1 accounts for the evolution of the population compared to that as of January 1, 1995, just before the earthquake. The population of the earthquake-hit area dropped by 4 points immediately after the quake, but it started to grow after that. The pre-earthquake level was once again achieved in 2001, and the population has continued to grow. Although it is not shown in the figure, the fact that apparent disparity is found between east and west sides of Sannomiya, the center of the city, should be considered. Figure 2 shows the evolution of the gross production from 1993. Compared to the national trend, the situation in the earthquake-hit-area is difficult. The gross production immediately after quake had been growing for several consecutive years due to the special demand by reconstruction, but then it began decreasing. It is true that the economic situation has been difficult nationwide for some time, but such numbers still show us that the recovery in the earthquake-hit area was extremely difficult.
1.1.1.2 How Industrial/Economic Regeneration Should be Considered in Urban Areas The recovery from the Kobe Earthquake was also a time to reconsider the way urban and local economy should be. When it comes to the characteristics of urban economy, the fact is that urban activities themselves have dense and complicated internal and external correlations, which are also minutely formed in multiplex and multi-layered manners. It is no exaggeration to say that the benefits of this aggregation, supported by these correlations, actually used to be the source of positive influence on urban and local economy dynamics. The core of industrial/economic recovery from the Kobe Earthquake was to construct the autonomous type economic system by revitalizing and creating such a linkage.
It goes without saying that recovery process from localized damage caused by disaster has a completely different aspect compared to local policies during normal times. The viewpoint of the urban disaster policies must precisely adapt to the characteristics of large-scale urban disasters. What we have learned through the recovery process following the Kobe Earthquake is the following. When it comes to the characteristics of the earthquake-hit area where the national and local governments are required to take a political approach; the situation is always changing dramatically in a short period of time, and the substance of the political approach will also change as time goes by. By reacting flexibly to such changes, we have to present the approach for solutions. Supposing such characteristics are located on a temporal axis, the spatial characteristics should then be considered. The situation surrounding the reality in the earthquake-hit area had a strongly localized nature, and requirements for political measures were completely different according to communities/districts. With conventional measures focusing on

179
urban industry/economy in general, it is almost impossible to meet such diverse challenges in a precise and flexible manner. Thirdly, emergent/short-term measures need to be clearly interlocked with the mechanism of autonomous regeneration of the city.
The argument so far suggests that political measures for recovery from huge urban disaster require restoration type measures, with the aim of getting things back to the status quo in emergency situations, to function as the initial response, and later to develop and then implement redevelopment-type measures, urging structural reorganization of the city from the mid- to long-term viewpoint. Moreover, in the process of such recovery, the mobility to adapt to changing situations with the passage of time and the flexibility to deal with increasing diversity in spatial expanse is needed.
We can define autonomous recovery as a requirement for urban recovery policies following huge urban disasters or as the process of urban redevelopment itself. In case of recovery from the Kobe Earthquake, such a process was covered by conventional financial aid such as national treasury
Figure 1. Evolution of Population in the Earthquake-Hit Area (Hyogo Prefecture, Recovery Support Division)
’86 ’87 ’88 ’89 ’90 ’91 ’92 ’93 ’94 ’95(Jan) ’95 ’96 ’97 ’98 ’99 ’00 ’01 ’02 ’03 ’04 ’05 ’06 ’07 ’08 ’09
total population of Hyogo Prefecture
population of the quake-hit area
population outside the quake-hit area
Figure 2. Evolution of Gross Production in Japan and the Earthquake-Hit Areas (Hyogo Prefecture, Recovery Support Division)
Hyogo Prefecturequake-hit area
’94 ’95 ’96 ’97 ’98 ’99 ’00 ’01 ’02 ’03 ’04 ’05 ’06 ’07

180
disbursement and local allocation tax. Consequently, we may say that the recovery measures have been implemented in a vertically-segmented manner based on the nationally standardized scheme, where the competent ministries and agencies or their internal bodies worked together with corresponding divisions of local authorities. Autonomous recovery, as proposed here however, puts emphasis on the diversity of regeneration, on the flexible response to changes, and furthermore, on the idea that such measures should be interlocked with structural reorganization of urban area in the mid to long-term. That being said, there is a high possibility that the recovery process based on conventional Japanese system didn’t contribute directly to autonomous regeneration. One of the things recognized was that social economic system in Japan, especially decentralization, had become extremely rigid and couldn’t respond to emergent situations such as huge disasters.
For example, the Enterprise Zone Scheme, mentioned hereinafter, proposed by researchers, local authorities, and businesses was symbolic as it was proposing how to lead autonomous regeneration in a region that was forced into special and serious situations by a huge disaster. Although the people in the earthquake-hit area had high expectations about the scheme, this idea was blocked by the government at that time due to strong adherence to the one-country-one-system way of thinking. The thing is that the said scheme was meant to delegate decisions on a choice-by-region basis as concerned with the recovery from a disaster.
Against such a backdrop, the situation surrounding urban and regional redevelopment has been changing dramatically. In October 2003, the government established the Regional Regeneration Department within the cabinet to promote local regeneration and job creation. Along with the urban regeneration measures and special structural reform zone already in place, three pillars were to start operation in the field of urban/regional regeneration. A series of political measures, starting with the establishment of the “Urban Regeneration Measures Law” in April 2002, followed by that of Structural Reform Special Zone Department in July 2002, and the proposal of the Regional Regeneration Basic Directive, occurred in unprecedentedly quick succession. Considering the fact that national land policy in Japan so far had been sticking with the nationally standardized scheme that had lost substance and had been depending on rigid bureaucratic sectionalism, such a change can be perceived as extremely revolutionary. These three pillars of urban/regional redevelopment policies can be evaluated as unprecedented for they are based on basic axis of regional initiative. Although the government’s implicit attitude of directly controlling each region can be perceived, the original objective of establishing such a zone is to link the two effects, that is to say, reactivation of companies through free trade and enhanced renovation by forming communities owing to the uniqueness of the zone, which is a significant viewpoint as such policies have never existed before. If the scheme of autonomous development in the region is proposed by way of rousing social/economic renovation in cities/communities, as a result of reorganizing the development of social economic activities and the relationship among corporations and between corporations and communities in limited a area, the proposal of such a system may be positioned as a discussion to further strengthen this trend. The government’s turnaround of policies with respect to regional political measures has also been accelerating since the Kobe Earthquake.
1.1.1.3 Three basic Viewpoints of Industrial/Economic Recovery Recovery form a huge disaster is nothing but promptly responding to the heavy damage and making a transition to an autonomous process afterwards. This is a viewpoint that enables the coexistence of response to the scale of a disaster and close handling of diverse and changing needs according to individuals and regions.① Respect of the Market Mechanism that Allows Choice by Local Communities The first step is to design a system or scheme that delegates decision making to local initiative or choice by local people and enterprises by utilizing a market mechanism. Emergency

181
assistance played a major role in disaster relief, and the activities of 1.3 million volunteers/year on an accumulated basis supported the earthquake-hit area. This kind of gift economy plays a very important role in the steps toward autonomy in the quake-hit area, but, at the same time, it is also important to urge the increasing presence of market at an accelerated rate. Growing out of extreme dependence on a gift economy is inevitable. In order to ensure that choice by the community be secured and to make industrial/economic recovery from a huge disaster in an urban area, just relying on the gift economy has both quantitative and qualitative limits. When thinking about the future of devastated urban industry and economy, it is necessary to make a mechanism that allows a choice by people/enterprises in the market. Ways to stimulate a self organizing system that is endogenously built up in the community should be examined. ② Program Packaging and Required Development of Social Experiment-Type Policies Mobile and prompt response to changes and flexible reaction to the diversity of challenges are needed in time of recovery. Government-led guidelines were made based on the assumption of nationally standardized fairness and stable continuity in normal times. However, recovery measures following a huge disaster must deal with a completely different situation. It is necessary to reconsider the system of local government, for they couldn’t respond sufficiently to the emergency conditions and need to be better prepared to respond to such peculiar conditions that couldn’t be imagined at the time of normalcy. Especially, it is necessary to have a mechanism that makes it possible for an earthquake-hit area to edit the existing measures on its own. More specifically, it is necessary for local communities to propose packages of political measures directly linked to solutions, so that the rigidity during the recovery process caused by inefficiency of bureaucratic sectionalism can be eliminated. Another challenge is to implement measures with a definite term. It is not appropriate to deal with an unprecedented situation by just implementing measures proven to be efficient in the past. Regardless of potential efficiency, it is necessary to implement conceivable measures with a time limit and then to make continuous judgment as to whether they are efficient or not by monitoring the outcome as a political measure. ③ Establishment of Governance by Various Bodies There are various bodies that can be useful in the case of industrial/economic recovery, and partnerships among them should be utilized. One remarkable thing is the rise of NPO and community business, etc. immediately after the Kobe Earthquake and through the following recovery process. Civic groups that used to play a supporting role in our society contributed significantly to the economic recovery. Moreover, minutely considered measures have been developed through partnerships between such new bodies and the local authorities. For example, the issue of employment/job creation should be seriously considered not only in emergency situations but in mid-to-long term. Probably due to the nature of the role played by the public sector so far, the matter of job creation has hardly been discussed in the recovery planning following the Kobe Earthquake. As it is presumable that huge disasters could cause devastating damage to industry/economy in some cases, reacting to the employment issues in the effected area is inevitable and can serve the function of an economic safety net vis-à-vis urban disasters. Moreover, the social economy sector formed by civic groups, based on the core of a reciprocal system, presents a potential to create a new industry such as community business and social enterprise in the future. Support in this area is considered to be an important aspect in terms of political measures for recovery.
1.1.2 Post-Earthquake Employment Situation and Process for Recovery1.1.2.1 Employment Issues in the Case of the Kobe Earthquake Among the impacts due to a huge disaster on industry/economy in an urban area, unemployment is possibly the most serious one. Taking as an example the number of unemployment benefits recipients, it grew from 10,000 in the month prior to the earthquake to 27,000 in April, three months
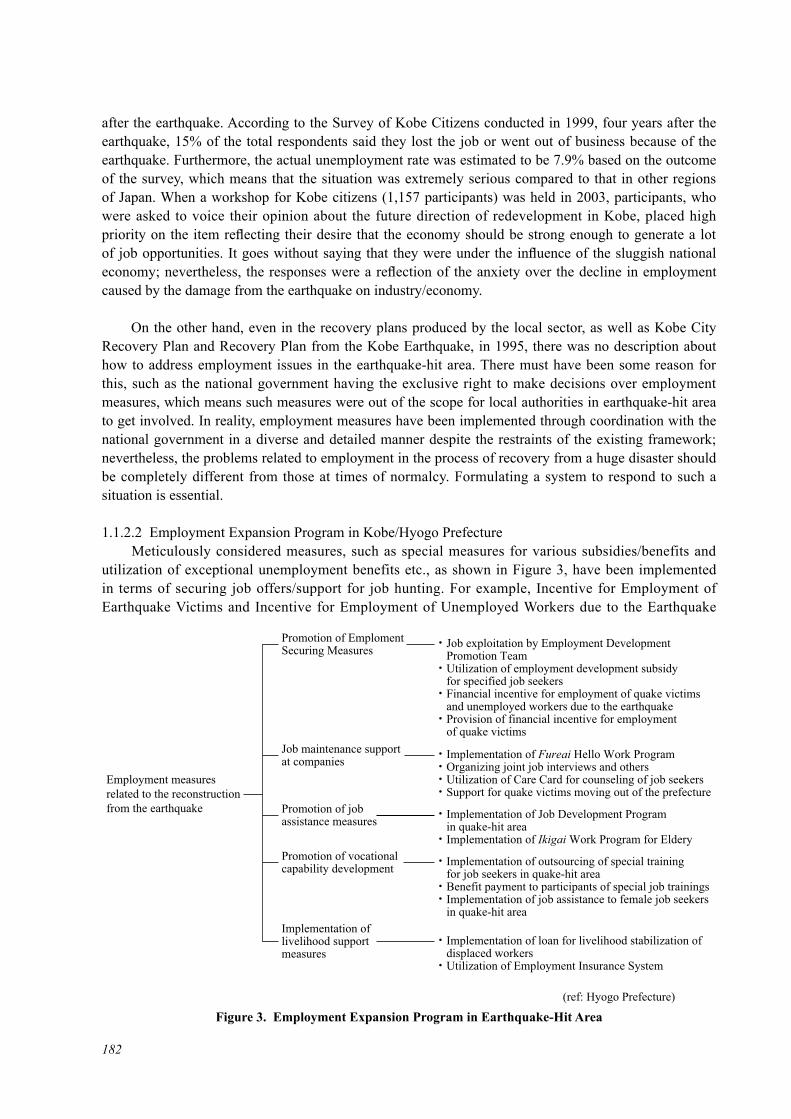
182
after the earthquake. According to the Survey of Kobe Citizens conducted in 1999, four years after the earthquake, 15% of the total respondents said they lost the job or went out of business because of the earthquake. Furthermore, the actual unemployment rate was estimated to be 7.9% based on the outcome of the survey, which means that the situation was extremely serious compared to that in other regions of Japan. When a workshop for Kobe citizens (1,157 participants) was held in 2003, participants, who were asked to voice their opinion about the future direction of redevelopment in Kobe, placed high priority on the item reflecting their desire that the economy should be strong enough to generate a lot of job opportunities. It goes without saying that they were under the influence of the sluggish national economy; nevertheless, the responses were a reflection of the anxiety over the decline in employment caused by the damage from the earthquake on industry/economy.
On the other hand, even in the recovery plans produced by the local sector, as well as Kobe City Recovery Plan and Recovery Plan from the Kobe Earthquake, in 1995, there was no description about how to address employment issues in the earthquake-hit area. There must have been some reason for this, such as the national government having the exclusive right to make decisions over employment measures, which means such measures were out of the scope for local authorities in earthquake-hit area to get involved. In reality, employment measures have been implemented through coordination with the national government in a diverse and detailed manner despite the restraints of the existing framework; nevertheless, the problems related to employment in the process of recovery from a huge disaster should be completely different from those at times of normalcy. Formulating a system to respond to such a situation is essential.
1.1.2.2 Employment Expansion Program in Kobe/Hyogo Prefecture Meticulously considered measures, such as special measures for various subsidies/benefits and utilization of exceptional unemployment benefits etc., as shown in Figure 3, have been implemented in terms of securing job offers/support for job hunting. For example, Incentive for Employment of Earthquake Victims and Incentive for Employment of Unemployed Workers due to the Earthquake
Figure 3. Employment Expansion Program in Earthquake-Hit Area
Employment measures related to the reconstruction from the earthquake
・Job exploitation by Employment Development Promotion Team・Utilization of employment development subsidy for specified job seekers・Financial incentive for employment of quake victims and unemployed workers due to the earthquake・Provision of financial incentive for employment of quake victims
Promotion of Emploment Securing Measures
・Implementation of Fureai Hello Work Program・Organizing joint job interviews and others・Utilization of Care Card for counseling of job seekers・Support for quake victims moving out of the prefecture
Job maintenance support at companies
・Implementation of Job Development Program in quake-hit area・Implementation of Ikigai Work Program for Eldery
Promotion of job assistance measures
・Implementation of outsourcing of special training for job seekers in quake-hit area・Benefit payment to participants of special job trainings・Implementation of job assistance to female job seekers in quake-hit area
Promotion of vocational capability development
・Implementation of loan for livelihood stabilization of displaced workers・Utilization of Employment Insurance System
Implementation of livelihood support measures
(ref: Hyogo Prefecture)

183
are supported by the Kobe Earthquake Reconstruction Fund, and the recipients of such benefits are employers who newly employ earthquake victims as regular workers for more than 6 months consecutively, which means 500,000 yen will be paid to the employer for each new qualifying employee. The Kobe Earthquake Reconstruction Fund is also supporting the Job Development Program in the Earthquake-Hit Area and Benefits Payment Scheme for Job Seeking Participants to attend the Special Training Course in Earthquake-Hit Area. In accordance with increasing volume of diverse tasks, the government operated Temporary Hello Work (Emergency Employment Insurance Service Center, Subsidy Center for Emergency Employment Adjustment, and Subsidy Computation Center for Emergency Employment Adjustment) for 2 and a half years after the earthquake. In actual field operation, such measures were said to have been addressed by dealing with things in a flexible and mobile manner. In addition to that, the Community Business Takeoff Support Program sponsored by Hyogo Prefecture was a remarkable political measure. This program is also supported by the abovementioned recovery foundation, and as this program is based on the assumption that the damage caused by the earthquake would inevitably have a serious impact on employment/job creation issues, it was quite meaningful that this initiative was incorporated as part of employment policies, taking into account of the importance of this viewpoint under the circumstances where the idea of community business itself hadn’t necessarily permeated the country. In January 2000, when Comprehensive Recovery Assessment was carried out in both Kobe and Hyogo Prefecture, this program was pointed out by both as a remarkable outcome of these validations, and on that occasion, the importance of strengthening community business was underlined again.
Later on, Kobe was to launch a program aimed at the creation of 20,000 new jobs, and Hyogo Prefecture launched a similar program with the aim of 50,000 jobs.
1.1.3 Political Measures for Employment and Job Creation (1): Emergency Measures Immediately after the Earthquake
1.1.3.1 Characteristic of Employment and Job Creation Issues Caused by the Disaster Bankruptcies caused by the Kobe Earthquake brought about the loss of 371,000 jobs (monthly average of recognized job loss: 31,000) in 1995 (courtesy of Employment Stabilization Bureau, Ministry of Labor: monthly total of job loss recognized by Temporary Office, Kobe Office, Nada Office of Emergency Employment Insurance Service Center). Since the earthquake occurred in January, it is more than likely that some of the job losses included in the above total actually occurred in 1994; however, it is still clear that unemployment shot up dramatically after the earthquake, based on the fact that the numbers for 1994 were 210,000 (monthly average: 17,000). It is quite obvious that employment issues on such an unprecedented scale in such a localized area couldn’t be handled within the framework of existing employment/job creation.
Generally speaking, unemployment can be categorized in several types according to the cause of job loss. First, demand deficiency unemployment caused by shrinking demand due to an economic slowdown, and in this case, industrial policies, such as expansion of effective demand and business start-up support, are required. Second, friction type unemployment caused by lack of information in the process of changing jobs, which requires careful distribution of job offer and layoff information to fix this issue. Third, structural unemployment against the backdrop where there exists discrepancy between job seekers and job offers in terms of age, skill, and regional conditions, and in this case, provision of educational programs and support for labor force transportation, etc. are necessary.
The major reasons for unemployment caused by a huge disaster are bankruptcy, business closure, and business shrinkage, so this can be described in a sense as demand deficiency unemployment. However, there are some aspects that cannot be simply defined as demand deficiency unemployment

184
when it comes to unemployment caused by a huge disaster in an urban area.
The first thing to be pointed out is the fact that the impact of great disasters is localized, and, in addition to that, the situation is changing over time. Actually, while the situation was business as usual in the adjacent city of Osaka, victims of the Kobe Earthquake were prone to experience psychological stress where only the earthquake-hit area was in a completely different situation. As great number of people lose jobs in such circumstances, emergency measures should be mobilized for them in the first place in order to give relief to their stress caused by external influence. The sudden isolation of the earthquake-hit area from external regions is the background of spatial miss-matching in the labor market. One way is to take measures to find a job in peripheral areas to which jobless people of the earthquake-hit area can commute. However, in reality, commuting from earthquake-hit area is almost impossible immediately after a huge disaster. It is also worthwhile to consider measures to secure the workplace along with accommodation in an integrated approach, so that people can move into the place temporarily. In reality however, there is still a strong tendency among unemployed victims to seek jobs in the area where they have lived so far.
For example, it is no exaggeration to say that the unemployment situation in Kobe, that became obvious following the Kobe Earthquake, showed complete different trends between the area to the east and that to the west of the city center. In eastern region such as Higashinada and Nada Wards, where there were originally a large number of commuters to Osaka, the job was maintained. On the contrary, in the western region, such as Hyogo and Nagata Wards where groups of small-to-mid size companies were concentrated, the disappearance of the workplace and the damage to housing took place simultaneously when offices collapsed or were burned down, as homes and factories were intermingled there, and the residences and the workplaces formed an integrated industrial complex. The emergence of unemployment issues due to a huge disaster has an extremely localized nature, which suggests that measures to address them should take into account such local characteristics, and at the same time measures should be examined by putting into perspective the way the labor market is operating in the adjacent and surrounding areas outside the earthquake-hit area.
Consequently, flexible application of unemployment insurance is necessary as an emergency measure. Concerning this point, Yashiro pointed out that the required reaction is taken under abnormal circumstances where the earthquake victims are concentrated in a limited area due to large-scale external shock and that this happens in volume at the same time, whereas unemployment insurance is originally designed based on the assumption that unemployment risk happens with a certain probability in the process of the economic cycle. He advocates the necessity of the longest application period of unemployment benefits for job seekers regardless of age segment (Naohiro Yashiro, 1996). Actually, the government has been taking measures such as an act on special financial support to deal with the process of recovery from and individual extension of benefits payment, etc. During the first 4 months after the earthquake, the number of implemented temporary closure (covered by unemployment benefits of the preferential measure under the “Serious Disaster Law”) was 1,162 cases, and that of temporary severance (covered by unemployment benefits of the preferential measure under the “Disaster Relief Act”) was 142 cases (during the same period, 7,005 cases were covered by normal benefits payments). However, the measures to eliminate the disparity by age segment, proposed by Yashiro, have not yet materialized.
1.1.3.2 Job Development Programs in the Earthquake-Hit Area Hyogo Prefecture implemented the Job Development Program in the Earthquake-Hit Area as an emergency employment action. Various measures were carried out to relieve earthquake-related jobless people, and the position of this program is shown in Figure 4. This program was meant to provide
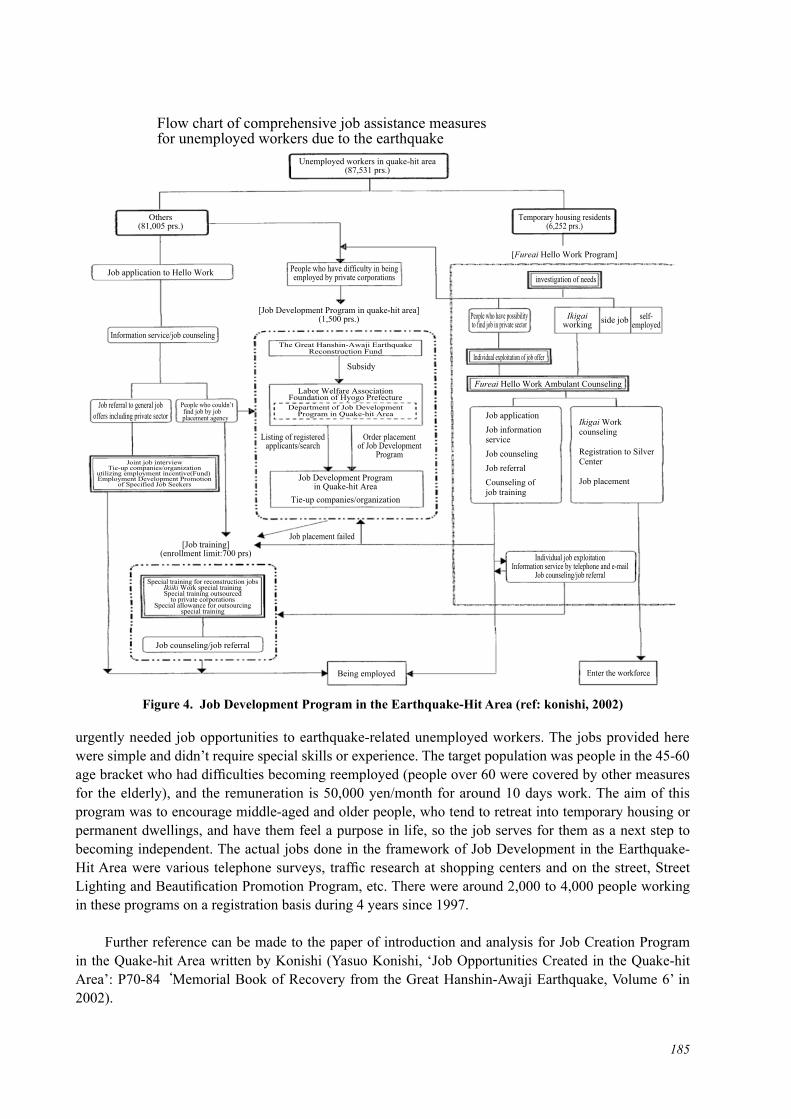
185
urgently needed job opportunities to earthquake-related unemployed workers. The jobs provided here were simple and didn’t require special skills or experience. The target population was people in the 45-60 age bracket who had difficulties becoming reemployed (people over 60 were covered by other measures for the elderly), and the remuneration is 50,000 yen/month for around 10 days work. The aim of this program was to encourage middle-aged and older people, who tend to retreat into temporary housing or permanent dwellings, and have them feel a purpose in life, so the job serves for them as a next step to becoming independent. The actual jobs done in the framework of Job Development in the Earthquake-Hit Area were various telephone surveys, traffic research at shopping centers and on the street, Street Lighting and Beautification Promotion Program, etc. There were around 2,000 to 4,000 people working in these programs on a registration basis during 4 years since 1997.
Further reference can be made to the paper of introduction and analysis for Job Creation Program in the Quake-hit Area written by Konishi (Yasuo Konishi, ‘Job Opportunities Created in the Quake-hit Area’: P70-84 ‘Memorial Book of Recovery from the Great Hanshin-Awaji Earthquake, Volume 6’ in 2002).
Figure 4. Job Development Program in the Earthquake-Hit Area (ref: konishi, 2002)
Flow chart of comprehensive job assistance measures for unemployed workers due to the earthquake
Unemployed workers in quake-hit area(87,531 prs.)
[Job Development Program in quake-hit area](1,500 prs.)
The Great Hanshin-Awaji EarthquakeReconstruction Fund
Labor Welfare AssociationFoundation of Hyogo PrefectureDepartment of Job Development
Program in Quake-hit Area
Joint job interviewTie-up companies/organization
utilizing employment incentive(Fund) Employment Development Promotion
of Specified Job SeekersJob Development Program
in Quake-hit AreaTie-up companies/organization
Individual job exploitationInformation service by telephone and e-mail
Job counseling/job referral
Enter the workforce
(ref.: Konishi, 2002)
Being employed
[Job training](enrollment limit:700 prs)
Job counseling/job referral
Special training for reconstruction jobsIkiiki Work special trainingSpecial training outsourced
to private corporationsSpecial allowance for outsourcing
special training
Listing of registeredapplicants/search
Job placement failed
Order placementof Job Development
Program
Subsidy
Others(81,005 prs.)
Job application to Hello Work
Information service/job counseling
Job referral to general joboffers including private sector
People who couldn’t find job by job placement agency
People who have possibilityto find job in private sector
Individual exploitation of job offer
Ikigaiworking side job self-
employed
investigation of needsPeople who have difficulty in beingemployed by private corporations
Temporary housing residents(6,252 prs.)
[Fureai Hello Work Program]
Fureai Hello Work Ambulant Counseling
Job applicationJob information serviceJob counselingJob referralCounseling ofjob training
Ikigai Workcounseling
Registration to SilverCenter
Job placement

186
1.1.4 Political Measures for Employment and Job Creation (2): Adjustment Economy Policy1.1.4.1 Need for the Function of Intermediate Labor Market Following emergency measures, it is necessary to urge the formation of a labor market in the earthquake-hit area. First, job information, generated in conjunction with disaster relief and reconstruction should be provided to job seekers. In the reconstruction job market, which is different from the labor market at times of normalcy, a rapid and meticulous reaction to friction type unemployment is inevitable, because there is a sudden increase in temporary employment and diverse needs of job seekers,.
Furthermore, educational programs for jobless people should be applied the in mid-to-long term. Earthquake damage to industry was more serious in relatively subordinate sectors. Regeneration of such sectors cannot be limited to the simple recovery of the activities before the earthquake. The move to high value added business and the creation of new industry by way of technological renovation is inevitable. The remarkable presence of such structural unemployment is something that should be predicted in the case of huge disasters in urban areas. Concerning this point, there is a need to design a scheme that enables integrated human resource training with the alliance of universities and graduate schools in the local community.
If the first characteristic is relative to that of employment generated by a huge disaster in a spatial and temporal context, the second characteristic is relative to the quality of the job that would become necessary in the process of reconstruction, in other words, it has something to do with the quality of the bodies that would take initiatives in such a process. What was experienced in case of the Kobe Earthquake, for example, is that various kinds of jobs that were different from those in normal times were generated in the process of reconstruction, and it became obvious that the existing market and public sectors couldn’t accurately handle such situation. In reality, the number of volunteers who were involved with the activities in the earthquake-hit area during the first year after the earthquake reached 1.3 million on accumulated basis. The activities of the NPO sector, including volunteers involved with the process of reconstruction, was a remarkable phenomenon when thinking about the socioeconomic system in Japan. Certainly, this kind of reciprocal interdependent relationship has been recognized as the economy of gift/donation, which has been incorporated as a part of the society since olden times. The recovery process from the earthquake urged it to emerge from sideline to take a main role, with rising appreciation for such a sector and its substantial expansion. Against such a backdrop, the emergence of social activities with business theme, especially community business, is noteworthy. Community business is a job creation policy originally evaluated as an inner-city policy in the UK, and in the process of recovery from the earthquake, various grassroots-type community businesses emerged in the earthquake-hit area. This new area of activities, which tries to tackle local and social challenges in the form of business, is on the rise as a type of business making regional/social contributions rather than putting profitability first, and the job in this area puts emphasis on the mission of workers.
Talking about the characteristic of jobs involved with recovery from the disaster, the complex nature of reciprocity should be pointed out. It is not a simple one-way relationship where a clear demarcation exists between job seekers and job providers but rather an interdependent two-way relationship that includes information sharing. This kind of multiplex structure needs to be supported by various bodies. The job related to recovery is not a stereotype, and its attitude is different from behavioral principles of existing bodies, namely the public sector and market sector, so extremely diverse bodies must perform their jobs in diversified styles. The fact that such new emerging players are being deployed in multiple layers cannot be overlooked. It is possible to say that such a multi-layered/multiplex-style job is the characteristics of working involvement in the process of reconstruction from huge disasters.
187
After some consideration, it becomes quite clear that regeneration of the labor market, damaged by the huge disaster, requires special political measures that should be different from conventional unemployment policies. In order to make a mobile and flexible response to a localized serious disaster in an urban area, which must be anticipated, it is indispensable to establish an intermediate labor market for recovery.
1.1.4.2 Role of Community Business in the Process of Recovery① Rise of Community Business On the occasion of overview validation of recovery 5 years after the earthquake implemented in the earthquake-hit area by Hyogo Prefecture and Kobe, inspections from various viewpoints were conducted in order to examine the future course of redevelopment economy at the turning point, such as the mounting expectation toward the development of new local industry through expansion of the business start up ratio or prospect for new direction after the business sector achieved 80% recovery. As the outcome of their efforts, the two local authorities pointed out and stressed, in common, the importance of strengthening community business. In their economic recovery assessment, for example, Kobe proposed 6 viewpoints to realize autonomous recovery, and one of them stipulates fostering community economy, which is proposing a new way of working and giving people motivation to live. Actually, activities of the NGO/NPO sector including volunteers were a remarkable phenomenon when we think about the socioeconomic system in Japan. Indeed, this kind of interdependence without going through the market has been recognized as the economy of charity/donation. Increasing evaluation toward this sector and the expansion of its substantial activities for 10 years after the earthquake brought about their transformation or their promotion from a minor part to the protagonist of society. Against such a backdrop, it is worth recognizing that social activities with business orientation such as community business started to emerge.② Recovery from the Kobe Earthquake and Community Business・What is Community Business? As of now, there exists no clear definition for community business. It is possible to describe it as business with a clear social objective in the sense that its activities are based in the community and it urges the expansion of employment in the community or returns the surplus gained through such activities to the community. In the UK, where community business has greatly advanced, it is defined as organizations doing economic activities. As community business was positioned as a measure to address the inner-city problems in major cities in the 1980’s, its goal of urban policies was to address the unemployment issues. Nowadays, it is also an objective to address unmet needs not sufficiently covered by existing organizations (public/private sectors) because some issues have a strong local specific nature. In some cases, community business plays a role in funding the voluntary sector that has undertaken various activities in each region. Community business has a strong local specific nature and has the characteristic of taking flexible and diverse actions, and now community business is going through a transformation into a social enterprise, while its scope is developing into the global arena, especially in the EU and Asian countries.・Community Business Measures Taken by Local Authorities Currently, community business is being positioned by many local authorities as political measures for regional promotion. However, it is not yet utilized in a clear form of political measures such as the case with employment policies in the UK, but in reality community business is expanding, while the term community business is interpreted in a rather ambiguous and local-specific manner. Therefore, the situation in Japan is nothing but immature compared to that in the UK, where community business has its origin, even when taking into account the fact that not only social/cultural background but also cultural/political background in Japan is different from that in the UK. A great number of community businesses exist in the earthquake-hit area after the
188
disaster. An increasingly visible existence of such new activities generated from the earthquake may symbolize early stage development of community economy, whose actual activities are moving ahead of its definition. The actual situation surrounding community business in Japan under the said circumstances may better be explained by looking at case studies.・Community Business Takeoff Support Program of Hyogo Prefecture As already pointed out, a lot of such activities have been generated and developed in the process of recovery from the Kobe Earthquake in earthquake-hit area. Responding to such civic activities, Hyogo Prefecture is taking proactive measures to support them. In the 3rd Hyogo Prefecture Council on People’s Lives held in October 1998, community business was referred to as follows: “Community business, composed of local inhabitants and volunteers, is a program that tries to meet diverse and individual needs found in the community and carries out its activities without payment in order to realize local independence and development. Instead of having a purpose of maximizing profit, it pursues business in various ways from the local people’s perspective, so that community’s benefit can be maximized. It is regarded as a form of small business rooted in the community, and is expected to be a new type of body in the economy.” Taking this into account, Hyogo Prefecture has been running Support Program for Community Business and Others since 1999. In this support program, various programs are skillfully combined, which is evaluated as measures to comprehensively support the start-up phase of community business, and the nucleus role is played by the Community Business Takeoff Support Program. The requirements for the subsidy are indicated as following: 1) business for profit, 2) business which compensates labor by paying salary, 3) profit should be returned to the community, and 4) business should be implemented with continuity, etc. These points can be considered a summary of the basic philosophy for community business. With the start of the year 2000, the list of measures supporting community business was expanded. First, the Ikigaishigoto Support Center was founded. Increasing numbers of people are willing to achieve self-realization by working for the common good regardless of the value of labor, such as working with community business or an NPO or more specifically providing care for the elderly, childcare, or school meal service in the community, which make them feel a purpose in life. The job opportunities for Ikigaishigoto should be created by providing various means of support to the people willing to start working or already working in this area, while exploring would-be workers in this new area through disseminating relative job information, and that’s why it was decided that the Ikigaishigoto Support Program would be implemented by contracting out to a corporate body like a special non-profitable corporation. Actually, official competition for proposal of a 2-year program was widely announced to corporations having offices in Hyogo Prefecture. Hyogo Prefecture’s naming of community business as ‘Ikigaishigoto’ was unique, but furthermore, the role played by this center for the sake of community business development, namely the role of an intermediate support organization, is noteworthy. Hyogo Prefecture started Community Business Support Measures in 1999. These measures are quite unique for an initiative taken by local authorities, and it is considered that they have greatly influenced the ensuing support measures taken by other local authorities, such as the methodology of support. The background of implementation of such measures owes a great deal to the existence of financial resources, namely the Kobe Earthquake Reconstruction Fund, which made it possible to react in terms of support measures related to earthquake recovery in a relatively flexible manner. However, it is noteworthy that they positioned the relatively unknown area of community business as a public measure of local authorities and that their initiative led to the current rise of community business. Furthermore, the fact that the decision of the organizations to be subsidized was taken through official competition from the very beginning and that intermediate organizations and support functions, such as the Ikigaishogoto Support Center and Support Net for Community Business, were founded in order to promote integrated support for community business cannot be

189
neglected. On the occasion of The Conference of Support for Earthquake Victims 2, established as an intermediate support organization to link earthquake victims and local authorities, there was a proposal to develop community activities, such as community maintenance in the earthquake-hit area, into community business.③ Community Business in Evolution: Growing into a Social Enterprise It looks like the most important characteristic of community business is its transformation. Even outside the earthquake-hit area, community businesses with various styles have started activities, and such activities have been recognized quite rapidly in the last several years. Community Business is continuing its evolution even in the UK, the birthplace of community business. In the 1980’s, the term community business was used in a general sense in the UK, but this expression is currently used in a rather limited way to indicate all program activities based in a community in order to differentiate it from social enterprise, which is developing without any geographic restriction. In this context, community business can be categorized as a part of social enterprise. In 2002, the UK government defined a social enterprise as a business with primarily social objectives whose surpluses are principally reinvested for that purpose in the business or in the community. Based on the assumption that social enterprise is an evolution from community business, the aspect of being an innovative organization making full use of social technology may be raised as a characteristic of social enterprise. Finding unused resources, social enterprise intends to promote community innovation by reorganizing/re-editing activities of the local community, which means this organization is fulfilling the function of a social entrepreneur. The characteristics of such social enterprise are: 1) development of new products/creation of new markets, 2) organization operated by multi-stakeholders as it has social objectives, and 3) changing the nature of organization symbolized by financial independence and shift toward an organization with complex functions. Among these, a shift toward an organization with functional complexity can be a change of necessity, taking into account the hybrid nature of social enterprise: an enterprise with both social and economic efficiency. Application of various resources and relationships with multi-layered groups of stakeholders makes it possible for social enterprise to have this functional complexity based on the economy of coverage. Making results in the earthquake-hit area, groups of community business play an increasingly visible role in the new society, in addition to their initial mission of securing employment/job opportunities. ④ Urban/Regional Policies and Community Business In contrast with the rapid evolution of community business and mounting expectation in local society, its development is under various restrictions in reality. In summary, it is first necessary to point out the difficulty of managing community business. Community business is not only about economic activities since it has clear social objectives and, as such, is supported by various stakeholders. This type of organization comprising multi-stakeholders has the possibility to bring about innovative operation of organizations through collaboration with new human resources, such as involvement of volunteers, which existing bodies have never experienced. On the other hand, as it has to meet the expectations of various stakeholders, it is possible to say that its management is quite different from existing businesses and NPOs, etc. It is necessary to indicate that community business is a body acting on completely different and new principles compared to existing sectors and, at the same time, that its organization and activities are changing at an accelerated rate. For example, acceleration of shift toward organization with functional complexity in these days can be called a change of necessity, taking into account the hybrid nature of community business, and such an aspect makes its management more peculiar in nature. Secondly, its activities are dependent on relationships with existing sectors. What this means

190
is that is necessary to somehow put a price on the assets/services it provides. Community business has a cost competitive privilege in a way by collaborating with volunteers. On the other hand, if it is to compete against products of private companies on an equal basis, it cannot enjoy the merit of a scale economy, as its production capability is small in most of cases, and, as a result, there is a possibility that the price of its assets/services may prove more expensive. In the UK, methods to determine the price, such as the best price, by considering the social aspect of activities are now under examination; however, this way of thinking is already the source of confusion. Thirdly, the relationship with the public sector is another aspect of relationships with existing sectors. Due to its social nature, many activities done by community business are quite similar to services that have been provided by the public sector up to now. The problem for community business is how to meet the requirements, for example, of fairness and continuity, which are heavily respected when national and local authorities provide such services. Above all, it is about social reliability of an organization. In case of the UK, it is extremely important for community business to have democratic operation and to disclose information. Moreover, research on social audits has advanced in order to judge objectively the sociality aspect of its activities. Discussion with regard to this aspect is still immature in Japan, and this presents a big challenge in the future. Finally, a framework to support community business is necessary. The rapid rise in community business in recent years is evidence that such activities have been socially recognized, and the launch of support measures for such activities by local authorities should be welcomed. However, defining such activities often comes first, which arouses some concerns that such definitions might rigidify community business that has the remarkable nature of diversity and continuous change. Social recognition of community business means fixation of community business into the existing social system at the same time. The dynamism of activities that constantly change is the very nature that enables community business to respond to local needs in a flexible way and to create employment adapted to the surrounding environment. It is essential to consider that while positioning community business as a tool for political measures, its essence should never become obsolete. Kobe created the Kobe Social Venture Award in 2003. This award was purported to find social ventures playing social role while remaining economically independent. The awarded activities are respectively suggesting a break from the rigid part of society that Japanese modern society should confront. Future development of community business in Japan is unpredictable, but social request for such programs is large.
1.1.4.3 Safety Net in the Earthquake-Hit Area Following the argument so far, establishment of an intermediate labor market with the assumption of recovery from a huge disaster seems appropriate, although it is difficult to clearly define intermediate labor market. As devastation of the labor market due to a disaster is assumed to have strong local characteristics, only a basic viewpoint of this concept can be considered.
Figure 5 shows an image of the intermediate labor market for recovery in the earthquake-hit area. On the left side of the chart, employment program and community business policies are positioned. At the top center of the chart, emergency measure/job creation program, and both wings of this, employment in the labor market and job (Ikigai) creation are placed. The emergency measures taken immediately after a huge disaster are to be led by the approach to regenerate the labor market in the process of recovery and development of Ikigai/job creation.
First, in order to recover from a non-functioning or weakened labor market and return to normal conditions, an intermediate role is required. Consequently, intermediate labor market policies will be terminated once they have fulfilled their purpose. In the meantime, it is necessary that various
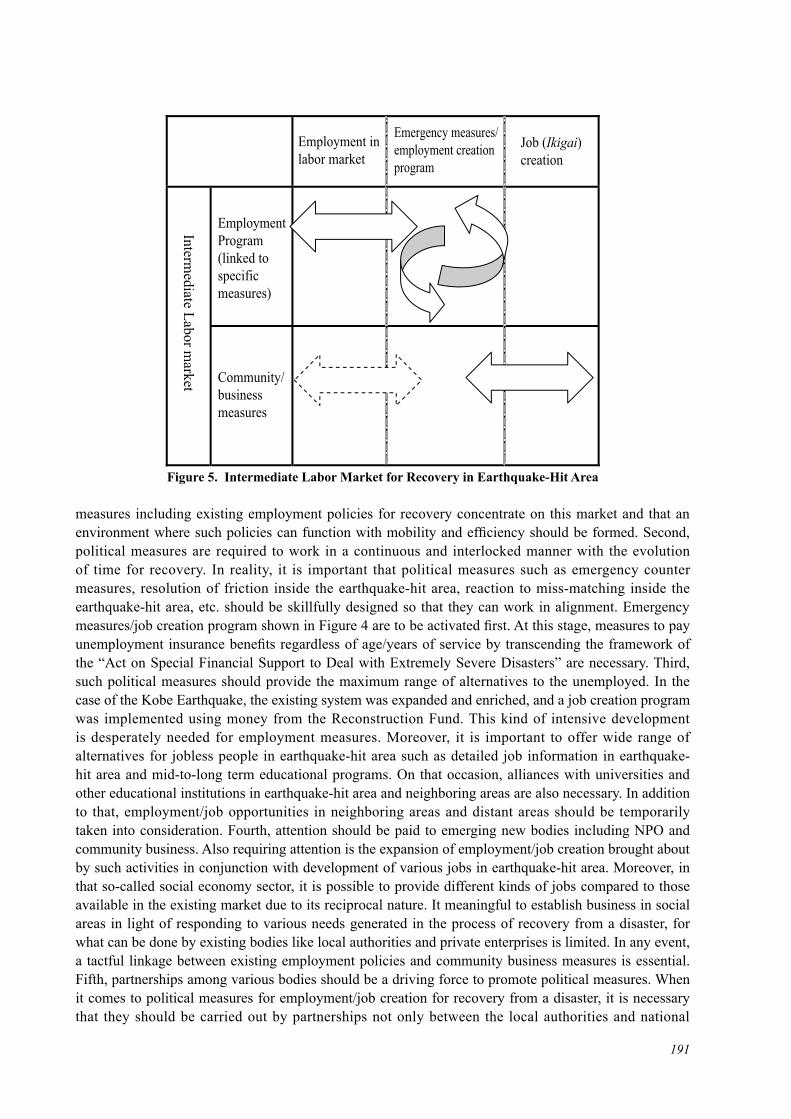
191
measures including existing employment policies for recovery concentrate on this market and that an environment where such policies can function with mobility and efficiency should be formed. Second, political measures are required to work in a continuous and interlocked manner with the evolution of time for recovery. In reality, it is important that political measures such as emergency counter measures, resolution of friction inside the earthquake-hit area, reaction to miss-matching inside the earthquake-hit area, etc. should be skillfully designed so that they can work in alignment. Emergency measures/job creation program shown in Figure 4 are to be activated first. At this stage, measures to pay unemployment insurance benefits regardless of age/years of service by transcending the framework of the “Act on Special Financial Support to Deal with Extremely Severe Disasters” are necessary. Third, such political measures should provide the maximum range of alternatives to the unemployed. In the case of the Kobe Earthquake, the existing system was expanded and enriched, and a job creation program was implemented using money from the Reconstruction Fund. This kind of intensive development is desperately needed for employment measures. Moreover, it is important to offer wide range of alternatives for jobless people in earthquake-hit area such as detailed job information in earthquake-hit area and mid-to-long term educational programs. On that occasion, alliances with universities and other educational institutions in earthquake-hit area and neighboring areas are also necessary. In addition to that, employment/job opportunities in neighboring areas and distant areas should be temporarily taken into consideration. Fourth, attention should be paid to emerging new bodies including NPO and community business. Also requiring attention is the expansion of employment/job creation brought about by such activities in conjunction with development of various jobs in earthquake-hit area. Moreover, in that so-called social economy sector, it is possible to provide different kinds of jobs compared to those available in the existing market due to its reciprocal nature. It meaningful to establish business in social areas in light of responding to various needs generated in the process of recovery from a disaster, for what can be done by existing bodies like local authorities and private enterprises is limited. In any event, a tactful linkage between existing employment policies and community business measures is essential. Fifth, partnerships among various bodies should be a driving force to promote political measures. When it comes to political measures for employment/job creation for recovery from a disaster, it is necessary that they should be carried out by partnerships not only between the local authorities and national
Figure 5. Intermediate Labor Market for Recovery in Earthquake-Hit Area
Employment Program(linked to specificmeasures)
Community/ businessmeasures
Employment in labor market
Job (Ikigai)creation
Emergency measures/employment creation program
Intermediate Labor m
arket

192
government, as is the case of normalcy, but with diverse bodies like private enterprises, NPOs, and citizens’ groups. Political measures related to recovery in an earthquake-hit area need to have remarkable characteristics such as urgency, temporal continuity, and flexibility to meet individual needs, which is completely different from what has been done in the past. Sixth, demand expansion in the earthquake-hit area and in surrounding neighborhoods is an important challenge to solve employment issues, and alignment with local industrial measures is necessary. Seventh, the local and national governments will be at the core of the bodies promoting this intermediate labor market; however, such an intermediate market should be, in reality, run by strategic partnerships among various bodies due to their mobility and flexibility. Finally, such employment policies are required to operate as a package program for recovery policies as mentioned before. Industrial policies relative to demand creation, educational policies to address structural problems in the mid-to-long term viewpoint, and community policies having something to do with motivation to live/job creation for the elderly, and so on should be proposed as a package of political measures that meets local and community-specific challenges.
1.1.5 Political Measures for Employment and Job Creation (3): Mid-to-long Term Demand Creation Policies
1.1.5.1 Proposal of Enterprise Zone in the Case of the Kobe Earthquake In the process of autonomous recovery from a huge disaster, it is an extremely important to stimulate the mechanism of market regeneration by deregulating in terms of industrial recovery. Actually, such a proposal came first from the earthquake-hit area in the case of the Kobe Earthquake. Here is a summary of the viewpoint of the demand side for mid-to-long term job creation by citing the example of the proposal of Enterprise Zone Policies in the recovery process following the earthquake.
It was the Hyogo Creation Study Group that came up with a proposal first. In March 1995, they published “New Regional Promotion by Designation of Enterprise Zone.” In this proposal paper, they suggested simplification of various approval procedures, deregulation related to land utilization/construction, etc., deregulation of employment of foreign workers, liberalization of information/communication, tax reduction or exemption for corporate tax/property tax, etc. with such tax benefits being valid for 10 years.
It was then in May 1995 when Kobe City Enterprise Zone Study Group proposed the Kobe Enterprise Zone. In that paper, they proposed urban regeneration policies with the core of incentives with time limits based on tax reduction and deregulation, with the purpose of quick response to employment issues such as joblessness, image reform of Kobe as a business city, and formation of a location for new industry creation, etc.
In response, the Kobe City Recovery Plan was launched in June 1995, and it positioned establishment of an Enterprise Zone (location to promote establishment of enterprises) as one of the measures to urge promotion of a high-level industrial structure in Kobe among other industrial recovery measures. This plan advocated various economic deregulation measures while setting up the zone equipped with various preferential measures to promote investment and import, such as tax reduction and deregulation, so as to attract enterprises. This was a plan for industrial regeneration designed in a broad and detailed manner, and the scheme for the Enterprise Zone was the only one that provided a clear framework for the new system that was like nothing ever seen in the past. The Plan for Recovery from the Kobe Earthquake, produced at almost the same time as the Kobe City Recovery Plan, also proposed the establishment on an Enterprise Zone as a system to implement preferential measures in order to promote investment from inside and outside of Japan, to invite foreign corporations, and to promote import and attract foreign and domestic corporations in the zone.

193
Against such a backdrop, MITI (currently the Ministry of Economy, Trade, and Industry) conducted Research on Social Infrastructure for New Industry: Research for Establishment of Enterprise Zone. In that research, the Enterprise Zone was set up on Port Island Phase 2 District, and the setup period was specified as 10 years. Conventionally, there has been no precedent of specifying the setup period in advance, and the characteristic of this project is that once the mission of the project is completed, the system itself will cease to exist. This project tried to provide support by utilizing harbor function, support for enterprise activities, and international exchange/arrangement of infrastructure to attract enterprises based on the axis of preferential tax exemption measures and deregulation.
Many discussions regarding the establishment of the Enterprise Zone were held during the process of recovery from the Kobe Earthquake. As a conclusion, the government at that time still strongly adhered to the one-country-one-system ideal, so the initiative of setting up the Enterprise Zone, started by the proposal of Kobe Enterprise Zone, couldn’t materialize in a full-fledged manner. Nevertheless, Kobe and Hyogo Prefecture actually took the first step to implement economic policies based on the initiative of the local community by respectively establishing the “Kobe Enterprise Zone Ordinance” and “Industrial Recovery Promotion Code” in January 1997, and both incorporated preferential measures to attract various industries.
As the discussion from this viewpoint was going on, programs and proposals by economists, who thought it inevitable to reorganize the system in the process of industrial/economic recovery, were presented in quick succession. For example, the Group of Thinking about Kansai in the 21st Century: Team of Safe and Secure City/Community Development (led by Kojiro Niino) stressed the necessity of additional political measures by arguing that the idea should be highly evaluated as a new administrative method as it has an aspect that local authorities, who had been dependant on financial measures provided by the national government when they carried out political measures, will implement the incentive to attract businesses in a limited area on their own judgment and with their own financial resources. Furthermore, the Duty Free Island (DFI) Scheme and Plane Expansion from Port Island Phase 2 District were also proposed by this team.
1.1.5.2 Kobe Enterprise Zone Ordinance and Industrial Recovery Promotion Code Kobe Enterprise Zone, established in 1997, is focusing on Port Island Phase 2 District where preferential measures are applied in the framework of the Kobe Enterprise Zone Ordinance by Kobe and the “Industry Accumulation Code” by Hyogo Prefecture (Table 1). The measures, shown hereinafter, are to be applied to 9 special business areas including fashion, information communication, and medical care, and a reduced tax rate is applied for property tax, urban planning tax, and real estate acquisition tax, and in the case of core facilities, which play a leading role and have economic effects, corporate tax reduction is applied. Other than the measures mentioned-above, preferential treatment such as various subsidies and financing will be taken. Moreover, Port Island District Phase 2 is expanding the incentives, focusing on strategic industries such as medical care/biotechnology, by establishing the Kobe Bio-Medical Fund for the support of bio-medical venture business and the Pilot Enterprise Zone that provides leasing of land to healthcare professionals rent free for 10 years under the Project for Kobe Medical Industrial City. As of 2009, over 160 medical care companies in total opened offices in this zone.
When it comes to the selection of business location in the future, it is expected that more importance will be placed on the formation of clusters that have diverse core functions such as human resource training and services relative to strategic industries, in addition to tax reduction measures and deregulation. The formation of business space, with the aim of sharing the cost and risk regarding R&D and human resource training by developing an accumulative network inside the community in order to alleviate individual burden, is inevitable for cities exposed to global competition. In this sense, it will

194
be indispensable to have strategic management for the autonomy of the cluster in the case of Kobe’s initiative to start industrial cluster formation.
Table 1. Preferential Measures of Kobe Enterprise ZonePreferential item Preferential treatment
given to the companies of growing segments doing ‘specified business’
Preferential treatment given to ‘nuclear facilities’
Tax related property tax/city planning tax
3 years reduction by 1/2 (land/building/depreciable property) tax rate: reduction from 1.7 % to 0.85 %
real estate acquisition tax at the time of acquisition: reduction on 1/2 (land/building)Tax rate: reduction from 3 % to 1.5 % (limit amount: 200 million yen)
business facility tax tax discount on asset: reduction by 1/2 for 3 years, from 600 yen/m2 /year to 300 yen/m2/year
Subsidy related subsidy of accumulativepromotion for job creationtype industry
1) incentive to new local employees :600 thousand to 1.2 million yen/worker (in case the number of such new local employees is more than 11 workers2) incentive to introduction of new energy: incentive ratio of 1/2
recipient: companies acquiring or leasing land and investing more than 50 million yen on facilities and depreciable assets, or foreign/foreign capital companies leasing such facilities as tenantlimit amount: 300 million yen(100 million yen in case that the number of new employees living in Hyogo Prefecture is less than 100.)
incentive to feasible studyfor office establishment
domestic companies: incentive ratio 3/4 limit amount:3 million yencompanies from overseas: incentive ratio 11/12 limit amount:5.5 million yen
subsidy to tenant feepayment for offices
subsidy of 2,500/m2/month for 3 years limit amount: 3 million yen*Entitled recipient should move in to Kobe International Business Center/ Foreign/foreign capital companies operating specified business will receive 1,000 yen/m2/month for 3 years in addition to that payment (limit amount: 5 million yen/year
subsidy to constructionexpenses
grant or 10 % subsidy of construction expenses (limit amount:1 billion yen)(application: by the end of March 2005/ duration: by the end of March 2007)
Finance and Others
financial program forattracting companiesoutside the prefecture
limit amount: up to 80 % and 2.5 billion yen of the said business expensesinterest rate: 1.1 % duration: up to 15 years
subsidy to interestpayment of constructionexpenses
Entitled recipients should be also borrowers of the said finance, and the subsidy should be less than 25 % of the construction expenses and the interest subsidy is paid less than 1 % upon the amount after the deduction of such finance amount(application: by the end of March 2005/ duration: by the end of March 2011)limit amount: equivalent to interest on the borrowing up to 5 billion yen combined with the said finance amount
* It is necessary to submit planning documents related to specified business or upgrading program of nuclear facilities to Kobe city in order to have preferential treatment and then to get approval of such treatment. Moreover, it is necessary to submit separate documents in order to receive preferential treatment based on Industry Accumulation Code of Hyogo Prefecture.
* Other than above mentioned preferential treatments, it is possible for some businesses such as transportation business dealing with import of goods, manufacturers, wholesalers, and retailers to be granted the special depreciation measures of national tax and others based on FAZ Act.
1.1.5.3 Proposal of Special Economic Zone for Recovery from Serious Disasters As was already mentioned, it is appropriate to say that the concept of special economic zones started taking root in Japan after the Kobe Earthquake. However, from the viewpoint of special economic zones involved with recovery from huge disasters, much more advanced proposals are necessary. Three types of special economic zones are potentially possible.
The first type is an enterprise zone aimed at attracting businesses. The incentives in this case should be tax reduction and deregulation, but these two incentives should be thoroughly pursued with the assumption that they should be carried out within a definite period. Especially, in case of Kobe the Enterprise Zone, although partial tax relaxation was achieved, it was not sufficient. Even in case of urban redevelopment, although regulation was largely relaxed for city planning proposals from urban developers in urban redevelopment special zones, there were no measures for tax reduction, and financial support was limited to starting up a business.
195
The second is a special economic zone incorporating strategically guided regulations and placing emphasis on industrial structure reform in urban areas. Taking the example of location cost for intelligence intensive enterprises of the next generation, it is not simply comprised of land price and tax. The investment in high quality education, expenditure on R&D and marketing, and response to expansive risks are essential factors. This second type of special economic zone requires strategically intensive investment, which eventually decreases such costs. In this case, incentives should not be limited to the designated zone, but rather such merits should be invested on activities from which we can expect some effects of correlation.
The third type is a special economic redevelopment zone established in existing urban districts. In most cases, this type of special economic zone has been developed with the assumption of developing an open space location. However, if the autonomous redevelopment of urban areas is the objective, the most efficient path is to utilize existing industrial groups. The deregulation and tax reduction measures for this type should take into account relationships with other competitive industrial areas, but such measures should be examined as a vehicle of regeneration with a time limitation.
Economic activities in major cities are not only an issue of the industrial economy itself but that of the spatial system correlated with such an economy. Various systems were designed related to industrial space, which served as a remedy to solve urban issues in the era of high economic growth, but such systems are becoming obsolete with rapid changes in the urban economy. In the era of international competition where cities compete with each other over the boundaries of states, national land policies are almost meaningless if they are designed on the assumption that the national economy is in a situation of zero-sum gain. The thing is that in the process of transition from a branch type economy to an autonomous economy, the centralized structure of the national government should be converted into a decentralized structure that allows each region to decide what is necessary for the region by its own initiative. The systems and structures for space organization, which have assured efficient function of the national economy, should be altered in a direction that urges an autonomous type economy. As well, the fact that these systems/structures have been constructed from the viewpoint of government and local authorities who have controlled the space and probably have notions that differ from those of the users of the space cannot be overlooked. Originally, the objective of an industrial space system is to maximize the satisfaction of those who use it, and it is necessary to review the way the system/structure should be from user’s point of viewpoint.
1.1.6 Future Challenge : CED (Community Economic Development) Policy1.1.6.1 CED Policy Potential A sudden huge disaster has great influence over people’s lives including their jobs. People’s jobs are intricately linked their lives and have specific local challenges. Therefore, job regeneration is complicatedly intertwined with various elements in addition to specific local issues. Reaction to these challenges is required for an industrial economic policy to function in normal times as well as in the case of an emergency, as is the case with other countermeasures for disasters.
The experience and challenges of CED (Community Economic Development), which emerged as a new urban policy in the 1990’s, and its potential in Japan are additional points of interest. Urban regeneration by way of social inclusion, which is also an objective of CED, differs greatly from previously existing urban policies, and it is beneficial to examine the background of the emergence of CED as a new urban policy.
CED policy was originally positioned as a regional political measure in the EU, which has been reinforcing integrated support for communities, while defining the support for social exclusion as a

196
local challenge on the community level, citizen’s participation from the design/planning stage, and mid-to-long term perspective as the axis. There is a great difference between the EU and Japan in terms of society/economy, in addition to different historical and cultural situations. Nevertheless, with changing global trends, regions and communities have a lot in common in terms of the distress they have to face. An integrated approach to local issues, which has also just started in Japan but is albeit still in the embryonic phase, will eventually evolve into a CED-type urban policy.
The concept of social inclusion was used by France in the 1970’s, but it was in 90’s in the UK, under the Blair administration, when this perspective started to gain a high profile as a way to deal with reality. In 1997, the Social Exclusion Unit was founded as a governmental body in the UK, and since then, it has established itself an organization serving to provide an integrated perspective for community business. Awareness of a localized decline of regions is also increasing in Japan as a new local challenge, although the way this issue becomes visible varies from region to region. The framework of a new urban policy against localized regional decline/dilapidation should be designed after examining what the emergence of this new approach for social regeneration suggests, as it is predicted that such issues will aggravate the trend of rapid demographic decline and increasingly multi-cultural social settings.
Such a perspective is also becoming obvious in Japan. In the case of the Kobe Earthquake, community business emerged as one of the major players in the process of recovery in earthquake-hit area, which is a noteworthy initiative. Clarifying its position that community issues should be tackled in the form of business by the community, community business has its base of existence in a closely-linked community network. The attention to social capital existing in the community, such as trust and social relationships, suggested the rise of a mechanism for new social adjustment in terms of urban/regional regeneration. It is possible to say that a CED-type urban policy, with its core of social inclusion incorporating such an angle/mechanism, is closely interlocked with the mechanism of social adjustment such as social economy and the third system whose role is being increasingly recognized on a global basis. In this context, the social inclusion approach indicates a specific method on the field, and CED is a mechanism of urban policy for regional regeneration that incorporates this approach.
Three points are considered important when discussing CED, taking into account the Japanese situation and its application. The first point is a community-based approach. When considering the mosaic structure of a local area, there is always the question of how to deal with an individual piece that has been increasingly acting on its own. Social exclusion and its root cause, poverty and social disparity, are deeply connected, and they have an extremely localized nature. Such recognition is rousing the necessity of political measures based in the community. The social inclusion approach, which has the objective of inducing the process of economic regeneration and autonomy of communities in the face of complicated challenges of communities, consists of packaging various and different programs in reality. As this is an approach to community-specific problems, that’s why political measures are made up of various groups of policies. The social inclusion approach is a potential solution to community-specific problems, which look like a mosaic, and its characteristic is to tackle challenges as a whole in an integrated manner and to attach importance to the process with the passage of time.
From a holistic viewpoint, local challenges are dynamically changing, while various elements have complicated relevance. Social exclusion incorporates various aspects such as economic/social/space structures, and they form the structure of social exclusion comprising many elements that are complicatedly entangled. So far, community issues have been handled by individual departments of local government when such issues surfaced. However, it is no exaggeration to say that community challenge is made up of all the elements in the community that are closely correlated. There is a high possibility that addressing one issue will lead to making another challenge more obvious. As a consequence,

197
inefficiency of the vertically-segmented administration on the field cannot be denied, this might make it difficult to realize a scheme where the regeneration would be accelerated in an integrated and autonomous way by the choice of the community. In regions where changes are getting more obvious, addressing varying situations is a prerequisite. In order to address issues that are accelerating, the use of an integrated approach is inevitable. It must not be overlooked that this holistic approach of CED enables not only regional economic regeneration but environmental/social/cultural regeneration and new creation.
Thirdly, a process-oriented approach is required. Alan Kay (2007) characterized the dynamism of exclusion as “being caught in a downward poverty cycle,” “causing people…thus more excluded; and prejudice against a particular group thus causing their social exclusion,” “geographical/structural such as remoteness of the area…depopulation of rural areas meaning the population density can no longer maintain the level of service, …and residents become more excluded,….and move to a better” area”. So far, the perspective of urban challenges and their solutions tends to be rather static, whereas his viewpoint is that multiplex/multi-layered elements are intertwined and that they continue to change dynamically, which means a process-oriented approach is required.
Such a perspective is greatly related to the way of decision making on local regeneration. The process of local regeneration in a mature society should not be chosen from a list of choices presented by somebody like government or local authorities, but it should be chosen by two-way communication, or through a mechanism of information distribution like a network where people can participate in the decision making process. Consequently, such a mechanism of decision making based on people’s participation should have a structure that allows continuous adjustment of trajectory according to changes in the external environment and by the will of the participants. The conventional way of planning, first determining a regional target and then deciding how to achieve it efficiently, makes little sense anymore. It should not be control of the society based on the strict logic and authorization by specific groups, but the very process of repeating experiments in reciprocal relationships with diverse bodies will become more important. This kind of decision making based on people’s participation is of course a challenge for the whole society, but in reality, it will be applied on town and community development. The future of town development in the next generation depends on how such participation in the mechanism of decision making can be embedded in the process. This is where cutting the chain of exclusion in the community and booting the dynamism of social inclusion comes in. Consequently, it is not possible to keep running the dynamism of social exclusion with the current way of completing political measures on a single-year basis that had been implemented so far. It is necessary to position and extend such measures in multiple years from a mid-to-long term perspective.
1.1.6.2 Community Coordination Policy for CED Design in order to materialize such basic perspective as political measures should be carefully considered. An individual approach to the diversity of community, comprehensive and integrated support, and emphasis on the regeneration process extending into multiple years are challenges that are difficult to meet under the conventional policy framework, and reaction to such challenges is required. However, CED doesn’t require a special policy that is completely different from existing ones. Rather, most of its political measures have something in common with conventional policies, but it is necessary to achieve conversion/reorganization of relationships with respect to various systems and mechanisms in implementing such policies. That is to say, CED is not simply aiming at increasing the local income level or purchasing power, but it is trying to create a sustainable process by stimulating urban regeneration.
Among the points of contention related to CED, the following three points are examples of a rigid relationship that should be addressed. First of all, in the case of urban regeneration, it is necessary

198
to make flexible and quick responses to various challenges, and the inefficiency of bureaucratic sectionalism on the field must be eliminated. Second, rigidity has something to do with the way the central government presents its logic and structures to local authorities/local communities. This kind of top-down framework of decision making cannot deal with communities that are facing diversification and changes related to globalization. It is important to design a bottom-up mechanism reflecting the voices from the field. Thirdly, sharing the experience of problems and solutions or forming relationships between geographically remote communities through active communication will certainly become more importance in the future. Now is the time for local authorities to make a step forward to set up full-fledged relationships among them. Finally, putting emphasis on process, urban regeneration is a challenge to be addressed in the mid-to-long term. The current single-year principle abolished to make a shift toward a multiple-year system, which should be considered to be an urgent challenge.
In realizing CED policy, different relationships compared to existing urban policy, which means functional coordination in terms of organization/fusion of various policies inside community, spatial coordination among communities (regions), and coordination on a temporal axis from a mid-to-long term perspective need to be established.
1.2 Concrete Measures1.2.1 Thematic Background There is a deeper reason local governments promote local industries. It is because local industries support the lives of local citizens. In other words, in areas where local industries are concentrated, people living in those areas are engaged in work in those industries and get income from them as well. As a result, local industries flourish as do bonds among community people and the community itself, invigorating the local economy and the entire community.
Local governments in Japan try to develop local industries in their area by promoting various measures in cooperation with the industrial sector. Some examples are: (1) invigorating existing industries as they are, (2) inviting or generating totally new industries, and (3) promoting development of the overall community by promoting local industries.
Local industries in Japan were facing hardship due to the prolonged economic sluggishness after the collapse of the bubble economy, economic globalization and the transformation of industrial structure.
When the hybrid-rubber shoe industry is taken as example, competition in the shoe industry was intensifying among domestic companies. On top of that, low-end products from other countries in Asia, including China, and high-end products from Italy and France were also coming into the Japanese market, making the situation even tougher. In the hybrid-rubber shoe industry, it was estimated that there were 1,600 companies with 15,000 to 20,000 employees in Kobe before the earthquake. How to support this huge local industry was a big challenge for the city. It was under these circumstances that the Kobe Earthquake struck.
There is a difference between relief and recovery. Relief means to restore the original state, and in the area of business, this is the state in which each company is able to temporarily maintain its operation. Meanwhile, recovery is the effort to get the condition to the pre-earthquake state in a full-scale manner that is sustainable.
What Kobe focused on was how to draw a road map to recovery. In the process in which local industries rose from the disaster, the key was to initiate relief activity as quickly as possible, followed by recovery and then bringing in new development. Appropriate support measures were required to realize
199
a smooth transition from emergency relief to permanent recovery. Kobe planned a series of measures based on three phases: relief, recovery, and new development to solve the problems local industries were facing before the earthquake. Obviously, collaboration with local business entities was indispensable starting with the first phase in order to make sure that the measures taken by the city would meet the needs of industry. However, substantive collaboration did not occur in the beginning as each company was fully occupied with what they urgently had to do.
Therefore, Kobe took on the challenge of relief measures on its own in the beginning with the hope of restoration as quickly as possible.
1.2.2 Efforts on Economic Recovery1.2.2.1 Large Companies As large companies on the whole have strong economic and personnel power, they were encouraged to promote relief and recovery on their own in principle. Some large companies relocated their head offices rather than reconstructing offices at the original location or withdrew their business from Kobe rather than resuming the operations of large-sized factories that were greatly damaged by the earthquake, taking into consideration the sluggish demand during the months preceding the earthquake. Other companies could restore their production facilities within about six months thanks to their serious efforts. The industrial production index of Hyogo Prefecture showed a large decline during the period from January to March in 1995, but later in the period from April to June, the index not only recovered but topped the previous year.
1.2.2.2 Small and Medium-sized Companies① Essential Items for Recovery Concerning the recovery of small and medium-sized companies, the earthquake took away the places where people lived, worked, and shopped. Kobe considered what was required for the recovery of local industries and concluded that the most important thing was financial resources to resume business. The second most important thing was a place to live for each person engaged in business to live, and finally it was necessary to find a place for business to restart. The keywords for recovery of local industries were money, people, and place.② Emergency Financial Loans Securing financial resources to resume operations was an urgent need for companies that lost buildings and equipment. The national government, Hyogo Prefecture and Kobe decided immediately to implement financial loans programs. On January 21, 1995, Kobe started discussions with Hyogo Prefecture, and on February, 9, 1995, the national government decided its supportive policy. Hyogo Prefecture implemented the Emergency Disaster Relief Fund, while the Disaster Relief Emergency Special Fund and Disaster Relief Special Fund without Collateral/Guarantor were implemented by Kobe. These loan programs were initiated on February 15, 1995, less than one month after the earthquake, and were in effect until July 31. Based on these programs, Hyogo Prefecture offered 304.1 billion yen, and Kobe offered 118.1 billion yen. In total, 422.2 billion yen was offered with the national government providing half. The companies and organizations eligible for these programs were small and medium-sized companies that had difficulty in continuing their business due to the damage of their factories or shops, and they had to be certified as victims of the earthquake. The intended purpose of the loan program was confined to the restoration of stores or factories needed for the recovery of operation, construction and equipment, and temporary working capital for continued business operation. Utilizing the Disaster Relief Emergency Special Fund, Kobe offered 50 million yen to one company for equipment, and up to 10 million yen of this was offered without collateral/guarantor.

200
The repayment period was to 10 years, which was ultimately extended up to 17 years. The interest rate was as low as 2.5% per annum. The grace period for interest payment was three years, and this was also eventually extended up to 10 years, up to 20 million yen. In addition, the Kobe Earthquake Reconstruction Support Fund, co-established by Hyogo Prefecture and Kobe, subsidized the interest payments. Therefore, if a certain condition was satisfied, the loan became de facto interest-free. In addition to the disaster relief loan program conducted by government-affiliated financial institutions, grace periods were provided for the amount already financed and redemption period was also extended. According to the survey for the companies located in Kobe conducted in May, 1997, 47.5% of them used either a loan program offered by the city of Kobe or Hyogo Prefecture; 32.8% used a program offered by a government-affiliated financial institution; and 16.5% used a program offered by a private sector financial institution (multiple answers were allowed). It was assumed that more companies used loan programs, in particular the public ones, under the severe condition right after the earthquake, but actually some companies were not eligible even though they wanted to use one or more of the programs. The loan programs were available only for those who had a prospect for repayment, and some companies were rejected due to their already harsh financial condition under the sluggish economy.③ Temporary Housing The next most important issue was related to people. The city of Kobe provided support to secure places where employees could live so that companies could start up operations. Many temporary housing units were constructed in Kobe, as is described in detail in previously. The construction of temporary housing started gradually from January 20, 1995, three days after the earthquake, and earthquake victims started living there from February 15, 1995. By the beginning of August 1995, about 30,000 units in the urban center and 3,000 units in suburb areas had been constructed and provided support for the victims until December 1999, when all displaced victims had moved to permanent housing. As temporary housing had to be supplied quickly and in a large quantity, it was constructed not only in parks and company sites in the urban center but also in areas such as the sites for future development projects such as those on Rokko Island and Port Island and in the Seihokushin district. As there was a concern that the temporary housing had to be maintained for a relatively a long period of time, 80% of the total land (215 ha) for temporary housing was city-owned land.④ Temporary Factories The third important aspect that plays a key role in the recovery of local industries is place. In order for local industries to recover and advance towards the future, both industry and government need to work together to implement measures. To this end, the first and foremost priority was that the companies could start their business operations at the earliest possible date. Therefore, Kobe decided to secure places where businesses could restart their operations. There were few cases in which small and medium-sized companies that had their own land to do their business in the urban center of a city as large as Kobe. Most of them leased a space from a building owner or used a factory in an industrial complex. The scale of business was small, and this tendency was noteworthy. Consequently, Kobe decided to construct temporary factories in order to support the companies that used rental facilities. However, there were several issues related to the construction of temporary factories. Firstly, unlike temporary housing that was covered by the Disaster Relief Act, the construction of temporary factories was unprecedented. As there was no institution in place, financing the construction cost was a big issue. Secondly, it was assumed that a large area for construction would be necessary, and each company’s operational environment had to be taken into consideration when considering where to find the land. Thirdly, appropriate construction design had to be taken into

201
consideration as the structural needs for a hybrid-rubber shoe factory were different from those for a metal machining factory. Finally, as this initiative was to support operational startup in an urgent manner, the issues of how to choose targeted companies, the period for them to be able to use the space, and the rent were also of concern. Kobe resolved these issues one by one in cooperation with the national and prefectural governments. As for the construction cost, Kobe requested that the national government provide a subsidy, but this was not realized as there was no such a case in the past. Then, the Japan Small Business Corporation (currently the Organization for Small & Medium Enterprise and Regional Innovation, Japan) proposed a preferential measure for innovation projects. Kobe Urban Development Corporation, one of the Kobe’s auxiliary bodies, utilized this measure to get a loan of 8 billion yen from the national government and Hyogo Prefecture with a redemption period of 20 years, and 95% of the amount was interest free. Concerning the land for construction, it was decided to construct temporary factories as far as possible from citizens’ living spaces because they were temporary. As a result, it was decided that the factories would be constructed at industrially dedicated areas or urbanization-restricted areas in principle. A total of 170 factories was constructed in six locations: three in the coastal area of Nagata Ward (Kobe Inner 4th Industrial Complex, Karumojima and Minami Komae) and another three in West Ward (Kobe High-tech Park, Takatsukadai and Koaike Park). The floor space for each facility was decided to be from 48 to 240 square meters based on the opinions collected from each company by city staff. It was decided that the companies eligible for temporary factories were those small and medium-sized companies that could not operate their business for some reason and their property was certified as having been totally or partially destroyed/burned. The maximum length that companies could use the temporary factories was set at five years, as this was an emergency supportive measure. Efforts were also made to minimize the rent, although it could not be free because the factories were run for a profit. As many factories to rent were destroyed by the earthquake, the market rate for rent was skyrocketing at that time. The market price prior to the earthquake was surveyed, and the rent for temporary factories was set at 500 yen/m2, roughly one third of the pre-earthquake market price. On February 25, 1995, after about one month had passed since the earthquake, the primary applications were received from those companies wanting to enter the temporary factories. For the third factory complex in Nagata Ward, in particular, the chance to be accepted among the primary applications was as high as 12.7 times on average. Companies started moving into the temporary factories on April 4, 1995, and by summer in 1995, all temporary factories started their operation, and about 250 companies were there during the peak period.
Photo 1. Temporary Factories

202
The city staff members who were in charge of this project at that time felt that many companies wanted to have their business recovered at their local site just like the residents at temporary housing had a desire to live in their original community. In particular, hybrid-rubber shoe companies had a strong desire to reconstruct their businesses in their original area in Nagata. Kobe thought at that time that it would be difficult to rent privately-owned land to construct temporary factories and it was better to use city-owned land, taking into consideration the fact that the temporary factories would be pulled out in five years. However, in retrospect, more factories should have been constructed in the urban center to meet the companies’ desire to continue business in their local communities.⑤ Temporary Shops As for commercial activities, one third of the shopping arcades and about half of the markets in the urban area were severely damaged or totally destroyed. In addition to the direct impact on their equipment and stores, the scale of damage was enormous due to the destruction of inventory and stagnation of distribution. It was felt anew that the shopping arcades and markets in local communities played a role in not only providing daily necessities but also served as a place to create core vitality in the community. If the arcades and markets could resume operation as soon as possible and could again become active, that would be very encouraging to the people in the community. In order to secure daily necessities and to live up the demands of a depressed community, Kobe visited the arcades and markets and encouraged them to reopen their stores at their earliest possible convenience. Consequently, by February 2, 1995, about two weeks after the earthquake, 23.4% of the shopping arcades and 23.3% of the markets resumed operation, and 47.5% of the shopping arcades and 45.5% of the markets did so by March 1, 1995. Kobe supported the resumption of their operation by establishing a subsidy system for joint temporary shops from March 8, 1995. As shopping arcades and markets are a mainstay of a local community, shops needed to be reconstructed in essentially the same place they were before the earthquake. Most shopping arcades and markets in Japan own or lease private land or buildings for their commercial activities, and public money could not be offered for individuals’ asset formation. Kobe’s subsidy system could solve this problem as it subsidized the construction cost or rental fees in the cases where five or more shop owners jointly established a temporary shop to conduct their commercial activities. When temporary stores were constructed, half of the cost, up to 10 million yen, was subsidized. Any cost to acquire or develop land or that could lead to private asset formation such as interior decorating was out of the scope. In the city, 35 temporary buildings for 408 shops were constructed, and the total amount of subsidy was more than 100 million yen. It was challenging to get a consensus among shop owners, but it was a very valuable approach
Photo 2. Temporary Shops

203
that individual shops collectively exerted their strength to respond to consumers’ needs as it was getting harder for them to compete individually against large-scale supermarkets that attract more and more people. Of course, in some cases, consensus was not achieved, and the project was not realized.
1.2.2.3 Support Measures for the Recovery of Small and Medium-Sized Companies Since the earthquake struck Kobe, each day had passed very quickly. In retrospect, restorative activities took place with amazing speed but in a tentative manner. Tentative restoration cannot last forever. While support measures for relief were carried out, future support for sustainable recovery had to be considered.① Kobe City Recovery Support Factories As the temporary factories were available for only five years, Kobe considered it necessary to have permanent factories to rent to support small and medium-sized companies after their leaving temporary factories. Before the earthquake, Kobe did not think it necessary to construct public factories to rent as there were sufficient private ones available in the city. However, the earthquake served to emphasize the necessity to do so for the following reasons.(1) Temporary factories were public facilities, although they were temporary.(2) There was no prospect for town development, in particular in Nagata Ward where the rezoning
project was not to be completed for at least five years.(3) Owners of factories to rent had no willingness to reconstruct them after the earthquake, and
small and medium-sized companies could not find a place to do business. Even if the owners had reconstructed their factories, some small and medium-sized companies could not have met the new terms such as rent. Under these circumstances, the idea to construct public factories to rent was realized to support the recovery of Kobe’s small and medium-sized companies including hybrid-rubber shoe companies on a full scale as Kobe was able to acquire land of approximately 1.8 ha in the area dedicated for industrial development in Hyogo Ward in 1996.
This was the first large-scale factories-to-rent scheme by the public sector in Japan. Under the name Kobe City Recovery Support Factories, construction began in 1996 and operation started in 1998. The total construction cost was 10.3 billion yen, and the preferential loan measure for innovation projects was applied to this project just like the project for temporary factories. The factories consist of four buildings with 5 stories made out of steel-framed reinforced concrete. There are 242 units, and each unit has a 70- to 72-m2 space with a total floor area of 25,990 m2 (5,300 m2 for three buildings and 10,000 m2 for one building). As there had been multi-storied factory buildings in Kobe, people were used to them and there were no problems regarding structure. However, rent was an issue. As the factory to rent was run by the public sector, the rent had to be carefully set so that it did not compete against private businesses. The rent that Kobe set was 1,200 to 1,900 yen/m2, about 20% lower than the market rate. The name Kobe City Recovery Support Factories was changed to Kobe City Monozukuri (manufacturing) Recovery Factories in 2004, and as of September 2009, a total of 91 companies moved in, making the occupancy rate 75.2%. New facilities were added to this factory space such as Kobe Liaison Laboratory, a collaboration center for industry, academia, government, and business, and Kobe Monozukuri Cluster Support Center, which has multi-faceted functions of consultation, support, and exchange, serving as a comprehensive support center.② Clustering Project for Small and Medium-Sized Companies Although some individual small and medium-sized companies are vulnerable, they could exert their capabilities more effectively if they were clustered to do business cooperatively. A clustering project for small and medium-sized companies (Disaster Relief Preferential Subsidy Program) was

204
utilized by the two cooperatives to enter the urban center and industrial complex.③ Rent Subsidy Program for Private Factories to Rent When Kobe constructed recovery support factories, it is not an exaggeration to say that most small and medium-sized companies in Kobe were in a financial crisis because the earthquake hit them hard under the recession period after the collapse of the bubble economy. Many such companies were using rental factories run by the private sector but were faced with difficulties in staying there because of the hike in rental fee. Under these circumstances, Kobe established the Subsidization Project for Private Factories for Rent to support those companies that did not qualify for use of the public factories for recovery support and had no choice but to use private rental factories by subsidizing the difference in rent between private and public factories. The monthly subsidy was up to 300 yen/m2 for a maximum of 100 m2. The yearly amount of the subsidy was as small as 360,000 yen at most, but Kobe believes this program was epoch-making in terms of the government’s support for private business activities. This subsidy program provided support for a total of 689 companies.④ Loan Program to Support Factory Relocation from Temporary Location As the temporary factories were planned to be abolished in 2001, Kobe established a loan program for factory relocation from the temporary location in order to support the companies and lessen their financial burden of relocation. This loan program did not require any collateral, guarantor, or interest, and companies could receive a loan for up to 5 million yen with a redemption period of 7 years. A total of 41 companies used this program.
1.2.2.4 Efforts by the Business Community The business community tried to rise from the earthquake damage with an unyielding spirit with collaboration and coordination with Kobe. The most representative examples were the hybrid-rubber shoe industry and the sake brewing industry.
In May 1995, when companies had entered or were about to enter the temporary factories, the Japan Hybrid-Rubber Shoe Industrial Association established a Study Group for Hybrid-Rubber Shoe Industrial Recovery by appealing to related organizations and Kobe. This group was comprised of representatives of the industry, government, and academic experts, and they discussed possible ways to rebuild the hybrid-rubber shoe industry in a sustainable manner. In June 1995, the group announced the Recovery Plan for Nagata as a Town of Shoes. The premise of this plan was that recovery of the hybrid-rubber shoe industry and recovery and vitalization of Shin-Nagata as new town were intertwined. This plan proposed the recovery of both the hybrid-rubber shoe industry and the town, taking into consideration the challenges that were faced by the industry, and it stressed the necessity of a core
Photo 3. Kobe City Recovery Support Factories

205
facility and a school specializing in shoes. This proposal led to new development of the industry.
Individual sake brewing companies had their own production facilities before the earthquake, but two companies decided to start sake brewing together. Their brewing site also has facilities such as a restaurant and multi-purpose hall so that visitors can become familiar with Japanese sake.
1.2.2.5 New Developments in Industry The following are some examples of unique efforts for new development in industry after the earthquake.① Kitano Meister Garden Kitano Meister Garden was opened in 1998 by utilizing the building of a former Kitano Elementary School that had been closed due to the declining number of children in urban center before the earthquake. It is a place where workshops on typical local industries of Kobe such as Japanese and western-style confectioneries are located, and visitors are able to see the craftsmanship and to enjoy some hands-on experience. Today, about 20 companies run shops in what were previously classrooms, and approximately 800,000 people visit this place annually, making it a popular tourist attraction.
② Kobe Brand Plaza This effort was made under the Recovery Plan for Nagata as a Town of Shoes mentioned above. Hybrid-rubber shoe manufacturers in Nagata had manufactured OEM-basis products in most cases. This means they produced shoes under their customers’ brand names after receiving orders from such business partners as wholesalers and specialty shops. They had been faced with the challenge of exploring a new market as the number of existing customers such as wholesalers started declining even before the earthquake. They thought it very important to start producing their own original brands and develop them by directly receiving feedback from consumers. To this end, it was decided to open a satellite shop, a pilot store to gauge the consumers’ response, in Tokyo, and Kobe Brand Plaza was opened in 1999, hailing Nagata, Kobe, as a town of shoes. The plaza was opened in Aoyama and first three years later relocated to Daikanyama. In 2004, the plaza was closed as it had fulfilled its function. For the hybrid-rubber shoe industry that had no prior experience with direct contact with consumers, this was a totally new approach, focusing on the future. About 10 hybrid-rubber shoe manufacturers and one confectionary company joined this project.
Photo 4. Kitano Meister Garden Photo 5. Kitano Meister Garden

206
③ Shoes Plaza Like the Kobe Brand Plaza, this idea was also based on the plan mentioned above. The goal was to establish a core facility around Shin-Nagata Station where the hybrid-rubber shoe industry is concentrated. The industry and Machizukuri Council worked together for further research. In 2000, the Shoes Plaza was opened as the national government’s “Central City Invigoration Law” was applied to it. Satellite shops of hybrid-rubber shoe manufacturers had operations in this facility as well, serving as a core facility for regional vitalization and a recovery symbol for the industry. The plaza is run by Shoe Town Nagata Kobe, Ltd. that was formed with a total capital outlay of 1.5 billion yen: 70 million yen from each the national Government and Kobe and about 100 million yen from the private sector. In addition to satellite shops and shops where shoes can be ordered, a show room is now available to support shoe manufacturers to explore distribution channels. A program to support entrepreneurs is also available.
④ Kobe Monozukuri Shokunin Daigaku (College for Craftsmen) Although the clothing, shoe, and furniture industries started to grow following the reopening of Kobe Port, they had problems of the aging of craftsmen and shortage of successors along with the reduced market size. Under these circumstances, Kobe Monozukuri Shokunin Daigaku (College for Craftsmen) was opened in 2000, with the aim of encouraging young people to enter this industry and passing on the excellent skills and technologies accumulated in Kobe to the next generation.
Photo 6. Kobe Brand Plaza Photo 7. Kobe Brand Plaza
Photo 8. Shoes Plaza Photo 9. Shoes Plaza

207
One course at the college is for three years and active craftsmen teach their skills directly to the students. As of today, a total of 65 craftsmen have graduated from this college. Some of them have established their own original brands, increasing their orders, and a younger generation of craftsmen is steadily developing in Kobe.
1.2.2.6 Creation of New Business The road to recovery was not easy for the local industries in Kobe partly due to the prolonged recession. As time went by, the damage caused by the earthquake seemed to become gradually bigger and bigger. For example, the production value of the hybrid-rubber shoe industry was 52.5 billion yen in 1999, indicating about 80% recovery based on the 1994 value. However, since that time, recovery seems to have been stalled at 80%. Due to other factors such as building reconstruction rate and revenue level of department stores, the economy of Kobe was said to have recovered to only 80% of that before the earthquake, and recovery was very slow. In order to attain the remaining 20%, some new industries had to be created.① Project for Kobe Medical Industrial City The medical industry, which includes areas such as biotechnology, drug discovery, and medical equipment, is a growth industry in the 21st century, but it never had a presence in Kobe in the past. The purpose of this project is to construct research and development centers for advanced medical technology and to establish clusters of companies in the medical industry with the second phase of Port Island redevelopment as its core, creating a healthier and more vibrant Kobe. The goals are as follows.(1) To provide advanced medical services to actual healthcare settings in such areas of early
detection and treatment of disease and less invasive treatment, improving the citizens’ QOL and
Photo 10. Kobe Monozukuri Shokunin Daigaku
Photo 11,12. Kobe Monozukuri Shokunin Daigaku

208
wellbeing.(2) To support the efforts of small and medium-sized companies in this field in addition to the direct
effectiveness from clusters, contributing to the vitalization of Kobe’s economy.(3) To promote exchanges with China and other Asian countries through medical technology for
international contribution. As of October 20, 2009, 160 companies including a well-known German pharmaceutical company have taken up residence in this area. Regenerative medicine is a major theme for such core facilities as the Institute of Biomedical Research and Innovation and Riken Center for Developmental Biology. The goal is organ transplantation using the patient’s own organ regenerated from his/her tissue by utilizing the most advanced cellular and genetic engineering technologies.② Kobe RT (Robot Technology) Project The robot industry has been promoted since 2001. In Kobe, there had already been good accumulation of development and production technologies for industrial robots, mainly in large companies, as well as researchers in the field of robotics at universities and technical colleges. Under this project, sub-projects in such areas of medicine, nursing care, and disaster relief are now ongoing, and small and medium-sized companies in the city also participate in them. The goal is to advance and vitalize the industry through the development and application of robotic technology and to combine technologies in various areas such as control, communication, and sensing to be utilized in every aspect of people’s lives. Also, research on rescue robots has been promoted based on the experiences and lessons learned from the earthquake.③ Design City Kobe as an Urban Strategy the Kobe of the Future Today, Kobe envisions a new city image under the new concept of Design City Kobe to move forward. The bond of people and mutual assistance were nurtured during the process of post-earthquake recovery in Kobe, and they became part of the culture. This was nicely combined with Kobe’s original features developed together with the Kobe Port. This new urban strategy is to create further attractiveness and vitalization of the city as well as personal wellbeing from the city design’s perspective. It aims at creating a city where people want to keep living and to visit, a city that enjoys sustainable development, and a city that is selected, becoming a winner in interurban competition. The city design’s perspective in this context implies not only the shape and color of the architectural design but also the planning and mechanism as well as the basic philosophy of the urban development. The basic policy focuses on the three design perspectives: town design, life design, and monozukuri (manufacturing) design, encouraging further efforts and disseminating this concept and approach in various areas. On October 16, 2008, Kobe was certified as an UNESCO City of Design, as was Nagoya for the first time among Asian cities, and became a member of UNESCO’s Creative Cities Network. Kobe will make even further effort to promote and disseminate the concept of Design City Kobe through networking, cooperation, and exchanges with other overseas certified cities such as Buenos Aires, Berlin, and Montreal. In September 2009, Kansei Kachi Sozo Museum (sensitivity value creation) was opened to help such facilities as municipal museums, in cooperation with Ministry of Economy, Trade, and Industry, to convey the concept of Design City Kobe and monozukuri design unique for Kobe.
1.2.2.7 Important Points There are three important three points: road map with specific measures, relationships with the national government and prefectural government, and people.
Firstly, it has already been emphasized many times how important it is to move forward with a
209
projected roadmap. The specific path has to be planned stage by stage from relief to recovery to new development. In order to implement measures for each stage properly, challenges for local industries that already existed before the earthquake must be taken into account to identify most appropriate solutions and implement them.
Relationships with the national and prefectural governments are also important. The huge earthquake deprived Kobe of many things instantaneously. Nobody anticipated it at all, but it occurred. For Kobe, a regional city with limited financial resources, it was indeed indispensable to get full-scale cooperation and financial support from the national and prefectural governments in order to implement support measures for recovery.
When there was no system to support the projects of temporary factories and recovery support factories, Kobe asked the national and prefectural governments to create a new system or to deal with extraordinary cases by stretching the existing system. Both national and prefectural governments were flexible when responding to the Kobe’s requests. The Reconstruction Support Fund system played a supplementary role to support recovery projects quantitatively, qualitatively, and institutionally, such as interest payment coverage, and this system was applied very effectively at the time of the Niigataken Chuetsu-oki Earthquake in 2007. The Kobe Earthquake caused increased momentum to revisit and organize the way to deal with disasters at the national government level as well as to review the institutional and legal frameworks, thanks to the lessons learned from the earthquake that took away many things from Kobe.
However, there were still some frameworks that could not be changed. For example, the concept of special zones was not accepted by the national government at first. The measures to promote new industries and industrial clustering were very critical for Kobe as its economy had recovered to only 80% of the pre-earthquake level. Kobe, together with Hyogo Prefecture and local economic circles, proposed the project of the Kobe Enterprise Zone at the district of the second phase redevelopment of Port Island, in order to create a basis of exchange open to the rest of the world by promoting tax incentives, deregulation, and other measures, and made a request to the national government to help realize this project.
Unfortunately, the national government did not accept this idea on the grounds that if the government should endorse it, there would be two separate systems operating in one country. Kobe, therefore, implemented its own unique and bold measures including reduction in taxes and rent subsidization by putting “Ordinance for Kobe Entrepreneurial Zone” into effect in 1997. This was the original starting point to promote the abovementioned project of the Kobe Medial Industrial City and today’s measures to attract enterprises to Kobe. A series of activities to make requests to the national government gave momentum to change the national government’s local policies, making the national government oriented towards multiple systems in one country such as designated structural reform district, urban rejuvenation, and community regeneration. It was around March 2004, when the concept of special zones came out at the national government level. In April 2005, two zones in Kobe were certified by the national government as Special Zone for Advanced Medical Industry and International Minato (Port) Economic Special Zone, the first of their kind nationwide.
Although it is indispensable for a city to have a good cooperation and collaboration with the prefectural and the national governments, the city needs to be prepared to go ahead on its own in order to work on recovery from massive disaster.
The final important point is related to people. Industries in Kobe were suffered enormously due

210
to the earthquake. The national government, Hyogo Prefecture, and Kobe supported the recovery of local industries by dividing roles among themselves. The government support was essential, but a more important thing was that companies and industries on the whole exerted their efforts for recovery and were engaged in realizing sustainable recovery at an amazing speed and with strong commitment and ability to take actions. The governmental measures only supported such efforts of the private sector from behind.
The industries, in particular the ones deeply rooted in the community, could not recover without the recovery of the community on the whole. It is people who play the key role to make it happen, and it is not an exaggeration to say that people are everything.
When the community and industry is full of vitality, there are always people who actively support them. It is also the government’s role to support such people. What the government has to do is to meet people in the field, discuss issues thoroughly, and understand what their needs are. Then, the government also has to take their problems to heart and consider what can be done without being restricted by precedents.
1.2.3 Evaluation When considering what could be done if the same thing should happen again, most people have no idea to be quite honest. Probably, almost the same responses and measures would be taken in the areas related to money, people, and place as they are critical right after a disaster. The measures must be taken by stages, and they should ultimately usher in further steps towards new development. As the issues important to local industries vary depending on a certain period of time, the measures and the steps to reach goals must be considered in a flexible manner.
In retrospect, people tend to think that many things should have been done differently, and wonder how the outcome would have been affected. However, people have come to believe what Kobe did at that time was right because actions such as investigation, planning, and implementation had to be taken with amazing speed for several months after the earthquake.
The economic environment that surrounds local industries is constantly changing. Although Kobe took some measures for a certain period of time after the earthquake, it is obvious that appropriate follow-up must be conducted in response to the changes of the times.
1.2.4 Conclusion What must be considered first and foremost is how to implement measures step by step.
The process where local industries rise from the damage caused by an earthquake starts with the relief efforts, followed by full-scale recovery to attain pre-earthquake conditions, and the subsequent action is to try to solve the issues that existed even before the earthquake. Measures must be taken in stages: relief, recovery, and new development.
At the relief stage, emergency loan programs were developed to secure funds for companies to resume their operations, and temporary housing was constructed to secure living space for employees. Furthermore, temporary factories were constructed to secure a space for companies to resume production, and the subsidy program for temporary shops was implemented. At the stage of recovery, Kobe City Recovery Support Factories, permanent public factories to rent, were constructed, and the clustering project for small and medium-sized companies was promoted. Finally, at the new developmental stage, Kitano Meister Garden, Kobe Brand Plaza, and Shoes Plaza were opened. It is

211
very important to envision these stages even from the beginning even though outcomes cannot always be predicted.
Of course, cooperation with the national government and the prefectural government is indispensable in order to implement measures. For example, the loan programs were carried out with the coordination of the national, prefectural, and city governments, and the national government newly established a system to support the temporary factory project upon the request of the city government. In the meantime, as there were some cases where the national and prefectural governments could not offer support, Kobe established new systems on its own due to urgent necessity.
Last, but certainly not the least important point, is people. There have been active persons who supported the industries in Kobe. It is their efforts that helped local industries overcome the effects of the damage caused by the earthquake. The government measures only supported their efforts from behind. Good human relationships are the key to success when trying to implement policy and receiving cooperation from the national and prefectural governments. Once good relationships are established, the local industry’s conditions and issues and its needs and possible solutions can be considered properly. Of course, this is not confined to the time of a disaster. Even at ordinary times, it is important to engage in daily tasks by having good human relationships as well as raising awareness of potential problems.
2 Port Reconstruction
2.1 Damage to the Port of Kobe and Post-Disaster Response The entire waterside of the Port of Kobe was damaged by the earthquake, and parts of it were totally destroyed. In particular, the container terminals handling about 70% of all foreign cargo were heavily damaged and became unserviceable.
In the meantime, while ground transportation that was disrupted and was in a state of paralysis, ports and harbors played a significant role in transporting emergency materials and rescue parties and securing commuter lines. They were also used as sites for the storage of emergency materials, an emergency heliport, and wreckage disposal.
2.1.1 The Position of the Port of Kobe Since its opening in 1868, the Port of Kobe has been supporting economic development as one of the leading international ports in Japan and has served as a basis for human life and as an economic infrastructure for the citizens of Kobe. A container ship came into the Port of Kobe for the first time in 1972. Since then, the port services have improved to readily accommodate container transportation, and it has successfully developed into a world-class port. In 1977, the Port of Kobe handled the second largest quantity of containers in the world. Although the ranking fell to 6th place in 1994 due to the development of other ports in the East Asian region, the Port of Kobe was still the number 1 port in Japan in terms of the number of ships entering into the port and the number of containers handled, accounting for about 30% of the total in Japan.
According to a survey conducted by Kobe in 1988, about 17% of employees in Kobe and about 39% of the citizens’ income depended on the Port of Kobe. The Kobe Port also plays a role of protecting the port itself and the urban area located behind the port from damage caused by tsunamis.
2.1.2 The Earthquake’s Influence on Social and Economic Activities The Kobe Earthquake caused severe damage to the harbors and shoreline facilities of the Port of Kobe. A total of about 116 km of Kobe Port’s waterside with an east to west linear distance of 20 km

212
was severely damaged, and parts were totally destroyed.
Especially, the container terminals were seriously damaged and all of them came to be totally out of service. Hyogo Prefecture estimated the direct damage to the port facilities in the entire affected area, and it was 760 billion yen for public facilities and 240 billion yen for private facilities. Most of this damage was to the Port of Kobe.
As the Port of Kobe was functionally paralyzed, its distribution function came to an abrupt halt. This caused an increase in distribution costs and had a huge impact on industrial activities and people who were engaged in port-related industries dependent on the Port of Kobe. More than 90% of container cargo was shifted to other major ports such as Tokyo (20.7%), Yokohama (46.7%), Osaka (19.3%), and Busan, South Korea (2.9%) right after the earthquake from January 17 to 30, 1995. The former Ministry of Transport estimated that the amount of loss on domestic industries caused by the increase in domestic transportation cost due to this shift was 240 billion yen in 1995 alone.
The number of passenger ships visiting the Port of Kobe declined from 130 ships (46 oceangoing ships and 84 coastal ships) in 1994 to 14 ships (10 oceangoing ships and 4 coastal ships) in 1995.
The impact on socioeconomic activities caused by the damage to the Port of Kobe was enormous, and restoration of the Port of Kobe was obviously essential to the economic recovery of Kobe.
2.1.3 Post-Earthquake Conditions and Response2.1.3.1 Emergency Response The post-earthquake conditions of port facilities such as berths, warehouses, roads and bridges, and coastal protection facilities such as breakwaters and iron tide gates in afflicted areas were investigated onsite. The damage conditions of port-related industries were also checked via trade organizations including the Warehouse Association of Hyogo Prefecture. Urgent inquiries were also made by persons acting under the order of the Mayor of Kobe on January 19, 1995. Based on the responses, actions were taken as quickly as possible.
On January 25, 1995, the Kobe Port Liaison Conference comprised of nine public- and private-organizations, including government agencies, trade organizations, and labor unions, was formed in order to facilitate coordination of activities for restoration. The ship mooring positions were decided in consideration of port entrance purpose and utilization style as well as the damage to berths in order to secure maritime access routes that could help alleviate the problems caused by severed and disrupted ground traffic networks. As the entire water facilities became unserviceable, drinking water was transported by ships of the Maritime Self-Defense Force and Japan Coast Guard and brought from Osaka by Kobe’s water supply vessels, and this water was supplied to local citizens and hotel ships.
On the ground side, monitoring related to traffic regulations was conducted in extensively damaged areas such as the Kobe Ohashi Bridge. Also, emergency measures were taken such as the restoration of berths and protected shores, utilizing sand and soil, and the construction of slopes at the entrances of warehouses with differences in level caused by the earthquake.
When it comes to consultation and communication, the extent of the damage was reported to the Coast Administration and Disaster Prevention Division of the former Ministry of Transport. Information concerning the damage was also collected from the Kobe Port Terminal Corporation and Kobe New Transit Co., Ltd., and consultation on emergency restoration with the Third District Port Construction Bureau of the former Ministry of Transport occurred on January 19, 1995.
213
2.1.3.2 Dissemination of Information Contact points were integrated into one to provide coordinated information because an avalanche of inquiries including those on the number of operable berths came to the various sections in the Port and Harbor Bureau of Kobe. As there was a common misunderstanding that the Port of Kobe would be out of service for a long time, it was decided to present “The Port of Kobe Recovery News,” three times a month in the first month and about twice a month as needed in successive months, in order to provide information such as recovery schedule to all parties concerned including the users of the Port of Kobe.
2.1.3.3 Acceptance of Rescue Supplies and Activities Given the disruption of land traffic, marine traffic made a great contribution to the recovery activities in urban areas by accepting rescue supplies and rescue teams. The port space was utilized for various purposes such as mooring sites for water supply vessels and hotel ships and a heliport. In addition, four locations at the port were utilized for the shipment and disposal of debris and construction waste soil generated in urban areas. In this way, ports and harbors played a significant role in the recovery of the entire city.
Other cities made offers of support from the very early stage. Some of them could not be accepted due to confusion in the beginning, but then Kobe received technical staff from the cities of Yokohama and Fukuoka, and Kobe Port Terminal Corporation also received support from the Terminal Corporations of Tokyo, Yokohama, and Osaka Ports.
2.1.3.4 Opening of Temporary Shipping Routes As the land traffic network was severed and disrupted, the modes of transport for commuting and daily life were tried to the opening of temporary shipping routes and working on the early resumption of existing routes. The berths for temporary shipping routes were carefully selected, centering on Takahama Berth and Naka Pier in consideration of the safety of incoming and outgoing passengers and convenience of transit to other modes of transport.
2.1.3.5 Conditions of Port Workers The earthquake also caused employment problems for people working at the Port of Kobe. Due to the “Port Transportation Business Act” and the “Port Labor Act,” both employers and employees in port-related business were not allowed to work at other ports. It was, therefore, necessary to take exceptional measures concerning legal regulations and labor-management agreements as an emergency response. On January 26, 1995, the Kobe Earthquake Restoration Headquarters of Central Labor-Management was formed by the Japan Harbor Transportation Association, and the Kobe Port Restoration Headquarters of Labor-Management was set up in the Port of Kobe in order to take employment measures for port workers so that they were able to work at other ports or in different industries.
2.1.3.6 Cargo Handling Operations for 24 Hours a Day/7 Days a Week The number of operable berths was reduced due to the impact of the Kobe Earthquake on the Port of Kobe. In order to increase opportunities of port entry and to secure employment, working two shifts for 24 hours a day, 7 days a week was allowed starting on April 11, 1995, under an agreement with and confirmation by the Hyogo Harbor Transportation Association, Conference of Kobe Port and Harbor Labor Union, and Hyogo Head Office of the Japanese Confederation of Port and Transport Workers’ Unions. Also, the National Harbor Labor Union Council and Japanese Confederation of Port and Transport Workers’ Unions agreed to take special measures for cargo handling operations on Sundays for break-bulk vessels for the time being during the full-scale reconstruction of the Port of Kobe, and they notified the Japan Harbor Transportation Association about it on October 18, 1995.

214
2.1.3.7 Emergency Response Taken by Government Agencies and Trade Organizations There was no time to lose for Kobe Port’s recovery from its dysfunctional state. Various urgent measures were taken immediately after the earthquake by government agencies related to Kobe Port such as Kobe Customs, the Kobe District Maritime Administration Department, the former Third District Port Construction Bureau, Kobe Maritime Safety Agency, Kobe Harbor Police Station, Kobe City Harbor Fire Station, and Self-Defense Forces and by trade organizations such as the Japanese Ship Owners’ Association, Kobe Passenger Boats Association, Warehouse Association of Hyogo Prefecture Secretary, Hyogo Association of Refrigerated Warehouse, Hyogo Harbor Transportation Association, Hanshin Pilots Union, Kobe Tugboat Association, Kinki Branch of the Japan Domestic Maritime Transport Ship Owners Corporation, Conference of Kobe Port and Harbor Labor Union, and All Japan Seamen’s Union Kansai Region Hanshin Office.
2.1.3.8 Support Measures for the Private Sector In order to stop degradation of the distribution function throughout the Port of Kobe and to support restoration of port-related businesses severely damaged by the earthquake, port facility usage fees and rental fees were reduced or exempted. After that, the former Japan Development Bank provided low-interest loans for the recovery of protected shores owned by the private sector and the Kobe Earthquake Reconstruction Support Fund provided a grant for paying a fixed rate of interest for port transportation businesses and private coastline protection facilities.
2.2 The Port of Kobe Reconstruction Plan and Projects The year during which the earthquake hit happened to be the same year when the plan for the Port of Kobe was to be revised and actually was already under preparation. Part of the Port of Kobe Reconstruction Plan, therefore, started to be implemented earlier than indicated in the original plan, being incorporated into the Kobe City Recovery Plan.
Towards the reconstruction of the Port of Kobe, the following four measures were included in the Kobe City Recovery Plan.
・To realize the recovery of functions throughout the Port of Kobe in approximately 2 years・To develop high-standard container terminals with a depth of 15 meters or more to be ready for
international competition among ports・To redevelop the Port of Kobe as a distribution space and water zone where people can relax and
enjoy life・To improve port services to meet the users’ needs in order to strengthen international
competitiveness
2.2.1 Policy for the Port of Kobe Reconstruction Plan The goal of the plan was to recreate the Port of Kobe as user-friendly port with more forward-looking and advanced port facilities and services than before rather than just recovering to the pre-earthquake state. On January 30, 1995, a meeting of the Kobe Port Council was held, and the Central Port Council approved a new plan for the Port of Kobe with a target year of 2005 on February 17, 1995. This plan turned out to be very effective for the reconstruction and further develop the existing piers, to implement post-disaster recovery based on the plan for the southern part of Rokko Island, and to utilize new reclaimed land for the disposal of debris.
The Port of Kobe Reconstruction Committee was formed on February 12, 1995 in order to utilize lessons learned from the earthquake and to strengthen international competitiveness. The committee began detailing a reconstruction plan based on the new plan and compiled The Report by the Port of

215
Kobe Reconstruction Committee on April 28, 1995. The reconstruction plan made clear the ideal State of the Port of Kobe in the 21st Century in order to define specific directions of reconstruction, and it also explained the details of creating a port with disaster preparedness. The facility reconstruction schedule was considered, by dividing it into two timelines: one was the short-term reconstruction plan, targeting the facilities’ functional recovery in about two years, and the other was the medium- and long-term reconstruction plan, for the next 10 years or so. The details were also reflected in the Recovery Plan of Kobe.
Also, the National Committee on Hanshin-Awaji Reconstruction was established on February 16, 1995 in order to discuss what measures should be taken by the national government for the recovery of Hanshin-Awaji Area. The committee gave advice and made proposals, and some of the proposals related to the Port of Kobe concerned the construction of temporary piers and the promotion of the Shanghai-Yangtze Trade Promotion Project.
2.2.2 Efforts toward Early Recovery The attempt for the early recovery of port functions required financial resources as well as various planning and operational efforts. As for the financial resources, the national government provided financial aid beyond the conditions set forth by law. The redevelopment of existing piers that had been planned even before the earthquake was incorporated into the post-disaster recovery process, and recovery projects were implemented for the damaged shore protection facilities including private ones.
While post-disaster recovery work was being carried out by the Third District Port Construction Bureau of the former Ministry of Transport, Kobe, and the Kobe Port Terminal Corporation, it was learned that 570 billion yen would be required for the recovery of public facilities. Financial aid was requested from the national government, and as a result, the national government subsidy rate for extreme-severity disasters was applied, national financial aid was made available to the facilities that were not eligible, and special financial support was offered to berths managed and operated by the Kobe Port Terminal Corporation.
Existing finger-type piers such as Maya Piers, Shinko Piers, and Hyogo Piers were also seriously damaged. As they had already become old and functionally obsolete, their redevelopment plan had already been included in the port plan. For this reason, it was decided to promote their redevelopment by conducting recovery work in line with the redevelopment plan rather than just restoring them to their original state.
Among coastal protection facilities, most recovery work was completed for the ones under the jurisdiction of coastal managers by the end of December 1995 and for private ones by the end of October 1996.
2.2.3 Recovery Work2.2.3.1 Allocation of Recovery Work Operation and maintenance of the facilities of the Port of Kobe are provided mainly by Kobe, the Kobe Port Terminal Corporation, and the private sector. Although the national government-owned facilities are also managed by the city, the national government decided to engage in the post-disaster recovery work in coordination with the city. From midnight till early morning on January 19, 1995, the national government, Kobe and the Kobe Port Terminal Corporation held discussions, and various tasks were allocated among them.
216
2.2.3.2 Procedures of Recovery Work Right after the disaster, measures to prevent secondary disasters were taken as well as urgent recovery work such as securing available berths required for the transportation of personnel and emergency supplies. Some berths that were relatively less damaged received emergency repairs and provided temporary services until full-scale reconstruction started in order to recover the function of the Port of Kobe as a distribution base as soon as possible. A so called “by-turns reconstruction method” was used so that the facilities did not become totally dysfunctional during the recovery work by maintaining temporary use of some districts and functions.
One of the urgent issues was the disposal of the huge mount of debris generated by the collapse of buildings. The debris was disposed of at the existing facility located on Osaka Bay (reclaimed land managed by the Osaka Bay Regional Offshore Environmental Improvement Center) at first and later at the planned site for reclamation at the Port of Kobe. Furthermore, it was decided to construct a temporary bridge to connect the 3rd and 4th Shinko Piers in order to secure traffic between Port Island and the urban area as well as to facilitate recovery work on the Kobe Ohashi Bridge and its on- and off-ramps.
2.2.3.3 Reconstruction Method The extent of damage, peripheral circumstances, and usage were taken into account by each facility, and a reconstruction profile and method were determined with detailed engineering based on the results of post-disaster investigation of the soil.
As breakwater is structurally less susceptible to uneven earth pressure, the impact of relocation of face lines and tilt of breakwater were minimal. Rather, the major damage was to land subsistence, so the raising of superstructures was applied as reconstruction method.
In case of berths, inclined wharves, and protected shores, if the degree of damage was small with limited relocation of face lines, correcting the face lines and securing the height of crowns were accomplished by adjusting the superstructure. On the other hand, in where the relocation of face lines was prohibitive, the plan was divided into two categories: where it was possible to put the face lines forward and where it was not. If it was possible to put the face lines forward, structures such as piers, caissons, and blocks were constructed in front of the affected buildings. If it was impossible, caissons were resettled after rubble-mounds were reshaped and anti-friction measures were taken.
The characteristic of seismic damage was that the infrastructures of bridges and elevated highways, in particular the foundation of cast-in-place concrete piles, were damaged with cracks in the pile tops just below the footings, and the junction between geological strata and the pile depth of reinforcement were cut-off. Reconstruction work was done by increasing the number of piles and footings in consideration of construction and economic efficiency.
A total of 89 warehouses were affected by the earthquake, and their early restoration was sought under the policy as they were critical focal points for the recovery of the distribution system. Considering the plan, the degree of the damage, condition of the users, and construction years, it was decided that 74 of them were to be repaired and the remaining 15 were to be newly built after dismantlement.
The earthquake caused considerable damage to the essentially all cargo-handling equipment. In order to complete economical restoration in a short period of time, the equipment, except that completely destroyed, was basically to be repaired onsite or at the factory. As this work was carried out simultaneously with the reconstruction of berths, the equipment was removed by crane ships to a

217
temporary location for repair onsite or at the factory.
2.2.3.4 Reinforcement against Earthquakes The earthquake-reinforced berths were characterized as large-scale anti-seismic facilities in the port plan, and the construction of three such berths at Maya Piers had already been completed before the earthquake. As the degree of their damage caused by the earthquake this time was minimal, the necessity of reinforced berths was even more appreciated. Therefore, it was decided that earthquake-reinforced berths should be allocated extensively by different cargo-handling patterns, cities/wards, and directions in order to strengthen the functions of Kobe Port.
2.2.3.5 Implementation of Recovery Work In order to begin recovery work in a full-scale manner, disaster assessment needs to be made based on the provisions of the “Post-Disaster Public Works Subsidies Act.” The details of recovery work and the amount of subsidy were decided based on the result of this assessment whether the recovery work was conducted directly under national government control or under Kobe’s control with the national government’s subsidy.
Upon secondary revision of fiscal 1995 budgetary measures under the national government, the national government, Kobe, and the Kobe Port Terminal Corporation decided to proceed with placing orders for reconstruction work while assessment procedures were still ongoing. Approximately 60 reconstruction orders were placed by the end of March 1995.
Thanks to day-in and day-out efforts, the completion ceremony for post-disaster reconstruction of the Port of Kobe was successfully held on April 23, 1997.
2.2.3.6 Information Center for Navigation Safety under Port of Kobe Reconstruction Projects While recovery work for the damaged berths was conducted throughout the Port of Kobe, both efficient reconstruction and navigation safety for ships had to be given top priority. For this reason, the Service Center of Port Engineering (SCOPE) was entrusted to establish the Information Center for Navigation Safety under Port of Kobe Reconstruction Projects by the Third District Port Construction Bureau of the former Ministry of Transport, Kobe, and the Kobe Port Terminal Corporation. From this center, information such as the conditions of incoming and outgoing ships and reconstruction work was provided to marine operation managers and those involved in reconstruction work.
2.2.4 Toward the Recovery of Port Influence2.2.4.1 Port Sales Efforts Port sales activities were aggressively carried out by explaining the Kobe Port’s recovery status to users both at home and abroad in order to promote a comeback and attract ships to the Port of Kobe.
As for domestic sales promotional activities, a delegation was dispatched to the prefectures in the Hokuriku region and westward regions located behind the Port of Kobe to explain the recovery status directly to local companies in the regions, generating increased interest. Three separate delegations were sent out during fiscal 1995 and 1996.
The information about recovery provided overseas was not as extensive as the information immediately after the disaster. In order to allay concerns about the use of the Port of Kobe and to explain the state of recovery, two groups were dispatched to regions in Asia in fiscal 2005, and in fiscal 2006, a youth mission was sent to South East Asia, while a mission of senior members was sent to Latin America. A seminar was held in Tokyo for shipping companies and head offices of agents in each fiscal
218
1995 and 1996. For private companies and organizations of cargo owners, the progress of recovery was explained by holding tours of the Port of Kobe, explanatory meetings, and company visits.
2.2.4.2 Public Relations concerning Recovery Conditions In order to publicize the Port of Kobe recovery progress, The Port of Kobe Recovery News was issued and distributed among related industries. Recovery was strongly emphasized by means of articles and advertisements in industry papers and specialized magazines as well. Furthermore, presentations were made on the occasions of international conferences on ports to promote publicity.
The Port of Kobe Recovery News was first issued in March 1995. It covered the recovery progress and schedule for the Port of Kobe, improvement of port services, and events for recovery, and it was distributed mainly to the related industries. Its news source was port managers and the Kobe Port Terminals Corporation, and the newsletter enjoyed a good reputation as a formal information source on port recovery. The news content in the newsletter was also covered in detail in a monthly magazine, “Kobe Port,” issued by the Kobe Port Promotion Association.
Public relations activities concerning recovery of the Port of Kobe were also promoted by attending conferences, such as the 19th General Meeting of the International Association of Ports and Harbors (IAPH) in Seattle in June 1995, the 8th Pacific Rim Friendly Seminar in Busan in April 1996, the 8th Pan-Pacific Port and Harbor Meeting in Vancouver in June 1996, and Tri-Port Seminar in Seattle in November 1996, and making presentations concerning suitable themes on these occasions.
2.2.4.3 Coordination with Related Organizations, Industry Groups, and Labor Unions On January 25, 1995, both government and private sectors cooperatively established the Kobe Port Liaison Conference. Its purpose was to grasp the current status of related industries, to exchange information about recovery conditions, and to engage in liaison and coordination for reconstruction.
In May 1996, this group was developmentally reorganized into the Kobe Port Reconstruction Promotion Council. Under this council, specific issues were discussed in order to solve various problems to strengthen international competitiveness and to promote recovery of the Port of Kobe.
The Board members of the Kobe Port Liaison Conference met 21 times in total before the end of March 1996. At the meetings, various issues were discussed such as traffic restrictions for National Routes 2 and 43, early restoration of traffic access, employment of port workers, recovery support for port-related companies, and review of the compulsory pilot system.
The Kobe Port Reconstruction Promotion Council formed an extensive network related to the Port of Kobe and was joined by 25 organizations, including related government agencies, trade organizations, and labor unions. Its function was divided into two working groups to discuss specific issues, namely, the Facilities’ Utilization section and Port Service section. The Facilities’ Utilization section considered the possibility that domestic vessels could be moored directly at foreign-trade berths and how to promote collaboration in the port distribution industry, such as common use of cargo-handling machines and joint management of container terminals. Meanwhile, the Port Service section worked on the simplification of clearance inwards and outwards, and 22 kinds of documents related to the Port and Harbor Bureau of Kobe started to be received by facsimile from November 1, 1996. Starting the following month, Customs Houses, Immigration Services and the Maritime Safety Agency also started to receive documents by facsimile on a trial basis.

219
2.2.4.4 Efforts to Improve Port Services In order to restore and strengthen international competitiveness of the Port of Kobe, port services needed to be improved along with the recovery of port facilities, for example, simplification of port procedures, deregulation of the compulsory pilot system, and EDI (electronic data interchange) promotion.
Concerning the simplification of port procedures, documents started to be received by facsimile as was mentioned in the above. The rate of utilization for this service exceeded 60%, helping shipping companies and head offices of agents to reduce their burden of paperwork. The criteria of the vessels subject to compulsory pilotage is different among ports in Osaka Bay, and this issue came to the forefront as a possible factor prohibiting ships to coming back to the Port of Kobe. Upon a request made by the users of the Port of Kobe, a committee was formed in fiscal 1996 by the former Ministry of Transport, and discussion started on the nationwide perspective of the navigational safety of ships. As for the IT issue on port-related information, the port distribution industry, in particular, requested speedy procedures by using electronic data system as it is essential to strengthen international competitiveness. In this context, joint surveys were conducted by six major ports together with the Ministry of Transport in fiscal 1996 and 1997, and standard formats were formulated. A study group represented by relevant government agencies and trade organizations reviewed this issue and promoted system development, while port managers also considered the introduction of the system. Finally, the Port of Kobe started using the EDI system for approximately 80% of total applications needed for port procedures from October 1999. The Kobe Port’s introduction of the EDI system was ahead of the other ports in Japan, and the utilization ratio has reached 85%.
2.2.4.5 Citizen-Energizing Public Relations Activities for Port Recovery A wide variety of events were held at Meriken Park as a major venue in order to encourage affected citizens and to appeal for support for the recovery of the Port of Kobe. Many events hosted by various groups, including port-related organizations, were also held and they were well received. With the recovery of facilities for passenger ships, such ships have been steadily coming back.
Among the events that took place at the port area, one of the most notable events was the project funded by the Kobe Earthquake Reconstruction Support Fund where the proceeds of a special motorboat race were contributed. In fiscal 1995, The Port of Kobe Reconstruction Festival was held, and this project had a total of 19 events with the participation of approximately 290,000 people. One of the 19 events was the International Symposium on the Revitalization of the Port of Kobe in September 1995, where the progress and schedule of recovery were explained to port-related parties both at home and abroad and experts. During the symposium, valuable proposals were presented by the participants with themes aimed at revitalizing the Port of Kobe with a strong sense of international competitiveness. For a PR activity for recovery of the Port of Kobe, PR containers painted with the phrase “REBUILDING THE FUTURE” were sent to 30 major ports around the world. The Kobe Port Reconstruction Memorial Park was constructed under this project where part of the earthquake-stricken Meriken Wharf was preserved as it was. The park also emphasizes the post-disaster situation and the recovery plan that will be handed down to future generations. Volunteer activities were also led by port-related organizations, economic groups, and celebrities.
The annual Kobe Festival and seaside fireworks were cancelled in fiscal 1995 in consideration of limited available sites and the emotional state of affected citizens. However, in fiscal 1996, they were resumed during the days around July 20 that became a national holiday called “Marine Day” that same year.

220
The port terminals of the 4th Shinko Pier, dedicated terminals for oceangoing passenger ships, were seriously damaged by the earthquake and with the relocation of berths and the tilt of buildings. Despite the damage, regular international ferries and other oceangoing passenger ships were accepted while the recovery work was ongoing. By the end of June 1996, the recovery work on terminal buildings was completed, and the reconstruction of berths was also completed by the end of the same fiscal year, helping attract more passenger ships.
2.2.5 Redevelopment and Utilization of the Port Kobe formulated the Minato-Kobe Vitalizing Plan in 2005 in order to make the Port of Kobe a vitalizing space full of dynamism and popularity. Under this plan, efforts have been made for revitalizing the Port of Kobe with a distribution zone in the east and a water zone in the west where people could relax and enjoy life.
2.2.5.1 Super-Hub Port Project With the rapid growth and development of major ports in Asia, the relative positioning of Japans ports has been declining greatly. As national policy, this project was aimed at strengthening international competitiveness of the Japanese ports by reducing 30% of the port-related cost and by shortening lead time to about one day. Like Keihan Port and Ise Bay, the Port of Kobe, together with the Port of Osaka, was designated as a Super-Hub Port under the name of Hanshin Port in July 2004. The Port of Kobe planned to start service for high-standard container terminals with large depth by the end of fiscal 2009 under the second phase redevelopment project on Port Island.
Furthermore, a more efficient and low-carbon oriented distribution system was to be promoted by improving services for domestic operations, extending open hours for gates, and simplifying and integrating port procedures.
2.2.5.2 Redevelopment of the Waterfront in the City Center In order to create a port area where citizens can enjoy life, various facilities have been developed at the waterside relatively close to the city center. One example is HAT Kobe, a large-scale extensive redevelopment facility, that is also expected to serve as a disaster preparedness center, and another example is Kamomeria (Naka Pier Central Terminal). In January 2006, a CIQ (customs, immigration, and quarantine) facility was established at Naka Pier Passenger Terminal, and people can enjoy watching oceangoing passenger ships up close. In the west district of Port Island, where there used to be the largest container terminal in Japan till the beginning of 1990’s, land was redeveloped, and now Port Island Shiosai (Waterfront) Park and three universities are located there.
2.2.5.3 Formation of a Center of Sea, Ground, and Air Transportation Network Kobe Airport, opened in February 2006, was added to the excellent network of transportation offered in the port city of Kobe. Kobe Airport is connected with Kansai International Airport by marine transportation called the Bay Shuttle, and the opening of the Hanshin Expressway Harbor Route is anxiously awaited. Thus, a comprehensive sea, ground, and air traffic network for people and goods is expected to serve as an infrastructure for new vigorous development.
The Port of Kobe has served as hub port, connecting various locations of western Japan with domestic operators and ferries. The port intends to further strengthen its domestic function and further cooperation with other ports in the Seto Inland Sea, and it will also promotes its function as a hub port for the cruising on the Seto Inland Sea by emphasizing attractive points in this region both at home and abroad.

221
Redevelopment of the Waterfront in the City Center1996 Naka Pier Passenger Terminal started its service.1998 Kamomeria (Naka Pier Central Terminal) started its service.
HAT Kobe was opened.2004 Redevelopment project in the west district of Port Island started.2005 The renewal of Meriken Park was completed.2006 Kobe Airport was opened to traffic.2007 Port Island Shiosai (Waterfront) Park was opened to commemorate the
140th year of the opening of the Port of Kobe2008 Redevelopment project in the west district of Port Island was completed.
2.2.6 Important Points① Various efforts were made to realize early recovery of port functions such as securing huge
financial resources for recovery, recovery planning, reconstruction work, measures for employment, promotion of port utilization, and improvement of port services.② As for the financial resources required for recovery, the national government responded to the
requests made right after the earthquake and provided special financial support. The national government subsidy rate for an extreme-severity disaster was applied to facilities managed by Kobe, and some of the facilities that were not eligible received some national government subsidies. As for the container berths managed by the Kobe Port Terminal Corporation, interest-free financing was provided by the national government under special legislation, and the redemption period for national loans provided before the earthquake was also extended. Furthermore, ports and coastal facilities owned by the private sector were financially supported by the former Japan Development Bank under a super-low interest rate financing system due to the facilities’ public nature. In particular, the reconstruction of private protected shores was also supported by the government in combination with the public project for tsunami management under the precondition that the protected shores would ultimately belong to the government when reconstruction was completed.③ The port reconstruction plan aimed at creating a robust port that could weather disasters,
utilizing the lessons learned from the earthquake rather than merely restoring it to its original state. Berths that were designed to be earthquake resistant and could be used even at the time of disaster were built in large numbers. The Port of Kobe was also expected to serve as part of the city’s disaster recovery system by providing evacuation space as well as the functions of stockpiling of critical materials, life support, and healthcare. The port was also expected to be user-friendly with modern and highly sophisticated facilities.④ The reconstruction project was to be completed in about two years, in order to recover the
entire functions of the Port of Kobe. To meet this goal, recovery work was prioritized so that critical work was conducted in efficient manner. Specifically, the berths that became available due to emergency recovery and repairs were utilized temporarily, while full-scale recover work proceeded in adjacent berth. Users were shifted to the berths where recovery work has been completed from the temporarily-repaired berths, which then started full-scale reconstruction. This construction method is called the “by-turns reconstruction method.” In the meantime, temporary piers were constructed on Rokko Island and used for foreign trade container berths and domestic berths with a total extension of 1,000 meters.⑤ Better software functions were also needed to help in increasing port entry opportunities
and securing employment as the number of operable berths declined. According to the “Port Transportation Business Act” and “Port Labor Act,” there are legal restrictions and labor-

222
management agreements that do not allow employers and workers to freely work at other ports. However, exceptional measures due to the emergency situation were taken to allow them to engage in cargo-handling operations for 24 hours a day and 7 days a week with two shifts and to work at other ports and in other industries. Related governmental agencies and trade organizations also took emergency actions quickly.⑥ As the Port of Kobe is regarded as citizens’ property, recovery had to be accomplished as soon
as possible, and recovery was also necessary to strengthen international competitiveness. In this context, information about the progress and schedule of recovery was provided to users and citizens through port sales activities and The Port of Kobe Recovery News. Furthermore, an attempt was made to improve port services through the simplification and computerization of port procedures, well ahead of the other ports in Japan, and a request was made to the national government to deregulate the compulsory pilot system.⑦ A wide variety of events were held in the waterfront area in order to make an extensive appeal
for the recovery of the Port of Kobe, to invigorate citizens affected by the earthquake, and to bring hope for the future.
2.3 Evaluation What was most required for the Kobe economy was to realize early recovery of the Port of Kobe. The period when the handling volume of containers accounted for only 70% of the pre-disaster level continued for a while, but foreign and domestic trade kept increasing for the six years from 2002 to 2008, reaching 90% of the pre-disaster level. However, the transshipment function that used to be exercised by the Port of Kobe has shifted to major ports in East Asia due to the rise of Asian ports. Instead, more domestic containers from the Setouchi and Kitakyushu regions are handled at the Port of Kobe. The number of passenger ships that visited the Port of Kobe was 100 in 2007, bringing the recovery rate up to slightly less than 80%.
When it came to the reconstruction project this time, efforts were made to shorten the reconstruction period by using the “by-turns reconstruction method,” utilizing larger and precast components and existing caissons. In the future, there are two points that need to be considered from the perspective of disaster reduction as follows. Firstly, collaboration efforts have been made in an extensive area for preparation of large scale disaster that might happen again in the future. In May 2006, the Port of Kobe concluded with the Port of Osaka the Agreement on Mutual Utilization of Port Facilities for the Purpose of Securing Port Distribution Functions in case of a Large Scale Disaster. The purpose of this agreement was to avoid confusion right after a disaster, to secure port distribution functions as early as possible, and to maintain business continuity. In order to realize this, it is necessary to have physical facilities that can fulfill necessary functions at the time of a disaster such as anti-seismic reinforced berths and extensive disaster-preparedness facilities. At the same time, the people and parties concerned need to cooperate continuously to eliminate any possible problem that could paralyze the continuity of business activities. Secondly, as for the measures against tsunamis, physical improvement has been made gradually such as land-lock improvement, prevention of dike breakage, and evacuation pathways, but on the other hand, areas involving people need to be handled better such as letting local citizens know about potential risks by making hazard maps and conducting evacuation and disaster-prevention drills. Cooperation with the local community is essential on a daily basis; for example, an exercise to close a disaster-prevention iron door must be conducted together with the people living in the community.
2.4 Conclusion As self-sufficiency levels in Japan are low with regard to energy and food, ports and harbors are indispensable social infrastructures, and it is very important to have a system that enables continued business activities even at the time of a large-scale disaster. It is also essential to provide a recreational
223
space where citizens and visitors can see the ocean and observe ships under the sea breeze.
In order to make these things happen, stakeholders must play a vital role to facilitate communication on potential risks on a daily basis. What became clear from the experience of the Kobe Earthquake is that mutual assistance and self-help capability at the local community level are indispensable because there is a limitation to government support. Therefore, it is necessary for all port-related parties to share information on a routine basis and to clarify roles and responsibilities to facilitate communication, so that a collaborative system is in place and can be put into action immediately in the event of a disaster.
Based on the lessons learned from the earthquake, the Port of Kobe is continuously aiming at becoming a safe and secure port with a user-friendly environment, and the generous support and cooperation extended by the people and various organizations should never be forgotten.
ReferencesKobe (1998, March). News on the Recovery of Kobe Port Facilities – Overcoming the Kobe Earthquake (Technical
Version) (Japanese language)Kobe (2005, February). Minato-Kobe Vitalizing Plan
CHAPTER 5
Life Recovery

226
1 The Role of Civil Society for Long-Term Life Recovery from a Megadisaster: The 1999, 2001, 2003 and 2005 Life Recovery Social Survey Results among the Survivors of the 1995 Kobe Earthquake1
1.1 Introduction This chapter summarizes major findings from the Hyogo Life Recovery Survey Project, a series of four consecutive cross-sectional social surveys as well as three time point longitudinal (panel) survey in order to study long-term life recovery processes among the 1995 Kobe earthquake survivors. The first survey was conducted in 1999, five years after the Kobe earthquake. The questionnaires were then repeatedly administered to those who resided in the same three hundred and thirty impacted areas out of which ten subjects were randomly selected each time in the years 2001, 2003 and 2005. During these three years, the additional panel survey was also conducted at the same areas.
The research framework for both cross-sectional and longitudinal studies evolved in three stages over the course of the project’s seven-year period. The first stage was exploratory due to the fact that there was no preceding long-term life recovery model that would have applied to an urban mega-disaster (Kawata, 1995) in recent years either nationally or internationally. The first survey that was administered in March 1999 was therefore designed to develop several scales and measures that could be repeatedly employed in the following surveys. Among those scales and measures, one of the most important developments was that of life recovery, which was designed to quantify the dependent variable for the project. The 1999 survey also examined demographic, disaster impact and social characteristics of those who showed a higher level of life recovery (Tatsuki & Hayashi, 2000). The second stage integrated the findings from the 1999 study as well as those from the grass roots assessment workshop on life recovery conducted in the summer of 1999 (Tatsuki & Hayashi, 2001). Based on those findings, the seven critical element model of life recovery was constructed. The model guided research framework building for the 2001 Hyogo Life Recovery Survey. The third stage refined the research strategy that was then employed in the 2003 and 2005 surveys. Those two surveys paid attention not only to life recovery outcomes but also to intervening life recovery process variables. The 2003 survey resulted in the construction of the long-term life recovery process and outcome model from a mega-disaster (Tatsuki et al, 2004). The 2005 survey along side with the 2003 and 2004 grass roots assessment workshops that were conducted in Kobe and southern Hyogo areas respectively (Tatsuki, 2004) confirmed, in general, both internal and external validity of the final life recovery process and outcome model.
1.1.1 Preceding studies on the recovery process in Japan and the US Based on ethnographic interviews (cf., Shigekawa & Hayashi, 1997) with Kobe earthquake victims in Nishinomiya city, Aono, Tanaka, Hayashi, Shigekawa and Miyano (1998) found three distinctive time phases in the victims’ disaster response behaviors. This finding provided the basis for the following quantitative analyses that incorporated the suggested “normalcy-to-disaster-to-recovery” pattern model utilizing macro level time-series statistics such as regional power consumption (Takashima & Hayashi, 1999) and Kobe city monthly reports on household and socio-economic activity statistics (Karatani, Hayashi & Kawata, 2000).
Webb, Tierney and Dahlhamer (2000) summarized results from four cross-sectional post-event large sample surveys on short- and long-term business recovery after major disasters such as the Loma Prieta earthquake in 1989, Hurricane Andrew in 1992, Midwest floods in 1993, and the Northridge Earthquake in 1994. They observed differential impacts upon business recovery due to disaster severity, business size, the degree of operational problems such as disruptions in supply and employee-related problems, as
1 A large portion of this chapter was already reported in the Journal of Disaster Research, Vol.2., No.6, pp484- 501.

227
well as damage to the surrounding areas that provide the business customer base.
Based on numerous longitudinal/ethnographic interviews with disaster-hit small business owners and NGO leaders, Alesch, Holly, Mittler, and Nagy (2001) pointed out the five most critical variables for long term recovery: a) the disaster's impact on the organization's clientele; b) the availability of convenient substitute goods or services; c) pre-disaster major trends in the organization's industry, and the individual organization's position in relation to those trends; d) the extent of financial resources lost by the organization; and e) the owner/operator's ability to adapt to the new business environment. These points seem to correspond closely with those reported by Webb et al. (2000). Alesch and his associates (2001) also noted common narratives being repeatedly told to interviewers across different disaster sites. Those included misplaced confidence, an illusion of security, a feeling of helplessness to change the outcome, a continuing nightmare, self-imposed limits on recovery efforts, imprudent use of financial resources, failure to discern changes in customer base, an assumption that circumstances will revert to normal, special impact on retirement age people, and a lack of short term help. Those common narratives seemed to reflect the victims’ view of reality and the outside world, which in return might have had a strong influence upon what they did or did not do (see also Alesch, 2001 as well as Alesch & Holly, in press) .
Although the above mentioned studies seem to reflect the current state of art on the study of long term recovery in Japan and the US, they do not seem to have fully responded to and/or solved some of the research issues raised at the 1996 Boulder workshop session titled “What is known and trends for improving recovery and reconstruction following disasters,” in which Joanne Nigg, Trish Bolton, Claire Rubin, and Phil Berke participated as panelists. Dennis Wenger, who moderated the session summarized some of the discussion points as follows: a) there exists a “need to shift the conceptualization of recovery from linear and outcome-based to seeing it as an ongoing and long-term process”; b) antecedent recovery studies tend to be “overly descriptive, fragmented, and short-term oriented”; c) not much attention has been paid to link a disaster response phase to a recovery phase; and d) more research is needed in order to understand the long-term effects of disaster recovery (Wenger, Rubin, Nigg, Berke & Bolton, 1996).
The 1996 Boulder workshop session participants agreed that an attempt should be made to overcome “overly descriptive, fragmented, and short- term oriented” studies by incorporating a large systematically sampled surveys. The following studies (e.g., Webb, Tierney & Dahlhamer, 2000; Tatsuki & Hayashi, 2002), are cross-sectional, linear and outcome-based at best, and thus do not fully pay attention to ongoing recovery processes. In comparison, long-term, longitudinal, and ethnographic studies on disaster victims provided rich insights about recurring themes (e.g., Shigekawa & Hayashi, 1997; Aono, Tanaka, Hayashi, Shigekawa & Miyano, 1998; Alesch & Holly, in press). Their insights have not yet been fully verified by either long-term large sample surveys or by those based on individual as opposed to aggregate data sources.
1.2 The 1999 Study The 1999 Hyogo Life Recovery Survey aimed to identify determinants of the changes of residence and life reconstruction among the 1995 Kobe earthquake victims. Based on findings from the preceding ethnographic research (Aono, Tanaka, Hayashi, Shigekawa, & Miyano, 1998; Tanaka, Aono, & Hayashi, 1998;Tanaka, Hayashi, & Shigekawa, 1999), the questionnaire was designed to inquire about residence location, source of help, sense of civic-mindedness and family relations at the 10th, 100th, and 1000th hour as well as at the six months point after the onset of the earthquake. These time points were considered to correspond with critical boundaries, which segmented phases of the disaster victims' behavior. With regard to the purpose of the current chapter, the 1999 study should be noted as the first attempt to construct standardized measures of life recovery, physical and mental stress, civic-mindedness
228
and family relations. Those scales were to be repeatedly used in the following three surveys.
1.2.1 Method1.2.1.1 Subjects A random sample mail survey was conducted on 3,300 earthquake victims who experienced severe life difficulties due to the 1995 Kobe earthquake. The sample was divided into two groups. One group consisted of those who stayed within Hyogo prefecture: 2,500 In-Hyogo residents were sampled from 250 randomly selected points with a seismic intensity of 7 and/or with a more than two month cut-off from the city gas supply. The other group consisted of those who left Hyogo prefecture: 800 Out-of-Hyogo residents were randomly selected from the subscribers' list for a Hyogo Government newsletter aimed at Out-of-Hyogo residing earthquake victims. 3,300 questionnaires were mailed at the beginning of March 1999 and 993 (683 In-Hyogo and 313 Out-of-Hyogo) questionnaires were returned by the end of March. 915 responses (623 or 25.7 % from In-Hyogo and 292 or 37.1% from Out-of-Hyogo residents) were valid.
1.2.1.2 Instruments Based on findings from preceding ethnographic research, the questionnaire was designed to inquire about life environment at the 10th, 100th, and 1000th hour as well as at the sixth month after the onset of the earthquake. These time points were found to correspond with critical boundaries, which segmented phases of the disaster victims' behavior (Tanaka, Hayashi, & Shigekawa, 1999). The survey questionnaire included the following four scales that measured family functioning, civic-mindedness, physical as well as psychological stress and life recovery.
The family functioning scale is a sixteen-item Thurstone scale, which measures the two critical dimensions of family relations, family adaptability and cohesion (Olson, Russell, & Sprenkle, 1979; Tatsuki, 1999). Family adaptability is defined as a family system’s ability to change its power structure, role relations, and relationship rules in response to a situational and developmental stress. Family cohesion is the emotional bonding that family members feel to each other. Under normal circumstances, a moderate level of family adaptability and cohesion is optimal; too much or too little adaptability or cohesion is considered to be dysfunctional. However, families are known to become extreme on either dimension in order to adjust to crisis situations.
The civic-mindedness scale is a twenty question trichotomous instrument that measures self-governance and community solidarity. This scale was specifically developed for the 1999 study and was based on conceptual clustering of the preceding literature on civil society and civic-mindedness (Rousseau, 1913/1762; Kline, 1994; Burchell, 1995). Each dimension is bipolar. The self-governance dimension contrasts valuation based on internal criterion (self-governance) with that based on external/societal criterion. The community solidarity dimension contrasts cooperation (community solidarity) with non-cooperation. For each of twenty five items, respondents chose one of the bipolar options on either dimension or a neutral answer (“cannot decide either”).
Physical and psychological stress scale consists of six physical and six psychological stress items. They were selected from a total of 111 stress symptom items that were parts of the 1995 Japan Red Cross Stress Study (Hayashi, Nishio, Sugawara, Monma, Kohno, Makishima, Numata, & Nemoto, 1996). Factor analysis with a varimax rotation of these twelve items in the original Japan Red Cross Study data showed a clear two factor simplex structure with psychological stress on the first factor and physiological stress on the second.
Life recovery scale is a 14 item 5-point Likert scale. It asks subjective evaluations of life fulfillment
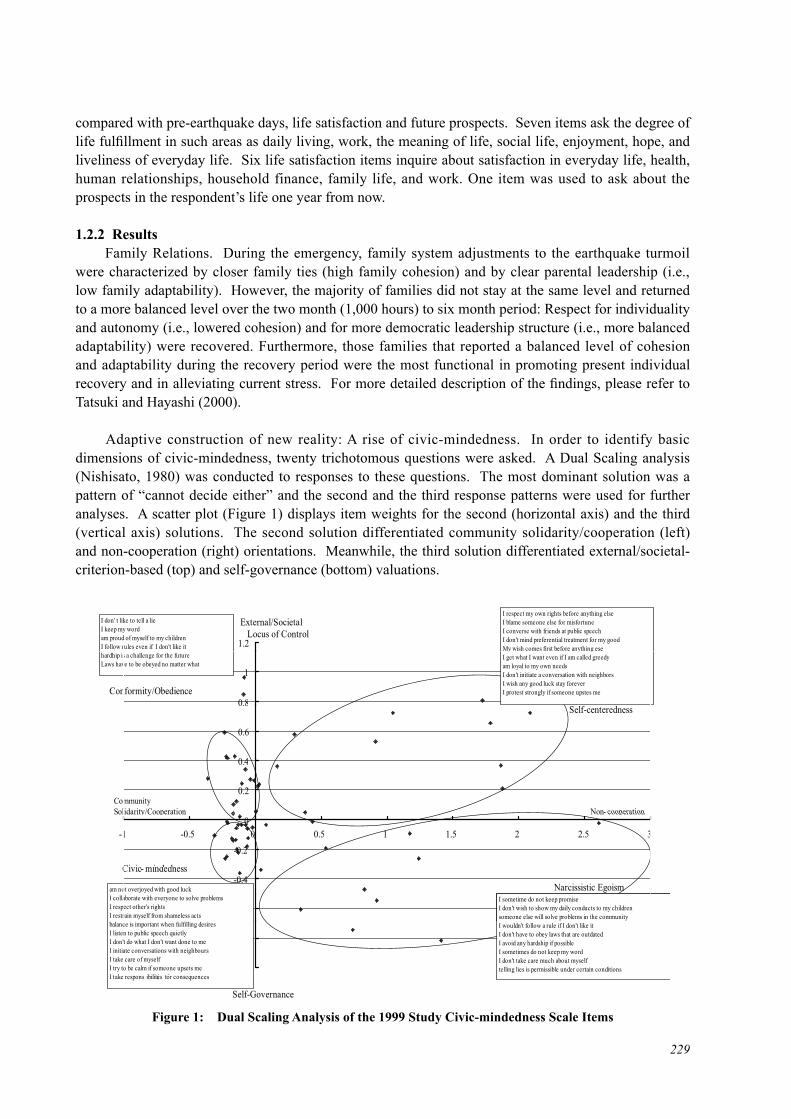
229
compared with pre-earthquake days, life satisfaction and future prospects. Seven items ask the degree of life fulfillment in such areas as daily living, work, the meaning of life, social life, enjoyment, hope, and liveliness of everyday life. Six life satisfaction items inquire about satisfaction in everyday life, health, human relationships, household finance, family life, and work. One item was used to ask about the prospects in the respondent’s life one year from now.
1.2.2 Results Family Relations. During the emergency, family system adjustments to the earthquake turmoil were characterized by closer family ties (high family cohesion) and by clear parental leadership (i.e., low family adaptability). However, the majority of families did not stay at the same level and returned to a more balanced level over the two month (1,000 hours) to six month period: Respect for individuality and autonomy (i.e., lowered cohesion) and for more democratic leadership structure (i.e., more balanced adaptability) were recovered. Furthermore, those families that reported a balanced level of cohesion and adaptability during the recovery period were the most functional in promoting present individual recovery and in alleviating current stress. For more detailed description of the findings, please refer to Tatsuki and Hayashi (2000).
Adaptive construction of new reality: A rise of civic-mindedness. In order to identify basic dimensions of civic-mindedness, twenty trichotomous questions were asked. A Dual Scaling analysis (Nishisato, 1980) was conducted to responses to these questions. The most dominant solution was a pattern of “cannot decide either” and the second and the third response patterns were used for further analyses. A scatter plot (Figure 1) displays item weights for the second (horizontal axis) and the third (vertical axis) solutions. The second solution differentiated community solidarity/cooperation (left) and non-cooperation (right) orientations. Meanwhile, the third solution differentiated external/societal-criterion-based (top) and self-governance (bottom) valuations.
Figure 1: Dual Scaling Analysis of the 1999 Study Civic-mindedness Scale Items
1.2
External/Societal Locus of Control
I don' t like to tell a lieI keep my wordam proud of myself to my childrenI follow rules even if I don't like it
I respect my own rights before anything elseI blame someone else for misfortuneI converse with friends at public speechI don't mind preferential treatment for my goodMy wish comes first before anything ese
0.8
1
Conformity/Obedience
hardhip is a challenge for the futureLaws have to be obeyed no matter what
I get what I want even if I am called greedyam loyal to my own needsI don't initiate a conversation with neighborsI wish any good luck stay foreverI protest strongly if someone upstes me
0 4
0.6
0.8Self-centeredness
0.2
0.4
CommunitySolidarity/Cooperation Non- cooperation
-0.2
0-1 -0.5 0 0.5 1 1.5 2 2.5 3
Civic mindedness
Solidarity/Cooperation Non cooperation
-0.6
-0.4Civic- mindedness
Narcissistic Egoismam not overjoyed with good luckI collaborate with everyone to solve problemsI respect other's rightsI restrain myself from shameless acts
I sometime do not keep promiseI don't wish to show my daily conducts to my childrensomeone else will solve problems in the community
-1
-0.8balance is important when fulfilling desiresI listen to public speech quietlyI don't do what I don't want done to meI initiate conversations with neighboursI take care of myselfI try to be calm if someone upsets meI t k ibiliti f
I wouldn't follow a rule if I don't like itI don't have to obey laws that are outdatedI avoid any hardship if possibleI sometimes do not keep my wordI don't take care much about myselftelling lies is permissible under certain conditions
Self-Governance
I take respons ibilities for consequences

230
Based on these two axes, items were clearly grouped into four quadrants. The first quadrant or the top right corner was named self-centeredness, which was characterized by high non-cooperation and high external criterion-based valuation. The self-centeredness items included such wordings as “respect my own rights before anything else”, “blame someone else for misfortune”, “converse with friends at public speech”, and “don’t mind preferential treatment for my good”. While self-centeredness depends on others in order to feel better off or one-up on others, narcissistic egoism (the bottom right quadrant) depends on nothing but one’s own value system. Narcissistic egoism items included such wordings as “sometimes do not keep promise”, “wouldn’t follow a rule if I don’t like it”, and “avoid any hardship if possible”. The top left quadrant was named conformity/obedience, which was characterized by high community solidarity and high external/societal valuation. Conformity/ Obedience items included such wordings as “don’t like to tell a lie”, “keep my word”, “follow rules even if I don’t like it” and “hardship is a challenge for the future”. In contrast to conformity/obedience, civic-mindedness at the bottom left quadrant was characterized by high self-governance as well as by high community solidarity. Civic-mindedness items included such phrases as follows:
Self-governance 1. Am not overjoyed with good luck 2. I restrain myself from shameless acts 3. I try to be calm if someone upsets me 4. Balance is important when fulfilling desires 5. I take care of myself 6. I try to keep my word
Community Solidarity 1. I collaborate with everyone to solve problems 2. I respect other's rights 3. I listen to public speeches quietly 4. I don't do what I don't want done to me 5. I initiate conversations with neighbors 6. I take responsibility for consequences
Reflection on pre- to post-earthquake changes in civic-mindedness. Respondents were requested to evaluate their sense of civic-mindedness before and after the earthquake. Responses from the six self-governance and six community solidarity items listed above were added for each occasion and scores were obtained. Figure 2 indicates that both self-governance (left graph) and community solidarity (right graph) scores increased from pre- to post-earthquake time. It should be noted that although separate scores were obtained from each of the other three quadrants of self-centeredness, narcissistic egoism, and conformity/obedience, no apparent change was observed from pre- to post-earthquake times among these scores. The adaptive nature of their changed worldview on society was further elaborated in Figure 3, which shows that those who reported high civic-mindedness (a sum of the self-governance and community solidarity scores) at post-earthquake time tended to be better-recovered from the disaster (left graph) and less stressed (right graph) than those who reported low civic-mindedness. These findings suggest that the earthquake disaster experiences caused among many survivors a change in their internal value system, that they constructed a new civic-minded worldview as a result of adaptation to a new environment, and that these changes in civic-mindedness were responsible for elevating both their subjective evaluation of life recovery and their coping with the current life stressors.
The 1999 Life Recovery Survey was exploratory and developmental in its nature. Four sets of measures were developed and they showed an empirical evidence for continued use. First, an
231
operational measure of life recovery was developed. The fourteen item life recovery scale covered three related but conceptually different areas, a level of life fulfillment as compared with pre-earthquake days, life satisfaction in the current daily lives, and a future prospect. This scale was repeatedly used in the following three surveys as a dependent/criterion measure. Second, a Japanese version of Family Adaptability and Cohesion Evaluation Scale demonstrated predicted relations with individual life recovery: Those who enjoyed functional family relationships showed a significantly higher level of life recovery. Third, a physical and mental stress scale was developed and it demonstrated clear relation with both life recovery and family functioning. Lastly, a concept of civic-mindeness was constructed as a predictor of life recovery and its operationalized measure was developed. The 1999 survey found a rise of civic-mindedness among people from pre- to post-earthquake periods. Furthermore, those who were high on self-governance and/or solidarity, two dimensions of civic-mindedness, reported a higher level of life recovery and a lower level of physical or mental stress (Tatsuki & Hayashi, 2000).
1.3 The 2001 Study The research frame development for the 2001 study was guided by the preceding 1999 study results and also by those findings that were obtained through a series of grass roots stakeholder assessment workshops on life recovery that were conducted during the summer of 1999 (Kobe City Research Committee on Disaster Recovery, 2000; Tatsuki and Hayashi, 2001). The aim of the assessment was to identify major factors that determine life recovery among those who experienced damages and losses during and after the 1995 Kobe earthquake. Residents from all of Kobe's nine wards and three special interest groups provided their assessments concerning life recovery at grass roots workshop sessions. This yielded 1,623 opinion cards which were taken back to the laboratory and conceptual clustering was attempted. In the end, seven mutually exclusive super-categories were formed. They were housing, social ties, community rebuilding, physical and mental health, preparedness, economic and financial
Figure 3: Level of civic-mindedness by degree of recovery: results from the 1999 Hyogo life recovery survey (2) (n=993)
50 50
40
30
40
30
Life
Life
djus
tmen
t 20
10
djus
tmen
t 20
10
e Recover
e Recovery
465448N =
Cur
rent
Ad
0
-10
573505895495
521540869690818
525388N =
Cur
rent
Ad
0
-10
439451891523806468488657802863
ry Score
y Score
465448N =
Past Civic-mindednessHighLow
525388N
Current Civic MindednessHighLow
Figure 2: Changes in civic-mindedness pre- & post-earthquake: results from the 1999 Hyogo life recovery survey (1) (N=993)
88
6
4
6
4S Co
2
0
2 134197117761370127613524376242671436164772377656861
2
0888072581401424559550989656956789824424580211366929748290863045910974446
Self Gove
omm
unity
- 2
-4
-6
13419711776137012761352
131016021637
1638
4376242671436164772377656861
395803804
720
422455
780
-2
-4
- 6
1604
1352
1602
68736184681259980345347739604
103
803437780
804
ernance
y Solidarit
907907N =
NOWBEFORE
-8
909909N =
NOWBEFORE
6
-8
ty

232
situation, and relation to government. Each super-category was further divided into subcategories. Sub-categories were evaluated on two dimensions: Whether it refers to an individual or a community as a whole and whether it was recovered or more work needed. Figure 4 illustrates assessment results for sub-categories within each super-category or life recovery element.
The 2001 study aimed to develop valid and reliable scales for the seven critical life recovery elements. The scale construction strategy was guided by elaborating which sub-categories were judged as being “more work needed” within each super-category. For example, “Number one priority” was placed to solve issues related to housing. Therefore, a relocation experience due to the earthquake was used as a measure of housing. Likewise, because more work was judged as needed to empower self-governance and solidarity in social ties, further item selection and refinements were attempted in regard to the 1999 study product civic-mindedness scale. As for data analysis, the 2001 study conducted a general linear model or GLM analysis to examine which variables or what combinations of variables best predicted the level of life recovery outcome among the impacted citizens.
1.3.1 Method1.3.1.1 Subjects 3,300 questionnaires were sent by mail in January of 2001 to those adults over the age of twenty who resided in the Kobe-Hanshin region at the time of the 1995 Kobe earthquake. 1,203 valid responses were returned (36.5%). Originally, it was intended that the same respondents that participated in the 1999 survey were again to be studied in the 2001 survey. However, due to the confidentiality requirements made by the Hyogo Prefecture government that commissioned the four consecutive surveys, it became clear that mailing new questionnaires to the same respondents would violate the prefecture's privacy protection policy because of the lack of signed consent from the 1999 survey participants. For the 2001 survey, therefore, ten new subjects were sampled from each of the same 250 research points that the 1999 study used. In addition, 80 extra points in the Northern and Western wards of Kobe were included. Those two wards were the only two out of the total of nine wards that
Figure 4: Seven Critical Elements for Life Recovery (Jul. to Aug., 1999)
Housing Preparedness
Housing Var ious No. 1 Pr ior ity Individua l Community Many Lessons
Socia l Ties
Damage TemporaryHousings
Preparedness P reparedness
Socia l Ties
I’ve beenhelped
Under standing & Empathy
New Rela t ionsh ipE d
Self-Gover-nance &
Economic & Financia l Situa t ion
Regiona l E i Sl
Damage to S ll
We Lost Affl
Community Rebuilding
through t ies Emerged Solidar ity Economic SlumpSmall Business
Affluence
Rela t ion to GovernmentHolist ic Recon-st ruct ion Not Yet Completed
Built EnvironmentReconst ructed
Crea t ive Use of Urban CommonsNeeded Rigid &
Paterna list icDiscr imina t ion Aga inst Those
Gra t itudeWith R t
Rela t ion to Government
Physica l & Menta l Hea lth
Need for St C
St ruggle for
Bureaucracy Who Left TownRequest
Physica lly OK,Individual Community
Var iousC i St ress Care
ProgramsMeaningBut Menta lly
Not Yet Recovered
More WorkNeeded
CopingResources
Needed

233
were not surveyed in the previous 1999 survey. The residents in these new points did not experience as devastating an earthquake impact as the residents in the other 250 points. However, they had also suffered from the same degree of socio-economic impact as those who resided in the rest of the Kobe-Hanshin region. Like the other 250 points, ten subjects were randomly selected from each of the new 80 points. Efforts were also made to ensure a gender balance. The 1999 study surveyed heads of households. This caused the sample to be unequally male-dominated in the 1999 study data. The 2001 survey targeted men and women over the age of twenty in order to ensure a gender balance.
1.3.1.2 Instrument The 1999 grass roots assessment proposed seven critical elements that determined life recovery among the Kobe earthquake survivors. Scales/items were constructed to capture each of these seven elements. These scales/items were designed as the predictor variables in the current research design. As for the criterion/dependent variable, the life recovery scale that was first constructed in the 1999 survey was again used for the current study.
Life Recovery Scale. The life recovery scale consists of 14 five-point Likert scale items that ask about 1) the fulfillment of daily activity, social relationship, subjective well-being compared with pre-earthquake days (7 items), 2) life satisfaction (6 items), and 3) one year prospect (1 item). These 14 items were originally developed in the 1999 Kobe survey and showed unidimensionality with high reliability (Cronbach's alpha was .91) (Tatsuki & Hayashi, 2000).
Table 1. Overview of the independent and dependent variables scalesScale DescriptionHousing Relocation due to the earthquakeSocial Ties Self-Governance, Community Solidarity, Community Participation,
Social Trust, Family Cohesion and AdaptabilityCommunity Rebuilding Awareness of Urban CommonsPhysical and Psychological Health Physical and Mental Stress Symptom Checklist, General Health
Practices IndexPreparedness Awareness/Preparedness for the next major earthquakeEconomic/Financial Situation Increase/Decrease in Household Income, Expenditure, and SavingsRelation to Government Paternalistic, Liberal, and Communitarian Views of Government,
Willingness to Pay (WTP)Life Recovery Life fulfillment, Life satisfaction, One year prospectSocial Desirability MMPI Lie Scale
Housing. A measure of housing for the 1999 study was whether respondent experienced relocation due to the earthquake damage. It was postulated that relocation made housing as one of the most important critical elements in the 1999 grass roots assessment workshop. The study prepared some other measures for housing. Those included how much settled one felt at his/her place, types of current housing and the structure of the housing unit. It became evident, however, in the following GLM analyses that relocation experience was one of the best housing element indicators and the rest did not provide much empirical support to qualify them for housing variables.
Social Ties. The civic-mindedness scale is an 8 question dichotomous instrument that measures self-governance and community solidarity. This scale was originally developed for the 1999 study and was based on conceptual clustering of the preceding literature on civil society and civic-mindedness (Tatsuki & Hayashi, 2000). The scale's content dimensions were then qualitatively cross-validated by
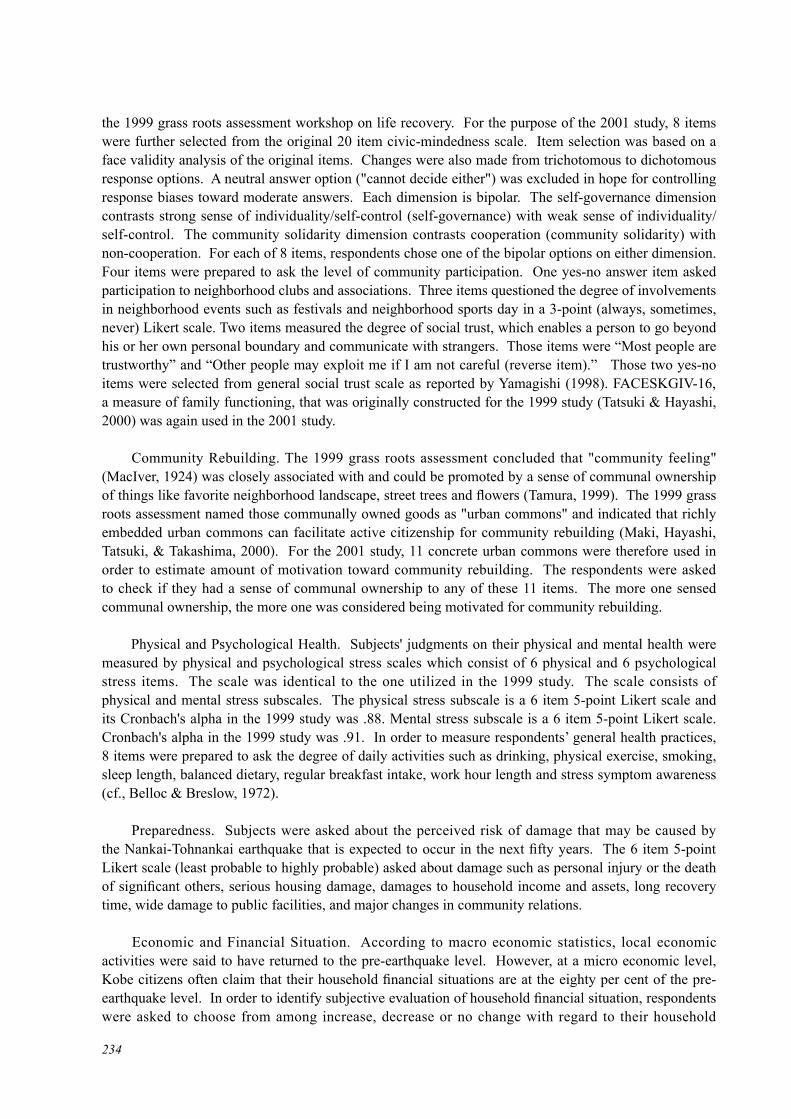
234
the 1999 grass roots assessment workshop on life recovery. For the purpose of the 2001 study, 8 items were further selected from the original 20 item civic-mindedness scale. Item selection was based on a face validity analysis of the original items. Changes were also made from trichotomous to dichotomous response options. A neutral answer option ("cannot decide either") was excluded in hope for controlling response biases toward moderate answers. Each dimension is bipolar. The self-governance dimension contrasts strong sense of individuality/self-control (self-governance) with weak sense of individuality/self-control. The community solidarity dimension contrasts cooperation (community solidarity) with non-cooperation. For each of 8 items, respondents chose one of the bipolar options on either dimension. Four items were prepared to ask the level of community participation. One yes-no answer item asked participation to neighborhood clubs and associations. Three items questioned the degree of involvements in neighborhood events such as festivals and neighborhood sports day in a 3-point (always, sometimes, never) Likert scale. Two items measured the degree of social trust, which enables a person to go beyond his or her own personal boundary and communicate with strangers. Those items were “Most people are trustworthy” and “Other people may exploit me if I am not careful (reverse item).” Those two yes-no items were selected from general social trust scale as reported by Yamagishi (1998). FACESKGIV-16, a measure of family functioning, that was originally constructed for the 1999 study (Tatsuki & Hayashi, 2000) was again used in the 2001 study.
Community Rebuilding. The 1999 grass roots assessment concluded that "community feeling" (MacIver, 1924) was closely associated with and could be promoted by a sense of communal ownership of things like favorite neighborhood landscape, street trees and flowers (Tamura, 1999). The 1999 grass roots assessment named those communally owned goods as "urban commons" and indicated that richly embedded urban commons can facilitate active citizenship for community rebuilding (Maki, Hayashi, Tatsuki, & Takashima, 2000). For the 2001 study, 11 concrete urban commons were therefore used in order to estimate amount of motivation toward community rebuilding. The respondents were asked to check if they had a sense of communal ownership to any of these 11 items. The more one sensed communal ownership, the more one was considered being motivated for community rebuilding.
Physical and Psychological Health. Subjects' judgments on their physical and mental health were measured by physical and psychological stress scales which consist of 6 physical and 6 psychological stress items. The scale was identical to the one utilized in the 1999 study. The scale consists of physical and mental stress subscales. The physical stress subscale is a 6 item 5-point Likert scale and its Cronbach's alpha in the 1999 study was .88. Mental stress subscale is a 6 item 5-point Likert scale. Cronbach's alpha in the 1999 study was .91. In order to measure respondents’ general health practices, 8 items were prepared to ask the degree of daily activities such as drinking, physical exercise, smoking, sleep length, balanced dietary, regular breakfast intake, work hour length and stress symptom awareness (cf., Belloc & Breslow, 1972).
Preparedness. Subjects were asked about the perceived risk of damage that may be caused by the Nankai-Tohnankai earthquake that is expected to occur in the next fifty years. The 6 item 5-point Likert scale (least probable to highly probable) asked about damage such as personal injury or the death of significant others, serious housing damage, damages to household income and assets, long recovery time, wide damage to public facilities, and major changes in community relations.
Economic and Financial Situation. According to macro economic statistics, local economic activities were said to have returned to the pre-earthquake level. However, at a micro economic level, Kobe citizens often claim that their household financial situations are at the eighty per cent of the pre-earthquake level. In order to identify subjective evaluation of household financial situation, respondents were asked to choose from among increase, decrease or no change with regard to their household

235
income, expenditure and saving levels after the earthquake.
Relation to Government. The 1999 disaster process study illustrated a significant increase in civic-mindedness among some citizens. At the same time, the Kobe TQM assessment indicated the other people still maintained a paternalistic view to the government. Okamoto (1997) classified the relation to government into paternalistic, liberal and communitarian orientations. Based on his model, four questions were asked with regard to how to enforce garbage separation rules, how to vitalize community activities, how to save lives at the time of major disaster, and how to promote community development. Elsewhere, respondents were also asked how much money and time they were willing to spend in order to maintain their community. The amount of money and time that they were willing to pay (WTP) for local park maintenance, community festivals, and neighborhood activities was used as a six-item scale of communitarian orientation.
Social Desirability. Questionnaire surveys are known to be affected by response biases such as social desirability and defensiveness. In order to estimate and statistically control the response bias, 10 yes-no social desirability items were selected from the MMPI lie scale (Oguchi, 2001).
1.3.2 Results The predictor variables in the 2001 study included earthquake hazard, demographic variables and seven critical elements. Their effects on life recovery scores were examined. Because some predictors were categorical variables such as house damage (fully, half, partial, no damages), sex (male, female), generation (young adult, middle, old), occupation (classified into 10 categories), and household financial situation (increase, decrease, no change), and the other predictors were scaled values (e.g., indices for social ties, local commons, preparedness, physical and mental health, relation to government, and social desirability), General Linear Model (GLM) was used to examine their individual as well as interaction effects on life recovery scores.
1.3.2.1 Damage, Demography, and Damage-by-Demography Interaction With regard to the damages directly or indirectly caused by earthquake hazard (i.e., house, furniture and economic damages), no main effect was found on life recovery. Generation and occupation were two most significant predictors among the demographic variables. Young adults (those in their 20's and 30's) were significantly better recovered than the middle (40's and 50's) or old age (60 and over) groups (F 2,1202=14.415, p<.01). Occupation main effect was also significant (F 9,1202=3.264, p<.01). Those who were in agriculture/fishery, students, and administrative jobs were better recovered than those who were unemployed/retired, in blue color or sales clerk jobs. Although damage main effects were not significant, it did not mean that direct or indirect damages had no impact. As Table 2 shows, significant locality-by-economic damage (F119,1202=1.251, p<.05) and house damage-by-occupation-by-generation (F86, 1202=1.461, p<.01) interaction effects were found on life recovery. Young adults were found to be better recovered among most occupational categories. However those young adults whose houses were fully damaged and those who were proprietors were found to be having difficulty recovering their lives. Among those who were in their 40’s or 50’s, two groups were found to be having difficulty. One group consisted of those whose houses were fully damaged and those who were currently unemployed. The other group consisted of those whose houses were half-damaged and those who were proprietors. For the old (over age of 60) whose houses were fully, half, or partially damaged, those who engaged in clerical or sales clerk jobs were the least recovered.

236
Table 2. 2001 Life Recovery study General Linear Model Analysis ResultsSource of Variance Type III SS df MS F value p partialη2
Corrected Model 702.311 293 2.397 4.360 *** 0.584 Intercept 0.000 1 0.000 0.001 n.s. 0.000 Damage
House Damage 0.955 3 0.318 0.579 n.s. 0.002 Furniture Damage 2.116 9 0.235 0.428 n.s. 0.004
Economic Damage 2.736 4 0.684 1.244 n.s. 0.005 Demography
Locality 7.817 16 0.489 0.889 n.s. 0.015 Locality*Economic Damage 81.829 119 0.688 1.251 ** 0.141
Sex 0.984 1 0.984 1.790 n.s. 0.002 Generation 15.848 2 7.924 14.415 *** 0.031 Occupation 16.149 9 1.794 3.264 *** 0.031
House Damage*Sex 4.222 3 1.407 2.560 * 0.008 House Damage*Generation*Occupation 69.058 86 0.803 1.461 *** 0.121
① HousingRelocation Experience 2.332 1 2.332 4.242 * 0.005
② Social TiesFamily Cohesion 13.515 3 4.505 8.195 *** 0.026
Family Adaptability 6.925 3 2.308 4.199 *** 0.014 Self Governance 2.263 1 2.263 4.117 ** 0.005
Community Solidarity 2.990 1 2.990 5.439 ** 0.006 Community Activity Participation 4.827 1 4.827 8.781 *** 0.010
Social Trust 7.947 1 7.947 14.456 *** 0.016 ③ Community Rebuilding
Urban Common.s. 2.025 1 2.025 3.684 * 0.004 ④ Physical and Mental Stress
Physical Stress 1.114 3 0.371 0.676 n.s. 0.002 Psychological Stress 57.008 3 19.003 34.568 *** 0.102
Physical * Psychological Stress 17.631 8 2.204 4.009 *** 0.034 General Health Practice 7.306 1 7.306 13.291 *** 0.014
⑤ Preparedness Future Earthquake Damage 3.581 1 3.581 6.515 *** 0.007
⑥ Economic/Financial Situation Income 17.437 3 5.812 10.573 *** 0.034 Savings 2.473 3 0.824 1.499 n.s. 0.005
Expenditure 2.928 3 0.976 1.776 n.s. 0.006 ⑦ Relation to Government
Communitarianism 1.420 1 1.420 2.584 n.s. 0.003 Willingness to Pay 4.291 1 4.291 7.806 *** 0.009
Communitarianism*WTP 1.909 1 1.909 3.472 * 0.004 Social Desirability Bias 2.041 1 2.041 3.712 * 0.004 Error 501.598 910 0.551 Total 1202 1203*** p<.01 ** p<.05 * p<.10 n.s. Not Significant 0.365
1.3.2.2 Critical Elements As for the critical elements that were identified by the Kobe TQM assessment, all components were entered into the GLM model. All of the seven critical components turned out to show significant main effects on life recovery. The effects of critical elements on life recovery were described in the following paragraphs.
Housing. Whether one experienced house relocation due to the earthquake was used as measures

237
for housing. House relocation showed a tendency (F1, 1202=4.242, p<.10) that lowered life recovery scores.
Social Ties. Social ties component was measured by 1) civic-mindedness scale, 2) community participation scale, 3) social trust scale and 4) family functioning (i.e., adaptability and cohesion) scales. Dual scaling (Nishisato, 1980) was used to scale response options and scaled scores were obtained for each of civic-mindedness and community participation scales. Dual scaling of an 8 item civic-mindedness scale yielded a two dimensional structure, in which 4 items were loaded high on the first dimension and they reflected community cohesion, while the other 4 items were loaded high on the second self-governance dimension. Cronbach’s alpha for a 4-item community solidarity subscale was .543 while that for the other 4-item self-governance subscale was .147. The community participation items were Dual-scaled and the 3 item scale provided Cronbach’s alpha .848. Similarly, two item social trust scale was Dual-scaled and the two item scale showed Cronbach’s alpha .411. Finally, 8 items for each of family adaptability and cohesion were Dual-scaled and the scaled scores were used as measures for family adaptability and cohesion. Cronbach’s alphas for family adaptability and cohesion were .916 and .942, respectively.
All variables designated to social ties showed moderate to strong effects on life recovery. Those include a sense of civic-mindedness that consists of self-governance (F1, 1202=4.117, p<.05) and community solidarity (F1, 1202=5.439, p<.05), the degree of actual community participation (F1, 1202=8.781, p<.01) and social trust (F1, 1202=14.456, p<.01).
Family system was also found to facilitate life recovery. The Circumplex model of marital and family systems defines family cohesion and adaptability as being the two major factors to decide family relationship functioning (Olson, Russell, & Sprenkle, 1979; Tatsuki, 1999; Tatsuki & Hayashi, 2000). Those whose family cohesion was characterized by moderate levels of family cohesion (F3, 1202=8.195, p<.01) and family adaptability (F3, 1202=4.199, p<.01) reported a higher level of life recovery.
Community Rebuilding. Dual scaling analysis of 11 items for urban commons yielded a two dimensional structure, where the first dimension contrasted “no” to “yes” and “do not know” while the second dimension contrasted “yes” to “no” and “do not know”. The first dimension was interpreted to reflect “definitive versus non-definitive” attitude, which was a part of response biases. On the contrary, the scaled values for “yes”, “no” and “do not know” options in the second dimension appeared in a linear order. Because of this, the second dimension solution was used as the scaled score for urban commons. Cronbach’s alpha for urban commons scale was .726 for the current data.
One cannot sense a recovery of everyday life in no man’s land. It was hypothesized that recovery of everyday life was partly attributed to by an increased sense of stake-holdership to local urban commons. A sense of stake-holdership would increase people’s involvement in community affairs and thus would help increase a sense of normalcy in community life. GLM analysis results supported this hypothesis and showed a tendency that the more one was aware of the urban commons, the better one was recovered (F1,1202=3.684, p<.10).
Physical and Psychological Health. Subjects' judgments on their physical and psychological health as well as the degree of daily health practices were measured by physical stress scale, mental stress scale, and general health practice index, respectively. 6 items were used to measure each of physical and psychological stress. Cronbach’s alphas for physical and mental stress scales were .894 and .943, respectively. Meanwhile, respondents’ general health practices were measured by 8 item scale. Cronbach’s alpha for general health practices was .537.

238
In order to detect non-linear relations between stress and life recovery, both stress scores were categorized into four ordered categories using quantiles. Psychological stress was a very strong linear predictor of life recovery (F3, 1202= 34.568, p<.01). It turned out to be the single most influential predictors of life recovery among all the predictors. The GLM model as presented in table 2 accounted for 58.4% of the total variance, one sixth of which was accounted for by the psychological stress (partial η2 = .102). Meanwhile, physical stress was found not to have a statistically significant impact upon life recovery (F3,1202=0.676, n.s.). General linear model analyses, however, revealed that there was a significant physical-by-mental stress interaction (F8,1202=4.009, p<.01). For those whose psychological stress were very low or moderately low, it turned out that a moderate level of physical stress further facilitated sense of life recovery. Finally the degree of general health practices was a significant predictor of life recovery (F1,1202=13.291, p<.01).
Preparedness. The 1999 grass roots assessment suggested that a sense of life recovery was accompanied by the heightened sense of preparedness for future disaster. The 2001 panel survey thus asked the degree of damages that respondents anticipated from the soon-to-occur Nankai-Tohnankai earthquake. Principal component analysis of the 6 items showed that the first solution accounted for 71.2 % of the total variance and the only first eigenvalue (4.27) was larger than 1, suggesting a clear unidimensional structure. The 6 items scale provided Cronbach’s alpha .918.
On the contrary to the hypothesis expectation, it was found that the pessimistic expectation on the future disaster (the higher expectation of personal injuries, death of significant others, serious damages on housing, income and assets, the longer recovery time, and the wider damages on public facilities and community relations) was significantly associated with lower level of life recovery among the studied subjects (F1,1202=6.515, p<.01).
Economic and Financial Situation. Subjects were asked to compare between the pre-earthquake and current levels of household income, expenditure and savings. Results showed that changes in income was a significant predictor of life recovery F3,1202=10.573, p<.01). The better off one was in terms of income, the better recovery he or she reported. Saving and expenditure, on the other hand, did not predict life recovery.
Relation to Government. 4 trichotomous items were prepared to ask respondents' views of the government in either paternalistic, liberal, or communitarian orientations. Dual scaling analysis of the 4 items revealed a 2 dimensional structure, where the first solution contrasted liberalism versus paternalism and the second solution differentiated communitarian from the other two orientations. Cronbach’s alphas for liberalism-paternalism and communitarianism subscales were .362 and .345, respectively. GLM analyses revealed that communitarian subscale had a only weak effect on life recovery (F1, 1202=2.584, n.s., p=.105). On the contrary, six item Willingness-to-Pay (WTP) Scale for community affairs (Cronbach's alpha was .899) was a significant predictor of life recovery. Those who are willing to pay more money and time for community affairs were found to be better recovered (F1, 1202 =7.806, p<.01). Finally, a tendency of communitarinism and WTP interaction was found (F1, 1202 = 3.472, p<.10), suggesting those who were communitarians tended to be extraordinarily generous in offering time and money for community affairs.
Social Desirability. 10 items social desirability scale showed a unidimensional structure and its Cronbach’s alpha for all 10 items was .536. Social Desirability showed a weak effect on life recovery (F1, 1202 = 3.712, p<.10). This means that a portion of life recovery variance was weakly explained by the bias to make respondents answer their situations better than they actually were. However, that proportion as measured by partial η2 was only 0.4% and thus judged to be negligible.

239
1.4 The 2003 and 2005 Study The current chapter’s brief literature review illustrated a need to understand recovery as long-term, ongoing, individual processes by incorporating a systematic and longitudinal methodology. The 2003 and 2005 Life Recovery Survey directly tackled these issues. Two additional sources of general literature were sought in order to build working models that conceptualized life recovery as long-term, ongoing and individual processes. One source was a sociological view of how the reality of everyday life was constructed in transactions in a social context (Berger & Luckman, 1966). Based on this model a “normalcy-to-disaster-to-recovery” curve model was constructed (See Figure 5). Three recovery curve types were identified by this model, i.e., return to normalcy, struggle for meaning and retreat.
The other rich source of previous literature on human recovery was found in writings by psychologists and psychiatrists who had worked with holocaust survivors, hibakusha, Vietnam veterans, and dying patients (Frankl, 1959, Lifton, 1967; Kubler-Ross, 1969). Their writings emphasized that victims never regained the same normalcy as before and that what mattered the most was how one re-appraised the past event and made sense out of it in the “here and now”. Two axes were postulated in this model(Figure 7); one was whether the earthquake was still conceived to be a major life event or not (horizontal axis) and the other was whether life change after the earthquake was felt to be positive or
Figure 5: The normalcy-to-disaster-to-recovery curve model
DisasterDisaster
Life A CitizenAdjustm
e
Victim/Citizen
Victim
Time
REN l
nt, Satis
Victim
1000hr LifeRecovery
10hr Disorientation100hr Development
Life as an ordinary citizenRecoveryEmergencyNormalcy
sfactionRecovery1000hr Disaster
Utopia
Figure 6: Three Recovery Curve Typologies
Recovered
TimeLife RRecovery Score Time
Withddraw
al
Time
In Process
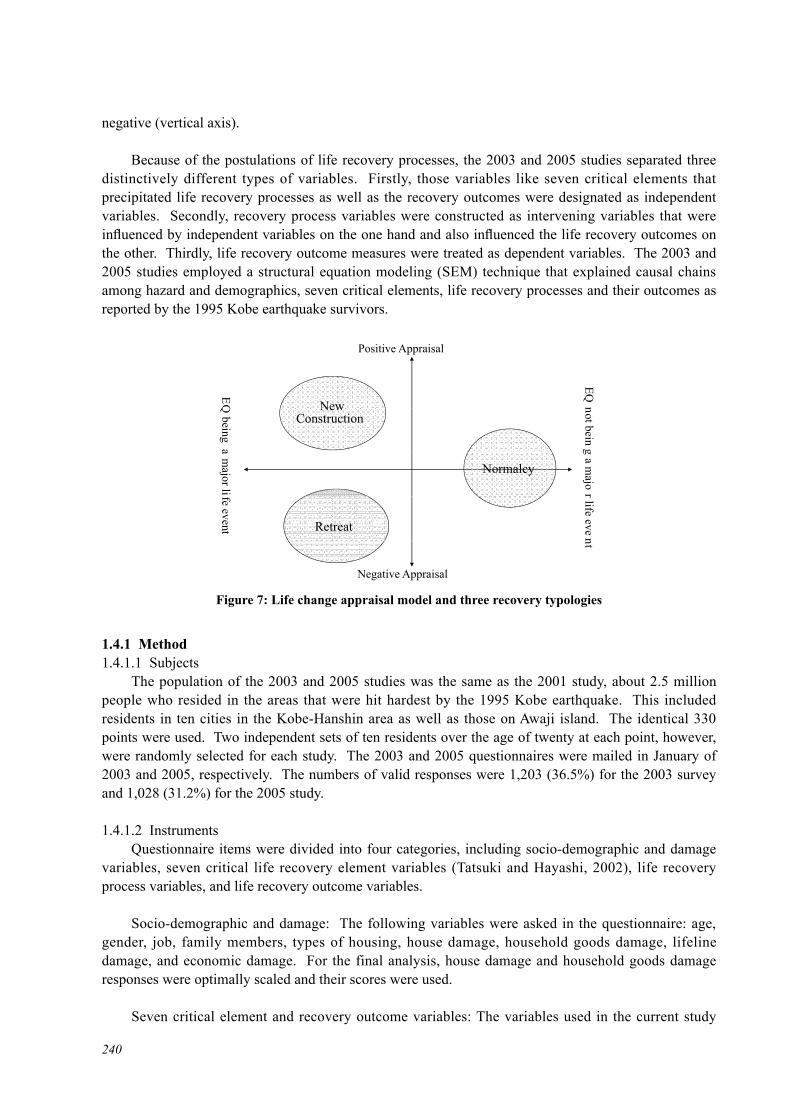
240
negative (vertical axis).
Because of the postulations of life recovery processes, the 2003 and 2005 studies separated three distinctively different types of variables. Firstly, those variables like seven critical elements that precipitated life recovery processes as well as the recovery outcomes were designated as independent variables. Secondly, recovery process variables were constructed as intervening variables that were influenced by independent variables on the one hand and also influenced the life recovery outcomes on the other. Thirdly, life recovery outcome measures were treated as dependent variables. The 2003 and 2005 studies employed a structural equation modeling (SEM) technique that explained causal chains among hazard and demographics, seven critical elements, life recovery processes and their outcomes as reported by the 1995 Kobe earthquake survivors.
1.4.1 Method1.4.1.1 Subjects The population of the 2003 and 2005 studies was the same as the 2001 study, about 2.5 million people who resided in the areas that were hit hardest by the 1995 Kobe earthquake. This included residents in ten cities in the Kobe-Hanshin area as well as those on Awaji island. The identical 330 points were used. Two independent sets of ten residents over the age of twenty at each point, however, were randomly selected for each study. The 2003 and 2005 questionnaires were mailed in January of 2003 and 2005, respectively. The numbers of valid responses were 1,203 (36.5%) for the 2003 survey and 1,028 (31.2%) for the 2005 study.
1.4.1.2 Instruments Questionnaire items were divided into four categories, including socio-demographic and damage variables, seven critical life recovery element variables (Tatsuki and Hayashi, 2002), life recovery process variables, and life recovery outcome variables.
Socio-demographic and damage: The following variables were asked in the questionnaire: age, gender, job, family members, types of housing, house damage, household goods damage, lifeline damage, and economic damage. For the final analysis, house damage and household goods damage responses were optimally scaled and their scores were used.
Seven critical element and recovery outcome variables: The variables used in the current study
Figure 7: Life change appraisal model and three recovery typologies
Positive Appraisal
EQ
EQ nNewQ
being a
not being
NewConstruction
a major li
g a majo
r
Normalcy
fe event
r life evenRetreat nt
Negative Appraisal
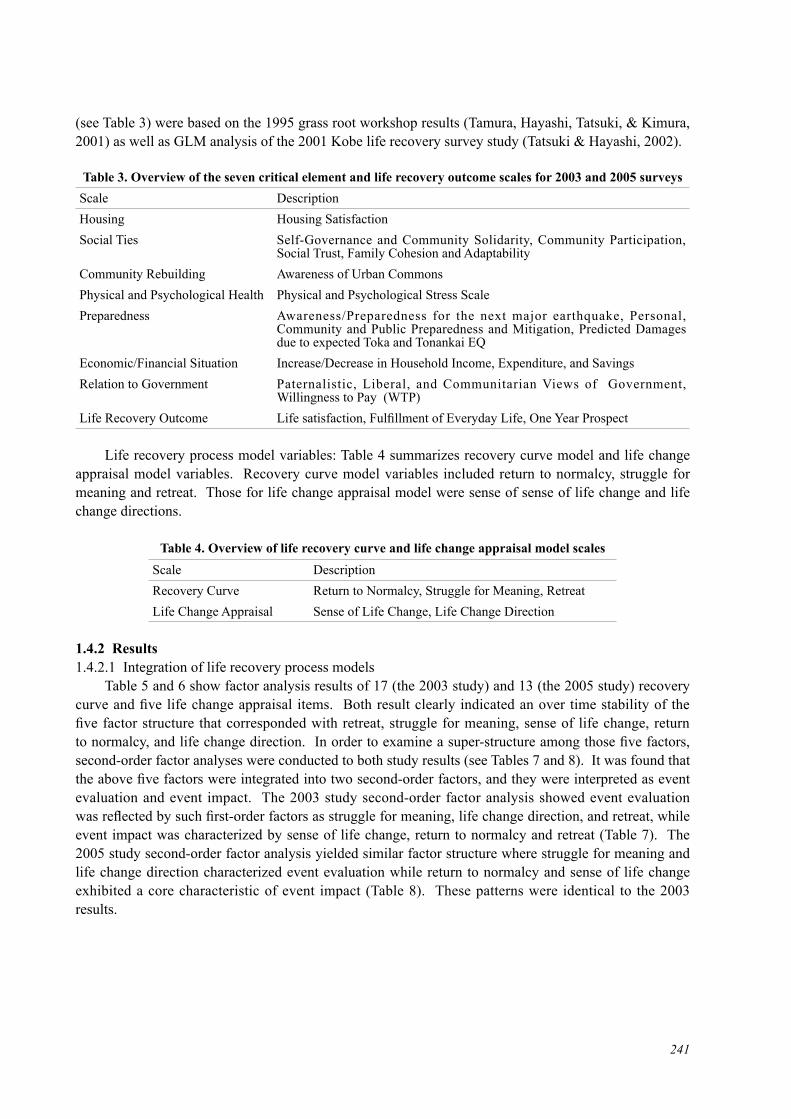
241
(see Table 3) were based on the 1995 grass root workshop results (Tamura, Hayashi, Tatsuki, & Kimura, 2001) as well as GLM analysis of the 2001 Kobe life recovery survey study (Tatsuki & Hayashi, 2002).
Table 3. Overview of the seven critical element and life recovery outcome scales for 2003 and 2005 surveysScale DescriptionHousing Housing SatisfactionSocial Ties Self-Governance and Community Solidarity, Community Participation,
Social Trust, Family Cohesion and AdaptabilityCommunity Rebuilding Awareness of Urban CommonsPhysical and Psychological Health Physical and Psychological Stress ScalePreparedness Awareness/Preparedness for the next major earthquake, Personal,
Community and Public Preparedness and Mitigation, Predicted Damages due to expected Toka and Tonankai EQ
Economic/Financial Situation Increase/Decrease in Household Income, Expenditure, and SavingsRelation to Government Paternalistic, Liberal, and Communitarian Views of Government,
Willingness to Pay (WTP)Life Recovery Outcome Life satisfaction, Fulfillment of Everyday Life, One Year Prospect
Life recovery process model variables: Table 4 summarizes recovery curve model and life change appraisal model variables. Recovery curve model variables included return to normalcy, struggle for meaning and retreat. Those for life change appraisal model were sense of sense of life change and life change directions.
Table 4. Overview of life recovery curve and life change appraisal model scalesScale DescriptionRecovery Curve Return to Normalcy, Struggle for Meaning, RetreatLife Change Appraisal Sense of Life Change, Life Change Direction
1.4.2 Results1.4.2.1 Integration of life recovery process models Table 5 and 6 show factor analysis results of 17 (the 2003 study) and 13 (the 2005 study) recovery curve and five life change appraisal items. Both result clearly indicated an over time stability of the five factor structure that corresponded with retreat, struggle for meaning, sense of life change, return to normalcy, and life change direction. In order to examine a super-structure among those five factors, second-order factor analyses were conducted to both study results (see Tables 7 and 8). It was found that the above five factors were integrated into two second-order factors, and they were interpreted as event evaluation and event impact. The 2003 study second-order factor analysis showed event evaluation was reflected by such first-order factors as struggle for meaning, life change direction, and retreat, while event impact was characterized by sense of life change, return to normalcy and retreat (Table 7). The 2005 study second-order factor analysis yielded similar factor structure where struggle for meaning and life change direction characterized event evaluation while return to normalcy and sense of life change exhibited a core characteristic of event impact (Table 8). These patterns were identical to the 2003 results.

242
Table 5: The 2003 study factor analysis results of 17 recovery curve and 5 life change appraisal model items (promax rotation)
Items Retreat Struggle for Meaning
Sense of Life Change
Return to Normalcy
Life Change Direction Communality
I don’t want to be asked about my EQ experiences. 0.842 -0.134 0.026 -0.138 -0.145 0.719 I don’t want to listen to EQ stories 0.828 -0.177 0.004 -0.116 -0.165 0.691 I don’t want to recall EQ episodes. 0.806 -0.119 0.114 -0.072 -0.208 0.659 I want to erase EQ experiences from my past. 0.716 -0.101 0.208 -0.049 -0.212 0.552 I have had little emotionally moving experience afther EQ. 0.669 -0.226 0.130 -0.138 -0.228 0.469 I have become indifferent about my fate. 0.577 -0.254 -0.051 0.063 -0.259 0.380 I don’t talk about EQ experiences anymore. 0.453 -0.186 -0.382 0.019 -0.083 0.385
I feel strongly that living a life has a meaning. -0.249 0.738 0.043 0.137 0.259 0.567 I think that there is a meaning in my life. -0.200 0.706 0.040 0.060 0.215 0.520 I have emotionally grown thanks to EQ experiences. -0.112 0.658 0.332 0.065 0.331 0.475 I have re-appraised people's willingness to help others. -0.192 0.620 0.185 0.169 0.295 0.402 I started thinking about the mission of my life. 0.013 0.612 0.282 -0.046 0.130 0.434 I have a courage that beats my fate. -0.072 0.600 -0.007 0.071 0.292 0.398 I have gained some valuable experiences during EQ. -0.208 0.412 0.210 0.256 0.096 0.264
I think that I have changed after EQ. 0.080 0.234 0.818 -0.224 0.349 0.740 I think that my life changed after EQ. 0.120 0.194 0.806 -0.301 0.216 0.700 I use EQ as a time boundary when talking about my life. 0.087 0.065 0.718 0.052 -0.082 0.592
I feel normal about my daily life. -0.124 0.153 -0.140 0.850 0.146 0.730 I feel that everyday is a repetition of routine things. 0.049 -0.009 -0.094 0.749 -0.059 0.593 I have a good prospect on my daily life -0.166 0.204 -0.138 0.713 0.269 0.562
Myself has changed toward a positive direction after EQ. -0.251 0.353 0.257 0.106 0.872 0.783 My life has changed toward a positive direction after EQ. -0.267 0.330 0.049 0.160 0.866 0.766
Eigenvalues 4.574 2.980 2.194 1.453 1.180 Variance Accounted For (%) 20.8% 13.5% 10.0% 6.6% 5.4%
Table 6: The 2005 study factor analysis results of 13 recovery curve and 5 life change appraisal model items (promax rotation)
Items Struggle for Meaning Retreat Sense of Life
ChangeReturn to Normalcy
Life Change Directon Communality
I feel strongly that living a life has a meaning. 0.800 -0.108 0.115 0.134 0.272 0.650 I think that there is a meaning in my life. 0.789 -0.145 0.063 0.119 0.235 0.647 I have re-appraised people's willingness to help others. 0.689 -0.092 0.094 0.195 0.282 0.490 I have emotionally grown thanks to EQ experiences 0.687 -0.120 0.299 0.133 0.397 0.540 I started thinking about the mission of my life. 0.672 0.078 0.399 -0.084 0.137 0.523 I have gained some valuable experiences during EQ. 0.453 -0.222 0.187 0.365 0.067 0.371
I don’t want to be asked about my EQ experiences -0.106 0.872 0.116 -0.062 -0.181 0.764 I don’t want to recall EQ episodes. -0.113 0.855 0.119 -0.150 -0.227 0.734 I don’t want to listen to EQ stories -0.130 0.850 0.109 -0.047 -0.141 0.732 I want to erase EQ experiences from my past. -0.025 0.733 0.151 -0.135 -0.296 0.567
I think that I have changed after EQ. 0.260 0.158 0.878 -0.225 0.165 0.788 I think that my life changed after EQ. 0.205 0.205 0.850 -0.252 0.113 0.741 I use EQ as a time boundary when talking about my life. 0.098 0.053 0.760 -0.073 -0.086 0.628
I feel normal about my daily life. 0.168 -0.104 -0.274 0.820 0.292 0.713 I feel that everyday is a repetition of routine things. 0.047 0.038 -0.178 0.760 -0.066 0.635 I have a good prospect on my daily life 0.121 -0.174 -0.037 0.703 0.323 0.547
My life has changed toward a positive direction after EQ. 0.298 -0.203 0.024 0.222 0.886 0.790 Myself has changed toward a positive direction after EQ. 0.352 -0.286 0.117 0.185 0.882 0.790
Eigenvalues 3.875 3.112 2.098 1.337 1.154 Variance Accounted For (%) 21.5% 17.3% 11.7% 7.4% 6.4%

243
Table 7: 2003 second-order factor analysis results of 5 factors (promax rotation)First-order Factors Event Evaluation Event Impact CommunalityStruggle for Meaning 0.789 0.055 0.629 Life Change Direction 0.784 0.015 0.617 Retreat -0.534 0.474 0.493 Sense of Life Change 0.267 0.740 0.633 Return to Normalcy 0.150 -0.668 0.463 Eigenvalues 1.621 1.214 Variance Accounted For (%) 32.4% 24.3%
Table 8. 2005 second-order factor analysis results of 5 factors (promax rotation)First-order Factors Event Evaluation Event ImpactStruggle for Meaning 0.803 -0.102Life Change Directon 0.632 -0.418Sense of Life Change 0.629 0.620Return to Normalcy 0.089 -0.682Retreat -0.165 0.628Eigenvalues 1.611 1.302Variance Accounted For (%) 32.2% 26.0%
The above integrative analyses implied that there seemed to be two different processes or paths toward life recovery. One path was through alleviating or counteracting against the event impact caused the 1995 earthquake damages and losses. The other path was through event evaluation where earthquake experiences were re-appraised as being meaningful. Those implications were based on exploratory analyses of the 2003 and 2005 study data. The following causal analyses were to confirm the internal validity of these postulations on life recovery processes.
1.4.2.2 Structural Equation Modeling of life recovery process and outcome Figures 8 and 10 show the results of structural equation modeling (or SEM) of the 2003 and 2005 study data respectively. The results are summarized as path diagrams that signify causal directions (arrows) and their magnitude (standardized coefficients) among damage, seven critical elements, life recovery processes (i.e., event impact and evaluation) and outcome variables. The variables in squares are designated as observed measures that were obtained from the data, while those in oval shapes are latent variables or postulated constructs (e.g. seven critical elements) that explain high correlations among measures of the same construct. Both 2003 and 2005 studies demonstrated high overall fit between the model and the data; GFI=.924, AGFI=.905, RMSEA=.05 for the 2003 study and GFI=.934, AGFI=.921, RMSEA=.041 for the 2005 study. The estimated parameters or coefficients in both models were all statistically significant at the pre-established p<.05 level.
Figures 9 and 11 present bird’s-eye view summaries of the 2003 and 2005 study results respectively by means of illustrating major causal relations among latent variables. Both studies supported that two different processes, damage alleviation and community empowerment, influenced life recovery outcomes.
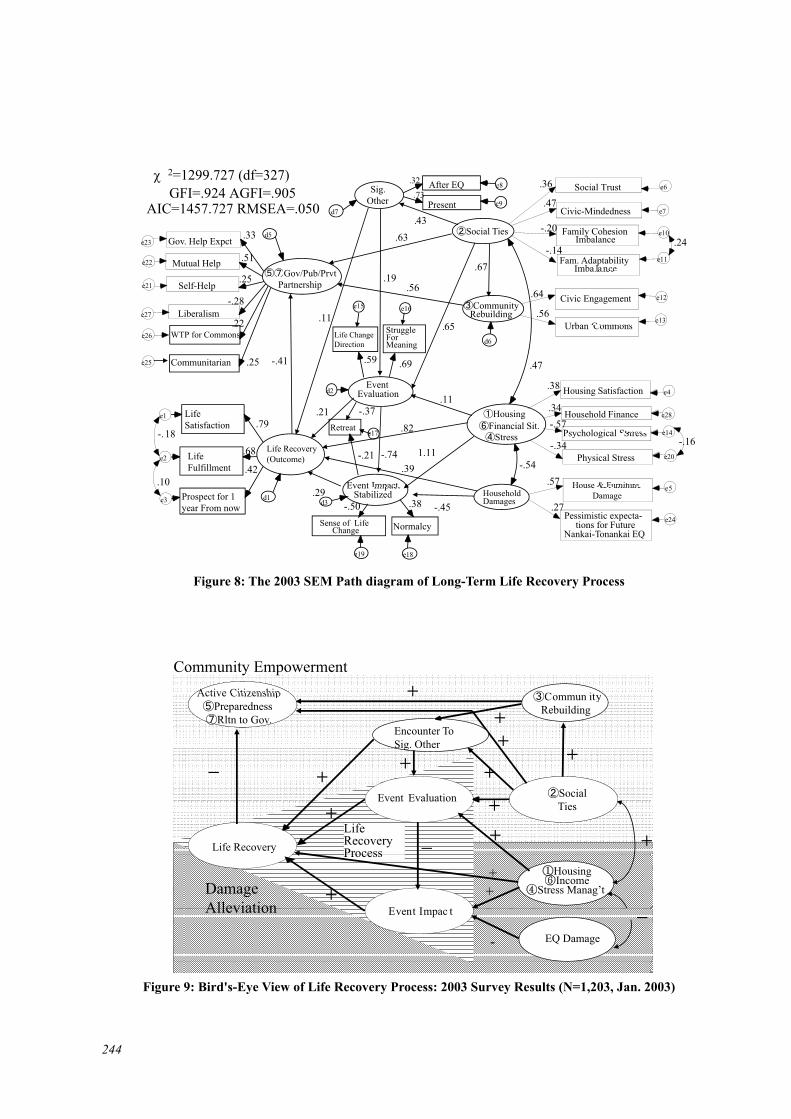
244
Figure 8: The 2003 SEM Path diagram of Long-Term Life Recovery Process
χ 2=1299.727 (df=327)GFI=.924 AGFI=.905
AIC=1457.727 RMSEA=.050 Civic-Mindedness
Social Trust
Present
After EQ .36
.47
e6
e7
e8
e9
Sig.Other
d743
.73
.32
Mutual Help
Gov. Help Expct
Fam. AdaptabilityImba lance
Family Cohesion Imbalance
Social Ties
G /P b/P t
e10
e11
d5 .63
.67
.43-.20
-.14.24
.33
.51e22
e23
Self-Help
Urban Commons
Civic EngagementLiberalism
Imbalance
e15 e16 Community Rebuilding
Gov/Pub/PrvtPartnership
.64
.56e12
e13
.56.19
.11-.28
.25
22 65
e21
e27
Urban Commons
Communitarian
WTP for Commons StruggleFor Meaning
.69
d6
.59 .47-.41.25
.22 .65
e25
e26 Life ChangeDirection
Life Satisfaction
e1.79
Psychological Stress
Housing Satisfactiond2
Household Finance
Event Evaluation
Retreate17
HousingFinancial Sit.
e4
e14
e28-.37.21.82
.11.38
.34-.57
18Life Recovery(Outcome)
.42Life Fulfillment
e2
Psychological Stress
Physical Stress
House & Furniture
e17
Event Impact
Stress
5
e14
e20.68 -.21
.57
-.34
-.541.11
.39
-.18
.10
-.74-.16
Prospect for 1 year From now
e3 d1
Pessimistic expecta-tions for Future
Nankai-Tonankai EQ
d3
House & Furniture Damage
Event Impact Stabilized
NormalcySense of Life Change
.38e5
e24
-.50.29 Household
Damages .27-.45
e18e19
Figure 9: Bird's-Eye View of Life Recovery Process: 2003 Survey Results (N=1,203, Jan. 2003)
Community EmpowermentActive Citizenship C iActive Citizenship
PreparednessRltn to Gov.
Commun ityRebuilding
Encounter To Sig Other
Event Evaluation Social
Sig. Other
Event Evaluation
Life Recovery
Ties
LifeRecoveryProcess
E t I t
DamageAlleviation
ProcessHousing Income
Stress Manag’t++
Event Impac tAlleviation
EQ Damage-
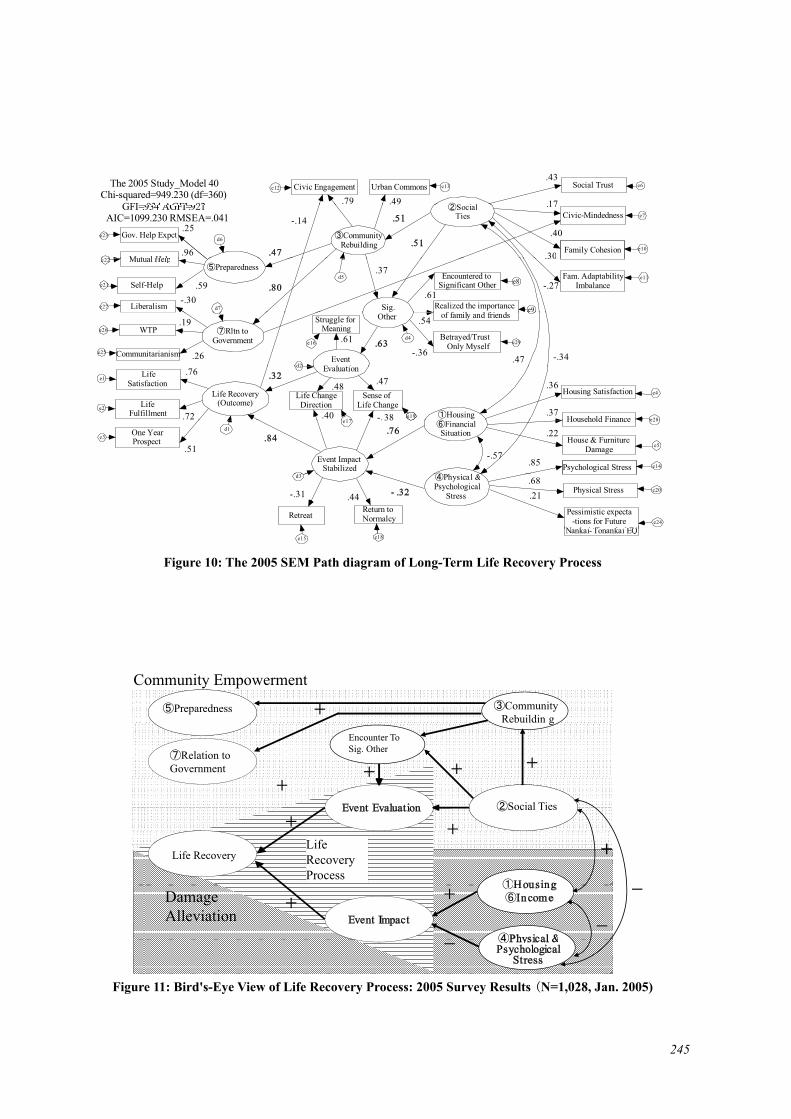
245
Figure 10: The 2005 SEM Path diagram of Long-Term Life Recovery Process
The 2005 Study_Model 40Chi-squared=949.230 (df=360)
GFI 934 AGFI 92
Social TrustUrban CommonsCivic Engagement
S i l
e6e12 e13.43
.49.79 17GFI=.934 AGFI=.921AIC=1099.230 RMSEA=.041 Civic-Mindedness
Mutual Help
Gov. Help Expct
Family Cohesion
SocialTies
CommunityRebuilding
e7
e10
22
e23.25
.96d6 .51
.30
.17
.47
.40.51-.14
Self-Help
Mutual Help
Realized the importancef f il d f i d
Liberalism
Encountered toSignificant Other
Fam. AdaptabilityImbalance
Preparedness
e8
e9
e11e21
e22
e27 Sig.
-.27.59d5
.30
d7
.80-.30 .61
.37
of family and friends
Communitarianism
WTP
EventE l ti
Struggle forMeaning
e16
e25
e26
Other
Betrayed/TrustOnly Myself e29
d2
d4.63.61
Rltn toGovernment
.26
.19
.47
.54
-.36 -.34
Life Recovery(Outcome)Life
Fulfillmente2
LifeSatisfaction
e1.76
Housing Satisfaction
Household Finance
Evaluation
Life ChangeDirection
17
Sense ofLife Change
e19
e4
e28.72
d2
.32
Housing
.36
.37.40 -. 38
.47.48
One YearProspecte3
Psychological Stress
House & FurnitureDamage
Household Financee17
Event ImpactStabilized
e5
e14
e28
d1
d3
FinancialSituation
h i l &
.85-.57
.22.76.84
38
.51
Physical Stress
Pessimistic expecta-tions for Future
N k i T k i EQ
RetreatReturn toNormalcy
e20
e24
d3 Physical &Psychological
Stress .21.68
- .32-.31 .44
Nankai- Tonankai EQe15 e18
Figure 11: Bird's-Eye View of Life Recovery Process: 2005 Survey Results (N=1,028, Jan. 2005)
Community Empowerment
Preparedness CommunityRebuildin gg
Encounter To Sig. OtherRelation to
Government
Event Evaluation Social Ties
Life Recovery
Housing
LifeRecoveryProcess
Event Impact
Damage Alleviation
HousingIncome
Physical &Physical &Psychological
Stress

246
Event Impact: Based on the preceding exploratory factor analyses, a latent variable, event impact, was postulated as an intermediary process to alleviate the impact of damage and stress upon life recovery. In this process, life recovery was directly caused by the degree to which the event impact was stabilized (see Figures 9 and 11). The event impact was measured by such life recovery process variables as a sense of life no longer in transition, a sense of normalcy, and no need for retreat (see Figures 8 and 10).
In the 2003 study (Figures 8 and 9), the event impact stabilization was negatively influenced by the magnitude of household earthquake damages and positively influenced by improvements in those three critical elements as housing, financial situation, physical and psychological stress. In other words, when the improvements overweighed the damages, the event impact was stabilized. The stabilization eventually led to a sense of life recovery. The 2005 study (Figures 10 and 11) repeatedly supported the above causal path in general. A slight but worth noting difference, however, was observed: The event impact stabilization was determined only by the housing and financial situations on one hand and physical and psychological stress on the other. This was due to the fact that the direct 1995 earthquake hazard effect as measured by house, furniture or economic damages disappeared in the 2005 study. People were not suffering because they were hit by the earthquake that occurred ten years ago. Rather, people were suffering from such secondary effects as a lack of housing/financial adjustment and/or long lasting physical and psychological stress.
In 2003 study, life recovery was also directly influenced by the housing-finance-stress critical element latent variable. It also exerted an influence on the event evaluation that will be discussed in the below. It should be noted, however, that these direct effects failed to be confirmed in the 2005 study, suggesting that these effects were temporary and considered to be idiosyncratic to the 2003 study data.
Community Empowerment: Both 2003 and 2005 studies demonstrated that event evaluation, another construct postulated by the preceding exploratory analyses, played an important intervening role in community empowerment process. This was another path that led to life recovery (see Figures 8 and 9). The two studies identified a common community empowerment path where a sense of life recovery was achieved through positive event evaluation. This was measured by such attempts and feelings as struggle for meaning (e.g., “I feel strongly that living a life has a meaning”), life change toward a positive direction and low need for retreat (see path diagram in Figures 6 and 7 in more detail). Social ties, as evidenced by high social trust, civic-mindedness and balanced family relationships, exerted an influence in such a way that one’s evaluation of the earthquake experiences was reframed into positive narratives. The influence paths were both direct and indirect. The indirect paths were through empowering community building efforts and/or increasing opportunities to encounter significant other who provided social and psychological support for re-socialization to and reconstruction of the post-earthquake reality (Berger & Luckman, 1966; Mead, 1963).
Active Citizenship: Social ties were found in both 2003 and 2005 studies to increase a sense of active citizenship and public-community-private partnership. This was considered as being a separate by-product of life recovery processes (see Figures 9 and 11). The active citizenship was demonstrated by high self- and community-help preparedness initiatives as well as by a rise of communitarianism (“We govern ourselves by our own hands.”) as opposed to more individualistic liberalism orientation (“The lesser the interference from the government, the better the government we have.”). In the 2003 study, preparedness and relation-to-government variables were amalgamated while they were conceptually separated in the 2005 study. Otherwise, the same interpretation was applicable to both study results: Stronger social ties were responsible for an increase in active citizenship.

247
In both 2003 and 2005 studies, life recovery outcomes showed a negative impact upon the active citizenship and government-public-private partnership, although this relation was more clearly demonstrated in the 2003 results. The 2003 SEM analysis spotted a downward trend that made people less inclined to take communitarian attitudes and pay less attention to preparedness efforts as life recovered (see Figure 9). Like the 2003 study, the 2005 SEM analysis identified the similar negative effect of life recovery upon civic engagement activities. Unlike the 2003 study, however, a communitarian view of government was found to strengthen a norm of civic-mindedness (see Figure 10). This seems to suggest that although a civic activity level lowered, a sense of civic-mindedness that emerged over the course of post-earthquake years was internalized within a value system among the surveyed respondents. In other words, if or when another occasion should arise, the civic-mindedness would be reactivated into civic engagement activities.
1.5 The 2001, 2003 and 2005 Hyogo Life Recovery Panel Survey Study Kuromiya, Tatsuki, Hayashi, Noda, Tamura, and Kimura (2006) reported the power of social capital upon life recovery using Hyogo Life Recovery Panel Survey Study data. The following section summarizes the major findings.
1.5.1 Subjects 297 subjects responded to the panel survey questionnaires at three different time points, in January of the years 2001, 2003 and 2005. The respondents resided in the area where a seismic intensity of seven on the Japanese scale was recorded and/or city gas service stopped for more than three months after the quake. In January of 2001, 3,300 residents who resided in the above-mentioned areas were randomly chosen. The questionnaires were mailed to them and 1,203 returned. They were the same subjects as reported in the 2001 Hyogo Recovery Survey Study. All were invited to participate in the panel survey and 486 subjects agreed. In January of 2003, along with the 2003 Hyogo Recovery Survey subjects, those 486 year 2001 panel survey participants were sent the 2003 survey questionnaires and 364 (66.1 %) responded. In January of 2005, the 2005 Survey questionnaires were also sent to the 364
Figure 12: the 2001, 2003 and 2005 Panel Study sample
2001 2003 2005
N =297
2001 2003 2005
Responded
N =364Responded
A d t ti i t i
N =486
N =122
N =67Agreed to participate in a panel study
Did not Respond
N =1203
N =717
N =122
Did t t
Did not Respond
Did no t agrree toparticipate
N =1203 N =1203 N =1028Cross Sectionalsample
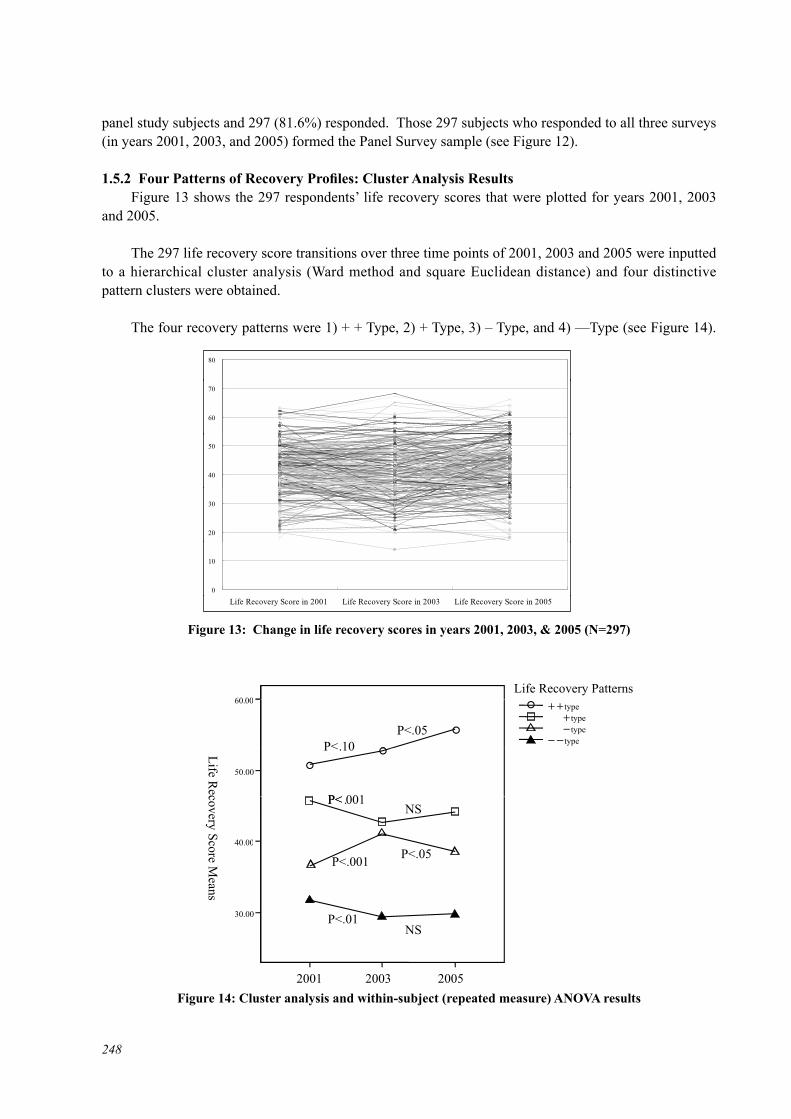
248
panel study subjects and 297 (81.6%) responded. Those 297 subjects who responded to all three surveys (in years 2001, 2003, and 2005) formed the Panel Survey sample (see Figure 12).
1.5.2 Four Patterns of Recovery Profiles: Cluster Analysis Results Figure 13 shows the 297 respondents’ life recovery scores that were plotted for years 2001, 2003 and 2005.
The 297 life recovery score transitions over three time points of 2001, 2003 and 2005 were inputted to a hierarchical cluster analysis (Ward method and square Euclidean distance) and four distinctive pattern clusters were obtained.
The four recovery patterns were 1) + + Type, 2) + Type, 3) – Type, and 4) ––Type (see Figure 14).
Figure 13: Change in life recovery scores in years 2001, 2003, & 2005 (N=297)
80
60
70
40
50
20
30
0
10
Life Recovery Score in 2001 Life Recovery Score in 2003 Life Recovery Score in 2005
Figure 14: Cluster analysis and within-subject (repeated measure) ANOVA results
60 00Life Recovery Patterns
60.00type
typetype
typeP<.05
50.00
Life Rec
40.00
P< .NS
covery Sc 40.00
P<.001 P<.05
core Mean
30.00 P<.01NS
ns
2001 2003 20052001 2003 2005
P<.10
P< 001□
□
□
□
△
△
△
△
▲▲▲
▲

249
1) + + Type pattern, being situated over 1SD above the mean of each time point, indicated a high and an upward within-subject life recovery score transition, i.e., a tendency (p<. 10) to increase from 2001 to 2003 and a further significant increase (p<. 05) from 2003 to 2005. 2) + Type pattern, being situated within 1 SD above the mean of each time point, showed a significant (p<. 001) within-subject drop from 2001 to 2003. There was, however, no significant change in life recovery score means between 2003 and 2005. 3) – Type pattern, being situated within 1 SD below the mean of each time point, showed a significant (p < .001) within-subject upward shift from 2001 to 2003 and then a significant (p < .05) downward shift from 2003 to 2005. 4) ––Type, being situated over 1 SD below the mean of each time point, showed a significant within-subject drop from 2001 to 2003. There was, however, no significant change between years 2003 and 2005 (Kuromiya, & Tatsuki et. al., 2006).
The cluster analysis results suggested that: 1) the ++ Type or those who scored very high on recovery in year 2001 continued and even increased their life recovery scores in the following two time points, 2) that those who scored moderately high (the + Type) or low (the – Type) on recovery maintained their respective scores in years 2003 and 2005, and 3) the –– Type or those who scored very low on recovery in year 2001 remained low in the following two time points.
Kuromiya, and Tatsuki et. al. (2006) summarized the characteristics of the 65 individuals who were categorized as being the ––Type. Demographically, they tended to be males who experienced the earthquake in their 50’s to early 60’s. Physical injuries were commonly experienced by them or their family members. They also tended to report severe damage to household goods. With regard to the seven critical elements, they had more chance of dwelling in public housing units, showing low social ties/low awareness of local urban commons, being highly stressed both physically and mentally, engaging in small businesses, experiencing economic damage to business, and experiencing a decrease in income.
It should be noted that although the –– Type showed a significant decrease in their life recovery scores from year 2001 to 2003, there was no further significant change after 2003, suggesting that a time factor alone cannot explain the 2003-to-2005 within-subject variance and that other factors can be suspected to account for the variance. The Seven Critical Element Model variables were introduced as between-subject factors in the repeated measure ANOVA analyses for the 65 –– Type subjects. Within-subject contrast tests revealed moderate to significant time-by-factor interactions from the year 2003 to
Figure 15: Number of relocations and changes in life recovery scores among “- -” type respondents
Liife Reco ○overy Sc
+
core Meaans
2001 2003 2005N=65
2001 2003 2005

250
2005 in three variables. Those were 1) number of relocations, 2) level of participation in community activities, and 3) community outlook where the respondents were residing.
The effects of relocations upon repeated measure life recovery profiles were shown in Figure 15. The 2001-to-2003 profiles all indicate downward shift among five groups, i.e., those who moved none, once, twice, three times, and four times or more after the earthquake. In comparison, those who moved more than four times scored further and deeper decline from 2003 to 2005 while the other groups remained within the same range or even mildly bounced back in the year 2005. A within-subject contrast test from year 2003 to 2005 suggested a mild time-by-group interaction effect (F4, 60 = 1.981, p= .109). This implied that those who were very transient and therefore considered being the least affiliated with locality were the least resilient ten years after the earthquake.
Secondly, the impact of community activity participation over a repeated measure life recovery score profiles was illustrated in Figure 16. Those who very often or sometimes participated in community activities showed a V-shape bounce-back of life recovery means while those who did not
Figure 16: Participation in community activities & changes in life recovery scores among “- -” type respondents
Life Reccovery SScore MM
eans
2001 2003 2005N=65N 65
Figure 17: Community outlook & changes in life recovery scores among “- -” type respondents
Life R
○R
ecoverry Scoree Means
N=652001 2003 2005
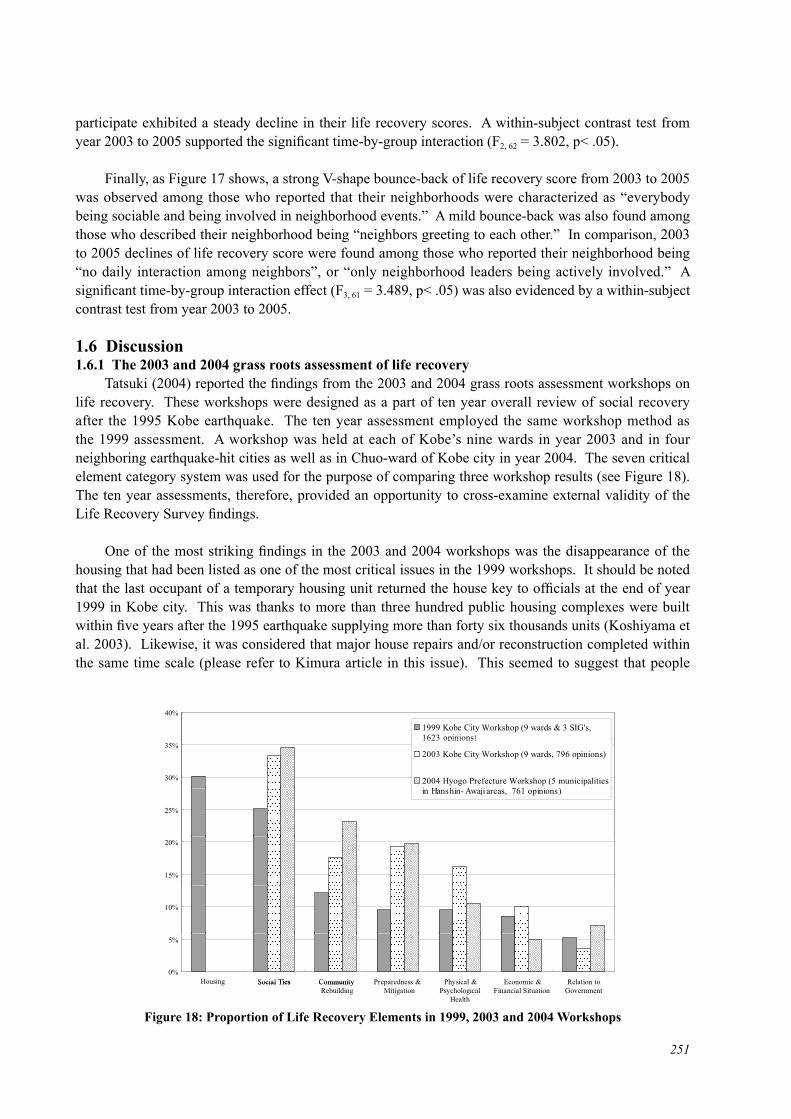
251
participate exhibited a steady decline in their life recovery scores. A within-subject contrast test from year 2003 to 2005 supported the significant time-by-group interaction (F2, 62 = 3.802, p< .05).
Finally, as Figure 17 shows, a strong V-shape bounce-back of life recovery score from 2003 to 2005 was observed among those who reported that their neighborhoods were characterized as “everybody being sociable and being involved in neighborhood events.” A mild bounce-back was also found among those who described their neighborhood being “neighbors greeting to each other.” In comparison, 2003 to 2005 declines of life recovery score were found among those who reported their neighborhood being “no daily interaction among neighbors”, or “only neighborhood leaders being actively involved.” A significant time-by-group interaction effect (F3, 61 = 3.489, p< .05) was also evidenced by a within-subject contrast test from year 2003 to 2005.
1.6 Discussion1.6.1 The 2003 and 2004 grass roots assessment of life recovery Tatsuki (2004) reported the findings from the 2003 and 2004 grass roots assessment workshops on life recovery. These workshops were designed as a part of ten year overall review of social recovery after the 1995 Kobe earthquake. The ten year assessment employed the same workshop method as the 1999 assessment. A workshop was held at each of Kobe’s nine wards in year 2003 and in four neighboring earthquake-hit cities as well as in Chuo-ward of Kobe city in year 2004. The seven critical element category system was used for the purpose of comparing three workshop results (see Figure 18). The ten year assessments, therefore, provided an opportunity to cross-examine external validity of the Life Recovery Survey findings.
One of the most striking findings in the 2003 and 2004 workshops was the disappearance of the housing that had been listed as one of the most critical issues in the 1999 workshops. It should be noted that the last occupant of a temporary housing unit returned the house key to officials at the end of year 1999 in Kobe city. This was thanks to more than three hundred public housing complexes were built within five years after the 1995 earthquake supplying more than forty six thousands units (Koshiyama et al. 2003). Likewise, it was considered that major house repairs and/or reconstruction completed within the same time scale (please refer to Kimura article in this issue). This seemed to suggest that people
Figure 18: Proportion of Life Recovery Elements in 1999, 2003 and 2004 Workshops
40%
1999 Kobe City Workshop (9 wards & 3 SIG's,1623 opinions)
30%
35%1623 opinions)
2003 Kobe City Workshop (9 wards, 796 opinions)
2004 Hyogo Prefecture Workshop (5 municipalitiesi H hi A ji 761 i i
25%
in Hanshin- Awaji areas, 761 opinions)
15%
20%
10%
0%
5%
Social Ties Community Preparedness & Physical & Economic & Relation toHousing Social Ties CommunityRebuilding
Mitigation
Psychological
Health
Financial Situation
Government

252
were just about to finish dealings with house related damages when the 1999 grass roots assessment was conducted and that housing was felt being one of the timeliest and therefore the most talked-about critical elements for life recovery among the workshop participants at that time.
Social ties, the second most talked-about critical element for life recovery in the 1999 workshops still remained as being the top priority at both 2003 and 2004 assessment workshops. Further more, a rise in proportions of opinions from the 1999 workshops were observed not only in social ties but also in the next two critical elements, community rebuilding and preparedness. This suggested that far more emphases were placed on those life recovery elements almost ten years after the Kobe earthquake. A rise was also observed for the physical and psychological health at the 2003 assessment held in Kobe, the hardest hit city by the 1995 earthquake. This rise was mainly due to an increase in opinions for its subcategory “struggle for meaning” (see Figure 4 for subcategories within each critical element). Examples in this subcategory included “The earthquake changed my view of life”, “My values changed”, “I feel a sense of obligation to keep memories alive and to share them with new generations of people.”
The life recovery process and outcome model (e.g., Figure 11) as was examined in the 2003 and 2005 Hyogo Life Recovery Studies can explain the rise in opinions in such categories as social ties, community rebuilding, preparedness, and physical and psychological health. A process of event evaluation continued being active among the 2003 and 2004 workshop participants. Event evaluation consisted of such variables as struggle for meaning and a sense of life change toward a positive direction. This process was facilitated by empowered social ties and community rebuilding efforts and led to a sense of life recovery as well as to more civic engagement in preparedness.
The disappearance of housing can be explained also by the same model. A process of event impact was at its peak during the 1999 workshops. This was mainly due to high satisfaction with housing, leading to a sense of life recovery during this time. Toward an end of a decade after the earthquake, however, repaired or reconstructed homes became a part of normal everyday life, and thus housing was no longer associated with life recovery. It should be noted, however, that proportionately almost the same number of opinions were found in economic and financial situation as a critical element for life recovery particularly among Kobe city residents. This may suggest the importance of household and local economy improvement in further alleviation of the impact caused by the 1995 earthquake.
1.6.2 Policy implications for long-term life recovery from urban mega disasters The current chapter aimed to examine what constituted “life recovery”, what facilitated it and how on a long-term basis. The study resulted in a grass roots-assessment-based working model (the seven critical element model of life recovery), which was then tested, validated and further refined by a series of empirical studies. The life recovery process and outcome model, the final product of these research endeavors, provided a framework for life recovery assistance programs and policies for future urban mega-disaster victims/survivors.
At an earlier course of life recovery (i.e., within five years), housing, income as well as physical and psychological health management issues should be addressed in order to alleviate the event impact. This leads to a sense of normalcy and stability in everyday life. Policies and programs geared toward this objective include provisions of many different types of temporal and permanent housing units, grants and low interest loans, and other housing related programs, monetary compensations and grants for livelihood assistance, public health care services including stress management programs.
Apart from damage alleviation, another and possibly longer-term life recovery process, event evaluation, was identified. This process was found directly facilitated by social ties by which disaster
253
experiences were reframed into complete, coherent and meaningful narratives. Social ties also exerted indirect influences on event evaluation through empowering community rebuilding efforts and/or through enriching opportunities to encounter significant others who assisted re-socialization to and reconstruction of the post-earthquake realities. The policies and programs toward event evaluation, therefore, should include family and community enrichment/empowerment activities as well as those to commemorate and transcend the experiences to the next generations.
In addition to life recovery, the above community empowerment process was found also to produce a norm of government-community-private partnership and civic engagement in arenas like preparedness and local governance. Although life recovery outcomes had a negative effect on levels of civic activities over time, the newly emerged norm of civic engagement stayed even ten years after the earthquake. A concept of civil society became a reality as a by-product of social recovery. Policy makers and administrators, therefore, need to consider this window of opportunity as an asset for creation of a better and just post-recovery society.
References[1] D. Alesch, “A quantitative and qualitative analysis of small organization survival and recovery following
a natural hazard event.” A session summary (recorded by C. L. Reiss), the 2001 Hazards Research and Applications Workshop, http://www.colorado.edu/hazards/ss/ss01/s35.html, 2001.
[2] D. Alesch and J.N. Holly, Long-term Community Disaster Recovery: Managing in the Aftermath, VA:Public Entity Risk Institute, in press
[3] D. Alesch, J.N. Holly, E. Mittler, and Nagy, R. “When small businesses and not-for-profit organizations collide with natural disasters,” Paper presented at the 26th Annual Hazard Research and Applications Workshop, Boulder, Colorado, July, 2001.
[4] F. Aono, S. Tanaka, H. Hayashi, K. Shigekawa, and M. Miyano, “A Study of Disaster Victims’ Response Behavior during the Hanshin-Awaji Great Earthquake: A Nishinomiya City Case Study, ” (In Japanese) Proceedings of the 8th Annual Conference of the Institute of Social Safety Science, pp. 36-39, 1998.
[5] N.B. Belloc and J. Breslow, “Relationship of physical health status and health practices.” Internal Prev. Med, 1, pp. 409-421, 1972.
[6] P. L. Berger and T. Luckman, The Social Construction of Reality: A Treatise in the Sociology of Knowledge. NY: Doubleday, 1966.
[7] D. Burchell, "The Attributes of Citizens: Virtue, Manners and the Activity of Citizenship", Economy and Society, 24-4, pp. 540-558, 1995.
[8] J.M. Dahlhamer and K.J. Tierney, “Winners and Losers: Predicting Business Disaster Recovery Outcomes Following the Northridge Earthquake,” Disaster Research Center, University of Delaware, Newark, N.J., 1996.
[9] V. E. Frankl, Man's Search for Meaning. NY: Pocket Books, 1959.[10] H. Hayashi, M. Nishio, K. Sugawara, I. Monma, M. Kohno, T. Makishima, K. Numata, and Y. Nemoto,
Research Report on Mental Health Responses that are Needed for Life Support of Elderly Victims after a Large Scale Disaster. (In Japanese). Tokyo: Japan Red Cross, 1996.
[11] Y. Karatani, H. Hayashi, and Y. Kawata, “Development of Socioeconomic Rehabilitation Index based on Kobe Statistics for the Great-Hanshin-Awaji Earthquake Disaster” (in Japanese) Journal of Institute of Social Safety Science, 2, pp. 213-222, 2000.
[12] Y. Kawata, Urban Mega-Disaster, (in Japanese) Nagoya:Kin-Mirai-Sha, 1995.[13] R. Kimura, H. Hayashi, S. Tatsuki, and K. Tamura, “Determinants and Timing of Housing Reconstruction
Decisions by the Victims of the 1995 Hanshin-Awaji Earthquake Disaster: A 2001 Replication.” (In Japanese) Journal of Institute of Social Safety Science, 3, pp. 23-32, 2001.
[14] G. Kline, “Democracy, Community, and Human Development”, Journal of Third World Studies, 11-1, pp. 224-244, 1994.
[15] Kobe City Research Committee on Disaster Recovery, Kobe City’s Review for Individual Recovery, Kobe City, 2000.
254
[16] K.Koshiyama, S.Tatsuki,I.Kobayashi,Y.Murosaki,et. al.:Analysis of Sense of Recovery of Residents Living in Disaster Recovery Public Housing, Journal of Institute of Social Safety Science, 3, pp.237-244, 2003.
[17] E. Kubler-Ross, On Death and Dying. NY:Simon & Schuster/Touchstone, 1969.[18]A. Kuromiya, S. Tatsuki, H. Hayashi, T. Noda, K. Tamura, & R. Kimura. Four Recovery Patterns from the
Hanshin-Awaji Earthquake: Using the 2001, 2003, & 2005 Panel Data, Journal of the Institute of Social Safety Science, 8, pp.405-414, 2006,.
[19] R.J. Lifton, Death in Life: The Survivors of Hiroshima, NY: Random House, 1967.[20] R.M. MacIver, Community - A Sociological Study, 3rd Edition, London:Macmillan, 1924.[21] N. Maki, H. Hayashi, S. Tatsuki, and M. Takashima, Structure of Recovery Processes from the 1995 Kobe
Earthquake: A summary of findings from the 5th year review by Kobe city government, Proceedings of International Workshop on Annual Commemoration of Chi-Chi Earthquake, Volume IV Social Aspect, pp. 210-221, 2000.
[22] G.H. Mead, Mind, Self and Society from the Standpoint of a Social Behaviorist (Works of George Herbert Mead) Il:Univ of Chicago Press, 1963.
[23] S. Nishisato, Analysis of categorical data: Dual scaling and its Applica tions. Toronto: University of Toronto Press, 1980..
[24] T. Oguchi, (Ed.) A Study on International Questionnaire Scales MMPI-2 and MMPI-A. KN Publisher, 2001.[25] M. Okamoto, “Civil society, volunteers, and government.” (In Japanese) In S. Tatsuki (Ed.) Volunteerism and
Civil Society. Kyoto:Koyo Shobo, 1997.[26] D. H.Olson, D. H. Sprenkle, and C.S. Russell, “Circumplex Model of Marital and Family Systems: Cohesion
and Adaptability Dimensions, Family Types, and Clinical Applications,” Family Process, 18, pp. 3-28, 1979.[27] J.J.Rousseau, The Social Contract or Principles of Political Right, (G. D. H. Cole, Trans.) http://www.
constitution.org/jjr/socon.htm, 1913/1762.[28] K. Shigekawa and H. Hayashi, “A study of disaster process as viewed from disaster responders’ perspectives:
The Kobe earthquake case study.” (In Japanese) Proceedings of the 7th Annual Conference of the Institute of Social Safety Science, 370-375, 1997.
[29] M. Takashima and H. Hayashi, “Spacio-Temporal Patterns of Recovery Process under Large Earthquake Disaseter: A Case Study for Hanshin-Awaji Earthquake.” (In Japanese) Journal of Institute of Social Safety Science, 1, pp.1-8, 1999.
[30] A. Tamura, Practice of Community Development, (In Japanese) Iwanami-shinsho, 1999. [31] K. Tamura, H. Hayashi, S. Tatsuki, and R. Kimura, “A quantitative verification of the seven elements model
of socio-economic recovery from the Kobe earthquake.” (In Japanese) Journal of Institute of Social Safety Science, 3, pp. 33-40, 2001.
[32] S. Tanaka, H. Hayashi, and K. Shigekawa, “A Consideration on Time-series Development of Disaster Process Based on Ethnographic Study of Disaster Victims’ Responses” (In Japanese) Journal of Japan Society for Natural Disaster Science, 18-1, pp. 21-29, 1999.
[33] S. Tanaka, F. Aono, and H. Hayashi, “Disaster victims behavior analysis after the Hanshin-Awaji earthquake disaster.” the Proceedings of the 3rd China-Japan-US Trilateral Symposium on Lifeline Earthquake Engineering, pp. 309-314, 1998.
[34] S. Tatsuki, "The Current Status of Self-governance and Solidarity in Kobe" (In Japanese) Urban Policy, 116, pp. 88-105, 2004.
[35] S. Tatsuki, Theoretical and empirical study of family system: Validation of Olson's Circumplex model of marital and family systems, (In Japanese) Tokyo: Kawashima Shoten, 1999.
[36] S. Tatsuki, H. Hayashi, K. Yamori, T. Noda, K. Tamura, and Reo Kimura, "Model Building and Testing of Long-Term Life Recovery Processes of the Survivors of the 1995 Kobe earthquake: Structural Equation Modeling (SEM) of the 2003 Hyogo Prefecture Life Recovery Survey", (In Japanese) Journal of Institute of Social Safety Science, 6, pp.251-260, 2004.
[37] S. Tatsuki and H. Hayashi, “Seven Critical Element Model of Life Recovery: General Linear Model Analyses of the 2001 Kobe Panel Survey Data.” Proceedings of the 2nd Workshop for “Comparative Study on Urban Earthquake Disaster Management”, pp. 27-46, 2002.
[38] S. Tatsuki and H. Hayashi, "Comprehensive Assessment of Life Recovery Utilizing the Total Quality Control Method: Grassroots assessment and Construction of Bird's Eye View of Lire Recovery", (In Japanese) Urban

255
Policy, 104, pp.123-141, 2001.[39] S. Tatsuki and H. Hayashi, “Family system adjustment and adaptive reconstruction of social reality among the
1995 earthquake survivors,” International Journal of Japanese Sociology, 9, pp. 81-110, 2000.[40] G.Webb, K. Tierney, and J. Dahlhamer, "Businesses and Disasters: Empirical Patterns and Unanswered
Questions." Natural Hazards Review, 1, pp. 83-90, 2000.[41] D. Wenger, C. B. Rubin, J. Nigg, P. Berke, and T. Bolton, “S96-4 What is Known and Trends for Improving
Recovery and Reconstruction Following Disasters” A session Summary (recorded by C. Streeter), the 1996 Hazards Research and Applications Workshop http://www.colorado.edu/hazards/ss/ss96.html#4, 1996.
[42] T. Yamagishi, Structure of Trust, ( In Japanese) Tokyo:University of Tokyo Press, 1998.
2 Concrete Measures
2.1 Measures to Support Life Recovery2.1.1 Condition of the Victims The trajectory of life recovery for the victims of the Kobe Earthquake can be divided into three phases.
2.1.1.1 The Chaotic Period This period lasted one year and three months from the time immediately after the earthquake to the time when most victims had moved to temporary housing units from evacuation shelters.
At the peak time during this period, 236,899 people moved to temporary housing units or some other locations, and the shelters were closed on August 20, 1995. Eventually, approximately 30,000 households started living in temporary housing units.
2.1.1.2 The Life-Supporting Period This period was a transitional period for the people moving from temporary housing to permanent housing. The main focus during this period was to support the life of the people living in temporary housing and to facilitate their life transition from temporary housing to permanent housing.
Figure 1. Trajectory of Life Recovery
Phase 1(ChaoticPeriod)
Phase 2(Life-Supporting
Period)
Phase 3(Independence-Supporting
Period)
January17, 1995
November1999
April1996
April1998
236,899 personsAt the peak (Jan. 24)
Number ofevacuees
No. of householdsin temporaryhousing units
Appx. 30,000 households
December 20, 1999
0 households
36,775
No. of disaster reconstructivehousing units available
No. of householdsin temporary housing units
7,511households
8,140 persons
August 20, 1995

256
2.1.1.3 The Independence-Supporting Period While the transition from temporary housing to permanent housing was ongoing, the main focus during this period was to support the people’s independent living in their new permanent houses. Measures to build communities and to watch over vulnerable residents with caring eyes were made. On December 20, 1999, the temporary housing units were closed after the last resident moved out.
2.1.2 Direction to Life Recovery
2.1.2.1 Establishment of Life Recovery Headquarters Right after the earthquake, Kobe’s Disaster Countermeasures Office was activated for disaster relief and recovery, and each bureau and division worked on its relevant task. It was the Public Welfare Bureau that served as the contact point for disaster relief-related matters.
In April 1995, an ad hoc project organization called the Disaster Relief Division was formed within the Public Welfare Bureau to support the afflicted citizens in terms of shelter, emergency temporary housing, and financial compensation.
In April 1996, the Life Recovery Headquarters was formed, independent of the Public Welfare Bureau, and took over the tasks previously carried out by Disaster Relief Division.
The purpose of this new organization was comprehensive support and coordination of life recovery for the victims. There were two reasons behind this. Firstly, most people had already moved to temporary housing units from shelters, and it became necessary to watch over them, in particular vulnerable people, while living in temporary housing and to start supporting their preparation for moving to permanent housing. Secondly, as Kobe’s roles and responsibility for citizens’ life recovery were not clear within its organizational structure, it was decided to establish an independent organization to coordinate various measures throughout the city with well-defined responsibilities.
This organization was initiated with 50 city officials under the direction of a Director-General. Also, other city officials were assigned to each ward as life recovery staff in order to directly support the citizens living in temporary housing in cooperation with Public Welfare Department and Public Health Department of each ward.
Figure 2. Establishment of Life Recovery Headquarters
Mayor
Deputy Mayor
Public Welfare Bureau
Life Recovery Headquarters
Disaster Relief Division
Disaster Restoration and Coordination Bureau
•Evacuation Shelters•Emergency Temporary Housing•Financial Compensation
Ad Hoc Project Organization (staff belonged to this team while working for another bureau)
April 1, 1996
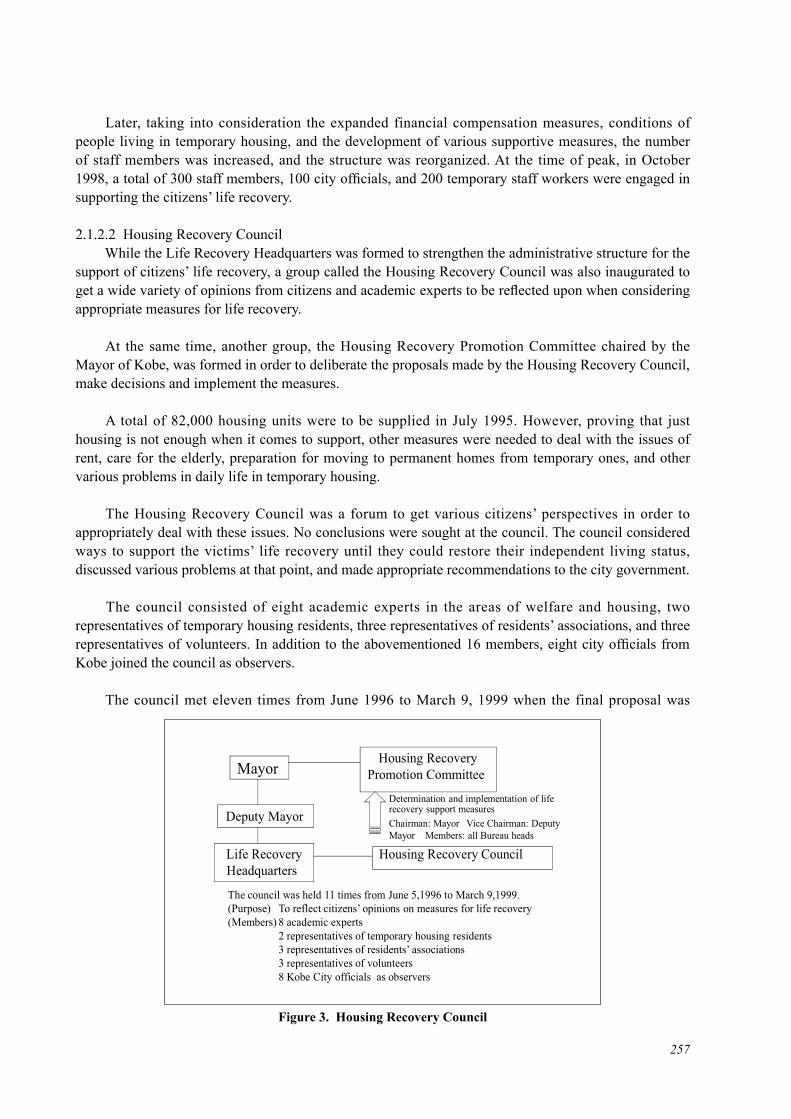
257
Later, taking into consideration the expanded financial compensation measures, conditions of people living in temporary housing, and the development of various supportive measures, the number of staff members was increased, and the structure was reorganized. At the time of peak, in October 1998, a total of 300 staff members, 100 city officials, and 200 temporary staff workers were engaged in supporting the citizens’ life recovery.
2.1.2.2 Housing Recovery Council While the Life Recovery Headquarters was formed to strengthen the administrative structure for the support of citizens’ life recovery, a group called the Housing Recovery Council was also inaugurated to get a wide variety of opinions from citizens and academic experts to be reflected upon when considering appropriate measures for life recovery.
At the same time, another group, the Housing Recovery Promotion Committee chaired by the Mayor of Kobe, was formed in order to deliberate the proposals made by the Housing Recovery Council, make decisions and implement the measures.
A total of 82,000 housing units were to be supplied in July 1995. However, proving that just housing is not enough when it comes to support, other measures were needed to deal with the issues of rent, care for the elderly, preparation for moving to permanent homes from temporary ones, and other various problems in daily life in temporary housing.
The Housing Recovery Council was a forum to get various citizens’ perspectives in order to appropriately deal with these issues. No conclusions were sought at the council. The council considered ways to support the victims’ life recovery until they could restore their independent living status, discussed various problems at that point, and made appropriate recommendations to the city government.
The council consisted of eight academic experts in the areas of welfare and housing, two representatives of temporary housing residents, three representatives of residents’ associations, and three representatives of volunteers. In addition to the abovementioned 16 members, eight city officials from Kobe joined the council as observers.
The council met eleven times from June 1996 to March 9, 1999 when the final proposal was
Figure 3. Housing Recovery Council
Mayor
Deputy Mayor
Life Recovery Headquarters
Housing Recovery Council
Housing Recovery Promotion Committee
Chairman: Mayor Vice Chairman: Deputy Mayor Members: all Bureau heads
Determination and implementation of life recovery support measures
Held 11 meetings between June 5, 1996 and March 9, 1999
The council was held 11 times from June 5,1996 to March 9,1999.(Purpose) To reflect citizens’ opinions on measures for life recovery(Members) 8 academic experts
2 representatives of temporary housing residents3 representatives of residents’ associations3 representatives of volunteers8 Kobe City officials as observers
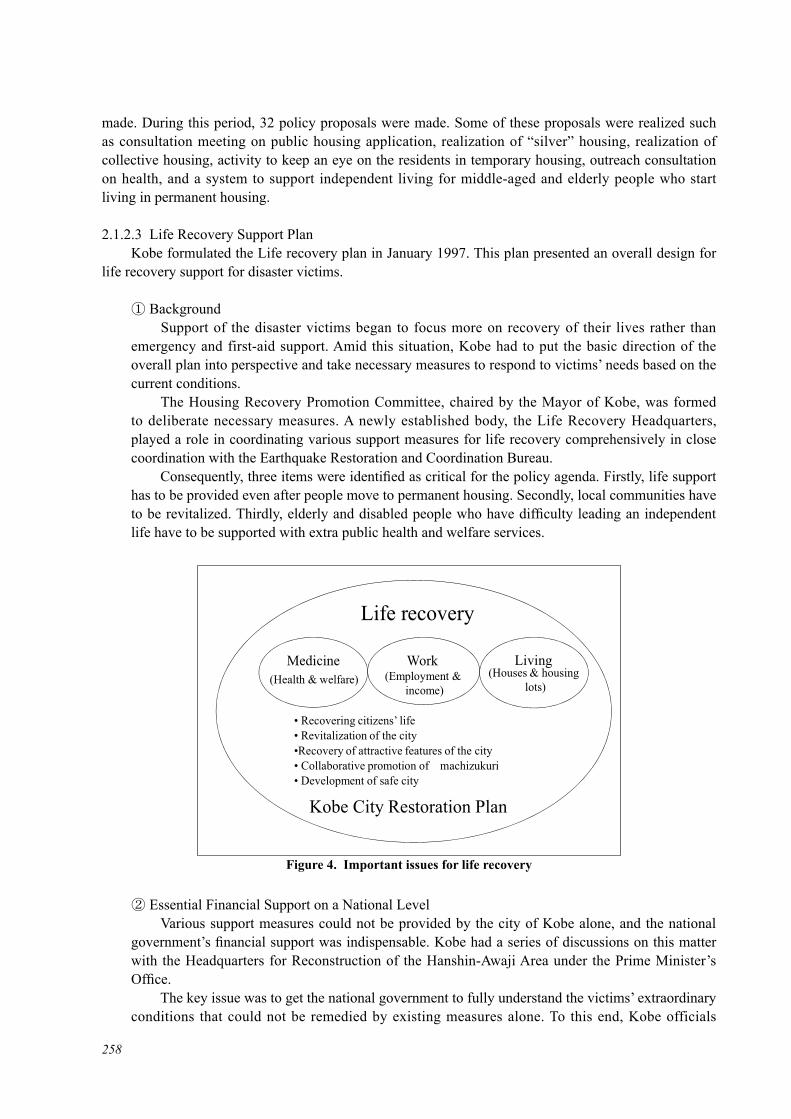
258
made. During this period, 32 policy proposals were made. Some of these proposals were realized such as consultation meeting on public housing application, realization of “silver” housing, realization of collective housing, activity to keep an eye on the residents in temporary housing, outreach consultation on health, and a system to support independent living for middle-aged and elderly people who start living in permanent housing.
2.1.2.3 Life Recovery Support Plan Kobe formulated the Life recovery plan in January 1997. This plan presented an overall design for life recovery support for disaster victims.
① Background Support of the disaster victims began to focus more on recovery of their lives rather than emergency and first-aid support. Amid this situation, Kobe had to put the basic direction of the overall plan into perspective and take necessary measures to respond to victims’ needs based on the current conditions. The Housing Recovery Promotion Committee, chaired by the Mayor of Kobe, was formed to deliberate necessary measures. A newly established body, the Life Recovery Headquarters, played a role in coordinating various support measures for life recovery comprehensively in close coordination with the Earthquake Restoration and Coordination Bureau. Consequently, three items were identified as critical for the policy agenda. Firstly, life support has to be provided even after people move to permanent housing. Secondly, local communities have to be revitalized. Thirdly, elderly and disabled people who have difficulty leading an independent life have to be supported with extra public health and welfare services.
② Essential Financial Support on a National Level Various support measures could not be provided by the city of Kobe alone, and the national government’s financial support was indispensable. Kobe had a series of discussions on this matter with the Headquarters for Reconstruction of the Hanshin-Awaji Area under the Prime Minister’s Office. The key issue was to get the national government to fully understand the victims’ extraordinary conditions that could not be remedied by existing measures alone. To this end, Kobe officials
Figure 4. Important issues for life recovery
Medicine Work Living(Health & welfare) (Employment &
income) (Houses & housing
lots)
Life recovery
Kobe City Restoration Plan
• Recovering citizens’ life• Revitalization of the city•Recovery of attractive features of the city• Collaborative promotion of machizukuri• Development of safe city

259
explained the victims’ actual living conditions utilizing voices directly from the field. Kobe and the national government considered what could be done by expanding existing measures both quantitatively and qualitatively and what should be done by means of new measures. Kobe’s efforts paid off, and it seemed likely that most measures would receive support from the national government.③ Formulation Process for the Life Recovery Support Plan After consultation with the national government was completed around the end of December 1996, the final draft of the Life Recovery Support Plan was drawn up. Immediately after the draft was approved by the Housing Recovery Promotion Committee on January 8, 1997, the Mayor of Kobe presented the support plan to the relevant national government agency and made a request for financial support. Upon this request, the national government decided to provide support on January 16, 1997.
2.1.2.4 Basic Concept of the Life Support Plan The Life Support Plan succeeded the previously formulated Housing Recovery Plan, which mainly focused on hardware-oriented measures such as measures to reduce rent. However, the new plan paid more attention to the victims’ wellbeing and expanded services of public health and welfare as well as community development and employment issues, with the overall design aimed at people’s life recovery.
2.1.2.5 Outline of Life Recovery Support Plan In the transitional period from temporary housing to permanent housing, the Life Recovery Support Plan was implemented with a focus on five major areas: local community development, health promotion, support for a secure life for the elderly, youth programs, and support for meaningful work and life.
This plan includes some new and experimental measures such as one to cope with the aging society that became apparent due to the earthquake and life recovery financial aid for the elderly, a measure that was said to be a step further to more individual compensation.
When it comes to employment, as the city’s project to support for engagement in rewarding work was not sufficient, a new measure was realized as a fund-supported project in cooperation with prefectural government’s labor administrative agency and other organizations.
2.1.2.6 Budget Preparation and Distribution of Guidebooks Based upon the Life Recovery Support Plan, in fiscal 1997, 85.2 billion yen was budgeted to implement measures related to the Life Recovery Support Plan. If expenses for other related projects were included, a total of 200.5 billion yen was allocated in order to comprehensively promote a wide variety of support measures. Kobe was strongly committed to implementing the Life Recovery Support Plan as a top priority.
Figure 5. Basic Concept of the Life Support Plan
Life Recovery Support Plan
Medicine (health & welfare)
A part of Work (support for engagement in rewarding work)
A part of Living(community development)

260
In the following three years, from fiscal 1997 through fiscal 1999, a total of 554.3 billion yen was earmarked for 545 projects.
A booklet entitled “Life Genki Up (cheer up) Guide” was prepared, and copies were distributed to all households in temporary housing, and they were also given away for free at ward offices and other places. This booklet explains all the support measures in clearly understandable terms, helping citizens to fully understand the life recovery support measures.
2.1.3 Reconstruction Fund2.1.3.1 Utilization of the Fund System The projects to support the recovery of the earthquake victims’ lives required a large amount of funding. As of January 3, 2000, 179.2 billion yen in donations was received. Although this was a huge amount in total, the amount per victim was not enough to support life recovery as the number of victims was enormous.
The conventional system, which is a subsidy system, does not permit individual compensation as it has no fair or public nature. Some unique mechanisms had to be devised to promote Kobe’s own measures by filling the gap between the existing legislative structure and the financial system. The idea was to utilize a fund system.
In April 1995, the Kobe Earthquake Reconstruction Fund was established. The total capital for this foundation was 20 billion yen with an investment ratio of two to one between Hyogo Prefecture and the city of Kobe.
2.1.3.2 Operational Mechanism for the Reconstruction Fund The scheme for the reconstruction fund is shown in the diagram above. The total scale of the fund was 900 billion yen.
Hyogo Prefecture and the city of Kobe borrowed 880 billion yen from financial institutions. This borrowed amount was loaned interest-free to the foundation. The foundation then put this amount together with 20 billion yen from a basic fund, and a total of 900 billion yen was deposited to financial institutions for fund management. Interest income from the fund totaled 358.9 billion yen over 10 years, and this income was utilized to implement support projects. Hyogo Prefecture and Kobe paid 342 billion yen to the financial institutions as interest on the 880 billion yen. In order to alleviate the financial
Figure 6. Operational Mechanism of Reconstruction Fund
Reconstruction fund (900 billion yen)
Financial institutions
Hyogo Prefecture/ Kobe City
1. Fund loan
2. Loan(interest-free)
3. Fund manage-ment
4. Interest income
Projects supported by the fund (358.9 billion yen)
National government
6. Tax allocations
5. Payment of interest

261
burden of interest payments covered by Hyogo Prefecture and Kobe, the national government provided 259.35 billion yen as local allocation tax grants.
2.1.4 Life Recovery Projects2.1.4.1 Support for Residents in Temporary Housing
① Dispatch of life support advisors In August, 1996, 45 life support advisors were assigned, and later in October, 1997, the number increased to 97. Major tasks of life support advisors are: 1.Providing information, consultation and support about permanent housing, and 2. Providing information and liaison and coordination with related agencies for life recovery support. Life support advisors played a role of helping the residents living in temporary housing to secure permanent housing, reflecting the residents’ needs on the measures, providing care for the persons who required support, and providing appropriate management of temporary housing.② Development of a Program for Watching over Residents Activities to watch over the residents in temporary housing started with friendly visits by welfare commissioners, Child Committee members, and Friendly Visit group members. In August 1995, Fureai (friendship) Promoters were allocated, and Fureai Centers was set up so that residents themselves could start to be more attentive to each other. On the city government side, case workers at each ward’s Public Welfare Department and Public Health Department, public nurses, and mental health and welfare counselors provided care to the residents from their own professional perspectives. A Liaison Conference for Life Recovery Support was formed in each ward, and necessary measures were discussed at meetings and were put into action while exchanging information. The eyes of the community and those of the city government worked together, and volunteers were also added to the program. This is how the system took hold.③ Door-to-Door Health Survey After residents had lived in temporary housing for more than one year, there was a growing concern about their mental and physical health wellbeing. Accordingly, representatives of the city of Kobe visited the all residents (49,033 people in total) to conduct a survey on their health conditions from November through December 1996. The survey items were residents’ health condition, their hospital/clinic visits and health checkups, and their livelihood and work conditions. Based on the survey result, public nurses visited individuals who answered that their health condition was very poor to get a better understanding of their actual conditions and provide the necessary care.④ Project on Mental Healthcare Center In order to prevent earthquake victims from developing PTSD (Post-Traumatic Stress Disorder), to offer information, and to provide psychological care, mental healthcare centers were opened at ten locations for five years from fiscal 1995 through fiscal 1999. The center’s activities included consultation, providing opportunities to meet other people, psychological care (consultation) for volunteers, and peer counseling for alcohol dependency.⑤ Support Projects on Exercise for Health Promotion Members of the Physical Education Committee and sports counselors from Kobe worked together with staff members of public health centers to hold programs at Fureai centers. ⑥ Rewarding Work Creation Projects Projects were organized to help the earthquake victims find their lives worth living by regaining their independent living status. Through the projects, the victims could supplement their income with a side job, and those elderly people who lost their connection with their local community could become a part of the community by making products, utilizing their knowledge

262
and skills in areas such as handicrafts and carpentry, and could also receive a small income.
2.1.4.2 Support for Relocation to Permanent Housing① Establishment of Relocation Promotion Center (April 1998) In April 1998, the office of Life Recovery Headquarters was relocated, and in the same space the Kobe City Relocation Promotion Center was opened in order to promote transition from temporary housing to permanent housing. As of April 1998, there were 15,895 households still living in temporary housing, and about 5,000 of these households has not decided where to go after temporary housing.② Relocation support from Temporary to Permanent Housing・Provision of Public Housing and Rent Reduction Measures According to the survey of temporary housing residents in February 1996, 74% of all households, 42% of elderly households, and about 70% of the households with an annual income of less than three million yen wished to live in public housing. To respond the needs of these people, two additional measured were taken. The number of public housing units for low-income households was increased, and the reduction of rent in public housing complexes and other housing facilities was further pursued.・Rent Reduction for Private-Sector Leased Housing In October 1996, the Rent Reduction Project for Private-Sector Leased Housing was initiated utilizing the reconstruction support fund. This project aimed to facilitate the life recovery of earthquake victims by reducing the initial financial burden of house rent. Later on, this system was revised and financial aid up to 1.62 million yen was provided up to fiscal 2001.・Support System for Those Waiting for Relocation to Public Housing The Hyogo Prefectural Housing Corporation leased private-sector housing to temporarily provide homes for those waiting for the completion of public housing construction (the latest completion was in May 2000) with the hope that they could settle in as quickly as possible. A rent subsidy of up to 70,000 yen per month was provided for a period of up to two years.・Support System for People Awaiting Completion of Their Own Houses This system aimed to subsidize a fixed amount of rent for private-sector housing where people lived temporarily while waiting for completion of the reconstruction of their own houses. The amount of the subsidy was up to 30,000 yen per month, with an additional 50,000 yen to help cover moving expenses. The subsidy was available for three years at longest.・Consultation Meetings for Those Wanting to Apply for Public Housing Consultation meetings for those wanting to apply for public housing were held at each temporary housing quarter. City officials answered questions related to the application for public housing and instructed people how to fill out the application forms. City officials and life support advisors visited individual households for interview and consultation. In order to encourage them to apply for public housing complexes in suburban areas, chartered bus tours were organized to show participants the available housing and the surrounding area including convenience facilities.・Consultation Office for Housing Reconstruction As housing construction was delayed in the western area, a consultation office for housing reconstruction was opened in Nagata Ward to give advice and dispatch housing reconstruction helpers.・Volunteers to Help with Relocation In order to support the elderly living alone, disabled persons, and others who had difficulties in moving from temporary housing to permanent housing on their own, volunteer groups and private businesses cooperated with each other to form the Relocation Project Network for Citizens in April 1997. This organization was engaged in volunteer activities to support relocation in cooperation with volunteer centers in each ward.

263
2.1.4.3 Life Support after Relocation to Permanent Housing① Establishment of Life Support Project Teams at Permanent Housing As all households were new comers, community development had to be initiated from the scratch. Many of the new residents were elderly, and it was necessary to keep watch over them. In July 1997, in order to enhance life support measures after the earthquake victims’ relocation to the permanent housing, a Life Support Project Team for Permanent Housing was established in each ward. These project teams promoted life support projects and also cooperated aggressively with a group called Genki up (cheer up) Kobe, which promoted a grassroots campaign to welcome people to Kobe.② Allocation of Advisors・Life Recovery Advisors (from January 1997) Life recovery advisors visited people who had moved into permanent housing to explain how to use equipment at the housing unit, and they kept in close contact with the residents.・Advisors for the Elderly/Disabled (from May 1997) Residents who were eligible to receive support from advisors were disabled person and persons 65 years of age or older. The advisors visited them at their homes, and staff members of social welfare facilities were dispatched to them for about two years after they started living in permanent housing.・Life Support Advisors Life Support Advisors were dispatched from social welfare facilities to residents of silver housing. They visited each household, and their major activities were the confirmation of residents’ safety, life-related consultations, responses in emergencies, and community development.・Health Advisors (from October 1997) Aiming at health maintenance and health promotion for the earthquake victims who started their lives in a new environment, health advisors paid a visit to the residents in cooperation with public health nurses in each ward.③ Support Projects after Relocation・Promotion of Activities to Watch Over Residents Activities to watch over residents had been carried out in the past by local welfare commissioners, Child Committee members, and Friendly Visit groups. Their activities were enhanced even further.・Outreach Consultation on Health by Public Health Nurses Public health nurses visited all households for health consultations. They made regular visits to those persons newly identified as requiring health guidance as well as those persons that had received health guidance while residing in temporary housing. The number of persons who received guidance on a regular basis was 3,773 at the end of October 1999.・Community Regeneration Community welfare coordinators were allocated to each district to promote a wide variety of activities to support community development in cooperation with various advisors and local organizations.・Mutual Support Network on a Small-Community Level A Community Mutual Support Conference was held in each district, and roles were defined, information was shared, and activities were coordinated among those engaged in this effort. In addition, in each housing complex, persons involved in supportive activities exchanged information about life support by holding liaison meetings.
2.1.4.4 Life Support① Assistance Grant for Life Recovery The biggest issue for life recovery support for disaster victims was the one related to their lives

264
and living expenses. After they moved into permanent housing, it was essential for them to receive support for living expenses for the near term in order to get back their independent living status. Their demands for cash benefits also increased. The national government had a policy of not providing individual compensation. However, Kobe negotiated with the national government, and a system for assistance grants for life recovery was finally realized by increasing the recovery support fund by 300 billion yen in December 1996.② Expansion of the Assistance Grant System・Life Recovery Grant for the Elderly (from April 1997) This was targeted for the people who needed support such as 65-year old or older people with low income and disabled people who moved into the permanent housing. The amount was 20,000 yen per month per household (In case of single-person household, it was 15,000 yen). Support period was for five years.・Permanent Housing Grant Assistance for Middle-Aged and Elderly Persons (from December
1997) The system was expanded further, and it started to be applied to middle-aged and elderly people who had a heavy financial burden from the earthquake and expenses that had to be covered for relocation to permanent housing. It was applied to persons 45 years or age or older with a total annual income of 5.07 million yen or less per household who moved into permanent housing. The amount was 20,000 yen per month per household (in the case of a single-person household, it was 15,000 yen). The support period was for two years.・Assistance Grant for Independent Living (from July 1998) This new system was applied to households who moved into permanent housing. The households eligible for this system were as follows. For those 44 years of age or younger, the total annual household income had to be 3.46 million yen or less. For those 45 years of age or older, it had to be 5.1 million yen or less. For those 60 years of age or older, it had to be 6 million yen or less.
2.1.4.5 “Act on Support for Livelihood Recovery of Disaster Victims” (May 1998) Both Life Recovery Grant for Elderly Households and Permanent Housing Grant Assistance for Middle-Aged and Elderly People were projects under the Support Fund, but they were not sufficient to meet the needs of the earthquake victims. Under these circumstances, a movement to request public support at the time of a disaster took place nationwide. As a result, the “Act on Support for Livelihood Recovery of Disaster Victims” was passed by the Diet in May 1998. The outline for this law is as follows.
The original amount of the assistance grant was 1 million yen, and it could be used only for specific purposes. The law was then revised in 2007, lifting the restriction on how the grant could be used and making available an additional grant between 500,000 yen and 2 million yen.
It was decided that this law was to be applied only to disasters occurring after its enforcement. However, according to the Diet resolution accompanying the enactment of the law, the victims of the Kobe Earthquake were eligible for administrative measures equivalent to this law, and the measure was taken under the scheme of Assistance Grant for Independent Living mentioned above.
The “Act on Support for Livelihood Recovery of Disaster Victims” has been applied to disasters that have occurred since then, and, as of October 2009, a total of 22.8 billion yen has been provided to approximately 17,700 households.

265
2.1.4.6 Termination of Temporary Housing① Program for Termination of Temporary Housing・Program for Transition to Permanent Housing (August 1998) As of the end of June 1998, approximately 11,000 households resided in temporary housing. Kobe set the goal for termination of temporary housing as the end of March 1999 and supported the residents for a smooth transition to permanent housing by classifying them depending on the prospect of their possible relocation.・Program for Termination of Temporary Housing (August 1999) As the number of households still living in temporary housing had reduced to 543 at the end of June 1999, a program for complete termination of temporary housing was initiated in August 1999. The goal of this program was that there would be no households that have no prospect for leaving temporary housing and all residents could leave by the end of December 1999.② Detailed Assistance for Relocation・Relocation Support for Each Type of Resident The residents were grouped into several categories: those who were eligible for public housing and had decided where to go, young residents eligible for public housing, those who were not eligible and had no prospect for relocation, and those who faced difficulty in independent living. The challenge was reviewed for each group, and appropriate and detailed assistance was provided to each group.・Kobe City Support Commission for Independent Living There were 93 households who had difficulties in independent living. Kobe not only took administrative measures but also established a support commission, and at the commission, opinions and suggestions were solicited from various experts and volunteers in order to find possible solutions for relocation. The commission intensively discussed the 20 cases that were found to be the most difficult, and city officials received opinions and suggestions from the commission. In the end, all cases were resolved.③ Complete Termination of Temporary Housing All-out efforts were made for all residents to leave temporary housing by mediating public housing disputes and introducing private-sector rented accommodations. For those who found it very difficult to leave, a clue to solving their problems was sought based on the opinions of the support commission and by reshuffling staff members in charge. Consequently, all the residents were able to have some prospect for relocation by the end of September 1999. When they moved, a total of 100 staff members of the Life Recovery Headquarters were mobilized to help them to move.
Photo 1. Transportation of temporary housing to Taiwan (October 1999)
266
④ Reuse of Temporary Housing Units Overseas In order to utilize temporary housing units effectively after removal from Kobe site, many of them were provided to assist victims of disasters in foreign countries. A total of 12,624 units were shipped to such countries as the People’s Republic of China, Republic of the Philippines, Republic of Indonesia, Republic of Turkey and Republic of Vanuatu.
2.1.4.7 Development of Community Watch-Over Programs① Looking Ahead to the “super-aging” Society・Collective Living for the Elderly The Kobe Earthquake struck city areas with a large elderly population. This was why the average age of the population in temporary housing and disaster reconstructive public housing was higher than in other areas. According to a survey conducted in December 1995, 31.2% of the residents in temporary housing were 65 years of age or older, while an October 1995 survey of the entire city of Kobe showed that only 13.5% of the residents were in this age group. Furthermore, 43.2% of persons living in disaster reconstructive public housing were 65 or older as of the end of December 2001. This number is quite high given that the number was only 16.7% for the entire city in October 2000.・Looking Ahead Watch-over activities for vulnerable people such as the elderly living in temporary housing and disaster reconstructive public housing served as a model for community a mutual watch-over program in the upcoming super-aging society.・Citywide Movement The population aging rate for the entire city of Kobe reached 20% in October 2005, and the super-aging society is just around the corner. Community mutual watch-over programs were originally implemented to support earthquake victims, but this initiative has now evolved into a general measure throughout the city.② City-wide efforts of the community mutual watch-over program・Promotion Staff for Community Mutual Watch-Over Programs The original watch-over programs were implemented at temporary housing and disaster reconstructive public housing facilities as emergency measures, but this developed into a general measure. In addition to the original program conducted by welfare commissioners, Child Committee members, and Friendly Visit groups, promotion staff workers were allocated to Anshin Sukoyaka (anxiety-free and healthy) Center (Comprehensive Community Support Center) from fiscal 2001. In collaboration and cooperation with welfare commissioners, Child Committee members, and Friendly Visit groups, the center has been assisting the program conducted by community people. On top of that, promotion staff members make regular visits to the elderly living mainly in disaster reconstructive public housing to check up on their safety and wellbeing.・Small-Community Watch-Over Liaison Meetings Welfare commissioners, Child Committee members, members of Friendly Visit groups, and officials of related administrative organizations attend liaison meetings at the small-community level to exchange ideas and information, trying to created an even better program.
2.1.5 Important Points for Life Recovery2.1.5.1 Changes in Issues and Conditions over Time Around April 1996, when the second phase was about to begin, approximately 30,000 households were living in temporary housing. In June, 1996, the Housing Recovery Plan was formulated to make a commitment of public housing supply and rent reduction, increasing the earthquake victims’ prospects for housing and providing them with a sense of security. However, the conditions of the victims’ lives could not been made better by merely solving the housing problem. In order for the victims to recover

267
their lives, various long-term measures had to be taken such as restoration of economic infrastructures and community renovation.
The victims’ issues also became more individualized and segmented with the passage of time. The earthquake victims across the board looked to be tired due to their prolonged life as evacuees caused by chaotic situation after the disaster, and their health problems derived from stress and alcohol became serious as did the widening disparity among the victims.
2.1.5.2 Disasters in Large Cities/Request for Generous and Detailed Support What makes life recovery difficult is that many problems tend to be compounded. The problems of the victims could be divided into two groups: those caused directly by the earthquake and underlying problems unique to large cities that became apparent due to the earthquake.
Problems related to temporary housing such as inconveniences in daily life and the long distance from peoples’ original residences, anxiety caused by the collapse of the communities where the victims used to live, discomfort and confusion due to the lack of information, anxiety about the future caused by the loss and reduction of assets, loss and reduction of places to work, and reduction of income due to unemployment and other factors were some of the typical problems caused directly by the earthquake.
At the same time underlying problems also became apparent as the earthquake struck in an area with a large aging population and where many small and medium-sized local businesses were concentrated. As well, the rate of households with elderly people living alone had already been quite high, and many such households had no choice but to live in temporary housing and then public housing, pointing out various problems in the upcoming super-aging society. To make matters worse in an already sluggish economy, underlying structural problems became apparent after the earthquake in areas where small and medium-sized local businesses, such as the hybrid-rubber shoe industry, were concentrated.
The abovementioned factors affected the victims’ lives in a confounding manner. Under these circumstances, generous and detailed support measures for the victims’ overall wellbeing were needed for life recovery.
2.1.5.3 Significance of Recostruction Fund The mechanism of the Reconstruction Fund to create financial resources for support projects successfully served as model to quickly implement support projects with mobility and flexibility by filling the gap between the existing legal structure and the financial system.
2.1.6 Evaluation The following are the critical elements for life recovery and institutional issues of national government. They became evident after the 5th year evaluation, and they should prove useful when considering life recovery following future disasters.
2.1.6.1 Seven Elements for Life Recovery A grassroots workshop was held to commemorate the 5th anniversary of the earthquake in order to review and verify the actual condition of life recovery. Various views were exchanged, and seven elements emerged regarding life recovery from citizens’ perspectives: housing, social ties, community rebuilding, preparedness, physical & mental health, economic & financial situation, and relations to government.
It was taken for granted that housing would be at the top because it is the foundation of people’s

268
lives. What was noticeable, however, is that social ties was the next biggest issue. This suggests how important it is to build community and promote human relationships to support the life recovery of disaster victims.
2.1.6.2 National Disaster Relief Act and the Kobe Earthquake① Benefit in Kind and Cash Vouchers According to the “National Disaster Relief Act,” the main premise for support is to provide first-aid and tentative relief, meaning that only benefit in kind such as food, shelter, and emergency temporary housing could be provided. However, this general rule of only benefit in kind posed many problems when it was applied to such a huge disaster as the Kobe Earthquake.② Issues Regarding Assistance Grants for Self-Initiated Relocation to Temporary Housing Some people tried to secure land and have temporary housing built on their own. There were some people who needed temporary housing units that were attached to a shop space in order to continue their business in afflicted areas. If financial assistance had been available for the self-initiated construction of temporary housing, it could have helped to fulfill the victims’ wishes to stay in their place of original residence, contributing to some degree to economic relief for self-owned businesses and maintenance of community afflicted areas. However, the idea of financial assistance for such ventures was rejected as it violates the principle of no individual compensation.③ Issues Regarding the Introduction of a Cash Voucher System to Provide Food When lifelines such as gas and water supply were disrupted right after the earthquake, providing boxed meals to the victims was effective. However, as the lifelines were restored and grocery stores and restaurants gradually resumed their services, it became necessary to flexibly respond to the victims’ needs. In this situation, Kobe requested that the national government permit a cash voucher system that would be useful for the victims as well as local businesses in the afflicted areas, but this idea was rejected.④ Ordinance-Designated Cities and Allocation of Authority According to National Disaster Relief Act, relief activities are to be led by the prefectural governor with the assistance of the mayor of the city/village concerned. When it comes to ordinance-designated cities (large cities) like Kobe, they are able to directly negotiate with the national government about welfare administration in normal times, and they have sufficient administrative capabilities. Cities at the level of ordinance-designated cities need to have delegated authority equivalent to the prefectural government so that they, as the closest administrative body to local residents, can implement quick and appropriate relief measures to meet the direct needs of residents. Kobe made a proposal concerning this matter to the national government, and the national government’s study group on disaster relief will discuss this matter.
2.1.7 Conclusion Many earthquake victims lost not only their houses but also their jobs and families. The local communities that sustained their lives were also destroyed as was the urban infrastructure. Furthermore, the prolonged life as evacuees had a negative impact on the victims’ health conditions. In order to support the life recovery of the victims, it was indispensable to deal with multilayered issues covering essentially all aspects of people’s lives.
Kobe formed the Life Recovery Headquarters in order to more systematically implement necessary measures while securing emergency shelters, temporary housing, and permanent housing in each life recovery phase. With the life recovery support plan in place, Kobe implemented comprehensive and detailed support measures covering healthcare, employment, and housing to help victims recover their lives.

269
Although it generally takes many years for the recovery of urban and economic infrastructures, thanks to Kobe’s supportive efforts for citizens’ life recovery, the transition of residents from temporary housing to permanent housing was completed within five years after the disaster.
Finally, the fact that the community mutual watch-over program that originated at temporary housing and disaster reconstructive public housing complexes has now evolved into a citywide program clearly shows that life recovery support measures proved to be effective in a forward-looking manner, given the upcoming super-aging society. This could not be realized by administrative efforts alone. Rather, it was thanks to the partnership with various NPO organizations, volunteers, and many others that supported victims. Last but not the least, the importance of bringing people together and forming a new type of community should never be underestimated.
2.2 Support for the Elderly and Disabled in Kobe City after the Earthquake2.2.1 Thematic Background Kobe has implemented two major projects for elderly and disabled disaster victims during the 15 years since the Kobe Earthquake. The projects aim at building communities where local residents help each other at temporary and reconstructed housing sites and community residents support each other based on the concept of community work.
People who lost their homes due to the Kobe Earthquake had to live in evacuation shelters utilizing facilities such as schools and kominkan (community centers). To ease the situation, Hyogo Prefecture and the city of Kobe constructed temporary housing for the victims at a fast pace. The temporary housing units were one story with one or two rooms, a kitchen, a toilet and a bath, and the construction required an extensive area of land. In Kobe, temporary housing units were constructed in areas where a large amount of land could be secured such as Kita Ward, Nishi Ward, and a landfill area utilized by Kobe Port. The affected areas were mainly in the southern part of Kobe that had been developed for many years and where many elderly citizens resided. Temporary housing was constructed in areas far removed from areas where the elderly and disabled were used to living. Many of them stayed in the shelters because they were concerned that they would not be able to do their daily shopping or visit clinics or hospitals if they moved to temporary housing. It was very cold when the earthquake struck this region, and many of the elderly and disabled victims who stayed in shelters experienced ill effects on their health and general wellbeing because they had to sleep crowded together in empty classrooms.
Kobe constructed 1,500 community-based temporary housing units for the elderly and the disabled victims1) (hereinafter called “community-based temporary housing”). The community-based temporary housing units were prefabricated buildings with two stories built in a dormitory style. Each building had about 50 rooms with communal kitchens, baths, and toilets, and 84 buildings in total were constructed in 21 neighborhood parks in the areas where many elderly people lived.
The people eligible to live in the community-based temporary housing were the elderly and intellectually-, physically-, or mentally-disabled people. This attempt at community- based temporary housing where people with multiple disabilities and the elderly lived together was a first for Japan (and possibly the world), and all the residents were entitled to the aid of Social Services. When a care plan is made for each individual, many services such as home help, day service, and transportation are needed. Therefore, it was assumed that a larger staff was required in community-based temporary housing compared with that in residential care facilities where people with a single type of disability or the elderly lived.
Many welfare institutions and their staff members in the community were affected by the
270
earthquake, and it was impossible to get support from them. As the nursing-care insurance system had not yet been inaugurated in Japan at that time, there were few available care managers to arrange individualized services.
The theme for this project was how the Life Support Advisor (hereinafter called “LSA”) system could provide support to the residents in community-based temporary housing in the situation where only one LSA was allocated for one building that accommodated 50 households.
Kobe constructed 28,000 housing units over several years following the earthquake. People who were able to have their own houses reconstructed returned to their original place of residence, but many elderly people had to move to the housing units constructed by the city as it was economically very difficult for them to have their houses reconstructed. Among the housings units constructed by the city, more than 2,000 units were silver housing2) specially designed for elderly victims. This project focused on mutual help among community people and community work, following the LSA service manual developed for the project of community-based temporary housing.
Now that 15 years has passed since the earthquake, the average age of people living in silver housing is close to 80, and elderly people who live alone account for more than three quarters of the residents. The needs of the people living there have changed from those at the time when they moved in. It is now time to consider how the silver housing project should evolve, taking into consideration the coming aging society with fewer children.
2.2.2 Thematic Outlines and Important Points2.2.2.1 Thematic Outlines of the Project for Community-Based Temporary Housing① The Outline of Community-Based Temporary Housing The first community-based temporary housing unit was constructed in Higashi-Kawasaki Park in Chuo Ward, Kobe. It was a prefabricated building with two stories, and it looked like an office building at a construction site. People started living in the housing units from April 27, 1995. According to the guidelines for applicants, people who were eligible to move into temporary housing were those who were recognized as having difficulties living in shelters due to physical or mental vulnerability. More specifically, they were holders of certificates of physical, intellectual or mental disability, and their disability level was certified as severe. While applicant selection for general temporary housing was made by drawing lots, the residents for community-based temporary housing were selected by the city administration. Additional points were given to those people with severe disabilities and older people; the applicants with the most points were selected and were able to live in this type of housing.② LSA Allocation and Issues Base on the experiences with LSAs for silver housing, Kobe allocated one LSA per 50 households for community-based temporary housing. While some other cities allocated LSAs for 24 hours a day with three shifts, LSAs in Kobe worked from 9:00 a.m. to 5:00 p.m., Monday through Friday, because there were many victims and many community-based temporary housings were constructed. Originally, Kobe was planning to entrust this project to a foundation called Kobe Citizen’s Welfare Promotion Association (hereinafter called “Promotion Association”), an auxiliary organization of the Kobe city government, but it was difficult to secure LSAs dedicated for this project as action had to be taken quickly. Therefore, city staff workers started to engage in this project as a model project. Every day, several people moved into temporary housing from the evacuation shelters. Minimum daily necessities such as kitchen utensils, dishes, rice, and a kotatsu (low table with an
271
electric heater underneath and covered by a quilt) were provided to the residents. LSAs provided necessary information for daily life such as how to use the facilities and equipment at the temporary housing site, how/when to put out the trash, and where to find nearby shops and hospitals. There were markets and stores close to the housing site, but many of them had been affected by the earthquake and were still closed. At shelters, boxed meals were offered three times a day, but there was no such service available at the temporary housing site. Therefore, it was very important for residents to secure a source for meals once they had moved in. The temporary housing units were makeshift, rather poorly built and had thin walls. Noise from one unit could easily be heard in the surrounding units, and lifestyles varied among residents, which caused many problems. Many residents were not used to collective living and were frustrated. What LSAs could do was to listen to their individual complaints, but they could not bring about any solution. Many of the residents tended to seclude themselves in their rooms, as they had lost their families, friends, and property, and there was no one close to them. It seemed that many of them bought boxed meals rather than cooking for themselves, even though kitchen facilities were available. Some of them came to the LSA office merely because they were lonely or depressed. In their daily lives, residents encountered many problems due to their various disabilities. For example, if a wheelchair was placed in a common hallway, visually-impaired residents often bumped into the wheelchair while walking. As well, people with mental disabilities often knocked on the doors of their neighbors, and some people could not take a bath due to their disabilities.
2.2.2.2 Important Points of the LSA Project at Community-Based Temporary Housing① LSAs as Social Workers As project commenced, it was found that individual support was insufficient to solve the residents’ complaints derived from differences in lifestyles and the use of common spaces. It was felt necessary to encourage communication among the residents. In order for the residents to live well in this housing, it seemed important that the residents demonstrate their own unique capability and support each other. Rather than focusing on disability or old age, paying attention to each individual’s unique strengths revealed that the residents were not simply the recipients of service but were able to become the providers of services to others. Therefore, what LSAs tried to do was find the fields that the residents were good at and then find opportunities for them to utilize their abilities for community development. In community-based temporary housing where the severely disabled and single elderly persons lived together, it was found essential to gain support from the community. In view of this, attempts were made to develop community work projects, and the details can be divided into three categories although there is some overlap.② Three Social Work Techniques・Case Work: Support for the Individual Individual counseling was provided by using a case-work technique. At first, when counseling was offered, the sign saying “In Interview” was hung on the doorknob of the LSA office to protect privacy. However, this practice did not last long as the word “interview” did not fit the real-life situation. Since many people were suffering from economic hardships caused by the earthquake, applying for welfare benefits was often suggested as a potential solution for their problems. The LSAs allocated by Kobe were professional care workers with experience in special nursing-care for the aged, and they also had experience as home-care attendants. As they understood the psychological conditions of the elderly and had a good perspective towards preventative care, they were able to provide individualized care by listening to each individual’s problems, leading to the success of this project.・Group Work: Support for the Group When the elderly and the disabled started living together, many problems came up. As

272
community-based temporary housing was a two-storied building, LSAs proposed that residents on each floor should talk. On each floor, a coordinator was chosen from among the residents so that the residents themselves were essentially in charge of the process to solve their problems. There were many problems caused by the fact that kitchen and bathroom facilities had to be shared. Such problems were also solved by the residents through discussion and deciding on the way to use and clean up the common spaces. As the utility bills were charged per capita, some residents walked around the hallway to turn off lights to save electricity, while others with poor eyesight went through the hallway turning on every light as they could not see well in the dark. This problem was also discussed among the residents and as a result, they requested that Kobe charge the same amount every month, and the problem was solved. Other problems related to daily living activities were discussed among the residents and resolved fairly. An outdoor tea party was held for the residents. The residents gathered with their own tea cups supplied by the city. As the housing was built in a children’s park, they enjoyed looking at trees and the sky by sitting down on mats that they brought themselves. In the blessings of the nature, they soon enjoyed a feeling of freedom. They gradually built up a sense of fellowship by enjoying activities such as a self-introduction game. Later, the residents started planning to hold another tea party and to eat together on their own. They discussed these ideas as a group and made plans, assigning such roles as making posters, shopping, planning for games, and accounting among themselves. Elderly women were in charge of cooking as they were good at cooking for many people. Persons with mental disabilities were in charge of accounting, while intellectually-impaired persons helped by carrying bags of groceries. During this process, LSAs tried to make themselves invisible as much as possible, working behind the scenes. What LSAs did was not to pay attention to the residents’ disabilities but to focus on their capabilities and encourage them to demonstrate these capabilities. A series of these activities successfully nurtured a supportive neighborhood environment.・Community Work: Support for the Community Support from local residents in the community is indispensable for temporary housing where only elderly and disabled people reside. People such as members of the Neighborhood Community Association, Senior Citizens’ Association, and Women’s Association as well as the local welfare commissioner were called on for support of the residents. The people living in this housing facility could not evacuate without help if a fire should occur. Therefore, fire drills were conducted with the cooperation of the local community and a nearby fire station. Stickers were put as marks on the doors of the rooms where persons in wheelchairs and visually-impaired persons lived so that local residents could find them easily and help them to evacuate. At nighttime and during the weekends when LSAs were not available, people living in the neighborhood watched over them. People working in meal/food delivery service stores and visiting physicians were also significant social resources. As the residents came to be on familiar terms with people in the local community, they were able to be protected by the community. Contact information for family members was also very important because most of the residents lived alone. After obtaining a resident’s agreement, LSAs tried to get in touch with family members. By inviting the families to join the events, cooperation among the family members of the residents living close was also nurtured.③ Small Need for External Services Originally, it was anticipated that there would be a large need for external services in order for the severely disabled and single elderly people to live in community-based temporary housing. However, as it turned out, the need for external services at community-based temporary housing was minimal as the residents supported each other and they also received support from within the

273
community.④ Project Characteristics in Kobe When community-based temporary housing facilities with 24-hour care service in other cities were visited, it was found that the residents had a relaxing look on their faces. One-on-one service seemed to be available there. By contrast, the residents in the Kobe’s community-based temporary housing went out to buy their groceries by themselves, dragging their feet in a cold wind. They sometimes purchased groceries for their neighbors. Although they looked stern, they seemed to take pleasure in helping each other without external support. One LSA was allocated for one building in many cases, and it was the Promotion Association that was entrusted with the general responsibility that supported LSA activities. A monthly meeting for education and information exchange was held for LSAs who were allocated in various areas. Through lectures and guidance from experts in various disciplines, LSAs were able to gain specialized knowledge and skills to solve various problems. The Promotion Association allocated a dedicated person for consultation services, and standardized LSA tasks by developing manuals. These efforts truly helped to make this project successful.⑤ Community Work Developed from Community-Based Temporary Housing The project on community-based temporary housing was terminated within three years after the earthquake as the residents started moving into their reconstructed houses or newly built housing for post-disaster recovery. This project’s policy emphasizing the importance of community development carried over to the project of the advisors to elderly households who supported not only the elderly but also the disabled who moved in the newly-built housing for post-disaster recovery. Later, this project evolved into a unique Kobe project. Under the project, community supporters specializing in community development were allocated in the Community General Support Centers. The centers, one for each junior high school district, are the focal points of services under the nursing-care insurance system. This activity also carried over into another project of community supporters. The project is to watch over people, especially the elderly, by utilizing vacant housing space in collective housing where many elderly people live.
2.2.2.3 Thematic Outlines of the Projects for Silver Housing The Silver Housing Project was initiated by the national government with coordination between groups involved in housing policy and welfare policy. Silver housing is free of barriers and equipped with an emergency call unit, and LSA services are also available. Before the earthquake, three silver housing units had already been constructed in Kobe. After the earthquake, many more were constructed as housing for post-disaster recovery, and the number ended up to be 38 buildings, 2,341 units in the entire region of Kobe. At that time, the total number of units in Kobe accounted for one quarter of the total in Japan, and 50 LSAs were allocated there. LSAs assigned at community-based temporary housing were based on the model of the Silver Housing Project, and the lessons learned from the LSA project for community-based temporary housing were.
LSAs’ support under the national government’s Silver Housing Project was on an individual basis. In contrast, what was unique in the case of Kobe was the focus on community development through mutual assistance among residents, in other words, community work.① Conditions of Residents at the Beginning and LSA Activities The housing built for post-disaster recovery was permanent housing for victims. The earthquake forced them to leave their pervious communities behind. They had to move from evacuation shelters to temporary housing for a short period of time, and finally reached the housing built for post-disaster recovery where they had no acquaintances or relatives. In the silver housing facilities, many residents tended to shut themselves off from others, and many of them fell ill due to conditions such as alcohol dependence, emotional disorders, and dementia.

274
Illegal business flourished at this time with persons coming in and selling items such as bedding, air-fan filters, and water filters of questionable quality at extremely high prices. There were also many incidents in which villains, calling themselves volunteers, entered residents’ homes in order to exploit money and valuables from the elderly. Therefore, LSAs at the silver housing facilities made efforts to protect residents from falling prey to illegal business by proving information. In order to create and strengthen relationships among residents, LSAs planned and implemented events such as radio gymnastics and tea parties. In the case of community-based temporary housing, noise was a problem as the housing unit was divided by very thin walls, but there was no such a problem in the housing built for post-disaster recovery because the material used for construction was concrete. However, as no sound inside the room was heard from outside once the door was closed, it soon became apparent that elderly persons living alone could die at home and no one would notice for quite some time. As this type of housing was newly built in many areas, many people moved in and started living there. All of them were new to the community, and there was, of course, no local association formed by the residents. Therefore, LSAs indirectly supported the residents to form community organizations such as a neighborhood community association and senior citizens’ association. Just after the housing was built, community development was very successful with the indirect support from LSAs as well as financial aid from the Kobe Earthquake Reconstruction Fund. Volunteers also supported the residents, and the residents themselves were vigorous. What LSAs did was to get useful information, such as information on events, and communicate this information to the residents, encouraging them not to withdraw from the community. As time went by, financial aid was terminated; volunteer support started declining; and the residents continued to get older. Under these circumstances, LSAs were expected to play a facilitating role for community development. However, the problem was that there was no budget for leasing a room for a gathering or preparing for an event even if LSAs wanted to hold a small tea party to promote community development.② Budget-Driven Effectiveness of Community Development In fiscal 2006, The Project on Community Support Development was implemented to support community development. With a subsidy of about 50,000 yen per year per LSA, LSAs were able to work on this project that could help create meaningful life and promote interpersonal relationships. LSAs worked on a wide variety of activities such as tea parties, communal dining, movie viewing, nutrition classes, health promotion classes, and seasonal events. Although LSAs were very used to planning events by themselves as they worked for welfare facilities, they tried to involve the residents from the planning stage to help discover their capabilities and encourage them to demonstrate them. As not only the LSAs but also the residents were involved in the entire process of planning, implementation, and evaluation of the project, the circle of community was nurtured. The residents could be invigorated by demonstrating their capabilities and taking care of others, rather than just being the ones receiving care. This was a lesson already learned from the experiences with the community-based housing project.③ Verification Based on a Survey of Residents The Kobe Citizen’s Welfare Promotion Association (later renamed the Kobe City Council of Social Welfare) conducted surveys on the actual condition of the residents living in silver housing in order to understand the residents’ conditions and needs in a more objective manner to aid in further LSA training and future planning. In 1999, the number of residents and the average age were 908 men, 71.2 years old and 1,381 women, 73.3 years old; the overall average age was 72.6 years old. In 2006, there were 942 men and 1,546 women, and the average age was 74.5 years old and 76.4 years old, respectively; overall the average age was 75.7 years old. Households of single elderly person accounted for slightly less than 80% of the total, and the average age was 76.7 years old.
275
When the data for these 2 years is compared, the frequency at which residents leave their homes to go out and to participate in events did not change much over these seven years. More than 80% of the residents could keep their homemaking skills such as cooking, laundry, shopping, and cleaning. According to the statistical data from the surveys, many residents seemed to still be vigorous although they were getting older, and this was good news. The number of people who suffered from alcoholic dependency, depression, and schizophrenia, which was large in 1999, declined while the number of elderly residents suffering from dementia increased to 10% of the total number of residents in 2006. Also, 30% of the residents were certified as eligible for the nursing-care insurance scheme in 2006. From the survey results, the important issue in the future is to create an environment where elderly persons living alone can feel at ease and be well enough to be able to live in silver housing. There are many households of single elderly persons in this group. A notebook called “My Anxiety-Free Notebook” was created and with which residents can decide what they want to do and what they want others including LSAs to do in the case of emergency.④ New Programs in Fiscal 2009・Workshop for One Million Supporters for Dementia As Japan is now a rapidly-aging society, there are growing concerns that some of the silver housing residents may wander off and not be able to find their way back to their home by themselves because of dementia. In some cases, other residents supported the elderly suffering from dementia to help them live better, but in other cases, they preferred keeping them away because there was concern that damage, especially fires, could be caused. Educational sessions about dementia were held for LSAs, and LSAs learned how important it is for those suffering from dementia to have appropriate contact with the people around them including LSAs. Later, aiming at creating silver housing where people can keep living in peace even if they come to suffer from dementia, a program called “Workshop for One Million Supporters for Dementia” was held. In fiscal 2009, this program was carried out at all silver housing complexes, aiming at creating neighborhood relationships so that the people living in silver housing could support each other even if some of them come to suffer from dementia. If the people around those suffering from dementia understand and support them, they are able to keep living in the home they have become used to. It is important for the people in the neighborhood to watch over them.・My Anxiety-Free Notebook (end-of-life note) Although this project aims at creating an environment where the residents could live in silver housing until the end of their lives, health conditions may suddenly change as many elderly persons have pre-existing diseases. Under the project on community support development, a drama is performed and shown to the residents, assuming that a resident would fall ill and need to be taken to a hospital. By watching the drama, the residents better able to think about what they would have to do to prepare for a potential medical emergency so that they could be better prepared. Among the elderly people living alone, many had lost their relatives, and many that still had relatives had been alienated or had not had any contact with them for a long time. Each individual resident must have his/her own preparedness plan to be put into action at the time of a crisis. To this end, a notebook called My Anxiety-Free Notebook was created with the support of LSAs. LSAs then encouraged the residents to write down necessary information in their notebooks and keep it together with their health insurance cardc.⑤ Community Eco Map3)
The Eco Map was originally developed by A. Hartman for the practice of social work. This chart is a tool to find clues to solve problems that could exist among families, people, and social capital surrounding an individual. For LSA activities, cooperation with local social resources is the key to success. In some cases, an LSA had a personal relationship with the residents, and this relationship was destroyed when the LSA was relocated, leaving the successor with the difficult task

276
of starting from scratch to try to rebuild such a relationship with the residents. In order to resolve this issue, development of community eco maps was started three years ago based on Hartman’s model. Each item of social resources available in the community is pre-printed on stickers, and the stickers are put on the map with the LSA as its center to better understand the various relationships. LSAs make community eco maps at the same time each year, and they utilize them to evaluate the community’s environment that surrounds the silver housing complex. At the same time, LSAs put such information as the characteristics and concerns in the community, issues raised in the last fiscal year, measures taken so far, things that have been resolved and remain unresolved, new findings from the community eco map, and future actions in a chronological manner. Community eco maps enable LSAs to evaluate the outcome of the community work implemented by them together with the residents and to clarify the issues. The efforts toward the issues found in the previous year and new issues can also be clearly understood. Furthermore, a new LSA can take over the social resources from the former LSA at the time of personnel reallocation.
2.2.2.4 Important Points of the LSA Project for Silver Housing① Proactive Measures for the Super-Aging Society In silver housing, nearly 80% of residents live alone, so in this sense it enables coping with the upcoming super-aging society in a proactive manner. One of the critical issues in the future is how to deal with a society in which the aging population continues to grow combined with the diminishing number of children. In 1950, the elderly population accounted for less than 5% of the total population in Japan, but it is estimated that it will be 25.2% by 2015, meaning that one out of every four persons will be elderly. It is also estimated that the increase in the elderly population 75 years of age or older will be greater than that in the elderly population younger than 75 years old by 2017 and the trend will continue. While the population aging rate will continue to increase, the productive-age population ratio will decline. Presumably, more and more elderly people will need nursing care, and the elderly suffering from dementia will increase more with the advancing aging society. Such a prospective future society is now becoming a reality in silver housing. People in charge of this project are trying to develop it in a proactive manner for the upcoming super-aging society. Based on the slogan “Elderly people will live well and long in a community where people in the neighborhood support each other,” the project aims at creating an environment where people in the neighborhood can care for and help each other. Rather than bringing many services in from outside, the residents in silver housing help and support each other by mobilizing their own capabilities, which helps create pleasure and motivation in their lives. In the case of the project of temporary housing for the elderly right after the earthquake, the specifics of the project had to be decided after some tentative activities were initiated. On the contrary, the Silver Housing Project is a long-lasting project. In order to understand the real needs of the residents, LSAs share information about their daily work, learn and review some difficult cases they experienced, and conduct needs surveys. Attempts are made to solve problems through information gathering, planning and, implementation. It is indeed critical to get real-life information because this project is the first of its type.② Consciously-Built Community Such social resources as communities are easily overlooked unless the people in charge are conscious of them. In order to make communities more visible, community eco maps and chronological charts have been useful tools to make the communities more evident as social resources in each LSA’s mind. These two sheets have helped LSAs to be more conscious of local social resources and collaborate better with them. At the same time, LSAs are able to deepen their relationships with the community from a more professional perspective. These tools are also very useful when a new LSA takes over, being effective as a technique for community work. It is said

277
that abusive treatment and death in isolation can be avoided if social services are available and close enough to the elderly. Elderly persons suffering from dementia can live in a community if other people in the community keep watch over and treat them well. If not, they cannot live there. It is indispensable for the community to watch over the elderly with caring eyes. In this sense, one of the LSAs’ tasks is to encourage the people in the community to participate in a circle to support the elderly residents. Community is a social resource that has to be consciously built and maintained.
2.2.3 Evaluation The role of social workers is to assess issues in the field, make plans to solve problems, and come up with ways to implement the plans, mobilize organizations involved, and implement the plan in a given welfare environment. If social workers are placed in post-earthquake conditions and in the same position, they should work in the same way. One of the successful factors for LSAs was that they were able to receive good support from their supervisors and colleagues.
On the other hand, there were some difficulties conducting LSA tasks. In order to support the creation of relationships among residents who had just moved into the housing, there was an ancillary project by “Fureai” (friendship) Center at temporary housing and a project by Community Plaza at the housing for disaster recovery. These projects were subsidized by the Kobe Reconstruction Fund. With this financial support, community people were very active in holding various events such as tea parties to build relationships. At the same time however, the amount of subsidy was relatively large like one million yen or even two million yen, causing some problems among people in many cases. If there were an established autonomous body in the community, handing money directly to the resident representative would have been effective. However, the reality of the situation was that no autonomous body had been developed yet, and there was a case of fraud by a self-proclaimed chairperson of an autonomous body. Also, there was a case in which the residents fought over the money.
The LSAs who cooperated with these projects were almost involved in such problems in some cases. Social workers such as LSAs need to be part of an autonomous body so that a different approach can be taken if similar situations were to arise.
2.2.4 Conclusion LSAs, together with residents, plan and implement a wide variety of events such as drinking tea and eating together, watching movies, nutrition and health promotion classes, and seasonal events for each housing area. These projects are not only for the sake of the wellbeing of the active participants. In reality, surveys show that a maximum of only about half of the total residents participate in these events. Some people like interaction, and others do not. Some cannot join in due to poor mental or physical conditions. The most important purpose for community work is to support all the residents so that they can help and care for each other. For LSAs, meeting this purpose in the events is also a challenging but worthwhile part of the process.
Based on the coming aging society with fewer children, Japan will be faced with more serious conditions due to the negative impact caused by the issuance of huge national bonds, weakening of corporate financial structures, and shortage of human resources due to the declining working population. As Japan has the world’s highest longevity rate, it is expected that the number of people who need nursing care and who come to suffer from dementia will increase considerably.
Taking this situation into consideration, it is clear that the time will come in the near future when the individualized support plan, that is being developed today, will no longer be sustainable due to financial and personnel shortages.

278
When looking at the care plan made under the nursing care insurance scheme, it is an individualized one, and in the plan, only the requirements to receive support are emphasized, while there is no mention of a person’s utilizing his or her own ability voluntarily. However, it was found through the experiences with community-based temporary housing that even residents 80 or 90 years old or suffering from severe disability could find their lives worthwhile and live in the community well for a long time if they helped others and were appreciated. Assuming that the number of people suffering from dementia will rise sharply in the Japanese society, human relationships and mutual assistance in the neighborhood are extremely important.
In the community-based temporary housing where only people with severe intellectual, physical, and mental disabilities and elderly people resided, LSAs worked invisibly in the background for them so that they could help each other and receive support from outside.
Meanwhile, in silver housing where almost 80% resident are elderly and many of them are fragile both physically and mentally, it is thanks to the mutual support in the neighborhood that their wish to keep living in their home until the end of their life can be fulfilled rather than moving to a hospital or nursing home. Currently, the number of elderly suffering from dementia is increasing in silver housing, and community people together with LSAs are seeking ways to solve problems related to living together by learning through trial and error as well as attending training sessions on dementia. Cooperation from the people in the community is indispensable especially for the silver housing residents suffering from dementia who tend to wander about and get lost. By developing community eco maps to identify available social resources and building relationships with the newly identified social resources, LSAs are making efforts to expand the circle of people who can provide support for the residents in silver housing.
What has been realized up to now is that the residents should not be thought of as clients. If only a social worker and client relationship existed, the roles of providers and recipients would have been rigidly fixed. Once the roles were fixed, the residents would have been recipients of support all the time. However, once social workers and the residents are on the equal footing, the capabilities of both are brought together. Under the projects on community-based housing and silver housing, there has not been a concept of clients who just receive support passively. Under the present situation of the nursing-care insurance scheme, there is growing concern about the increasing demand for services. Mutual assistance in the community could help in reducing such a demand and allow people to live better because they get energized by helping others.
It is hoped that the Silver Housing Project, originally designed for elderly people affected by the Kobe Earthquake, will ultimately become an effective model in the upcoming aging society.
References 1) Osamu Ema (1997). Community-Based Housing is a New Style of Housing that was Generated from the Kobe
Earthquake. The Record of Life Support Advisors for the Great Hanshin-Awaji Earthquake Community-based Temporary Housing (Mutual Aid between Elderly and Disabled People), page 3.
2) Taemi Shigeno (2000). The Password is Community Work - From Temporary Housing for the Elderly and the Disabled to the Project of Advisors for Elderly Households and the Silver Housing Project. Three LSA Projects Generated in Kobe, page 14.
3) Taemi Shigeno (2009). Community Eco Map Developed by the Kobe City Council of Social Welfare. Bulletin of Social Welfare, page 73.

CHAPTER 6
Creating a Safe City

280
1 Basic Concept
1.1 Background The city government drew up the Safe City Creation Plan in June 1997. Under the plan, the city government has made efforts to create a disaster-resilient urban structure by taking advantage of the characteristics of the city and to develop a disaster-preventive urban infrastructure that can flexibly address various disasters, while it has also placed emphasis on community-conscious policies and promoted community development by taking into consideration the characteristics of individual communities so that the residents want to continue living there. In addition, the city government has worked on the advancement of a system that facilitates cooperation with other organizations along with the strengthening of its capacity for crisis management, improvement of the system for collecting, distributing, and processing information, reinforcement of emergency response functions such as relief and rescue, medical care, and firefighting, and creation of an environment that promotes comprehensive and systematic joint efforts of citizens, businesses, and the city government for creating a safe city. The Safe City Creation Plan has been put into practice in a manner consistent with the city’s Master Plan and Disaster Management Plan.
1.2 Three Policies for Creating a Safe City1.2.1 Development of a Disaster-Preventive Urban Infrastructure A disaster-preventive urban infrastructure forms the framework of a safe city, serving as a base to support the safety of the city. Specifically, a disaster-preventive urban infrastructure is developed by improving lifelines, expanding green-space areas for disaster prevention, and implementing disaster management bases as well as enhancing the safety of the whole city.
1.2.2 Formation of Disaster-Preventive Living Zones Formation of disaster-preventive living zones aims to secure safe living places based on citizens’ daily living activities. It is important to consider the safety of the city from the viewpoint of the citizens’ living spaces. Specific measures include the establishment of a Disaster-safe Welfare Community (voluntary disaster-reduction organization) in each elementary school district, the fostering of community organizations as leading players in disaster reduction drills, and other local disaster-reduction activities.
1.2.3 Improvement of Disaster Management Disaster management implies the capacity to respond to emergencies. Comprehensive and efficient management of resources and information is required according to the disaster phase, starting from immediately after a disaster through the recovery period. Specific measures are the clarification of responsibilities of the departments that are in charge of disaster management and implementation of training and disaster reduction drills to further develop the disaster-management ability of each in each department.
1.3 Making Use of the Earthquake Experience to Create a Safe City In the initial stage of a disaster, it is often difficult for a government to offer assistance to the affected people. In the case of the Kobe Earthquake, more than 80% of the people who were saved were rescued by family and/or neighbors. For this reason, it is necessary for citizens to be prepared so that they can survive for one or two days by themselves in cooperation with their neighbors.
1.3.1 Specific Lesson Learned from the Kobe Earthquake1) Information on severely damaged areas cannot always be delivered to the government
immediately. Therefore, public rescue operations can be delayed.

281
2) Rivers, parks, and roads prevented fire from spreading further. It is necessary to take this into consideration when advancing community development.
3) For disaster response, it is necessary to consider things that are used daily. Facilities constructed exclusively for disaster use are often useless at a time of a disaster unless they are used in ordinary times. For example, during the earthquake, personal computers were distributed to local evacuation shelters for the management of the shelters. However, they were worthless because no one knew how to use them at that time.
1.3.2 Conclusion Creation of a safe city cannot be achieved by a single person or the government alone. Under the concept of self help, mutual help, and public assistance, it is necessary to share roles appropriately and cooperate among citizens, businesses, and the local government. In this cooperation framework, the city government is required to offer direction for achieving a safe city as the coordinator; businesses are required to appropriately develop and manage facilities that make up the city; and the citizens are required to work toward improving their communities as they go about their daily lives. It is considered that a safe city will be achieved under such mutual cooperation.
2 Concrete Measures
2.1 Crisis Management2.1.1 Introduction The Kobe City Government is developing a system to ensure a prompt and appropriate response to large scale disasters and other crises, based on the experiences and lessons learned from the Kobe Earthquake.
Currently, the Kobe City Crisis Management Basic Policy classifies emergency cases that require the city’s prompt response as 1) a natural disaster, including an earthquake or typhoon, 2) a large-scale accident, or 3) another type crisis such as a health crisis or major terrorist incident, and this policy outlines the measures and procedures to be taken in the case of each of these emergency situations.
2.1.2 Major Issues of Crisis Management following the Kobe Earthquake2.1.2.1 Initial Response Delay in initial response by the concerned municipalities and the national government following
Figure 1. Creating a Safe City
Everyday Life Zone
Ward Zone
Neighborhood Zone
Disaster Management
Disaster-Preventive CityInfrastructure

282
the earthquake was pointed out. This was caused by a series of factors: the mobilization scheme was not fully implemented by the officials in the concerned municipalities, and some officials themselves were affected; the municipal office buildings were hit and functionally damaged by the earthquake; and information collection on the disaster situation was delayed because of the delay in the assembly of the officials due to disruption of transportation services as well as the lack of initial information.
Issues for disaster response activities include 1) establishment of an initial response system and clarification of specific response operations, 2) development of backup functions for the disaster management headquarters and ward offices, 3) improvement of the information collection and distribution system in the initial response stage, 4) establishment of personnel mobilization and deployment systems, 5) clarification and equalization of the responsibilities of the personnel in disaster response operations, and 6) study on upgrading the coordination functions for disaster response.
2.1.2.2 Collection and Distribution of Information and Public Relations Activities Following the earthquake, the affected areas had difficulty collecting information due to the loss of telephone services and disturbance in the function of radio communication abilities. The Kobe Government tried to distribute information to the citizens, by publishing newsletters and utilizing various communication tools such as the Ajisai Net (the city’s network system for information service), facsimile, and the media. However, it was pointed out that the city government could not respond to the large demand for information promptly or distribute the detailed information necessary to meet the victims’ changing needs.
As issues for information collection and distribution, building up of the disaster information system, including a simultaneous communication system, and establishment of an efficient information collection system were raised. Meanwhile, challenges in public relations during disasters included 1) collaboration with the media, 2) improvement of the system of information distribution to rescue and relief bases such as local evacuation shelters, 3) improvement of the contents of newsletters, and 4) study on the utilization of multimedia. Although no tsunamis occurred following the earthquake, it is also necessary to review the tsunami information communication system.
2.1.2.3 Wide-Area Cooperation and Request for Assistance In the case of the earthquake, the city government could not make a prompt request for assistance due to the delay in grasping the damage situation. Also, the city government had difficulty accepting relief teams dispatched from other municipalities and related organizations due to such issues as securing accommodations and food supplies for them.
Moreover, although many relief teams came to the devastated areas, their deployments and operations were disorganized. Similar problems and confusion were seen in acceptance of relief teams from overseas.
Issues for wide-area cooperation and request for assistance are 1) improvement of the system for prompt request for help from related organizations such as Self-Defense Forces and the Japan Coast Guard, 2) improvement of various systems and agreements on request for wide-area support, 3) development of an acceptance mechanism for support teams, and 4) improvement of the acceptance system for support teams from overseas such as international rescue teams.
2.1.2.4 Voluntary Disaster-Reduction Activities by Citizens and Businesses The earthquake caused tremendous damage. Municipalities also suffered damage and were unable to address this serious disaster alone. Instead, citizens cooperated with each other and conducted initial
283
firefighting operations and rescue and relief activities. Citizens and the disaster victims played a great role in operating local evacuation shelters and improving the lives of the evacuees. Businesses also contributed to relief activities by offering human resources and supplies.
Challenges in voluntary disaster-reduction activities by citizens and businesses include 1) clarification of the roles of citizens and businesses at the time of a disaster, 2) fostering and reinforcement of voluntary disaster-reduction organizations, 3) enhancement of citizens’ awareness against disasters such as the promotion of self-preparation of supplies, and 4) strengthening of disaster-reduction activities by businesses.
2.1.2.5 Evacuation Since unexpected damage was caused by the earthquake, around 230,000 people were evacuated to local schools and assembly halls that functioned as local evacuation shelters. Because of the occurrence of simultaneous damage in large areas, evacuation guidance, issuance and dissemination of evacuation calls, was not properly carried out. In addition, the evacuation scheme for earthquake disasters stipulated in the local disaster management plan at the time was also insufficient. Since there were no operation or management plans for local evacuation shelters, many problems arose.
Issues for evacuation in earthquake disasters include 1) establishment of an evacuation system in the event of an earthquake, 2) improvement of evacuation sites, evacuation shelters, and evacuation routes, 3) creation of a distribution system to supply information such as evacuation advisories and instructions, and 4) creation of an operational system for evacuation shelters. Although no tsunamis occurred following the earthquake, it is also necessary to review the tsunami evacuation system for the Tonankai and Nankai earthquakes expected to occur in the future.
2.1.2.6 Prevention of Secondary Disasters Issues for measures related to expected secondary disasters after earthquakes include 1) implementation of immediate measures, such as assessment of dangerous places, establishment of restricted areas, issuance of evacuation calls, and disaster prevention works, 2) distribution of information to citizens on the potential occurrence of secondary disasters due to localized torrential rainfall and aftershocks, 3) improvement of the information distribution system in the places where secondary disasters can be expected to occur, 4) establishment of an evacuation system, and 5) securing of the safety of local evacuation shelters.
2.1.3 Kobe Crisis Management Structure2.1.3.1 Chief Officer for Crisis Management and Crisis Management Office At the time of a large scale disaster, initial response is vital. The government is required to obtain and analyze the disaster situation promptly and distribute information to citizens and related organizations accurately.
Since many city officials could not mobilized smoothly following the earthquake, the Kobe City Government established the position of Chief Officer for Crisis Management and the Crisis Management Office in April 2002, for the first time among ordinance-designated cities, and set up standby lodging to respond to natural disasters and other various crises promptly and accurately.
When a large scale disaster occurs, if the Mayor is absent, the Chief Officer for Crisis Management will direct and supervise all the departments of the government in place of the Mayor. In ordinary times, the Chief Officer works in the Crisis Management Office for reinforcement of the disaster management system within the government as well as partnership with other disaster-related organizations, so as to

284
ensure a prompt and accurate response to various crises that could threaten the safety of citizens.
In addition, the city government concurrently appointed executive officers in the departments that will take key roles in emergency response activities including operations at the devastated sites (Public Relations Division, Public Health and Welfare Bureau, Public Construction Projects Bureau, Port and Urban Projects Bureau, Fire Bureau, Ward Offices, etc.) as staff members of the Crisis Management Office so as to achieve a concerted and united emergency response by the whole government.
2.1.3.2 Disaster Management Headquarters The Disaster Management Headquarters is an organization set up within the city government when a disaster occurs or is expected to occur that will implement disaster emergency responses in order to protect the lives and properties of the citizens. ① Establishment Standard・When an earthquake with a seismic intensity of 5 or greater occurs in the city area, a tsunami
warning is issued in the coastal regions of the Inland Sea in Hyogo Prefecture, or a disaster occurs due to an earthquake or there is a possibility that it will spread
・When a warning of windstorms or heavy rain is issued and it is expected that a serious disaster will occur in the city area, etc.② Organizational Structure and Management
Figure 1. Structure of the Kobe City Crisis Management Ststem
Crisis Management Office
Chief Officer for Crisis Management Other Departments
Vice Mayor
Mayor
Kobe City Disaster Management Headquarters
Headquarters Members Council
Chief (Mayor)
Deputy Chief (Vice Mayor)
Chief Officer for Crisis Management
Headquarters Members (Department Heads)
Secretarial Department
Crisis Management Department
Accounting Department
Coordination Department
Administration and Finance Department
Citizen Participation Promotion Department
International Affairs, Culture and Tourism Department
Public Health and Welfare Department
Environment Department
Industry and Agriculture Promotion Department
Ward Disaster Management Headquarters

285
2.1.3.3 Personnel Deployment When a disaster occurs or there is a possibility that a disaster will occur, the mayor will issue an emergency call-out order to concerned personnel to take necessary countermeasures according to the scope, type, and timing of the disaster.
2.1.3.4 Emergency Response Information Center The Emergency Response Information Center will become the liaison office when an emergency call-out order is issued or the Disaster Management Headquarters is established. The center is located on the 8th floor of Building No. 1 of Kobe City Hall (with an area of approximately 120 m2). As the hub for disaster information management, the center has the following functions.① Securing Information Relay Routes Since the center has various types of information communication equipment, including emergency-response administrative radio communication systems, the Hyogo Satellite Communication Network, and hot lines, it can collect and distribute information even when telephone lines are disrupted.② Collecting Information All the disaster information such as weather information including information on earthquakes and tsunamis, information on the disaster situation and response operations collected by personnel, related organizations, and citizens in the initial response stage, and breaking damage reports from each department will be collected by the center.③ Sharing Information Collected information will be shared with all the personnel of the city government through the liaison official of each department. Also, information will be distributed through a computer system called the Kobe Emergency-Response Net.④ Supporting Decision-Making Processes and Relaying the Decisions Collected information will be analyzed and organized at the liaison office and provided to decision-making bodies such as the Headquarters Member Council, supporting their decision-making process. The decisions made by those bodies will be relayed to each department.⑤ Coordination Activities In the liaison office, not only the staff members from the departments will coordinate with each other on response measures but also the liaison officers from related organizations such as the police and Self-Defense Forces will stand by so as to achieve coherent response measures among related organizations.⑥ Distributing Information to Citizens The center will distribute emergency information including information on tsunamis and evacuation calls to citizens and others using emergency-response administrative radio communication systems.
2.1.3.5 Kobe City Crisis Management Center Construction Project The current Emergency Response Information Center was installed eight years ago. In order for the city government to address all crises including storm and flood disasters as well as earthquake disasters in a unified manner, the base for crisis response should have more advanced functions. For this reason, the Kobe City Crisis Management Center is under construction and should be ready for operation in the spring of 2012.① Basic Objectives・Reinforcement of initial response system・Enhancement of information sharing in crisis situations・Strengthening of the local capacity for disaster reduction② Outline of the Center
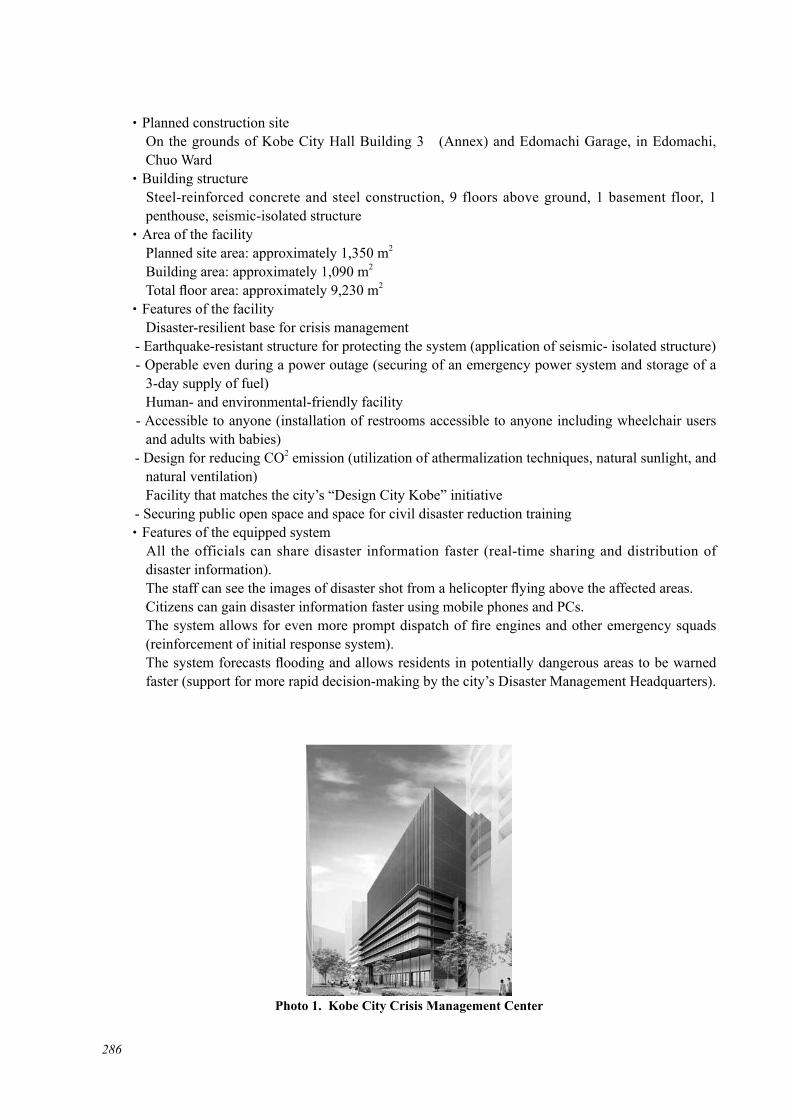
286
・Planned construction site On the grounds of Kobe City Hall Building 3 (Annex) and Edomachi Garage, in Edomachi,
Chuo Ward・Building structure Steel-reinforced concrete and steel construction, 9 floors above ground, 1 basement floor, 1
penthouse, seismic-isolated structure・Area of the facility Planned site area: approximately 1,350 m2
Building area: approximately 1,090 m2 Total floor area: approximately 9,230 m2
・Features of the facility Disaster-resilient base for crisis management - Earthquake-resistant structure for protecting the system (application of seismic- isolated structure) - Operable even during a power outage (securing of an emergency power system and storage of a
3-day supply of fuel) Human- and environmental-friendly facility - Accessible to anyone (installation of restrooms accessible to anyone including wheelchair users
and adults with babies) - Design for reducing CO2 emission (utilization of athermalization techniques, natural sunlight, and
natural ventilation) Facility that matches the city’s “Design City Kobe” initiative - Securing public open space and space for civil disaster reduction training・Features of the equipped system All the officials can share disaster information faster (real-time sharing and distribution of
disaster information). The staff can see the images of disaster shot from a helicopter flying above the affected areas. Citizens can gain disaster information faster using mobile phones and PCs. The system allows for even more prompt dispatch of fire engines and other emergency squads
(reinforcement of initial response system). The system forecasts flooding and allows residents in potentially dangerous areas to be warned
faster (support for more rapid decision-making by the city’s Disaster Management Headquarters).
Photo 1. Kobe City Crisis Management Center

287
2.1.4 Development of Crisis Management in Kobe City2.1.4.1 Kobe City Disaster Management Plan Under the Disaster Countermeasures Basic Act, the Kobe City Disaster Management Plan comprehensively and systematically stipulates affairs to be managed by the city government and support services by local related organizations to protect the lives and property of citizens when disasters such as earthquakes, floods and storms occur in the city.
The plan has been revised based on the experiences of the Kobe Earthquake. The city government added the Earthquake Disaster Countermeasures in March 1996 and the Manual for Earthquake Disaster Management and the Activities Plan for Disaster Management in June 1996. It also added countermeasures for the Tonankai and Nankai earthquakes that are expected to occur in the near future (Plan for Promoting Countermeasures against Disasters of the Tonankai and Nankai Earthquakes) in June 1999.① Earthquake Disaster Countermeasures and Storm and Flood Countermeasures These parts comprehensively describe measures to be taken by the city government and related disaster organizations against earthquakes, storms and floods.② Manual for Earthquake Disaster Management The manual describes concrete principles and measures to be over time by the responsible department and by the disaster organizations in a comprehensible and usable manner.③ Activities Plan for Disaster Management The Safe City Creation Plan, which outlines a five-year activities plan for safe city development, is positioned as the activities plan for the Kobe City Disaster Management Plan. The city government is promoting various disaster countermeasure projects under the plan.④ Disaster Management Data Base The city government collects and manages various types of data necessary for implementing disaster countermeasures in an integrated manner as the Disaster Management Data Base.
2.1.4.2 Ordinance for Promoting the Safety of the Citizens of Kobe The “Ordinance for Promoting the Safety of the Citizens of Kobe” was put into force on the 3rd anniversary of the earthquake. It proclaims that, based on the lessons learned from the earthquake, citizens, businesses, and the city government will share the roles in developing good communities so that local communities will be able to address disasters, crimes, and accidents.
2.1.5 Concrete Measures for Disaster Management2.1.5.1 Disaster-Safe Welfare Community Disaster-Safe Welfare Communities are local organizations that are engaged in voluntary disaster reduction activities and welfare activities in cooperation with businesses and the city government in order to develop safe and secure communities. Based on the lessons learned from the earthquake, the city government is supporting development of Disaster-Safe Welfare Communities as voluntary disaster reduction organizations so that local residents are able to protect their own communities by themselves. Details on these organizations will be presented later in this section.
2.1.5.2 Storage of Food and Relief Supplies For a large scale disaster, the city government is enhancing storage of food and relief supplies at local storage facilities and comprehensive storage facilities. Local elementary and junior high schools, which are accessible to residents, are designated as local storage facilities (they are also designated as local evacuation shelters). Comprehensive storage facilities are there to supplement the local storage facilities. Specifically, the city government plans to store food and relief supplies for 60,000 people at local storage facilities and for 90,000 people at comprehensive local storage facilities.

288
Based on the lessons learned from the earthquake, the city government is promoting the following measures to secure food for a large scale disaster under the assumption that 200,000 people will be affected.① Storage by citizens② Storage by designated businesses in the retail industry, such as agricultural cooperatives,
supermarkets, and department stores, based on an agreement concerning procurement of food and relief supplies③ Support from other municipalities④ Storage at storage facilities
By these measures, the city government is trying to secure a food supply so that 200,000 people can survive for three days after the occurrence of a large scale disaster. Regarding storage at the storage facilities, the city government plans to store food and relief supplies for 100,000 people for the first day following the disaster and for 50,000 people for the second day. Currently local storage facilities such as elementary schools and junior high schools store food and relief supplies for 200 people each (51,000 people in total). The city government aims to increase this number to 60,000 by promoting the storage plan further. In addition, it plans to store food and relief supplies for 90,000 people at eight places, including Kobe City Agricultural Park, Shiawase no Mura (Village of Happiness Kobe), Home’s Stadium Kobe, and Kobe Municipal Fruit & Flower Park, in order to intensively distribute food to severely damaged areas. Food and relief supplies for 54,000 people have been stored in those comprehensive storage facilities to date.
2.1.5.3 Hyogo Emergency Net, Rain Map Kobe, etc. Hyogo Emergency Net is a service to distribute meteorological information, sediment-related disaster warnings, evacuation orders and instructions in the event of flood and storm disasters, and other emergency information through mobile phones and other communication tools to residents of Hyogo Prefecture.
The city government also provides useful information for preparation against disasters through Rain Map Kobe and the river monitoring system, which enable citizens to gain information on rainfall and the water levels of rivers using the Internet functions of their PCs and mobile phones.
2.1.5.4 Crisis Management Research Committee “Kobe Safety Net Council” The Crisis Management Research Committee Kobe Safety Net Council was established in April 2001, aiming at enhancing the capacity to address a wide variety of emergency situations, not only natural disasters but also various incidents and accidents, through cooperation among businesses, research institutions, and the government.
The members aim to promote safe and secure city development by working together on a study of crisis management examining such items as business continuity plans (BCP) and the development of a framework for disaster management.① Members (number: 84) (Businesses) Businesses in various fields, such as finance, manufacturing, construction, utilities, railways,
distribution, food, service, and consulting (Research institutions) Research Center for Urban Safety and Security of Kobe University, Disaster Prevention Research
Institute of Kyoto University, Kobe Gakuin University, etc. (Government)

289
Kobe City Government② Main activities ・Holding of general meetings and board meetings ・Holding of seminars by specialists on crisis management ・Individual research by members (e.g., crisis management in individual companies) ・Study of advanced cases ・Running of the website
2.1.5.5 Kobe Earthquake Disaster Recovery Memorial Park The construction of Kobe Earthquake Disaster Recovery Memorial Park (provisional name) is positioned as one of the Kobe Earthquake Memorial Projects related to Recovery-Specific Projects. The project is designed to pass on the experiences and lessons learned from the earthquake to future generations and to symbolize the recovery of the city, under the concept of constructing a Portside Forest Park that will watch over the city’s progress from recovery to further development as well as the growth of the planted trees. Based on the lessons learned from the earthquake, the park will be constructed in the urban waterfront area as a disaster management park to form a disaster management base with City Hall and Higashi Yuenchi Park that are located nearby.① Outline of the project Project implementing body: Kobe City Government and Urban Renaissance Agency Location: Hamabe-dori, Chuo Ward (the JR Cargo Kobe Port Station site) Area: approximately 5.6 ha Project method: Disaster management park and urban area improvement project② Basic policies To create a park that will be the main symbol of the Kobe Earthquake To make the project a trigger to further develop the city for the future To have the park serve as a place for civil activities To have the park serve as a place for disaster preparedness drills To create a forest in the center of the city
2.1.6 Conclusion These days stronger typhoons and frequent localized torrential rain due to global warming are big concerns, and large-scale disasters continue to occur throughout the world. Meanwhile, it is said that the Tonankai earthquake and Nankai earthquake will occur within 30 years with a 60-70% probability and a 50-60% probability, respectively (according to the Headquarters for Earthquake Research Promotion). If the Tonankai and Nankai earthquakes occur, Kobe may be hit by a tremor measuring up to lower 6 on the Japanese scale, which may not only cause serious damage itself but also produce tsunami damage. In addition, more complicated and diversified crises that threaten the safety of citizens’ lives, such as large- scale accidents and new infectious diseases have been occurring.
The Kobe City Government would like to improve its preparedness against various crises to keep citizens’ safety and secure, without forgetting the following lessons learned from the earthquake.
2.1.6.1 Significance of Life Needless to say, human life is the most precious thing, and this was reconfirmed through the earthquake disaster and the recovery process. Without forgetting this fundamental perspective even for a moment, it is vital to consider preparedness for future disasters and crisis management.
2.1.6.2 Significance of Mutual Help and Interpersonal Relationships Through the 15 years of recovery following the earthquake, it was learned that the most essential

290
things are mutual help and interpersonal relationships. Especially in the aftermath of the earthquake, initial rescue and firefighting operations were conducted under the cooperation among local people rather than by the government. Based on this experience, preparations are being made for future disasters with the significance of self help and mutual help in mind.
2.1.6.3 Significance of Preparedness Everyone needs to be prepared for disasters. Since people cannot effectively utilize in emergencies skills they do not use in ordinary times, it is important to keep in mind that a disaster can occur anytime and anywhere, conduct practical disaster-reduction drills on the assumption of real emergency situations, and use skills necessary for disasters in ordinary times.
2.2 Kobe City Disaster-Safe Welfare Community – BOKOMI2.2.1 Background The Kobe Earthquake revealed that initial response by the government is frequently not sufficient when a large scale disaster occurs, while it also showed that voluntary activities by citizens are a great force for responding to disasters.
Based on the lessons learned from the earthquake, the Kobe City Government has supported citizens’ efforts to establish volunteer disaster-reduction organizations called Disaster-Safe Welfare Communities (hereinafter referred to as BOKOMI, which is an abbreviation of the Japanese name, Bosai-Fukushi Komuniti). In 1995, just after the earthquake, BOKOMI started to be established in selected areas in each ward, and their establishment has been expanded throughout the city since the guidelines on BOKOMI were formulated in 1997. Currently, all city areas have their own BOKOMI, which vigorously conducts disaster reduction drills and other various activities for community-based disaster reduction.
The Kobe City Government had established and nurtured Volunteer Disaster-Reduction Promotion Councils as community based organizations to promote citizens’ voluntary activities for disaster reduction since 1985. The organizations were basically organized by elementary school zone (each of which has a population of roughly 10,000) and consisted of local civic groups, such as neighborhood residents’ associations, women’s associations, PTA, senior citizens’ associations, children’s associations, and volunteer fire fighters. However, since the organizations mainly focused on dissemination of knowledge and awareness-raising about disaster reduction and conducted few practical drills, they could not respond to the earthquake in an organized manner.
Following post-earthquake discussions on the necessity of forming volunteer disaster- reduction organizations that would be involved in the initial response in the event of a disaster, BOKOMI have been organized and nurtured with various support measures from the city government, including implementation of disaster reduction drills, training of civil disaster-reduction leaders, and provision of equipment and materials necessary for disaster response activities.
2.2.2 Positions of Volunteer Disaster-Reduction Organizations in Japan In order to alleviate damage from large scale disasters, structural measures such as aseismic reinforcement of buildings and well-planned city development incorporating features to preventing the spread of fires are indispensable. At the same time however, it is also essential to take non-structural measures such as raising local residents’ awareness about disaster reduction and establishing a system for disaster reduction.
It is necessary to obtain agreement from residents when promoting structural measures. Also, in
291
the stages of utilizing and maintaining developed structures, consideration must also be given to the natural features of the area, and further development and maintenance of these non-structural features is important for achieving effective initial response in times of disaster.
Currently in Japan, based on the lessons learned from the Kobe Earthquake and with growing awareness of the necessity of preparing for expected large scale disasters such as the Tonankai and Nankai Earthquakes, volunteer disaster-reduction organizations are being established and nurtured throughout the country.
Volunteer disaster-reduction organizations are organizations for disaster reduction established by local residents voluntarily based on the idea that they are able to protect their communities by themselves. The “Disaster Countermeasures Basic Act” provides the legal basis for volunteer disaster-reduction organizations and positions them as volunteer organizations for disaster reduction based on the spirit of cooperation among neighborhoods. The volunteer disaster-reduction organizations are characterized in that they are not expected to rely on public power unlike volunteer firefighters who are also local residents. Their activities are conducted entirely by their own initiatives.
Following the Kobe Earthquake, many survivors in need of help were rescued by volunteer rescue operations organized by local residents, and firefighting activities were conducted by bucket brigades formed by them.
The volunteer disaster-reduction organizations conduct or are expected to conduct various activities in ordinary times as well as at the time of a disaster. Their activities, although varying depending on the community, are basically divided into two parts: activities in ordinary times such as conducting disaster-reduction drills, dissemination of knowledge on disaster reduction, anti-disaster patrols, and installment of equipment and materials for disaster-response activities; and activities expected at the time of a disaster such as initial firefighting operations, rescue and aid of the injured, evacuation guidance for local residents, and food and water supply.
The national average of the rate of coverage by volunteer disaster-reduction organizations (based on the number of households in an area included in the activity coverage of the local voluntary disaster-reduction organization and the total number of households in that area) was 73.5% in fiscal 2008, and the rates in Hyogo Prefecture and Aichi Prefecture, where a large scale earthquake called the Tokai Earthquake is expected to occur, were high: the rates were 96.1% and 98.9% respectively1). In Kobe, BOKOMI are formed based on elementary school zones. They have already been established in 191 areas, covering the area of the entire city.
Regarding the scale of volunteer disaster-reduction organizations, they are organized on the basis of neighborhood residents’ associations in most municipalities in Japan. The case of BOKOMI in Kobe, which consist of various civic groups in each elementary school zone, is in the minority. Since the area of a neighborhood residents’ association is smaller than that of an elementary school zone, it is easier for an organization to build a consensus among members if it is based on the area of a neighborhood residents’ association. However, such an organization is a bit too small to conduct comprehensive operations in the event of a disaster. On the other hand, organizations formed based on elementary school zones can mobilize a larger number of people so that they can respond to disasters in more comprehensive ways, while more efforts are required to organize the members when conducting activities since the area of coverage is larger.
As described above, both types of organizations have merits and demerits. Currently, efforts are
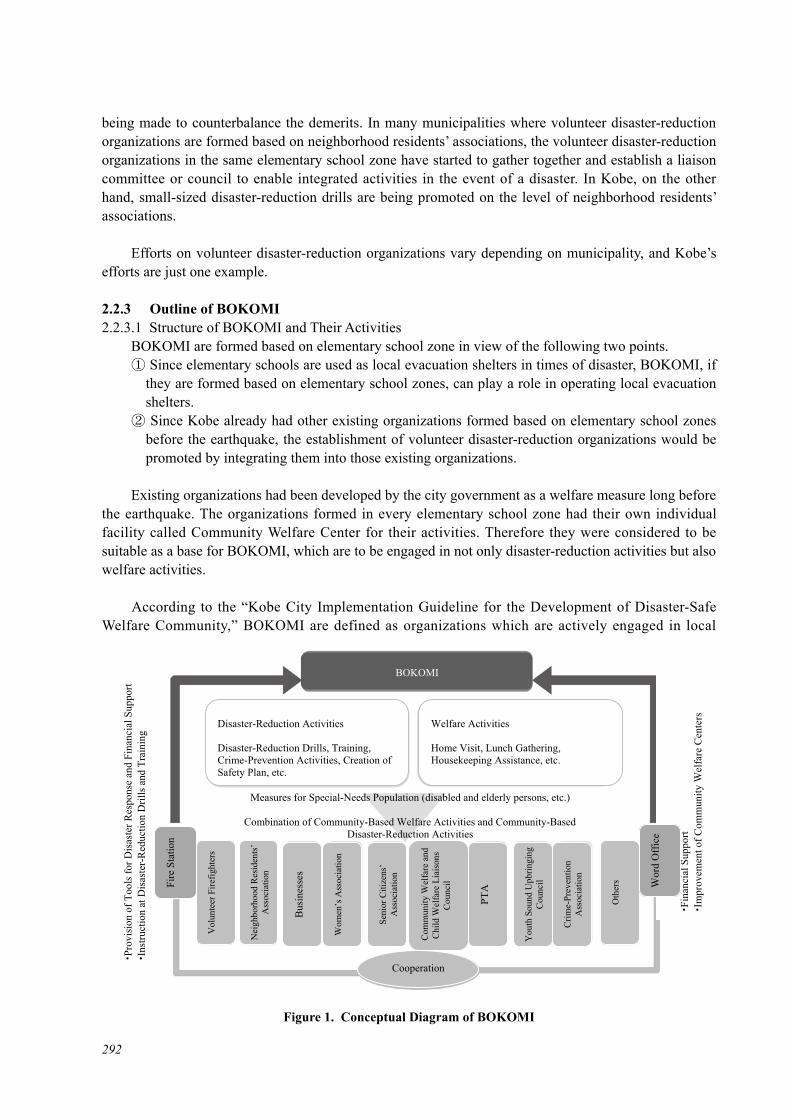
292
being made to counterbalance the demerits. In many municipalities where volunteer disaster-reduction organizations are formed based on neighborhood residents’ associations, the volunteer disaster-reduction organizations in the same elementary school zone have started to gather together and establish a liaison committee or council to enable integrated activities in the event of a disaster. In Kobe, on the other hand, small-sized disaster-reduction drills are being promoted on the level of neighborhood residents’ associations.
Efforts on volunteer disaster-reduction organizations vary depending on municipality, and Kobe’s efforts are just one example.
2.2.3 Outline of BOKOMI2.2.3.1 Structure of BOKOMI and Their Activities BOKOMI are formed based on elementary school zone in view of the following two points.① Since elementary schools are used as local evacuation shelters in times of disaster, BOKOMI, if
they are formed based on elementary school zones, can play a role in operating local evacuation shelters.② Since Kobe already had other existing organizations formed based on elementary school zones
before the earthquake, the establishment of volunteer disaster-reduction organizations would be promoted by integrating them into those existing organizations.
Existing organizations had been developed by the city government as a welfare measure long before the earthquake. The organizations formed in every elementary school zone had their own individual facility called Community Welfare Center for their activities. Therefore they were considered to be suitable as a base for BOKOMI, which are to be engaged in not only disaster-reduction activities but also welfare activities.
According to the “Kobe City Implementation Guideline for the Development of Disaster-Safe Welfare Community,” BOKOMI are defined as organizations which are actively engaged in local
Figure 1. Conceptual Diagram of BOKOMI
BOKOMI
Welfare Activities Home Visit, Lunch Gathering, Housekeeping Assistance, etc.
Cooperation
Vol
unte
er F
irefig
hter
s
Nei
ghbo
rhoo
d R
esid
ents
’ A
ssoc
iatio
n
Bus
ines
ses
Wom
en’s
Ass
ocia
tion
Seni
or C
itize
ns’
Ass
ocia
tion
Com
mun
ity W
elfa
re a
nd
Chi
ld W
elfa
re L
iais
ons
Cou
ncil
PTA
You
th S
ound
Upb
ringi
ng
Cou
ncil
Crim
e-Pr
even
tion
Ass
ocia
tion
Oth
ers
・ P
rovi
sion
of T
ools
for D
isas
ter R
espo
nse
and
Fina
ncia
l Sup
port
・ In
stru
ctio
n at
Dis
aste
r-R
educ
tion
Dril
ls a
nd T
rain
ing
Fire
Sta
tion
Measures for Special-Needs Population (disabled and elderly persons, etc.)
Combination of Community-Based Welfare Activities and Community-Based Disaster-Reduction Activities
・ F
inan
cial
Sup
port
・ Im
prov
emen
t of C
omm
unity
Wel
fare
Cen
ters
Wor
d O
ffic
e
Disaster-Reduction Activities Disaster-Reduction Drills, Training, Crime-Prevention Activities, Creation of Safety Plan, etc.

293
activities such as activities for disaster reduction and welfare in ordinary times so as to enable residents to take the initiative in conducting appropriate disaster-reduction and welfare activities in times of disaster with a sense of solidarity. The guideline stipulates BOKOMI’s structure, activities, and support from the city government (Figure 1).
When a BOKOMI is organized, it is first necessary to gain a consensus among local residents. The residents and the representatives of local civic groups (neighborhood residents’ associations, senior citizens’ associations, women’s associations, PTA, etc.) in the elementary school zone and the representatives of the city government (local ward office and fire station) have meetings and discuss the establishment of a BOKOMI. In the meetings, the rules, structure, executive members, and activities of the organization are determined. Eventually the establishment of a BOKOMI is determined at a residents’ general meeting. Later, the city government provides various support measures to help nurture the activities of the BOKOMI.
BOKOMI are composed of the headquarters and block groups. The headquarters consists of a chairman and other executive members, who make decisions as an organization and are in charge of general affairs. In most cases, the executive members are representatives from local civic groups such as the neighborhood residents’ association and women’s association.
Figure 2. Example of BOKOMI Structure
Information Team
(Awareness-raising for Disaster Reduction, Implementation
of Information-Transmission Drills, etc
Firefighting Team
(Instruction on Firefighting Operations, Implementation of
Initial Firefighting Drills, etc.)
Headquarters Rescue and Aid Team
・ Chairman (Learning of First-aid Techniques, Implementation of Rescue
・ Vice Chairman and Aid Drills, etc.)
・ Accountant Evacuation Guidance Team
・ Team Leaders (Block (Creation of Community Safety Map, Implementation of
Leaders) Evacuation Drills, etc.)
Food and Water Supply Team
(Planning of Stockpiles, etc.)
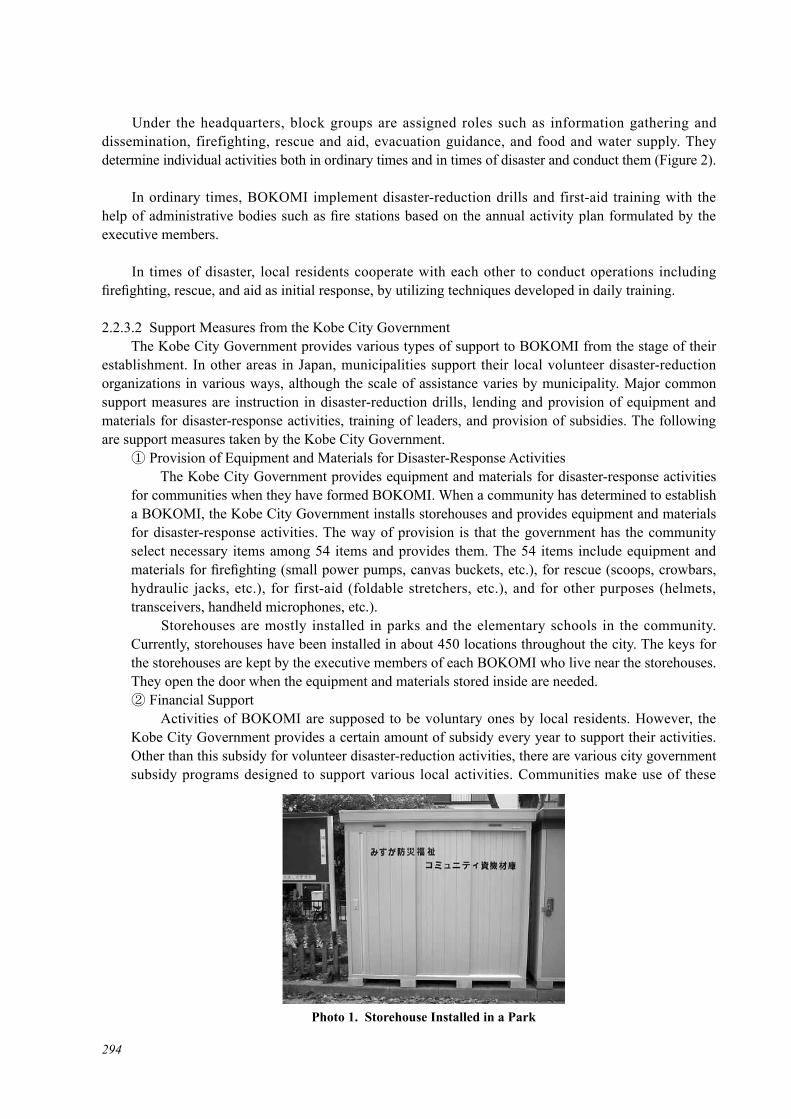
294
Under the headquarters, block groups are assigned roles such as information gathering and dissemination, firefighting, rescue and aid, evacuation guidance, and food and water supply. They determine individual activities both in ordinary times and in times of disaster and conduct them (Figure 2).
In ordinary times, BOKOMI implement disaster-reduction drills and first-aid training with the help of administrative bodies such as fire stations based on the annual activity plan formulated by the executive members.
In times of disaster, local residents cooperate with each other to conduct operations including firefighting, rescue, and aid as initial response, by utilizing techniques developed in daily training.
2.2.3.2 Support Measures from the Kobe City Government The Kobe City Government provides various types of support to BOKOMI from the stage of their establishment. In other areas in Japan, municipalities support their local volunteer disaster-reduction organizations in various ways, although the scale of assistance varies by municipality. Major common support measures are instruction in disaster-reduction drills, lending and provision of equipment and materials for disaster-response activities, training of leaders, and provision of subsidies. The following are support measures taken by the Kobe City Government.① Provision of Equipment and Materials for Disaster-Response Activities The Kobe City Government provides equipment and materials for disaster-response activities for communities when they have formed BOKOMI. When a community has determined to establish a BOKOMI, the Kobe City Government installs storehouses and provides equipment and materials for disaster-response activities. The way of provision is that the government has the community select necessary items among 54 items and provides them. The 54 items include equipment and materials for firefighting (small power pumps, canvas buckets, etc.), for rescue (scoops, crowbars, hydraulic jacks, etc.), for first-aid (foldable stretchers, etc.), and for other purposes (helmets, transceivers, handheld microphones, etc.). Storehouses are mostly installed in parks and the elementary schools in the community. Currently, storehouses have been installed in about 450 locations throughout the city. The keys for the storehouses are kept by the executive members of each BOKOMI who live near the storehouses. They open the door when the equipment and materials stored inside are needed.② Financial Support Activities of BOKOMI are supposed to be voluntary ones by local residents. However, the Kobe City Government provides a certain amount of subsidy every year to support their activities. Other than this subsidy for volunteer disaster-reduction activities, there are various city government subsidy programs designed to support various local activities. Communities make use of these
Photo 1. Storehouse Installed in a Park

295
subsidies to cover part of the expenses for their activities on disaster reduction, environment protection, crime prevention, welfare, etc. The Kobe City Government offers a subsidy up to 140,000 yen per year to each BOKOMI as an operation subsidy. The operation subsidy is used to cover part of the expenses for holding drills and meetings, purchasing equipment and materials for disaster-response activities, and other activities. The city government additionally offers a subsidy of up to 200,000 yen to BOKOMI that have proposed the implementation of pioneering activities (the amounts quoted here are those for fiscal 2009). Pioneering activities proposed by communities are required to be activities befitting the community’s characteristics as well as the seasons in which the activities are to be held. The Kobe City Fire Bureau sets up a committee to judge the proposals and offers subsidies for the best proposals within the budget every year. In fiscal 2009, there were 53 proposals from BOKOMI, and 40 of these were adopted. Examples of the adopted proposals are disaster-reduction athletic meet (that consists of programs where participants can enjoy disaster-reduction drills in a competition style) and disaster-reduction camp (in which participants learn about disaster reduction while staying in an elementary school designated as a local evacuation shelter). Such pioneering and original activities as these qualify for the proposed activity subsidies.③ Area Firefighting System In Kobe, for one BOKOMI, two or three staff members of the local fire station are assigned as exclusive supervisors and directly support local disaster-reduction activities. Their support includes advice on the planning and implementation of disaster-reduction drills, assistance with clerical works such as application for a subsidy, and participation in local meetings. This system started in 2007. This system, a pioneering effort, was created by the Kobe City Government and was designed to build and maintain a close relationship between communities and the government on a regular basis so as to effectively promote community-based disaster-reduction activities. This effort made it easier for communities, especially those in which BOKOMI activities were lacking, to consult with firefighters about the implementation of drills and other issues since firefighters became directly involved in the local activities. Therefore, the number of disaster-reduction drills conducted by BOKOMI in the entire city area increased about 1.5 times as compared to that before the system was introduced.④ Fostering of Civil Disaster-Reduction Leaders Following the Kobe Earthquake, leaders able to organize residents’ response activities were absent. Based on this lesson, each fire station in the city offers training programs to foster leaders who will play an important role not only in times of disaster but also as instructors for drills in ordinary times. Participants learn about hints for leaders, how to handle equipment and materials for disaster-response activities, first-aid training, and so on. They also learn coaching methods so that they can instruct local residents in their communities. The Kobe City Government aims to foster one civil disaster-reduction leader per 30 to 50 households and offers training to about 700 citizens every year. As of April 2009, 7,817 people have completed the training.⑤ Other Support Measures As other support measures, when disaster-reduction drills are held, the city government dispatches firefighters, members of volunteer firefighter units, and fire engines and lends equipment and materials for disaster-response activities. The government also sends instructors for first-aid training and provides leaflets and brochures for awareness-raising. Moreover, in order to encourage BOKOMI to conduct disaster-reduction drills, the Kobe City Government has published a guidebook for disaster-reduction activities that introduces various

296
programs for disaster-reduction drills.
2.2.3.3 Examples of Distinctive Local Activities BOKOMI which have been established in Kobe since the earthquake are still conducting various activities even 15 years later. In fiscal 2008, more than 800 activities such as disaster-reduction drills and first-aid training (which include small drills by block groups) were held by BOKOMI in the city. Distinctive activities among them are as follows.① Disaster-Reduction Junior Teams Some communities involve elementary and junior-high school students in their BOKOMI activities. Local elementary and junior-high school students are registered as members of Disaster-Reduction Junior Teams and conduct activities. Currently there are 15 Junior Teams in the city. The members of Junior Teams participate in various disaster-reduction drills and receive first-aid training. In some communities, members conduct activities regularly every month. Such efforts not only attract local children to disaster-reduction activities but also foster an interest in playing a leading role in community-based disaster-reduction activities in the future.
② Disaster-Reduction Athletic Meet As mentioned above, this activity consists of programs in which participants can enjoy disaster-reduction drills in a competition style. It provides local residents and children with an opportunity to learn about disaster reduction while interacting with each other. The athletic meets are held at local elementary schools as part of the schools’ annual events. The school staff and firefighters provide instruction and manage the activities, but members of local BOKOMI are also involved in the activities so that communities, schools, and children can jointly conduct the activities.
Photo 2. Guidebook for BOKOMI Activities
Photo 3. Activity of a Junior Team (Junior-High School Students)

297
The programs of the athletic meets include: Loudly Reporting Game, Telephone Game, Yes-No Disaster-Reduction Quiz, Doll Transportation using a Blanket, Shooting Game using a Fire Extinguisher, Soup-Run Training, Transportation of the “Injured” using a Stretcher, and Bucket Brigade. These programs are conducted in the style of a competition. The program shown in Photo 4 is a caterpillar race in which participants compete by crawling together through a cardboard enclosure toward the goal while learning how to evacuate an area filled with smoke. Since participants cannot see the direction of movement, members of BOKOMI are indicating the direction by making sounds.③ Creation of Community Safety Map This activity is designed to share information on local hazards and useful resources for disaster reduction among residents. Local residents walk around their community, put the collected information on a map to make a community safety map, and distribute it to all the households in the community. Currently more than 160 of 191 BOKOMI have created their own community safety maps. This is a suitable activity to motivate local residents to consider the importance of their community.
④ Overnight Stay at Local Evacuation Shelter (Disaster-Reduction Junior Camp) This activity provides participants with an opportunity to stay overnight in the gymnasium of a local elementary school, which becomes a local evacuation shelter in times of disaster, and to experience evacuation life. In this activity, various disaster- reduction drills are also held to encourage participants to consider disaster reduction in their community. Some BOKOMI conduct this activity targeting elementary and junior-high school students as part of disaster education, calling the activity Disaster Reduction Junior Camp.
Photo 4. Example of an Athletic Meet Program -- Fire Evacuation Game
Photo 5. Walking around the Community Photo 6. Example of Community Safety Map
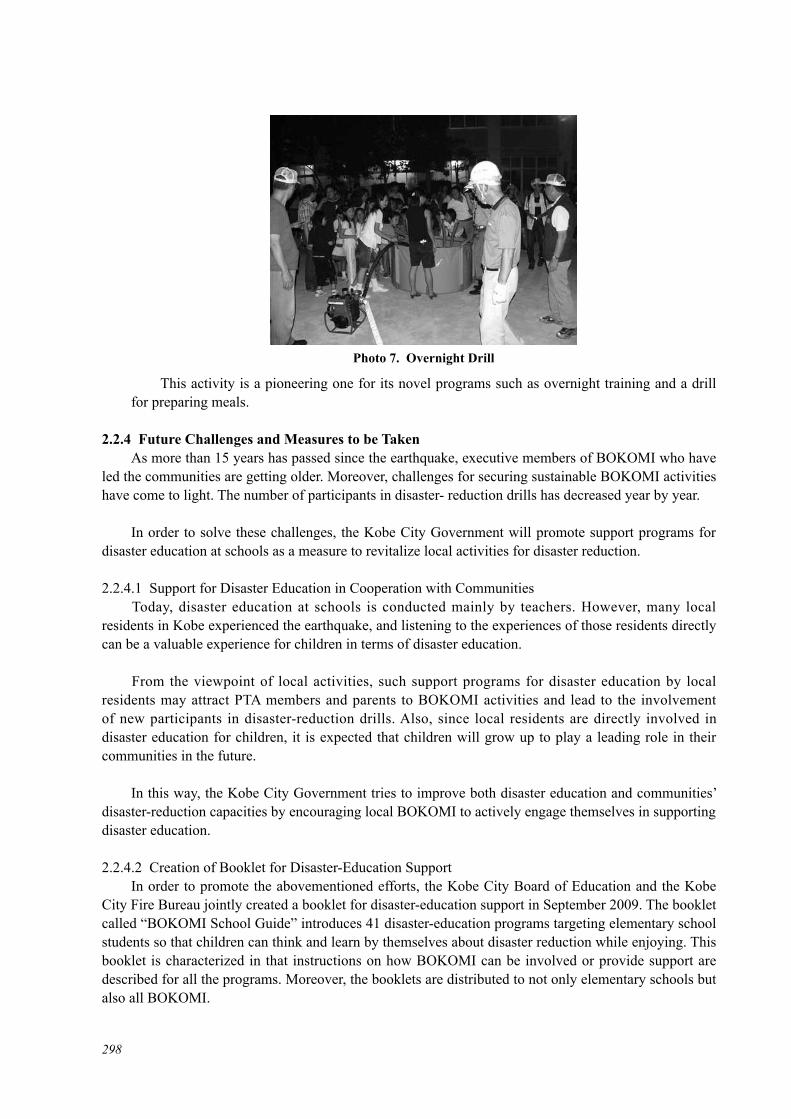
298
This activity is a pioneering one for its novel programs such as overnight training and a drill for preparing meals.
2.2.4 Future Challenges and Measures to be Taken As more than 15 years has passed since the earthquake, executive members of BOKOMI who have led the communities are getting older. Moreover, challenges for securing sustainable BOKOMI activities have come to light. The number of participants in disaster- reduction drills has decreased year by year.
In order to solve these challenges, the Kobe City Government will promote support programs for disaster education at schools as a measure to revitalize local activities for disaster reduction.
2.2.4.1 Support for Disaster Education in Cooperation with Communities Today, disaster education at schools is conducted mainly by teachers. However, many local residents in Kobe experienced the earthquake, and listening to the experiences of those residents directly can be a valuable experience for children in terms of disaster education.
From the viewpoint of local activities, such support programs for disaster education by local residents may attract PTA members and parents to BOKOMI activities and lead to the involvement of new participants in disaster-reduction drills. Also, since local residents are directly involved in disaster education for children, it is expected that children will grow up to play a leading role in their communities in the future.
In this way, the Kobe City Government tries to improve both disaster education and communities’ disaster-reduction capacities by encouraging local BOKOMI to actively engage themselves in supporting disaster education.
2.2.4.2 Creation of Booklet for Disaster-Education Support In order to promote the abovementioned efforts, the Kobe City Board of Education and the Kobe City Fire Bureau jointly created a booklet for disaster-education support in September 2009. The booklet called “BOKOMI School Guide” introduces 41 disaster-education programs targeting elementary school students so that children can think and learn by themselves about disaster reduction while enjoying. This booklet is characterized in that instructions on how BOKOMI can be involved or provide support are described for all the programs. Moreover, the booklets are distributed to not only elementary schools but also all BOKOMI.
Photo 7. Overnight Drill

299
The city government expects that the entire population will consider disaster reduction and promote activities by building a system of disaster-education support among communities, schools, and the city government (the Fire Bureau) with this booklet as a common tool. The city government will introduce this effort to other areas inside and outside Japan as a model that steers the direction of activities by volunteer disaster-reduction organizations. Recently, the Fire Bureau has created a guidebook in English jointly with the JICA (Japan International Cooperation Agency).
2.2.5 Conclusion Following the Kobe Earthquake, people realized the importance of interpersonal relationships and the significance of mutual help, through their own experience.
From these lessons, it can be said that it is important to make efforts in ordinary times to build a structure which can respond to disasters effectively, and BOKOMI’s steady efforts on a daily basis will be useful in emergencies.
BOKOMI also play an important role in passing on the experiences of the earthquake disaster to the next generation. In this sense, BOKOMI’s active involvement in disaster education helps develop disaster-education programs that make an impression on those children who will one day be responsible for the future of Kobe.
Kobe received assistance from inside and outside Japan following the earthquake. Now that the city has recovered, it is considered necessary to convey the knowledge gained from the earthquake and disseminate information on efforts such as BOKOMI activities and disaster-education support programs to related people both inside and outside Japan by accepting visits or giving lectures.
The city government also has created a training course on community-based disaster management jointly with JICA Hyogo as a means of conveying its knowledge overseas and accepts participants from foreign countries to introduce BOKOMI and other efforts in Kobe. The city government will continue this activity, expecting that the training will contribute to disaster reduction in other countries.
Another large-scale earthquake may hit Kobe in the future, and it is hoped that children who receive disaster education led by BOKOMI to prepare for a coming big earthquake will grow up to play a role as disaster-reduction leaders in the next 10 to 20 years.
Reference 1) Fire and Disaster Management Agency, Ministry of Internal Affairs and Communications (2009). Shobo
hakusho heisei 21 nendo [White Paper on Fire Service 2009], Appendix 25, Tokyo.
2.3 Disaster-Mitigation Education (DME) in Kobe2.3.1 Introduction Disaster education undertaken by the Kobe City Board of Education since the Kobe Earthquake has placed emphasis on children’s knowledge, skills, and emotional support as a basic concept and focused on education which fosters children’s zest for living through creation and utilization of new materials and improvement of curricula.
Disaster education in Kobe is characterized by its learning style: schools (students) and communities (local residents) learn together in the disaster-mitigation perspective. This contributes to the enhancement of local capacities for disaster reduction by offering learning curricula that contain both elements of school education and elements of social education. This disaster-mitigation education

300
(DME) model is gradually being introduced not only in other areas of Japan but also in disaster-stricken countries through advice and guidance as a tool of international cooperation and assistance.
In Kobe, DME helps local residents to promote crisis management activities as well as, through those activities, to discover and foster local human resources and realize vibrant communities. In this way, DME contributes to the reconstruction of local governance and plays a role in creating a culture of disaster reduction in communities.
2.3.2 The Kobe Earthquake and Education in Kobe2.3.2.1 The Earthquake and Recovery of Education The Kobe Earthquake caused unprecedented damage to the field of education in Kobe. In Kobe, 179 students died; 403 lost family members; and 27 became orphans. Meanwhile, 11 school staff members died, and more than 5,000 of the about 7,000 school staff members were affected to some extent such as loss of family members and collapse of houses.
Under these severe situations, teachers and other educational personnel were required to handle situations they never experienced: recovery of education, restart of school services, management of school facilities both as local evacuation shelters and schools, mental health care for students, etc.
In March 1995, the Conference of Urgent Proposal for Rebuilding of Education in Kobe was established to discuss rebuilding and recovery of education in Kobe. In the conference, not only short-term plans to recover school services as soon as possible but also mid- and long-term plans to utilize the lessons learned from the earthquake for developing new school educational programs were proposed.
Under the theme of developing new education that utilizes the earthquake experiences, development of disaster education at school, education that utilizes the earthquake experiences, and renewal of education in Kobe were points included in the proposals.
As a result, disaster education in Kobe has undergone dramatic changes since the earthquake. Renewed disaster education in Kobe basically aims at having students acquire positive attitudes toward disaster reduction based on respect for life as well as the necessity of knowledge and skills for disaster reduction.
Major efforts made by the Kobe City Board of Education on disaster mitigation education (DME) since the earthquake are described in Table 1.
Table 1. Transition of Policies on Disaster Mitigation EducationFiscal 1995 Holding of the Kobe City Education Forum; Study on Disaster Education; Creation of a
Supplementary Reader on DME, Shiawase Hakobo (Bringing Happiness) Fiscal 1996 Formulation of Guidelines for Preparing a School Manual for Earthquake Disaster Management;
Holding of the National Junior-High School Student Disaster-Reduction Forum in Kobe, Appointment of Teachers in Charge of Education Recovery; Establishment of the Disaster-Education Promotion Committee; Creation of a Teachers’ Reference Material called Disaster Education to Foster Children’s Zest for Living and Revision of Supplementary Materials
Fiscal 1997-Fiscal 1999
Holding of the Kobe City Workshop on DME; Holding of the Liaison Conference of Pilot Schools on DME Promotion
Fiscal 2000- Development of Disaster-Reduction Junior Teams and Students’ Acquisition of Civil Lifeguard Qualification; Holding of the 21th Century Kobe Youth Forum
Fiscal 2005- Revision of Shiawase Hakobo; Creation of a Visual Version of Shiawase HakoboFiscal 2008 Creation of Teaching Materials Following a Flashflood Accident near the Toga River;
Establishment of the DME Advisor System
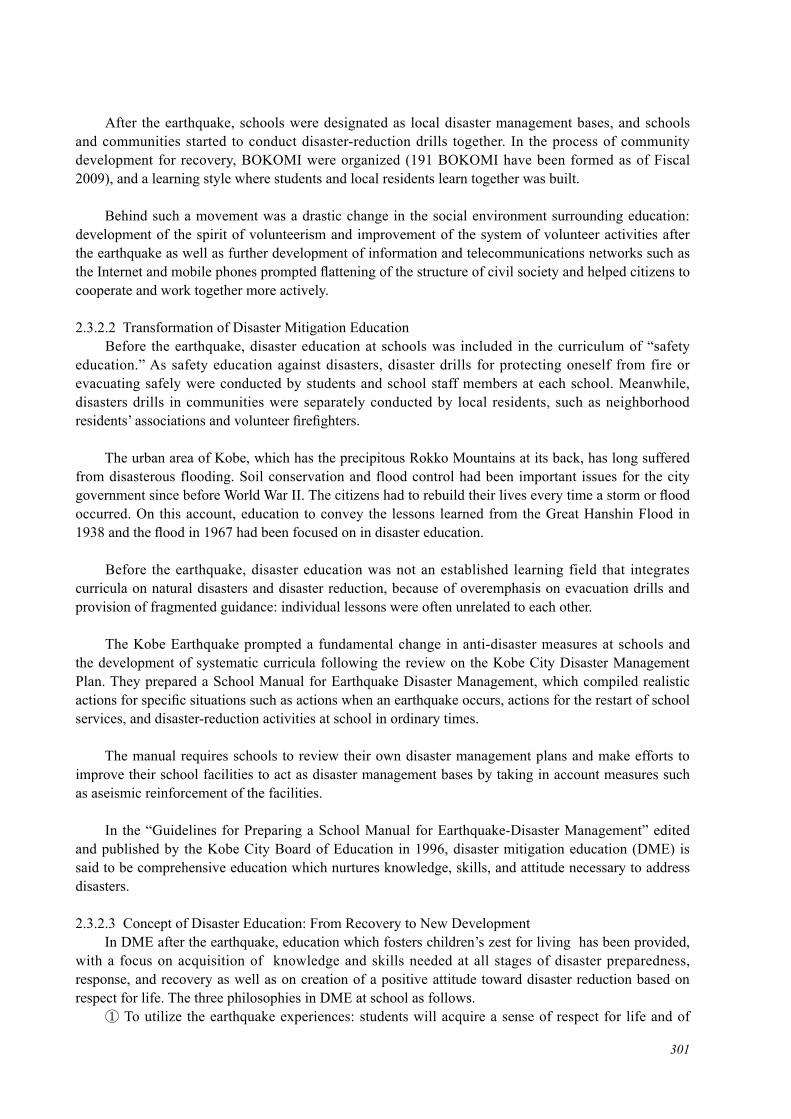
301
After the earthquake, schools were designated as local disaster management bases, and schools and communities started to conduct disaster-reduction drills together. In the process of community development for recovery, BOKOMI were organized (191 BOKOMI have been formed as of Fiscal 2009), and a learning style where students and local residents learn together was built.
Behind such a movement was a drastic change in the social environment surrounding education: development of the spirit of volunteerism and improvement of the system of volunteer activities after the earthquake as well as further development of information and telecommunications networks such as the Internet and mobile phones prompted flattening of the structure of civil society and helped citizens to cooperate and work together more actively.
2.3.2.2 Transformation of Disaster Mitigation Education Before the earthquake, disaster education at schools was included in the curriculum of “safety education.” As safety education against disasters, disaster drills for protecting oneself from fire or evacuating safely were conducted by students and school staff members at each school. Meanwhile, disasters drills in communities were separately conducted by local residents, such as neighborhood residents’ associations and volunteer firefighters.
The urban area of Kobe, which has the precipitous Rokko Mountains at its back, has long suffered from disasterous flooding. Soil conservation and flood control had been important issues for the city government since before World War II. The citizens had to rebuild their lives every time a storm or flood occurred. On this account, education to convey the lessons learned from the Great Hanshin Flood in 1938 and the flood in 1967 had been focused on in disaster education.
Before the earthquake, disaster education was not an established learning field that integrates curricula on natural disasters and disaster reduction, because of overemphasis on evacuation drills and provision of fragmented guidance: individual lessons were often unrelated to each other.
The Kobe Earthquake prompted a fundamental change in anti-disaster measures at schools and the development of systematic curricula following the review on the Kobe City Disaster Management Plan. They prepared a School Manual for Earthquake Disaster Management, which compiled realistic actions for specific situations such as actions when an earthquake occurs, actions for the restart of school services, and disaster-reduction activities at school in ordinary times.
The manual requires schools to review their own disaster management plans and make efforts to improve their school facilities to act as disaster management bases by taking in account measures such as aseismic reinforcement of the facilities.
In the “Guidelines for Preparing a School Manual for Earthquake-Disaster Management” edited and published by the Kobe City Board of Education in 1996, disaster mitigation education (DME) is said to be comprehensive education which nurtures knowledge, skills, and attitude necessary to address disasters.
2.3.2.3 Concept of Disaster Education: From Recovery to New Development In DME after the earthquake, education which fosters children’s zest for living has been provided, with a focus on acquisition of knowledge and skills needed at all stages of disaster preparedness, response, and recovery as well as on creation of a positive attitude toward disaster reduction based on respect for life. The three philosophies in DME at school as follows.① To utilize the earthquake experiences: students will acquire a sense of respect for life and of
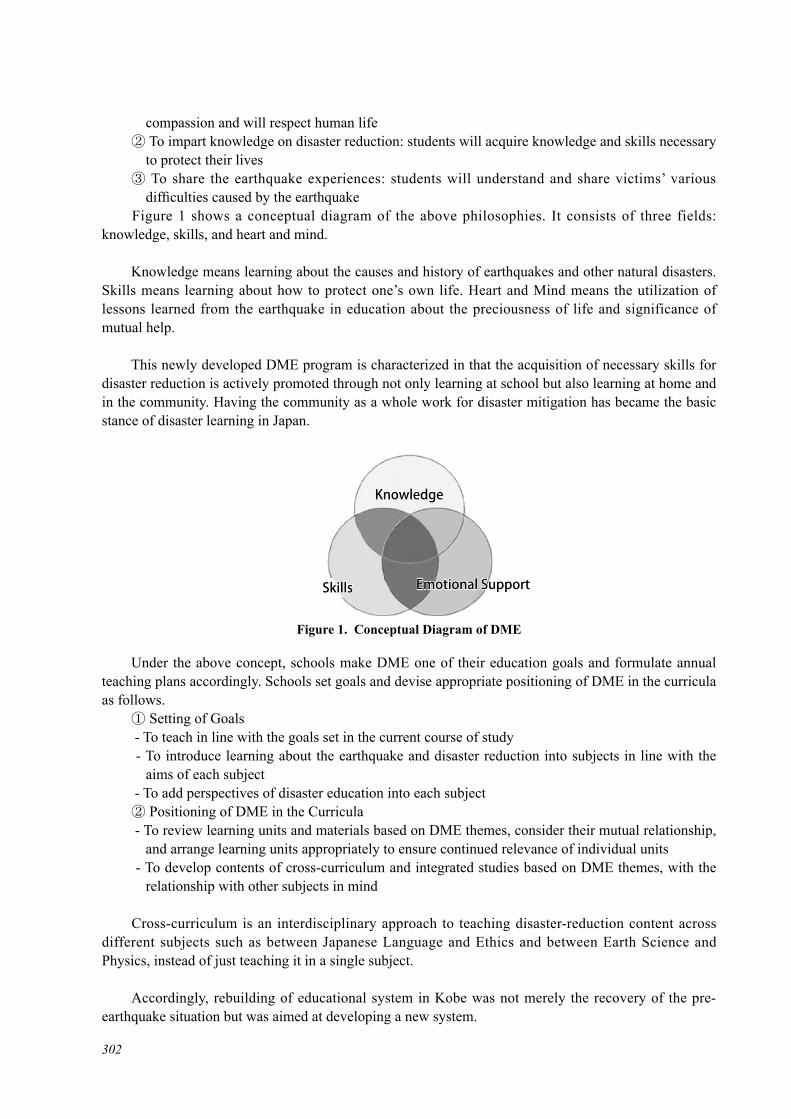
302
compassion and will respect human life② To impart knowledge on disaster reduction: students will acquire knowledge and skills necessary
to protect their lives③ To share the earthquake experiences: students will understand and share victims’ various
difficulties caused by the earthquake Figure 1 shows a conceptual diagram of the above philosophies. It consists of three fields: knowledge, skills, and heart and mind.
Knowledge means learning about the causes and history of earthquakes and other natural disasters. Skills means learning about how to protect one’s own life. Heart and Mind means the utilization of lessons learned from the earthquake in education about the preciousness of life and significance of mutual help.
This newly developed DME program is characterized in that the acquisition of necessary skills for disaster reduction is actively promoted through not only learning at school but also learning at home and in the community. Having the community as a whole work for disaster mitigation has became the basic stance of disaster learning in Japan.
Under the above concept, schools make DME one of their education goals and formulate annual teaching plans accordingly. Schools set goals and devise appropriate positioning of DME in the curricula as follows.① Setting of Goals - To teach in line with the goals set in the current course of study - To introduce learning about the earthquake and disaster reduction into subjects in line with the
aims of each subject - To add perspectives of disaster education into each subject② Positioning of DME in the Curricula - To review learning units and materials based on DME themes, consider their mutual relationship,
and arrange learning units appropriately to ensure continued relevance of individual units - To develop contents of cross-curriculum and integrated studies based on DME themes, with the
relationship with other subjects in mind
Cross-curriculum is an interdisciplinary approach to teaching disaster-reduction content across different subjects such as between Japanese Language and Ethics and between Earth Science and Physics, instead of just teaching it in a single subject.
Accordingly, rebuilding of educational system in Kobe was not merely the recovery of the pre-earthquake situation but was aimed at developing a new system.
Figure 1. Conceptual Diagram of DME
KnowledgeKnowledge
Emotional SupportEmotional SupportSkillsSkills

303
2.3.3 DME at Schools DME in Kobe is implemented in cycle: (a) formulation of the annual teaching plan, (b) preparation of curricula and learning materials, and (c) implementation of lessons and response to new challenges.
2.3.3.1 Formulation and Implementation of DME Curricula at Schools Schools formulate the annual teaching plan as shown in Table 2 and conduct school events and lessons in line with it. In conjunction with preparation of DME curricula, the school manual for disaster management is revised.
Table 2. DME Annual Teaching Plan for an Elementary School (Excerpt)School Term
1st School Term 2nd School Term 3rd School Term
Events on Disaster Reduction
Formulation of the Annual Teaching Plan
Lectures on Disaster Reduction
Disaster-Reduction Day, Disaster-Reduction Assembly,
Drill against Suspicious Individuals
Anti-Crime Study Earthquake Drill
Handover Drill, Water Safety Program
Fire Evacuation Drill Inspection of Anti-Disaster Equipment
Community Safety Patrol Community Patrol Local Comprehensive Disaster- Reduction Drill
Under the individual annual teaching plans, various events were conducted at elementary and junior-high schools as shown in Table 3. In comparison between almost 10 years and 15 years after the earthquake, there was an increase in the number of elementary schools which had anti-disaster weeks as well as drills to handover students to their parents in view of the safety of students in an emergency. Meanwhile in junior-high schools, more and more schools implemented disaster-learning programs and evacuation drills.
Table 3. Number of Kobe City Municipal Elementary and Junior-High Schools that Implemented Events Related to the Earthquake by Type of Event
School Type Fiscal Year Assembly Anti-Disaster
Week
Disaster Learning
Class Visit Evacuation Drill
Handover Drill
Elementary School
20042008
79137
3362
147163
6382
131135
4885
Junior-High School
20042008
8364
122
4263
32
3344
20
Note. The data were compiled by the Kobe City Board of Education in Fiscal 2008.
Table 4 shows the implementation status of disaster drills in Fiscal 2008.
Table 4. Number of Kobe City Municipal Elementary and Junior-High Schools that Implemented Disaster-Reduction Drills by Type of Disaster Scenario
School Type Fiscal Year Fire Earthquake Comprehensive Disaster
SuspiciousIndividual
Storm and Flood
Elementary School
20042008
170169
129169
52—
79—
127
Junior-High School
20042008
5983
3667
19—
12—
04
Note. The data were compiled by the Kobe City Board of Education in Fiscal 2008. Comprehensive Disaster means drills against both earthquake and fire. Regarding the comprehensive disaster drills and drills against suspicious individuals, the survey was not conducted in Fiscal 2008.

304
2.3.3.2 Disaster Mitigation Education (DME) Learning Materials and Implementation of Lessons Learning materials created and revised after the earthquake consist of (a) supplementary readers, (b) visual materials, and (c) additional materials.① Creation and Utilization of a supplementary reader Shiawase Hakobo (Bringing Happiness) Following the proposals at the Conference of Urgent Proposal for Rebuilding of Education in Kobe held in 1995, a supplementary reader was created in 1995 (revised in 2005), and learning curricula that utilize it have been prepared at all municipal elementary and junior-high schools in the city. When the supplementary reader was revised, experience-based learning materials that include scientific knowledge on natural disasters such as tsunamis, volunteer activities, and creation of a community safety map were added, reflecting the increase in students who did not experience the earthquake (see Table 5).
Table 5. Aims of the Supplementary Reader (Junior-High School Version)Field Theme Aim and ContentKnowledge Chapter 1: Here is What
HappenedDamage caused by the earthquake; How people felt
To convey to students who didn’t experience the Kobe Earthquake the damage it caused and how people felt at that time, while showing video and photo materials of the earthquake and data on the damage.
Skills Chapter 2: Protect LivesCauses of ear thquakes; Natural disasters in Kobe; First-aid
To have students learn about the cause of natural disasters such as earthquakes and tsunamis, the history of flood disasters, how to respond to fire and earthquake disasters, how to use information equipment, diet in emergency situations, etc., in order to protect lives.
Heart and Mind
Chapter 3: Live TogetherVolunteer activities in the disaster-hit areas; Warm encouragement
To make students consider what they can do when disasters occur in other areas inside and outside Japan, such as fundraising and support activities for the affected areas, in return for warm assistance offered just after the earthquake.
The following are examples of disaster-education lessons using the supplementary reader by subject. Efforts are made to enable students to learn the essence of disaster reduction in every subject (see Table 6).
Table 6. Examples of Utilization of the Supplementary Reader by Subject (Junior-High School Version)Subject Examples of Expected Utilization
(Names of the units in the supplementary reader are written in italics.)Social StudiesScienceTechnical ArtsHome EconomicsEnglishMusic
Flood Disasters in Kobe, Natural Disasters in JapanWhy a Large-Scale Earthquake Occurred in KobeUtilization of Information ProcessorLet’s Review Home Security, Diet in Emergency SituationsA Letter from President Clinton of the United States Shiawase Hakoberu Youni (Bring Happiness to the World)
Ethics Family love: When the Past Memory Seems Bright to Me Sense of gratitude: Smell of Yakisoba (pan-fried noodles)Preciousness of life: Together with Orange OsmanthusSpirit of volunteerism: Ai’s Diary about Volunteer Activities
Special Activities Together with People in the CommunityPeriods of Integrated Studies
Let’s Create a Community Safety MapFirst-Aid Methods Useful in Emergencies
School Events How Will You Act at a Time like This?Protect Yourself First. Then, What Will You Do Next?
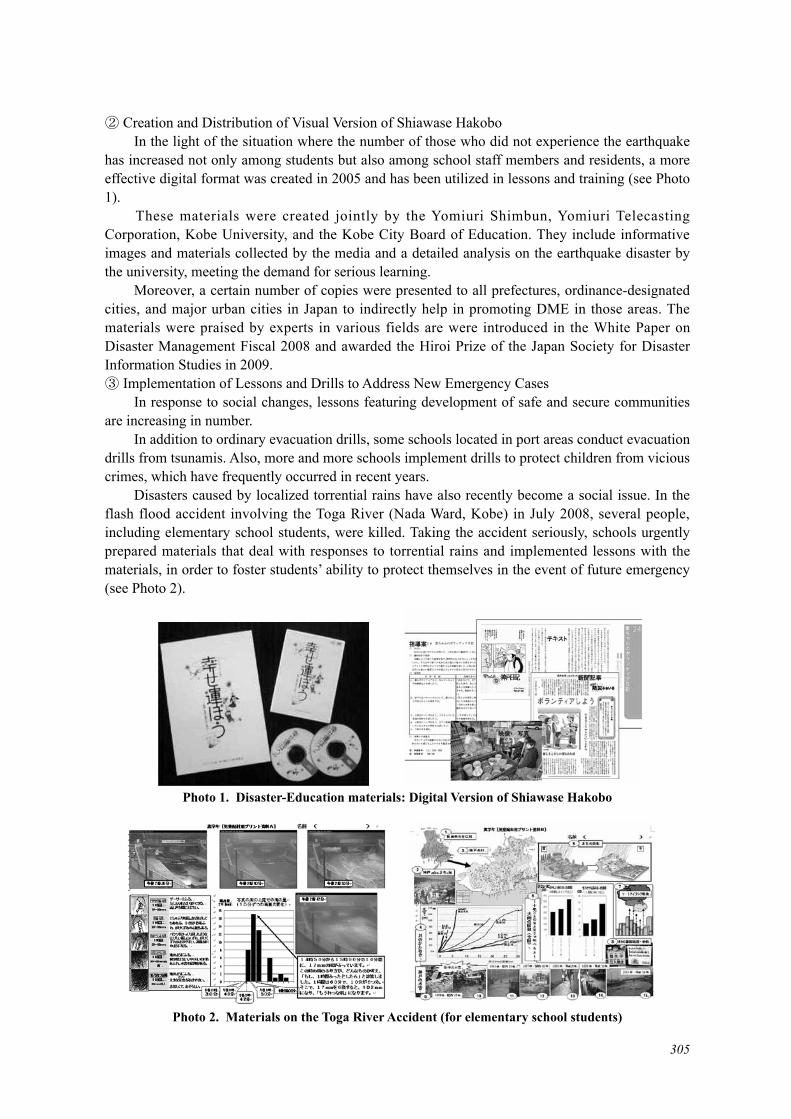
305
② Creation and Distribution of Visual Version of Shiawase Hakobo In the light of the situation where the number of those who did not experience the earthquake has increased not only among students but also among school staff members and residents, a more effective digital format was created in 2005 and has been utilized in lessons and training (see Photo 1). These materials were created jointly by the Yomiuri Shimbun, Yomiuri Telecasting Corporation, Kobe University, and the Kobe City Board of Education. They include informative images and materials collected by the media and a detailed analysis on the earthquake disaster by the university, meeting the demand for serious learning. Moreover, a certain number of copies were presented to all prefectures, ordinance-designated cities, and major urban cities in Japan to indirectly help in promoting DME in those areas. The materials were praised by experts in various fields are were introduced in the White Paper on Disaster Management Fiscal 2008 and awarded the Hiroi Prize of the Japan Society for Disaster Information Studies in 2009.③ Implementation of Lessons and Drills to Address New Emergency Cases In response to social changes, lessons featuring development of safe and secure communities are increasing in number. In addition to ordinary evacuation drills, some schools located in port areas conduct evacuation drills from tsunamis. Also, more and more schools implement drills to protect children from vicious crimes, which have frequently occurred in recent years. Disasters caused by localized torrential rains have also recently become a social issue. In the flash flood accident involving the Toga River (Nada Ward, Kobe) in July 2008, several people, including elementary school students, were killed. Taking the accident seriously, schools urgently prepared materials that deal with responses to torrential rains and implemented lessons with the materials, in order to foster students’ ability to protect themselves in the event of future emergency (see Photo 2).
Photo 1. Disaster-Education materials: Digital Version of Shiawase Hakobo
Photo 2. Materials on the Toga River Accident (for elementary school students)

306
2.3.4 Disaster Education in Communities2.3.4.1 Cooperation with Schools One of the lessons learned from the Kobe Earthquake is the importance of self help, mutual help, and public assistance. Following the fact that strong ties in communities developed in ordinary times were particularly useful in times of disaster and in emergencies, disaster drills in communities have fundamentally changed.
In chapter five of the Kobe City Disaster Management Plan entitled “Awareness-raising and Human Resources Cultivation on Development of Safe and Secure Communities,” enhancement of local capabilities for disaster reduction through activities such as ones led by BOKOMI is advocated.
Accordingly, DME is promoted in cooperation with parents and local communities, and various disaster drills such as fire drills, evacuation drills, soup-run drills, and handover drills are conducted jointly with parents and local BOKOMI at many elementary and junior-high schools. Regarding the method of the drills, more and more schools conduct drills for emergency response without notifying the participants in advance.
Moreover, as the establishment of BOKOMI and their activities have been promoted, schools that participate in local disaster-reduction activities as part of school education activities have been increasing in number.
① Disaster-Reduction Junior Team Some BOKOMI in Kobe have Junior Teams which mainly consist of junior-high school students. To date, 15 Junior Teams have been formed. To cite a case, the Hiyodori-dai BOKOMI Disaster-Reduction Junior Team, which was established in 2001 in Kita Ward, Kobe, contributes to not only disaster-related activities in the community but also revitalization of the community. In the Hiyodori-dai housing estate, people 65 years of age or older make up 45.3% of the total population, far beyond the city-wide average of 34.4%. Since the community is rapidly aging with low birthrates, both welfare and disaster reduction are important issues. The Junior Team consists of 150 students of the Kobe City Municipal Hiyodori-dai Junior-High School. Students of the Kobe City Municipal Hiyodori-dai Elementary School also participate in the activities. The students registered as members and participate in the activities of their own free will. This Junior Team is characterized in that all the members maintain civil lifeguard certification and disseminate their knowledge and experiences in disaster-reduction activities such as firefighting drills to local residents. Inspired by the students’ activities, many of their parents have started to show an understanding of and interest in disaster-reduction activities and to participate in them. The Junior Team is a unit that plays an important role in community activities. Therefore, the participation rate in local disaster-reduction drills is always high. The members are highly
Photo 3. Rescue Drill using Rescue Tools Photo 4. Building an Arbor

307
motivated to study, and the Junior Team is indispensable in revitalizing the community. Their vigorous activities are largely supported by understanding and cooperation of the Hiyodori-dai Junior-High School and Hiyodori-dai Elementary School. In addition to that, a retired firefighter who worked in the Kobe City Fire Bureau is an executive member of this BOKOMI, serving as a liaison with the Fire Bureau and the Hiyodori-dai Branch of Kita Fire Station, which also contributes in promotion of the activities. In monthly meetings, not only disaster-reduction drills but also a wide variety of learning curricula including environmental learning and walking around the community are implemented. For example, the members made rescue tools called Shinsai Konbo (handmade rescue tools) by processing thinned wood planted around their housing estate and built an arbor for local residents. When building the arbor, a local architect explained about aseismic structures as a volunteer so that the members of the Junior Team could learn about aseismic building structure and work together with local residents (see Photos 3 and 4). The Junior Team is actively involved in the summer festival and other local events, by engaging themselves in the operations of the events and demonstrating disaster drills. In this way, they contribute to enhancement of local capability for disaster reduction and revitalization of the community. Seeing their activities, local residents and their parents started to show interest in disaster reduction, participating in monthly drills and, in some cases, leading the activities as civil instructors. The Junior Team also plays a role in discovering local human resources. Moreover, adults in the community started to recognize the high potential of the Junior Team from a local disaster-reduction viewpoint, and more adults now support and participate in their activities. In this way, the presence of the Junior Team creates an additional positive effect on community development. Since their activities are community-based and they are expected to be leaders of the community in the future, the Junior Team gains trust from local residents and bears a leading role in disaster learning in the community and at home. Activities like those of the Hiyodori-dai Junior Team can be said to be the fusion point of school education and social education, with disaster reduction as the key, as well as to be the origin of local cooperation in which children also join in the development of communities. ② An Example of Cooperation between Schools and Communities: Disaster-Reduction Athletic
Meet (Elementary School: Gymnastics and Integrated Studies) Proposals from BOKOMI are sometimes adopted in DME curricula at schools. For example, the Motoyama No. 2 Elementary School Area BOKOMI holds a disaster-reduction athletic meet every year jointly with the elementary school as part of its local activities for disaster reduction (see Photos 5 and 6).
Photo 5. Disaster-Reduction Athletic Meet(relay race with collapsible stretchers)
Photo 6. Disaster-Reduction Athletic Meet(sand bucket brigade)
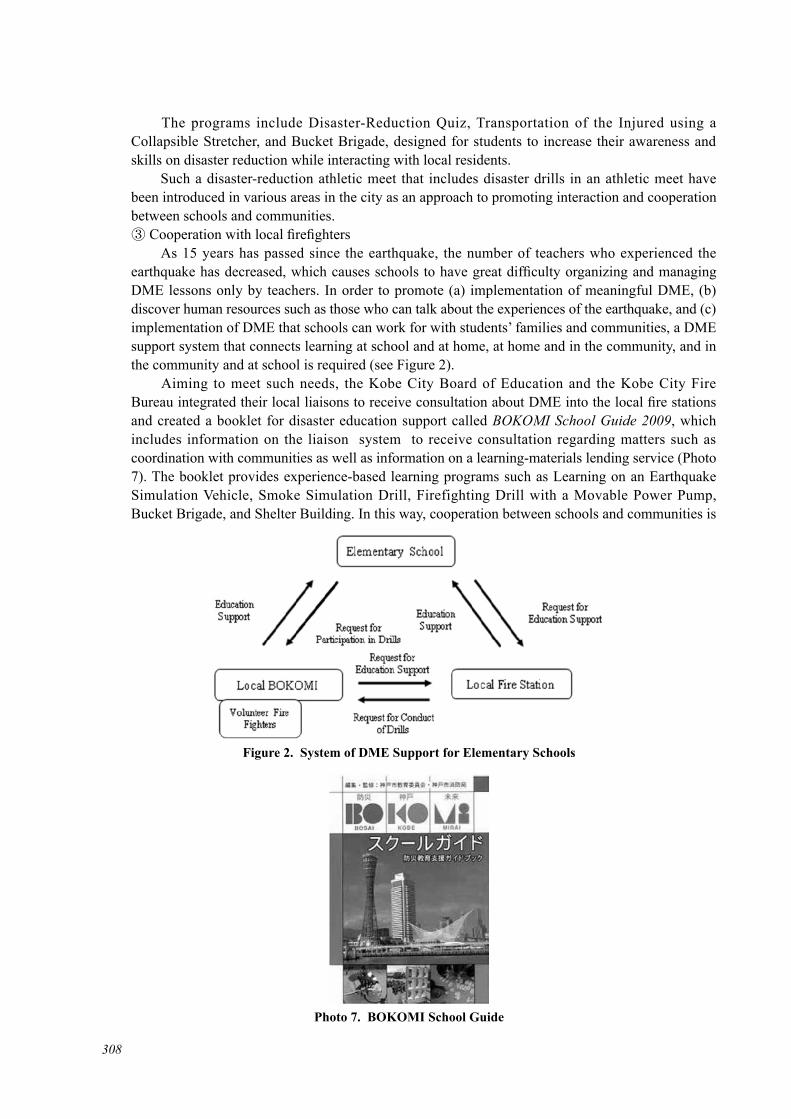
308
The programs include Disaster-Reduction Quiz, Transportation of the Injured using a Collapsible Stretcher, and Bucket Brigade, designed for students to increase their awareness and skills on disaster reduction while interacting with local residents. Such a disaster-reduction athletic meet that includes disaster drills in an athletic meet have been introduced in various areas in the city as an approach to promoting interaction and cooperation between schools and communities.③ Cooperation with local firefighters As 15 years has passed since the earthquake, the number of teachers who experienced the earthquake has decreased, which causes schools to have great difficulty organizing and managing DME lessons only by teachers. In order to promote (a) implementation of meaningful DME, (b) discover human resources such as those who can talk about the experiences of the earthquake, and (c) implementation of DME that schools can work for with students’ families and communities, a DME support system that connects learning at school and at home, at home and in the community, and in the community and at school is required (see Figure 2). Aiming to meet such needs, the Kobe City Board of Education and the Kobe City Fire Bureau integrated their local liaisons to receive consultation about DME into the local fire stations and created a booklet for disaster education support called BOKOMI School Guide 2009, which includes information on the liaison system to receive consultation regarding matters such as coordination with communities as well as information on a learning-materials lending service (Photo 7). The booklet provides experience-based learning programs such as Learning on an Earthquake Simulation Vehicle, Smoke Simulation Drill, Firefighting Drill with a Movable Power Pump, Bucket Brigade, and Shelter Building. In this way, cooperation between schools and communities is
Figure 2. System of DME Support for Elementary Schools
Photo 7. BOKOMI School Guide
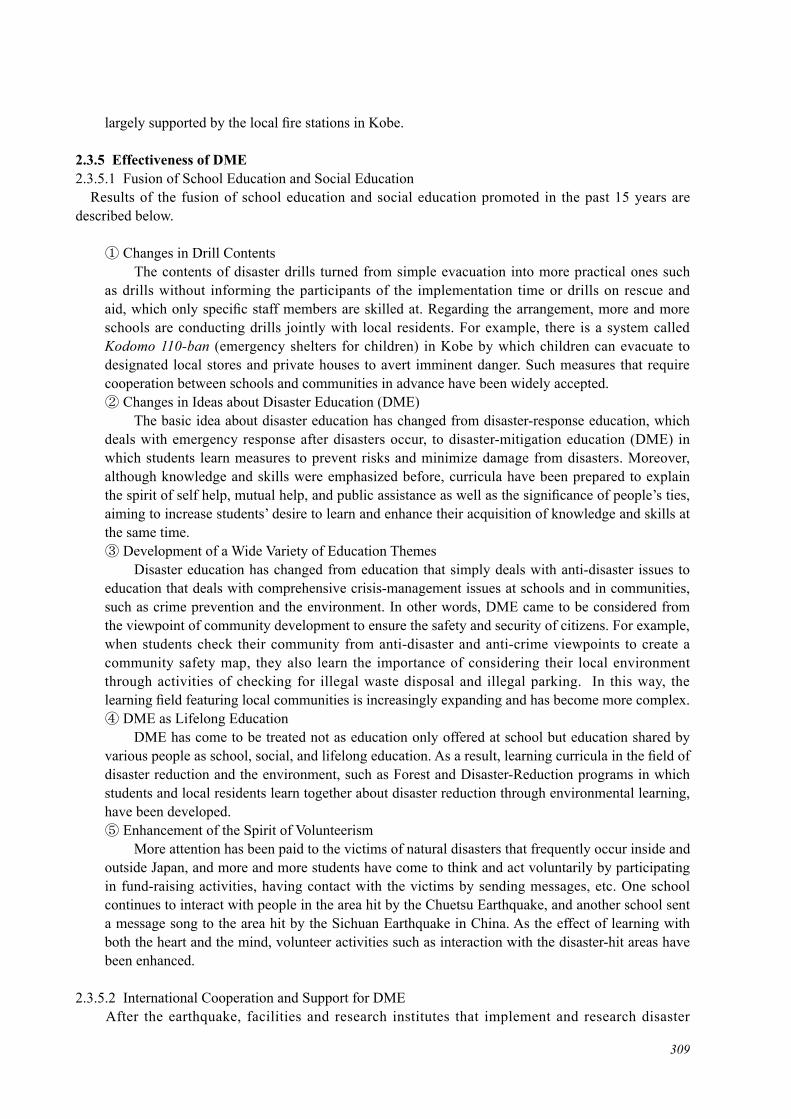
309
largely supported by the local fire stations in Kobe.
2.3.5 Effectiveness of DME2.3.5.1 Fusion of School Education and Social Education Results of the fusion of school education and social education promoted in the past 15 years are described below.
① Changes in Drill Contents The contents of disaster drills turned from simple evacuation into more practical ones such as drills without informing the participants of the implementation time or drills on rescue and aid, which only specific staff members are skilled at. Regarding the arrangement, more and more schools are conducting drills jointly with local residents. For example, there is a system called Kodomo 110-ban (emergency shelters for children) in Kobe by which children can evacuate to designated local stores and private houses to avert imminent danger. Such measures that require cooperation between schools and communities in advance have been widely accepted.② Changes in Ideas about Disaster Education (DME) The basic idea about disaster education has changed from disaster-response education, which deals with emergency response after disasters occur, to disaster-mitigation education (DME) in which students learn measures to prevent risks and minimize damage from disasters. Moreover, although knowledge and skills were emphasized before, curricula have been prepared to explain the spirit of self help, mutual help, and public assistance as well as the significance of people’s ties, aiming to increase students’ desire to learn and enhance their acquisition of knowledge and skills at the same time.③ Development of a Wide Variety of Education Themes Disaster education has changed from education that simply deals with anti-disaster issues to education that deals with comprehensive crisis-management issues at schools and in communities, such as crime prevention and the environment. In other words, DME came to be considered from the viewpoint of community development to ensure the safety and security of citizens. For example, when students check their community from anti-disaster and anti-crime viewpoints to create a community safety map, they also learn the importance of considering their local environment through activities of checking for illegal waste disposal and illegal parking. In this way, the learning field featuring local communities is increasingly expanding and has become more complex.④ DME as Lifelong Education DME has come to be treated not as education only offered at school but education shared by various people as school, social, and lifelong education. As a result, learning curricula in the field of disaster reduction and the environment, such as Forest and Disaster-Reduction programs in which students and local residents learn together about disaster reduction through environmental learning, have been developed.⑤ Enhancement of the Spirit of Volunteerism More attention has been paid to the victims of natural disasters that frequently occur inside and outside Japan, and more and more students have come to think and act voluntarily by participating in fund-raising activities, having contact with the victims by sending messages, etc. One school continues to interact with people in the area hit by the Chuetsu Earthquake, and another school sent a message song to the area hit by the Sichuan Earthquake in China. As the effect of learning with both the heart and the mind, volunteer activities such as interaction with the disaster-hit areas have been enhanced.
2.3.5.2 International Cooperation and Support for DME After the earthquake, facilities and research institutes that implement and research disaster

310
education were build in the HAT Kobe Area in Chuo Ward, Kobe.
The Disaster Reduction and Human Renovation Institution serves as an education facility where visitors can experience a simulated earthquake in the theater and view materials on the earthquake. Many elementary and junior-high schools in Kobe arrange a visit to the institution as a field trip. Moreover, the institution draws many other visitors from both inside and outside Japan, playing a role as a core facility of disaster education. Its learning programs, such as storytelling of earthquake experiences by civil volunteers, meet the needs of both social education and conventional education.
Moreover, various international organizations on disaster reduction such as the Japan International Cooperation Agency (JICA) Hyogo, the United Nations Center for Regional Development (UNCRD) Hyogo Office, the United Nations International Strategy for Disaster Reduction (UNISDR) Hyogo Office, the Asian Disaster Reduction Center (ADRC), the Office for Coordination of Humanitarian Affairs (OCHA) Kobe, and International Recovery Platform (IRP) Secretariat are also located in the HAT Kobe area, conduct research and provide training on disaster reduction, playing a COE (Center of Excellence) role in disaster mitigation.
In cooperation with those organizations, teachers and municipal officials who experienced the earthquake give lectures to training-program participants as well as visitors. Their experiences of responding to the emergent situation on the front line constitute precious knowledge that is well worth studying.
JICA and ADRC, in particular, provide training-programs on disaster management for foreign officials such as those in charge of disaster management and education and dispatch experts in Kobe and other areas of Hyogo Prefecture to disaster-stricken countries to provide training and trial lessons about disaster education (see Photos 8 and 9).
As described above, Kobe’s disaster education redeveloped after the earthquake has adopted the idea of disaster mitigation and has become an education program that closely connects classroom education and local disaster reduction activities.
Japan, which has suffered various natural disasters since ancient times, has stored a lot of experiences and lessons at various levels in various fields.
Since large scale disasters, such as the Sumatra Earthquake and the Sichuan Earthquake, have frequently occurred in recent years, there has been an increase in international cooperation and assistance activities for disaster reduction that try to convey disaster- reduction measures and knowhow related to disaster education developed in Japan to the disaster-stricken countries.
Photos 8 and 9. Overseas Trial Lessons by an Expert in Algeria (left) and Armenia (right)

311
Regarding education, Kobe’s efforts such as (a) development of a school disaster- management system such as aseismic reinforcement of school facilities and crisis management, (b) creation and implementation of DME curriculum, and (c) method of how to cooperate with local communities are conveyed abroad. Underlying these efforts is Kobe’s distinctive learning style that enables not only researchers but also local residents, businesses, and various organizations to cooperate with each other to share the experiences and lessons of the earthquake.
Kobe received support from all over the world at the time of the disaster. In return, the city tries to help disaster-stricken countries to achieve their own learning style, while respecting their culture and climate. DME is an important element of such assistance.
In the scene of international cooperation and assistance, Kobe’s DME contributes to the creation of a DME culture in other countries.
2.3.6 Future Perspective and Challenges2.3.6.1 Efforts to Prevent the Memory from Fading As shown above, DME has been developed with emphasis on measures against earthquake disasters ever since the earthquake. However, the flash flood accident involving the Toga River clearly indicated that a river that local residents are familiar with can be a threat due to the forces of nature. This accident emphasized the necessity of including types of natural disasters other than earthquakes in the DME system.
Memories of disasters are sure to fade. In Kobe, because of the generation change, one-third of the total population of 1.5 million did not experience the earthquake. In order to prevent memories of the earthquake from fading and convey the experiences and lessons to the next generation, it is necessary to enhance people’s awareness and knowledge. On the other hand, how to maintain the motivation of people is a challenge. Schools in Kobe have implemented programs in an attempt to keep the memories alive.① Workshop for Teachers in Charge of DME As the number of students and teachers who do not know about the earthquake is increasing, a workshop is held every year targeting teachers of the all municipal schools (kindergartens, elementary schools, junior-high schools, high schools, and special-needs schools) as an opportunity for them to restudy the experiences and lessons learned from the earthquake (see Photo 10). The workshop is offered twice a year to the teachers in charge of DME at individual schools. The contents include presentation of examples, provision of the latest information from disaster-
Photo 10. Kobe City Workshop for Teachers in Charge of DME
312
related organizations, and explanation about the actions and policies on disaster education to be taken throughout the city. The workshop provides the participants with an opportunity to review the efforts in their schools and seeks to establish new ties with neighboring schools and local related organizations. It helps to prevent the memory of the disaster from fading as well as serves as a place to consider new DME.② Preparation and Implementation of DME Annual Learning Curricula All the elementary and junior-high schools in the city prepare and implement their own annual learning plan on DME. Based on the learning curricula, schools implement DME in the lessons of individual subjects, ethics, periods of integrated studies, and special activities. Many schools set the unit featuring disaster reduction as a priority unit and hold events such as disaster drills, school visits, and memorial meetings around January 17, the date of the Kobe Earthquake. Schools try to discover human resources, people who can talk about the earthquake based on firsthand experience, from among school staff members, parents, and local residents and actively utilize them. These days, more and more schools utilize the grown-up students who experienced the earthquake as a student to give lectures to the current students as new storytellers of the earthquake. The generation change and expansion of the earthquake storytellers are steadily proceeding. Considering that the new Course of Study to be adopted in 2012 places more emphasis on DME, it is expected that the above efforts at schools will be enhanced even further.
2.3.6.2 DME in the Future As 15 years has passed since the Kobe occurred and the generation change has already started, children who received DME have grown up and are active as members of society. Some became firefighters or nurses; some work as researchers in disaster-related organizations or universities; and some became teachers and are now in charge of DME.
Although their occupations are different each other, young people, who took the experiences and lessons of the earthquake, acquired knowledge and skills in the area of disaster reduction, and shared the pain of the victims, start to be active in society. This fact is the great achievement of 15 years of DME.
Activities by young people who received DME to hand down the experiences and lessons of the earthquake to the next generation are also seen. For example, the activity of “Youth Storyteller” has started. In this activity, young people who experienced the earthquake when they were elementary school students visit their old schools to talk about their experiences to the current students who were not yet born at the time of the earthquake and know very little about it. Meanwhile, disaster-reduction programs have been established in many high schools and universities, which indicates that society has started to accept DME as a requisite subject in the present education system. This proves that the experiences and lessons from the earthquake are surely being utilized in education.
However, there is a possibility that DME sometimes becomes stereotyped. As was learned from the experience of localized torrential rains, disaster education in schools is not always perfect. Constant review and improvement are required as follows.
① Overhaul of School Manual for Disaster Management Schools need to overhaul the manual for disaster management every year and review the crisis management system so as to be disaster resilient. For example, efforts, such as implementation of transportation drills of special-needs populations and blackout simulation drills and improvements that meet the actual conditions of individual schools, are necessary. Inspection and maintenance of equipment and materials for disaster- response activities should be performed on a routine basis.
313
② Revision of DME Learning Materials and Curricula It is necessary to ensure continued relevance of individual lessons by paying attention to the arrangement of lessons and utilizing supplementary readers and visual materials across different subjects. Also, it is necessary to improve curricula so that children’s interest and motivation are enhanced. Schools and teachers should compile and share materials on disaster education to improve the learning environment. Development of teachers’ training and network building for the utilization of local human resources by individual schools are also important. Constant improvement of DME in communities is needed as well. However, since no local organization can constantly serve as a core of the community like a school and promote educational activities, continuity of DME is a challenge for the enhancement of community-based DME. Therefore, close cooperation among volunteer disaster-reduction organizations, fire stations, and schools is indispensable to ensuring improvement of education curricula as well as achievement and sustainability of local capabilities for disaster reduction.③ Discovering and Fostering Local Human Resources Vital local communities have a wide variety of human resources. Volunteer disaster- reduction organizations, in particular, should be managed not by a single charismatic leader but by several leaders. By doing so, the organizations can involve many residents in local activities for disaster reduction continuously. As pointed out above, discovery of potential local human resources, people to serve as civil lecturers, sometimes brings new life to and extends the range of local activities. As additional effects, new learning curricula are created and start to draw more participants to new activities. Fusion of classroom education and social education through the implementation of DME is an important element to support the process of developing disaster- resilient communities with the participation of citizens, based on the idea of disaster mitigation. Current DME in Kobe helps local residents to promote their crisis management activities as well as, through those activities, to discover and foster local human resources and realize vibrant communities. In this sense, disaster education contributes to the reconstruction of local governance and plays a vital role in creating a culture of disaster reduction in communities.
2.4 Seismic Retrofitting for Housing 2.4.1 Background
The Kobe Earthquake caused catastrophic damage, collapsing and destroying a large number of wooden houses and even some reinforced concrete condominiums. Additionally, such collapsed buildings obstructed escape and rescue routes.
Photo 1. January 17, 1995 – A Day We Will Never Forget
January 17, 1995 The Memory of the Day “We Will Never Forget That Day”The Kobe Earthquake caused catastrophic damage, collapsing and destroying a large number of wooden houses and even some reinforced concrete condonminiums, and numerous pieces of furniture fell. Additionally, such collapsed buildings obstructed escape and rescue routes.

314
2.4.1.1 Housing Destruction Within the city of Kobe alone, more than 4,500 people were killed, and approximately 82,000 housing units, both public and private, were destroyed. Wooden and brick/concrete block buildings, in particular, were seriously damaged, with their total destruction rate being about 68%.
2.4.1.2 Housing Damage and Casualties Analytical data on the cause of death reveal that many people were crushed to death under houses that collapsed instantaneously due to the strong earthquake and aftershocks (suffocation/crushing accounted for 77% of the deaths). To minimize casualties in large earthquakes, it is important to improve building structures to make them aseismic.
2.4.1.3 Relationship between Year of Construction and Severity of Damage According to a 1995 survey report, buildings built in and before 1965, i.e., more than 30 years of age, were particularly heavily damaged. In the buildings constructed in and before 1981, based on the old seismic-design standard, those rated as “Fallen/Collapsed” and “Extensive/Moderate Damage” reached as high as 63.5%.
2.4.1.4 Conclusion Fallen/collapsed residential buildings deprive people living there of their lives and property. At the same time, such houses can obstruct the pathways and roads around the buildings, interfering with escape and rescue activities. Hence, increasing the earthquake-resistance strength of each housing unit
Figure 1. Causes of Death in Hyogo Prefecture (Kobe Earthquake Disaster, General Issues, 2000)
Figure 2. Housing Units Destroyed/Year of Construction (1995 Interim Report of the Committee for Surveys on Building Damage Caused by the Kobe Earthquake)
Fallen/Collapsed + Extensive/Moderate Damage: 63.5%
Before or During 1981 After or During 1982
No DamageSlight/Minute DamageExtensive/Moderate DamageFallen/Collapsed

315
should lead to the enhanced disaster-prevention performance of a community as a whole.
Furthermore, it is more effective to allocate budgets and other resources to “seismic retrofitting for housing” as a measure against large earthquakes rather than to take countermeasures after their onset. This is especially important now as citizens’ awareness concerning disasters is continuing to diminish, even in the disaster-stricken city of Kobe.
2.4.2 Seismic Retrofitting for Housing 2.4.2.1 Outline of Seismic Retrofitting for Housing
① Nankai and Tonankai Earthquakes ― An approaching Reality The southwest part of the Japanese Archipelago, where the city of Kobe is located, faces the Nankai Trough and has been hit by large earthquakes on the order of magnitude of at least 8 once every 100 to 150 years. The probability that the Nankai and Tonankai earthquakes will occur within the coming 30 years is estimated at 60-70%.② Estimated Damage from a Nearby Earthquake in an Urban Area Although it is difficult to predict the exact probability, it is estimated that the Arima-Takatsuki Tectonic Line - Rokko Fault Zone Earthquake (magnitude 7.7), a hypothetical major nearby earthquake that may hit the urban area of Kobe, will cause heavy damage to buildings, including about 60,000 housing units totally destroyed and about 37,000 units with damage amounting to at least 50% destruction (Local Disaster Prevention Plan of Kobe City, March 2005, City of Kobe).③ Research and Development Concerning Housing Regarding seismic retrofitting measures, research and development have advanced since the Kobe Earthquake, and their economical potential and effectiveness has been verified through shaking tests using three-dimensional full-scale earthquake testing facilities. The aim of these activities is to achieve seismic retrofitting of a dwelling at a cost equal to that of one car (E-Defense Open Experiments, December 2006).
④ Kobe City Amendment of Building Retrofitting Promotion Plan Given the background described above, the Government of Japan formulated the Amendment of Building Retrofitting Promotion Plan (2007) with the aim of “halving the putative damage from a great earthquake in the coming 10 years,” including a numerical target for raising the
Figure 3. History of Major Earthquakes that Occurred along the Nankai Trough (Earthquake Research Committee, Headquarters for Earthquake Research Promotion,
Ministry of Education, Culture, Sports, Science, and Technology)
Epicenter area Cape Ashizurimisaki
Major
earth
quak
es in
the pa
st
Eurasian Plate
Kochi
Cape Shionomisaki
Kobe
Lake Hamana Shizuoka
NagoyaTsu
OsakaWakayama
Tokai Earthquake
Tonankai EarthquakeNankai Earthquake
1605 Keicho Earthquake M 7.9
1707 Hoei Earthquake M 8.5
1854 Ansei Nankai Earthquake M 8.4
1946 Showa Nankai Earthquake M 8.0 1944 Showa Tonankai Earthquake M 7.9
Probability of Onset by 2035
1854 Ansei Tokai Earthquake M 8.4
102 years
Nankai Earthquake: 50% Tonankai Earthquake: 60-70% Tokai Earthquake: 87% (reference value)
102 years
147 years 32 hours later
2 years later
Nankai Trough
Suruga Trough

316
housing seismic retrofit rate from 73% as of 2004 to 90% or more by 2014. In this situation, Kobe formulated the Kobe City Amendment of Building Retrofitting Promotion Plan in February 2009, to raise the retrofitting ratio from 84% as of 2004 to 95% or more by 2014.
2.4.2.2 Points of Note in Implementing Seismic Retrofitting for Housing ① Self Help (Personal Preparation for Disasters) Self help is most effective against disasters, provided that individual citizens constantly implement it as a routine activity. To this end, Kobe has formulated the “Three Principles for an Anti-Seismic System” and is endeavoring to raise citizens’ awareness and provide support for increasing the earthquake resistance of their houses.The Three Principles are as follows.
1) Know your Housing (‘health checks’ for housing = seismic capacity evaluation) - A free seismic capacity evaluation is recommended.2) Make your Housing more Robust (treatment of housing = seismic retrofitting) - Seismic retrofitting to be included when renovating housing3) Devise Safe Ways of Living (health management for housing = securing furniture) - Sleep in a place safe from potentially falling furniture - Arrange pieces of furniture so that they do not obstruct your escape routes should they fall On the assumption that the above-described self help activities will be constantly promoted under an accurate understanding of earthquake disasters, measures regarding the seismic retrofitting for housing are designed with a focus on both mutual help within the local community, and public assistance provided by the prefectural and municipal sectors.② Mutual Help (Community) - Local Efforts (community development with disaster-prevention and welfare activities) - Mutual Aid System (Hyogo Mutual Aid Fund for Housing Reconstruction)③ Public Assistance (Government) - Rescue by fire services, police, and the Self-Defense Forces - Providing places of refuge, provision of temporary housing, etc.
2.4.3 Evaluation of Seismic Retrofitting for Housing It has to be admitted that since modernization in the Meiji Era, people living in western Japan have neglected vigilance regarding major earthquakes, such as The Great Kanto Earthquake of 1923, affecting urban areas. It is the first priority and responsibility for Kobe citizens, as sufferers of the devastating damage caused by the Kobe Earthquake to pass on what has been learned to people of the next generation.
Additionally, what can be done by the administration after the onset of such a disaster is subject to limitation as a matter of course; focus should be placed more on precautionary measures. In the context of seismic retrofitting for housing in particular, the following seem to be of basic importance.
Figure 4. Three Principles for an Anti-Seismic System
Know your Housing Make your Housing more Robust Devise Safe Ways of Living
317
- Minimize reliance on public-assistance activities, such as providing places for refugees and constructing a vast number of temporary housing units
- Facilitate mutual help with neighboring residents and in local communities - Promote public relations and conduct awareness-raising activities to help individual households
prepare themselves for disasters based on self help and to provide constant support for seismic retrofitting for housing and other measures
Meanwhile, the great majority of casualties due to the Kobe Earthquake consisted of deaths caused by crushing beneath fallen buildings. Published reports conclude that these deaths were prevalent in old wooden housing units whose earthquake-resistance strength was insufficient. In this case, housing, which should provide safe shelter, was a major cause of causalities.
It should also be noted that in densely built-up areas, fallen buildings and other debris hampered rescue activities and the securing of escape routes. With these facts in mind, we must continue to increase public awareness regarding housing among all Kobe citizens.
2.4.4 Future Prospects As stated above, the city of Kobe has been engaged in promoting seismic retrofitting for housing under the slogan “We Will Never Repeat the Tragedy of That Day.” As the situation stands however, while there are about 80,000 detached houses estimated to be in need of seismic retrofits, the cumulative number of housing units that have undergone seismic-capacity evaluations remains at a level of about 3,500 units (4.5%) since 2002. According to a questionnaire-based follow-up survey on citizens who had a seismic capacity evaluation of their housing (implemented by Kobe in July 2005), the following were the most prevalent answers to the question of why citizens have not had seismic retrofitting work carried out on their dwellings.
- Such a large earthquake will not occur again. - If such an earthquake occurs again, then I will do it. - I don’t have confidence in the effects of retrofitting. - I don’t know where to go or whom to consult. - I can’t afford the expense of retrofitting work.
In this situation with citizens’ diminishing awareness of the earthquake disaster, Kobe, along with citizens and specialists, is drawing up or implementing community development measures based on the following policies.
2.4.4.1 Raising Public Awareness and Spreading Useful Information① Dissemination of Three Principles for an Anti-Seismic System - Know about Your House - Strengthen Your House
Photo 2. Seismic Retrofitting Campaign Photo 3. Earthquake Simulation Van

318
- Devise Safe Ways of Living② Continued Implementation of the Seismic Retrofitting Campaign (2007) Awareness-raising events are held during the campaign in September and October every year.③ Efforts Regarding Housing Education Lessons concerning earthquake disasters and seismic retrofitting for housing are carried out with young people who did not experience the Kobe Earthquake disaster through technical arts and home economics classes at elementary and junior-high schools and drills at technical high schools.
2.4.4.2 Centralization of Seismic Retrofit Consultation for Citizens A centralized liaison has been opened within Smilenet, Kobe City Housing Support Center, to allow citizens to have one-stop contact concerning consultation on seismic retrofits of their houses and the like.
2.4.4.3 Support for Forming a Consensus among Condominium Residents In the context of apartment housing, it is necessary to provide technical assistance and information to help the many residents reach a consensus. Hence, support for residents’ management associations is provided (e.g., dispatching seismic retrofitting advisors).
2.4.4.4 Coalition with Civic Groups and Specialist Organizations With increased awareness of citizens following the earthquake concerning housing, town, and local community, the Kobe City Housing Seismic Retrofit Promotion Workshop was organized to undertake continued study with the participation of civic groups, specialist organizations, and administrative authorities.
2.4.4.5 Nurturing Industrial Sectors (Referral of Specialists and Reliable Contractors) To meet the demands for repairing and maintaining a wide variety of housing facilities effectively and efficiently, industrial activities for seismic retrofits are encouraged with a focus on creating a system for linking citizens and specialists.
2.4.4.6 Implementing Support Programs for Promotion of Seismic Retrofits In order to encourage self-help activities, rather than public-assistance activities, on a continuous basis, support programs for promoting seismic retrofitting for housing for citizens should be continuously implemented.
① Seismic Capacity Evaluation (free of charge)② Monetary Support for Seismic Retrofits - Improvement of Living Safety (grants for securing furniture) - Improvement of Housing Safety (grants for repairs to increase earthquake resistance) - Improvement of Community Disaster Resistance (grants for the dismantling of buildings and
clearance of debris)
Photos 4 and 5. Housing Education

PART IV
Collaborative CommunityDevelopment for Recovery
1. Concrete Development of Social Capital 2. Examples of Specific Projects


CHAPTER 1
Concrete Development of Social Capital

322
1 Introduction
The tangible effects of social capital on life recovery of the survivors from the Kobe Earthquake have been quite apparent when looking at what local communities were able to do in the phase of emergency response immediately after the earthquake and during the decade-long recovery period and at the effectiveness of creating local communities at temporary housing facilities and disaster-restoration public housing facilities, where the residents were disconnected from the communities they used to belong to. Volunteer activities also came to the public’s attention. There are also several facets to the relationship between local activities and social capital in Kobe as shown by the results of a survey of local residents conducted by the Kobe Institute of Urban Research in 2007.
2 Roles that Mature Local Communities Played in Life Recovery
Local activities in the Mano district and the Northern Noda district, both located in Kobe’s Nagata Ward, played leading roles in the life recovery of the earthquake survivors.
2.1 Case of the Mano District The Mano district is situated in the inner-city area, consisting of a mix of houses/housing complexes, commerce, and industry, especially a lot of small factories. About 5,500 people lived in this area of approximately 40 ha just before the earthquake. Among them, the elderly accounted for 20%, and 246 lived alone or were bedridden.
The residents of this district had been actively involved in welfare activities to address the aging of the population as well as community development activities to improve their living environment ever since a local movement against pollution in the 1960s. A community development organization called the Community Development Promotion Organization in Mano District, which was based on a neighborhood residents’ association, had already been formed in the local elementary school area before the earthquake. In Japan, the neighborhood residents’ associations is the most basic unit of local community and is most closely involved in solving local problems on a daily basis.
On the day of the earthquake, a building collapsed and the residents were trapped under the debris. The people of the community borrowed heavy machinery from a local enterprise and saved seven residents after an all-day rescue operation. They also conducted firefighting operations by themselves before a fire engine arrived 6 hours after the fire broke out and having succeeded in minimizing the damage. As a result, there were only 17 fatalities and only 40 houses were completely destroyed by fire.
Three days after the earthquake, residents in the Mano district set up a disaster management headquarters that organized an enormous number of volunteers coming from outside the district to classify and manage relief goods and distribute them to the local residents and also operated a local evacuation shelter established in the local elementary school. In Kobe, many local evacuation shelters were run by representatives of the evacuees or by school teachers since schools were used as local evacuation shelters. In the Mano district however, the local community ran the local evacuation shelter.
After the evacuation shelter closed, the local community set up the Mano District Recovery and Community Development Office and steadily implemented measures so that the residents were able to keep living in the district even after the earthquake. The office succeeded in making the city government accept their requests to construct temporary housing and public housing in their district, to set up a community welfare center with public housing facilities for the elderly having care service, and to dispatch consultants for joint housing projects among other things. These efforts were advanced by
323
cooperation with volunteers coming from outside the district and experts that had supported the district since before the earthquake.
2.2 Case of the Northern Noda District The Northern Noda district is situated at the west end of Kobe’s Nagata Ward. Located southeast of JR Takatori Station, this mixed residential-commercial area has an area of approximately 13 ha and is divided into almost square-shaped blocks. Before the earthquake, the area had a population of 2,629 in 1,031 households, and the elderly made up 19.2% of the population (according to the 1990 census).
Community development by the residents in this district started when they established a community development organization in 1993 to address inner-city problems such as the declining population and degradation of their living environment. Before the earthquake, the Northern Noda Community Development Organization had been working against illegal car and bicycle parking in front of the train station and on issues related to aging and local revitalization.
The earthquake caused catastrophic damage in this area: 41 people died, and about 70% of the houses collapsed or were completely destroyed by fire. If buildings where only partial collapse occurred are included, more than 90% of the houses were damaged.
On the day of the earthquake, the members of the community development organization parked a van in front of the station with nothing more than a cardboard sign saying Northern Noda Earthquake Recovery Headquarters and started to use it as their earthquake recovery headquarters. The headquarters was relocated to the assembly hall in Kaiun-cho 4-chome three days later and became the base for the activities of community development organization.
Immediately after the occurrence of the earthquake, rescue and other operations were promptly conducted by the community led by the younger executives of the community development organization. Many residents were trapped under collapsed houses. Neighbors cooperated with each other to dig out trapped people and transport them to hospitals. At the same time, operations to receive and distribute relief goods were implemented. The community development organization started to survey the conditions of damage in the district on January 19. The members also conducted a night patrol for three months from January 22.
On February 10, the first meeting for recovery was held to discuss measures for recovery of the community. During the meeting, the participants confirmed the basic policy of rebuilding the community so that as many former residents as possible would be able to return. This reflected the residents’ strong concern that their community itself might not survive if it fails to draw its former residents back.
The community development organization also quickly responded to the land readjustment project and other urban planning projects proposed by the city government for housing reconstruction, achieving rather smoother progress in the recovery phase than other districts. With the help of volunteers gathering from all over the country, academic experts, and consultants, the Northern Noda district was the first district in the city to recover.
2.3 Key Points As described above, local communities independently deployed various efforts to support life recovery of the residents from the emergency response phase through the recovery phase in the Mano district and the Northern Noda district. Such efforts are valued as a process of generating choices for the recovery of their lives and communities by themselves in order to supplement the insufficiencies

324
of the existing governmental policies. Since administrative approaches to recovery do not always pay much attention to the details of the local circumstances, the needs of some residents are not covered by the government’s measures. Therefore, the support of local communities that mediate between the government and the residents is indispensable for achieving life recovery.
Meanwhile, some districts, where neighborhood residents’ associations only conducted stereotypical activities, could not responded to the earthquake in an organized manner, let alone work well for community development for recovery because community development that requires handling of physical town-development issues was beyond their capability. According to the results of a survey conducted by the Kobe Institute of Urban Research in 1995 on behaviors of residents in the earthquake-stricken areas, 31.4% of neighborhood residents’ associations worked during the earthquake and 61.5% did not.
3 Formation of New Communities
3.1 Community Creation at Temporary Housing Facilities In Kobe, a total of about 32,000 temporary housing units were provided. Due to this large number, the city government determined it necessary to build large-scale housing complexes in the potential New Town sites in the suburban areas and the artificial islands because it was difficult to procure land in the afflicted urban areas and was necessary to built a large quantity of housing units as soon as possible. When selecting tenants, those with physical and/or mental problems such as the elderly and the disabled were given priority for entering temporary housing units in order to extricate them from the harsh environment of local evacuation shelters as soon as possible.
As a result, the tenants that were selected based on such attributes had to collectively live in large-scale temporary housing complexes in the suburban areas, disconnected from the communities that they had belonged to and the human ties they had cultivated there. Since tangible and intangible support gained from human ties in local communities was an important life resource for those vulnerable people, moving into temporary housing units meant the loss of those ties. Under such isolated circumstances, sad incidents, often referred to as neglected death, occurred. Neglected death is defined as a case in which someone died alone at his or her residence in temporary housing and the cause of death was determined by a post-mortem examination to be a noncriminal matter except, i.e., suicide or an accident.
Prompted by a spate of neglected deaths, activities to support residents in temporary housing were promoted. Firstly, activities to confirm safety of the residents and visit them were implemented to prevent neglected deaths. However, those activities were nothing more than covering a tiny fraction of time in their daily lives and were not decisive measures to stop neglected deaths. Eventually, it was found that forming a community that supplements the local ties to the communities where people previously lived is a rather effective method to unite residents in housing complexes and encourages residents to support each other through daily interaction.
Since the city government had promoted the establishment of residents’ associations in temporary housing complexes from the time the complexes were constructed, residents started to establish residents’ associations in many housing sites after about three months from moving in. However, due to the residents’ attributes mentioned above, the residents had limited capability to establish and operate residents’ associations independently. Therefore, various forms of assistance were required.
The city government first conducted surveys on the conditions of the residents and set up committees to obtain the views of experts and general citizens in order to develop various support
325
measures. Specifically, the city government (a) improved services for the special-needs population by employing manpower from the fields of medicine, public health, and welfare (the dispatch of life-support advisers, etc.), (b) commissioned the Community Welfare Promotion Staff who strive to enhance mutual help within the temporary housing complex, (c) nurtured and supported the residents’ associations in temporary housing complexes, and (d) installed Fureai (Interaction) Centers as assembly halls in the complexes that had more than 50 housing units and paid operational expenses.
In addition to such public support, outside supporters such as residents living near the temporary housing complexes and volunteers who sought opportunities to continue their activities after local evacuation shelters closed also developed various support activities. Fureai centers functioned as a physical field to accept those outside supporters and manage temporary housing with their help.
3.2 Community Creation at Disaster-Restoration Public Housing Facilities As public support for those who had difficulty in rebuilding their own homes, 42,137 disaster-restoration public housing units were provided in Hyogo Prefecture after the earthquake. As the survivors’ relocation to disaster-restoration public housing went into full swing, concrete efforts to support livelihood of the residents were advanced by the Livelihood Support at Permanent Housing Team.
At disaster-restoration public housing facilities, it is desirable that the residents establish organizations for mutual exchange of ideas such as a residents’ association or a senior citizens’ association by themselves as soon as possible. To that end, it was considered necessary for an outside party to provide the residents with opportunities to get to know each other and hold events to prevent them from staying alone in their homes in the early days after they moved in. Therefore, from fiscal year 1997, the city government stationed one Local Welfare Coordinator at every Ward Council of Social Welfare office in order to reinforce the community friendly visit program and support revitalization of communities. Local Welfare Coordinators worked together with Life Recovery Counselors, Elderly Household Advisors, Community Welfare Liaisons and Child Welfare Liaisons as well as gained the cooperation of local groups to promote the establishment of home visit groups, organize and implement local exchange programs to help the residents to create communities, such as welcome programs and tea parties, offer living information, and hold the meetings of the Community Watching Over Liaison Committee.
The city government also opened the assembly halls built at the disaster-restoration public housing facilities to local community groups such as Disaster Restoration Public Housing Community Plazas and subsidized them. One of the subsidy programs involved financial support to cover part of the operational expenses for exchange programs and volunteer activities based on the assembly halls. It aimed to help the residents who moved into disaster-restoration public housing from temporary housing to build up ties with neighbors early on so that they could overcome the sense of isolation and eventually join a new community.
3.3 Key Points Since communities were formed at temporary housing facilities, second disasters such as neglected deaths were minimized.
The most typical management system for communities at temporary housing facilities was one in which residents’ associations formed by the residents primarily managed each community while being supported by various structural and non-structural measures taken by the government and a variety of activities conducted by the private sector including residents of the neighborhood and volunteers.
326
Such a series of measures and activities was later applied to supporting community creation at disaster-restoration public housing facilities as well as to the general governmental policies on local welfare services.
4 Volunteer Activities during the Kobe Earthquake
4.1 Characteristics of Earthquake Volunteers A large number of volunteers rushed to the earthquake-stricken areas from all over the country under the slogan “Did you go to Kobe?” The number of volunteers reached around 1.22 million in the first five months following the earthquake. The characteristics of the volunteers were: (a) about 70% had never been involved in volunteer activities before, (b) about 40% came from outside the devastated areas, and (c) the majority of them were young people, such as high school, junior college, and university students.
As mentioned above, people unfamiliar with volunteer activities, such as students and office workers, went to the devastated areas spontaneously and conducted relief activities in place of dysfunctional local government agencies. Therefore, 1995 is now referred to as the first year of volunteerism.
4.2 Activities of Volunteers In the first stage immediately after the occurrence of the earthquake, the needs for activities regarding saving and maintenance of life, such as lifesaving and provision of medical care and relief goods, were high. Therefore, volunteer activities focused on such needs.
Needs in the devastated areas gradually changed as time passed and conditions changed. Accordingly, activities by volunteers shifted into those to support the survivors’ daily lives, such as operation of local evacuation shelters and support for the elderly and the disabled. Later on, they shifted to support for recovery and reconstruction, including activities to help the survivors move from local evacuation shelters to temporary housing and clean up their houses. From around the summer of 1995, emphasis was placed on activities to help the survivors regain their ordinary lives. For example, volunteers visited the residents in temporary housing complexes and helped them to establish residents’ associations. At the same time, programs were developed to encourage the survivors to find motivation for living.
4.3 Support for Volunteer Activities4.3.1 Governmental Support for Volunteer Activities As a support program for volunteer activities, the city government established Ward Volunteer Centers. After the activities conducted by volunteers, who gathered from all over the country immediately after the occurrence of the earthquake, settled down, their support activities were handed over to local groups. Starting with the establishment of the Hyogo Ward Volunteer Center in March 1995, volunteer centers were established at Ward Councils of Social Welfare in all other wards by June 1995. The Kobe City Government also established a subsidy program for local volunteer activities and started a computer network system in September 1996 called the Volunteer Information System that connects the City Council of Social Welfare and the Ward Councils of Social Welfare to reinforce coordination.
Moreover, the city government offered disaster-relief volunteer accident insurance from February 1, 1995 until March 1, 1995, using a contribution from the General Insurance Association of Japan.
In addition to those support programs taken by the city government, the Kobe Earthquake Recovery

327
Fund was jointly created by the Hyogo Prefecture Government and the Kobe City Government to subsidize part of the expenses for volunteer activities that aimed at assisting the survivors with their evacuation life and independence.
4.3.2 Nationwide Institutionalization of Support for Volunteer Activities In order not to make these volunteer activities a transient movement, various support programs for volunteer activities were institutionalized. On December 15, 1995, the Cabinet decided to designate January 17 as “Disaster Reduction and Volunteer Day” each year. While volunteer activities that were actively carried out during the earthquake came to be highly recognized, a movement involving citizens and political parties to seek incorporation of volunteer organizations gained momentum. The “Law to Promote Specified Nonprofit Activities” (NPO Law), which was introduced by a cross-party group of lawmakers, was enacted in1998.
4.4 Key Points Following the Kobe Earthquake, volunteer activities were carried out on a scale never seen before in Japan. Volunteers flexibly addressed various needs of the survivors in the fields the government had difficulty in dealing with, playing a great role in life recovery of the survivors.
On the other hand, various problems concerning volunteer activities were revealed. The first problem was the lack of coordination. Since contact points and a system to accept volunteers were not prepared, personnel to coordinate volunteer activities were insufficient, causing a lot of confusion. Immediately after the occurrence of the earthquake, the Disaster Management Headquarters established at Kobe City Hall received numerous inquiries from volunteers all over the country. On January 18, the Disaster Relief Volunteer Headquarters was established under the Disaster Management Headquarters to start accepting volunteer applications. However, since far more people than expected applied for registration as volunteers, the personnel were too busy accepting applications to handle registration work appropriately, resulting in keeping many volunteers waiting to register.
Since the headquarters found it difficult to match volunteers with work sites, it was decided to accept only doctors and nurses three days later, when the number of registered volunteers exceeded 5,000. On January 22, the headquarters stopped accepting volunteer applications, following the acceptance of doctors and nurses dispatched by the Ministry of Health, Labor and Welfare. Such an insufficient system for accepting volunteer applications was pointed out as a major issue.
The second problem was limits of volunteers. Since about 70% of volunteers had no experience in volunteer activities and could stay in the devastated areas only for a short term, a lot of time was spent teaching volunteers. Some volunteers even waited for instructions instead of working independently. The coordination between volunteers and the recipient side became a big concern.
There was also the issue of overwork of volunteers. Coming to Kobe full of passion to do something for people in the devastated areas, many volunteers forced themselves into severe conditions, working overnight or taking a quick nap in the meeting room instead of sleeping. However, not all the survivors gave a warm welcome to volunteers. Some residents hurled abusive remarks toward them, and there was a case in which volunteers and residents had a quarrel over slight things, almost leading to injury. Due to the gap between the ideal and reality, some volunteers suffered burnout.
After the first month following the earthquake, the survivors’ independence was gradually encouraged. In some areas however, only a few survivors responded to the call of volunteers for working together for recovery, and a rift was created between volunteers and the survivors. The gap between the
328
feelings of the volunteers who thought they were offering assistance to the survivors and the survivors who took receiving such support for granted sometimes caused trouble among them.
There were also complaints that volunteer activities were preventing self-support of people in the devastated areas. Complaints include those about free medical consultations, discouraging patients from visiting local practitioners, and soup-run activities damaging the business of local restaurants.
The third problem was that it became harder and harder to gain support for volunteers from businesses and individuals as time passed. As a result, volunteer groups suffered a lack of resources (funds, lodging, information, personnel, etc.) to continue their activities.
5 Approaches to Forming and Promoting Social Capital
5.1 Questionnaire Targeting Local Residents Kobe consists of different spatial elements such as inner-city areas, traditional new- town areas, farming village areas, and current new-town areas. In order to grasp the condition of social capital that serves as a basis for local activities and to find elements that form and promote social capital, the Kobe Institute of Urban Research selected one typical district having active local activities from each of the four areas mentioned above and conducted a survey by distributing questionnaires to about 2,200 residents (hereinafter referred to as the Local Resident Survey). Targeted as typical districts were the Northern Noda district representing inner-city areas, the Northern Suma district representing traditional new-town areas, the Ozo district representing farming village areas, and the Ibukidai Higashi district (and surrounding areas) representing new-town areas. The survey was conducted in September and October 2007, and the response rate was 34.7%.
5.2 Relationship between Local Activities and Social Capital The concept of social capital is defined here as social networks and the norms of reciprocity and trustworthiness that arise from them, following American political scientist Robert Putnam’s definition. Regarding the relationship between civil activities including volunteer activities and the elements of social capital based on the above definition, trust, social associations and exchanges, and social participation, a Cabinet Office conducted quantitative analysis in its study entitled “Social Capital: Seeking a Virtuous Cycle between Close Human Relationship and Civil Activities” in fiscal 2002. According to the results of the study, a certain positive correlation was found to exist between each element of social capital and civil activities.
Whether this nationwide correlation is applicable to the case in Kobe was examined by comparison between the results of the abovementioned Local Resident Survey and the results of the Kobe 2010 Vision Challenge Index Field Survey, which was separately conducted by the Kobe City Government.
5.2.1 Frequency of Community Activities In the Local Resident Survey, the residents in the four districts were asked how often they participate in local activities. ① Activities for Safeguarding and Sound Nurturing of Children The largest proportion of the respondents answered they do “Nothing” (42.9%). The second most frequent answer was “Sometimes” (19.3%). Compared with the results of the Kobe 2010 Vision Challenge Index Field Survey, the proportions of the answers “Frequently” and “Sometimes” are higher and the proportion of the answer “Nothing” is lower in the four districts.

329
② Watching-Over and Life Support for the Elderly and the Disabled The largest proportion of the respondents answered they do “Nothing” (46.1%), and the second most frequent answer was “Seldom” (17.9%). Compared with the results of the Kobe 2010 Vision Challenge Index Field Survey, the proportions of the answers “Frequently” and “Sometimes” are higher, and the proportion of the answer “Nothing” is lower in the four districts.
Figure 1. Results from 4 Districts: Safeguarding of Children
n=776
19.3%
15.5%
42.9%
11.9%
10.4%
Frequently 10.4%
Sometimes 19.3%
Seldom 15.5%
Nothing 42.9%
No response11.9%
Figure 2. Results of “Kobe 2010 Vision” Challenge Index Field Survey: Safeguarding of Children (2005 & 2006)
”noisiV 0102 eboK“ 5002
Frequently 3%
Sometimes 10%
Seldom 14%
Nothing 73%
”noisiV 0102 eboK“ 6002
Frequently 4% Sometimes
10%
Seldom 15%
Nothing 71%
Figure 3. Results from 4 Districts: Support for the Elderly
n=776
9.3%
46.1%
17.9%
14.3%
Frequently 9.3%
Sometimes 14.3%
Seldom 17.9%
No response12.4%
Nothing 46.1%
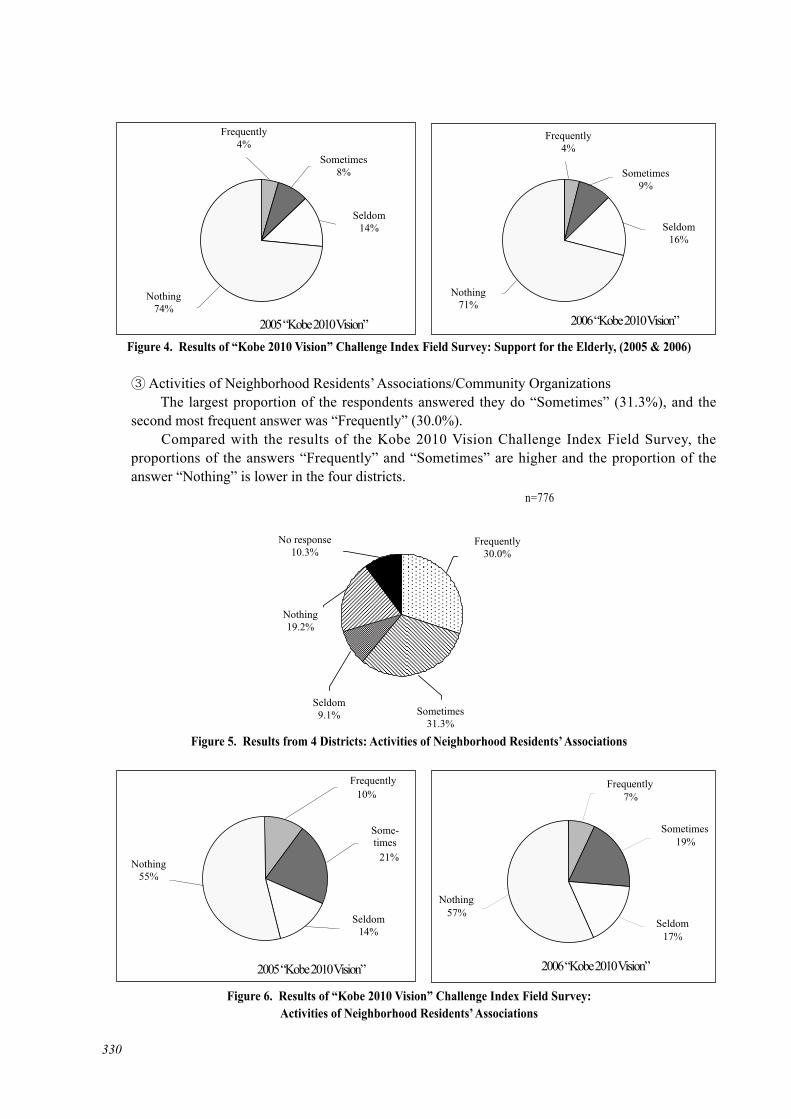
330
③ Activities of Neighborhood Residents’ Associations/Community Organizations The largest proportion of the respondents answered they do “Sometimes” (31.3%), and the second most frequent answer was “Frequently” (30.0%). Compared with the results of the Kobe 2010 Vision Challenge Index Field Survey, the proportions of the answers “Frequently” and “Sometimes” are higher and the proportion of the answer “Nothing” is lower in the four districts.
Figure 4. Results of “Kobe 2010 Vision” Challenge Index Field Survey: Support for the Elderly, (2005 & 2006)
2005 “Kobe 2010 Vision”
Frequently 4%
Sometimes8%
Seldom 14%
Nothing 74% 71%
4%
9%
16%
2006 “Kobe 2010 Vision”
Frequently 4%
Sometimes 9%
Seldom 16%
Nothing 71%
Figure 5. Results from 4 Districts: Activities of Neighborhood Residents’ Associations
n=776
30.0%No response
10.3% Frequently
30.0%
Sometimes 31.3%
Seldom 9.1%
Nothing 19.2%
Figure 6. Results of “Kobe 2010 Vision” Challenge Index Field Survey: Activities of Neighborhood Residents’ Associations
10%
21%
Frequently
Some- times
Seldom 14%
Nothing 55%
2005 “Kobe 2010 Vision”
Frequently 7%
Sometimes19%
Seldom 17%
Nothing 57%
2006 “Kobe 2010 Vision”

331
④ Volunteer and NPO Activities The largest proportion of the respondents answered they do “Nothing” (51.8%), and the second most frequent answer was “Frequently” (15.2%). Compared with the results of the Kobe 2010 Vision Challenge Index Field Survey, the proportions of the answers “Frequently” and “Sometimes” are higher and the proportion of the answer “Nothing” is lower in the four districts.
⑤ Disaster-Reduction Activities The largest proportion of the respondents answered they do “Nothing” (36.2%), and the second most frequent answer was “Sometimes” (24.1%). Compared with the results of the Kobe 2010 Vision Challenge Index Field Survey, the proportions of the answers “Frequently” and “Sometimes” are higher and the proportion of the
Figure 7. Results from 4 Districts: Volunteer Activities
n=776
15.2%
51.8%
10.7%
10.7%
Frequently 15.2% No response
11.6% Sometimes10.7%
Seldom 10.7%
Nothing 51.8%
Figure 8. Results of “Kobe 2010 Vision” Challenge Index Field Survey: Volunteer Activities
2006 “Kobe 2010 Vision”
Frequently 5%
Sometimes 7%
Seldom 9%
Nothing 79%
2005 “Kobe 2010 Vision”
Frequently 5% Sometimes
6%
Seldom 8%
Nothing 81%
Figure 9. Results from 4 Districts: Disaster-Reduction Activities
n=776Frequently 12.4%
Sometimes 24.1%
Seldom 16.4%
Nothing 36.2%
No response11.0%
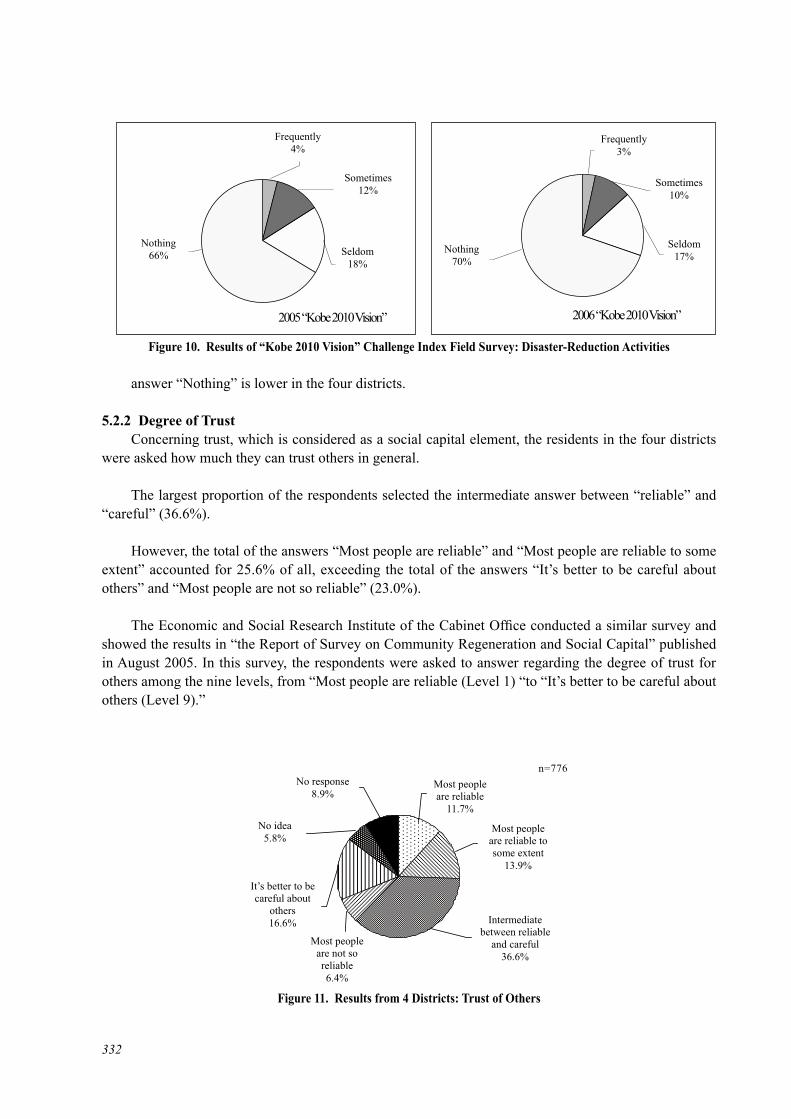
332
answer “Nothing” is lower in the four districts.
5.2.2 Degree of Trust Concerning trust, which is considered as a social capital element, the residents in the four districts were asked how much they can trust others in general.
The largest proportion of the respondents selected the intermediate answer between “reliable” and “careful” (36.6%).
However, the total of the answers “Most people are reliable” and “Most people are reliable to some extent” accounted for 25.6% of all, exceeding the total of the answers “It’s better to be careful about others” and “Most people are not so reliable” (23.0%).
The Economic and Social Research Institute of the Cabinet Office conducted a similar survey and showed the results in “the Report of Survey on Community Regeneration and Social Capital” published in August 2005. In this survey, the respondents were asked to answer regarding the degree of trust for others among the nine levels, from “Most people are reliable (Level 1) “to “It’s better to be careful about others (Level 9).”
Figure 10. Results of “Kobe 2010 Vision” Challenge Index Field Survey: Disaster-Reduction Activities
2005 “Kobe 2010 Vision”
Frequently 4%
Sometimes12%
Seldom 18%
Nothing 66%
2006 “Kobe 2010 Vision”
Frequently 3%
Sometimes10%
Seldom 17%
Nothing 70%
Figure 11. Results from 4 Districts: Trust of Others
n=776Most people are reliable
11.7%
Most people are reliable to some extent
13.9%
Intermediate between reliable
and careful 36.6%
Most people are not so reliable 6.4%
It’s better to be careful about
others 16.6%
No idea 5.8%
No response8.9%
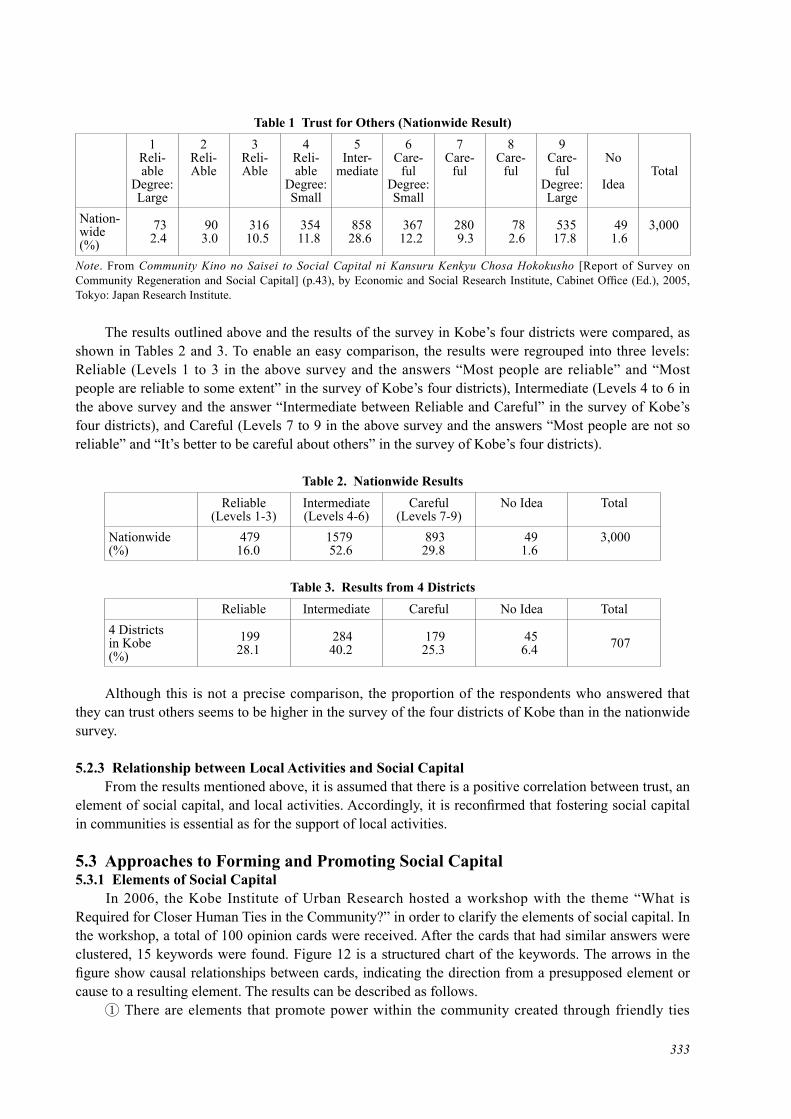
333
Table 1 Trust for Others (Nationwide Result)1
Reli-able
Degree:Large
2Reli-Able
3Reli-Able
4Reli-able
Degree:Small
5Inter-
mediate
6Care-
fulDegree:Small
7 Care-
ful
8Care-
ful
9 Care-
fulDegree:Large
No
IdeaTotal
Nation-wide(%)
732.4
903.0
31610.5
35411.8
85828.6
36712.2
2809.3
782.6
53517.8
491.6
3,000
Note. From Community Kino no Saisei to Social Capital ni Kansuru Kenkyu Chosa Hokokusho [Report of Survey on Community Regeneration and Social Capital] (p.43), by Economic and Social Research Institute, Cabinet Office (Ed.), 2005, Tokyo: Japan Research Institute.
The results outlined above and the results of the survey in Kobe’s four districts were compared, as shown in Tables 2 and 3. To enable an easy comparison, the results were regrouped into three levels: Reliable (Levels 1 to 3 in the above survey and the answers “Most people are reliable” and “Most people are reliable to some extent” in the survey of Kobe’s four districts), Intermediate (Levels 4 to 6 in the above survey and the answer “Intermediate between Reliable and Careful” in the survey of Kobe’s four districts), and Careful (Levels 7 to 9 in the above survey and the answers “Most people are not so reliable” and “It’s better to be careful about others” in the survey of Kobe’s four districts).
Table 2. Nationwide ResultsReliable
(Levels 1-3)Intermediate(Levels 4-6)
Careful(Levels 7-9)
No Idea Total
Nationwide(%)
47916.0
157952.6
89329.8
491.6
3,000
Table 3. Results from 4 DistrictsReliable Intermediate Careful No Idea Total
4 Districts in Kobe (%)
19928.1
28440.2
17925.3
456.4 707
Although this is not a precise comparison, the proportion of the respondents who answered that they can trust others seems to be higher in the survey of the four districts of Kobe than in the nationwide survey.
5.2.3 Relationship between Local Activities and Social Capital From the results mentioned above, it is assumed that there is a positive correlation between trust, an element of social capital, and local activities. Accordingly, it is reconfirmed that fostering social capital in communities is essential as for the support of local activities.
5.3 Approaches to Forming and Promoting Social Capital5.3.1 Elements of Social Capital In 2006, the Kobe Institute of Urban Research hosted a workshop with the theme “What is Required for Closer Human Ties in the Community?” in order to clarify the elements of social capital. In the workshop, a total of 100 opinion cards were received. After the cards that had similar answers were clustered, 15 keywords were found. Figure 12 is a structured chart of the keywords. The arrows in the figure show causal relationships between cards, indicating the direction from a presupposed element or cause to a resulting element. The results can be described as follows.① There are elements that promote power within the community created through friendly ties

334
between people and elements derived from the power. This power can be defined as social capital.② The causal elements were classified into the following six directivity axes, and these six axes are
elements that create and foster social capital. ・Axis of event: on the premise that people have free time and surplus money, it is necessary
that many events are held in the community. ・Axis of communication with children: on the premise that there is good communication
between couples and family members, it is necessary that people communicate with children in the neighborhood. ・Axis of interest and respect for the community: on the premise that people know the local
history and attractions, it is necessary that people have an interest in the community and respect the community. ・Axis of greeting: on the premise that people have lived in the community for a long time, it
is necessary that people exchange greetings and chat with neighbors. ・Axis of participation of various residents: on the premise that people have lived in the
community for a long time, it is necessary that various people participate. ・Axis of common challenge: it is necessary that people have common enemies and problems.③ One of the derived elements is that people have consideration for others, trust others, and are
kind to others. This element implies that people help and make friends with each other.④ The power in the community created through friendly ties between people and the all elements
derived from it are the premises of the element stating that local organizations consisting of members with diverse roles must be maintained.⑤ A correlation is shown between the element stating local organizations consisting of members
with diverse roles must be maintained and the element calling for no excessive involvement of the administration (this relationship is hereinafter referred to as the autonomy axis of local resident organizations
Figure 12. Hypothesis Concerning the Elements of Social Capital(Second Workshop for Joint Policies for Social Capital, 2006)
What is required for closer human ties in
the community?
People know the local history and attractions.
People have free time and surplus
money.
Many events are held in the community.
People communicate with children in the
neighborhood.
People have an interest in the
community and respect the community.
People exchange greetings and chat
with neighbors.
People have lived in the community for a
long time.
Power in the community created through friendly ties
between people
Various people can participate.
People have common enemies and problems.
People have consideration for
others, trust others, and are kind to
others.
People help and make friends with
each other.
Local organizations consisting of members with diverse roles are
maintained.
No excessive involvement of the
administration
What is required for closer human ties in the community?There is good communication between
couples and family members.
335
5.3.2 Factors that Facilitate Ties between People Concerning the important factors that facilitate ties between people in the community, the residents in the four districts were asked to choose two from among eight choices: six elements that create social capital, autonomy of local organizations, and role of the government.
The largest proportion of the respondents chose “to facilitate greetings among local residents” as an important factor to facilitate ties between people (54.0%), and the second most frequent answer was “to sufficiently communicate to all residents information on local problems and challenges” (39.2%).
5.3.3 Participation of Various Residents Concerning the necessary items to enhance the participation of various residents, which is an element that creates social capital, the residents in the four districts were asked to choose two from among five choices.
The largest proportion of the respondents chose “anyone welcome, open social gathering, like a housewives’ chat session” as a necessary item to enhance the participation of various residents, accounting for 47.7%. The answer with the second largest number of responses was “democratic management of local organizations including neighborhood residents’ associations” (35.6%), followed by “opportunities to discuss and act in the community concerning various topics such as child rearing and environmental problems” (33.6%).
Figure 13. Factors that Facilitate Ties between People
n=776
12.5%
54.0%
18.3%
13.1%
10.2%
39.2%
9.8%
13.0%
2.1%
10.8%
0% 10% 20% 30% 40% 50% 60%
To have more interest in and understanding of local culture, history, and events
To facilitate greetings among local residents
To plan and hold local events (festivals and athletic meets) mainly by local residents
To promote manners of resident participation, not just through territorial connections
To sufficiently communicate to all residents information on local problems and challenges To enhance self-managing capability (autonomy and independence) of the community
To expand and deepen relationships with children in the community
Governmental support of local activities that residents chose and implemented for themselves
Others
No response
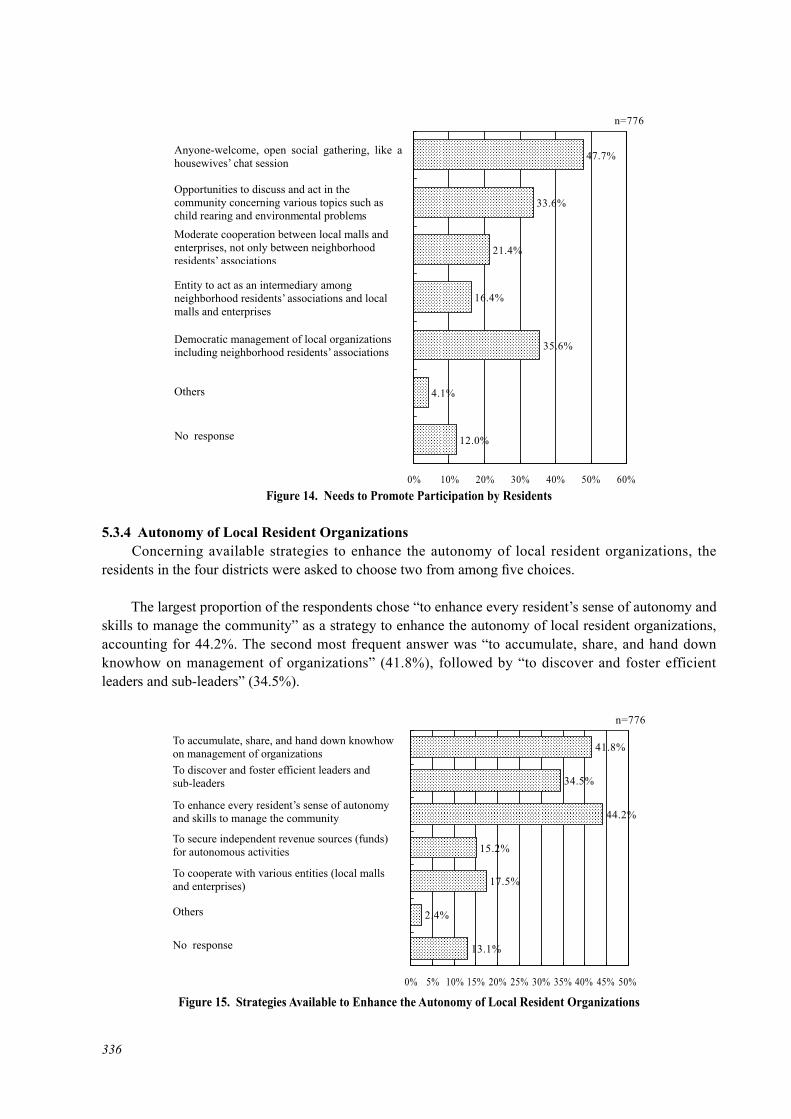
336
5.3.4 Autonomy of Local Resident Organizations Concerning available strategies to enhance the autonomy of local resident organizations, the residents in the four districts were asked to choose two from among five choices.
The largest proportion of the respondents chose “to enhance every resident’s sense of autonomy and skills to manage the community” as a strategy to enhance the autonomy of local resident organizations, accounting for 44.2%. The second most frequent answer was “to accumulate, share, and hand down knowhow on management of organizations” (41.8%), followed by “to discover and foster efficient leaders and sub-leaders” (34.5%).
Figure 14. Needs to Promote Participation by Residents
n=776
47.7%
33.6%
21.4%
16.4%
35.6%
4.1%
12.0%
0% 10% 20% 30% 40% 50% 60%
Anyone-welcome, open social gathering, like a housewives’ chat session
Opportunities to discuss and act in the community concerning various topics such as child rearing and environmental problems Moderate cooperation between local malls and enterprises, not only between neighborhood residents’ associations
Entity to act as an intermediary among neighborhood residents’ associations and local malls and enterprises
Democratic management of local organizations including neighborhood residents’ associations
Others
No response
Figure 15. Strategies Available to Enhance the Autonomy of Local Resident Organizations
n=776
41.8%
34.5%
44.2%
15.2%
17.5%
2.4%
13.1%
0% 5% 10% 15% 20% 25% 30% 35% 40% 45% 50%
No response
To secure independent revenue sources (funds) for autonomous activities
To cooperate with various entities (local malls and enterprises)
To enhance every resident’s sense of autonomy and skills to manage the community
To discover and foster efficient leaders and sub-leaders
To accumulate, share, and hand down knowhow on management of organizations
Others

337
5.3.5 Role of the Government Concerning the roles of the government that are expected to support local activities in the future, the residents in the four districts were asked to choose two from among seven choices.
The largest proportion of the respondents chose “to provide detailed assistance, taking into consideration the circumstances and activities of individual communities” as the most important role of the government, accounting for 33.1%. The second most frequent answer was “to create opportunities to achieve autonomy and independence of the community” (29.1%), followed by “to respect independence of individual communities when providing assistance and to unite subsidy programs as to allow as flexible use of the subsidies” (26.7%).
6 Conclusion
Local communities that had functioned well since long before the earthquake not only worked well together in the emergency-response phase immediately after the earthquake but also overcame a number of trying conditions and took the initiative for life recovery of the residents. These communities served as a bridge among the survivors, the government, and the volunteers from outside the communities and played an important role in requesting that the government address the needs of the survivors. Meanwhile, creation of communities at temporary housing facilities and disaster-restoration public housing facilities helped to prevent neglected deaths.
Figure 16. Appropriate Roles for the Government in Supporting Local Activities
n=776
29.1%
22.6%
11.2%
21.9%
33.1%
26.7%
9.0%
3.1%
13.3%
0% 5% 10% 15% 20% 25% 30% 35%
To create opportunities to achieve autonomy and independence of the community
Others
No response
To expand commission of projects (consignment of jobs by giving compensation) from the government to the community
To respect the independence of individual communities when providing assistance and to unite subsidy programs as to allow flexible use of the subsidies
To provide detailed assistance, taking into consideration the circumstances and activities of individual communities
To appoint municipal staff for each community and promote a face-to-face local administration
To help promote resident-led community development: dispatch of experts such as consultants, etc.
To enhance management ability of personnel (including government officials) who play a role in the community

338
Having known the tremendous damage caused by the Kobe Earthquake, many people inside and outside Japan offered a helping hand to people in the devastated areas. Many volunteers came to the devastated areas and played a great role in life recovery. This enabled people to rediscover the great power of volunteers and their significance. The function that such local communities and volunteers fulfilled to help obtain life recovery of the survivors serves to emphasize the tangible effects of social capital.
Also, it has been demonstrated that there was a positive correlation between local activities and the social capital element, trust, in the case of Kobe and confirmed that fostering of social capital in communities is essential for the support of local activities.
Furthermore, it was found that providing detailed assistance taking into account the circumstances and activities of individual communities is the role most people expect the government to play. This was followed by the creation of opportunities to achieve community autonomy and independence and the respect of the independence of individual communities when providing assistance.
ReferenceQuality-of-Life Policy Bureau, Cabinet Office (Ed.) (2003), Social Capital: Yutakana ningen kankei to
shimin katudo no kojunkan o motomete [Social capital: Seeking a Virtuous Cycle between Close Human Relationships and Civil Activities]. Tokyo: National Printing Bureau.

CHAPTER 2
Examples of Specific Projects
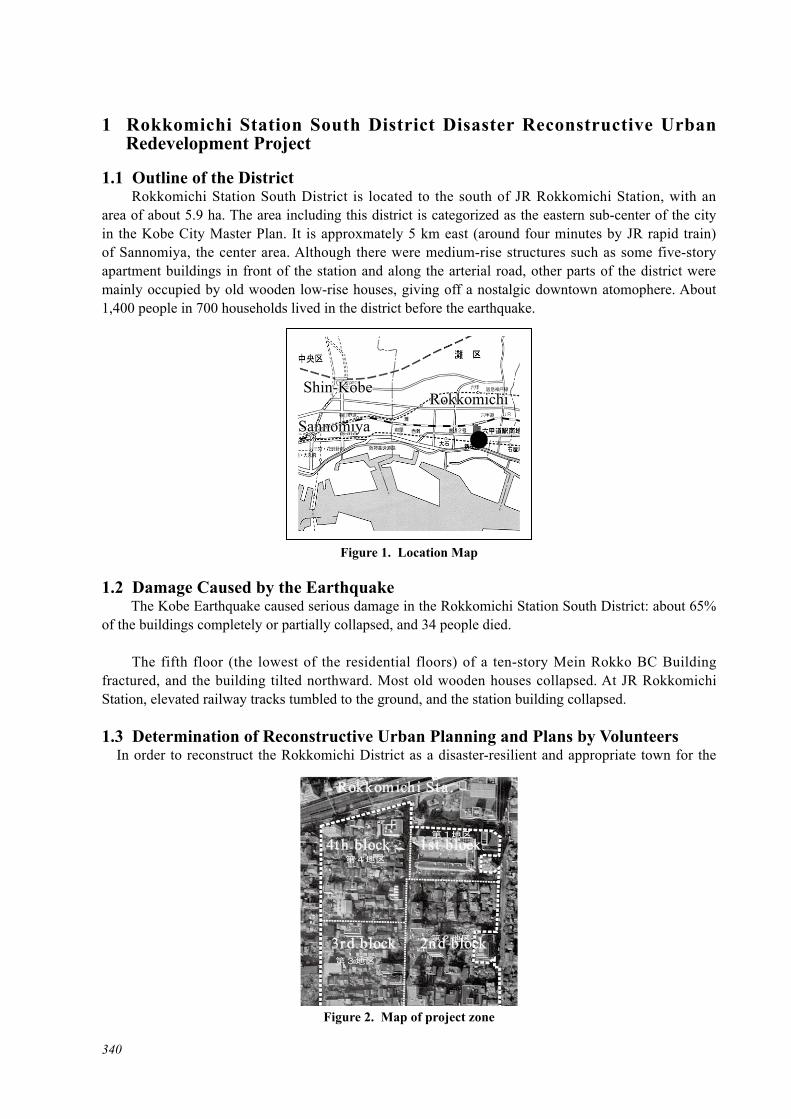
340
1 Rokkomichi Station South District Disaster Reconstructive Urban Redevelopment Project
1.1 Outline of the District Rokkomichi Station South District is located to the south of JR Rokkomichi Station, with an area of about 5.9 ha. The area including this district is categorized as the eastern sub-center of the city in the Kobe City Master Plan. It is approxmately 5 km east (around four minutes by JR rapid train) of Sannomiya, the center area. Although there were medium-rise structures such as some five-story apartment buildings in front of the station and along the arterial road, other parts of the district were mainly occupied by old wooden low-rise houses, giving off a nostalgic downtown atomophere. About 1,400 people in 700 households lived in the district before the earthquake.
1.2 Damage Caused by the Earthquake The Kobe Earthquake caused serious damage in the Rokkomichi Station South District: about 65% of the buildings completely or partially collapsed, and 34 people died.
The fifth floor (the lowest of the residential floors) of a ten-story Mein Rokko BC Building fractured, and the building tilted northward. Most old wooden houses collapsed. At JR Rokkomichi Station, elevated railway tracks tumbled to the ground, and the station building collapsed.
1.3 Determination of Reconstructive Urban Planning and Plans by Volunteers In order to reconstruct the Rokkomichi District as a disaster-resilient and appropriate town for the
Figure 1. Location Map
Shin-Kobe Shin-Kobe
Sannomiya Sannomiya
RokkomichiRokkomichi
Figure 2. Map of project zone
Rokkomichi Sta .
4th block 1st block
3rd block 2nd block

341
eastern sub-center, the Kobe City Government decided to apply the redevelopment method to the south district and the land readjustment method to the north and west districts.
The Kobe City Government had previously used this redevelopment method to improve the districts of several areas, including the center area of Sannomiya, Ohashi, and Shin-Nagata areas in the western sub-center and the Rokko area in the eastern sub-center. Based on these experiences, the city government decided to recover two districts of the eastern and western sub-centers, Rokkomichi Station South District (approx. 5.9 ha) and Shin-Nagata Station South District (approx. 20 ha), by using the redevelopment method.
The Rokkomichi Station South District Reconstructive Urban Redevelopment Project covers an area of about 5.9 ha, which is surrounded by the JR line and the station plaza to the north, Route 2 to the south, the Yahata Line to the east, and the Rokko-Shinmichi Line to the west. The four main purposes of the project are as follows: provision of disaster management bases, realization of urban functions worthy of a city sub-center, mass provision of various types of housing, and improvement of pedestrian networks.
■ A redevelopment project is a project to improve public facilities such as roads and parks, buildings, and their sites, in an integrated manner.
■With effective and intensive land use, land space for roads and parks is created. Land owners exchange their land and buildings for floor space in redeveloped buildings, the value of which is equivalent with that of their land and buildings, and they move into the redeveloped buildings.
■ Project expenses (project planning fees, re t i rement cos t , compensat ion cos t , construction cost, etc.) are covered by monetary gains on the sale of “reserved floor spaces,” which are those spaces other than those the land owners acquire (“entitled floor space”), subsidies, etc.
Figure 3. Imagery of Redevelopment Project
Figure 4. Original Urban Planning
Rokkomichi Sta.
Route 2
Rok
ko-s
hinm
ichi
Yaha
ta L
ine

342
Figure 4 shows the original urban-planning design formulated by the city government. Although there was strong opposition to the plan from local residents, it was finalized on March 17, 1995.
Realizing that redevelopment of the district would be inevitable and that their opinions should be reflected in the urban planning design, about 50 local residents drew up a separate plan themselves, with the help of university teachers and students, outlining their vision of the ideal town where they want to keep living. This plan was significantly different from the city government’s plan in the following two areas: the district mainly consists of low-rise complex housing structures that still gives residents a sense that they live in detached houses, while high-rise buildings are situated only in front of the station, and a mall featuring greenery and water runs through the center of the district from north to south with a small park placed in every block.
In early April, the members proposed their plan to the Kobe City Government to ask for its adoption. The answer from the city was that it would later establish a Machizukuri (community development) organizations composed of residents in the entire district, and therefore the proposals should be discussed in the meetings of this organization. Accordingly, the members participated in the Machizukuri organization and started their activities to have their opinions reflected in the urban planning.
1.4 Establishment of the Machizukuri Organizations Although the progress of the redevelopment project was stalemated for some time after the determination of urban planning, in mid-May residents started to establish Machizukuri organizations. They decided to set up a Machizukuri organization on the basis of neighborhood residents’ associations, and four Machizukuri organizations (Sakuraguchi-5, Obin-4, Fukabin-5, and Fukada-4 Minami) were established by June 18, 1995.
The role of the Machizukuri organizations is to build a consensus among residents to draw up a proposal on community development. With the progress of the project, the organizations also review the contents of facilities to be built, negotiate on floor-spaces price with the city government, and determine matters on the management of buildings and parks.
Since four Machizukuri organizations were established in the district, the Machizukuri Joint Organization of Rokkomichi Station South District was formed to coordinate the activities of the four organizations.
Photo 1. Counter Plan by Residents
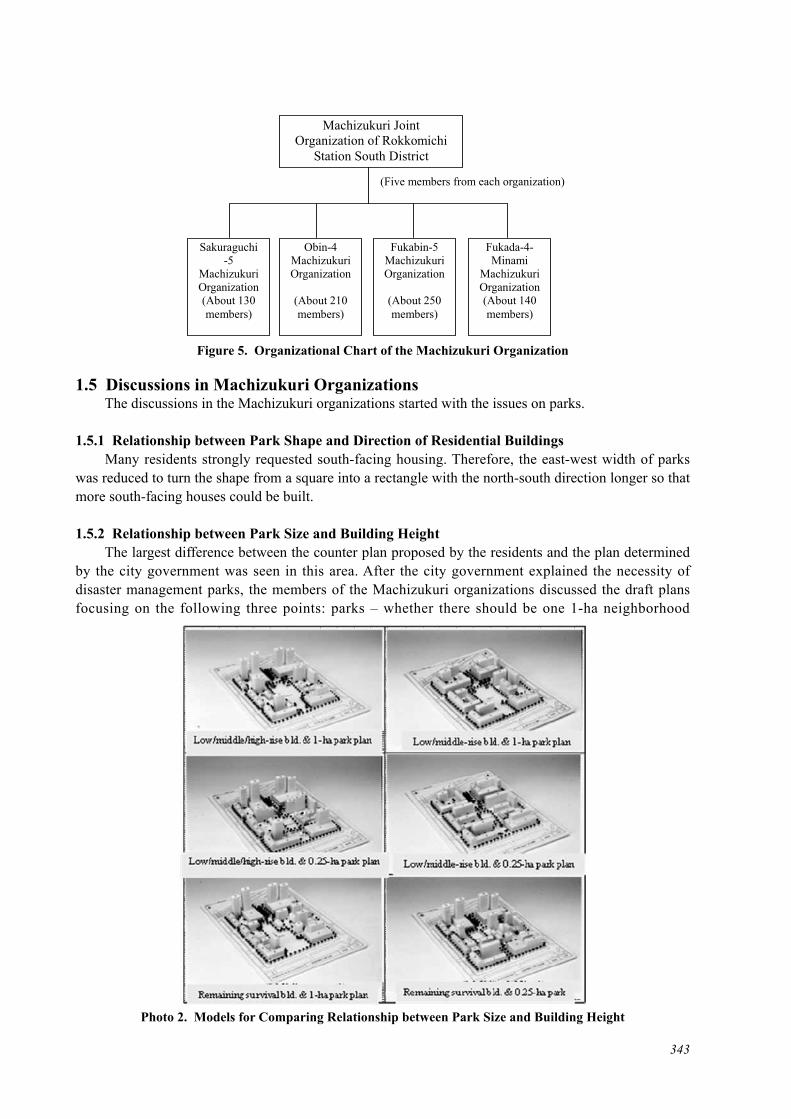
343
1.5 Discussions in Machizukuri Organizations The discussions in the Machizukuri organizations started with the issues on parks.
1.5.1 Relationship between Park Shape and Direction of Residential Buildings Many residents strongly requested south-facing housing. Therefore, the east-west width of parks was reduced to turn the shape from a square into a rectangle with the north-south direction longer so that more south-facing houses could be built.
1.5.2 Relationship between Park Size and Building Height The largest difference between the counter plan proposed by the residents and the plan determined by the city government was seen in this area. After the city government explained the necessity of disaster management parks, the members of the Machizukuri organizations discussed the draft plans focusing on the following three points: parks – whether there should be one 1-ha neighborhood
Figure 5. Organizational Chart of the Machizukuri Organization
Fukabin-5 Machizukuri Organization
(About 250 members)
Fukada-4- Minami
Machizukuri Organization(About 140 members)
Obin-4 Machizukuri Organization
(About 210 members)
Sakuraguchi-5
Machizukuri Organization (About 130 members)
Machizukuri Joint Organization of Rokkomichi
Station South District
(Five members from each organization)
Photo 2. Models for Comparing Relationship between Park Size and Building Height

344
park placed in the area (plan A) or a 0.25-ha park in each block (plan B), buildings – whether high-rise, middle-rise, and low-rise buildings should be built in mix (plan A) or only middle- and low-rise buildings should be built (plan B), and surviving apartment buildings (*four apartment buildings in the area were relatively large and suffered little damage from the earthquake) – whether these apartment buildings should remain (plan A) or be demolished and jointly redeveloped (plan B). The members combined these draft plans and created models for comparison.
1.5.3 Relationship between Park Size and Building Price Based on Floor Space Under the national standards for building parks, a block park shall have an area of 0.25 ha. The next larger one, a neighborhood park, shall have an area of 2 ha. The city government previously obtained the national government’s consent to reduce the size of neighborhood parks from 2 ha to 1 ha. However, there was worry that the construction of parks would be ineligible for subsidies from the national government if the size were further reduced, which could lead to the rise in housing prices in the newly constructed buildings in order to balance the project budget.
Moreover, the main purpose of the project was to create disaster-management support bases, which requires a large park. From this aspect, the city government could not compromise in securing the size commensurate with a disaster management park. After sufficient discussion, a questionnaire on this matter was circulated among the residents. Although the results from each Machizukuri organization differed, the respondents who supported the building of a 1-ha neighborhood park had a majority in every organization (56%-70%). This result comes from the fact that many residents still vividly remembered that they needed a large park as a primary evacuation site as well as to use for relief activities immediately after the earthquake, and they also realized that it was difficult to change the opinion of the city government on the park size.
Finally, in the process of discussing the architectural planning of each block, it was settled to reduce the park size from 1 ha to 0.93 ha.
1.6 Submission of the Machizukuri Proposal In December 1996, a Machizukuri Proposal, which was drawn up by the four Machizukuri organizations, was submitted to the city government. The main contents of the proposal were as follows: reduce the size of the park from 1 ha to 0.93 ha (turning its shape from a square into a vertically long shape to connect to Route 2), secure as many south-facing residences as possible, divide residential building projects into several projects to ensure that one building consists of only about 50 residences (to facilitate a consensus among tenants on building management), limit the height of buildings to less than
Figure 6. Machizukuri Proposal (Image of Total Area)

345
14 stories (to reduce maintenance fees), limit spaces for commercial tenants to those that face basically outside, consider inviting facilities, such as the ward office, mass retailers, and sports facilities, and respond flexibly on the matter of the surviving apartments through thorough discussions between the city government and the residents of those apartments.
After receiving the proposal, the Kobe City Government changed the urban planning in February 1997. Two years were required to finalize the urban planning after the original one was determined.
1.7 Examination of Park Planning in Residents’ Workshop The Machizukuri Joint Organization of Rokkomichi Station South District held a workshop, which a variety of residents, from children to the elderly, participated in, to draw up a draft park plan. Proposals from five groups were compiled to draw up a basic image of the park: where various local residents can safely enjoy themselves, many flowers and trees are planted, and local events and festivals can be held and which can serve as a disaster prevention base in the time of an emergency. The park was built, reflecting this basic image.
1.8 Women’s Meeting In order to reflect the opinions of women who will move into the apartment buildings in the design of the apartment interior, each Machizukuri organization held a Women’s meeting. Reflecting the women’s opinions, room arrangement and the colors of interior materials became were determined, and the installation of several household conveniences, such as floor-heating devices, electromagnetic cookers, ovens, microwave ovens, water purifiers, and dishwashers became optional to satisfy the diverse needs of women, even sink height was determined by the future owner of the living space.
This method increased the popularity of these apartment buildings also among general public, and the units were easily sold.
1.9 Reviewing the Project The construction of all the 14 buildings was completed in March 2004. The construction of Rokkomichi South Park was finished in September 2005, and the project was completed. The following review of the project.
Photo 3. Resident’s Workshop

346
1.9.1 Movement Toward Creation of a New Community In the case of redevelopment projects, since many people move into the district from outside, residents are required to create a new community, where both existing residents and newcomers can gather. Welcome parties for tenants and an event to celebrate the start of the community gave residents opportunities to connect with each other and start developing a new community.
The management of the park and a community center in the park was entrusted to the community. The Minami Yahata Residents’ Joint Association has taken the lead in managing them.
The Rokkomichi Minami Park Hana (Flower) Club is a group of local volunteers that started activities when the redevelopment project was underway to enrich the district by planting flowers. They maintain the flower gardens in the park.
One of the challenges is that the participation rate in neighborhood residents’ associations, which were revived after the Machizukuri organizations were dissolved, has been low. Also, as another challenge, only one commercial association called Tanto-no-Kai, which consists of commercial tenants of a building in the Fukabin-5 block, has been formed so far, and the movement of forming such associations is not spreading throughout the area.
1.9.2 Achievements of the Redevelopment Project1) Temporary housing for the redevelopment project was built promptly in the district.2) City-provided housing was constructed in the district, and local residents were given priority.3) New urban functions were introduced, such as the Ward Office, a sports facility, a mass retailer,
and parking lots.4) Public facilities were constructed, such as a disaster-management park which became a symbol
of the area, and a pedestrian deck.5) Housing that meets the needs of a wide range of people was provided, and the population and the
number of households increased about 1.4-fold based on the number before the earthquake.
1.9.3 What Couldn’t be Achieved by the Redevelopment Project and Countermeasures1) Creation of a town with detached houses and low-rise housing As a countermeasure, the city government offered alternative sites in the surrounding areas to
those who requested detached houses.2) Emergency restoration and recovery within a few years after the earthquake Countermeasures are
as follows. a) The city government constructed temporary housing in the district to encourage residents to
Photo 4. Event for Celebrating the Start of a Community

347
come back to the district. - The city government built temporary housing for the redevelopment project in the district. - The city government permitted residents to build temporary houses in their land until they
move out due to the redevelopment project. (When they moved out in the project, the city government also included the value of the rebuilt houses in the compensation money.)
b) The city government devised ways for project implementation. - The city government broke the construction work down by zones, commenced works
wherever possible, and completed projects one by one. - The city government allowed exchange of land titles between the construction zones so that
residents who made requests could move into early-built housing in a different zone. - Ahead of the other work, the city government constructed public housing, for which local
residents were given priority.
1.9.4 Factors to Enabled the Rokkomichi Station South District Reconstructive Urban Redevelopment Project to be Completed in 10 Years
The redevelopment project in this district is said to have been completed much more quickly than other redevelopment projects on similarly large scale. This is partly because the project was a reconstructive project in an earthquake-stricken area. However, the main factors are as follows.
1) Machizukuri organizations functioned well. a) Opinions of local residents were integrated into the organization. b) Sufficient discussions occurred in the organization meetings.c) Discussions in the meetings were always open to the residents (e.g., publication of newsletters,
holding of briefing sessions, implementation of questionnaires, and use of the postal ballot system).
d) Local residents trusted the Machizukuri organizations and followed their decisions.2) Cooperation among residents (Machizukuri organizations), experts, and the city government was
successful, and it is because of this collaboration that the projects could be completed in 10 years.
2 Rokkomichi Station North District Disaster Reconstructive Land Readjustment Project
2.1 Introduction The urban areas of Kobe, including dense areas of old wooden houses, suffered catastrophic damage from the Kobe Earthquake. The Kobe City Government implemented urban redevelopment projects and
Photo 5. Redeveloped Rokkomichi Station South District Photo 6. Rokkomichi South Park

348
land readjustment projects as disaster reconstructive projects to create disaster-resilient, safe, secure, and comfortable urban areas. The Rokkomichi Station North District Disaster Reconstructive Land Readjustment Project is an example of these projects.
2.2 Outline of Rokkomichi Station North District2.2.1 Location The Rokkomichi Station North District is categorized as part of the eastern sub-center of the city in the Kobe City Master Plan. Located to the northwest of Rokkomichi Station on the JR Kobe Line, the district is about 4 km east of Sannomiya, the center area of Kobe. It has an area of 16.1 ha, surrounded by the Yamate Trunk Road (urban planning road, width: 27 m) to the north, the JR Kobe Line to the south, Rokko-Hondori Shopping Mall to the east, and Nada Elementary School to the west.
2.2.2 State Before the Earthquake Before the earthquake, the district was a residential area with mainly wooden detached houses or row housing, and many of the row houses were built prior to World War II. While the district was a convenient place where commercial facilities, such as a shopping mall and a market, were concentrated, it suffered several problems, including a concentration of very small houses, the aging of houses, and the lack of roads and other urban infrastructures.
2.2.3 Damage Caused by the Earthquake The Kobe Earthquake inflicted devastating damage to the district. Utilities such as electricity, gas, water, sewage, and telephone lines were cut off, and transport services were disrupted. Many houses, old wooden houses in particular, were destroyed.
Most everything in the northern parts of Rokko-cho 1- and 2-chome were burned to the ground because of fires that broke out immediately after the earthquake. About two thirds of the buildings in the
Figure 1. Location MapNote. From Ima Yomigaeru Sato Soshite Asue: Rokkomichi Eki Kita Chiku Shinsai Fukko Tochi Kukakuseiri Jigyo [Recovering a Hometown and Its Future: Rokkomichi Station North District Disaster Reconstructive Land Readjustment Project] by Junji Kumabuchi (January 2007, Land Readjustment, 50(1), p. 73).
Rokkomichi Station North District JR Kobe Line
Sannomiya
Rokkomichi St.
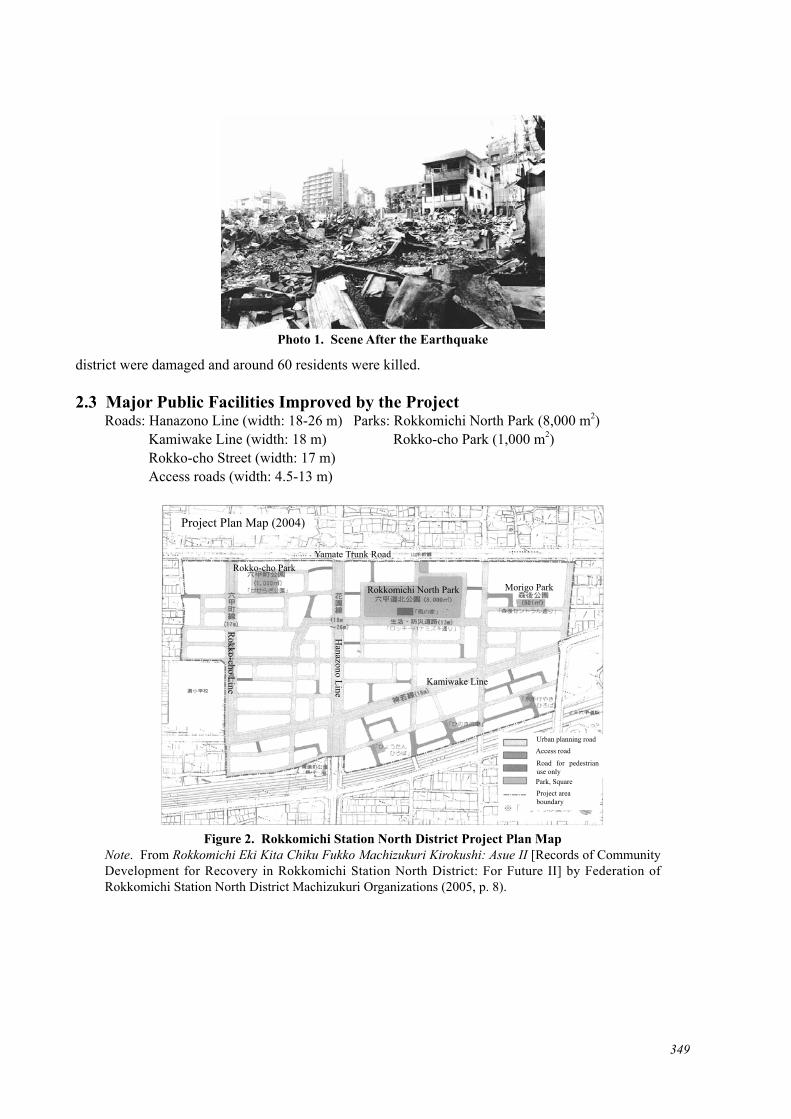
349
district were damaged and around 60 residents were killed.
2.3 Major Public Facilities Improved by the Project Roads: Hanazono Line (width: 18-26 m) Parks: Rokkomichi North Park (8,000 m2) Kamiwake Line (width: 18 m) Rokko-cho Park (1,000 m2) Rokko-cho Street (width: 17 m) Access roads (width: 4.5-13 m)
Photo 1. Scene After the Earthquake
Figure 2. Rokkomichi Station North District Project Plan MapNote. From Rokkomichi Eki Kita Chiku Fukko Machizukuri Kirokushi: Asue II [Records of Community Development for Recovery in Rokkomichi Station North District: For Future II] by Federation of Rokkomichi Station North District Machizukuri Organizations (2005, p. 8).
Project Plan Map (2004)
Yamate Trunk Road
Rokkomichi North Park
Rokko-cho Park
Morigo Park
Kamiwake Line
Hanazono Line
Rokko-cho Line
Urban planning road Access road
Road for pedestrian use only Park, Square Project area boundary

350
2.4 Process of Community Development for Recovery2.4.1 Consensus Building with Local Residents The city government determined to apply the land readjustment method to the reconstruction of the Rokkomichi Station North District, with the aims of introducing urban functions appropriate for the eastern sub-center as well as improving the living environment.
However, residents were alarmed by the designation of building-restriction areas (February 1, 1995) and the publication of the land readjustment project (February 23, 1995). In order to better understand the project and relevant technical terms, including “reduction of site area” and “land reallocation,” some residents voluntarily established the Association of Community Development in Rokko on March 10 and then conducted workshops and circulated questionnaires. As a result, many residents’ opinions were that the project should not be implemented at the time when they were still in the process of recovering from the disaster. The association submitted their opinion in writing with 931 signatures just before the urban-planning procedures were determined (March 17, 1995).
In May, in order to clarify the issues on the land readjustment project and find solutions, “Meetings to Express Opinions to the Kobe City Government” were held between the association and the city government nine times within a six-day period. In the discussions, the city government made several proposals to the residents, such as the establishment of Machizukuri (community development) organizations and the dispatch of Machizukuri consultants, in order to facilitate community development
What is a Land Readjustment Project? The land readjustment project is a project to improve the living environment of an urban area by constructing necessary public facilities such as roads and parks as well as promoting effective use of building lots. This project involves provision of a portion of land by individual landowners and land reallocation. As a basic method for upgrading the urban infrastructure, the land readjustment project is called “the mother of urban planning.” The projects are implemented in accordance with the characteristics of areas and their purposes.
Figure 3. System of Land Readjustment

351
under cooperation between local residents and the city government.
2.4.2 Establishment of Machizukuri Organizations After the determination of the urban-planning program, preparation for establishing Machizukuri organizations started. Between August and November 1995, eight Machizukuri organizations were established on the basis of neighborhood residents’ associations. For the activities of Machizukuri organizations, subsidies were provided by the Kobe Machizukuri Center. Each Machizukuri organization independently worked to formulate a draft community-development plan. They not only held a study meeting almost every week but also conducted a survey and produced newsletters.
As for the formulation of the draft, since local residents started their activities by holding study meetings, they could gain various knowledge required for community development and share common perceptions, which provided them with hints to resolve the issues. In this manner, individual Machizukuri organizations independently studied various issues, coordinated and integrated the opinions of the residents into one, and eventually submitted the first Machizukuri proposal to the city government.
The Federation of Rokkomichi Station North District Machizukuri Organizations was established in April 1996, to serve as a window of overall negotiations with the city government as well as to
Photo 2. Explanation by a Machizukuri Consultant Photo 3. Submission of a Machizukuri Proposal
Figure 4. Organizational Chart of a Machizukuri Organization

352
facilitate cooperation among the eight organizations in solving the issues that were difficult to address individually as well as the common challenges. In addition, the federation set up six expert committees, including the Housing Reconstruction Expert Committee and the Roads and Squares Expert Committee, to study specific issues more concretely and technically. As a result of such detailed study, the number of proposals by residents reached five.
2.5 Community Development Considering Local Characteristics2.5.1 Housing Reconstruction Under the federation, residents held discussions and worked together to formulate the district planning program, which was to stipulate certain rules on housing reconstruction and community development, aiming to create a comfortable living environment and an attractive townscape as well as to facilitate housing reconstruction. The federation submitted a proposal on district planning to the city government in November 1996. The district planning program, which stipulated various rules such as restriction of building usage, minimum site area, and restriction on building height, was finalized in February 1997.
Since this district was a densely populated residential area and a large number of building lots were very small, some residents found it difficult to independently reconstruct houses the same size as their former ones in their lots due to regulations. Therefore, the Kobe City Inner-Row-Housing Urban Area Improvement Guidance System was adopted, and the building coverage ratio was eased by 10 percent by designating those small lots as sites equivalent to corner sites.
As a measure to support those who sold their land for the land readjustment project and thus had to find a new place to live, the city government built a public housing apartment (8 stories, 61 units). The joint housing projects were also promoted, in order to prevent houses from being rebuilt densely in small lots as before, increase the number of fire-proof buildings, and promote efficient and intensive land use. In the joint housing projects, four apartment buildings (242 units in total) were constructed.
2.5.2 Creation of a Stream Having keenly realized the importance of water during the firefighting activities and evacuation life in the aftermath of the earthquake, residents included the creation of a stream on the western sidewalk of Rokko-cho Street in the second and third Machizukuri proposals.
In constructing the stream, efficient use of energy was also taken into consideration. As the source of water, groundwater is used and solar energy is utilized as power for water intake. Since completion of
Photo 4. Public housing (Rokko Apartment) Photo 5. Joint House (Sefure Rokko)

353
the stream, the federation has been cleaning it about four times a year to maintain the landscape of the stream. The federation sought ideas for a nick name for Rokko-cho Street and decided to call it “Rokko Seseragi (Stream) Road.” Tiles with the nickname were also installed on the sidewalk. The road and stream are beloved by local residents.
2.5.3 Construction of Parks In the first Machizukuri proposal, construction of a neighborhood park, 2 block parks, and four pocket parks was proposed. In reviewing the construction issues, the construction of the Rokkomichi North Park, a neighborhood park, became an issue. Although it was originally decided to construct a park with an area of 1 ha, there was an argument about the necessity of creating such a large park at this site. The city government and the federation discussed the size and arrangement of the park and compared several draft plans. Eventually, taking the results of a survey of residents into account, the federation proposed reducing the park size. Accordingly, the city government altered the plan to change the size of the park to 0.8 ha in August 1996 and finalized the project plan in November of the same year.For the construction of the Rokkomichi North Park, the federation set up the Park Studies Expert Committee aiming to create a people-friendly park that everyone from children to the elderly could use comfortably. The committee held study meetings and workshops to draw up the park plan. The park plan was submitted to the city government as the fifth Machizukuri proposal in April 2002. With a large multipurpose plaza that can be used for local events, the Rokkomichi North Park has grandstands, playground equipment for small children, a pond, an arbor, and flower gardens. As a local disaster management base, it is also equipped with anti-seismic fire cisterns, temporary toilets, and storehouses of disaster- response tools and can be used as a temporary evacuation site in emergencies.
Photo 6. Stream beside Rokko-cho Street Photo 7. People Enjoying the Stream
Photo 8. Well with a Hand-Turned Pump Photo 9. Pocket Park
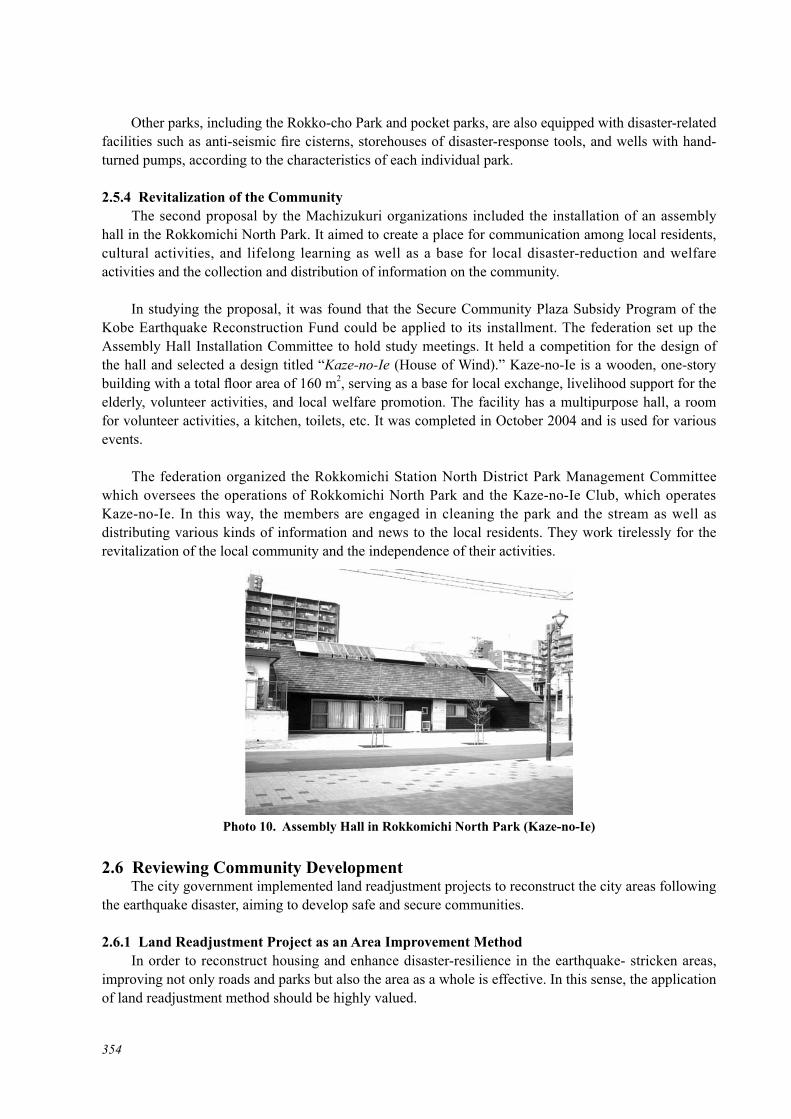
354
Other parks, including the Rokko-cho Park and pocket parks, are also equipped with disaster-related facilities such as anti-seismic fire cisterns, storehouses of disaster-response tools, and wells with hand-turned pumps, according to the characteristics of each individual park.
2.5.4 Revitalization of the Community The second proposal by the Machizukuri organizations included the installation of an assembly hall in the Rokkomichi North Park. It aimed to create a place for communication among local residents, cultural activities, and lifelong learning as well as a base for local disaster-reduction and welfare activities and the collection and distribution of information on the community.
In studying the proposal, it was found that the Secure Community Plaza Subsidy Program of the Kobe Earthquake Reconstruction Fund could be applied to its installment. The federation set up the Assembly Hall Installation Committee to hold study meetings. It held a competition for the design of the hall and selected a design titled “Kaze-no-Ie (House of Wind).” Kaze-no-Ie is a wooden, one-story building with a total floor area of 160 m2, serving as a base for local exchange, livelihood support for the elderly, volunteer activities, and local welfare promotion. The facility has a multipurpose hall, a room for volunteer activities, a kitchen, toilets, etc. It was completed in October 2004 and is used for various events.
The federation organized the Rokkomichi Station North District Park Management Committee which oversees the operations of Rokkomichi North Park and the Kaze-no-Ie Club, which operates Kaze-no-Ie. In this way, the members are engaged in cleaning the park and the stream as well as distributing various kinds of information and news to the local residents. They work tirelessly for the revitalization of the local community and the independence of their activities.
2.6 Reviewing Community Development The city government implemented land readjustment projects to reconstruct the city areas following the earthquake disaster, aiming to develop safe and secure communities.
2.6.1 Land Readjustment Project as an Area Improvement Method In order to reconstruct housing and enhance disaster-resilience in the earthquake- stricken areas, improving not only roads and parks but also the area as a whole is effective. In this sense, the application of land readjustment method should be highly valued.
Photo 10. Assembly Hall in Rokkomichi North Park (Kaze-no-Ie)

355
When residents tried to reconstruct their houses and recover their livelihood individually, they had to overcome a lot of challenges, such as requirements for road access, securing temporary houses, defining land boundaries, and issues concerning the rights of tenancy. Actually, there is a conventional governmental framework designed to help solve these issues. However, they would not have been smoothly overcome without additional support from the city government: the government constructed local roads and access roads to resolve the issues of road access, built temporary housing and public housing to help residents secure their houses, defined land boundaries and areas through the land-reallocation work, coordinated issues on rights such as those of tenancy, inheritance, etc.
Moreover, improvement of roads and parks and reconstruction of housing that were accomplished under the project enhanced disaster-resilience of the project districts and promoted earthquake-proofing of houses, which led to the development of safe and secure communities. Although there were difficulties in the process, the projects have come to be highly valued by many residents.
2.6.2 Community Development through Collaboration The city government had promoted community development through collaboration between local residents and the government even before the earthquake. The land readjustment project further advanced that effort. Measures such as the establishment of Machizukuri organizations, setting up of onsite advice centers, and dispatch of community development experts made a great contribution to community development for recovery after the earthquake.
Although there had been local organizations such as neighborhood residents’ associations, women’s associations, and children’s associations, they were formed by specific groups of people or focused on specific issues, and there was few opportunity for residents and related organizations to discuss community development. Establishment of the Machizukuri organizations gave residents, from children to the elderly, an opportunity to exchange opinions with each other to find solutions to the issues related to community development. Residents set up committees to study various issues and drew up a concrete image of community development by creating models for draft plans, holding workshops, and other approaches. These activities enhanced the residents’ awareness and integrated their opinions into better ones for the whole district, resulting in many proposals to the city government.
Regarding the onsite advice centers, local residents could easily consult and ask questions of the officials at the centers. Face-to-face meetings between local residents and government officials helped to dispel issues of mutual distrust and deepen discussions on specific issues.
Moreover, when the Machizukuri organizations studied the construction of local roads and parks, community development experts played a great role in explaining technical issues to residents and coordinating among the concerned parties since it was difficult for the Machizukuri organizations to handle these issues on their own. Especially, the experts served as a bridge between the residents and the government. Although the residents and the government were in a major conflict at first, the experts acted as an intermediary, helping them to communicate with each other and make constructive discussions. Needless to say, the experts also earned the trust of the residents and made a great contribution to building a consensus among residents for the proposals.
2.6.3 Revitalization of the Local Community In the process of community development, it is vital that residents have a strong attachment to their own community and take the initiative in addressing various local issues. This requires building a good community based on active exchange and unity among local residents. In the process of community development for recovery, residents established the Mahichizukuri organizations, where they drew up

356
proposals after active discussion. They are also engaged in the maintenance of roads and the facilities that were installed in parks and hold events using these facilities. These activities have promoted the revitalization of the local communities.
The disaster reconstructive land readjustment projects contributed to the enhancement of collaboration among local residents and nurturing of communities. The parks and streams constructed in various districts under the projects are maintained by local residents. The park management committees clean the parks and replant and water flowers and trees. Streams installed beside several roads are periodically cleaned by local residents. Residents also conduct various activities and hold events at assembly halls and community centers installed in the parks, making efforts to revitalize their communities.
Moreover, even after completion of the projects, residents are trying to realize the future image of the communities drawn up by themselves, by utilizing the experiences, knowhow, and human resources developed through the community-development activities for recovery. They are working to nurture their communities so that people in the community can continue their activities and act on their own initiative with a sense of responsibility as main players in community development.
Photo 11. Cleaning the Stream
Photo 12. Rokko Autumn Tokimeki (Cheer Up) Festival

List of Authors ●
Yasuo TANAKA Part I, Chapter 1 Professor, Research Center for Urban Safety & Security, Kobe UniversityChusaku YASUDA Part III, Chapter 2-1; Part III, Chapter 3-1 Professor Emeritus, Kobe University/ Kobe Technical Experts Co-operative Association for the Prevention Against DisastersYoshimasa KATOH Part III, Chapter 4-1.1 Professor, University of HyogoShigeo TATSUKI Part III, Chapter 5-1 Professor, Doshisha UniversityTaemi SHIGENO Part III, Chapter 5-2.2 Senior Assistant Professor, Kobe Shinwa Women's UniversityNorio KATASE Part I, Chapter 2-1; Part I, Chapter 2-2.1; Part I, Chapter 3-1/2/3 Kobe City Urban Develpoment Corporation/ Kobe Technical Experts Co-operative Association for the
Prevention Against DisastersMakoto MATSUSHITA Part I, Chapter 2-2.2; Part III, Chapter 1; Part III, Chapter 6-1 Waterworks Bureau, City of Kobe/ Kobe Technical Experts Co-operative Association for the
Prevention Against DisastersHiroshi OSAMURA Part I, Chapter 2-3; Part III, Chapter 4-1.2 Industry and Agriculture Promotion Bureau, City of KobeKumie NONOMURA Part I, Chapter 3-4 Planning and Coordination Bureau, City of Kobe/Kobe Technical Experts Co-operative Association
for the Prevention Against DisasterToshikazu OTA Part II, Chapter 1 Port and Urban Projects Bureau, City of Kobe/ Kobe Technical Experts Co-operative Association for
the Prevention Against DisastersTadasu MASUDA Part III, Chapter 2-2 Urban Planning and Housing Bureau, City of KobeHisanori NAKAYAMA Part III, Chapter 3-2 Urban Planning and Housing Bureau, City of Kobe/ Kobe Technical Experts Co-operative Association
for the Prevention Against DisastersHaruyoshi SHINYA Part III, Chapter 4-2 Kobe Port Terminal Corporation/ Kobe Technical Experts Co-operative Association for the Prevention
Against DisastersKenji KATO Part III, Chapter 5-2.1 Kobe City Hospital OrganizationYasumasa HASEGAWA Part III, Chapter 6-2.1 Crisis Management Office, City of Kobe/ Kobe Technical Experts Co-operative Association for the
Prevention Against DisastersYoshinori SADAOKA Part III, Chapter 6-2.2 Fire Bureau, City of KobeTaisuke MATSUZAKI Part III, Chapter 6-2.3 Board of Education Secretariat, City of Kobe/ Kobe Technical Experts Co-operative Association for
the Prevention Against DisastersTetsuya IKUTA Part III, Chapter 6-2.4 Kobe City Housing Supply CorporationMasami KURAHASHI Part IV, Chapter 2-1 Kobe City Housing Supply Corporation/ Kobe Technical Experts Co-operative Association for the
Prevention Against DisastersHisashi UCHIDA Part IV, Chapter 2-2 Japan Society of Land Readjustment Experts/ Kobe Technical Experts Co-operative Association for
the Prevention Against DisastersYuichi HONJO Introduction; Part II, Chapter 2; Part IV, Chapter 1 Kobe Institute of Urban Research/ Kobe Technical Experts Co-operative Association for the
Prevention Against Disasters