Compound-Specific Isotope Analysis of Diesel Fuels in a Forensic Investigation
10
ORIGINAL RESEARCH ARTICLE published: 27 February 2015 doi: 10.3389/fchem.2015.00012 Compound-specific isotope analysis of diesel fuels in a forensic investigation Syahidah A. Muhammad 1,2,3 *, Russell D. Frew 1,4 and Alan R. Hayman 1 1 Department of Chemistry, University of Otago, Dunedin, New Zealand 2 Environmental Technology Division, School of Industrial Technology, Universiti Sains Malaysia, Pulau Pinang, Malaysia 3 Doping Control Centre, Universiti Sains Malaysia, Pulau Pinang, Malaysia 4 Division of Nuclear Applications in Food and Agriculture, International Atomic Energy Agency, Vienna, Austria Edited by: Ahmad Zaharin Aris, Universiti Putra Malaysia, Malaysia Reviewed by: Nasr Bensalah, Qatar University, Qatar Zheng Ren, University of Connecticut, USA *Correspondence: Syahidah A. Muhammad, Doping Control Centre, Universiti Sains Malaysia, Block J, 11800 USM, Pulau Pinang, Malaysia e-mail: syahidah.muhammad@ usm.my Compound-specific isotope analysis (CSIA) offers great potential as a tool to provide chemical evidence in a forensic investigation. Many attempts to trace environmental oil spills were successful where isotopic values were particularly distinct. However, difficulties arise when a large data set is analyzed and the isotopic differences between samples are subtle. In the present study, discrimination of diesel oils involved in a diesel theft case was carried out to infer the relatedness of the samples to potential source samples. This discriminatory analysis used a suite of hydrocarbon diagnostic indices, alkanes, to generate carbon and hydrogen isotopic data of the compositions of the compounds which were then processed using multivariate statistical analyses to infer the relatedness of the data set. The results from this analysis were put into context by comparing the data with the 13 δ C and 2 δ H of alkanes in commercial diesel samples obtained from various locations in the South Island of New Zealand. Based on the isotopic character of the alkanes, it is suggested that diesel fuels involved in the diesel theft case were distinguishable. This manuscript shows that CSIA when used in tandem with multivariate statistical analysis provide a defensible means to differentiate and source-apportion qualitatively similar oils at the molecular level. This approach was able to overcome confounding challenges posed by the near single-point source of origin, i.e., the very subtle differences in isotopic values between the samples. Keywords: diesel fuel, alkane, compound-specific isotope analysis (CSIA), principal component analysis (PCA), hierarchical clustering analysis (HCA) INTRODUCTION Compound-specific isotopic analysis (CSIA) is a technique that is becoming increasingly popular as a forensic tool to measure stable isotope composition of chemical compounds, such as hydrocar- bons, which can be likened to fingerprinting at the molecular level. From a forensic perspective, it is important to infer a link between a sample to a suspected source(s) by obtaining chemi- cal information from both data sets or to differentiate the sample in question from the other samples of known origin, i.e., a pop- ulation study where an informed assessment can be made by obtaining the profiles of the sample population to provide context for the data. In other words, stable isotope fingerprinting pro- vides the resolution to the question of whether two compounds or substances are distinguishable, i.e., un-related. If the two samples are indistinguishable this supports the hypothesis that they are related. Although variations in stable isotope ratios are generally very small they are robust and have allowed workers in numerous fields to formulate links between samples (e.g., Brand and Coplen, 2012). With the help of stable isotope fingerprinting, forensic sci- entists are able to support inferences to link a person to an event, a crime scene, or a criminal organization, based on a unique char- acteristic of some physical evidence. Traceability of diesel fuel, i.e., to demonstrate any linkages, or relationships, between diesel sam- ples is very important to ascertain culpability in a diesel theft case. Therefore, to have methods to unambiguously characterize, iden- tify and assign sources is key to withstand the legal scrutiny in the court of law. Current techniques for the characterization of oil products generally use gas chromatography (GC) to separate and quantify the different molecular species. Crude oils from different sources exhibit different characteristics in terms of the ratios of molecu- lar species. Processing of the oil changes these characteristics, e.g., the high molecular weight pentacyclic terpenes and steranes are generally removed during the refining process whereas the dia- mondoids (adamantanes and diamantanes) are found in most petroleum products (Wang et al., 2006). Recent advances in the interfacing of GC to isotope ratio mass spectrometers offers the potential to enhance the fingerprinting capability of the GC tech- niques by harnessing the discriminating power offered through isotope ratio measurements (Turner et al., 2006). Petroleum- derived hydrocarbon samples of different origin and/or history have been shown to be distinguishable by CSIA based on the sta- ble isotope signatures albeit the differences obtained are subtle (Philp et al., 2002; Smallwood et al., 2002). www.frontiersin.org February 2015 | Volume 3 | Article 12 | 1
Transcript of Compound-Specific Isotope Analysis of Diesel Fuels in a Forensic Investigation
ORIGINAL RESEARCH ARTICLEpublished: 27 February 2015
doi: 10.3389/fchem.2015.00012
Compound-specific isotope analysis of diesel fuels in aforensic investigationSyahidah A. Muhammad1,2,3*, Russell D. Frew1,4 and Alan R. Hayman1
1 Department of Chemistry, University of Otago, Dunedin, New Zealand2 Environmental Technology Division, School of Industrial Technology, Universiti Sains Malaysia, Pulau Pinang, Malaysia3 Doping Control Centre, Universiti Sains Malaysia, Pulau Pinang, Malaysia4 Division of Nuclear Applications in Food and Agriculture, International Atomic Energy Agency, Vienna, Austria
Edited by:
Ahmad Zaharin Aris, Universiti PutraMalaysia, Malaysia
Reviewed by:
Nasr Bensalah, Qatar University,QatarZheng Ren, University ofConnecticut, USA
*Correspondence:
Syahidah A. Muhammad, DopingControl Centre, Universiti SainsMalaysia, Block J, 11800 USM,Pulau Pinang, Malaysiae-mail: [email protected]
Compound-specific isotope analysis (CSIA) offers great potential as a tool to providechemical evidence in a forensic investigation. Many attempts to trace environmentaloil spills were successful where isotopic values were particularly distinct. However,difficulties arise when a large data set is analyzed and the isotopic differences betweensamples are subtle. In the present study, discrimination of diesel oils involved in adiesel theft case was carried out to infer the relatedness of the samples to potentialsource samples. This discriminatory analysis used a suite of hydrocarbon diagnosticindices, alkanes, to generate carbon and hydrogen isotopic data of the compositionsof the compounds which were then processed using multivariate statistical analysesto infer the relatedness of the data set. The results from this analysis were put intocontext by comparing the data with the 13δ C and 2δ H of alkanes in commercial dieselsamples obtained from various locations in the South Island of New Zealand. Based onthe isotopic character of the alkanes, it is suggested that diesel fuels involved in thediesel theft case were distinguishable. This manuscript shows that CSIA when used intandem with multivariate statistical analysis provide a defensible means to differentiateand source-apportion qualitatively similar oils at the molecular level. This approach wasable to overcome confounding challenges posed by the near single-point source of origin,i.e., the very subtle differences in isotopic values between the samples.
Keywords: diesel fuel, alkane, compound-specific isotope analysis (CSIA), principal component analysis (PCA),
hierarchical clustering analysis (HCA)
INTRODUCTIONCompound-specific isotopic analysis (CSIA) is a technique that isbecoming increasingly popular as a forensic tool to measure stableisotope composition of chemical compounds, such as hydrocar-bons, which can be likened to fingerprinting at the molecularlevel. From a forensic perspective, it is important to infer a linkbetween a sample to a suspected source(s) by obtaining chemi-cal information from both data sets or to differentiate the samplein question from the other samples of known origin, i.e., a pop-ulation study where an informed assessment can be made byobtaining the profiles of the sample population to provide contextfor the data. In other words, stable isotope fingerprinting pro-vides the resolution to the question of whether two compounds orsubstances are distinguishable, i.e., un-related. If the two samplesare indistinguishable this supports the hypothesis that they arerelated. Although variations in stable isotope ratios are generallyvery small they are robust and have allowed workers in numerousfields to formulate links between samples (e.g., Brand and Coplen,2012). With the help of stable isotope fingerprinting, forensic sci-entists are able to support inferences to link a person to an event,a crime scene, or a criminal organization, based on a unique char-acteristic of some physical evidence. Traceability of diesel fuel, i.e.,
to demonstrate any linkages, or relationships, between diesel sam-ples is very important to ascertain culpability in a diesel theft case.Therefore, to have methods to unambiguously characterize, iden-tify and assign sources is key to withstand the legal scrutiny in thecourt of law.
Current techniques for the characterization of oil productsgenerally use gas chromatography (GC) to separate and quantifythe different molecular species. Crude oils from different sourcesexhibit different characteristics in terms of the ratios of molecu-lar species. Processing of the oil changes these characteristics, e.g.,the high molecular weight pentacyclic terpenes and steranes aregenerally removed during the refining process whereas the dia-mondoids (adamantanes and diamantanes) are found in mostpetroleum products (Wang et al., 2006). Recent advances in theinterfacing of GC to isotope ratio mass spectrometers offers thepotential to enhance the fingerprinting capability of the GC tech-niques by harnessing the discriminating power offered throughisotope ratio measurements (Turner et al., 2006). Petroleum-derived hydrocarbon samples of different origin and/or historyhave been shown to be distinguishable by CSIA based on the sta-ble isotope signatures albeit the differences obtained are subtle(Philp et al., 2002; Smallwood et al., 2002).
www.frontiersin.org February 2015 | Volume 3 | Article 12 | 1

Muhammad et al. CSIA of diesel fuels in a forensic investigation
Petroleum products are generally mixtures of volatile, semi-volatile and refractory compounds. These will exhibit quite dif-ferent isotopic evolution during processing and/ degradation withsome compounds changing very little and others exhibiting verysignificant change (e.g., Muhammad et al., 2015). Furthermore,once leaving the refinery or following release into the environ-ment, the original isotopic signatures may change due to fraction-ation or mixing processes. This tremendous isotopic variabilityoffers a strong forensic tool in comparing/contrasting differentsamples of the same compound (contaminant). Thus, carefulselection of target molecules offers the means to identify theorigin of the petroleum products.
A few studies have incorporated multivariate statistics to cor-relate and differentiate petroleum hydrocarbons to its source(s)using stable isotope fingerprints (Boyd and Coffin, 2004; Boydet al., 2006). These statistical techniques are suitable to be appliedin the area of environmental hydrocarbon fingerprinting due tothe large number of samples and variables involved. Principalcomponent analysis (PCA) is an exploratory statistical analy-sis which is frequently applied in this area due to its ability indetecting potential group tendency within a sample set; i.e., toassign a class membership to each sample. PCA can also revealunderlying features in the dataset that are responsible for thedetected classification (Pasadakis et al., 2008). Another statistical
FIGURE 1 | A map of the South Island of New Zealand
showing the diesel theft location as well as the area where
the 45 diesel samples were obtained from commercial service
stations. Locations were marked as follows: Blenheim ( ),Dunedin City ( ), Canterbury region and North Otago ( ), SouthOtago and Twizel ( ).
Frontiers in Chemistry | Green and Environmental Chemistry February 2015 | Volume 3 | Article 12 | 2

Muhammad et al. CSIA of diesel fuels in a forensic investigation
technique which is also frequently utilized in oil-source correla-tion work is hierarchical clustering analysis (HCA). Models arebuilt based on distance connectivity between samples in a mul-tidimensional space spanned by the original variables in thistype of analysis. The objective is to assign each sample to agroup of objects in a stepwise manner where extensive hier-archies of clusters merge with each other at certain distances(Muhammad et al., 2013).
The objective of this study is to carry out forensic finger-printing of diesel fuels based on the isotopic character of a suiteof hydrocarbon compounds as diagnostic indices. The relation-ship between samples in the data set was then explored usingmultivariate statistical analyses to provide a defendable means ofclassification.
MATERIALS AND METHODSSAMPLE DETAILS AND PREPARATIONCase samples were provided by the Blenheim Police Departmentand arrived in our laboratory in separate, labeled bottles withpolypropylene screwed caps. The samples were labeled in twodifferent categories: (1) Control (2 samples); (2) GKT ### (9 sam-ples). The Control samples were taken from the storage tankslocated at the ski field in Blenheim (Figure 1) where the dieseltheft occurred and the GKT samples with different denomina-tions were sub-sampled from containers found with the suspect.The diesel from the ski field was winterized diesel. This type ofdiesel is formulated to withstand the freezing temperature dur-ing the winter to avoid it coagulating and becoming solid infuel lines. Fluidity was enhanced by adding a small amount of
FIGURE 2 | Carbon and hydrogen isotope ratios of the alkane
compounds found in Control, GKT, and South Island of New
Zealand diesel samples. Bars represent the range of isotope valuesfor each compound. (A) The range of carbon isotope compositions
of the alkanes within these diesel samples were between −33.3 to−25.8 �. (B) The range of hydrogen isotope compositions of thealkanes within these diesel samples were between −116.6 to−58.1 �.
www.frontiersin.org February 2015 | Volume 3 | Article 12 | 3

Muhammad et al. CSIA of diesel fuels in a forensic investigation
additive (i.e., lower molecular weight hydrocarbons) to improveliquefaction. In this regard, these winterized diesels would pos-sibly show distinct fingerprints from the regular diesels foundat service stations. No information was provided as to the ori-gin of the samples or, e.g., whether the samples were replicates asthe sampling details were kept secret according to the provisionsof law.
To provide context for the analysis of the diesel fuel involvedin the theft case, a further 45 commercial diesel samples wereobtained from different service stations located around the SouthIsland of New Zealand (Figure 1). These samples came fromareas such as Dunedin City, North and South Otago, Twizel,Christchurch City and South Canterbury (Muhammad et al.,2013).
The diesel fuels were prepared for GC analysis by sub-sampling20 µL of each sample and dispensed using a micro syringe intoa GC vial which was then diluted to 2 mL with n-pentane. Allsamples were prepared in duplicate.
GC ANALYSISGas chromatographic and isotope analyses were obtained on atleast two aliquots of each sample and each analysis was an averageof at least three measurements. Compound specific carbon and
Table 1 | Statistics of the δ13C and δ2H value of individual alkanes in
Control, GKT, and South Island of New Zealand samples.
N Range Minimum Maximum Mean SD lVariance
nC1213C 56 3.9 −29.6 −25.8 −27.6 0.9 0.8
nC1313C 56 3.3 −30.2 −26.8 −28.4 0.9 0.8
nC1413C 56 2.8 −30.3 −27.4 −28.6 0.6 0.3
nC1513C 56 1.6 −29.4 −27.7 −28.6 0.4 0.1
nC1613C 56 2.3 −30.2 −27.9 −29.1 0.5 0.2
nC1713C 56 1.4 −29.5 −28.1 −28.6 0.4 0.1
Pris13C 56 4.1 −33.3 −29.2 −31.3 1.1 1.1
nC1813C 56 2.4 −30.6 −28.2 −29.1 0.6 0.4
Phy13C 56 4.9 −33.3 −28.3 −30.9 1.2 1.6
nC1913C 56 2.9 −31.2 −28.3 −29.3 0.7 0.5
nC2013C 56 2.7 −31.1 −28.4 −29.4 0.6 0.4
nC2113C 56 2.9 −31.1 −28.2 −29.4 0.8 0.6
nC2213C 56 3.0 −31.0 −28.0 −29.2 0.8 0.6
nC2313C 56 4.5 −31.7 −27.2 −29.1 1.2 1.3
nC122H 56 54.6 −100.0 −45.5 −82.1 11.4 130.1
nC132H 56 35.0 −108.9 −74.0 −88.4 7.9 62.7
nC142H 56 39.9 −105.1 −65.1 −78.2 10.6 111.4
nC152H 56 38.1 −96.2 −58.1 −72.8 11.3 126.7
nC162H 56 31.3 −97.5 −66.2 −77.6 8.6 73.6
nC172H 56 37.9 −97.6 −59.7 −73.3 11.0 122.0
Pris2H 56 29.2 −114.6 −85.4 −100.6 5.9 35.0
nC182H 56 22.4 −82.1 −59.7 −69.8 6.0 36.3
Phy2H 56 39.1 −116.6 −77.5 −105.5 10.3 105.1
nC192H 56 22.5 −88.3 −65.8 −74.3 4.8 23.2
nC202H 56 19.8 −88.5 −68.7 −80.0 5.3 28.6
nC212H 56 17.6 −90.0 −72.4 −82.3 4.8 22.8
nC222H 56 19.1 −87.5 −68.5 −78.6 6.1 36.9
nC232H 56 33.9 −86.4 −52.5 −73.7 6.8 46.4
hydrogen isotope ratios were determined using a Trace Ultra-gas chromatograph (Thermo, Milan, Italy) coupled to a Deltaplus
XP isotope ratio mass spectrometer (Thermo, Bremen, Germany)via a high temperature conversion furnace, heated to 940◦Cand 1450◦C for carbon and hydrogen analyses, respectively. Theinjection mode used was splitless with the temperature set at300◦C. Compounds were separated using a HP-1 GC column(30 m, 0.32 mm i.d., 0.25 µm film thickness: J&W scientific).Identification of the analytes was made prior to isotope analysisusing GC-FID by comparing the retention time of DRH-008S-R2 hydrocarbon standard solution (AccuStandard, Connecticut,USA), which contains 35 n-alkane compounds in chloroform,with that of the samples. The GC analytical conditions for bothinstruments were set to be the same throughout each run to avoidmisrepresentation. The carrier gas for the analysis was heliumwith a constant flow of 1.5 ml/min. The parameters for the ana-lytical run were as follows: initial oven temperature 50◦C, initial
Table 2 | Component matrix which shows variables and their
contribution to the variance in the data set of Control and South
Island of New Zealand samples.
Componenta
1 2 3 4 5
nC1213C 0.728 0.445 0.153 −0.262 0.368
nC1313C 0.651 0.494 0.211 −0.184 0.324
nC1413C 0.713 0.454 −0.110 −0.253 0.304
nC1513C 0.144 0.774 0.216 0.323 0.268
nC1613C 0.264 0.678 0.302 0.478 0.176
nC1713C 0.457 0.479 0.520 0.301 −0.294
Pris13C 0.884 0.173 −0.079 0.268 0.182
nC1813C 0.827 0.429 −0.085 −0.103 −0.042
Phy13C 0.814 0.154 −0.338 0.242 0.089
nC1913C 0.869 0.358 −0.226 0.006 −0.101
nC2013C 0.754 0.412 −0.377 −0.066 −0.216
nC2113C 0.744 0.481 −0.298 0.013 −0.242
nC2213C 0.798 0.366 −0.227 0.117 −0.342
nC2313C 0.854 0.267 −0.124 0.123 −0.310
nC122H 0.370 −0.386 −0.752 −0.077 0.191
nC132H 0.794 −0.372 −0.093 −0.393 −0.016
nC142H 0.876 −0.276 0.057 −0.324 −0.043
nC152H 0.916 −0.287 0.085 −0.165 0.002
nC162H 0.869 −0.229 0.175 −0.365 0.002
nC172H 0.922 −0.224 0.131 −0.246 0.010
Pris2H 0.635 −0.378 0.316 0.026 0.008
nC182H 0.686 −0.315 0.563 −0.061 −0.026
Phy2H 0.377 −0.427 −0.570 0.444 0.206
nC192H 0.572 −0.607 0.333 0.228 0.130
nC202H 0.673 −0.576 −0.098 0.266 0.029
nC212H 0.579 −0.597 0.001 0.435 0.085
nC222H 0.655 −0.549 0.019 0.325 −0.034
nC232H 0.672 −0.305 0.488 0.107 −0.142
Results are based on the δ13C and δ2H values of the alkane compounds.a5 components extracted.
Frontiers in Chemistry | Green and Environmental Chemistry February 2015 | Volume 3 | Article 12 | 4
Muhammad et al. CSIA of diesel fuels in a forensic investigation
hold time of 1 min, temperature ramp at 10◦C min to 300◦C, andfinal hold time 4 min.
Instrumental drift during individual sample analysis(∼30 min) was corrected by injecting multiple pulses ofmonitoring gas (CO2 or) at the beginning and end of eachsample run. While instrumental drift during a batch samplewas corrected by injecting a standard mixture (containing sevenn-alkanes whose δ 13C and δ2H had been previously determinedby bulk IRMS) every six samples. The instrument analyticalprecision for compound specific δ 13C and δ2H analysis wasdetermined to be <0.3 and 3�, respectively, based on long-termrepeatability of a control sample. Isotopic compositions of eachalkane were expressed as δ values per mil (�) deviation relativeto isotopic standard reference materials:
δ = [(Rsample/Rstandard) − 1] (1)
where R = 13C/12C or 2H/1H. The δ13C were reported rela-tive to the Vienna Pee Dee Belemnite (VPDB), while δ2H valueswere reported relative to the Vienna Standard Mean Ocean Water(VSMOW) standard. The H+
3 factor was determined daily usingthe standard hydrogen gas introduced through the interface. TheH+
3 is a byproduct species formed during ion-molecule reactionwhich can interfere with the measurement of HD, so correctionwas required for H isotope determination. The mass spectrometerwas tuned to ensure that the H+
3 factor was less than 10 nA/ppmand the daily variability was <0.1.
ISOTOPIC COMPOSITION OF ALKANES IN DIESEL FUELDiesel fuel is a complex mixture of hydrocarbon moleculesderived from petroleum crude oil and may contain thousands
of individual compounds, most with carbon numbers between9 and 23. This complexity can cause analytical problems in gaschromatography such as peak separation and baseline resolu-tion, even more so with GC-IRMS as true compound-specificisotopic analysis requires baseline resolution and no co-elutingpeaks. Hence, it is important to note that the measured sta-ble isotope ratios across selected peaks may therefore includesome underlying co-eluting material and are not entirely spe-cific for individual compounds. However, the data in this studyremain forensically relevant as part of an “isotopic fingerprintpattern.” The alkane compounds which were able to be reliablyquantified and yielded reproducible isotopic values using a GC-IRMS system in this study started with nC12 and ended withnC23.
DATA TREATMENT USING STATISTICAL METHODSAll mathematical and statistical computations were made usingExcel 2007 (Microsoft Office®), SigmaPlot 11.0 (Systat SoftwareInc.®) and SPSS 16.0 (IBM®). Multivariate statistical analysis ofthe stable isotope data was performed using PCA and HCA.
PCA is a mathematical procedure that converts the possiblycorrelated original variables into new linearly uncorrelated vari-ables, called the principal components (PCs). This technique alsoreveals the internal structure of the data and finds the indiceswhich best explains the variance in the data set. PCA also pro-vides the most meaningful parameters which interpret the wholedata set, thus reducing the dimensionality of the transformeddata and summarize the statistical correlation among constituentswith minimum loss of original information (Kazi et al., 2009).For the purpose of this study, PCA was used as an exploratory
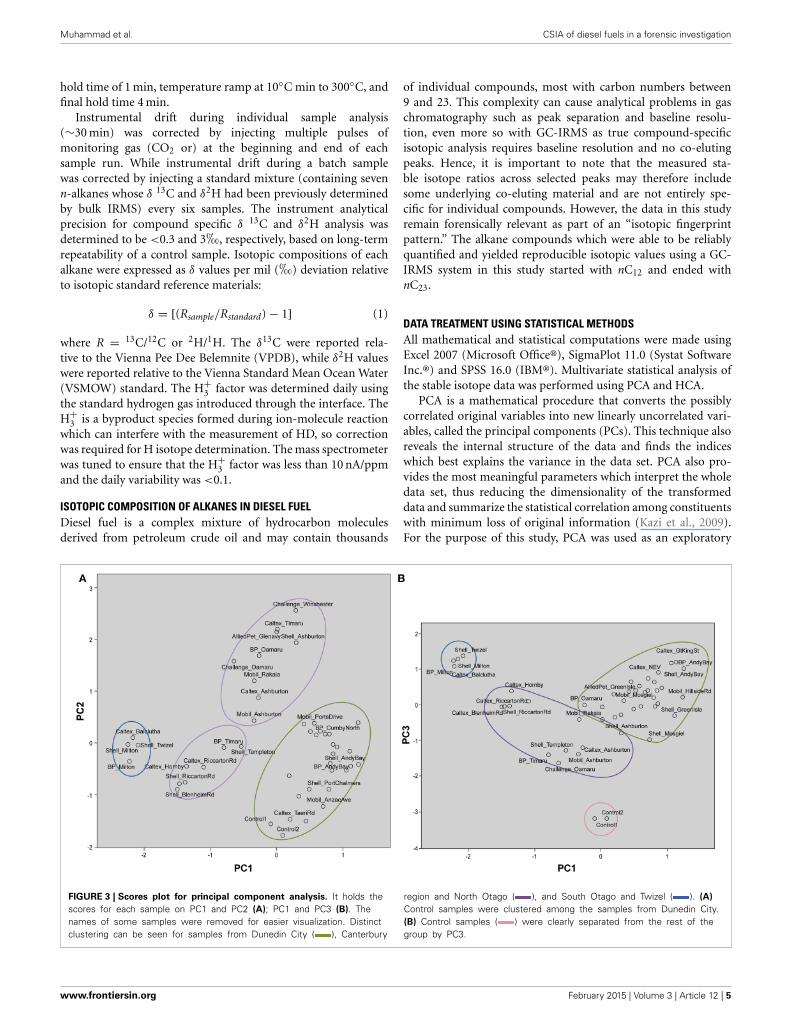
FIGURE 3 | Scores plot for principal component analysis. It holds thescores for each sample on PC1 and PC2 (A); PC1 and PC3 (B). Thenames of some samples were removed for easier visualization. Distinctclustering can be seen for samples from Dunedin City ( ), Canterbury
region and North Otago ( ), and South Otago and Twizel ( ). (A)
Control samples were clustered among the samples from Dunedin City.(B) Control samples ( ) were clearly separated from the rest of thegroup by PC3.
www.frontiersin.org February 2015 | Volume 3 | Article 12 | 5

Muhammad et al. CSIA of diesel fuels in a forensic investigation
technique to group samples with similar isotopic compositions inPC space. The outcomes of the analysis can be visualized usingscores plot which illustrate the tendency of a sample grouping.The contribution of certain characteristics which is called pat-terns or loadings of the data set will determine the position ofeach sample in the scores space (Pasadakis et al., 2008).
HCA is an analysis that builds a hierarchy of clusters by mea-suring either the distance or the similarity between the objects
to be clustered. It is normally used when there are no a pri-ori hypotheses. The hierarchical agglomerative clustering or the“bottom up” method is the preferred approach for applying thistechnique. Briefly, it builds the hierarchy from the individual ele-ments by progressively merging clusters. The results of HCA arenormally illustrated using a dendrogram (tree diagram). The den-drogram summarizes the clustering process, showing the numberof clusters (number criterion) and indicating their proximity in
FIGURE 4 | Dendrogram using Ward’s linkage method showing
cluster relationship between Control and South Island of New
Zealand. Lengths of vertical lines represent statistical difference
between multivariate components in each sample. The differentcolors reflect the different areas where the samples were obtained(see Figure 1).
Frontiers in Chemistry | Green and Environmental Chemistry February 2015 | Volume 3 | Article 12 | 6

Muhammad et al. CSIA of diesel fuels in a forensic investigation
space (distance criterion), thus reducing the dimensionality ofthe original data. To analyze the data set in this study, HCAwas performed using Ward’s linkage method. The Ward’s methodminimizes the total within-cluster variance, and the cluster dis-tances are defined by the squared Euclidean distances as a measureof similarity.
RESULTS AND DISCUSSIONCARBON ISOTOPE ANALYSISThe ranges of carbon isotope ratios of each individual alkanein Control, GKT and South Island of New Zealand samples areillustrated in Figure 2A. The mean value of pristane was lighter(−30.1�) when compared with phytane and the rest of the alka-nes. Table 1 shows the statistical analysis of the δ13C values ofindividual alkanes in the same set of samples. The range of carbonisotope compositions of the alkanes within these diesel samples(−33.3 to −25.8�) was comparable to the values determinedin previous work (Mazeas et al., 2002; Sun et al., 2005). Thesecompounds show a broad range of carbon isotopic ratios, thegreatest being observed for phytane (−33.3 to −28.3�), nC23
(−31.7 to −27.2�) and pristane (−33.3 to −29.2�). There wasno significant difference in δ13C values of odd and even numberedalkanes.
HYDROGEN ISOTOPE ANALYSISTable 1 presents the δ2H values of individual alkanes in Control,GKT and South Island of New Zealand samples. The largest rangeof δ2H was found in nC12 (−100.0 to −45.5�), nC15 (−96.2to −58.1�) and nC17 (−97.6 to −59.7�). The wide range ofhydrogen isotopic values for these alkanes was in agreement withprevious published result (Li et al., 2001). The ranges in δ2H val-ues of each of the alkane compounds are illustrated in Figure 2B.The findings from the analysis of δ2H values revealed similarpatterns as observed in the δ13C.
MULTIVARIATE STATISTICAL ANALYSISThe forensic evidence provided by stable isotope analysis is cir-cumstantial in that when two samples are indistinguishable thatsupports, but does not prove, the hypothesis that they are related.The likelihood that they are actually related can only be esti-mated by measuring control samples and determining how likelytwo samples could have identical isotopic character by chance. Inthe present context it is important to establish whether samplesobtained from the same source region have similar isotopic char-acteristics and are distinctive from samples obtained from othersource regions. Therefore, it is imperative that control samplesbe subject to a population study in order for analysts to makean informed assessment of the likelihood. The control samplesused here were commercially available diesel samples obtainedfrom around the South Island of New Zealand (Muhammad et al.,2013) plus the Control samples supplied by NZ Police. The sta-ble isotope ratios of individual alkanes from all the diesel sampleswere subjected to PCA and HCA. The information obtained fromthe statistical analyses was used to associate and differentiatediesel samples based on δ13C and δ2H values. The first principalcomponent (PC1) described 50.4% of the variance in the data.The second principal component (PC2) described an additional
19.1% of the variance while the third principal component (PC3)explained further 9.6% of the data variability. Thus, 79.1% of thetotal variance was explained by the first three components.
Table 2 shows the component matrix which listed δ13C andδ2H values as variables and their contribution to the variancein the data set. Component matrix 1 shows the δ13C values ofthe alkane compounds contributed evenly with large positivecoefficients. This implies that they have equal weighting in theinterpretation of the scores for PC1. Likewise, δ2H values of thealkane compounds show positive coefficients for the same princi-pal component. As for PC2, δ13C still shows positive coefficientsfor all the compounds. On the other hand, δ2H values of the com-pounds for this component show negative correlations to δ13Calthough both variables may have equal weighting and contribu-tion to the interpretation of the scores. In component matrix 3,the top contributors to the scores were the δ2H values of nC12
and nC18 with highly negative coefficients.
Table 3 | Component matrix which shows variables and their
contribution to the variance in the data set of Control, GKT, and
South Island of New Zealand samples.
Componenta
1 2 3 4 5
nC1213C 0.709 −0.199 −0.486 0.012 0.008
nC1313C 0.686 0.009 −0.437 −0.064 0.135
nC1413C 0.751 0.202 −0.303 −0.176 −0.148
nC1513C 0.254 0.364 −0.626 −0.241 0.435
nC1613C 0.335 0.644 −0.308 −0.071 0.527
nC1713C 0.481 0.078 −0.456 0.226 0.544
Pris13C 0.738 0.541 0.202 −0.203 0.180
nC1813C 0.863 0.172 −0.312 0.045 −0.086
Phy13C 0.663 0.603 0.249 −0.243 0.015
nC1913C 0.878 0.364 −0.102 −0.034 −0.151
nC2013C 0.773 0.452 −0.144 −0.002 −0.273
nC2113C 0.757 0.050 −0.404 0.151 −0.302
nC2213C 0.774 0.069 −0.284 0.370 −0.219
nC2313C 0.812 0.027 −0.185 0.419 −0.133
nC122H 0.200 0.724 0.558 0.054 −0.218
nC132H 0.715 0.049 0.431 −0.264 −0.203
nC142H 0.810 −0.448 0.201 −0.148 −0.144
nC152H 0.788 −0.561 0.138 −0.065 −0.057
nC162H 0.777 −0.555 0.080 −0.149 −0.101
nC172H 0.799 −0.571 0.076 −0.025 −0.076
Pris2H 0.487 −0.439 0.105 −0.529 0.208
nC182H 0.491 −0.792 −0.011 0.049 0.262
Phy2H 0.215 0.674 0.552 −0.370 0.061
nC192H 0.447 −0.565 0.455 −0.027 0.384
nC202H 0.539 0.000 0.667 −0.230 0.159
nC212H 0.389 −0.020 0.643 0.463 0.222
nC222H 0.457 0.130 0.644 0.479 0.158
nC232H 0.382 0.210 0.261 0.634 0.199
Results are based on the δ13C and δ2H values of the alkane compounds.a5 components extracted.
www.frontiersin.org February 2015 | Volume 3 | Article 12 | 7

Muhammad et al. CSIA of diesel fuels in a forensic investigation
These interpretations are visualized on the scores plot inFigure 3A (PC1 vs. PC2) and Figure 3B (PC1 vs. PC3). Figure 3Ashows two distinct clusters with South Otago and Twizel sam-ples in one group and Dunedin City in another. The Controlsamples are grouped in the same cluster as the Dunedin Citysamples. The samples obtained from the Canterbury and NorthOtago appears to be separated into 2 clusters by PC2. However, inFigure 3B several clusters are apparent comprising South Otagoand Twizel samples in one group, Dunedin City in another andCanterbury region and North Otago samples in a group of its ownin the middle of the plot. The Control samples were clearly sep-arated from the other groups due to the substantial contributionby PC3.
The dendrogram presented in Figure 4 shows that the Controldiesel samples were subtly correlated with the samples fromCanterbury region and North Otago samples. South Otago andTwizel samples were grouped together and showed moderate cor-relation with the Control, Canterbury region and North Otagosamples. The dendrogram also shows clear separation of DunedinCity samples from the rest of the group as illustrated in the largejump of the linkage which indicates the clusters are far apart (readto the right of the dendrogram to see the clusters).
The statistical analyses on the subtle differences in δ13C andδ2H of alkanes enabled clear discrimination of the Control sam-ples from the other South Island samples. Following this obser-vation, similar statistical treatments were carried out for Controland GKT samples, together with the South Island of New Zealandsamples.
The PCA analysis resulted in a first principal component (PC1)that described 40.9% of the variance in the data. The secondprincipal component (PC2) described an additional 17.9% of thevariance while the third principal component (PC3) explained
further 14.8% of the data variability. Thus, 73.6% of the totalvariance was explained by the first three components.
Table 3 shows the component matrix with δ13C and δ2H val-ues as variables and their contribution to the variance in the dataset comprised of the Control, GKT and South Island of NewZealand samples. Component matrix 1 shows the δ13C and δ2Hvalues of the alkane compounds contributed evenly with highlypositive coefficients for most of the compounds. This implies thatthey have equal weighting in the interpretation of the scores forPC1. For PC2, δ2H values of the compounds were mostly neg-atively correlated to the δ13C variables with more compoundsshowing higher weightage and contributed more to the interpre-tation of the scores. In component matrix 3, an opposing trendfor δ13C and δ2H values was seen with δ13C variables showingnegative correlations to that of δ2H variables.
These interpretations from PCA were visualized on the scoresplots in Figures 5A,B. Figure 5A shows distinct clusters com-prised of South Otago and Twizel samples in one group andDunedin City samples in another. The Canterbury region andNorth Otago samples showed moderate clustering in the mid-dle of the scores plot. GKT 107/1, GKT 107/2, and GKT 108were separated from the rest of the diesel samples by PC2 whilstControl and other GKT samples fell in the cluster of Canterburyregion and North Otago samples. When PC1 was plotted againstPC3 (Figure 5B), similar observations were seen for South Otagoand Twizel and Dunedin City clustering in Figure 5A. The pri-mary difference is that Control samples are now grouped togetherwith GKT 106, GKT 202/1, and GKT 202/2. Clearly, this patternwas mainly due to the contribution from PC3. However, someof the GKT samples were seen to have similarities with that ofDunedin City samples as scores plot showed moderate clusteringbetween them.
FIGURE 5 | Scores plot for principal component analysis. It holds thescores for each sample on PC1 and PC2 (A); PC1 and PC3 (B). The names ofsome samples were removed for easier visualization. (A) Distinct clusteringcan be seen for samples from Dunedin City ( ), Canterbury region andNorth Otago ( ), and South Otago and Twizel ( ). GKT 107/1, GKT107/2,and GKT 108 ( ) were separated from the rest of the groups by PC2 whilst
Control and other GKT samples were grouped in the cluster of Canterburyregion and North Otago. (B) Distinct clustering can be seen for samples fromDunedin City ( ), Canterbury region and North Otago ( ), and SouthOtago and Twizel ( ). PC3 showed substantial contribution in separatingControl, GKT 106, GKT 202/1, and GKT 202/2 samples ( ) from the rest ofthe data set.
Frontiers in Chemistry | Green and Environmental Chemistry February 2015 | Volume 3 | Article 12 | 8

Muhammad et al. CSIA of diesel fuels in a forensic investigation
FIGURE 6 | Dendrogram using Ward’s linkage method showing
cluster relationship between Control, GKT, and South Island of
New Zealand samples. Lengths of vertical lines represent statistical
difference between multivariate components in each sample. Thedifferent colors reflect the different areas where the samples wereobtained (see Figure 1).
The stable isotope data of the diesel samples involved in thetheft case were also analyzed using cluster analysis to see theirassociation with the diesel samples from the South Island ofNew Zealand. This relationship was presented in a dendrogramin Figure 6. Here the Blenheim diesel samples are grouped intosmall clusters with samples under the same denominations such
as GKT 107 samples and GKT 108, classed together. Likewise, theGKT 106 sample found to be highly correlated with GKT 202samples and Control diesels. Additionally, except for GKT 105samples, the rest of the Blenheim diesels were closely related andshowed only a small amount of variation between them. GKT105 diesels were more closely correlated with the samples from
www.frontiersin.org February 2015 | Volume 3 | Article 12 | 9

Muhammad et al. CSIA of diesel fuels in a forensic investigation
Dunedin City service stations than the samples from Blenheim,as seen by the large jump of the linkage between them. Similardiscrimination is observed for the rest of the commercial dieselsamples with each of the group classed together due to the highcorrelation between them.
CONCLUSIONSThe forensic discrimination of diesel fuels involved in a theft caseutilizing stable isotope fingerprint of hydrocarbon indices wasachieved. There were variations in the stable isotopic composi-tions of alkanes within the diesel samples that can be used todifferentiate them. Additionally, a large population of commer-cial diesel fuels obtained from various areas in the South Islandof New Zealand was included in the data set to rule out statisticalcoincidence as well to put the data into context thus providing aninformed assessment of the analysis.
Discrimination of the diesel samples into groups was evidentby comparing the subtle differences in the stable isotope values ofthe alkane compounds using multivariate statistical analyses suchas PCA and HCA. The main conclusions from these analyses are:
• PCA showed that the Control diesel samples were strongly cor-related with GKT 106 and GKT 202 samples and moderatelycorrelated with the other GKT samples.
• Diesel samples that were grouped together based on PCA alsoshowed high correlation using HCA.
• However, GKT 105 samples were shown to be grouped sepa-rately from the other Blenheim samples using HCA.
• PCA and HCA both highlighted the association of Controlsamples with that of GKT 106, GKT 107, GKT 108, and GKT202 samples.
• In our opinion, the most likely explanation is that these dieselsshare a common history.
In summary, this paper provided some context on the Blenheimdiesel theft case. The Control samples were found to be chemicallyrelated to samples found in possession of the suspect, i.e., theywere indistinguishable by measurements of their stable isotopefingerprint. That they were distinguishable from the 45 addi-tional samples collected from around the South Island and thatthe South Island samples were able to be grouped according tosource provided support for the prosecution hypothesis that thesamples in possession of the suspect had originated from the theft.When this evidence was presented in court the accused changedtheir plea to guilty and was convicted of the theft.
ACKNOWLEDGMENTSAM acknowledges the support from Ministry of HigherEducation Malaysia and Universiti Sains Malaysia (USM) for herstudies.
REFERENCESBoyd, T. J., and Coffin, R. B. (2004). Use of stable carbon isotopes and multivariate
statistics to source-apportion fuel hydrocarbons. Environ. Res. Eng. Manag. 4,28–35.
Boyd, T. J., Osburn, C. L., Johnson, K. J., Birgl, K. B., and Coffin, R. B. (2006).Compound-specific isotope analysis coupled with multivariate statistics tosource-apportion hydrocarbon mixtures. Environ. Sci. Technol. 40, 1916–1924.doi: 10.1021/es050975p
Brand, W. A., and Coplen, T. (2012). Stable isotope deltas: tiny, yet robustsignatures in nature. Isotopes Environ. Health Stud. 48, 393–409. doi:10.1080/10256016.2012.666977
Kazi, T. G., Arain, M. B., Jamali, M. K., Jalbani, N., Afridi, H. I., Sarfraz, R. A.,et al. (2009). Assessment of water quality of polluted lake using multivariatestatistical techniques: a case study. Ecotoxicol. Environ. Saf. 72, 301–309. doi:10.1016/j.ecoenv.2008.02.024
Li, M., Huang, Y., Obermajer, M., Jiang, C., Snowdon, L. R., and Fowler,M. G. (2001). Hydrogen isotopic compositions of individual alkanes asa new approach to petroleum correlation: case studies from the WesternCanada Sedimentary Basin. Org. Geochem. 32, 1387–1399. doi: 10.1016/S0146-6380(01)00116-4
Mazeas, S., Budzinski, H., and Raymond, N. (2002). Absence of stable car-bon isotope fractionation of saturated and polycyclic aromatic hydrocarbonsduring aerobic bacterial biodegradation. Org. Geochem. 33, 1259–1272. doi:10.1016/S0146-6380(02)00136-5
Muhammad, S. A., Frew, R. D., and Hayman, A. R. (2013). Forensic differentia-tion of diesel fuels using hydrocarbon isotope fingerprints. Centr. Euro. Geol.56, 19–37. doi: 10.1556/CEuGeol.56.2013.1.3
Muhammad, S. A., Hayman, A. R., Van Hale, R., and Frew, R. D. (2015).Assessing carbon and hydrogen isotopic fractionation of diesel fuel n-alkanesduring progressive evaporation. J. Forensic Sci. 60(Suppl. 1), S56–S65. doi:10.1111/1556-4029.12551
Pasadakis, N., Gidarakos, E., Kanellopoulou, G., and Spanoudakis, N. (2008).Identifying sources of oil spills in a refinery by gas chromatogra-phy and chemometrics: a case study. Environ. Forensics 9, 33–39. doi:10.1080/15275920701729548
Philp, R. P., Allen, J., and Kuder, T. (2002). The use of the isotopic compositionof individual compounds for correlating spilled oils and refined products inthe environment with suspected sources. Environ. Forensics 3, 341–348. doi:10.1006/enfo.2002.0104
Smallwood, B. J., Paul Philp, R., and Allen, J. D. (2002). Stable carbon iso-topic composition of gasolines determined by isotope ratio monitoringgas chromatography mass spectrometry. Org. Geochem. 33, 149–159. doi:10.1016/S0146-6380(01)00142-5
Sun, Y., Chen, Z., Xu, S., and Cai, P. (2005). Stable carbon and hydrogen isotopicfractionation of individual n-alkanes accompanying biodegradation: evidencefrom a group of progressively biodegraded oils. Org. Geochem. 36, 225–238. doi:10.1016/j.orggeochem.2004.09.002
Turner, N., Jones, M., Grice, K., Dawson, D., Ioppolo-Armanios, M., andFisher, S. J. (2006). Delta C-13 of volatile organic compounds (VOCS) inairborne samples by thermal desorption-gas chromatography-isotope ratio-mass spectrometry (TD-GC-IR-MS). Atmos. Environ. 40, 3381–3388. doi:10.1016/j.atmosenv.2006.01.030
Wang, Z. D., Yang, C., Hollebone, B., and Fingas, M. (2006). Forensic fingerprintingof diamondoids for correlation and differentiation of spilled oil and petroleumproducts. Environ. Sci. Technol. 40, 5636–5646. doi: 10.1021/es060675n
Conflict of Interest Statement: The authors declare that the research was con-ducted in the absence of any commercial or financial relationships that could beconstrued as a potential conflict of interest.
Received: 31 July 2014; paper pending published: 28 October 2014; accepted: 12February 2015; published online: 27 February 2015.Citation: Muhammad SA, Frew RD and Hayman AR (2015) Compound-specific iso-tope analysis of diesel fuels in a forensic investigation. Front. Chem. 3:12. doi: 10.3389/fchem.2015.00012This article was submitted to Green and Environmental Chemistry, a section of thejournal Frontiers in Chemistry.Copyright © 2015 Muhammad, Frew and Hayman. This is an open-access articledistributed under the terms of the Creative Commons Attribution License (CC BY).The use, distribution or reproduction in other forums is permitted, provided theoriginal author(s) or licensor are credited and that the original publication in thisjournal is cited, in accordance with accepted academic practice. No use, distribution orreproduction is permitted which does not comply with these terms.
Frontiers in Chemistry | Green and Environmental Chemistry February 2015 | Volume 3 | Article 12 | 10